More resourcesfrom our Grammar, Punctuation and Spelling ...
1
Formatted: Check spelling and grammar

2
Climate Change Adaptation Plan for the Municipal Development and the Land Use Plans in San Pedro de Macorís
WORK TEAM ICMA Indhira De Jesús, Alejandro Herrera Moreno, Erick Dorrejo, Andrea Vogel, Andrés Cepeda FEDOMU José Antonio Chevalier, Beatriz Alcántara, Yamilkis Flores, ICF Michael Savonis, Molly Hellmuth, Joanne Potter, Angela Wong, Tara Hamilton Ayuntamiento de San Pedro de Macorís Ramón Antonio Echavarría, Danilo Miñoso, Domingo Gelabert, Francesco Gravina, Jesús Batista, Johanna Santana, Moisés Vizcaíno, Richard Miller, Nelly Altagracia de Pilier, Cándido Pichardo, Indhira Ortiz, Eugenio Encarnación, Domingo Ramirez, Rafael Amiama
Reference: ICMA/ICF/FEDOMU/ASPM (2017). Climate Change Adaptation Plan for the Municipal Development and the Land Use Plans in San Pedro de Macorís. International Association for the Management of Cities and Municipalities, ICF International, Dominican Federation of Municipalities and San Pedro de Macorís City Council. Planning Program for Climate Adaptation of the United States Agency for International Development (USAID), San Pedro de Macoris, Dominican Republic, 23 pp. August 2017 This publication has been prepared by the International Association for the Management of Cities and Municipalities (ICMA), ICF International, the Dominican Federation of Municipalities (FEDOMU) and the City of San Pedro de Macorís (ASPM) for review by the United States Agency for International Development (USAID). The production of this material was possible thanks to the support of the People of the United States through USAID. The opinions expressed in this publication do not necessarily reflect
Formatted: Font: 20 pt
Formatted: Font: 20 pt
Formatted: Left
Formatted: Font: 11 pt
Formatted: Left
Formatted: Spanish (Spain)
Formatted: Spanish (Spain)
Formatted: Spanish (Spain)
Formatted: Spanish (Spain)
Formatted: Justified
Formatted: Font: Gill Sans MT, 11 pt
Formatted: Border: Box: (Single solid line, Auto, 0.5 ptLine width)
Formatted: Font: Gill Sans MT
Formatted: Normal, Justified
Formatted: Font: Gill Sans MT, 11 pt
Formatted: Font: Gill Sans MT
Formatted: Font: 11 pt

3
the views of USAID or the Government of the United States. Cover picture: Old house of San Pedro. adapted to floods. Source Alejandro Herrera. ABBREVIATIONS AND ACRONYMS AP. Protected areas. ASPM. Municipality of San Pedro de Macoris CH. Higuamo Coalition CODIA. Dominican College of Engineering CP. Development Council of San Pedro de Macorís CPPMR. Provincial Committee for Prevention and Mitigation of Risks CPSPM. Beach Committee of San Pedro de Macorís DGODT. Directorate General of Territorial Planning ECORED. National Network of Business Support to Environmental Protection EDEESTE.EDESUR. Distributor of Electricity to the South East FB. Brugal Foundation GC. Central Government INAPA. National Potable Water and Sewerage Institute INDHRI. National Institute of Hydraulic Resources IP. Public institutions JBN. National Botanical Garden MIC. Ministry of Culture MINERD. Ministry of Education MISPAS. Ministry of Health and Social Assistance MITUR. Ministry of Tourism MMA. Ministry of the Environment MV. Macorís Verde P. Programs and projects PLM. Board of Laguna Mallén POSC. Population and civil society organizations R. Regulations RVS. Wildlife Refuge. SIND. Sector Industrial SP. Private sector T. Time frame: Short (C) medium (M) and Long Term (L). UCE. Central University of the East. Z. Zonation ZNUNUZ. Non-developable urbanizable zones
Formatted: Font: 11 pt, English (United States)
Formatted: Font: 11 pt
Formatted: Font: 11 pt, English (United States)
Formatted: Font: 11 pt, Spanish (Spain)
Formatted: Font: Gill Sans MT, Spanish (Spain)
Formatted: Spanish (Spain)

4
CONTENT 1. INTRODUCTION 2. OVERVIEW OF CLIMATE IMPACTS AND VULNERABILITIES 2.1. Temperature increase and heat waves 2.2. Extreme weather events with heavy rainfall and flooding 2.3. Changes of rainfall patterns 2.4. Sea level rise more storm surges and coastal flooding 3. ADAPTATION STRATEGIES AND MEASURES 4. IMLEMENTATION CRITERIA 4.1. Creation of a technical team 4.2. Implementation times 4.3. Adaptive management 5. REFERENCES CONTENT 1. INTRODUCTION 2. RESOURCES, SECTORS AND MUNICIPAL SERVICES KEY FOR DEVELOPMENT 3. MAIN IMPACTS AND VULNERABILITY CLIMATE 3.1. Temperature increase and heat waves 3.2. extreme weather events with heavy rainfall and flooding 3.3. Reduced rainfall and drought 3.4. Sea level rise more storm surges and coastal flooding 4. STRATEGIES AND OBJECTIVES OF ADAPTATION 5. ADAPTATION MEASURES 6. REFERENCES
Formatted: Font: 11 pt, Font color: Blue
Formatted: Font: 11 pt
Formatted: Font: 11 pt, Not Bold
Formatted: Font: 11 pt, Not Bold
Formatted: Font: 11 pt, Not Bold, Not Highlight
Commented [WA1]: To be updated UPDATED
Formatted: Font: Gill Sans MT, 11 pt, Not Highlight
Formatted: Font: 11 pt, Not Bold
Formatted: Font: Not Bold
Formatted: Add space between paragraphs of thesame style
Formatted: Add space between paragraphs of thesame style
Formatted: Font: 11 pt
5
1. INTRODUCTION The coastal city of San Pedro de Macoris has an economy driven by agriculture and industry and is reowned well known for its cultural heritage and as the birthplace of great baseball players. However, San Pedro is highly vulnerable to current and future climate variability and change which are resulting in significant impacts on toimpacts to its natural resources and infrastructure that are vital to the city’s development. Climate variability and change will continue to have substantial impacts on the city’s resources, services, and sectors, likely impeding municipal efforts to achieve development objectives which are centered around local governance; social development; economic development; environment and natural resources; sustainable land use; and quality basic services. It is therefore vitally important to manage these climate risks in order to achieve development objectives. This Adaptation Plan outlines specific strategies for the municipality to improve resilience to climate change. Climate change is increasingly recognized as a major global development challenge. Increasing temperature, changes in rainfall seasonality and amount, extreme weather events, and rising sea levels are already having an impact on sectors and key development services, and vulnerability is expected to continue to increase. The Dominican Republic’s Third National Communication on Climate Change (TNCCC) projects indicates that by the year 2060, annual average rainfall may be reduced by as much as 17%, dry seasons will be more intense, and increases in extreme rainfall event intensity and frequency are likely to occur even outside of the rainy season. Likewise, climate models project a general increase in average annual temperatures of between 1°C to 3°C by mid centurymid-century. Sea level is projected to increase by as much as 5 mm per year over the next 100 years, which will have serious negative impacts on coastal resources and livelihoods (IPCC, 2017). These changes in climate conditions will result in impacts across resources, services, and sectors. Thus, it is increasingly a matter of importance to take into consideration these changes in strategic planning and investment, in order to adapt to a changing climate. Adaptation is the process of adjustment to actual or expected climate and its effects in order to moderate harm or exploit beneficial opportunities (IPCC, 2017). Climate adaptation enhances a municipality’s
6
resilience by amplifying its capability to anticipate, prepare for, respond to, and recover from significant climate stressors with minimum damage. Adaptation planning can build a community’s resilience through the development and implementation of a portfolio of complementary strategies and measures that will help it address vulnerabilities and risks. Once a community has identified primary vulnerabilities and risks, the adaptation planning process includes identifying adaptation measures; evaluating adaptation measures; building an adaptation measure portfolio; and monitoring, evaluating, and adjusting the plan. To address these risks, this Adaptation Plan takes a portfolio approach that includes a variety of strategies and near- and longer-term adaptation measures identified and validate by the City Hallsuch as capacity building; structural and technological actions; land use, policy, and planning initiatives; and operations and program management approaches. Implementing a range of options can help San Pedro improve resilience across various sectors and increase general adaptive capacity. This plan addresses multiple sectors, stressors, and implementation timeframes through a suite of land use and non-land use measures. The portfolio of adaptation measures focuses on addressing the priority vulnerabilities of resources, services, and sectors identified by San Pedro. In the framework of planning for climate adaptation, this Adaptation Plan offers a portfolio of key adaptation measures which should be considered within the Municipal Land Use Plan (POTM) or the Municipal Development Plan (PDM). There are a number of pathways the municipality can follow to implement the adaptation measures, including through the municipal land use plan, the municipal development plan, and the annual operating budget (Figure 1). San Pedro can incorporate land use adaptation measures into the territorial perspective phase of its municipal land use planning process. The municipality can also incorporate adaptation measures into its municipal plan as a program or project or through the municipal development plan’s associated annual operating budget. This Adaptation Plan outlines San Pedro de Macorís’ key climate stressors and risks across multiple sectors, identifies a portfolio of actionable adaptation measures, and provides next steps to implement the priority adaptation measures. This Adaptation Plan was developed by the City Council with the collaboration of the International Management Association of Cities and Municipalities Management Association (ICMA) and ICF.
Figure 1. Pathway for implementation of an adaptation portfolio.
Formatted: Font: Gill Sans MT

7
This Adaptation Plan outlines San Pedro de Macorís’ key climate stressors and risks across multiple sectors, identifies a portfolio of actionable adaptation measures, and provides next steps to implement the priority adaptation measures. This Adaptation Plan was developed by the City Council with the collaboration of the International Management Association of Cities and Municipalities and ICF. 2. OVERVIEW OF CLIMATE IMPACTS AND VULNERABILITIES Livelihoods and the natural resources, infrastructure, and municipal services that people depend on in San Pedro de Macoris are vulnerable to multiple climate change stressors. Temperature increase and heat waves, extreme weather events including heavy rainfall and flooding, changes in rainfall patterns and drought, and sea level rise and storm surge has impacted a range of sectors in the past and may continue to under changing climate conditions. Climate stressors have varying levels of impacts on different communities, municipal services and facilities, and natural resources. The following sections and Table 1 presents an overview of climate change impacts and vulnerabilities on sectors vital to the city’s development (ICMA / ICF / FEDOMU / ASPM, 2016).The climate vulnerability assessment of San Pedro de Macorís (ICMA / ICF / FEDOMU / ASPM, 2016) reveals that the population and urban infrastructure and all key sectors and municipal services are vulnerable to various climatic threats and stressors that can cause a variety of impacts (Table 1) according to their vulnerability (their degree of exposure and sensitivity, the level of development of their adaptive capacity1). We refer to the increase in temperature and heat waves, greater intensity of extreme weather events with intense rainfall and floods, changes in the pattern of precipitation (with scenario of reductions and drought or extreme rainfalls out of season rain), and sea level rise with greater storm surge and coastal flooding. 2.1. Temperature increase and heat waves The population and all sectors and services, particularly in the city center, are vulnerable to projected increases in temperature and extreme heat events. Temperatures are projected to increase 0.7°C to 0.8°C by 2030 and 1.4°C to 1.7°C by 2050, in high and low emissions scenarios respectively. Due to the urban heat island effect, the urban area of San Pedro is hotter than the rest of the region between June to September. High temperatures will impact multiple sectors, such as public health (e.g., thermal discomfort); solid waste (e.g., high temperatures accelerate physical and chemical processes associated with the processing and decomposition of organic matter); electrical systems (e.g., overheating of the transmission and distribution lines); and built cultural heritage sites (e.g., high temperatures accelerate deterioration). Vulnerability to increases in temperature is exacerbated by non-climate stressors such as lack of vegetation cover to provide shade. Vulnerability is increased by non-climatic impacts such as the scarce vegetation cover that does not favor sufficient spaces for acclimatization and shading. 2.2. Extreme weather events with heavy rainfall and flooding The city of San Pedro extends from sea level to 30 masl, in a system of coastal terraces that reaches 50 masl. The regional geomorphological context favors the runoff to the city. The location of the city in the lower basins of the Soco and Higuamo rivers, plus the presence of water bodies as the Mallén Lagoon, also favor flooding conditions. San Pedro is particularly vulnerable to heavy rainfall and flooding and
1 Exposure is the presence of population and infrastructure in sites that could be adversely affected; sSensitivity is the degree to which they may be affected and the ability to adjust to moderate potential harms or benefit from opportunities is adaptive capacity.
Formatted: Not Highlight
Formatted: Font: Bold
Formatted: Normal
Formatted: Not Highlight
Formatted: Not Highlight
Formatted: Not Highlight
Formatted: Not Highlight
Formatted: Not Highlight
Formatted: Font: Gill Sans MT, 9 pt
Formatted: Justified
Formatted: Font: Gill Sans MT, 9 pt
Formatted: Font: Gill Sans MT, 9 pt

8
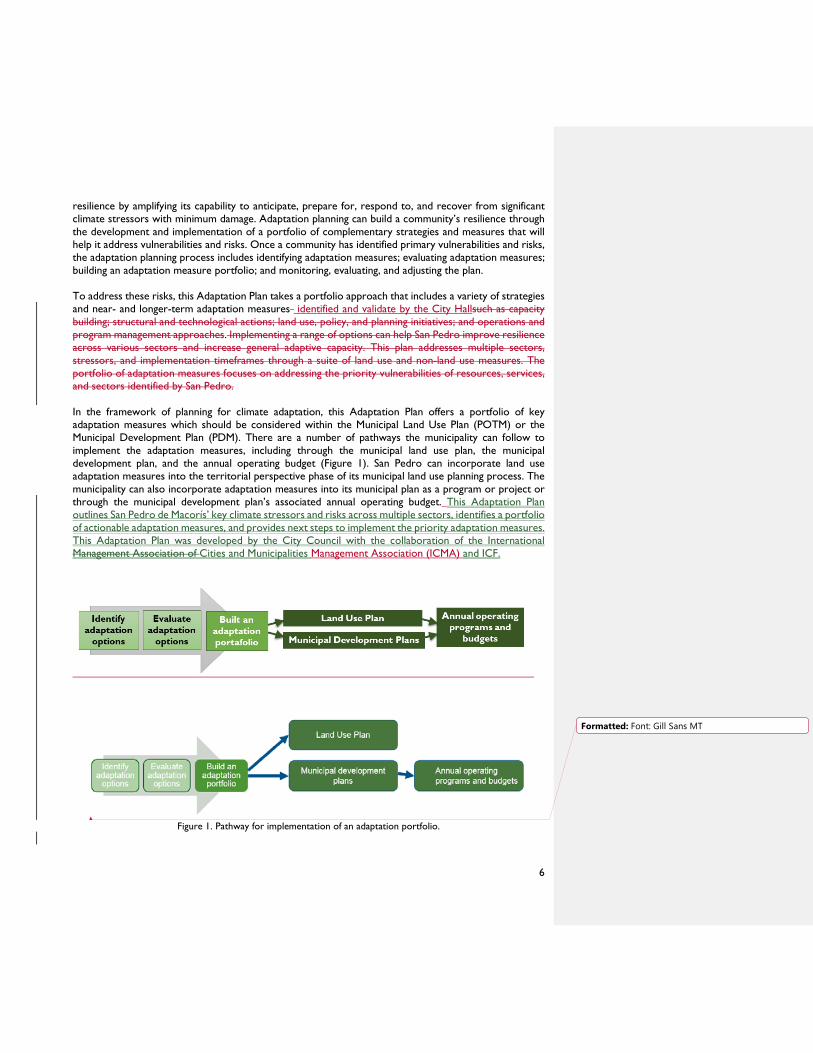
extreme weather events are projected to increase in intensity. The population, services, and urban infrastructure are vulnerable to riverine flooding (caused by the flooding overflow of the Higuamo and River, Soco r Rivers, or the Laguna Malléen or ) and pluvial flooding (caused by the accumulation of rainfall in naturally low-lying areas or areas with poor drainage). Vulnerable areas include fourteen neighborhoods and bateyes in the center city (Villa Municipal, Villa Progreso II, Placer Bonito, April 24, Kennedy, Villa Esperanza, Sarmiento, Lindo, Mexico, Restoration, Los Guandules, Cemetery, Spring, and Santa Clara); four along the banks of the River Higuamo (Cantalarrana, Blanco, Los Cangrejitos, and Punta Pescadora); at least one on the north shore of Laguna Mallen (Pedro Justo Carrión); and three in the coastal area (San Anton, Villa Playa, and Villa Faro). As the urban area has grown, more people and businesses are moving into areas of potential inundation. This haphazard growth has occurred mostly in the form of informal settlements with inhabitants living in extreme poverty along the Higuamo River and coast. Vulnerability to flooding is increased by non-climatic stressors such as the high proportion of impermeable soil and solid waste dispersion which obstructs drainage. Projections indicate a reduction in average annual precipitation in 2030 (-4.26% to -2.60%) that increase toward midcentury (-11.9% to -14.9%). While water services have not been disrupted by drought in the past, the natural resource the sector relies on is particularly vulnerable to future changes in rainfall. The municipality’s water supply comes from wells and an intake on the Soco River in Ramón Santana to serve a population of approximately 195.000 inhabitants. The change in rainfall patterns also includes sudden extreme precipitations that cause flooding, destruction of homes and roads and isolation of communities as occurred in the last quarter of 2016. 2.4. Sea level rise, storm surge, and coastal flooding The municipality of San Pedro de Macorís spans across ~13 km of the Caribbean Sea coastline where settlements, the wastewater treatment plant, the liquefied gas terminal, beaches, and local tourism assets are located. In the coastal area, the population, services, and urban infrastructure such as in San Anton are very vulnerable to coastal flooding and storm surge. With sea level rise and more intense extreme weather events in the future, the risk of coastal flooding may increase. Table 1. Summary of potential impacts of climate change on key sectors for the development objectives of the municipality San Pedro de Macoris. Source: ICMA / ICF / FEDOMU / ASPM (2016).
Sectors Temperature increase
Extreme weather events
Changes in rainfall patterns Sea level rise
Participatory governance
Climate impacts to livelihoods and disruptions to municipal services, increase pressure on the municipality to better include the community in its governance and decision-making processes and shifting citizens’ requests for public investments in the participatory budget planning to adaptation.
Participatory governanceFiscal management
Reduction of outdoor activities that generate income for the City Hall of San PedroClimate impacts to livelihoods and disruptions to municipal services, increasing pressure on the municipality to better include the community in its governance and decision making processes and shifting citizens’ requests for public investments in the participatory budget planning.
Health and public safety
Increase heat stress and increase of the spread of pathogens.
Population ddisplacement. Physical damage to schools, public health infrastructure., and public safety.
Lack of water for activities in health centers. Exacerbation of heat stress (thermal discomfort).Flooding and reduced access to schools and public health and public safety infrastructure.
Inundation of schools and public health and public safety infrastructure.
Agriculture, livestock, fishing
Changes in agricultural productivity. Major
Damage to crops and plantations, agriculture
Changes in the weather and amount of rain for rainfed
Salt water intrusion of agricultural soil.
Formatted: Not Highlight
Formatted: Not Highlight
Formatted: Not Highlight
Formatted: Not Highlight
Formatted: Not Highlight
Formatted: Not Highlight
Formatted: Centered, Add space between paragraphsof the same style, Line spacing: single
Formatted Table
Formatted: Font: 9.5 pt
Formatted: Font: 9.5 pt
Formatted: Font: 9.5 pt
Formatted: Font: 9.5 pt
Formatted: Font: 9.5 pt
Formatted: Font: 9.5 pt, Not Italic
Formatted: Font: 9.5 pt
Formatted: Font: 9.5 pt
Formatted: Font: 9.5 pt
Formatted: Font: 9.5 pt
Formatted: Font: 9.5 pt

9
Sectors Temperature increase
Extreme weather events
Changes in rainfall patterns Sea level rise
problems with weeds, pests and diseases. Reduction of fish resources (loss of reefs and changes in fish migration patterns) Higher spending on product conservationHeat stress on crops, livestock, agriculture infrastructure, fish, and marine ecosystems, and workers. Shifts of pests and diseases. Decreased productivity of farms and fisheries. Impacts to corals and shellfish due to ocean acidification.
infrastructure . including processing mills, fish breeding sites, fish landing sites, and coral reefs (especially barriers and shallow reefs). Disruption to electricity and transport services. required for operation of processing plants and goods movement.Damage to fishing landing sites, impact to shallow reefs, reduction of fishing time.
agriculture and the availability of water for agricultural irrigation. Possible changes in the balance of nutrients in the ocean and increased sedimentation.Potential changes in the timing and amount of precipitation for rain-fed agriculture and water availability for irrigated agriculture. Potential changes in nutrient balance in ocean and increased sedimentation.
Possible reduction of reef growth. Inundation Loss of fish landing sites (infrastructure and ships.)
Industrial free zones
Reduced operational capacity of machinery and increased cooling demands. Exacerbation of organic and thermal pollution.Decrease in the operational capacity of machinery. Higher refrigeration demand. Exacerbation of organic and thermal pollution. Loss of efficiency of generators with marine cooling
Floods and damages to the infrastructure. Increase in repair and maintenance costs Interruption of electricity services and freight transport. Physical damage to industrial infrastructure and increased maintenance and repair costs. Disruption to electricity and transport services required for operation and goods movement.
Changes in the availability of water necessary for industrial processes. Greater need for seawater for cooling in conditions of scarcity Flooding and damage to mechanical equipment. Changes to availability of water required for industrial processes. Disruption of transport of goods due to inundation of roads.
Flooding of coastal infrastructure. Interruption of the transport of goods by flooding coastal roads and portsInundation of coastal industrial infrastructure. Disruption of transport of goods due to inundation of roads and port.
Commercial activity
Increased cooling demands.
Temporary closure of companies for physical damage and floods. Interruption of electricity and transportation for operation and movement of goods. More repair / maintenance cost Physical damage to commercial businesses and increased maintenance and repair costs. Disruption to electricity and transport services required for operation and goods movement.
Lack of water for commercial activities. Increases stress due to heat (thermal discomfort)Temporary closure of businesses due to flooding. Disruption of transport of goods due to inundation of roads.
Interruption of freight transport due to the flooding of roads and ports.Disruption of transport of goods due to inundation of roads and port.
Formatted: Centered, Add space between paragraphsof the same style, Line spacing: single
Formatted Table
Formatted: Font: 9.5 pt
Formatted: Font: 9.5 pt
Formatted: Font: 9.5 pt
Formatted: Font: 9.5 pt
Formatted: Font: 9.5 pt
Formatted: Not Highlight
Formatted: Font: 9.5 pt
Formatted: Not Highlight
Formatted: Font: 9.5 pt
Formatted: Not Highlight
Formatted: Font: 9.5 pt
Formatted: Font: 9.5 pt
Formatted: Font: 9.5 pt
Formatted: Font: 9.5 pt
Formatted: Font: 9.5 pt
Formatted: Font: 9.5 pt
Formatted: Font: 9.5 pt
Formatted: Font: 9.5 pt
Formatted: Font: 9.5 pt
Formatted: Font: 9.5 pt
10
Sectors Temperature increase
Extreme weather events
Changes in rainfall patterns Sea level rise
Tourism
Higher energy consumption to acclimatize tourist facilities Deterioration of tourist sites due to thermal stress. Accelerated deterioration of tourism sites due to thermal stress and biochemical activity and cracking of historical building materials.
Floods and physical damage to tourist attractions and facilities. Interruptions of tourist operations. Physical damage of attractions and tourism facilities. Interruptions to tourism operations.
Reduction of water for tourist operations. Need to search for water sources, treatment, transfer and storage Flooding and physical damage of attractions and tourism facilities. Interruptions to tourism operations.
Erosion of beaches and flooding of tourist sites in low-lying coastal areas. Erosion and inundation of sites in low-lying areas.
Natural resources
Thermal stress on ecosystems and terrestrial, coastal and marine biota. Coral bleaching (aggravated by acidification of the oceans). Heat stress on vegetation and wildlife. Coral bleaching due to ocean acidification.
Physical damage to wetlands, mangroves and shallow reefs. Physical damage to ecosystems, with impact on the coast by storm waves. Changes in coastal salinity. Physical damage to forests, with greater impact on coastal forests by large storm waves. Physical damage to marshes and mangroves. Physical damage to coral reefs, especially barriers and shallow reefs.
Possible changes in the nutrient balance and sedimentation in the coastal zone. Possible alteration of natural forest structure and composition. Potential changes in nutrient balance and increased sedimentation. Increased erosion and runoff and damage to marine ecosystems.
Loss of rocky coast. Changes in zoning of the mangrove. Limitation of reef growth.Submersion of coastal forests. Changes in zonation of species. Loss of wetlands. Possible reduction of reef growth.
Cultural heritage sites
Fissure and cracking of building materials. Accelerated deterioration of sites due to thermal stress and biochemical activity.
Flooding of heritage sites. Erosion and corrosion of metal structures. Organic growths Physical changes due to humidity. Less time for outdoor cultural activities. Structural damage, erosion, and penetrative moisture into porous materials.
Lack of water for the activities of use and maintenance of heritage sites. Damage to heritage. Flooding of heritage sites. Erosion and corrosion of metals. Growth of organic materials such as insects, molds, and fungi. Physical changes to the structures’ materials due to changes in humidity cycles. Cracking and heaving due to changes in sediment moisture.
Flooding of sites in low coastal or riparian zones.Erosion and inundation of sites in low-lying areas.
Transport
More rapid road asphalt deterioration. Increased maintenance and repair costs of roads and port.
Temporary inundation and increased maintenance and repair costs of roads and port. Closures for "disaster waste" and damage to infrastructure
Flooding of roadways and increased maintenance and repair costs.
Erosion of road base and inundation of coastal roadways. Damage to port infrastructure and possible inundation.
Formatted: Centered, Add space between paragraphsof the same style, Line spacing: single
Formatted Table
Formatted: Font: 9.5 pt
Formatted: Font: 9.5 pt
Formatted: Font: 9.5 pt
Formatted: Font: 9.5 pt
Formatted: Font: 9.5 pt
Formatted: Font: 9.5 pt
Formatted: Font: 9.5 pt
Formatted: Font: 9.5 pt
Formatted: Font: 9.5 pt
Formatted: Font: 9.5 pt
Formatted: Font: 9.5 pt
Formatted: Font: 9.5 pt
Formatted: Font: 9.5 pt
Formatted: Font: 9.5 pt
Formatted: Font: 9.5 pt
Formatted: Font: 9.5 pt
Formatted: Font: 9.5 pt
Formatted: Font: 9.5 pt, English (United States)
Formatted: Font: 9.5 pt
Formatted: Font: 9.5 pt, English (United States)
Formatted: Font: 9.5 pt
Formatted: Font: 9.5 pt
Formatted: Font: 9.5 pt
Formatted: Font: 9.5 pt
Formatted: Font: 9.5 pt
Formatted: Font: 9.5 pt
Formatted: Font: 9.5 pt
Formatted: Font: 9.5 pt
Formatted: Font: 9.5 pt, English (United States)
Formatted: Font: 9.5 pt
Formatted: Font: 9.5 pt, English (United States)

11
Sectors Temperature increase
Extreme weather events
Changes in rainfall patterns Sea level rise
Solid waste management
Increased odor and gases. M, requiring more frequent waste collection and rigorous landfill management. Altered decomposition rates. Overheating of collection vehicles. Increase of plaguesf flies around organic waste,/ increasing risk of infectious diseases.
Damage and debris along the collection routes. Greater dispersion of waste. Physical impacts on infrastructure Damage and debris along collection routes. Dispersal of waste.
Water limitations for recycling processes Flooding of collection routes. Dispersal of waste.
Reduction of collection routes along coastal roadsNarrowed collection routes.
Storm water
Thermal impact on infrastructure, equipment and pipes of the drainage system. Exceeding the working temperature range of the pipes
Damage to infrastructure and equipment due to exceedance of its flows capacity. Overflow of pipes. Wastewater treatment plants out of service by interruption of electric service. Increase of "disaster waste" that blocks drainage.
Reduction of rainwater captured useable
Damage to infrastructure and equipment of the drainage system near the coast.
Sewage and stormwater
Equipment/infrastructure degradation. Reduction in treatment efficiency by oxygen reduction, increase of algae and microorganisms, and gases and odors. Heat stress at work Lower water quality due to algal blooms and pathogens.
Floods and damage to infrastructure and equipment. Plants out of service due to interruption of electric service. Black water spills that pollute and expose the population to pathogens Damage to collection systems. Potential for wastewater treatment ponds to overflow and increase release of contamination into the ocean.
Reduction in the dilution of wastewater in treatment plants and dumping sites in rivers and coasts Overwhelmed sewage collection pipes.
Floods and damage to equipment and infrastructures of the treatment plant near the coastInundation of stormwater outfall.
Water supply and treatment
Increased water demand Greater potential losses due to evaporation. Changes in water quality. Potentially higher evaporation losses. Changes in water quality.
Damage to treatment, storage and distribution systems. Reduction of water quality. Service interruptions Potential damage to water treatment, storage, and distribution infrastructure. Potential reductions in water quality.
Changes in water quality and availability. Depletion in storage systems. Damage to water service systems due to reduction of flows Changes in water quality, water availability.
Advance of salt wedge. Salinization of rivers. Saline intrusion in coastal aquifers Advancement of the salt wedge and salinization of rivers. Salt water intrusion in coastal aquifers.
Electricity
Thermal expansion of electric lines. Risks of distension of the laying and power cuts.
Fallen electric lines. Interruption of the energy service. Increase in maintenance and repair
Potential reductions of water in cooling processes and hydroelectric
Drop in power lines in coastal roads. Flooded electrical system sitesDowned power
Formatted: Centered, Add space between paragraphsof the same style, Line spacing: single
Formatted Table
Formatted: Font: 9.5 pt
Formatted: Font: 9.5 pt
Formatted: Font: Gill Sans MT, Not Italic
Formatted: Font: 9.5 pt
Formatted: Font: 9.5 pt, English (United States)
Formatted: Font: 9.5 pt
Formatted: Font: 9.5 pt, English (United States)
Formatted: Font: 9.5 pt
Formatted: Font: 9.5 pt
Formatted: Font: 9.5 pt
Formatted: Font: 9.5 pt, English (United States)
Formatted: Font: 9.5 pt
Formatted: Font: 9.5 pt
Formatted: Font: Not Italic, Font color: Auto
Formatted: Font: 9.5 pt
Formatted: Font: 9.5 pt
Formatted: Font: 9.5 pt
Formatted: Font: 9.5 pt
Formatted: Font: 9.5 pt
Formatted: Font: 9.5 pt
Formatted: Font: 9.5 pt
Formatted: Font: 9.5 pt
Formatted: Font: 9.5 pt, Not Italic, Font color: Auto
Formatted: Font: 9.5 pt, English (United States)
Formatted: Font: 9.5 pt
Formatted: Font: 9.5 pt
Formatted: Font: 9.5 pt
Formatted: Font: 9.5 pt, Not Italic, Font color: Auto
Formatted: Font: 9.5 pt, English (United States)
Formatted: Font: 9.5 pt
Formatted: Font: 9.5 pt, Not Italic, Font color: Auto
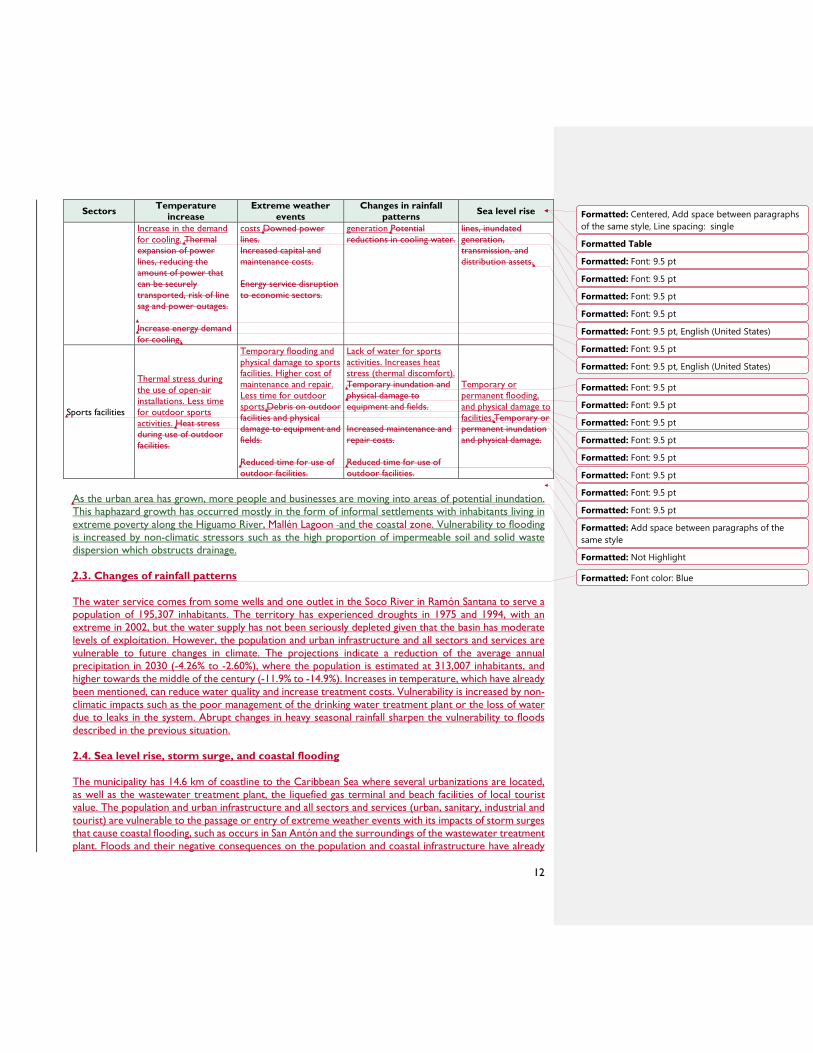
12
Sectors Temperature increase
Extreme weather events
Changes in rainfall patterns Sea level rise
Increase in the demand for cooling. Thermal expansion of power lines, reducing the amount of power that can be securely transported, risk of line sag and power outages. Increase energy demand for cooling.
costs Downed power lines. Increased capital and maintenance costs. Energy service disruption to economic sectors.
generation Potential reductions in cooling water.
lines, inundated generation, transmission, and distribution assets.
Sports facilities
Thermal stress during the use of open-air installations. Less time for outdoor sports activities. Heat stress during use of outdoor facilities.
Temporary flooding and physical damage to sports facilities. Higher cost of maintenance and repair. Less time for outdoor sports.Debris on outdoor facilities and physical damage to equipment and fields. Reduced time for use of outdoor facilities.
Lack of water for sports activities. Increases heat stress (thermal discomfort). Temporary inundation and physical damage to equipment and fields. Increased maintenance and repair costs. Reduced time for use of outdoor facilities.
Temporary or permanent flooding, and physical damage to facilities.Temporary or permanent inundation and physical damage.
As the urban area has grown, more people and businesses are moving into areas of potential inundation. This haphazard growth has occurred mostly in the form of informal settlements with inhabitants living in extreme poverty along the Higuamo River, Mallén Lagoon and the coastal zone. Vulnerability to flooding is increased by non-climatic stressors such as the high proportion of impermeable soil and solid waste dispersion which obstructs drainage. 2.3. Changes of rainfall patterns The water service comes from some wells and one outlet in the Soco River in Ramón Santana to serve a population of 195,307 inhabitants. The territory has experienced droughts in 1975 and 1994, with an extreme in 2002, but the water supply has not been seriously depleted given that the basin has moderate levels of exploitation. However, the population and urban infrastructure and all sectors and services are vulnerable to future changes in climate. The projections indicate a reduction of the average annual precipitation in 2030 (-4.26% to -2.60%), where the population is estimated at 313,007 inhabitants, and higher towards the middle of the century (-11.9% to -14.9%). Increases in temperature, which have already been mentioned, can reduce water quality and increase treatment costs. Vulnerability is increased by non-climatic impacts such as the poor management of the drinking water treatment plant or the loss of water due to leaks in the system. Abrupt changes in heavy seasonal rainfall sharpen the vulnerability to floods described in the previous situation. 2.4. Sea level rise, storm surge, and coastal flooding The municipality has 14.6 km of coastline to the Caribbean Sea where several urbanizations are located, as well as the wastewater treatment plant, the liquefied gas terminal and beach facilities of local tourist value. The population and urban infrastructure and all sectors and services (urban, sanitary, industrial and tourist) are vulnerable to the passage or entry of extreme weather events with its impacts of storm surges that cause coastal flooding, such as occurs in San Antón and the surroundings of the wastewater treatment plant. Floods and their negative consequences on the population and coastal infrastructure have already
Formatted: Centered, Add space between paragraphsof the same style, Line spacing: single
Formatted Table
Formatted: Font: 9.5 pt
Formatted: Font: 9.5 pt, English (United States)
Formatted: Font: 9.5 pt
Formatted: Font: 9.5 pt, English (United States)
Formatted: Font: 9.5 pt
Formatted: Font: 9.5 pt
Formatted: Font: 9.5 pt
Formatted: Font: 9.5 pt
Formatted: Font: 9.5 pt
Formatted: Font: 9.5 pt
Formatted: Font: 9.5 pt
Formatted: Font: 9.5 pt
Formatted: Font: 9.5 pt
Formatted: Font: 9.5 pt
Formatted: Font: 9.5 pt
Formatted: Add space between paragraphs of thesame style
Formatted: Not Highlight
Formatted: Font color: Blue
13
been significant in the past and may be greater in the future under the scenarios indicating more intense extreme weather events with larger storm surges due to the rise in water level. sea, with projections of ascent between 0.20 to 0.58 m to 2050, with higher swells of storms increases the risk of coastal flooding. 3. ADAPTATION STRATEGIES AND MEASURES To implement the present adaptation measures and provide an organizational and methodological framework for new measures in the future, this plan is based on nine interrelated adaptation strategies (Table 2) that address the situations of vulnerability of the territory, considering its three components: exposure, sensitivity and adaptive capacity. Strategy 1 addresses a fundamental problem of the territory: exposure to threats, and focuses on reducing vulnerability by regulating the use of vulnerable soil. Strategy 2 assumes that vulnerable land is already occupied and is responsible for reducing vulnerability by acting more on sensitivity. Strategies 3, 4, 5 and 6 focus adaptation actions basically towards the reduction of sensitivity, although they may have some impact on the increase of adaptive capacity, in which strategies 7, 8 and 9 are definitely focused. In relation to the instruments of the ordering, Strategy 1 is expressed mainly through zoning and regulations, while in the rest the plans, programs and projects that have been incorporated into the PMOT or the PMD may be more relevant (Appendix 1).To reduce and manage these climate risks, San Pedro identified and evaluated adaptation measures to increase the resilience of the city. The municipality prioritized measures to address key vulnerabilities in the territory and are organized within the following eight interrelated adaptation strategies: 1. To prevent further development in areas at risk to flooding through land use zoning and regulations in areas along the Higamo and Soco Rivers, Laguna Mallen, and the coast. 2. To reduce flood impacts to populations and assets in at-risk areas including along the Higamo and Soco Rivers, Laguna Mallen, the coast, and low-lying areas in the city with poor drainage. 3. To conserve, restore, and develop the environment along the coast to reduce flood risk to populations, assets, and coastal and marine resources and habitats, and improve biodiversity and eco-tourism. 4. To increase urban green spaces in order to reduce urban heat and flood impacts on populations, resources, and assets, while increasing biodiversity and the urban aesthetic. 5. To protect cultural heritage sites throughout the city by reducing impacts from flooding, humidity, and extreme heat. 6. To develop and strengthen relationships and coordination across institutions, civil society, and key sectors in order to build capacity to manage climate vulnerabilities while also improving services and living conditions. 7. To identify and invest in priority research and information needs to in order to improve monitoring and understanding of climate-related vulnerabilities.
8. To increase education and public awareness of climate change risks and its relationship to land use management.
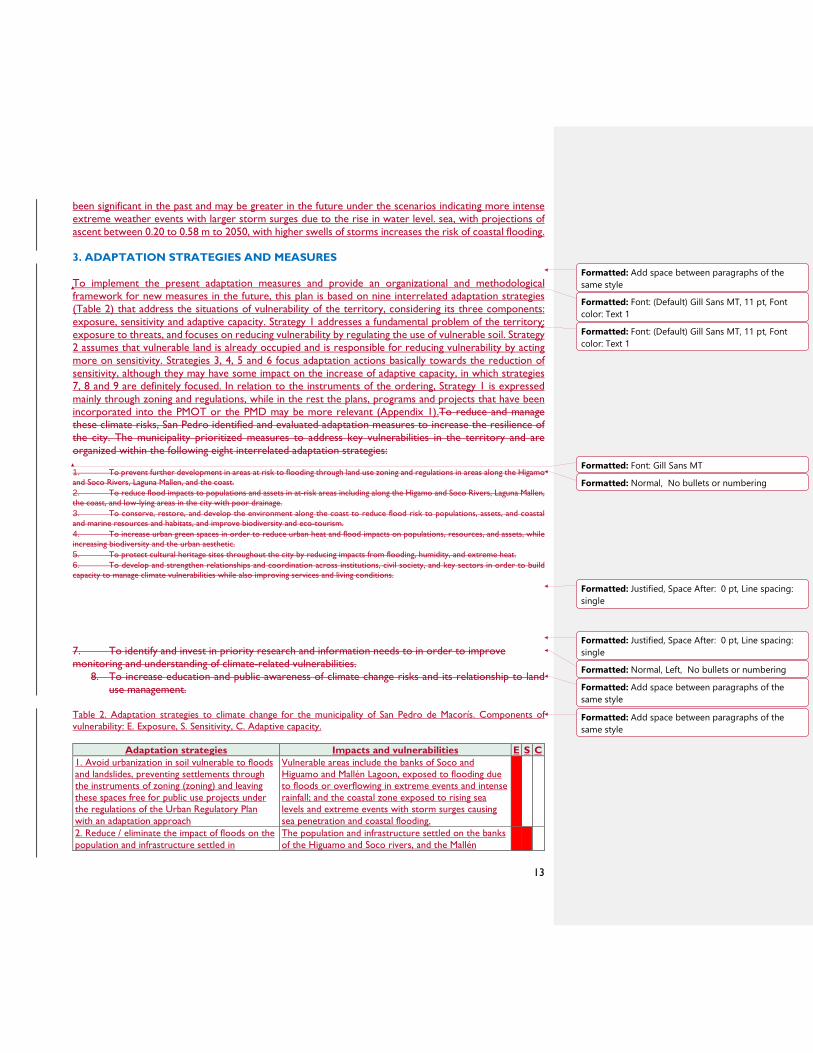
Table 2. Adaptation strategies to climate change for the municipality of San Pedro de Macorís. Components of vulnerability: E. Exposure, S. Sensitivity, C. Adaptive capacity.
Adaptation strategies Impacts and vulnerabilities E S C 1. Avoid urbanization in soil vulnerable to floods and landslides, preventing settlements through the instruments of zoning (zoning) and leaving these spaces free for public use projects under the regulations of the Urban Regulatory Plan with an adaptation approach
Vulnerable areas include the banks of Soco and Higuamo and Mallén Lagoon, exposed to flooding due to floods or overflowing in extreme events and intense rainfall; and the coastal zone exposed to rising sea levels and extreme events with storm surges causing sea penetration and coastal flooding.
2. Reduce / eliminate the impact of floods on the population and infrastructure settled in
The population and infrastructure settled on the banks of the Higuamo and Soco rivers, and the Mallén
Formatted: Add space between paragraphs of thesame style
Formatted: Font: (Default) Gill Sans MT, 11 pt, Fontcolor: Text 1
Formatted: Font: (Default) Gill Sans MT, 11 pt, Fontcolor: Text 1
Formatted: Font: Gill Sans MT
Formatted: Normal, No bullets or numbering
Formatted: Justified, Space After: 0 pt, Line spacing: single
Formatted: Justified, Space After: 0 pt, Line spacing: single
Formatted: Normal, Left, No bullets or numbering
Formatted: Add space between paragraphs of thesame style
Formatted: Add space between paragraphs of thesame style

14
vulnerable sites through structural measures (technologies for management and control of floods), non-structural (early warning) or resettlement, medium and long term
Lagoon, in areas of flooding or where the topography and drainage have been altered is vulnerable to flooding due to overflow, extreme events and intense rainfall.
3. Conserve, restore and take advantage of terrestrial, coastal and coastal environments to implement an adaptation strategy based on ecosystems in urban projects integrated with nature with co-benefit for biodiversity and ecotourism
Riparian ecosystems (especially mangroves) and coastal ecosystems of San Pedro de Macoris, and the services they provide, play a key role in adapting to climate change under a great array of climate vulnerabilities
4. Develop the vegetation cover (urban trees) in a continuous green circuit (corridor) to favor urban adaptation by creating spaces for acclimatization, shading and drainage) with the co-benefit of landscape improvement and increased biodiversity
The population and infrastructure are vulnerable to the increase of temperature and heat waves. This situation is aggravated by the scarce vegetation cover. The urban trees provide shade and cooling, helps reduce the temperature during heat waves; and offers rainwater infiltration spaces.
5. Rescue, protect and adapt to the climate key objectives (activities, sectors and services) for municipal development: cultural heritage, built and intangible
Due to its location in flood areas and the incidence of high temperatures and humidity, the historical heritage (cultural, built or intangible) is very vulnerable to climatic variations.
6. Implement actions that reduce / avoid the negative synergy between climatic and non-climatic impacts and offer a co-benefit of environmental improvement and municipal basic services
Floods are aggravated by the dispersion of solid waste that obstructs drainage. Wastewater is dispersed during floods and pollutes water sources, with damage to health. Leaks make the supply system more sensitive to reduced rainfall. Heat sources (transport and industry) worsen seasonal heat waves.
7. Create relationships and alliances and strengthen inter-institutional and inter-sectoral mechanisms and with civil society for the adaptation and joint solution of environmental impacts that aggravate climate impacts
The lack of coordination between institutions and sectors prevents the approach of climate impacts that promote vulnerability and constitutes -in fact- one of the most serious non-climatic impacts that aggravate it
8. Address priority needs for information and research to better understand the vulnerabilities of the territory and a more effective and focused approach to municipal adaptation
Vulnerability is conditioned by climatic, spatial and socioeconomic factors -historical and present- of the territory that must be known for adaptation under technical criteria
9. Increase education and citizen awareness before the needs of land use planning and the risks of climate change in the municipality
The ability to manage and understand climate information and a correct perception of risk are crucial to increase adaptive capacity and reduce vulnerability to climate variations.
In the following pages, each adaptation strategy is presented and described in relation to the measures that correspond to them. All measures were assessed through the ICF Tool (2016). In each case, the measures are listed, organized by resources, sectors and services. Its geographical area of action is indicated; some responsible institutions, among a set of some thirty areas and sectors; the land use instrument is identified through which the measure is incorporated in the PMOT (zoning, regulations and programs and projects) and finally a temporary implementation framework is assigned (short, medium or long term). These measures can be complemented with the technical sheets to support climate adaptation and planning of ICMA / ICF (2017). The first strategy identifies adaptation measures through the land use planning instruments of zoning and regulations while the subsequent strategies are expressed through programs and projects which can be
Formatted: Normal
Formatted: Font color: Black, English (United States)
Formatted: English (United States)
Formatted: Font: Font color: Auto
Formatted: Font: 10 pt
Formatted: Add space between paragraphs of thesame style
Formatted: Font color: Blue

15
integrated into the Municipal Land Use Plan and Municipal Development Plan. The adaptation measures detailed in the sections below identify the geographical area, institutions responsible for implementation, the instrument that may be used to incorporate into the municipal planning processes (i.e., zoning (Z); regulations (R); and projects, programs, and policies (P)), and implementation timeframe (short (C), medium (M), or long term (L)).2 The adaptation measures for the municipality of San Pedro de Macoris were identified through technical team discussions, a working group adaptation workshop, and contributions from the CityLinks partner. The measures were then evaluated by the technical team. The feasibility, effectiveness, and affordability of a range of measures were assessed through the tool ICF (2016), with a priority set of measures identified for inclusion in an adaptation portfolio. 3.1. Strategy 1. Reduce exposure in vulnerable sites Strategy 1 addresses the fundamental problem of the municipality: exposure to threats, and focuses on reducing vulnerability by regulating the use of vulnerable land (mainly floods and landslides). It is based on the results of the vulnerability assessment (Figure 2), to propose measures (Table 3) that give criteria for mapping (Figure 3) areas that should not be occupied (e.g., banks of the Higuamo river and Laguna Mallén) defined in a territorial analysis with tools of the Geographical Information System (Table 4) that must be endorsed by a body of regulations (in an Urban Regulatory Plan). This strategy expresses the adaptation fundamentally through the zoning and regulation instruments, within the land use plan. Table 3. Adaptation measures within Strategy 1 validated by the City of San Pedro de Macorís. Note. The first number of the measure relates to an adaptation strategy.3.1. Strategy 1 The first strategy addresses one of the fundamental vulnerabilities of the municipality, exposure to floods, by preventing further development in areas at risk through land use zoning and regulations. Strategy 1 is based on the results of the vulnerability assessment of the territory which identified areas at risk to flooding (Figure 2). This adaptation strategy identifies measures for a set of areas that should not be occupied (e.g., banks of the Higuamo River and Laguna Mallen) through land use instruments including zoning and regulations (Table 2, Figure 3). Table 2. Priority adaptation measures for Strategy 1. Adaptation measure Action Area Responsible Z R P T
Sectors and services Adaptation measure Action Area Responsible3 Z R P T
Planning, population, infrastructure and environment
1.1. In the context of land use classification of the municipality, establish a NUZ ZNU in the east and west banks of the Higuamo River
Higuamo River ASPM,, DGODT,
MMA X C
2 Additionally, note the following acronyms in the adaptation tables below. No-development Area (ZNU). Protected areas (AP). Wildlife Refuge (RVS). City Hall of San Pedro de Macorís (ASPM). Coalition Higuamo (CH). College of Engineers (CODIA). Development Council of San Pedro de Macorís (CP). Committee of beach of San Pedro de Macorís (CPSPM). Provincial Committee of Prevention and Mitigation of Risks (CPPMR). General Direction of Territorial Ordering (DGODT). National Network of Business Support to Environmental Protection (ECORED). Empresa Distribuidora de Electricidad del Sur (EDESUR). Brugal Foundation (FB). Central government (GC). National Potable Water and Sewerage Institute (INAPA). National Institute of Hydraulic Resources (INDHRI). Public institutions (IP). National Botanical Garden (JBN). Culture Ministry (MIC). Ministry of Education (MINERD). Ministry of Health and Social Welfare (MISPAS). Ministry of Tourism (MITUR). Ministry of the Environment (MMA). Macorís Verde (MV). Patronage of Laguna Mallén (PLM). Population and civil society organizations (POSC). Industrial Sector (SIND). Private Sector (SP). Central University of Este (UCE). In section of ABBREVIATIONS AND ACRONYMS 3 The main responsible is indicated first and in bold
Formatted: Font color: Blue
Formatted: Font color: Blue
Formatted: Add space between paragraphs of thesame style
Formatted: Font: Not Bold
Formatted: Font: Not Bold
Formatted: Font: Not Bold
Formatted: Font: 10 pt
Commented [HM2]: Recommend breaking this up by strategy – so they can focus on one strategy and response at a time. Thie strategy sections would cover- what is the strategy, and what are the measures.
Formatted: Font: 10 pt
Formatted: Font: 10 pt
Formatted: Font: 10 pt
Formatted: Centered
Formatted: Font: 10 pt
Formatted: Font: Bold
Formatted: Font: Bold
Formatted: Spanish (Spain), Strikethrough
Formatted: Not Highlight
Formatted: Not Highlight
16
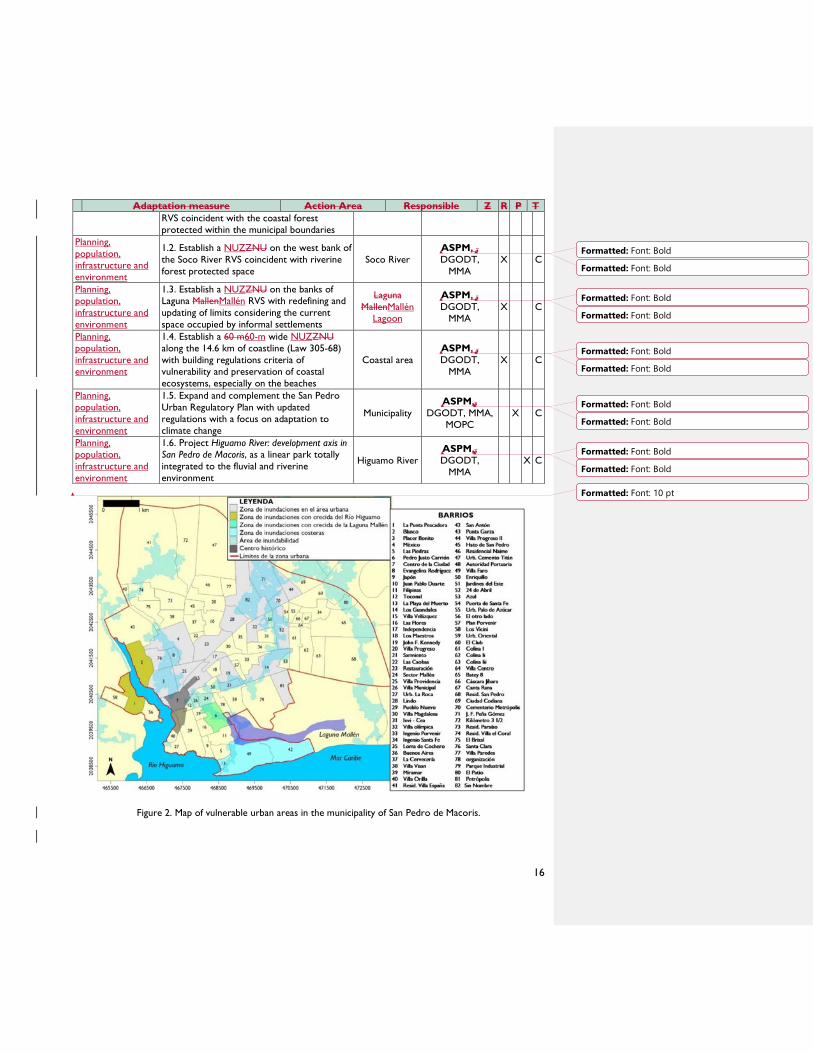
Adaptation measure Action Area Responsible Z R P T RVS coincident with the coastal forest protected within the municipal boundaries
Planning, population, infrastructure and environment
1.2. Establish a NUZZNU on the west bank of the Soco River RVS coincident with riverine forest protected space
Soco River ASPM, , DGODT,
MMA X C
Planning, population, infrastructure and environment
1.3. Establish a NUZZNU on the banks of Laguna MallenMallén RVS with redefining and updating of limits considering the current space occupied by informal settlements
Laguna MallenMallén
Lagoon
ASPM, , DGODT,
MMA X C
Planning, population, infrastructure and environment
1.4. Establish a 60 m60-m wide NUZZNU along the 14.6 km of coastline (Law 305-68) with building regulations criteria of vulnerability and preservation of coastal ecosystems, especially on the beaches
Coastal area ASPM, , DGODT,
MMA X C
Planning, population, infrastructure and environment
1.5. Expand and complement the San Pedro Urban Regulatory Plan with updated regulations with a focus on adaptation to climate change
Municipality ASPM,,
DGODT, MMA, MOPC
X C
Planning, population, infrastructure and environment
1.6. Project Higuamo River: development axis in San Pedro de Macoris, as a linear park totally integrated to the fluvial and riverine environment
Higuamo River ASPM,, DGODT,
MMA X C
Figure 2. Map of vulnerable urban areas in the municipality of San Pedro de Macoris.
Formatted: Font: Bold
Formatted: Font: Bold
Formatted: Font: Bold
Formatted: Font: Bold
Formatted: Font: Bold
Formatted: Font: Bold
Formatted: Font: Bold
Formatted: Font: Bold
Formatted: Font: Bold
Formatted: Font: Bold
Formatted: Font: 10 pt
17
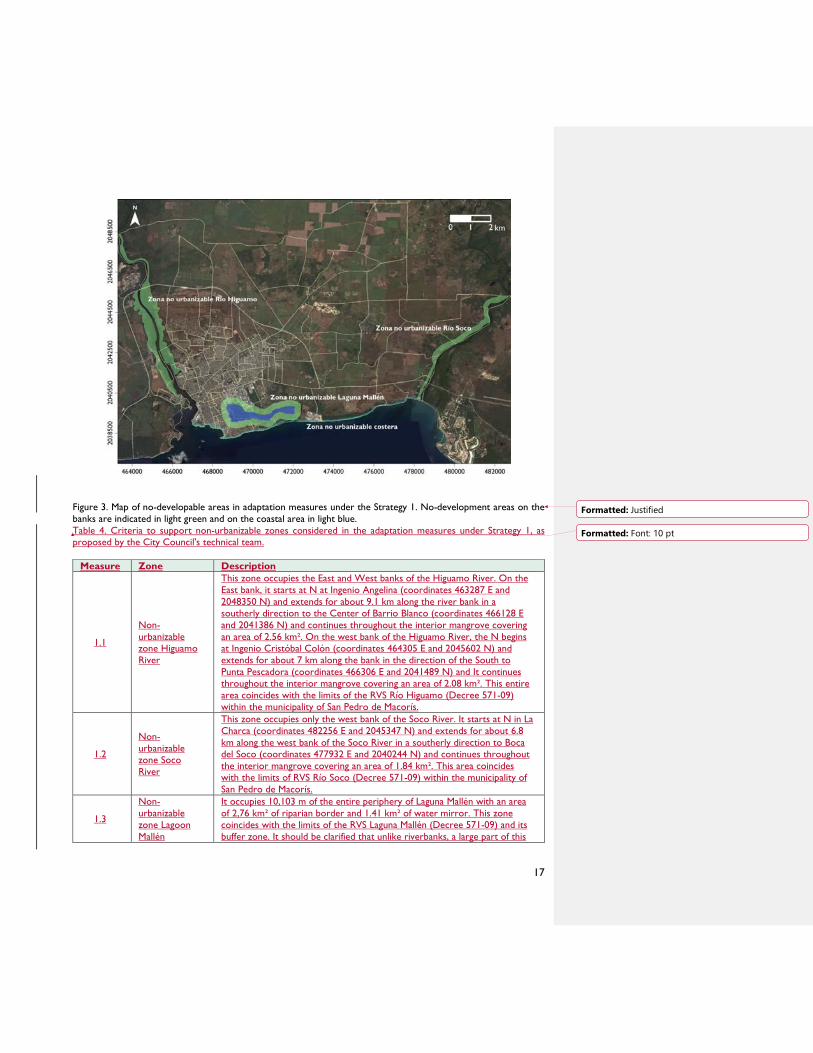
Figure 3. Map of no-developable areas in adaptation measures under the Strategy 1. No-development areas on the banks are indicated in light green and on the coastal area in light blue. Table 4. Criteria to support non-urbanizable zones considered in the adaptation measures under Strategy 1, as proposed by the City Council's technical team.
Measure Zone Description
1.1
Non-urbanizable zone Higuamo River
This zone occupies the East and West banks of the Higuamo River. On the East bank, it starts at N at Ingenio Angelina (coordinates 463287 E and 2048350 N) and extends for about 9.1 km along the river bank in a southerly direction to the Center of Barrio Blanco (coordinates 466128 E and 2041386 N) and continues throughout the interior mangrove covering an area of 2.56 km². On the west bank of the Higuamo River, the N begins at Ingenio Cristóbal Colón (coordinates 464305 E and 2045602 N) and extends for about 7 km along the bank in the direction of the South to Punta Pescadora (coordinates 466306 E and 2041489 N) and It continues throughout the interior mangrove covering an area of 2.08 km². This entire area coincides with the limits of the RVS Río Higuamo (Decree 571-09) within the municipality of San Pedro de Macorís.
1.2
Non-urbanizable zone Soco River
This zone occupies only the west bank of the Soco River. It starts at N in La Charca (coordinates 482256 E and 2045347 N) and extends for about 6.8 km along the west bank of the Soco River in a southerly direction to Boca del Soco (coordinates 477932 E and 2040244 N) and continues throughout the interior mangrove covering an area of 1.84 km². This area coincides with the limits of RVS Río Soco (Decree 571-09) within the municipality of San Pedro de Macorís.
1.3
Non-urbanizable zone Lagoon Mallén
It occupies 10,103 m of the entire periphery of Laguna Mallén with an area of 2,76 km² of riparian border and 1.41 km² of water mirror. This zone coincides with the limits of the RVS Laguna Mallén (Decree 571-09) and its buffer zone. It should be clarified that unlike riverbanks, a large part of this
Formatted: Justified
Formatted: Font: 10 pt

18
area is heavily anthropized, so this measure includes a redefinition and updating of limits excluding the current occupation space for informal settlements that will be addressed within Strategy 2
1.4. Coastal non-urbanizable zone
It begins to the West in the La Roca Urbanization (coordinates 466945 E and 2039140 N) and extends east along the coastline to Boca del Soco (coordinates 478304 E and 2040161 N) by an extension of 14.6 km from coastline and a width of 60 m, occupying an area of 0.84 km². This zone coincides with the limits of the 60-m strip established by Law 305-68.
3.2. Strategy 2. Reduce vulnerability in occupied vulnerable sites Although the previous strategy proposes the creation of non-urbanizable areas in areas of high vulnerability, it must be considered that, in San Pedro de Macorís, a product of informal settlements (e.g., the Pedro Justo Carrión neighborhood), unplanned urbanization , buildings without proper drainage designs (e.g. Tetelo Vargas Stadium and parking lot of Central Eastern University) and even inadequate resettlement, there are several areas vulnerable to flooding that have been occupied and that cannot be forgotten in a municipal adaptation plan. Therefore, Strategy 2 includes actions (Table 5) to reduce or eliminate the impact of climatic threats on the population and infrastructure located in vulnerable places, through structural measures (e.g. flood management and control technologies). and non-structural (housing census and early warning systems or contingency plans), which contribute to the reduction of sensitivity. Eventually, resettlement of the population could be managed, which would contribute to the reduction of exposure, although this alternative requires more time, resources and coordination with the Central Government. Table 5. Adaptation measures within Strategy 2 validated by the City of San Pedro de Macorís. 3.2. Strategy 2 Although Strategy 1 proposes the creation of no-development areas in highly vulnerable areas, adaptation measures for informal settlements or unplanned urbanization already established in vulnerable areas should still be considered. This strategy aims to reduce or eliminate the impacts of flooding on the population and infrastructure located in vulnerable sites. The strategy includes structural measures (for example, technology management and flood control) and nonstructural measures (early warning systems) to reduce sensitivity, and resettlement to reduce exposure (Table 3). Table 3. Priority adaptation measures for Strategy 2.
Sectors and services Adaptation measure Action Area Responsible Z R P T
Planning, population, infrastructure and environment
2.1. Conduct a census of households in coastal areas to declare no-development areas and assess appropriate short and medium term structural and nonstructural measures, including selective resettlement (linked to the model of Project Juan Boch City)
Blanco, Punta La Garza and
Pescadora ASPM, GC POSC X M
Planning, population, infrastructure and environment
2.2. Flood management project in the neighborhood Pedro Justo Carrión through a neighborhood design with paving, ditches, and trenches to divert water, planting trees, and creating drainage spaces
Pedro Justo Carrión
INAPA, ASPM, DGODT, MMA,
POSC i X M
Formatted: Font: Not Bold, Font color: Text 1
Formatted: Font: Not Bold, Font color: Text 1
Formatted: Font: Not Bold, Font color: Text 1
Formatted: Font: Not Bold, Font color: Text 1
Formatted: Font: Not Bold, Font color: Text 1
Formatted: Font: Not Bold, Font color: Text 1, English(United States)
Formatted: English (United States)
Formatted: Font: Gill Sans MT
Formatted: Font: Gill Sans MT, 10 pt
Formatted: Font: 10 pt
Formatted: Font: 10 pt
Formatted: Spanish (Spain)
Formatted: Font: Bold
Formatted: Spanish (Spain)
19
Sectors and services Adaptation measure Action Area Responsible Z R P T
Planning, population, infrastructure and environment
2.3. Identify and implement local solutions to flooding by managing the soil infiltration capacity of the soil using multiplethrough existing modern technologies technologies (from biofiltration to permeable pavements) at specific some locations (e.g., Stadium Tetelo Vargas and UCE parking of UCE)
Stadium flood-prone areas
and UCE
INAPA CODIA, ASPM, DGODT, INAPA CODIA, MMA, SP, UCE
X M
Planning, population, infrastructure and environment
2.4. Develop out climate contingency plans for extreme weather impacts on wastewater and industrial infrastructure on the waterfront of the Higuamo River and the coast
Higuamo River and
coast
CPPMR, INAPA ASPM, CPPMR,
SINDSind, ASPM, INAPA
X C
Planning, population, infrastructure and environment
2.5. Incorporate actions to reduce vulnerability to flooding (e.g., canalization and drainage) into the the participatory budget projects by sector and neighborhoods
Municipality ASPM, POSC X M
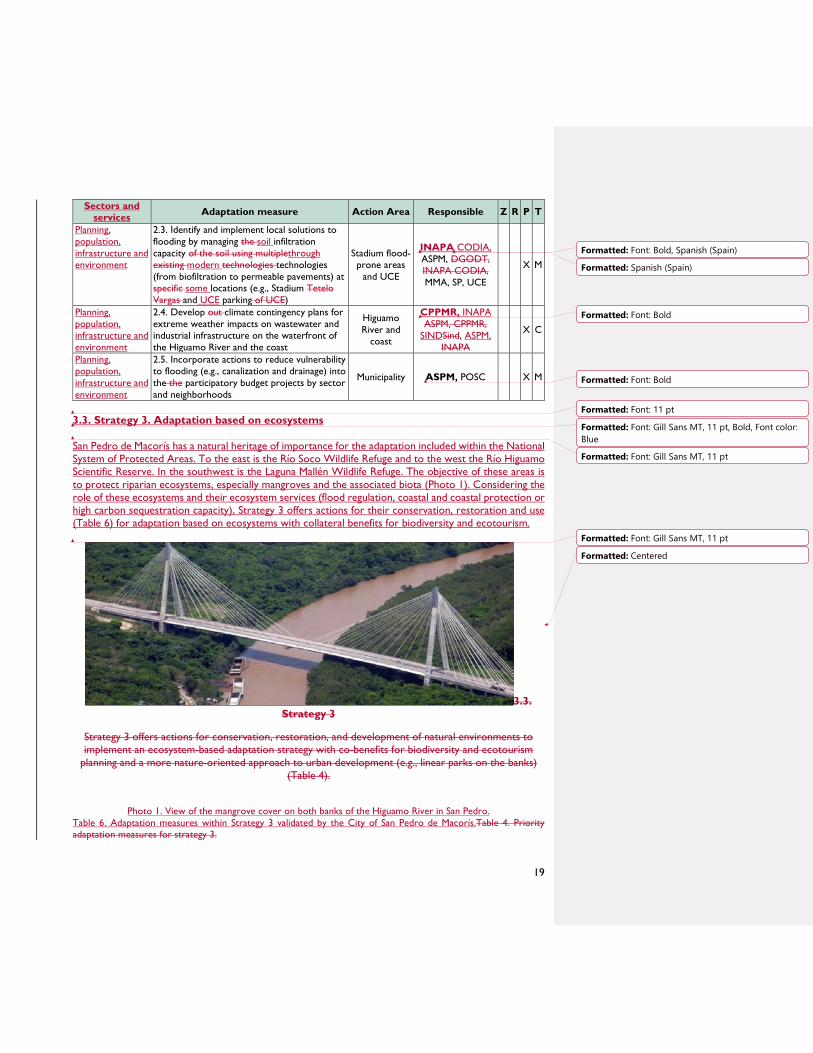
3.3. Strategy 3. Adaptation based on ecosystems San Pedro de Macorís has a natural heritage of importance for the adaptation included within the National System of Protected Areas. To the east is the Río Soco Wildlife Refuge and to the west the Río Higuamo Scientific Reserve. In the southwest is the Laguna Mallén Wildlife Refuge. The objective of these areas is to protect riparian ecosystems, especially mangroves and the associated biota (Photo 1). Considering the role of these ecosystems and their ecosystem services (flood regulation, coastal and coastal protection or high carbon sequestration capacity), Strategy 3 offers actions for their conservation, restoration and use (Table 6) for adaptation based on ecosystems with collateral benefits for biodiversity and ecotourism.
3.3. Strategy 3
Strategy 3 offers actions for conservation, restoration, and development of natural environments to implement an ecosystem-based adaptation strategy with co-benefits for biodiversity and ecotourism
planning and a more nature-oriented approach to urban development (e.g., linear parks on the banks) (Table 4).
Photo 1. View of the mangrove cover on both banks of the Higuamo River in San Pedro. Table 6. Adaptation measures within Strategy 3 validated by the City of San Pedro de Macorís.Table 4. Priority adaptation measures for strategy 3.
Formatted: Font: Bold, Spanish (Spain)
Formatted: Spanish (Spain)
Formatted: Font: Bold
Formatted: Font: Bold
Formatted: Font: 11 pt
Formatted: Font: Gill Sans MT, 11 pt, Bold, Font color:Blue
Formatted: Font: Gill Sans MT, 11 pt
Formatted: Font: Gill Sans MT, 11 pt
Formatted: Centered
20
Sectors and
services Adaptation measure Action Area Responsible Z R P T
Biodiversity and green spaces
3.1. Develop management plans for the three RVS of the municipality, to strengthen environmental criteria in the proposed zoning
All RVS MMA, ASPM,
MMA, MV, PLM, FB, CH, ASPM
X C
Biodiversity and green spaces
3.2. Ecological restoration project on the banks of Soco and Higuamo rivers, Laguna MallenMallén, and the coastal zone (e.g., cleaning, sanitation and reforestation)
All RVS and coastal area
ASPM, MMA, MV, PLM, FB, CH,
ASPM, X M
Planning, population, infrastructure and environment
3.3. Engineering project in Laguna MallenMallén: delimitation, topographic survey, bathymetric and hydrological modeling, dredging, assessment of the capacity and water quality, creation of plant cover, and rehabilitation of the channel
RVS Laguna MallenMallén
Lagoon
ASPM, MMA, CODIA, INDHRI
ASPM, MMA, CODIA, INDHRI
X L
Planning, population, infrastructure and environment
3.45. Project to recover and maintain Playa El Faro: information gathering, technical workshop discussion, and definition of actions for implementation
Playa El Faro Beach
CPSPM ASPM, MITUR, MMA,
CPSPM X M
3.4. Strategy 4. Increase urban green coverage Strategy 4 manages a similar principle that the previous strategy but in the urban area, with actions (Table 7) to develop the vegetation cover (forests, parks and urban gardens) in a continuous green circuit (corridors) that favors the adaptation with the co-benefit of improving the urban landscape and increasing biodiversity. The urban trees provide shade and cooling by evaporation, helping to reduce the temperature during heat waves; and interception spaces, storage and infiltration of rainwater. It is advisable to use the ITree tools (2017) that are already implemented in the country (Domínguez and Bauer, 2016). As part of this strategy green facades, roofs, vertical gardens and other innovative systems should be included. Table 7. Adaptation measures within Strategy 4 validated by the City of San Pedro de Macorís. Note. The first number of the measure relates to an adaptation strategy.3.4. Strategy 4 Strategy 4 focuses on ecosystem-based adaptation measures for urban areas, with efforts to develop the plant cover (i.e., urban trees) in a continuous green circuit with the co-benefit of improving the urban landscape and increasing biodiversity. Urban trees provide shade and evaporative cooling which help reduce the temperature during heat waves, and infiltrate rainwater. Table 5. Priority adaptation measures for strategy 4.
Sectors and services Adaptation measure Action
Area Responsible Z R P T
Biodiversity and green spaces
4.1. Urban reforestation in selected sites, taking advantage of the natural urban land and increasing the green infrastructure to create continuous corridors linked with the natural spaces (iTree Tools4)
Urban zone
ASPM, JBN, MMA X C
4 These tools offer a comprehensive assessment of structural and functional value of the urban forest withallow information on the number and species and of trees, and their diameters, coverage (%), pollutants removal of pollutants (tons / year), storage (tonnes) and capture, (tons / year) of carbon, oxygen production (tons / year), and avoided runoff (m3 / year), energy saving buildings ($) and avoided carbon emissions (tons / year), carbon storage (tonnes), avoided runoff (m3/year) and, energy saving buildings ($). offering a comprehensive assessment of structural and functional value of the urban forest.
Formatted Table
Formatted: Font: Bold
Formatted: Font: Bold
Formatted: Font: Bold
Formatted: Font: Bold
Formatted: Font: 11 pt
Formatted: Font: Gill Sans MT, 11 pt, Bold, Font color:Blue
Formatted: Font: Gill Sans MT, 11 pt
Formatted: Justified
Formatted: Font: Gill Sans MT, 11 pt
Formatted: Font: Gill Sans MT, 11 pt
Formatted: Font: Gill Sans MT, 11 pt
Formatted: Font: Gill Sans MT, 11 pt
Formatted: Font: Gill Sans MT, 10 pt
Formatted: Font: 10 pt
Formatted: Left
Formatted Table
Formatted: Font: Bold
Formatted: Superscript
21
3.5. Strategy 5. Protection and adaptation of key municipal objectives Strategy 5 contains actions (Table 8) for the rescue, protection and adaptation of key objectives of municipal development, represented in San Pedro de Macorís, as decided by the City Council, by the assets of its heritage: historical: cultural (art museums and history), built (monuments, buildings and historical houses) or intangible (carnivals, artistic expressions and traditional knowledge), which play a role in preserving the cultural values and identity of a municipality that aspires to the development of heritage tourism from of this historical wealth, which has recently been mapped as part of the present process of municipal adaptation (Figure 4). 3.5. Strategy 5 Strategy 5 deals with the rescue, protection, and adaptation of San Pedro’s heritage, one of the key sectors of municipal development. Heritage assets include cultural sites (art and history museums), built sites (monuments, historic buildings and houses, and religious sites), and intangibles (carnivals, artistic expressions, and traditional knowledge). Building resilience to this sector would play a role in preserving the cultural values and identity of the municipality which aspires to develop heritage tourism. Table 8. Adaptation measures within Strategy 5 validated by the City of San Pedro de Macorís. Note. The first number of the measure relates to an adaptation strategy. Table 6. Priority adaptation measures for strategy 5.
Sectors and services Adaptation measure Action
Area Responsible Z R P T
Tourism, Heritage, Education
5.1. Inventory, catalog and update maps of cultural and built heritage sites (e.g., art and history museums, monuments, historic buildings and houses, and religious sites)
Historical Center
MIC, ASPM, MIC, MITUR,
UCE X C
Tourism, Heritage, Education
5.2. Multiple assessments of built municipal heritage sites for value, condition, and climate vulnerability
Historical Center
MIC, ASPM, ASPM, MIC, MITUR, UCE
X M
Tourism, Heritage, Education
5.3. Application of rescue techniques, maintenance, and preservation of select municipal heritage sites in vulnerable areas
Historical Center
MIC, ASPM, ASPM, MIC, MITUR, UCE
X L
Formatted: Font: Not Bold, Font color: Text 1
Formatted: Font: 10 pt
Formatted: Font: Gill Sans MT, 10 pt
Formatted: Font: 10 pt
Formatted Table
Formatted: Font: Bold

22
Figure 4. Cartographic inventory of heritage sites as support for adaptation. 3.6. Strategy 6. Reduce synergies between climate and non-climate impacts Climate impacts are aggravated by non-climatic impacts that have their origin in poor management of some basic services. In San Pedro the floods are aggravated by the scarce coverage of the storm water drainage system, which is joined by the dispersion of solid waste that obstructs the scarce drainage. In the impact of heat waves there is an incidence of anthropogenic heat sources that contribute to urban warming, such as industry and transport. The malfunctioning of the potable water system treatment plant exacerbates the impact of a water scarcity scenario. The deficiencies of the sanitary sewer system cause the wastewater to overflow from the rains, exacerbating the problem of flooding with health risks. Considering this problem, Strategy 6 focuses on actions that avoid or help to reduce this negative synergy (Table 9). In this strategy, the approach of climatic risks and environmental management converge, which has important co-benefits for the environment and for the improvement of the municipal basic services. Table 9. Adaptation measures within Strategy 6 validated by the City of San Pedro de Macorís. Note. The first number of the measure relates to an adaptation strategy.
Formatted: Font: 10 pt
Formatted: Centered
Formatted: Font: Gill Sans MT, 11 pt, Bold, Font color:Blue
Formatted: Font: Gill Sans MT, 11 pt
Formatted: Font: Gill Sans MT, 11 pt
Formatted: Font: Gill Sans MT, 11 pt
Formatted: Font: Gill Sans MT, 11 pt
Formatted: Font: Gill Sans MT, 11 pt
Formatted: Font: Gill Sans MT, 11 pt
Formatted: Font: Gill Sans MT, 11 pt
Formatted: Font: Gill Sans MT, 11 pt
Formatted: Font: Gill Sans MT, 10 pt
Formatted: Font: 10 pt

23
Sectors and services Adaptation measure Action
Area Responsible Z R P T
Solid wastes
6.1. Implement an integrated municipal solid waste management system in San Pedro de Macoris that addresses environmental issues and provides adaptation measures for the sector5
Municipality ASPM, MMA,
MISPAS, SP, ECORED6
X M
Water supply 6.2. Offer definitive solutions to the interruptions of the electric service in the drinking water system, especially in the water treatment plant.
Treatment plant
INAPA, ASPM, EDEESTE X C
Energy
6.3. Promotion of clean energies with design of a national-local strategy aimed at transforming the energy system used in the municipality to reduce the heat island effect while improving the natural environment and reducing production costs.
Municipality EDEESTE,
ASPM, SIND
X L
Transport
6.4. Mobility plan with actions to improve the urban connection, organize travel (pedestrian and motorized) while helping to reduce the anthropogenic heat of the transport system that contributes to urban warming
Municipality INTRANS,
ASPM
X L
Sewage system
6.5. Articulation between the national government and the municipality to expand the coverage of the sanitary sewer system in the urban area, eliminating its dispersion during floods. Municipality
Municipality INAPA, ASPM, GC X L
Storm water
6.6. Construction of the storm water drainage system (articulated to the creeks recovery program) to reduce the problem of flooding in the urban area.
Municipality INAPA, ASPM, GC X L
3.6. Strategy 6 Climate impacts are aggravated by non-climatic impacts resulting from poor management of some basic services (e.g., solid waste or water supply) and lack of coordination between the governing institutions and sectors of these services. Therefore, Strategy 6 focuses on institutional and sectoral strengthening with the aim of avoiding or helping to reduce these negative synergies. This strategy has co-benefits for the urban environment and the improvement of basic services. This strategy is intended to increase the adaptive capacity of institutions. Table 7. Priority adaptation measures for strategy 6. 3.7. Strategy 7. Institutional and sectoral strengthening for adaptation The lack of coordination between institutions (e.g. decisions found regarding the use of land between the City Council and a ministry), the lack of recognition and respect for the functions of each entity or the assumption by certain sectors of responsibilities that they do not correspond, it is a serious problem that prevents problems of vulnerability from being addressed from an integral perspective and therefore harms
5 The system must be in line with the Ministry of Environment’s policy for the integrated municipal solid waste management (2014). The adaptation measure will have the co-benefit to help address public health and reduce flooding related to obstruction of drainage due to dispersion of solid waste. 6 Currently the National Network of Business Support for Environmental Protection (ECORED) implements the Inclusive Recycling Project in San Pedro de Macorís, with the support of the City Council.
Formatted Table
Formatted: Font: Bold
Formatted: Font: 10 pt
Formatted: Font: Gill Sans MT, 10 pt
Formatted: Font: Gill Sans MT
Formatted: Space After: 0 pt, Line spacing: single
Formatted: Font: Gill Sans MT, 11 pt, Bold, Font color:Blue
Formatted: Justified
Formatted: Font: Gill Sans MT, 11 pt
Formatted: Font: Gill Sans MT, 11 pt
24
adaptation. In addition, this problem causes neglect of basic services with deficiencies that end up interacting negatively with the impacts of climate to aggravate its consequences. This situation is addressed by Strategy 7, which creates alliances and commitments, and strengthens institutions and sectors as part of a participatory governance, focused on the growth of institutional adaptive capacity, having a definitive impact on the creation of new forms of relationships and structures. organizations that guarantee that each entity plays the role that corresponds to it in a framework of complementation of functions and agreed solutions (Table 10). Table 10. Adaptation measures within Strategy 7 validated by the City of San Pedro de Macorís. Note. The first number of the measure relates to an adaptation strategy. 3.7. Strategy 7 This strategy focuses on identifying and investing in priority research and information needs to improve understanding of climate-related vulnerabilities. This strategy is intended to increase the municipality’s technological adaptive capacity. Table 8. Priority adaptation measures for Strategy 7. Sectors and
services Adaptation measure Action Area Responsible Z R P T
Participatory governance
7.1. Concentration of efforts and interests around the City Council and the Development Council to achieve an inter-sectoral and inter-institutional coordination that guarantees the recognition and respect of the functions of each entity and complementation to address and solve the problems of vulnerability, offer quality services, the protection of natural resources and the proper use of public spaces.7.1. Conduct a technical study using LIDAR technology to update urban topographical maps in order to inform neighborhood flooding actions in the context of the natural drainage pattern of the territory
Urban zoneMunicipality
ASPM, CD, IP, SP,
POSCASPM, UCE
X X MC
3.8. Strategy 8. Information and research to focus adaptation Strategy 8 contains actions to address the information and research needs required by the municipality to focus on adaptation (Table 11). The strategy aims at the growth of adaptive capacity in technology (available adaptation technologies, flood control options, technical capacity, early warning systems or availability and management of climate information). Vulnerability is conditioned by climatic, spatial and socio-economic factors -historical and present- that are particular to the territory that should be investigated and known, since adaptation works best when it is based on technical criteria (for example, precision topography allows the identification of areas of Flooding and safe urbanization areas) Table 11. Adaptation measures within Strategy 8 validated by the City of San Pedro de Macorís. Note. The first number of the measure relates to an adaptation strategy.
Sectors and services Adaptation measure Action
Area Responsible Z R P T
Research
8.1. Carry out a technical study to update the urban topography (LIDAR technology) to have a precise topographic map that allows actions to resolve floods in the context of the natural drainage pattern of the territory.
Urban zone UCE, ASPM X M
Formatted: Font: Gill Sans MT, 10 pt
Formatted: Font: 10 pt
Formatted: Font: 10 pt
Formatted Table
Formatted: Font: Bold
Formatted: Font: Bold
Formatted: Font: Gill Sans MT, 11 pt, Bold, Font color:Blue
Formatted: Font: Gill Sans MT, 11 pt
Formatted: Font: Gill Sans MT, 10 pt
Formatted: Font: 10 pt
Formatted Table
Formatted: English (United States)

25
3.8. Strategy 8 This strategy focuses on increasing education and public awareness of climate change risks and its relationship to land use management. Table 9. Priority adaptation measures for Strategy 8.
Adaptation measure Action Area Responsible Z R P T
8.1. Education program on land use, climate change, and integrated risk management7 Municipality ASPM, MINERD,
UCE X C
3.9. Strategy 9. Training and awareness for adaptation The ability to manage and understand climate information and a correct perception of risk are crucial to increase adaptive capacity and reduce vulnerability to climate variations. Strategy 9 proposes actions within a comprehensive training program (workshops, lectures and diplomas) for teachers of the basic and middle level, the incorporation of climate issues into the student curriculum, use of murals (graffiti) as part of the education program to citizenship and the dissemination of education and climate messages at different levels (Table 12). Table 12. Adaptation measures within Strategy 9 validated by the City of San Pedro de Macorís. Note. The first number of the measure relates to an adaptation strategy.
Sectors and services Adaptation measure Action
Area Responsible Z R P T
Education 9.1. Comprehensive education program at different levels on territorial planning, climate change and risk management.
Municipality MINERD, UCE, ASPM X C
4. IMPLEMENTATION CRITERIA 4.1. Creation of a technical team Adaptation to climate change is a complex and transversal process that must be undertaken as part of the development of the municipality with the commitment of a range of stakeholders including local government, public institutions and civil society. In this context, the first step is the definition of an operational structure, a Municipal Technical Team for Climate Change (ETMCC) to facilitate the implementation of cross-sectoral and sectorial actions and monitor these actions as part of a monitoring, evaluation and updating system. The scheme of the operational structure for implementation corresponds to an intersectoral approach, led by the City Council and the participation of public institutions and civil society. The creation of an ETMCC responds to the action plan to concentrate efforts and interests around the City Council and the Development Council to achieve intersectoral and inter-institutional coordination to ensure the recognition and respect of the functions of each entity and the complementation solution for address the problems of vulnerability, offering quality services, protection of natural resources and the proper use of public spaces. After the creation of an operational structure
7 Training (workshops, lectures, and diplomados) for basic and mid-level teachers, a student curriculum that incorporates the issue of climate, use of murals (graffiti) as part of the program for civic education and dissemination of messages.
Formatted: Font: 10 pt
Formatted: Font: Gill Sans MT, 11 pt
Formatted: Font: Bold
Formatted: Font: Bold, Font color: Blue
Formatted: Font: 10 pt
Formatted Table
Formatted: Font: Gill Sans MT, 11 pt, (Asian) Japanese
Formatted: Font: Bold, Font color: Blue, (Asian)Japanese
Formatted: Font: Gill Sans MT, 11 pt
Formatted: Normal, Justified
Formatted: Font: Gill Sans MT
Formatted: Font: Gill Sans MT, 11 pt
Formatted: Font: Gill Sans MT
Formatted: Font: Gill Sans MT, Not Bold, Font color:Auto
Formatted: Font: 11 pt, Not Bold, Font color: Auto
Formatted: Normal
Formatted: Font: 11 pt
Formatted: Font: 11 pt, Not Bold, Font color: Auto
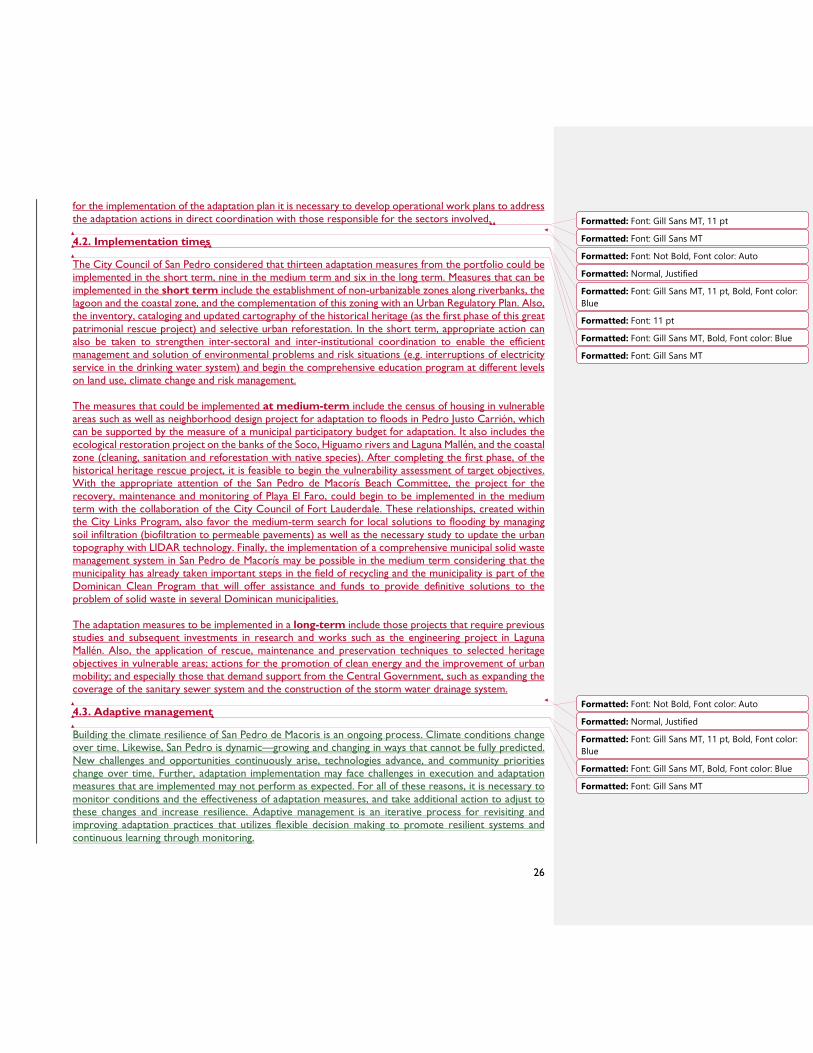
26
for the implementation of the adaptation plan it is necessary to develop operational work plans to address the adaptation actions in direct coordination with those responsible for the sectors involved. 4.2. Implementation times The City Council of San Pedro considered that thirteen adaptation measures from the portfolio could be implemented in the short term, nine in the medium term and six in the long term. Measures that can be implemented in the short term include the establishment of non-urbanizable zones along riverbanks, the lagoon and the coastal zone, and the complementation of this zoning with an Urban Regulatory Plan. Also, the inventory, cataloging and updated cartography of the historical heritage (as the first phase of this great patrimonial rescue project) and selective urban reforestation. In the short term, appropriate action can also be taken to strengthen inter-sectoral and inter-institutional coordination to enable the efficient management and solution of environmental problems and risk situations (e.g. interruptions of electricity service in the drinking water system) and begin the comprehensive education program at different levels on land use, climate change and risk management. The measures that could be implemented at medium-term include the census of housing in vulnerable areas such as well as neighborhood design project for adaptation to floods in Pedro Justo Carrión, which can be supported by the measure of a municipal participatory budget for adaptation. It also includes the ecological restoration project on the banks of the Soco, Higuamo rivers and Laguna Mallén, and the coastal zone (cleaning, sanitation and reforestation with native species). After completing the first phase, of the historical heritage rescue project, it is feasible to begin the vulnerability assessment of target objectives. With the appropriate attention of the San Pedro de Macorís Beach Committee, the project for the recovery, maintenance and monitoring of Playa El Faro, could begin to be implemented in the medium term with the collaboration of the City Council of Fort Lauderdale. These relationships, created within the City Links Program, also favor the medium-term search for local solutions to flooding by managing soil infiltration (biofiltration to permeable pavements) as well as the necessary study to update the urban topography with LIDAR technology. Finally, the implementation of a comprehensive municipal solid waste management system in San Pedro de Macorís may be possible in the medium term considering that the municipality has already taken important steps in the field of recycling and the municipality is part of the Dominican Clean Program that will offer assistance and funds to provide definitive solutions to the problem of solid waste in several Dominican municipalities. The adaptation measures to be implemented in a long-term include those projects that require previous studies and subsequent investments in research and works such as the engineering project in Laguna Mallén. Also, the application of rescue, maintenance and preservation techniques to selected heritage objectives in vulnerable areas; actions for the promotion of clean energy and the improvement of urban mobility; and especially those that demand support from the Central Government, such as expanding the coverage of the sanitary sewer system and the construction of the storm water drainage system. 4.3. Adaptive management Building the climate resilience of San Pedro de Macoris is an ongoing process. Climate conditions change over time. Likewise, San Pedro is dynamic—growing and changing in ways that cannot be fully predicted. New challenges and opportunities continuously arise, technologies advance, and community priorities change over time. Further, adaptation implementation may face challenges in execution and adaptation measures that are implemented may not perform as expected. For all of these reasons, it is necessary to monitor conditions and the effectiveness of adaptation measures, and take additional action to adjust to these changes and increase resilience. Adaptive management is an iterative process for revisiting and improving adaptation practices that utilizes flexible decision making to promote resilient systems and continuous learning through monitoring.
Formatted: Font: Gill Sans MT, 11 pt
Formatted: Font: Gill Sans MT
Formatted: Font: Not Bold, Font color: Auto
Formatted: Normal, Justified
Formatted: Font: Gill Sans MT, 11 pt, Bold, Font color:Blue
Formatted: Font: 11 pt
Formatted: Font: Gill Sans MT, Bold, Font color: Blue
Formatted: Font: Gill Sans MT
Formatted: Font: Not Bold, Font color: Auto
Formatted: Normal, Justified
Formatted: Font: Gill Sans MT, 11 pt, Bold, Font color:Blue
Formatted: Font: Gill Sans MT, Bold, Font color: Blue
Formatted: Font: Gill Sans MT

27
The monitoring and evaluation and adaptive management process should be led by the ETMCC. During the implementation phase, adaptation measures identified in this plan must undergo a process of monitoring and evaluation to track the progress and performance and serve as a starting point for improving adaptation practices. Monitoring and evaluation will require defining specific indicators to estimate the estimate the progress of implementation and effectiveness of the adaptation measures. Through this evaluation, the municipality can identify the reasons the measures have been effective or ineffective and begin the process of identifying techniques to change, supplement, or add to the adaptation measures in place and continually advance San Pedro de Macoris towards resilience. 4. Toward a More Climate-Resilient San Pedro de Macoris: Implementing Priority Adaptation Measures 4.1. Creation of a technical team Adaptation to climate change is a complex and cross-process that must be undertaken as part of the development of the municipality with the engagement of a range of stakeholders including the local government, public institutions, and civil society. In this context, the first step is the definition of an operational structure, a Municipal Technical Team on Climate Change (ETMCC) to facilitate the implementation of actions, both transversal and sectoral, and to monitor these actions as part of a system monitoring, evaluation and updating. The scheme of the operating structure for implementation corresponds to an intersectoral approach, led by Hall and involvement of public institutions and civil society. Creating a ETMCC responds to the action plan to concentrate efforts and interests around the City Hall and Development Council to achieve inter-sectoral and inter-institutional coordination to ensure the recognition and respect for the roles of each entity and the complementation solution to address the problems of vulnerability, offering quality services, protection of natural resources and the proper use of public spaces. After the creation of an operational structure for the implementation of the adaptation plan is necessary to develop operational workplans to address the actions that can be grouped into three lines: a) PMOTs, b) sectoral c) cross. 4.2. Adaptive management Building the climate resilience of San Pedro de Macoris is an ongoing process. Climate conditions change over time. Likewise, San Pedro is dynamic—growing and changing in ways that cannot be fully predicted. New challenges and opportunities continuously arise, technologies advance, and community priorities change over time. Further, adaptation implementation may face challenges in execution and adaptation measures that are implemented may not perform as expected. For all of these reasons, it is necessary to monitor conditions and the effectiveness of adaptation measures, and take additional action to adjust to these changes and increase resilience. Adaptive management is an iterative process for revisiting and improving adaptation practices that utilizes flexible decision making to promote resilient systems and continuous learning through monitoring. The monitoring and evaluation and adaptive management process should be led by the ETMCC. During the implementation phase, adaptation measures identified in this plan must undergo a process of monitoring and evaluation to track the progress and performance and serve as a starting point for improving adaptation practices. Monitoring and evaluation will require defining specific indicators to estimate the estimate the progress of implementation and effectiveness of the adaptation measures. Through this evaluation, the municipality can identify the reasons the measures have been effective or ineffective and begin the process of identifying techniques to change, supplement, or add to the adaptation measures in place and continually advance San Pedro de Macoris towards resilience.
Commented [WA3]: Clean up this English
Formatted: Font: Gill Sans MT
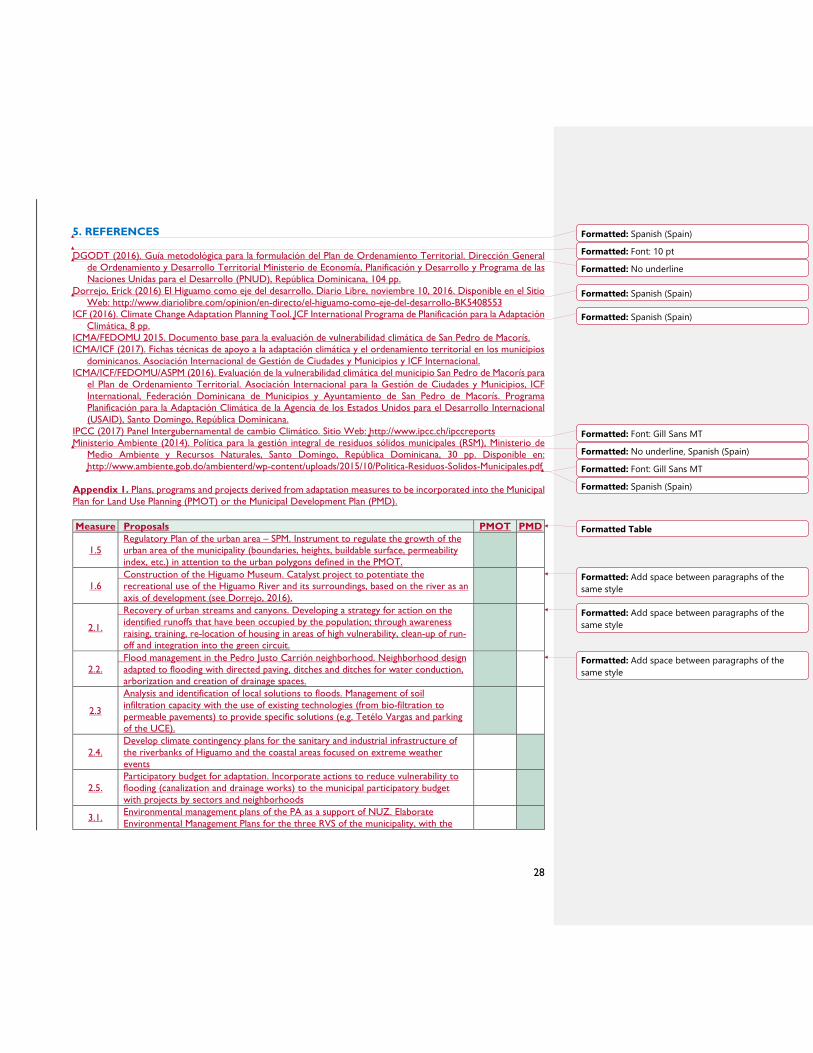
28
5. REFERENCES DGODT (2016). Guía metodológica para la formulación del Plan de Ordenamiento Territorial. Dirección General
de Ordenamiento y Desarrollo Territorial Ministerio de Economía, Planificación y Desarrollo y Programa de las Naciones Unidas para el Desarrollo (PNUD), República Dominicana, 104 pp.
Dorrejo, Erick (2016) El Higuamo como eje del desarrollo. Diario Libre, noviembre 10, 2016. Disponible en el Sitio Web: http://www.diariolibre.com/opinion/en-directo/el-higuamo-como-eje-del-desarrollo-BK5408553
ICF (2016). Climate Change Adaptation Planning Tool. ICF International Programa de Planificación para la Adaptación Climática, 8 pp.
ICMA/FEDOMU 2015. Documento base para la evaluación de vulnerabilidad climática de San Pedro de Macorís. ICMA/ICF (2017). Fichas técnicas de apoyo a la adaptación climática y el ordenamiento territorial en los municipios
dominicanos. Asociación Internacional de Gestión de Ciudades y Municipios y ICF Internacional. ICMA/ICF/FEDOMU/ASPM (2016). Evaluación de la vulnerabilidad climática del municipio San Pedro de Macorís para
el Plan de Ordenamiento Territorial. Asociación Internacional para la Gestión de Ciudades y Municipios, ICF International, Federación Dominicana de Municipios y Ayuntamiento de San Pedro de Macorís. Programa Planificación para la Adaptación Climática de la Agencia de los Estados Unidos para el Desarrollo Internacional (USAID), Santo Domingo, República Dominicana.
IPCC (2017) Panel Intergubernamental de cambio Climático. Sitio Web: http://www.ipcc.ch/ipccreports Ministerio Ambiente (2014). Política para la gestión integral de residuos sólidos municipales (RSM), Ministerio de
Medio Ambiente y Recursos Naturales, Santo Domingo, República Dominicana, 30 pp. Disponible en: http://www.ambiente.gob.do/ambienterd/wp-content/uploads/2015/10/Politica-Residuos-Solidos-Municipales.pdf
Appendix 1. Plans, programs and projects derived from adaptation measures to be incorporated into the Municipal Plan for Land Use Planning (PMOT) or the Municipal Development Plan (PMD). Measure Proposals PMOT PMD
1.5 Regulatory Plan of the urban area – SPM. Instrument to regulate the growth of the urban area of the municipality (boundaries, heights, buildable surface, permeability index, etc.) in attention to the urban polygons defined in the PMOT.
1.6 Construction of the Higuamo Museum. Catalyst project to potentiate the
recreational use of the Higuamo River and its surroundings, based on the river as an axis of development (see Dorrejo, 2016).
2.1.
Recovery of urban streams and canyons. Developing a strategy for action on the identified runoffs that have been occupied by the population; through awareness raising, training, re-location of housing in areas of high vulnerability, clean-up of run-off and integration into the green circuit.
2.2. Flood management in the Pedro Justo Carrión neighborhood. Neighborhood design
adapted to flooding with directed paving, ditches and ditches for water conduction, arborization and creation of drainage spaces.
2.3
Analysis and identification of local solutions to floods. Management of soil infiltration capacity with the use of existing technologies (from bio-filtration to permeable pavements) to provide specific solutions (e.g. Tetélo Vargas and parking of the UCE).
2.4. Develop climate contingency plans for the sanitary and industrial infrastructure of the riverbanks of Higuamo and the coastal areas focused on extreme weather events
2.5. Participatory budget for adaptation. Incorporate actions to reduce vulnerability to flooding (canalization and drainage works) to the municipal participatory budget with projects by sectors and neighborhoods
3.1. Environmental management plans of the PA as a support of NUZ. Elaborate Environmental Management Plans for the three RVS of the municipality, with the
Formatted: Spanish (Spain)
Formatted: Font: 10 pt
Formatted: No underline
Formatted: Spanish (Spain)
Formatted: Spanish (Spain)
Formatted: Font: Gill Sans MT
Formatted: No underline, Spanish (Spain)
Formatted: Font: Gill Sans MT
Formatted: Spanish (Spain)
Formatted Table
Formatted: Add space between paragraphs of thesame style
Formatted: Add space between paragraphs of thesame style
Formatted: Add space between paragraphs of thesame style
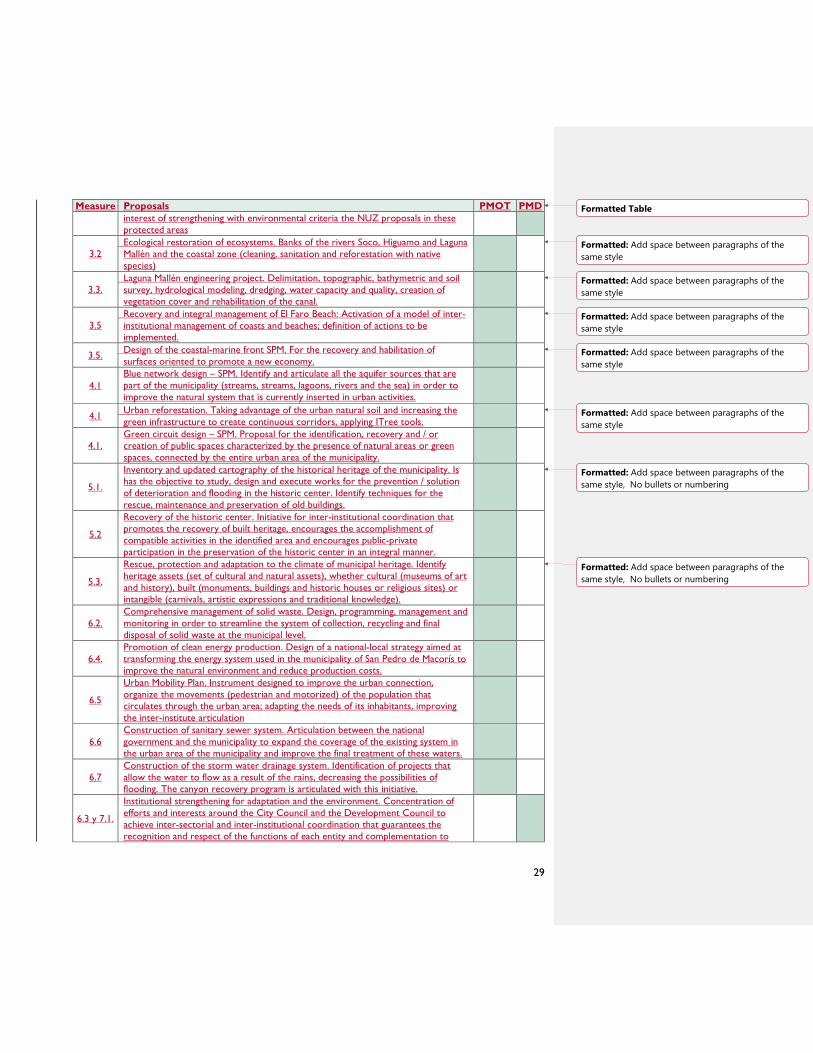
29
Measure Proposals PMOT PMD interest of strengthening with environmental criteria the NUZ proposals in these protected areas
3.2 Ecological restoration of ecosystems. Banks of the rivers Soco, Higuamo and Laguna
Mallén and the coastal zone (cleaning, sanitation and reforestation with native species)
3.3. Laguna Mallén engineering project. Delimitation, topographic, bathymetric and soil
survey, hydrological modeling, dredging, water capacity and quality, creation of vegetation cover and rehabilitation of the canal.
3.5 Recovery and integral management of El Faro Beach: Activation of a model of inter-
institutional management of coasts and beaches; definition of actions to be implemented.
3.5. Design of the coastal-marine front SPM. For the recovery and habilitation of surfaces oriented to promote a new economy.
4.1 Blue network design – SPM. Identify and articulate all the aquifer sources that are part of the municipality (streams, streams, lagoons, rivers and the sea) in order to improve the natural system that is currently inserted in urban activities.
4.1 Urban reforestation. Taking advantage of the urban natural soil and increasing the green infrastructure to create continuous corridors, applying ITree tools.
4.1. Green circuit design – SPM. Proposal for the identification, recovery and / or creation of public spaces characterized by the presence of natural areas or green spaces, connected by the entire urban area of the municipality.
5.1.
Inventory and updated cartography of the historical heritage of the municipality. Is has the objective to study, design and execute works for the prevention / solution of deterioration and flooding in the historic center. Identify techniques for the rescue, maintenance and preservation of old buildings.
5.2
Recovery of the historic center. Initiative for inter-institutional coordination that promotes the recovery of built heritage, encourages the accomplishment of compatible activities in the identified area and encourages public-private participation in the preservation of the historic center in an integral manner.
5.3.
Rescue, protection and adaptation to the climate of municipal heritage. Identify heritage assets (set of cultural and natural assets), whether cultural (museums of art and history), built (monuments, buildings and historic houses or religious sites) or intangible (carnivals, artistic expressions and traditional knowledge).
6.2. Comprehensive management of solid waste. Design, programming, management and monitoring in order to streamline the system of collection, recycling and final disposal of solid waste at the municipal level.
6.4. Promotion of clean energy production. Design of a national-local strategy aimed at transforming the energy system used in the municipality of San Pedro de Macorís to improve the natural environment and reduce production costs.
6.5
Urban Mobility Plan. Instrument designed to improve the urban connection, organize the movements (pedestrian and motorized) of the population that circulates through the urban area; adapting the needs of its inhabitants, improving the inter-institute articulation
6.6 Construction of sanitary sewer system. Articulation between the national government and the municipality to expand the coverage of the existing system in the urban area of the municipality and improve the final treatment of these waters.
6.7 Construction of the storm water drainage system. Identification of projects that allow the water to flow as a result of the rains, decreasing the possibilities of flooding. The canyon recovery program is articulated with this initiative.
6.3 y 7.1.
Institutional strengthening for adaptation and the environment. Concentration of efforts and interests around the City Council and the Development Council to achieve inter-sectorial and inter-institutional coordination that guarantees the recognition and respect of the functions of each entity and complementation to
Formatted Table
Formatted: Add space between paragraphs of thesame style
Formatted: Add space between paragraphs of thesame style
Formatted: Add space between paragraphs of thesame style
Formatted: Add space between paragraphs of thesame style
Formatted: Add space between paragraphs of thesame style
Formatted: Add space between paragraphs of thesame style, No bullets or numbering
Formatted: Add space between paragraphs of thesame style, No bullets or numbering

30
Measure Proposals PMOT PMD solve the problems of vulnerability, offer quality services, the protection of natural resources and the proper use of public spaces.
8.1.
Comprehensive research project for municipal adaptation. Carry out a technical study to update the urban topography with LIDAR technology to have a precise urban topographic map that allows actions to resolve neighborhood floods, in the context of the natural drainage pattern of the territory.
9.1
San Pedro de Macorís EMPRENDE. initiative aimed at young people to guide (training and registration) in the process of creating wealth in order to take advantage of opportunities present in the environment or to meet the needs of personal income generating value to the economy and the society.
9.1.
Strengthening of capacities for the management of land use: training for City Council staff, acquisition of hardware, updating of the municipality to new technologies, recruitment of key personnel to implement a monitoring and management system of the territory.
9.1.
Permanent training in territorial planning, climate change and comprehensive risk management. Conducting workshops, lectures and graduate’s courses, for elementary and middle school teachers, incorporating the theme of climate into the student curriculum, using murals (graffiti) as part of the education program citizenship, to spread positive messages.
DGODT (2016). Methodological guide for the formulation of the Land Use Plan. General Directorate for Territorial Planning and
Development Ministry of Economy, Planning and Development and United Nations Development Program (UNDP), the Dominican Republic, 104 pp.
Dorrejo, Erick (2016). The Higuamo center of development. Diario Libre, November 10, 2016. Available on the website: http://www.diariolibre.com/opinion/en-directo/el-higuamo-como-eje-del-desarrollo-BK5408553
ICF (2016). Climate Change Adaptation Planning Tool. ICF InternationalProgram Planning for Climate Adaptation, 8 pp. ICMA / ICF / FEDOMU / ASPM (2016). Assessing climate vulnerability of the municipality San Pedro de Macoris for the Land Use Plan.
International Management Association of Cities and Municipalities, ICF International, Dominican Federation of Municipalities and City of San Pedro de Macoris. Planning for Climate Adaptation Program of the United States Agency for International Development (USAID), Santo Domingo, Dominican Republic.
Ministry of Environment (2014). Policy for the integrated management of municipal solid waste (MSW), Ministry of Environment and Natural Resources, Santo Domingo, Dominican Republic, 30 pp. Available at: http://www.ambiente.gob.do/ambienterd/wp-content/uploads/2015/10/Politica-Residuos-Solidos-Municipales.pdf
IPCC (2017). Intergovernmental Panel on Climate Change. Web site: http://www.ipcc.ch/ipccreports
Formatted Table
Formatted: English (United States)
Formatted: English (United States)
Formatted: No underline
Formatted: Normal, Pattern: Clear
Formatted: Font: Gill Sans MT