Formation photoinduite du radical hydroxyle dans la phase ...
222
HAL Id: tel-01539434 https://tel.archives-ouvertes.fr/tel-01539434 Submitted on 14 Jun 2017 HAL is a multi-disciplinary open access archive for the deposit and dissemination of sci- entific research documents, whether they are pub- lished or not. The documents may come from teaching and research institutions in France or abroad, or from public or private research centers. L’archive ouverte pluridisciplinaire HAL, est destinée au dépôt et à la diffusion de documents scientifiques de niveau recherche, publiés ou non, émanant des établissements d’enseignement et de recherche français ou étrangers, des laboratoires publics ou privés. Formation photoinduite du radical hydroxyle dans la phase aqueuse du nuage : impact sur les acides carboxyliques et les acides aminés Angelica Bianco To cite this version: Angelica Bianco. Formation photoinduite du radical hydroxyle dans la phase aqueuse du nuage: impact sur les acides carboxyliques et les acides aminés. Chimie théorique et/ou physique. Université Blaise Pascal - Clermont-Ferrand II, 2016. Français. NNT: 2016CLF22746. tel-01539434
Transcript of Formation photoinduite du radical hydroxyle dans la phase ...
HAL Id: tel-01539434https://tel.archives-ouvertes.fr/tel-01539434
Submitted on 14 Jun 2017
HAL is a multi-disciplinary open accessarchive for the deposit and dissemination of sci-entific research documents, whether they are pub-lished or not. The documents may come fromteaching and research institutions in France orabroad, or from public or private research centers.
L’archive ouverte pluridisciplinaire HAL, estdestinée au dépôt et à la diffusion de documentsscientifiques de niveau recherche, publiés ou non,émanant des établissements d’enseignement et derecherche français ou étrangers, des laboratoirespublics ou privés.
Formation photoinduite du radical hydroxyle dans laphase aqueuse du nuage : impact sur les acides
carboxyliques et les acides aminésAngelica Bianco
To cite this version:Angelica Bianco. Formation photoinduite du radical hydroxyle dans la phase aqueuse du nuage :impact sur les acides carboxyliques et les acides aminés. Chimie théorique et/ou physique. UniversitéBlaise Pascal - Clermont-Ferrand II, 2016. Français. �NNT : 2016CLF22746�. �tel-01539434�

N° d’Ordre : D.U. 2746
UNIVERSITE BLAISE PASCAL U.F.R. Sciences et Technologies
ECOLE DOCTORALE DES SCIENCES FONDAMENTALES N° 885
THESE Presentée pour obtenir le grade de
DOCTEUR D’UNIVERSITE Specialité : Chimie Physique
Par Angelica BIANCO
Formation photoinduite du radical hydroxyle dans la phase aqueuse du nuage : impact sur les acides
carboxyliques et les acides aminés. Hydroxyl radical photogeneration in cloud aqueous phase :
impact on carboxylic acids and amino acids.
President :
Dr. LAJ Paolo (Physicien, Université Joseph Fourier, Grenoble)
Rapporteurs :
Pr. VILLENAVE Eric (Professeur, Université de Bordeaux, Bordeaux)
Pr. WORTHAM Henri (Professeur, Aix-Marseille Université, Marseille)
Examinateurs :
Dr. DEGUILLAUME Laurent (Physicien Adjoint, Université Blaise Pascal, Clermont Ferrand)
Dr. GEORGE Christian (DR, CNRS-Université Claude Bernard, Lyon)
Directeurs de thèse :
Dr. BRIGANTE Marcello (Maître de Conférences HDR, Université Blaise Pascal, Clermont Ferrand)
Dr. MAILHOT Gilles (DR, CNRS-Université Blaise Pascal, Clermont Ferrand)
Soutenue publiquement le 4 novembre 2016

2
Clouds come floating into my life,
No longer to carry rain or usher storm
But to add color to my sunset sky.
Rabindranath Tagore, Stray Birds
A mamma, papà, Elia e Alice,
solide fondamenta dei miei castelli di carte.

3
4
Mots clés: Photochimie, Chimie atmospherique, Chimie radicalaire, Acides
carboxyliques, Acides aminés
Keyword : Photochemistry, Atmospheric chemistry, Radical Chemistry,
Carboxylic acids, Amino acids

5
Table of contents
Motivation .................................................................................................................................. 9
Introduction .............................................................................................................................. 11
Chapter 1 .................................................................................................................................. 15
Cloud microphysics .............................................................................................................. 15
Homogeneous nucleation .................................................................................................. 15
Heterogeneous nucleation ................................................................................................. 16
Cloud chemistry .................................................................................................................... 19
Dissolution of aerosols ...................................................................................................... 20
Dissolved gases ................................................................................................................. 21
Cloud water droplets composition .................................................................................... 22
Chapter 2 .................................................................................................................................. 28
Cloud aqueous phase oxidant capacity. ................................................................................ 28
Oxidation in dark conditions ............................................................................................. 28
Photochemistry principles ................................................................................................. 29
Photochemistry in cloud water .......................................................................................... 30
Main oxidants in cloud water ............................................................................................... 32
Hydrogen peroxide ............................................................................................................ 32
Nitrate radical .................................................................................................................... 34
Hydroxyl radical ............................................................................................................... 35
Chapter 3 .................................................................................................................................. 43
Organic matter in clouds ....................................................................................................... 43
Carboxylic acids ................................................................................................................... 43
Sources .............................................................................................................................. 44
Reactivity .......................................................................................................................... 47
Sinks .................................................................................................................................. 49
Amino acids .......................................................................................................................... 50
Sources .............................................................................................................................. 52
Reactivity .......................................................................................................................... 53

6
HULIS, TRYLIS and TYLIS ............................................................................................... 55
Experimental set-ups and methods ........................................................................................... 59
Chapter 4 .................................................................................................................................. 61
Sampling site ........................................................................................................................ 61
Cloud collector .................................................................................................................. 63
Cloud water samples analysis ............................................................................................... 63
Back-trajectory plot .......................................................................................................... 63
Irradiation ............................................................................................................................. 64
Analytical instruments and methods ..................................................................................... 67
Physico-chemical parameters ............................................................................................ 67
Spectroscopic analysis ...................................................................................................... 67
Ionic Chromatography analysis ........................................................................................ 73
HPLC ................................................................................................................................ 74
Total Organic Carbon ....................................................................................................... 77
Results ...................................................................................................................................... 79
Chapter 5 .................................................................................................................................. 81
Motivation ......................................................................................................................... 81
A better understanding of hydroxyl radical photochemical sources in cloud waters collected
at the puy de Dôme station : Experimental versus modeled formation rates ....................... 83
5.1 Introduction ................................................................................................................. 84
5.2 Materials and Methods ................................................................................................ 86
5.3 Results and Discussion ............................................................................................... 92
5.4 Conclusion ................................................................................................................ 107
Chapter 6 ................................................................................................................................ 109
Motivation ........................................................................................................................... 109
Photochemical fate of Tartronic acid in cloud waters. ....................................................... 111
6.1. Introduction .............................................................................................................. 111
6.2. Chemicals ................................................................................................................. 112
6.3. Results ...................................................................................................................... 113
6.4. Conclusions and perspectives. ................................................................................. 119

7
Chapter 7 ................................................................................................................................ 121
Motivation ........................................................................................................................... 121
Improving the characterization of dissolved organic carbon in cloud water: Amino acids
and their impact on the oxidant capacity ............................................................................ 123
7.1. Introduction .............................................................................................................. 124
7.2. Results and discussions ............................................................................................ 126
7.3. Experimental Materials and methods ....................................................................... 136
Chapter 8 ................................................................................................................................ 139
Motivation ........................................................................................................................... 139
Tryptophan and tryptophan-like substances in cloud water: occurrence and photochemical
fate ...................................................................................................................................... 141
8.1. Introduction .............................................................................................................. 142
8.2. Materials and Methods ............................................................................................. 144
8.3. Results and Discussion ............................................................................................ 148
8.4 Atmospheric Relevance and Conclusions ................................................................. 159
Chapter 9 ................................................................................................................................ 163
Motivation ........................................................................................................................... 163
Les microorganismes: acteurs oubliés de la chimie des nuages. Compétition avec les voies
de phototransformation ....................................................................................................... 165
Résumé ............................................................................................................................ 165
9.1. Introduction .............................................................................................................. 165
9.2. Le nuage, siège de transformations chimiques et microbiologiques ....................... 169
9.3. Compétition chimie radicalaire vs métabolisme microbien ..................................... 176
9.4. Conclusion ............................................................................................................... 179
Conclusions and perspectives ................................................................................................. 181
References .............................................................................................................................. 185

8

9
Motivation
The water cycle is all about storing water and moving water on, in, and above the Earth.
Although the atmosphere may not be a great storehouse of water, it is the superhighway used
to move water around the globe. Chemical and photochemical processes in surface water has
aroused the interest of the scientific community for the reason that water is one of the most
primordial needs for humankind and many lifeforms on Earth. Nevertheless, this is only the
lowest level of the cycle: for this reason it is necessary to study the atmospheric aqueous
phase composition and reactivity and, in particular, cloud water.
Atmospheric water is in equilibrium with gas and particulate phase and atmosphere in general
is linked with global warming, health, oceans, land use, climate patterns and many other vital
topics.
These chapters try to set the scene for the work carried out during this thesis by introducing
important concepts and by situating them on the global puzzle of the Earth’s system.

10

11
Introduction
Clouds have always fascinated people, from children to old wise men. Children are fascinated
by their fluffy white shapes and they see faces, fantastic landscapes and all sorts of wonderful
images. In ancient times, the seers went a stage further: they believed that the pictures seen in
clouds have a meaning about the things that were to come. Also in contemporary imagination,
white clouds symbolize serenity and positive thinking while dark clouds conjure up
depressing or pessimistic thoughts. In comics, clouds are used to give voice to the character’s
thoughts.
Different names based on their shape and their height in the sky are given to the clouds. Some
clouds are near the ground, others are almost as high as jet planes fly, some are puffy like
cotton and others are grey and uniform.
Clouds seem so simple from our perspective, just large masses of airborne water that take
random shapes in the sky, occasionally dropping some of their water in various forms of
precipitation on our heads. In reality, these beautiful feather pillows floating above us cover
70% of the earth are majestically complicated, and their very specific shapes are determined
by different physical processes in the atmosphere. There is actually a huge amount that we
still don't understand about clouds and how they operate, but significant progress has been
made during the last century that has allowed us to uncover a lot of their inner workings.
Whether they are hurling baseball-sized hailstones to the ground or frying radio towers with
lightning strikes, clouds are always performing amazing feats of physics at both the
microscopic and macroscopic levels.
Even if clouds seem so immense and deep, the aqueous phase of clouds and fog constitutes a
small volume of the atmosphere (∼ 10−7
vol vol−1
) 1 and only 0.03% (12000 km
3) of fresh
water on Earth but clouds are of fundamental importance for the terrestrial climate in general.
In fact, they are a physical obstacle to incoming and outgoing irradiation and they are also
chemical reactors for the different atmospheric constituents. A cloud is a complex ecosystem
(composed of solid, liquid and gas phases) where physical, microphysical, chemical,
photochemical and microbiological transformations take place and it is impossible to study a
single compartment without taking into account the others.
Figure 1 shows the classification of clouds on the basis of altitude and shapes.
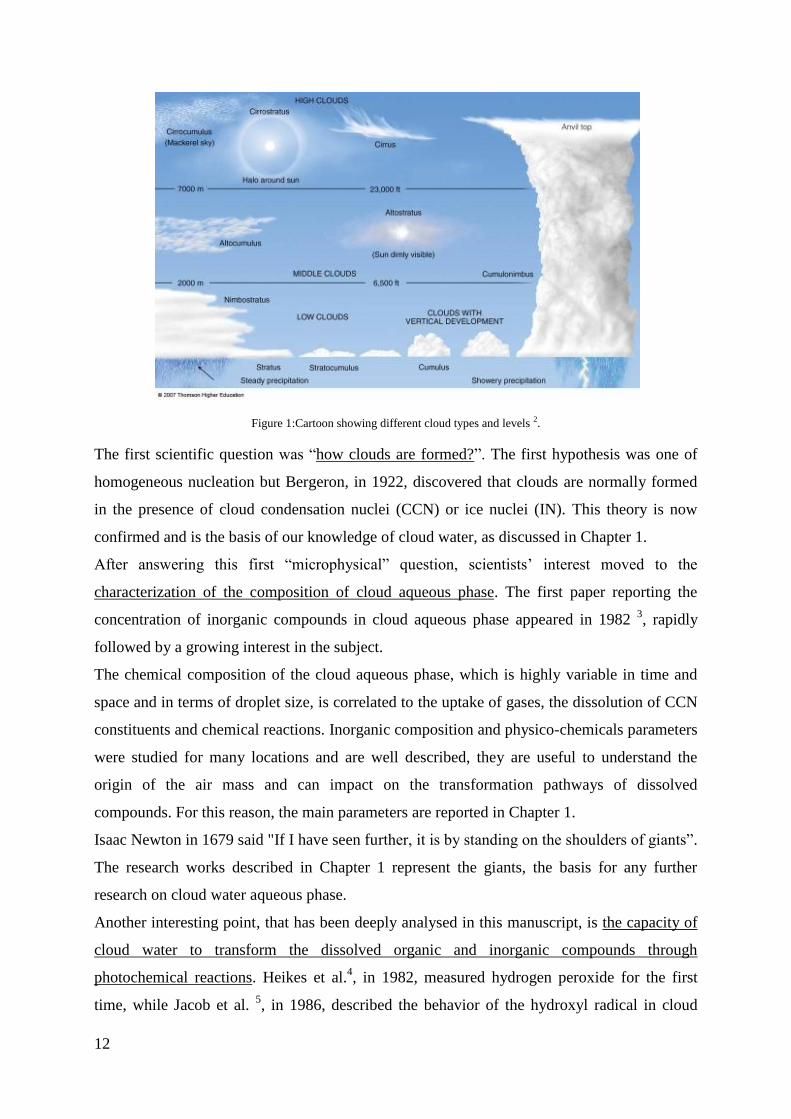
12
Figure 1:Cartoon showing different cloud types and levels 2.
The first scientific question was “how clouds are formed?”. The first hypothesis was one of
homogeneous nucleation but Bergeron, in 1922, discovered that clouds are normally formed
in the presence of cloud condensation nuclei (CCN) or ice nuclei (IN). This theory is now
confirmed and is the basis of our knowledge of cloud water, as discussed in Chapter 1.
After answering this first “microphysical” question, scientists’ interest moved to the
characterization of the composition of cloud aqueous phase. The first paper reporting the
concentration of inorganic compounds in cloud aqueous phase appeared in 1982 3, rapidly
followed by a growing interest in the subject.
The chemical composition of the cloud aqueous phase, which is highly variable in time and
space and in terms of droplet size, is correlated to the uptake of gases, the dissolution of CCN
constituents and chemical reactions. Inorganic composition and physico-chemicals parameters
were studied for many locations and are well described, they are useful to understand the
origin of the air mass and can impact on the transformation pathways of dissolved
compounds. For this reason, the main parameters are reported in Chapter 1.
Isaac Newton in 1679 said "If I have seen further, it is by standing on the shoulders of giants”.
The research works described in Chapter 1 represent the giants, the basis for any further
research on cloud water aqueous phase.
Another interesting point, that has been deeply analysed in this manuscript, is the capacity of
cloud water to transform the dissolved organic and inorganic compounds through
photochemical reactions. Heikes et al.4, in 1982, measured hydrogen peroxide for the first
time, while Jacob et al. 5, in 1986, described the behavior of the hydroxyl radical in cloud

13
water. The main pathways of production and consumption of oxidants such as hydrogen
peroxide and free radicals are described in Chapter 2. This bibliographic study is the starting
point of this thesis and it is useful to understand the impact of hydroxyl radical
photogeneration and its correlation with the concentration of inorganic sources, presented in
Chapter 5.
Following the hystory of the first studies on cloud water, the next question was “what is the
nature of the organic matter dissolved in cloud water?”. The first paper on this topic was
published in 1987 6 and showed that cloud particles contain “complex proteins and cellulose”.
Additionally, the authors found “some degraded material (likely protein) and an unidentified
orange−brown material”. Until now, even if the dissolved organic matter remains still
unknown, scientists measured the concentration of carboxylic acids and some other
compounds for different sites. The presence of oxidized organic matter gives rise to another
crucial question: “oxidized organic matter comes from the dissolution of the CCN, from the
gas phase, or is it produced in cloud aqueous phase through the transformations of
precursors?”. Chamaides and Davis 7, in 1983, investigate the sources of formic acid in cloud
water and report that the “hydroxyl radical can both produce and destroy formic acid”. This is
a milestone of the study of cloud aqueous phase reactivity.
Nowadays, it is well recognized that cloud chemical processes can lead to the formation of
new low volatile compounds like carboxylic acids, as described in Chapter 3, as well as
aldehydes that modify aerosol particles in terms of their (micro)physical and chemical
properties (particle size, chemical composition, and morphology). If water evaporates from
cloud droplets, secondary organic aerosols (SOAs) may be formed and they could act as
CCN. These SOAs affect the effective radiative forcing from aerosol–radiation interactions
(ERFari) and from aerosol–cloud interactions (ERFari). So clouds could change Earth’s
albedo and consequently affect the climate system.
The oxidative pathway is not the only possibility: the reaction of organic matter with free
radicals could lead to the functionalization or formation or dimers/high weight molecular
compounds as the result of the recombination of organic radicals. To understand the reactivity
of carboxylic acids, it is helpful to choose a proxy, like tartronic acid, and to study its
reactivity at low concentration under direct and indirect photolysis. Experimental results will
be implemented in a model to predict the behavior of short chain carboxylic acids in cloud
water. The results are reported in Chapter 6.
Twenty years ago scientists discovered the presence of microbiological activity in clouds. The
logical consequence is the presence of dissolved organic matter related to living and dead

14
cells, like amino acids. These compounds were never detected in cloud water, but were
studied related to other atmospheric aqueous media, as reported in Chapter 3. In this work, a
method for the detection of amino acids was adapted and clouds samples were analyzed, as
reported in Chapter 7. Moreover, tryptophan, an essential amino acid that could be considered
a marker of microbiological activity, was quantified in cloud water samples and its reactivity
with the hydroxyl radical was investigated, as reported in Chapter 8.
Chapter 9 reports an invited divulgatif review concerning the comparison between chemical,
photochemical and microbiological processes, as a perspective of a future collaboration to
understand the impact of microorganisms on cloud water chemistry.
15
Chapter 1
Cloud microphysics
Historically, cloud physics was the first studied section. Cloud physics is the study of the
physical processes that lead to the formation, growth and precipitation of atmospheric clouds.
Clouds consist of microscopic droplets of liquid water (warm clouds), tiny crystals of ice
(cold clouds), or both (mixed phase clouds).
Homogeneous nucleation
Cloud formation requires a vertical movement of an air mass. When water evaporates from an
area of the Earth’s surface, the air over this area becomes moist. Moist air is lighter than the
surrounding dry air, and tends to lift, creating an unstable situation. When enough moist air is
accumulated, it rises as a single parcel, without mixing with the surrounding air. The process
happens several times and the result is a series of discrete parcels of moist air rising to form
clouds. This process occurs when one of three possible lifting agents, cyclonic/frontal,
convective, or orographic movement, causes air containing invisible water vapor to rise and
cool to its dew point, the temperature at which the air becomes saturated. During this ascent,
the volume of air undergoes adiabatic cooling and the relative humidity grows. When the air
mass reaches the Lifting Condensation Level (LCL), the air mass achieves the saturation
needed to form cloud water droplets. The value of Liquid Water Content (LWC) reached is
from 0.02 to 0.94 g m−3
.
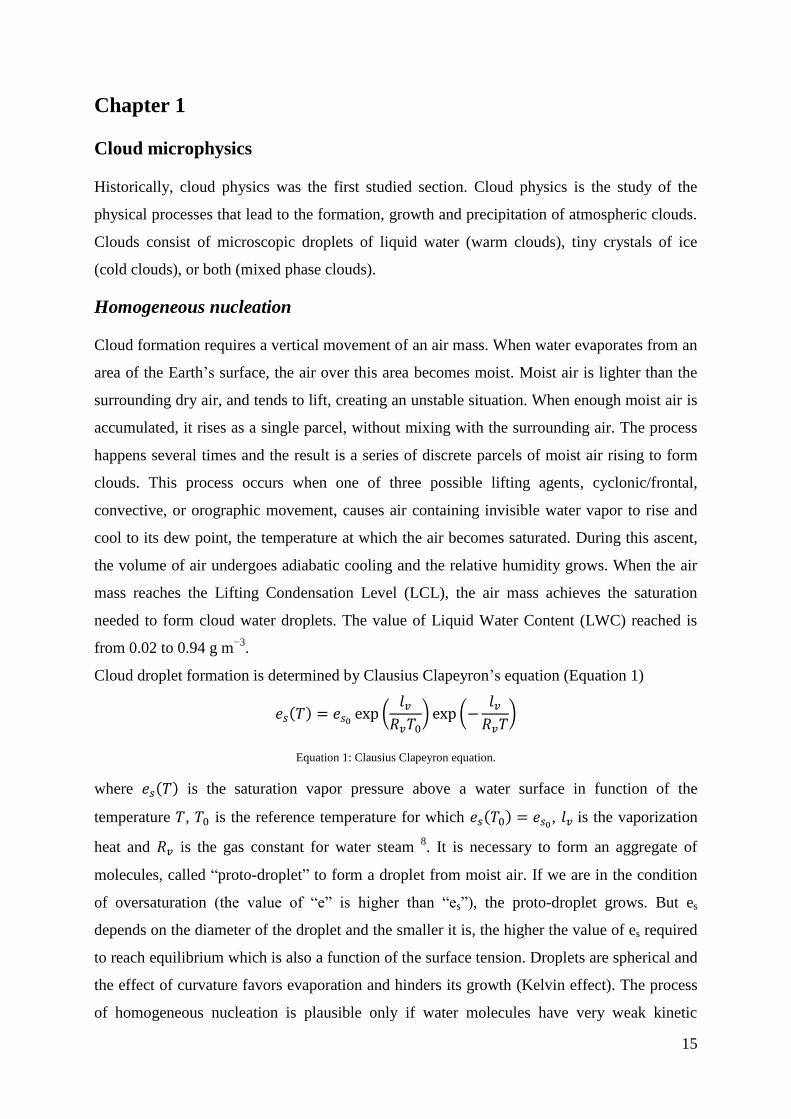
Cloud droplet formation is determined by Clausius Clapeyron’s equation (Equation 1)
Equation 1: Clausius Clapeyron equation.
where is the saturation vapor pressure above a water surface in function of the
temperature , is the reference temperature for which , is the vaporization
heat and is the gas constant for water steam 8. It is necessary to form an aggregate of
molecules, called “proto-droplet” to form a droplet from moist air. If we are in the condition
of oversaturation (the value of “e” is higher than “es”), the proto-droplet grows. But es
depends on the diameter of the droplet and the smaller it is, the higher the value of es required
to reach equilibrium which is also a function of the surface tension. Droplets are spherical and
the effect of curvature favors evaporation and hinders its growth (Kelvin effect). The process
of homogeneous nucleation is plausible only if water molecules have very weak kinetic
16
energy, for temperatures lower than −40°C: this process is possible only in the high
troposphere.
Heterogeneous nucleation
Cloud condensation nuclei or CCNs (also known as cloud seeds) are small particles on which
water vapor condenses. A typical raindrop is about 2 mm in diameter, a typical cloud droplet
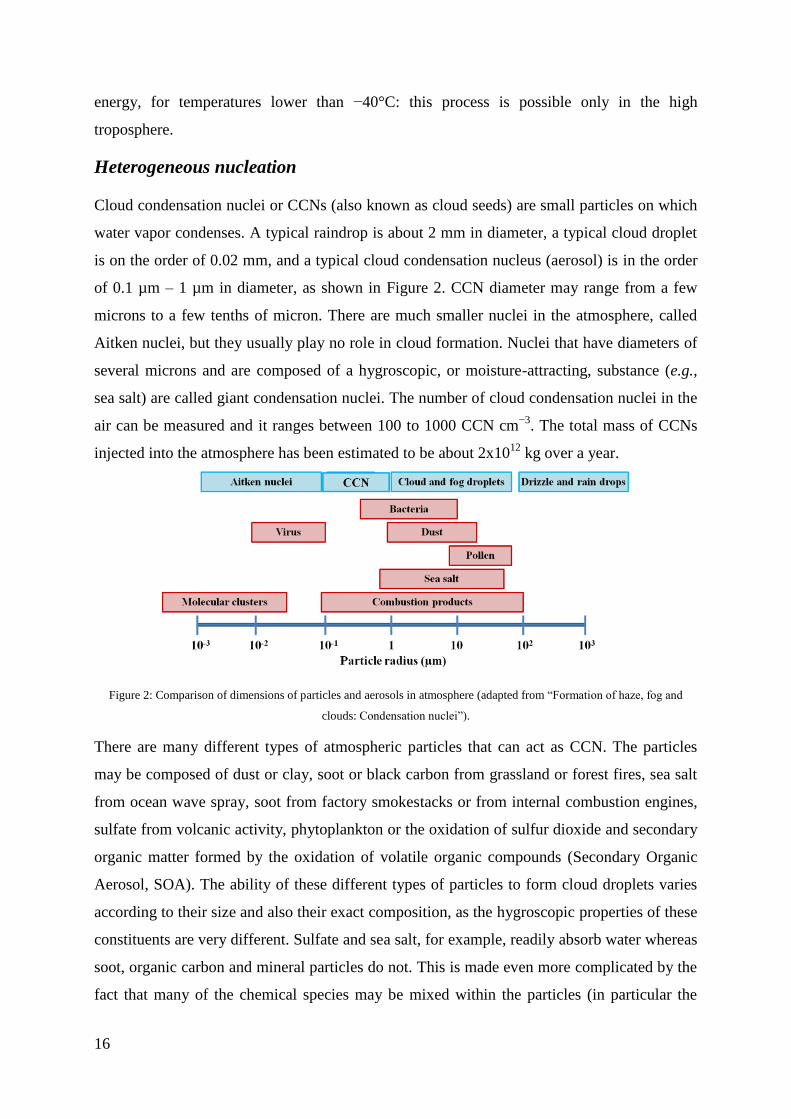
is on the order of 0.02 mm, and a typical cloud condensation nucleus (aerosol) is in the order
of 0.1 µm – 1 µm in diameter, as shown in Figure 2. CCN diameter may range from a few
microns to a few tenths of micron. There are much smaller nuclei in the atmosphere, called
Aitken nuclei, but they usually play no role in cloud formation. Nuclei that have diameters of
several microns and are composed of a hygroscopic, or moisture-attracting, substance (e.g.,
sea salt) are called giant condensation nuclei. The number of cloud condensation nuclei in the
air can be measured and it ranges between 100 to 1000 CCN cm−3
. The total mass of CCNs
injected into the atmosphere has been estimated to be about 2x10¹²
kg over a year.
Figure 2: Comparison of dimensions of particles and aerosols in atmosphere (adapted from “Formation of haze, fog and
clouds: Condensation nuclei”).
There are many different types of atmospheric particles that can act as CCN. The particles
may be composed of dust or clay, soot or black carbon from grassland or forest fires, sea salt
from ocean wave spray, soot from factory smokestacks or from internal combustion engines,
sulfate from volcanic activity, phytoplankton or the oxidation of sulfur dioxide and secondary
organic matter formed by the oxidation of volatile organic compounds (Secondary Organic
Aerosol, SOA). The ability of these different types of particles to form cloud droplets varies
according to their size and also their exact composition, as the hygroscopic properties of these
constituents are very different. Sulfate and sea salt, for example, readily absorb water whereas
soot, organic carbon and mineral particles do not. This is made even more complicated by the
fact that many of the chemical species may be mixed within the particles (in particular the
17
sulfate and organic carbon). Additionally, while some particles (such as soot and minerals) do
not make very good CCN, they act as very good ice nuclei in colder parts of the atmosphere.
The number and type of CCNs can affect the lifetimes and radiative properties of clouds as
well as the amount of clouds and hence have an influence on climate change; the details are
not well understood but they are the subject of research. There is also speculation that solar
variation may affect cloud properties via CCNs, and thus affect climate.
Because of the Kelvin effect, cloud condensation nuclei are necessary for cloud droplets
formation. As explained before, without CCN the effect of curvature on a spherical droplet
favors evaporation and hinders its growth. Cloud droplets are initially formed by the
condensation of water vapor onto condensation nuclei when the oversaturation of air exceeds
a critical value according to Köhler’s theory (Equation 2).
Equation 2: Köhler's equation.
where is the droplet water vapor pressure, is the corresponding saturation vapor
pressure over a flat surface, is the droplet surface tension, is the density of pure water,
is the moles of solute, is the molecular weight of water, and is the cloud drop
diameter 9. At small radii, the level of oversaturation needed for condensation to occur is so
high that it does not happen naturally. Raoult's Law describes how the vapor pressure is
dependent on the amount of solute in a solution. At high concentrations, when the cloud
droplets are small, the oversaturation required is smaller than without the presence of a
nucleus. The precise processes of how a cloud forms and grows is not completely understood,
but scientists have developed theories explaining the structure of clouds by studying the
microphysics of individual droplets.
The main mechanism behind this process is adiabatic cooling. Water vapor in saturated air is
normally attracted to condensation nuclei such as dust and salt particles that are small enough
to be held aloft by normal circulation of the air. The water droplets in a cloud have a average
radius of about 0.02 mm. The droplets may collide to form larger droplets which remain
suspended as long as the drag force of the air is greater than the gravitational force.
18
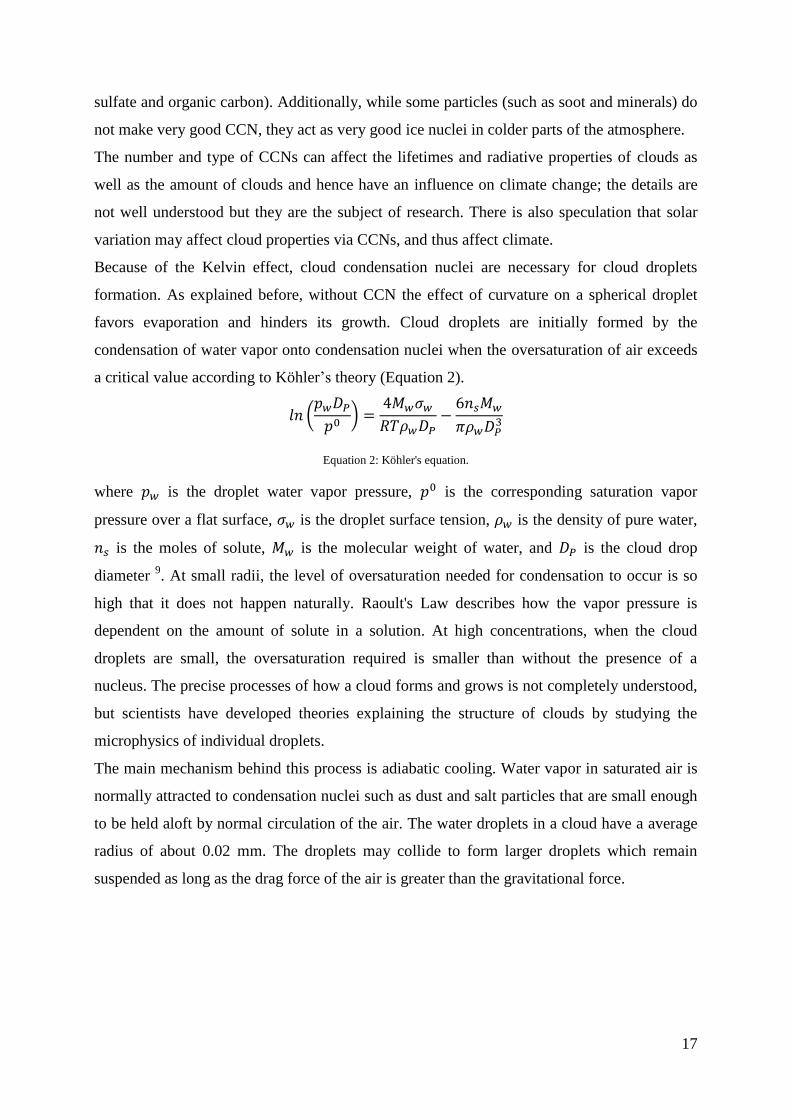
Figure 3: Cloud droplets nucleation (with kind permission of Deguillaume).
As said before, the initial growth of cloud condensation nuclei and their subsequent activation
to form droplets is generally calculated with the assumption that cloud droplet activation
occurs as an equilibrium process described by Köhler’s theory, as shown in Figure 3. Chuang
et al 10
show that this assumption is not valid under certain conditions present in nature. They
demonstrate that there is a poor empirical correlation between cloud droplets and CCN
concentrations and organic compounds can alter a particle’s Köhler curve. Many authors such
as Gill et all. 11
, Blanchard 12
and Husar and Shu 13
demonstrate the existence of a organic
film on atmospheric aerosol particles made of non-volatile organic compounds which can
have different effects on cloud water droplet formation. The effect of such organic matter can
affect droplet formation in three ways: changes in droplet surface tension, gradual dissolution
of solute due to limited solubility and changes in the mass accommodation coefficient. All
these effects lead to the inhibition of droplets growth. The general idea is that some
amphiphilic organic compounds can form compressed films on the surface of the droplets.
This coating may inhibit droplet growth for long enough so that some fraction of droplets
grow in conditions of relatively high oversaturation. For this reason they achieve larger sizes
than they would have if the entire population of drops had grown simultaneously 14
.
For this reason it is very important to understand the organic composition of particles and
cloud water.
When the protodroplet is formed, thermodynamic processes of condensation and evaporation
take place: if the relative humidity continues to increase, the condensation of water on the
surface of the aerosol particle grows as does the volume of the droplet. If the relative humidity

19
decreases, the water evaporates. Other microphysical phenomena of collision and coalescence
can increase the size of droplets.
To summarize, when moist air ascends adiabatically, temperature decreases and relative
humidity increases. Haze droplets grow following Köhler’s curve and, if they reach the
critical ray, they increase in size spontaneously, becoming activated droplet. If the air mass
reaches the LCL, larger droplets are activated before smaller droplets. Their growth
implicates a decrease of air humidity and oversaturation stops increasing. Equilibrium
between oversaturation and droplet activation is reached and a cloud with droplets of different
dimensions is formed. Droplets size is correlated to aerosol concentration and dimension and
to the lifting rate of air mass. Collision and coalescence lead to the formation of rain drops
which are heavy enough to fall to the ground.
The equilibrium between cloud water droplets, gas and particulate phase, leads to the
absorption/desorption of chemical compounds and to their chemical, photochemical,
microbiological or microphysical transformation. Moreover, clouds can transport chemical
compounds for long distances.
Cloud chemistry
The term “cloud chemistry” comprises both cloud composition as well as the reactions that
take place in clouds. Cloud water chemical composition is variable and the reactivity is
influenced by many physico-chemical parameters such as pH, temperature and solar
irradiation. Chemical compounds in cloud water droplets can come from the dissolution of
aerosols and for some species, like iron, this is the only source in cloud aqueous phase 15
.
Moreover water condensed-phase (liquid or solid) can dissolve gases and it allows the
occurrence of reactions that would not otherwise happen or would be much slower. In this
sense “clouds may be considered to serve as catalysts of atmospheric reactions” 16
(Figure 4).
The uptake and reactivity of organic and inorganic matter in clouds, especially sulfur and
nitrogen oxides and acids, has received particular attention in the context of gaining improved
understanding of the processes responsible for acid deposition and climate change 17
, because
it is important to fully understand these processes.
20
Figure 4: Transformations in clouds (with kind permission of Deguillaume).
Dissolution of aerosols
Cloud water composition is directly related to its air mass origin, and it largely depends on the
availability of soluble ionic species. Main ionic species present in cloud water include
chloride, from seawater, sulfate and nitrate anions, and ammonium and sodium ions as
cations. In regions influenced by industrial emissions of sulfur and nitrogen oxides, cloud
water concentrations of H3O+ are commonly 10
−1 mol L
−1 18. The fact that cloud droplets are
formed on aerosols and CCN has immediate implications for cloud water composition. Let’s
consider an ammonium sulfate aerosol particle with a dry diameter of 0.1 µm that serves as a
nucleus for a cloud droplet of 10 µm diameter. The amount of ammonium sulfate contained in
the particle is 10−17
mol which correspond to 10−5
mol L−1
16
. This concentration is at the low
end of the range of concentrations of sulfate in cloud water in regions influenced by industrial
emissions. In general the fractional uptake of soluble aerosol species into cloud water is fairly
high. A recent study shows that, contrary to earlier studies 19,20
, the main factor controlling
bulk solute concentration is the concentration of incoming air masses rather than cloud liquid
water content (LWC) 21
. A conceptual model developed by Ogren et al. 22
qualitatively
describes the variation of non-volatile solute concentrations with cloud drop size in three
regions with different drop size: in Region I drop diameter is lower than approximately 5 µm
and contains freshly activated (or non-activated) droplets close to their equilibrium size at the
prevailing oversaturation. In this so-called “equilibrium growth” region, solute concentrations
sharply decrease with increasing drop size, because at their critical diameter, larger droplets
21
are more dilute than smaller ones as a result of the interactions between the Kelvin and the
Raoult effect. Region II, ranging from approximately 5 to 50 µm, represents droplets which
have freely grown by water condensation beyond their critical size. In this “condensation
growth” region, solute concentrations increase with increasing drop size, because small drops
grow faster than large drops (inverse correlation between growth and radius, as shown by
Köhler’s theory), i.e. large drops experience less dilution as compared to smaller ones. In
Region III, with drops above approximately 50 µm in diameter, coalescence of drops becomes
important. As larger drops collide more efficiently with smaller ones, solute concentrations
decrease with increasing drop size in this “coalescence growth” region.
Dissolved gases
The situation is different in the case of gases: in general, a gaseous substance does not
dissolve entirely in cloud water in view of the rather limited solubility of most atmospheric
gases in water. The equilibrium concentration of a gas physically dissolved in a liquid is given
by Henry's law and depends strictly on the solubility coefficient of the gas 16
(Equation 3)
Equation 3: Henry's law.
Where is the concentration of solute in water, is the Henry’s law solubility
coefficient, is the mixing ratio pressure, is the molar mixing ratio in air and is the
atmospheric pressure.
Several studies investigated the behavior of gases such as O3, HClO, NOx and H2O2 in the
presence of clouds, showing a general decrease in gaseous concentrations resulting from the
diffusion to the liquid phase. Similarly, the budget of radical species can be affected as well.
In particular, it is recognized that aqueous phase photochemistry has an important effect on
hydroxyl radical (HO•) concentration. The perturbation of the HO
• concentrations in the
presence of clouds is partially linked to the alteration of hydrogen peroxide (H2O2) behavior.
Hydrogen peroxide, hydroxyl radical and peroxyl radical (HO2•) are soluble and can reach
very high concentrations in a relatively small volume of water controlling liquid phase
oxidation processes 23
. Otherwise O3 does not diffuse in cloud water: O3 molecules react on
the internal surface of the droplet, before being able to enter the bulk droplet. Furthermore,
because O3 molecules are not formed in the aqueous phase, their chemical destruction rate per
surface unit is equal to the net transfer flux of ozone from the gas-phase. As a result, the

22
washout of ozone is irreversible 24
. Diffusion of oxidant species such as H2O2, HO• and HO2
•
and O3 reactivity leads to a faster reactivity in the aqueous phase than in the gas phase.
Many campaigns of measurements on different sites were organized and inorganic
composition of cloud water was largely studied 25-29
. Nevertheless, the development of
numeric models is needed to have a better description and prediction of the complex
interactions between microphysical and chemical processes. Many models, based on
campaign measurements, were developed by Herrmann et al 30
, Ervens et al 31
, Leriche et al
32, and Deguillaume et al
33.
The study of the chemical composition of cloud water droplets assumes fundamental
importance in understanding its variability in function of environmental conditions. The
chemical compounds reactivity is then studied in the laboratory and these data are useful for
the development of atmospheric cloud water models for the prediction of the behavior of
chemicals in such a complex medium.
Cloud water droplets composition
Physico−chemical parameters
Liquid Water Content
The liquid water content (LWC) is the measure of the mass of water in a cloud in a specified
amount of dry air. It is typically measured per volume of air (g m−3
) or mass of air (g kg−1
).
The classification of the cloud is highly related to the liquid water content as well as its origin.
Clouds that have low densities, such as cirrus clouds, contain very little water, thus resulting
in relatively low liquid water content values of around 0.03 g m−3
. Clouds that have high
densities, like cumulonimbus, have much higher liquid water content values that are around 1-
3 g m−3
, so more liquid is present in the same amount of space. Measurements of cloud liquid
water are central to many aspects of cloud microphysics research. The observed liquid water
content is often compared with the adiabatic value to infer the effects of precipitation and
entrainment on cloud structure 34
. The liquid water content (LWC) of clouds is one of the
main controls of chemical concentrations in cloud water. According to theoretical formulation
by Junge 35
, the concentration of a cloud water solute is proportional to its concentration in the
air and inversely proportional to LWC. However, the cloud environment is very complex and
other factors tend to distort this relationship. It is commonly observed that solute
concentration decreases with increasing LWC, however the functional form of this
relationship remains open to question.

23
Redox potential
In aqueous solutions, redox potential is a measure of the tendency of the solution to either
gain or lose electrons when it is subject to change by introducing a new species. Redox
potential is defined as pε as reported in Equation 4, where ae− is the activity coefficient of the
electron donor species. A solution with a higher (more positive) reduction potential species
will have a tendency to gain electrons from the new species (i.e. to be reduced by oxidizing
the new species) and a solution with a lower (more negative) reduction potential will have a
tendency to lose electrons to the new species (i.e. to be oxidized by reducing the new species).
In the field of environmental chemistry, the reduction potential is used to determine if
oxidizing or reducing conditions are prevalent in water or soil, and to predict the oxidation
states of different chemical species in the water, such as dissolved metals.
Equation 4: Definition of pε.
values in water range from −12 to 25; the levels where the water itself becomes reduced or
oxidized, respectively.
The redox potential of cloud water was measured only by Sinner et al.: they report a value of
2.5 – 2.6 V 36
.
Conductivity
The conductivity of an electrolyte solution is a measure of its ability to conduct electricity.
The IS unit of conductivity is Siemens per meter (S m−1
). Ionic species in cloud water are
responsible for the conductivity of this medium because there is a linear correlation between
ion concentration and its conductivity via molar conductivity. The total conductivity of the
solution is expressed as the sum of the partial conductivity of each ion. This kind of
measurement permits us to estimate the ionic concentration of cloud water and to compare it
with other atmospheric media: the range values measured by Cini et al. 37
is 47-485 µS cm−1
while Kawamura et al. 38
measured 6-190 µS cm−1
. Ionic species that mainly influence
conductivity are H3O+, HO
− and then SO4
2−, Ca
2+ and other inorganic ions. Cloud water has a
similar conductivity to source fresh water 39
.
pH
pH values in cloud water droplets are influenced by the solubilization of gaseous carbon
dioxide which gives at equilibrium a pH value of 5.6. Other species coming from gaseous
(SO2, HNO3, NH3, carboxylic acids) or particulate phase (H2SO3, CaCO3) can change this

24
value after solubilization. The simultaneous presence of many acid and basic compounds,
such as nitrates, sulfate, ammonium, carbonates, and many organic acids, such as acetate and
formate, leads to a buffer effect. Generally, the pH value is lower for air masses influenced by
anthropic emissions caused by the solubilization of SO2, HNO3 and carboxylic acids from the
gas or the particulate phase 40,41
. Measured pH values are between 2.2 and 7.3 42
.
Inorganic ions
The role of clouds in the atmospheric cycle of inorganic substances has been discussed in
many publications in the past 43,44
focusing on the oxidation/transformation of sulfur and
nitrogen compounds 45,46
. Several in situ investigations of cloud chemistry have already been
reported, and most of them are based on specific single campaigns. These studies showed a
high variability in the cloud chemical composition, which is driven by both source proximity
and local microphysics. The main inorganic anions in cloud water aqueous phase are
chlorides, nitrates, sulfates, sodium, ammonium, magnesium, potassium and calcium.
Integrated studies considering different cloud experiments can be difficult, especially because
cloud sampling methodologies are not standardized and not easily comparable. Table 1 shows
the concentration in µmol L−1
of the main ions in cloud water.
Concentration
(µmol L−1
) NH4
+ SO4
2− NO3
− Ca
2+ Mg
2+ K
+ Na
+ Cl
−
Sellegri (2003) 47
24-150* 4-40* 12-93*
Aleksic (2009) 25
67-175* 58-147* 40-99* 2-21* 1-5* 0.8-3* 1-6* 1-8*
Loflund (2002) 26
29-491* 11-212* 16-320* 2-39* 0,8-42* 1-20* 3-49* 0-45*
Deguillaume (2014) 27
4-376* 3-218* 1-516*
1-679* 1-394*
Acker (1998) 28
472° 156° 360° 25° 12° 1.3° 100° 101°
Guo (2012) 29
1515° 687° 600° 139° 45° 75° 36° 114°
Table 1: Minimum and maximum values (*) or mean values (°) for ions concentration in cloud water.
There are many sources and sinks of inorganic compounds in atmosphere. Nitrate, sulfate and
ammonium ions are abundant, as previously observed by Sellegri et al. at the puy de Dome 47
and during other field campaigns 25,26
and they represent an average contribution to the TIC
(Total Ionic Current) from 60 to 80% 47
for air masses with anthropogenic influences. Their
contribution to the TIC of marine clouds is much lower (25%), due to the relative high
concentrations of sodium and chloride.
The principal source of nitrates (NO3−) is nitric acid (HNO3), which comes, in aqueous phase,
from the reaction of pernitric acid (HNO4) and the hydrogenosulfate ion (HSO3−) or by the

25
hydrolysis of N2O5 48
, and in gaseous phase from the oxidation of NOx. Another source of
nitrates is the dissolution of aerosols, in particular of ammonium nitrate particles. In cloud
aqueous phase nitrates can be reduced to nitrites (NO2−) by photochemical or microbiological
processes 49
. Sulfate ions (SO42−
) can come from the dissolution of sea spray aerosol which
contains sodium sulfate (Na2SO4) crystals or from the oxidation of reduced sulfur gases,
primarily dimethylsulfide (DMS), which is produced by biological activity in the oceans, as
well as from SO2. Sulfate ions can also be produced by oxidation of sulfite ions (SO32−
) in
cloud water in the presence of hydrogen peroxide (H2O2), HNO4 or O3 50
. Chloride ions (Cl−)
come principally (35% of global emission 45
) from the dissolution of sea spray aerosols which
contains NaCl crystals but there are many other secondary sources: for example potassium
chloride (KCl) is emitted by biomass combustions, HCl is emitted by volcanic eruptions and
industrial processes and CH3Cl is produced by biological activity in oceans and seas.
Sodium (Na+) is mostly emitted as sea salt particles (Na2SO4 and NaCl) but it can come also
from dust produced in soil erosion or by waste incineration. Ammonium (NH4+) comes from
the dissolution of ammonium based aerosols (NH4NO3 and (NH4)2SO4 principally) or from
gaseous ammonia (NH3). Ammonia sources are volatilization of fertilizers, biomass burning
and microbial decomposition of N-containing organic matter. Potassium (K+), magnesium
(Mg2+
) and calcium (Ca2+
) ions are emitted as sea salt as KCl, MgCl2 and CaCl2 but they can
also come from soil dust and industrial emissions as secondary sources 51
.
As observed before, chemical composition is influenced by the sampling site: observations
made at the puy de Dôme station are in agreement with those of Gioda et al. 52
and Reyes-
Rodriguez et al. 53
who sampled air masses from the Atlantic Ocean in Puerto Rico and
showed similar pH and concentrations of inorganic ions while concentrations found by Blas et
al. 54
for cloud water sampled at the “Black Triangle”, one of Europe’s most industrialized
regions, are higher (pH difference = 2.5). In France, measurements of cloud chemical
composition in the Vosges mountains show high sulfate and nitrate concentrations attributed
to an anthropogenic additional source 55,56
. Aleksic et al. 25
sampled at the Whiteface
Mountain, in northeastern United States, and observed a lower concentration than the ones
found in puy de Dôme and in Puerto Rico, attributed to a different influence of air masses.
The authors 25
made a comparison between cloud and rain water and they observe that the
same main ions (sulfate, nitrate, hydrogen and ammonium) are less concentrated in rainwater,
especially for ammonium. Lin et al. 57
estimated that concentrations of compounds found in
rain water are between 2 and 23 times more diluted that the corresponding concentrations in
26
cloud water. They also observed that trends of main ions in both cloud and rainwater are not
linear and an inter-annual oscillation could be observed.
Since it is very difficult to compare absolute concentrations for different measurement sites
for the reasons explained before, it can be helpful to consider the ratios of the concentrations
of main ions. The nitrate to sulfate equivalent ratio that increases with the distance from the
source of pollution, which makes this value an indicator of the remoteness of a site is
particularly interesting 58
. This ratio is highest in polluted clouds due to the high nitrate
content in polluted air masses.
The ammonium contribution to the TIC is relatively high in air masses of different origins.
Therefore, the pH of cloud water is influenced by ammonium related to emissions from
agricultural activities. However, the sum of nitrate and sulfate concentrations is much higher
than the ammonium concentration for polluted cases, resulting in partial acid neutralization
and acidic cloud water.
The concentration of calcium is higher in polluted and continental air masses than in marine
air masses, as a result of the higher contribution of its terrestrial source rather than its marine
source.
In marine air masses, the average ratio Cl− / Na
+ is equal to 1.41 and reaches 1.06 for clouds
defined as highly marine, a value that is below that of seawater (1.17) 59
. This loss of chlorine
may be caused by the deposit of HCl gas on the sea surface before its absorption by the
clouds. For polluted air masses, this ratio is 2.54, resulting from the enrichment of chloride
that occurs over polluted areas.
Transition metals
Transition metals ions (TMI) are very common constituents of atmospheric droplets. When
aerosol particles act as CCN, soluble metals, present as metal oxide, oxo-hydroxide and
silicate particles, dissolve into cloud droplets by undergoing thermal and photochemical
processes at the surface of the particles. Various field campaigns report concentrations of
dissolved trace metals in rainwater and in cloud water samples 60
. Iron (Fe), manganese (Mn)
and copper (Cu) are the most abundant transition metals in the atmospheric liquid water as
well as in aerosols. The most striking characteristic of the data is the range of concentrations,
which covers 3-4 orders of magnitude, from nM to µM and depending on their solubility, on
pH or on ionic strenght. Similar results could be presented for other transition metals, though
the data would be less extensive 15
.

27
The major effects of transition metals are principally linked to the homogeneous aqueous
phase chemistry. Graedel et al. 61
first attempted to explain the complex redox chemistry of
transition metals in atmospheric water through the development of a detailed kinetic model.
Their results indicated that transition metals (Cu(I) and Cu(II), Fe(II) and Fe(III) and Mn(II)
and Mn(III)) could play an important role in the radical chemistry of the atmospheric water
phases. This ability is due to the formation of aqua-complex or complex with organic
compounds which facilitate the solubilisation of metals and lead to a catalytic activity in
redox cycles of organic and inorganic compounds. For example, Graedel et al. predict that
photolysis of Fe(III)-complexes should be important in-cloud sources of HO• radicals, and
that transition metals should be the most important sinks and sources of hydroperoxide radical
and superoxide radical anion (HO2•/O2
•−). Considering these hypotheses, we can argue that
their presence can influence the chemical composition of cloud droplets and the oxidative
capacity of cloud aqueous phase.
Organic Matter
Within the ongoing discussion on climate change the role of Organic Carbon (OC) in the
atmosphere has gained more attention. Organic matter is present in all atmospheric
compartments (gaseous phase, aerosols and cloud droplets). It is estimated that only 20% of
the organic matter is directly emitted by the Earth’s surface 62
, due to its high reactivity in the
atmosphere through chemical and photochemical transformations: to give an idea of the
complexity of its characterization, 105 volatile organic compounds (VOCs) are identified in
the atmosphere 63
.
Dissolved organic carbon (DOC) refers to the hundreds of dissolved compounds found in
water that derive from organic materials and is composed of “organic acids”, “organic bases”
and “neutral groups”. The limit between DOC and particulate organic carbon is set at 0.45
µm. DOC is a mixture of simple substances such as carbohydrates, fatty acids and N-
containing compounds, and of complex polymeric molecules. They can be present as truly
dissolved molecules or as colloids.
Cloud water DOC was quantified to be in the order of 10 mg L−1
. Clouds composition has
been studied for decades and several low molecular weight organic species have been
detected and are believed to be transferred from the gas phase 64
including formic acid, acetic
acid 65,66
, glyoxal, methylglyoxal, phenol and nitrophenol 67,68
. Many other compounds were
observed in clouds, mostly mono and di-carboxylic acids, alcohols and aldehydes 69
. However
a large proportion of cloud water DOC is still uncharacterized.

28
Chapter 2
Cloud aqueous phase oxidant capacity.
Cloud aqueous phase is a complex atmospheric medium where different kinds of reactivity
take place: interface and bulk reactivity need to be taken into account but, recently, mainly
bulk reactivity was investigated.
Main transformations are initiated by free radicals or oxidant species which can be generated
in the presence of light or in dark conditions. In this work, the attention is focused on the
photoproduction of radicals and oxidant species by different precursors: these processes, due
to solar irradiation during the day, represent the main production pathway of oxidant species.
Their importance decreases during the night, when dark reactions become more important.
Although only photo-initiated reactions were considered in this thesis, dark reactions are
briefly described in the next paragraph to better understand their importance in the real
environment and their possible occurrence also during the day.
Oxidation in dark conditions
In dark conditions the main oxidative processes in cloud water are Fenton reaction and
oxidation by ozone.
The oxidation of organic substrates catalyzed both by Fe2+
and H2O2 is called the “Fenton
chemistry”. The Fenton reaction can contribute, significantly, to the production of HO•
although its reaction rate is weak (about 50 M−1
s−1
at 25 °C). However, the importance of the
Fenton reaction regarding the production of HO• radicals in solution is still subject to
controversy. This HO• radical production by the Fenton reaction has been questioned by
several studies which suggest that the reaction between H2O2 and Fe2+
produces the ferryl ion
(Fe4+
), which is then the active intermediate species in Fenton chemistry 70
. Nevertheless, the
reaction could be resumed as follow (R1).
R1) Fe2+
+ H2O2 Fe3+
+ HO•+ HO
−
Ozone plays a central role in tropospheric chemistry. It is a highly reactive and toxic species
and it absorbs both ultraviolet and infrared light contributing to the greenhouse effect and
providing protection from the exposure to UV radiations. Even in dark conditions, ozone can
oxidize, as reported by Pitts and Lokensgard in the atmospheric oxidation of benzo-a-pyrene
71. However, ozone solubility is very low and its importance in the bulk of cloud droplets
could be negligible. Concerning the surface chemistry of cloud droplets, only a little
information is available.

29
Photochemistry principles
The absorption of sunlight induces photochemistry and generates a variety of high energy
species (triplet states and radicals) that drive the chemistry of both the troposphere and the
stratosphere. Photochemical reactions are initiated by the absorption of a photon, typically in
the ultraviolet wavelength range of 290-400 nm. The energy of an absorbed photon is
transferred to the electrons in the molecule which changes its configuration (i.e., from a
ground state to an excited state). In chemistry, the most important electron excitations are
those resulting in the dissociation of molecular bonds. In order to induce bond breaking, the
energy absorbed by the molecule has to be generally higher than 40 kcal mol−1
. The radiations
containing this amount of energy are essentially the UV radiations which are almost
completely absorbed by ozone in the stratosphere. Thought the quantity of UV radiation
reaching the lower troposphere and the surface of the Earth is very small compare to the
incoming radiation at the top of the atmosphere, this small amount of UV radiation will be the
driving force for most of the photochemical reactions in the troposphere 72
.
Photophysical processes are processes in which the excited state which is formed in reaction
(R2) undergoes radiative transition (R3) or not-radiative transition in which the energy of the
excited molecule is converted into collision or vibrational energy and, finally, into heat (R4).
Photochemical processes are the processes in which the excited species dissociate (R5),
isomerizes, rearranges (R6) or reacts with another molecule (R7). Finally, the electronically
excited molecule can also reacts through photosensitized reactions with the surrounding
molecules (R8).
R2) AB + hν AB* Excitation
R3) AB* AB + hν Light emission (fluorescence/phosphorescence)
R4) AB* + M AB + M Energy conversion by collisions
R5) AB* A + B Dissociation
R6) AB* AB§ Isomerisation or rearrangement
R7) AB* + C AC + B Reaction with another molecule
R8) AB* + M AB + M* Photosensitized reaction
Direct photochemistry indicates dissociation, isomerisation or rearrangement of a molecule in
an excited state. This is a key process in the production of radicals in atmosphere for both
gaseous and condensed phase. Moreover, as mentioned before, an excited molecule can react
through photosensitized reactions with other molecules, meaning that the excited molecule
induces photochemical reactions in molecules that are not photochemically reactive (they

30
don’t absorb sunlight). This kind of reactivity is defined as photosensitized reactivity or
indirect photolysis.
Many organic compounds are thermodynamically unstable in the presence of oxygen;
however, their rate of spontaneous oxidation is slow at room temperature. From a physico-
chemical point of view, such reactions are kinetically limited. Molecular oxygen can be
photosensitized by a large number of molecules through energy transfer from their triplet state
to form 3O2 and finally singlet oxygen (
1O2). For this reason, oxygen is considered as an
oxidant even if it absorbs sunlight only at the top of the atmosphere, where wavelengths in the
range of 200-240 nm are available.
In condensed phase, the photochemical excitation of a chromophore is often followed by an
electron transfer or an H-transfer: this kind of indirect photolysis is theoretically different
from photosensization and energy transfer, even if it could be a simultaneous process, and
leads to the production of the superoxide radical anion (O2•−
), for example.
Photochemistry in cloud water
Homogeneous photochemistry is not limited to gas-phase reactions, but can also take place in
the liquid phase. Cloud droplets can undergo chemical changes through photochemical
reactions because they receive a considerable amount of sunlight. Organic molecules in the
atmosphere, in gas or in condensed phase, are susceptible to undergo chemical or
photochemical reaction after their formation or emission. These kinds of reactions include
oxidative and not-oxidative pathways which can happen in the gas phase, on aerosol surface
or in the aqueous phase. Under natural conditions, where irradiation occurs simultaneously
with gas phase oxidation, it is often very difficult to distinguish the part of gas phase
photochemistry from the photochemistry in the condensed phases as both are so entwined.
The main photosensitizer in natural waters is chromophoric dissolved organic matter
(CDOM), while nitrates (NO3−), nitrites (NO2
−) and iron, that are responsible for Fenton and
photo-Fenton processes, are other important sources of photogenerated radicals. Degradation
of organic compounds in cloud aqueous phase is generally initiated by inorganic radicals or
by hydrogen peroxide (H2O2) and ozone (O3) 73
. Many radicals are produced in liquid phase
such as ionic radicals: like sulfate (R12), dichlorine (R14−16), dibromine (R17−19), sulphite
(R11) and superoxide radical anion (SO4•−
, Cl2•−
, Br2•−
and SO3•−
and O2•−
respectively).
Moreover, neuter radicals, like hydroxyl radical (HO•), nitrite radical (NO2
•) (R9), nitrate
radical (NO3•) (R10) and superoxide radical (HO2
•), can diffuse from the gas phase (gas to
liquid transfer) or can be produced directly in the aqueous phase. The comparison between

31
oxidation potentials of each species gives reactivity that increase with the redox potential
reported in Table 2.
Radical E (V)
HO• 2.7
74
NO3• 2.3 ÷ 2.6
75
SO4•−
2.43 74
Cl2•−
2.41 74
Br2•−
1.69 74
Table 2: Redox potential of main oxidant species in the aqueous phase.
The main production pathway of oxidant species is the reaction between HO• and the
corresponding inorganic anion.
R9) HO• + NO2
− NO2
• + HO
− k9 = 6.0×10
9 ÷ 1.4×10
10 M
−1s
−1 *
R10) HO• + NO3
− NO3
• + HO
− k10 = 1.1×10
10 M
−1s
−1 *
R11) HO• + HSO3
− SO3
•− + H2O k11 = 4.5×10
9 M
−1s
−1 *
R12) HO• + HSO4
− SO4
•− + H2O k12 = 3.5×10
5 ÷ 1.7×10
6 M
−1s
−1 *
R13) SO4•−
+ NO3− SO4
2− + NO3
• k13 = 5.0×10
4 ÷ 2.0×10
6 M
−1s
−1 *
R14) HO• + Cl
− ClOH
•− k14 = 3.0 ÷ 4.3×10
9 M
−1s
−1 *
R15) Cl• + H2O ClOH
•− + H
+ k15 = 2.5×10
5 M
−1s
−1 *
R16) Cl• + Cl
− Cl2
•− k16 = 8.0×10
9 M
−1s
−1 *
R17) HO• + Br
− BrOH
•− k17 = 1.1×10
10 M
−1s
−1 *
R18) Br• + H2O BrOH
•− + H
+
R19) Br• + Br
− Br2
•− k19 = 1.0×10
10 M
−1s
−1 *
* Constants from NIST (National Institute of Standard and Technology) Solution Kinetics Database.
Br2•−
and Cl2•−
have a weak impact due to their low concentrations and reactivity while SO4•−
has an important effect on reaction with transition metal ions (TMI), halogenated and S-
containing compounds 30
. In most cases, the second order rate constant between these radicals
and organic compounds is lower than the one between HO• and organic compounds (generally
one or two orders of magnitude) 76
. NO3• is a strong oxidant during nighttime while its
concentration during the day is very low because it is photolysed in the gas phase 45
. HO• is
the main oxidant in the atmosphere, especially during the day, and is the most important way
of transforming organic compounds in cloud water 30
.

32
Main oxidants in cloud water
In this chapter, the oxidative capacity of H2O2, NO3• and HO
•, which are the most important
oxidants in cloud water, will be described. Ozone will not be considered in this work because
of its low solubility which hinders its transfer from the gas to the liquid phase (KH = 1.2 ×
10−2
M atm−1
).
Hydrogen peroxide
Sources in gas and liquid phase
Gaseous H2O2 is formed from the radical-radical reaction of hydroperoxyl (HO2•) (R20)
and/or hydrated hydroperoxyl (HO2•−H2O) radicals (R21−24), which are produced by the
photochemical reactions of atmospheric trace gases such as ozone and volatile organic
compounds 77
. Hydrogen peroxide in cloud droplets originates both from gas-to-liquid
partitioning of H2O2 and HO2• and from aqueous-phase photo-production. The first situation
has traditionally been considered as the predominant source 66
because of the high solubility
of H2O2 (KH = 1.0 × 10⁵ M atm
−1)
78 and of HO2
• (KH = 2.0±1.0 × 10
3 M atm
−1), while other
studies support the hypothesis that light absorbing compounds present in cloud droplets can
initiate aqueous phase photochemical reactions resulting in the formation of H2O2 79-82
.
Several mechanisms have been proposed for the H2O2 photoproduction in atmospheric water
drops but only on the basis of laboratory experiments. For example the oxidation of transition
metal ions (TMI) by radical species leads to the formation of H2O2 (R25−27): this is the case
of the iron-oxalate complex which is usually used as a model to describe the action of organic
iron complexes in cloud aqueous phase. Even if the role of this complex is the subject of
debate, the irradiation of cloud water leads to an increase in the concentration of H2O2 and
Fe(II) 83
. The photolysis of phenolic compounds 79
and biacetyl compounds 84
was also
proposed as a source of H2O2. Zuo and Deng observed that substantial amounts of H2O2 were
produced by lightning activities during thunderstorms 85
. Another production pathway is the
photolysis of organic peroxides, in particular of the methyl hydroperoxide normally present in
water droplets. This photolysis is a source of HO• which leads to the formation of
formaldehyde and HO2• which are sources of H2O2 (R28−29).
R20) HO2• + HO2
• H2O2 + O2 k20 = 8.3×10⁵ M
−1s
−1*
R21) HO2• + H2O (HO2
•−H2O) k21 = 9.7×10
7 M
−1s
−1 *
R22) HO2• + (HO2
•−H2O) H2O2 + O2 + H2O k22 = 9.6×10
7 M
−1s
−1*
R23) (HO2•−H2O) + (HO2
•−H2O) H2O2 + O2 + 2H2O k23 = 9.6×10
7 M
−1s
−1*
33
R24) HO2• O2
•− + H
+ pka = 4.88
R25) Fe(II) + O2•−
+ 2H+ Fe(III) + H2O2 k25 = 1.2 ÷ 2.1×10
6 M
−1s
−1 *
R26) Fe(II) + O2 Fe(III) + O2•−
pH dependent
R27) O2•−
+ HO2•+ H2O H2O2 + O2 + HO
− k27 = 9.7×10
7 M
−1s
−1*
R28) CH3OOH + hν CH3O• +HO
•
R29) CH3O• + O2 H2CO + HO2
•
* Constants from NIST (National Institute of Standard and Technology) Solution Kinetics Database.
Concerning real cloud water, many modeling studies affirm that the main source of HO•
comes from the gas phase mass transfer while secondary sources are divided between H2O2
photolysis and Fenton like reactions according to the different scenarios.
Steady state concentration
In the gas phase the concentration of H2O2 is in the range of 0.1-2 pptv (parts per trillion in
volume) but many authors report also higher values 86
. A negative correlation with the
concentration of NOx was found. The half-life time in the gas phase is of 24 h 72
and Valverde
Canossa 87
observed a daily cycle, a dependence of the concentration on the actinic radiation.
Previous measurements at the puy de Dôme station show that H2O2 concentrations in the
cloud aqueous phase ranges from 0.3 µM to 20 µM 23
, while a study on cloud water sampled
in Los Angeles shows concentrations up to 88 µM 88
.
Sinks in gas and liquid phase
The main removal mechanisms for H2O2 from the gas phase are the photolysis of H2O2 (λ <
370 nm) (R30), the reaction with HO• (R31) and the gas to liquid phase transfer since H2O2 is
a very soluble species that readily dissolves in the atmospheric waters. Moreover, all reactions
leading to the consumption of HO2•, such as the oxidation of NO
• 89
(R32) or the reaction with
O3 (R33−34), can impact on H2O2 gaseous concentrations.
R30) H2O2 + hν 2HO•
R31) H2O2 + HO• HO2
• + H2O k31 = 3.2×10
7 M
−1s
−1*
R32) HO2• + NO
• NO2
• + HO
• k32 = 8.8 × 10
−12 cm
3 molecules
−1 s
−1 45
R33) HO2• + O3 2O2 + HO
• k33 = < 1.0×10
4 M
−1s
−1*
R34) HO2• + O3 HO3
• + O2 k34 = 1.5×10
9 M
−1s
−1*
* Constants from NIST (National Institute of Standard and Technology) Solution Kinetics Database.
In the gas phase, photolysis leads to a significant loss of peroxides in the troposphere (R30),
although the absorption drops rapidly at wavelength above the actinic cutoff of 290 nm. The
34
quantum yield is of two HO• for each H2O2, corresponding to a photodissociation quantum
yield of 2 at wavelengths > 222 nm 90
. In condensed phase the quantum yield is lower because
the formed radicals have a higher probability of recombining due to the cage solvent effect.
Moreover, in cloud aqueous phase, H2O2 can be consumed by Fenton processes. Many other
inorganic compounds seem to have an impact on the disappearance of H2O2: Zuo and Deng
found an inverse correlation between H2O2 and NO3−
and SO42−
concentrations in rainwater
and cloud water. This phenomenum is explained by the oxidation of sulfites (S(IV)) to
sulfates (S(VI)) and of ammonium (NH4+) to nitrates, where the role of H2O2 (directly or as a
HO• source) is important at typical hydrometeor pH values.
Nitrate radical
Sources in gas phase
The nitrate radical NO3• is an important intermediary in nighttime chemistry. It is produced in
the gas phase by the reaction between NO2• and O3 (R35) or between HO
• and HNO3 (R36).
R35) NO2•(g)
+ O3(g) NO3
•(g)
+ O2(g)
R36) HO•(g)
+ HNO3(g) NO3
•(g)
+ H2O(g)
Steady state concentration and sinks
NO3• absorbs strongly in the red region (620−670 nm) of the visible spectrum, unlike most
atmospherically important species which absorb in the UV region. Due to this absorption,
during the day it photolyses giving NO2• or NO
• (R37−38).
The spectroscopic proprieties of NO3• allow a good estimation of its concentration in the dry
troposphere during the day (104 molecules cm
−3) and during the night (10
9 molecules cm
−3)
72.
In the case of wet air, NO3• reacts with NO
• to give N2O5 which in the presence of water
forms HNO3, responsible for acid fog and rain (sink of nitrate radical by wet deposition) 91
.
The exchange of NO3• with the aqueous−phase was investigated by Thomas et al
92 at room
temperature (293 K). From these experiments, the uptake coefficient of NO3• (γ(NO3
•)) was
found to be ≥ 2 × 10⁻³
while the Henry coefficient was estimated to be KH(NO3•) = 1.8 ± 3 M
atm−1
. Because of its low solubility, the heterogeneous removal of NO3• is only important
under conditions when the dissolved NO3• is removed quickly from the equilibrium, for
example by reactions with Cl− or HSO3
− ions (R39−40) in the liquid−phase. Otherwise,
heterogeneous removal should mainly proceed via N2O5 92
, with production of HNO3 and
consequent inactivation of this radical in condensed phase.
35
R37) NO3• + hν < 635 nm NO2
• + O(
1D)
R38) NO3• + hν < 586 nm NO
• + O2
R39) NO3• + Cl
− Cl
• + NO3
− k38 = 1.0 ×10
7 ÷ 1.0×10
8 M
−1s
−1 *
R40) NO3• + HSO3
− SO3
•− + NO3
− + H
+ k39 = 1.4 ÷ 2.0×10
9 M
−1s
−1 *
* Constants from NIST (National Institute of Standard and Technology) Solution Kinetics Database.
Hydroxyl radical
The hydroxyl radical drives the daytime chemistry of both polluted and clean atmosphere.
The HO• - mediated oxidation of organic compounds in the aqueous phase can lead to the
formation of shorter but often multifunctional organic species and, ultimately, to complete
mineralization. Complex chemical reactions catalyzed by HO• can also occur in the aqueous
phase forming accretion products such as oligomers 62
. These alternative chemical pathways
are efficient processes to convert organic compounds into Secondary Organic Aerosols
(SOAs).
HO• can be produced in the gas phase and then diffuse to the liquid phase or it can be directly
produced in the aqueous phase. On the contrary of what was previously described for the
nitrate radical, the hydroxyl radical can diffuse to the aqueous phase after its production in the
gas phase (KH(HO•) = 3.0 ± 0.2 M atm−1
) 93
. In the following paragraph the main sources are
described.
Sources in the gas phase
The hydroxyl radical is produced in the gas phase by photolysis of O3 and subsequent reaction
between O(1D) (electronically excited singlet atom) and H2O (R41−42) or by photolysis of
HNO2 (R43) and H2O2 (R44). Without light, a very important source is the reaction between
HO2• and NO
• (R45). The relative importance of these sources of HO
• depends on the species
present in the air mass and hence on the location and the time of the day.
R41) O3 + hν < 340 nm O(1D) + O2
R42) O(1D) + H2O(g) 2HO
•(g) k42 = 1.8 ×10
10 M
−1s
−1 94
R43) HNO2(g) + hν < 370 nm NO•(g) + HO
•(g)
R44) H2O2(g) + hν < 370 nm 2 HO•(g)
R45) HO2•(g) + NO
•(g) OH
•(g) + NO2
•(g) k45 = 9.7 × 10
−12 cm
3 molecules
−1 s
−1 95
Ozone can react directly on the gas-aqueous interface with HO2• or with O2
•− to produce HO
•
96 following the reactions R46−49. These pathways could be important at the gas-droplet
interface.
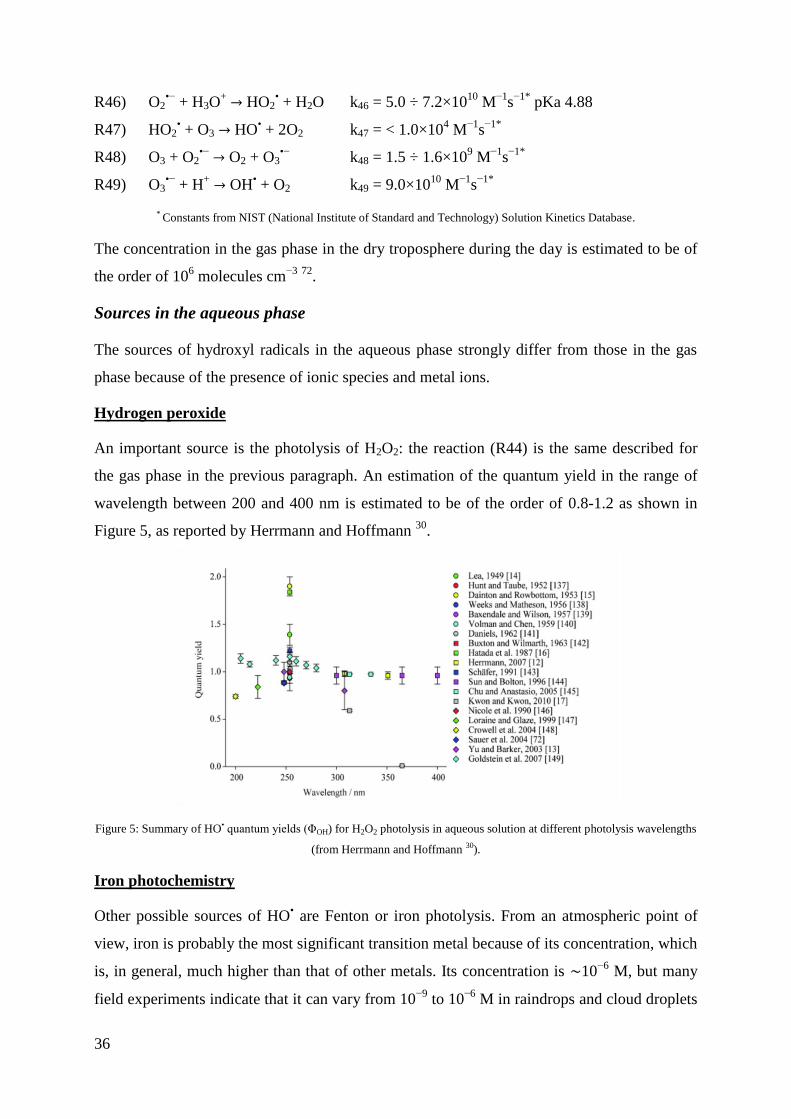
36
R46) O2•−
+ H3O+ HO2
• + H2O k46 = 5.0 ÷ 7.2×10
10 M
−1s
−1* pKa 4.88
R47) HO2• + O3 HO
• + 2O2 k47 = < 1.0×10
4 M
−1s
−1*
R48) O3 + O2•−
O2 + O3•−
k48 = 1.5 ÷ 1.6×10⁹ M
−1s
−1*
R49) O3•−
+ H+ OH
• + O2 k49 = 9.0×10
10 M
−1s
−1*
* Constants from NIST (National Institute of Standard and Technology) Solution Kinetics Database.
The concentration in the gas phase in the dry troposphere during the day is estimated to be of
the order of 106 molecules cm
−3 72
.
Sources in the aqueous phase
The sources of hydroxyl radicals in the aqueous phase strongly differ from those in the gas
phase because of the presence of ionic species and metal ions.
Hydrogen peroxide
An important source is the photolysis of H2O2: the reaction (R44) is the same described for
the gas phase in the previous paragraph. An estimation of the quantum yield in the range of
wavelength between 200 and 400 nm is estimated to be of the order of 0.8-1.2 as shown in
Figure 5, as reported by Herrmann and Hoffmann 30
.
Figure 5: Summary of HO• quantum yields (ΦOH) for H2O2 photolysis in aqueous solution at different photolysis wavelengths
(from Herrmann and Hoffmann 30).
Iron photochemistry
Other possible sources of HO• are Fenton or iron photolysis. From an atmospheric point of
view, iron is probably the most significant transition metal because of its concentration, which
is, in general, much higher than that of other metals. Its concentration is ∼10−6
M, but many
field experiments indicate that it can vary from 10−9
to 10−6
M in raindrops and cloud droplets

37
61. The concentration of iron drives the concentration of radicals in cloud droplets, but also
partly in the gaseous phase (due to the rate of the mass transfer). In cloud aqueous phase, the
redox cycle between Fe(II) and Fe(III) depends on many factors such as the concentration of
oxidant, reducing and complexing agents and the intensity of the actinic irradiation. The iron
redox cycle is linked to the chemistry of HxOy (H2O2, HO•, HO2
•/ O2
•−), and the main
chemical pathways driving the reactivity of the HxOy/iron system in cloud water are presented
in Figure (left). Iron(III) is present in 3 monomeric forms: Fe3+
, Fe(OH)2+
and Fe(OH)2+. In
cloud droplets, the speciation of iron between its two oxidation states (II and III) is a key
parameter of its reactivity in solution and is a function of pH and redox potential, as shown in
Figure 6Figure (right). Fe(II) is oxidized by hydrogen peroxide via the Fenton reaction (R51)
to form Fe(III) and HO•. Under irradiation, this reaction is in competition with the direct
photolysis of H2O2 (R44) and the photoreduction of Fe(III) (R50) 97
. Furthermore, as shown
in Figure 6, hydroxyl radicals can oxidize iron (reaction D′) and react with hydrogen peroxide
to form HO2•/ O2
•−. These radicals can trigger the oxido-reduction of iron (reactions E and E′)
and generate H2O2. Also iron complexes, like the iron-oxalate complex, can undergo Fenton
reaction, as shown in reaction R52. The relevance of iron photochemistry in hydroxyl radical
production is high, in particular for air masses of continental origin, but need to be quantified.
R50) Fe(III)
(OH)2+
+ hν Fe2+
+ HO•
R51) Fe(II)
(OH)+ + H2O2 Fe(OH)
2+ + HO
•+ HO
−
R52) Fe(II)
(C2O4) + H2O2 Fe(C2O4)+ + HO
•+ HO
−
Figure 6: (left) Iron chemistry and photochemistry (adapted from Barbusinski et al. 98)
(right) Pourbaix diagram of iron: speciation is a function of pH and redox potential.

38
Nitrate and nitrite photolysis
As discussed in Chapter 1, many studies report the concentration of nitrates in cloud water.
Nitrate photolysis was firstly investigated in seawater 99
. Nitrates can absorb sunlight and
their photolysis gives NO2• and O
•− or O(
3P) (ground state oxygen atom) (R53−56), which is
responsible for the formation of HO•. NO2
• reacts following many pathways (R57−64) and
produces nitrite anions NO2−.
R53) NO3− + hν NO2
• + O
•−
R54) NO3− + hν NO2
− + O(
3P) Φ305nm = 1.1 ± 0.1 × 10
−3 100
R55) O•−
+ H2O HO− + HO
•
R56) O(3P) + H2O 2HO
•
R57) NO2• + HO
• HNO3
R58) HNO3 + hν NO3− + H
+
R59) HNO3 + hν NO2• + HO
•
R60) NO2• + O2
•− NO2
− + O2
R61) 2NO2• N2O4
R62) 2NO2• + H2O NO2
− + NO3
− + 2H
+
R63) N2O4 + H2O NO2− + NO3
− + 2H
+
R64) NO2− + HO
• NO2
• + HO
−
Nitrous acid (HNO2) is a compound normally studied in the gaseous phase because it is
strictly connected to the NOx cycle. Cloud and fog droplet could be sinks of HNO2 from the
gaseous phase because of its high value of Henry’s law constant (KH(HNO2) = 50 M atm
−1).
Nitrous acid in droplets can undergo photolysis as in the gas phase (R65−67) but, more
probably, it follows another reaction pathway: at water droplet pH values, nitrous acid is
present in the deprotonated form, nitrite. Even if the concentration is very low (of the order of
0.1 µM), nitrites can absorb sunlight more efficiently than nitrates and they photogenerate
HO• following the reactions R68−R70.
R65) 2NO2(g) + H2O(g) HNO2(g) + HNO3(g)
R66) NO(g) + NO2(g) + H2O(g) 2HNO2(g)
R67) HNO2(g) + hν NO• + HO
•
R68) HNO2 H+ + NO2
− pka=3.35
R69) NO2− + hν NO
• + O
•−
R70) O•−
+ H2O HO− + HO
•
Main generation and destruction pathways are resumed in Figure 7.
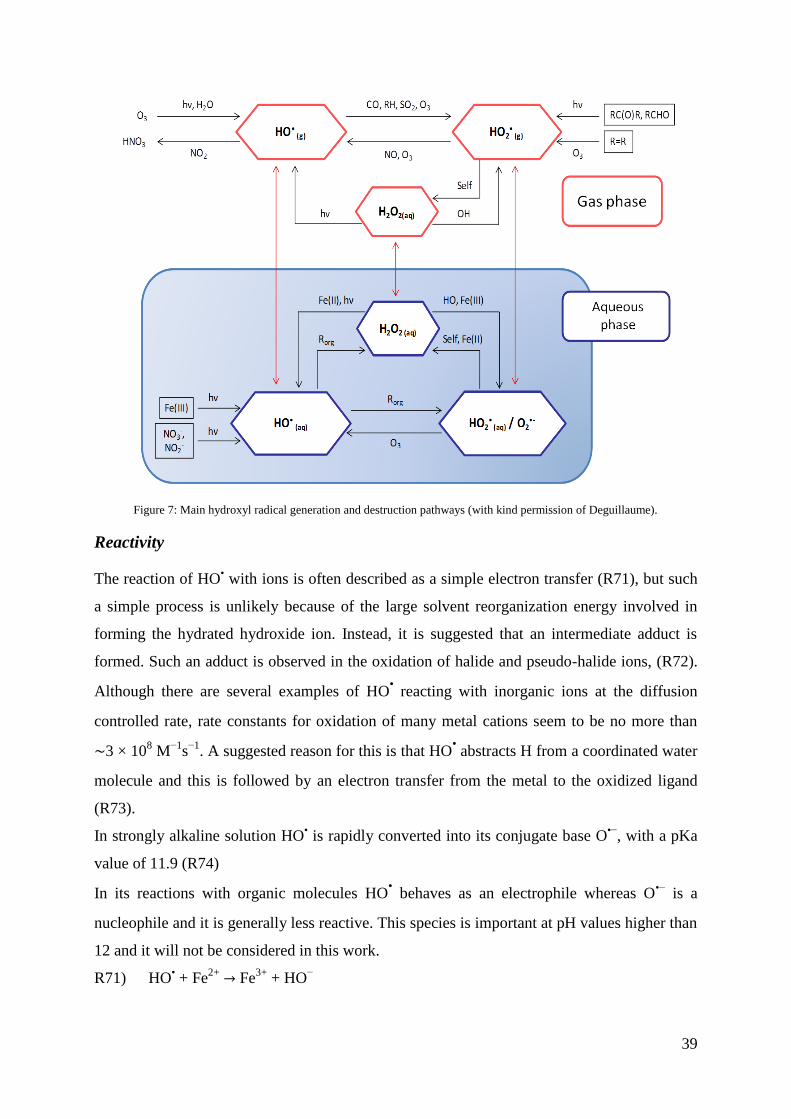
39
Figure 7: Main hydroxyl radical generation and destruction pathways (with kind permission of Deguillaume).
Reactivity
The reaction of HO• with ions is often described as a simple electron transfer (R71), but such
a simple process is unlikely because of the large solvent reorganization energy involved in
forming the hydrated hydroxide ion. Instead, it is suggested that an intermediate adduct is
formed. Such an adduct is observed in the oxidation of halide and pseudo-halide ions, (R72).
Although there are several examples of HO• reacting with inorganic ions at the diffusion
controlled rate, rate constants for oxidation of many metal cations seem to be no more than
∼3 × 10⁸ M
−1s
−1. A suggested reason for this is that HO
• abstracts H from a coordinated water
molecule and this is followed by an electron transfer from the metal to the oxidized ligand
(R73).
In strongly alkaline solution HO• is rapidly converted into its conjugate base O
•−, with a pKa
value of 11.9 (R74)
In its reactions with organic molecules HO• behaves as an electrophile whereas O
•− is a
nucleophile and it is generally less reactive. This species is important at pH values higher than
12 and it will not be considered in this work.
R71) HO• + Fe
2+ Fe
3+ + HO
−

40
R72) HO• + Cl
− HClO•−
R73) HO• + Fe
2+ Fe
2+HO
• Fe
3+ + OH
−
R74) HO• + HO
− O
− + H2O pKa = 11.5
76
HO• reacts by different pathways (double bond addition, hydrogen abstraction, electron
transfer and aromatic ring addition) with organic molecules, as schematized in Figure 8:
Figure 8: HO• reaction pathway (left) and becoming of organic compounds after reaction (right).
Hydroxyl radical mediated oxidation of organic compounds can lead to the fragmentation or
to the formation of oxidized organic species, introducing different functional group, to result
in the complete mineralization to CO2. But another pathway is possible: when water
evaporates and solutes become more concentrated, the recombination of organic radicals
becomes possible. The result is the formation of dimers, oligomers or, in general, Large
Molecular Compounds, as shown in Figure (right). The competition between fragmentation
and formation of high weight molecular compounds is well known for oxalic acid that by
reacting with hydroxyl radical can mineralize to carbon dioxide or dimerize 101
.
Hydroxyl radical sinks
The hydroxyl radical is an important oxidant in atmospheric aqueous phase, where it reacts
with both organic and inorganic species. HO is scavenged in the aqueous phase, primarily by
dissolved organic compounds: for example, the HO-mediated oxidation of aqueous glyoxal,
glyoxylic acid, and other small, multifunctional organic compounds produces low-volatile
secondary organic aerosol species such as oxalic acid and oligomers. The lifetime of an
aqueous species “S” considering the reactivity with hydroxyl radical is inversely proportional
to the steady-state concentration of HO, generally expressed by the Equation 5:

41
Equation 5: Hydroxyl radical steady state concentration.
where is the bimolecular rate constant between S and HO. Thus, the steady-state
concentration of HO ( ) is a crucial quantity for understanding the fates of
atmospheric pollutants. This concentration is determined by the balance of the HO sources
and sinks, reported in Equation 6
Equation 6: Hydroxyl radical mass balance.
where is the rate of production of HO and
is the apparent first-order rate constant
for loss of HO (s
−1). Since there are many scavengers for HO
, the rate constant for HO
loss
is the sum of the individual scavenger contributions, and can be calculated, as reported in
Equation 7 as the product of the bimolecular rate constant and the scavenger concentration for
each species
Equation 7: First-order rate constant for loss of HO• (s−1).
Determining the rate constant for HO loss in this manner is a herculean task since
atmospheric drops and particles can contain on the order of 104 individual organic
compounds, as well as significant concentrations of poorly characterized, large molecular
weight species such as humic-like substances 102
. In contrast, the most sophisticated numerical
models of atmospheric waters track the reactions of fewer than 100 individual organic
compounds, with none larger than four carbon atoms.
Arakaki et al. found that the HO sink can be simply estimated by a general carbon rate
constant that is applicable both for atmospheric waters as well as surface waters, which allows
to be estimated by using organic carbon concentrations
103. Their results show that the
scavenging rate constant of HO by organic species in atmospheric waters can be simply
estimated as the product of a robust general rate constant ( ) multiplied by the
dissolved organic carbon concentration of the sample, as reported in Equation 8.
Equation 8: First order rate constant for hydroxyl radical loss as a function of the general second order rate constant between
hydroxyl radical and DOC.

42
In the work of Arakaki et al. 103
, is estimated to be of the order of 3.8 ± 1.9 × 10⁸ L
molC−1
s−1
.
Steady state concentration
Uncertainties in HO sinks and sources make its concentrations in atmospheric water highly
difficult to determine. For this estimation, models describing the multiphase cloud chemistry
have been developed and have considered the reactivity in the gas and aqueous phases along
with the mass transfer between the two phases 97,104,105
. These numerical tools allow the
estimation of the steady−state concentration of HO ([HO
]ss), which is a crucial quantity to
understand the fate of atmospheric pollutants 103
. The range of the maximal HO concentration
varies from 10−16
to 10−12
M, depending on the "chemical scenario" (i.e., emission/deposition
and the initial chemical conditions) used in the modeling study, as shown in Table 3, where
the estimation of the HO steady state concentration for different air mass origins is reported.
The amounts of organic matter and iron are key parameters controlling the [HO]ss. These
models are expected to underestimate the radical sinks because organic scavengers cannot be
exhaustively described in the aqueous chemical mechanism 103
.
Polluted origin cloud water
[HO] (M)
Remote origin cloud water
[HO] (M)
Marine origin cloud water
[HO] (M)
mean max min mean max min mean max min
3.5×10⁻¹⁵
1.6×10⁻¹⁴
2.9×10⁻¹⁶
2.2×10⁻¹⁴
6.9×10⁻¹⁴
4.8×10⁻¹⁵
2.0×10⁻¹²
5.3×10⁻¹²
3.8×10⁻¹⁴
Table 3: Calculated HO radical concentrations in clouds and deliquescent particles using the CAPRAM 3.0 multiphase
mechanism. Mean concentrations are averaged values over three simulation days. Data adapted from Herrmann et al. 30.

43
Chapter 3
Organic matter in clouds
Cloud droplets efficiently scavenge and modify water-soluble compounds and, thus, modify
the chemical composition of gas and particle phases. The concentration of DOC in aqueous
phase reaches concentrations of the order of 10 mgC L−1
1. A number of attempts have been
made to obtain a mass balance of organic carbon in cloud water but to date no conclusive
identification of individual components is available 103
. In addition, the organic carbon in an
atmospheric liquid sample is expected to be a very complex mixture 26
. As said before, cloud
droplets are formed by condensation of water on CCNs, which contain in most cases a large
amount of organic matter that can be dissolved by the liquid phase. Water-soluble organic
carbon (WSOC) may comprise up to 70% of the total organic aerosol mass 106
and so a large
fraction of the WSOC may partition to the aqueous phase. Moreover, suspended droplets are
subject to the gas-liquid equilibrium of volatile compounds and the solid-liquid equilibrium of
non-volatile compounds, thus new transport and transformation pathways affecting the
composition of DOC may occur 107,108
. For this reason, a considerable number of species,
either from the gas phase or the particle phase, can be found in the liquid phase of the
droplets. The multiphase environment of the droplets facilitates aqueous phase reactions of
the water-soluble species. Several low molecular weight organic species have been studied
and are believed to be transferred from the gaseous phase, including formic acid, acetic acid,
formaldehyde, glyoxal, methylglyoxal, phenol and nitrophenol 65-68
. Aldheydes and mono and
dicarboxylic acids typically comprise a large fraction of DOC because of their high solubility
106 and their behavior is described in the following paragraph. Compounds similar to the high
molecular weight organic substances or HULIS found in aerosols were also recently observed
in clouds 53,109
. For example, Reyes-Rodriguez et al. 53
observed the high molecular weight
organic compounds in cloud samples to be mostly aliphatic and oxygenated, with a small
amount of aromatic compounds based on the study of the functional groups. Overall, previous
studies either observed several individual compounds or functional groups rather than the
complex mixture of the organic compounds on a molecular level.
Carboxylic acids
Determination of the concentration of organic anions gains a lot of importance if we consider
that the ion balance of inorganic anions and cations is not equal. An anion deficit was first
observed during the HCCT−2010 campaign by van Pinxteren 21
and it ranged up tu 178 µeq

44
L−1
. The inorganic anions missing from this calculation (bicarbonate and sulfite) do not
impact the ion balancing.
Only in the last few decades researchers started to investigate cloud water organic
composition and its reactivity, especially the formation and transformation of carboxylic acids
101. For the HCCT−2010 campaign, the concentrations of a large number of organic acids
were measured from the bulk of cloud water samples. It was estimated to be in the range of 3-
115 µeq L−1
and can thus explain a large fraction of the anion deficit. Considering that the
DOC fraction is likely to contain many more than the analytically resolved organic acids, it
can be assumed that the missing anions are predominantly organic in nature and that organic
acidic material had a non negligible impact on cloud water acidity during the HCCT−201021
.
This result is not an isolated case: similar observations were made during many studies
110,111,112,113.
Such soluble compounds include oxidation products of volatile organic compounds (VOCs)
that are emitted from anthropogenic or biogenic sources and are ubiquitous in the atmosphere
114. The most abundant organic compounds that have been identified in cloud and fog droplets
are small volatile carboxylic acids: formic, acetic, oxalic, succinic, malonic, malic and tartaric
acids are the most important 5. Notwithstanding, the composition of DOC is mostly unknown:
Loflund at al. 26
correlate the carboxylic acid concentrations to DOC and found that the
monocarboxylic acids alone represent 9.3% of DOC. Adding the dicarboxylic acids, this
average value increases to 11%.
In a recent work, Deguillaume et al. show that carboxylic acids represent 9 to 12% of the
DOC with a preponderance of acetic acid (29-70% of the total of carboxylic acids) and formic
acid (15-47%), while malonic succinic and oxalic acids are less concentrated (≈ 20%). In the
same work aldehydes are also described and they represent from 0.83 to 1.4% of the DOC,
with a prevalence of formaldehyde (from 52 to 73% of the total aldehydes) 27
.
Sources
In the atmospheric aqueous phase, carboxylic acids have different sources, such as
anthropogenic and biogenic direct emissions in the gas and particulate phases, or chemical
transformations from organic precursors 101
. It is quite problematic to distinguish between
primary and secondary sources and biogenic and anthropogenic origins and also if they come
mostly from the gas phase (high Henry’s constant value) or from the dissolution of CCN.
Concerning primary emissions, the most important are anthropic sources (fossil fuel
combustion) 115
, biogenic sources (from vegetation and oceans) 65
and natural sources (wood

45
combustion) 116
. In gas phase carboxylic acids are produced by degradation of hydrocarbons,
for example by oxidation of alkenes by ozone. Also, C1–C3 carbonyl compounds 55,108
were
identified in cloud water along with formaldehyde, that represents a final product in the
oxidation chain of numerous VOCs, and is the most concentrated. However, difunctional
aldehydes, such as glyoxal or methylglyoxal, have higher Henry’s law constants than
formaldehyde and their concentration are similar to those observed for formaldehyde. Their
oxidation pathway is important and lead to the production of oxalic acid 117
.
Monocarboxylic acids
Acetic and formic acids represent the most abundant of the carboxylic acids 26
. Regarding
their biogenic sources, Khwaya et al 112
, Khare et al 118
and Montero et al 119
observe seasonal
variation, strictly correlated to the vegetation cycle, and daily variation, correlated to
photochemical production. The latter is probably due to the oxidation of monoterpenes and
isoprene emitted by vegetation. Concerning anthropic sources, biomass burning leads to the
emission in the atmosphere of carboxylic acid and is the most important source of acetic and
formic acid in the atmosphere. Incomplete combustion of fossil fuel is also a source of
monocarboxylic acids in the atmosphere, especially in densely populated areas. Many authors
showed that acetic acid production is more elevated than the formic one 115,120,121
.
One source of formic acid in cloud aqueous phase is the oxidation of methanol 122
and
formaldehyde 7. Acetic acid can be produced in the aqueous phase by the oxidation of various
alcohols, like ethanol, ethylene glycol or 2-propanol. The transfer from the gas phase is also
an important source of formic and acetic acids in the atmospheric aqueous phase, whose
Henry’s law constants are equal to 5400 and 5300 M atm−1
respectively 123
. Sellegri et al 47
showed, during a campaign of measurements at the Puy de Dôme station, that acetic and
formic acid are present in the interstitial gaseous phase and that their presence in aqueous
phase is due to the gas transfer. Moreover, the presence of acetic and formic acids can also be
potentially the result of their production by microorganisms as they are common
intermediates in different metabolic pathways 124
.
Formic acid concentration in cloud water was evaluated to be of the order of 10 µM during
the FEBUKO (II) campaign 21
, while Loflund 26
found a concentration of 1 µM. In the same
works acetic acid concentration was reported to be of the order of 7 µM and 1 µM
respectively.
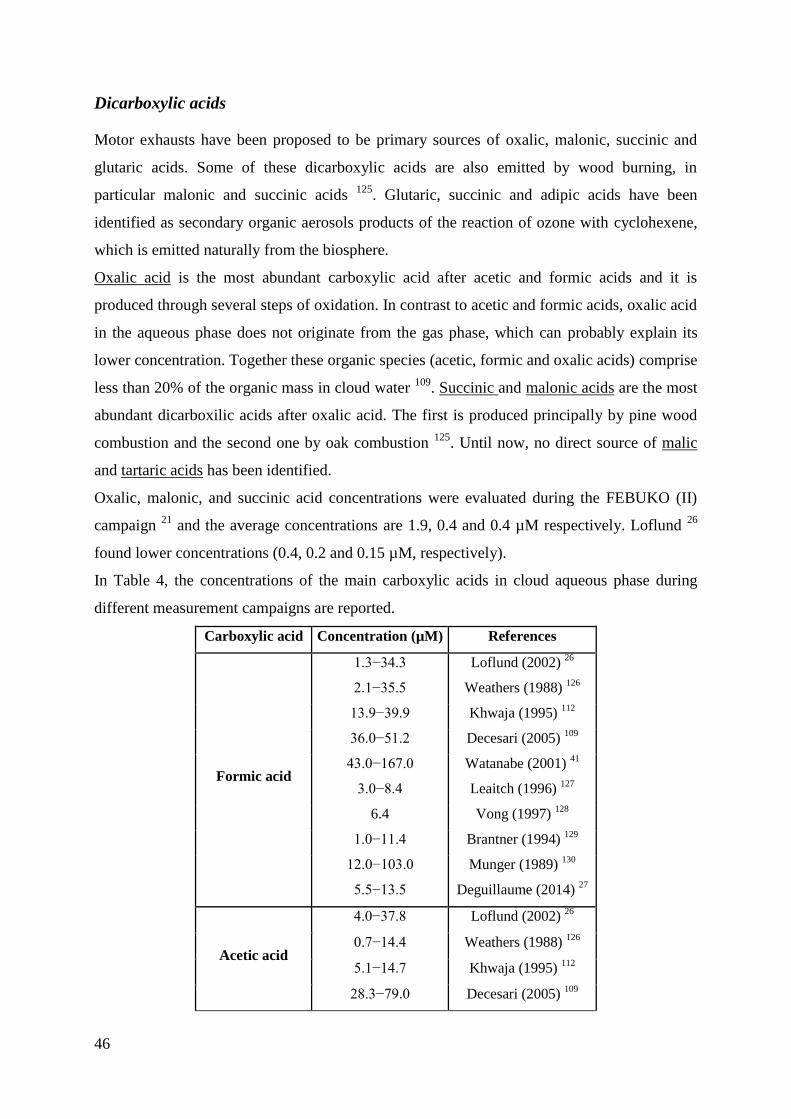
46
Dicarboxylic acids
Motor exhausts have been proposed to be primary sources of oxalic, malonic, succinic and
glutaric acids. Some of these dicarboxylic acids are also emitted by wood burning, in
particular malonic and succinic acids 125
. Glutaric, succinic and adipic acids have been
identified as secondary organic aerosols products of the reaction of ozone with cyclohexene,
which is emitted naturally from the biosphere.
Oxalic acid is the most abundant carboxylic acid after acetic and formic acids and it is
produced through several steps of oxidation. In contrast to acetic and formic acids, oxalic acid
in the aqueous phase does not originate from the gas phase, which can probably explain its
lower concentration. Together these organic species (acetic, formic and oxalic acids) comprise
less than 20% of the organic mass in cloud water 109
. Succinic and malonic acids are the most
abundant dicarboxilic acids after oxalic acid. The first is produced principally by pine wood
combustion and the second one by oak combustion 125
. Until now, no direct source of malic
and tartaric acids has been identified.
Oxalic, malonic, and succinic acid concentrations were evaluated during the FEBUKO (II)
campaign 21
and the average concentrations are 1.9, 0.4 and 0.4 µM respectively. Loflund 26
found lower concentrations (0.4, 0.2 and 0.15 µM, respectively).
In Table 4, the concentrations of the main carboxylic acids in cloud aqueous phase during
different measurement campaigns are reported.
Carboxylic acid Concentration (µM) References
Formic acid
1.3−34.3 Loflund (2002) 26
2.1−35.5 Weathers (1988) 126
13.9−39.9 Khwaja (1995) 112
36.0−51.2 Decesari (2005) 109
43.0−167.0 Watanabe (2001) 41
3.0−8.4 Leaitch (1996) 127
6.4 Vong (1997) 128
1.0−11.4 Brantner (1994) 129
12.0−103.0 Munger (1989) 130
5.5−13.5 Deguillaume (2014) 27
Acetic acid
4.0−37.8 Loflund (2002) 26
0.7−14.4 Weathers (1988) 126
5.1−14.7 Khwaja (1995) 112
28.3−79.0 Decesari (2005) 109
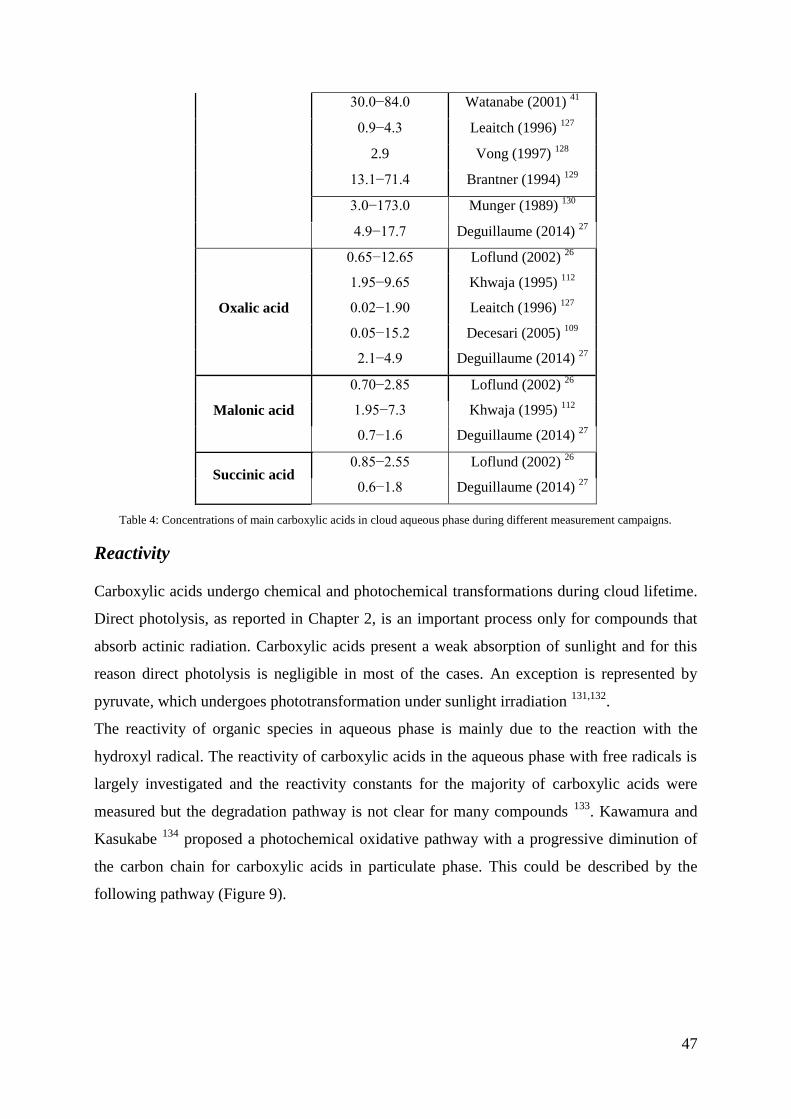
47
30.0−84.0 Watanabe (2001) 41
0.9−4.3 Leaitch (1996) 127
2.9 Vong (1997) 128
13.1−71.4 Brantner (1994) 129
3.0−173.0 Munger (1989) 130
4.9−17.7 Deguillaume (2014) 27
Oxalic acid
0.65−12.65 Loflund (2002) 26
1.95−9.65 Khwaja (1995) 112
0.02−1.90 Leaitch (1996) 127
0.05−15.2 Decesari (2005) 109
2.1−4.9 Deguillaume (2014) 27
Malonic acid
0.70−2.85 Loflund (2002) 26
1.95−7.3 Khwaja (1995) 112
0.7−1.6 Deguillaume (2014) 27
Succinic acid 0.85−2.55 Loflund (2002)
26
0.6−1.8 Deguillaume (2014) 27
Table 4: Concentrations of main carboxylic acids in cloud aqueous phase during different measurement campaigns.
Reactivity
Carboxylic acids undergo chemical and photochemical transformations during cloud lifetime.
Direct photolysis, as reported in Chapter 2, is an important process only for compounds that
absorb actinic radiation. Carboxylic acids present a weak absorption of sunlight and for this
reason direct photolysis is negligible in most of the cases. An exception is represented by
pyruvate, which undergoes phototransformation under sunlight irradiation 131,132
.
The reactivity of organic species in aqueous phase is mainly due to the reaction with the
hydroxyl radical. The reactivity of carboxylic acids in the aqueous phase with free radicals is
largely investigated and the reactivity constants for the majority of carboxylic acids were
measured but the degradation pathway is not clear for many compounds 133
. Kawamura and
Kasukabe 134
proposed a photochemical oxidative pathway with a progressive diminution of
the carbon chain for carboxylic acids in particulate phase. This could be described by the
following pathway (Figure 9).
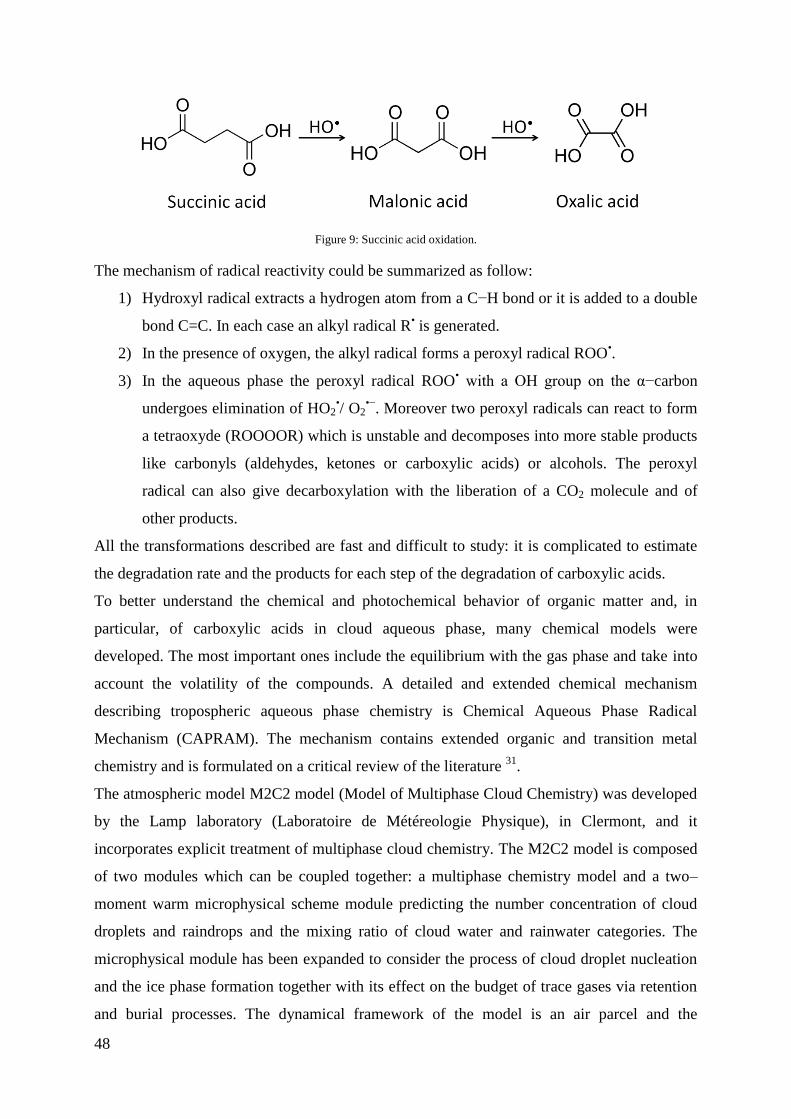
48
Figure 9: Succinic acid oxidation.
The mechanism of radical reactivity could be summarized as follow:
1) Hydroxyl radical extracts a hydrogen atom from a C−H bond or it is added to a double
bond C=C. In each case an alkyl radical R• is generated.
2) In the presence of oxygen, the alkyl radical forms a peroxyl radical ROO•.
3) In the aqueous phase the peroxyl radical ROO• with a OH group on the α−carbon
undergoes elimination of HO2•/ O2
•−. Moreover two peroxyl radicals can react to form
a tetraoxyde (ROOOOR) which is unstable and decomposes into more stable products
like carbonyls (aldehydes, ketones or carboxylic acids) or alcohols. The peroxyl
radical can also give decarboxylation with the liberation of a CO2 molecule and of
other products.
All the transformations described are fast and difficult to study: it is complicated to estimate
the degradation rate and the products for each step of the degradation of carboxylic acids.
To better understand the chemical and photochemical behavior of organic matter and, in
particular, of carboxylic acids in cloud aqueous phase, many chemical models were
developed. The most important ones include the equilibrium with the gas phase and take into
account the volatility of the compounds. A detailed and extended chemical mechanism
describing tropospheric aqueous phase chemistry is Chemical Aqueous Phase Radical
Mechanism (CAPRAM). The mechanism contains extended organic and transition metal
chemistry and is formulated on a critical review of the literature 31
.
The atmospheric model M2C2 model (Model of Multiphase Cloud Chemistry) was developed
by the Lamp laboratory (Laboratoire de Météreologie Physique), in Clermont, and it
incorporates explicit treatment of multiphase cloud chemistry. The M2C2 model is composed
of two modules which can be coupled together: a multiphase chemistry model and a two–
moment warm microphysical scheme module predicting the number concentration of cloud
droplets and raindrops and the mixing ratio of cloud water and rainwater categories. The
microphysical module has been expanded to consider the process of cloud droplet nucleation
and the ice phase formation together with its effect on the budget of trace gases via retention
and burial processes. The dynamical framework of the model is an air parcel and the
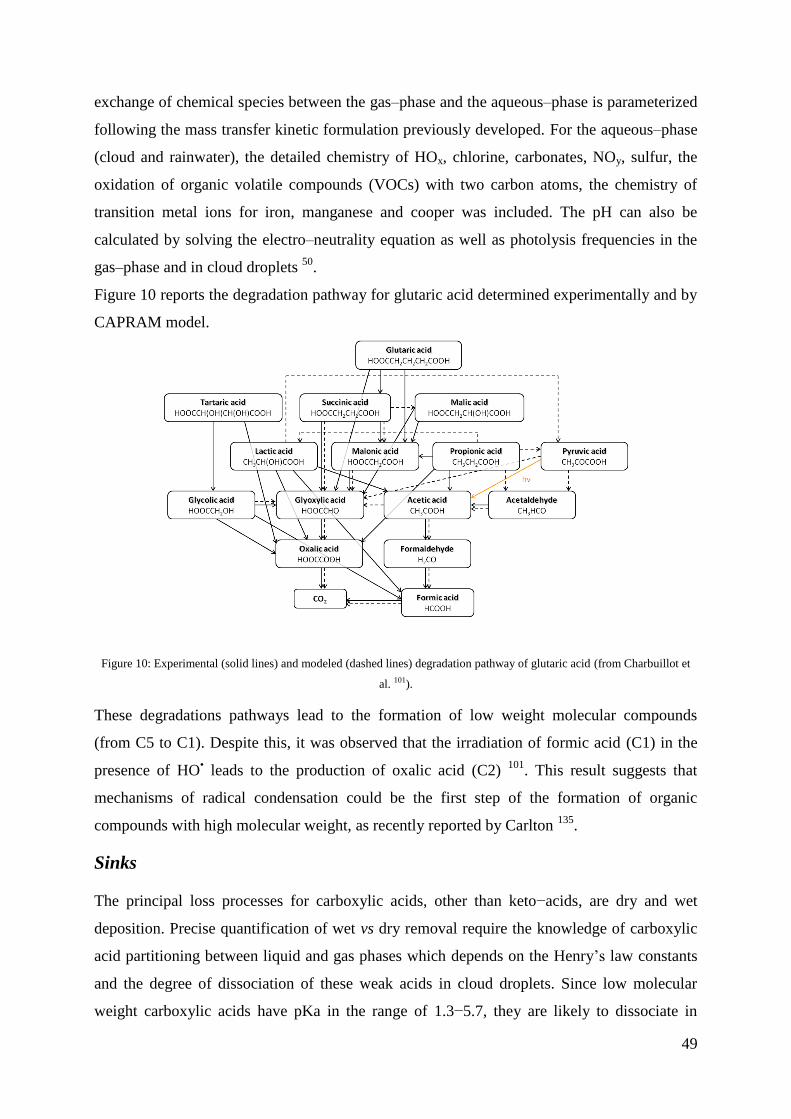
49
exchange of chemical species between the gas–phase and the aqueous–phase is parameterized
following the mass transfer kinetic formulation previously developed. For the aqueous–phase
(cloud and rainwater), the detailed chemistry of HOx, chlorine, carbonates, NOy, sulfur, the
oxidation of organic volatile compounds (VOCs) with two carbon atoms, the chemistry of
transition metal ions for iron, manganese and cooper was included. The pH can also be
calculated by solving the electro–neutrality equation as well as photolysis frequencies in the
gas–phase and in cloud droplets 50
.
Figure 10 reports the degradation pathway for glutaric acid determined experimentally and by
CAPRAM model.
Figure 10: Experimental (solid lines) and modeled (dashed lines) degradation pathway of glutaric acid (from Charbuillot et
al. 101).
These degradations pathways lead to the formation of low weight molecular compounds
(from C5 to C1). Despite this, it was observed that the irradiation of formic acid (C1) in the
presence of HO• leads to the production of oxalic acid (C2)
101. This result suggests that
mechanisms of radical condensation could be the first step of the formation of organic
compounds with high molecular weight, as recently reported by Carlton 135
.
Sinks
The principal loss processes for carboxylic acids, other than keto−acids, are dry and wet
deposition. Precise quantification of wet vs dry removal require the knowledge of carboxylic
acid partitioning between liquid and gas phases which depends on the Henry’s law constants
and the degree of dissociation of these weak acids in cloud droplets. Since low molecular
weight carboxylic acids have pKa in the range of 1.3−5.7, they are likely to dissociate in
50
atmospheric liquid phase, and their degree of dissociation is pH dependent. Quantification of
dry deposition rates is not easily achieved because they are expected to vary with season, time
of day, temperature, humidity and the ground topology. Wet deposition depends mainly on
the rate and frequencies of precipitations, so, its relative importance is different for regions
with various pluviometries and for different seasons. Effective residence times of carboxylic
acids in the troposphere are not well known. Estimations range from several hours to more
than a week, and are due to variable precipitations frequencies in different studies and to
uncertainties regarding deposition 120
.
Amino acids
Water soluble organic compounds (WSOC) are particularly important in heterogeneous
nucleation and the formation of clouds and precipitation. A large proportion of WSOC is still
uncharacterized: little is known about the chemical compounds present, their sources,
temporal and spatial patterns of variation, and the subsequent impact on climate and
environment.
NOx and their photochemical products are recognized as being centrally important species in
the chemistry of the atmosphere. In parallel to the inorganic reactivity, NOx form also organic
nitrates like peroxyacetylnitrate (PAN). Similarly ammonium is the dominant reservoir of
nitrogen in the reduced form 86
.
A recent study of Zhao et al. 136
, concerning the identification of organic matter in clouds
using FT−ICR mass spectrometry, shows that there is a large number (about 50%) of CHNO
molecular formulas with an Oxygen/Carbon (O/C) ratio lower than 0.7. Generally, these
compounds have a large range of Hydrogen/Carbon ratios (H/C) from 0.2 to 2.2. Other studies
found an O/C ratio of 0.5 137,138
. Moreover it was found that compounds with one nitrogen
atom represent 40% of CHNO compounds.
Amino acids have an average O/C ratio of 0.6 and a H/C ratio of 0.16, as reported in Table 5,
and they could represent a significant contribution to N−containing organic compounds in
cloud water.
Amino acid Abbreviation
Molecular
Weight
(g mol−1
)
%C %N %O %H O/C H/C
Alanine ALA 89.08 40.45 15.72 31.44 7.92 0.78 0.20
Arginine ARG 174.20 41.37 8.04 16.08 8.10 0.39 0.20
Asparagine ASN 132.12 36.36 21.20 31.80 6.10 0.87 0.17

51
Aspartate ASP 133.10 36.10 10.52 42.08 5.30 1.17 0.15
Cysteine CYS 121.15 29.74 11.56 23.12 5.82 0.78 0.20
Glutamate GLU 147.13 40.82 9.52 38.07 6.17 0.93 0.15
Glutamine GLN 146.15 41.09 19.16 28.74 6.90 0.70 0.17
Glycine GLY 75.07 32.00 18.65 37.31 6.71 1.17 0.21
Histidine HIS 155.16 46.45 27.07 18.05 5.85 0.39 0.13
Isoleucine ILE 131.18 54.94 10.67 21.35 9.99 0.39 0.18
Leucine LEU 131.18 54.94 10.67 21.35 9.99 0.39 0.18
Lysine LYS 146.19 49.30 19.16 19.16 9.65 0.39 0.20
Methionine MET 149.20 40.25 9.39 18.77 7.43 0.47 0.18
Phenylalanine PHE 165.19 65.44 8.48 16.95 6.71 0.26 0.10
Proline PRO 115.13 52.16 12.16 24.33 7.88 0.47 0.15
Serine SER 105.09 34.29 13.32 39.97 6.71 1.17 0.20
Threonine THR 119.12 40.33 11.76 35.27 7.62 0.87 0.19
Tryptophan TRP 204.23 64.69 13.71 13.71 5.92 0.21 0.09
Tyrosine TYR 181.19 59.66 7.73 23.18 6.12 0.39 0.10
Valine VAL 117.15 51.26 11.95 23.91 9.46 0.47 0.18
Table 5: Amino acids: molecular weight. C,O and N percentage and O/C−H/C ratios.
The presence of amino acids in atmospheric precipitation and aerosols has been noted since
many years, but no information concerning their occurrence in the atmosphere is reported yet.
An important distinction between free and combined forms of amino acids must be
distinguished in the analysis of environmental samples. The twenty commons amino acids,
that make proteins in living systems, are reported in Table 5. They are normally found in their
uncombined forms (as dissolved free amino acids, DFAA) only at low concentrations in the
environment. This is due to the fact that they are the favourite form for the uptake of nitrogen
compounds by aquatic organisms 139
. In environmental samples amino acids are present as
dissolved combined amino acids (DCAA) as proteins and peptides and it is necessary to
consider both fractions to describe completely the behaviour of N-containing organic
compounds 140
.
The interest in amino compounds in the atmosphere is driven by their bioavailability in
deposition and their potential role in ecological processes. Amino compounds could have a
role in cloud formation, as suggested by the presence of proteinaceous matter in cloud water
141, due to their surface active properties
142,143 and by the fact that L−leucine can act as an ice
nucleus 144
. Thus amino compounds could affect the atmospheric water cycle, the radiation
balance, and the scavenging of air pollutants.

52
Sources
In the marine environment, the enrichment of organic matter and proteinaceous material in
cloud water is associated with the ubiquitous production of sea salt aerosol caused by air
bubbles bursting at the ocean surface 12
. This process is expected to be the main source of
combined amino acids in the marine troposphere. Three different sources of proteinaceous
matter associated with bubble transport need to be considered: bacteria, phytoplankton and the
organic film found in the sea surface microlayer 139
.
Proteins generally represent the largest single component of the organic material of many
algae and are known to be important extracellular products of blue-green algae. These
compounds accumulate at the air-sea interface and are subsequently transported into the
aerosol fraction. Tiny aerosol particles contain material from a 2 µm thick portion of the
surface microlayer while smaller jet droplets that are suspended in the air carry the material
from a 100 µm thick portion of the layer, as shown in Figure 11. In marine aerosol
proteinaceous matter is found in a variety of forms: as part of the dissolved organic matter of
planktonic and bacterial origin, as particulate organic matter in microorganisms and debris or
adsorbed onto inorganic particles 139
. As described before, sea salt aerosol can act as CCN and
proteinaceous material could be found in cloud water droplets by solubilisation of WSOC.
However, a first oxidation of the proteinaceous matter could happen on the aerosol particle,
especially for methionine and tryptophan, which are rapidly transformed during exposure to
ozone and sunlight 145
.
In the continental environment, proteinaceous matter, including plant debris, pollen, algae and
bacteria, has been frequently detected in the atmosphere as aerosols and particles 146,147
and
can undergo the same transformations that occur in marine aerosol.
Figure 11: Schematic representation of marine spray (left) and continental biogenic aerosol formation (right).

53
A crucial point is how proteins and peptides are converted into free amino acids. Aerosols
particles and cloud water droplets are known to be unusual chemical systems with highly
saline and acidic conditions: however thermal hydrolysis seems not to be a favoured process.
The presence of enzymatic hydrolysis in these media is a subject on which little is known, but
which cannot be excluded: enzymes are themselves proteinaceous and, if bacteria and other
unicellular organisms are found in cloud water droplets, so must be their attendant enzymes.
Photochemical transformation would seem most likely except for the drawback that the
optical cross sections of peptide and protein fragments are low at sun wavelengths. It is
possible that there is a photocatalytic or photosensitized reaction pathway responsible for the
hydrolysis step 140
.
Reactivity
Direct photolysis
Aqueous solutions of proteins and peptides are decomposed by UV radiation to give a
complex series of simpler products. However the direct photolysis of chromophoric amino
acids is likely to be a minor process. This is correlated to the low molar extinction coefficient
at sun wavelength. The main chromophores are the aromatic amino acids (phenylalanine,
tyrosine and tryptophan), with smaller absorbance for histidine 148
.
Concerning direct photolysis, the case of tryptophan, which has a weak absorption beyond
300 nm is particularly interesting. Irradiation of TRP leads to its direct photochemical
oxidation to N-formylkynureine, which has a strong absorption band in the range of 300-400
nm and can act as a photosensitizer for proteins and peptides that would otherwise be
transparent to these wavelengths 149
.
Reaction with HO•
One plausible reaction pathway of amino acids with the hydroxyl radical leads to the
deamination and production of ammonia. This reaction could be very important for the acido-
base balance because it leads to the formation of α-keto acids, like pyruvic acid, which is
microbiologically transformed in the Krebs cycle to give acetate and other products.
A schematic degradation is reported in R75−76.
R75) HO• +H3N
+CH(R)COO
− H2O + H3N
+C
•(R)COO
−
R76) 2 H3N+C
•(R)COO
− H3N
+CH(R)COO
− + H2N
+=C(R)COO
−
At sufficiently high concentrations, some fraction of H3N+C
•(R)COO
− radicals may dimerize
to form α,α’-diamino dicarboxylic acid; its presence has never be detected in aerosols. The

54
imino acid produced further hydrolyzes following reaction R77 leading to deamination and
production of a α-ketoacid.
R77) H2N+=C(R)COO
− + H2O NH4
+ + RCOCOO
−
For the simplest amino acids, such as glycine and alanine, the α-carbonyl radical produced in
reaction R75 is expected to react with oxygen to form an imino acid that hydrolyzes as in
reaction R77 150
.
For the more complex amino acids the attack of HO• will no longer take place solely at the
C−H bond. HO• attacks at the side chain C−H bonds of unsaturated α-amino acids such as
phenylalanine, histidine and tyrosine and this is an important pathway for aromatic amino
acids. Cysteine and methionine are preferentially attacked at the S−H bond 151
.
Similarly, the pathways of oxidative degradation of peptides and polypeptides yield amide
and keto functions, according to reaction mechanism reported by Milne and Zika 140
.
In summary, the photochemical production of ammonia, carbon dioxide, simpler carboxylic
acids, amides and amines from the oxidative attack of hydroxyl radical on peptides appears to
be a process that may be reasonably expected to take place in cloud water, although the actual
extent of these pathways is much harder to determine.
Reactivity with other atmospheric radicals
The reactivity of amino acids with main atmospheric radicals was investigated: scarce
information is reported concerning the reactivity with nitrate radicals, which act as one-
electron oxidants.
Some works report the reaction between nitrite radical (NO2•) and cysteine
152.
The reaction of O2•−
with amino acids has been studied and overall amino acids are relatively
unreactive with both O2•−
and HO2• 153
(k" ≤ 102 M
-1 s
-1).
Concerning chlorine and bromine radical anions, their selectivity in the reaction with amino
acids was investigated by Adams et al. 154
. Methionine, cysteine, tryptophan, tyrosine and
phenylalanine show the greatest reactivity which is strongly influenced by pH. Rates of
H−abstraction, which appears to be the main mechanistic pathway, are two orders of
magnitude lower than the corresponding reaction with HO•.
Second order rate constants of reactions of selected radicals with amino acids are reported in
Table 6.
55
Amino acid
ALA 5.4 × 10⁷ 1.0 × 10
7 1.3 × 10
5
ARG 3.5 × 10⁹
ASN 4.9 × 10⁷
ASP 7.4 × 10⁷
CYS 1.5 × 10¹⁰
8.5 × 10⁸ 1.8 × 10
8
GLU 1.6 × 10⁸ 2.3 × 10
5
GLY 1.7 × 10⁷ 9.0 × 10
6 < 10
4
HIS 5.0 × 10⁹ 2.5 × 10
6 1.4 × 10
7 1.5 × 10
7
ILE 2.2 × 10⁹
LEU 1.7 × 10⁹
LYS 7.7 × 10⁸
MET 8.3 × 10⁹ 1.1 × 10
9 4.0 × 10
9 2.5 × 10
9
PHE 6.5 × 10⁹ 6.0 × 10
6 < 1 × 10
6
PRO 3.5 × 10⁸
SER 3.3 × 10⁸ 2.3 × 10
7 1.2 × 10
5
THR 4.7 × 10⁸
TRP 1.2 × 10¹⁰
2.1 × 10⁹ 2.6 × 10
9 7.0 × 10
8
TYR 1.3 × 10¹⁰
3.2 × 10⁹ 2.7 × 10
8 4.5 × 10
7
VAL 7.6 × 10⁸
Table 6: Second order rate constants of reactions of selected radicals with amino acids.
HULIS, TRYLIS and TYLIS
Muller et al. 155
identified by fluorescence spectrophotometry in rainwater three fluorophores:
HULIS, TRYLIS and TYLIS.
HUmic−LIke Substances (HULIS) are thought to be present and to originate from aerosol in
the atmosphere and are high molecular weight compounds, also called “macromolecular
compounds” 156
or “atmospheric humic matter” 157
, which are believed to play an important
role in cloud formation processes. Although atmospheric HULIS share similar features to
terrestrial and aquatic humic substances, they have substantial differences, such as smaller
average molecular weight, lower aromatic moiety content, weaker acidic nature, higher
aliphatic content and a better surface activity. Atmospheric HULIS are thought to include, in
addition to humic and fulvic acids, organic acids and some organic compounds that do not
dissociate in aqueous solution such as sugars and peptides 62
. Many authors report that
approximately 20−50% of organic carbon in particulate matter can be attributed to HULIS
56
158,159. Potential sources of atmospheric HULIS include primary antropogenic sources (motor
vehicle exhaust, tyre and asphalt wear), biomass burning and marine organic material (bubble
bursting on ocean surface). Moreover, secondary organic aerosol formation of both higher and
lower molecular weight HULIS are correlated to isoprenoid, terpenoid and α−pinene
emissions, photochemical reaction of oligomerization of polar low molecular weight
degradation products of organic debris and other natural and antropogenic sources. HULIS, as
humic substances, present a fluorescence signal: they lie in a similar area of the optical space
of humic and fulvic acids identified by Coble 160
, even if their precise location can be more
blue-shifted. In Table 7 fluorescence excitation and emission wavelengths observed for each
fluorophore by Muller et al. are reported 155
.
As reported by Muller, visible HULIS, which absorb light in the visible range, are thought to
be similar to fulvic acid; they contain amino acid peptides and nucleic acids from original
plant matter, including aliphatic carbon, carbohydrates, olephinic, ketonic and aldheydeic
carbons, and aromatic and carboxylic carbons, with the latter two providing the fluorescence
fraction.
TRYptophan−LIke Substances (TRYLIS) and TYrosine−LIke Substances (TYLIS) were also
detected by Muller et al. in rainwater: the authors defined these substances in comparison with
the fluorescence signal of tryptophan and tyrosine, respectively, according to the previous
quantification of these amino acids in particulate matter and aerosols by Kuznetsova 139
and
Zhang and Anastasio 143,145
. Their fluorescence fingerprint is reported in Table 7, while in
Figure 12 the Excitation Emission Matrix (EEM) with the optical location for (B) TYLIS, (T)
TRYLIS, and (C) ‘visible’ HULIS is reported.
Substance Min Max Mean
TYLIS λex (nm) 295 315 301
λem (nm) 265 285 274
TRYLIS λex (nm) 335 370 358
λem (nm) 260 295 275
HULIS λex (nm) 390 475 414
λem (nm) 300 340 320
Table 7: Fluorescence excitation and emission wavelengths observed for each fluorophore by Muller et al. 155.
57
Figure 12: Emission (x)–Excitation (y) Matrix (EEM) chart for a precipitation sample reported by Muller et al 155 showing
the approximate optical locations for (B) TYLIS, (T) TRYLIS, and (C) ‘visible’ HULIS.

58

59
Experimental set-ups and methods

60
61
Chapter 4
The experimental set-ups and methods used during my PhD will all be described in this
chapter. The general set-up and theoretical principles behind the used techniques and methods
used will be presented here while the specific analytical methods and experimental details are
addressed in the following chapters while dealing with the results.
Sampling site
The cloud sampling was performed at the puy de Dôme atmospheric measurement station
(PUY, 45.46°N,°E; 1465 m altitude), in central France.
In pre-Christian Europe, puy de Dôme served as an assembly place for spiritual ceremonies.
Temples were built at the summit, including a Gallo-Roman temple dedicated to the God
Mercury, the ruins of which were discovered in 1873. In 1648 Blaise Pascal, proved
Evangelista Torricelli's theory that barometric observations were caused by the weight of air
by measuring the height of a column of mercury at three elevations on puy de Dôme. In 1875,
a physics laboratory was built at the summit. A photo of the new observatory is reported in
Figure 13.
The station is part of the EMEP (European Monitoring and Evaluation Programme), GAW
(Global Atmosphere Watch), and ACTRIS2 (Aerosols, Clouds, and Trace gases Research
InfraStructure) networks where atmospheric clouds, aerosols and gases are studied. The PUY
station is located on the top of an inactive volcano at an altitude of 1465 m rising above the
surrounding area, where fields and forest are dominant.
The main advantage of the site is the high frequency of the cloud occurrence (50% of the time
on average throughout the year). Westerly and northerly winds are dominant. Meteorological
parameters, including the wind speed and direction, temperature, pressure, relative humidity
and radiation (global, UV and diffuse), atmospheric trace gases (O3, NOx, SO2, CO2) and
particulate black carbon (BC) are monitored continuously throughout the year. Long-term
studies have been conducted at the site, in particular of aerosol size distribution 161,162
, aerosol
chemical composition 163,164
, aerosol optical properties 165,166
, aerosol hygroscopic properties
6, cloud chemistry
27,64 and cloud microphysics
167.
A complete description of the equipment available at the puy de Dome observatory is reported
in the recent work of Guyot et al. 168
. To better characterize sampled air masses, cloud water
droplet effective radius (reff) and liquid water content (LWC) were monitored continuously
using the instruments described below.

62
The Particle Volume Monitor (PVM-100, manufactured by Gerber Scientific, Inc., Reston,
Virginia) is a ground-based forward-scattering laser spectrometer for particulate volume
measurements. It is designed to measure the LWC, the particle surface area (PSA) and to
derive the reff. The PVM-100 (Figure 13, right) measures the laser light (λ = 0.780 µm)
scattered in the forward direction by an ensemble of cloud droplets which crosses the probe’s
sampling volume of 3 cm−3
. The light scattered in the 0.25 to 5.2° angle range is collected by
a system of lenses and directed through two spatial filters. The first filter converts scattered
light to a signal proportional to the particle volume density (or LWC) of droplets; the second
filter produces a signal proportional to the particle surface area density (PSA). From the ratio
of these two quantities, reff can be derived (Equation 9):
Equation 9: Calculation of reff.
Figure 13: Puy de Dome atmospheric measurement station (left) and instruments set up on the roof (PVM100 in detail)
(right).
Since 2001, the observation service BEAM (Biophysico-chimie de l’Eau Atmospherique et
Modification antropiques) is responsible for studying the chemical and biological composition
and microphysical proprieties of cloud water samples collected at the puy de Dome station.
Clouds are frequently formed at the top of the site, either during advection of frontal systems
or by the orographic rising of moist air. During the winter/spring months, the station lies in
the free troposphere and air masses are usually free from the influence of local pollution.
Road access to the site was restricted to authorized personnel during all sampling periods. A
small military base is located to the north of the station, but fuel combustibles are limited
exclusively to winter storm events.
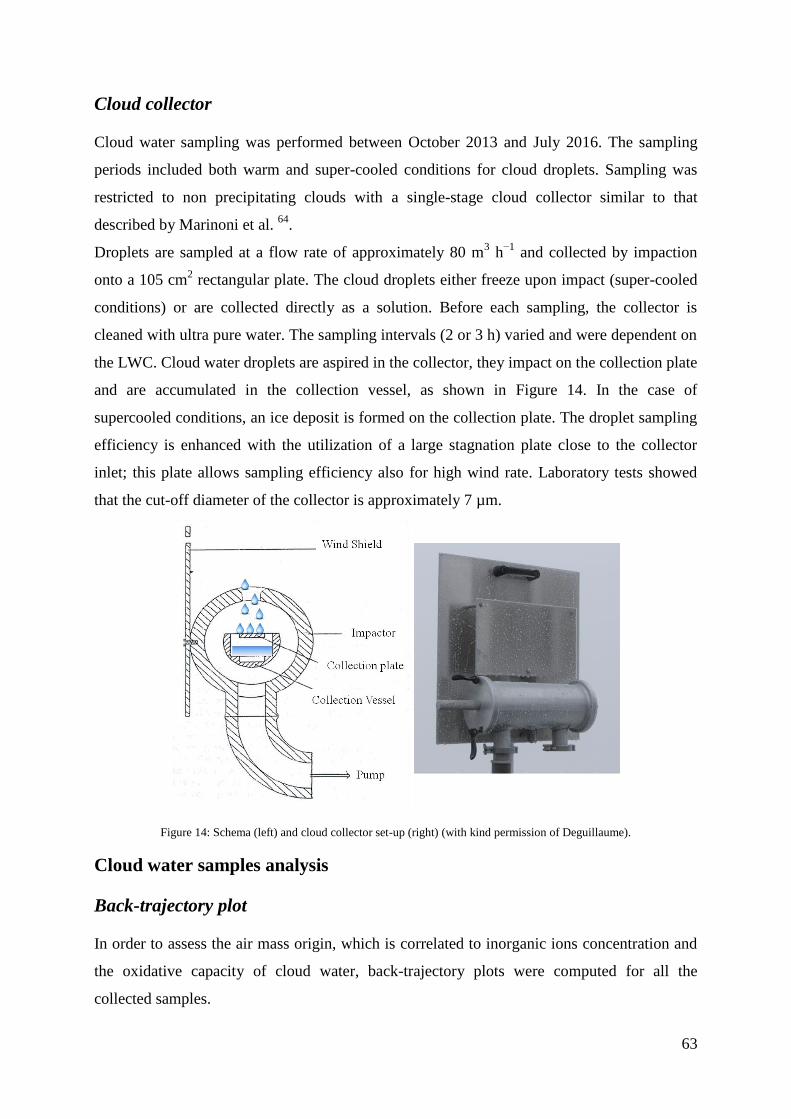
63
Cloud collector
Cloud water sampling was performed between October 2013 and July 2016. The sampling
periods included both warm and super-cooled conditions for cloud droplets. Sampling was
restricted to non precipitating clouds with a single-stage cloud collector similar to that
described by Marinoni et al. 64
.
Droplets are sampled at a flow rate of approximately 80 m3 h
−1 and collected by impaction
onto a 105 cm2 rectangular plate. The cloud droplets either freeze upon impact (super-cooled
conditions) or are collected directly as a solution. Before each sampling, the collector is
cleaned with ultra pure water. The sampling intervals (2 or 3 h) varied and were dependent on
the LWC. Cloud water droplets are aspired in the collector, they impact on the collection plate
and are accumulated in the collection vessel, as shown in Figure 14. In the case of
supercooled conditions, an ice deposit is formed on the collection plate. The droplet sampling
efficiency is enhanced with the utilization of a large stagnation plate close to the collector
inlet; this plate allows sampling efficiency also for high wind rate. Laboratory tests showed
that the cut-off diameter of the collector is approximately 7 µm.
Figure 14: Schema (left) and cloud collector set-up (right) (with kind permission of Deguillaume).
Cloud water samples analysis
Back-trajectory plot
In order to assess the air mass origin, which is correlated to inorganic ions concentration and
the oxidative capacity of cloud water, back-trajectory plots were computed for all the
collected samples.

64
The National Oceanic and Atmospheric Administration (NOAA) Air Resources Laboratory’s
(ARL) Hybrid Single-Particle Lagrangian Integrated Trajectory model (HYSPLIT) is a
complete system for computing simple air parcel trajectories as well as complex transport,
dispersion, chemical transformation, and deposition simulations. One of the most common
model applications is a back-trajectory analysis to determine the origin of air masses and
establish source-receptor relationships. The model calculation method is a hybrid between the
Lagrangian approach, using a moving frame of reference for the advection and diffusion
calculations as the trajectories of air parcels move from their initial location, and the Eulerian
methodology, which uses a fixed three-dimensional grid as a frame of reference to compute
pollutant air concentrations 169
.
Back-trajectories were computed for each cloud event for 72 hours using the option “model of
vertical velocity”; in Figure 15 an example is reported.
Figure 15: Back-trajectory plot on 72h obtained with the HYSPLIT model.
Irradiation
Irradiation set-ups
Different irradiation set-ups were used during the experimental work:
- Xenon lamp: this device is composed of a Xenon lamp (Oriel arc lamp 300 W, solar
simulator USHIO UXL-302-O) equipped with a water cooler to avoid the increase of
temperature and a mirror to reflect the light vertically (Figure 16). A Pyrex filter was
Retrotrajectory plot

65
located before the reactor to filter radiation below 290 nm. Two cylindrical Pyrex
reactors, cooled by water circulation to limit thermal reactions, with volume of 40 mL
or a 15 mL were used. The solution was continuously stirred with a magnetic stirrer
and a Teflon bar to ensure homogeneity.
Figure 16: Bulk reactor equipped with a Xenon lamp source.
- Photoreactor 365 nm and 313 nm: these set-ups are made up of a cylindrical
stainless steel container. Six and four fluorescent lamps (Philips TL D15W/05), whose
emission spectrum is centered at 365 and 313 nm respectively (reported in Figure 19),
are separately placed in three-two different axes, while the photoreactor, a Pyrex tube
of 2.6 cm internal diameter, is placed in the center of the set-up. A schematic
representation of this set-up is reported in Figure 17.
Figure 17: Irradiation devices equipped with neon lamps with emission centered at 365 nm (left) and 313 nm (right).
Actinometry
The emission spectrum of each irradiation system was recorded using a fiber optics coupled
with a CCD spectrophotometer (Ocean Optics USD 2000+UV-VIS) calibrated with a UV-
Vis-NIR Light source DH2000 from Ocean Optics.
66
To verify the polychromatic photonic flux of each irradiation system, a chemical actinometry
was performed, using the method described by Dulin 170
. A solution 10 µM of p-nitroanisole
(PNA) is irradiated in the presence of pyridine 100 µM. The disappearance of PNA is
followed by HPLC/PDA using isocratic elution (methanol 60%, MilliQ water 40%) and a
Cary Eclipse XDB-C18 column (Agilent, 4.6 × 150 mm, 5 µm). Flow rate was set at 1 mL
min-1
and PDA at 316 nm.
The disappearance rate of PNA (Rd) is directly correlated to Pabs, the radiation absorbed by
the solution between 290 and 400 nm, as in Equation 10, where ΦPNA is the quantum yield of
PNA, which can be calculated as in Equation 11.
Equation 10.
Equation 11.
The absorbed radiation for each wavelength Pabs(λ) is correlated to the radiation emitted by
the lamp P0(λ) following Equation 12.
Equation 12.
If we consider that P0(λ) is proportional to i0 measured with the optical fiber by a correction
factor k, Equation 13 can be written as follows
Equation 13.
And the correction factor k can be calculated by the Equation 14
Equation 14.
This factor allows the “calibration” of the spectrum obtained with the optical fiber: in fact, the
radiation that reaches the solution can be partially reflected by the reactor. An example is
reported in Figure 18.
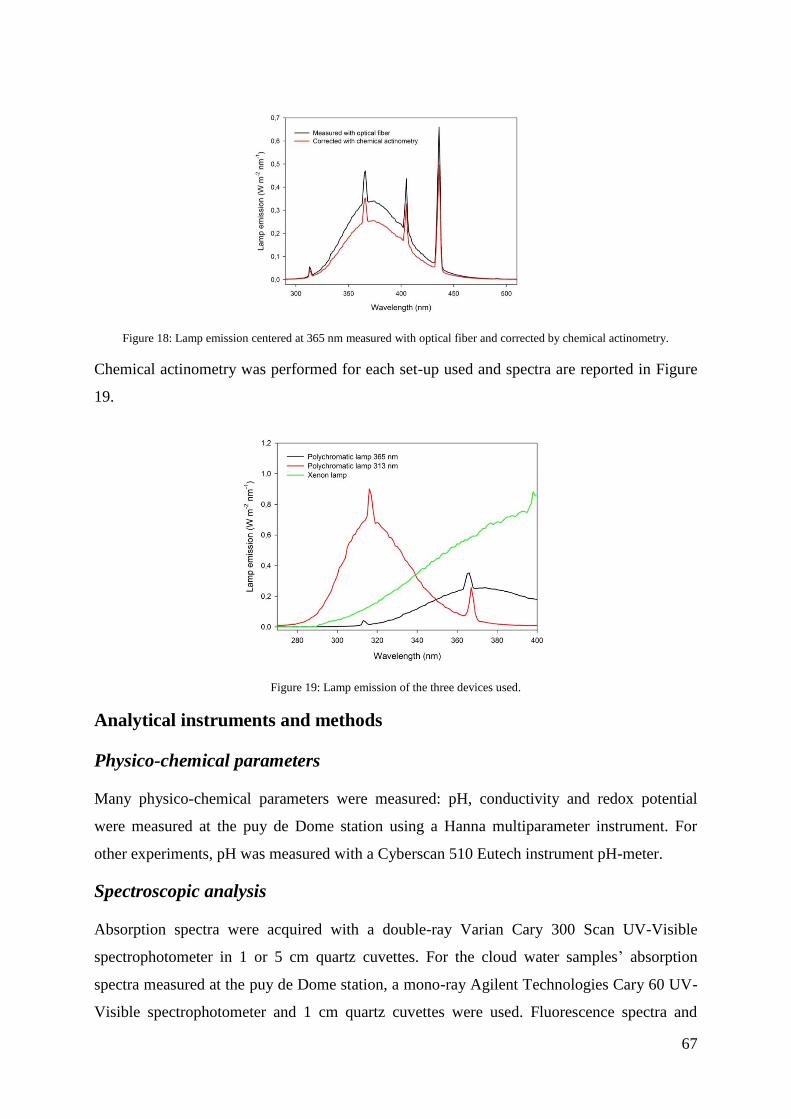
67
Figure 18: Lamp emission centered at 365 nm measured with optical fiber and corrected by chemical actinometry.
Chemical actinometry was performed for each set-up used and spectra are reported in Figure
19.
Figure 19: Lamp emission of the three devices used.
Analytical instruments and methods
Physico-chemical parameters
Many physico-chemical parameters were measured: pH, conductivity and redox potential
were measured at the puy de Dome station using a Hanna multiparameter instrument. For
other experiments, pH was measured with a Cyberscan 510 Eutech instrument pH-meter.
Spectroscopic analysis
Absorption spectra were acquired with a double-ray Varian Cary 300 Scan UV-Visible
spectrophotometer in 1 or 5 cm quartz cuvettes. For the cloud water samples’ absorption
spectra measured at the puy de Dome station, a mono-ray Agilent Technologies Cary 60 UV-
Visible spectrophotometer and 1 cm quartz cuvettes were used. Fluorescence spectra and

68
excitation emission matrix (EEM) were acquired using a Varian Cary Eclipse
spectrofluorimeter.
Hydrogen peroxide concentration
Hydrogen peroxide concentration is estimated according to the spectrofluorimetric
quantification method described by Miller 171
. Horseradish peroxidase (purchased from Sigma
Aldrich, 150-200 units for mg) is dissolved in phosphate buffer at pH 7.4. Two mL of this
solution are mixed with 4 mL of 4-hydroxyphenylacetic acid (HPAA) 1 × 10⁻³
M solution and
60 µL of sample. The formation of the dimer of HPAA, shown in Figure 20, is directly
correlated to the concentration of hydrogen peroxide and is detected by fluorescence
spectroscopy in 1 cm quartz cuvette setting excitation wavelength at 320 nm and emission
wavelength at 408 nm (the fluorescence spectra were acquired between 340 and 500 nm).
Considering that the concentration of hydrogen peroxide in cloud water is in the range 1-50
µM, the scan rate was set at 600 nm min-1
and the bandpass for excitation and emission were
of 10 nm. For other experiments with higher concentrations of H2O2 (100 µM ÷ 1 mM), the
bandpass were set at 5 nm or the solution was diluted before analysis.
Figure 20: Reaction of formation of the dimer of hydroxyphenylacetic acid (HPAA).
Iron speciation
Fe(II) and Fe(III) concentrations are determined by complexation with FerroZine® (3-(2-
Pyridyl)-5,6-diphenyl-1,2,4-triazine-p,p′-disulfonic acid monosodium salt hydrate) (purity >
97%) purchased from Sigma-Aldrich (Figure 21). The spectrophotometric method was
adapted from Stookey 172
. Firstly, Fe(II) was determined measuring the absorption at 562 nm
of the solution obtained mixing 500 µL of sample and 50µL of FerroZine 20 mM, as shown in
Equation 15. The molar absorption coefficient of the complex at 562 nm is 27900 M-1
cm-1
.
Equation 15: Concentration of iron(II).

69
To determine Fe(III) it is necessary to reduce it to Fe(II): ascorbic acid (purity > 99%, Sigma
Aldrich) 0.5 M was used. 500 µL of the sample were mixed with 60 µL of ascorbic acid and,
after 10 minutes, with 50 µL of FerroZine solution. Fe(III) is determined by Equation 16,
where Asample and Ablank are sample and blank absorption, respectively, ε562 is the molar
extinction coefficient, l is the optic path length, Vtot is the total volume (610 µL) and Vsample is
the sample volume (500 µL). No buffer was used because the signal is stable between pH 4
and 7.
Equation 16: Concentration of iron(III).
Figure 21: FerroZine (A) and ascorbic acid (B) chemical structure.
Hydroxyl radical formation rate and quantum yield.
Hydroxyl radical formation rate (RfHO•) is determined using terephthalate (TA, purity > 99%
purchased from Alfa Aesar) as a probe. Stock solution of disodium terephthalate was added to
the sample to have a final TA concentration of 2 mM. The concentration of the probe must be
much greater compared with the concentration of organic matter to trap all the photogenerated
hydroxyl radicals and to estimate a value for the hydroxyl radical formation rate not affected
by depletion by other sinks. This solution was irradiated and at fixed times an aliquot was
withdrawn and analyzed using the Varian Cary Eclipse spectrophotometer, setting excitation
wavelength at 320 nm and emission wavelength at 420 nm, scan rate of 600 nm min−1
and
bandpass of 10 or 5 nm. Photogenerated hydroxyl radicals react with TA (not fluorescent) to
give fluorescent hydroxyterephthalate (TAOH) and non fluorescent products (Reaction R78).
The limit of detection of TAOH is 1 nM.
R78) TA + HO• TAOH + products k = 4.0 × 10
9 M
−1 s
−1 76
The degradation rate of TA (Rd
TA) is correlated to the formation rate of TAOH (RfTAOH) and
of HO• (R
fHO•) following the Equation 17.
70
Equation 17.
RfTAOH can be directly determined by the slope of the linear regression of the concentration of
TAOH in function of time.
The quantum yield for the photolysis of a molecule in a decomposition reaction is defined as
the ratio between the number of molecules decomposed and the number of photons absorbed.
In this work the quantum yield was calculated for the photo-generated hydroxyl radical in
cloud water samples but also for the photolysis of organic compounds like tryptophan or
tartronic acid using different irradiation set-ups.
The quantum yield of hydroxyl radical formation (
) can be calculated by the ratio
between RfHO• and the number of absorbed photons per unit of time in the overlap range
between λ1 and λ2 (Equation 18). This value evaluates the photochemical process efficiency
independently from the experimental photochemical conditions.
Equation 18.
Ia can be calculated from the following Equation 19:
Equation 19.
I0(λ) is the incident photon flux corresponding to the lamp emission and Abs(λ) is the
absorption of the solution, normalized for the optical path.
For the photolysis of organic compounds polychromatic quantum yield is calculated using
Equation 20
Equation 20.
Where ΦP
λ1− λ2 is the quantum yield of photolysis of a product P, Rd
P is the disappearance rate
of the compound P and Ia is defined as in Equation 19.
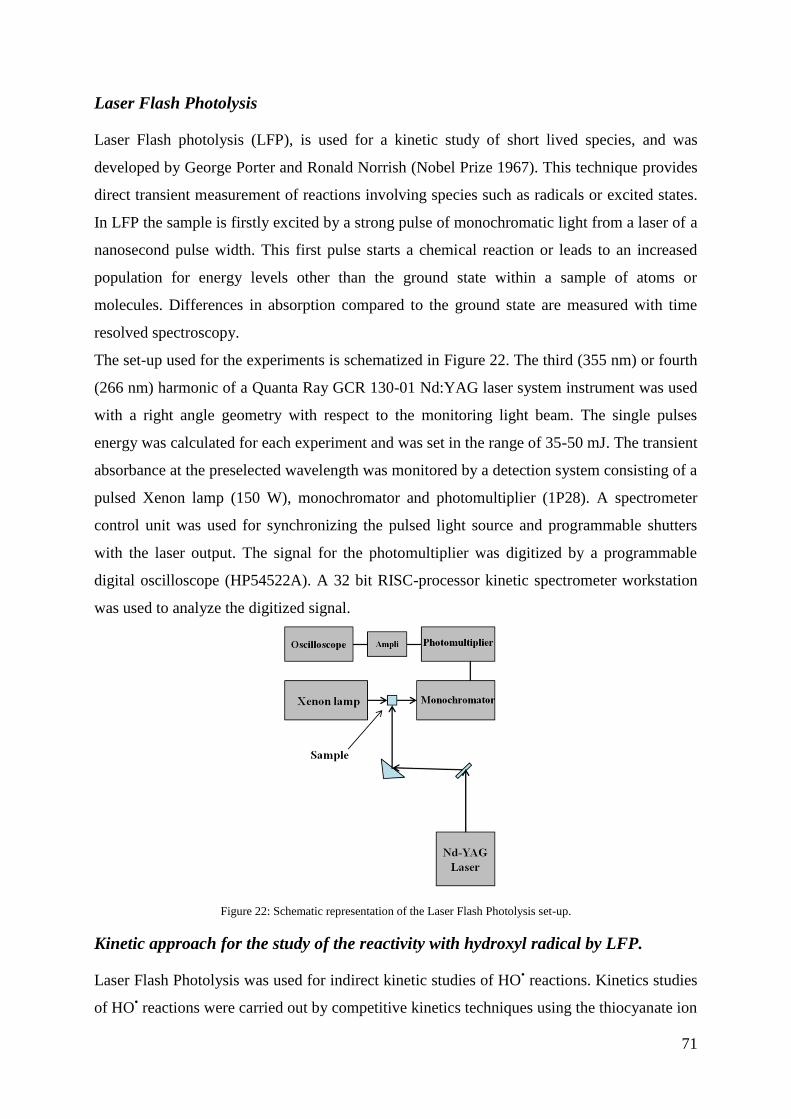
71
Laser Flash Photolysis
Laser Flash photolysis (LFP), is used for a kinetic study of short lived species, and was
developed by George Porter and Ronald Norrish (Nobel Prize 1967). This technique provides
direct transient measurement of reactions involving species such as radicals or excited states.
In LFP the sample is firstly excited by a strong pulse of monochromatic light from a laser of a
nanosecond pulse width. This first pulse starts a chemical reaction or leads to an increased
population for energy levels other than the ground state within a sample of atoms or
molecules. Differences in absorption compared to the ground state are measured with time
resolved spectroscopy.
The set-up used for the experiments is schematized in Figure 22. The third (355 nm) or fourth
(266 nm) harmonic of a Quanta Ray GCR 130-01 Nd:YAG laser system instrument was used
with a right angle geometry with respect to the monitoring light beam. The single pulses
energy was calculated for each experiment and was set in the range of 35-50 mJ. The transient
absorbance at the preselected wavelength was monitored by a detection system consisting of a
pulsed Xenon lamp (150 W), monochromator and photomultiplier (1P28). A spectrometer
control unit was used for synchronizing the pulsed light source and programmable shutters
with the laser output. The signal for the photomultiplier was digitized by a programmable
digital oscilloscope (HP54522A). A 32 bit RISC-processor kinetic spectrometer workstation
was used to analyze the digitized signal.
Figure 22: Schematic representation of the Laser Flash Photolysis set-up.
Kinetic approach for the study of the reactivity with hydroxyl radical by LFP.
Laser Flash Photolysis was used for indirect kinetic studies of HO• reactions. Kinetics studies
of HO• reactions were carried out by competitive kinetics techniques using the thiocyanate ion
72
as a reference reactant because hydroxyl radical is not directly detectable due to its low
absorption. The formation of the HO• was initiated by photolysis of hydrogen peroxide by the
fourth harmonic (λ = 266 nm) of the Laser set-up described in the previous paragraph. The
mean pulse energy was 40-50 mJ and measurements were performed at room temperature.
Solutions were prepared mixing 0.1 M of thiocyanate and 8 × 10⁻²
M of hydrogen peroxide
solutions. The concentration of the hydrogen peroxide stock solution was determined daily by
UV-vis spectroscopy. The concentrations of the organic reactant, tartronic acid in particular,
were in the range between 2.5 mM and 10 mM. (NH4)SCN, H2O2 and the organic reactants
were obtained from Merck or Fluka. If necessary, the pH value was adjusted with NaOH and
HClO4.
All experiments were carried out under conditions of pseudo-first order kinetics using an
excess of the concentrations of the organic reactants in the reaction solution compared to the
initial radical concentration. The errors given in the present study represent statistical errors
for a confidence interval of 95% as derived from linear regression analysis of the data
obtained.
The concentration of the HO• radical was detected by recording the absorbance of the
(SCN)2•−
radical anion. The competition kinetics system applied here is based on the
following reactions (R78-81):
R78) H2O2 + hν (266 nm) 2 HO•
R79) HO•+ SCN
− SCNHO
•−
R80) SCNHO•− SCN
•+ HO
−
R81) SCN •
+ SCN− (SCN)2
•−
R82) HO• + R P
Assuming complete consumption of the initial HO• radicals, it can be concluded that the
resulting (SCN)2•−
concentration is equal to the hydroxyl radical initial concentration without
R. Calculations based on available data for the reactivity of the SCNHO•−
and SCN• radicals
show that their possible side reactions do not have any influence on the final (SCN)2•−
yield
under adopted conditions. By adding a reactant (R) the yield of (SCN)2•−
is reduced by the
fraction of HO• consumed by R, following reaction R82. The formation of (SCN)2
•− is
inhibited and its signal decreases proportionally to the concentration of R in the solution. An
example of the diminution of the absorbance is given in Figure 23.
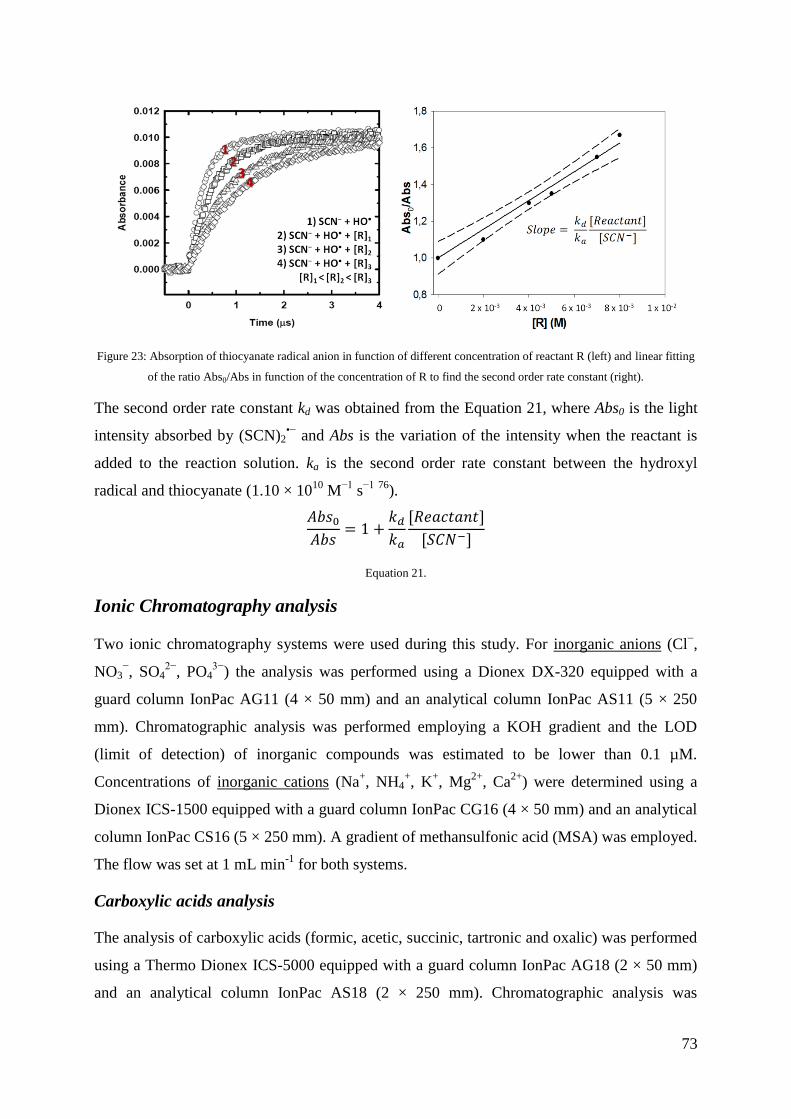
73
Figure 23: Absorption of thiocyanate radical anion in function of different concentration of reactant R (left) and linear fitting
of the ratio Abs0/Abs in function of the concentration of R to find the second order rate constant (right).
The second order rate constant kd was obtained from the Equation 21, where Abs0 is the light
intensity absorbed by (SCN)2•−
and Abs is the variation of the intensity when the reactant is
added to the reaction solution. ka is the second order rate constant between the hydroxyl
radical and thiocyanate (1.10 × 10¹⁰
M−1
s−1
76
).
Equation 21.
Ionic Chromatography analysis
Two ionic chromatography systems were used during this study. For inorganic anions (Cl−,
NO3−, SO4
2−, PO4
3−) the analysis was performed using a Dionex DX-320 equipped with a
guard column IonPac AG11 (4 × 50 mm) and an analytical column IonPac AS11 (5 × 250
mm). Chromatographic analysis was performed employing a KOH gradient and the LOD
(limit of detection) of inorganic compounds was estimated to be lower than 0.1 µM.
Concentrations of inorganic cations (Na+, NH4
+, K
+, Mg
2+, Ca
2+) were determined using a
Dionex ICS-1500 equipped with a guard column IonPac CG16 (4 × 50 mm) and an analytical
column IonPac CS16 (5 × 250 mm). A gradient of methansulfonic acid (MSA) was employed.
The flow was set at 1 mL min-1
for both systems.
Carboxylic acids analysis
The analysis of carboxylic acids (formic, acetic, succinic, tartronic and oxalic) was performed
using a Thermo Dionex ICS-5000 equipped with a guard column IonPac AG18 (2 × 50 mm)
and an analytical column IonPac AS18 (2 × 250 mm). Chromatographic analysis was

74
performed using a KOH gradient, reported in Table 8, and the LOD was estimated to be lower
than 0.1 µM. In Figure 24 the chromatogram obtained for the analysis of a standard solution 5
µM of carboxylic acids is reported. Samples were analyzed without further purification.
Time (min) KOH (mM)
0 10.0
4 11.0
11 17.0
21 19.5
23 19.5
23.1 10.0
35 10.0
Table 8:KOH gradient used for the analysis of carboxylic acids.
Figure 24: Example of chromatogram obtained for the analysis of carboxylic acids.
HPLC
The HPLC systems used are
- Waters Alliance
- Water Acquity UPLC
- Shimadzu Nexera XR
All the HPLC systems are equipped with photo diode array (PDA) and fluorescence detector
(FLR).

75
Nitrites
Nitrite ion concentration was determined by derivatization with 2,4-dinitrophenylhydrazine
(DNPH) (purity > 97%, Sigma Aldrich). The derivatizing solution was prepared mixing 250
mg of DNPH with 6.25 mL of HCl 35%, 3.12 mL of acetonitrile and 15.6 mL of MilliQ
water. 50 µL of this solution were added to 3 mL of sample. Nitrites were analyzed by HPLC
using isocratic elution (methanol 60%, MilliQ water 40%, H3PO4 ≈ 0.1%) and a Cary Eclipse
XDB-C18 column (Agilent, 4.6 × 150 mm, 5 µm). Flow rate was set at 1 mL min-1
and PDA
at 307 nm. This method allows the determination of nano molar concentrations of nitrites 173
also in frozen samples. In Figure 25 the reaction between 2,4-dinitrophenylhydrazine and
nitrite ions is reported.
Figure 25: Reaction between 2,4-dinitrophenylhydrazine and nitrite ions.
Detection of amino acids
A lot of derivatization methods have been proposed for detection of amino acids in order to
increase sensitivity and selectivity. In this work, samples were pretreated with o-
phthalaldehyde (OPA), separated by HPLC and analysed by fluorescence detection.
Primary amino acids with the NH2 group reacts with OPA to form fluorescent compounds
under the presence of a thiol group, in our case of mercaptopropionic acid (MPA). Figure 26
shows the reaction of derivatization.
Figure 26: Derivatization of amino acids with o-phthalaldehyde (OPA) in the presence of mercaptopropionic acid (MPA).
OPA 15.0 mM and MPA 7.7 mM were prepared in borate buffer solution 0.1 M and the
derivatization is automatically carried on by the HPLC autosampler Shimadzu Nexera SIL-
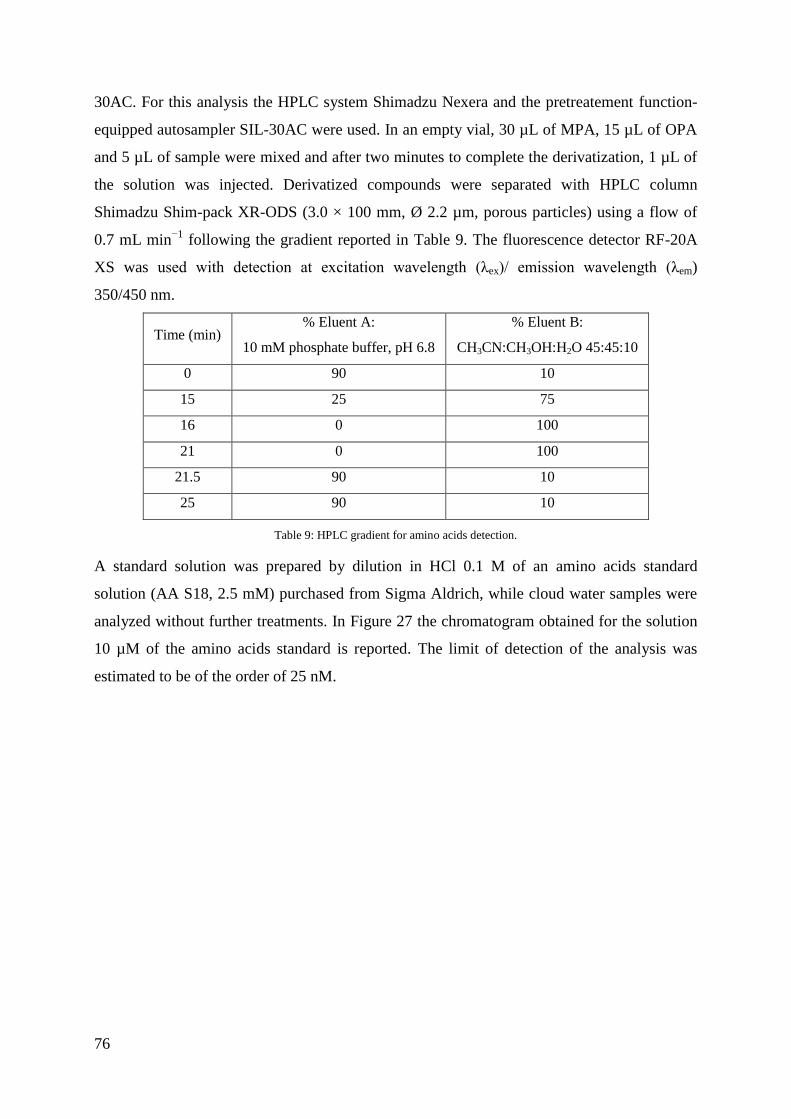
76
30AC. For this analysis the HPLC system Shimadzu Nexera and the pretreatement function-
equipped autosampler SIL-30AC were used. In an empty vial, 30 µL of MPA, 15 µL of OPA
and 5 µL of sample were mixed and after two minutes to complete the derivatization, 1 µL of
the solution was injected. Derivatized compounds were separated with HPLC column
Shimadzu Shim-pack XR-ODS (3.0 × 100 mm, Ø 2.2 µm, porous particles) using a flow of
0.7 mL min−1
following the gradient reported in Table 9. The fluorescence detector RF-20A
XS was used with detection at excitation wavelength (λex)/ emission wavelength (λem)
350/450 nm.
Time (min) % Eluent A:
10 mM phosphate buffer, pH 6.8
% Eluent B:
CH3CN:CH3OH:H2O 45:45:10
0 90 10
15 25 75
16 0 100
21 0 100
21.5 90 10
25 90 10
Table 9: HPLC gradient for amino acids detection.
A standard solution was prepared by dilution in HCl 0.1 M of an amino acids standard
solution (AA S18, 2.5 mM) purchased from Sigma Aldrich, while cloud water samples were
analyzed without further treatments. In Figure 27 the chromatogram obtained for the solution
10 µM of the amino acids standard is reported. The limit of detection of the analysis was
estimated to be of the order of 25 nM.

77
Figure 27: Chromatogram obtained for the solution of the amino acids standard with concentration 10 µM.
Total Organic Carbon
The TOC concentration is determined with a TOC 5050A analyser which uses high
temperature catalytic oxidation (HTCO) and is equipped with a non-dispersive infra red
detector (NDIR). The limit of detection is of the order of 1 mg L-1
and the precision of 0.1 mg
L-1
.

78

79
Results

80
81
Chapter 5
Motivation
The following chapter, in the form of a scientific article, published in 2015 in Atmospheric
Chemistry and Physics, deals with the photochemical production of hydroxyl radicals in cloud
water. As described in Chapter 2, organic compounds in cloud aqueous phase react following
two competitive pathways: oxidative vs accretion. The first part was devoted to the
determination of hydroxyl radical photo-formation rate and quantum yield which determine
the preferred pathway between oxidation and accretion.
Hydroxyl radical photochemical generation is mainly attributed to the photolysis of inorganic
sources like hydrogen peroxide, nitrates, nitrites and iron ions. The second goal of this work
was to assess the contribution of inorganic sources to the formation rate and to find the
correlation between this parameter and the air mass origin.
The last part of this work concerns the comparison between experimental values and modeled
formation rates, calculated by the model of multiphase cloud chemistry (M2C2). This part is
the result of collaboration with the LAMP-OPGC (Laboratoire de Météorologie Physique –
Observatoire de la Physique du Globe de Clermont-Ferrand) and it enables the adjustment of
the contribution of each inorganic source to the hydroxyl radical formation rate in the model.
This work allows, for the first time, the assessment of the role of iron in cloud water oxidant
capacity, to date overestimated in atmospheric models.

82

83
A better understanding of hydroxyl radical photochemical sources in cloud
waters collected at the puy de Dôme station : Experimental versus modeled
formation rates
A. Biancoa,b,†
, M. Passanantia,b,†
, H. Perrouxc,d
, G. Voyarda,b
, C. Mouchel-Vallonc,d
, N.
Chaumerliacc,d
, G. Mailhota,b
, L. Deguillaumec,d,*
, M. Brigantea,b,*
a Université Clermont Auvergne, Université Blaise Pascal, Institut de Chimie de Clermont-Ferrand, BP 10448,
F-63000 CLERMONT-FERRAND, FRANCE
b CNRS, UMR 6296, ICCF, F-63171 AUBIERE, FRANCE
c Université Clermont Auvergne, Université Blaise Pascal, Laboratoire de Météorologie Physique, BP 10448, F-
63000 CLERMONT-FERRAND, FRANCE
d CNRS, UMR 6016, LaMP, F-63171 AUBIERE, FRANCE
* Corresponding author e-mail:
† These two authors contributed equally to this work
Atmos. Chem. Phys., 15, 9191-9202, 2015
http://www.atmos-chem-phys.net/15/9191/2015/
doi:10.5194/acp-15-9191-2015
Received: 15 Apr 2015 – Published in Atmos. Chem. Phys. Discuss.: 18 May 2015
Revised: 15 Jul 2015 – Accepted: 30 Jul 2015 – Published: 19 Aug 2015
Keywords
cloud water, photochemistry, hydroxyl radical, in situ measurements, cloud chemistry model
Abstract. The oxidative capacity of the cloud aqueous phase is investigated during three field
campaigns from 2013 to 2014 at the top of the puy de Dôme station (PUY) in France. Forty-
one cloud samples are collected, and the corresponding air masses are classified as highly

84
marine, marine and continental. Hydroxyl radical (HO) formation rates (
) are determined
using a photochemical setup (Xenon lamp that can reproduce the solar spectrum) and a
chemical probe coupled with spectroscopic analysis that can trap all of the generated radicals
for each sample. Using this method, the obtained values correspond to the total formation of
HO without its chemical sinks. These formation rates are correlated with the concentrations
of the naturally occurring sources of HO, including hydrogen peroxide, nitrite, nitrate and
iron. The total hydroxyl radical formation rates are measured as ranging from approximately 2
× 10‒11
to 4 × 10‒10
M s‒1
, and the hydroxyl radical quantum yield formation ( ) is
estimated between 10‒4
and 10‒2
. Experimental values are compared with modeled formation
rates calculated by the model of multiphase cloud chemistry (M2C2), considering only the
chemical sources of the hydroxyl radicals. The comparison between the experimental and the
modeled results suggests that the photoreactivity of the iron species as a source of HO is
overestimated by the model, and H2O2 photolysis represents the most important source of this
radical (between 70 and 99%) for the cloud water sampled at the PUY station (primarily
marine and continental).
5.1 Introduction
In the atmosphere, many trace gases are transformed by the hydroxyl radical (HO), which is
considered the most efficient environmental oxidant (e.g., Seinfeld et al. 45
). Evaluating the
production of this short-lived species is crucial because it determines the fate of many
chemical compounds. In atmospheric water drops and aqueous particles, the hydroxyl radical
also controls the fate of inorganic and organic species 30
. The HO - mediated oxidation of
organic compounds in the aqueous phase can lead to the formation of shorter but often
multifunctional organic species and, ultimately, to complete mineralization 101
. Complex
chemical reactions catalyzed by HO can also occur in the aqueous phase forming accretion
products such as oligomers 135,174-178
. These alternative chemical pathways are efficient
processes to convert organic compounds into Secondary Organic Aerosols (SOAs) 107
.
The sources of hydroxyl radicals in the aqueous phase strongly differ from those in the gas
phase because of the presence of ionic species and metal ions. Aqueous phase reactants that
produce HO present high concentrations in water drops and aqueous particles, likely
enhancing the HO photochemical production in the condensed phase. This radical can be
generated in the aqueous phase by direct photolysis of hydrogen peroxide (H2O2) 30,179
, iron

85
complexes 15
, nitrate (NO3‒)
180 and nitrite ions (NO2
‒)
181. The other significant source of
HO in cloud water is the uptake from the gas phase
83. The relative importance of the
different hydroxyl radical sources depends on the chemical composition of the aqueous phase,
which is also strongly variable 27
. HO is further scavenged in the aqueous phase, primarily by
dissolved organic compounds. Evaluation of this sink is difficult because the dissolved
organic matter is diverse, complex and poorly characterized 102
.
Uncertainties in HO sinks and sources make its concentrations in atmospheric water highly
difficult to estimate. For this estimation, models describing the multiphase cloud chemistry
have been developed and have considered the reactivity in the gas and aqueous phases along
with the mass transfer between the two phases 97,104,105
. These numerical tools allow the
estimation of the steady-state concentration of HO ([HO
]ss), which is a crucial quantity to
understand the fate of atmospheric pollutants 103
. The range of the maximal HO concentration
varies from 10‒16
to 10‒12
M, depending on the "chemical scenario" (i.e., emission/deposition
and the initial chemical conditions) used in the modeling study. The amounts of organic
matter and iron are key parameters controlling the [HO]ss. These models are expected to
underestimate the radical sinks because organic scavengers cannot be exhaustively described
in the aqueous chemical mechanism 103
.
In this study, we propose the investigation of the hydroxyl radical formation in real cloud
water sampled at the puy de Dôme mountain (France). The hydroxyl radical formation rate is
quantified for 36 cloud water samples collected during 3 field campaigns (2013-2014).
Because the main photochemical sources (hydrogen peroxide, iron, nitrite and nitrate) are also
quantified, we can calculate their relative contributions to the production of the hydroxyl
radicals. For this purpose, the contribution to the hydroxyl radical formation rate of more
concentrated inorganic photochemical sources is investigated separately in synthetic solution.
In parallel, the model of multiphase cloud chemistry (M2C2) is used to simulate HO
formation rates. This model considers explicit aqueous chemical mechanisms, and a
"simplified" version of the model is used to reproduce the bulk water irradiation experiments
(lamp spectrum) under variable physico-chemical conditions (pH, initial concentrations of
HO sources) corresponding to the cloud water samples. The comparison between the
modeled and experimental HO production rates facilitates quantification of the various HO
sources and enables validation of the model to reproduce the oxidative capacity of the
atmospheric aqueous phase.
86
5.2 Materials and Methods
5.2.1 Chemicals
Hydrogen peroxide (30% in water, not stabilized), sodium nitrate (purity > 99%) and
ferrozine (purity > 97%) were obtained from Fluka, while sodium nitrite (purity > 98%) and
terephthalic disodium salt (purity > 99%) were purchased from ProLabo and Alfa Aesar,
respectively. All of the other chemicals (purity reagent grade) used for the analysis were
obtained from Sigma-Aldrich.
Solutions are prepared with deionized ultra-pure aerated milli-Q water from Millipore
(resistivity = 18.2 MΩ cm) under a laminar flux hood. Moreover, glass containers and
injection material are washed three times with ultra-pure water before use. If necessary, the
pH values are adjusted with perchloric acid (1 N) and NaOH (1 N) using a JENWAY 3310
pH-meter within ± 0.01 pH unit. All of the solutions are stored under dark conditions, and the
final preparations are performed in a room equipped with a sodium lamp (589 nm emission).
5.2.2 Cloud water sampling
Cloud water is sampled at the puy de Dôme (PUY) station (48°N, 2°E; 1465 m a.s.l.) in the
Massif Central region (France). Three campaigns occurred during autumn 2013 from October
14th
to November 6th
, during spring and autumn 2014 from March 22nd
to April 5th
and from
November 4th
to 19th
. During these periods, the station was primarily located in the free
troposphere; thus, the air masses from various origins were not influenced by the local
pollution 182
.
The cloud droplet sampling is performed by a one stage cloud droplet impactor 27
. With the
air flux used, the lower limit of the aerodynamic diameter is approximately 7 μm 129
. The
impactor used for this study is constructed of stainless steel and aluminum, and cloud droplets
are collected by impaction onto a rectangular aluminum plate with an average sampling time
of two hours. Cloud water samples are filtered using a 0.45 μm PTFE filter within 10 minutes
after sampling to eliminate all of the microorganisms and particles that can interfere with the
spectroscopic analysis.
Measurements performed immediately after cloud collection are conductivity, redox potential,
pH, UV-visible spectroscopy, H2O2 and iron concentrations. Ion chromatography (IC), total
organic carbon (TOC), and nitrite analysis are determined less than 24 hours after sampling.
At each stage, sampling and analyses are performed with the greatest precaution to minimize
all possible external contaminations, and the solutions are stored at 277 K under dark
87
conditions. Hydroxyl radical formation rates (
) and polychromatic quantum yields ( )
are calculated using polychromatic wavelengths.
5.2.3 Physico-chemical measurements
Different parameters are monitored, including pH, conductivity and redox potential, which are
measured using a Hanna multiparameter instrument. The UV-Vis spectrum of the collected
cloud water is determined with an Agilent Technologies Cary 60 UV-vis spectrophotometer.
The TOC concentration is determined with a TOC 5050A analyzer (Shimadzu). Hydrogen
peroxide concentration is estimated using p-hydroxyphenilacetic acid (HPAA, purity > 98%)
and horseradish peroxidase (POD) (solid containing 150-200 units per mg), according to the
spectrofluorimetric quantification method 183
. The formation of the dimer of HPAA is
correlated with the concentration of hydrogen peroxide and is detected using a Varian Cary
Eclipse Fluorescence Spectrophotometer setting excitation wavelengths at 320 nm, while
emission is registered from 340 and 500 nm. The maximum signal is quantified at 408 nm.
The scan rate is 600 nm min‒1
, and a bandpass of 10 nm is set for excitation and emission.
Nitrite ions concentration is determined by derivatization with 2,4-dinitrophenylhydrazine
(DNPH) (purity > 97%), in acidic solution (HCl 37%). The UV-absorbing derivative (2,4-
dinitrophenilazide) is detected by HPLC. The HPLC system (Waters Alliance) equipped with
a diode array detector is used with an Eclipse XDB-C18 column (Agilent, 4.6 × 150 mm, 5
μm), and an isocratic method is adopted, using 40% acidified water (0.1% phosphoric acid)
and 60% methanol. The flow rate is 1 mL min‒1
, and 2,4‒dinitrophenilazide is eluted with a
retention time of 4.1 min 173
and detected at 307 nm. Fe(II) and Fe(III) concentrations are
determined by the spectrophotometric method by complexation with ferrozine (purity > 97%),
as described by Stookey 172
. Fe(II) and Fe(III) represent the oxidative state of the iron species.
Adopted complexation method allows us to determine all Fe(II) and Fe(III) species present in
solution (i.e., considered as free, aquacomplexes and as complex with other organic
molecules). Ascorbic acid (purity reagent grade) is used as the reducing agent to determine
total iron. The complex absorption is measured with a Varian Cary 300 Scan
Spectrophotometer at 562 nm.
It has been previously demonstrated that filtration does not modify the soluble iron
quantification in natural cloud water samples 184,185
. It is not possible to measure particulate
iron because the ferrozine method cannot solubilize solid phase iron (the contact time between
acidic reagents and particulate iron is too short). Moreover, the iron particle is expected to be
less reactive than the solubilized iron; consequently, its contribution can be neglected 83
.
88
Ion chromatography (IC) analysis is performed employing a DIONEX DX-320 equipped with
an IonPac AG11 (guard-column 4 × 50 mm) and an IonPac AS11 (analytical column 5 × 250
mm) for anions and a DIONEX ICS-1500 equipped with an IonPac CG16 (guard-column 4 ×
50 mm) and an IonPac CS16 (analytical column 5 × 250 mm) for cations.
5.2.4 Statistical analysis
Principal component analysis (PCA) and hierarchical clustering analysis (HCA) are
performed with R-3.1.2 software 186
using the FactoMineR package (version 1.28, 187
). This
statistical analysis provides a synthetic representation of experimental data as a function of the
correlations between variables considered and similarities present among the analyzed
samples. This technique allows the determination of information contained in a set of
multivariate data, summarizing it in a few linear combinations of the variables 188
. HCA data
are grouped by similarity, considering all of the information contained in the data set. HCA is
a statistical method to qualitatively study the composition of cloud water and can be used to
identify the grouping variables that are not well detectable using only PCA.
5.2.5 Irradiation experiments
To evaluate the contribution of each possible photochemical source (nitrate, nitrite or
hydrogen peroxide) to the hydroxyl radical formation in cloud water, synthetic solutions
doped with a single source of oxidant are irradiated to quantify their contribution to the total
generation of hydroxyl radicals in a more complex medium.
The photochemical device is composed of a Xenon lamp equipped with a water cooler to
avoid the increase of temperature due to the infrared radiations and a mirror to reflect the light
vertically. A Pyrex filter was located before the reactor for filtering of light at wavelengths
below than 290 nm, corresponding to the lowest wavelengths of the solar emission spectrum.
The reactor is a 40 mL cylindrical Pyrex container cooled by water circulation at a
temperature of 278 ± 2 K to limit thermal reactions. Samples are continuously stirred with a
magnetic stirrer using a Teflon bar to ensure homogeneity.
In Fig. 1, the emission spectrum of the lamp recorded using fiber optics coupled with a
charge-coupled device (CCD) spectrophotometer (Ocean Optics USD 2000+UV-VIS) is
reported. The energy was normalized with the actinometry results using a paranitroanisole
(PNA)/pyridine actinometer 170
. Over the wavelength range of 290 to 600 nm, a total flux of
157 W m‒2
is measured. The intensity values of the sun emission under clear sky and cloudy
conditions at the puy de Dôme mountain in autumn 2013 are also presented in Fig. 1.

89
Figure 1: Absorption spectra of different cloud water samples (left axis) and the right-hand axis shows the emission spectrum
of the adopted Xenon lamp reaching solutions over the range of 290 to600 nm (total flux intensity = 157 W m‒2) compared
with the sun emission spectrum (dashed line) for a sunny (353 W m‒2) and a cloudy day (90 W m‒2) in October 2013.
5.2.6 Hydroxyl radical formation rate and quantum yield determination
The hydroxyl radical formation rate is determined using terephthalate (TA) (terephthalic
disodium salt, purity > 99%) as a probe 189
. Formation of hydroxyterephthalate (TAOH) is
quantified using a Varian Cary Eclipse Fluorescence Spectrophotometer, setting excitation
wavelengths at 320 nm, while the emission maximum is measured at 420 nm. The scan rate is
600 nm min‒1
, and a bandpass of 10 nm is set for excitation and emission. Terephthalate is a
useful probe because it allows the determination of hydroxyl radical formation rates in the
presence of fluorescent dissolved organic matter. The concentration of the probe is in a large
excess (2 mM) compared with the concentration of organic matter to trap all of the
photogenerated hydroxyl radicals and then to estimate a value for the hydroxyl radical
formation rate not affected by depletion of HO by other sinks.
The reaction between TA and the hydroxyl radical leads to the formation of fluorescent
TAOH and non fluorescent secondary products (R1), as follows:
(R1) •TA + HO TAOH + products
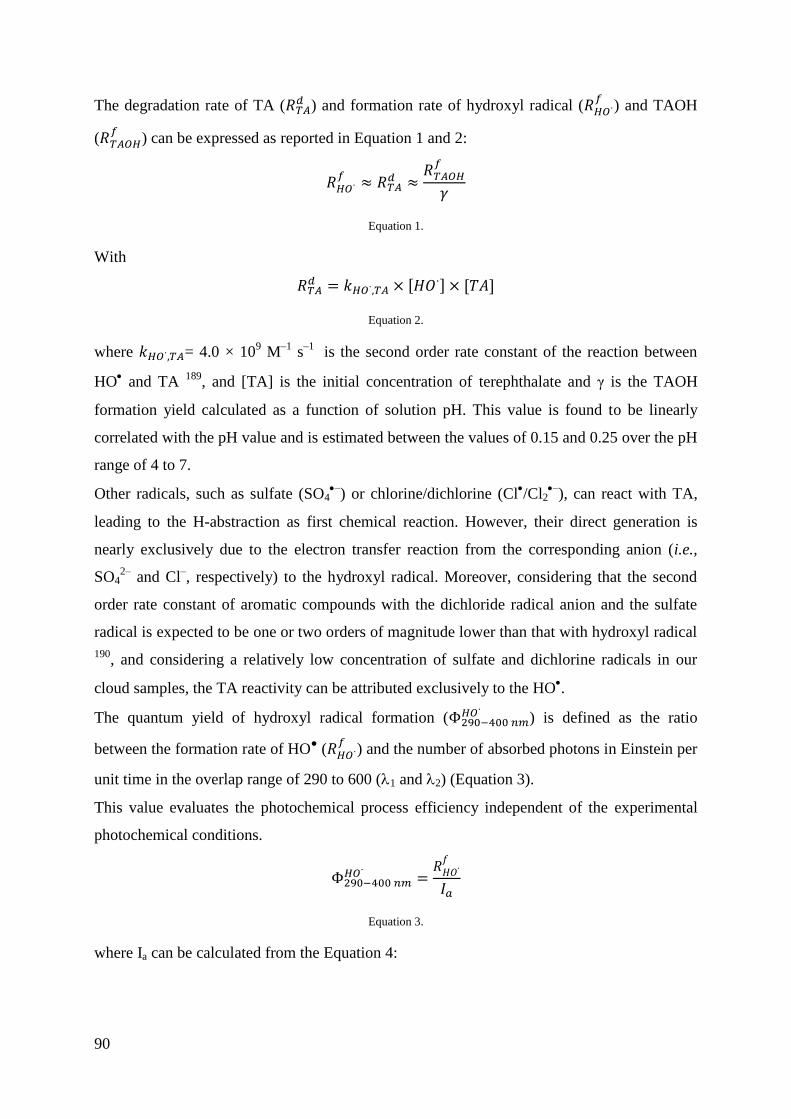
90
The degradation rate of TA ( ) and formation rate of hydroxyl radical (
) and TAOH
(
) can be expressed as reported in Equation 1 and 2:
Equation 1.
With
Equation 2.
where = 4.0 × 10⁹ M
‒1 s
‒1 is the second order rate constant of the reaction between
HO and TA
189, and [TA] is the initial concentration of terephthalate and γ is the TAOH
formation yield calculated as a function of solution pH. This value is found to be linearly
correlated with the pH value and is estimated between the values of 0.15 and 0.25 over the pH
range of 4 to 7.
Other radicals, such as sulfate (SO4‒
) or chlorine/dichlorine (Cl/Cl2
‒), can react with TA,
leading to the H-abstraction as first chemical reaction. However, their direct generation is
nearly exclusively due to the electron transfer reaction from the corresponding anion (i.e.,
SO42‒
and Cl‒, respectively) to the hydroxyl radical. Moreover, considering that the second
order rate constant of aromatic compounds with the dichloride radical anion and the sulfate
radical is expected to be one or two orders of magnitude lower than that with hydroxyl radical
190, and considering a relatively low concentration of sulfate and dichlorine radicals in our
cloud samples, the TA reactivity can be attributed exclusively to the HO.
The quantum yield of hydroxyl radical formation (
) is defined as the ratio
between the formation rate of HO● (
) and the number of absorbed photons in Einstein per
unit time in the overlap range of 290 to 600 (1 and 2) (Equation 3).
This value evaluates the photochemical process efficiency independent of the experimental
photochemical conditions.
Equation 3.
where Ia can be calculated from the Equation 4:

91
Equation 4.
where I0 (photons m‒2
s‒1
) is the incident photon flux corresponding to the lamp emission and
Abs is the absorption of cloud water (normalized considering the optical path length of 5 cm
inside of the thermostated reactor).
5.2.7 Back-trajectory plots
Backward trajectories of collected air masses are calculated using the HYSPLIT (hybrid
single-particle Lagrangian integrated trajectory) model with the GDAS1 meteorological data
archive and the model of vertical velocity (http://ready.arl.noaa.gov/HYSPLIT.php).
Backward trajectories are calculated for 72 hours 191
.
5.2.8 Model description
The M2C2 combines detailed multiphase chemistry along with the parameterization of the
microphysics 32,50,192
. Particularly, the detailed chemistry of HxOy, chlorine, carbonates, NOy,
sulfur, transition metal ions (iron, copper, manganese) and the oxidation of volatile organic
compounds (VOCs) is included. Photolysis rates are calculated in the gaseous and aqueous
phases, and the pH is calculated following the H+ concentration. Numerical results consist of
following the time evolution of the concentrations of each chemical species and calculating at
each time step the relative contribution of chemical reactions in the production/destruction of
chemical compounds.
In this study, a simplified version of the model is used. The cloud chemical mechanism is
restricted to inorganic chemistry (HxOy, nitrogen, iron) that leads to the HO formation (see
Table SM1 for details about the considered reactions). The complexation of iron by oxalate is
also considered in the model because it can interfere with the HO formation rates
97.
Laboratory irradiation experiments are simulated with the M2C2 model considering its
chemical module and neglecting microphysical processes and mass transfer
parameterizations. Temperature and pH remained constant during the simulation time. We set
the pH for each cloud water sample to the values reported in Table SM2, and the temperature
is fixed at 278 K, which corresponds to the temperature of the irradiated solutions. The
simulated irradiation intensity is held constant and homogenous throughout the experiment.
The actinic flux of the experimental lamp is discretized in the tropospheric ultraviolet-visible
(TUV) model in 156 non-regular intervals over a wavelength range of 120 to 750 nm 193
. The

92
photolysis rates of the chemical species are calculated in TUV according to the experimental
quantum yields and absorption cross-sections and are indicated in Table SM1. Experimental
chemical concentrations (Table SM2) are used to initialize the model (H2O2, nitrite, nitrate,
iron). Moreover, oxalic acid is considered as an organic complexant during the Fe(II)/Fe(III)
cycle. The formation rate of HO is calculated by the model considering the modeled
contribution of each reaction producing HO during one hour of experiment.
Species Ka or Kh -∆H/R
(K)
References
H2O2 ↔ HO2‒ + H
+ T(1) 2.2 10‒12 ‒3730 194
HO2• ↔ O2
•‒ + H
+ T(2) 1.6 10‒5 195
HNO2 ↔ NO2‒ + H
+ T(3) 1.6 10‒3 1760 196; 197
HNO3 ↔ NO3‒ + H
+ T(4) 2.2 101 198
HNO4 ↔ NO4‒ + H
+ T(5) 1.3 10‒6 199
HCl ↔ Cl‒ + H
+ T(6) 1.7 10‒6 ‒6890 200
SO2 + H2O ↔ HSO3‒ + H
+ T(7) 1.3 10‒2 ‒1960 201
HSO3‒ ↔ SO3
2‒ + H
+ T(8) 6.4 10‒8 ‒1430 201
H2SO4 ↔ HSO4‒ + H
+ T(9) 1.0 103 202
HSO4‒ ↔ SO4
2‒ + H
+ T(10) 1.0 10‒2 203
Fe3+
+ H2O ↔ [Fe(OH)]2+
+ H+ T(11) 6.0 10‒3 204
[Fe(OH)]2+
+ H2O ↔ [Fe(OH)2]+ + H
+ T(12) 7.6 10‒4 204
CO2 + H2O ↔ HCO3‒ + H
+ T(13) 4.2 10‒7 202
HCO3‒ ↔ CO3
2‒ + H
+ T(14) 4.8 10‒11 202
Table SM1: Chemical mechanism considered in the M2C2 model.
5.3 Results and Discussion
5.3.1 Classification of cloud samples
Recently, physicochemical parameters and concentrations of the major organic and inorganic
compounds of cloud samples collected over the last ten years at the puy de Dôme are
measured and statistically analyzed by PCA 27
. Along with the corresponding back‒trajectory
plots, 4 different categories of air masses reaching the summit of the PUY could be
distinguished, as follows: polluted, continental, marine and highly marine. Highly marine
clouds exhibited high concentrations of Na+ and Cl
‒, and the marine category presented a
lower concentration of ions but more elevated pH, while the two remaining clusters, classified
as “continental” and “polluted”, are characterized by the second-highest and highest levels of
NH4+, NO3
‒, and SO4
2‒, respectively.

93
In Table SM2, the measured physico-chemical composition of the cloud water samples is
reported for this study. We use the same statistical analysis to classify these cloud water
samples as Deguillaume et al. 27
. PCA is performed using the pH and the concentration of
sulfate, nitrate, chloride, sodium and ammonium ions as variables. Figure 2 reports the scores
plot for samples used for the previously reported classification as a function of the attributed
class and for the new samples.

Date Origin Temperature
(°C) pH
Redox
potential
(mV)
TOC
(mg/L)
TC
(mg/L)
IC
(mg/L)
Anions (µmol/L) Cations (µmol/L)
SO42‒ Cl‒ Acet Form Oxal Succ Na+ NH4
+ Mg2+ K+ Ca2+
1 10/14/2013 4PM-6PM W 6 6.1 NM NM NM 2.7 23.0 45.9 8.7 34.8 4.5 3.3 18.5 66.2 33.7 7.2 2.4
2 10/14/2013 6PM-9PM W 6.5 5.6 NM NM NM 0.9 16.7 82.5 3.3 20.4 2.5 3.7 7.6 33.0 6.4 33.1 0.4
3 10/14/2013 9PM-12PM W 6.7 5.6 NM 1.6 2.2 0.7 18.5 46.2 2.6 11.7 1.8 4.2 11.9 44.6 5.2 20.9 3.8
4 10/29/2013 5AM-8AM W 2.2 5.0 261 2.8 3.6 0.8 46.8 246.9 21.1 28.5 2.7 4.2 56.3 38.0 NM 4.8 NM
5 10/29/2013 8AM-12AM W 3.1 5.6 248 3.2 3.3 0.1 55.8 269.5 19.1 25.3 2.8 5.2 76.3 64.0 NM 11.7 NM
6 11/5/2013 2PM-4PM W 6 5.8 231 2.0 2.7 0.7 8.5 25.0 13.9 25.5 1.9 3.4 7.8 13.5 NM 34.1 NM
7 11/5/2013 4PM-7PM W 6 5.5 263 1.1 1.7 0.6 4.5 7.2 17.5 12.4 1.3 3.9 3.7 8.9 NM 25.7 NM
8 11/5/2013 7PM-9PM W 5.8 5.6 313 0.8 1.4 0.56 7.9 16.6 9.3 24.5 1.7 3.0 4.5 17.7 NM 21.9 NM
9 11/5/2013 9PM-12PM W 5.5 5.0 290 0.6 1.5 0.8 9.8 16.9 5.7 7.2 1.3 2.3 6.5 26.7 NM 22.7 NM
10 11/6/2013 7AM-10AM W 7.9 5.4 289 1.1 1.9 0.9 6.1 9.7 7.5 17.2 1.3 5.7 6.0 18.0 NM 24.3 NM
11 11/6/2013 10AM-12AM W 8 5.7 352 1.9 2.6 0.7 6.7 5.8 7.5 9.5 1.5 2.7 3.3 27.0 NM 25.8 NM
12 3/22/2014 7AM-11AM W 0 6.7 228 2.9 3.5 0.6 34.8 65.7 13.3 48.3 4.1 0.1 20.9 87.6 12.4 2.3 4.7
13 3/22/2014 11AM-2PM W 0 6.7 264 5.4 6.1 0.7 37.1 133.8 20.4 43.8 5.4 0.2 36.8 108.8 8.7 4.9 6.6
14 3/25/2014 11AM-1PM W -2 6.6 240 3.4 3.9 0.5 49.2 228.5 13.8 30.6 3.2 0.1 56.8 73.2 10.3 9.1 7.1
15 3/25/2014 1PM-3PM NW 0 6.4 228 6.0 6.6 0.5 32.6 153.8 14.0 65.1 3.3 0.2 38.8 79.6 12.5 6.4 6.9
16 3/25/2014 7PM-9PM NW -2 6.1 243 8.7 9.0 0.4 14.8 73.0 12.5 65.0 3.8 0.2 20.8 50.2 13.6 4.0 9.4
17 3/26/2014 8AM-9AM N -3 5.5 233 6.5 7.0 0.5 56.4 25.2 26.2 38.3 5.9 0.8 9.6 252.4 7.2 2.9 7.9
18 3/26/2014 9AM-11AM N -3 5.4 239 8.6 9.2 0.6 45.4 26.5 15.8 34.9 5.3 0.7 8.3 206.0 9.0 2.4 15.6
19 4/4/2014 8PM-10PM NW 2 6.2 261 1.5 2.0 0.5 13.5 19.4 9.6 23.6 3.4 0.4 5.0 39.6 5.4 7.8 0.0
20 4/4/2014 10PM-12PM NW 2 6.5 261 1.7 2.1 0.4 18.2 18.2 7.2 24.2 3.8 0.3 3.9 71.4 4.3 7.1 0.0
21 4/5/2014 1PM-4AM W 2 6.6 250 2.6 3.1 0.5 26.0 29.4 14.3 32.5 4.4 0.3 6.9 124.1 4.4 7.4 0.0
22 4/5/2014 4AM-7AM W 2 6.9 237 3.9 4.6 0.7 39.8 48.7 25.4 48.8 6.9 0.4 12.6 192.8 4.3 4.8 0.0
23 4/5/2014 7AM-10AM W 2 6.8 239 4.5 5.3 0.7 67.5 76.1 30.4 63.4 7.4 0.5 18.0 212.7 5.3 4.3 2.0
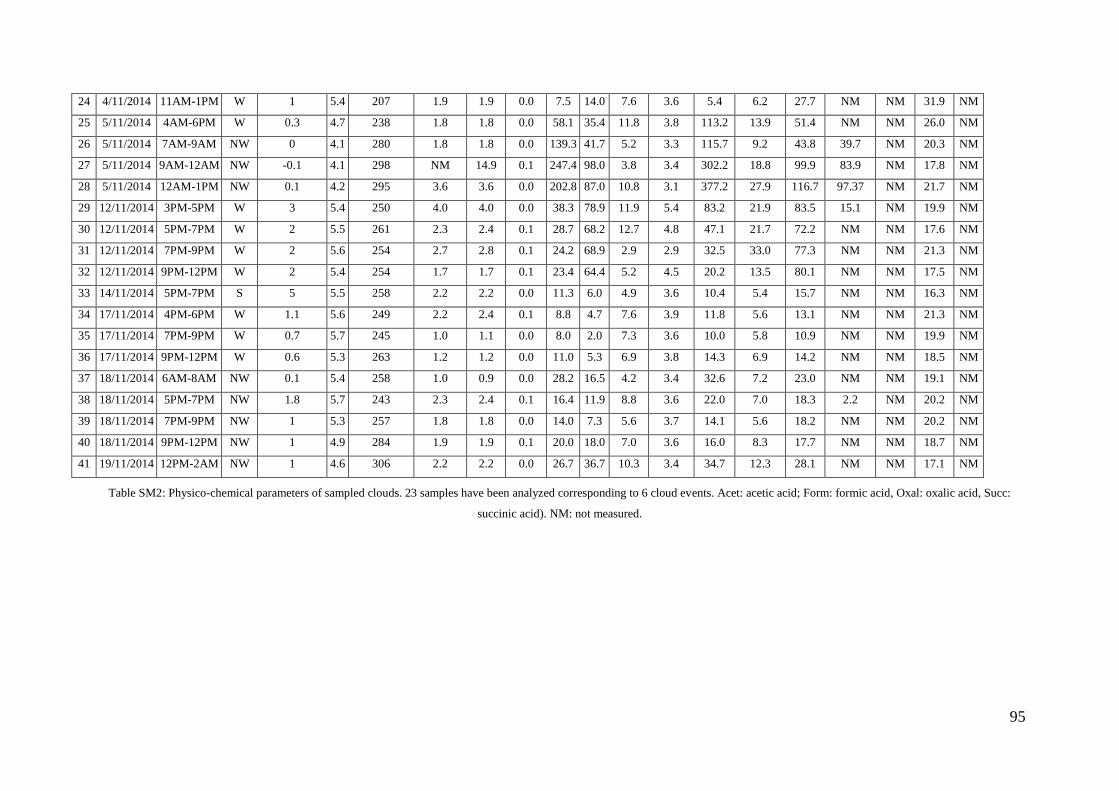
95
24 4/11/2014 11AM-1PM W 1 5.4 207 1.9 1.9 0.0 7.5 14.0 7.6 3.6 5.4 6.2 27.7 NM NM 31.9 NM
25 5/11/2014 4AM-6PM W 0.3 4.7 238 1.8 1.8 0.0 58.1 35.4 11.8 3.8 113.2 13.9 51.4 NM NM 26.0 NM
26 5/11/2014 7AM-9AM NW 0 4.1 280 1.8 1.8 0.0 139.3 41.7 5.2 3.3 115.7 9.2 43.8 39.7 NM 20.3 NM
27 5/11/2014 9AM-12AM NW -0.1 4.1 298 NM 14.9 0.1 247.4 98.0 3.8 3.4 302.2 18.8 99.9 83.9 NM 17.8 NM
28 5/11/2014 12AM-1PM NW 0.1 4.2 295 3.6 3.6 0.0 202.8 87.0 10.8 3.1 377.2 27.9 116.7 97.37 NM 21.7 NM
29 12/11/2014 3PM-5PM W 3 5.4 250 4.0 4.0 0.0 38.3 78.9 11.9 5.4 83.2 21.9 83.5 15.1 NM 19.9 NM
30 12/11/2014 5PM-7PM W 2 5.5 261 2.3 2.4 0.1 28.7 68.2 12.7 4.8 47.1 21.7 72.2 NM NM 17.6 NM
31 12/11/2014 7PM-9PM W 2 5.6 254 2.7 2.8 0.1 24.2 68.9 2.9 2.9 32.5 33.0 77.3 NM NM 21.3 NM
32 12/11/2014 9PM-12PM W 2 5.4 254 1.7 1.7 0.1 23.4 64.4 5.2 4.5 20.2 13.5 80.1 NM NM 17.5 NM
33 14/11/2014 5PM-7PM S 5 5.5 258 2.2 2.2 0.0 11.3 6.0 4.9 3.6 10.4 5.4 15.7 NM NM 16.3 NM
34 17/11/2014 4PM-6PM W 1.1 5.6 249 2.2 2.4 0.1 8.8 4.7 7.6 3.9 11.8 5.6 13.1 NM NM 21.3 NM
35 17/11/2014 7PM-9PM W 0.7 5.7 245 1.0 1.1 0.0 8.0 2.0 7.3 3.6 10.0 5.8 10.9 NM NM 19.9 NM
36 17/11/2014 9PM-12PM W 0.6 5.3 263 1.2 1.2 0.0 11.0 5.3 6.9 3.8 14.3 6.9 14.2 NM NM 18.5 NM
37 18/11/2014 6AM-8AM NW 0.1 5.4 258 1.0 0.9 0.0 28.2 16.5 4.2 3.4 32.6 7.2 23.0 NM NM 19.1 NM
38 18/11/2014 5PM-7PM NW 1.8 5.7 243 2.3 2.4 0.1 16.4 11.9 8.8 3.6 22.0 7.0 18.3 2.2 NM 20.2 NM
39 18/11/2014 7PM-9PM NW 1 5.3 257 1.8 1.8 0.0 14.0 7.3 5.6 3.7 14.1 5.6 18.2 NM NM 20.2 NM
40 18/11/2014 9PM-12PM NW 1 4.9 284 1.9 1.9 0.1 20.0 18.0 7.0 3.6 16.0 8.3 17.7 NM NM 18.7 NM
41 19/11/2014 12PM-2AM NW 1 4.6 306 2.2 2.2 0.0 26.7 36.7 10.3 3.4 34.7 12.3 28.1 NM NM 17.1 NM
Table SM2: Physico-chemical parameters of sampled clouds. 23 samples have been analyzed corresponding to 6 cloud events. Acet: acetic acid; Form: formic acid, Oxal: oxalic acid, Succ:
succinic acid). NM: not measured.

Three types are identified, as follows: (i) highly marine, (2 samples) characterized by pH
values of 5.0 and 5.6, respectively, high concentration of chloride and sodium and low
concentrations of nitrate, nitrite and ammonium; (ii) marine cloud waters (28 samples),
showing pH values between 4.7 and 7.6 and very low concentrations of anions and cations,
and (iii) continental samples (11 samples), with pH values from 4.1 to 6.9 and a medium
concentration of nitrates, sulfates and ammonium, while sodium and chloride concentrations
are very low. No sample could be classified as polluted cloud water because polluted cloud
waters have been characterized by concentrations of nitrates, sulfates and ammonium higher
than 350, 70 and 330 µM, respectively. This statistical analysis confirms that the majority of
the collected samples are of marine origin. This statistical analysis is confirmed by the back-
trajectory plots from the HYSPLIT model, showing that most of the air masses reaching the
puy de Dôme arises from the west sector i.e., from the Atlantic Ocean.
Figure 2. Scores plot obtained by PCA analysis of 137 samples collected before 2013 and grouped in four classes as a
function of the previously described classification 27 and 41 samples collected during 2013 and 2014. These new data
correspond to 15 cloud events and are indicated in black triangles. Statistical analysis is performed using 6 selected variables
(pH, [Na+], [Cl‒], [SO42‒], [NO3
‒], and [NH4+]). The scree plot obtained from autoscaled data shows that two selected
principal components (PC) containing a total variance of about 81%.
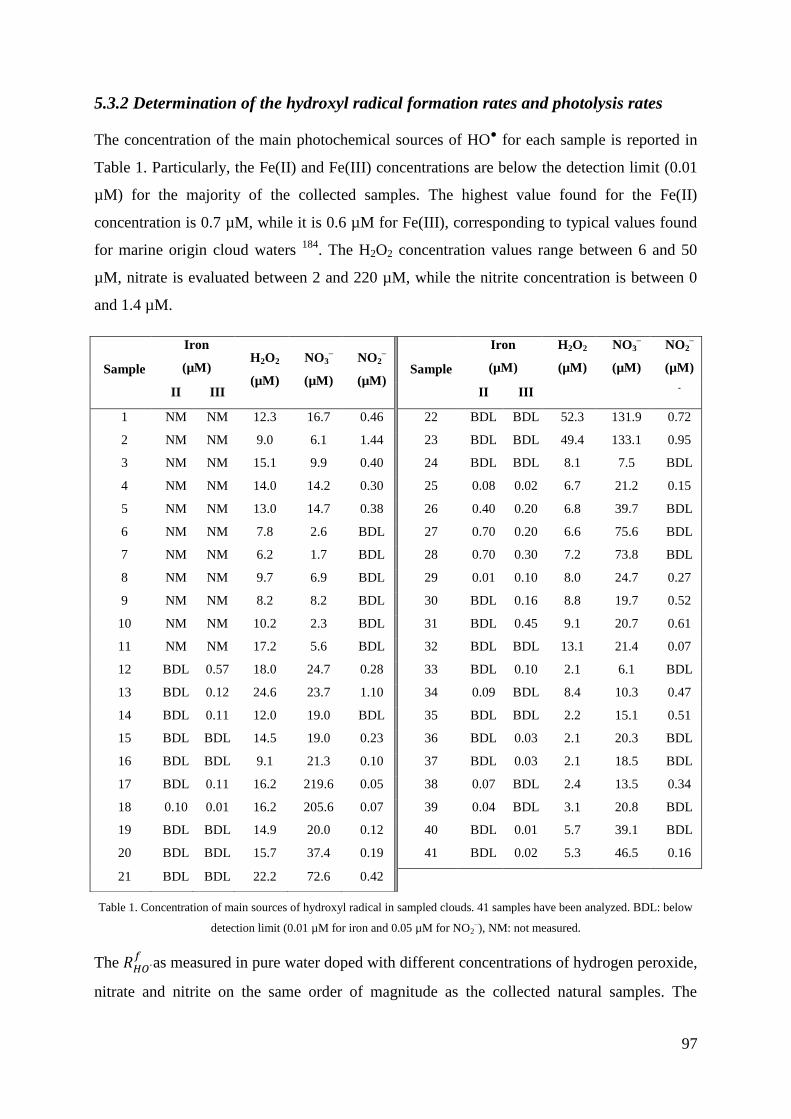
97
5.3.2 Determination of the hydroxyl radical formation rates and photolysis rates
The concentration of the main photochemical sources of HO● for each sample is reported in
Table 1. Particularly, the Fe(II) and Fe(III) concentrations are below the detection limit (0.01
µM) for the majority of the collected samples. The highest value found for the Fe(II)
concentration is 0.7 µM, while it is 0.6 µM for Fe(III), corresponding to typical values found
for marine origin cloud waters 184
. The H2O2 concentration values range between 6 and 50
µM, nitrate is evaluated between 2 and 220 µM, while the nitrite concentration is between 0
and 1.4 µM.
Table 1. Concentration of main sources of hydroxyl radical in sampled clouds. 41 samples have been analyzed. BDL: below
detection limit (0.01 µM for iron and 0.05 µM for NO2‒), NM: not measured.
The
as measured in pure water doped with different concentrations of hydrogen peroxide,
nitrate and nitrite on the same order of magnitude as the collected natural samples. The
Sample
Iron
(µM) H2O2
(µM)
NO3‒
(µM)
NO2‒
(µM) Sample
Iron
(µM)
H2O2
(µM)
NO3‒
(µM)
NO2‒
(µM)
II III II III -
1 NM NM 12.3 16.7 0.46 22 BDL BDL 52.3 131.9 0.72
2 NM NM 9.0 6.1 1.44 23 BDL BDL 49.4 133.1 0.95
3 NM NM 15.1 9.9 0.40 24 BDL BDL 8.1 7.5 BDL
4 NM NM 14.0 14.2 0.30 25 0.08 0.02 6.7 21.2 0.15
5 NM NM 13.0 14.7 0.38 26 0.40 0.20 6.8 39.7 BDL
6 NM NM 7.8 2.6 BDL 27 0.70 0.20 6.6 75.6 BDL
7 NM NM 6.2 1.7 BDL 28 0.70 0.30 7.2 73.8 BDL
8 NM NM 9.7 6.9 BDL 29 0.01 0.10 8.0 24.7 0.27
9 NM NM 8.2 8.2 BDL 30 BDL 0.16 8.8 19.7 0.52
10 NM NM 10.2 2.3 BDL 31 BDL 0.45 9.1 20.7 0.61
11 NM NM 17.2 5.6 BDL 32 BDL BDL 13.1 21.4 0.07
12 BDL 0.57 18.0 24.7 0.28 33 BDL 0.10 2.1 6.1 BDL
13 BDL 0.12 24.6 23.7 1.10 34 0.09 BDL 8.4 10.3 0.47
14 BDL 0.11 12.0 19.0 BDL 35 BDL BDL 2.2 15.1 0.51
15 BDL BDL 14.5 19.0 0.23 36 BDL 0.03 2.1 20.3 BDL
16 BDL BDL 9.1 21.3 0.10 37 BDL 0.03 2.1 18.5 BDL
17 BDL 0.11 16.2 219.6 0.05 38 0.07 BDL 2.4 13.5 0.34
18 0.10 0.01 16.2 205.6 0.07 39 0.04 BDL 3.1 20.8 BDL
19 BDL BDL 14.9 20.0 0.12 40 BDL 0.01 5.7 39.1 BDL
20 BDL BDL 15.7 37.4 0.19 41 BDL 0.02 5.3 46.5 0.16
21 BDL BDL 22.2 72.6 0.42

98
conditions were those used for natural cloud samples . A linear correlation between
and
the concentrations of photochemical precursors is found (Figure 3). The photolysis rate (J)
(s‒1
) is then estimated from the slopes and are reported in Table 4. For H2O2, the J value is
half of the experimental slope because H2O2 provides two HO● radicals.
Modeled photolysis
rates J (s‒1
)
Experimental photolysis
rates J (s‒1
)
2 2 2hH O HO 1.52 × 10‒6
(2.50 ± 0.11) × 10‒6
2
hHNO HO NO 6.16 × 10‒5
2 2
hNO H O HO NO HO 9.98 × 10‒6
(5.15 ± 0.30) × 10‒6
3 2 2
hNO H O HO NO HO 6.71 × 10‒8
(1.23 ± 0.04) × 10‒7
3 2
2
hFe H O HO Fe H 1.24 × 10‒6
2 2( ) hFe OH HO Fe 2.81 × 10‒4
2
2( ) hFe OH HO Fe HO 3.53 × 10‒4
Table 4. Modeled photolysis rates calculated by the model versus experimental photolysis rates obtained from experiments
reported in Figure 3.
Figure 3. Scatter plot of hydroxyl radical formation rates vs. hydrogen peroxide, nitrate and nitrite concentrations using 2 mM
of TA at pH 5.0 under Xenon lamp irradiation. The solid line is the linear fit, and dashed lines denote the 90% confidence of
the linear fit.

99
The hydroxyl radical formation rate (
) is determined for 36 samples, and its value is
estimated between 3.3 × 10‒12
and 4.2 × 10‒10
M s‒1
. Higher values are obtained for cloud
water samples of continental origin, while the values found for marine and highly marine
cloud waters are less than 1.4 × 10‒10
M s‒1
. The quantum yield of the formation of hydroxyl
radicals under polychromatic irradiation between 290 and 400 nm (
, see
Equation 3) is estimated as between 10‒5
and 10‒2
. (Table 2).
Sample
(M s‒1)
Class Sample
(M s‒1)
Class
1 (3.30±0.23)×10‒11 1.27×10‒3 Mar 22 (3.37±0.01)×10‒10 2.5×10‒3 Cont
2 NM NM Mar 23 (4.16±0.01)×10‒10 1.8×10‒3 Cont
3 NM NM Mar 24 (5.10±0.01)×10‒10 NM Mar
4 (1.40±0.01)×10‒10 1.0×10‒2 H-Mar 25 (2.42±0.08)×10‒11 1.9×10‒4 Cont
5 (1.24±0.02)×10‒10 6.0×10‒3 H-Mar 26 (1.41±0.01)×10‒10 3.4×10‒3 Cont
6 (2.77±0.01)×10‒11 1.5×10‒4 Mar 27 (4.95±0.01)×10‒11 1.5×10‒4 Cont
7 (5.60±0.06)×10‒11 9.0×10‒3 Mar 28 NM NM Cont
8 (2.48±0.01)×10‒11 2.9×10‒3 Mar 29 (8.48±0.04)×10‒11 1.3×10‒4 Mar
9 (2.20±0.02)×10‒11 1.8×10‒3 Mar 30 (8.43±0.02)×10‒11 1.2×10‒4 Mar
10 (2.93±0.02)×10‒11 2.4×10‒3 Mar 31 (6.11±0.21)×10‒11 5.1×10‒5 Mar
11 (6.77±0.02)×10‒11 2.7×10‒3 Mar 32 NM NM Mar
12 (6.10±0.19)×10‒11 1.7×10‒4 Mar 33 (3.27±0.23)×10‒12 1.3×10‒5 Mar
13 (4.66±0.01)×10‒11 1.5×10‒4 Mar 34 (2.73±0.01)×10‒11 8.5×10‒4 Mar
14 (2.81±0.01)×10‒11 2.0×10‒4 Mar 35 (3.60±0.30)×10‒11 6.0×10‒4 Mar
15 (1.09±0.04)×10‒11 9.0×10‒5 Mar 36 (5.97±0.12)×10‒11 9.6×10‒5 Mar
16 NM NM Mar 37 (2.41±0.04)×10‒11 8.4×10‒5 Mar
17 (6.05±0.44)×10‒11 4.1×10‒5 Cont 38 (5.76±0.13)×10‒11 2.7×10‒4 Mar
18 (3.39±0.20)×10‒11 3.2×10‒5 Cont 39 (2.69±0.04)×10‒11 1.1×10‒4 Mar
19 (8.11±0.02)×10‒11 1.9×10‒4 Mar 40 (1.27±0.01)×10‒10 2.6×10‒4 Cont
20 (8.46±0.01)×10‒11 8.4×10‒3 Mar 41 (1.09±0.01)×10‒10 5.1×10‒4 Cont
21 (1.54±0.01)×10‒10 1.5×10‒3 Cont
Table 2. Hydroxyl radical formation rate (
(M s‒1
)) and hydroxyl radical polychromatic quantum yield formation
(
) values estimated from cloud water samples. NM: not measured. Mar: Marine, H‒Mar: highly marine and
Cont: continental influence. The error on
are derived at the 1‒σ level simply from the scattering of experimental data.
To our knowledge, only a scarce number of data are available in the literature concerning
measurements of hydroxyl radical formation rates (
) and formation quantum yield ( )
in real cloud waters (Table 3).

100
(M s‒1
) References
Rain water 2.0 - 6.5 × 10‒11
205
Cloud water 1.3 - 8.3 × 10‒10
4.6 × 10
‒4 - 1.0 × 10
‒2
at 313 nm 80
Fog 0.9 - 6.9 × 10‒10
Aqueous
extracted aerosol
particles
0.4 - 3.8 × 10‒10
3.0 × 10‒4
- 1.7 × 10‒3
206
Cloud water 3.1 - 6.9 × 10‒10
207
Cloud water 0.3 - 5.9 × 10‒10
5.1 × 10‒4
- 3.0 × 10‒3
83
Cloud water at
the PUY station 0.2 - 4.2 × 10
‒10
1.3 × 10‒5
- 1.0 × 10‒2
Polychromatic This work
Table 3. Hydroxyl radical formation rates (
, M s‒1)and polychromatic quantum yield ( ) found in literature and in
this work.
Faust and Allen 80
measured the photoformation rates of HO (ranging from 1.3 to 8.3 × 10
‒10
M s
‒1) under monochromatic light (313 nm) and hydroxyl radical quantum yield (between ~ 5
× 10‒4
and 10‒2
) of six continental cloud water samples. Anastasio and McGregor 207
investigated the photoreactivity of two cloud waters from the Tenerife Islands to compare the
obtained values with fog waters. The authors found
ranging between 3.0 and 6.9 × 10‒10
M s
‒1. t that are approximately 1 order of magnitude higher than those reported in this study
for marine cloud waters, and the differences can be attributed to the air mass origin, as
suggested by Faust and Allen 80
. The authors suggested that long-range terrestrial aerosol and
gas transport in continental clouds could provide an additional source of hydroxyl radicals
compared with other marine or remote clouds.
5.3.3 Modeling the hydroxyl radical formation rates
We simulate the hydroxyl formation rate,
mod, using the model along with the relative
contribution (%) of each chemical source (Table SM3). In Figure 4, the differences between
the modeled and experimental HO● formation rates are estimated calculating the bias error
((
mod -
exp) /
exp in (%)).
Cloud
sample
Relative contribution (%) f
HOR mod (M s
‒1)
f
HOR exp (M s
‒1)
H2O2 + hν Fe (II) + H2O2 Fe (III) + hν NO3‒ + hν HNO2 + NO2
‒ + hν
1 86.7 0.0 0.0 2.6 10.6 4.3×10‒11
3.3×10‒11
2 64.9 0.0 0.0 1.0 34.1 4.2×10‒11
NM
3 90.7 0.0 0.0 1.3 7.9 5.0×10‒11
NM
4 91.2 0.0 0.0 2.0 6.7 4.6×10‒11
1.4×10‒10
5 89.1 0.0 0.0 2.2 8.6 4.4×10‒11
1.2×10‒10
6 99.3 0.0 0.0 0.7 0.0 2.4×10‒11
2.8×10‒11
7 99.4 0.0 0.0 0.6 0.0 1.9×10‒11
5.6×10‒11
8 98.4 0.0 0.0 1.6 0.0 3.0×10‒11
2.5×10‒11
9 97.8 0.0 0.0 2.2 0.0 2.5×10‒11
2.2×10‒11
10 99.5 0.0 0.0 0.5 0.0 3.1×10‒11
2.9×10‒11
11 99.3 0.0 0.0 0.7 0.0 5.2×10‒11
6.8×10‒11
12 22.3 21.6 54.2 0.7 1.2 2.4×10‒10
6.1×10‒11
13 57.3 10.7 22.4 1.2 8.4 1.3×10‒10
4.7×10‒11
14 52.4 10.7 35.1 1.8 0.0 6.9×10‒11
2.8×10‒11
15 92.5 0.0 0.0 2.7 4.9 4.7×10‒11
1.1×10‒11
16 91.8 0.0 0.0 4.8 3.4 3.0×10‒11
NM
17 50.2 12.4 21.7 15.1 0.7 9.8×10‒11
6.1×10‒11
18 51.8 22.3 10.4 14.6 0.9 9.4×10‒11
3.4×10‒11
19 94.6 0.0 0.0 2.8 2.6 4.8×10‒11
8.1×10‒11
20 91.4 0.0 0.0 4.8 3.7 5.2×10‒11
8.5×10‒11
21 88.0 0.0 0.0 6.4 5.6 7.6×10‒11
1.5×10‒10
22 90.7 0.0 0.0 5.1 4.2 1.7×10‒10
3.4×10‒10
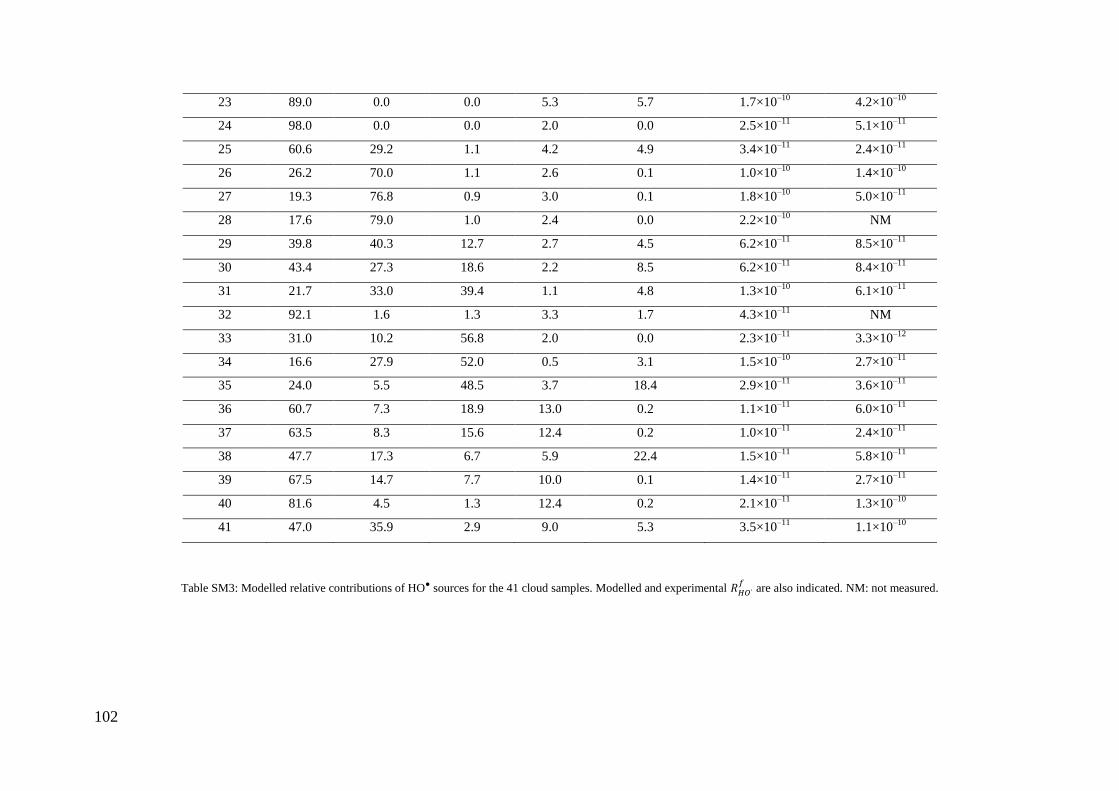
102
23 89.0 0.0 0.0 5.3 5.7 1.7×10‒10
4.2×10‒10
24 98.0 0.0 0.0 2.0 0.0 2.5×10‒11
5.1×10‒11
25 60.6 29.2 1.1 4.2 4.9 3.4×10‒11
2.4×10‒11
26 26.2 70.0 1.1 2.6 0.1 1.0×10‒10
1.4×10‒10
27 19.3 76.8 0.9 3.0 0.1 1.8×10‒10
5.0×10‒11
28 17.6 79.0 1.0 2.4 0.0 2.2×10‒10
NM
29 39.8 40.3 12.7 2.7 4.5 6.2×10‒11
8.5×10‒11
30 43.4 27.3 18.6 2.2 8.5 6.2×10‒11
8.4×10‒11
31 21.7 33.0 39.4 1.1 4.8 1.3×10‒10
6.1×10‒11
32 92.1 1.6 1.3 3.3 1.7 4.3×10‒11
NM
33 31.0 10.2 56.8 2.0 0.0 2.3×10‒11
3.3×10‒12
34 16.6 27.9 52.0 0.5 3.1 1.5×10‒10
2.7×10‒11
35 24.0 5.5 48.5 3.7 18.4 2.9×10‒11
3.6×10‒11
36 60.7 7.3 18.9 13.0 0.2 1.1×10‒11
6.0×10‒11
37 63.5 8.3 15.6 12.4 0.2 1.0×10‒11
2.4×10‒11
38 47.7 17.3 6.7 5.9 22.4 1.5×10‒11
5.8×10‒11
39 67.5 14.7 7.7 10.0 0.1 1.4×10‒11
2.7×10‒11
40 81.6 4.5 1.3 12.4 0.2 2.1×10‒11
1.3×10‒10
41 47.0 35.9 2.9 9.0 5.3 3.5×10‒11
1.1×10‒10
Table SM3: Modelled relative contributions of HO● sources for the 41 cloud samples. Modelled and experimental
are also indicated. NM: not measured.

103
Figure 4. Distribution of the bias error for the whole cloud water samples (black) and for cloud samples discretized as a
function of different iron concentration ranges (in color). The bias error is defined by the ratio (
mod -
exp) /
exp in (%). The number of samples analyzed is indicated above each box plot. The bottom and top lines correspond to
the 25th and 75th percentiles, respectively. The full line represents the median values. The ends of the whiskers are the 10th
and 90th percentiles.
Globally, for the whole cloud water samples (black boxplot), the model can reproduce the
range of measured hydroxyl radical formation rates with a slight model underestimation
(median of the bias error equal to -23%). However, if the cloud samples are discretized as a
function of different iron concentration ranges (boxplots in color), then the model tends to
overestimate the hydroxyl radicals formation for iron concentrations (Fe(II) + Fe(III)) more
than 0.1 µM. For concentration of iron between 0.1 and 0.4 µM (8 cloud samples), the median
of the bias error is 61% whereas for iron concentrations over 0.4 µM (5 cloud samples), the
median reaches 260%. For cloud samples in which the iron concentration is 0.4 µM, the
modeled contribution to the hydroxyl radical formation of iron (Fenton reaction and
photolysis of aqua-complexes) can reach 80% (Table SM3). In the model, Fe(III) is partially
complexed with oxalic acid, but the majority of iron for these cloud samples is simulated as
aqua-complexes (mainly Fe(OH)2+
and Fe(OH)2+). Therefore, iron can act as a significant
HO source due to its efficient photolysis (Reactions R7, R8, R9, Table SM1) and the Fenton
reaction with H2O2 (Reactions R11, Table SM1).
However, in atmospheric natural water, the chemical composition of organic matter is still not
very well characterized 102
. Part of this organic matter is expected to efficiently complex

104
metals in cloud water 208
. Due to missing information about the iron speciation and
complexation in natural cloud water, the model probably overestimates the free Fe(III).
Moreover, iron organic complexes are not expected to directly generate hydroxyl radicals but
primarily contribute to the oxidative capacity via Fe(II) generation and the Fenton process. To
evaluate this hypothesis, we decide to consider the iron as totally complexed by the organic
matter present in natural cloud waters. As a first general approximation, we consider iron as
not reactive in the model. The new simulations show that the majority of the simulated values
(75%) of the hydroxyl radical formation rates are now underestimated by the model (median
of the bias error equal to -40%) (Figure 5).
Figure 5. Distribution of the bias error for the whole cloud water samples for the reference case and for two sensitivity tests
performed with the model: (i) the iron chemistry (photolysis of Fe(III) and the Fenton reaction) is neglected in the model; (ii)
the iron chemistry is neglected, and the new photolysis rate constants obtained from experimental measurements are
implemented in the model. The bias error is defined by the ratio (
mod -
exp) /
exp in (%).The number of
samples analyzed is indicated above each box plot. The bottom and top lines correspond to the 25th and 75th percentiles,
respectively. The full line represents the median values. The ends of the whiskers are the 10th and 90th percentiles.
Based on the laboratory irradiation experiments (Figure 3), new photolysis rates from nitrite,
nitrate and hydrogen peroxide are previously estimated from the hydroxyl radical formation
rates (Table 4). For nitrate and H2O2, the values calculated by the model are lower than the
experimental ones; the experimental photolysis rates are higher by a factor ~1.5 for H2O2 and
~2 for nitrate. For nitrite, the experimental photolysis rate is approximately half of the
modeled value. These discrepancies should partially explain the underestimation of HO

105
formation by the model. Therefore, we consider the experimental photolysis rates in the
model, and a new comparison of modeled HO formation rates with experimental values is
shown in Figure 5. The median of the bias error is -3% with the 25th
and 75th
percentiles at -
50 and 60%, respectively. Table SM4 reports the distribution of the relative contributions of
H2O2, NO3‒ and NO2
‒ photolysis to the modeled
. While the median value of the nitrite
and nitrate contributions is calculated by the model as equal to 1 and 5%, respectively (Figure
6), the main HO contributor is H2O2 photolysis (median value of 93%, with the 25
th and 75
th
percentiles at 85 and 96%, respectively). This result suggests that H2O2 is the key compound
that drives the oxidative capacity of our cloud water samples when iron concentrations are
relatively low or when iron is suggested to be totally complexed by organic matter.
Cloud sample Relative contribution (%)
mod (M s‒1
)
exp (M s‒1
) H2O2 + hν NO3
‒ + hν HNO2 + NO2
‒ + hν
1 93.2 3.1 3.7 6.6 × 10‒11
3.3 × 10‒11
2 84.4 1.4 14.2 5.3 × 10‒11
NM
3 95.7 1.6 2.7 7.9 × 10‒11
NM
4 95.3 2.4 2.4 7.3 × 10‒11
1.4 × 10‒10
5 94.4 2.6 3.0 6.9 × 10‒11
1.2 × 10‒10
6 99.2 0.8 0.0 3.9 × 10‒11
2.8 × 10‒11
7 99.3 0.7 0.0 3.1 × 10‒11
5.6 × 10‒11
8 98.3 1.7 0.0 4.9 × 10‒11
2.5 × 10‒11
9 97.6 2.4 0.0 4.2 × 10‒11
2.2 × 10‒11
10 99.4 0.6 0.0 5.1 × 10‒11
2.9 × 10‒11
11 99.2 0.8 0.0 8.6 × 10‒11
6.8 × 10‒11
12 95.2 3.2 1.6 9.4 × 10‒11
6.1 × 10‒11
13 93.4 2.2 4.3 1.3 × 10‒10
4.7 × 10‒11
14 96.2 3.8 0.0 6.2 × 10‒11
2.8 × 10‒11
15 95.3 3.1 1.6 7.6 × 10‒11
1.1 × 10‒11
16 93.5 5.4 1.1 4.8 × 10‒11
NM
17 74.6 25.0 0.4 1.1 × 10‒10
6.1 × 10‒11
18 75.8 23.8 0.5 1.1 × 10‒10
3.4 × 10‒11
19 96.0 3.2 0.8 7.7 × 10‒11
8.1 × 10‒11
20 93.3 5.5 1.2 8.4 × 10‒11
8.5 × 10‒11
21 90.8 7.3 1.8 1.2 × 10‒10
1.5 × 10‒10
22 92.9 5.8 1.4 2.8 × 10‒10
3.4 × 10‒10
23 92.0 6.1 1.9 2.7 × 10‒10
4.2 × 10‒10
24 97.7 2.2 0.0 4.1 × 10‒11
5.1 × 10‒11
25 90.4 7.1 2.6 3.7 × 10‒11
2.4 × 10‒11

106
26 87.3 12.6 0.1 3.9 × 10‒11
1.4 × 10‒10
27 77.8 22.0 0.2 4.2 × 10‒11
5.0 × 10‒11
28 79.7 20.2 0.2 4.5 × 10‒11
NM
29 89.8 6.8 3.3 4.4 × 10‒11
8.5 × 10‒11
30 89.4 5.0 5.7 4.9 × 10‒11
8.4 × 10‒11
31 88.7 5.0 6.3 5.1 × 10‒11
6.1 × 10‒11
32 95.6 3.8 0.6 6.8 × 10‒11
NM
33 93.3 6.7 0.0 1.1 × 10‒11
3.3 × 10‒12
34 91.8 2.8 5.5 4.6 × 10‒11
2.7 × 10‒11
35 70.6 12.0 17.4 1.6 × 10‒11
3.6 × 10‒11
36 80.7 19.2 0.1 1.3 × 10‒11
6.0 × 10‒11
37 82.0 17.9 0.1 1.3 × 10‒11
2.4 × 10‒11
38 77.6 10.8 11.7 1.5 × 10‒11
5.8 × 10‒11
39 85.7 14.2 0.1 1.8 × 10‒11
2.7 × 10‒11
40 85.4 14.5 0.1 3.3 × 10‒11
1.3 × 10‒10
41 79.5 17.2 3.2 3.3 × 10‒11
1.1 × 10‒10
Table SM4. Modeled relative contributions of HO● sources for the 41 cloud samples considering the new photolysis
experimental rates in the model for H2O2, nitrite and nitrate and without iron chemistry. Modeled and experimental
are
also indicated. NM: not measured.
Figure 6. Distribution of relative contributions of modeled HO● formations rates for each photochemical source (H2O2, NO3‒
and NO2‒ photolysis) for the whole cloud water samples. Model outputs are obtained from the sensitivity test in which the
iron chemistry is not considered, and new photolysis rate constants from experimental measurements are implemented in the
model. The number of samples analyzed is indicated above each box plot. The bottom and top lines correspond to the 25th
and 75th percentiles, respectively. The full line represents the median values. The ends of the whiskers are the 10th and 90th
percentiles.
107
5.4 Conclusion
In this study, we compare experimental and modeled HO formation rates for 41 cloud water
samples with contrasted chemical compositions depending on the origin of the air masses.
This approach helps to elucidate the complex aqueous photoreactivity of natural cloud water
that is expected to drive the oxidative capacity. Experimental data are obtained considering
only the HO formation sources with addition of an excess of chemical probe leading to the
measurements of total generated HO radicals. The first comparison with the M2C2 model
shows that the model can reproduce the order of magnitude of measured
(from 1.1 ×
10‒11
to 4.2 × 10‒10
M s‒1
and from 1.1 × 10‒11
to 2.4 × 10‒10
M s‒1
for experimental and
modeled values, respectively). Some discrepancies appear for samples containing iron
concentrations over 0.4 µM in which the model overestimates the contribution of iron(III)-
aqua complexes to the HO production rate. Ultimately, the aqueous chemical mechanism in
the model was modified considering new photolysis rates for H2O2, nitrite and nitrate
estimated by laboratory irradiation experiments. As a sensitivity test, iron reactivity was also
suppressed in the model to account for the total complexation of iron. The modeled
production rates of HO with the updated mechanism are closer to the experimental values.
This supports the hypothesis that iron could be strongly complexed by the organic matter in
natural cloud water. These complexes could be more stable and less photoreactive, leading to
less HO production than that calculated by theoretical models in which only the
photochemistry of Fe(III)-carboxylate is considered 209
. In this context, evaluation of the
complexation of iron by organic compounds in the cloud aqueous phase and the
photoreactivity of these complexes should be pursued in the future. Their photoreactivity
provides significant data to understand the specific role of iron species and, more generally,
the oxidant capacity of this medium.

108
109
Chapter 6
Motivation
This chapter is focused on the photochemical behavior of tartronic acid, a dicarboxylic acid
that can be formed by oxidation of sugars in the atmosphere.
This work was carried out considering that many oxidative pathways in atmospheric models
lead to the formation of tartronic acid which chemical and photochemical behavior is not
completely understood, especially at low concentrations.
The next chapter reports in the first part the results of the spectroscopic investigation on
tartronic acid and in the second its reactivity. Direct photolysis and hydroxyl radical
photodegradation were performed and the chapter ends with the determination of the second
order rate constant between tartronic acid and hydroxyl radical by Laser Flash Photolysis.
This work is still not finished: NMR spectroscopy of irradiated solutions will give us an idea
of the reaction’s products for both direct and indirect photolysis. Kinetic contants and
transformation pathways will be implemented in the model of multiphase cloud chemistry
(M2C2).

110
111
Photochemical fate of Tartronic acid in cloud waters.
6.1. Introduction
Organic compounds are oxidized in the gas and in the liquid phase of the atmosphere
according to their reactivity, as shown in Chapter 2 leading in most cases, to the formation of
less volatile products. Scarce information is available about the organic composition of cloud
water but it can be assumed that the presence of microorganisms is strictly correlated to the
presence of sugars, lipids and other biological molecules. In 1951 Kulka underlined how the
metabolism of microorganisms leads to the production of short chain carboxylic acids and, in
particular, of tartronic acid:
“... this is the first instance in which tartronic acid has been identified as a product of the
dissimilation of glucose by microbiological agency. It is not yet possible to decide whether
this production of tartronic acid was affected by living cells of A.acetosum or by an enzyme
system released from autolysed cells of the organism [A. acetosum]...”210.
Moreover, sugar oxidation was proved to give short chain carboxylic acids like tartronic,
tartaric and oxalic acids also in the absence of microrganisms, as recently reported by Smith
et al 211
“The products of the nitric acid oxidation of D-glucose have been identified as D-glucaric
acid and its precursors D-gluconic acid along with the byproducts 5-keto-D-gluconic acid,
tartaric acid, tartronic acid and oxalic acid”.
Despite numerous investigations on the fate of oxalic and tartaric acids, to the best of our
knowledge, no data concerning tartronic acid are reported.
Tartronic acid (structure and physico-chemical properties reported in Table 1) was found in
PM 10 by van Pixteren et al., who report a concentration of 4 ng m‒3
for all the sites
investigated. Only for one sampling site the concentration reaches the value of 14 ± 13 ng m‒3
212. The same research group found tartronic acid in continental aerosol samples with
concentrations of 0.3, 1.9 and 3.8 ng m‒3 213
. Neusüss et al 214
found the same average
concentrations in marine aerosols.

112
TARTRONIC
ACID
IUPAC name 2-hydroxypropanedioic acid
CAS number 80-69-3
Chemical formula C3H4O5
Molar mass 120.06 g mol‒1
Appearance beige powder
Table 1: Tartronic acid physico-chemical characteristics.
Considering that this compound was found in atmospheric particulate phase, we can suggest
the presence of tartronic acid in cloud water due to three different processes: microbiological
and chemical oxidation of sugars and also dissolution from aerosols. It could be interesting to
understand the chemical and photochemical behaviour of tartronic acid and to implement
these data in atmospheric models, where the formation of this compound is predicted but it
does not react chemically or photochemically.
6.2. Chemicals
The hydrogen peroxide (solution 30% in water) was purchased from Fluka while the
carboxylic acids (tartronic, formic, acetic, oxalic and mesoxalic, were obtained from Sigma
Aldrich with a purity ≥ 97%. All the other chemicals (purity reagent grade) used for the
analysis were obtained from Sigma-Aldrich.
All the solutions were prepared with deionized ultra pure aerated milli-Q water from
Millipore (resistivity = 18.2 MΩ cm) under laminar flux hood. Moreover, all the glass
containers and injection material were washed three times with ultra pure water before use. If
necessary, the pH values were adjusted with perchloric acid (1 N) and NaOH (1 N) using a
JENWAY 3310 pH-meter to ± 0.01 pH unit. During irradiation pH was monitored using a
Hanna portable pH-meter. All the solutions were kept in dark conditions and the final
preparations were performed in a room equipped with a sodium lamp (589 nm emission).
Fresh solutions of tartronic acid (TAR) were prepared before each experiment from a stock
solution (2 mM) stored in the dark at 278 K. The concentration of the stock solution of H2O2
in milli-Q water was determined using a molar attenuation coefficient of 38.1± 1.4 M‒1
cm‒1
at 240 nm 171
.
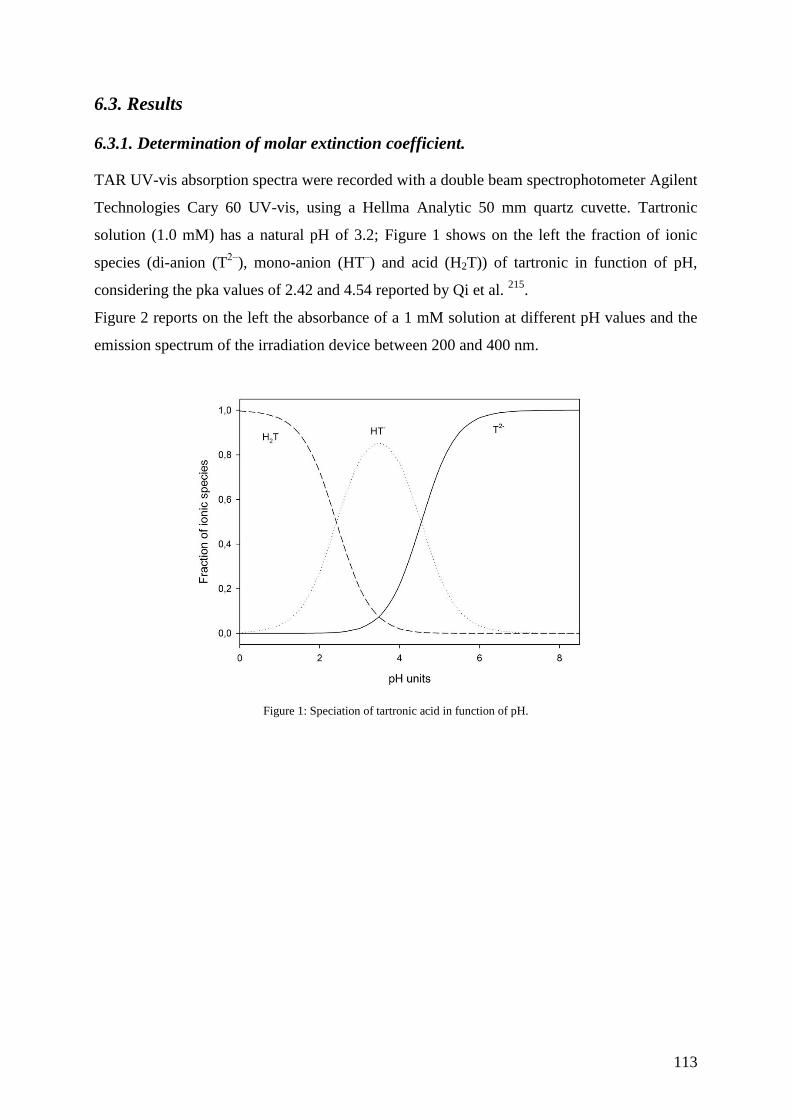
113
6.3. Results
6.3.1. Determination of molar extinction coefficient.
TAR UV-vis absorption spectra were recorded with a double beam spectrophotometer Agilent
Technologies Cary 60 UV-vis, using a Hellma Analytic 50 mm quartz cuvette. Tartronic
solution (1.0 mM) has a natural pH of 3.2; Figure 1 shows on the left the fraction of ionic
species (di-anion (T2‒
), mono-anion (HT‒) and acid (H2T)) of tartronic in function of pH,
considering the pka values of 2.42 and 4.54 reported by Qi et al. 215
.
Figure 2 reports on the left the absorbance of a 1 mM solution at different pH values and the
emission spectrum of the irradiation device between 200 and 400 nm.
Figure 1: Speciation of tartronic acid in function of pH.

114
Figure 2: Absorption spectrum of tartronic acid at three pH and lamp emission spectrum.
The molar attenuation coefficient (ε, M‒1
cm‒1
) was determined previously by Herrmann et
al.216
for tartronic acid at pH 0.5, with a value of 1160 M‒1
cm‒1
at λ = 224 nm, and for the
dianionic form at pH 9, with a value of 8470 M‒1
cm‒1
at λ = 219 nm. In this work the
absorption spectra of tartronic acid were recorded at different pH, from 1 to 11, and the molar
extinction coefficient was extrapolated for each form, considering the speciation of the
compounds in solution. ε at 219 nm is estimated to be for the dianionic form TAR2‒
194 ± 6
M‒1
cm‒1
, for the monoanionic form HTAR‒ 420 ± 20 M
‒1 cm
‒1. For H2TAR the UV-vis
spectrum of the solution changes in time at pH lower than 2, as shown in Figure 3.
Figure 3: Absorption spectrum of tartronic acid at pH 1.6 before and after 2h.

115
This is probably due to the protonation of the hydroxyl group on the second carbon in the
presence of a large excess of H+ which leads to the liberation of one water molecule and to the
formation of the new species described in Figure 4. This molecule is stabilized by two
resonance forms and the conjugated double bond could explain the absorption in the range
260-320 nm. This is only a hypothesis and more computational calculations are needed to
prove this degradation pathway. In any case we consider that tartronic acid is not stable at pH
lower than 2.
Figure 4: formation of new a species at low pH.
It is very difficult to determine the molar attenuation coefficient (ε) at wavelength of 219 nm
because the absorption increases rapidly and the error associated increases exponentially. For
this reason we calculated epsilon for the three forms, using the equations reported hereafter.
Equation 1.
Equation 2.
Equation 3.
Equation 4.
where is the absorption measured for each wavelength, is the
concentration (1×10‒3
M), represents the optical pathway (1 cm) and and are the
fractions of dianionic and monoanionic species respectively. The molar extinction coefficient
for the two forms is reported in Figure 5.

116
Figure 5: Molar extinction coefficient of tartronic mono and dianionic form.
6.3.2. Irradiation experiments
6.3.2.1. Direct Photolysis
Aqueous solutions of tartronic acid 10 µM were irradiated in the reactor described in Chapter
4. The energy was normalized to the actinometry results using the paranitroanisole
(PNA)/pyridine method 170
. A total flux of 44 W m−2
reaching the solution was determined in
the range 290‒400 nm.
Hydrogen peroxide concentration was estimated by using p-hydroxyphenilacetic acid (HPAA,
purity > 98%) and peroxydase from horseradish (POD) according with the spettrofluorimetric
quantification method described in Chapter 4.
Carboxylic acids quantification was performed using the ion chromatography Thermo
Scientific Dionex ICS 5000 described in Chapter 4. The experimental method was modified
compared to the one previously reported in Chapter 4 to better separate tartronic acid from
oxalic acid. The KOH gradient used is reported in Table 2.
Under these conditions, the retention times of acetate, formate and tartronate are of 6.5, 7.3
and 28.5 min, respectively.
Time (min) KOH Concentration (mM)
0 10
33 20
35 24
35.5 10
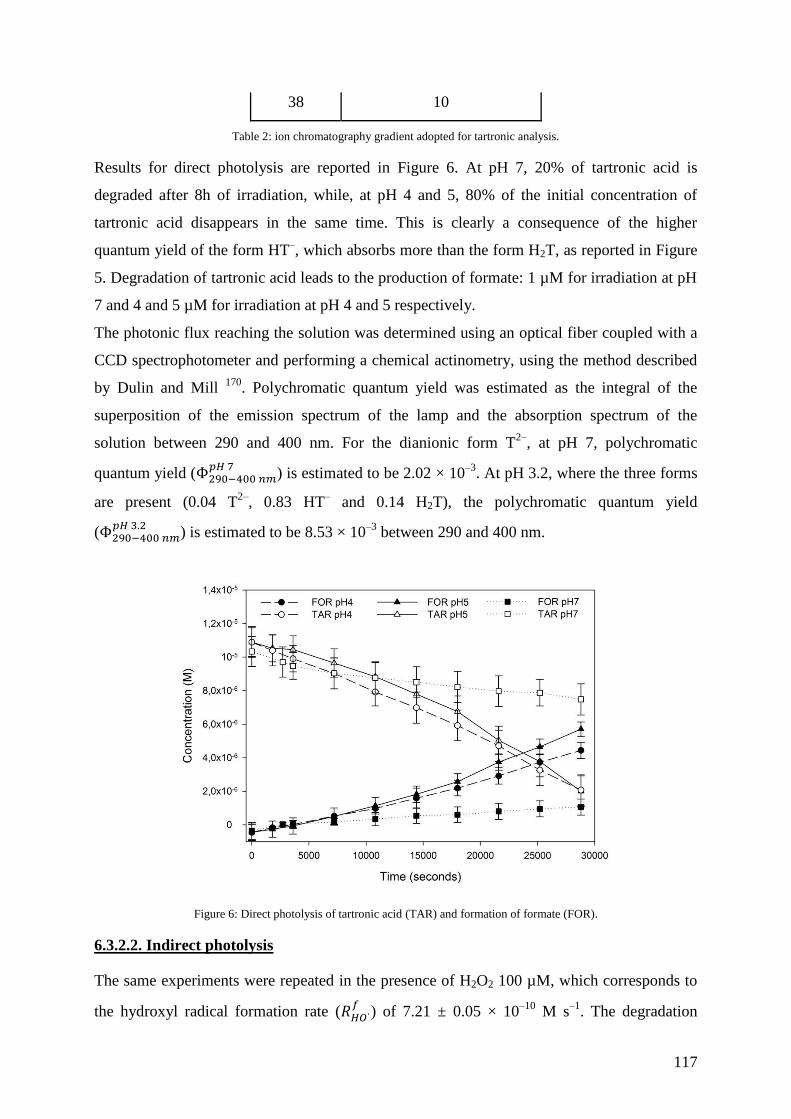
117
38 10
Table 2: ion chromatography gradient adopted for tartronic analysis.
Results for direct photolysis are reported in Figure 6. At pH 7, 20% of tartronic acid is
degraded after 8h of irradiation, while, at pH 4 and 5, 80% of the initial concentration of
tartronic acid disappears in the same time. This is clearly a consequence of the higher
quantum yield of the form HT‒, which absorbs more than the form H2T, as reported in Figure
5. Degradation of tartronic acid leads to the production of formate: 1 µM for irradiation at pH
7 and 4 and 5 µM for irradiation at pH 4 and 5 respectively.
The photonic flux reaching the solution was determined using an optical fiber coupled with a
CCD spectrophotometer and performing a chemical actinometry, using the method described
by Dulin and Mill 170
. Polychromatic quantum yield was estimated as the integral of the
superposition of the emission spectrum of the lamp and the absorption spectrum of the
solution between 290 and 400 nm. For the dianionic form T2‒
, at pH 7, polychromatic
quantum yield (
) is estimated to be 2.02 × 10‒3
. At pH 3.2, where the three forms
are present (0.04 T2‒
, 0.83 HT‒ and 0.14 H2T), the polychromatic quantum yield
(
) is estimated to be 8.53 × 10‒3
between 290 and 400 nm.
Figure 6: Direct photolysis of tartronic acid (TAR) and formation of formate (FOR).
6.3.2.2. Indirect photolysis
The same experiments were repeated in the presence of H2O2 100 µM, which corresponds to
the hydroxyl radical formation rate (
) of 7.21 ± 0.05 × 10‒10
M s‒1
. The degradation
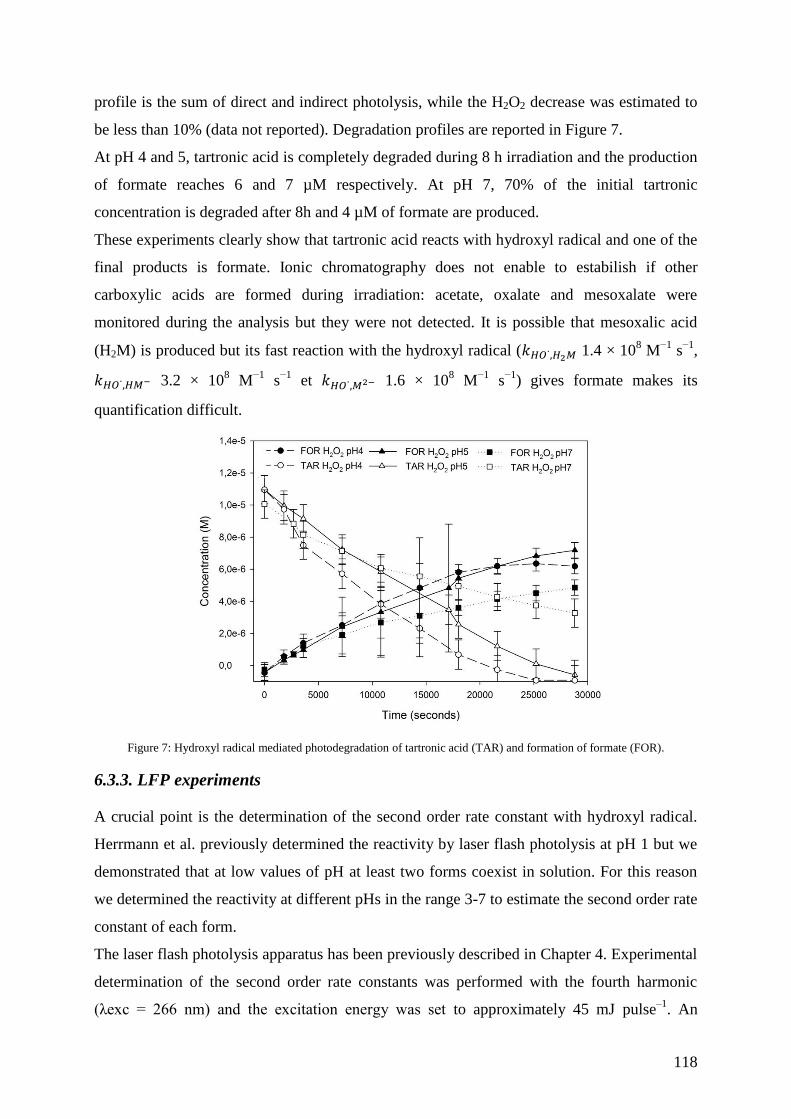
118
profile is the sum of direct and indirect photolysis, while the H2O2 decrease was estimated to
be less than 10% (data not reported). Degradation profiles are reported in Figure 7.
At pH 4 and 5, tartronic acid is completely degraded during 8 h irradiation and the production
of formate reaches 6 and 7 µM respectively. At pH 7, 70% of the initial tartronic
concentration is degraded after 8h and 4 µM of formate are produced.
These experiments clearly show that tartronic acid reacts with hydroxyl radical and one of the
final products is formate. Ionic chromatography does not enable to estabilish if other
carboxylic acids are formed during irradiation: acetate, oxalate and mesoxalate were
monitored during the analysis but they were not detected. It is possible that mesoxalic acid
(H2M) is produced but its fast reaction with the hydroxyl radical ( 1.4 × 10⁸ M
−1 s
−1,
3.2 × 10⁸ M
−1 s
−1 et 1.6 × 10
8 M
−1 s
−1) gives formate makes its
quantification difficult.
Figure 7: Hydroxyl radical mediated photodegradation of tartronic acid (TAR) and formation of formate (FOR).
6.3.3. LFP experiments
A crucial point is the determination of the second order rate constant with hydroxyl radical.
Herrmann et al. previously determined the reactivity by laser flash photolysis at pH 1 but we
demonstrated that at low values of pH at least two forms coexist in solution. For this reason
we determined the reactivity at different pHs in the range 3-7 to estimate the second order rate
constant of each form.
The laser flash photolysis apparatus has been previously described in Chapter 4. Experimental
determination of the second order rate constants was performed with the fourth harmonic
(λexc = 266 nm) and the excitation energy was set to approximately 45 mJ pulse‒1
. An
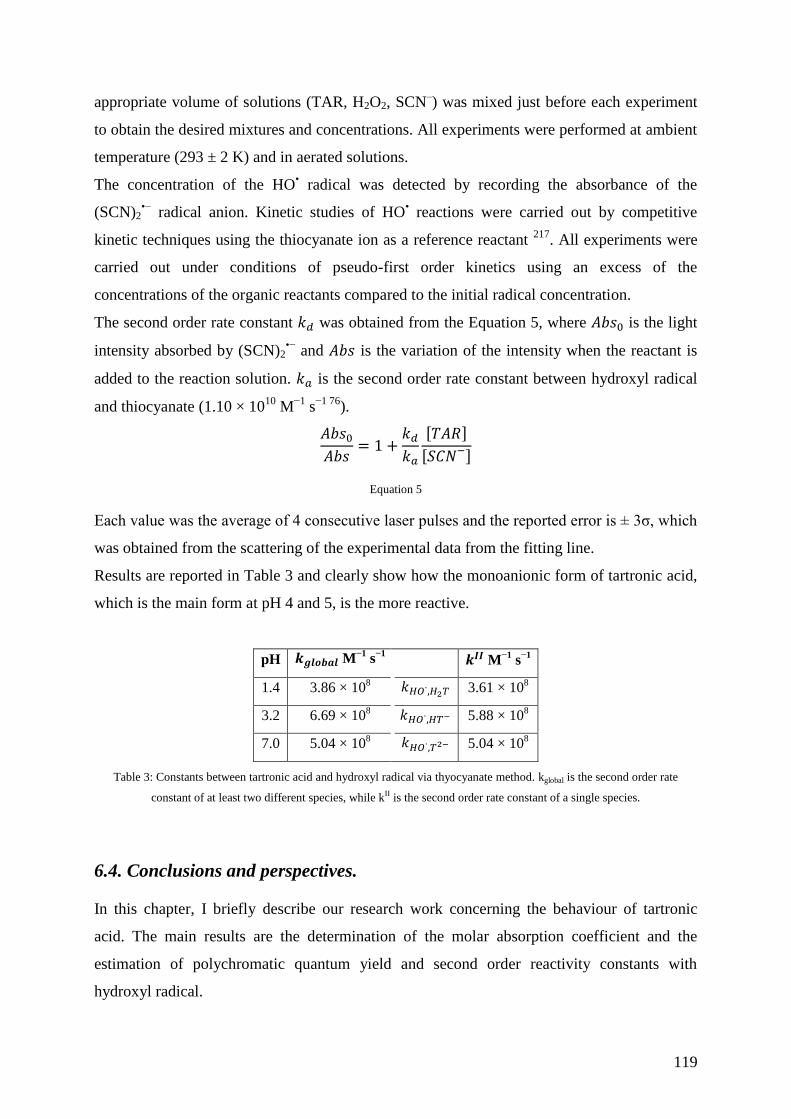
119
appropriate volume of solutions (TAR, H2O2, SCN‒) was mixed just before each experiment
to obtain the desired mixtures and concentrations. All experiments were performed at ambient
temperature (293 ± 2 K) and in aerated solutions.
The concentration of the HO• radical was detected by recording the absorbance of the
(SCN)2•−
radical anion. Kinetic studies of HO• reactions were carried out by competitive
kinetic techniques using the thiocyanate ion as a reference reactant 217
. All experiments were
carried out under conditions of pseudo-first order kinetics using an excess of the
concentrations of the organic reactants compared to the initial radical concentration.
The second order rate constant was obtained from the Equation 5, where is the light
intensity absorbed by (SCN)2•−
and is the variation of the intensity when the reactant is
added to the reaction solution. is the second order rate constant between hydroxyl radical
and thiocyanate (1.10 × 10¹⁰
M−1
s−1 76
).
Equation 5
Each value was the average of 4 consecutive laser pulses and the reported error is ± 3σ, which
was obtained from the scattering of the experimental data from the fitting line.
Results are reported in Table 3 and clearly show how the monoanionic form of tartronic acid,
which is the main form at pH 4 and 5, is the more reactive.
pH M−1
s−1
M−1
s−1
1.4 3.86 × 10⁸ 3.61 × 10
8
3.2 6.69 × 10⁸ 5.88 × 10
8
7.0 5.04 × 10⁸ 5.04 × 10
8
Table 3: Constants between tartronic acid and hydroxyl radical via thyocyanate method. kglobal is the second order rate
constant of at least two different species, while kII is the second order rate constant of a single species.
6.4. Conclusions and perspectives.
In this chapter, I briefly describe our research work concerning the behaviour of tartronic
acid. The main results are the determination of the molar absorption coefficient and the
estimation of polychromatic quantum yield and second order reactivity constants with
hydroxyl radical.

120
This is only the beginning of a complex work in which the main photoproducts of tartronic
acid will be determined by proton nuclear magnetic resonance (H-NMR) and all the results
will be implemented in the atmospheric model M2C2 described in Chapter 3.

121
Chapter 7
Motivation
Cloud water dissolved organic carbon composition is mostly undetermined: as shown in
Chapter 3 only aldehydes and main carboxylic acids were determined.
We focused our work on proteinaceous matter that, after enzymatic or hydrolytic action, can
be separated into amino acids. In this sense amino acids could constitute the link between
microbiological activity and cloud aqueous chemistry and photochemistry. However, they can
also come from other sources, as described in Chapter 3.
For this reason, in the work presented in this chapter, we detected and quantified amino acids
in cloud water adopting a chromatographic method with pre-column derivatization. We found
that the average total concentration of amino acids account for 10% of the DOC. In the second
part of this work, we show that amino acids reactivity with the hydroxyl radical is greater than
that of carboxylic acids.
For many years, the presence of microorganisms and their activity in cloud water droplet and
in the atmosphere in general has been well known but only recently their influence on cloud
water dissolved organic carbon speciation has been proved. In particular, it was shown that
they transform short chain carboxylic acids. Starting from this assumption, we can easily
hypothesize that, during their life in cloud water, microorganisms release organic compounds,
mainly in the form of simple carbohydrates (sugars) and proteins. Furthermore, after the death
of the cells, the cellular membrane can fissure and all the material contained in cytoplasm
(salts, sugars, enzymes, proteins and RNA) pour into the droplet. A general perspective of the
work presented could be the correlation between microorganism activity and concentration of
amino acids.

122

123
Improving the characterization of dissolved organic carbon in cloud water:
Amino acids and their impact on the oxidant capacity
Angelica Biancoa,b
, Guillaume Voyarda,b
, Laurent Deguillaumec,d
, Gilles Mailhota,b
,
Marcello Brigantea,b*
a Université Clermont Auvergne, Université Blaise Pascal, Institut de Chimie de Clermont-Ferrand, BP 10448,
F-63000 CLERMONT-FERRAND, FRANCE
b CNRS, UMR 6296, ICCF, F-63171 AUBIERE, FRANCE
c Université Clermont Auvergne, Université Blaise Pascal, OPGC, Laboratoire de Météorologie Physique, BP
10448, F-63000 CLERMONT-FERRAND, FRANCE
d CNRS, UMR 6016, LaMP/OPGC, BP80026, F-63177 AUBIERE, FRANCE
* Corresponding author Marcello Brigante: University Blaise Pascal, Institute of Chemistry of
Clermont-Ferrand, avenue des Landais 63171 Aubière, France; Phone +33 0473405514 e-
mail: [email protected]
Article submitted to Nature Scientific Reports
Abstract
Improving our understanding of cloud chemistry depends on achieving better chemical
characterization (90% of the organic carbon [OC] fraction remains uncharacterized) and,
consequently, assessing the reactivity of this complex system. In this manuscript, we report
for the first time the concentrations of 16 amino acids (AAs) in 25 cloud water samples. The
concentrations of individual AAs ranged from a few nM up to ~2.0 µM, and the average
contribution of AAs corresponded to 10% (5.1% to 25.9%) of the dissolved OC (DOC)
concentration. Considering their occurrence and concentrations, AAs were expected to
represent an important hydroxyl radical (HO●) sink in aqueous cloud samples. In this work,
we estimated that approximately 20% of the hydroxyl radical-scavenging ability of the DOC
could be attributed to the presence of AAs, whereas comparing the AAs suggested that up to
60% of their reactivity with HO● could account for the presence of tryptophan. These results
clearly demonstrate that the occurrence and reactivity of AAs must be considered to better
estimate the chemical composition and oxidant capacity of the aqueous cloud phase.

124
7.1. Introduction
The organic carbon (OC) fraction of aerosol accounts for a large portion of air particulate
matter and exhibits many complex molecular structures 218
. This organic matter originates
from a wide variety of natural and anthropogenic sources; additionally, it undergoes chemical
transformations during its atmospheric lifetime 62
and strongly influences the climate and
health effects of atmospheric aerosols 219
. In the OC fraction of aerosols, water-soluble OC
(WSOC) is especially interesting because it contributes to particles’ hygroscopic properties
and participates in aqueous cloud chemistry 220
. Some WSOC components are emitted into the
air as primary particles (e.g., through biomass burning), and others are produced by reactions
in the gas and aqueous phases 221,222
. One major concern is related to the effects of WSOC on
the surface tension of particles and their ability to be activated into cloud droplets 223
.
However, a large fraction of WSOC remains uncharacterized, and substantial work has
focused on quantifying short-chain mono and di-carboxylic acids (CAs) and carbonyl and
dicarbonyl compounds 27,102
.
Soluble organic matter comprises small volatile molecules associated with larger
multifunctional structures containing a substantial fraction of hetero-atoms (e.g., N, S, and O),
such as HUmic LIke Substances (HULIS), and polyols, such as sugars, phenols, and
polyconjugated species 224,225
. Multiple functionalities, including hydroxyl, carboxyl and
carbonyl groups, are present in these molecules. Field measurements have revealed that a
large part of this WSOC remains uncharacterized (10% to 50%), despite the application of a
variety of analytical approaches.
Among these compounds, the presence of amino acids (AAs) belonging to proteinaceous
matter was highlighted in rain, fog waters and aerosols 145,226
. Their effect on the surface
tension properties of aerosols and their role as ice nuclei were studied, revealing that AAs
could affect the atmospheric water cycle 141,142,144,147
. Proteinaceous matter is injected into the
atmosphere by the production of sea salt aerosol when air bubbles burst at the ocean surface.
Proteinaceous matter can also be emitted in the atmosphere by the activity of bacteria and
phytoplankton or from the injection of organic film into the air at the sea surface 12,139,227
.
Over continental areas, proteinaceous matter is injected into the atmosphere as plant debris,
pollen, and algae, and this biological fraction has been frequently detected on aerosol particles
146. The first oxidation of the proteinaceous matter could occur on the aerosol particle, for
example, involving methionine and tryptophan, which are rapidly oxidized when exposed to
ozone and sunlight 228
.
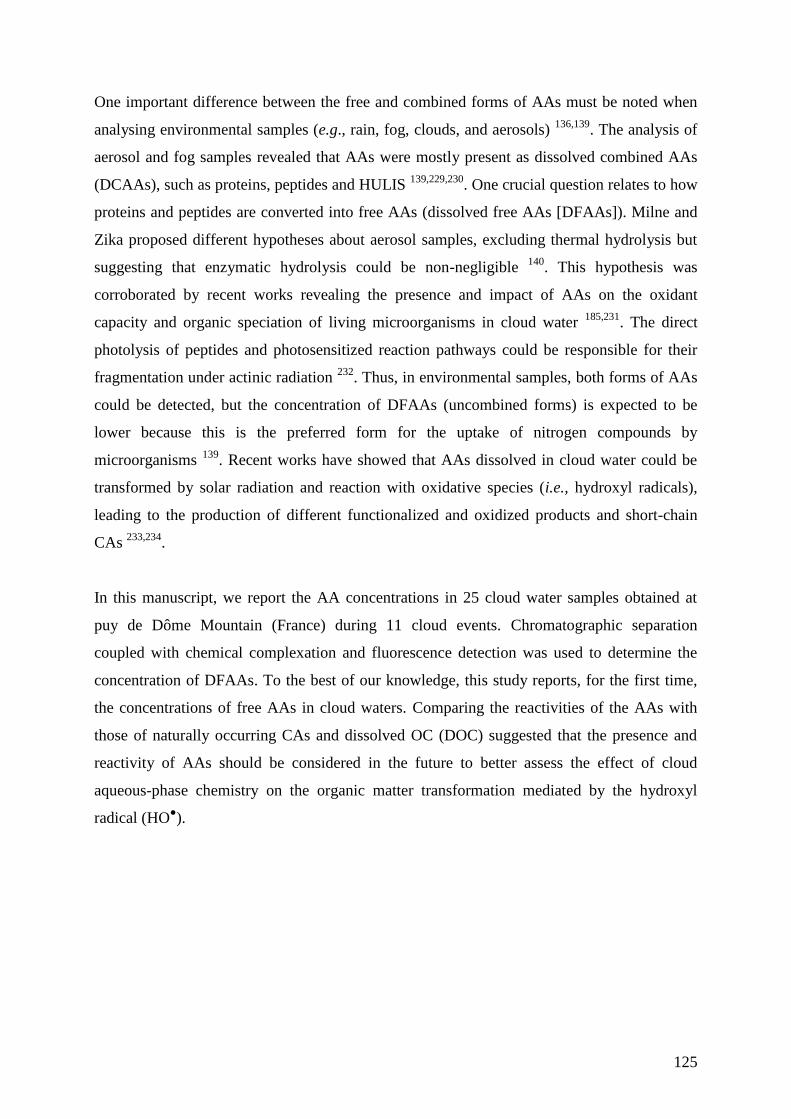
125
One important difference between the free and combined forms of AAs must be noted when
analysing environmental samples (e.g., rain, fog, clouds, and aerosols) 136,139
. The analysis of
aerosol and fog samples revealed that AAs were mostly present as dissolved combined AAs
(DCAAs), such as proteins, peptides and HULIS 139,229,230
. One crucial question relates to how
proteins and peptides are converted into free AAs (dissolved free AAs [DFAAs]). Milne and
Zika proposed different hypotheses about aerosol samples, excluding thermal hydrolysis but
suggesting that enzymatic hydrolysis could be non-negligible 140
. This hypothesis was
corroborated by recent works revealing the presence and impact of AAs on the oxidant
capacity and organic speciation of living microorganisms in cloud water 185,231
. The direct
photolysis of peptides and photosensitized reaction pathways could be responsible for their
fragmentation under actinic radiation 232
. Thus, in environmental samples, both forms of AAs
could be detected, but the concentration of DFAAs (uncombined forms) is expected to be
lower because this is the preferred form for the uptake of nitrogen compounds by
microorganisms 139
. Recent works have showed that AAs dissolved in cloud water could be
transformed by solar radiation and reaction with oxidative species (i.e., hydroxyl radicals),
leading to the production of different functionalized and oxidized products and short-chain
CAs 233,234
.
In this manuscript, we report the AA concentrations in 25 cloud water samples obtained at
puy de Dôme Mountain (France) during 11 cloud events. Chromatographic separation
coupled with chemical complexation and fluorescence detection was used to determine the
concentration of DFAAs. To the best of our knowledge, this study reports, for the first time,
the concentrations of free AAs in cloud waters. Comparing the reactivities of the AAs with
those of naturally occurring CAs and dissolved OC (DOC) suggested that the presence and
reactivity of AAs should be considered in the future to better assess the effect of cloud
aqueous-phase chemistry on the organic matter transformation mediated by the hydroxyl
radical (HO●).
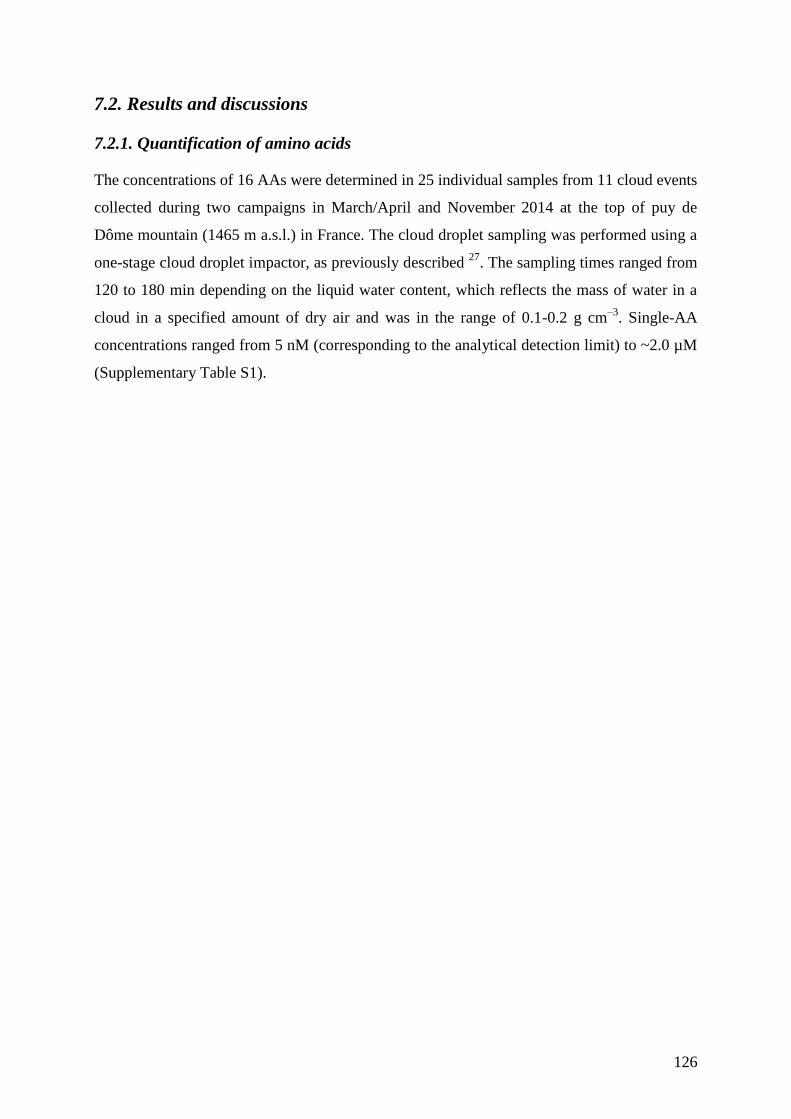
126
7.2. Results and discussions
7.2.1. Quantification of amino acids
The concentrations of 16 AAs were determined in 25 individual samples from 11 cloud events
collected during two campaigns in March/April and November 2014 at the top of puy de
Dôme mountain (1465 m a.s.l.) in France. The cloud droplet sampling was performed using a
one-stage cloud droplet impactor, as previously described 27
. The sampling times ranged from
120 to 180 min depending on the liquid water content, which reflects the mass of water in a
cloud in a specified amount of dry air and was in the range of 0.1-0.2 g cm‒3
. Single-AA
concentrations ranged from 5 nM (corresponding to the analytical detection limit) to ~2.0 µM
(Supplementary Table S1).

127
Cloud
event Sample
Sampling
period and time
(dd/mm/time)
Concentrations (nM)
ALA ARG ASP GLU GLY HIS ILE LEU LYS MET PHE SER THR TRP TYR VAL
I 1 22/03 7am-11pm 363 ± 27 31 ± 6 260 ± 21 55 ± 13 278 ± 43 41 ± 5 349 ± 8 93 ± 9 484 ± 43 261 ± 17 287 ± 47 736 ± 63 166 ± 16 686 ± 156 48 ± 5 44 ± 12
II 2 25/03 11am-1pm 271 ± 11 57 ± 8 223 ± 25 61 ± 20 197 ± 5 38 ± 6 312 ± 78 79 ± 7 82 ± 54 108 ± 26 385 ± 48 526 ± 44 150 ± 29 797 ± 189 30 ± 5 56 ± 14
III 3 26/03 8am-9am 170 ± 5 36 ± 5 130 ± 14 40 ± 12 176 ± 5 75 ± 20 1174 ± 327 111 ± 5 162 ± 81 84 ± 7 507 ± 169 268 ± 6 147 ± 9 1318 ± 367 21 ± 5 61 ± 5
IV 4 26/03 9am-11am 638 ± 50 27 ± 5 168 ± 19 86 ± 15 250 ± 8 84 ± 8 1142 ± 289 102 ± 7 129 ± 41 64 ± 17 564 ± 177 298 ± 18 202 ± 26 1497 ± 421 24 ± 5 67 ± 10
5 04/04 8pm-10pm 231 ± 5 54 ± 5 242 ± 16 85 ± 12 151 ± 5 41 ± 5 353 ± 12 108 ± 4 57 ± 32 93 ± 5 246 ± 38 319 ± 5 195 ± 20 671 ± 100 34 ± 5 56 ± 6
V
6 04/04 10pm-12pm 185 ± 5 35 ± 5 137 ± 16 45 ± 11 144 ± 10 49 ± 10 434 ± 5 99 ± 5 95 ± 28 31 ± 5 350 ± 23 276 ± 8 166 ± 29 898 ± 125 20 ± 5 31 ± 5
7 04-05/04 1pm-4am 106 ± 21 38 ± 5 87 ± 18 38 ± 12 300 ± 48 217 ± 98 278 ± 7 38 ± 5 80 ± 31 71 ± 12 226 ± 10 223 ± 5 123 ± 54 1378 ± 18 19 ± 5 58 ± 6
8 05/04 4am-7am 167 ± 5 40 ± 6 152 ± 22 44 ± 15 259 ± 5 71 ± 12 1569 ± 42 167 ± 5 148 ± 30 80 ± 11 254 ± 20 237 ± 6 72 ± 14 2034 ± 530 29 ± 5 72 ± 5
9 05/04 7am-10am 277 ± 15 22 ± 6 211 ± 11 63 ± 13 449 ± 21 80 ± 22 1881 ± 16 226 ± 5 282 ± 81 174 ± 91 481 ± 31 498 ± 26 447 ± 16 1758 ± 614 23 ± 4 63 ± 24
VI 10 04/11 11am-1pm 603 ± 11 310 ± 24 314 ± 15 182 ± 13 330 ± 15 134 ± 13 169 ± 5 173 ± 5 269 ± 85 169 ± 12 310 ± 51 639 ± 4 198 ± 12 307 ± 49 90 ± 5 152 ± 5
VII
11 05/11 4am-6pm 253 ± 12 165 ± 26 205 ± 18 59 ± 10 350 ± 14 129 ± 14 295 ± 21 111 ± 8 107 ± 65 119 ± 5 274 ± 50 629 ± 46 186 ± 32 534 ± 160 62 ± 5 91 ± 14
12 05/11 7am-9am 256 ± 5 153 ± 23 200 ± 13 83 ± 9 207 ± 5 88 ± 18 341 ± 10 91 ± 12 347 ± 85 97 ± 6 414 ± 6 330 ± 5 85 ± 6 771 ± 228 38 ± 5 62 ± 5
13 05/11 9am-12am 561 ± 12 132 ± 24 458 ± 46 71 ± 11 889 ± 76 196 ± 13 498 ± 5 242 ± 5 259 ± 112 213 ± 10 748 ± 43 1694 ± 83 512 ± 20 1095 ± 245 135 ± 5 111 ± 9
VIII
14 12/11 5pm-7pm 87 ± 6 339 ± 33 165 ± 14 47 ± 9 79 ± 10 92 ± 15 251 ± 8 66 ± 5 190 ± 78 131 ± 8 253 ± 20 126 ± 9 81 ± 5 684 ± 171 47 ± 5 37 ± 5
15 12/117pm-9pm 56 ± 6 210 ± 27 119 ± 11 35 ± 10 57 ± 12 62 ± 14 240 ± 10 61 ± 5 123 ± 64 102 ± 7 228 ± 41 95 ± 10 51 ± 5 568 ± 121 25 ± 5 33 ± 5
16 12/11 9pm-12pm 410 ± 5 430 ± 22 989 ± 58 361 ± 20 206 ± 5 271 ± 26 489 ± 23 294 ± 5 325 ± 103 172 ± 5 394 ± 46 484 ± 5 762 ± 9 491 ± 98 409 ± 6 243 ± 13
IX 17 14/11 5pm-7pm 118 ± 5 126 ± 24 147 ± 15 39 ± 10 139 ± 7 45 ± 9 171 ± 8 55 ± 5 96 ± 28 55 ± 5 100 ± 51 210 ± 11 77 ± 6 455 ± 11 30 ± 5 25 ± 5
X
18 17/11 4pm-6pm 79 ± 5 57 ± 6 109 ± 15 31 ± 11 66 ± 5 30 ± 5 275 ± 77 29 ± 5 67 ± 36 26 ± 5 66 ± 9 134 ± 5 72 ± 24 446 ± 93 22 ± 5 18 ± 5
19 17/11 7pm-9pm 79 ± 5 90 ± 7 128 ± 12 33 ± 11 73 ± 11 42 ± 5 200 ± 32 50 ± 5 162 ± 52 86 ± 21 159 ± 29 136 ± 11 59 ± 7 349 ± 12 27 ± 5 42 ± 16
20 17/11 9pm-12pm 71 ± 5 51 ± 5 91 ± 13 28 ± 9 60 ± 11 34 ± 12 191 ± 27 59 ± 5 100 ± 52 53 ± 5 209 ± 47 116 ± 9 66 ± 18 531 ± 101 25 ± 5 15 ± 5
21 18/11 6am-8am 143 ± 6 44 ± 5 127 ± 17 39 ± 11 113 ± 5 30 ± 5 199 ± 5 58 ± 5 183 ± 46 59 ± 5 155 ± 41 270 ± 16 145 ± 25 433 ± 93 32 ± 5 31 ± 7
22 18/11 5pm-7pm 188 ± 5 47 ± 6 188 ± 12 37 ± 10 173 ± 5 31 ± 5 218 ± 7 57 ± 5 196 ± 74 64 ± 7 182 ± 35 374 ± 7 157 ± 6 571 ± 98 33 ± 5 30 ± 5
23 18/11 7pm-9pm 88 ± 5 37 ± 5 106 ± 10 39 ± 13 55 ± 8 22 ± 5 197 ± 5 49 ± 5 110 ± 29 54 ± 5 193 ± 43 127 ± 6 51 ± 7 504 ± 93 22 ± 5 21 ± 5
XI 24 18/11 9pm-12pm 126 ± 5 43 ± 5 171 ± 17 38 ± 9 91 ± 5 25 ± 6 226 ± 5 55 ± 5 168 ± 52 79 ± 10 198 ± 26 205 ± 5 92 ± 31 614 ± 137 31 ± 5 31 ± 6
25 19/11 12pm-2am 226 ± 5 63 ± 5 176 ± 12 49 ± 11 220 ± 5 44 ± 6 201 ± 7 71 ± 5 173 ± 41 109 ± 7 201 ± 42 353 ± 10 216 ± 16 459 ± 34 35 ± 5 69 ± 5
Table S1: Amino acids concentrations in each cloud water sample. Number of cloud events is given in Roman. Errors are given considering 2 separates injections.
Figure 1 illustrates the concentrations of each AA in the cloud samples, showing that the
average concentrations of ALA, ILE, PHE, SER and TRP exceeded 0.25 µM (see Table 1 for
the AA abbreviations and relative concentrations). Specifically, ALA, PHE and SER were
categorized as hydrophilic and amphiphilic compounds and can alter the surface activity and
surface tension 235
, which are important properties involved in cloud drop activation 236,237
.
Compound Abbreviation Number
of
Carbons
Molecular
weight
(g mol−1
)
Average concentration
(nM)
Carbon average
concentration
(µg C L−1
)
Alanine ALA 3 89.0 230 ± 11 8.3 ± 0.4
Arginine ARG 6 174.2 106 ± 10 7.6 ± 0.7
Aspartate ASP 4 133.1 212 ± 11 10.2 ± 0.5
Glutamate GLU 5 147.1 68 ± 3 4.1 ± 0.2
Glycine GLY 2 75.1 212 ± 18 5.1 ± 0.4
Histidine HIS 6 155.2 79 ± 19 5.7 ± 1.4
Isoleucine ILE 6 131.2 466 ± 83 33.6 ± 6.0
Leucine LEU 6 131.2 102 ± 3 7.3 ± 0.2
Lysine LYS 6 146.2 176 ± 25 12.7 ± 1.8
Methionine MET 5 149.2 102 ± 18 6.1 ± 1.1
Phenylalanine PHE 9 165.2 295 ± 41 31.9 ± 4.4
Serine SER 3 105.1 372 ± 21 13.4 ± 0.8
Threonine THR 4 119.1 179 ± 12 8.6 ± 0.6
Tryptophan TRP 11 204.2 791 ± 157 104.4 ± 20.7
Tyrosine TYR 9 181.2 52 ± 1 5.6 ± 0.1
Valine VAL 5 117.2 61 ± 6 3.7 ± 0.4
Total 3504 268
Table 1: Average single-AA concentration (nM) and corresponding average carbon concentration expressed in µg C L‒1.
Values are presented with the standard deviation determined by analysing 25 samples.
129
Figure 1: Distribution of each AA in the cloud samples. The bottom and top lines of the box correspond to the 25th and 75th
percentiles, respectively. The middle line represents the median. The ends of the whiskers are the 10th and 90th percentiles,
and the filled circle is an outlier. The y-right scale shows the total AA concentration.
Simulations and laboratory experiments also confirmed the role of AAs as effective cloud
condensation nuclei (CCNi) 236,238
. The median values of the single-AA concentrations were
lower than 0.5 µM, and TRP’s concentration was the highest: 2 µM. The total AA
concentration, defined as the median value of the sum of the AA concentration in each
sample, ranged from 0.5 µM to 4 µM. The average concentrations of AA in cloud water
samples were lower than those measured in fog water by Zhang et al. 145
(2.6-99 µM, mean ±
1σ = 20 ± 27 µM) and in dew water samples in Germany by Scheller 239
(0.5-110 µM, mean =
22.5 µM). The concentrations found here were relatively similar to those reported in rainwater
by Gorzelska et al. 240
(≈ 0.4 µM) and Mopper and Zika 237
(6.5 µM). Fog and dew water were
expected to be more concentrated than cloud water because they are influenced relatively
strongly by local sources. The sampling procedure may also have contributed to this
difference because of the potential evaporation of the liquid sample. The high TRP
concentration cannot be directly correlated to the hydrolysis of proteinaceous matter.
However, TRP was recently demonstrated to be strongly correlated with the formation of
high-molecular-weight compounds with spectroscopic characteristics similar to those of
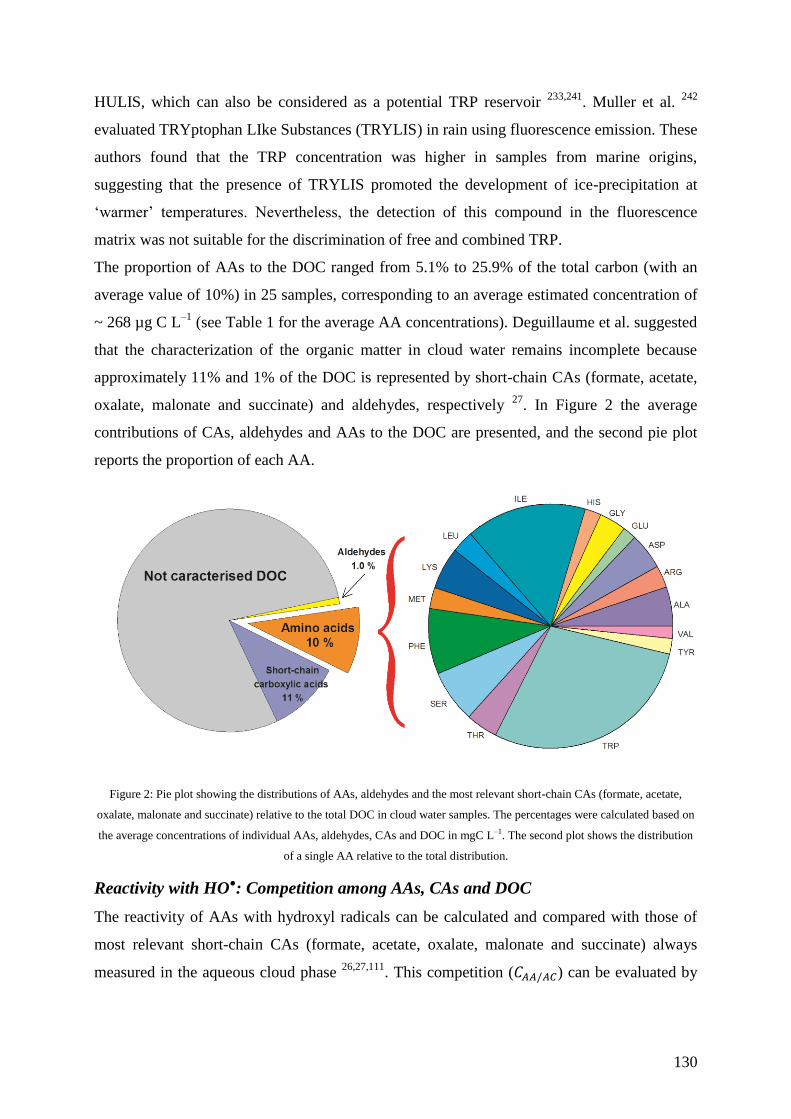
130
HULIS, which can also be considered as a potential TRP reservoir 233,241
. Muller et al. 242
evaluated TRYptophan LIke Substances (TRYLIS) in rain using fluorescence emission. These
authors found that the TRP concentration was higher in samples from marine origins,
suggesting that the presence of TRYLIS promoted the development of ice-precipitation at
‘warmer’ temperatures. Nevertheless, the detection of this compound in the fluorescence
matrix was not suitable for the discrimination of free and combined TRP.
The proportion of AAs to the DOC ranged from 5.1% to 25.9% of the total carbon (with an
average value of 10%) in 25 samples, corresponding to an average estimated concentration of
~ 268 µg C L‒1
(see Table 1 for the average AA concentrations). Deguillaume et al. suggested
that the characterization of the organic matter in cloud water remains incomplete because
approximately 11% and 1% of the DOC is represented by short-chain CAs (formate, acetate,
oxalate, malonate and succinate) and aldehydes, respectively 27
. In Figure 2 the average
contributions of CAs, aldehydes and AAs to the DOC are presented, and the second pie plot
reports the proportion of each AA.
Figure 2: Pie plot showing the distributions of AAs, aldehydes and the most relevant short-chain CAs (formate, acetate,
oxalate, malonate and succinate) relative to the total DOC in cloud water samples. The percentages were calculated based on
the average concentrations of individual AAs, aldehydes, CAs and DOC in mgC L‒1. The second plot shows the distribution
of a single AA relative to the total distribution.
Reactivity with HO●: Competition among AAs, CAs and DOC
The reactivity of AAs with hydroxyl radicals can be calculated and compared with those of
most relevant short-chain CAs (formate, acetate, oxalate, malonate and succinate) always
measured in the aqueous cloud phase 26,27,111
. This competition ( ) can be evaluated by
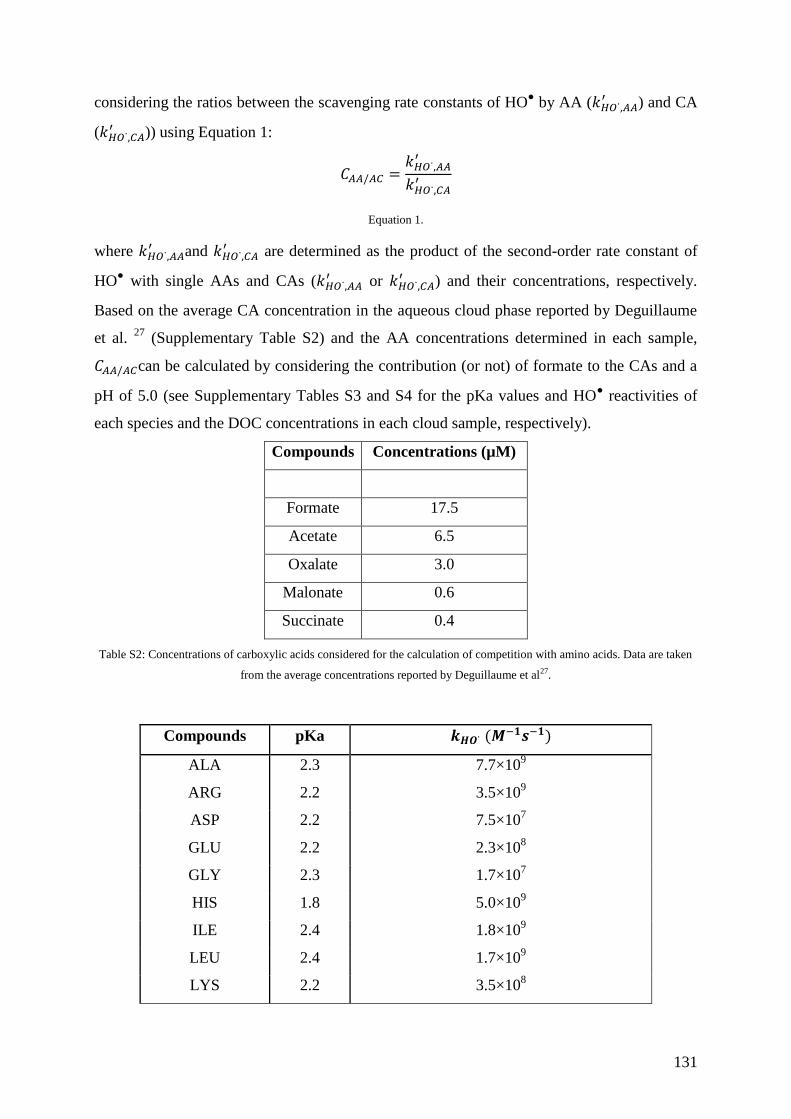
131
considering the ratios between the scavenging rate constants of HO● by AA (
) and CA
( )) using Equation 1:
Equation 1.
where and
are determined as the product of the second-order rate constant of
HO● with single AAs and CAs (
or ) and their concentrations, respectively.
Based on the average CA concentration in the aqueous cloud phase reported by Deguillaume
et al. 27
(Supplementary Table S2) and the AA concentrations determined in each sample,
can be calculated by considering the contribution (or not) of formate to the CAs and a
pH of 5.0 (see Supplementary Tables S3 and S4 for the pKa values and HO● reactivities of
each species and the DOC concentrations in each cloud sample, respectively).
Compounds Concentrations (µM)
Formate 17.5
Acetate 6.5
Oxalate 3.0
Malonate 0.6
Succinate 0.4
Table S2: Concentrations of carboxylic acids considered for the calculation of competition with amino acids. Data are taken
from the average concentrations reported by Deguillaume et al27.
Compounds pKa
ALA 2.3 7.7×10⁹
ARG 2.2 3.5×10⁹
ASP 2.2 7.5×10⁷
GLU 2.2 2.3×10⁸
GLY 2.3 1.7×10⁷
HIS 1.8 5.0×10⁹
ILE 2.4 1.8×10⁹
LEU 2.4 1.7×10⁹
LYS 2.2 3.5×10⁸

132
MET 2.3 8.5×10⁹
PHE 1.8 6.9×10⁹
SER 2.2 3.2×10⁸
THR 2.6 5.1×10⁸
TRP 2.4 1.3×10¹⁰
TYR 2.2 1.3×10¹⁰
VAL 2.3 8.5×10⁸
Formate 3.76 3.2×10⁹
(A–); 1.3×10
8 (HA)
Acetate 4.75 8.5×10⁷
(A–); 1.6×10
7 (HA)
Oxalate 1.25-4.23 7.7×10⁶ (A
2–); 4.7×10
7 (HA
–); 1.4×10
6 (H2A)
Succinate 4.23-5.64 5.0×10⁸ (A
2–); 5.0×10
8 (HA
–); 1.1×10
8 (H2A)
Malonate 2.8-5.6 3.0×10⁸ (A
2–); 6.0×10
7 (HA
–); 2.0×10
7 (H2A)
Table S3: Second order rate constant with HO● ( ) of amino acids and carboxylic acids (values are taken from
literature 76,133,243). For amino acids the value is given for the deprotonated form while, for carboxylic acids the values are
given for deprotonated and protonated forms.
Sample DOC (mgC L‒1
)
Without Formate With Formate
1 2.9 21.0 ± 3.3 0.34 ± 0.05
2 3.4 17.9 ± 4.1 0.29 ± 0.07
3 6.5 28.6 ± 8.1 0.46 ± 0.13
4 8.6 31.1 ± 8.6 0.50 ± 0.14
5 1.5 14.9 ± 2.1 0.24 ± 0.03
6 1.7 18.5 ± 2.3 0.30 ± 0.04
7 2.6 24.8 ± 1.4 0.40 ± 0.02
8 3.9 37.6 ± 8.1 0.60 ± 0.13
9 4.5 38.7 ± 10.6 0.62 ± 0.17
10 1.9 15.3 ± 2.2 0.25 ± 0.04
11 1.8 15.3 ± 3.6 0.25 ± 0.06
12 1.8 20.0 ± 4.3 0.32 ± 0.07
13 NM 31.6 ± 5.1 0.51 ± 0.08
14 2.3 17.8 ± 3.6 0.29 ± 0.06
133
15 2.7 14.0 ± 2.8 0.23 ± 0.05
16 1.7 26.5 ± 3.0 0.43 ± 0.05
17 2.2 10.4 ± 1.0 0.17 ± 0.02
18 2.2 9.1 ± 2.0 0.15 ± 0.03
19 1.0 10.0 ± 1.2 0.16 ± 0.02
20 1.2 11.8 ± 2.4 0.19 ± 0.04
21 1.0 11.0 ± 2.1 0.18 ± 0.03
22 2.3 13.4 ± 2.5 0.22 ± 0.04
23 1.8 11.2 ± 2.0 0.18 ± 0.03
24 1.9 13.9 ± 2.8 0.22 ± 0.04
25 2.2 12.4 ± 1.3 0.20 ± 0.02
Table S4: DOC value for each cloud water sample.
are used to determine the HO● scavenge
competition between amino acids (AA) and carboxylic acids (CA). NM: not measured
As shown in Figure 3, for the comparison without formate, the AA contribution was between
~9 and 40 times larger than that of the CAs. Interestingly, for all samples, the scavenging
abilities of the AAs were at least one order of magnitude higher than those of the short-chain
CAs. In terms of the proportion of formate among the short-chain CAs, the value
ranged from 0.15 to 0.5. These findings seem reasonable given the high reactivity of formate
with HO● (
). Nevertheless, at lower pH values, the
contribution of formate was expected to be relatively small; indeed, at pH 4.0, approximately
37% of formate exists as its acidic form (i.e., formic acid, pKa = 3.76), which is less reactive
towards HO● (
).
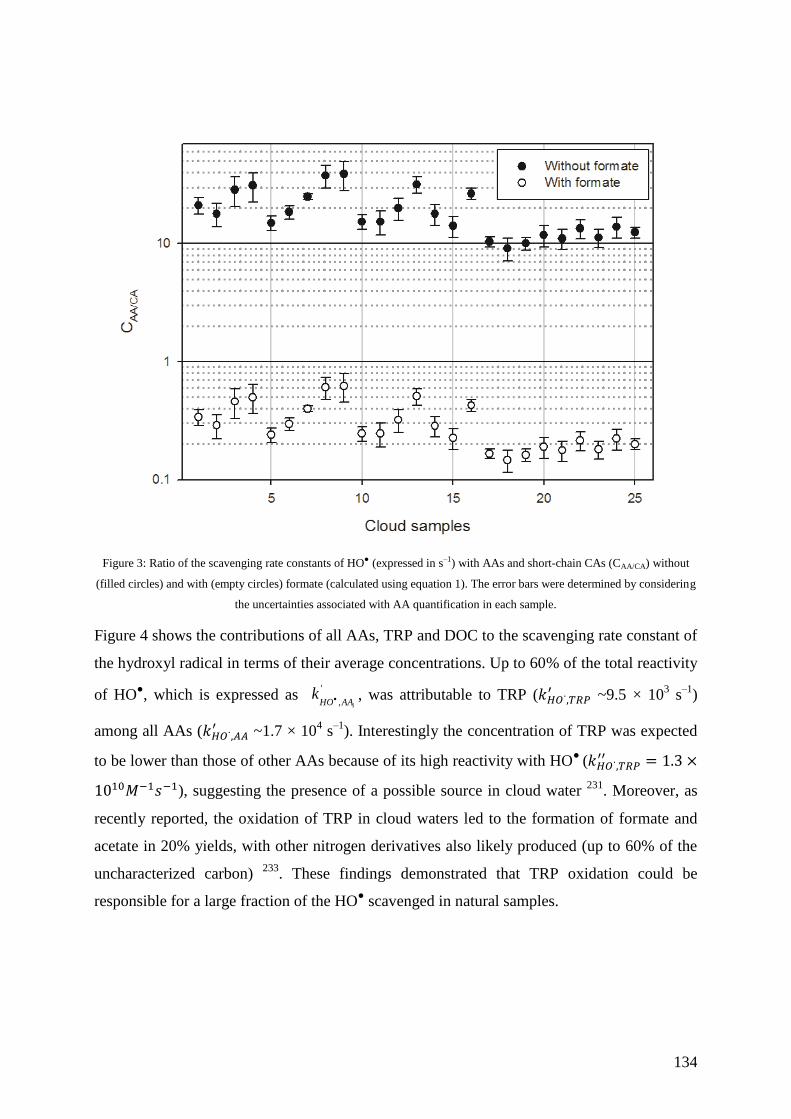
134
Figure 3: Ratio of the scavenging rate constants of HO● (expressed in s‒1) with AAs and short-chain CAs (CAA/CA) without
(filled circles) and with (empty circles) formate (calculated using equation 1). The error bars were determined by considering
the uncertainties associated with AA quantification in each sample.
Figure 4 shows the contributions of all AAs, TRP and DOC to the scavenging rate constant of
the hydroxyl radical in terms of their average concentrations. Up to 60% of the total reactivity
of HO●, which is expressed as
'
,
iHO AAk , was attributable to TRP (
~9.5 × 10³ s
‒1)
among all AAs ( ~1.7 × 10
4 s
‒1). Interestingly the concentration of TRP was expected
to be lower than those of other AAs because of its high reactivity with HO●
(
), suggesting the presence of a possible source in cloud water 231
. Moreover, as
recently reported, the oxidation of TRP in cloud waters led to the formation of formate and
acetate in 20% yields, with other nitrogen derivatives also likely produced (up to 60% of the
uncharacterized carbon) 233
. These findings demonstrated that TRP oxidation could be
responsible for a large fraction of the HO● scavenged in natural samples.
135
Figure 4: HO● scavenging rates (k') of AAs, TRP and DOC. These values were determined based on the average values of
,
and
using the concentrations and second-order rate constants
reported in Tables S1 and S3. The value was taken from Arakaki et al.103
Moreover, the relative contributions of AAs to the DOC’s reactivity with HO● can be
estimated using Equation 2:
Equation 2.
where and are the second-order rate constant between HO
● and DOC
estimated by Arakaki et al. 103
to be 3.8 × 10⁸ L (mol C)
‒1 s
‒1) and the concentration of DOC,
which varied from 1.0 mgC L‒1
to 8.6 mgC L‒1
, with an average of 2.65 mgC L‒1
(Supplementary Table S4). In our samples, was in the range 0.14–2.72 × 10
5 s
‒1.
These values are similar to those previously determined by Arakaki and Faust, who reported a
HO● scavenging rate range of 0.95 – 4.2 × 10
5 s
‒1 in 7 cloud water samples collected from
Whiteface Mountain 83
. Comparing the reactivity of hydroxyl radicals and AAs in each cloud
sample revealed that 10% to 43% of the total hydroxyl radicals scavenged by DOC were
attributable to the presence of AAs (see Supplementary Table S5 for the calculations
performed for each cloud sample).
Finally, AAs constituted a large fraction of the OC in cloud waters and play an important role
in the scavenging of generated hydroxyl radicals. The origins of these AAs remain somewhat

136
unknown, and their concentrations could not be explained by considering only particle
dissolution during cloud droplet formation. This observation suggests the presence of in-situ
sources (i.e., macromolecule oxidation or microorganism metabolism) that should be
investigated in the future. However, our findings implied that the oxidant capacity of this
medium (mainly related to HO● reactivity) was strongly influenced by the presence of AAs,
which can both act as sinks but modify the hydroxyl radical photogeneration processes via,
for example, iron (Fe2+
/Fe3+
) complexation in cloud water. Finally, we demonstrated that the
presence of AAs in cloud waters must be accounted for to facilitate predicting the cloud water
oxidizing capacity using multiphase chemistry models.
7.3. Experimental Materials and methods
7.3.1. AA analysis
Cloud water samples were filtered immediately after collection using a 0.45-μm
polytetrafluoroethylene (PTFE) filter to eliminate any microorganisms or particles. The
solutions were stored at 255 K in the dark before analysis. The derivatization adopted was
based on a previous method described by Ishida et al. 244
and adapted to the cloud water
analysis of primary AAs. Essentially, the -NH2 groups of primary AAs react with o-
phthalaldehyde (OPA) to form a fluorescent derivative in the presence of a thiol group (here,
mercaptopropionic acid [MPA]), which acts as a reaction catalyst. Secondary AAs were
previously reported to be unreactive with OPA. After reacting with OPA, the cloud water
samples were analysed by high-performance liquid chromatography (HPLC; Shimadzu
Nexera equipped with an autosampler/pretreatment unit (SIL-30AC). For this purpose, 30 µL
of MPA (7.7 mM in 0.1-M borate buffer), 15 µL of OPA (15.0 mM in 0.1-M borate buffer)
and 5 µL of sample were mixed in a vial, and after 35 min, which is the length of time
required for complete complexation, 20 µL of the solution was injected. Chemicals were
purchased from Sigma-Aldrich and all solutions were prepared using MilliQ water (≥ 18.2
MΩ cm). The derivatized compounds were separated with an HPLC column (Shimadzu
Shim-pack XR-ODS; 3.0 × 100 mm, Ø 2.2 µm, porous particles) and eluted at a flow rate of
0.7 mL min−1
using a gradient program with two eluents: eluent A (10-mM phosphate buffer,
pH 6.8) and eluent B (acetonitrile, methanol and water 45:45:10 v/v/v). The gradient elution
was as follows: initially, 10% of (B); a linear gradient to 75% (B) within 15 min; a faster
increase of (B) to 100% in 1 min (corresponding to 16 min of elution); and constant (B) for an
additional 5 min. A fluorescence detector (RF-20A XS) was used to detect AA-OPA

137
derivatives at an excitation wavelength (λex)/emission wavelength (λem) 350/450 nm (Figure 5
shows the HPLC chromatograms of samples 2 and 9).
The standard solution was prepared by diluting the AA-S-18 AA standard solution (Sigma
Aldrich) in 0.1 M HCl (Supplementary Figure S1). Cloud water samples were analysed
without further pre-treatment.
Figure 5: Example HPLC chromatograms obtained from samples 2 and 9.

138
Figure S1: Chromatogram obtained for a standard solution (10 µM of each amino acid injection volume of 1 µL).
Each analysis was evaluated and monitored in terms of the reproducibility of the peak
retention times and peak heights and the linearity of the calibration curve. The method’s limit
of detection (LOD) was estimated to be on the order of 5 nM with the injection of 20 µL of
sample. Blank experiments (MilliQ water subjected to the entire derivatization process) were
performed and confirmed that the AA concentration in water was always lower than the LOD.
In this work, only the DFAA concentration was quantified. The samples were subjected to
acidic hydrolysis according to the method described by Fountoulakis et al. 245
(1.5 mL of
sample combined with 6 M HCl in an ampoule and then heated at 100 °C for 60 min).
However, both the combined and dissolved AAs were hydrolysed, and the concentration was
below the LOD. No significant differences in the AA concentration were found using filtered
vs. unfiltered samples or before and after freezing.

139
Chapter 8
Motivation
It was previously reported in Chapter 3 that atmospheric water contains three principal
fluorophores, identified as similar to humic substances (HULIS), to tyrosine (TYLIS) and to
tryptophan (TRYLIS). These compounds are very important in the atmosphere because they
can act as cloud condensation nuclei due to their hygroscopicity and surface tension activity.
In addition they could represent a large fraction of dissolved organic matter but this parameter
is difficult to evaluate because their physico-chemical proprieties are poorly characterized.
In this work, presented as a published article in Atmospheric Environment, we performed
spectroscopic analysis of cloud water samples and we identified TRYLIS and HULIS and we
quantified tryptophan by HPLC-FLR. In addition we irradiated tryptophan in distilled water
and synthetic cloud water, mimicking cloud water composition, in the presence and in the
absence of hydroxyl radical inorganic sources, in order to investigate direct and indirect
photolysis of this compound.
The last part of this work reports the comparison between tryptophan and of dissolved organic
carbon in hydroxyl radical scavenging.

140
141
Tryptophan and tryptophan-like substances in cloud water: occurrence and
photochemical fate
Angelica Biancoa, b
, Monica Passanantia, b
, Laurent Deguillaumec, d
, Gilles Mailhota, b
,
Marcello Brigantea, b*
a Université Clermont Auvergne, Université Blaise Pascal, Institut de Chimie de Clermont-
Ferrand, BP 10448, F-63000 CLERMONT-FERRAND, FRANCE
b CNRS, UMR 6296, ICCF, F-63171 AUBIERE, FRANCE
c Université Clermont Auvergne, Université Blaise Pascal, OPGC, Laboratoire de
Météorologie Physique, BP 10448, F-63000 Clermont-Ferrand (France)
d CNRS, UMR 6016, LaMP/OPGC, BP80026, F-63177 Aubière
* Corresponding author E-mail: [email protected]
Atmos. Env., 137, 53 - 61, 2016
doi:10.1016/j.atmosenv.2016.04.034
Received 9 March 2016
Received in revised form 22 April 2016
Accepted 24 April 2016
Highlights
Tryptophan and tryptophan-like substances were quantified in cloud water sampled at the puy
de Dôme station.
The fate of tryptophan was investigated in the cloud aqueous phase under sun-simulated
conditions.
The hydroxyl radical-mediated transformation of tryptophan in cloud water can be considered
to be a source of carboxylic and N-functionalized compounds.
Keywords
cloud water; photochemistry; organic matter; amino acids
Abstract
This work investigates the occurrence and photochemical behaviour of tryptophan (TRP) in
the cloud aqueous phase. The concentrations of tryptophan, TRYptophan LIke Substances
142
(TRYLIS) and HUmic LIke Substances (HULIS) in real cloud water, collected between
October 2013 and November 2014 at the top of the puy de Dôme station, were determined
using the Excitation-Emission-Matrix (EEM) technique. The amount of free and complexed
tryptophan (TRP) up to 10‒7
M in cloud aqueous phase was quantified by HPLC-UV-
fluorescence analysis, and its photoreactivity under sun-simulated conditions was investigated
in synthetic water samples mimicking cloud aqueous phase compositions (oceanic and
continental origins). TRP undergoes direct photolysis, and its degradation is enhanced in the
presence of naturally occurring species able to photo-generate hydroxyl radicals (HO●). The
polychromatic quantum yield of TRP ( ) is estimated to be 8.37 × 10
‒4 between
290 and 340 nm, corresponding to the degradation rate ( ) of 1.29 × 10
‒11 M s
‒1 under our
irradiation conditions. The degradation is accelerated up to 3.65 × 10‒10
and 8.26 × 10‒10
M
s‒1
in synthetic oceanic and continental cloud water samples doped with 100 µM hydrogen
peroxide, respectively.
Hydroxyl radical-mediated transformation leads to the generation of different functionalized
and oxidized products, as well as small carboxylic acids, such as formate and acetate.
Moreover, fluorescent signals of irradiated solutions indicate the formation of HULIS.
8.1. Introduction
In the atmosphere, Primary Biological Aerosols (PBA) are ubiquitous and are comprised of
either biological particles, including dead or live cells, or cell fragments 246-248
. They are able
to nucleate cloud droplets and ice particles via physical processes 249-251
. PBA are mainly
made up of organic substances and contribute to aerosol masses (organic carbon fraction,
OC), and the organic fraction resulting from PBA components is made of biological
compounds such as proteins and/or amino acids. These amino compounds were found to
account for a significant fraction of fine particulate matter 252
. For example, 253
showed that
amino acids can represent between 1.6 and 14% of the PM2.5 mass at Davis in California.
Several sources can be responsible for the atmospheric amino acid content; over a continental
area, the biological compounds are produced by plants, pollen, algae, fungi and bacteria
spores 145,254-256
. Human activities can also lead to the input of amino acids into the
atmosphere. Zhang and Anastasio 145
identified livestock farming as the most important
source of amino acids over the Californian region. These compounds are also present on
anthropogenic coarse particles; soil and desert dust are also probably important sources of
amino acids 257
. Moreover, marine emissions can also influence the atmospheric
concentrations of amino acids 226
, as confirmed by Weydan and Preston 258
over the southern
143
Atlantic Ocean. Finally, amino acids can be ejected into the atmosphere by volcanoes 259
or by
biomass burning 254,260
.
Amino acids can influence the microstructure of aerosol particles and consequently their
water uptake, thus modifying cloud formation 261-263
. They can also act as ice-forming nuclei
due to their hygroscopicity 258
, leading to the formation of new particles in the atmosphere 264
.
These compounds belong to the Water-Soluble Organic Compounds (WSOC) and
consequently dissolve into the atmospheric aqueous phase. Several studies have reported
concentrations of amino acids in the condensed phase of aerosols 145,265-267
as well as in
rainwater and fog 268
. For example, the total amino acids have been evaluated to account for
13% of the Dissolved Organic Carbon (DOC) in fog waters and approximately 10% of the
WSOC in PM2.5 145
. Amino acids should also be present in cloud water and could contribute
to the dissolved organic content of cloud water that is currently still not well characterized
269,270.
In atmospheric water and aerosols, amino acids have been classified into the following
different categories: DFAA (Dissolved Free Amino Acids), which indicates the free amino
acids, and DCAA (Dissolved Combined Amino Acids), which indicates peptides, proteins
and free amino acids that are also constituents of humic and fulvic acids 139
. Another
classification distinguishes between FAC (Free Amino Compounds), which are comprised of
amino acids and alkyl amines, and CAC (Combined Amino Compounds) if they are free or
combined in proteins, peptides or HULIS substances 145
.
Amino acids, and more particularly TRP, present in atmospheric water can directly absorb sun
radiation or react with oxidants leading to the formation of inorganic and organic products
145,234,255,271,272. Their reactivity can therefore modify the chemical composition of dissolved
organic matter changing the chemical properties of water droplets and thus of aerosol
particles.
Currently, scarce data are present in the literature on the occurrence and fate of amino acids or
amino compounds in atmospheric water. To our knowledge, only Muller and co-workers 155
have previously reported the presence of TRYptophan LIke Substances (TRYLIS) in
rainwater. In our work, we quantified the TRP concentration and detected the presence of
TRYLIS and HUmic-LIke-Substances (HULIS) in cloud water samples collected at the puy
de Dôme mountain station (France). To assess the possible impact on the aqueous organic
chemical composition, TRP solutions are irradiated under sun-simulated conditions and
transformation products are characterized. Oxidation processes occur and lead to the
formation of carboxylic acids, as well as HULIS, which are followed during our experiments.

144
8.2. Materials and Methods
8.2.1 Sampling method
A total of 23 cloud samples were collected during two field campaigns in October and
November 2013 and in March and April 2014 at the top of puy de Dôme mountain (1465 m
a.s.l.) in France that belongs to the GAW (Global Atmosphere Watch) stations network.
Cloud samples are spread among the following three classes: marine, highly marine and
continental following the statistical analysis from Deguillaume et al. 27
.
The cloud droplet sampling was carried out by a one stage cloud droplet impactor. The
sampling times ranged from 120 to 180 minutes depending on the Liquid Water Content
(LWC), which was in the range of 0.1-0.2 g cm‒3
.
8.2.2 Chemical analysis
In order to characterize the main physicochemical properties of the sampled solution, the
following physico-chemical measurements are performed immediately after cloud sampling
and filtration: conductivity, redox potential, pH, UV-visible spectrum, and Excitation
Emission Matrix (EEM) are carried out in less than one hour, while ion chromatography,
quantification of the nitrite concentration and determination of the Total Organic Carbon
(TOC) were performed on frozen samples. Analyses on frozen samples (kept at 255 K) are
carried out in less than 48 hours after sampling. The results of the physico-chemical analysis
are reported in Bianco et al. 273
.
8.2.3 Irradiation experiments
One hundred millilitre aliquots of TRP solutions are irradiated in a photoreactor placed in a
cylindrical stainless steel container. Six fluorescent lamps (Philips TL D15W/05), whose
emission spectrum ranges from 290 to 500 nm, are separately placed along three different
axes, while the photoreactor, a Pyrex tube with a 2.6 cm internal diameter, is placed in the
centre of the setup. All of the experiments are carried out at 278 ± 2 K. An aliquot of the
solution (3 mL) is withdrawn from the reactor and used for analysis at fixed times. In Figure
1, the emission spectrum of the lamp recorded using fibre optics coupled with a CCD
spectrophotometer (Ocean Optics USD 2000+UV-VIS) is reported. The energy has been
normalized to the actinometry results using paranitroanisole (PNA)/pyridine actinometer 274
.
Over the UV region (wavelength range 290-400 nm), a total flux of 15.8 W m‒2
is measured.
The adopted intensity was close to the intensity measured between 290 and 400 nm at the top
of puy de Dôme mountain during a late-autumn cloudy day at 11:00 am (see Figure 1).
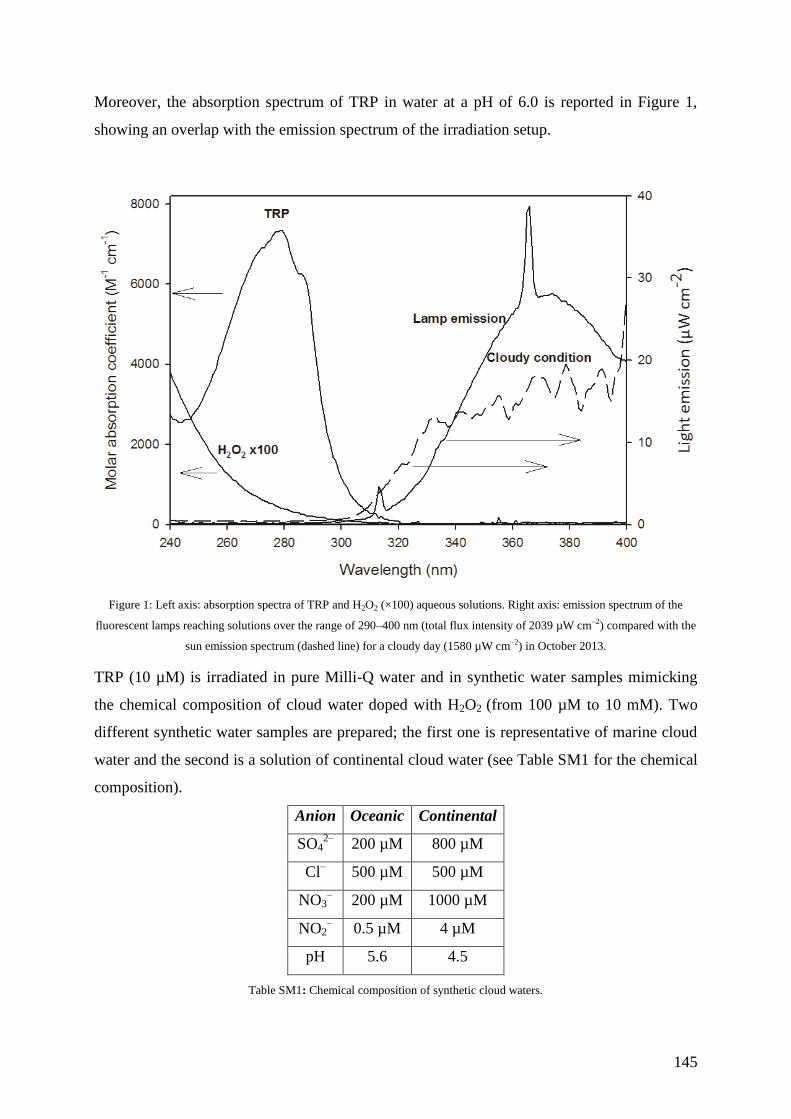
145
Moreover, the absorption spectrum of TRP in water at a pH of 6.0 is reported in Figure 1,
showing an overlap with the emission spectrum of the irradiation setup.
Figure 1: Left axis: absorption spectra of TRP and H2O2 (×100) aqueous solutions. Right axis: emission spectrum of the
fluorescent lamps reaching solutions over the range of 290–400 nm (total flux intensity of 2039 µW cm‒2) compared with the
sun emission spectrum (dashed line) for a cloudy day (1580 µW cm‒2) in October 2013.
TRP (10 µM) is irradiated in pure Milli-Q water and in synthetic water samples mimicking
the chemical composition of cloud water doped with H2O2 (from 100 µM to 10 mM). Two
different synthetic water samples are prepared; the first one is representative of marine cloud
water and the second is a solution of continental cloud water (see Table SM1 for the chemical
composition).
Anion Oceanic Continental
SO42‒
200 µM 800 µM
Cl‒ 500 µM 500 µM
NO3‒ 200 µM 1000 µM
NO2‒ 0.5 µM 4 µM
pH 5.6 4.5
Table SM1: Chemical composition of synthetic cloud waters.

146
8.2.4 Fluorescence characterization of samples
Fluorescence chromophores are identified in real cloud water samples on the basis of
previously reported data 160,275
using an Excitation Emission Matrix (EEM).
EEM are recorded with a Varian Cary Eclipse Fluorescence Spectrophotometer with 5 nm
intervals for excitation wavelengths from 200 to 500 nm and emission from 220 to 600 nm
with scan rate of 600 nm min‒1
and bandpass of 10 nm for both excitation and emission.
Standard solutions of TRP (between 1×10‒9
and 5×10‒7
M) were used to calibrate the
fluorescence signal. The following two signals are considered: the first one at λex 225 nm and
λem 330 nm and the second one at λex 275 nm and λem 340 nm. Many other compounds could
present fluorescence emission at λex 225 nm; for this reason, the second signal at λex/ λem
275/330 nm is considered for calibration. The limit of detection of this method is estimated to
be 5 × 10‒10
M according to the signal/noise ratio of the instrument.
8.2.5 Chromatographic analysis and kinetics
The TRP concentration was determined in cloud water samples and in synthetic solutions
prepared with Milli-Q water. Quantification was performed with a Waters Acquity Ultra
Performance LC equipped with Water Acquity Photo Diode Array detector and fluorescence
detector. Compound separation was performed using a Waters Acquity UPLC C18 column
(100 mm x 2.1 mm x 1.7 µm) and isocratic elution with 90% acetate buffer (2.5 mM) and
10% methanol. The eluent flow rate was 0.3 mL min‒1
, and the retention time of TRP is 2.7
min. Fluorescence detection is performed with λex = 225 nm and λem = 340 nm.
The initial rates of TRP degradation were determined by fitting the experimental data with the
pseudo-first order decay equation of the form , where
and are the concentrations of TRP at the initial time and time t, respectively, and
is the pseudo-first order decay constant. The TRP degradation rate ( , M s
‒1) could then
be obtained from .
The polychromatic degradation quantum yield ( ) is also calculated.
is defined as the ratio between the number of molecules transformed and the number of
photons absorbed in the same period of time (Equation 1):
Equation 1.
147
where is the TRP degradation rate (M s
‒1) and is the absorbed photon flux per unit of
surface and unit of time. The latter was calculated from Equation 2:
Equation 2.
where I0 is the incident photon flux, ε the molar absorption coefficient of TRP, d the optical
path length inside the cell and [TRP]0 is the initial TRP concentration.
8.2.6 Transformation product identification
With the objective of detecting the photoproducts, more concentrated TRP solutions (200
µM) are irradiated in the presence and absence of hydrogen peroxide (1 mM) and analysed by
LC-MS with ESI (Electro Spray Ionization) in the positive mode, followed by detection by
tandem mass spectrometry using a qTOF (quadrupole time of flight) detector. A resolution of
5000 was used for the TOF-MS analyses.
SM: Identification of tryptophan transformation products .
A LC-MS system (Agilent 1100 Series, binary pump) equipped with an ESI ion source (MSD VL) is used to
identify TRP transformation products. All transformation products are identified in the positive mode.
Electrospray mass spectra and tandem mass spectra are acquired with a Q-TOF (Micromass, Manchester, UK).
The capillary needle voltage is 3 kV, and the source temperature is maintained at 100°C. Nitrogen is used as the
nebulizer gas. The cone voltage is 35 V for MS. The resulting product ions are determined by the TOF analyser.
Data acquisition is carried out with a Micromass MassLynx 4.1 data system.
Water acidified with 0.1% of formic acid/methanol 50/50 is used as the solvent system to move the sample to the
electrospray source, and the signal is acquired for 5 minutes.
Ion Chromatography (IC) analyses are performed using a DIONEX DX-320 equipped with an
IonPac AG18 (guard column, 2 × 50 mm) and an IonPac AS18 (analytical column 2 × 250
mm). Elution is performed with a gradient of 10 mM potassium hydroxide to 20 mM in 30
minutes and with a prior stabilization for 5 minutes at 10 mM. The injection loop volume is
fixed to 750 µL. Under these conditions, the retention times of acetate and formate are of 6.5
and 7.3 min, respectively.
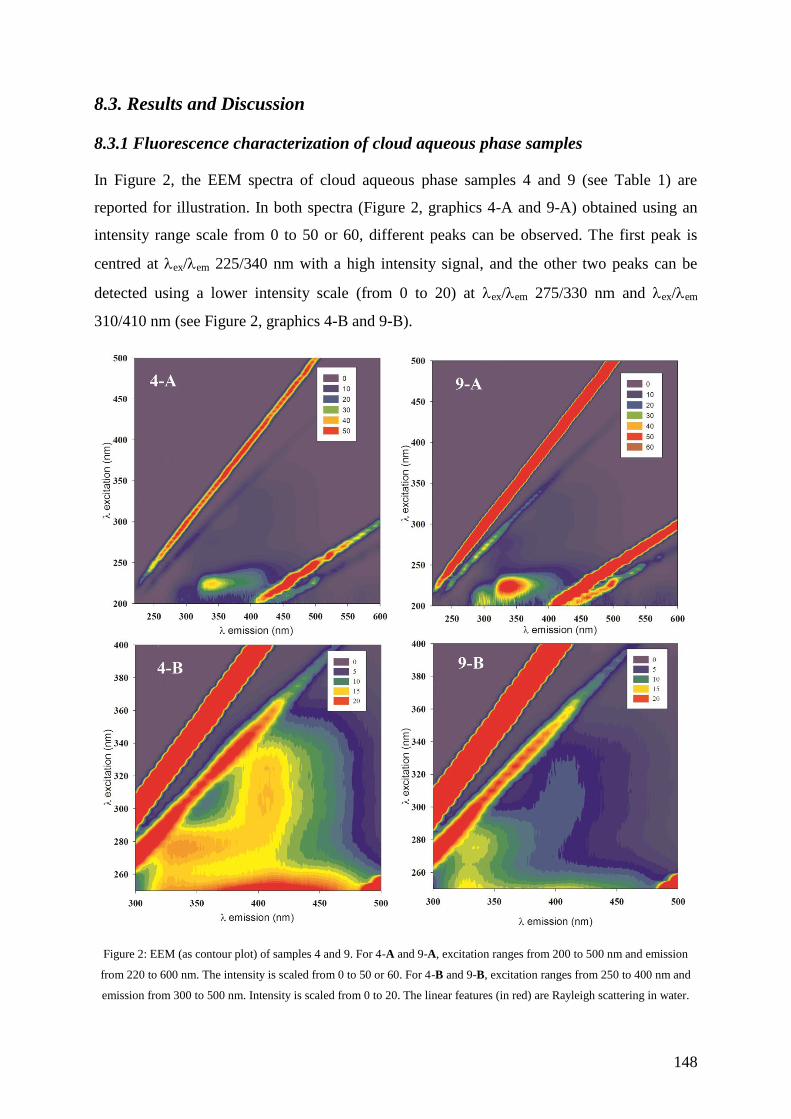
148
8.3. Results and Discussion
8.3.1 Fluorescence characterization of cloud aqueous phase samples
In Figure 2, the EEM spectra of cloud aqueous phase samples 4 and 9 (see Table 1) are
reported for illustration. In both spectra (Figure 2, graphics 4-A and 9-A) obtained using an
intensity range scale from 0 to 50 or 60, different peaks can be observed. The first peak is
centred at ex/em 225/340 nm with a high intensity signal, and the other two peaks can be
detected using a lower intensity scale (from 0 to 20) at ex/em 275/330 nm and ex/em
310/410 nm (see Figure 2, graphics 4-B and 9-B).
Figure 2: EEM (as contour plot) of samples 4 and 9. For 4-A and 9-A, excitation ranges from 200 to 500 nm and emission
from 220 to 600 nm. The intensity is scaled from 0 to 50 or 60. For 4-B and 9-B, excitation ranges from 250 to 400 nm and
emission from 300 to 500 nm. Intensity is scaled from 0 to 20. The linear features (in red) are Rayleigh scattering in water.
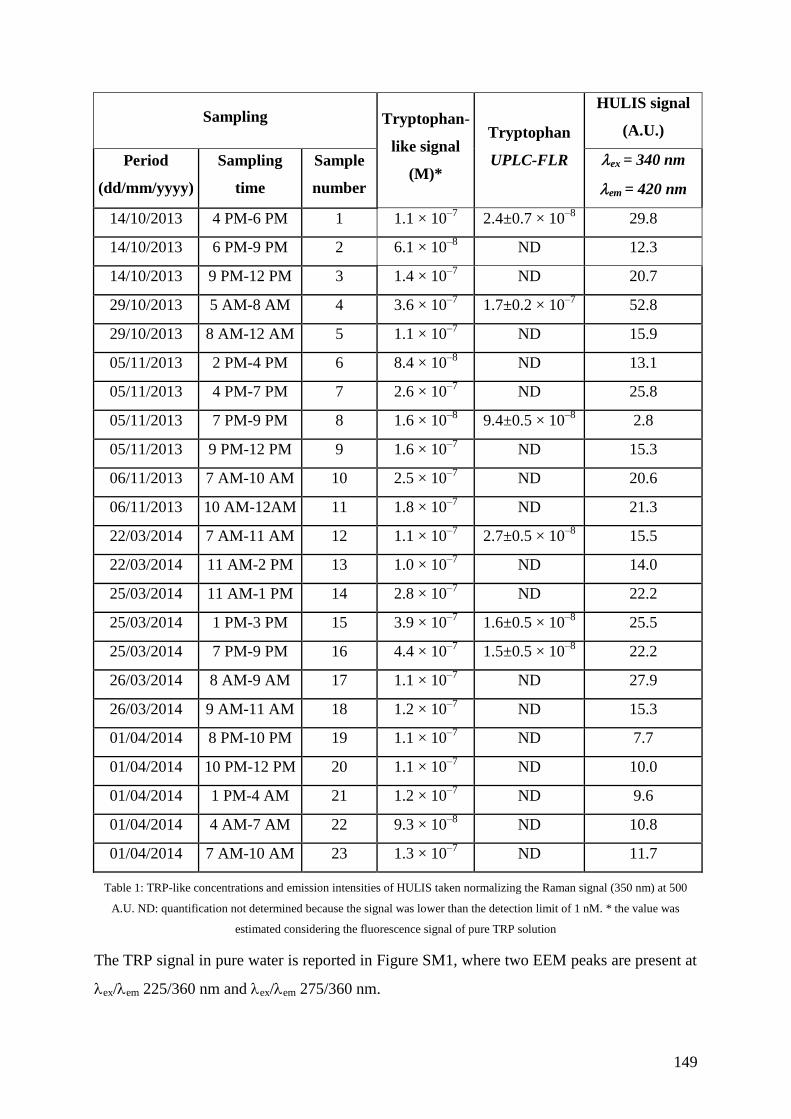
149
Sampling Tryptophan-
like signal
(M)*
Tryptophan
UPLC-FLR
HULIS signal
(A.U.)
Period
(dd/mm/yyyy)
Sampling
time
Sample
number
ex = 340 nm
em = 420 nm
14/10/2013 4 PM-6 PM 1 1.1 × 10‒7
2.4±0.7 × 10‒8
29.8
14/10/2013 6 PM-9 PM 2 6.1 × 10‒8
ND 12.3
14/10/2013 9 PM-12 PM 3 1.4 × 10‒7
ND 20.7
29/10/2013 5 AM-8 AM 4 3.6 × 10‒7
1.7±0.2 × 10‒7
52.8
29/10/2013 8 AM-12 AM 5 1.1 × 10‒7
ND 15.9
05/11/2013 2 PM-4 PM 6 8.4 × 10‒8
ND 13.1
05/11/2013 4 PM-7 PM 7 2.6 × 10‒7
ND 25.8
05/11/2013 7 PM-9 PM 8 1.6 × 10‒8
9.4±0.5 × 10‒8
2.8
05/11/2013 9 PM-12 PM 9 1.6 × 10‒7
ND 15.3
06/11/2013 7 AM-10 AM 10 2.5 × 10‒7
ND 20.6
06/11/2013 10 AM-12AM 11 1.8 × 10‒7
ND 21.3
22/03/2014 7 AM-11 AM 12 1.1 × 10‒7
2.7±0.5 × 10‒8
15.5
22/03/2014 11 AM-2 PM 13 1.0 × 10‒7
ND 14.0
25/03/2014 11 AM-1 PM 14 2.8 × 10‒7
ND 22.2
25/03/2014 1 PM-3 PM 15 3.9 × 10‒7
1.6±0.5 × 10‒8
25.5
25/03/2014 7 PM-9 PM 16 4.4 × 10‒7
1.5±0.5 × 10‒8
22.2
26/03/2014 8 AM-9 AM 17 1.1 × 10‒7
ND 27.9
26/03/2014 9 AM-11 AM 18 1.2 × 10‒7
ND 15.3
01/04/2014 8 PM-10 PM 19 1.1 × 10‒7
ND 7.7
01/04/2014 10 PM-12 PM 20 1.1 × 10‒7
ND 10.0
01/04/2014 1 PM-4 AM 21 1.2 × 10‒7
ND 9.6
01/04/2014 4 AM-7 AM 22 9.3 × 10‒8
ND 10.8
01/04/2014 7 AM-10 AM 23 1.3 × 10‒7
ND 11.7
Table 1: TRP-like concentrations and emission intensities of HULIS taken normalizing the Raman signal (350 nm) at 500
A.U. ND: quantification not determined because the signal was lower than the detection limit of 1 nM. * the value was
estimated considering the fluorescence signal of pure TRP solution
The TRP signal in pure water is reported in Figure SM1, where two EEM peaks are present at
ex/em 225/360 nm and ex/em 275/360 nm.
150
Figure SM1: 3D fluorescence excitation-emission matrix (as contour plot) of 10µM tryptophan M in milli-Q water.
Fluorescence intensity is scaled from 0 to 800 intensity units. The linear feature (in red) is the Raman signal.
Tryptophan-like substances are detected in our samples from the signal intensity at λex = 225
nm and λem = 330 nm (see Table 1). The fluorescence signal is normalized for the Raman
intensity peak at 350 nm, and the concentration is calculated with the calibration reported in
Figure SM2.

151
Figure SM2: Dependence of the intensity of fluorescence signal at λex/λem 225/340 and λex/λem 275/330 on TRP
concentration. Lines show linear fit of data and 95% confidence range.
TRYLIS signals in the cloud aqueous phase present a blue-shift emission as reported when
amino acids are combined. Fluorescence in the natural environment may be different to that
observed in the laboratory under controlled conditions using pure amino acid solutions.
Protein fluorescence resembles that of amino acids, as observed by Mayer et al. 275
. Most of
the intrinsic fluorescence emission is due to the excitation of TRP residues (quantum yield of
fluorescence of 0.20), with some emission due to tyrosine (TYR, with a fluorescence quantum
yield of 0.14) or phenylalanine (PHE, with a fluorescence quantum yield of 0.04). TRP
fluorescence emission is dominant over the weaker signals of TYR and PHE. The signal of
TRP is influenced by the proximity of other amino acid residues; the signal could be shifted
or quenched, especially by aspartate (ASP) or glutamate (GLU) residues 276
. Many authors
found a blue shift to shorter emission wavelengths due to differences in the behaviour of
amino acids in the different microenvironments present within proteins. Determann and co-
workers 277
detect TRP and TRYLIS in seawater with ex/em 230/350 nm, and Hudson and
co-workers 278
show that there are two signals with the first one at ex 225–237 nm and em
340–381 nm and the less intense second signal at ex/em 275/310 nm.
Many compounds could present a fluorescent signal with excitation at ex 225 nm, and the
concentration could be overestimated. For this reason, TRP is detected and quantified in EEM
from the signal intensity at ex/em 275/330 nm. The concentration is calculated with the

152
calibration reported in Figure SM2. The average concentration of TRP is 1.7 ± 1.1 × 10‒7
M.
The EEM method is not able to distinguish between free and combined TRP, so the reported
concentration values correspond to the total concentration of TRP. We quantified free TRP by
UPLC-FLR, and the data are shown in Table 1. The limit of detection (LOD), based on the
signal/noise ratio of the instrument, allows the determination of concentrations up to 5 × 10‒9
M. TRP is not detected in all of the samples; however, when TRP is detected, the average
concentration is 5.8 ± 6.2 × 10‒8
M. Considering that the concentration of the sum of free and
combined TRP is estimated to be approximately 1.7 × 10‒7
M, free TRP represents less than
37% of the total TRP in cloud water.
8.3.2 TRP photoreactivity
Different irradiation experiments using 10 µM TRP solutions were performed in Milli-Q and
synthetic cloud water doped with H2O2 (used as photochemical source of hydroxyl radicals) in
order to investigate the photoreactivity and fate of TRP. Under direct photolysis, TRP
undergoes slow degradation, with up to 5% disappearance after 4 h of irradiation, and the
polychromatic quantum yield between 290 and 350 nm ( ) is estimated to be 8.37
× 10‒4
.
In the presence of different H2O2 concentrations (100 µM, 1 mM and 10 mM), TRP
degradation rates increase from 1.29 × 10‒11
M s‒1
in pure water to 4.32 × 10‒10
M s‒1
in the
presence of H2O2 (10 mM) corresponding to a hydroxyl radical formation rate of
= 2.78
± 0.01 × 10‒8
M s‒1
(see Figure SM2). Under our experimental conditions, a fraction of the
photogenerated hydroxyl radicals also reacts with the source (H2O2). It is then possible to
quantify the fraction of hydroxyl radicals reacting with TRP for each experimental condition
considering the initial concentration of H2O2 in the solution and the related second order rate
constants with HO● (
= 2.7 × 10⁷ M
‒1 s
‒1)
76.
SM: HO● formation rate quantification.
The TRP degradation in the presence of hydroxyl radical photochemical sources (S) can be estimated to be the
sum of contributions of direct photolysis ( ) and hydroxyl radical mediated degradation (
):
Equation 1 SM.
Regarding the chemical reactions, the source can absorb the radiation leading to the formation of hydroxyl
radical (R1) that can reacts with TRP (R2) and the source (R3):
R1) S + hν HO•
(M s
‒1)
R2) HO• + TRP products1 =1.3×10
10 M
‒1 s
‒1 76
153
R3) HO• + S products2
In the presence of a high scavenger concentration, we can argue that
can be estimated to be equal to the
.
TRP degradation can be quantitatively attributed to the hydroxyl radical as shown in Figure 3,
where a linear correlation between
and the hydroxyl radical formed (making the radicals
available to react with TRP) is found.
Figure 3: Correlation between the initial transformation rate of TRP ( , M s‒1) and the formation rate of hydroxyl
radicals (
, M s‒1). The experiment was performed using an initial TRP concentration of 10 µM and varying the H2O2
concentration between 0 and 10 mM. The error bars represent the 3σ based on the linear fit of experimental data, and dashed
lines denote the 95% confidence of the linear fit.
In order to better understand the behaviour of TRP in cloud water, synthetic water samples are
prepared on the basis of the concentrations of anions found in real cloud water 273
(see Table
SM1). To maintain the same ratio between TRP and the inorganic compounds, the average
concentration of anions is multiplied by a factor 10.
Figure 4 reports the kinetic profiles for 10 µM TRP in the presence of Milli-Q and synthetic
cloud water samples doped with 100 µM of H2O2. In the oceanic and continental synthetic
water samples, TRP degradation is increased by approximately 3.5 and 10 times, respectively,
compared to the value with an initial concentration of 100 µM H2O2 in pure water. This trend
154
can be explained by considering the presence of nitrates (NO3‒) and nitrites (NO2
‒) that
provide an additional source of HO● 273
.
Figure 4: Irradiation time-dependent concentration of TRP (10 µM) under polychromatic irradiation in the presence of H2O2
(100 µM) in distilled water or in synthetic cloud water mimicking the continental or oceanic origin scenario. The pH was set
to 4.5 for the continental and 5.6 for the marine synthetic water samples, and the temperature was 288 ± 3 K.
8.3.3 Transformation mechanism
TRP (10 µM) is irradiated in the presence of 1 and 10 mM hydrogen peroxide. Irradiated
solutions are analysed by Ion Chromatography for quantification of the carboxylic acid
concentrations and by HPLC-fluorescence analysis for estimation of the fate of TRP (Figure
5). After 4 h of irradiation and with 1 mM H2O2, TRP disappearance leads to the formation of
0.74 µM acetate and 0.37 µM formate. In the presence of 10 mM hydrogen peroxide, a
complete disappearance of TRP is reported, leading to the formation of 2.0 µM acetate and
formate (Figure 5). After 4 h of irradiation, acetate and formate concentrations represent less
than 10% of the initial carbon concentration (mgC L‒1
), and thus the carbon gap indicates the
formation of other organic compounds.

155
Figure 5: Disappearance of TRP (10 µM) in the presence of H2O2 1 mM (A) and 10 mM (B) and the formation of formate
and acetate under polychromatic irradiation in water at a pH of approximately 5.5 and T = 288 ± 3 K.
A plausible interpretation of the photochemical and HO●-induced transformation of TRP is
reported in Figure 6. TRP can undergo the following two different transformation pathways:
hydroxyl radical addition (i and ii) and hydrogen abstraction (iii). Hydroxyl radical addition
(i) can lead to the formation of mono- and di-hydroxylate derivatives detected by LC-MS at
[M+H]+
= 221 m/z and at [M+H]
+ = 237 m/z, respectively. The hydroxylation of tryptophan
occurs in different positions of the molecule yielding several possible hydroxytryptophan
isomers. Unfortunately, in this case mass spectrometry does not allow understanding of which
position on the aromatic ring the hydroxyl functional group is located 279
.
156
Figure 6: Suggested transformation mechanism of TRP (red) in aqueous solution. In blue are the chemical structures
proposed for products detected by MS-ESI, and in violet are the carboxylic acids detected by ion chromatography.
The addition of HO● (ii) could take place on the pyrrolic ring, and the oxidative opening of
the five-membered ring can lead to N-formylkynurenine ([M+H]+
= 237 m/z). The oxidative
opening of the pyrrolic ring has been previously observed for other indole derivatives 280
.
Formation of N-formylkynurenine from TRP oxidation has been previously reported 279
. The
reactivity of molecular oxygen, after HO● addition, can occur as previously suggested for
several amino acids 255
and could lead to the formation of 2-hydroxyindoline-3-carbaldehyde
([M+H]+
= 164 m/z). This product could undergo further oxidation to form 2-oxoindoline-3-
carbaldehyde and 2-oxoindoline-3-carboxylic acid detected by MS at [M+H]+
= 162 m/z and
[M+H]+
= 178 m/z, respectively 281
.
Hydrogen abstraction (pathway iii) can take place on the α-carbon, and the generated radical
could be reduced to an unsaturated compound with a double bond between carbons in the α
and β positions. The chemical structures of these compounds have been previously proposed
279. The radical at the α-carbon could also undergo oxidative deamination (through imine) and

157
produce a ketoacid ([M+H]+
= 204 m/z) 255
. The hydrogen abstraction could also take place at
the β-carbon, leading to the formation of formic acid and a resonance-stabilized radical
intermediate; this intermediate could lead to an imine by H-transfer. The imine can be easily
hydrolysed in water to form an aldehyde detected by MS at [M+H]+
= 160 m/z. The further
oxidation of the aldehyde by a hydroxyl radical could lead to fragmentation of the carbon
chain with the production of acetic acid and formation of indole detected by ion
chromatography and mass spectrometry, respectively.
The formation of carboxylic acids by the photo-oxidation of amino acids has also been
suggested by Milne and Zika 255
. Tryptophan can absorb UV-light, and therefore, it can
undergo direct photolysis. We have shown that the photolysis process in the presence and
absence of hydrogen peroxide leads to the formation of the same products but with a
prevalence of hydroxylated products in the case of irradiation in the presence of hydrogen
peroxide. In the absence of photogenerated hydroxyl radicals, TRP could undergo
photoionization, as reported in the literature for TRP and other indole derivatives 271,282
,
leading to a radical intermediate. The decarboxylation of this intermediate followed by H-
transfer could produce the same imine produced in presence of HO● 282
. The radicals produced
during TRP irradiation could lead to a radical chain reaction with the formation of oxidized
products and small carboxylic acids, as observed with hydrogen peroxide.
High molecular weight products are also detected at [M+H]+ = 332 m/z and 334 m/z, with the
ion at 334 m/z most likely being an adduct of tryptophan with 3-methyl indole. The ion at
[M+H]+ = 332 m/z corresponds to the reduced form of this adduct with a double bond
between the α and β carbons of the tryptophan molecule 279
. Moreover, the product with a
mass of [M+H]+ = 409 m/z can be attributed to the dimer of TRP.
8.3.4 Fluorescence spectra of irradiated solutions
Figure 7 reports the EEM spectra of a 10 µM TRP solution before (Figure 7A) and after 4 h of
irradiation in the presence of 100 µM H2O2 (Figure 7B). In the presence of H2O2 under
irradiation, the intensity of the TRP signal decreases, while another signal appears at λex 330
nm and λem 425 nm (see the difference between 7B and 7A in Figure 7).
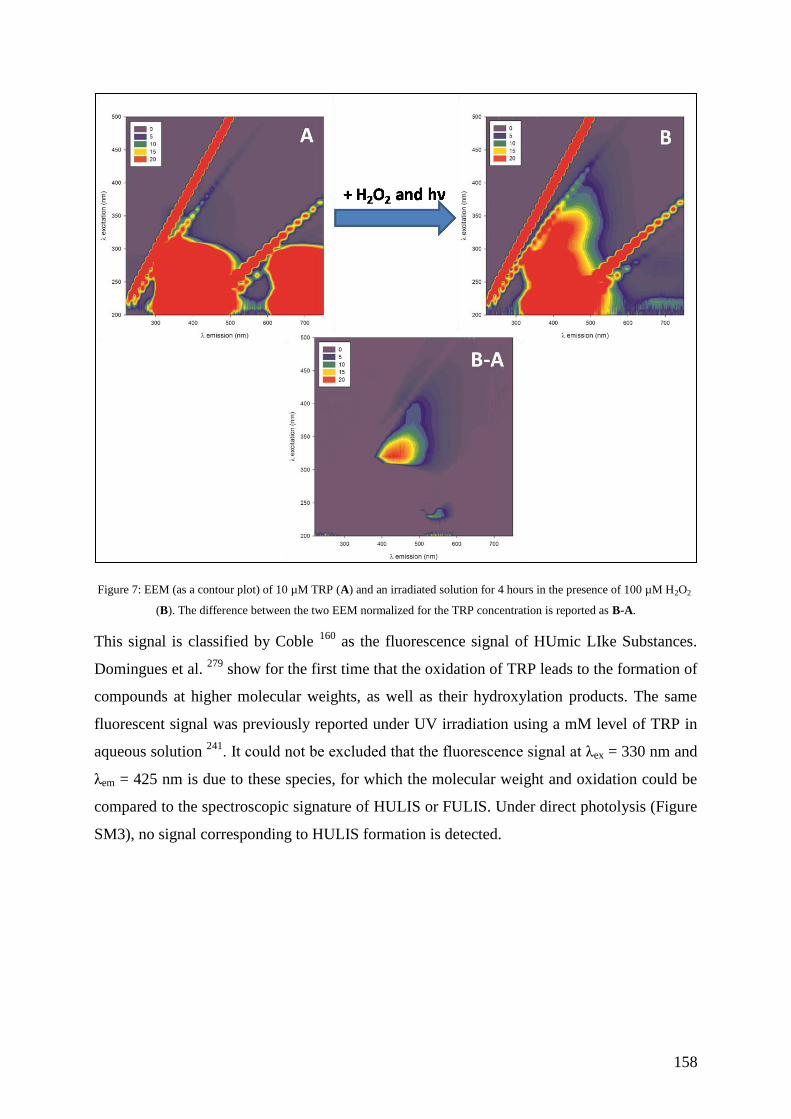
158
Figure 7: EEM (as a contour plot) of 10 µM TRP (A) and an irradiated solution for 4 hours in the presence of 100 µM H2O2
(B). The difference between the two EEM normalized for the TRP concentration is reported as B-A.
This signal is classified by Coble 160
as the fluorescence signal of HUmic LIke Substances.
Domingues et al. 279
show for the first time that the oxidation of TRP leads to the formation of
compounds at higher molecular weights, as well as their hydroxylation products. The same
fluorescent signal was previously reported under UV irradiation using a mM level of TRP in
aqueous solution 241
. It could not be excluded that the fluorescence signal at λex = 330 nm and
λem = 425 nm is due to these species, for which the molecular weight and oxidation could be
compared to the spectroscopic signature of HULIS or FULIS. Under direct photolysis (Figure
SM3), no signal corresponding to HULIS formation is detected.

159
Figure SM3: Excitation Emission Matrix of TRP 10 µM (A), of TRP 10 µM irradiated for 4h (B) and of TRP 10 µM
irradiated for 4h in the presence of H2O2 100 µM (C).
8.4 Atmospheric Relevance and Conclusions
TRP is found in cloud water from oceanic and continental origin, and its concentration is
estimated to be on the order of 10‒7
to 10‒8
M. Considering the second order rate constant
between TRP and HO●
( ) of 1.3 × 10¹⁰
M‒1
s‒1
76
, we can compare the hydroxyl
radical scavenging ability of TRP with those of other relevant short-chain carboxylic acids,
such as acetic, oxalic and succinic acids, that are generally found in concentrations of a few
micromolar in cloud water. This value can be correlated to the fraction of HO● scavenged by
DOC (Dissolved Organic Matter), considering the of 3.8 × 10⁸ L molC
‒1 s
‒1 103. The
HO●
inhibition ( , %) for TRP and selected carboxylic acids can be estimated for each
cloud water sample using Equation 3:
Equation 3.
where [A] and are the concentration and second order rate constant with HO●
of the
considered species A, and is determined considering the DOC
concentration of each sample (see Table SM2). In Figure 8, the contributions are reported
considering a pH of 6.0 and the relative concentrations of the acidic and basic forms of
species thereafter (see SM).
SM: HO● inhibition.
The HO● inhibition was determined considering the chemical species speciation calculated at a pH of 6.0 as
reported in Table SM2 and following the second order rate constant with the hydroxyl radical.
The reaction rate constants with HO● are 1.6 ×10
7 M
−1 s
−1 (acetic acid), 8.5 ×10
7 M
−1 s
−1 (acetate), 4.7×10
7 M
−1
s−1
(oxalate mono-anion), 7.7 ×10⁶ M
−1 s
−1 (oxalate di-anion), 1.1 ×10
8 M
−1 s
−1 (succinic acid), 5.0 ×10
8 M
−1 s
−1
(succinate mono-anion), 5.0 × 10⁸ M
−1 s
−1 (succinate di-anion) , 3.8 × 10
8 L molC
−1 s
−1 (DOC)
76,103,133,243.

160
Acetic acid 4.35×10‒7
1.06×10‒6
4.66×10‒7
6.67×10‒7
6.99×10‒7
6.25×10‒7
* Average value
Table SM2: Concentration for each acidic and basic form determined at a pH of 6.0. Values are reported by Bianco et al. 273.
Figure 8: HO● inhibition ( , %) by TRP, acetate, oxalate and succinate. Values are estimated considering a pH of 6.0. The
relative concentration of each species is reported in the SM.
Sample
Chemical
1 4 8 12 15 16
Concentration (M)
Acetate 8.27×10‒6
2.01×10‒5
8.84×10‒6
1.27×10‒5
1.33×10‒5
1.19×10‒5
Oxalate (mono-anion) 9.00×10‒8
5.34×10‒8
3.40×10‒8
8.26×10‒8
6.62×10‒8
7.50×10‒8
Oxalate (di-anion) 4.41×10‒6
2.62×10‒6
1.67×10‒6
4.05×10‒6
3.24×10‒6
3.68×10‒6
Succinic acid 3.32×10‒8
4.18×10‒8
3.04×10‒8
1.40×10‒9
1.60×10‒9
1.90×10‒9
Succinate (mono-
anion) 9.96×10
‒7 1.25×10
‒6 9.12×10
‒7 4.20×10
‒8 4.80×10
‒8 5.70×10
‒8
Succinate (di-anion) 2.29×10‒6
2.88×10‒6
2.10×10‒6
9.66×10‒8
1.10×10‒7
1.31×10‒7
TOC (mgC L‒1
) 5.0* 2.8 0.9 2.9 6.0 8.7

161
The contribution of TRP is between 0.07 and 0.38% for samples n° 1, 12, 15 and 16, while
the concentrations for cloud water samples n° 4 and 8 rise up to 2.50 and 4.55%, respectively.
Moreover, considering that TRP is only one of the essential amino acids, we can argue that
investigating the concentrations of amino acids and their transformation is crucial to better
assess the organic matter composition and hydroxyl radical reactivity in cloud water.
In this work, we demonstrated that TRP reactivity with hydroxyl radicals occurs following
different reactivity pathways: 1) formation of hydroxylated products, 2) formation oligomeric
compounds with similar fluorescence characteristics to those reported for HULIS, 3)
formation of decarboxylated compounds such as N-formylkynurenine and 4) formation of
short chain carboxylic acids. The phototransformation of TRP (direct and HO•-mediated) in
cloud water can be considered to be a new source of short chain organic compounds and
HULIS. These results highlight the importance of the complementary approach (i.e.,
characterization and reactivity assessment) in improving the understanding of photochemical
and hydroxyl radical-driven transformations in this medium. Certainly, the real impact of
proteinogenic amino acid transformation depends on their concentrations and on the oxidative
properties of the cloud aqueous phase.

162
163
Chapter 9
Motivation
During my PhD I had the opportunity to participate to the redaction of an invited divulgatif
publication concerning the work of our research group that is composed by three main teams,
working in chemistry/photochemistry, microbiology and physics/microphysics. The following
chapter is an invited review in french that will be soon published on Revue belge des
questions scientifiques. It shows how the reactivity in cloud water is influenced not only by
chemical and photochemical processes but also by microbial activity, which has an impact on
the organic composition and on radical activity as sinks of radicals and of their precursors.
For this review, my main contribution focuses on the description of the sampling site and of
the analysis performed on cloud water. In addition I summarized our knowledge concerning
cloud water oxidant capacity and composition.
In this chapter it is reported how microorganisms interact with chemical and photochemical
processes and it is introduced a new research work on the combined impact of
microorganisms and light on accurately characterized chemical compounds such as iron,
carboxylic acids and amino acids.
This work clearly demonstrates that, for a better understanding of cloud water composition
and reactivity, we need to investigate the interactions between chemical, photochemical,
microphysical and microbiological processes and not only their contribution.

164

165
Les microorganismes: acteurs oubliés de la chimie des nuages. Compétition
avec les voies de phototransformation
Anne-Marie DELORT, Angelica BIANCO et Marcello BRIGANTE
Université Clermont Auvergne, Université Blaise Pascal, Institut de Chimie de Clermont-
Ferrand, BP 10448, F-63000 CLERMONT-FERRAND, FRANCE
Résumé
On sait depuis longtemps que la phase aqueuse des nuages est le siège de réactions
radicalaires et notamment photochimiques de tels que le peroxyde d'hydrogène, les nitrates et
les complexes de Fer. Ces précurseurs peuvent former des espèces très réactives telles que les
radicaux hydroxyles, espèces chimiques considérées comme oxydants majeurs et transformer
la matière organique dans la goutte d'eau nuageuse.
Cependant la découverte très récente de la présence de microorganismes métaboliquement
actifs dans les nuages implique qu’ils sont capables d’utiliser des composés carbonés présents
dans ce milieu comme nutriment ou interagir avec des espèces oxydantes. Les
microorganismes peuvent donc être considérés comme des biocatalyseurs, acteurs potentiels
de la chimie atmosphérique en compétition avec la chimie radicalaire.
Le travail de notre groupe au sein de l'Institut de Chimie de Clermont-Ferrand porte sur une
meilleure compréhension et l'évaluation du rôle joué par les microorganismes dans le chimie
nuageuse qui reste très complexe.
9.1. Introduction
9.1.1. La chimie des nuages
Les nuages ont toujours suscité la curiosité de l’homme et ont étés objet de définitions et
classifications à partir d’Aristote (IV siècle a J.-C.). Cependant, l’étude scientifique au sens
moderne a commencée seulement au début du XX siècle pour faire face à des situations de
crise, comme les pluies acides, l’effet de serre ou le trou dans la couche d’ozone. Dans un
premier temps, les efforts se sont concentrés principalement sur la photochimie et plus
généralement la chimie en phase gazeuse. Pourtant, étant donné leur capacité à capter et
dissoudre une grande partie des composés gazeux et particulaires, les gouttelettes des nuages

166
sont un des milieux les plus concentrés et réactifs de l’atmosphère et donc un lieu privilégié
d’interaction entre les constituants les plus divers. La gouttelette de nuage peut être
considérée comme un réacteur chimique extrêmement efficace où ont lieu des nombreuses
réactions chimiques 270
. Toutefois, le rôle central des nuages dans la composition chimique de
l’atmosphère planétaire est encore mal connu et reste une des principales incertitudes dans les
modèles de prévision du climat et plus particulièrement de l’estimation du réchauffement
climatique terrestre 283
.
Dans ce contexte, les chercheurs de l’Institut de Chimie de Clermont-Ferrand (ICCF)
travaillent depuis plus de 10 ans sur les phénomènes photochimiques et microbiologiques
présents dans la phase aqueuse des nuages, le but étant d’évaluer les impacts sur la
composition chimique et sur la capacité oxydante de l’atmosphère pour répondre aux
problématiques liées plus généralement à la pollution atmosphérique et aux changements
climatiques. Les études sont menées parallèlement en laboratoire mais aussi sur site à travers
des prélèvements de la phase aqueuse des nuages effectués au sommet du puy de Dôme. Ce
site, qui reste unique en France, est géré par l’Observatoire de Physique du Globe de
Clermont-Ferrand (OPGC) et il a reçu le label Global GAW (Global Atmosphere Watch).
(Figure 1)
Figure 1 : Le site de prélèvement d’eau nuageuse du puy de Dôme.
Photo P. Amato.
Depuis 2001, la phase aqueuse des nuages prélevée au sommet du puy de Dôme est analysée
et caractérisée par la mesure de paramètres physico-chimiques (pH, conductivité, potentiel
d’oxydoréduction) et de la concentration d’espèces inorganiques et organiques ainsi que du
carbone organique total (TOC) 27
. Les prélèvements sont effectués avec un impacteur à nuage
qui permet d’aspirer les gouttelettes de nuage qui sont collectées dans un réservoir, en
collaboration avec les chercheurs du Laboratoire de Météorologie Physique.
167
L’eau du nuage présente souvent un caractère acide (> 3,8), mais les valeurs de pH peuvent
aller jusqu’à 7,6. Parmi les composés inorganiques les plus abondants on peut citer les anions
nitrate (NO3–), chlorure (Cl
–) et sulfate (SO4
2–) et les cations ammonium (NH4
+) et sodium
(Na+) dont les concentrations peuvent dépasser les 100 µM. Les composés organiques sont
quantifiés par mesure de la concentration en carbone organique total (COT). La valeur de
COT est typiquement de quelque mg de carbone par litre (mgC L‒1
), mais peut atteindre 25
mgC L‒1
pour des nuages très pollués. En termes de spéciation, les composés organiques
majoritaires qui ont été identifiés sont des acides carboxyliques (acétique, formique, oxalique,
succinique et malonique, du plus concentré au moins concentré) 27
, et, à un degré moindre en
termes de concentration, des aldéhydes (principalement la formaldéhyde) 284
. Cependant, il est
important de noter que la contribution des acides carboxyliques et des aldéhydes représente
seulement en moyenne environ 11% et un peu plus de 1% du carbone organique total
respectivement. Le constat que plus de 80% du carbone organique n'est pas identifié montre la
complexité de la phase aqueuse des nuages et donc la présence d’une multitude d’autres
composés organiques non identifiés de manière récurrente. Tous ces composés qui peuvent
conduire à la formation d’acides carboxyliques par oxydation, restent difficiles à identifier à
cause de leur nombre important, des très faibles concentrations et des différentes techniques
analytiques permettant leur détection.
La gouttelette d’eau de nuage est exposée à la radiation solaire qui peut induire des réactions
photochimiques sur les composées organiques et inorganiques (photolyse) et donc conduire à
leur transformation. La photolyse des nitrates (NO3‒)
285 et du peroxyde d’hydrogène (H2O2)
286 mène, par exemple, à la formation du radical hydroxyle (HO
•), qui est appelé le détergent
de l'atmosphère à cause de sa forte réactivité. Le radical hydroxyle est majoritairement
impliqué dans la photochimie de la phase aqueuse atmosphérique et peut donc être considéré
comme le principal oxydant responsable de la transformation de la matière organique présente
dans ce milieu 103,287
.
9.1.2. Les microorganismes des nuages
Pendant très longtemps seuls des processus chimiques et physiques ont été considérés dans les
nuages, ce n’est que récemment qu’il a été mis en évidence la présence de microorganismes
(bactéries, champignons, levures, etc.) et leur rôle potentiel comme acteurs de la chimie
atmosphérique 288
. Ces microorganismes sont aérosolisés à partir de la surface de la Terre par
des mécanismes de «bubbling» (formation des embruns marins), l’action du vent (poussières)
ou de la pluie (surface des feuilles). Comme toute particule de quelques microns, les

168
microorganismes peuvent condenser de l’eau à leur surface en tant que CCN (Cloud
Condensation Nuclei) et être ainsi intégrés aux nuages sous forme de gouttelettes. Ils peuvent
ensuite retourner sur Terre après un temps de résidence de 2 a 10 jours dans l’atmosphère
notamment lors de précipitations 289
. La concentration microbienne dans les nuages est de
l’ordre de 105 cellules mL
‒1 pour les bactéries et 10
4 cellules mL
‒1 pour les levures et
champignons 290-292
. La biodiversité de cette communauté microbienne reste encore assez
méconnue, ceci est principalement dû à la difficulté d’échantillonner des nuages et aussi au
fait que la plupart des études sont basées sur des méthodes culturales. Les genres bactériens
cultivables majeurs sont les genres Pseudomonas (-Proteobacteria), Sphingomonas -
Proteobacteria), Streptomyces (Actinobacteria), Rhodococcus (Actinobacteria), et Bacillus
(Firmicutes), et pour les levures ce sont les genres Dioszegia (Basidimycota), Udeniomyces
(Basidimycota) et Crytococcus (Basidimycota) 292-294
. Des analyses moléculaires récentes
confirment la présence de ces genres tout en rapportant la présence d’autres microorganismes
d’intérêt tels que des Cyanobacteria, et des classes bactériennes comme les
Methylobacteriacae et Oxalobacteraceae 295-297
.
Le milieu nuage semble a priori un environnement particulièrement hostile pour les
microorganismes, d’une part parce que ce milieu est très instable d’un point de vue
microphysique, d’autre part parce qu’il contient des molécules toxiques. Cependant les
microorganismes ont développé des stratégies pour se protéger des stress atmosphériques dans
les zones troposphériques: i) la présence de pigments (près de 50% des souches isolées des
nuages sont pigmentées), 292
ii) la synthèse de polymères, dits EPS (ExoPolymeric
Substances, 298
iii) la présence de spores (Bacillus, levures, champignons). Récemment, Joly
et al. 299
ont mesuré le taux de survie de microorganismes modèles isolés de nuages, exposés à
différents stress: la présence d’H2O2 et l’exposition aux rayons UV (stress oxydant); des
cycles d’évaporation-condensation (choc osmotique), de congélation–décongélation (stress
multiple combinant choc au froid/ stress oxydant/ choc osmotique). Les résultats montrent que
le stress le plus important est celui du cycle congélation–décongélation et qu’il est souche
dépendant, la réponse aux chocs osmotiques est relativement efficace, les oxydants et la
lumière ont très peu d’effet sur les microorganismes.
La capacité des microorganismes à survivre dans le milieu nuage fait que ceux-ci sont
métaboliquement actifs. Sattler et al. 300
ont été les premiers à montrer que les
microorganismes pouvaient intégrer des molécules marquées au 3H dans des gouttelettes de
nuage en surfusion. Amato et al. 301
ont démontré que les microorganismes présents dans de
l’eau de nuage incubée en laboratoire pouvaient se développer en utilisant des substrats
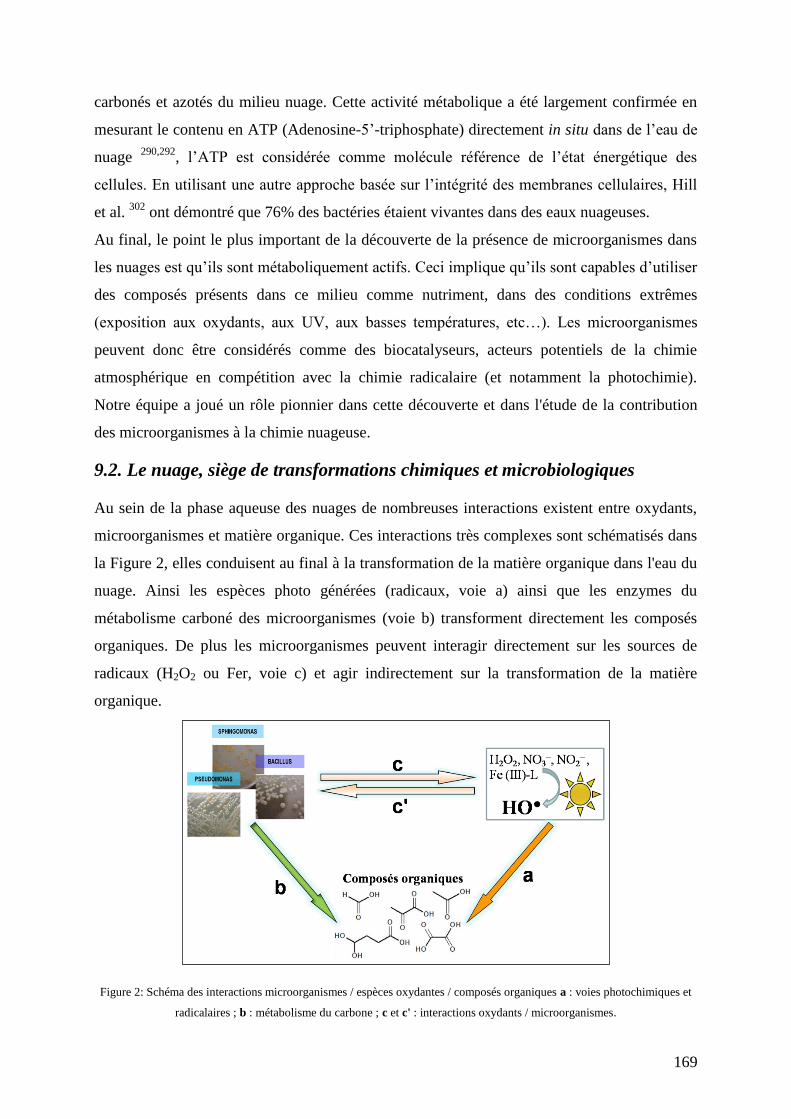
169
carbonés et azotés du milieu nuage. Cette activité métabolique a été largement confirmée en
mesurant le contenu en ATP (Adenosine-5’-triphosphate) directement in situ dans de l’eau de
nuage 290,292
, l’ATP est considérée comme molécule référence de l’état énergétique des
cellules. En utilisant une autre approche basée sur l’intégrité des membranes cellulaires, Hill
et al. 302
ont démontré que 76% des bactéries étaient vivantes dans des eaux nuageuses.
Au final, le point le plus important de la découverte de la présence de microorganismes dans
les nuages est qu’ils sont métaboliquement actifs. Ceci implique qu’ils sont capables d’utiliser
des composés présents dans ce milieu comme nutriment, dans des conditions extrêmes
(exposition aux oxydants, aux UV, aux basses températures, etc…). Les microorganismes
peuvent donc être considérés comme des biocatalyseurs, acteurs potentiels de la chimie
atmosphérique en compétition avec la chimie radicalaire (et notamment la photochimie).
Notre équipe a joué un rôle pionnier dans cette découverte et dans l'étude de la contribution
des microorganismes à la chimie nuageuse.
9.2. Le nuage, siège de transformations chimiques et microbiologiques
Au sein de la phase aqueuse des nuages de nombreuses interactions existent entre oxydants,
microorganismes et matière organique. Ces interactions très complexes sont schématisés dans
la Figure 2, elles conduisent au final à la transformation de la matière organique dans l'eau du
nuage. Ainsi les espèces photo générées (radicaux, voie a) ainsi que les enzymes du
métabolisme carboné des microorganismes (voie b) transforment directement les composés
organiques. De plus les microorganismes peuvent interagir directement sur les sources de
radicaux (H2O2 ou Fer, voie c) et agir indirectement sur la transformation de la matière
organique.
Figure 2: Schéma des interactions microorganismes / espèces oxydantes / composés organiques a : voies photochimiques et
radicalaires ; b : métabolisme du carbone ; c et c' : interactions oxydants / microorganismes.
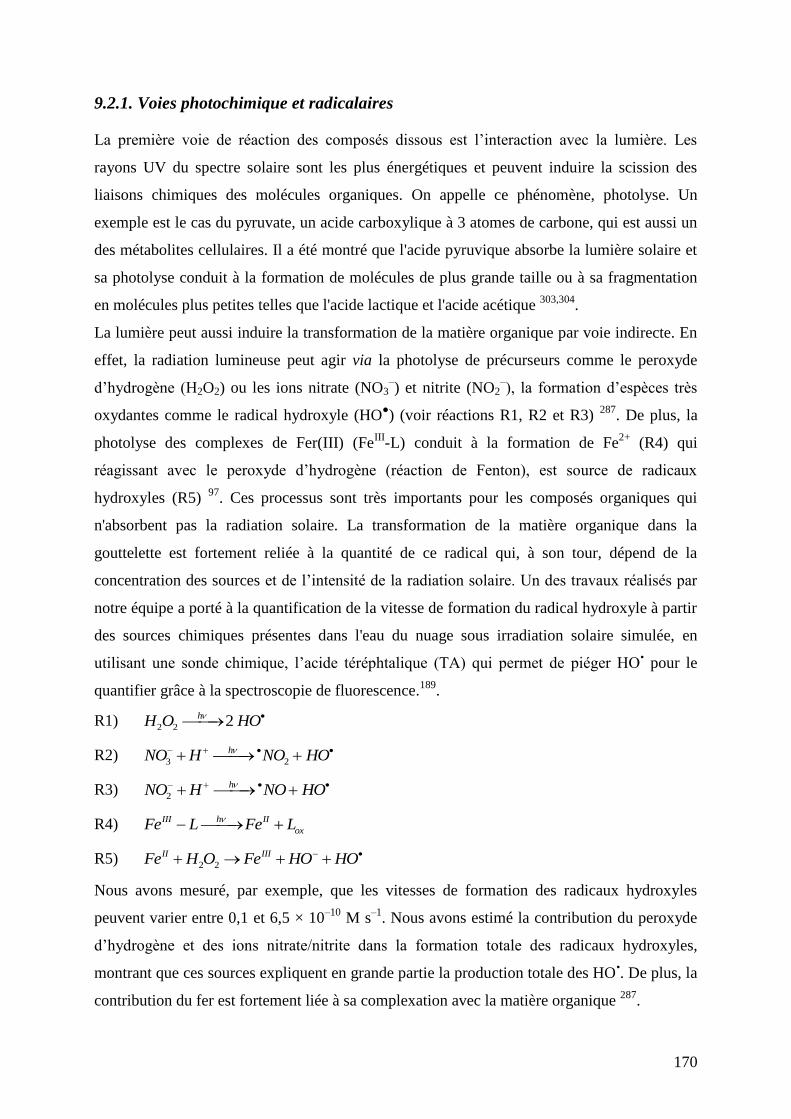
170
9.2.1. Voies photochimique et radicalaires
La première voie de réaction des composés dissous est l’interaction avec la lumière. Les
rayons UV du spectre solaire sont les plus énergétiques et peuvent induire la scission des
liaisons chimiques des molécules organiques. On appelle ce phénomène, photolyse. Un
exemple est le cas du pyruvate, un acide carboxylique à 3 atomes de carbone, qui est aussi un
des métabolites cellulaires. Il a été montré que l'acide pyruvique absorbe la lumière solaire et
sa photolyse conduit à la formation de molécules de plus grande taille ou à sa fragmentation
en molécules plus petites telles que l'acide lactique et l'acide acétique 303,304
.
La lumière peut aussi induire la transformation de la matière organique par voie indirecte. En
effet, la radiation lumineuse peut agir via la photolyse de précurseurs comme le peroxyde
d’hydrogène (H2O2) ou les ions nitrate (NO3‒) et nitrite (NO2
‒), la formation d’espèces très
oxydantes comme le radical hydroxyle (HO●) (voir réactions R1, R2 et R3)
287. De plus, la
photolyse des complexes de Fer(III) (FeIII
-L) conduit à la formation de Fe2+
(R4) qui
réagissant avec le peroxyde d’hydrogène (réaction de Fenton), est source de radicaux
hydroxyles (R5) 97
. Ces processus sont très importants pour les composés organiques qui
n'absorbent pas la radiation solaire. La transformation de la matière organique dans la
gouttelette est fortement reliée à la quantité de ce radical qui, à son tour, dépend de la
concentration des sources et de l’intensité de la radiation solaire. Un des travaux réalisés par
notre équipe a porté à la quantification de la vitesse de formation du radical hydroxyle à partir
des sources chimiques présentes dans l'eau du nuage sous irradiation solaire simulée, en
utilisant une sonde chimique, l’acide téréphtalique (TA) qui permet de piéger HO• pour le
quantifier grâce à la spectroscopie de fluorescence.189
.
R1) 2 2 2hH O HO
R2) 3 2
hNO H NO HO
R3) 2
hNO H NO HO
R4) hIII II
oxFe L Fe L
R5) 2 2
II IIIFe H O Fe HO HO
Nous avons mesuré, par exemple, que les vitesses de formation des radicaux hydroxyles
peuvent varier entre 0,1 et 6,5 × 10‒10
M s‒1
. Nous avons estimé la contribution du peroxyde
d’hydrogène et des ions nitrate/nitrite dans la formation totale des radicaux hydroxyles,
montrant que ces sources expliquent en grande partie la production totale des HO•. De plus, la
contribution du fer est fortement liée à sa complexation avec la matière organique 287
.

171
La transformation de plusieurs composés chimiques a été étudiée dans la phase aqueuse des
nuages. Du fait de leur concentration la plus abondante parmi les nombreux composés
chimiques identifiés dans ce milieu, les principaux efforts se sont focalisés sur le devenir des
acides carboxyliques, eux-mêmes résultant vraisemblablement de l’oxydation par HO•
d’autres molécules plus grandes comme les hydrocarbures ou les alcools.
Plusieurs travaux se sont focalisés sur la compréhension des voies de formation/dégradation
des acides carboxyliques à courte chaine 105,305,306
. Notre équipe à contribué a ces travaux avec
l'étude du devenir de 13 acides carboxyliques en présence des radicaux hydroxyles dans le
milieu nuageux. Nous avons constaté que la dégradation des acides carboxyliques conduit très
majoritairement à la formation d’autres acides carboxyliques avec une chaîne carbonée plus
courte (fragmentation) 189
. Ce processus de raccourcissement de chaîne est particulièrement
observé avec les acides dicarboxyliques. Cependant il est important de noter que l’expérience
avec l’acide formique (HCOOH) conduit à la transformation en CO2 mais aussi à la formation
d’acide oxalique (plus grand) qui représente 1% de l’acide formique dégradé. Même si cette
voie ne représente qu’un faible pourcentage, cela suggère la possible formation de composés
de plus haut poids moléculaire via des mécanismes de condensation radicalaire comme cela a
été déjà montré dans différentes études) 307
(Figure 3).
En ce qui concerne les irradiations d’eau de nuage, elles ont conduit systématiquement à la
formation d’acide acétique et d’acide formique qui sont les deux acides carboxyliques les plus
abondants présents dans ce milieu, composés quasi-terminaux des voies d’oxydation de la
matière organique. Cette formation est donc très probablement due à l’oxydation des
composés organiques de plus haut poids moléculaire et plus généralement de la matière
organique présente dans ce milieu qui reste encore peu caractérisée.

172
Figure 3: Représentation schématique des possibles voies de fragmentation (en acides carboxyliques et puis minéralisation en
CO2) et augmentation de la taille (jusqu’à la formation de substances type humiques, HULIS et FULIS) de la matière
organique présente dans le nuage suite à la réaction avec les radicaux hydroxyles.
9.2.2. Métabolisme du carbone
Comme tout organisme vivant, les microorganismes tirent leur énergie en bio-transformant la
matière organique, et plus particulièrement les composés carbonés, grâce à de très
nombreuses voies métaboliques 308
. En ce qui concerne la chimie atmosphérique, encore peu
de voies ont été explorées; elles se limitent aux voies des composés en C1 (méthanol,
formaldéhyde), et aux voies impliquant des acides mono- ou di-carboxyliques à courte chaine.
La mise en évidence de l’implication de ces voies métaboliques s’est faite en
construisant des microcosmes de plus en plus complexes pour mimer au plus près
l’environnement nuageux. Trois grandes approches ont été utilisées :
- Incubation d’une souche microbienne pure isolée des nuages en présence d’un
composé pur, dans un tampon phosphate.
- Incubation d’une souche microbienne pure isolée des nuages dans un milieu «nuage
artificiel» contenant les principaux composés carbonés, azotés et inorganiques.
- Incubation d’échantillons «d’eau de nuage réel» contenant toute la biodiversité
microbienne et complexité chimique.

173
Métabolisme des composés en C1
Comme le montre la Figure 4, le formaldéhyde est au centre du métabolisme des composés en
C1, il est formé par oxydation du méthanol. Ce composé peut être considéré comme toxique
et éliminé par la cellule par une voie dite de «dissimilation» conduisant à la formation de CO2.
Cette voie est soit directe via la formation de formiate, soit indirecte via le RuMP cycle qui
redonne du ribulose-5P et du CO2. Chez certains microorganismes le formaldéhyde est aussi
une source de carbone et peut être intégré dans le métabolisme de la cellule par une voie
«d’assimilation». Ainsi la voie du RuMP conduit à la production de frucose-6P qui entre dans
la voie classique de la glycolyse et du métabolisme central. Alternativement, le formaldéhyde
peut rentrer dans le cycle de la serine (acide aminé) relié au cycle de Krebs et des acides gras.
Figure 4: Métabolisme des composés en C1 (adapté de Schrader J. et al.)309.
Il est à noter que contrairement aux voies radicalaires le formaldéhyde peut être réduit en
méthanol et peut servir à construire des molécules à plus haut poids moléculaire.
Amato et al.301
ont réalisé un large screening de 60 souches (bactéries et levures) isolées d’eau
de nuage au puy de Dôme (1465m) pour leur capacité à transformer le formaldéhyde et le
méthanol. Ils ont montré que toutes dégradaient activement le formaldéhyde alors que la
transformation du méthanol dépendait des souches (Gram‒, Gram
+ et levures). Une étude
approfondie a été menée sur une de ces souches, Bacillus sp 3B6, en utilisant la spectroscopie
RMN du 13
C in vivo 310
. Cette souche peut transformer le formaldéhyde en méthanol, en
formiate et CO2 mais peut aussi utiliser la voie de la serine et conduire à la production de
glycérol, de 1,2- et 1,3-propanediol.
174
Biodégradation d’acides mono- ou di-carboxyliques à courte chaine
La voie la plus connue de la dégradation des acides carboxyliques est le cycle de Krebs
encore appelé TCA (TriCarboxylic Acid) cycle. Ce cycle permet la transformation successive
de l’acide acétique en acide citrique, puis succinique, fumarique et malique 311
. Ce cycle
constitue le métabolisme central des microorganismes et est relié à de très nombreuses autres
réactions. On peut citer le métabolisme de l’acide pyruvique, de l’acide glycolique, d’acide
di-carboxyliques, la glycolyse, le métabolisme des acides aminés, etc…
Pour ce qui est des acides di-carboxyliques, l’équipe d’Aryia a montré que les acides
succiniques, maloniques, glutariques, adipique, pimélique et piniques étaient dégradées
efficacement par des souches fongiques isolées de l’atmosphère 312,313
. Notre équipe a
également montré la dégradation de l’acide succinique par de très nombreuses souches isolées
des nuages soit avec des souches pures soit dans l’eau réelle de nuage 185,301,314,315
. Ces deux
groupes de recherche ont démontré que, dans leurs conditions, l’oxalate n’était pas dégradé.
Pour les acides mono-carboxyliques, Herlily et al. 316
furent les premiers à montrer la
dégradation de l’acide formique et acétique dans l’eau de pluie. Amato et al.301
ont pour leur
part montré qu’un panel de 60 souches microbiennes isolées d’eau de nuage pouvait dégrader
l’acide formique, acétique et lactique. Certains intermédiaires de dégradation ont été mis en
évidence comme le pyruvate et le fumarate, montrant que le métabolisme microbien pouvait
servir à la fois de puits mais aussi de source pour les composés carbonés de la phase aqueuse
du nuage. D’autres expériences menées en microcosmes de plus en plus proches du milieu
nuage ont confirmé le potentiel des microorganismes des nuages à dégrader l’acide formique
et acétique 185,314,315
. Une étude très récente a également montré le potentiel d’une souche de
Shingomonas aerolata aérosolisée dans un tunnel à intégrer de l’acide acétique dans son
métabolisme 317
. Cette étude est intéressante car elle élargit la problématique du rôle des
microorganismes dans la chimie atmosphérique en phase aqueuse à la chimie en phase gaz.
9.2.3. Interaction microorganismes / oxydants
Métabolisme du stress oxydant
Les microorganismes qui vivent dans les nuages sont de type aérobie, ils utilisent l’oxygène
comme accepteur d’électrons lors de la respiration (Figure 5). En réalité l’oxygène qui diffuse
à travers la membrane plasmique est très vite transformé en ion superoxyde qui est très
toxique pour les cellules. Cette molécule est donc convertie de manière extrêmement efficace
en H2O2 par la SOD (superoxyde dismutase), ensuite le peroxyde d’hydrogène est transformé
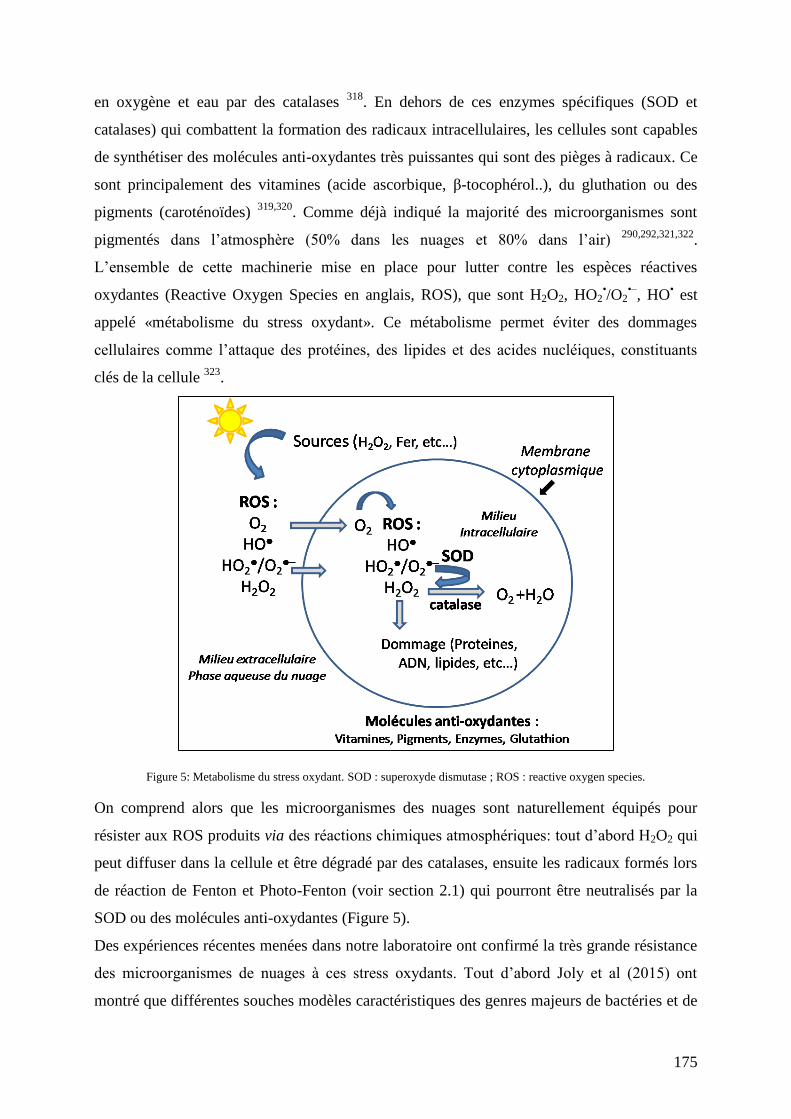
175
en oxygène et eau par des catalases 318
. En dehors de ces enzymes spécifiques (SOD et
catalases) qui combattent la formation des radicaux intracellulaires, les cellules sont capables
de synthétiser des molécules anti-oxydantes très puissantes qui sont des pièges à radicaux. Ce
sont principalement des vitamines (acide ascorbique, β-tocophérol..), du gluthation ou des
pigments (caroténoïdes) 319,320
. Comme déjà indiqué la majorité des microorganismes sont
pigmentés dans l’atmosphère (50% dans les nuages et 80% dans l’air) 290,292,321,322
.
L’ensemble de cette machinerie mise en place pour lutter contre les espèces réactives
oxydantes (Reactive Oxygen Species en anglais, ROS), que sont H2O2, HO2•/O2
•–, HO
• est
appelé «métabolisme du stress oxydant». Ce métabolisme permet éviter des dommages
cellulaires comme l’attaque des protéines, des lipides et des acides nucléiques, constituants
clés de la cellule 323
.
Figure 5: Metabolisme du stress oxydant. SOD : superoxyde dismutase ; ROS : reactive oxygen species.
On comprend alors que les microorganismes des nuages sont naturellement équipés pour
résister aux ROS produits via des réactions chimiques atmosphériques: tout d’abord H2O2 qui
peut diffuser dans la cellule et être dégradé par des catalases, ensuite les radicaux formés lors
de réaction de Fenton et Photo-Fenton (voir section 2.1) qui pourront être neutralisés par la
SOD ou des molécules anti-oxydantes (Figure 5).
Des expériences récentes menées dans notre laboratoire ont confirmé la très grande résistance
des microorganismes de nuages à ces stress oxydants. Tout d’abord Joly et al (2015) ont
montré que différentes souches modèles caractéristiques des genres majeurs de bactéries et de

176
levures pouvaient survivre même à une concentration aussi élevée que 1mM de H2O2 ; la
concentration maximale de H2O2 dans les nuages au puy de Dôme est de l’ordre de quelques
dizaines de 30 µM 324
. D’autre part Vaitinlingom et al.185
ont montré que la flore endogène
microbienne des nuages pouvait dégrader H2O2 présente dans l’eau de nuage. Dans ce même
article, la mesure du rapport ATP/ADP, marqueur de l’énergétique cellulaire, reste inchangé
en présence de radicaux, ce qui démontre que les microorganismes résistent à la présence de
ces ROS.
Ces résultats sont très importants et novateurs car ils ont mis en lumière pour la première fois
l’impact potentiel des microorganismes sur la capacité oxydante du nuage.
Interaction avec le Fer :
Comme expliqué précédemment, le fer joue un rôle important dans la chimie atmosphérique
(voir section 2.1). Les réactions de Fenton qui impliquent le Fe2+
et H2O2 ainsi que la
photolyse des complexes de Fer(III) sont considérés comme une source de radicaux.
Actuellement seuls les complexes de Fer-oxalate sont considérés dans les modèles de chimie
atmosphérique, cependant des études récentes de Bianco et al 287
suggèrent que la production
de HO• est surestimée par ce type de réactions. Se pose donc la question de la complexation
du fer de la part de la matière organique dans les nuages. Dans l’océan comme dans l’eau de
pluie la présence de sidérophores a été démontrée 325,326
. Les sidérophores sont des
complexants très puissants du Fe(III) (log K>20), leur structures chimiques sont très variées
mais ils possèdent des fonctions chantantes communes de type catéchol, hydroxamate ou
carboxylates. Ces composés sont produits par les microorganismes, exportés hors de la cellule
pour complexer le fer présent dans le milieu puis internalisés dans la cellule. Le fer est un
élément essentiel de la vie des microorganismes car il intervient dans de nombreuses réactions
d’oxydo-réduction et il est présent dans le site actif d’enzymes. Notre hypothèse est que les
microorganismes présents dans les nuages pourraient produire des sidérophores et être donc
en compétition avec l’oxalate pour complexer le fer. De plus les mécanismes de photolyse de
ces complexes peuvent varier en fonctions du complexant organique (oxalate, sidérophores,
etc…). Des expériences sont en cours pour valider cette hypothèse.
9.3. Compétition chimie radicalaire vs métabolisme microbien
Si la capacité des microorganismes à transformer des composés organiques ou à interagir avec
des oxydants est maintenant acquise, le grand challenge est d’évaluer la contribution réelle de

177
ces réactions biologiques par rapport à la chimie radicalaire. Plusieurs stratégies ont été
utilisées pour aborder cette compétition entre chimie radicalaire et métabolisme microbien:
Approche indirecte: cette première approche consiste à mesurer expérimentalement
des vitesses de biodégradation de composés présents dans les nuages par des microorganismes
(souche isolée ou population endogène) et de les comparer avec des vitesses théoriques
calculées sur la base de la réactivité des principaux radicaux tels que les HO• et NO3
• sur ces
mêmes composés.
Approche directe: cette deuxième approche vise à comparer les vitesses de
biodégradation et de photodégradation de composés atmosphériques d’intérêt, mesurées
expérimentalement dans des photo-bioréacteurs. Là encore souches pures ou population
microbiennes complexes peuvent être étudiées dans des milieux nuages artificiels ou naturels.
9.3.1. Approche indirecte
En ce qui concerne les composés en C1, Husarova et al. 310
ont étudié la biodégradation du
méthanol et du formaldéhyde par 4 souches isolées d’eau nuageuse au puy de Dôme. Les
vitesses de biodégradation mesurées à 5°C (température moyenne du site de prélèvement) ont
été comparées aux vitesses de transformation de ces mêmes composés par les radicaux HO• et
NO3•. Ceci permet d’appréhender la contribution de l’activité microbienne pendant le jour où
les deux types de radicaux sont présents et pendant la nuit où seul NO3• intervient. De plus
deux scénarios ont été considérés, l’un où les nuages sont considérés comme pollués ([NO3•]
élevée), l’autre comme non pollués ([NO3•] faible). Dans tous scénarios les radicaux HO
• sont
les plus actifs pendant le jour. La nuit, l’activité des microorganismes domine sauf pour le
méthanol en milieu pollué où les radicaux NO3• restent plus actifs.
Pour les acides dicarboxyliques (acides maloniques, succiniques, adipiques, pimeliques et
pineliques), Aryia et al 312
ont montré que les vitesses de biodégradation par une souche
fongique de Geotrichum sp isolée de l’air étaient du même ordre de grandeur que celles de
transformation par HO• mais beaucoup plus rapides (de 70 à 1000 fois) que les
transformations induites par O3 ou HO2•.
Vaïtilingom et al 315
ont mené une étude exhaustive en considérant 17 souches isolées au puy
de Dôme. Les incubations ont été réalisées dans des milieux artificiels mimant l’eau des
nuages et contenant 4 acides organiques représentatifs (oxalate, succinate, acétate et
formiate). En dehors de l’oxalate qui n’est pas dégradé biologiquement, les autres composés
sont dégradés plus rapidement par les microorganismes que par les radicaux HO• et NO3
•
pendant la nuit. Les microorganismes restent très compétitifs le jour lorsque les calculs sont

178
faits avec des concentrations en radicaux de 10‒14
M (Figure 6A). Le même résultat est obtenu
si on incube un échantillon de nuage réel contentant toute la biodiversité et complexité
chimique (Figure 6B).
Figure 6: Contribution relative de l’activité microbienne (en noir) sur la dégradation d’acides organiques par rapport à
l’action des radicaux HO• (gris clair). L’activité microbienne a été mesurée en laboratoire en milieu artificiel ou en milieu
nuage réel. L’activité radicalaire a été calculée avec des concentrations de HO• de 10‒14M.
9.3.2. Approche directe
L’approche utilisée précédemment s’est révélée très utile pour comparer activités radicalaires
et microbiennes, cependant elle est fortement dépendante de la concentration en radicaux
utilisée dans les calculs. Or cette concentration est issue de calculs de modélisation ce qui
conduit à des incertitudes extrêmes. Ainsi par exemple la concentration en HO• varie de 10
‒12
M à 10‒16
M. L’alternative pertinente est donc de comparer directement des vitesses de
dégradations biotiques et abiotiques mesurées dans les mêmes conditions expérimentales dans
des photo-bioréacteurs.
Une première série d’expériences menées en nuage artificiel avec 17 souches microbiennes
pures, avec ou sans lumière, ont confirmé les résultats obtenus par calcul décrits
précédemment.315

179
Une autre expérience beaucoup plus complète a été réalisée avec 3 échantillons de nuages
différents prélevés au sommet du puy de Dôme.185
L’oxalate n’est dégradé qu’en présence de
lumière, le formiate (c’est aussi vrai pour l’acétate et le succinate) sont surtout biodégradés
par les cellules. Enfin le cas du formaldéhyde est intéressant puisqu’il est photo-produit alors
qu’il est dégradé par les microorganismes. Dans cette même expérience les auteurs ont montré
que les microorganismes dégradaient H2O2 de manière majoritaire la nuit (78%) et de manière
substantielle le jour (18%).
9.4. Conclusion
La compréhension du rôle des microorganismes dans la chimie du nuage représente un défi
majeur pour comprendre les voies de transformation dans ce milieu très complexe. Le double
rôle de synergie et compétition avec les voies photochimiques reste un sujet encore très peu
étudié, notre équipe est une des seules au monde à s'y consacrer. A l'avenir de nombreuses
pistes sont à explorer: Tout d'abord la transformation d'autres composés organiques tels que
les sucres ou les acides aminés doivent être étudiés, leur comportement photochimique est peu
connu et ils sont de très bons substrats pour les microorganismes. Un autre aspect concerne la
formation de molécules de plus haut poids moléculaires. Une activité scientifique importante
s'est développée autour de la synthèse d'aérosols organiques secondaires (OAS) par voie
radicalaire, les microorganismes peuvent aussi former des macromolécules ou des métabolites
secondaires (sidérophores, biosurfactants, substances exopolymériques...). Enfin même si les
études de photo et biotransformation de composés organiques ont montré que les
microorganismes pouvaient être des acteurs efficaces de la chimie atmosphérique, les études
réalisées, même en milieu nuage réel, restent limitées à des expériences en laboratoire. Seul
des modèles numériques de chimie atmosphérique peuvent rendre compte de la complexité du
système multiphasique du nuage intégrant de très nombreuses réactions et des transferts entre
phase aqueuse -phase gazeuse. Ces modèles ne prennent pas en compte la composante
biologique, notre équipe travaille en étroite collaboration avec le Laboratoire de Météorologie
Physique qui développe actuellement cette nouvelle approche. Le développement de modèles
plus performants devrait conduire à terme à une meilleure prévision du climat.

180

181
Conclusions and perspectives
In my PhD work the attention was firstly focused on hydroxyl radical photogeneration:
hydroxyl radical formation rate and polychromatic quantum yield were estimated for clouds
with different geographic origin and characterized by peculiar chemical composition and pH
values. These two parameters were correlated with the concentrations of inorganic precursors
such as hydrogen peroxide, nitrates, nitrites and iron (Fe2+
/Fe3+
) and the main result was that
the photolysis of hydrogen peroxide is the predominant source of hydroxyl radical, while
nitrates and nitrites have a secondary importance. Concerning the production of hydroxyl
radical by iron chemistry and photochemistry, our results show that iron is a minor source in
disagreement with literature data.
Experimental results were compared with modeled hydroxyl radical formation rates,
calculated with the M2C2 model. This model can reproduce the order of magnitude of
experimental values but some discrepancies appear in the case of high concentration of iron or
hydrogen peroxide. For this reason, iron chemistry was not considered and the photolysis of
hydrogen peroxide was determined experimentally. The modeled production rates of hydroxyl
radical with the updated mechanism are closer to the experimental values, supporting the
hypothesis that iron could be strongly complexed by organic ligands and it is less
photoreactive in this form.
This study provides significant data on the oxidant capacity of cloud aqueous phase.
Subsequently, the attention was focused on the chemical and photochemical behavior of
tartronic acid, a dicarboxylic acid, in cloud water. This work is still not finished but
spectroscopic properties of this compound and direct and indirect photolysis were presented
in the manuscript. Moreover, the second order rate constants of the three forms of tartronic
acid with hydroxyl radical were determined experimentally by Laser Flash Photolysis. The
results will be implemented in the M2C2 model to better understand the reactivity of C3
functionalized compounds in cloud aqueous phase.
Another crucial point of this thesis was the development of a chromatographic method with
precolumn derivatization and fluorescence detection for the quantification of free amino acids
at low concentration. 16 amino acids were detected and quantified in cloud water samples and
their concentration ranges from few nM up to 2 µM. The average contribution of amino acids
to the cloud water DOC was for the first time estimated and it is of 10%, with maximum value
of 25%.
182
This result represents an important step in the characterization of cloud water composition,
especially if we consider that up to now only 11% of the DOC was described as composed by
carboxylic acids and aldehydes. Furthermore, amino acids contribution to the hydroxyl radical
scavenge ranges from 10% up to 30% with an average value around 20%.
Tryptophan was found to be the most concentrated amino acid. It can also be detected, as the
sum of free and combined form, by fluorescence spectroscopy (EEM, Excitation Emission
Matrix) and, in the free form, by a chromatographic method coupled with fluorescence
detection. Using these two methods, tryptophan and TRYLIS (TRYptophan LIke Substances)
were detected in cloud water from oceanic and continental origin.
Tryptophan photoreactivity under sun simulated conditions was investigated in distilled water
and in synthetic water samples mimicking cloud aqueous phase composition. Irradiated
solutions were analyzed by ion chromatography, mass spectrometry and fluorescence
spectroscopy and it was found that hydroxyl radical-mediated transformation leads to the
generation of different functionalized and oxidized products, as well as small carboxylic
acids, such as formate and acetate. In addition fluorescent signals of irradiated solutions
indicate the formation of HULIS. This finding improve our comprehension of the reactivity of
organic compounds in cloud water: in parallel to the oxidation and the diminution of
molecular weight, reactions of formation of high weight molecular compounds by
dimerization or aggregation processes have been demonstrated.
This is a crucial subject that needs to be deeply investigated to understand and predict the
behavior of organic compounds in cloud water by atmospheric models.
In the last part of this manuscript, I have choosen to present an article that will be published in
a divulgatif review: it describes how microorganisms, naturally present in cloud water, could
impact cloud water oxidant capacity, acting as sinks of hydroxyls radicals but also as
inhibitors of their formation. They could also impact carboxylic acids and amino acids
concentration and speciation in function of their production and consumption.
This article indicates a perspective of the work presented: the interaction between
microbiological activity and light need to be investigated, especially concerning hydroxyl
radical formation rate and steady state concentration and amino acids behavior. Many
questions rise to mind: “do microorganisms inhibit significantly hydroxyl radical formation
rate?”, “is the concentration of amino acids influenced by the presence of microorganisms?”,
“does microorganisms really influence chemical and photochemical processes?”…
183
Cloud water chemistry can have a relevant repercussion on the comprehension of atmospheric
chemistry and on climate change. At this stage, more work is needed to fully understand the
natural processes, to investigate their universality and their impact on tropospheric chemistry.

184
185
References
(1) Ervens, B.; Wang, Y.; Eagar, J.; Leaitch, W. R.; Macdonald, A. M.; Valsaraj, K. T.;
Herckes, P. Atmos. Chem. Phys. 2013, 13, 5117-5135.
(2) Education, T. H.; Cartoon showing different cloud types and levels., Ed., 2007.
(3) Daum, P. H.; Schwartz, S. E.; Newman, L. “Studies of the gas-and aqueous-phase
composition of stratiform clouds,” Brookhaven National Lab., Upton, NY (USA),
1982.
(4) Heikes, B.; Lazrus, A.; Kok, G.; Kunen, S.; Gandrud, B.; Gitlin, S.; Sperry, P. J.
Geophys. Res., Oceans. 1982, 87, 3045-3051.
(5) Jacob, D. J. J. Geophys. Res., Atmos. 1986, 91, 9807-9826.
(6) Bank, S.; Castillo, R. Geophys. Res. Lett. 1987, 14, 210-212.
(7) Chameides, W. L.; Davis, D. D. Nature 1983, 304, 427-429.
(8) Allen, M. R.; Ingram, W. J. Nature 2002, 419, 224-232.
(9) Fischer, J.; Bohn, M. Mol. Phys. 1986, 58, 395-399.
(10) Chuang, P. Y.; Charlson, R. J.; Seinfeld, J. H. Nature 1997, 390, 594-596.
(11) Gill, P. S.; Graedel, T. E.; Weschler, C. J. Rev. Geophys. 1983, 21, 903-920.
(12) Blanchard, D. C. Science 1964, 146, 396-397.
(13) Husar, R. B.; Shu, W. R. Thermal Analyses of the Los Angeles Smog Aerosol;
American Meteorological Society, 1975.
(14) Feingold, G.; Chuang, P. Y. In Journal of the Atmospheric Sciences; American
Meteorological Society, 2002; Vol. 59.
(15) Deguillaume, L.; Leriche, M.; Desboeufs, K.; Mailhot, G.; George, C.; Chaumerliac,
N. Chem. Rev. 2005, 105, 3388-3431.
(16) Schwartz, S. E.; Potter, T. D.; Colman, B. R. Handbook of Weather, Climate, and
Water: Cloud chemistry; Wiley Interscience, 2003.
(17) van Breemen, N.; Burrough, P. A.; Velthorst, E. J.; van Dobben, H. F.; de Wit, T.;
Ridder, T. B.; Reijnders, H. F. R. Nature 1982, 299, 548-550.
(18) Daum, P. H.; Kelly, T. J.; Schwartz, S. E.; Newman, L. Atmos. Environ. 1984, 18,
2671-2684.
(19) Elbert, W.; Hoffmann, M. R.; Kramer, M.; Schmitt, G.; Andreae, M. O. Atmos.
Environ. 2000, 34, 1109-1122.
(20) Moller, D.; Acker, K.; Wieprecht, W. Atmos. Res. 1996, 41, 321-335.
186
(21) van Pinxteren, D.; Fomba, K. W.; Mertes, S.; Muller, K.; Spindler, G.; Schneider, J.;
Lee, T.; Collett, J.; Herrmann, H. Atmos. Chem. Phys. Discuss. 2015, 2015, 24311-
24368.
(22) Ogren, J. A.; Heintzenberg, J.; Zuber, A.; Noone, K. J.; Charlson, R. J. Tellus B 1989,
41B, 24-31.
(23) Marinoni, A.; Parazols, M.; Brigante, M.; Deguillaume, L.; Amato, P.; Delort, A.-M.;
Laj, P.; Mailhot, G. Atmos. Res. 2011, 101, 256-263.
(24) Monod, A.; Carlier, P. Atmos. Environ. 1999, 33, 4431-4446.
(25) Aleksic, N.; Roy, K.; Sistla, G.; Dukett, J.; Houck, N.; Casson, P. Atmos. Environ.
2009, 43, 2709-2716.
(26) Loflund, M.; Kasper-Giebl, A.; Schuster, B.; Giebl, H.; Hitzenberger, R.; Puxbaum, H.
Atmos. Environ. 2002, 36, 1553-1558.
(27) Deguillaume, L.; Charbouillot, T.; Joly, M.; Vaitilingom, M.; Parazols, M.; Marinoni,
A.; Amato, P.; Delort, A. M.; Vinatier, V.; Flossmann, A.; Chaumerliac, N.; Pichon, J.
M.; Houdier, S.; Laj, P.; Sellegri, K.; Colomb, A.; Brigante, M.; Mailhot, G. Atmos.
Chem. Phys. 2014, 14, 1485-1506.
(28) Acker, K.; Möller, D.; Wieprecht, W.; Kalaß, D.; Auel, R. Fresenius. J. Anal. Chem.
1998, 361, 59-64.
(29) Guo, J.; Wang, Y.; Shen, X.; Wang, Z.; Lee, T.; Wang, X.; Li, P.; Sun, M.; Collett Jr,
J. L.; Wang, W.; Wang, T. Atmos. Environ. 2012, 60, 467-476.
(30) Herrmann, H.; Hoffmann, D.; Schaefer, T.; Bräuer, P.; Tilgner, A. ChemPhysChem
2010, 11, 3796-3822.
(31) Ervens, B.; George, C.; Williams, J. E.; Buxton, G. V.; Salmon, G. A.; Bydder, M.;
Wilkinson, F.; Dentener, F.; Mirabel, P.; Wolke, R.; Herrmann, H. C. J. Geophys.
Res., Atmos. 2003, 108, 4426.
(32) Leriche, M.; Voisin, D.; Chaumerliac, N.; Monod, A.; Aumont, B. Atmos. Environ.
2000, 34, 5015-5036.
(33) Deguillaume, L.; Tilgner, A.; Schrödner, R.; Wolke, R.; Chaumerliac, N.; Herrmann,
H. J. Atmos. Chem. 2009, 64, 1-35.
(34) Albrecht, B. A.; Fairall, C. W.; Thomson, D. W.; White, A. B.; Snider, J. B.; Schubert,
W. H. Geophys. Res. Lett. 1990, 17, 89-92.
(35) Junge, C. E. Air chemistry and radioactivity; New York and London. Academic Press,
1963.
(36) Sinner, T.; Hoffmann, P.; Ortner, H. Contrib. Atmos. Phys. 1994, 67, 353-357.

187
(37) Cini, R.; Prodi, F.; Santachiara, G.; Porci, F.; Bellandi, S.; Stortini, A. M.; Oppo, C.;
Udisti, R.; Pantani, F. Atmos. Res. 2002, 61, 311-334.
(38) Kawamura, K.; Steinberg, S.; Ng, L.; Kaplan, I. R. Atmos. Environ. 2001, 35, 3917-
3926.
(39) Behar, S. Testing the Waters: Chemical and Physical Vital Signs of a River; River
Watch Network, 1996.
(40) Collett Jr, J. L.; Bator, A.; Sherman, D. E.; Moore, K. F.; Hoag, K. J.; Demoz, B. B.;
Rao, X.; Reilly, J. E. Atmos. Res. 2002, 64, 29-40.
(41) Watanabe, K.; Takebe, Y.; Sode, N.; Igarashi, Y.; Takahashi, H.; Dokiya, Y. Atmos.
Res. 2006, 82, 652-662.
(42) Castillo, R. A.; Jiusto, J. E.; McLaren, E. Atmos. Environ. 1983, 17, 1497-1505.
(43) Fowler, D.; Pilegaard, K.; Sutton, M. A.; Ambus, P.; Raivonen, M.; Duyzer, J.;
Simpson, D.; Fagerli, H.; Fuzzi, S.; Schjoerring, J. K.; Granier, C.; Neftel, A.; Isaksen,
I. S. A.; Laj, P.; Maione, M.; Monks, P. S.; Burkhardt, J.; Daemmgen, U.; Neirynck,
J.; Personne, E.; Wichink-Kruit, R.; Butterbach-Bahl, K.; Flechard, C.; Tuovinen, J.
P.; Coyle, M.; Gerosa, G.; Loubet, B.; Altimir, N.; Gruenhage, L.; Ammann, C.;
Cieslik, S.; Paoletti, E.; Mikkelsen, T. N.; Ro-Poulsen, H.; Cellier, P.; Cape, J. N.;
Horvath, L.; Loreto, F.; Niinemets, U.; Palmer, P. I.; Rinne, J.; Misztal, P.; Nemitz, E.;
Nilsson, D.; Pryor, S.; Gallagher, M. W.; Vesala, T.; Skiba, U.; Bruggemann, N.;
Zechmeister-Boltenstern, S.; Williams, J.; O'Dowd, C.; Facchini, M. C.; de Leeuw, G.;
Flossman, A.; Chaumerliac, N.; Erisman, J. W. Atmos. Environ. 2009, 43, 5193-5267.
(44) Monks, P. S.; Granier, C.; Fuzzi, S.; Stohl, A.; Williams, M. L.; Akimoto, H.; Amann,
M.; Baklanov, A.; Baltensperger, U.; Bey, I.; Blake, N.; Blake, R. S.; Carslaw, K.;
Cooper, O. R.; Dentener, F.; Fowler, D.; Fragkou, E.; Frost, G. J.; Generoso, S.;
Ginoux, P.; Grewe, V.; Guenther, A.; Hansson, H. C.; Henne, S.; Hjorth, J.;
Hofzumahaus, A.; Huntrieser, H.; Isaksen, I. S. A.; Jenkin, M. E.; Kaiser, J.;
Kanakidou, M.; Klimont, Z.; Kulmala, M.; Laj, P.; Lawrence, M. G.; Lee, J. D.;
Liousse, C.; Maione, M.; McFiggans, G.; Metzger, A.; Mieville, A.; Moussiopoulos,
N.; Orlando, J. J.; O'Dowd, C. D.; Palmer, P. I.; Parrish, D. D.; Petzold, A.; Platt, U.;
Poschl, U.; Prevot, A. S. H.; Reeves, C. E.; Reimann, S.; Rudich, Y.; Sellegri, K.;
Steinbrecher, R.; Simpson, D.; ten Brink, H.; Theloke, J.; van der Werf, G. R.;
Vautard, R.; Vestreng, V.; Vlachokostas, C.; von Glasow, R. Atmos. Environ. 2009,
43, 5268-5350.
188
(45) Seinfeld, J. H.; Pandis, S. N. Atmospheric Chemistry and Physics: From Air Pollution
to Climate Change, 2nd Edition; Wiley Interscience, 2006.
(46) Barth, M. C. Atmos. Res. 2006, 82, 294-309.
(47) Sellegri, K.; Laj, P.; Marinoni, A.; Dupuy, R.; Legrand, M.; Preunkert, S. Atmos.
Chem. Phys. 2003, 3, 1509-1522.
(48) Leriche, M.; Deguillaume, L.; Chaumerliac, N. C. J. Geophys. Res., Atmos. 2003, 108,
4433.
(49) Suslick, K. S.; Watson, R. A. Inorg. Chem. 1991, 30, 912-919.
(50) Deguillaume, L.; Leriche, M.; Monod, A.; Chaumerliac, N. Atmos. Chem. Phys. 2004,
4, 95-110.
(51) Lee, D. S.; Pacyna, J. M. Atmos. Environ. 1999, 33, 1687-1697.
(52) Gioda, A.; Mayol-Bracero, O. L.; Morales-García, F.; Collett, J.; Decesari, S.;
Emblico, L.; Facchini, M. C.; Morales-De Jesús, R. J.; Mertes, S.; Borrmann, S.;
Walter, S.; Schneider, J. Water, Air, Soil Pollut. 2008, 200, 3-14.
(53) Reyes-Rodriguez, G. J.; Gioda, A.; Mayol-Bracero, O. L.; Collett Jr, J. Atmos.
Environ. 2009, 43, 4171-4177.
(54) Blas, M.; Sobik, M.; Twarowski, R. Atmos. Res. 2008, 87, 224-231.
(55) Herckes, P.; Hannigan, M. P.; Trenary, L.; Lee, T.; Collett Jr, J. L. Atmos. Res. 2002,
64, 99-108.
(56) Lammel, G.; Metzig, G. Fresenius. J. Anal. Chem. 1991, 340, 564-574.
(57) Lin, N.-H.; Peng, C.-M. Terr. Atmos. Ocean. Sci. 1999, 10, 693-704.
(58) Wang, Y.; Guo, J.; Wang, T.; Ding, A.; Gao, J.; Zhou, Y.; Collett Jr, J. L.; Wang, W.
Atmos. Res. 2011, 99, 434-442.
(59) Holland, H. D. The chemistry of the atmosphere and oceans, Wiley interscience;
Wiley interscience, 1978.
(60) Anastasio, C.; Jordan, A. L. Atmos. Environ. 2004, 38, 1153-1166.
(61) Graedel, T. E.; Mandich, M. L.; Weschler, C. J. J. Geophys. Res., Atmos. 1986, 91,
5205-5221.
(62) Kanakidou, M.; Seinfeld, J. H.; Pandis, S. N.; Barnes, I.; Dentener, F. J.; Facchini, M.
C.; Van Dingenen, R.; Ervens, B.; Nenes, A.; Nielsen, C. J.; Swietlicki, E.; Putaud, J.
P.; Balkanski, Y.; Fuzzi, S.; Horth, J.; Moortgat, G. K.; Winterhalter, R.; Myhre, C. E.
L.; Tsigaridis, K.; Vignati, E.; Stephanou, E. G.; Wilson, J. Atmos. Chem. Phys. 2005,
5, 1053-1123.
(63) Goldstein, A. H.; Galbally, I. E. Environ. Sci. Technol. 2007, 41, 1514-1521.
189
(64) Marinoni, A.; Laj, P.; Sellegri, K.; Mailhot, G. Atmos. Chem. Phys. 2004, 4, 715-728.
(65) Keene, W. C.; Mosher, B. W.; Jacob, D. J.; Munger, J. W.; Talbot, R. W.; Artz, R. S.;
Maben, J. R.; Daube, B. C.; Galloway, J. N. J. Geophys. Res., Atmos. 1995, 100,
9345-9357.
(66) Laj, P.; Fuzzi, S.; Facchini, M. C.; Lind, J. A.; Orsi, G.; Preiss, M.; Maser, R.;
Jaeschke, W.; Seyffer, E.; Helas, G.; Acker, K.; Wieprecht, W.; Muller, D.; Arends, B.
G.; Mols, J. J.; Colvile, R. N.; Gallagher, M. W.; Beswick, K. M.; Hargreaves, K. J.;
Storeton-West, R. L.; Sutton, M. A. Atmos. Environ. 1997, 31, 2589-2598.
(67) Luttke, J.; Levsen, K. Atmos. Environ. 1997, 31, 2649-2655.
(68) Luttke, J.; Scheer, V.; Levsen, K.; Wunsch, G.; Neil Cape, J.; Hargreaves, K. J.;
Storeton-West, R. L.; Acker, K.; Wieprecht, W.; Jones, B. Atmos. Environ. 1997, 31,
2637-2648.
(69) Charbouillot, T.; Brigante, M.; Deguillaume, L.; Mailhot, G. J. Photochem. Photobiol.
2012, 88, 32-37.
(70) Walling, C. Acc. Chem. Res. 1998, 31, 155-157.
(71) Pitts, J. N.; Lokensgard, D. M.; Ripley, P. S.; Van Cauwenberghe, K. A.; Van Vaeck,
L.; Shaffer, S. D.; Thill, A. J.; Belser, W. L. Science 1980, 210, 1347-1349.
(72) Finlayson-Pitts, B. J.; Pitts, J. N. Chemistry of the upper and low atmosphere.
Academic Press, San Diego, 2000.
(73) Herrmann, H.; Tilgner, A.; Barzaghi, P.; Majdik, Z.; Gligorovski, S.; Poulain, L.;
Monod, A. Atmos. Environ. 2005, 39, 4351-4363.
(74) Huie, R. E.; Clifton, C. L.; Neta, P. Int. J. Radiat. Appl. Instrum. C Radiat. Phys.
Chem. 1991, 38, 477-481.
(75) Schuchmann, H. P.; Deeble, D. J.; Olbrich, G.; Sonntag, C. v. Int. J. Radiat. Biol.
Relat. Stud. Phys. Chem. Med. 1987, 51, 441-453.
(76) Buxton, G. V.; Greenstock, C. L.; Helman, W. P.; Ross, A. B. J. Phys. Chem. Ref.
Data 1998, 17, 513-886.
(77) Finlayson, B. J.; Pitts, J. N. Atmospheric chemistry: Fundamentals and experimental
techniques; John Wiley and Sons Inc.,New York, NY, 1986.
(78) Lind, J. A.; Kok, G. L. J. Geophys. Res., Atmos. 1986, 91, 7889-7895.
(79) Arakaki, T.; Anastasio, C.; Shu, P. G.; Faust, B. C. Atmos. Environ. 1995, 29, 1697-
1703.
(80) Faust, B. C.; Allen, J. M. Environ. Sci. Technol. 1993, 27, 1221-1224.
(81) Faust, B. C.; Anastasio, C.; Allen, J. M.; Arakaki, T. Science 1993, 260, 73-75.
190
(82) Anastasio, C.; Faust, B. C.; Allen, J. M. J. Geophys. Res., Atmos. 1994, 99, 8231-
8248.
(83) Arakaki, T.; Faust, B. C. J. Geophys. Res. 1998, 103, 3487-3504.
(84) Faust, B. C.; Powell, K.; Rao, C. J.; Anastasio, C. Atmos. Environ. 1997, 31, 497-510.
(85) Zuo, Y.; Deng, Y. Geochim. Cosmochim. Acta 1999, 63, 3451-3455.
(86) Finlayson-Pitts, B. J.; Pitts Jr, J. N. Chemistry of the upper and lower atmosphere:
theory, experiments, and applications; Academic press, 1999.
(87) Valverde-Canossa, J.; Wieprecht, W.; Acker, K.; Moortgat, G. K. Atmos. Environ.
2005, 39, 4279-4290.
(88) Richards, L. W.; Anderson, J. A.; Blumenthal, D. L.; McDonald, J. A.; Kok, G. L.;
Lazrus, A. L. Atmos. Environ. 1983, 17, 911-914.
(89) Atkinson, R.; Baulch, D. L.; Cox, R. A.; Hampson, R. F.; Kerr, J. A.; Rossi, M. J.;
Troe, J. J. Phys. Chem. Ref. Data 1997, 26, 1329-1499.
(90) Vaghjiani, G. L.; Turnipseed, A. A.; Warren, R. F.; Ravishankara, A. R. J. Chem.
Phys. 1992, 96, 5878-5886.
(91) Wayne, R. P.; Barnes, I.; Biggs, P.; Burrows, J.; Canosa-Mas, C.; Hjorth, J.; Le Bras,
G.; Moortgat, G.; Perner, D.; Poulet, G. Atmos. Environ. A-Gen. 1991, 25, 1-203.
(92) Thomas, K.; Volz-Thomas, A.; Mihelcic, D.; Smit, H. G. J.; Kley, D. J. Atmos. Chem.,
29, 17-43.
(93) Hanson, D. R.; Burkholder, J. B.; Howard, C. J.; Ravishankara, A. R. J. Phys. Chem.
1992, 96, 4979-4985.
(94) Biedenkapp, D.; Hartshorn, L. G.; Bair, E. J. Chem. Phys. Lett. 1970, 5, 379-381.
(95) Bohn, B.; Zetzsch, C. J. Phys. Chem. A 1997, 101, 1488-1493.
(96) Jans, U.; Hoigné, J. Atmos. Environ. 2000, 34, 1069-1085.
(97) Long, Y.; Charbouillot, T.; Brigante, M.; Mailhot, G.; Delort, A.-M.; Chaumerliac, N.;
Deguillaume, L. Atmos. Environ. 2013, 77, 686-695.
(98) Barbusinski, K. Ecological Chemistry and Engineering. S 2009, 16, 347-358.
(99) Zafiriou, O. C.; True, M. B. Mar. Chem. 1979, 8, 33-42.
(100) Warneck, P.; Wurzinger, C. J. Phys. Chem. 1988, 92, 6278-6283.
(101) Charbouillot, T.; Gorini, S.; Voyard, G.; Parazols, M.; Brigante, M.; Deguillaume, L.;
Delort, A.-M.; Mailhot, G. Atmos. Environ. 2012, 56, 1-8.
(102) Herckes, P.; Valsaraj, K. T.; Collett Jr, J. L. Atmos. Res. 2013, 132-133, 434-449.

191
(103) Arakaki, T.; Anastasio, C.; Kuroki, Y.; Nakajima, H.; Okada, K.; Kotani, Y.; Handa,
D.; Azechi, S.; Kimura, T.; Tsuhako, A.; Miyagi, Y. Environ. Sci. Technol. 2013, 47,
8196-8203.
(104) Ervens, B.; Sorooshian, A.; Lim, Y. B.; Turpin, B. J. J. Geophys. Res. 2014, 119,
3997-4016.
(105) Tilgner, A.; Herrmann, H. Atmos. Environ. 2010, 44, 5415-5422.
(106) Saxena, P.; Hildemann, L. M. J. Atmos. Chem. 1996, 24, 57-109.
(107) Ervens, B.; Turpin, B. J.; Weber, R. J. Atmos. Chem. Phys. 2011, 11, 11069-11102.
(108) Collett Jr, J. L.; Herckes, P.; Youngster, S.; Lee, T. Atmos. Res. 2008, 87, 232-241.
(109) Decesari, S.; Facchini, M. C.; Fuzzi, S.; McFiggans, G. B.; Coe, H.; Bower, K. N.
Atmos. Environ. 2005, 39, 211-222.
(110) Straub, D. J.; Hutchings, J. W.; Herckes, P. Atmos. Environ. 2012, 47, 195-205.
(111) Hegg, D. A.; Gao, S.; Jonsson, H. Atmos. Res. 2002, 62, 1-10.
(112) Khwaja, H. A. Atmos. Environ. 1995, 29, 127-139.
(113) Collett, J.; Daube, B.; Munger, J. W.; Hoffmann, M. R. Atmos. Environ. 1989, 23,
999-1007.
(114) Kesselmeier, J.; Staudt, M. J. Atmos. Chem. 1999, 33, 23-88.
(115) Khare, P.; Kumar, N.; Kumari, K. M.; Srivastava, S. S. Rev. Geophys. 1999, 37, 227-
248.
(116) Gaeggeler, K.; Prevot, A. S. H.; Dommen, J.; Legreid, G.; Reimann, S.; Baltensperger,
U. Atmos. Environ. 2008, 42, 8278-8287.
(117) Warneck, P. J. Atmos. Chem. 2005, 51, 119-159.
(118) Khare, P.; Satsangi, G. S.; Kumar, N.; Maharaj Kumari, K.; Srivastava, S. S. Atmos.
Environ. 1997, 31, 3867-3875.
(119) Montero, L.; Vasconcellos, P. C.; Souza, S. R.; Pires, M. A. F.; Sanchez-Ccoyllo, O.
R.; Andrade, M. F.; Carvalho, L. R. F. Environ. Sci. Technol. 2001, 35, 3071-3081.
(120) Chebbi, A.; Carlier, P. Atmos. Environ. 1996, 30, 4233-4249.
(121) Kawamura, K.; Kaplan, I. R. Environ. Sci. Technol. 1987, 21, 105-110.
(122) Deguillaume, L.; Tilgner, A.; Schrödner, R.; Wolke, R.; Chaumerliac, N.; Herrmann,
H. J. Atmos. Chem., 64, 1-35.
(123) Johnson, B. J.; Betterton, E. A.; Craig, D. J. Atmos. Chem. 1996, 24, 113-119.
(124) Amato, P.; Demeer, F.; Melaouhi, A.; Fontanella, S.; Martin-Biesse, A. S.; Sancelme,
M.; Laj, P.; Delort, A. M. Atmos. Chem. Phys. 2007, 7, 4159-4169.
192
(125) Rogge, W. F.; Hildemann, L. M.; Mazurek, M. A.; Cass, G. R. Environ. Sci. Technol.
1998, 32, 13-22.
(126) Weathers, K. C.; Likens, G. E.; Bormann, F. H.; Bicknell, S. H.; Bormann, B. T.;
Daube, B. C.; Eaton, J. S.; Galloway, J. N.; Keene, W. C.; et al. Environ. Sci. Technol.
1988, 22, 1018-1026.
(127) Leaitch, W. R.; Banic, C. M.; Isaac, G. A.; Couture, M. D.; Liu, P. S. K.; Gultepe, I.;
Li, S. M.; Kleinman, L.; Daum, P. H.; MacPherson, J. I. J. Geophys. Res., Atmos.
1996, 101, 29123-29135.
(128) Vong, R. J.; Baker, B. M.; Brechtel, F. J.; Collier, R. T.; Harris, J. M.; Kowalski, A.
S.; McDonald, N. C.; McInnes, L. M. Atmos. Environ. 1997, 31, 1991-2001.
(129) Brantner, B.; Fierlinger, H.; Puxbaum, H.; Berner, A. Water, Air, Soil Pollut. 1994,
74, 363-384.
(130) Munger, J. W.; Collett, J.; Daube, B. C.; Hoffmann, M. R. Tellus B 1989, 41B, 230-
242.
(131) Atkinson, R. Atmos. Environ. 2007, 41, 200-240.
(132) Grosjean, D. Atmos. Environ. 1983, 17, 2379-2382.
(133) Herrmann, H. Chem. Rev. 2003, 103, 4691-4716.
(134) Kawamura, K.; Kasukabe, H.; Barrie, L. A. Atmos. Environ. 1996, 30, 1709-1722.
(135) Carlton, A. G.; Turpin, B. J.; Altieri, K. E.; Seitzinger, S.; Reff, A.; Lim, H.-J.;
Ervens, B. Atmos. Environ. 2007, 41, 7588-7602.
(136) Zhao, Y.; Hallar, A. G.; Mazzoleni, L. R. Atmos. Chem. Phys. 2013, 13, 12343-12362.
(137) Wozniak, A. S.; Bauer, J. E.; Sleighter, R. L.; Dickhut, R. M.; Hatcher, P. G. Atmos.
Chem. Phys. 2008, 8, 5099-5111.
(138) Mazzoleni, L. R.; Ehrmann, B. M.; Shen, X.; Marshall, A. G.; Collett, J. L. Environ.
Sci. Technol. 2010, 44, 3690-3697.
(139) Kuznetsova, M.; Lee, C.; Aller, J. Mar. Chem. 2005, 96, 359-377.
(140) Milne, P. J.; Zika, R. G. J. Atmos. Chem. 1993, 16, 361-398.
(141) Saxena, V. K. J. Phys. Chem. 1983, 87, 4130-4134.
(142) Facchini, M. C.; Mircea, M.; Fuzzi, S.; Charlson, R. J. Nature 1999, 401, 257-259.
(143) Zhang, Q.; Anastasio, C. Atmos. Environ. 2001, 35, 5629-5643.
(144) Szyrmer, W.; Zawadzki, I. Bull. Am. Meteorol. Soc. 1997, 78, 209-228.
(145) Zhang, Q.; Anastasio, C. Atmos. Environ. 2003, 37, 2247-2258.
(146) Zhang, Q.; Anastasio, C.; Jimenez-Cruz, M. J. Geophys. Res., Atmos. 2002, 107.
193
(147) O'Sullivan, D.; Murray, B. J.; Ross, J. F.; Whale, T. F.; Price, H. C.; Atkinson, J. D.;
Umo, N. S.; Webb, M. E. Sci. Rep. 2015, 5, 8082.
(148) Edelhoch, H. Biochemistry 1967, 6, 1948-1954.
(149) Pirie, A. Biochem. J. 1972, 128, 1365-1367.
(150) Bonifacic, M.; Stefanic, I.; Hug, G. L.; Armstrong, D. A.; Asmus, K.-D. J. Am. Chem.
Soc. 1998, 120, 9930-9940.
(151) Xu, G.; Chance, M. R. Chem. Rev. 2007, 107, 3514-3543.
(152) Forni, L. G.; Mora-Arellano, V. O.; Packer, J. E.; Willson, R. L. J. Chem. Soc., Perkin
Trans. 2 1986, 1-6.
(153) Bielski, B. H.; Shiue, G. G. In Oxygen free radicals and tissue damage; CIBA
Foundation Symposium, Ed., 1979.
(154) Adams, G. E.; Aldrich, J. E.; Bisby, R. H.; Cundall, R. B.; Redpath, J. L.; Willson, R.
L. Radiat. Res. 1972, 49, 278-289.
(155) Muller, C. L.; Baker, A.; Hutchinson, R.; Fairchild, I. J.; Kidd, C. Atmos. Environ.
2008, 42, 8036-8045.
(156) Kiss, G.; Tombacz, E.; Varga, B.; Alsberg, T.; Persson, L. Atmos. Environ. 2003, 37,
3783-3794.
(157) Zappoli, S.; Andracchio, A.; Fuzzi, S.; Facchini, M. C.; Gelencser, A.; Kiss, G.;
Krivacsy, Z.; Molnar, Ã.; Meszaros, E.; Hansson, H. C.; Rosman, K.; Zebuhr, Y.
Atmos. Environ. 1999, 33, 2733-2743.
(158) Havers, N.; Burba, P.; Lambert, J.; Klockow, D. J. Atmos. Chem. 1998, 29, 45-54.
(159) McFiggans, G.; Alfarra, M. R.; Allan, J.; Bower, K.; Coe, H.; Cubison, M.; Topping,
D.; Williams, P.; Decesari, S.; Facchini, C.; Fuzzi, S. Faraday Discuss. 2005, 130,
341-362.
(160) Coble, P. G. Mar. Chem. 1996, 51, 325-346.
(161) Venzac, H.; Sellegri, K.; Villani, P.; Picard, D.; Laj, P. Atmos. Chem. Phys. 2009, 9,
1465-1478.
(162) Rose, C.; Boulon, J.; Hervo, M.; Holmgren, H.; Asmi, E.; Ramonet, M.; Laj, P.;
Sellegri, K. Atmos. Chem. Phys. 2013, 13, 11573-11594.
(163) Freney, E. J.; Sellegri, K.; Canonaco, F.; Boulon, J.; Hervo, M.; Weigel, R.; Pichon, J.
M.; Colomb, A.; Prevot, A. S. H.; Laj, P. Atmos. Chem. Phys. 2011, 11, 13047-13059.
(164) Bourcier, L.; Sellegri, K.; Chausse, P.; Pichon, J. M.; Laj, P. J. Atmos. Chem. 2012,
69, 47-66.

194
(165) Hervo, M.; Sellegri, K.; Pichon, J.; Roger, J.; Laj, P. Atmos. Chem. Phys. 2014, 14,
27731-27767.
(166) Asmi, E.; Freney, E.; Hervo, M.; Picard, D.; Rose, C.; Colomb, A.; Sellegri, K. Atmos.
Chem. Phys. 2012, 12, 11589-11607.
(167) Mertes, S.; Schwarzenback, A.; Laj, P.; Wobrock, W.; Pichon, J.-M.; Orsi, G.;
Heintzenberg, J. Atmos. Res. 2001, 58, 267-294.
(168) Guyot, G.; Gourbeyre, C.; Febvre, G.; Shcherbakov, V.; Burnet, F.; Dupont, J. C.;
Sellegri, K.; Jourdan, O. Atmos. Meas. Tech. 2015, 8, 4347-4367.
(169) Stein, A. F.; Draxler, R. R.; Rolph, G. D.; Stunder, B. J. B.; Cohen, M. D.; Ngan, F.
Bull. Am. Meteorol. Soc. 2015, 96, 2059-2077.
(170) Dulin, D.; Mill, T. Environ. Sci. Technol. 1982, 16, 815-820.
(171) Miller, W. L.; Kester, D. R. Anal. Chem. 1988, 60, 2711-2715.
(172) Stookey, L. L. Anal. Chem. 1970, 42, 779-781.
(173) Kieber, R. J.; Seaton, P. J. Anal. Chem. 1995, 67, 3261-3264.
(174) Altieri, K. E.; Seitzinger, S. P.; Carlton, A. G.; Turpin, B. J.; Klein, G. C.; Marshall,
A. G. Atmos. Environ. 2008, 42, 1476-1490.
(175) Perri, M. J.; Seitzinger, S.; Turpin, B. J. Atmos. Environ. 2009, 43, 1487-1497.
(176) Tan, Y.; Lim, Y. B.; Altieri, K. E.; Seitzinger, S. P.; Turpin, B. J. Atmos. Chem. Phys.
2011, 12, 801-813.
(177) Ervens, B.; Volkamer, R. Atmos. Chem. Phys. 2010, 10, 8219-8244.
(178) De Haan, D. O.; Tolbert, M. A.; Jimenez, J. L. Geophys. Res. Lett. 2009, 36, L11819.
(179) Yu, X.-Y.; Barker, J. R. J. Phys. Chem. A 2003, 107, 1325-1332.
(180) Zellner, R.; Exner, M.; Herrmann, H. J. Atmos. Chem. 1990, 10, 411-425.
(181) Zafiriou, O. C.; Bonneau, R. J. Photochem. Photobiol. 1987, 45, 723-727.
(182) Hervo, M., Etude des propriétés optiques et radiatives des aérosols en atmosphère
réelle : impact de l'hygroscopicité. Blaise Pascal University, 2013.
(183) Miller, W. L.; Kester, D. R. Anal. Chem. 2002, 60, 2711-2715.
(184) Parazols, M.; Marinoni, A.; Amato, P.; Abida, O.; Laj, P.; Mailhot, G. J. Atmos.
Chem. 2006, 54, 267-281.
(185) Vaitilingom, M.; Deguillaume, L.; Vinatier, V.; Sancelme, M.; Amato, P.;
Chaumerliac, N.; Delort, A.-M. Proc. Natl. Acad. Sci. 2013, 110, 559-564.
(186) R Core Team Vienna, Austria, 2013.
(187) Lê, S.; Josse, J.; Husson, F. J. Stat. Softw. 2008, 25, 1-18.

195
(188) Deming, S. N.; Michotte, Y.; Massart, D. L.; Kaufman, L.; Vandeginste, B. G. M.
Chemometrics: A textbook, 1st Edition; Elsevier Science, 1988.
(189) Charbouillot, T.; Brigante, M.; Mailhot, G.; Maddigapu, P. R.; Minero, C.; Vione, D.
J. Photochem. Photobiol., A 2011, 222, 70-76.
(190) Neta, P.; Huie, R. E.; Ross, A. B. J. Phys. Chem. Ref. Data 1988, 17, 1027-1284.
(191) Draxler, R. R.; Rolph, G. D., 2012.
(192) Leriche, M.; Chaumerliac, N.; Monod, A. Atmos. Environ. 2001, 35, 5411-5423.
(193) Madronich, S.; Flocke, S. In Environmental Photochemistry; Boule, P., Ed.; Springer
Berlin Heidelberg, 1999; Vol. 2 / 2L.
(194) Smith, R. M.; Martell, A. E. Critical Stability Constants, Volume 4: Inorganic
Complexes: New York, 1976.
(195) Bielski, B. H. J.; Cabelli, D. E.; Arudi, R. L.; Ross, A. B. J. Phys. Chem. Ref. Data
1985, 14, 1041-1100.
(196) Park, J. Y.; Lee, Y. N. J. Phys. Chem. 1988, 92, 6294-6302.
(197) Riordan, E.; Minogue, N.; Healy, D.; O'Driscol, P.; Sodeau, J. R. J. Phys. Chem. A
2005, 109, 779-786.
(198) IUPAC SC-Database: A comprehensive database of published data on equilibrium
constants of metal complexes and ligands
(199) Goldstein, S.; Czapski, G. Inorg. Chem. 1997, 36, 4156-4162.
(200) Marsh, A. R. W.; McElroy, W. J. Atmos. Environ. 1985, 19, 1075-1080.
(201) Maash, H. G. In Heterogenous Atmospheric Chemistry, Geophys. Monogr. Ser.;
Schryer, D. R., Ed.; AGU: Washington, D. C., 1982; Vol. 6.
(202) Cotton, F. A.; Wilkinson, G. Advanced inorganic chemistry: a comprehensive text; 4th
ed.; John Wiley & Sons: New York, 1980.
(203) Eigen, M.; Krause, W.; Maash, H. G.; Demaeyer, L. In Progress in reaction kinetics;
Porter, G., Ed.; Macmillan: N. J., 1964; Vol. 2.
(204) Brandt, C.; van Eldik, R. Chem. Rev. 1995, 95, 119-190.
(205) Albinet, A.; Minero, C.; Vione, D. Sci. Total Environ. 2010, 408, 3367-3373.
(206) Arakaki, T.; Kuroki, Y.; Okada, K.; Nakama, Y.; Ikota, H.; Kinjo, M.; Higuchi, T.;
Uehara, M.; Tanahara, A. Atmos. Environ. 2006, 40, 4764-4774.
(207) Anastasio, C.; McGregor, K. G. Atmos. Environ. 2001, 35, 1079-1089.
(208) Okochi, H.; Brimblecombe, P. Sci. World. J. 2002, 2, 767-786.
(209) Weller, C.; Tilgner, A.; Brauer, P.; Herrmann, H. Environ. Sci. Technol. 2014, 48,
5652-5659.

196
(210) Kulka, D.; Hall, A. N.; Walker, T. K. Nature 1951, 167, 905-906.
(211) Smith, T. N.; Hash, K.; Davey, C.-L.; Mills, H.; Williams, H.; Kiely, D. E. Carbohydr.
Res. 2012, 350, 6-13.
(212) van Pinxteren, D.; Neusus, C.; Herrmann, H. Atmos. Chem. Phys. 2014, 14, 3913-
3928.
(213) Herrmann, H.; Wolke, R.; Muller, K.; Bruggemann, E.; Gnauk, T.; Barzaghi, P.;
Mertes, S.; Lehmann, K.; Massling, A.; Birmili, W.; Wiedensohler, A.; Wieprecht,
W.; Acker, K.; Jaeschke, W.; Kramberger, H.; Svrcina, B.; Bachmann, K.; Collett Jr,
J. L.; Galgon, D.; Schwirn, K.; Nowak, A.; van Pinxteren, D.; Plewka, A.;
Chemnitzer, R.; Rud, C.; Hofmann, D.; Tilgner, A.; Diehl, K.; Heinold, B.;
Hinneburg, D.; Knoth, O.; Sehili, A. M.; Simmel, M.; Wurzler, S.; Majdik, Z.;
Mauersberger, G.; Muller, F. Atmos. Environ. 2005, 39, 4169-4183.
(214) Neusüss, C.; Pelzing, M.; Plewka, A.; Herrmann, H. J. Geophys. Res., Atmos. 2000,
105, 4513-4527.
(215) Qi, J.; Xin, L.; Chadderdon, D. J.; Qiu, Y.; Jiang, Y.; Benipal, N.; Liang, C.; Li, W.
Appl. Catal., B 2014, 154-155, 360-368.
(216) Herrmann, H.; Barzaghi, P.; Hesper, J. In Kinetic and spectroscopic investigations of
OH radical reactions with tropospheric relevant compounds in aqueous solution,
2000, Poster.
(217) Zellner, R.; Exner, M.; Herrmann, H. Journal of Atmospheric Chemistry 1990, 10,
411-425.
(218) Fuzzi, S.; Baltensperger, U.; Carslaw, K.; Decesari, S.; Denier Van Der Gon, H.;
Facchini, M.; Fowler, D.; Koren, I.; Langford, B.; Lohmann, U. Atmos. Chem. Phys.
2015, 15, 8217-8299.
(219) Poschl, U. Angew. Chem. 2005, 44, 7520-7540.
(220) Saxena, P.; Hildemann, L. M.; McMurry, P. H.; Seinfeld, J. H. J. Geophys. Res.,
Atmos. 1995, 100, 18755-18770.
(221) Miyazaki, Y.; Kondo, Y.; Takegawa, N.; Komazaki, Y.; Fukuda, M.; Kawamura, K.;
Mochida, M.; Okuzawa, K.; Weber, R. J. Geophys. Res., Atmos. 2006, 111, D23.
(222) Kondo, Y.; Miyazaki, Y.; Takegawa, N.; Miyakawa, T.; Weber, R.; Jimenez, J.;
Zhang, Q.; Worsnop, D. J. Geophys. Res., Atmos. 2007, 112, D1.
(223) Shulman, M. L.; Jacobson, M. C.; Carlson, R. J.; Synovec, R. E.; Young, T. E.
Geophys. Res. Lett. 1996, 23, 277-280.
197
(224) Kiss, G.; Varga, B.; Galambos, I.; Ganszky, I. J. Geophys. Res., Atmos. 2002, 107
8339.
(225) Sullivan, A.; Weber, R.; Clements, A.; Turner, J.; Bae, M.; Schauer, J. Geophys. Res.
Lett. 2004, 31, L13105.
(226) Matsumoto, K.; Uematsu, M. Atmos. Environ. 2005, 39, 2163-2170.
(227) Bigg, E. K.; Leck, C. J. Geophys. Res., Atmos. 2008, 113, D11209.
(228) Sharma, V. K.; Graham, N. J. Ozone: Sci. Eng. 2010, 32, 81-90.
(229) Lin, P.; Rincon, A. G.; Kalberer, M.; Yu, J. Z. Environ. Sci. Technol. 2012, 46, 7454-
7462.
(230) Hawkins, L. N.; Lemire, A. N.; Galloway, M. M.; Corrigan, A. L.; Turley, J. J.;
Espelien, B. M.; De Haan, D. O. Environ. Sci. Technol. 2016, 50(14), 7443-7452.
(231) Vaitilingom, M.; Amato, P.; Sancelme, M.; Laj, P.; Leriche, M.; Delort, A.-M. Appl.
Environ. Microbiol. 2009, 76, 23-29.
(232) McLaren, A.; Gentile, P.; Kirk, D. C.; Levin, N. A. J. Polym. Sci. 1953, 10, 333-344.
(233) Bianco, A.; Passananti, M.; Deguillaume, L.; Mailhot, G.; Brigante, M. Atmos.
Environ. 2016, 137, 53-61.
(234) McGregor, K. G.; Anastasio, C. Atmos. Environ. 2001, 35, 1091-1104.
(235) Mulligan, C. N.; Sharma, S. K.; Mudhoo, A. Biosurfactants: research trends and
applications; CRC Press, 2014.
(236) Li, X.; Hede, T.; Tu, Y.; Leck, C.; Agren, H. Tellus B 2013, 65.
(237) Mopper, K.; Zika, R. G. Nature 1987, 325, 246-249.
(238) Kristensson, A.; Rosenorn, T.; Bilde, M. J. Phys. Chem. A 2009, 114, 379-386.
(239) Scheller, E. Atmos. Environ. 2001, 35, 2179-2192.
(240) Gorzelska, K.; Galloway, J. N.; Watterson, K.; Keene, W. C. Atmos. Environ. A-Gen.
1992, 26, 1005-1018.
(241) Bianco, A.; Minella, M.; De Laurentiis, E.; Maurino, V.; Minero, C.; Vione, D.
Chemosphere 2014, 111, 529-536.
(242) Muller, C. L.; Kidd, C.; Fairchild, I. J.; Baker, A. Atmos. Res. 2010, 96, 241-255.
(243) Ervens, B.; Gligorovski, S.; Herrmann, H. Phys. Chem. Chem. Phys. 2003, 5, 1811-
1824.
(244) Ishida, Y.; Fujita, T.; Asai, K. J. Chromatogr., A 1981, 204, 143-148.
(245) Fountoulakis, M.; Lahm, H.-W. J. Chromatogr., A 1998, 826, 109-134.
198
(246) Deguillaume, L.; Leriche, M.; Amato, P.; Ariya, P. A.; Delort, A. M.; Poschl, U.;
Chaumerliac, N.; Bauer, H.; Flossmann, A. I.; Morris, C. E. Biogeosciences 2008, 5,
1073-1084.
(247) Després, V. R.; Huffman, J. A.; Burrows, S. M.; Hoose, C.; Safatov, A. S.; Buryak,
G.; Frohlich-Nowoisky, J.; Elbert, W.; Andreae, M. O.; Poschl, U.; Jaenicke, R. Tellus
B 2012, 64, 15598.
(248) Zhu, C.; Kawamura, K.; Kunwar, B. C. J. D. J. Geophys. Res. Atmos. 2015, 120,
5504-5523.
(249) Möhler, O.; DeMott, P. J.; Vali, G.; Levin, Z. Biogeosciences 2007, 4, 1059-1071.
(250) Morris, C. E.; Conen, F.; Alex Huffman, J.; Phillips, V.; Pöschl, U.; Sands, D. C.
Glob. Change Biol. 2014, 20, 341-351.
(251) Spracklen, D. V.; Heald, C. L. Atmos. Chem. Phys. 2014, 14, 9051-9059.
(252) Ge, X.; Wexler, A. S.; Clegg, S. L. Atmos. Environ. 2011, 45, 524-546.
(253) Zhang, Q.; Anastasio, C.; Jimenez-Cruz, M. J. Geophys. Res. Atmos. 2002, 107, AAC
3-1-AAC 3-9.
(254) Mace, K. A.; Artaxo, P.; Duce, R. A. C. J. Geophys. Res. Atmos. 2003, 108.
(255) Milne, P.; Zika, R. J. Atmos. Chem. 1993, 16, 361-398.
(256) Scheller, E. Atmos. Environ. 2001, 35, 2179-2192.
(257) Mace, K. A.; Kubilay, N.; Duce, R. A. C. J. Geo. Res. Atmos. 2003, 108.
(258) Wedyan, M. A.; Preston, M. R. Atmos. Environ. 2008, 42, 8698-8705.
(259) Scalabrin, E.; Zangrando, R.; Barbaro, E.; Kehrwald, N. M.; Gabrieli, J.; Barbante, C.;
Gambaro, A. Atmos. Chem. Phys. 2012, 12, 10453-10463.
(260) Chan, M. N.; Choi, M. Y.; Ng, N. L.; Chan, C. K. Environ. Sci. Technol. 2005, 39,
1555-1562.
(261) Hock, N.; Schneider, J.; Borrmann, S.; Rompp, A.; Moortgat, G.; Franze, T.; Schauer,
C.; Poschl, U.; Plass-Dulmer, C.; Berresheim, H. Atmos. Chem. Phys. 2008, 8, 603-
623.
(262) McFiggans, G.; Artaxo, P.; Baltensperger, U.; Coe, H.; Facchini, M. C.; Feingold, G.;
Fuzzi, S.; Gysel, M.; Laaksonen, A.; Lohmann, U.; Mentel, T. F.; Murphy, D. M.;
O'Dowd, C. D.; Snider, J. R.; Weingartner, E. Atmos. Chem. Phys. 2006, 6, 2593-
2649.
(263) Schwier, A. N.; Viglione, G. A.; Li, Z.; Faye McNeill, V. Atmos. Chem. Phys. 2013,
13, 10721-10732.

199
(264) De Haan, D. O.; Corrigan, A. L.; Tolbert, M. A.; Jimenez, J. L.; Wood, S. E.; Turley,
J. J. Environ. Sci. Technol. 2009, 43, 8184-8190.
(265) Barbaro, E.; Zangrando, R.; Vecchiato, M.; Piazza, R.; Cairns, W. R. L.; Capodaglio,
G.; Barbante, C.; Gambaro, A. Atmos. Chem. Phys. 2015, 15, 5457-5469.
(266) Mandalakis, M.; Apostolaki, M.; Tziaras, T.; Polymenakou, P.; Stephanou, E. G.
Atmos. Environ. 2011, 45, 1003-1009.
(267) Mochizuki, T.; Kawamura, K.; Aoki, K. Aerosol Air Qual. Res. 2016, 16, 632-639.
(268) Zhang, Q.; Anastasio, C. Atmos. Environ. 2001, 35, 5629-5643.
(269) Herckes, P.; Valsaraj, K. T.; Collett Jr, J. L. Atmos. Res. 2013, 132-133, 434-449.
(270) Herrmann, H.; Schaefer, T.; Tilgner, A.; Styler, S. A.; Weller, C.; Teich, M.; Otto, T.
Chem. Rev. 2015, 115, 4259-4334.
(271) Creed, D. Photochem. Photobiol. 1984, 39, 537-562.
(272) Suzuki, J.; Ueki, T.; Shimizu, S.; Uesugi, K.; Suzuki, S. Chemosphere 1985, 14, 493-
500.
(273) Bianco, A.; Passananti, M.; Perroux, H.; Voyard, G.; Mouchel-Vallon, C.;
Chaumerliac, N.; Mailhot, G.; Deguillaume, L.; Brigante, M. Atmos. Chem. Phys.
2015, 15, 13923-13955.
(274) Dulin, D.; Mill, T. Environ. Sci. Technol. 1982, 16, 815-820.
(275) Mayer, L. M.; Schick, L. L.; Loder Iii, T. C. Mar. Chem. 1999, 64, 171-179.
(276) Vivian, J. T.; Callis, P. R. Biophys. J. 2001, 80, 2093-2109.
(277) Determann, S.; Lobbes, J. M.; Reuter, R.; Rullkotter, J. Mar. Chem. 1998, 62, 137-
156.
(278) Hudson, N.; Baker, A.; Reynolds, D. River Res. Appl. 2007, 23, 631-649.
(279) Domingues, M. R. M.; Domingues, P.; Reis, A.; Fonseca, C.; Amado, F. M. L.;
Ferrer-Correia, A. J. V. J. Am. Soc. Mass Spectrom. 2003, 14, 406-416.
(280) Turjanski, A. G.; Rosenstein, R. E.; Estrin, D. A. J. Med. Chem. 1998, 41, 3684-3689.
(281) Hinman, R. L.; Lang, J. Biochemistry 1965, 4, 144-158.
(282) Temussi, F.; Cermola, F.; DellaGreca, M.; Iesce, M. R.; Passananti, M.; Previtera, L.;
Zarrelli, A. J. Pharm. Biomed. Anal. 2011, 56, 678-683.
(283) Intergovernmental Panel on Climate Change, http://www.ipcc.ch/.
(284) Houdier, S. p.; Barret, M.; Dominé, F.; Charbouillot, T.; Deguillaume, L.; Voisin, D.
Anal. Chim. Acta 2011, 704, 162-173.
(285) Zellner, R.; Exner, M.; Herrmann, H. J. Atmos. Chem. 1990, 10, 411-425.
(286) Yu, X.-Y.; Barker, J. R. J. Phys. Chem. A 2003, 107, 1313-1324.

200
(287) Bianco, A.; Passananti, M.; Perroux, H.; Voyard, G.; Mouchel-Vallon, C.;
Chaumerliac, N.; Mailhot, G.; Deguillaume, L.; Brigante, M. Atmos. Chem. Phys.
2015, 15, 9191-9202.
(288) Delort, A.-M.; Vaitilingom, M.; Amato, P.; Sancelme, M.; Parazols, M.; Mailhot, G.;
Laj, P.; Deguillaume, L. Atmos. Res. 2010, 98, 249-260.
(289) Burrows, S. M.; Elbert, W.; Lawrence, M. G.; Poschl, U. Atmos. Chem. Phys. 2009, 9,
9263-9280.
(290) Amato, P.; Menager, M.; Sancelme, M.; Laj, P.; Mailhot, G.; Delort, A.-M. Atmos.
Environ. 2005, 39, 4143-4153.
(291) Amato, P.; Parazols, M.; Sancelme, M.; Laj, P.; Mailhot, G.; Delort, A.-M. FEMS
Microbiol. Ecol. 2007, 59, 242-254.
(292) Vaitilingom, M. l.; Attard, E. O.; Gaiani, N.; Sancelme, M.; Deguillaume, L.;
Flossmann, A. I.; Amato, P.; Delort, A.-M. Atmos. Environ. 2012, 56, 88-100.
(293) Ahern, H. E.; Walsh, K. A.; Hill, T. C. J.; Moffett, B. F. Biogeosciences 2007, 4, 115-
124.
(294) Fuzzi, S.; Mandrioli, P.; Perfetto, A. Atmos. Environ. 1997, 31, 287-290.
(295) DeLeon-Rodriguez, N.; Lathem, T. L.; Rodriguez-R, L. M.; Barazesh, J. M.;
Anderson, B. E.; Beyersdorf, A. J.; Ziemba, L. D.; Bergin, M.; Nenes, A.;
Konstantinidis, K. T. Proc. Natl. Acad. Sci. 2013, 110, 2575-2580.
(296) Kourtev, P. S.; Hill, K. A.; Shepson, P. B.; Konopka, A. Atmos. Environ. 2011, 45,
5399-5405.
(297) Santl-Temkiv, T.; Finster, K.; Dittmar, T.; Hansen, B. M.; Thyrhaug, R.; Nielsen, N.
W.; Karlson, U. G. PLoS One 2013, 8, e53550.
(298) Matulova, M.; Husarova, S.; Capek, P.; Sancelme, M.; Delort, A.-M. Environ. Sci.
Technol. 2014, 48, 14238-14247.
(299) Joly, M.; Amato, P.; Sancelme, M.; Vinatier, V.; Abrantes, M.; Deguillaume, L.;
Delort, A.-M. Atmos. Environ. 2015, 117, 92-98.
(300) Sattler, B.; Puxbaum, H.; Psenner, R. Geophys. Res. Lett. 2001, 28, 239-242.
(301) Amato, P.; Demeer, F.; Melaouhi, A.; Fontanella, S.; Martin-Biesse, A. S.; Sancelme,
M.; Laj, P.; Delort, A. M. Atmos. Chem. Phys. 2007, 7, 4159-4169.
(302) Hill, K. A.; Shepson, P. B.; Galbavy, E. S.; Anastasio, C.; Kourtev, P. S.; Konopka,
A.; Stirm, B. H. C. D. Journal of Geophysical Research: Atmospheres 2007, 112.
(303) Charbouillot, T.; Gorini, S.; Voyard, G.; Parazols, M.; Brigante, M.; Deguillaume, L.;
Delort, A.-M.; Mailhot, G. Atmos. Environ. 2012, 56, 1-8.

201
(304) Griffith, E. C.; Carpenter, B. K.; Shoemaker, R. K.; Vaida, V. Proc. Natl. Acad. Sci.
2013, 110, 11714-11719.
(305) Ervens, B.; Feingold, G.; Frost, G. J.; Kreidenweis, S. M. J. Geophys. Res. 2004, 109,
D15205.
(306) Warneck, P. Atmos. Environ. 2003, 37, 2423-2427.
(307) Tan, Y.; Carlton, A. G.; Seitzinger, S. P.; Turpin, B. J. Atmos. Environ. 2010, 44,
5218-5226.
(308) <http://www.genome.jp/kegg/pathway.html>.
(309) Schrader, J.; Schilling, M.; Holtmann, D.; Sell, D.; Filho, M. V.; Marx, A.; Vorholt, J.
A. Trends Biotechnol. 2009, 27, 107-115.
(310) Husarova, S.; Vaitilingom, M.; Deguillaume, L.; Traikia, M.; Vinatier, V.; Sancelme,
M.; Amato, P.; Matulova, M.; Delort, A.-M. Atmos. Environ. 2011, 45, 6093-6102.
(311) http://www.genome.jp/kegg-bin/show_pathway?rn00020+R00342.
(312) Ariya, P. A.; Nepotchatykh, O.; Ignatova, O.; Amyot, M. C. Geophys. Res. Lett. 2002,
29, 34-1-34-4.
(313) Côté, V.; Kos, G.; Mortazavi, R.; Ariya, P. A. Sci. Total Environ. 2008, 390, 530-537.
(314) Vaïtilingom, M.; Amato, P.; Sancelme, M.; Laj, P.; Leriche, M.; Delort, A.-M. Appl.
Environ. Microbiol. 2010, 76, 23-29.
(315) Vaitilingom, M.; Charbouillot, T.; Deguillaume, L.; Maisonobe, R.; Parazols, M.;
Amato, P.; Sancelme, M.; Delort, A. M. Atmos. Chem. Phys. 2011, 11, 8721-8733.
(316) Herlihy, L. J.; Galloway, J. N.; Mills, A. L. Atmos. Environ. 1987, 21, 2397-2402.
(317) Krumins, V.; Mainelis, G.; Kerkhof, L. J.; Fennell, D. E. Environ. Sci. Technol. Lett.
2014, 1, 376-381.
(318) Vorob'eva, L. I. Appl. Biochem. Microbiol. 2004, 40, 217-224.
(319) Dieser, M.; Greenwood, M.; Foreman, C. M. Arct., Antarc., Alp. Res. 2010, 42, 396-
405.
(320) Tong, Y.; Lighthart, B. FEMS Microbiol. Ecol. 1998, 26, 311-316.
(321) Fahlgren, C.; Hagstrom, Ã.; Nilsson, D.; Zweifel, U. L. Appl. Environ. Microbiol.
2010, 76, 3015-3025.
(322) Zweifel, U. L.; Hagstrom, Ã. k.; Holmfeldt, K.; Thyrhaug, R.; Geels, C.; Frohn, L. M.;
Skjeth, C. A.; Karlson, U. G. Aerobiologia 2012, 28, 481-498.
(323) Davey, M.; O'toole, G. Microbiol. Mol. Biol. Rev. 2000, 64, 847-867.
(324) Marinoni, A.; Parazols, M.; Brigante, M.; Deguillaume, L.; Amato, P.; Delort, A.-M.;
Laj, P.; Mailhot, G. Atmos. Res. 2011, 101, 256-263.

202
(325) Cheize, M.; Sarthou, G. r.; Croot, P. L.; Bucciarelli, E.; Baudoux, A.-C.; Baker, A. R.
Anal. Chim. Acta 2012, 736, 45-54.
(326) Gledhill, M.; Buck, K. N. Front. Microbiol. 2012, 3.
203
UNIVERSITE BLAISE PASCAL
U.F.R. Sciences et Technologies
ECOLE DOCTORALE DES SCIENCES FONDAMENTALES
Résumé de THESE
Présenté pour obtenir le grade de
DOCTEUR D’UNIVERSITE
Spécialité : Chimie Physique
Angelica BIANCO
Formation photoinduite du radical hydroxyle dans la phase
aqueuse du nuage : impact sur les acides carboxyliques et les
acides aminés.
204
Le cycle de l'eau vise à stocker de l'eau et à la déplacer sur, dans et au-dessus de la Terre. Les
transformations chimiques et photochimiques dans les eaux de surface et souterraines ont
réveillé l'intérêt de la communauté scientifique pour la raison que l'eau est un des besoins les
plus primordiaux de l'humanité et de formes de vie sur la Terre. Bien que l'atmosphère ne
puisse pas être un grand entrepôt d'eau, c'est la voie la plus rapide de déplacement de l'eau
autour du globe. Pour avoir une vision complète du devenir des composés, il faut considérer
aussi les transformations dans l’eau en phase vapeur : pour cette raison il est nécessaire
d'étudier la composition de phase aqueuse atmosphérique et sa réactivité, dans le but de
comprendre comment les émissions naturelles et anthropogéniques peuvent influencer la
déposition de polluants et le cycle des nuages. Ma thèse est donc centrée sur l’étude de l'eau
de nuage.
Pourquoi étudier l’eau de nuage ? On commence par le cycle de l’eau : l’eau s’évapore des
océans et plus généralement des eaux de surface, se condense, forme les nuages puis précipite
sous formes de pluie, de neige ou de grêle. Mais ce cycle n’est pas si simple : nous n’aurions
pas les nuages sans la présence de noyaux de condensation, des petites particules qui facilitent
la formation des gouttelettes, que nous appelons en anglais CCN (cloud condensation nuclei).
De plus, les émissions naturelles ou anthropogéniques sous forme de particules, d’aérosols ou
de gaz, peuvent être englobés dans les gouttelettes des nuages où elles sont transformés
chimiquement, photochimiquement ou bien subissent des transformations microbiologiques
ou des redistribution en fonction de la microphysique. Les composés transformés peuvent
subir une déposition sèche ou humide (sous forme de pluie) ou, si l’eau s’évapore, rester dans
l’atmosphère. Ces transformations peuvent avoir un impact sur la pollution de l’atmosphère si
elles rendent ces composés plus polluants. Ce n’est pas le seul effet car l’eau peut s’évaporer
de la gouttelette et le noyau solide, ou liquide concentré, appelé aérosol secondaire (SOA,
Secondary organic aerosol) peut agir à son tour comme noyau de condensation. Les émissions
ont un impact sur la formation d’aérosol, sur le cycle de nuage et, plus globalement, un impact
sur le cycle de l’eau.
La première étude concernant les nuages a été publiée en 1922 par Bergeron, qui a découvert
l’importance des CCN. Ensuite, pendant plus de 60 ans, il y a eu un développement
impressionnant des recherches au sujet de la microphysique des nuages. D’un point de vue
chimique, l’intérêt scientifique pour l’étude de l’atmosphère a commencé avec les
phénomènes de pollution du dernier siècle, comme le smog de Londres (1952). En premier
lieu les chercheurs se sont occupés de la phase gazeuse, de sa composition et réactivité.
Seulement à partir de 1982 on assiste au développement des études sur la chimie de l’eau de

205
nuage : sur la composition chimique, sur les oxydants majeurs et sur la caractérisation de la
matière organique. A partir de 1990 on a le plein développement de la recherche sur ces
sujets.
Le nuage est un milieu atmosphérique très complexe : il y a environ 100 gouttelettes d’eau et
de mille à cent mille particules d’aérosol par centimètre cube, en fonction de la propreté de
l’air. C’est un milieu dynamique et gouverné par la microphysique où la gouttelette d’eau est
en équilibre entre évaporation et condensation et son temps de vie est très court (de quelques
secondes à quelques minutes).
La première question que les chercheurs se sont posé est : « quelle est la composition de l’eau
de nuage ? ». Les composés présents dans l’eau des nuages peuvent provenir de la dissolution
de la fraction soluble du CCN au moment de la formation de la gouttelette ou par le transfert
de la phase gaz à la phase liquide. Le camembert en Figure 1 présente les principaux ions
inorganiques, dont la concentration varie de 10 à 200 µM. La valeur de pH est de 5,2 en
moyenne mais peut varier entre 4 et 7. Plusieurs oxydants sont présents, comme le peroxyde
d’hydrogène, avec une concentration allant jusqu'à 50 µM. Si les composants inorganiques et
leur concentration sont désormais bien connus, la matière organique est beaucoup moins
caractérisée : 1% environ d’aldéhydes, 10% d’acides carboxyliques et 89 % est inconnu à ce
jour.
Figure 1: Composition organique et inorganique de la phase aqueuse du nuage.
[1] Deguillaume, L. et al., Atmos. Chem. Phys. 2014, 14, (3), 1485-1506.
Si la composition est peu connue, la réactivité l’est moins encore : la plupart des études
concernent la phase liquide alors que la réactivité à l’interface n’a jamais été étudiée. A
l’obscurité, on peut avoir la réaction de Fenton et de l’ozone, même si celui-ci est limité par la

206
faible solubilité du gaz. La majorité des réactions sont de type photochimique : on peut avoir
la photolyse directe du composé, comme observé par l’acide pyruvique qui donne l’acide
lactique, l’acide acétique et l’acétoïne. Seulement peu de composés peuvent absorber la
radiation solaire : de ce fait la photolyse directe est rarement observée et la majorité des
réactions est de type « photolyse indirecte ». Des espèces réactives sont produites par
photolyse directe de précurseurs tels que le peroxyde d’hydrogène, les nitrates et les nitrites et
ces espèces réagissent avec les composés organiques. L’espèce la plus réactive est le radical
hydroxyle (HO•) qui réagit selon différentes voies : par addiction sur les doubles liaisons,
extraction d’hydrogène, transfert d’électron ou addition sur anneau aromatique. Chaque
composé absorbe différemment la lumière et réagit différemment avec le radical hydroxyle.
Pour ce motif, c’est bien difficile de comprendre les chemins de dégradation des composés.
Cette introduction permet de comprendre que l’eau de nuage est un milieu peu connu mais
très important d’un point de vu chimique, pour la transformation chimique des composés mais
aussi pour leur déposition sèche ou humide sur la surface terrestre ou, encore pour leur
transport. De plus, les nuages sont responsables de l’effet serre de notre planète et la
formation d’aérosol secondaire peut potentiellement amener à un changement de la
quantité/fréquence des nuages, qui peut impacter la température terrestre. Pour ce motif, il est
nécessaire d’étudier l’eau de nuage, en particulier sa composition organique et sa réactivité.
Ma thèse se développe sur trois axes principaux : la capacité oxydante de l’eau de nuage, à
travers l’étude de la photogeneration du radical hydroxyle et de la corrélation entre sa vitesse
de formation et la concentration des sources inorganiques ; la caractérisation de la
composition organique de l’eau de nuage, a travers la détection et quantification du
tryptophane et de 16 acides aminés ; J’ai ensuite étudié la réactivité par photolyse directe et
indirecte de l’acide tartronique, un acide à trois atomes de carbone qui peut être considéré un
proxy de plusieurs composés dans l’atmosphère, et du tryptophane. La Figure 2 schématise les
axes principaux de mon travail : l’étude de la capacité oxydante, en bleu, la caractérisation, en
vert, et la réactivité, en rouge.
207
Figure 2: Schématisation des mécanismes dans la gouttelette de l'eau de nuage.
Le travail sur l’eau de nuage implique forcement un échantillonnage. Contrairement à ce
qu’on pense, l’échantillonnage du nuage est très difficile : il faut avoir un bon site et le
matériel approprié. L’eau de nuage est prélevée sur le toit de l’observatoire au sommet du puy
de Dôme, où plusieurs paramètres comme la température, le contenu en eau liquide, le rayon
des gouttelettes et le contenu en eau liquide sont mesurés en continu. L’eau de nuage est
prélevée grâce à l’impacteur à nuage, composé d’une pompe d’aspiration et d’un impacteur
montré en Figure 3.
Figure 3: Impacteur à nuage.
Le vent impacte sur la plaque de l’impacteur et les gouttelettes de nuage sont aspirées par la
fente. Elles impactent sur la plaque de collection et sont récoltées sous forme de solution dans
le collecteur. L’eau de nuage est ensuite filtrée et caractérisée spectroscopiquement par
matrice de fluorescence (EEM, Excitation Emission Matrix) et par spectre UV-Visible. On

208
mesure également des parametres physico-chimiques (la température, le potentiel redox, le
pH), la composition chimique à travers la concentration des principaux cations et anions et le
carbone organique dissout, et la concentration des oxydants majeurs (H2O2, fer, nitrites). De
plus, pendent la thèse on a commencé à mesurer la vitesse et le rendement quantique
polychromatique de formation du radical hydroxyle. En parallèle, à l’aide du modèle de
retrotrajectoire HYSPLIT (NOAA), on évalue la provenance de la masse d’air sur 72h.
L’analyse de composantes principaux (ACP) sur certains paramètres nous permet de corréler
la composition de l’échantillon avec l’origine de la masse d’air en tenant en compte que,
l’origine différente est liée à une composition différente et à une réactivité différente.
La mesure de la vitesse de formation du radical hydroxyle et de son rendement quantique
nous a amené à l’étude de la capacité oxydante de l’eau de nuage et à sa corrélation avec la
concentration des sources.
Le radical hydroxyle est l’oxydant principal dans l’eau de nuage. Il est généré par l’interaction
de la lumière avec des précurseurs comme le peroxyde d’hydrogène, les nitrates, les nitrites et
le fer. La matière organique, représentée en Figure 2 comme RH, réagit avec le radical
hydroxyle pour former un radical R point qui peut suivre deux chemins en compétition :
l’oxydation accompagné de formation des composés à poids moléculaire moins élevé, ou
l’oligomérization/accretion, avec formation des composées à poids moléculaire plus élevé. La
vitesse de formation du radical hydroxyle est un paramètre fondamental pour déterminer le
chemin préférentiel. Dans la littérature, peu de données sont disponibles sur la vitesse de
formation d’HO• et encore moins sur le rendement quantique polychromatique.
Si on compare le spectre d’absorption des échantillons d’eau de nuage avec le spectre
d’emission solaire, on peut facilement voir que le recouvrement entre les spectres peut donner
lieu à des réactions de photolyse, directe et indirecte, dont la photogeneration des radicaux
hydroxyles. La vitesse de formation du radical hydroxyle a été mesurée grâce à une sonde
chimique, l’acide téréphthalique, non fluorescent, qui réagit avec HO• pour former l’acide
hydroxytéréphthelique, fluorescent, dont on peut mesurer la vitesse de formation. Cette
vitesse est corrélée à celle de formation d’HO• par le paramètre gamma, dépendent de la
température et du pH. Le rendement quantique polychromatique est calculé comme rapport
entre la vitesse de formation u radical hydroxyle et l’intensité de radiation absorbée par la
solution.
41 échantillons ont été analysés et la vitesse de formation d’ HO• présente des valeurs
comprises entre 10-12
et 10-10
M s-1
tandis que le rendement quantique est de l’ordre de 10-5
à
10-3
. Les valeurs changent en fonction de la provenance de la masse d’air et, pour la vitesse de
209
formation d’ HO•, sont plus élevés pour un nuage d’origine continentale que pour un nuage
d’origine océanique ou désertiques. La question qu’on s’est posée est: Existe-t-il une
corrélation entre la vitesse de formation d’ HO• et la concentration des sources inorganiques ?
Figure 4: Hydrogen peroxide, nitrate, nitrite and TOC concentrations in cloud samples collected during three campaigns in
2013-2014.
La Figure 4 montre en ordonné la concentration des sources d’ HO• telle que le peroxyde
d’hydrogène, les nitrates et les nitrites, dans les échantillons analysés. Il y a aussi la valeur de
TOC (principal piège d’ HO•). En abscisse le numéro d’échantillon. Le fer est sous la limite
de détection pour la plupart des échantillons, le peroxyde d’hydrogène est entre 2 et 50 µM,
les nitrates : entre 2 et 220 µM, les nitrites : entre 0 et 0,6 µM et la TOC a une valeur
moyenne de 3 mgC L-1
. En couleur la classification des échantillons en marin (bleu clair),
fortement marin (violet) et continentaux (orange). On peut bien voir que la concentration des
sources est plus élevée pour les nuages d’origine continentale.
Pour trouver expérimentalement la corrélation entre la vitesse de formation d’HO• et la
concentration des sources, on a cherché la corrélation entre le paramètre RfHO• et la
concentration des sources en eau ultrapure. Nous avons pu remarquer que les pentes pour le
peroxyde et pour le nitrite sont quasi équivalentes, alors que les nitrates ont une pente
beaucoup plus faible (production de radicaux moins élevée). Tout se joue donc sur la
concentration: vu que le peroxyde d’hydrogène est plus concentré, on peut estimer que sa

210
photolyse est la source principale de radicaux hydroxyles. Pour mieux comprendre le rôle du
fer et des ions nitrite et nitrate j’ai collaboré avec le LaMP qui a mis au point un modèle de
chimie de nuage M2C2 (Model of Multiphase Cloud Chemistry). Les vitesses de formation d’
HO• ont été calculées théoriquement avec le modèle M2C2 en fonction de la concentration
des sources, de la température, du pH et du spectre de la lampe Xénon.
Le modèle M2C2 arrive à reproduire l’ordre de grandeur de la vitesse de formation d’ HO•
mais il y a quelques divergences pour les échantillons contenant du fer. Pour ce motif, les
vitesses expérimentales de photolyse de peroxyde d’hydrogène, nitrate et nitrite ont été
introduites dans le modèle et la réactivité du fer a été supprimée. Finalement, avec les
nouvelles conditions, le modèle estime des valeurs de vitesse de formation d’ HO• plus
proches des valeurs expérimentales. On trouve donc que la vitesse de formation d’ HO• est
due en moyenne pour 90% au peroxyde d’hydrogène, 5 % au nitrate et 2% au nitrite, comme
montré en Figure 5.
Figure 5: Distribution de la contribution relative de chaque source photochimique à la vitesse de formation du radical
hydroxyle pour la totalité des échantillons d’eau de nuage.
En conclusion, la vitesse et le rendement quantique de formation photoinduite du radical
hydroxyle ont été estimés pour plusieurs échantillons d’eau de nuage. La formation du radical
HO• est principalement due à la photolyse du peroxyde d’hydrogène alors que les nitrates et
les nitrites contribuent pour moins de 10 % à la vitesse totale. Le rôle du fer pour les
échantillons analysés est négligeable. Les résultats ont été comparés avec la sortie du modèle
M2C2 et le modèle à été calibré avec des données expérimentales pour mieux décrire la

211
corrélation entre la vitesse de formation d’ HO• et les sources inorganiques. L’ensemble de
ces résultats ont été publiés dans la revue Atmospheric Chemistry and Physics en 2015.
Le radical hydroxyle est donc un des acteurs principaux de la chimie atmosphérique avec la
lumière solaire. Pour mieux comprendre leur impact sur le devenir des composés organique
on a étudié l’acide tartronique.
L’acide tartronique est un acide à trois atomes de carbone et il a été détecté dans différent
milieu atmosphériques comme le PM10 et l’aérosol continental et marin. Il est produit par
dégradation chimique et microbiologique des sucres, comme le glucose, de la dissolution du
CCN et de l’oxydation d’acides carboxyliques comme l’acide lactique et malonique. Il peut
potentiellement se trouver dans l’eau de nuage et produire par photolyse directe et indirecte de
l’oxalate, du formiate et du dioxyde de carbone. Ce composé a été peu caractérisé d’un point
de vue de sa réactivité et de ses propriétés spectroscopiques. De plus, dans les modèles
atmosphériques, comme M2C2, il y a que des hypothèses de réactivité basées sur les relations
structure-activité. Ce travail expérimental vise à confirmer ces hypothèses en passant par
l’étude des propriétés spectroscopiques, l’effet du pH, le rendement quantique de photolyse, la
réactivité, les intermédiaires de réaction et les rapports de branchement. Ce travail, en cours,
est mené en collaboration avec le LaMP.
Figure 6: Speciation de l’acide tartronique.
La Figure 6 montre la spéciation de l’acide tartronique en fonction du pH. A pH 7 la forme di-
anionique est prévalente, à pH 3.2 on a un mélange des trois formes avec une dominance de la
forme mono-anionique, enfin, à pH 1.6 on a majoritairement la forme protonée. A valeurs de
pH inferieurs à 1.6 le spectre évolue en fonction du temps, comme montré dans notre étude.
Le pH de l’eau de nuage étant normalement supérieur à 3, la forme protonée n’a pas été
considérée dans cette étude. On a calculé le coefficient d’extinction molaire pour les deux
formes anioniques, montrés en graphique, et le rendement quantique polychromatique à pH 7
et 3.2.

212
Ensuite on a irradié, avec l’enceinte montrée pour l’étude de la capacité oxydante, des
solutions de tartronique de concentration 10 µM à pH 4 et 7 et elles ont été analysées par
chromatographie ionique, comme montré en Figure 7.
Figure 7: Photolyse indirecte (à gauche) et directe (à droite) du tartronique à valeurs de pH 4 et 7.
La forme mono-anionique, prévalent à pH 4 se dégrade plus rapidement que la forme di-
anionique, présente à pH 7 (en rouge), mais les deux procédées mènent à la formation de
formiate (en noir). On n’a pas observé la production d’oxalate. On a répété les mêmes
manipulations en présence de peroxyde d’hydrogène à 100 µM pour étudier la réactivité avec
HO• (Figure 7 à droite). Ce graphique est le résultat de la combinaison entre photolyse directe
et indirecte et on peut en déduire que le tartronique réagit avec HO•. Encore une fois la forme
HT- semble être la plus réactive. Les constantes de réactivité entre le tartronique et HO
• (à pH
différents) ont été déterminées expérimentalement par Laser Flash Photolysis avec la méthode
du thiocyanate. On a calculé une constante pour les trois valeurs de pH et estimé, en fonction
de la spéciation, les constantes de second ordre pour chaque forme. La forme mono-anionique
est effectivement la plus réactive avec une constante de 5.9 108 M
-1s
-1.
La conclusion présentée ici n’est que partielle : le coefficient d’extinction molaire a été
déterminé ainsi que l’effet du pH, le rendement quantique de photolyse et la réactivité par
irradiation continue et pulsé mais il nous reste à identifier les produits de réaction par
spectroscopie RMN et chromatographie ionique, à déterminer le rapport de branchement et à
comparer toutes ces données avec les sorties du modèle M2C2.
Je vous ai montré que le radical hydroxyle est produit dans l’eau de nuage et qu’il réagit avec
la matière organique, comme l’acide tartronique. Le principal problème est que la
composition de la matière organique est méconnue pour la quasi-totalité : le 10 % est
213
constitué d’acides carboxyliques et le 1 % d’aldéhydes mais on à peu d’idée, et encore moins
de mesures expérimentales, sur la composition du restant 89 %.
Figure 8: Mécanismes de dégradation des acides carboxyliques dans l'eau de nuage.
La Figure 8 regroupe tous les acides détectés dans l’eau des nuages et leurs chemins
réactionnels d’oxydation induit par le radical hydroxyle. On peut voir que l’oxydation est
généralement accompagnée par une diminution du poids moléculaire et que tous les composés
mènent à la formation des acides formique, oxalique et de CO2. Dans l’eau de nuage, on n’a
pas que des acides : récemment des composés à poids moléculaire élevé (nommés HULIS et
FULIS) ont été identifiés. Ils sont similaires aux acides humiques et fulviques présents dans
les eaux de surface mais sont très difficiles à caractériser. On ne sait pas, mais on peut
supposer, que des produits de leur dégradation soient des acides carboxyliques. La question
qui se pose est : qui a-t-il entre les composés à poids moléculaire élevé et les composés très
oxydés à faible poids moléculaire ?
Chaque échantillon a été analysé par matrice de fluorescence, dite matrice EEM, d’excitation-
émission. Si on agrandi le signal de la matrice en Figure 9, on voit la présence de deux
taches : une première A, plus intense attribuable aux HULIS et une deuxième T attribuable au
tryptophane et à ses dérivés, dit TRYLIS (tryptophan like substances).

214
Figure 9: Matrice de fluorescence EEM d'un échantillon d'eau de nuage.
Le TRP est un acide aminé qui a déjà été quantifié comme molécule libre ou combiné dans
l’aérosol continental et dans le brouillard. Le tryptophane présent deux signaux de
fluorescence : un, moins intense, à la longueur d’onde d’excitation de 275 nm et un deuxième,
plus intense, à la longueur d’onde d’excitation de 220 nm.
Le TRP a été quantifié dans 23 échantillons d’eau de nuage : par matrice de fluorescence on a
considéré seulement le signal à excitation 275 nm et on a fait l’approximation que la
fluorescence soit due uniquement au tryptophane et pas aux TRYLIS. On obtient ainsi une
valeur surestimée qui ne tient ni compte de la forme libre ou combiné de la molécule, ni de la
contribution au signal des dérivés du tryptophane (1.7×10⁻⁷
M). Les mêmes échantillons ont
été analysés par chromatographie liquide avec détection en fluorescence et la concentration
moyenne trouvée est de l’ordre de 60 nM, plus faible que celle déterminé par EEM. On a fait
l’hypothèse que la forme combinée du tryptophane soit des résidus de protéines et on a
acidifié nos échantillons pour les hydrolyser partiellement. Le TRP a alors été trouvé dans 8
échantillons.
Malgré que sa détection soit assez difficile avec cette méthode sans pré-concentration ou
dérivation, le TRP dans les nuages est donc présent. On a donc étudié son devenir sous
irradiation UVA. En premier lieu on a estimé le rendement quantique de photolyse du TRP de
l’ordre de 8,4×10⁻⁴
. La photolyse directe est donc peu efficace, dans nos conditions et pour les
temps considérés, pour la transformation du TRP. On est donc passé à la photolyse indirecte:
la constante de réactivité de second ordre avec HO• est de l’ordre de 10
10 M
-1 s
-1, proche de la
limite de diffusion. On a suivi la dégradation du TRP à 10 µM dans l’eau ultrapure avec et
sans peroxyde d’hydrogène mais également en eau synthétique de nuage d’origine

215
continentale ou océanique. L’eau synthétique à été préparé en multipliant par 10 la
concentration moyenne de l’eau de nuage en sulfate, chlorure, nitrate et nitrite. La dégradation
est accélérée en eau synthétique par la présence des ions nitrites et nitrates en concentration
non négligeable et irradié dans leur domaine d’absorption.
Les solutions irradiées ont été analysée par spectrométrie de masse. On a pu voir la formation
de TRP mono et di hydroxyle, de n-formylkinurenine, d’indole, de produits de déamination,
des isomères de la sérotonine et de composés à poids moléculaire élevé qui n’ont pas pu être
identifiés. En plus, l’analyse par chromatographie ionique a mis en évidence la formation
d’acétate et de formiate.
Les solutions irradiées on été analysées aussi par spectroscopie de fluorescence et on
remarque, dans la matrice B, la présence d’un nouveau signal. Si on soustrait, la matrice A de
la matrice B, on voit que le signal est centré à longueur d’onde d’excitation et d’émission
telles qu’il est identifiable avec l’empreinte de fluorescence des acides humiques selon la
classification de Coble (Figure 10).
Figure 10: EEM d'une solution de TRP avant et apres irradiation.
Peut-on en déduire que l’irradiation du TRP, à faible concentration, en présence de radicaux
hydroxyles, puisse mener à la formation de composés à poids moléculaire élevé avec une
empreinte de fluorescence typique des acides humiques ? Ce phénomène peut-il être
également observé dans l’eau de nuage ?
En résumé, j’ai quantifié pour la première fois le TRP par spectroscopie de fluorescence et par
chromatographie avec détection en fluorescence dans les échantillons d’eau de nuage. Sa
réactivité, avec les radicaux hydroxyles photo-générés, a été étudiée en eau ultrapure et en eau
de nuage synthétique. L’analyse de solutions irradiées a mis en évidence la formation de

216
composés à poids moléculaire plus faibles et de composés à poids moléculaire plus élevé avec
une empreinte de fluorescence des acides humiques. Ces résultats ont fait l’objet d’un article
publié dans Atmospheric Environment en 2016.
Le tryptophane peut donc rentrer dans le chemin montré précédemment comme source
d’acides acétique et formique et comme possible source d’HULIS et FULIS. Mais le TRP est
seulement 1 des 20 acides aminés les plus communs. Que se passe-t-il pour les autres ?
Vu les résultats très intéressants obtenus pour le TRP, nous nous sommes intéressés à la
détection des acides aminés dans l’eau de nuage, l’estimation de leur réactivité avec le radical
hydroxyle ainsi que la comparaison avec la réactivité des acides carboxyliques et de la
matière organique dissoute.
Les acides aminés sont les briques qui constituent les protéines. La structure fondamentale
présente un groupement acide (carboxylique), un groupement basique (amine) et une chaine
latérale R différent d’un acide aminé à l’autre. Leur présence dans le nuage n’est pas du au
transfert de la phase gaz car ils ne sont pas volatiles mais ils peuvent venir de la dissolution du
CCN. Une autre source hypothétique est l’activité microbienne. Les acides aminés essentiels
sont au nombre de 20. Ceux sont des molécules amphotères très difficiles à détecter, car la
plupart absorbe faiblement la lumière visible ou UV. Dans le cadre de ma thèse on a mis au
point une méthode pour la détection de 16 acides aminés à faible concentration.
La méthode prévoit une dérivation chimique pré-colonne, fait d’une façon automatique par
l’injecteur de l’appareil HPLC. Les acides aminés réagissent à température ambiante avec
l’OPA, ortophthalaldehyde, en présence de MPA, acide mercaptopropionique. La solution est
ensuite séparée sur colonne C18 avec détection des acides aminés dérivés par fluorescence.
La limite de détection est de 5 nM.
Malheureusement, on travaille dans un milieu naturel comme l’eau de nuage et les
chromatogrammes ne sont pas aussi propres que dans l’eau ultrapure. Par conséquence, une
calibration a été faite en tenant compte de l’effet de matrice et on a calculé la concentration de
chaque acide aminé. La Figure 11 (haut) montre la distribution des concentrations. On peut
rapidement remarquer que tous les acides aminés sont présents et que les plus concentrés sont
ILE, PHE, SER et TRP. La somme des concentrations des acides aminés oscille entre 1 et 4
µM.

217
Figure 11: Concentration des acides aminés dans l'eau de nuage (haut) et distribution relative (bas).
La somme des acides aminés représente en moyenne 200 µgC/L, équivalent à 9% de la valeur
moyenne de TOC dans l’eau de nuage. On peut donc mettre à jour le camembert montré en
Figure 1 (droite) et diminuer le pourcentage de matière organique non caractérisée. La Figure
11 (bas) montre la distribution relative des acides aminés dans les échantillons analysés.
Vis-à-vis des concentrations trouvées dans l’eau de nuage, on est donc passé à une estimation
de la réactivité des acides aminés dans l’eau de nuage, en tenant en compte leur constante de
réaction avec HO•. Les valeurs sont bien différentes : on passe de 10
7 M
-1s
-1 pour l’ASP à 10
10
M-1
s-1
pour la TYR et le TRP. On a décidé de comparer les acides aminés avec les acides
carboxyliques mesurés, dont la concentration moyenne dans l’eau de nuage et la réactivité
sont connues. Les constantes de réactivité sont plus faibles et varient en fonction de la

218
protonation/ déprotonation de la molécule. On a calculé le ratio CAA/AC avec l’Equation 22 qui
nous permets d’estimer qui, entre AA et CA piège plus d’ HO•.
,
AA/CA
,
[ ]C =
[ ]
i
i
II
iHO AA
II
iHO CA
k AA
k CA
Equation 22
Si on considère la réactivité du formiate, qui est l’acide le plus concentré et le plus réactif
avec HO•, les acides carboxyliques sont les plus importants piégeurs d’ HO
•. Si on ne tient pas
compte du formiate, les acides aminés peuvent piéger de 6 à 30 fois plus de radicaux
hydroxyles que les acides carboxyliques. La même comparaison est faite avec la matière
organique dissoute en utilisant les constantes de second ordre de réactivité pour les acides
aminés. Pour la DOC on a considéré la constante DOC- HO• reporté en littérature par Arakaki
dont la valeur est de 3.8x10⁸ L/(molC s). On a pu estimer que les acides aminés peuvent
piéger jusqu’à 36% de radicaux hydroxyles. La moitié de ces radicaux sont consommé par le
tryptophane.
Pour conclure cette partie, j’ai détecté et quantifié les acides aminés pour la première fois
dans l’eau de nuage et leur contribution à la DOC a été estimée d’environ 9%, avec des
valeurs qui vont de 4 à 21 % en fonction de la composition de l’echantillon. Le TRP est le
plus concentré. La réactivité des AA avec l’ HO• a été comparé avec celle des acides
carboxyliques et avec la DOC. Il a été démontré que de 8 à 36 % des radicaux hydroxyles sont
piégé par les AA.
En conclusion j’ai travaillé sur trois aspects de la chimie des nuages : en premier lieu sur
l’estimation de la capacité oxydante : pendant ma thèse j’ai pu évaluer la vitesse de formation
du radical hydroxyle et sa corrélation avec les sources inorganiques. La deuxième partie a eu
comme thème générale la caractérisation de la matière organique dissoute et l’étude de sa
réactivité : J’ai pu améliorer notre connaissance de la composition de la matière organique
dans l’eau de nuage en ajoutant le contribue des acides aminés. J’ai ainsi étudié la réactivité
des composés considérés et j’ai pu déterminer que les acides aminés sont des pièges de
radicaux hydroxyles et que l’acide tartronique et le tryptophane se transforment dans l’eau de
nuage et forment des acides carboxyliques tels que le formate et l’acétate.
On a donc vu l’interaction du radical hydroxyle avec la matière organique dissoute mais
l’ensemble de ce que je vous ai décrit est beaucoup plus complexe : dans l’eau de nuage, sont
présents des microorganismes comme les bactéries, les champignons, les algues, qui peuvent
agir comme consommateurs de radicaux hydroxyles mais aussi comme inhibiteurs de leur

219
formation. Ces microorganismes peuvent également avoir un impact sur la concentration des
AA et des AC. Plusieurs questions se posent : les microorganismes influencent-ils la vitesse
de formation du radical hydroxyle d’une manière significative? De quelle façon ?
220
Abstract
Clouds represent a multiphase complex and reactive medium in which gases, liquid particles
and aerosols are in continuous interaction. A large fraction of atmospheric chemical
compounds present in the particulate and gaseous phases can be transferred to the cloud
droplets where can undergo chemical, photochemical and microbiological transformations.
Cloud waters were sampled at the puy de Dôme station. The first part of my PhD work is
focused on the photoreactivity of cloud water. Formation of a reactive species such as
hydroxyl radical, by direct photolysis of inorganic sources was investigated, as well as the
correlation between the concentration of sources and the hydroxyl radical formation rate. The
spectroscopic proprieties and fate of tartronic acid, were investigated under cloud water
conditions. Moreover, photochemical experiments were performed using continuous
irradiation (direct and hydroxyl radical mediated photolysis) and nanosecond flash photolysis
in order to assess the reactivity of this compound in cloud aqueous phase. The second part of
my work is centered on the characterization of organic matter in clouds. Two studies are
presented: i) Detection and quantification of tryptophan by fluorescence spectroscopy and the
assessment of its reactivity; ii) detection and quantification of amino acids. Amino acids are
detected for the first time in cloud water using a derivatization method and this work show
that they represent the 9% of the dissolved organic matter in cloud. Their reactivity with
hydroxyl radical was compared to the reactivity of carboxylic acids and dissolved organic
matter. These results clearly demonstrate that amino acids represent a major sink of hydroxyl
radicals in cloud water.
Résumé
Les nuages représentent un milieu multiphasique complexe et réactif. Une grande partie de
composés chimiques atmosphériques de la phase particulaire ou gazeuse se dissout dans les
gouttelettes de nuage où peuvent subir des transformations chimiques, photochimiques et
microbiologiques. L'eau de nuage a été échantillonnée à la station du puy de Dôme et
caractérisée par des mesures physico-chimiques. La première partie de mon travail de thèse
est focalisée sur la réactivité de l’eau du nuage. La formation d’espèces réactives, le radical
hydroxyle, est étudiée par photolyse directe de sources inorganiques et photolyses nano-
pulsée et sa vitesse de formation a été corrélée à la concentration de sources. Les propriétés
spectroscopiques et la dégradation d'un composé modèle, l'acide tartronique, ont été étudiés.
Les expériences faite par irradiation continue (photolyse directe et induite par le radical
221
hydroxyle) et par photolyse pulsée ont permis de comprendre la réactivité de ce composé dans
le milieu nuageux. La deuxième partie de mon travail est focalisée sur la caractérisation et la
réactivité de la matière organique dans la phase aqueuse des nuages. La détection et la
quantification de tryptophane par spectroscopie de fluorescence et l'étude de sa réactivité ainsi
que la détection et quantification d‘acides aminés représente une partie importante de ce
travail. Les acides aminés ont été détectés pour la première fois dans l'eau de nuage grâce à
l'utilisation d'une méthode chromatographique de dérivation et détection par fluorescence. Ce
travail à démontré que les acides aminés peuvent représenter entre 4 et 21 % de la
concentration en carbone de la matière organique dissoute dans le nuage. La réactivité des
acides aminés avec le radical hydroxyle a été comparée avec celle des acides carboxyliques et
de la matière organique dissoute. Ce résultat montre clairement que le rôle des acides aminés
comme piège de radicaux hydroxyles ne peut plus être négligé.