Formation and Properties of Various Amine Complexes of ... · aniline 185 1:6200 51.3 49.5 *...
15
Title Formation and Properties of Various Amine Complexes of Iron-Phthalocyanine (Commemoration Issue Dedicated to Professor Eiji Suito on the Occasion of his Retirement) Author(s) Kobayashi, Takashi; Kurokawa, Fumio; Uyeda, Natsu Citation Bulletin of the Institute for Chemical Research, Kyoto University (1975), 53(2): 186-199 Issue Date 1975-09-25 URL http://hdl.handle.net/2433/76604 Right Type Departmental Bulletin Paper Textversion publisher Kyoto University
Transcript of Formation and Properties of Various Amine Complexes of ... · aniline 185 1:6200 51.3 49.5 *...
TitleFormation and Properties of Various Amine Complexes ofIron-Phthalocyanine (Commemoration Issue Dedicated toProfessor Eiji Suito on the Occasion of his Retirement)
Author(s) Kobayashi, Takashi; Kurokawa, Fumio; Uyeda, Natsu
Citation Bulletin of the Institute for Chemical Research, KyotoUniversity (1975), 53(2): 186-199
Issue Date 1975-09-25
URL http://hdl.handle.net/2433/76604
Right
Type Departmental Bulletin Paper
Textversion publisher
Kyoto University
Bull. Inst. Chem. Res., Kyoto Univ., Vol. 53, No. 2, 1975
Formation and Properties of Various Amine
Complexes of Iron-Phthalocyanine
Takashi KOBAYASHI, Fumio KUROKAWA, and Natsu UYEDA*
Received May 12, 1975
The formation of additive complexes was studied in regard to iron-phthalocyanine (FePc) dispersed in various amines. The compositions were determined by means of weight-loss measurement and
from the thermal behavior of the additive complexes as observed by DTA and X-ray powder diffraction. The decomposition temperature ranges from 100 to 300°C, above which the crystallites are converted into the a-form of pure FePc. Infrared absorption spectra indicated that amine molecules are co-
ordinated to the central metal of FePc, while some extra molecules are freely included in the space of crystal lattice. From kinetic study of visible light absorption spectra, it was found that new absorption
appears when the second molecule of the two is combined to the Fe atom of Pc-ring, indicating that a charge transfer mechanism is involved in the complex formation.
INTRODUCTION
The behavior of transition metal derivatives of porphyrin calls for biological signifi-cance when it forms additive complexes with various n-donor molecules which have the ability of co-ordinating to the central metal ion. In the previous paper,') we reported on the formation and properties of similar complexes of zinc-derivative of tetrabenztetraazapor-
phyrin (zinc-phthalocyanine) suspended in various n-donor dispersion media. Infrared spectra"2) were examined to presume the binding state of adduct molecules and the exact molecular structure was determined by X-ray diffraction analysis with a normal amine complex.3)
In the present paper, we extended similar study to iron derivative which was found to
produce stoichiometric complexes as in the previous case.
EXPERIMENTAL SECTION
1. Preparation of Samples
The iron phthalocyanine (FePc) was synthesized4) by heating a stoichiometric mixture of pure iron and sublimation-purified phthalonitrile at 270-350°C for about 5 hours and with constant stirring. The crude FePc was purified by washing for 24 hours with pure acetone in a Soxhlet extractor and then by repeated sublimation in a silica-tube with a nitrogen atmosphere flowing at 50 cm3/min. The resulting needle-like crystals were converted into a finely divided powder by the acid-paste method.
The organic suspension media are mainly various amines as listed below: 1: methylamine, 2: dimethylamine, 3: trimethylamine, 4: ethylamine, 5: n-plopyl-
* iJ4fp ., wn)z*, A : Laboratory of Crystal and Powder Chemistry, Institute for Chemical Research, Kyoto University, Uji, Kyoto.
(186)
Amine Complex of Iron-Phthalocyanine.
amine, 6: n-butylamine, 7: n-hexylamine, 8: pyridine, 9: y-picoline, and 10: aniline. About 1 g of FePc powder was dispersed in 10 ml of each solvent of the above group
and was left in stoppered glass tubes for 48 hours at 50°C. The precipitated powder was separated from individual media by filteration and was dried at 50-70°C under reduced
pressure. The separated solvents or suspension media, which were colored in greenish- blue, were also stored for further examinations.
2. Analytical Procedures
a. X-ray Powder Diffraction. The crystal forms of the dried precipitates were identified by X-ray powder diffraction with Mn-filtered FeKa radiation from a source
operated at 30 kV. The scanning speed was 1°/min and the time constant was set at 2.5 sec for automatic recording of the intensities of reflected X-rays. The dimensions of dispersion and receiving slits were fixed to be 2.0 and 0.5 mm, respectively, for the gonio-
meter radius of 175 mm. The X-ray diffraction analysis was also applied to specimens which were subjected to differential thermal analysis.
b. Differential Thermal Analysis (DTA). As for DTA, specimen of 200mg of each powder was heated to about 300°C at a rate of 10°C/min for temperature elevation. A
Pt-Pt10%Rh thermocouple was used to detect the temperature difference between the
sample and a-alumina powder used for the reference. Since one to four peaks of endo- thermic reaction appeared in most of the DTA curves, the weight loss due to the heat treatment was examined for all these specimens in order to determine the compositions
of additive complexes. The crystallographic change caused by the heat treatment was detected by another
X-ray diffraction measurement of the specimens which were taken from the furnace right after the DTA scanning produced a peak. The temperature of the furnace was controlled
with an accuracy of +0.5°C. c. Infrared Absorption Spectroscopy. The infrared absorption spectra of the
specimen obtained in y-picoline, n-propylamine, and aniline as well as their decomposition
intermediates were recorded with a Perkin-Elmer Model 521 grating spectrometer. The accuracy in frequencies was +0.5 cm-1, as calibrated with polystylene film. The specimens for y-picoline and n-propylamine were prepared with nujol while that obtained
in aniline was measured with KBr pellet. d. Visible-Light Absorption Spectroscopy. The powder of FePc was vacuum-
evaporated from a fused silica crucible onto quartz plates to form thin films of 500 to 3000 A thick. These films were exposed to vapor of those amines as listed above. After the film
color turned to green, the absorption spectra were measured in a range of wavelength between 350 and 750 nm. On the other hand, FePc was dissolved in a-chloronaphthalene
of special grade to have a concentration of 10-3 mole/1. Another a-chloronaphthalene solution of pyridine which had been distilled for dehydration (10-3 mole/1) was prepared,
5 portion of which was mixed with 1 portion of former solution of FePc. The change of absorption spectra was recorded to follow the additive complex formation in solution.
The apparatus used was Shimadzu Multipurpose Spectrometer (MPS-50 L).
RESULTS AND DISCUSSION
The composition of each precipitate was determined by the combined use of differential
(187)
T. Kobayashi, F. Kurokawa, and N. Uyeda
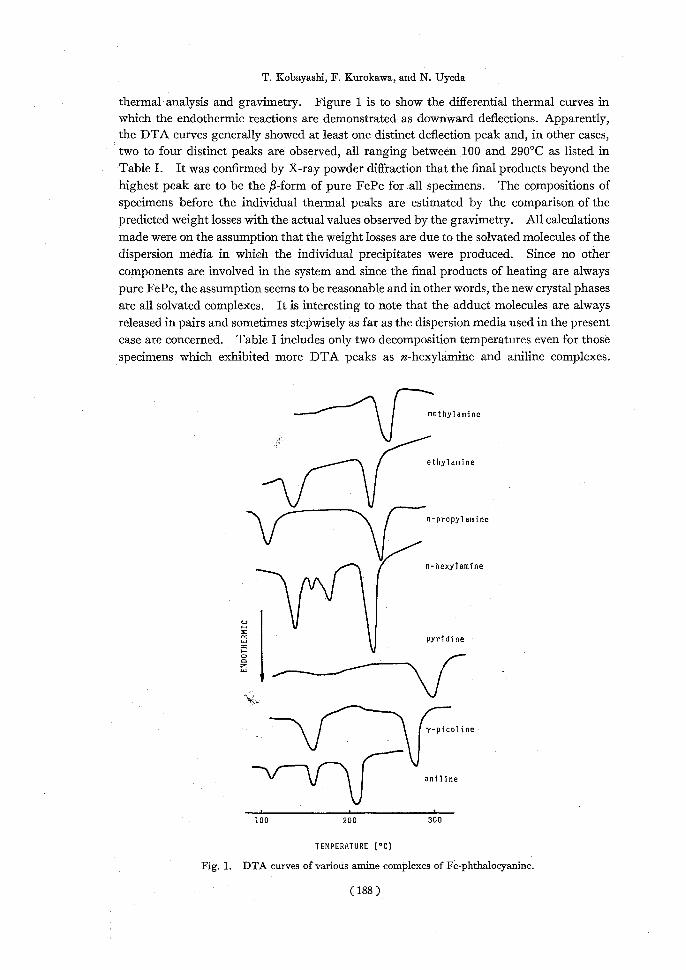
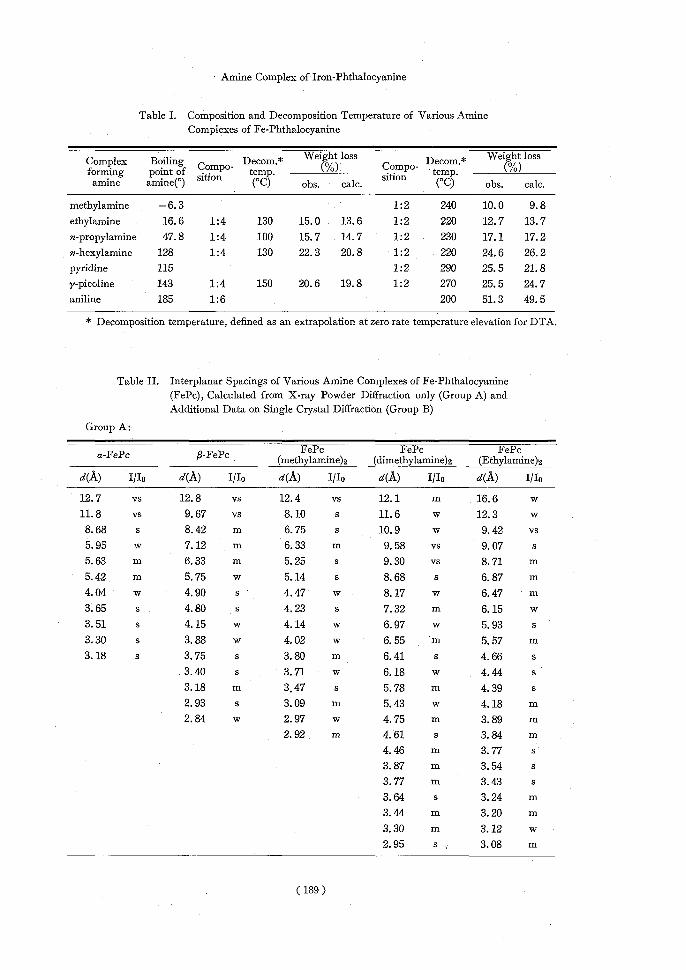
thermal analysis and gravimetry. Figure 1 is to show the differential thermal curves in which the endothermic reactions are demonstrated as downward deflections. Apparently, the DTA curves generally showed at least one distinct deflection peak and, in other cases, two to four distinct peaks are observed, all ranging between 100 and 290°C as listed in Table I. It was confirmed by X-ray powder diffraction that the final products beyond the highest peak are to be the fl-form of pure FePc for all specimens. The compositions of specimens before the individual thermal peaks are estimated by the comparison of the
predicted weight losses with the actual values observed by the gravimetry. All calculations made were on the assumption that the weight losses are due to the solvated molecules of the dispersion media in which the individual precipitates were produced. Since no other components are involved in the system and since the final products of heating are always
pure FePc, the assumption seems to be reasonable and in other words, the new crystal phases are all solvated complexes. It is interesting to note that the adduct molecules are always released in pairs and sometimes stepwisely as far as the dispersion media used in the present case are concerned. Table I includes only two decomposition temperatures even for those specimens which exhibited more DTA peaks as n-hexylamine and aniline complexes.
methylamine
• ethylamine
n-propylamine
n-hexylamine
pyridine 0
y-Picoline
aniline
100200300
TEMPERATURE (°C)
Fig. 1. DTA curves of various amine complexes of Fe-phthalocyanine.
(188)
Amine Complex of Iron-Phthalocyanine
Table I. Composition and Decomposition Temperature of Various Amine Complexes of Fe-Phthalocyanine
Complex BoilingDecom.* Weight loss Decom.* Weight loss forming point ofCompo-temp. (/0) Compotemp. (%)
amine amine(°)sition(°C) obs. calc.sition (°C) obs. calc.
methylamine -6.31:2 240 10.0 9.8
ethylamine 16.6 1:4 130 15.0 13.6 1:2 220 12.7 13.7
n-propylamine 47.8 1: 4 100 15.7 14.71:2 230 17.1 17.2
n-hexylamine 128 1:4 130 22.3 20.8 1:2 220 24.6 26.2
pyridine 1151:2 290 25.5 21.8
y-picoline 143 1:4 150 20.6 19.8 1:2 270 25.5 24.7 aniline 185 1:6200 51.3 49.5
* Decomposition temperature , defined as an extrapolation at zero rate temperature elevation for DTA.
Table II. Interplanar Spacings of Various Amine Complexes of Fe-Phthalocyanine
(FePc), Calculated from X-ray Powder Diffraction only (Group A) and Additional Data on Single Crystal Diffraction (Group B)
Group A:
a-FePc-FePcFePcFePcFePc ------------------ (methylamine)2 (dimethylamine)2 (Ethylamine)z
d(A) I/Io d(A) I/Io d(A) I/Io d(A) I/Io d(A) I/Io
12.7 vs 12.8 vs 12.4 vs 12.1 m 16.6 w
11.8 vs 9.67 vs 8.10 s 11.6 w 12.3 w
8.68 s 8.42 m 6.75 s 10.9 w 9.42 vs 5.95 w 7.12 m 6.33 m 9.58 vs 9.07 s
5.63 m 6.33 m 5.25 s 9.30 vs 8.71 m
5.42 m 5.75 w 5.14 s 8.68 s 6.87 m
4.04 w 4.90 s' 4.47 w 8.17 w 6.47 m
3.65 s 4.80 s 4.23 s 7.32 m 6.15 w 3.51 s 4.15 w 4.14 w 6.97 w 5.93 s
3.30 s 3.88 w 4.02 w 6.55 m 5.57 m
3.18 s 3.75 s 3.80 m 6.41 s 4.66 s
3.40 s 3.71 w 6.18 w 4.44 s
3.18 m 3.47 s 5.78 m 4.39 s
2.93 s 3.09 m 5.43 w 4.18 m
2.84 w 2.97 w 4.75 m 3.89 m 2.92 m 4.61 s 3.84 in
4.46 m 3.77 s
3.87 m 3.54 s
3.77 m 3.43 s
3.64 s 3.24 m 3.44 m 3.20 m
3.30 m 3.12 w
2.95 s ,- 3.08 m
(189)
T. Kobayashi, F. Kurokawa, and N. Uyeda
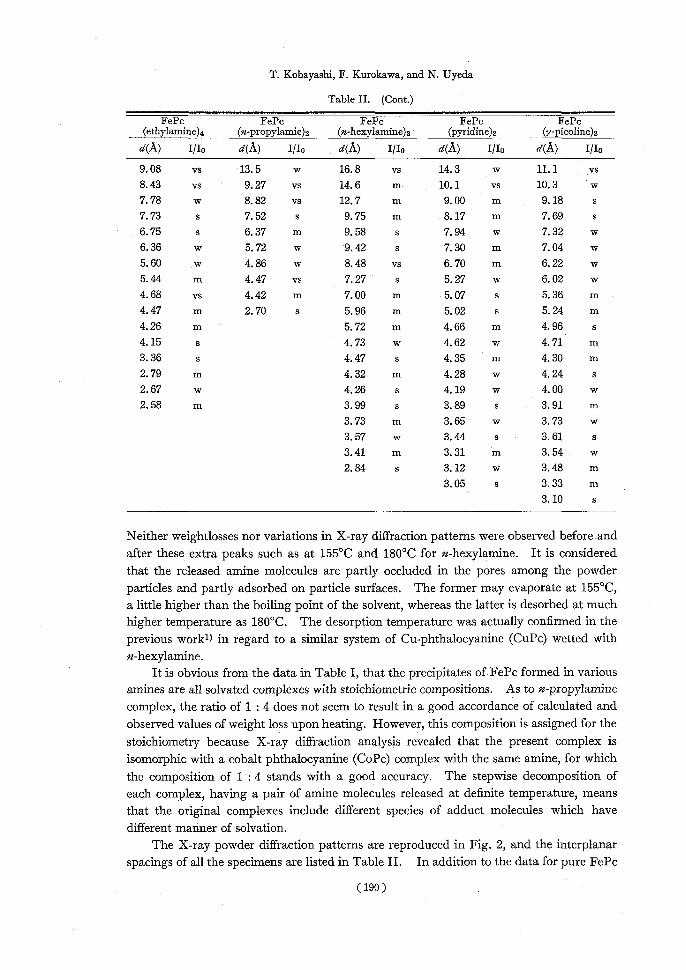
Table II. (Cont.)
FePcFePcFePc FePcFePc (ethylamine)4 (n-propylamie)2 (n-hexylamine)2 (pyridine)2 (y-picoline)2
d(A) I/Io d(A) I/Io d(A) I/Io d(A) I/I0 d(A) I/Io
9.08 vs13.5 w 16.8 vs 14.3 w 11.1 vs
8.43 vs9.27 vs 14.6 m 10.1 vs 10.3 w
7.78 w8.82 vs 12.7 m 9.00 m 9.18 s 7.73 s7.52 s 9.75 m 8.17 m 7.69 s
6.75 s6.37 m 9.58 s 7.94 w 7.32 w
6.36 w5.72 w 9.42 s 7.30 m 7.04 w
5.60 w4.86 w 8.48 vs 6.70 m 6.22 w
5.44 m4.47 vs 7.27 s 5.27 w 6.02 w
4.68 vs4.42 m 7.00 m 5.07 s 5.36 m
4.47 m2.70 s 5.96 m 5.02 s 5.24 m 4.26 m5.72 m 4.66 m 4.96 s
4.15 s4.73 w 4.62 w 4.71 m
3.36 s4.47 s 4.35 m 4.30 m
2.79 m4.32 m 4.28 w 4.24 s
2.67 w4.26 s 4.19 w 4.00 w
2.58 m3.99 s 3.89 s 3.91 m
3.73 m 3.65 w 3.73 w 3.57 w 3.44 s 3.61 s
3.41 m 3.31 m 3.54 w
2.84 s 3.12 w 3.48 m
3.05 s 3.33 m
3.10 s
Neither weightlosses nor variations in X-ray diffraction patterns were observed before and
after these extra peaks such as at 155°C and 180°C for n-hexylamine. It is considered
that the released amine molecules are partly occluded in the pores among the powder particles and partly adsorbed on particle surfaces. The former may evaporate at 155°C, a little higher than the boiling point of the solvent, whereas the latter is desorbed at much higher temperature as 180°C. The desorption temperature was actually confirmed in the
previous work') in regard to a similar system of Cu-phthalocyanine (CuPc) wetted with n-hexylamine.
It is obvious from the data in Table I, that the precipitates of FePc formed in various amines are all solvated complexes with stoichiometric compositions. As to n-propylamine
complex, the ratio of 1 : 4 does not seem to result in a good accordance of calculated and observed values of weight loss upon heating. However, this composition is assigned for the stoichiometry because X-ray diffraction analysis revealed that the present complex is
isomorphic with a cobalt phthalocyanine (CoPc) complex with the same amine, for which the composition of 1 : 4 stands with a good accuracy. The stepwise decomposition of
each complex, having a pair of amine molecules released at definite temperature, means that the original complexes include different species of adduct molecules which have
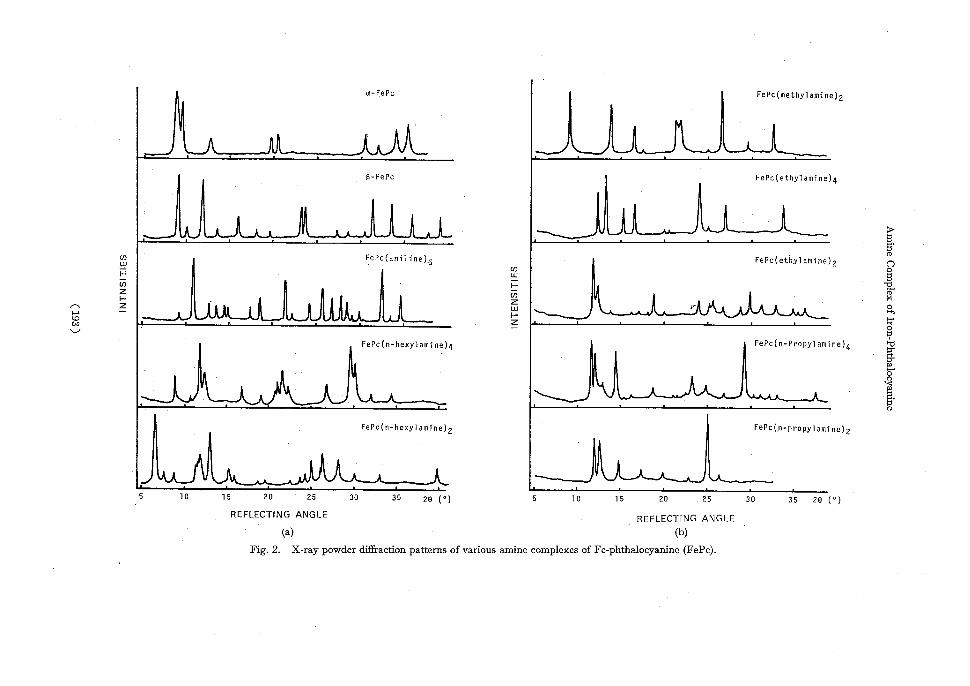
different mariner of solvation. The X-ray powder diffraction patterns are reproduced in Fig. 2, and the interplanar
spacings of all the specimens are listed in Table II. In addition to the data for pure FePc
(190)
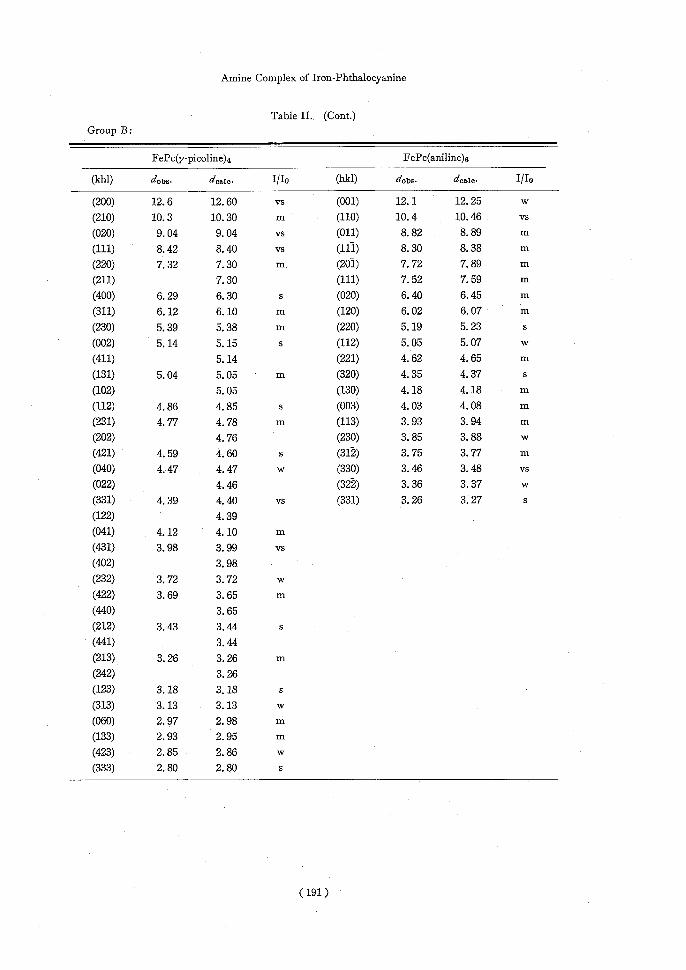
Amine Complex of Iron-Phthalocyanine
Table II. (Cont.) Group B:
FePc(y-picoline)4 FePc(aniline)6
(khl) dobs• dealc. I/Ip (hkl)dons. doolo. I/I0
(200) 12.6 12.60 vs (001)12.1 12.25 w
(210) 10.3 10.30 m (110)10.4 10.46 vs
(020) 9.04 9.04 vs (011)8.82 8.89 m
(111) 8.42 8.40 vs (111)8.30 8.38 m (220) 7.32 7.30 m (201)7.72 7.89 m
(211)7.30(111)7.52 7.59 m
(400) 6.29 6.30 s (020)6.40 6.45 m
(311) 6.12 6.10 m (120)6.02 6.07 m
(230) 5.39 5.38 m (220)5.19 5.23 s
(002) 5.14 5.15 s (112)5.05 5.07 w (411)5.14(221)4.62 4.65 m
(131) 5.04 5.05 m (320)4.35 4.37 s
(102)5.05(130)4.18 4.18 m
(112) 4.86 4.85 s (003)4.03 4.08 m
(231) 4.77 4.78 m (113)3.93 3.94 m (202)4.76(230)3.85 3.88 w
(421) 4.59 4.60 s (312)3.75 3.77 m
(040) 4.47 4.47 w (330)3.46 3.48 vs
(022)4.46(32)3.36 3.37 w
(331) 4.39 4.40 vs (331)3.26 3.27 s (122)4.39
(041) 4.12 4.10 m
(431) 3.98 3.99 vs
(402)3.98
(232) 3.72 3.72 w
(422) 3.69 3.65 m (440)3.65
(212) 3.43 3.44 s
(441)3.44
(213) 3.26 3.26 m
(242)3.26
(123) 3.18 3.28 s
(313) 3.13 3.13 w
(060) 2.97 2.98 m
(133) 2.93 2.95 m
(423) 2.85 2.86 w (333) 2.80 2.80 s
(191)
T. Kobayashi, F. Kurokawa, and N. Uyeda
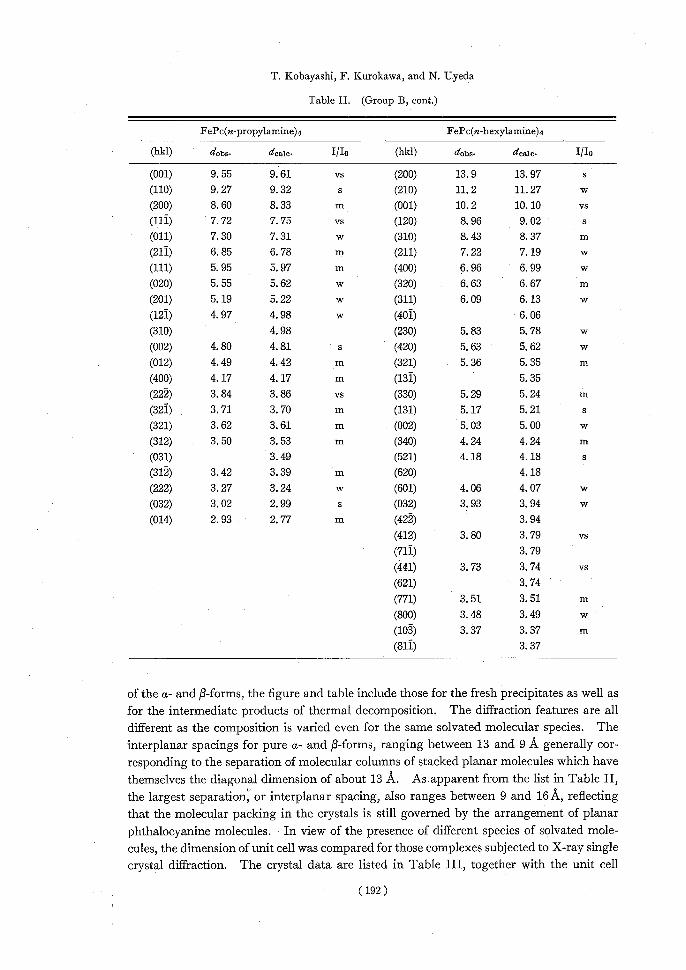
Table II. (Group B, cont.)
FePc(n-propylamine)4FePc(n-hexylamine)4
(hkl) dobs. deale. I/Io(hkl)dons. doalc. I/Io
(001) 9.55 9.61 vs(200)13.9 13.97 s (110) 9.27 9.32 s(210)11.2 11.27 w (200) 8.60 8.33 m(001)10.2 10.10 vs
(111) 7.72 7.75 vs(120)8.96 9.02 s (011) 7.30 7.31 w(310)8.43 8.37 m
(211) 6.85 6.78 m(211)7.22 7.19 w (111) 5.95 5.97 m(400)6.96 6.99 w (020) 5.55 5.62 w(320)6.63 6.67 m (201) 5.19 5.22 w(311)6.09 6.13 w
(121) 4.97 4.98 w(401)6.06 (310)4.98(230)5.83 5.78 w
(002) 4.80 4.81 s(420)5.63 5.62 w (012) 4.49 4.42 m(321)5.36 5.35 m (400) 4.17 4.17 m(131)5.35
(222) 3.84 3.86 vs(330)5.29 5.24 m (321) 3.71 3.70 m(131)5.17 5.21 s (321) 3.62 3.61 m(002)5.03 5.00 w (312) 3.50 3.53 m(340)4.24 4.24 m (031)3.49(521)4.18 4.18 s
(312) 3.42 3.39 m(620)4.18 (222) 3.27 3.24 w(601)4.06 4.07 w
(032) 3.02 2.99 s(032)3.93 3.94 w (014) 2.93 2.77 m(422)3.94
(412)3.80 3.79 vs (711)3.79 (441)3.73 3.74 vs
(621)3.74 (771)3.51 3.51 m
(800)3.48 3.49 w (103)3.37 3.37 m (811)3.37
of the a- and fl-forms, the figure and table include those for the fresh precipitates as well as for the intermediate products of thermal decomposition. The diffraction features are all different as the composition is varied even for the same solvated molecular species. The interplanar spacings for pure a- and /3-forms, ranging between 13 and 9 A generally cor-responding to the separation of molecular columns of stacked planar molecules which have themselves the diagonal dimension of about 13 A. As apparent from the list in Table II, the largest separation, or interplanar spacing, also ranges between 9 and 16 A, reflecting that the molecular packing in the crystals is still governed by the arrangement of planar
phthalocyanine molecules. In view of the presence of different species of solvated mole-cules, the dimension of unit cell was compared for those complexes subjected to X-ray single crystal diffraction. The crystal data are listed in Table III, together with the unit cell
(192)
1 a-FePcFePc(methylamine)2 I1 ....ia____.,vU\---A-1-- —.--WA---.--------- t-FePc
IFePc(ethylamine)4 I Ijil j _________L__. ;....-.... A..?Li , ..... A .. - :. . L.A . - . J.-7.....-J...../.--A., ..........--ta... co cn-IFePc(ani1ine)6FePc(ethylamine)2n
F- cooF.
~( ICT)ss .A...1AILA......_.,A—L---.o co
1 FePc(n-hexylamine)41 FePc(n-Propylamine)4 it PI
o
-IA uik ___A------ 0 a.
IFePc(n-hexylamine)2 IFePc(n-propy1amine)2
t
_1 LA...3\-/...Ä.---------- 5 10152025 30 35 29 (°)510 15 20 25 30 35 20 (0)
REFLECTING ANGLE REFLECTING ANGLE
(a)(b) Fig. 2. X-ray powder diffraction patterns of various amine complexes of Fe-phthalocyanine (FePc).
T. Kobayashi, F. Kurokawa, and N. Uyeda
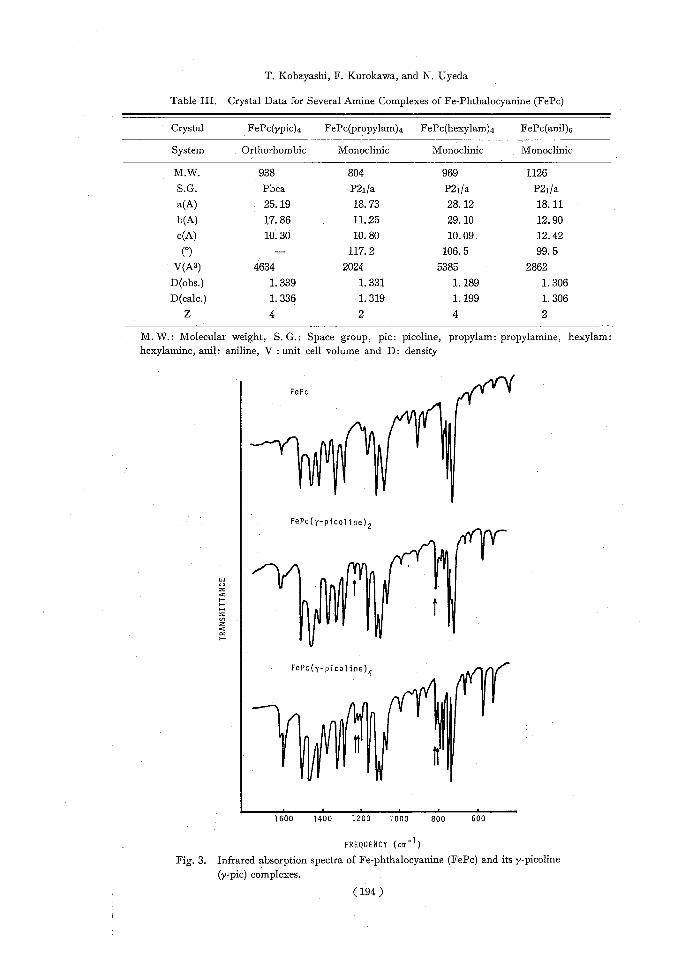
Table III. Crystal Data for Several Amine Complexes of Fe-Phthalocyanine (FePc)
Crystal FePc(ypic)4 FePc(propylam)4 FePc(hexylam)4 FePc(anil)s
SystemOrthorhombic Monoclinic Monoclinic Monoclinic
M.W.9388049691126
S.G.PbcaP2i/aP21/aP21/a
a(A)25.1918.7328.1218.11 b(A)17.8611.2529.1012.90
c(A)10.3010. 8010.0912.42
(°)—117.2106.599.5 V(A3)4634202453852862
D(obs.)1.3391.3311.1891.306 D(calc.)1.3361.3191.1991.306
Z4242
M. W.: Molecular weight, S. G.: Space group, pic: picoline, propylam: propylamine, hexylam: hexylamine, anil: aniline, V : unit cell volume and D: density
FePc
FePc(y-picoline)2
FePc(Y-picoline)4
Or( / 1111(
1600---------------------------------------------------------------------------------------1400 1200 1000 800 600
FREQUENCY (cm-1)
Fig. 3.Infrared absorption spectra of Fe-phthalocyanine (FePc) and its y-picoline
(y-pic) complexes.
(194)
Amine Complex of Iron-Phthalocyanine
volume and the density of complex crystals. Apparently, the density, ranging between 1.19 and 1.34, is much smaller than those of the pure a- and /3-forms which are 1.59 and
1.52, respectively. The volumes of unit cell exceed 2000 M for every two phthalocyanine molecules, which are again larger than those of plain crystals, indicating that fairly
wide spaces are included in the crystal lattice. The infrared spectra, as reproduced in. Fig. 3, were examined in order to obtain in-
formation about the nature of different species of adduct molecules. Here the results with the complexes of y-picoline are demonstrated for the example, since the adduct molecules
exhibited a very definite spectral behavior depending upon their compositions. In Fig. 3. the infrared spectra of plain FePc of the /3-form5) is reproduced for comparison. Although
the spectra of complexes resemble those of the plain compound, a few absorption peaks due to the adduct y-picoline molecules are clearly observed without overlapping the peaks of
FePc as indicated by arrows. It has to be noted that each absorption peak of the adduct molecule in the complex which has four y-picoline molecules appear as doublet. The
wave numbers in cm-1 are listed in Table IV, where similar data for aniline complex are also included. When compared with corresponding absorption bands of pure y-picoline,
considerable blue shifts are observed for the singlet of FePc(pic)2 and one of each doublet of FePc(pic)4, where pic stands for y-picoline. Goodgame et al.sl reported that similar blue shifts occur to y-picoline which is co-ordinated to ions of the first transition metal in
halogenized complexes. Partial blue shifts were reported by Hague et al.8) also for y-picoline molecules which are combined with halogens and inter-halogen compounds
which are all regarded as strong electron acceptors. It is apparent from the above observations that two groups of y-picoline exist in the complex of FePc(y-pic)4, one of
which is strongly combined to FePc and the other is considered to exist rather freely in a wide space of the complex crystal. The existence of these amine molecules of two different
groups is apparently the origin of the stepwise process of thermal decomposition. As assigned by Green et al.,7) the absorption bands of y-picoline at 800 and 1224 cm -1
are y(CH) and 13(CH), respectively. In.the case of y-picoline complex of ZnPc, these two absorption bands also exhibited similar amount of blue shifts, which are considered to be
due to the variation of 7r-electron density distribution caused by the co-ordination of y- picoline to the central metal of ZnPc. The X-ray diffraction analysis for the FePc complex
showed that two y-picoline molecules are bonded with their nitrogen atoms facing to Fe atom perpendicularly from both sides of macromolecular ring of phthalocyanine. It was
also confirmed that the other two y-picolines are located in a space among the complex molecules. Judging from the distance from the surrounding molecules, the free y-picoline
molecules are not likely to be influenced by any strong interaction.
Table IV. Infrared Absorption Bands for y-Picoline (y-pic) and Aniline (anil) Complexes of Fe-Phthalocyanine (FePc)
ComplexesWave number of absorption peak in cm-1
FePc(y-pic)41237 1225 815 803 FePc(y-pic)21236814 y-picoline1220801 FePc(anil)6 3410 3315 3260
aniline3434 3397
(195)
T. Kobayashi, F. Kurokawa, and N. Uyeda
On the other hand, aniline in FePc(anil)6 shows more conspicuous behavior. As apparent from Table IV, absorption bands appear at 3410, 3315, and 3260 cm.-1 Accord-
ing to Lady and Whestel,9) free aniline gives rise to NH-stretching vibrations at 3484(a) and 3379(s)cm.-1 It was also reported by Hill and Curran10)'that absorption bands of
aniline appear at 3236, 3210, and 3121 cm-1 when it is co-ordinated to Ni, Mg, Cu, and Zn ions, exhibiting red shifts to lower frequencies by 149 through 187 cm.-1 Taking these
data into account, it is presumed that the shifting to lower frequencies is caused by the lowering of NH-bond order due to the co-ordination of nitrogen to the central metal
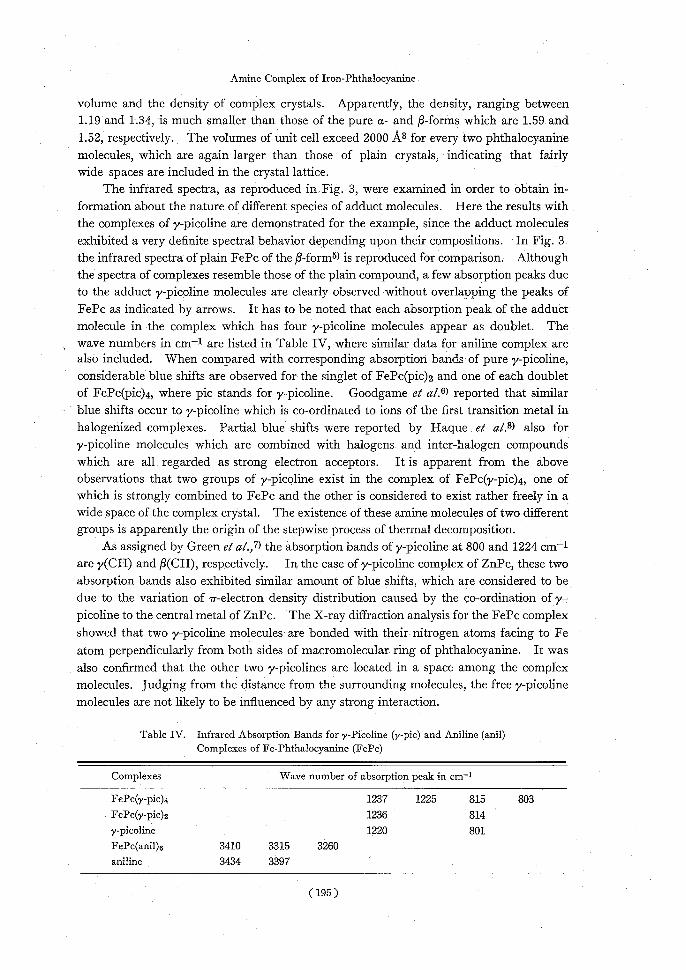
ion of FePc. Figure 4 shows visible light absorption spectra of vacuum-deposited thin film of FePc
and that exposed to pyridine vapor as well as those of a-chloronaphthalene solutions of FePc with and without addition of excess amount of pyridine. The position of absorption
peaks are listed in Table V for these spectra. The strong absorption between 600 and 700 nm, which cause these complexes to exhibit blue color, are due to 7r-electronic transi-
tions. Obviously, these transitions are sensitively influenced by the different molecular environments, solution or solid film. It should be noted, however, that a new absorption
appears at 410 nm whenever FePc forms complex regardless of the state of the product. Every amine complex examined here has a similar new absorption characteristic of the
adduct molecules. When the transition energy of each absorption is plotted against the ionization potential") of the corresponding amine, a fairly good linear relationship is
observed as shown in Fig. 5, indicating that the absorptions around 420 nm are due to charge transfer forces between FePc and amine molecules. Since the combination is based
on the perpendicular co-ordination of lone pair of amine nitrogen, the charge transfer takes
place through this bonding. Dale12) reported similar absorption bands of FePc complexes formed in dimethyl-sulfoxide solution saturated with various amines. Although no
definite linear relationships between the wave number and the ionic potential were observed,
perhaps being due to the presence of complex-forming solvent DMSO, the absorption bands were empirically interpreted in terms of the charge transfer force. The obvious
---- Pc thin tilm.
Pc-Py thin film ft
--• -- Pc in a-chloronophthalene I ---~ -- Pc-Py in a- chloronophthalene I I
a
I .
• o~ i1
400 500 600700 Wave Length mn m)
Fig. 4. Visible light absorption spectra of Fe-phthalocyanine (FePc) and its
pyridine complexes formed in a-chloronaphthalene and in vacuum deposited films. 1: FePc (thin film), 2: FePc-pyridine (thin film),
3: FePc in a-chloronaphthalene, and 4: FePc-pyridine in a-chlorona-
phthalene.
(196)
Amine Complex of Iron-Phthalocyanine
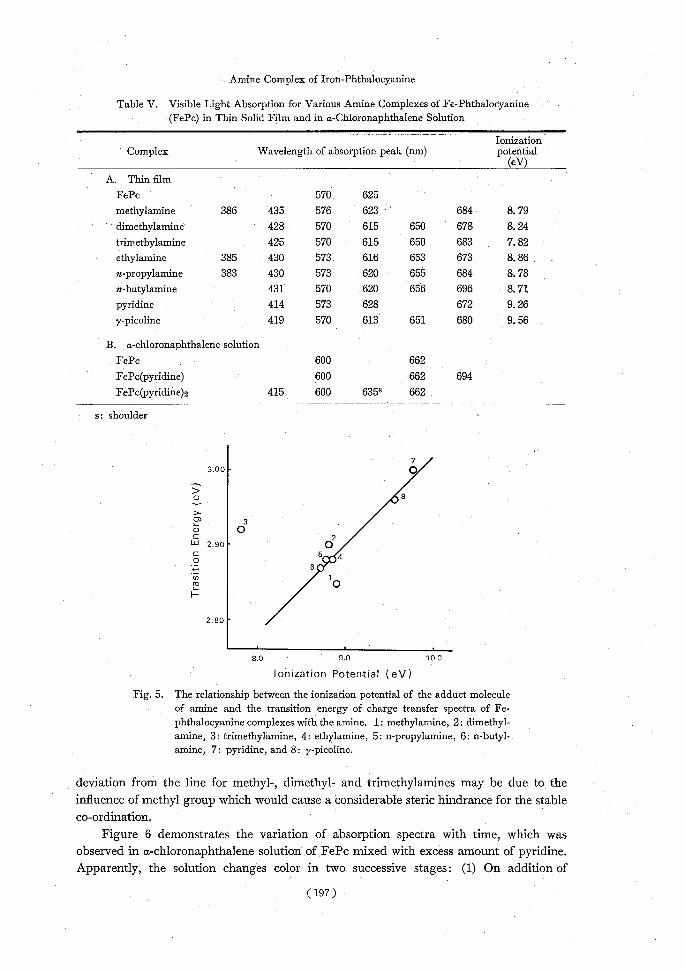
Table V. Visible Light Absorption for Various Amine Complexes of Fe-Phthalocyanine (FePc) in Thin Solid Film and in a-Chloronaphthalene Solution
Ionization ComplexWavelength of absorption peak (nm)potential
(eV) A. Thin film
FePc570 625 methylamine 386 435 576 623684 8.79
dimethylamine428 570 615650 678 8.24 trimethylamine425 570 615650 683 7.82
ethylamine 385 430 573 616653 673 8.86 n-propylamine 383 430 573 620655 684 8.78 n-butylamine431 570 620656 696 8.71
pyridine414 573 628672 9.26 y-picoline419 570 613651 680 9.56
B. a-chloronaphthalene solution FePc600 662
FePc(pyridine)600662 694 FePc(pyridine)2 415 600 635s 662
s: shoulder
7 3.00-•
• 8 T 3 4)
0 2 W 2.90-O o5••4
6• 10
F-
2.80 -
8.09,010.0 Ionization Potential (eV)
Fig. 5. The relationship between the ionization potential of the adduct molecule of amine and the transition energy of charge transfer spectra of Fe-
phthalocyanine complexes with the amine. 1: methylamine, 2: dimethyl- amine, 3: trimethylamine, 4: ethylamine, 5: n-propylamine, 6: n-butyl-.
amine, 7: pyridine, and 8: y-picoline.
deviation from the line for methyl-, dimethyl- and trimethylamines may be due to the influence of methyl group which would cause a considerable steric hindrance for the stable
co-ordination. Figure 6 demonstrates the variation of absorption spectra with time, which was
observed in a-chloronaphthalene solution of FePc mixed with excess amount of pyridine. Apparently, the solution changes color in two successive stages: (1) On addition of
(197)
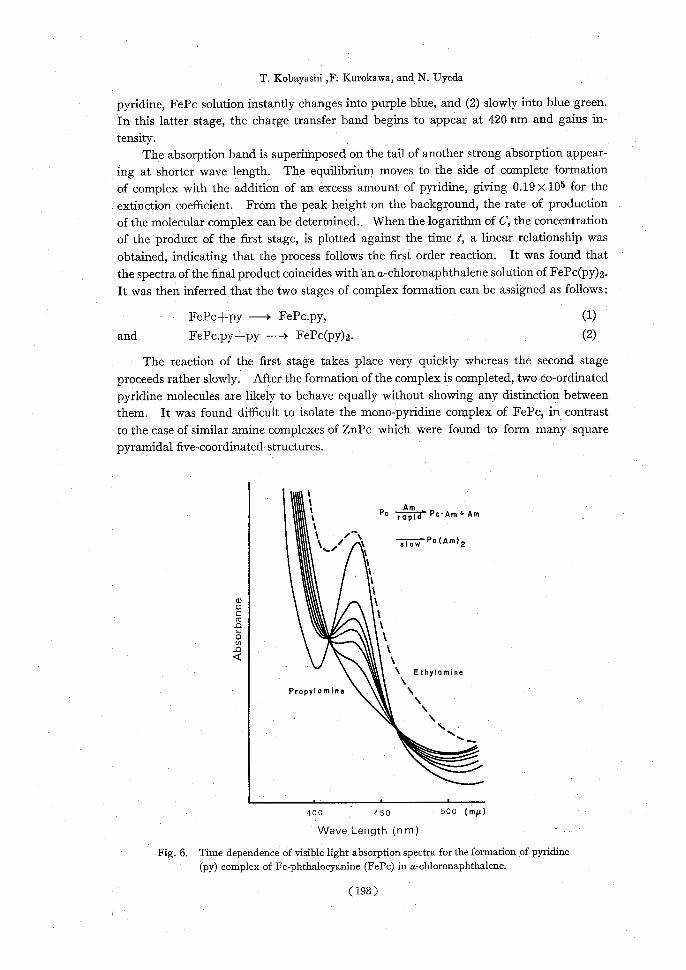
T. Kobayashi ,F. Kurokawa, and N. Uyeda
pyridine, FePc solution instantly changes into purple blue, and (2) slowly into blue green. In this latter stage, the charge transfer band begins to appear at 420 nm and gains in-tensity. The absorption band is superimposed on the tail of another strong absorption appear-ing at shorter wave length. The equilibrium moves to the side of complete formation of complex with the addition of an excess amount of pyridine, giving 0.19 x 10⁵ for the extinction coefficient. From the peak height on the background, the rate of production of the molecular complex can be determined. When the logarithm of C, the concentration of the product of the first stage, is plotted against the time t, a linear relationship was
obtained, indicating that the process follows the first order reaction. It was found that the spectra of the final product coincides with an a-chloronaphthalene solution of FePc(py)2. It was then inferred that the two stages of complex formation can be assigned as follows:
FePc+py --i FePc.py,(1)
and FePc.py+py — FePc(py)2.(2)
The reaction of the first stage takes place very quickly whereas the second stage
proceeds rather slowly. After the formation of the complex is completed, two co-ordinated pyridine molecules are likely to behave equally without showing any distinction between them. It was found difficult to isolate the mono-pyridine complex of FePc, in contrast to the case of similar amine complexes of ZnPc which were found to form many square
pyramidal five-coordinated structures.
Pc rapid Pc'Am+Am
1 //^\- Pc(Am) \`/\slow2 1
i1 1.
1 1 m
1 1 o\ .111111
‘\ \ Ethylamine Propylamine
400450500 (my.)
Wave Length (nm)
Fig. 6. Time dependence of visible light absorption spectra for the formation of pyridine
(py) complex of Fe-phthalocyanine (FePc) in a-chloronaphthalene.
(198)
Amine Complex of Iron-Phthalocyanine
ACKNOWLEDGMENTS
The authors wish to thank Professor T. Yamamoto and Dr. K. Soda in this Institute
for their kind help in spectroscopy. Thanks are also due to Professor T. Takenaka of the
same Institute for his kind help in taking infrared spectra of the specimens. This paper
is dedicated to Emeritus Professor E. Suito on the commemoration of his retirement.
REFERENCES
(1) T. Kobayashi, N. Uyeda, and E. Suito, J. Phys. Chem., 72, 2446 (1968). (2) T. Kobayashi, N. Uyeda, and E. Suito, Bull. Inst.Chem. Res., Kyoto Univ., 52, 605 (1974). (3) T. Kobayashi, T. Ashida, N. Uyeda, M. Kakudo, and E. Suito, Bull. Chem. Soc. Japan, 44,
2059 (1971).
(4) P. A. Barret, C. E. Dent, and R. P. Linstead, J. Chem. Soc., 1963, 1719. (5) T. Kobayashi, Spectrochim. Acta, 26A, 1313 (1970). (6) M. Goodgame and P. J. Hayward, J. Chem. Soc., 1966A 632. (7) J. H. S. Green, W. Kynaton, and H. M. Paisley, Spectrochim. Acta, 19, 549 (1963). (8) I. Hague and J. L. Wood, ibid, 23A, 2523 (1967). (9) J. H. Lady and K. B. Whestel, ibid, 21, 1969 (1965).
(10) A. G. Hill and C. Curran, J. Phys. Chem., 64, 1520 (1960). (11) K. Watanabe and J. R. Mottle, J. Chem. Phys., 26, 1773 (1957).
(12) B. W. Dale, Trans. Faraday Soc., 65, 331 (1969).
(199)