Formal sector internal migration in Myanmar.pdf
12
Formal Sector Internal Migration in Myanmar: Results from 2013-2014 Formal Sector Survey (SPPRG & SSB) Page1 Formal sector internal migration in Myanmar Dr. Michael P Griffiths, Director of Research, Social Policy & Poverty Research Group U Kyaw Zaw Oo, Research Office, Social Policy & Poverty Research Group Collaborating partners: Social Policy & Poverty Research Group Social Security Board, Ministry of Labour, Employment & Social Security, Government of the Republic of the Union of Myanmar ActionAid Myanmar Livelihood & Food Security Trust Fund (LIFT)
Transcript of Formal sector internal migration in Myanmar.pdf
Formal Sector Internal Migration in Myanmar: Results from 2013-2014 Formal Sector Survey (SPPRG & SSB)
Pag
e1
Formal sector internal migration in Myanmar
Dr. Michael P Griffiths, Director of Research, Social Policy & Poverty Research Group
U Kyaw Zaw Oo, Research Office, Social Policy & Poverty Research Group
Collaborating partners:
Social Policy & Poverty Research Group
Social Security Board, Ministry of Labour, Employment & Social Security, Government of the Republic of
the Union of Myanmar
ActionAid Myanmar
Livelihood & Food Security Trust Fund (LIFT)
Formal Sector Internal Migration in Myanmar: Results from 2013-2014 Formal Sector Survey (SPPRG & SSB)
Pag
e2
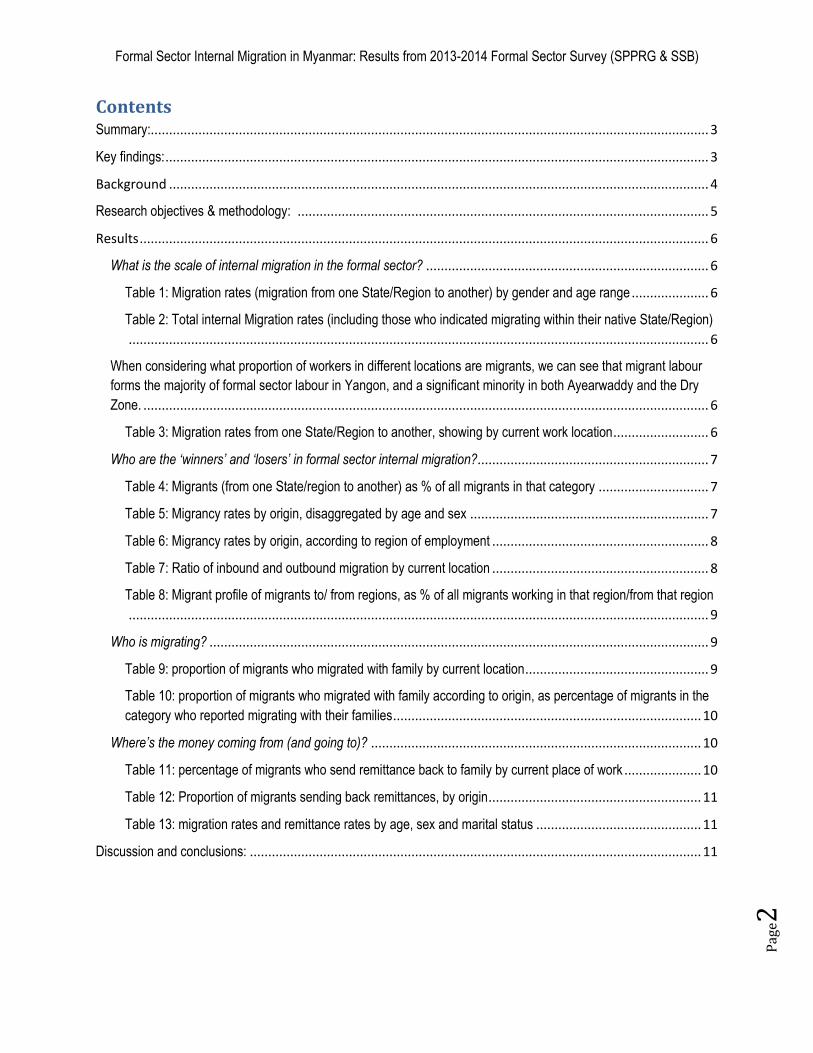
Contents Summary:........................................................................................................................................................ 3
Key findings: .................................................................................................................................................... 3
Background ................................................................................................................................................... 4
Research objectives & methodology: ................................................................................................................ 5
Results ........................................................................................................................................................... 6
What is the scale of internal migration in the formal sector? ............................................................................. 6
Table 1: Migration rates (migration from one State/Region to another) by gender and age range ..................... 6
Table 2: Total internal Migration rates (including those who indicated migrating within their native State/Region)
.............................................................................................................................................................. 6
When considering what proportion of workers in different locations are migrants, we can see that migrant labour
forms the majority of formal sector labour in Yangon, and a significant minority in both Ayearwaddy and the Dry
Zone. .......................................................................................................................................................... 6
Table 3: Migration rates from one State/Region to another, showing by current work location .......................... 6
Who are the ‘winners’ and ‘losers’ in formal sector internal migration?............................................................... 7
Table 4: Migrants (from one State/region to another) as % of all migrants in that category .............................. 7
Table 5: Migrancy rates by origin, disaggregated by age and sex ................................................................. 7
Table 6: Migrancy rates by origin, according to region of employment ........................................................... 8
Table 7: Ratio of inbound and outbound migration by current location ........................................................... 8
Table 8: Migrant profile of migrants to/ from regions, as % of all migrants working in that region/from that region
.............................................................................................................................................................. 9
Who is migrating? ........................................................................................................................................ 9
Table 9: proportion of migrants who migrated with family by current location .................................................. 9
Table 10: proportion of migrants who migrated with family according to origin, as percentage of migrants in the
category who reported migrating with their families .................................................................................... 10
Where’s the money coming from (and going to)? .......................................................................................... 10
Table 11: percentage of migrants who send remittance back to family by current place of work ..................... 10
Table 12: Proportion of migrants sending back remittances, by origin .......................................................... 11
Table 13: migration rates and remittance rates by age, sex and marital status ............................................. 11
Discussion and conclusions: ........................................................................................................................... 11
Formal Sector Internal Migration in Myanmar: Results from 2013-2014 Formal Sector Survey (SPPRG & SSB)
Pag
e3
Summary: nearly half of all formal sector workers have undertaken significant internal migration for work.
A major migration dynamic is the net import of migrant labour, particularly young male migrants, from
Ayearwaddy Region to Yangon Region. Migration in the formal sector in the Dry Zone tends to be from one
Region in the Dry Zone to another, although there is still a net export of migrant labour from the Dry Zone to
Yangon. The majority of migrants send back remittances, confirming the role that remittances have on
household economies.
Key findings:
- Over one-third (38.9%) of formal sector workers in sample had migrated for work from one
State/Region to another for work
- Nearly half (48.7%) of formal sector workers in the sample had either migrated from one
State/Region to another, or had migrated from one part of their native State/region to another for
work, with over half of all formal sector workers in Yangon being migrants
- Nearly three quarters (71%) of all migrants to the formal sector are from four regions: Ayearwaddy,
Yangon, Mandalay and Bago.
- The majority of migrants in formal sector labour in Yangon are from Ayearwaddy Region, whereas
migrants in the Dry Zone tend to be from other States/Regions within the Dry Zone.
- Ayearwaddy Region and the Dry Zone are net exporters of migrant labour to the formal sector,
whilst Yangon is a net importer. The majority of the migrants from Ayearwaddy are young men,
whereas of the small but significant number of migrants into the Delta, the majority were younger
women. Yangon Region imports younger men, but exports older men. Migrants into the Dry Zone
tended to be older men, and again, those migrants from the Dry Zone were more likely to be
younger women.
- Those migrating to Yangon or the Delta were less likely to migrate with their families than migrants
to the Dry Zone. Migrants from the Dry Zone were also more likely to migrate with families. This
suggests a difference in pattern of migration to the formal sector, whereby workers in the Dry Zone
are more likely to be male, married, and migrate within the Dry Zone with their families.
- Overall, 78% of all formal sector migrants sent back remittances. Rates of remittance sending were
highest amongst migrants from Ayearwaddy Region, and amongst workers working in the Dry
Zone. Remittance rates for migrants working in Ayearwaddy Region was significantly lower.
Younger men were more likely to send back remittances than older men, unmarried women were
more likely to send back remittances than married women, and .overall, remittance rates were
highest for younger, unmarried migrants.
Formal Sector Internal Migration in Myanmar: Results from 2013-2014 Formal Sector Survey (SPPRG & SSB)
Pag
e4
Background Globally, the estimates of the population of internal and external migrant populations are
between 750 million and one billion1, with continued growth in numbers in the 21st century. The inter-
relatedness of migrant labour and certain national or regional economies means that on one hand, certain
economies rely heavily on low-cost migrant labour to maintain competitiveness, whilst at the same time,
remittances form a major contribution to GDP in numerous countries which supply migrant labour2. Recent
studies of the Myanmar migrant labour force in Thailand highlight the dependence of certain sectors of the
Thai economy on Myanmar migrant labour, where an estimated 3.5 million migrants in either regular or
irregular status are in Thailand; roughly 3 million of these migrants are in the labour market. In Thailand, 76
per cent of the total migrant workforce3 is from Myanmar, meaning that Myanmar migrants constitute
approximately 7 per cent of Thailand’s total working population.4 Smaller studies of migration in 6
state/Regions as part of QSEM revealed that migration is a common coping strategy, with 26-30% of all
households having a family member migrating, and overall village population migration levels ranging from
less than 2% in Shan State to over 10% in Mandalay Region. International, non-seasonal migration was
highest in States bordering neighbouring countries, whilst in the central and delta areas, the migration was
predominantly internal and seasonal.5 Studies from the Dry Zone6 show that remittances make up over
10% of all household income, and in 6% of all households was the main source of income. Remittances
made up 15% of all income for the poorest households, compared with 5% of income for the richest
households.7 Female-headed households were twice as likely as male-headed households to be reliant on
remittances as the main household income source. Households where remittances were the main source of
income were nearly 6 times more likely to be classified as vulnerable than those where remittances were
not the main source of income (30.3% vs. 5.3%). Thus, research evidence underscores the significant role
of remittances in household income, both from internal and external migration. However, little is known of
the scale and patterns of internal migration in the formal sector. Although statistics estimate the formal
sector workforce to be around 650,0008 (around 2% of the total labour force), this figure is likely to be
higher. Given the likely expansion in the formal sector workforce in Myanmar due to the emphasis on
industrialization and technology-based industry in the proposed economic reforms, knowledge of current
internal migration patterns in the formal sector is vital in order to anticipate future trends.
1 Skeldon, R (1997) Migration and Development: A Global Perspective Harlow, Essex: Addison Wesley Longman 2 Taylor, E. J.1999. ‘The new economics of labour migration and the role of remittances in the migration process.’ International Migration 37: 63–88 3 J.H. Huguet and A. Chamratrithirong (eds.), Thailand Migration Report 2011, (Bangkok, IOM, 2011). 4 Thai Department of Employment, Ministry of Labour IOM Migrant Information Note (MIN), Issue #21 (September 2013) 5 LIFT/World Bank (2014) Qualitative Social and Econimic Monitoring (QSEM) Summary of Round Four Report 6 SPPRG Household Survey 2013-14 7 Poorest were in the lowest quintile for asset value; richest were in the highest quintile for asset value 8 This is based on records from the Social Security Board. However, it is assumed that not all formal sector workers are registered with the SSB. Likewise, the recent verification process identified a significant proportion of workers who were enrolled, but who were no longer working in the sector.
Formal Sector Internal Migration in Myanmar: Results from 2013-2014 Formal Sector Survey (SPPRG & SSB)
Pag
e5
Research objectives & methodology: Much of the research in Myanmar to date has focused
either on seasonal, internal migration or external migration. Little is known on the extent to which the formal
sector is supported by migrants from other parts of the country, and, given the emphasis on an expansion
of industrialized, formal sector employment envisaged by the new economic reforms, an estimate of the
current proportion of formal sector workforce which is migrant can help in making projections on likely
future migration patterns incurred in response to industrialization. Given those knowledge gaps concerning
internal migration in the formal sector, the research proposal was formulated in collaboration with the Social
Security Board, under the Ministry of Labour, Employment and Social Security of the Government of the
Union of Myanmar, with the objectives to consider the following research questions:
- What is the proportion of the current formal sector workforce which has migrated from one
State/Region to another for work?
- What proportion have migrated within their native State/Region for work in the formal sector?
- What are the main giving/receiving States/Regions?
- What are the patterns of remittances
Between December 2013 and December 2014, data was collected from a sample of employees enrolled
into the Social Security Board’s Social Security system, in tandem with the SSB’s own verification process
for group members. The proportion of workers in formal sector is currently estimated to be around 2% of
the entire workforce of Myanmar, and included factories, offices, and other places of employment with
workers registered in the social security scheme. Government workers are also part of the scheme, but
were not included in this study, as their migration could be considered less ‘voluntary’. A tripartite
agreement was signed between the Social Security board, SPPRG and ActionAid to provide funding and
questionnaires to SSB, with data entry to be conducted by an IT firm subcontracted by SSB, and analysis
and publication to be undertaken by SPPRG. The questionnaire was designed to be anonymized, simple,
and to be able to be machine-scanned for rapid data entry. Questionnaires would be handed out to by SSB
staff who were conducting the verification process to employees to complete as they waited for the
verification process for the social security board membership. Completion was voluntary, and afterwards,
completed forms were collected and returned by SSB staff. The form had no aspects which could lead to
subsequent identification of either the worker or the factory, and were simply collected by Township. In
total, a 10% weighted sample was identified from 650,000 registered workers. Due to catastrophic failures
by the subcontracted IT firm9, the data entry was delayed 12 months and the usable sample, after weighted
adjustment, was 2.5% of the total registered workforce. However, after excluding government staff10 from
the sample the overall sample was 3%, and, at over 15,000, this represents a large enough sample size to
satisfy statistical significance. Efforts are being made to secure the remaining data, which will allow more
detailed analysis of migration at State and Regional level. The questionnaire is available as Appendix 1.
Respondents were asked to indicate age and sex, and then whether they had migrated from another
State/Region in order to work here, and if so, from what State/Region. If they had not migrated from
another State/region, they were further asked whether they had migrated from a different area of their
native State/Region to work. They were asked if they had migrated with their family, whether they sent back 9 U Aung Soe Moe 10 Government staff are included in the social security board, but were not included in the survey as their migration is considered ‘involuntary’
Formal Sector Internal Migration in Myanmar: Results from 2013-2014 Formal Sector Survey (SPPRG & SSB)
Pag
e6
remittances, and, if female, a series of questions on workplace practice. Response was voluntary and
anonymized, so that no employees were forced, coerced or incentivized to participate. Completed
questionnaires were returned to the IT firm for machine reading and coding, after which data was sent to
SPPRG for collation and analysis. The final overall sample size was 15,765, and was 55% male and 45%
female, with 49% under 25 and 51% over 25, with females sampled were more likely to be over 25 (52.6%)
than males (43.5%).
Results
What is the scale of internal migration in the formal sector?
The overall migration rate was 38.9%, suggesting that well over two-thirds of the workforce in the formal
sector had migrated from another place. (Table 1) However, when migration within a State/region was
included, this figure rose to nearly 50% who reported as having moved either from another State/Region to
work, or from the countryside to the city to work. (Table 2).
Table 1: Migration rates (migration from one State/Region to another) by gender and age range
Male Female Total
Under 25 52.7% 38.3% 46.8%
Over 25 38.2% 21.3% 29.8%
Total 46.2% 29.6% 38.9%
Migration rates analyzed by gender showed statistically significant differences in the rates of migration by
gender and age group, with the highest rates of migration amongst men aged under 25, and the lowest
rates of migration were amongst females over 25.
Table 2: Total internal Migration rates (including those who indicated migrating within their native
State/Region)
Male Female Total
Under 25 56.2% 52.2% 55.1%
Over 25 48.7% 35.1% 42.1%
Total 52.8% 43.5% 48.7%
When considering what proportion of workers in different locations are migrants, we can see that
migrant labour forms the majority of formal sector labour in Yangon, and a significant minority in
both Ayearwaddy and the Dry Zone (here, Dry Zone is considered Sagaing, Mandalay, Bago and
Magwe Regions)
Table 3: Migration rates from one State/Region to another, showing by current work location
Male Female Total
Ayearwaddy 24.3% 51.3% 45.0%
Dry Zone 34.3% 27.8% 30.3%
Yangon 50.5% 56.4% 53.0%
Formal Sector Internal Migration in Myanmar: Results from 2013-2014 Formal Sector Survey (SPPRG & SSB)
Pag
e7
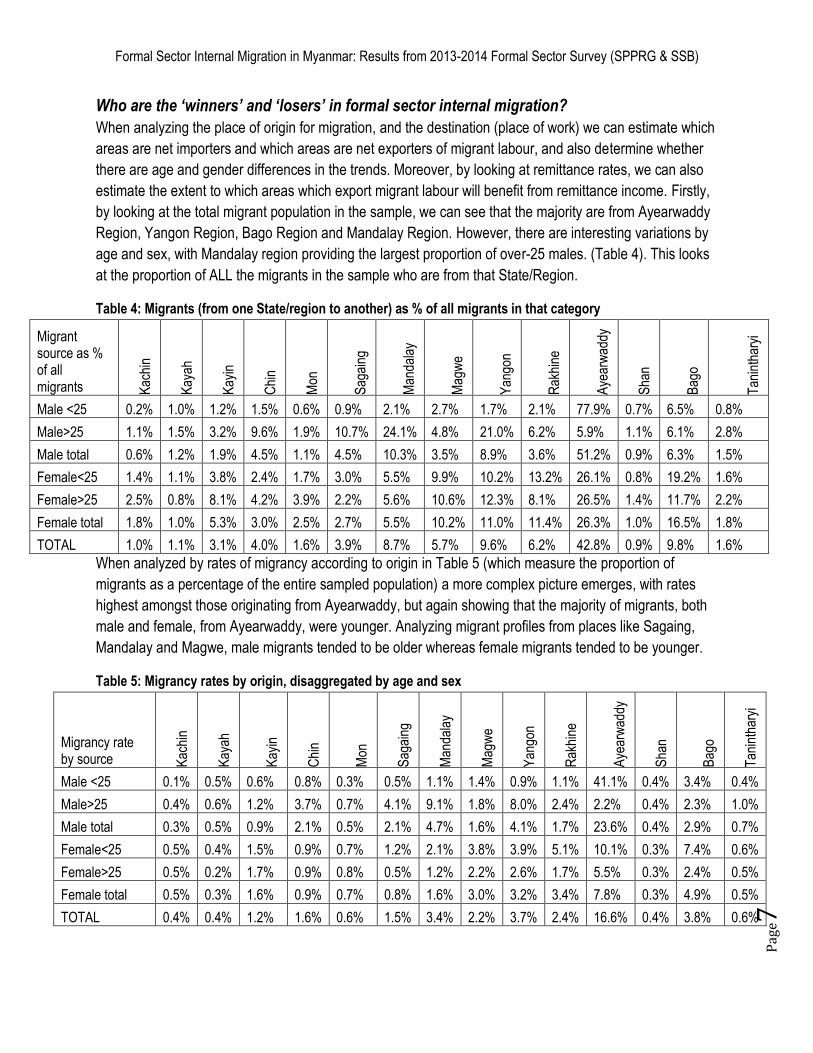
Who are the ‘winners’ and ‘losers’ in formal sector internal migration?
When analyzing the place of origin for migration, and the destination (place of work) we can estimate which
areas are net importers and which areas are net exporters of migrant labour, and also determine whether
there are age and gender differences in the trends. Moreover, by looking at remittance rates, we can also
estimate the extent to which areas which export migrant labour will benefit from remittance income. Firstly,
by looking at the total migrant population in the sample, we can see that the majority are from Ayearwaddy
Region, Yangon Region, Bago Region and Mandalay Region. However, there are interesting variations by
age and sex, with Mandalay region providing the largest proportion of over-25 males. (Table 4). This looks
at the proportion of ALL the migrants in the sample who are from that State/Region.
Table 4: Migrants (from one State/region to another) as % of all migrants in that category
Migrant source as % of all migrants K
achi
n
Kay
ah
Kay
in
Chi
n
Mon
Sag
aing
Man
dala
y
Mag
we
Yan
gon
Rak
hine
Aye
arw
addy
Sha
n
Bag
o
Tan
inth
aryi
Male <25 0.2% 1.0% 1.2% 1.5% 0.6% 0.9% 2.1% 2.7% 1.7% 2.1% 77.9% 0.7% 6.5% 0.8%
Male>25 1.1% 1.5% 3.2% 9.6% 1.9% 10.7% 24.1% 4.8% 21.0% 6.2% 5.9% 1.1% 6.1% 2.8%
Male total 0.6% 1.2% 1.9% 4.5% 1.1% 4.5% 10.3% 3.5% 8.9% 3.6% 51.2% 0.9% 6.3% 1.5%
Female<25 1.4% 1.1% 3.8% 2.4% 1.7% 3.0% 5.5% 9.9% 10.2% 13.2% 26.1% 0.8% 19.2% 1.6%
Female>25 2.5% 0.8% 8.1% 4.2% 3.9% 2.2% 5.6% 10.6% 12.3% 8.1% 26.5% 1.4% 11.7% 2.2%
Female total 1.8% 1.0% 5.3% 3.0% 2.5% 2.7% 5.5% 10.2% 11.0% 11.4% 26.3% 1.0% 16.5% 1.8%
TOTAL 1.0% 1.1% 3.1% 4.0% 1.6% 3.9% 8.7% 5.7% 9.6% 6.2% 42.8% 0.9% 9.8% 1.6%
When analyzed by rates of migrancy according to origin in Table 5 (which measure the proportion of
migrants as a percentage of the entire sampled population) a more complex picture emerges, with rates
highest amongst those originating from Ayearwaddy, but again showing that the majority of migrants, both
male and female, from Ayearwaddy, were younger. Analyzing migrant profiles from places like Sagaing,
Mandalay and Magwe, male migrants tended to be older whereas female migrants tended to be younger.
Table 5: Migrancy rates by origin, disaggregated by age and sex
Migrancy rate by source K
achi
n
Kay
ah
Kay
in
Chi
n
Mon
Sag
aing
Man
dala
y
Mag
we
Yan
gon
Rak
hine
Aye
arw
addy
Sha
n
Bag
o
Tan
inth
aryi
Male <25 0.1% 0.5% 0.6% 0.8% 0.3% 0.5% 1.1% 1.4% 0.9% 1.1% 41.1% 0.4% 3.4% 0.4%
Male>25 0.4% 0.6% 1.2% 3.7% 0.7% 4.1% 9.1% 1.8% 8.0% 2.4% 2.2% 0.4% 2.3% 1.0%
Male total 0.3% 0.5% 0.9% 2.1% 0.5% 2.1% 4.7% 1.6% 4.1% 1.7% 23.6% 0.4% 2.9% 0.7%
Female<25 0.5% 0.4% 1.5% 0.9% 0.7% 1.2% 2.1% 3.8% 3.9% 5.1% 10.1% 0.3% 7.4% 0.6%
Female>25 0.5% 0.2% 1.7% 0.9% 0.8% 0.5% 1.2% 2.2% 2.6% 1.7% 5.5% 0.3% 2.4% 0.5%
Female total 0.5% 0.3% 1.6% 0.9% 0.7% 0.8% 1.6% 3.0% 3.2% 3.4% 7.8% 0.3% 4.9% 0.5%
TOTAL 0.4% 0.4% 1.2% 1.6% 0.6% 1.5% 3.4% 2.2% 3.7% 2.4% 16.6% 0.4% 3.8% 0.6%
Formal Sector Internal Migration in Myanmar: Results from 2013-2014 Formal Sector Survey (SPPRG & SSB)
Pag
e8
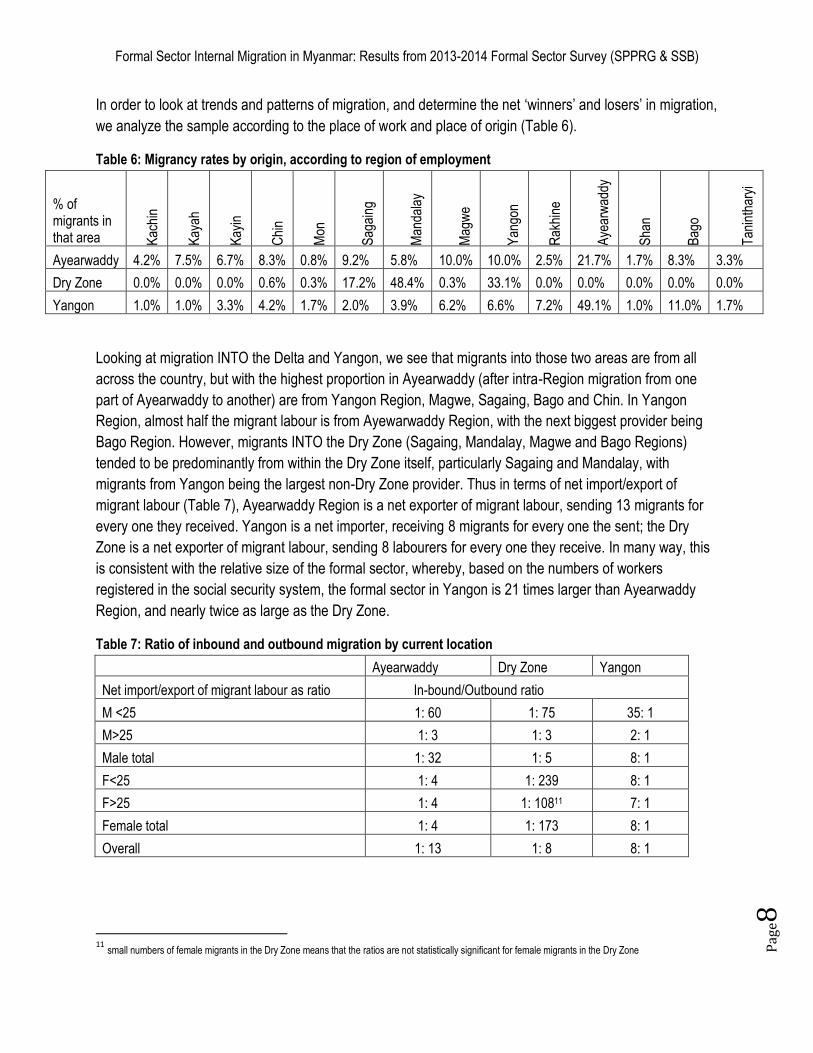
In order to look at trends and patterns of migration, and determine the net ‘winners’ and losers’ in migration,
we analyze the sample according to the place of work and place of origin (Table 6).
Table 6: Migrancy rates by origin, according to region of employment
% of migrants in that area K
achi
n
Kay
ah
Kay
in
Chi
n
Mon
Sag
aing
Man
dala
y
Mag
we
Yan
gon
Rak
hine
Aye
arw
addy
Sha
n
Bag
o
Tan
inth
aryi
Ayearwaddy 4.2% 7.5% 6.7% 8.3% 0.8% 9.2% 5.8% 10.0% 10.0% 2.5% 21.7% 1.7% 8.3% 3.3%
Dry Zone 0.0% 0.0% 0.0% 0.6% 0.3% 17.2% 48.4% 0.3% 33.1% 0.0% 0.0% 0.0% 0.0% 0.0%
Yangon 1.0% 1.0% 3.3% 4.2% 1.7% 2.0% 3.9% 6.2% 6.6% 7.2% 49.1% 1.0% 11.0% 1.7%
Looking at migration INTO the Delta and Yangon, we see that migrants into those two areas are from all
across the country, but with the highest proportion in Ayearwaddy (after intra-Region migration from one
part of Ayearwaddy to another) are from Yangon Region, Magwe, Sagaing, Bago and Chin. In Yangon
Region, almost half the migrant labour is from Ayewarwaddy Region, with the next biggest provider being
Bago Region. However, migrants INTO the Dry Zone (Sagaing, Mandalay, Magwe and Bago Regions)
tended to be predominantly from within the Dry Zone itself, particularly Sagaing and Mandalay, with
migrants from Yangon being the largest non-Dry Zone provider. Thus in terms of net import/export of
migrant labour (Table 7), Ayearwaddy Region is a net exporter of migrant labour, sending 13 migrants for
every one they received. Yangon is a net importer, receiving 8 migrants for every one the sent; the Dry
Zone is a net exporter of migrant labour, sending 8 labourers for every one they receive. In many way, this
is consistent with the relative size of the formal sector, whereby, based on the numbers of workers
registered in the social security system, the formal sector in Yangon is 21 times larger than Ayearwaddy
Region, and nearly twice as large as the Dry Zone.
Table 7: Ratio of inbound and outbound migration by current location
Ayearwaddy Dry Zone Yangon
Net import/export of migrant labour as ratio In-bound/Outbound ratio M <25 1: 60 1: 75 35: 1
M>25 1: 3 1: 3 2: 1
Male total 1: 32 1: 5 8: 1
F<25 1: 4 1: 239 8: 1
F>25 1: 4 1: 10811 7: 1
Female total 1: 4 1: 173 8: 1
Overall 1: 13 1: 8 8: 1
11
small numbers of female migrants in the Dry Zone means that the ratios are not statistically significant for female migrants in the Dry Zone
Formal Sector Internal Migration in Myanmar: Results from 2013-2014 Formal Sector Survey (SPPRG & SSB)
Pag
e9
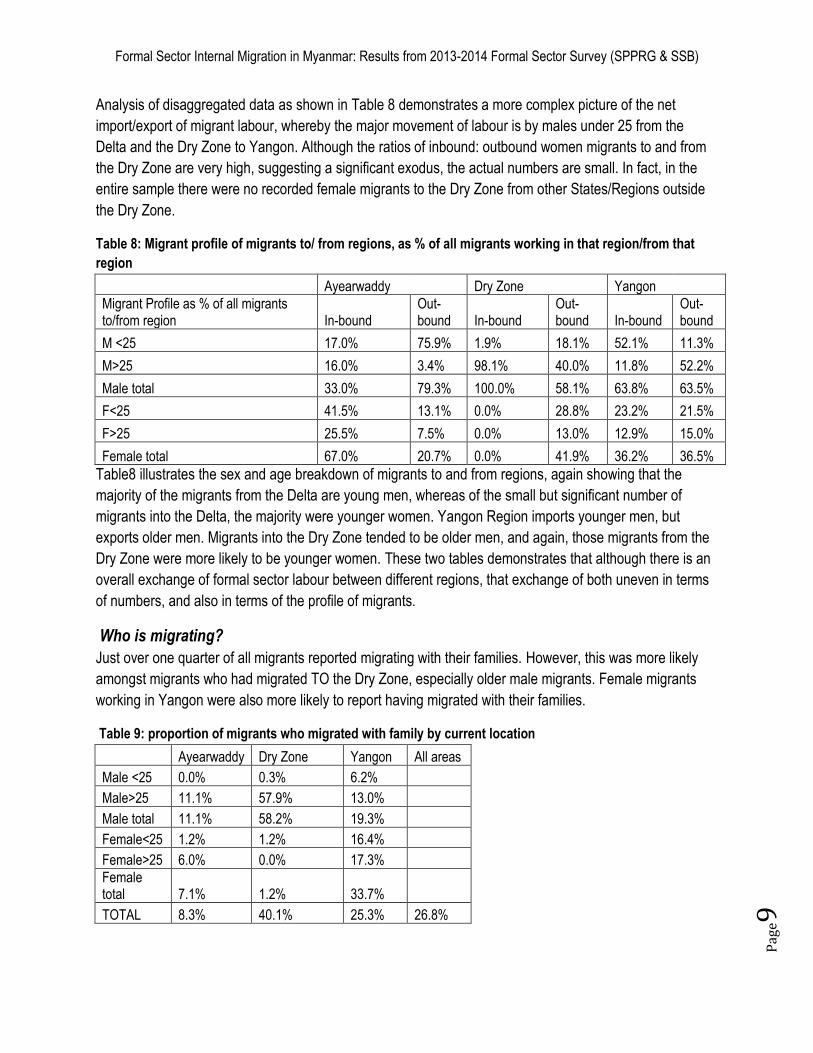
Analysis of disaggregated data as shown in Table 8 demonstrates a more complex picture of the net
import/export of migrant labour, whereby the major movement of labour is by males under 25 from the
Delta and the Dry Zone to Yangon. Although the ratios of inbound: outbound women migrants to and from
the Dry Zone are very high, suggesting a significant exodus, the actual numbers are small. In fact, in the
entire sample there were no recorded female migrants to the Dry Zone from other States/Regions outside
the Dry Zone.
Table 8: Migrant profile of migrants to/ from regions, as % of all migrants working in that region/from that
region
Ayearwaddy
Dry Zone Yangon
Migrant Profile as % of all migrants to/from region In-bound
Out-bound In-bound
Out-bound In-bound
Out-bound
M <25 17.0% 75.9% 1.9% 18.1% 52.1% 11.3%
M>25 16.0% 3.4% 98.1% 40.0% 11.8% 52.2%
Male total 33.0% 79.3% 100.0% 58.1% 63.8% 63.5%
F<25 41.5% 13.1% 0.0% 28.8% 23.2% 21.5%
F>25 25.5% 7.5% 0.0% 13.0% 12.9% 15.0%
Female total 67.0% 20.7% 0.0% 41.9% 36.2% 36.5%
Table8 illustrates the sex and age breakdown of migrants to and from regions, again showing that the
majority of the migrants from the Delta are young men, whereas of the small but significant number of
migrants into the Delta, the majority were younger women. Yangon Region imports younger men, but
exports older men. Migrants into the Dry Zone tended to be older men, and again, those migrants from the
Dry Zone were more likely to be younger women. These two tables demonstrates that although there is an
overall exchange of formal sector labour between different regions, that exchange of both uneven in terms
of numbers, and also in terms of the profile of migrants.
Who is migrating?
Just over one quarter of all migrants reported migrating with their families. However, this was more likely
amongst migrants who had migrated TO the Dry Zone, especially older male migrants. Female migrants
working in Yangon were also more likely to report having migrated with their families.
Table 9: proportion of migrants who migrated with family by current location
Ayearwaddy Dry Zone Yangon All areas
Male <25 0.0% 0.3% 6.2% Male>25 11.1% 57.9% 13.0% Male total 11.1% 58.2% 19.3% Female<25 1.2% 1.2% 16.4% Female>25 6.0% 0.0% 17.3% Female
total 7.1% 1.2% 33.7% TOTAL 8.3% 40.1% 25.3% 26.8%
Formal Sector Internal Migration in Myanmar: Results from 2013-2014 Formal Sector Survey (SPPRG & SSB)
Pag
e10
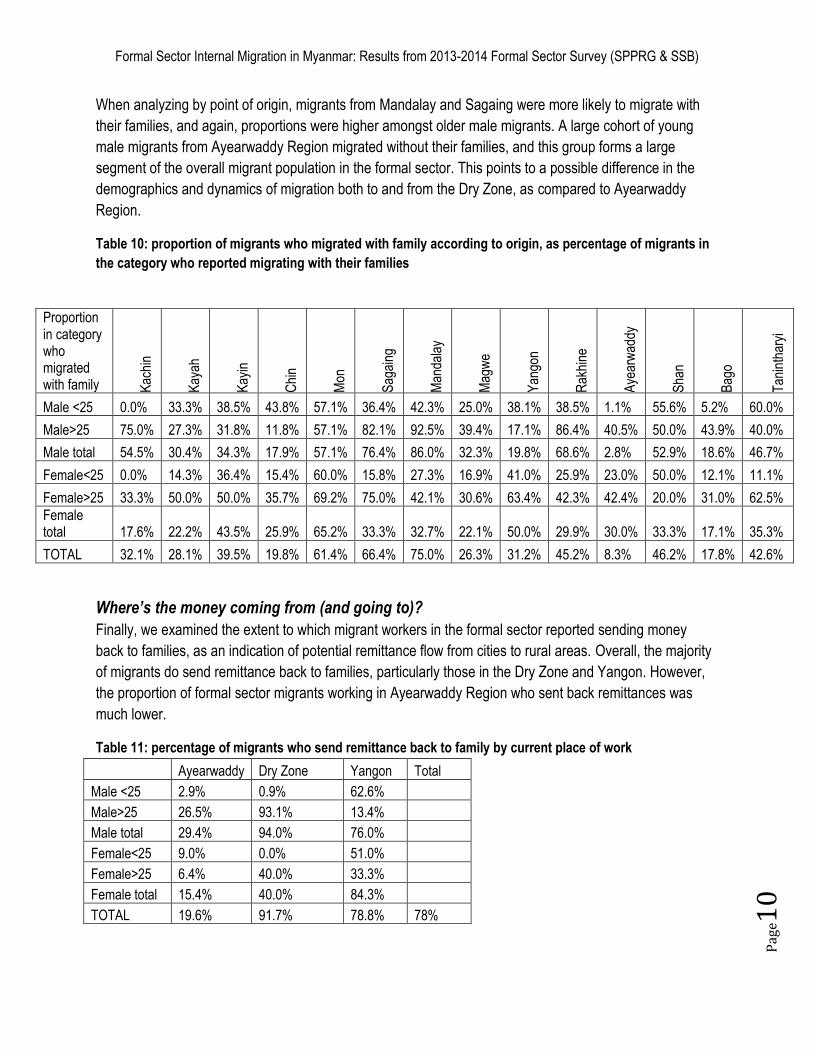
When analyzing by point of origin, migrants from Mandalay and Sagaing were more likely to migrate with
their families, and again, proportions were higher amongst older male migrants. A large cohort of young
male migrants from Ayearwaddy Region migrated without their families, and this group forms a large
segment of the overall migrant population in the formal sector. This points to a possible difference in the
demographics and dynamics of migration both to and from the Dry Zone, as compared to Ayearwaddy
Region.
Table 10: proportion of migrants who migrated with family according to origin, as percentage of migrants in
the category who reported migrating with their families
Proportion in category who migrated with family K
achi
n
Kay
ah
Kay
in
Chi
n
Mon
Sag
aing
Man
dala
y
Mag
we
Yan
gon
Rak
hine
Aye
arw
addy
Sha
n
Bag
o
Tan
inth
aryi
Male <25 0.0% 33.3% 38.5% 43.8% 57.1% 36.4% 42.3% 25.0% 38.1% 38.5% 1.1% 55.6% 5.2% 60.0%
Male>25 75.0% 27.3% 31.8% 11.8% 57.1% 82.1% 92.5% 39.4% 17.1% 86.4% 40.5% 50.0% 43.9% 40.0%
Male total 54.5% 30.4% 34.3% 17.9% 57.1% 76.4% 86.0% 32.3% 19.8% 68.6% 2.8% 52.9% 18.6% 46.7%
Female<25 0.0% 14.3% 36.4% 15.4% 60.0% 15.8% 27.3% 16.9% 41.0% 25.9% 23.0% 50.0% 12.1% 11.1%
Female>25 33.3% 50.0% 50.0% 35.7% 69.2% 75.0% 42.1% 30.6% 63.4% 42.3% 42.4% 20.0% 31.0% 62.5%
Female total 17.6% 22.2% 43.5% 25.9% 65.2% 33.3% 32.7% 22.1% 50.0% 29.9% 30.0% 33.3% 17.1% 35.3%
TOTAL 32.1% 28.1% 39.5% 19.8% 61.4% 66.4% 75.0% 26.3% 31.2% 45.2% 8.3% 46.2% 17.8% 42.6%
Where’s the money coming from (and going to)?
Finally, we examined the extent to which migrant workers in the formal sector reported sending money
back to families, as an indication of potential remittance flow from cities to rural areas. Overall, the majority
of migrants do send remittance back to families, particularly those in the Dry Zone and Yangon. However,
the proportion of formal sector migrants working in Ayearwaddy Region who sent back remittances was
much lower.
Table 11: percentage of migrants who send remittance back to family by current place of work
Ayearwaddy Dry Zone Yangon Total
Male <25 2.9% 0.9% 62.6% Male>25 26.5% 93.1% 13.4% Male total 29.4% 94.0% 76.0% Female<25 9.0% 0.0% 51.0% Female>25 6.4% 40.0% 33.3% Female total 15.4% 40.0% 84.3% TOTAL 19.6% 91.7% 78.8% 78%
Formal Sector Internal Migration in Myanmar: Results from 2013-2014 Formal Sector Survey (SPPRG & SSB)
Pag
e11
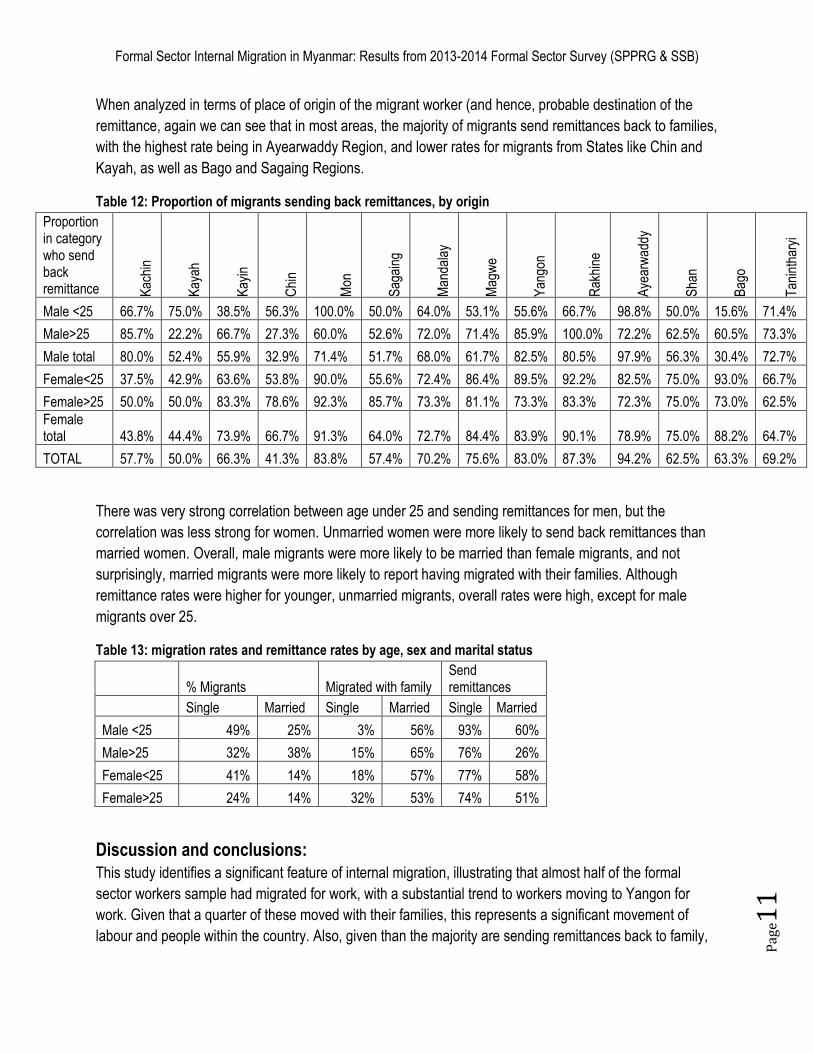
When analyzed in terms of place of origin of the migrant worker (and hence, probable destination of the
remittance, again we can see that in most areas, the majority of migrants send remittances back to families,
with the highest rate being in Ayearwaddy Region, and lower rates for migrants from States like Chin and
Kayah, as well as Bago and Sagaing Regions.
Table 12: Proportion of migrants sending back remittances, by origin
Proportion in category who send back remittance K
achi
n
Kay
ah
Kay
in
Chi
n
Mon
Sag
aing
Man
dala
y
Mag
we
Yan
gon
Rak
hine
Aye
arw
addy
Sha
n
Bag
o
Tan
inth
aryi
Male <25 66.7% 75.0% 38.5% 56.3% 100.0% 50.0% 64.0% 53.1% 55.6% 66.7% 98.8% 50.0% 15.6% 71.4%
Male>25 85.7% 22.2% 66.7% 27.3% 60.0% 52.6% 72.0% 71.4% 85.9% 100.0% 72.2% 62.5% 60.5% 73.3%
Male total 80.0% 52.4% 55.9% 32.9% 71.4% 51.7% 68.0% 61.7% 82.5% 80.5% 97.9% 56.3% 30.4% 72.7%
Female<25 37.5% 42.9% 63.6% 53.8% 90.0% 55.6% 72.4% 86.4% 89.5% 92.2% 82.5% 75.0% 93.0% 66.7%
Female>25 50.0% 50.0% 83.3% 78.6% 92.3% 85.7% 73.3% 81.1% 73.3% 83.3% 72.3% 75.0% 73.0% 62.5%
Female total 43.8% 44.4% 73.9% 66.7% 91.3% 64.0% 72.7% 84.4% 83.9% 90.1% 78.9% 75.0% 88.2% 64.7%
TOTAL 57.7% 50.0% 66.3% 41.3% 83.8% 57.4% 70.2% 75.6% 83.0% 87.3% 94.2% 62.5% 63.3% 69.2%
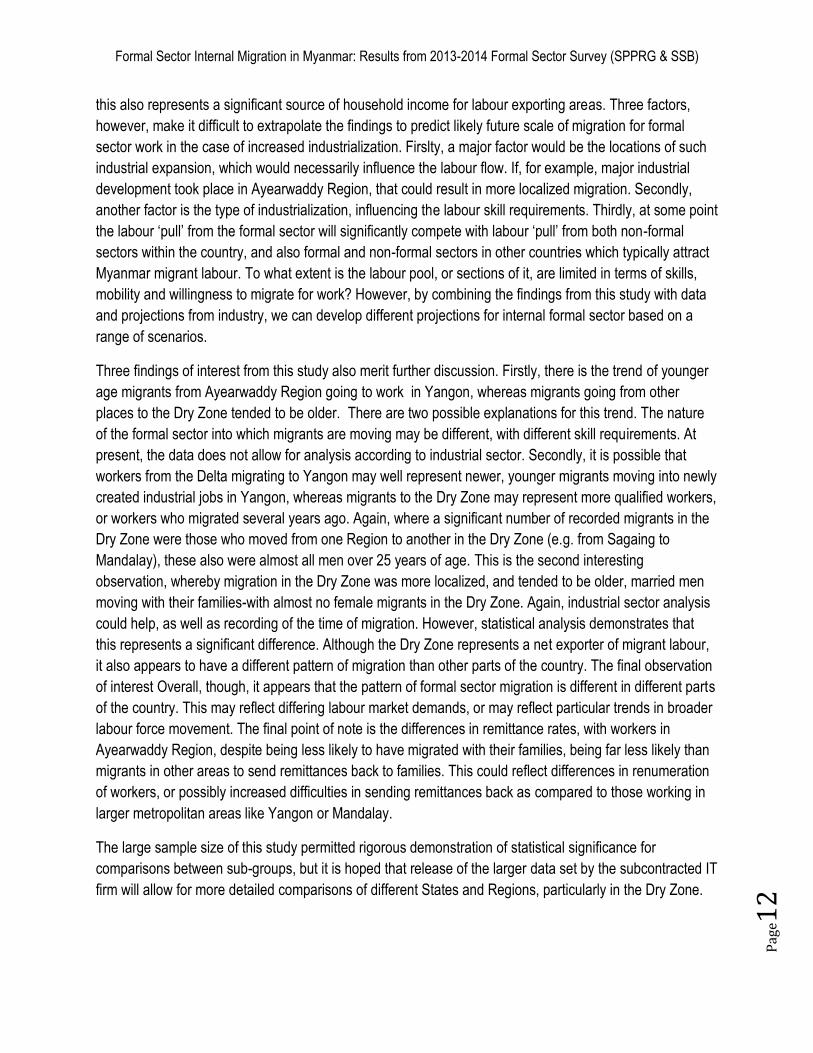
There was very strong correlation between age under 25 and sending remittances for men, but the
correlation was less strong for women. Unmarried women were more likely to send back remittances than
married women. Overall, male migrants were more likely to be married than female migrants, and not
surprisingly, married migrants were more likely to report having migrated with their families. Although
remittance rates were higher for younger, unmarried migrants, overall rates were high, except for male
migrants over 25.
Table 13: migration rates and remittance rates by age, sex and marital status
% Migrants
Migrated with family
Send remittances
Single Married Single Married Single Married
Male <25 49% 25% 3% 56% 93% 60%
Male>25 32% 38% 15% 65% 76% 26%
Female<25 41% 14% 18% 57% 77% 58%
Female>25 24% 14% 32% 53% 74% 51%
Discussion and conclusions:
This study identifies a significant feature of internal migration, illustrating that almost half of the formal
sector workers sample had migrated for work, with a substantial trend to workers moving to Yangon for
work. Given that a quarter of these moved with their families, this represents a significant movement of
labour and people within the country. Also, given than the majority are sending remittances back to family,
Formal Sector Internal Migration in Myanmar: Results from 2013-2014 Formal Sector Survey (SPPRG & SSB)
Pag
e12
this also represents a significant source of household income for labour exporting areas. Three factors,
however, make it difficult to extrapolate the findings to predict likely future scale of migration for formal
sector work in the case of increased industrialization. Firslty, a major factor would be the locations of such
industrial expansion, which would necessarily influence the labour flow. If, for example, major industrial
development took place in Ayearwaddy Region, that could result in more localized migration. Secondly,
another factor is the type of industrialization, influencing the labour skill requirements. Thirdly, at some point
the labour ‘pull’ from the formal sector will significantly compete with labour ‘pull’ from both non-formal
sectors within the country, and also formal and non-formal sectors in other countries which typically attract
Myanmar migrant labour. To what extent is the labour pool, or sections of it, are limited in terms of skills,
mobility and willingness to migrate for work? However, by combining the findings from this study with data
and projections from industry, we can develop different projections for internal formal sector based on a
range of scenarios.
Three findings of interest from this study also merit further discussion. Firstly, there is the trend of younger
age migrants from Ayearwaddy Region going to work in Yangon, whereas migrants going from other
places to the Dry Zone tended to be older. There are two possible explanations for this trend. The nature
of the formal sector into which migrants are moving may be different, with different skill requirements. At
present, the data does not allow for analysis according to industrial sector. Secondly, it is possible that
workers from the Delta migrating to Yangon may well represent newer, younger migrants moving into newly
created industrial jobs in Yangon, whereas migrants to the Dry Zone may represent more qualified workers,
or workers who migrated several years ago. Again, where a significant number of recorded migrants in the
Dry Zone were those who moved from one Region to another in the Dry Zone (e.g. from Sagaing to
Mandalay), these also were almost all men over 25 years of age. This is the second interesting
observation, whereby migration in the Dry Zone was more localized, and tended to be older, married men
moving with their families-with almost no female migrants in the Dry Zone. Again, industrial sector analysis
could help, as well as recording of the time of migration. However, statistical analysis demonstrates that
this represents a significant difference. Although the Dry Zone represents a net exporter of migrant labour,
it also appears to have a different pattern of migration than other parts of the country. The final observation
of interest Overall, though, it appears that the pattern of formal sector migration is different in different parts
of the country. This may reflect differing labour market demands, or may reflect particular trends in broader
labour force movement. The final point of note is the differences in remittance rates, with workers in
Ayearwaddy Region, despite being less likely to have migrated with their families, being far less likely than
migrants in other areas to send remittances back to families. This could reflect differences in renumeration
of workers, or possibly increased difficulties in sending remittances back as compared to those working in
larger metropolitan areas like Yangon or Mandalay.
The large sample size of this study permitted rigorous demonstration of statistical significance for
comparisons between sub-groups, but it is hoped that release of the larger data set by the subcontracted IT
firm will allow for more detailed comparisons of different States and Regions, particularly in the Dry Zone.