FORM 20-F - Santander
304
UNITED STATES SECURITIES AND EXCHANGE COMMISSION WASHINGTON, D.C. 20549 FORM 20-F (Mark One) ☐ REGISTRATION STATEMENT PURSUANT TO SECTION 12(b) OR (g) OF THE SECURITIES EXCHANGE ACT OF 1934 OR ☒ ANNUAL REPORT PURSUANT TO SECTION 13 OR 15(d) OF THE SECURITIES EXCHANGE ACT OF 1934 For the fiscal year ended December 31, 2018 OR ☐ TRANSITION REPORT PURSUANT TO SECTION 13 OR 15(d) OF THE SECURITIES EXCHANGE ACT OF 1934 For the transition period from to OR ☐ SHELL COMPANY REPORT PURSUANT TO SECTION 13 OR 15(d) OF THE SECURITIES EXCHANGE ACT OF 1934 Date of event requiring this shell company report to Commission file number 001-14928 Santander UK plc (Exact name of Registrant as specified in its charter) England (Jurisdiction of incorporation or organization) 2 Triton Square, Regent’s Place, London NW1 3AN, England (Address of principal executive offices) Julian Curtis 2 Triton Square, Regent’s Place, London NW1 3AN, England Tel: +44 (0) 20 7756 4272 E-mail: [email protected] (Name, Telephone, E-mail and/or Facsimile number and Address of Company Contact Person) Securities registered or to be registered pursuant to Section 12(b) of the Act. 2.500% Notes due March 14, 2019, issued by Abbey National Treasury Services plc* New York Stock Exchange Floating Rate Notes due March 14, 2019, issued by Abbey National Treasury Services plc * New York Stock Exchange 2.350% Notes due September 10, 2019, issued by Abbey National Treasury Services plc * New York Stock Exchange 2.375% Notes due March 16, 2020, issued by Abbey National Treasury Services plc * New York Stock Exchange 2.125% Notes due November 3, 2020, issued by Santander UK plc New York Stock Exchange Floating Rate Notes due November 3, 2020, issued by Santander UK plc New York Stock Exchange 2.500% Notes due January 5, 2021, issued by Santander UK plc New York Stock Exchange 3.400% Notes due June 1, 2021, issued by Santander UK plc New York Stock Exchange Floating Rate Notes due June 1, 2021, issued by Santander UK plc New York Stock Exchange 3.750% Notes due 2021 due November 15, 2021, issued by Santander UK plc New York Stock Exchange Floating Rate Notes due November 15, 2021, issued by Santander UK plc New York Stock Exchange 4.000% Notes due March 13, 2024, issued by Abbey National Treasury Services plc * New York Stock Exchange * From June 1, 2016 Santander UK plc became the issuer in respect of the outstanding notes issued by Abbey National Treasury Services plc under its US SEC registered debt shelf. All notes transferred to Santander UK plc by Abbey National Treasury Services plc under its US SEC registered debt shelf and all notes issued by Santander UK plc in the future under its US SEC registered debt shelf will be the sole liability of Santander UK plc and are not guaranteed by any other entity. Securities registered or to be registered pursuant to Section 12(g) of the Act.
Transcript of FORM 20-F - Santander
ˆ200G2Mlv!3LRayPg]Š200G2Mlv!3LRayPg]
628340 FS 1SANTANDERFORM 20-F (SAN UK PL
06-Mar-2019 15:30 ESTHTMLON
Donnelley Financial EGV corng0ln 13*ESS 0C
VDI-W7-PFL-024412.9.12.0
Page 1 of 2
UNITED STATES
SECURITIES AND EXCHANGE COMMISSION
WASHINGTON, D.C. 20549
FORM 20-F
(Mark One)
☐ REGISTRATION STATEMENT PURSUANT TO SECTION 12(b) OR (g) OF THE SECURITIES
EXCHANGE ACT OF 1934
OR
☒ ANNUAL REPORT PURSUANT TO SECTION 13 OR 15(d) OF THE SECURITIES EXCHANGE
ACT OF 1934
For the fiscal year ended December 31, 2018
OR
☐ TRANSITION REPORT PURSUANT TO SECTION 13 OR 15(d) OF THE SECURITIES
EXCHANGE ACT OF 1934
For the transition period from to
OR
☐ SHELL COMPANY REPORT PURSUANT TO SECTION 13 OR 15(d) OF THE SECURITIES
EXCHANGE ACT OF 1934
Date of event requiring this shell company report to
Commission file number 001-14928
Santander UK plc (Exact name of Registrant as specified in its charter)
England
(Jurisdiction of incorporation or organization)
2 Triton Square, Regent’s Place, London NW1 3AN, England
(Address of principal executive offices)
Julian Curtis
2 Triton Square, Regent’s Place, London NW1 3AN, England
Tel: +44 (0) 20 7756 4272
E-mail: [email protected]
(Name, Telephone, E-mail and/or Facsimile number and Address of Company Contact Person)
Securities registered or to be registered pursuant to Section 12(b) of the Act.
2.500% Notes due March 14, 2019, issued by Abbey National Treasury Services plc* New York Stock Exchange
Floating Rate Notes due March 14, 2019, issued by Abbey National Treasury Services plc * New York Stock Exchange
2.350% Notes due September 10, 2019, issued by Abbey National Treasury Services plc * New York Stock Exchange
2.375% Notes due March 16, 2020, issued by Abbey National Treasury Services plc * New York Stock Exchange
2.125% Notes due November 3, 2020, issued by Santander UK plc New York Stock Exchange
Floating Rate Notes due November 3, 2020, issued by Santander UK plc New York Stock Exchange
2.500% Notes due January 5, 2021, issued by Santander UK plc New York Stock Exchange
3.400% Notes due June 1, 2021, issued by Santander UK plc New York Stock Exchange
Floating Rate Notes due June 1, 2021, issued by Santander UK plc New York Stock Exchange
3.750% Notes due 2021 due November 15, 2021, issued by Santander UK plc New York Stock Exchange
Floating Rate Notes due November 15, 2021, issued by Santander UK plc New York Stock Exchange
4.000% Notes due March 13, 2024, issued by Abbey National Treasury Services plc * New York Stock Exchange
* From June 1, 2016 Santander UK plc became the issuer in respect of the outstanding notes issued by Abbey National
Treasury Services plc under its US SEC registered debt shelf. All notes transferred to Santander UK plc by Abbey
National Treasury Services plc under its US SEC registered debt shelf and all notes issued by Santander UK plc in the
future under its US SEC registered debt shelf will be the sole liability of Santander UK plc and are not guaranteed by any
other entity.
Securities registered or to be registered pursuant to Section 12(g) of the Act.

ˆ200G2Mlv!3LRayPg]Š200G2Mlv!3LRayPg]
628340 FS 1SANTANDERFORM 20-F (SAN UK PL
06-Mar-2019 15:30 ESTHTMLON
Donnelley Financial EGV corng0ln 13*ESS 0C
VDI-W7-PFL-024412.9.12.0
Page 2 of 2
None
Securities for which there is a reporting obligation pursuant to Section 15(d) of the Act.
7.95% Term Subordinated Securities due October 26, 2029
Indicate the number of outstanding shares of each of the issuer’s classes of capital or common stock as of the close of the
period covered by the annual report.
Ordinary shares of nominal value of £0.10 each* 31,051,768,866
10 3/8% Non-cumulative Preference Shares of nominal value of £1 each 200,000,000
8 5/8% Non-cumulative Preference Shares of nominal value of £1 each 125,000,000
Series A Fixed/Floating Rate Non-cumulative Preference Shares of nominal value
of £1 each
13,780
* All of the issued and outstanding ordinary shares of Santander UK plc are held by Santander UK Group Holdings plc.
Indicate by check mark if the registrant is a well-known seasoned issuer, as defined in Rule 405 of the Securities
Act. Yes ☒ No ☐
If this report is an annual or transition report, indicate by check mark if the registrant is not required to file reports pursuant
to Section 13 or 15(d) of the Securities Exchange Act of 1934. Yes ☐ No ☒
Indicate by check mark whether the registrant: (1) has filed all reports required to be filed by Section 13 or 15(d) of the
Securities Exchange Act of 1934 during the preceding 12 months (or for such shorter period that the registrant was
required to file such reports), and (2) has been subject to such filing requirements for the past 90 days. Yes ☒ No ☐
Indicate by check mark whether the registrant has submitted electronically every Interactive Data File required to be
submitted pursuant to Rule 405 of Regulation S-T (§232.405 of this chapter) during the preceding 12 months (or for such
shorter period that the registrant was required to submit such files). Yes ☒ No ☐
Indicate by check mark whether the registrant is a large accelerated filer, an accelerated filer, a non-accelerated filer or an
emerging growth company. See definition of “large accelerated filer,” “accelerated filer,” and “emerging growth company” in
Rule 12b-2 of the Exchange Act.
Large accelerated filer ☐ Accelerated filer ☐ Non-accelerated filer ☒ Emerging growth company ☐
If an emerging growth company that prepares its financial statements in accordance with U.S. GAAP, indicate by check
mark if the registrant has elected not to use the extended transition period for complying with any new or revised financial
accounting standards† provided pursuant to Section 13(a) of the Exchange Act.
† The term “new or revised financial accounting standard” refers to any update issued by the Financial Accounting
Standards Board to its Accounting Standards Codification after April 5, 2012.
Indicate by check mark which basis of accounting the registrant has used to prepare the financial statements included in
this filing:
U.S. GAAP ☐ International Financial Reporting Standards as issued
by the International Accounting Standards Board ☒Other ☐
If “Other” has been checked in response to the previous question, indicate by check mark which financial statement item
the registrant has elected to follow. Item 17 ☐ Item 18 ☐
If this is an annual report, indicate by check mark whether the registrant is a shell company (as defined in Rule 12b-2 of the
Exchange Act). Yes ☐ No ☒

ˆ200G2Mlv!24mZRSgBŠ200G2Mlv!24mZRSgB
628340 OFC 1SANTANDERFORM 20-F (SAN UK PL
01-Mar-2019 22:31 ESTHTMLON
Donnelley Financial EGV marik1dc 4*ESS 0C
VDI-W7-PFL-146612.9.12.0
Page 1 of 1
2018 Annual Report
Santander UK plc
Part of the Banco Santander group

ˆ200G2Mlv!23ZSoq6uŠ200G2Mlv!23ZSoq6u
628340 IFC 1SANTANDERFORM 20-F (SAN UK PL
01-Mar-2019 21:11 ESTHTMLON
Donnelley Financial EGV marik1dc 3*ESS 0C
VDI-W7-PFL-146612.9.12.0
Page 1 of 1
This page intentionally blank
ˆ200G2Mlv!2ZKB8tgeŠ200G2Mlv!2ZKB8tge
628340 TX 1SANTANDERFORM 20-F (SAN UK PL
04-Mar-2019 00:39 ESTHTMLON
Donnelley Financial EGV gopad0dc 4*ESS 0C
VDI-W7-PFD-037812.9.12.0
Page 1 of 1
Santander UK plc
Annual Report 2018
Strategic report 2
Financial review 5
Governance 18
Board of Directors 19
Corporate governance report 22
Directors’ remuneration report 41
Directors’ report 48
Risk review 52
Financial statements 127
Auditor’s report 128
Primary financial statements 134
Notes to the financial statements 142
Shareholder information 215
Selected financial data 216
Subsidiaries, joint ventures and associates 218
Forward-looking statements 220
Other information for US investors 221
Important information for readers
Santander UK plc and its subsidiaries (collectively Santander UK or the Santander UK group) operate primarily in the UK, and are part of
the Banco Santander group (comprising Banco Santander SA and its subsidiaries). Santander UK plc is regulated by the UK Prudential
Regulation Authority (PRA) and the Financial Conduct Authority (FCA) and certain other companies within the Santander UK group are
regulated by the FCA. This Annual Report contains forward-looking statements that involve inherent risks and uncertainties. Actual
results may differ materially from those contained in such forward-looking statements. See Forward-looking statements on page 220.
Santander UK Group Holdings plc is the immediate parent company of Santander UK plc. The two companies operate on the basis of a
unified business strategy and have common Boards, albeit the principal business activities of the Santander UK Group Holdings plc
group are carried on by Santander UK plc and its subsidiaries.
The Santander UK Group Holdings plc Corporate Governance and Risk Frameworks have been adopted by the Company and its
subsidiaries to ensure consistency of application. Prior to November 2018, the Corporate Governance and Risk Frameworks were
applied from the level of Santander UK plc across the Santander UK group and adopted by Santander UK Group Holdings plc.
As a result, the review of the business and principal risks and uncertainties facing the Company, and the description of the Company’s
Corporate Governance, including the activities of the Board and risk management arrangements, are integrated with those of Santander
UK Group Holdings plc and are reported in this Annual Report as operating within the Company for all periods presented.
None of the websites referred to in this Annual Report on Form 20-F for the year ended 31 December 2018 (the Form 20-F), including
where a link is provided, nor any of the information contained on such websites is incorporated by reference in the Form 20-F.
Santander UK plc 1
ˆ200G2Mlv!2ZKN3egAŠ200G2Mlv!2ZKN3egA
628340 TX 2SANTANDERFORM 20-F (SAN UK PL
04-Mar-2019 00:40 ESTHTMLON
Donnelley Financial EGV gopad0dc 4*ESS 0C
VDI-W7-PFD-037812.9.12.0
Page 1 of 1
Annual Report 2018 | Strategic report
Strategic report
Santander UK plc (the Company and together with its subsidiaries, Santander UK or the Santander UK group) is a subsidiary of
Santander UK Group Holdings plc (together with its subsidiaries, the Santander UK Group Holdings plc group). The Company is required
to set out in this report a fair review of its business and a description of its principal risks and uncertainties, including a balanced and
comprehensive analysis of the development and performance of the business in the year and of its position at the end of the year. This
information can be found below and in the following sections of this Annual Report, which are incorporated into and form part of this
Strategic report.
Under the UK Companies Act 2006, a safe harbour limits the liability of Directors in respect of statements in and omissions from the
Directors’ Report (for which see page 48), the Strategic report and the Remuneration report. Under English law the Directors would be
liable to the company, but not to any third party, if one or more of these reports contained errors as a result of recklessness or knowing
misstatement or dishonest concealment of a material fact, but would otherwise not be liable. Pages 48 to 51 inclusive comprise the
Directors’ Report, pages 2 to 4 inclusive comprise the Strategic report and pages 41 to 47 inclusive comprise the Remuneration report,
each of which have been drawn up and presented in accordance with and in reliance upon English company law and the liabilities of the
Directors in connection with these reports shall be subject to the limitations and restrictions provided by such law.
The Directors, in preparing this Strategic report, have complied with section 414C of the Companies Act 2006.
Principal activities and business review
Who we are
We are uniquely placed as a leading scale challenger. We have a simple and straightforward business model which focuses on retail and
commercial banking customers. We are a large UK ring-fenced bank with the scale and breadth of proposition to challenge the big four
UK banks. With our omni-channel approach we serve our customers through digital channels, in particular mobile, alongside a network of
755 branches and 64 Corporate Business Centres supported by telephone call centres.
We play an important role in the UK economy and in the communities in which we operate. We help people finance their home, save for
the future and support business growth.
What we do
Most of what we do can be described as lending money to borrowers, taking deposits from savers, providing bank accounts and payment
services. We also offer a wide range of investment and insurance products to households and other more specialised services and
products to companies.
We are here to help our customers prosper
We are here to help our customers prosper and by doing so we create and protect sustainable value for all our stakeholders.
We do things The Santander Way: Simple, Personal and Fair
– Our customers are at the heart of everything we do.
– We have a culture of personal responsibility.
Development and performance of our business in 2018
Information on the development and performance of our business in the year is set out in the ‘Income statement review’ section of the
Financial review.
Our position at 31 December 2018
Information on our position at the end of the year is set out in the ‘Balance sheet review’ section of the Financial review.
Our ring-fence structure
In 2013, UK legislation established a new requirement for certain UK banks to ring-fence their retail activities by 1 January 2019. The
intention was to enhance the resilience of the largest UK banks and to reduce the possibility of essential banking services being
disrupted in the event of a large bank getting into financial difficulty. In line with this legislation, we have now completed the
establishment of our ring-fence bank. This follows the conclusion in 2018 of the required transfers from Santander UK to Banco
Santander London Branch.
Under our current model, Santander UK plc is the ring-fenced bank of the Santander UK group. It serves all our personal customers in
the UK and the vast majority of our business customers. Any service or products which cannot be offered, or customers that cannot be
served by the ring-fenced bank, are now catered to through Banco Santander London Branch.
Additionally, in 2018 Abbey National Treasury Services plc (ANTS) became a subsidiary of Santander UK Group Holdings plc (formerly a
subsidiary of Santander UK plc). ANTS holds only a small number of legacy positions and the business of our Jersey and Isle of Man
branches.
Ring-fencing has been the biggest project that we have ever undertaken, involving significant effort over a number of years. In total, it
has cost c£240m and at its peak around 1,000 people were working to ensure the business was ready in time. We have now successfully
completed all the required transfers and operational changes without disruption for our customers.
For more information on ring-fencing, see Note 43 to the Consolidated Financial Statements.
2 Santander UK plc

ˆ200G2Mlv!2F=9xng]Š200G2Mlv!2F=9xng]
628340 TX 3SANTANDERFORM 20-F (SAN UK PL
02-Mar-2019 05:41 ESTHTMLON
Donnelley Financial EGV sraas0dc 5*ESS 0C
VDI-W7-PFL-133112.9.12.0
bar1
Page 1 of 1
> Strategic report
Santander UK plc 3
Uncertain economic environment
The UK economy has experienced moderate growth over the past three years, coupled with record low levels of
unemployment. Inflation was very low in 2016, but has since risen above 2% which prompted the Bank of England to
increase the Bank Rate twice by 25bps, in both 2017 and 2018, to 0.75%. House price growth has also slowed from high
single digit figures to a much more modest level, with Buy-to-Let (BTL) lending in particular slowing largely due to changes
in tax legislation.
We have a track record of consistent profitability, a resilient balance sheet and a relentless focus on customers. We believe
that we are well-placed to manage any potential uncertainties and deliver for our stakeholders.
Over the last few years, in addition to the significant changes we implemented for ring-fence compliance, we have taken a
number of actions to position the bank for the uncertain environment. We believe these actions together with our prudent
approach to risk leave us well placed for the future.
Demanding regulatory change agenda
UK banks have undergone significant structural change and invested considerable resources to ensure compliance with
ring-fencing legislation, ahead of the deadline of 1 January 2019. Digital advances have opened up opportunities for both
start-ups and established technology companies. Open Banking has opened up the door of financial services for both
start-ups and established technology companies, that will leverage customer data and improve competition, efficiency and
stimulate innovation.
We have also seen in 2018 the implementation of three major regulatory items in General Data Protection Regulation
(GDPR), Second Payment Services Directive (PSD2) and Markets in Financial Instruments Directive (MiFID II), and
received confirmation of two more: non-binding indicative minimum requirement for own funds and eligible liabilities (MREL)
requirements and the final rules and guidance on Payment Protection Insurance (PPI) from the FCA.
We expect our returns to continue to be impacted by increased regulatory compliance costs and the demanding banking
regulation regime, including the transfer of business for ring-fencing. However, we remain confident that we continue to
have a profitable and resilient business and plan to further develop loyal relationships by living up to our commitment to be
Simple, Personal and Fair.
2019 outlook remains uncertain
We expect global economic activity to continue to expand in 2019, albeit at a slower pace with a number of heightened
risks to the outlook from the ongoing imposition of trade restrictions, geopolitical tensions and slower growth in developed
economies. These risks, together with the uncertain environment, highly competitive banking market and demanding
regulatory agenda in the UK, mean we are cautious in our outlook.
In our core lending markets, we anticipate modest growth, with mortgage market growth of c3%, with weaker buyer
demand and subdued house price growth likely to continue. Corporate borrowing market growth is expected to slow to
c2%, as uncertainty continues to dampen investment intentions, particularly in the short term.
Our base case anticipates a slight improvement in economic growth, predicated on the UK’s orderly exit from the European
Union. The low levels of unemployment should continue with inflation on a downward path which, coupled with rising
wages, should result in real earnings growth. Extrapolating from the economic outlook at the end of 2018, our assumption
is that there will be a 25bps rise in base rate in H219.
Net interest margin is expected to be lower than in 2018, as a result of competition in new mortgage pricing, SVR attrition
and limited capacity for further liability margin improvement. SVR attrition is expected to be lower than the net £4.9bn
reduction in 2018.
We expect costs to increase slightly as we invest further in our business transformation, face an intensifying regulatory
change agenda and manage inflationary pressures. Incremental digital and strategic investments in process automation as
well as system and platform rationalisation are also planned. These actions, together with global Banco Santander group
initiatives, will improve our customer experience and deliver operational efficiencies over time. We expect to provide further
guidance on cost management initiatives in the next few months.
We expect our net mortgage lending to be broadly in line with 2018, as we focus on quality customer service, retention and
improved proposition for first-time buyers. We will continue to actively manage our CRE exposures while our lending growth
to non-CRE trading business customers is expected to remain robust.
Our principal risks and uncertainties
Information on our principal risks and uncertainties is set out in the Risk review by type of risk, with more detail by business
segment. When reading the Risk review and the other sections of the Annual Report, you should refer to the ‘Forward-
looking statements’ section in the Shareholder information.

ˆ200G2Mlv!24lHs5g&Š200G2Mlv!24lHs5g&
628340 TX 4SANTANDERFORM 20-F (SAN UK PL
01-Mar-2019 22:28 ESTHTMLON
Donnelley Financial EGV marik1dc 2*ESS 0C
VDI-W7-PFL-146612.9.12.0
Page 1 of 1
Annual Report 2018 | Strategic report
Key performance indicators
The directors of the Company’s immediate parent, Santander UK Group Holdings plc, manage the operations of the Santander UK
Group Holdings plc group (which includes the Santander UK group) on a business division basis. Key performance indicators are not set,
monitored or managed at the Santander UK group level. As a result, the Company’s Directors believe that analysis using key
performance indicators for the Company is not necessary or appropriate for an understanding of the development, performance or
position of the Company. The development performance and position of the business of the Santander UK group, mainly at a
consolidated level, is set out in the Financial Review. The key performance indicators of the Santander UK Group Holdings plc group can
be found on pages 12 and 13 of its 2018 Annual Report, which does not form part of this report.
Managing our environmental impact efficiently
Our Environment & Energy Management Systems provide a framework for defining responsibilities and processes in relation to waste,
energy, water, travel and supply chain management at our 15 main offices and data centres in the UK. In 2018, we successfully
recertified the ISO 14001 & ISO 50001 accreditation across all of these properties.
Managing our supply chain responsibly
We want to do business with like-minded companies who share our values and ambition to be a driver of prosperity and who therefore
meet our risk and control standards as outlined in our Third Party Supplier Risk Framework.
We continually review our supply chain management policies and processes to comply with the 2015 Modern Slavery Act requirements.
We require our suppliers to comply with explicit requirements to respect human rights and adhere to ethical labour practices.
We meet the Living Wage requirement for employees of suppliers who work at Santander UK sites, and our standard supplier contracts
include specific requirements to respect human rights and ethical labour practice based on the principles of the UN Global Compact.
We are committed to high ethical standards
Ethics and integrity are at the heart of a prosperous business and society. Corruption, bribery, modern slavery and financial crime erode
the value that business creates and divert precious resources away from the socio-economic growth of our country. We want to protect
and maintain our licence to operate by acting responsibly and demonstrating how we live up to our values in everything we do. We are
determined to uphold the highest standards and promote human rights, sound business ethics and corporate culture.
See the Director’s report for more on our Code of Ethical Conduct and Anti-Bribery and Corruption Policy.
By Order of the Board
Nathan Bostock
Director
26 February 2019
4 Santander UK plc

ˆ200G2Mlv!2ZK=7f6:Š200G2Mlv!2ZK=7f6:
628340 TX 5SANTANDERFORM 20-F (SAN UK PL
04-Mar-2019 00:40 ESTHTMLON
Donnelley Financial EGV gopad0dc 8*ESS 0C
VDI-W7-PFD-037812.9.12.0
bar2
Page 1 of 1
Financial review
Contents
Income statement review 6
Summarised Consolidated Income Statement 6
Profit before tax by segment 8
– Retail Banking 9
– Corporate & Commercial Banking 11
– Corporate & Investment Banking 12
– Corporate Centre 13
Balance sheet review 14
Cash flows 16
Business development highlights 17
Santander UK plc 5
ˆ200G2Mlv!2Zbl$06KŠ200G2Mlv!2Zbl$06K
628340 TX 6SANTANDERFORM 20-F (SAN UK PL
04-Mar-2019 01:00 ESTHTMLON
Donnelley Financial EGV gopad0dc 7*ESS 0C
VDI-W7-PFD-037812.9.12.0
Page 1 of 1
Annual Report 2018 | Financial review
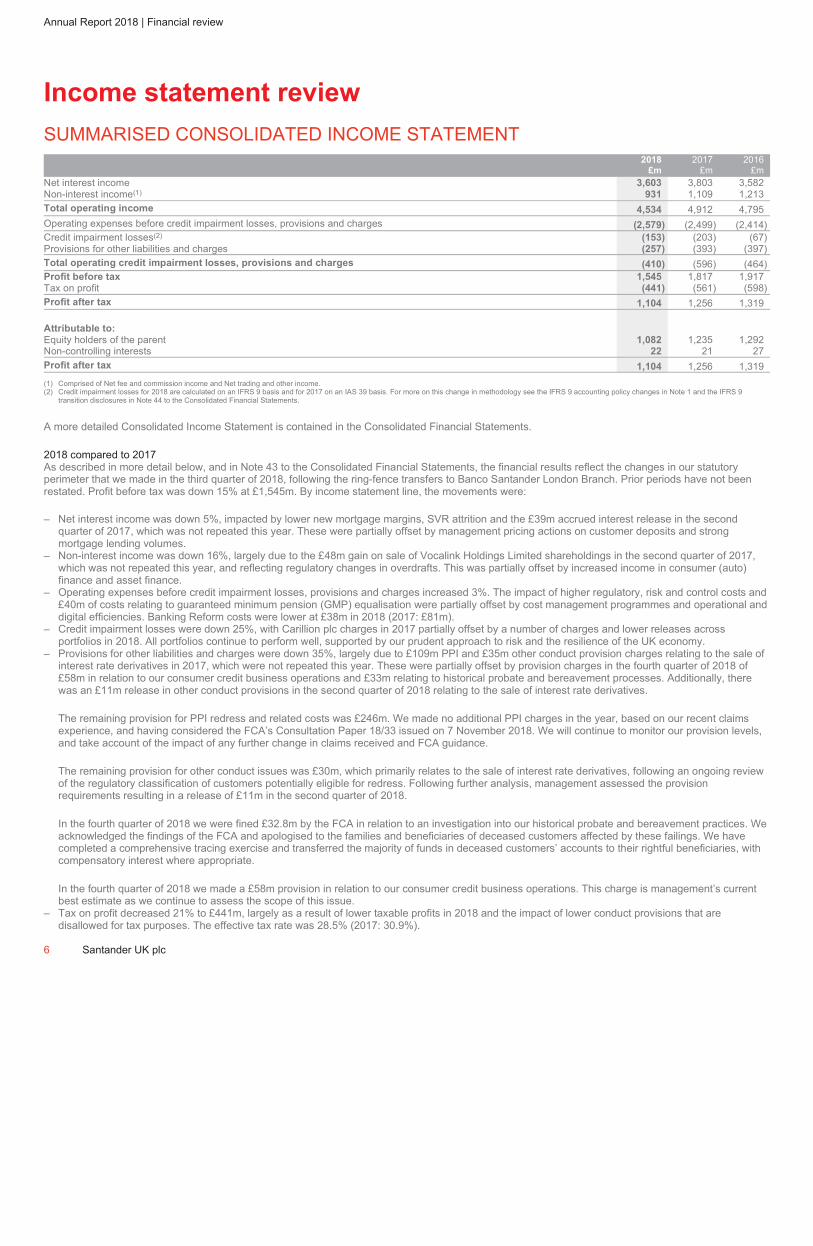
Income statement review
SUMMARISED CONSOLIDATED INCOME STATEMENT
2018
£m
2017
£m
2016
£m
Net interest income 3,603 3,803 3,582
Non-interest income(1) 931 1,109 1,213
Total operating income 4,534 4,912 4,795
Operating expenses before credit impairment losses, provisions and charges (2,579) (2,499) (2,414)
Credit impairment losses(2) (153) (203) (67)
Provisions for other liabilities and charges (257) (393) (397)
Total operating credit impairment losses, provisions and charges (410) (596) (464)
Profit before tax 1,545 1,817 1,917
Tax on profit (441) (561) (598)
Profit after tax 1,104 1,256 1,319
Attributable to:
Equity holders of the parent 1,082 1,235 1,292
Non-controlling interests 22 21 27
Profit after tax 1,104 1,256 1,319
(1) Comprised of Net fee and commission income and Net trading and other income.
(2) Credit impairment losses for 2018 are calculated on an IFRS 9 basis and for 2017 on an IAS 39 basis. For more on this change in methodology see the IFRS 9 accounting policy changes in Note 1 and the IFRS 9
transition disclosures in Note 44 to the Consolidated Financial Statements.
A more detailed Consolidated Income Statement is contained in the Consolidated Financial Statements.
2018 compared to 2017
As described in more detail below, and in Note 43 to the Consolidated Financial Statements, the financial results reflect the changes in our statutory
perimeter that we made in the third quarter of 2018, following the ring-fence transfers to Banco Santander London Branch. Prior periods have not been
restated. Profit before tax was down 15% at £1,545m. By income statement line, the movements were:
– Net interest income was down 5%, impacted by lower new mortgage margins, SVR attrition and the £39m accrued interest release in the second
quarter of 2017, which was not repeated this year. These were partially offset by management pricing actions on customer deposits and strong
mortgage lending volumes.
– Non-interest income was down 16%, largely due to the £48m gain on sale of Vocalink Holdings Limited shareholdings in the second quarter of 2017,
which was not repeated this year, and reflecting regulatory changes in overdrafts. This was partially offset by increased income in consumer (auto)
finance and asset finance.
– Operating expenses before credit impairment losses, provisions and charges increased 3%. The impact of higher regulatory, risk and control costs and
£40m of costs relating to guaranteed minimum pension (GMP) equalisation were partially offset by cost management programmes and operational and
digital efficiencies. Banking Reform costs were lower at £38m in 2018 (2017: £81m).
– Credit impairment losses were down 25%, with Carillion plc charges in 2017 partially offset by a number of charges and lower releases across
portfolios in 2018. All portfolios continue to perform well, supported by our prudent approach to risk and the resilience of the UK economy.
– Provisions for other liabilities and charges were down 35%, largely due to £109m PPI and £35m other conduct provision charges relating to the sale of
interest rate derivatives in 2017, which were not repeated this year. These were partially offset by provision charges in the fourth quarter of 2018 of
£58m in relation to our consumer credit business operations and £33m relating to historical probate and bereavement processes. Additionally, there
was an £11m release in other conduct provisions in the second quarter of 2018 relating to the sale of interest rate derivatives.
The remaining provision for PPI redress and related costs was £246m. We made no additional PPI charges in the year, based on our recent claims
experience, and having considered the FCA’s Consultation Paper 18/33 issued on 7 November 2018. We will continue to monitor our provision levels,
and take account of the impact of any further change in claims received and FCA guidance.
The remaining provision for other conduct issues was £30m, which primarily relates to the sale of interest rate derivatives, following an ongoing review
of the regulatory classification of customers potentially eligible for redress. Following further analysis, management assessed the provision
requirements resulting in a release of £11m in the second quarter of 2018.
In the fourth quarter of 2018 we were fined £32.8m by the FCA in relation to an investigation into our historical probate and bereavement practices. We
acknowledged the findings of the FCA and apologised to the families and beneficiaries of deceased customers affected by these failings. We have
completed a comprehensive tracing exercise and transferred the majority of funds in deceased customers’ accounts to their rightful beneficiaries, with
compensatory interest where appropriate.
In the fourth quarter of 2018 we made a £58m provision in relation to our consumer credit business operations. This charge is management’s current
best estimate as we continue to assess the scope of this issue.
– Tax on profit decreased 21% to £441m, largely as a result of lower taxable profits in 2018 and the impact of lower conduct provisions that are
disallowed for tax purposes. The effective tax rate was 28.5% (2017: 30.9%).
6 Santander UK plc
ˆ200G2Mlv!24pvzP6^Š200G2Mlv!24pvzP6^
628340 TX 7SANTANDERFORM 20-F (SAN UK PL
01-Mar-2019 22:37 ESTHTMLON
Donnelley Financial EGV arumv1dc 4*ESS 0C
VDI-W7-PFD-026512.9.12.0
bar2
Page 1 of 1
> Income statement review
Santander UK plc 7
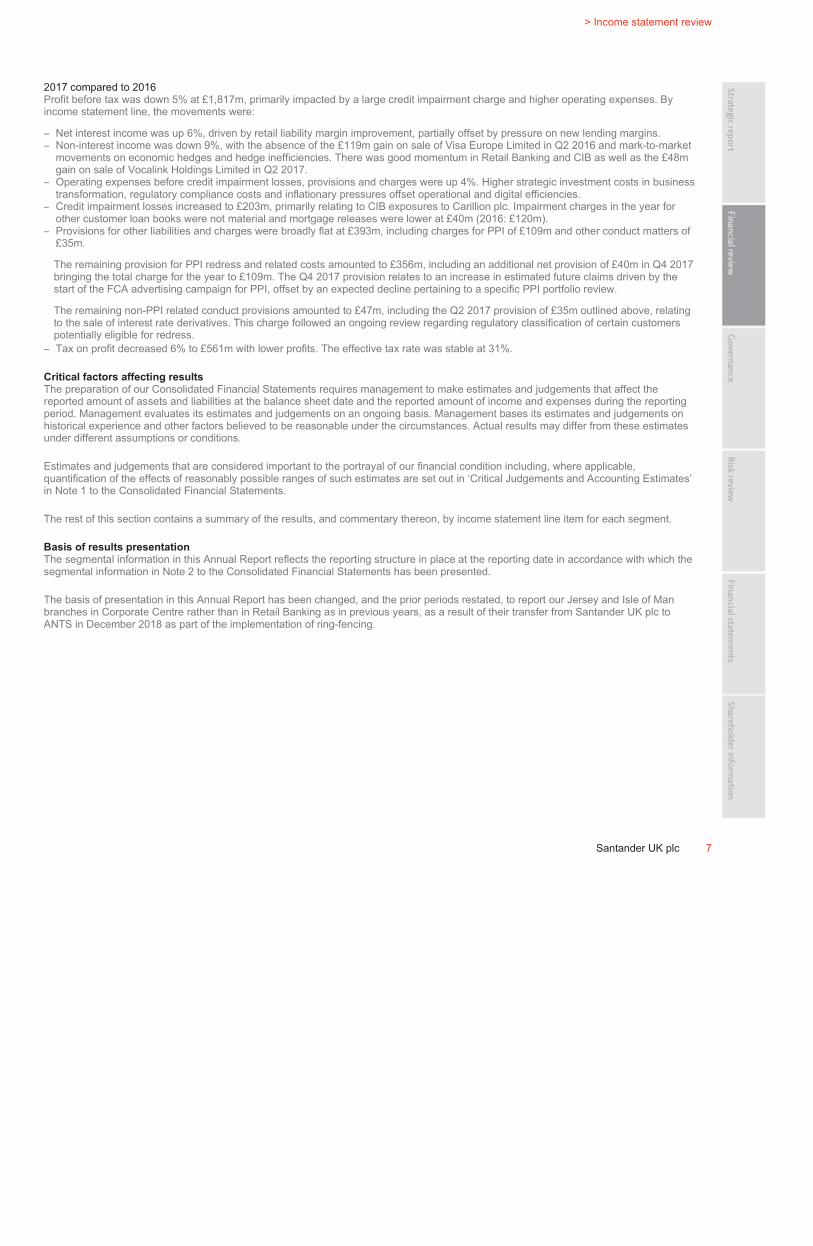
2017 compared to 2016
Profit before tax was down 5% at £1,817m, primarily impacted by a large credit impairment charge and higher operating expenses. By
income statement line, the movements were:
– Net interest income was up 6%, driven by retail liability margin improvement, partially offset by pressure on new lending margins.
– Non-interest income was down 9%, with the absence of the £119m gain on sale of Visa Europe Limited in Q2 2016 and mark-to-market
movements on economic hedges and hedge inefficiencies. There was good momentum in Retail Banking and CIB as well as the £48m
gain on sale of Vocalink Holdings Limited in Q2 2017.
– Operating expenses before credit impairment losses, provisions and charges were up 4%. Higher strategic investment costs in business
transformation, regulatory compliance costs and inflationary pressures offset operational and digital efficiencies.
– Credit impairment losses increased to £203m, primarily relating to CIB exposures to Carillion plc. Impairment charges in the year for
other customer loan books were not material and mortgage releases were lower at £40m (2016: £120m).
– Provisions for other liabilities and charges were broadly flat at £393m, including charges for PPI of £109m and other conduct matters of
£35m.
The remaining provision for PPI redress and related costs amounted to £356m, including an additional net provision of £40m in Q4 2017
bringing the total charge for the year to £109m. The Q4 2017 provision relates to an increase in estimated future claims driven by the
start of the FCA advertising campaign for PPI, offset by an expected decline pertaining to a specific PPI portfolio review.
The remaining non-PPI related conduct provisions amounted to £47m, including the Q2 2017 provision of £35m outlined above, relating
to the sale of interest rate derivatives. This charge followed an ongoing review regarding regulatory classification of certain customers
potentially eligible for redress.
– Tax on profit decreased 6% to £561m with lower profits. The effective tax rate was stable at 31%.
Critical factors affecting results
The preparation of our Consolidated Financial Statements requires management to make estimates and judgements that affect the
reported amount of assets and liabilities at the balance sheet date and the reported amount of income and expenses during the reporting
period. Management evaluates its estimates and judgements on an ongoing basis. Management bases its estimates and judgements on
historical experience and other factors believed to be reasonable under the circumstances. Actual results may differ from these estimates
under different assumptions or conditions.
Estimates and judgements that are considered important to the portrayal of our financial condition including, where applicable,
quantification of the effects of reasonably possible ranges of such estimates are set out in ‘Critical Judgements and Accounting Estimates’
in Note 1 to the Consolidated Financial Statements.
The rest of this section contains a summary of the results, and commentary thereon, by income statement line item for each segment.
Basis of results presentation
The segmental information in this Annual Report reflects the reporting structure in place at the reporting date in accordance with which the
segmental information in Note 2 to the Consolidated Financial Statements has been presented.
The basis of presentation in this Annual Report has been changed, and the prior periods restated, to report our Jersey and Isle of Man
branches in Corporate Centre rather than in Retail Banking as in previous years, as a result of their transfer from Santander UK plc to
ANTS in December 2018 as part of the implementation of ring-fencing.

ˆ200G2Mlv!2Zbnx4g=Š200G2Mlv!2Zbnx4g=
628340 TX 8SANTANDERFORM 20-F (SAN UK PL
04-Mar-2019 01:00 ESTHTMLON
Donnelley Financial EGV gopad0dc 8*ESS 0C
VDI-W7-PFD-037812.9.12.0
Page 1 of 1
Annual Report 2018 | Financial review
PROFIT BEFORE TAX BY SEGMENT
2018
Retail
Banking
£m
Corporate &
Commercial
Banking
£m
Corporate &
Investment
Banking
£m
Corporate
Centre
£m
Total
£m
Net interest income 3,126 403 69 5 3,603
Non-interest income(1) 638 82 272 (61) 931
Total operating income 3,764 485 341 (56) 4,534
Operating expenses before credit impairment losses, provisions and charges (1,929) (258) (262) (130) (2,579)
Credit impairment (losses)/releases(2) (124) (23) (14) 8 (153)
Provisions for other liabilities and (charges)/releases (230) (14) (8) (5) (257)
Total operating credit impairment losses, provisions and (charges)/releases (354) (37) (22) 3 (410)
Profit/(loss) before tax 1,481 190 57 (183) 1,545
2017
Net interest income 3,270 391 74 68 3,803
Non-interest income(1) 615 74 364 56 1,109
Total operating income 3,885 465 438 124 4,912
Operating expenses before credit impairment losses, provisions and charges (1,856) (223) (304) (116) (2,499)
Credit impairment (losses)/releases (36) (13) (174) 20 (203)
Provisions for other liabilities and (charges)/releases (342) (55) (11) 15 (393)
Total credit impairment losses, provisions and (charges)/releases (378) (68) (185) 35 (596)
Profit/(loss) before tax 1,651 174 (51) 43 1,817
2016
Net interest income 3,117 380 73 12 3,582
Non-interest income(1) 559 76 312 266 1,213
Total operating income 3,676 456 385 278 4,795
Operating expenses before credit impairment losses, provisions and charges (1,785) (215) (281) (133) (2,414)
Credit impairment (losses)/releases (21) (29) (21) 4 (67)
Provisions for other liabilities and charges (338) (26) (11) (22) (397)
Total credit impairment losses, provisions and (charges)/releases (359) (55) (32) (18) (464)
Profit before tax 1,532 186 72 127 1,917
(1) Comprised of Net fee and commission income and Net trading and other income.
(2) Credit impairment losses for 2018 are calculated on an IFRS 9 basis and for 2017 and 2016 on an IAS 39 basis. For more on this change in methodology see the IFRS 9 accounting policy changes in Note 1 and the IFRS
9 transition disclosures in Note 44 to the Consolidated Financial Statements.
8 Santander UK plc
ˆ200G2Mlv!2ZbpSog*Š200G2Mlv!2ZbpSog*
628340 TX 9SANTANDERFORM 20-F (SAN UK PL
04-Mar-2019 01:00 ESTHTMLON
Donnelley Financial EGV gopad0dc 8*ESS 0C
VDI-W7-PFD-037812.9.12.0
bar2
Page 1 of 1
> Income statement review
Santander UK plc 9
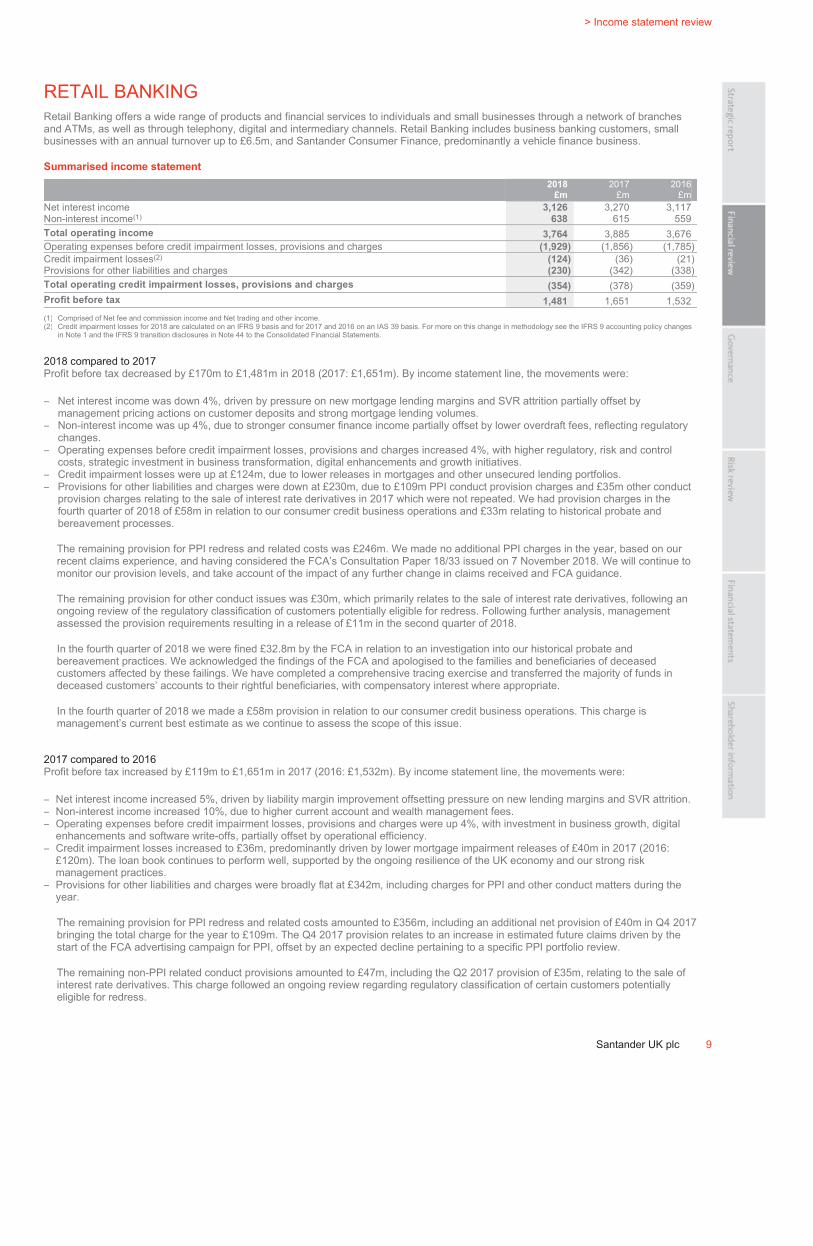
RETAIL BANKING
Retail Banking offers a wide range of products and financial services to individuals and small businesses through a network of branches
and ATMs, as well as through telephony, digital and intermediary channels. Retail Banking includes business banking customers, small
businesses with an annual turnover up to £6.5m, and Santander Consumer Finance, predominantly a vehicle finance business.
Summarised income statement
2018
£m
2017
£m
2016
£m
Net interest income 3,126 3,270 3,117
Non-interest income(1) 638 615 559
Total operating income 3,764 3,885 3,676
Operating expenses before credit impairment losses, provisions and charges (1,929) (1,856) (1,785)
Credit impairment losses(2) (124) (36) (21)
Provisions for other liabilities and charges (230) (342) (338)
Total operating credit impairment losses, provisions and charges (354) (378) (359)
Profit before tax 1,481 1,651 1,532
(1) Comprised of Net fee and commission income and Net trading and other income.
(2) Credit impairment losses for 2018 are calculated on an IFRS 9 basis and for 2017 and 2016 on an IAS 39 basis. For more on this change in methodology see the IFRS 9 accounting policy changes
in Note 1 and the IFRS 9 transition disclosures in Note 44 to the Consolidated Financial Statements.
2018 compared to 2017
Profit before tax decreased by £170m to £1,481m in 2018 (2017: £1,651m). By income statement line, the movements were:
– Net interest income was down 4%, driven by pressure on new mortgage lending margins and SVR attrition partially offset by
management pricing actions on customer deposits and strong mortgage lending volumes.
– Non-interest income was up 4%, due to stronger consumer finance income partially offset by lower overdraft fees, reflecting regulatory
changes.
– Operating expenses before credit impairment losses, provisions and charges increased 4%, with higher regulatory, risk and control
costs, strategic investment in business transformation, digital enhancements and growth initiatives.
– Credit impairment losses were up at £124m, due to lower releases in mortgages and other unsecured lending portfolios.
– Provisions for other liabilities and charges were down at £230m, due to £109m PPI conduct provision charges and £35m other conduct
provision charges relating to the sale of interest rate derivatives in 2017 which were not repeated. We had provision charges in the
fourth quarter of 2018 of £58m in relation to our consumer credit business operations and £33m relating to historical probate and
bereavement processes.
The remaining provision for PPI redress and related costs was £246m. We made no additional PPI charges in the year, based on our
recent claims experience, and having considered the FCA’s Consultation Paper 18/33 issued on 7 November 2018. We will continue to
monitor our provision levels, and take account of the impact of any further change in claims received and FCA guidance.
The remaining provision for other conduct issues was £30m, which primarily relates to the sale of interest rate derivatives, following an
ongoing review of the regulatory classification of customers potentially eligible for redress. Following further analysis, management
assessed the provision requirements resulting in a release of £11m in the second quarter of 2018.
In the fourth quarter of 2018 we were fined £32.8m by the FCA in relation to an investigation into our historical probate and
bereavement practices. We acknowledged the findings of the FCA and apologised to the families and beneficiaries of deceased
customers affected by these failings. We have completed a comprehensive tracing exercise and transferred the majority of funds in
deceased customers’ accounts to their rightful beneficiaries, with compensatory interest where appropriate.
In the fourth quarter of 2018 we made a £58m provision in relation to our consumer credit business operations. This charge is
management’s current best estimate as we continue to assess the scope of this issue.
2017 compared to 2016
Profit before tax increased by £119m to £1,651m in 2017 (2016: £1,532m). By income statement line, the movements were:
– Net interest income increased 5%, driven by liability margin improvement offsetting pressure on new lending margins and SVR attrition.
– Non-interest income increased 10%, due to higher current account and wealth management fees.
– Operating expenses before credit impairment losses, provisions and charges were up 4%, with investment in business growth, digital
enhancements and software write-offs, partially offset by operational efficiency.
– Credit impairment losses increased to £36m, predominantly driven by lower mortgage impairment releases of £40m in 2017 (2016:
£120m). The loan book continues to perform well, supported by the ongoing resilience of the UK economy and our strong risk
management practices.
– Provisions for other liabilities and charges were broadly flat at £342m, including charges for PPI and other conduct matters during the
year.
The remaining provision for PPI redress and related costs amounted to £356m, including an additional net provision of £40m in Q4 2017
bringing the total charge for the year to £109m. The Q4 2017 provision relates to an increase in estimated future claims driven by the
start of the FCA advertising campaign for PPI, offset by an expected decline pertaining to a specific PPI portfolio review.
The remaining non-PPI related conduct provisions amounted to £47m, including the Q2 2017 provision of £35m, relating to the sale of
interest rate derivatives. This charge followed an ongoing review regarding regulatory classification of certain customers potentially
eligible for redress.

ˆ200G2Mlv!24baYagÊ200G2Mlv!24baYagˆ
628340 TX 10SANTANDERFORM 20-F (SAN UK PL
01-Mar-2019 22:16 ESTHTMLON
Donnelley Financial EGV annas1dc 4*ESS 0C
VDI-W7-PFD-014312.9.12.0
Page 1 of 1
Annual Report 2018 | Financial review
Customer balances
2018
£bn
2017
£bn
Mortgages 158.0 154.7
Business banking 1.8 1.9
Consumer (auto) finance 7.3 7.0
Other unsecured lending 5.7 5.1
Customer loans 172.8 168.7
Current accounts(3)
68.4 67.5
Savings(3) 56.0 59.3
Business banking accounts 11.9 11.2
Other retail products(3) 5.8 5.8
Customer deposits 142.1 143.8
Risk-weighted assets (RWAs) 46.2 44.1
(3) Balances for ‘Savings’ and ‘Other retail products’ have been restated to reflect the transfer of the Crown Dependencies balances to Corporate Centre and cahoot current account and savings balances from ‘Other retail
products’ to ‘Current accounts’ and ‘Savings’.
2018 compared to 2017
– Mortgage lending increased £3.3bn, through a combination of well positioned service and product pricing, as well as our ongoing focus on customer
retention. In 2018, mortgage gross lending was £28.8bn (2017: £25.5bn) and consumer (auto) finance gross lending was £3.8bn (2017: £3.1bn). Credit
cards balances also increased £0.5bn with competitive pricing strategy in late 2018.
– Customer deposits decreased, primarily due to a decline of £3.3bn in savings balances, partially offset by a £0.9bn increase in current account
balances and a £0.7bn increase in business banking deposits.
– RWAs increased in line with customer loan growth.
10 Santander UK plc
ˆ200G2Mlv!2Zbqb%6zŠ200G2Mlv!2Zbqb%6z
628340 TX 11SANTANDERFORM 20-F (SAN UK PL
04-Mar-2019 01:00 ESTHTMLON
Donnelley Financial EGV gopad0dc 8*ESS 0C
VDI-W7-PFD-037812.9.12.0
bar2
Page 1 of 1
> Income statement review
Santander UK plc 11
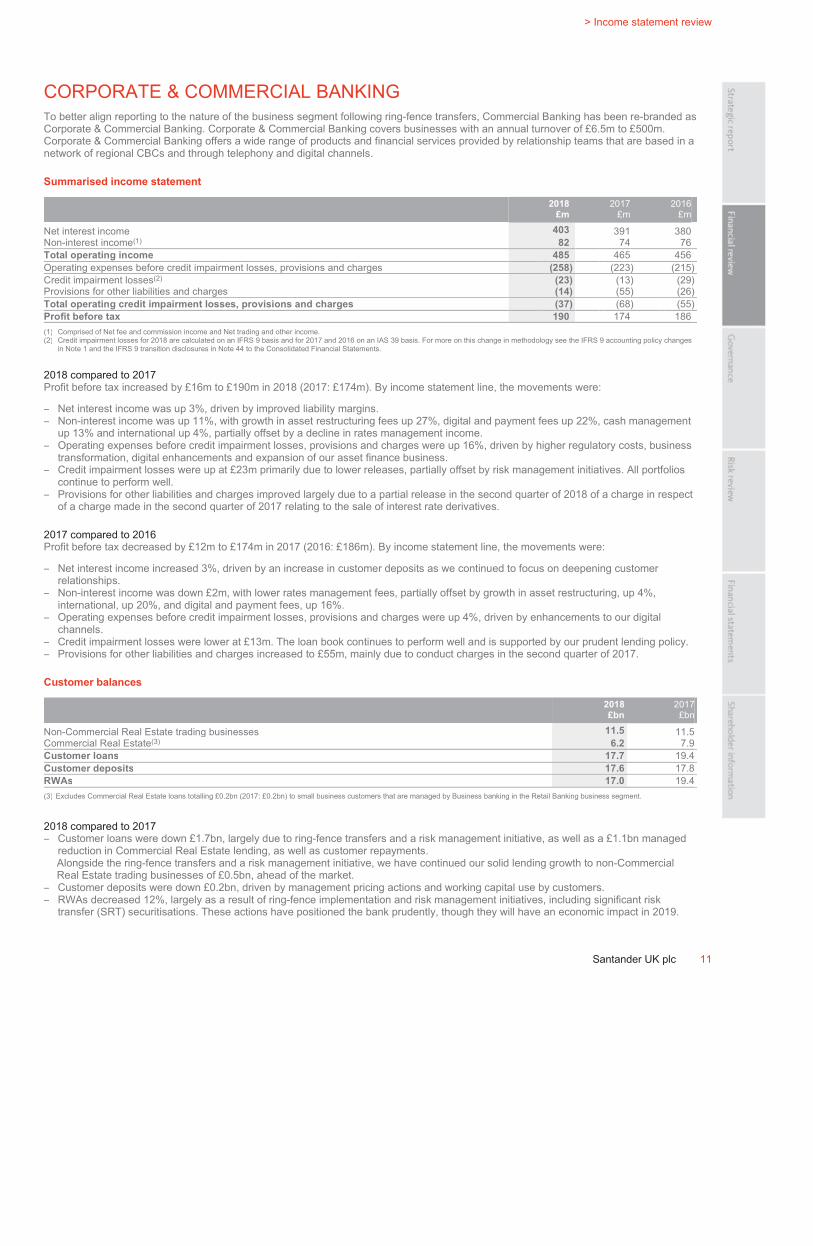
CORPORATE & COMMERCIAL BANKING
To better align reporting to the nature of the business segment following ring-fence transfers, Commercial Banking has been re-branded as
Corporate & Commercial Banking. Corporate & Commercial Banking covers businesses with an annual turnover of £6.5m to £500m.
Corporate & Commercial Banking offers a wide range of products and financial services provided by relationship teams that are based in a
network of regional CBCs and through telephony and digital channels.
Summarised income statement
2018
£m
2017
£m
2016
£m
Net interest income 403 391 380
Non-interest income(1) 82 74 76
Total operating income 485 465 456
Operating expenses before credit impairment losses, provisions and charges (258) (223) (215)
Credit impairment losses(2)
(23) (13) (29)
Provisions for other liabilities and charges (14) (55) (26)
Total operating credit impairment losses, provisions and charges (37) (68) (55)
Profit before tax 190 174 186
(1) Comprised of Net fee and commission income and Net trading and other income.
(2) Credit impairment losses for 2018 are calculated on an IFRS 9 basis and for 2017 and 2016 on an IAS 39 basis. For more on this change in methodology see the IFRS 9 accounting policy changes
in Note 1 and the IFRS 9 transition disclosures in Note 44 to the Consolidated Financial Statements.
2018 compared to 2017
Profit before tax increased by £16m to £190m in 2018 (2017: £174m). By income statement line, the movements were:
– Net interest income was up 3%, driven by improved liability margins.
– Non-interest income was up 11%, with growth in asset restructuring fees up 27%, digital and payment fees up 22%, cash management
up 13% and international up 4%, partially offset by a decline in rates management income.
– Operating expenses before credit impairment losses, provisions and charges were up 16%, driven by higher regulatory costs, business
transformation, digital enhancements and expansion of our asset finance business.
– Credit impairment losses were up at £23m primarily due to lower releases, partially offset by risk management initiatives. All portfolios
continue to perform well.
– Provisions for other liabilities and charges improved largely due to a partial release in the second quarter of 2018 of a charge in respect
of a charge made in the second quarter of 2017 relating to the sale of interest rate derivatives.
2017 compared to 2016
Profit before tax decreased by £12m to £174m in 2017 (2016: £186m). By income statement line, the movements were:
– Net interest income increased 3%, driven by an increase in customer deposits as we continued to focus on deepening customer
relationships.
– Non-interest income was down £2m, with lower rates management fees, partially offset by growth in asset restructuring, up 4%,
international, up 20%, and digital and payment fees, up 16%.
– Operating expenses before credit impairment losses, provisions and charges were up 4%, driven by enhancements to our digital
channels.
– Credit impairment losses were lower at £13m. The loan book continues to perform well and is supported by our prudent lending policy.
– Provisions for other liabilities and charges increased to £55m, mainly due to conduct charges in the second quarter of 2017.
Customer balances
2018
£bn
2017
£bn
Non-Commercial Real Estate trading businesses 11.5 11.5
Commercial Real Estate(3) 6.2 7.9
Customer loans 17.7 19.4
Customer deposits 17.6 17.8
RWAs 17.0 19.4
(3) Excludes Commercial Real Estate loans totalling £0.2bn (2017: £0.2bn) to small business customers that are managed by Business banking in the Retail Banking business segment.
2018 compared to 2017
– Customer loans were down £1.7bn, largely due to ring-fence transfers and a risk management initiative, as well as a £1.1bn managed
reduction in Commercial Real Estate lending, as well as customer repayments.
Alongside the ring-fence transfers and a risk management initiative, we have continued our solid lending growth to non-Commercial
Real Estate trading businesses of £0.5bn, ahead of the market.
– Customer deposits were down £0.2bn, driven by management pricing actions and working capital use by customers.
– RWAs decreased 12%, largely as a result of ring-fence implementation and risk management initiatives, including significant risk
transfer (SRT) securitisations. These actions have positioned the bank prudently, though they will have an economic impact in 2019.

ˆ200G2Mlv!2ZbrlFgpŠ200G2Mlv!2ZbrlFgp
628340 TX 12SANTANDERFORM 20-F (SAN UK PL
04-Mar-2019 01:00 ESTHTMLON
Donnelley Financial EGV gopad0dc 5*ESS 0C
VDI-W7-PFD-037812.9.12.0
Page 1 of 1
Annual Report 2018 | Financial review
CORPORATE & INVESTMENT BANKING
As part of a rebrand across the Banco Santander group, Global Corporate Banking (the UK segment of Santander Global Corporate Banking) has been
branded as Corporate & Investment Banking (CIB). CIB services corporate clients with an annual turnover of £500m and above. CIB clients require
specially tailored solutions and value-added services due to their size, complexity and sophistication. We provide these clients with products to manage
currency fluctuations, protect against interest rate risk, and arrange capital markets finance and specialist trade finance solutions, as well as providing
support to the rest of Santander UK’s business segments.
Summarised income statement
2018
£m
2017
£m
2016
£m
Net interest income 69 74 73
Non-interest income(1) 272 364 312
Total operating income 341 438 385
Operating expenses before credit impairment losses, provisions and charges (262) (304) (281)
Credit impairment losses(2) (14) (174) (21)
Provisions for other liabilities and charges (8) (11) (11)
Total operating credit impairment losses, provisions and charges (22) (185) (32)
Profit/(loss) before tax 57 (51) 72
(1) Comprised of Net fee and commission income and Net trading and other income.
(2) Credit impairment losses for 2018 are calculated on an IFRS 9 basis and for 2017 and 2016 on an IAS 39 basis. For more on this change in methodology see the IFRS 9 accounting policy changes in Note 1 and the
IFRS 9 transition disclosures in Note 44 to the Consolidated Financial Statements
2018 compared to 2017
As described in more detail below, and in Note 43 to the Consolidated Financial Statements, the financial results reflect the changes in our statutory
perimeter that we made in the third quarter of 2018, following the ring-fence transfers to Banco Santander London Branch which principally impacted
Corporate & Investment Banking. Prior periods have not been restated. Profit before tax increased by £108m to £57m in 2018 (2017: £51m loss). By
income statement line, the movements were:
– Operating income was down predominantly due to ring-fence transfers.
– We have continued our strategic investment in business transformation, digital enhancements and growth initiatives in our core business areas.
– Credit impairment losses were down, due to charges for Carillion plc in 2017.
2017 compared to 2016
Profit before tax decreased by £123m to a loss of £51m in 2017 (2016: £72m). By income statement line, the movements were:
– Net interest income was up £1m, due to lending growth in project and acquisition finance, securitisation and transactional services, offset by continued
asset margin pressures.
– Non-interest income increased 17% to £364m, driven by security financing, derivative sales, and market making.
– Operating expenses before credit impairment losses, provisions and charges increased 8% to £304m, due to a one-off charge for services provided by
Banco Santander SA. Going forward, the majority of these charges will be allocated to the Banco Santander London Branch under our new ring-fence
structure.
– Credit impairment losses increased to £174m, primarily relating to Carillion plc exposures.
– Provisions for other liabilities and charges remained at £11m.
Customer balances
2018
£bn
2017
£bn
Customer loans 4.6 6.0
Customer deposits 4.8 4.5
RWAs 7.2 16.5
2018 compared to 2017
– Customer loans decreased to £4.6bn, largely as a result of ring-fence transfers and a risk management initiative.
– Customer deposits increased to £4.8bn, largely as a result of higher instant access deposit balances.
– RWAs decreased 56% to £7.2bn largely as a result of ring-fence transfers and a risk management initiative. Other assets and liabilities of £21.5bn and
£20.7bn, primarily relating to derivative contracts, were transferred to Banco Santander London Branch in July 2018. RWAs attributable to customer
loans were £5.2bn (2017: £7.2bn). These actions will result in significantly lower future profits for this segment.
12 Santander UK plc
ˆ200G2Mlv!2ZbsuY6=Š200G2Mlv!2ZbsuY6=
628340 TX 13SANTANDERFORM 20-F (SAN UK PL
04-Mar-2019 01:00 ESTHTMLON
Donnelley Financial EGV gopad0dc 8*ESS 0C
VDI-W7-PFD-037812.9.12.0
bar2
Page 1 of 1
> Income statement review
Santander UK plc 13
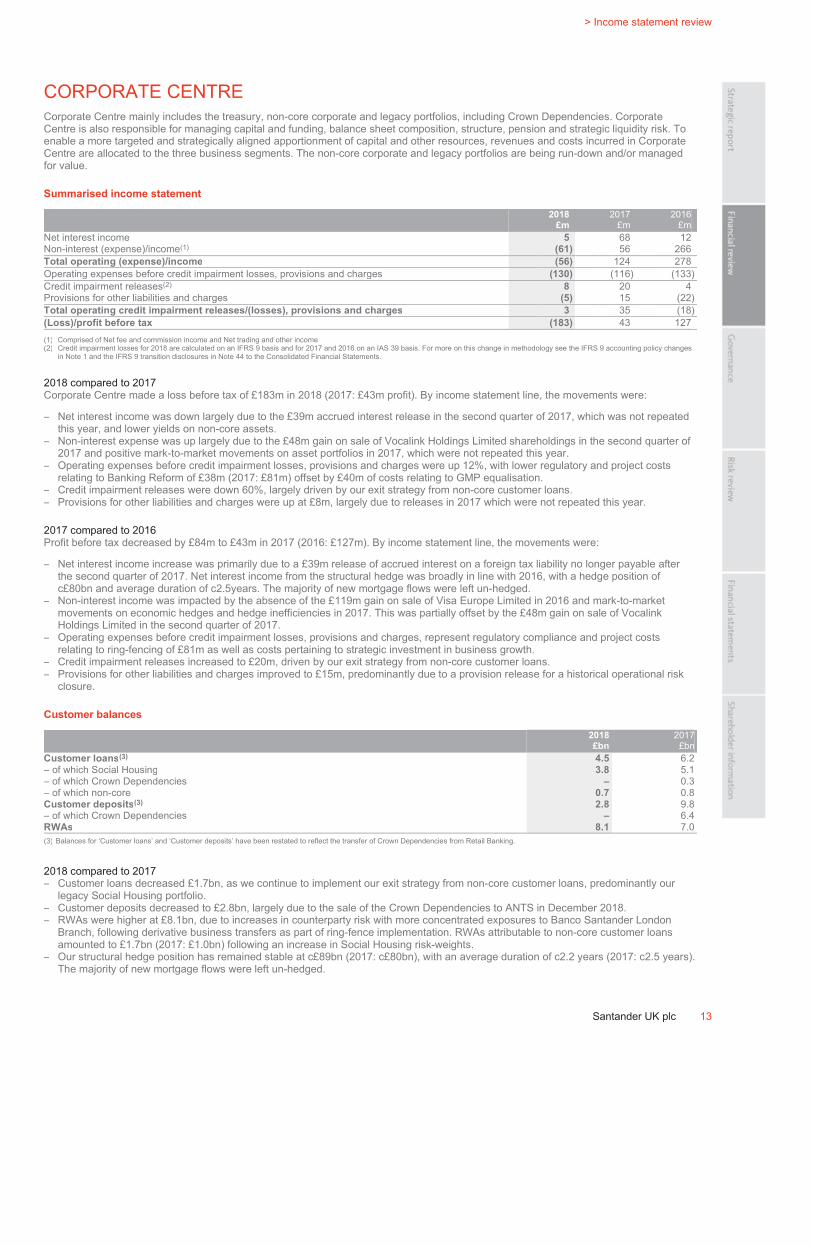
CORPORATE CENTRE
Corporate Centre mainly includes the treasury, non-core corporate and legacy portfolios, including Crown Dependencies. Corporate
Centre is also responsible for managing capital and funding, balance sheet composition, structure, pension and strategic liquidity risk. To
enable a more targeted and strategically aligned apportionment of capital and other resources, revenues and costs incurred in Corporate
Centre are allocated to the three business segments. The non-core corporate and legacy portfolios are being run-down and/or managed
for value.
Summarised income statement
2018
£m
2017
£m
2016
£m
Net interest income 5 68 12
Non-interest (expense)/income(1) (61) 56 266
Total operating (expense)/income (56) 124 278
Operating expenses before credit impairment losses, provisions and charges (130) (116) (133)
Credit impairment releases(2) 8 20 4
Provisions for other liabilities and charges (5) 15 (22)
Total operating credit impairment releases/(losses), provisions and charges 3 35 (18)
(Loss)/profit before tax (183) 43 127
(1) Comprised of Net fee and commission income and Net trading and other income
(2) Credit impairment losses for 2018 are calculated on an IFRS 9 basis and for 2017 and 2016 on an IAS 39 basis. For more on this change in methodology see the IFRS 9 accounting policy changes
in Note 1 and the IFRS 9 transition disclosures in Note 44 to the Consolidated Financial Statements.
2018 compared to 2017
Corporate Centre made a loss before tax of £183m in 2018 (2017: £43m profit). By income statement line, the movements were:
– Net interest income was down largely due to the £39m accrued interest release in the second quarter of 2017, which was not repeated
this year, and lower yields on non-core assets.
– Non-interest expense was up largely due to the £48m gain on sale of Vocalink Holdings Limited shareholdings in the second quarter of
2017 and positive mark-to-market movements on asset portfolios in 2017, which were not repeated this year.
– Operating expenses before credit impairment losses, provisions and charges were up 12%, with lower regulatory and project costs
relating to Banking Reform of £38m (2017: £81m) offset by £40m of costs relating to GMP equalisation.
– Credit impairment releases were down 60%, largely driven by our exit strategy from non-core customer loans.
– Provisions for other liabilities and charges were up at £8m, largely due to releases in 2017 which were not repeated this year.
2017 compared to 2016
Profit before tax decreased by £84m to £43m in 2017 (2016: £127m). By income statement line, the movements were:
– Net interest income increase was primarily due to a £39m release of accrued interest on a foreign tax liability no longer payable after
the second quarter of 2017. Net interest income from the structural hedge was broadly in line with 2016, with a hedge position of
c£80bn and average duration of c2.5years. The majority of new mortgage flows were left un-hedged.
– Non-interest income was impacted by the absence of the £119m gain on sale of Visa Europe Limited in 2016 and mark-to-market
movements on economic hedges and hedge inefficiencies in 2017. This was partially offset by the £48m gain on sale of Vocalink
Holdings Limited in the second quarter of 2017.
– Operating expenses before credit impairment losses, provisions and charges, represent regulatory compliance and project costs
relating to ring-fencing of £81m as well as costs pertaining to strategic investment in business growth.
– Credit impairment releases increased to £20m, driven by our exit strategy from non-core customer loans.
– Provisions for other liabilities and charges improved to £15m, predominantly due to a provision release for a historical operational risk
closure.
Customer balances
2018
£bn
2017
£bn
Customer loans(3) 4.5 6.2
– of which Social Housing 3.8 5.1
– of which Crown Dependencies – 0.3
– of which non-core 0.7 0.8
Customer deposits(3)
2.8 9.8
– of which Crown Dependencies – 6.4
RWAs 8.1 7.0
(3) Balances for ‘Customer loans’ and ‘Customer deposits’ have been restated to reflect the transfer of Crown Dependencies from Retail Banking.
2018 compared to 2017
– Customer loans decreased £1.7bn, as we continue to implement our exit strategy from non-core customer loans, predominantly our
legacy Social Housing portfolio.
– Customer deposits decreased to £2.8bn, largely due to the sale of the Crown Dependencies to ANTS in December 2018.
– RWAs were higher at £8.1bn, due to increases in counterparty risk with more concentrated exposures to Banco Santander London
Branch, following derivative business transfers as part of ring-fence implementation. RWAs attributable to non-core customer loans
amounted to £1.7bn (2017: £1.0bn) following an increase in Social Housing risk-weights.
– Our structural hedge position has remained stable at c£89bn (2017: c£80bn), with an average duration of c2.2 years (2017: c2.5 years).
The majority of new mortgage flows were left un-hedged.
ˆ200G2Mlv!2ZbuobgbŠ200G2Mlv!2Zbuobgb
628340 TX 14SANTANDERFORM 20-F (SAN UK PL
04-Mar-2019 01:00 ESTHTMLON
Donnelley Financial EGV gopad0dc 7*ESS 0C
VDI-W7-PFD-037812.9.12.0
Page 1 of 1
Annual Report 2018 | Financial review
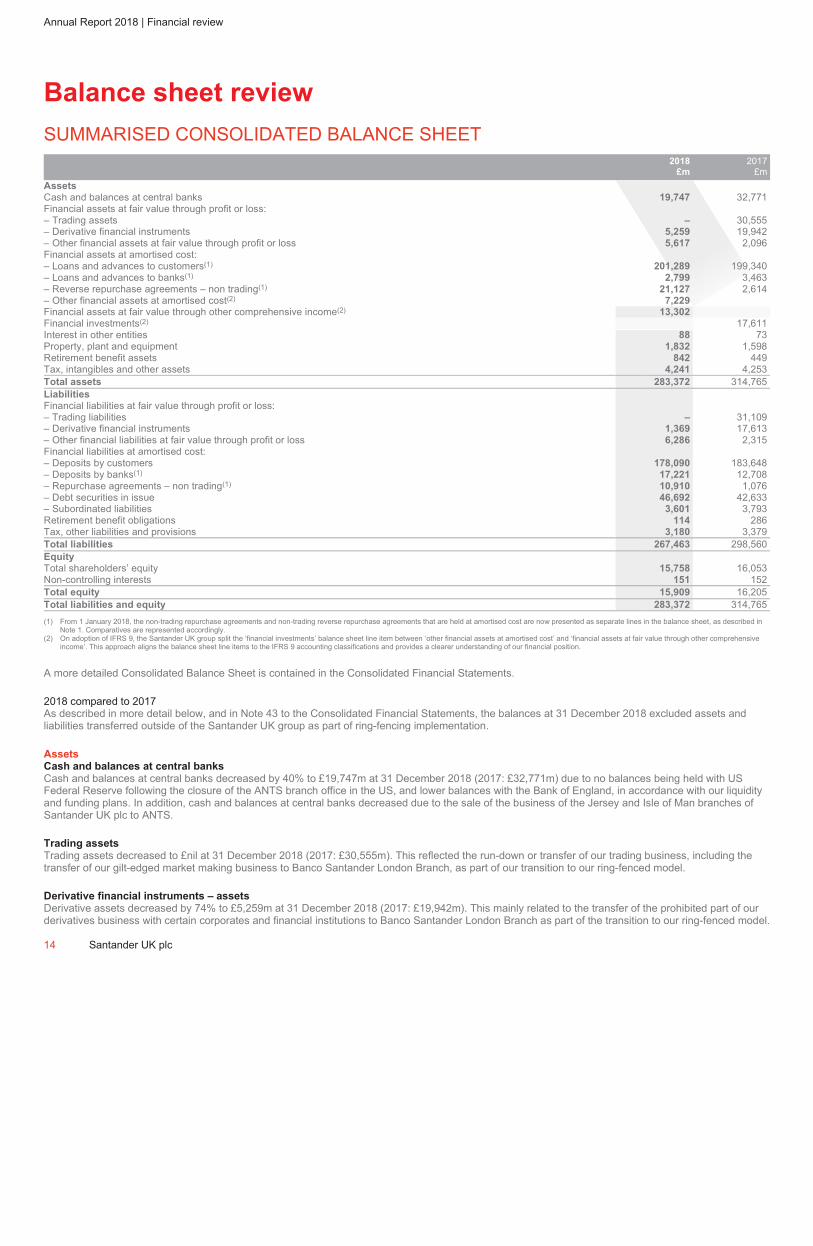
Balance sheet review
SUMMARISED CONSOLIDATED BALANCE SHEET
2018
£m
2017
£m
Assets
Cash and balances at central banks 19,747 32,771
Financial assets at fair value through profit or loss:
– Trading assets – 30,555
– Derivative financial instruments 5,259 19,942
– Other financial assets at fair value through profit or loss 5,617 2,096
Financial assets at amortised cost:
– Loans and advances to customers(1) 201,289 199,340
– Loans and advances to banks(1) 2,799 3,463
– Reverse repurchase agreements – non trading(1)
21,127 2,614
– Other financial assets at amortised cost(2)
7,229
Financial assets at fair value through other comprehensive income(2) 13,302
Financial investments(2) 17,611
Interest in other entities 88 73
Property, plant and equipment 1,832 1,598
Retirement benefit assets 842 449
Tax, intangibles and other assets 4,241 4,253
Total assets 283,372 314,765
Liabilities
Financial liabilities at fair value through profit or loss:
– Trading liabilities – 31,109
– Derivative financial instruments 1,369 17,613
– Other financial liabilities at fair value through profit or loss 6,286 2,315
Financial liabilities at amortised cost:
– Deposits by customers 178,090 183,648
– Deposits by banks(1) 17,221 12,708
– Repurchase agreements – non trading(1)
10,910 1,076
– Debt securities in issue 46,692 42,633
– Subordinated liabilities 3,601 3,793
Retirement benefit obligations 114 286
Tax, other liabilities and provisions 3,180 3,379
Total liabilities 267,463 298,560
Equity
Total shareholders’ equity 15,758 16,053
Non-controlling interests 151 152
Total equity 15,909 16,205
Total liabilities and equity 283,372 314,765
(1) From 1 January 2018, the non-trading repurchase agreements and non-trading reverse repurchase agreements that are held at amortised cost are now presented as separate lines in the balance sheet, as described in
Note 1. Comparatives are represented accordingly.
(2) On adoption of IFRS 9, the Santander UK group split the ‘financial investments’ balance sheet line item between ‘other financial assets at amortised cost’ and ‘financial assets at fair value through other comprehensive
income’. This approach aligns the balance sheet line items to the IFRS 9 accounting classifications and provides a clearer understanding of our financial position.
A more detailed Consolidated Balance Sheet is contained in the Consolidated Financial Statements.
2018 compared to 2017
As described in more detail below, and in Note 43 to the Consolidated Financial Statements, the balances at 31 December 2018 excluded assets and
liabilities transferred outside of the Santander UK group as part of ring-fencing implementation.
Assets
Cash and balances at central banks
Cash and balances at central banks decreased by 40% to £19,747m at 31 December 2018 (2017: £32,771m) due to no balances being held with US
Federal Reserve following the closure of the ANTS branch office in the US, and lower balances with the Bank of England, in accordance with our liquidity
and funding plans. In addition, cash and balances at central banks decreased due to the sale of the business of the Jersey and Isle of Man branches of
Santander UK plc to ANTS.
Trading assets
Trading assets decreased to £nil at 31 December 2018 (2017: £30,555m). This reflected the run-down or transfer of our trading business, including the
transfer of our gilt-edged market making business to Banco Santander London Branch, as part of our transition to our ring-fenced model.
Derivative financial instruments – assets
Derivative assets decreased by 74% to £5,259m at 31 December 2018 (2017: £19,942m). This mainly related to the transfer of the prohibited part of our
derivatives business with certain corporates and financial institutions to Banco Santander London Branch as part of the transition to our ring-fenced model.
14 Santander UK plc

ˆ200G2Mlv!26fa6@6LŠ200G2Mlv!26fa6@6L
628340 TX 15SANTANDERFORM 20-F (SAN UK PL
02-Mar-2019 00:17 ESTHTMLON
Donnelley Financial EGV gopad0dc 4*ESS 0C
VDI-W7-PFD-039812.9.12.0
bar2
Page 1 of 2
> Balance sheet review
Other financial assets at fair value through profit or loss
Other financial assets at fair value through profit or loss increased to £5,617m at 31 December 2018 (2017: £2,096m), due to the following:
– On adoption of IFRS 9, certain financial investments and loans and advances to customers, previously measured at amortised cost or
available-for-sale under IAS 39, were reclassified at fair value through profit or loss (FVTPL), as they did not have solely payment of
principal and interest (SPPI) characteristics. These reclassifications were partially offset by the Santander UK group electing to
re-measure Social Housing loans from FVTPL to amortised cost to reflect the hold to collect business model.
– As part of the establishment of a credit protection vehicle in the year, Santander UK acquired £2.5bn of credit linked notes (classified as
debt securities), which were measured at FVTPL.
– In addition, Santander UK elected to classify certain non-trading reverse repurchase agreements totalling £2.2bn at FVTPL to minimise
accounting mismatches during our ring-fencing transition.
Loans and advances to customers
Loans and advances to customers at amortised cost increased slightly to £201,289m at 31 December 2018 (2017: £199,340m). This was
mainly due to:
– Increases related to £3.3bn of lending growth in mortgages and £0.5bn lending growth to non-CRE trading businesses, £0.8bn in
lending to other group entities and £1.0bn due to the re-classification of Social Housing loans from FVTPL to amortised cost on
adoption of IFRS 9.
– Decreases largely due to managed reductions of £1.1bn in CRE and £1.4bn in non-core loans, as well as £1.4bn of ring-fence transfers.
In September 2018, we also transferred £1.3bn of customer loans to Banco Santander London Branch as part of a risk management
initiative.
Reverse repurchase agreements – non trading
Non trading reverse repurchase agreements increased to £21,127m at 31 December 2018 (2017: £2,614m), which reflected the revised
classification of the majority of our permitted non trading reverse repurchase agreements at amortised cost, in line with our ring-fenced
business model for managing these assets as part of our overall funding and liquidity plans.
Other financial assets at amortised cost
On adoption of IFRS 9, the Santander UK group split the ‘financial investments’ balance sheet line item between ‘other financial assets at
amortised cost’ and ‘financial assets at FVOCI. This aligned the balance sheet line items to the IFRS 9 accounting classifications and
provides a clearer understanding of our financial position. At 1 January 2018, this resulted in £7,776m of other financial assets at
amortised cost being re-classified from financial investments measured at amortised cost. When compared to 1 January 2018, the balance
reduced slightly to £7,229m at 31 December 2018.
Financial assets at fair value through other comprehensive income
At 1 January 2018 and on adoption of IFRS 9, financial investments of £8,743m that were previously measured at available-for-sale under
IAS 39 were re-classified at FVOCI. When compared to 1 January 2018, the balance increased to £13,302m at 31 December 2018 due to
higher volumes of short-dated bonds within the eligible liquidity pool.
Retirement benefit assets
Retirement benefit assets increased by 88% to £842m at 31 December 2018 (2017: £449m). This was mainly due to actuarial gains in the
year driven by rising corporate bond yields, partially offset by a higher assumed inflation rate, which when combined reduced the value
placed on Scheme liabilities.
Liabilities
Trading liabilities
Trading liabilities decreased to £nil at 31 December 2018 (2017: £31,109m). This reflected the run-down or transfer of the majority of our
trading business, including the transfer of our gilt-edged market making business to Banco Santander London Branch, as part of our
transition to our ring-fenced model.
Derivative financial instruments – liabilities
Derivative liabilities decreased to £1,369m at 31 December 2018 (2017: £17,613m). This mainly related to the transfer of the prohibited
part of our derivatives business with certain corporates and financial institutions to Banco Santander London Branch, as part of the
transition to our ring-fenced model.
Other financial liabilities at fair value through profit or loss
Other financial liabilities at fair value through profit or loss increased to £6,286m at 31 December 2018 (2017: £2,315m), due to the
classification of £1.7bn of non-trading repurchase agreements at FVTPL to minimise accounting mismatches during our ring-fencing
transition, and also higher structured deposit balances following the establishment of a new credit protection vehicle in the year.
Deposits by customers
Deposits by customers at amortised cost decreased by 3% to £178,090m at 31 December 2018 (2017: £183,648m), with lower corporate
deposits and management pricing actions driving a reduction in retail savings products. In addition, £4.8bn of customer deposits were
transferred as part of the sale of the business of the Jersey and Isle of Man branches of Santander UK plc to ANTS. This was partially
offset by a £0.9bn increase in personal current account balances.
Deposits by banks
Deposits by banks increased by 36% to £17,221m at 31 December 2018 (2017: £12,708m), driven by further drawdowns of the Term
Funding Scheme with the Bank of England, and higher deposits held as collateral.
Repurchase agreements – non trading
Non trading repurchase agreements increased to £10,910m at 31 December 2018 (2017: £1,076m), which reflected the revised
classification of the majority of our permitted non trading repurchase agreements at amortised cost, in line with our ring-fenced business
model for managing these liabilities as part of our overall funding and liquidity plans.
Debt securities in issue
Debt securities in issue increased by 10% to £46,692m at 31 December 2018 (2017: £42,633m) reflecting the pre-funding of our 2019
requirements.
Retirement benefit obligations
Retirement benefit obligations decreased by 60% to £114m at 31 December 2018 (2017: £286m). This was principally due to actuarial
gains in the year driven by widening credit spreads on the discount rate used to value scheme liabilities.
Equity
Total shareholders’ equity

ˆ200G2Mlv!26fa6@6LŠ200G2Mlv!26fa6@6L
628340 TX 15SANTANDERFORM 20-F (SAN UK PL
02-Mar-2019 00:17 ESTHTMLON
Donnelley Financial EGV gopad0dc 4*ESS 0C
VDI-W7-PFD-039812.9.12.0
bar2
Page 2 of 2
Santander UK plc 15
Total shareholders’ equity decreased by 2% to £15,758m at 31 December 2018 (2017: £16,053m). Total comprehensive income in the
period was offset by dividend payments, including £668m associated with ring-fencing transfers to Banco Santander London Branch. In
addition, as part of a capital management exercise, Santander UK plc purchased and redeemed £290m of 6.475% Perpetual Capital
securities.

ˆ200G2Mlv!2Zbvxr6iŠ200G2Mlv!2Zbvxr6i
628340 TX 16SANTANDERFORM 20-F (SAN UK PL
04-Mar-2019 01:00 ESTHTMLON
Donnelley Financial EGV gopad0dc 4*ESS 0C
VDI-W7-PFD-037812.9.12.0
Page 1 of 1
Annual Report 2018 | Financial review
Cash flows
SUMMARISED CONSOLIDATED CASH FLOW STATEMENT
2018 2017 2016
£m £m £m
Net cash flows from operating activities (15,405) 23,976 18,005
Net cash flows from investing activities (3,682) 816 (7,340)
Net cash flows from financing activities 2,730 (7,637) (6,388)
Change in cash and cash equivalents (16,357) 17,155 4,277
A more detailed Consolidated Cash Flow Statement is contained in the Consolidated Financial Statements.
The major activities and transactions that affected cash flows during 2018, 2017 and 2016 were as follows:
In 2018, the net cash outflows from operating activities of £15,405m resulted from net cash outflows relating to trading and derivative assets and liabilities.
The net cash outflows from investing activities of £3,682m mainly reflecting purchases of financial investments in the year as part of normal liquidity
management. The net cash inflows from financing activities of £2,730m reflected the net inflows from debt securities following the pre-funding of our 2019
requirements. This was offset by payments of dividends on ordinary shares, preference shares, other equity instruments and non-controlling interests.
Cash and cash equivalents decreased by £16,357m principally from the decrease in cash held at central banks.
In 2017, the net cash inflows from operating activities of £23,976m resulted from the increase in trading balances, increased customer lending and
customer savings and deposits from other banks. The net cash inflows from investing activities of £816m mainly reflected sale and redemption of financial
investments offset by purchases of property, plant and equipment and intangible assets. The net cash outflows from financing activities of £7,637m
principally reflected the repayment of debt securities maturing in the year of £13,763 offset by new issues of debt securities of £6,645m, the payment of
interim dividends on ordinary shares, preference shares, other equity instruments and non-controlling interests of £1,000m. Cash and cash equivalents
increased by £17,155m principally from the increase in cash and balances at central banks, which is held as part of the liquidity pool. This increase was
mainly due to a change in the mix of assets held for liquidity purposes as part of normal portfolio management activity.
In 2016, the net cash inflows from operating activities of £18,005m resulted from the increase in trading balances, increased customer lending and
customer savings and deposits from other banks. The net cash outflows from investing activities of £7,340m principally reflected the purchase of
held-to-maturity investments. The net cash outflows from financing activities of £6,388m principally reflected the repayment of debt securities maturing in
the year of £11,352m offset by new issues of debt securities of £5,547m, the payment of interim dividends on ordinary shares, preference shares, other
equity instruments and non-controlling interests of £559m. Cash and cash equivalents increased by £4,277m principally from the increase in cash held at
central banks and also debt securities, both of which are held as part of the liquidity pool. This has increased due to an increase in wholesale funding with
a maturity of less than 30 days.
16 Santander UK plc

ˆ200G2Mlv!2ZbyBJ6Ê200G2Mlv!2ZbyBJ6ˆ
628340 TX 17SANTANDERFORM 20-F (SAN UK PL
04-Mar-2019 01:00 ESTHTMLON
Donnelley Financial EGV gopad0dc 5*ESS 0C
VDI-W7-PFD-037812.9.12.0
bar2
Page 1 of 1
> Balance sheet review
Santander UK plc 17
2018 business development highlights
Retail Banking
– We announced plans to reshape our branch network and close 140 branches in response to changes in how customers are choosing to
carry out their banking. Our future branch network, with c615 branches, will be made up of a combination of larger branches offering
improved community facilities to support local businesses and customers, and smaller branches using the latest technology to offer
customers more convenient access to banking services. Furthermore, in order to deliver a branch network for the future, 100 branches
will be refurbished over the next two years through an investment of £55m.
– Our Wealth Management strategy continues to focus on expanding our multi-channel proposition to make investments accessible for
our customers. In the second half of 2018 we launched the Digital Investment Advisor, offering customers low cost online investments
advice. This complements our growing online platform, the Investment Hub, which now serves over 254,000 accounts (up 12% from
2017), as well as our face-to-face advice services for customers.
– We aim to help our customers manage their money and improve our customer experience by providing real-time support in their
channel of choice. In November 2018 we launched the Santander ChatBot for our online banking customers. It has been designed to
support their questions and queries using machine learning, giving instant answers to basic types of queries often raised.
– SMEs have traditionally been underserved by banks in the UK, and we aim to change this. In October 2018 we launched the 1I2I3
Business Current Account alongside the 1I2I3 Business World for small businesses and expanded our support by providing access to
our branch network for account holders. The 1I2I3 Business Current Account has been rated ‘Outstanding’ by Business Moneyfacts
since launch.
– We have successfully applied to be part of the Incentivised Switching Scheme (branded Business Banking Switch), which covers
eligible RBS business customers (formerly known as customers of Williams & Glyn), with an annual credit turnover of up to £25m.
These customers will be incentivised to switch their primary business current accounts and loans to participating challenger banks,
including Santander UK, when the scheme launches on 25 February. Under the scheme, participating banks will receive a one-off
payment for each switching customer that they attract.
– In April 2018, we launched ‘Santander One Pay FX’, a new blockchain-based international payments service which enables our
customers to have the majority of their euro transfers complete on the same day. This was part of a Banco Santander initiative for retail
customers across UK, Spain, Brazil and Poland.
– Throughout 2018, we have been making improvements to our mobile banking app which resulted in our iOS rating improving to 4.8 in
December 2018, based on 181,000 reviews.
– We have made improvements to our mortgage offering throughout 2018, including exclusive rates for First Time Buyers holding a Help
to Buy ISA, and our gifted deposit scheme promotion. We also added the ability to make a single mortgage overpayment online at any
time, offering customers more control over their mortgage.
Corporate & Commercial Banking
– Our Growth Capital team continues to provide high growth SMEs with innovative funding solutions to support investment, with over
£21m of growth capital and £101m of senior debt provided to 36 companies as part of our Breakthrough programme. In 2018, we
supported 478 companies who benefited from international events focused on helping create international connections and achieving
their global ambitions.
– We are also building primacy banking customer relationships with a growing number of international trade initiatives, which
complements existing services like the Santander Trade Club, which is part of the Trade Club Alliance. The Alliance currently has 12
members, formed of international banking groups, with 10 already offering global access to our customers looking to find new trading
partners.
We are developing these initiatives in collaboration with the Banco Santander group and key strategic partners to leverage global
expertise and contacts to help our customers grow their businesses.
– We have established 3 trade corridors in 2018 to connect our UK customers, helping UK businesses to establish the necessary
contacts and local support services to open up new markets and successfully grow trade overseas.
Corporate & Investment Banking
– We have made progress in completing the roll out of our client management service to all our customers, to simplify the client
on-boarding process and improve customer experience.
ˆ200G2Mlv!2ZbwJCgDŠ200G2Mlv!2ZbwJCgD
628340 TX 18SANTANDERFORM 20-F (SAN UK PL
04-Mar-2019 01:00 ESTHTMLON
Donnelley Financial EGV annas1dc 15*ESS 0C
VDI-W7-PFD-029812.9.12.0
Page 1 of 1
Annual Report 2018 | Governance
Governance
Santander UK Group Holdings plc is the immediate parent company of
Santander UK plc. The two companies operate on the basis of a unified
business strategy and have common Boards, albeit the principal business
activities of the Santander UK Group Holdings plc group are carried on by
Santander UK plc and its subsidiaries.
The Santander UK Group Holdings plc Corporate Governance and Risk
Frameworks have been adopted by the Company and its subsidiaries to
ensure consistency of application. Prior to November 2018, the Corporate
Governance and Risk Frameworks were applied from the level of Santander
UK plc across the Santander UK group and adopted by Santander UK Group
Holdings plc.
As a result, the review of the business and principal risks and uncertainties
facing the Company, and the description of the Company’s Corporate
Governance, including the activities of the Board and risk management
arrangements, are integrated with those of Santander UK Group Holdings plc
and are reported in this Annual Report as operating within the Company for all
periods presented.
Contents
Board of Directors 19
Corporate Governance report 22
Chair’s report on corporate governance 22
Board Nomination Committee Chair’s report 25
Board Risk Committee Chair’s report 27
Board Audit Committee Chair’s report 33
Board Responsible Banking Committee
Chair’s report 39
Directors’ Remuneration report 41
Board Remuneration Committee
Chair’s report 41
Remuneration report and
remuneration policies 43
Remuneration implementation report 45
Directors’ report 48
18 Santander UK plc
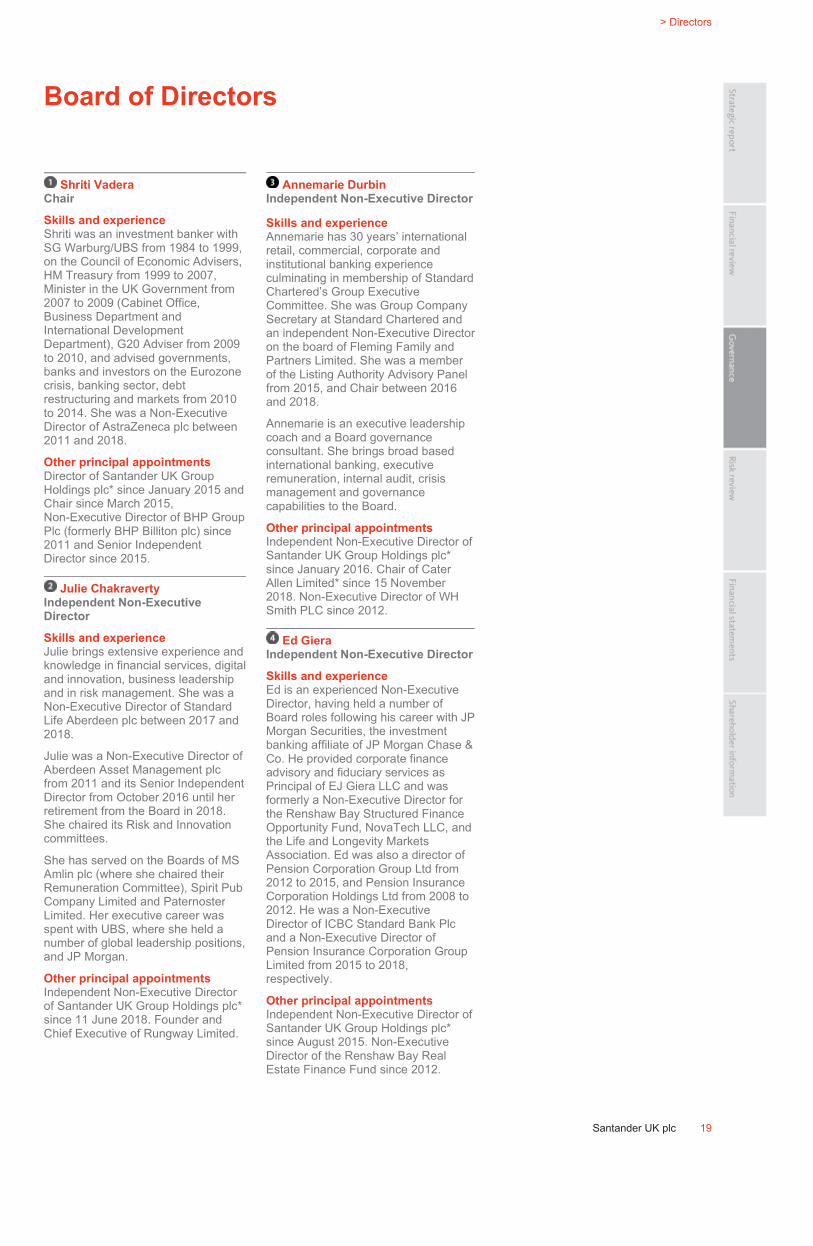
ˆ200G2Mlv!2Zkn=z6‹Š200G2Mlv!2Zkn=z6
628340 TX 19SANTANDERFORM 20-F (SAN UK PL
04-Mar-2019 01:10 ESTHTMLON
Donnelley Financial EGV gopad0dc 6*ESS 0C
VDI-W7-PFD-037812.9.12.0
1 2 3 4 bar3
Page 1 of 1
> Directors
Santander UK plc 19
Board of Directors
Shriti Vadera
Chair
Skills and experience
Shriti was an investment banker with
SG Warburg/UBS from 1984 to 1999,
on the Council of Economic Advisers,
HM Treasury from 1999 to 2007,
Minister in the UK Government from
2007 to 2009 (Cabinet Office,
Business Department and
International Development
Department), G20 Adviser from 2009
to 2010, and advised governments,
banks and investors on the Eurozone
crisis, banking sector, debt
restructuring and markets from 2010
to 2014. She was a Non-Executive
Director of AstraZeneca plc between
2011 and 2018.
Other principal appointments
Director of Santander UK Group
Holdings plc* since January 2015 and
Chair since March 2015,
Non-Executive Director of BHP Group
Plc (formerly BHP Billiton plc) since
2011 and Senior Independent
Director since 2015.
Julie Chakraverty
Independent Non-Executive
Director
Skills and experience
Julie brings extensive experience and
knowledge in financial services, digital
and innovation, business leadership
and in risk management. She was a
Non-Executive Director of Standard
Life Aberdeen plc between 2017 and
2018.
Julie was a Non-Executive Director of
Aberdeen Asset Management plc
from 2011 and its Senior Independent
Director from October 2016 until her
retirement from the Board in 2018.
She chaired its Risk and Innovation
committees.
She has served on the Boards of MS
Amlin plc (where she chaired their
Remuneration Committee), Spirit Pub
Company Limited and Paternoster
Limited. Her executive career was
spent with UBS, where she held a
number of global leadership positions,
and JP Morgan.
Other principal appointments
Independent Non-Executive Director
of Santander UK Group Holdings plc*
since 11 June 2018. Founder and
Chief Executive of Rungway Limited.
Annemarie Durbin
Independent Non-Executive Director
Skills and experience
Annemarie has 30 years’ international
retail, commercial, corporate and
institutional banking experience
culminating in membership of Standard
Chartered’s Group Executive
Committee. She was Group Company
Secretary at Standard Chartered and
an independent Non-Executive Director
on the board of Fleming Family and
Partners Limited. She was a member
of the Listing Authority Advisory Panel
from 2015, and Chair between 2016
and 2018.
Annemarie is an executive leadership
coach and a Board governance
consultant. She brings broad based
international banking, executive
remuneration, internal audit, crisis
management and governance
capabilities to the Board.
Other principal appointments
Independent Non-Executive Director of
Santander UK Group Holdings plc*
since January 2016. Chair of Cater
Allen Limited* since 15 November
2018. Non-Executive Director of WH
Smith PLC since 2012.
Ed Giera
Independent Non-Executive Director
Skills and experience
Ed is an experienced Non-Executive
Director, having held a number of
Board roles following his career with JP
Morgan Securities, the investment
banking affiliate of JP Morgan Chase &
Co. He provided corporate finance
advisory and fiduciary services as
Principal of EJ Giera LLC and was
formerly a Non-Executive Director for
the Renshaw Bay Structured Finance
Opportunity Fund, NovaTech LLC, and
the Life and Longevity Markets
Association. Ed was also a director of
Pension Corporation Group Ltd from
2012 to 2015, and Pension Insurance
Corporation Holdings Ltd from 2008 to
2012. He was a Non-Executive
Director of ICBC Standard Bank Plc
and a Non-Executive Director of
Pension Insurance Corporation Group
Limited from 2015 to 2018,
respectively.
Other principal appointments
Independent Non-Executive Director of
Santander UK Group Holdings plc*
since August 2015. Non-Executive
Director of the Renshaw Bay Real
Estate Finance Fund since 2012.

ˆ200G2Mlv!28pLctgOŠ200G2Mlv!28pLctgO
628340 TX 20SANTANDERFORM 20-F (SAN UK PL
02-Mar-2019 01:59 ESTHTMLON
Donnelley Financial EGV sraas0dc 6*ESS 0C
VDI-W7-PFL-133112.9.12.0
5 6 7 8
Page 1 of 1
Annual Report 2018 | Governance
Board of Directors continued
* Part of the Banco Santander group.
20 Santander UK plc
Chris Jones
Independent Non-Executive Director
Santander UK’s Whistleblower’s
Champion
Skills and experience
Chris was a partner at PwC from 1989 to
2014. He focused on the financial services
industry from the mid-1980s and was a
Senior Audit Partner specialising in the
audit of banks and other financial services
companies. He also led PwC’s EMEA
Financial Services practice and was a
member of their Financial Services global
leadership team. He is a past president of
the Association of Corporate Treasurers
and was Chairman of the Advisory Board
of the Association of Corporate
Treasurers between January 2010 and
July 2018.
Other principal appointments
Independent Non-Executive Director of
Santander UK Group Holdings plc* since
March 2015. Audit Committee member of
the Wellcome Trust since 2016.
Non-Executive Director of Redburn
(Europe) Ltd since 2014. Investment
Trustee of the Civil Service Benevolent
Fund since 2015. Board member of the
Audit Committee Chair’s Independent
Forum since January 2019.
Genevieve Shore
Independent Non-Executive Director
Skills and experience
Genevieve brings digital, technology and
commercial expertise to Santander UK
from a career in the media, publishing and
technology sectors, most recently as Chief
Product and Marketing Officer of Pearson
plc, and previously as Director of Digital
Strategy and Chief Information Officer.
Genevieve has also advised and invested
in Education Technology start-ups and
works with female executives as a coach
and mentor.
Other principal appointments
Independent Non-Executive Director of
Santander UK Group Holdings plc* since
May 2015. Non-Executive Director of
Next Fifteen Communications Group plc
since 2015. Non-Executive Director of
Moneysupermarket.com Group plc since
2014. Non-Executive Director of Arup
Group Limited since 2017. Independent
Non-Executive Director of the Rugby
Football Union since 2017.
Scott Wheway
Independent Non-Executive Director
Senior Independent Director
Skills and experience
Scott brings extensive retail and consumer
knowledge to the Board, having formerly
held various senior roles at Tesco plc,
including Operations Director and CEO,
Tesco Japan. Following this, he was CEO
of Best Buy Europe and Managing Director
and Retail Director of The Boots Company
plc and Managing Director of Boots the
Chemist at Alliance Boots plc. Scott also
has experience of the financial services
sector through his past roles at Aviva plc
(Non-Executive Director from 2007 to 2016)
and Aviva Insurance Limited (Chairman
from 2015 to 2017).
Other principal appointments
Independent Non-Executive Director of
Santander UK Group Holdings plc* since
2014. Non-Executive Director of Centrica
plc since 2016. Chairman of AXA UK plc
since 2017.
Ana Botín
Banco Santander Nominated
Non-Executive Director
Skills and experience
Ana joined the Banco Santander group in
1988 and was appointed Executive Chair of
Banco Santander SA in September 2014.
Ana has been a member of Banco
Santander SA’s Board and Executive
Committee since 1989 and previously
served as Chief Executive Officer and
Executive Director of Santander UK plc
between 2010 and 2014. She has
extensive financial services experience.
She directed Banco Santander SA’s Latin
American expansion in the 1990s and was
responsible for the Latin American
Corporate Banking, Asset Management
and Treasury divisions.
Other principal appointments
Executive Director of Santander UK Group
Holdings plc* in 2014. Non-Executive
Director of Santander UK plc* since
September 2014. Executive Chair of Banco
Santander SA* since 2014 and Director
since 1989. Non-Executive Director of The
Coca-Cola Company since 2013. Vice-
Chair of the Empresa y Crecimiento
Foundation since 2000. Vice-Chair of the
World Business Council for Sustainable
Development since 2016. Member of the
MIT’s CEO Advisory Board since 2015.

ˆ200G2Mlv!2Dwp7$6xŠ200G2Mlv!2Dwp7$6x
628340 TX 21SANTANDERFORM 20-F (SAN UK PL
02-Mar-2019 05:11 ESTHTMLON
Donnelley Financial EGV mania1dc 11*ESS 0C
VDI-W7-PFL-144112.9.12.0
10 11 12 13 9 bar3 tab
Page 1 of 2
> Directors
For Board Committee membership, see Board and Committee membership, tenure,
attendance and remuneration. For full bios visit
www.santander.co.uk/uk/about-santander-uk/about-us/non-executive-directors
Lindsey Argalas
Banco Santander Nominated
Non-Executive Director
Skills and experience
Lindsey joined Banco Santander SA
in 2017 as Chief Digital and
Innovation Officer in charge of digital
transformation and innovation.
She joined from the Silicon Valley-
based software company Intuit Inc,
where she held a number of senior
positions from 2008 to 2017, most
recently as Chief of Staff to the CEO.
Prior to that, Lindsey worked as a
Principal at the Boston Consulting
Group for 10 years.
Lindsey brings extensive international
experience of driving growth and
leading transformational change with
particular expertise in new market
entry, customer-driven innovation and
digital experiences.
Other principal appointments
Non-Executive Director of Santander
UK Group Holdings plc* since
1 January 2018. Director of
Santander Fintech Limited* since
September 2017.
Gerry Byrne
Banco Santander Nominated
Non-Executive Director
Skills and experience
Gerry has been Chairman of the
Supervisory Board of Santander Bank
Polska SA* (SBP) since 2011 having
joined the SBP Board as Deputy
Chairman in 2001. He held several
senior management roles at AIB
Group, both in Ireland (from 1973 to
2000) and in Poland (from 2001 to
2010), latterly as Managing Director
of the Central Eastern Europe
Division in 2009-2010. He is a
member of the Irish Institute of
Bankers, Irish Management Institute
and an alumnus of Harvard Business
School.
Other principal appointments
Non-Executive Director of Santander
UK Group Holdings plc* since
December 2017. Chairman of the
Supervisory Board of SBP since
2011.
Nathan Bostock
Executive Director
Chief Executive Officer
Skills and experience
Nathan joined Santander UK from
RBS, where he was an Executive
Director and Group Finance Director.
He joined RBS in 2009 as Head of
Restructuring and Risk, and Group
Chief Risk Officer. He previously
spent eight years with Abbey National
plc (now Santander UK plc*) and
served on the Board as an Executive
Director from 2005. During his time
with Abbey National plc, he held other
senior positions including Chief
Financial Officer. He was also at RBS
from 1991 to 2001 in a number of
senior positions and spent seven years
before that with Chase Manhattan
Bank, having previously qualified as a
Chartered Accountant at Coopers &
Lybrand (now PwC).
Other principal appointments
Chief Executive Officer of Santander
UK Group Holdings plc* since
September 2014. Member of the PRA
Practitioner Panel since 2014 and
a Member of the Financial Services
Trade Investment Board (FSTIB) since
2015.
Susan Allen
Executive Director
Head of Retail and Business
Banking
Skills and experience
Susan has substantial experience in
the banking sector following a career
spanning over 25 years. She joined
Santander UK in 2015 as MD, Retail
Banking before being appointed as
Chief Transformation Officer the same
year. In March 2017 she was
appointed as Head of Retail
Distribution. Prior to joining Santander
UK, she held a number of senior roles
at RBS including CEO, Customer
Solutions Group Corporate Banking
and MD, UK Retail.
Other principal appointments
Executive Director of Santander UK
Group Holdings plc* since 1 January
2019. Director of Cater Allen Limited*
since December 2017.
Antonio Roman
Executive Director
Chief Financial Officer
Skills and experience
Antonio has extensive financial
services experience across a wide
range of areas including Finance,
Investor Relations and Retail Banking.
He was appointed Treasurer of
Santander UK plc in 2014, with
responsibility for the management of
interest risk, liquidity, funding,
economics and investor relations.
Antonio joined Santander UK plc in
2013 as Deputy Treasurer and prior to
that held the position of Head of
Financial Management at Banco
Español de Credito SA*. He also
worked for Grupo Caja Madrid where
he served as Financial Controller from
2007 to 2010.
Other principal appointments
Chief Financial Officer of Santander
UK Group Holdings plc* since 2015
and Executive Director since August
2017. Director of Cater Allen Limited*
since December 2017 and Abbey
National Treasury Services plc* since
July 2014. Member of UK Finance’s

ˆ200G2Mlv!2Dwp7$6xŠ200G2Mlv!2Dwp7$6x
628340 TX 21SANTANDERFORM 20-F (SAN UK PL
02-Mar-2019 05:11 ESTHTMLON
Donnelley Financial EGV mania1dc 11*ESS 0C
VDI-W7-PFL-144112.9.12.0
10 11 12 13 9 bar3 tab
Page 2 of 2
Santander UK plc 21
Financial and Risk Policy Committee
since 2015.
* Part of the Banco Santander group.
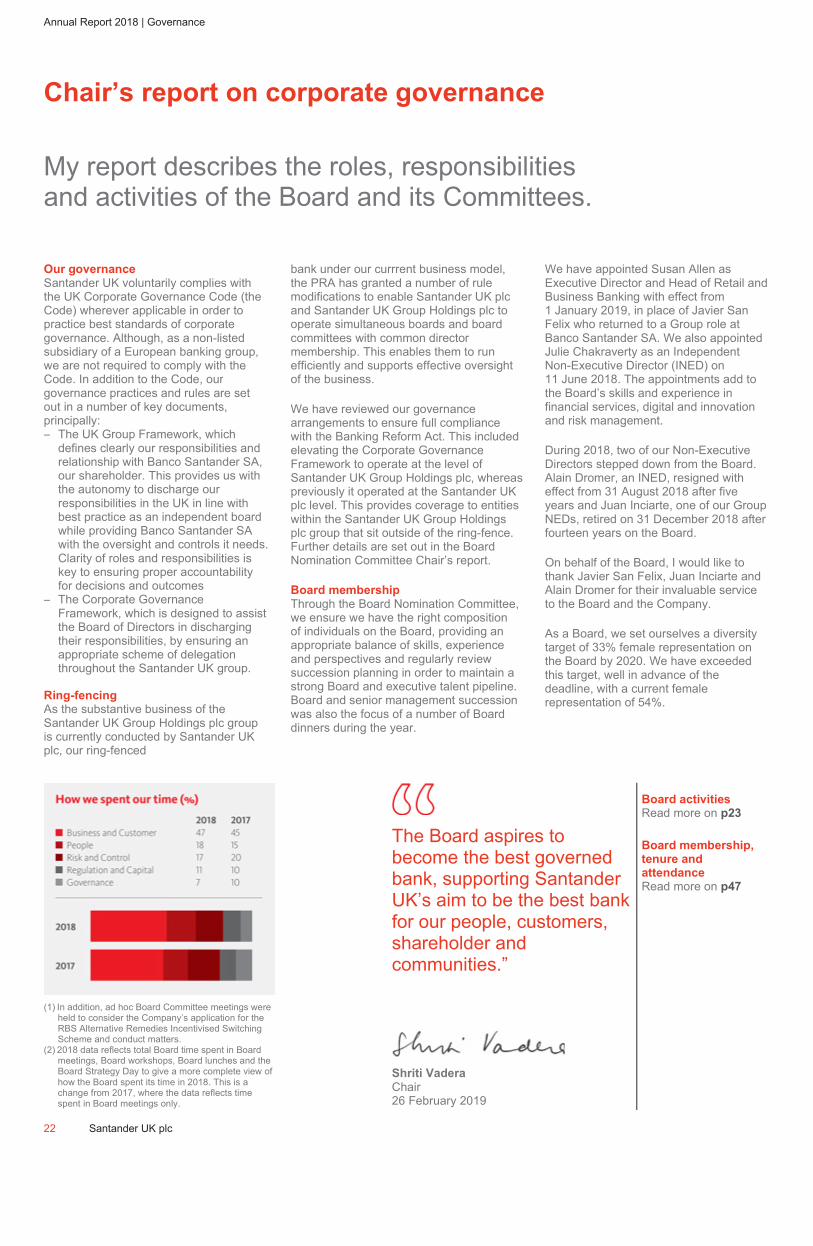
ˆ200G2Mlv!2ZkqBsgXŠ200G2Mlv!2ZkqBsgX
628340 TX 22SANTANDERFORM 20-F (SAN UK PL
04-Mar-2019 01:10 ESTHTMLON
Donnelley Financial EGV gopad0dc 7*ESS 0C
VDI-W7-PFD-037812.9.12.0
f22f22a rq
Page 1 of 1
Annual Report 2018 | Governance
Chair’s report on corporate governance
My report describes the roles, responsibilities and activities of the Board and its Committees.
(1) In addition, ad hoc Board Committee meetings were held to consider the Company’s application for the RBS Alternative Remedies Incentivised Switching Scheme and conduct matters.
(2) 2018 data reflects total Board time spent in Board meetings, Board workshops, Board lunches and the Board Strategy Day to give a more complete view of how the Board spent its time in 2018. This is a change from 2017, where the data reflects time spent in Board meetings only.
The Board aspires to become the best governed bank, supporting Santander UK’s aim to be the best bank for our people, customers, shareholder and communities.”
Shriti Vadera
Chair26 February 2019
Board activities
Read more on p23
Board membership,
tenure and
attendance
Read more on p47
22 Santander UK plc
Our governance
Santander UK voluntarily complies with the UK Corporate Governance Code (the Code) wherever applicable in order to practice best standards of corporate governance. Although, as a non-listed subsidiary of a European banking group, we are not required to comply with the Code. In addition to the Code, our governance practices and rules are set out in a number of key documents, principally: – The UK Group Framework, which
defines clearly our responsibilities and relationship with Banco Santander SA, our shareholder. This provides us with the autonomy to discharge our responsibilities in the UK in line with best practice as an independent board while providing Banco Santander SA with the oversight and controls it needs. Clarity of roles and responsibilities is key to ensuring proper accountability for decisions and outcomes
– The Corporate Governance Framework, which is designed to assist the Board of Directors in discharging their responsibilities, by ensuring an appropriate scheme of delegation throughout the Santander UK group.
Ring-fencing
As the substantive business of the Santander UK Group Holdings plc group is currently conducted by Santander UK plc, our ring-fenced
bank under our currrent business model, the PRA has granted a number of rule modifications to enable Santander UK plc and Santander UK Group Holdings plc to operate simultaneous boards and board committees with common director membership. This enables them to run efficiently and supports effective oversight of the business.
We have reviewed our governance arrangements to ensure full compliance with the Banking Reform Act. This included elevating the Corporate Governance Framework to operate at the level of Santander UK Group Holdings plc, whereaspreviously it operated at the Santander UK plc level. This provides coverage to entities within the Santander UK Group Holdings plc group that sit outside of the ring-fence. Further details are set out in the Board Nomination Committee Chair’s report.
Board membership
Through the Board Nomination Committee, we ensure we have the right composition of individuals on the Board, providing an appropriate balance of skills, experience and perspectives and regularly review succession planning in order to maintain a strong Board and executive talent pipeline. Board and senior management succession was also the focus of a number of Board dinners during the year.
We have appointed Susan Allen as Executive Director and Head of Retail and Business Banking with effect from 1 January 2019, in place of Javier San Felix who returned to a Group role at Banco Santander SA. We also appointed Julie Chakraverty as an Independent Non-Executive Director (INED) on 11 June 2018. The appointments add to the Board’s skills and experience in financial services, digital and innovation and risk management.
During 2018, two of our Non-Executive Directors stepped down from the Board. Alain Dromer, an INED, resigned with effect from 31 August 2018 after five years and Juan Inciarte, one of our Group NEDs, retired on 31 December 2018 after fourteen years on the Board.
On behalf of the Board, I would like to thank Javier San Felix, Juan Inciarte and Alain Dromer for their invaluable service to the Board and the Company.
As a Board, we set ourselves a diversity target of 33% female representation on the Board by 2020. We have exceeded this target, well in advance of the deadline, with a current female representation of 54%.

ˆ200G2Mlv!2FF1ud60Š200G2Mlv!2FF1ud60
628340 TX 23SANTANDERFORM 20-F (SAN UK PL
02-Mar-2019 05:26 ESTHTMLON
Donnelley Financial EGV sraas0dc 10*ESS 0C
VDI-W7-PFL-133112.9.12.0
bar3f23nn
Page 1 of 2
> Corporate governance report
We anticipate this ratio will decline this year as we look to return our Board size to 14 Directors. I am pleased that the ratio will remain at or close to target and represents a significant improvement from the 13% female representation in 2015. All aspects of diversity form part of our Board succession planning process, which is explained in the Board Nomination Committee Chair’s report.
* Board and Committee meetings held concurrently with Santander UK Group Holdings plc.
Summary of Board activities in 2018
The Board’s activities in 2018 included the following themes:
Theme Actions taken by the Board and outcomes
Business and
Customer
– Reviewed, challenged and remained apprised of the performance and strategy of the business divisions and functions, strategic business opportunities and developments with customer experience.
– Reviewed, challenged and approved the 3-year business plan (2018-2021) and the Budget for 2019, including cost efficiencies and associated risk assessments.
– Received and discussed regular updates on ring-fencing, including considering options in relation to the Jersey and Isle of Man branches.
Strategy – The Board held its annual Strategy Day in June 2018. They discussed: a comprehensive industry overview including banking trends and competitors, the Banco Santander-wide strategy and synergies between Banco Santander and Santander UK; M&A market opportunities; the three year business plan; strategies for Retail Banking, Corporate & Commercial Banking, Santander Services and Property; Strategic workforce planning; and digital and transformation programmes.
Regulation,
Balance Sheet
and capital
– Reviewed, challenged and approved the ICAAP, ILAAP, and Recovery and Resolution Plan; adequacy and effectiveness of stress-testing and capital management; Ring-Fencing Programme; Dividends and AT1 Payments.
– Received regular updates on capital planning.– Considered asset and liability management activities and was appraised of regulatory developments.– Approved policies including the Volcker Policy, Modern Slavery Statement, Money Laundering policy and Ring-
Fencing related policies.– Participated in the 2018 BoE Concurrent Stress Test, agreeing key assumptions and capabilities and approved
the final submission.
Risk and
control
– Reviewed, challenged and approved the update to the Risk Appetite and monitored performance across all risk types.
– Received regular enterprise wide risk updates from the CRO, together with updates on specific risks, such as pensions, cyber security, Brexit.
People and
Culture
– Received updates on issues including HR strategy, talent management and succession planning, gender pay, and diversity and inclusion.
– Considered the annual Whistleblowing Report.– Received updates on culture, considering our long-term strategic direction and assessment findings from the
Banking Standards Board.
Governance – Considered the impact of Ring-Fencing legislation on governance arrangements, and made consequential revisions to the Corporate Governance Framework and UK Group Framework.
– Approved the appointment of a new INED and executive director.– Reviewed, challenged and approved Santander UK’s Annual Report.
Board Committees
The Board delegates certain responsibilities to Board Committees to help discharge its duties, as set out later in this section. The Committees play an essential role in supporting the Board in these duties, providing focused oversight of key areas and aspects of the business.
The role and responsibilities of the Board and Board Committees are set out in formal Terms of Reference. These are reviewed at least annually as part of the review of the Corporate Governance Framework.
During 2018, the annual review focused on considering the impacts of ring-fencing legislation, as well as assessing the consequences of changes to the Code.
Board activities
The Chair, with the CEO and Company Secretary, and with the support of all Directors and senior management, ensure that the Board has an appropriate schedule so that its time is focused on matters of strategic importance to the business and monitoring of risks and controls.
The Board monitors progress against the strategic priorities on a regular basis. it also held its annual Strategy Offsite in June where it gave particular focus to the three year strategy, together with our longer-term plans and aspirations, recognising the internal and external challenges faced in light of our competitive and uncertain operating environment.
To ensure the most effective use of the time at Board meetings, in addition to the delegation of certain responsibilities to the Board Committees, the Board has Board dinners, external speaker lunches and workshops.

ˆ200G2Mlv!2FF1ud60Š200G2Mlv!2FF1ud60
628340 TX 23SANTANDERFORM 20-F (SAN UK PL
02-Mar-2019 05:26 ESTHTMLON
Donnelley Financial EGV sraas0dc 10*ESS 0C
VDI-W7-PFL-133112.9.12.0
bar3f23nn
Page 2 of 2
Santander UK plc 23
– Assessed the performance of the Board, its Committees and the Chair. Received regular updates from Board Committees, via the Chairs.
– Approved revised Board strategic priorities.

ˆ200G2Mlv!2D!fC1giŠ200G2Mlv!2D!fC1gi
628340 TX 24SANTANDERFORM 20-F (SAN UK PL
02-Mar-2019 05:14 ESTHTMLON
Donnelley Financial EGV mania1dc 11*ESS 0C
VDI-W7-PFL-144112.9.12.0
Page 1 of 1
Annual Report 2018 | Governance
Chair’s report on corporate governance continued
Board Committee responsibilities
Key responsibilities
Board
Nomination
Committee
Chair’s report
Read more on p25
Board
Nomination
Committee
– Review the Board’s structure, size and composition, including skills, knowledge, experience and diversity.– Consider succession planning for Directors and Senior Executives.– Identify and nominate candidates to fill Board vacancies as and when they arise.– Assess the performance of the Board.– Review each year whether NEDs have dedicated enough time to their duties to have been effective.– Oversee governance arrangements.
Board Risk
Committee
Chair’s report
Read more on p27
Board Risk
Committee
– Advise the Board on the enterprise wide risk profile, Risk Appetite and strategy.– Review the enterprise wide risk profile through business updates from the First Line of Defence and regular
reports and updates on each key risk type from the Second Line of Defence.– Provide advice, oversight and challenge to embed and maintain a supportive risk culture.– Review the Risk Framework and recommend it to the Board for approval.– Review and approve the key risk type and risk activity frameworks identified in the Risk Framework.– Review the capability to identify and manage new risks and risk types.– Oversee and challenge the day-to-day risk management actions and oversight arrangements and
adherence to risk frameworks and policies.
Board Audit
Committee
Chair’s report
Read more on p33
Board Audit
Committee
– Monitor and review the integrity of the financial reporting.– Keep under review the adequacy and effectiveness of the internal financial controls.– Review the adequacy of Whistleblowing arrangements.– Monitor and review the effectiveness of the Internal Audit function.– Assess the performance of the External Auditors and oversight of their independence.
Board
Responsible
Banking
Committee
Chair’s report
Read more on p39
Board
Responsible
Banking
Committee
– Oversee culture and operational risks relating to conduct, compliance, competition, financial crime and legal matters set within the Risk Appetites and Risk Framework.
– Ensure adequate and effective control processes and policies for conduct and compliance risk, fair customer treatment and customer outcomes.
– Monitor, challenge and support management in its efforts to evolve conduct, culture and ethical standards through sustained effectiveness of Santander UK’s values and nine behaviours.
– Oversee the reputation of Santander UK and how it impacts its brand and market positioning, and the Corporate and Social Responsibility Programme.
Board
Remuneration
Committee
Chair’s report
Read more on p41
Board
Remuneration
Committee
– Approve and oversee the remuneration governance framework.– Oversee implementation of remuneration policies, ensuring they promote sound, effective risk
management.– Consider and approve specific remuneration packages for EDs and other senior management.– Review and approve regulatory submissions in relation to remuneration.– Approve the variable pay pools for EDs and other senior management, including the application of risk
adjustment as appropriate.
24 Santander UK plc
The Board ensures regular contact with senior management through a number of means. These include inviting relevant business and function heads to present to the Board or its Committees on current developments; permitting observers as part of individual senior managers’ development plans; scheduling regular meetings for Committee Chairs to meet with relevant senior managers; site visits by one or more Directors; and topical or technical workshops.
In addition, senior leaders make themselves available to the NEDs throughout the year. The Board also held one of its meetings in our Milton Keynes office where it met with local staff to understand further the work they were doing in relation to Innovation, Keep It Simple Santander (KISS), Financial Crime and Complaints.
Board strategic priorities
The Board aspires to become the best governed bank, supporting Santander UK’s aim to be the best retail and commercial bank in the UK for our people, customers, shareholder and communities, helping people and business prosper and earning their lasting loyalty. In order to achieve this aspiration, the Board revised its strategic priorities including its focus on strategy and transformation, performance monitoring, management succession and responsibility to our stakeholders.
Director inductions and training
The delivery of our tailored NED induction programmes for our new appointments continued through 2018. As a new INED, Julie Chakraverty benefited from a tailored induction programme.
This included meetings with senior management and a number of site visits. All other NEDs have ongoing development plans. The Company Secretary supports the Chair in designing individual inductions for NEDs, which include site visits and cover topics such as strategy, key risks and current issues including the legal and regulatory landscape.
Throughout 2018, we continued to deliver regular workshops for all NEDs to further develop their knowledge and understanding of key business issues including the use of data in financial services, platforms & systems architecture, financial crime, ring-fencing, significant risk transfers and risk models. In 2018 this was supplemented with visits to corporate sites and branches. A summary of the Board’s activities in 2018 is set on page 23.
ˆ200G2Mlv!2ZksYKg*Š200G2Mlv!2ZksYKg*
628340 TX 25SANTANDERFORM 20-F (SAN UK PL
04-Mar-2019 01:10 ESTHTMLON
Donnelley Financial EGV gopad0dc 7*ESS 0C
VDI-W7-PFD-037812.9.12.0
bar3f25 rq
Page 1 of 1
> Corporate governance report
Santander UK plc 25
Board Nomination Committee Chair’s report
The Committee has focused on Succession Planning
and Governance throughout the year
Responsibilities
of the Committee
Read more on p24
We continue to ensure
that gender and all aspects
of diversity remain front
of mind in our succession
planning.”
Committee
membership,
tenure and
attendance
Read more on p47
Shriti Vadera
Chair
26 February 2019
Overview of the year
The Committee met on four occasions
in 2018. The majority of its time was
spent overseeing changes in the
membership of the Board and Board
Committees and on senior
management succession planning
and most of its business was
conducted virtually.
The Committee also reviewed the
collective skills of the Board, time
commitments and Directors’ conflicts
of interest and reviewed governance
arrangements in light of ring-fencing
and changes to the UK Corporate
Governance Code.
Furthermore, the Committee also
undertook an internal review of the
Board and its Committees’
Effectiveness.
Committee membership, Board
changes and Succession Planning
There have been no changes to the
Committee’s membership in 2018.
During the year, Alain Dromer (INED),
Juan Inciarte (a Banco Santander
nominated NED) and Javier San Felix
(Executive Director (ED)) stepped
down from the Board.
As referred to in my report on
Corporate Governance on page 22,
following assessment by the
Committee as to suitability, the
Committee recommended to the Board
the appointments of Julie Chakraverty
(INED) and Susan Allen (ED). Between
them, Susan and Julie add a wealth of
experience in financial services, digital
and innovation, risk management and
retail banking. In making the
appointments, the Committee
considered the overall mix of skills,
experience and diversity on the Board.
The Committee continued to review the
membership of the Board’s
Committees during the course of the
year. This resulted in certain
Committee membership changes as
explained in the respective Committee
reports.
All Committees continue to be chaired
by INEDs and have only INEDs as
members, other than the Board
Nomination Committee and Board
Risk Committee where the
membership has included one Group
nominated NED. The membership of
the Committees is set out on page 47.
The Committee also kept under
review executive succession planning
with a number of changes being
made during the year to the CEO’s
direct reports.
Diversity and inclusion
In 2016, we set an aspirational target
of having 33% women on the Board
by 2020. Following the appointment of
Julie Chakraverty in June 2018 and
Susan Allen in January 2019 we
achieved a ratio of 54%, ahead of
target, although we anticipate that this
will decline during the year.
We also signed up to the HM
Treasury Women in Finance Charter
and aim to create gender balance by
setting a target of 50% (+/-10%)
women in senior roles (excluding
Board members) – by 2021.

ˆ200G2Mlv!24okpqg0Š200G2Mlv!24okpqg0
628340 TX 26SANTANDERFORM 20-F (SAN UK PL
01-Mar-2019 22:35 ESTHTMLON
Donnelley Financial EGV munus0dc 2*ESS 0C
VDI-W7-PFL-126612.9.12.0
Page 1 of 1
Annual Report 2018 | Governance
Board Nomination Committee Chair’s report continued
26 Santander UK plc
We will continue to strive toward gender
balance. Santander UK has committed
to gender targets for our senior female
management population, and we have
embedded these into our Executive
Committee annual performance
objectives.
We will continue to ensure that gender
and all aspects of diversity remain front of
mind in our succession planning. In this
regard, the Board have signed up to the
Business in the Community ‘Race at
Work’ Charter.
Governance
During the year, the Committee has been
focused on governance including
monitoring corporate governance
developments, considering the impacts of
ring-fencing and conducting the annual
review of our Corporate Governance
Framework.
In 2018, the Committee considered the
changes to the 2016 UK Corporate
Governance Code and gave particular
focus to the recommendations in respect
of Employee engagement methods. Plans
are being developed to enable the Board
to have more dialogue with employees on
topics requiring direct feedback such as
the Board exploring emerging subjects of
interest with a group of volunteer
employees via virtual or face-to-face focus
groups.
The Committee also considered changes
to our Corporate Governance Framework
and UK Group Framework to ensure
compliance with ring-fencing rules.
Annual review of director interests,
time commitment, conflicts of interest
and fees
During the year, the Committee continued
to review any potential conflicts of interest
to ensure any conflicts are managed
appropriately and in compliance with CRD
IV and ring-fencing requirements. The time
commitments of the Directors were also
reviewed to ensure they have sufficient
time available to discharge their
responsibilities and to be effective
members of the Board. The review of time
commitments showed that Directors are
able to dedicate sufficient time to their
commitments on the Board and Board
Committees.
Santander UK’s Articles of Association
contain provisions that allow the Board to
consider and, if it sees fit, to authorise
situational conflicts. The Board confirms
that such powers have operated effectively
and that a formal system for Directors to
declare their interests and for the
non-conflicted Directors to authorise
situational conflicts continues to be in
place. Any authorisations given are
recorded by the Company Secretary.
Board Effectiveness (actions and
review)
During 2018, the Committee continued to
review progress against the actions from
the 2016 and 2017 evaluations, which
concluded that the performance of the
Board, its Committees, the Chair and
each of the Directors continues to be
effective.
In addition, during the year, the Board
conducted an internally facilitated
evaluation of its own performance and
that of its Committees. Individual
Directors’ assessments were also
conducted and the Senior Independent
Director undertook his twice-yearly
assessment of the performance of the
Chair.
The performance assessment results
show that the Committee, the Board and
its Committees continue to operate
effectively. The actions arising from the
review include rebalancing time spent on
strategic, business performance,
regulatory and other matters following
implementation of ring-fencing, together
with further enhancement of Board
reporting and co-ordination of Board
Committee agendas.
The Board intends to comply with the UK
Corporate Governance Code guidance
that the evaluation should be externally
facilitated at least every three years and
expects to commission the next externally
facilitated review in 2020.
Priorities for 2019
Over the next year we will continue to
work on talent and succession planning, in
particular on executive and senior
management succession and NEDs’
continuing development.
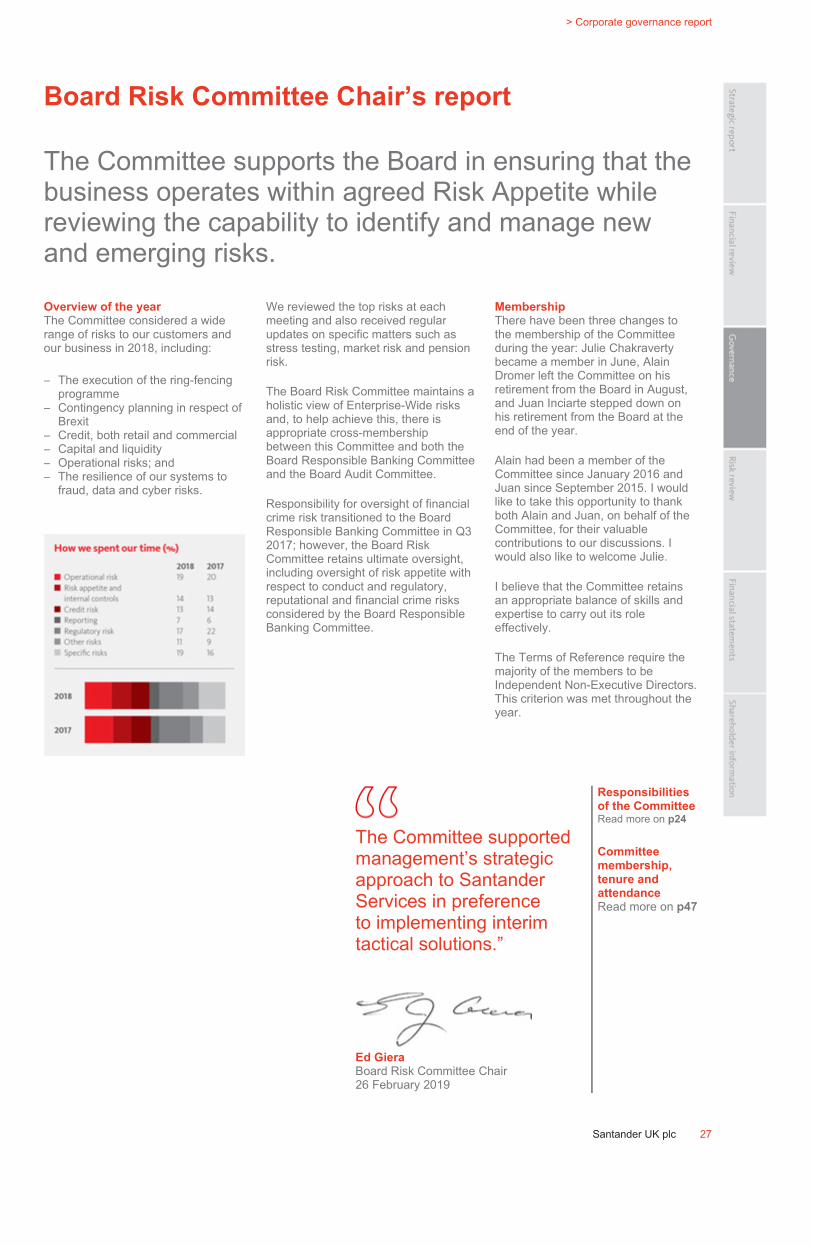
ˆ200G2Mlv!2ZoNLTgMŠ200G2Mlv!2ZoNLTgM
628340 TX 27SANTANDERFORM 20-F (SAN UK PL
04-Mar-2019 01:17 ESTHTMLON
Donnelley Financial EGV annas1dc 6*ESS 0C
VDI-W7-PFD-029812.9.12.0
bar3 f27a f27n rq
Page 1 of 1
> Corporate governance report
Santander UK plc 27
Board Risk Committee Chair’s report
The Committee supports the Board in ensuring that the
business operates within agreed Risk Appetite while
reviewing the capability to identify and manage new
and emerging risks.
Responsibilities
of the Committee
Read more on p24
The Committee supported
management’s strategic
approach to Santander
Services in preference
to implementing interim
tactical solutions.”
Ed Giera
Board Risk Committee Chair
26 February 2019
Committee
membership,
tenure and
attendance
Read more on p47
Overview of the year
The Committee considered a wide
range of risks to our customers and
our business in 2018, including:
– The execution of the ring-fencing
programme
– Contingency planning in respect of
Brexit
– Credit, both retail and commercial
– Capital and liquidity
– Operational risks; and
– The resilience of our systems to
fraud, data and cyber risks.
We reviewed the top risks at each
meeting and also received regular
updates on specific matters such as
stress testing, market risk and pension
risk.
The Board Risk Committee maintains a
holistic view of Enterprise-Wide risks
and, to help achieve this, there is
appropriate cross-membership
between this Committee and both the
Board Responsible Banking Committee
and the Board Audit Committee.
Responsibility for oversight of financial
crime risk transitioned to the Board
Responsible Banking Committee in Q3
2017; however, the Board Risk
Committee retains ultimate oversight,
including oversight of risk appetite with
respect to conduct and regulatory,
reputational and financial crime risks
considered by the Board Responsible
Banking Committee.
Membership
There have been three changes to
the membership of the Committee
during the year: Julie Chakraverty
became a member in June, Alain
Dromer left the Committee on his
retirement from the Board in August,
and Juan Inciarte stepped down on
his retirement from the Board at the
end of the year.
Alain had been a member of the
Committee since January 2016 and
Juan since September 2015. I would
like to take this opportunity to thank
both Alain and Juan, on behalf of the
Committee, for their valuable
contributions to our discussions. I
would also like to welcome Julie.
I believe that the Committee retains
an appropriate balance of skills and
expertise to carry out its role
effectively.
The Terms of Reference require the
majority of the members to be
Independent Non-Executive Directors.
This criterion was met throughout the
year.

ˆ200G2Mlv!2Zo4K0gpŠ200G2Mlv!2Zo4K0gp
628340 TX 28SANTANDERFORM 20-F (SAN UK PL
04-Mar-2019 01:17 ESTHTMLON
Donnelley Financial EGV annas1dc 9*ESS 0C
VDI-W7-PFD-029812.9.12.0
Page 1 of 1
Annual Report 2018 | Governance
Board Risk Committee Chair’s report continued
Meeting our key responsibilities in 2018
The Committee addressed our key responsibilities relating to Risk Appetite and the Risk Framework, as well as our oversight of stress testing and liquidity, as set out below, together with a selection of challenges raised relating to certain risk categories. For more on our responsibilities relating to risk management and internal controls see page 32.
Significant areas of focus
Area of focus Action taken by the Board Risk Committee Outcome
Risk Appetite – Considered a number of changes proposed to the Board’s Risk Appetite Statement as part of the Annual Risk Appetite Review.
– Noted some material reductions to certain credit limits and challenged management on its proposal to increase the appetite in respect of the renewable energy portfolio, and requested assurance in respect of asset valuations given the lack of history in the sector.
– Received management’s proposals for how the Risk Appetite would need to be updated to reflect ring-fencing implementation.
– Reviewed management’s minor adjustments to underwriting criteria to enable greater utilisation of existing risk appetite.
– Monitored management’s progress on addressing Financial Crime risk exposure relative to risk appetite.
– Following challenge, we expressed confidence that management was cognisant of the risks and issues relating to the renewables sector.
– Recommended management’s proposed amendments to Risk Appetite to the Board for approval.
– Asked management to progress recalibration of risk appetite and return in H1 2019.
– Confirmed that utilisation of mortgage credit risk capacity remained within risk appetite.
– Assessed management’s progress relative to Risk Appetite in the context of the Financial Crime Transformation Programme.
For more see page 57
Risk Framework – Received an update following the annual certification process, and assessed the extent to which the Risk Framework had been effectively implemented and embedded across the business.
– Received management’s proposals for how the Risk Framework would need to be updated to reflect the implementation of Banking Reform in 2019.
– Noted the Risk function’s confirmation that the Risk Framework was sufficiently understood and implemented across the business and that there was transparency and ownership of any areas for improved compliance.
– Recommended the proposed changes to the Board for approval.
For more see pages 53 to 56
Stress testing – Monitored the 2018 Bank of England Concurrent Stress Test exercise, and received updates throughout the process. We questioned the ability of our systems to process data seamlessly and discussed the additional complexity created by the IFRS 9 model implementation.
– Considered the results of the stress test both on an IFRS 9 transitional basis and on an IFRS 9 basis without transitional arrangements.
– Received a specific paper, produced by the Risk team, with details of risk management in stress testing.
– Noted that risks associated with Santander UK’s suite of stress testing models had generally improved across the last year; however, the introduction of IFRS 9 had been a material driver of stress, and management aligned the models, approaches and judgements as far as possible with the approach in 2017, to assess the impact of IFRS 9.
– Questioned whether sufficient resource was planned and available for the ongoing multi-year effort to improve Santander UK’s suite of stress testing models.
– Recommended the governance arrangements, process, controls and stress test results to the Board for approval and onward submission to the PRA.
– Committee members were provided with greater insight to review the most significant models.
– Supported management on the allocation of resources for planned stress testing model enhancements and requested a holistic view of the resource requirements as part of the next update.
For more see page 58
28 Santander UK plc

ˆ200G2Mlv!2ZyuW%g2Š200G2Mlv!2ZyuW%g2
628340 TX 29SANTANDERFORM 20-F (SAN UK PL
04-Mar-2019 01:28 ESTHTMLON
Donnelley Financial EGV annas1dc 7*ESS 0C
VDI-W7-PFD-029812.9.12.0
bar3
Page 1 of 2
> Corporate governance report
Area of focus Action taken by the Board Risk Committee Outcome
Ring-fencing – Received frequent updates on the ring-fencing programme both as part of the Enterprise Wide Risk Management Reports and separately. These updates focused on the ring-fencing programme’s top risks and mitigating actions, including operational, legal, execution and regulatory risks related to completion of the programme.
– Reviewed the options in respect of the Crown Dependencies business comprising branches in Jersey and Isle of Man and their relative merits from a regulatory perspective.
– Considered proposals for how both the Risk Framework and Risk Appetite would need to be updated to reflect ring-fencing.
– Sought assurance that management would conduct shadow monitoring of the proposed changes to the Risk Appetite in the run-up to formal implementation of ring-fencing.
– Considered the Ring-Fenced Body Permitted Exceptions Policy, focusing on the governance and waterfall of attestation processes. We questioned management on the challenges of applying the policy in practice, including how the process for transaction monitoring could be ‘dry run’. We also noted the risk of complacency developing should the policy have to be applied too frequently on the introduction of ring-fencing in 2019.
– In the course of monitoring progress on the execution of the ring-fencing programme, we:– Recommended the changes to the
Risk Appetite and Risk Framework to the Board.
– Recommended the Ring-Fenced Body Permitted Exceptions Policy to the Board for approval.
For more see page 211
Santander Services – Sought assurance from management that the pace of change relating to digitalisation and systems improvement was appropriate, and requested timely escalation of material changes and responses to material incidents.
– Discussed Santander UK’s role with other firms in working with the regulator to develop the technology for blockchain reporting.
– Received updates on cyber risk and the strategy and risk management relating to cloud usage.
– Considered the execution risks, and benefits, associated with a migration away from the existing technology infrastructure and emphasised the need for both Board-level involvement as well as alignment with Banco Santander group in the associated debate and decisions impacting data management and key systems architecture.
– Questioned management on the risks to the execution of the transformation programme related to recruitment of skilled staff.
– Considered the increased third party risks that might arise as partnering arrangements increased on infrastructure, data and cloud migration.
– Received updates from the Chief Data Officer who advised that progress continued in aligning data strategy with the increased focus on efficiency, robustness and risk management and noted the need for ongoing investment.
– Agreed that this additional information would be included in the Enterprise- Wide Risk Management Report in future.
– Requested a further update on the risks of significant projects, such as the transition to new architectures so that the Committee had a holistic view of significant risks.
– Supported management’s strategic approach to Santander Services in preference to implementing interim tactical solutions.

ˆ200G2Mlv!2ZyuW%g2Š200G2Mlv!2ZyuW%g2
628340 TX 29SANTANDERFORM 20-F (SAN UK PL
04-Mar-2019 01:28 ESTHTMLON
Donnelley Financial EGV annas1dc 7*ESS 0C
VDI-W7-PFD-029812.9.12.0
bar3
Page 2 of 2
Santander UK plc 29
Brexit – Received updates on management’s contingency plans as we continued to monitor the risks and potential impact to Santander UK of the negotiation of terms for the Withdrawal Agreement setting out the basis on which the UK intends to leave the EU.
– Discussed access to financial markets infrastructure, most notably derivatives clearing. In particular, we discussed the significant risks in respect of the treatment of back-book derivatives in the event that London-based clearing is not recognised by the European authorities.
– Considered data transmission, processing and storage, access to payment services and contract continuity.
– Questioned management on any actions that may be needed in the relatively short term, including contract re-papering, as well as the potential macro-economic risks.
– Emphasised the need for coordination with Banco Santander on any actions taken impacting customers and our employees working in the UK as EU nationals, in particular.
– We continue to monitor political developments and to review and challenge management’s contingency plans for Brexit, including a scenario for UK withdrawal without Parliament supporting a negotiated Withdrawal Agreement to mitigate risk exposures.
For more, see Our Key Operational Risks in the Risk Review.
ˆ200G2Mlv!27NW2W6=Š200G2Mlv!27NW2W6=
628340 TX 30SANTANDERFORM 20-F (SAN UK PL
02-Mar-2019 00:54 ESTHTMLON
Donnelley Financial EGV marik1dc 7*ESS 0C
VDI-W7-PFL-146612.9.12.0
Page 1 of 1
Annual Report 2018 | Governance
Board Risk Committee Chair’s report continued
Oversight and advice to the Board on Santander UK’s current risk exposure and future risk strategy
In 2018, we reviewed Santander UK’s exposure to the risks outlined below and analysed emerging themes, including regulatory, macro-economic and global risks, which could affect Santander UK’s ability to achieve its strategic goals.
Risk Action taken by the Board Risk Committee Outcome
Pension risk – Considered papers on investment strategy and governance and confirmed the status of all the governance actions presented to the Committee in September 2017.
– Sought assurance around the effectiveness of the new pension governance arrangements.
– Noted the agreement in principle with the trustees to continue along the path of de-risking the pension plans, inclusive of adjusting asset allocation over time, and increasing hedging of interest rate risk, and adjusting the hedge portfolio for inflation and equity risks, respectively.
– Queried management’s confidence in the changes in strategy intended to reduce the funding deficit at risk given a decrease in market risk and an increase in manager risk.
– Confirmed and supported the continued development of the pension investment portfolio transition and risk management strategies, and governance arrangements with the pension trustees. Management noted the initial phase of the portfolio transition strategy had been negotiated with the trustees, and also noted the manager selection process involved.
For more see pages 114 to 116
Credit risk – Received updates on various corporate exposures and, in relation to Carillion plc, noted the key learning points from management’s assessment of corporate credit monitoring and approval processes, operational procedures in the delivery of supply chain financing and receivables purchase programme products.
– Reviewed Santander UK’s exposure to corporate leveraged loans in accordance with regulatory concerns in the UK and internationally with respect to the status of the credit cycle, market conditions, and the risk of potential economic shocks.
– In respect of retail unsecured credit, we considered the status and management of regulatory, operational and conduct risks in connection with the delivery of positive customer journeys and outcomes.
– Received updates on the retail mortgage book, including Interest Only mortgages, and we questioned the basis for management’s decision making in light of the credit cycle, as well as in relation to tactical competitive adjustments in the ordinary course of business.
– Noted management’s plans to introduce new retail mortgage products in response to market and regulatory developments.
– Monitored utilisation of existing risk appetite and requested that the Committee has early and comprehensive assessments from Line 2 of any material adjustments to credit policy or risk limits recommended by management in connection with the update of the three year plan.
– Counselled management on the need for a comprehensive approach with the Banco Santander Risk function, and also to recognise the broader credit risks, including concentrations, which might evolve from industry or market responses to emerging risks, including climate change.
For more see pages 59 to 95
Strategic risk – Discussed the strategic threats to Santander UK’s capacity to defend and build further franchise value.
– Considered the advantages and benefits of developing specific scenarios around certain strategic risks, in addition to assigning risk metrics.
– Challenged management to include a longer term perspective in developing the ‘Top Risk’ log for each Enterprise- Wide Risk Management Report, and to avoid responding to long-term risks with short-term solutions.
For more see page 125
Liquidity risk – Considered the 2018 Internal Liquidity Adequacy Assessment Process (ILAAP) and questioned management about the flexibility and alacrity of our liquidity reporting.
– Agreed to recommend the 2018 ILAAP to the Board for approval.
For more see pages 103 to 105
30 Santander UK plc

ˆ200G2Mlv!27NXCkg9Š200G2Mlv!27NXCkg9
628340 TX 31SANTANDERFORM 20-F (SAN UK PL
02-Mar-2019 00:54 ESTHTMLON
Donnelley Financial EGV marik1dc 6*ESS 0C
VDI-W7-PFL-146612.9.12.0
bar3
Page 1 of 1
> Corporate governance report
Santander UK plc 31
Risk Action taken by the Board Risk Committee Outcome
Capital risk – Considered, from a capital risk perspective, dividends payable on AT1 securities, and the ordinary dividends proposed to be paid by Santander UK plc at mid-year and year-end respectively.
– Reviewed the Internal Capital Adequacy Assessment Process (ICAAP) and noted material enhancements to the previous process made by management.
– Noted the impacts of the application of IFRS 9.– Sought clarity on the key drivers to volatility in the
CET1 ratio and considered management’s proposals for various risk and capital management initiatives, including an application for a new internal ratings based (IRB) regulatory capital model for the mortgage book, as well as the securitisation of certain assets.
– Received updates on progress in respect of the risk management initiatives proposed during the year, and challenged management on execution, operating, and regulatory risks.
– Recommended the payment of dividends to the Board for approval.
– Comments and challenges received from Committee members were considered by management and incorporated into the final draft ICAAP.
– Agreed to recommend the ICAAP to the Board for approval.
– Agreed to recommend the plans for potential risk and capital management actions to the Board for approval.
– Requested that management develop an aggregate risk assessment of the entire securitisation programme for regular review.
For more see pages 111 to 113
Operational risk – Noted the design and implementation of the Operational Risk Framework, the downward trend of operational losses and management’s shift in focus toward business continuity as opposed to appetite for financial loss in respect of operational resiliency.
– Noted management’s development of a risk appetite measure for change capacity, including appropriate metrics to define the boundaries for acceptable practice when working to an ‘agile’ change methodology.
– Received regular updates on management’s strategies for mitigating cyber risk and third party risk, as well as on crystallised operational risk incidents impacting other companies, and considered how these had impacted our own customers, as well as any lessons that could be learned.
– Highlighted the need for strong programme management disciplines around change, considered how well our key suppliers might hold up under stress, and commented on the usefulness of KPIs and service availability indices.
– Noted an update on the status of the General Data Protection Regulation (GDPR) Programme.
– Monitored the impacts on operational risk and key controls associated with management’s execution of the high volume of significant transformation and remediation programmes.
For more see pages 120 to 123
Model risk – Considered an update on the regular monitoring of capital adequacy models.
– Received a paper on the regulatory review of our proposed new mortgage IRB model. We debated the challenges associated with differing regulatory perspectives on the best approach to tackle through-the-cycle capital requirements, as well as the possibility of having to run two approaches in tandem.
– The Committee will continue to monitor progress in respect of regulatory approval for the mortgage IRB model, and request evidence of appropriate model types, assumptions and calibration.

ˆ200G2Mlv!2H5$YYgÆŠ200G2Mlv!2H5$YYg˘
628340 TX 32SANTANDERFORM 20-F (SAN UK PL
02-Mar-2019 07:14 ESTHTMLON
Donnelley Financial EGV yuraa0dc 5*ESS 0C
VDI-W7-PFL-140512.9.12.0
Page 1 of 1
Annual Report 2018 | Governance
Board Risk Committee Chair’s report continued
32 Santander UK plc
Effectiveness of risk management
system and internal controls
Following the H2 2017 Risk and Control
Self Assessment (RCSA), the Committee
received updates on the risk and
exposure issues reported through the
2018 RCSA processes. Based on those
assessments, we considered that overall
critical and high risks had decreased (via
a mitigation and reassessment process)
and that the remaining high risks related
primarily to addressing residual IT
obsolescence. While the self-assessment
acknowledged a number of control
weaknesses, in particular for Financial
Crime, we were satisfied that appropriate
actions were planned and being
progressed by management to address
these. We will continue to monitor the
position.
We noted an increase in reported risks,
partly due to increased reporting across
the business as a result of improved
systems, and noted further the need for
additional classification improvements.
The Committee was also advised that all
operational controls improved following
system enhancements but noted the need
to make further progress.
In addition to the RCSA updates, during
2018 the Committee also reviewed and
discussed the continuation of
management’s dialogue with the regulator
regarding enhancements to core areas of
the corporate credit risk management
infrastructure in the wake of the
regulator’s reviews of certain corporate
credit portfolios and the corporate credit
risk management function in 2017 and
2018, respectively.
The Committee concurred with the
regulator’s expectation of a
comprehensive approach reflecting
appropriate prioritisation of investment in
management’s strategic plan. The
Committee will continue to review
management’s reports on the execution of
the overall risk infrastructure investment
programme, as well as the status of
management’s regulatory dialogue, and
will request management to evidence the
effectiveness of controls and
improvements driven by the programme
over the investment period.
Change Programme
The scale, scope and critical nature of the
various change initiatives undertaken by
Santander UK to meet regulatory and other
requirements continued to pose significant
risk.
The Committee expressed concern at
management’s capacity to effectively
resource and execute the number of
strategic transformation programmes in
progress concurrently with the execution of
Banking Reform and a range of other
mandatory regulatory initiatives. The
Committee considered that in-house project
management improvements mitigated this
risk and the development of an agile work
environment is continuing to enhance the
organisation’s capacity to adapt.
Effectiveness of the Committee
As noted above, the Committee
membership saw two members leave and
one member join during the year. I believe
that the Committee has an appropriate mix
of skills to enable it to operate effectively
and to offer appropriate challenge and
support to management.
In January 2019, we reviewed the
Committee’s responsibilities as set out in
the Terms of Reference and confirmed that
the Committee had discharged its
responsibilities in full in 2018.
Full terms of reference can be found on our
website at www.aboutsantander.co.uk and
a summary is given on page 24.
We continued to receive regular reports on
enterprise wide risk and to call risk owners
to our meetings to account for their
progress. We have benefited from the
perspectives of each of the three lines of
defence to gain assurance and confirm
progress in respect of material initiatives
intended to mitigate key risk exposures.
These actions are examples of how we
have looked to inform our debate and
decision making in the year and contribute
to our effectiveness as a Committee.
Priorities for 2019
The Committee will continue to focus on
the risks and uncertainties surrounding
Brexit. We will also continue to monitor
Santander UK’s capital adequacy and to
assess credit risk in changing economic
conditions.
Cyber, third party and other IT-related
operational risks will continue to be a
priority, including the adoption of cloud
services.
We also expect to monitor closely
continuing developments in areas such as
model risk, pension risk, and
enhancements to Santander UK’s risk
infrastructure.
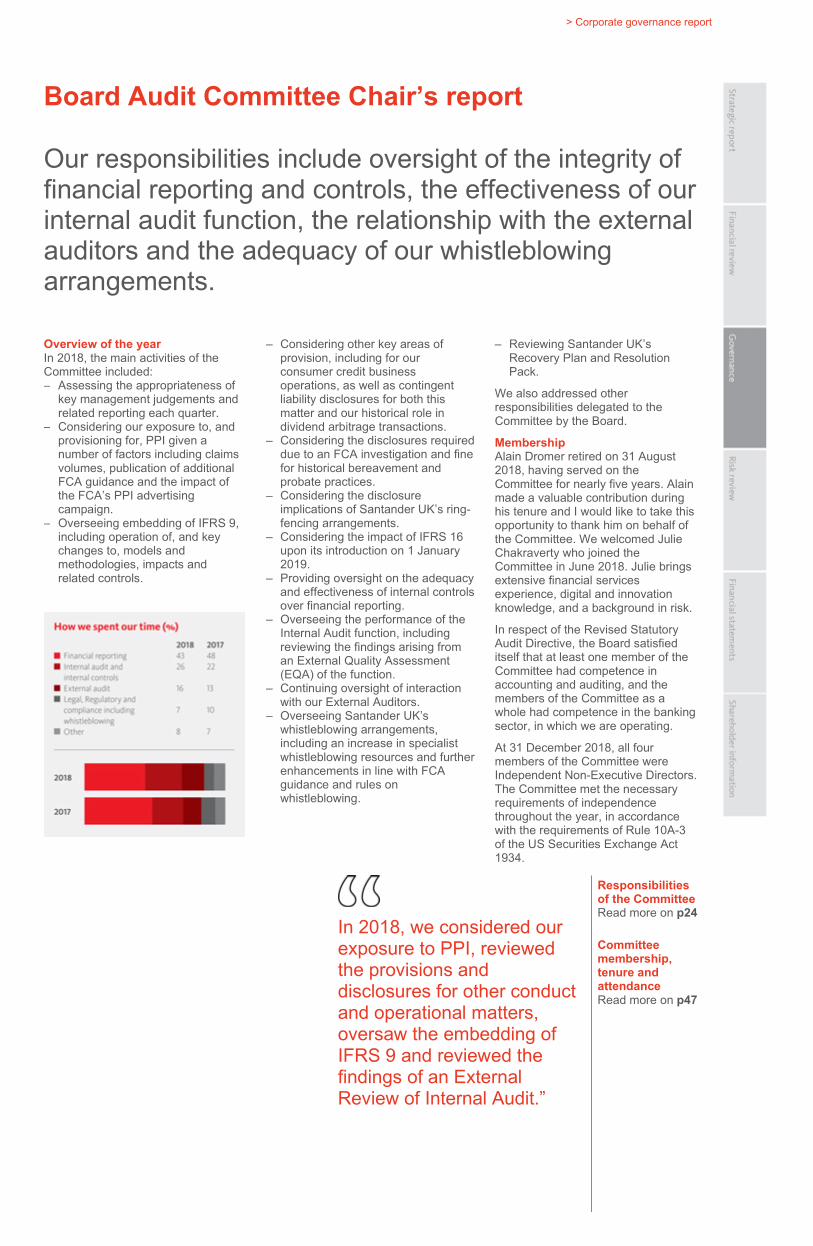
ˆ200G2Mlv!2Zkupqg!Š200G2Mlv!2Zkupqg!
628340 TX 33SANTANDERFORM 20-F (SAN UK PL
04-Mar-2019 01:10 ESTHTMLON
Donnelley Financial EGV gopad0dc 10*ESS 0C
VDI-W7-PFD-037812.9.12.0
bar3 bq f33a f33n
Page 1 of 2
> Corporate governance report
Board Audit Committee Chair’s report
Our responsibilities include oversight of the integrity of
financial reporting and controls, the effectiveness of our
internal audit function, the relationship with the external
auditors and the adequacy of our whistleblowing
arrangements.
In 2018, we considered our
exposure to PPI, reviewed
the provisions and
disclosures for other conduct
and operational matters,
oversaw the embedding of
IFRS 9 and reviewed the
findings of an External
Review of Internal Audit.”
Responsibilities
of the Committee
Read more on p24
Committee
membership,
tenure and
attendance
Read more on p47
Overview of the year
In 2018, the main activities of the
Committee included:
– Assessing the appropriateness of
key management judgements and
related reporting each quarter.
– Considering our exposure to, and
provisioning for, PPI given a
number of factors including claims
volumes, publication of additional
FCA guidance and the impact of
the FCA’s PPI advertising
campaign.
– Overseeing embedding of IFRS 9,
including operation of, and key
changes to, models and
methodologies, impacts and
related controls.
– Considering other key areas of
provision, including for our
consumer credit business
operations, as well as contingent
liability disclosures for both this
matter and our historical role in
dividend arbitrage transactions.
– Considering the disclosures required
due to an FCA investigation and fine
for historical bereavement and
probate practices.
– Considering the disclosure
implications of Santander UK’s ring-
fencing arrangements.
– Considering the impact of IFRS 16
upon its introduction on 1 January
2019.
– Providing oversight on the adequacy
and effectiveness of internal controls
over financial reporting.
– Overseeing the performance of the
Internal Audit function, including
reviewing the findings arising from
an External Quality Assessment
(EQA) of the function.
– Continuing oversight of interaction
with our External Auditors.
– Overseeing Santander UK’s
whistleblowing arrangements,
including an increase in specialist
whistleblowing resources and further
enhancements in line with FCA
guidance and rules on
whistleblowing.
– Reviewing Santander UK’s
Recovery Plan and Resolution
Pack.
We also addressed other
responsibilities delegated to the
Committee by the Board.
Membership
Alain Dromer retired on 31 August
2018, having served on the
Committee for nearly five years. Alain
made a valuable contribution during
his tenure and I would like to take this
opportunity to thank him on behalf of
the Committee. We welcomed Julie
Chakraverty who joined the
Committee in June 2018. Julie brings
extensive financial services
experience, digital and innovation
knowledge, and a background in risk.
In respect of the Revised Statutory
Audit Directive, the Board satisfied
itself that at least one member of the
Committee had competence in
accounting and auditing, and the
members of the Committee as a
whole had competence in the banking
sector, in which we are operating.
At 31 December 2018, all four
members of the Committee were
Independent Non-Executive Directors.
The Committee met the necessary
requirements of independence
throughout the year, in accordance
with the requirements of Rule 10A-3
of the US Securities Exchange Act
1934.

ˆ200G2Mlv!2Zkupqg!Š200G2Mlv!2Zkupqg!
628340 TX 33SANTANDERFORM 20-F (SAN UK PL
04-Mar-2019 01:10 ESTHTMLON
Donnelley Financial EGV gopad0dc 10*ESS 0C
VDI-W7-PFD-037812.9.12.0
bar3 bq f33a f33n
Page 2 of 2
Santander UK plc 33
Chris Jones
Board Audit Committee Chair
26 February 2019
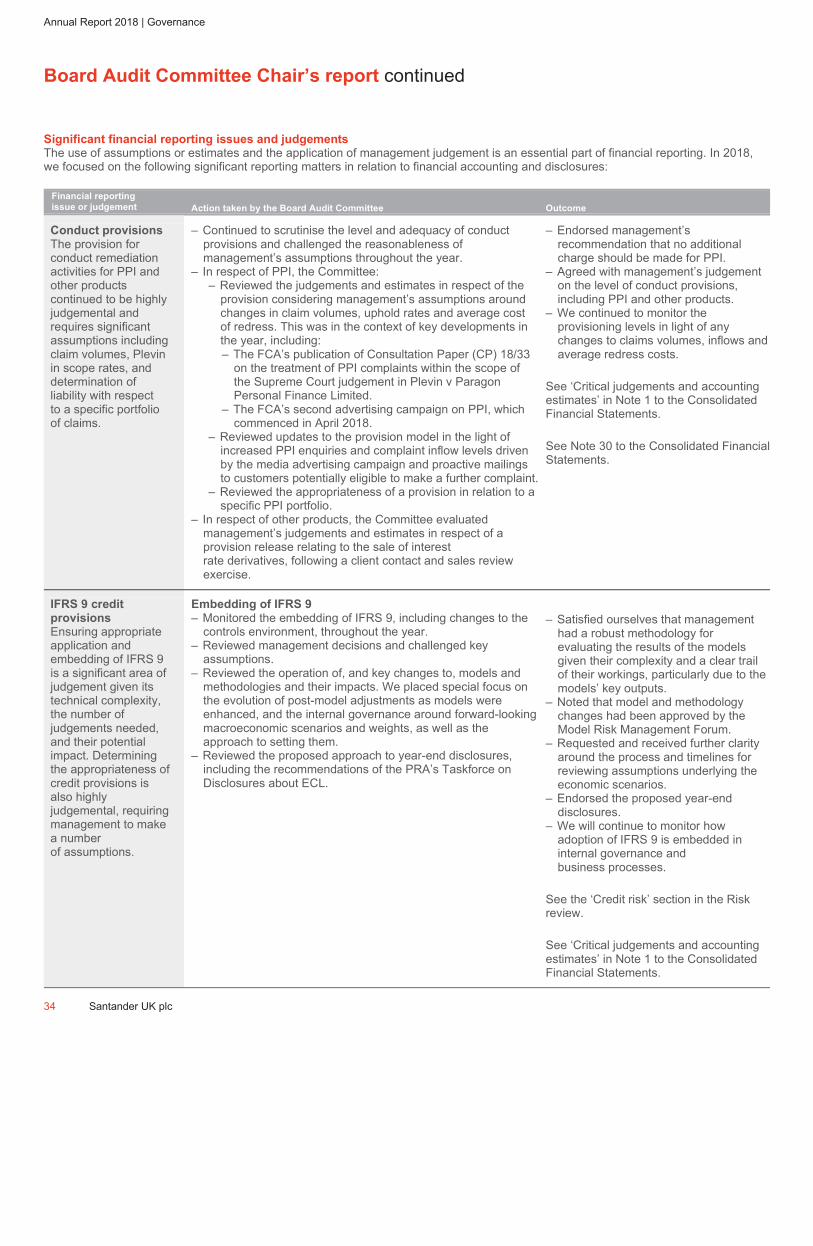
ˆ200G2Mlv!2BJVFcgÅŠ200G2Mlv!2BJVFcg¯
628340 TX 34SANTANDERFORM 20-F (SAN UK PL
02-Mar-2019 03:12 ESTHTMLON
Donnelley Financial EGV marik1dc 4*ESS 0C
VDI-W7-PFL-146612.9.12.0
Page 1 of 1
Annual Report 2018 | Governance
Board Audit Committee Chair’s report continued
Significant financial reporting issues and judgements
The use of assumptions or estimates and the application of management judgement is an essential part of financial reporting. In 2018, we focused on the following significant reporting matters in relation to financial accounting and disclosures:
Financial reporting
issue or judgement Action taken by the Board Audit Committee Outcome
Conduct provisions
The provision for conduct remediation activities for PPI and other products continued to be highly judgemental and requires significant assumptions including claim volumes, Plevin in scope rates, and determination of liability with respect to a specific portfolio of claims.
– Continued to scrutinise the level and adequacy of conduct provisions and challenged the reasonableness of management’s assumptions throughout the year.
– In respect of PPI, the Committee:– Reviewed the judgements and estimates in respect of the
provision considering management’s assumptions around changes in claim volumes, uphold rates and average cost of redress. This was in the context of key developments in the year, including:– The FCA’s publication of Consultation Paper (CP) 18/33
on the treatment of PPI complaints within the scope of the Supreme Court judgement in Plevin v Paragon Personal Finance Limited.
– The FCA’s second advertising campaign on PPI, which commenced in April 2018.
– Reviewed updates to the provision model in the light of increased PPI enquiries and complaint inflow levels driven by the media advertising campaign and proactive mailings to customers potentially eligible to make a further complaint.
– Reviewed the appropriateness of a provision in relation to a specific PPI portfolio.
– In respect of other products, the Committee evaluated management’s judgements and estimates in respect of a provision release relating to the sale of interest rate derivatives, following a client contact and sales review exercise.
– Endorsed management’s recommendation that no additional charge should be made for PPI.
– Agreed with management’s judgement on the level of conduct provisions, including PPI and other products.
– We continued to monitor the provisioning levels in light of any changes to claims volumes, inflows and average redress costs.
See ‘Critical judgements and accounting estimates’ in Note 1 to the Consolidated Financial Statements.
See Note 30 to the Consolidated Financial Statements.
IFRS 9 credit
provisions
Ensuring appropriate application and embedding of IFRS 9 is a significant area of judgement given its technical complexity, the number of judgements needed, and their potential impact. Determining the appropriateness of credit provisions is also highly judgemental, requiring management to make a number of assumptions.
Embedding of IFRS 9
– Monitored the embedding of IFRS 9, including changes to the controls environment, throughout the year.
– Reviewed management decisions and challenged key assumptions.
– Reviewed the operation of, and key changes to, models and methodologies and their impacts. We placed special focus on the evolution of post-model adjustments as models were enhanced, and the internal governance around forward-looking macroeconomic scenarios and weights, as well as the approach to setting them.
– Reviewed the proposed approach to year-end disclosures, including the recommendations of the PRA’s Taskforce on Disclosures about ECL.
– Satisfied ourselves that management had a robust methodology for evaluating the results of the models given their complexity and a clear trail of their workings, particularly due to the models’ key outputs.
– Noted that model and methodology changes had been approved by the Model Risk Management Forum.
– Requested and received further clarity around the process and timelines for reviewing assumptions underlying the economic scenarios.
– Endorsed the proposed year-end disclosures.
– We will continue to monitor how adoption of IFRS 9 is embedded in internal governance and business processes.
See the ‘Credit risk’ section in the Risk review.
See ‘Critical judgements and accounting estimates’ in Note 1 to the Consolidated Financial Statements.
34 Santander UK plc

ˆ200G2Mlv!2BF#L7gNŠ200G2Mlv!2BF#L7gN
628340 TX 35SANTANDERFORM 20-F (SAN UK PL
02-Mar-2019 03:10 ESTHTMLON
Donnelley Financial EGV marik1dc 5*ESS 0C
VDI-W7-PFL-146612.9.12.0
bar3
Page 1 of 2
> Corporate governance report
Financial reporting
issue or judgement Action taken by the Board Audit Committee Outcome
IFRS 9 credit
provisions
continued
Retail credit provisions
– Reviewed detailed reports from management throughout the year analysing the proposed provisions.
– Considered proposals on refinements to the assumptions underpinning the mortgage provision models and the impacts on the provisions required.
– Agreed with management’s judgement on the level of retail credit provisions, concluding that provisions remain robust and assumptions were appropriate.
– We will continue to monitor retail credit provisions.
See ‘Critical judgements and accounting estimates’ in Note 1 to the Consolidated Financial Statements.
See Note 14 to the Consolidated Financial Statements.
Corporate credit provisions
– Reviewed detailed reports from management throughout the year to satisfy ourselves that any impairment triggers had been correctly identified.
– Considered reports on specific cases, as well as a review of the rest of the portfolio to identify other cases that could potentially be at risk.
– Discussed other exposures and satisfied ourselves that there had been no impairment triggers in the year that warranted significant adjustment to provision levels.
– Agreed with management’s judgement on the level of corporate credit provisions, concluding that provisions remain robust and assumptions were appropriate.
– We will continue to monitor corporate credit provisions.
See ‘Critical judgements and accounting estimates’ in Note 1 to the Consolidated Financial Statements.
See Note 14 to the Consolidated Financial Statements.
Pension
obligations
Significant judgement is required on the key assumptions underlying defined benefit pension obligation calculations. Outcomes remain inherently uncertain.
– Reviewed detailed reports throughout the year on the key assumptions underlying the defined benefit pension obligation calculations. We recognised that, although some assumptions are based on observable data, others continue to require significant judgement.
– Noted that actuaries continue to help assess our pension obligations due to the calculations’ complexity.
– Reviewed enhancements to the discount rate assumption methodology.
– Reviewed the controls in place around the quality of some key data used to calculate pension liabilities.
– Reviewed the proposed change in respect of equalising pension benefits for men and women in relation to Guaranteed Minimum Pensions (GMP) in the context of the High Court judgement in October 2018 concluding that defined benefit schemes should equalise pension benefits in this regard.
– Monitored the continued appropriateness of the methodology and reviewed the inflation, discount and mortality rates applied at the year-end.
– Requested and received information on the level of debate and challenge concerning the pension models and proposed changes to the actuarial assumptions.
– Noted that the discount rate assumption methodology had been reviewed at the Pension Risk Forum and reviewed by Independent Model Risk Review.
– Agreed with management’s approach to the assumptions applied, including changes made in 2018.
– Agreed with management’s approach to recognising the impact of GMP equalisation and noted that the full exercise is expected to take time due to its complexity.
– Endorsed the proposed quantitative and qualitative year-end disclosures in respect of pension obligations.
See ‘Critical judgements and accounting estimates’ in Note 1 to the Consolidated Financial Statements.
See ‘Pension risk management’ in the Risk Review.
See Note 31 to the Consolidated Financial Statements.

ˆ200G2Mlv!2BF#L7gNŠ200G2Mlv!2BF#L7gN
628340 TX 35SANTANDERFORM 20-F (SAN UK PL
02-Mar-2019 03:10 ESTHTMLON
Donnelley Financial EGV marik1dc 5*ESS 0C
VDI-W7-PFL-146612.9.12.0
bar3
Page 2 of 2
Santander UK plc 35
Ring-fencing
Ensuring appropriate implementation of UK ring-fencing legislation is a significant area of judgement given its technical complexity and potential impact.
– Monitored the implementation of Santander UK’s ring-fencing plans throughout the year, with a specific focus on the financial reporting implications.
– Reviewed the proposed approach to year-end disclosures.
– Noted the successful implementation of UK ring-fencing legislation in advance of the legal deadline.
– Endorsed the proposed year-end disclosures.
See Note 43 to the Consolidated Financial Statements.
Other areas – Considered the provision in relation to our consumer credit business operations.
– Considered the disclosures required due to the FCA investigation and fine for historical bereavement and probate practices, and the Cologne Criminal Prosecution Office and German Federal Tax Office investigation into our historical role in dividend tax arbitrage transactions.
– Endorsed management’s recommendation that a provision of £58m should be made in the year in relation to our consumer credit business operations.
– Endorsed the proposed year-end disclosures in this regard.
See Note 30 to the Consolidated Financial Statements.

ˆ200G2Mlv!27rDT6gTŠ200G2Mlv!27rDT6gT
628340 TX 36SANTANDERFORM 20-F (SAN UK PL
02-Mar-2019 01:19 ESTHTMLON
Donnelley Financial EGV maria0dc 8*ESS 0C
VDI-W7-PFD-043912.9.12.0
Page 1 of 1
Annual Report 2018 | Governance
Board Audit Committee Chair’s report continued
36 Santander UK plc
The Committee’s focus continues to be on
areas of significant judgement which pose
the greatest risk of a material financial
statement misstatement. In addition to the
areas set out in the preceding table, the
Committee also considers other higher
risk items. During the 2018 year-end
process, these included the identification
and assessment of risks of material
misstatement due to fraud or error. We
also received regular reports on any
material litigation cases and their
progress, as part of our consideration of
provisions and contingent liabilities.
External Auditor
We continued to develop and oversee the
interaction with PwC and with Mr
Jonathan Holloway in his third year as the
audit partner, following PwC’s
appointment in 2016 resulting from the
re-tendering of the global external audit.
The independence of PwC was
considered and monitored throughout the
year.
Oversight of the relationship with our
External Auditors
As part of our review of our relationship
with PwC, our activities included:
– Consideration of their work and opinion
relating to management judgements.
– Review of the summary of
misstatements not corrected by
management. The Committee was
satisfied that they were not
quantitatively or qualitatively material,
either individually or in the aggregate.
– Discussion on the level of disclosure in
the Annual Report and Half Yearly
Financial Report to satisfy ourselves
that it is appropriate.
– Discussion of developments in financial
reporting including changes to
accounting standards, statute and best
practice.
– A review of PwC’s reports on findings
and recommendations on internal
control and financial reporting matters
identified during their audit and their
view of management’s progress in
resolving them.
– Interactions, including meetings in
private session during each Committee
meeting, and at other times throughout
the year.
– Reviewed the latest results of the
FRC’s quality inspections and our
auditors’ response to the FRC’s
challenge on the general quality of
banking audits as well as enquired into
the results of any audit quality reviews
of Santander UK.
Based on the above inputs, which were
captured in a formalised assessment, the
Committee satisfied itself as to the rigour
and quality of PwC’s audit process.
Non-audit fees
We have a policy on non-audit services
provided by our External Auditors, which
was updated in 2016 in the context of the
Revised Ethical Standard issued by the
FRC on auditor independence
requirements resulting from the new
European Audit Regulation and Directive.
Non-audit services were under continuous
review throughout 2018 to determine that
they were permitted by reference to their
nature, assessing potential threats and
safeguards to auditor independence as well
as the overall ratio of audit to non-audit
fees.
All assignments require advance approval,
either by the Chair (or in his absence his
alternate), under delegated authority for
amounts under £250,000 plus VAT or, if
larger, by the full Committee. This process
is in addition to the requirement for all
non-audit fees to be approved by the Banco
Santander Audit Committee.
The fees for non-audit work performed by
PwC in the year, which are disclosed in
Note 7, other than audit-related assurance
services relating principally to the support
of various debt issuance programmes,
mainly comprised services in respect of
enhancing Santander UK culture and
behaviours and the evolution of the
responsibility and sustainability strategy.
We ensured that these met the external
and internal tests for maintaining their
independence, including evidence of
their professional scepticism.
We also monitored other fees in respect
of work performed by EY, to ensure they
remained unconflicted in their role as our
appointed Independent Expert in relation
to the ring-fencing requirements.
Fees for non-audit work performed by PwC
in the year, other than those in relation to
audit related assurance services, were
approximately 5% of the average of the
fees approved for Deloitte, EY and KPMG.
The Committee considered the findings of
the Competition and Markets Authority
(CMA) market study into the UK Statutory
Audit market and the Kingman independent
review of the Financial Reporting Council
and responded to the CMA consultation.
Internal controls
The Board Risk Committee has overall
responsibility for the effectiveness of the
internal control systems. However, due to
the nature of internal control matters,
there is a degree of overlap in
responsibilities with those of this
Committee, particularly regarding financial
reporting controls.
Section 404 of the Sarbanes-Oxley Act
requires management to report on the
design and effectiveness of its internal
controls over financial reporting (ICFR)
framework. During 2018, further
enhancements have been introduced to
the framework including commencing a
review of the internal control set to ensure
they remain appropriate in light
of structural changes within the
organisation during the course of the year.
We considered the financial control
environment in the year. Finance and our
External and Internal Auditors provided
regular reports to the Committee on ICFR,
including key systems, and provided
feedback on remediation and overall
improvements required to ensure that the
relevant controls were appropriately
designed and operating effectively. This
included addressing weaknesses in end
user computing controls, controls over
IFRS 9 and the Client Assets control
environment.
ˆ200G2Mlv!2H7R6r6;Š200G2Mlv!2H7R6r6;
628340 TX 37SANTANDERFORM 20-F (SAN UK PL
02-Mar-2019 07:17 ESTHTMLON
Donnelley Financial EGV yuraa0dc 7*ESS 0C
VDI-W7-PFL-140512.9.12.0
bar3
Page 1 of 1
> Corporate governance report
Santander UK plc 37
Disclosure in the Annual Report
We received regular reports from the Disclosure Committee, a senior executive committee chaired by the CFO. Its remit is to advise the Committee on the completeness and accuracy of disclosures in Santander UK’s external reporting. This, together with other reports received in the year, and a review of best practice and the approach of our peers, enabled us to conclude that we were satisfied with the disclosures in this Annual Report.
Management also engaged the Board and Committee early on concerning the approach to the report which enabled them to provide input into the overall tone and messaging in a timely manner.
Fair, balanced and understandable
The Disclosure Committee also reports on whether the Annual Report is fair, balanced, and understandable and whether it provides the information necessary for readers to assess Santander UK’s position and performance, business model and strategy. In this context, the Disclosure Committee considered and advised us whether:
– Key messages remained consistent throughout the document, relating both to financial performance and progress against strategic objectives.
– All key judgements, significant risks and issues are reported and explained clearly and adequately.
– There is a clear framework to the document with good signposting and a complete picture of performance and events.
In addition to the above review process, the Committee’s assessment of fair, balanced and understandable is underpinned by the understanding it gains through the reporting made to it throughout the year of management judgements, internal control matters, Internal Audit activities and the reports of the External Auditors.
The Committee’s assessment also considers the robustness and outcomes of the assurance, review and verification processes conducted by management and considers whether the key risks reflected those that were of a concern to the Committee and were consistent with those reported by management.
Following our assessment we concluded that the 2018 Annual Report is fair, balanced and understandable.
Financial Reporting Council (FRC)
Annual Review of Corporate
Reporting 2018/19
In October 2018, the FRC issued a report which sets out its perspective on key developments for 2018/19 annual reports. As part of our oversight of this area, we received and reviewed a report from management on its work in respect of the areas of interest to the FRC. We are satisfied that management addressed the areas identified by the FRC in the preparation of this Annual Report to the extent appropriate to our ownership structure.
Going Concern
We satisfied ourselves that it is appropriate to use the going concern basis of accounting in preparing the financial statements, supported by a detailed analysis provided to the Committee by senior finance management.
As part of the assessment, we considered whether there are sufficient financial resources, including liquidity and capital, available to continue the operations of Santander UK. We considered Santander UK’s resilience in the face of potential stress and prominent events. In making our assessment, we took into account all information of which we were aware about the future, which was at least, but not limited to, 12 months from the date that the balance sheet was signed.
ˆ200G2Mlv!286Ywz6AŠ200G2Mlv!286Ywz6A
628340 TX 38SANTANDERFORM 20-F (SAN UK PL
02-Mar-2019 01:31 ESTHTMLON
Donnelley Financial EGV maria0dc 4*ESS 0C
VDI-W7-PFD-043912.9.12.0
Page 1 of 1
Annual Report 2018 | Governance
Board Audit Committee Chair’s report continued
38 Santander UK plc
Internal Audit
The Internal Audit plan, based on a
comprehensive risk assessment, was
presented in draft and then final form for
challenge and approval by the Committee.
The plan has been updated at regular
intervals throughout the year in response
to changes in the business and the
regulatory environment and at the request
of the Committee.
In 2018, there was an improvement in the
overall distribution of audit ratings, in part
due to continued focus on building a
stronger control environment. All
unsatisfactory audit reports issued were
subject to additional scrutiny by the
Committee with the relevant business
areas being required to present their
action plans to the Committee.
We chose to invite management to
present on progress with the
implementation of Internal Audit’s
recommendations, issues encountered,
key milestones and key dependencies.
We received regular reports on audit
recommendations from our Head of
Internal Audit (Quarterly Internal Audit
Reports) and monitored findings as part of
our oversight. We considered the total
number of recommendations, the rationale
for any of them becoming overdue, and
broader root cause analyses. The
Committee also requested that the Head
of Internal Audit highlight
recommendations becoming due.
We noted a strong engagement between
Internal Audit and the business in 2018.
We also oversaw the objective setting and
performance evaluation of the Head of
Internal Audit.
Internal Audit External Quality
Assessment
The Committee reviewed the conclusions
and recommendations arising from an
EQA of the Internal Audit function. This
review is conducted every five years and
evaluates the Internal Audit function in
respect of its conformance with the
standards of the Chartered Institute of
Internal Auditors (CIIA), as well as its
performance and effectiveness
in comparison to industry peers and good
practice. The outcome of the review was
favourable with the function being
compliant with the CIIA’s Guidance on
Effective Internal Audit in Financial
Services – Second Edition and also
benchmarked well against peers.
Whilst there were no material weaknesses,
as expected improvement opportunities
were identified, which have been included
in the function’s Continuous Improvement
Plan.
Whistleblowing
Santander UK recognises the importance of
a culture where colleagues feel able to
speak up.
In 2018, management continued to make
improvements to its whistleblowing
framework and arrangements under our
oversight. This included increased resource
for both the whistleblowing and
investigation teams, improved operating
procedures, strengthened controls testing
and targeted training. There has been
significant senior management
engagement, with the CEO sponsoring and
opening an awareness event in June 2018.
The Committee is responsible for reviewing
and monitoring the effectiveness of
Santander UK’s whistleblowing procedures.
It received and considered bi-annual
reports on Santander UK’s whistleblowing
arrangements. The reporting included
oversight and progress of concerns,
outcomes, identifiable trends, observable
risks, the regulatory environment, changes
to proposed legislation and activities to
promote and enhance the arrangements
to support the culture of speaking up.
The Committee also reviewed the annual
Whistleblowing Report prepared for the
Board to consider. The Committee is
satisfied that Santander UK has complied
with the FCA and PRA regulations on
whistleblowing in the year.
I continued to act as the Whistleblowers’
Champion to oversee the integrity,
independence, and effectiveness of the
whistleblowing arrangements. I remained
focused on procedures and governance to
prevent victimisation of those employees
raising a whistleblowing concern. I meet
regularly with management and I have
been involved in overseeing the
implementation of suggested
enhancements to continuously improve the
arrangements.
Effectiveness
The Board has determined that I have the
necessary qualifications and skills to
qualify as a Board Audit Committee
financial expert as defined in Item 16A of
Form 20-F and by reference to the NYSE
listing standards.
In my capacity as Committee Chair, I
meet with key members of the
management team and the External
Auditors in advance of each Committee
meeting. I ensure that the Committee
meets with management, the Internal
Auditors and the External Auditors
in private sessions. I also attend meetings
with the PRA, the FCA and the FRC.
In line with an assessment of the
Committee’s forward-looking agenda and
the Board programme, it has been agreed
that the number of scheduled meetings of
the Committee will increase to nine in
2019.
Committee’s Effectiveness Review
In accordance with good governance, the
Committee’s effectiveness was
considered as part of the Board’s annual
evaluation exercise. Further information,
including conclusions, have been provided
in the Board Nomination Committee
Chair’s Report.
Terms of Reference
The Committee reviews its Terms of
Reference annually. Following the 2018
review, they were revised primarily to
reflect the requirements of Banking
Reform. The Committee’s Terms of
Reference are available at
www.santander.co.uk
Planned activities for 2019
Areas of focus for the Committee for 2019
will include:
– The ongoing monitoring and reviewing
of the operation of IFRS 9, including
reviewing our response to the
recommendations of the PRA’s
Taskforce on Disclosure about ECL.
– The financial and disclosure
consequences of historical conduct
issues including PPI.
– The financial control and reporting
implications of any change in the
economy, including any arising from
the impact of Brexit.
– Embedding of IFRS 16.
– Reporting in line with Santander UK’s
ring-fencing requirements.

ˆ200G2Mlv!2ZkwKVg?Š200G2Mlv!2ZkwKVg?
628340 TX 39SANTANDERFORM 20-F (SAN UK PL
04-Mar-2019 01:10 ESTHTMLON
Donnelley Financial EGV gopad0dc 9*ESS 0C
VDI-W7-PFD-037812.9.12.0
39n bar3 f39a rq
Page 1 of 2
> Corporate governance report
Board Responsible Banking Committee Chair’s
report
The Committee supports the Board with oversight
of culture, inclusion, reputation, customer
outcomes and the wellbeing of our employees
Role and responsibilities
The Committee was established in
July 2017 to strengthen Santander
UK’s focus on culture, conduct and
customer outcomes. Its purpose is to
monitor, challenge and support
actions taken by management to
ensure that the business is run in a
socially responsible way, in the
interests of Santander UK’s
customers, people, stakeholders and
communities in order to promote
Santander UK’s long-term success.
The Committee assists the Board with
shaping Santander UK’s culture,
reputation and customer propositions
through oversight of matters related to
conduct, compliance, culture,
diversity, sustainability, corporate
social
responsibility, reputation, brand and
financial crime (including anti-money
laundering, sanctions, terrorist
financing and anti-bribery and
corruption).
Interconnectivity between Board
Committees
The respective Committee Chairs
agreed the timing and transition of
various items, either in part or whole,
from the Board Remuneration
Committee (RemCo) and the Board
Risk Committee (BRC) to the Board
Responsible Banking Committee
(RBC). The phased transition took
place between July 2017 and February
2018.
The Committee Chairs continue to
collaborate to prevent any gaps in
coverage and to ensure that any areas
of overlap are addressed in the
appropriate forum. Collaboration is
further enhanced by cross-membership
of the three respective Committee
Chairs. The Committee has oversight
for Conduct and Compliance risk within
the Risk Appetite and Risk Framework,
set by the BRC and will notify the BRC
of any material Conduct and
Compliance risk matters that require its
consideration.
Overview of the year
The Committee’s first full year of
operation was 2018, during which it
considered, monitored and
challenged a range of matters,
including:
Customers and customer
outcomes
The Committee focused on:
– Vulnerable customers
– Fair customer treatment and
outcomes
– Fraud prevention and detection
– SME customer experience
– Probate and bereavement,
including oversight of the process
improvements driven by
management during the last
two years
– Changes to overdraft charges
– Themes arising from customer
complaints whistleblowing and
satisfaction metrics including
referrals to the Financial
Ombudsman Service
– GDPR requirements
– Open Banking implementation, and
– Recruitment, up-skilling our people
and enhancing technology to
support our customer contact
colleagues.
Reputational risk
The Committee ensured that
adequate and effective control
processes were in place to identify
and manage reputational risks.

ˆ200G2Mlv!2ZkwKVg?Š200G2Mlv!2ZkwKVg?
628340 TX 39SANTANDERFORM 20-F (SAN UK PL
04-Mar-2019 01:10 ESTHTMLON
Donnelley Financial EGV gopad0dc 9*ESS 0C
VDI-W7-PFD-037812.9.12.0
39n bar3 f39a rq
Page 2 of 2
Santander UK plc 39
“During its first full year
of operation, the
Committee has ensured
that appropriate focus
has been given to the
issues of responsible
banking and how
Santander UK’s actions
have impacted all of our
stakeholders.”
Scott Wheway
Responsible Banking Committee Chair
26 February 2019
Responsibilities
of the Committee
Read more on p24
Committee membership,
tenure and attendance
Read more on p47

ˆ200G2Mlv!2BFTeX67Š200G2Mlv!2BFTeX67
628340 TX 40SANTANDERFORM 20-F (SAN UK PL
02-Mar-2019 03:10 ESTHTMLON
Donnelley Financial EGV annas1dc 6*ESS 0C
VDI-W7-PFD-014312.9.12.0
f40n
Page 1 of 1
Annual Report 2018 | Governance
Board Responsible Banking Committee Chair’s report continued
40 Santander UK plc
It received and considered reports
detailing ongoing and possible
reputational, brand and franchise risks,
including media and public policy issues.
The reports also included any
key decisions or key risk events that may
give rise to reputational risk issues.
Financial crime
The Committee:
– Received regular updates on Financial
Crime from the UK Money Laundering
Reporting Officer, including his annual
report, and endorsed the proposed
recommendations.
– Monitored progress of Santander UK in
developing and implementing effective
systems, processes and controls to
combat financial crime.
– Received regular updates on financial
crime from the retail and corporate
businesses, and
– Reviewed potential financial crime risks
and any actions required in response,
including in respect of international
sanctions compliance.
Conduct and Compliance
The Committee:
– Ensured that adequate and effective
control processes and policies were in
place to manage and measure Conduct
and Compliance risk.
– Considered key emerging Conduct and
Compliance risk issues, lessons
learned and anticipated risks via
horizon scanning and investigations.
– Received first and second line reporting
against Conduct and Compliance risk
metrics and reports on conduct-related
regulatory interaction matters.
– Considered the FCA Firm-Wide
Evaluation and appropriate response
plans.
– Considered the 2018 Compliance
Programme, including resourcing in the
2018 Compliance Monitoring Plan, and
– Considered any actions in response to
regulatory developments, including
individual and market developments, on
Conduct and Compliance risk matters
which may have a material impact on the
business.
Culture, Diversity and Inclusion
The Committee:
– Received regular updates on culture.
Risk culture, previously considered by
the BRC, transitioned to the Committee
and was considered as part of an holistic
culture update;
– Considered thematic culture and conduct
trends, including management-identified
cultural drivers and changes in policy
and working practices and the Annual
Banking Standards Board assessment;
– Monitored the culture strategy and
monitored management efforts to embed
and maintain the desired culture
throughout the business in line with
Santander UK’s purpose, vision, values
and the nine Santander behaviours;
– Monitored the approach to Diversity and
Inclusion, including progress towards
gender targets which support reducing
the gender pay gap. More information
can be found on our website;
– Reviewed programmes relating to the
responsible treatment of employees,
including diversity, inclusion and
wellbeing; and
– Reviewed key themes arising from
employee surveys, focus groups and
people metrics in order to evaluate the
impact on conduct, brand and culture.
Brand
The Committee:
– Considered and guided on brand
purpose.
– Considered the reputation of Santander
UK and how reputational risk impacts its
brand and market positioning, and
– Received reports on brand and
reputation tracker metrics.
Sustainability and Corporate Social
Responsibility
The Committee oversees Santander UK’s
alignment to the UN Principles for
Responsible Banking and monitors that the
Sustainability and Corporate Social
Responsibility strategy helps the bank
deliver value to all stakeholders and
protects its reputation and brand.
A separate Sustainability Report will be
issued during the first half of 2019.
Membership
All five members of the Committee,
including the Chair, are Independent
Non-Executive Directors (INEDs). A list of
members, details of their experience,
qualifications and attendance at
Committee meetings during the year are
shown on pages 19 and 20, and 47.
In addition to the Committee members,
regular attendees at Committee meetings
include the Board Chair, Chief Executive
Officer, Chief Legal and Regulatory
Officer, Chief Risk Officer, Head of Retail
and Business Banking, Company
Secretary, Chief HR Officer, Director of
Corporate Communications and the
Director of Conduct and Compliance.
Committee’s Effectiveness Review
In accordance with good governance, the
Committee’s effectiveness was
considered as part of the Board’s annual
evaluation exercise. Further information,
including conclusions, have been provided
in the Board Nomination Committee
Chair’s Report.
Terms of Reference
The Committee reviews its Terms of
Reference annually. Following the 2018
review, they were revised primarily to
reflect the requirements of Banking
Reform. The Committee’s Terms of
Reference are available at
www.santander.co.uk
2019 priorities
In 2019, the Committee will continue to
take an holistic approach to gain greater
understanding and oversight of all of the
key areas that contribute to the
experiences felt by our customers, our
people and wider stakeholders. Key
priorities within this will be:
– Ensuring that our customer
propositions are ever more Simple,
Personal and Fair.
– Enhancing fraud protection and
financial crime prevention and
detection processes.
– Managing conduct and compliance risk.
– Ensuring that our change and
transformation programmes are
delivered in a way that enhances the
strength of the organisation and the
environment for our people;
– Managing and enhancing our Brand
and reputation.
– Considering the impact of digital
disruption threats on our customers;
and
– Enhancing the wellbeing of our
employees.
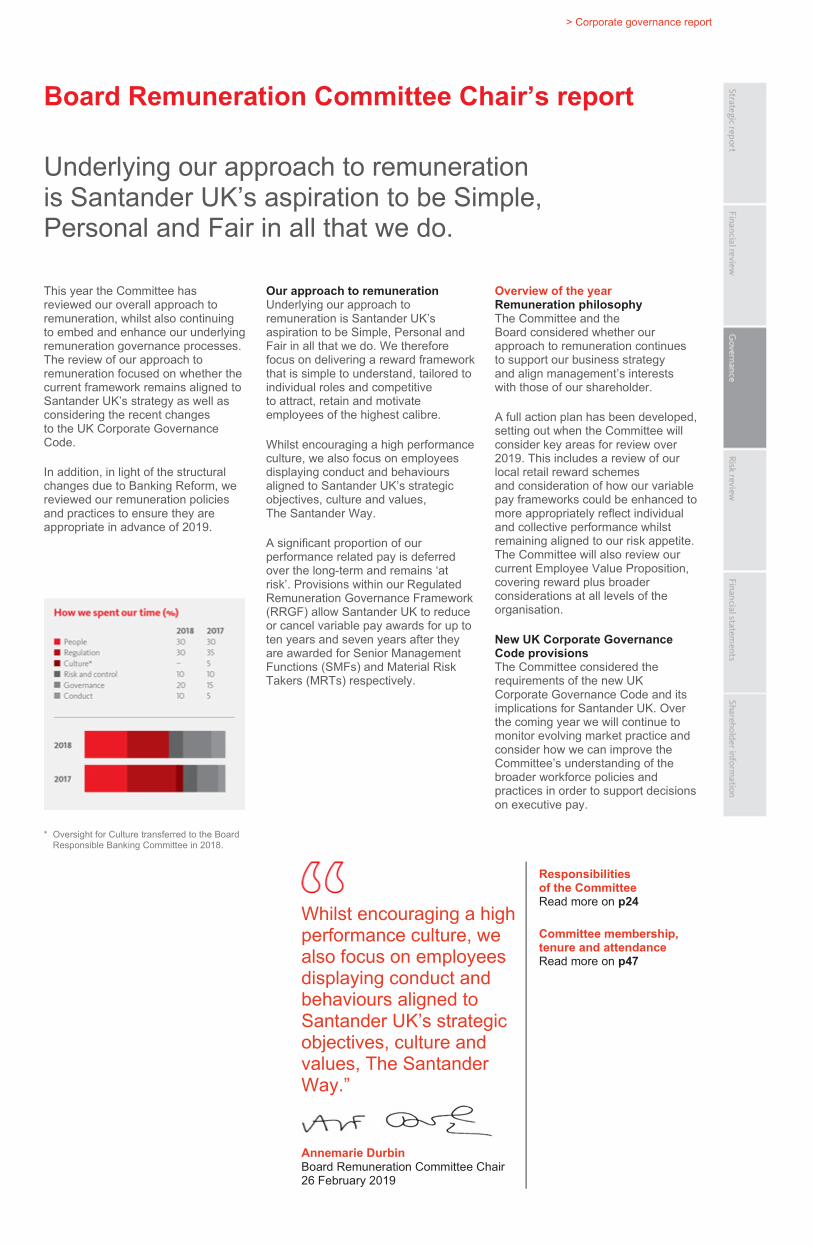
ˆ200G2Mlv!2=Fl$h66Š200G2Mlv!2=Fl$h66
628340 TX 41SANTANDERFORM 20-F (SAN UK PL
04-Mar-2019 01:52 ESTHTMLON
Donnelley Financial EGV annas1dc 9*ESS 0C
VDI-W7-PFD-029812.9.12.0
bar3 f41a f41n rq
Page 1 of 2
> Corporate governance report
Board Remuneration Committee Chair’s report
Underlying our approach to remuneration
is Santander UK’s aspiration to be Simple,
Personal and Fair in all that we do.
Whilst encouraging a high
performance culture, we
also focus on employees
displaying conduct and
behaviours aligned to
Santander UK’s strategic
objectives, culture and
values, The Santander
Way.”
Annemarie Durbin
Board Remuneration Committee Chair
26 February 2019
Responsibilities
of the Committee
Read more on p24
Committee membership,
tenure and attendance
Read more on p47
This year the Committee has
reviewed our overall approach to
remuneration, whilst also continuing
to embed and enhance our underlying
remuneration governance processes.
The review of our approach to
remuneration focused on whether the
current framework remains aligned to
Santander UK’s strategy as well as
considering the recent changes
to the UK Corporate Governance
Code.
In addition, in light of the structural
changes due to Banking Reform, we
reviewed our remuneration policies
and practices to ensure they are
appropriate in advance of 2019.
* Oversight for Culture transferred to the Board
Responsible Banking Committee in 2018.
Our approach to remuneration
Underlying our approach to
remuneration is Santander UK’s
aspiration to be Simple, Personal and
Fair in all that we do. We therefore
focus on delivering a reward framework
that is simple to understand, tailored to
individual roles and competitive
to attract, retain and motivate
employees of the highest calibre.
Whilst encouraging a high performance
culture, we also focus on employees
displaying conduct and behaviours
aligned to Santander UK’s strategic
objectives, culture and values,
The Santander Way.
A significant proportion of our
performance related pay is deferred
over the long-term and remains ‘at
risk’. Provisions within our Regulated
Remuneration Governance Framework
(RRGF) allow Santander UK to reduce
or cancel variable pay awards for up to
ten years and seven years after they
are awarded for Senior Management
Functions (SMFs) and Material Risk
Takers (MRTs) respectively.
Overview of the year
Remuneration philosophy
The Committee and the
Board considered whether our
approach to remuneration continues
to support our business strategy
and align management’s interests
with those of our shareholder.
A full action plan has been developed,
setting out when the Committee will
consider key areas for review over
2019. This includes a review of our
local retail reward schemes
and consideration of how our variable
pay frameworks could be enhanced to
more appropriately reflect individual
and collective performance whilst
remaining aligned to our risk appetite.
The Committee will also review our
current Employee Value Proposition,
covering reward plus broader
considerations at all levels of the
organisation.
New UK Corporate Governance
Code provisions
The Committee considered the
requirements of the new UK
Corporate Governance Code and its
implications for Santander UK. Over
the coming year we will continue to
monitor evolving market practice and
consider how we can improve the
Committee’s understanding of the
broader workforce policies and
practices in order to support decisions
on executive pay.

ˆ200G2Mlv!2=Fl$h66Š200G2Mlv!2=Fl$h66
628340 TX 41SANTANDERFORM 20-F (SAN UK PL
04-Mar-2019 01:52 ESTHTMLON
Donnelley Financial EGV annas1dc 9*ESS 0C
VDI-W7-PFD-029812.9.12.0
bar3 f41a f41n rq
Page 2 of 2
Santander UK plc 41

ˆ200G2Mlv!27RoRu6SŠ200G2Mlv!27RoRu6S
628340 TX 42SANTANDERFORM 20-F (SAN UK PL
02-Mar-2019 00:59 ESTHTMLON
Donnelley Financial EGV maria0dc 6*ESS 0C
VDI-W7-PFD-043912.9.12.0
Page 1 of 1
Annual Report 2018 | Governance
Board Remuneration Committee Chair’s report continued
42 Santander UK plc
Performance management framework
The Committee reviewed the end-to-end
performance management process for
MRTs and approved enhancements to our
current process which applied for 2018
pay decisions.
Risk adjustment
We further embedded the processes to
support our risk adjustment frameworks.
This included enhancements to the
individual remuneration adjustment
governance through which the Committee
receives recommendations from the
Individual Accountability Committee (IAC)
maintaining oversight of management’s
approach to in-year risk adjustments.
Structural changes
Following the acquisition of Santander
Services from Banco Santander SA on
1 January 2018 we sought to align their
remuneration policy, governance
frameworks and processes with our
RRGF, and where appropriate looked
to harmonise arrangements. Additionally,
in light of the changes to the Santander
UK Group due to Banking Reform and in
order to ensure compliance with the
relevant PRA ring-fencing rules under the
Banking Reform Act, we reviewed our
remuneration governance, policies and
processes during the year. This included
an end-to-end review of our RRGF to
ensure it was appropriate in advance of
2019.
Gender pay
As a Committee, we considered our
inaugural Gender Pay Gap (GPG) report,
which was issued in the first quarter of
2018. We published our second GPG
report in the final quarter of 2018.
Following its establishment in 2017,
the Board Responsible Banking
Committee has oversight of the
programmes aimed at improving diversity
across the bank including closing the
gender pay gap.
Senior appointments
During the year the Committee approved
the remuneration arrangements for a
number of senior appointments. This
included the remuneration package for
Susan Allen who was appointed as an
Executive Director from 1 January 2019.
Variable Pay
We reviewed the structure and metrics for
our variable reward and our local reward
schemes, with a focus on enhancing
differentiation, simplification and
harmonisation. We sought assurance that
any proposed changes to our incentive
plans rewarded appropriate conduct and
did not reward behaviours that could lead
to unnecessary risk taking.
Bonus pool approval
The Committee approved, with appropriate
adjustments, the overall bonus pools for
Santander UK, Santander Corporate &
Investment Bank (UK) and Santander
Consumer UK, taking into account the
financial and non-financial performance
achieved together with an assessment
of current and future risks.
Membership
All four members of the Committee
including the Committee Chair are
Independent Non-Executive Directors
(INEDs).
Regular attendees include the Board Chair,
CEO, Chief HR Officer, Performance &
Reward Director, Company Secretary,
Chief Legal & Regulatory Officer, Chief
Risk Officer, Deloitte LLP, as appointed
independent Remuneration Committee
advisers.
The Committee satisfied itself that Deloitte
do not have connections with Santander
UK that may impair their independence.
2018 Business Performance and Impact
on Remuneration
Our management team has delivered solid
business performance this year, delivering
for our shareholders, people, customers
and communities. The continued progress
made towards our strategic and operational
goals (including the establishment of the
ring-fence bank) was achieved despite the
competitive and uncertain environment.
Effectiveness of the Committee
In accordance with good governance, the
Committee’s effectiveness was considered.
This concluded that the Committee retains
an appropriate balance of skills and
expertise to carry out its role effectively.
The Committee also takes the opportunity
at the conclusion of each meeting to reflect,
together with management, on the quality
of papers, meeting management and any
other observations of relevance.
Terms of reference
The terms of reference were reviewed
and revised during the year to reflect
the scope of the Committee’s role with
respect to employees of Santander UK.
Full terms of reference are available at
www.aboutsantander.co.uk.
Priorities for 2019
In 2019, we will:
– Implement the changes agreed to our
remuneration policies and governance
structures due to the structural changes
as a result of the Banking Reform
legislation, and monitor their
implementation to ensure they are
operating effectively in the context of
the new structure of the Santander
UK Group.
– Continue to monitor the effectiveness
of our overall remuneration framework,
including the structure of our current
variable pay plans and determine
whether any changes should be made
for future years.
– Review the balanced scorecard of
quantifiable measures to ensure they
drive the right culture and behaviours
balancing the needs of our people,
customers, communities and
shareholders.
– In the spirit of recent changes to the UK
Corporate Governance Code and
market practice, consider executive pay
in relation to the broader employee
remuneration arrangements. This
includes setting the pensions
arrangements of new Executive
Director hires in line with those of the
general employee population. We will
continue to monitor changes in market
practice as others respond to the new
Code.
– Implement a new reward scheme for
our broader employee population to
incentivise the delivery of Santander
UK’s key strategic priorities.

ˆ200G2Mlv!2=wtPu6sŠ200G2Mlv!2=wtPu6s
628340 TX 43SANTANDERFORM 20-F (SAN UK PL
04-Mar-2019 02:25 ESTHTMLON
Donnelley Financial EGV annas1dc 8*ESS 0C
VDI-W7-PFD-029812.9.12.0
bar3
Page 1 of 2
> Corporate governance report
Remuneration report and remuneration policies
Executive Directors’ remuneration structure
Fixed Pay
Principle and description Policy
Base salary – Reviewed annually to ensure market competitive pay appropriate for the role.
– Set at an appropriate level so that inappropriate risk taking is not encouraged.
– Reflects the complexity of each role and the responsibilities and experience of each individual.
– Salaries are set to reflect prevailing market and economic conditions.
Pension
arrangements
– Post-retirement benefits for participants are offered in a cost-efficient manner.
– All Executive Directors receive a cash allowance in lieu of pension.
– Unless determined otherwise, pension arrangements for new appointments to the Board will be in line with the level of pension provision available to the broader workforce.
Other benefits – Benefits are offered to Executive Directors as part of a competitive remuneration package.
– Includes private medical insurance for Executive Directors and their dependants, life assurance, health screening, relocation allowances and expatriate allowances where relevant.
– Access to Santander UK’s all-employee share schemes on the same terms as all UK employees.
Variable Pay
Principle and description Policy
Basis of preparation
This report has been prepared on behalf of the Board by the Board Remuneration Committee. We follow UK corporate governance regulations, guidelines and codes to the extent considered appropriate taking into account our ownership structure. Accordingly, a number of voluntary disclosures relating to remuneration have been presented in this report.
Executive remuneration policies
and principles
Our core values of Simple, Personal and Fair drive our remuneration policy.
Our policies are designed with the long-term success of the business in mind, to deliver our business strategy and reinforce our values.
We apply a consistent approach to the reward of all our employees which upholds our prudent approach to Risk Appetite which is set as part of a Santander UK-wide Risk Framework.
The structure of our variable pay plan for our Executive Directors ensures that there is a clear link between the Company’s strategy and remuneration. Awards under the variable pay plan are based on a balanced scorecard of quantitative and qualitative metrics taking into account Santander UK Group Holding plc’s KPIs in the areas of Customers, Shareholders and People. This ensures that our day-to-day activities align with the over-arching strategy of the bank and helps us to measure progress towards our strategic priorities and our aim of being the best bank.
The allocation of awards under the variable pay plan takes into account an assessment of the Executive Director’s performance against a performance management framework set at the start of the year covering a range of financial, non-financial, quantitative and qualitative criteria.
Forward-looking remuneration
policies for Executive Directors
Our forward-looking remuneration policies are outlined in the table below. Remuneration is structured into two main elements: fixed pay and our single variable pay plan. The aim is to set fixed pay at market competitive levels appropriate for the role. The level of fixed pay aims to be sufficient so that inappropriate risk taking is not encouraged.

ˆ200G2Mlv!2=wtPu6sŠ200G2Mlv!2=wtPu6s
628340 TX 43SANTANDERFORM 20-F (SAN UK PL
04-Mar-2019 02:25 ESTHTMLON
Donnelley Financial EGV annas1dc 8*ESS 0C
VDI-W7-PFD-029812.9.12.0
bar3
Page 2 of 2
Santander UK plc 43
Variable pay plan – To motivate Executive Directors to achieve and exceed annual financial and strategic targets within Santander UK’s Risk Appetite and in alignment with our business strategy and values.
– Multi-year deferral, further performance testing and delivery in Banco Santander SA shares aligns Executive Directors’ interests to the long-term interests of Santander UK.
– Deferral of part of the award is applied in accordance with the requirements of the Remuneration Code.
– Awards are discretionary and determined by reference to performance against a scorecard of financial and strategic goals.
– 40% of the bonus awarded is paid upfront after the performance year ends (year one), delivered half in cash and half in shares.
– 60% of the bonus awarded is deferred and delivered in equal tranches over years three to seven, with each tranche delivered half in cash and half in shares.
– The final three award tranches are subject to performance testing, which may reduce the level of deferred payout.
– Share-based awards are subject to a minimum twelve month retention period following the relevant vesting date.
– Malus and clawback provisions apply to all elements of variable pay for up to ten years following the grant of an award.

ˆ200G2Mlv!26gsyrgtŠ200G2Mlv!26gsyrgt
628340 TX 44SANTANDERFORM 20-F (SAN UK PL
02-Mar-2019 00:19 ESTHTMLON
Donnelley Financial EGV maria0dc 3*ESS 0C
VDI-W7-PFD-043912.9.12.0
Page 1 of 1
Annual Report 2018 | Governance
Remuneration report and remuneration policies continued
44 Santander UK plc
The variable pay plan rewards financial
and non-financial performance over the
year with additional long-term metrics
applied to the deferred element which can
reduce, but not increase, the deferred
award.
Our remuneration structures, which
incorporate significant long-term deferral
and use of Banco Santander SA shares
align the interests of Executive Directors
with shareholders and encourage the
building of a long-term shareholding in
Banco Santander SA.
Our remuneration policy continues to
meet regulatory requirements. Santander
UK applies a 2:1 variable to fixed pay cap
in line with approvals granted to Banco
Santander SA. For control function staff, a
lower operational ratio of 1:1 is applied,
save for in exceptional circumstances.
On recruitment
When appointing a new Executive
Director, base salary is set at a market
competitive level appropriate for the role,
taking into consideration a range of
factors including scope and
responsibilities of the role, internal
relativities, the individual’s previous
remuneration, relevant experience, and an
assessment against relevant comparator
groups and cost. In line with the
requirements of the new UK Corporate
Governance Code and in particular the
guidance on executive director pension
levels, unless determined otherwise, any
new Executive Director will receive
pension benefits at a level aligned to the
wider employee population. Other
elements of remuneration will be
established in line with the Remuneration
Policy set out in the Executive Directors’
remuneration structure table on page 45.
Relocation support and international
mobility benefits may also be provided.
Buy-out awards
Compensation may be provided to
Executive Directors recruited externally for
the forfeiture of any award on leaving their
previous employer. The Committee
retains discretion to make such
compensation as it deems necessary and
appropriate to secure the relevant
Executive Director’s employment,
and ensure any such payments align with
the long-term interests of Santander UK
and the prevailing regulatory framework.
Service agreements
Terms and conditions of employment are
set out in individual service agreements
which include a notice period of six
months from both the Executive Director
and the Company.
The agreements may be terminated
immediately with payment of fixed pay in
lieu of notice. In the event of termination for
gross misconduct neither notice nor
payment in lieu of notice is required and
any deferred awards are forfeited.
Termination payments
The impact of an Executive Director leaving
the Company on remuneration under
various scenarios reflects the service
agreements and the relevant scheme rules,
and the Committee’s policy in this area.
With respect to outstanding variable pay
awards, these lapse on termination, other
than where an individual is considered to
be a ‘good leaver’. The Committee
determines whether an Executive Director
is a good leaver should their employment
end due to injury, ill-health, disability,
redundancy, retirement, death, or any other
reason at the Committee’s discretion.
In 2018, the Committee reviewed its
approach to determining good leaver status
and has approved a framework intended to
guide the Committee to determine the
discretionary circumstances when good
leaver status is appropriate. Other than a
payment in the event of redundancy, there
are no other payments upon termination of
employment for Executive Directors
anticipated in the policy.
Risk and Performance adjustment
We will continue to ensure that the
requirements of the Remuneration Code on
risk and performance adjustment are met
for our employees. All variable
remuneration is subject to adjustment for
current and future risks through our
Additional Risk Adjustment Standard which
is linked to our Board approved Risk
Appetite and our Individual Remuneration
Adjustment Standard.
Our Additional Risk Adjustment Standard
provides both a formula-based assessment
against Santander UK’s Risk Appetite and
an additional qualitative risk event
assessment overlay that can result in a
downward risk adjustment of up to 100% of
the bonus pool or individual awards at the
discretion of the Committee.
Our Individual Remuneration Adjustment
Standard provides a framework for the
process, governance and standards
relevant for making decisions in relation to
individual performance adjustments
following an Incident, including malus and
clawback.
Performance adjustments may include,
but are not limited to:
– Reducing a bonus for the current year
– Reducing the amount of any unvested
deferred variable remuneration
(including historical LTIP awards)
– Requiring repayment on demand (on a
net basis) of any cash and share
awards received at any time during the
ten year period after the date of award
– Requiring a bonus which has been
awarded (but not yet paid) to be
forfeited.
The Committee has full discretion to
prevent vesting of all or part of an amount
of deferred remuneration and/or to freeze
an award during an ongoing investigation
in any of the following circumstances:
– Employee misbehaviour or material
error
– Material downturn in the performance
of Santander UK or a relevant business
unit’s performance
– Santander UK or a relevant business
unit suffers a material failure of risk
management
– Significant changes in the Banco
Santander Group’s or Santander UK’s
economic or regulatory capital base
and the qualitative assessment of risk
– Material restatement of the Banco
Santander Group’s or Santander UK’s
financial statements (except when
required due to modification of the
accounting rules).
The Committee seeks input from the Chair
of the Board Risk Committee, the Chief
Risk Officer, the Chief Legal and
Regulatory Officer, and the Chief Internal
Auditor when determining whether any
performance or risk adjustments are
required.
Policy for all employees
Our performance, reward and benefits
approach across the Company supports
and drives our business strategy and
reinforces our values in the context of a
clearly articulated Risk Appetite. We apply
a consistent approach to reward for all
employees. Employees are entitled to a
base salary and benefits and have the
opportunity to receive an element of
performance-related compensation,
subject to their role and reward band. The
opportunity of performance-rated
compensation available is based on the
seniority and responsibility of the role. The
Remuneration Committee annually
approve the operation of all of our variable
reward schemes for our customer-facing
colleagues to ensure that all our plans
reward appropriate behaviour and do not
incentivise unnecessary risk taking.

ˆ200G2Mlv!2Zk#S2gXŠ200G2Mlv!2Zk#S2gX
628340 TX 45SANTANDERFORM 20-F (SAN UK PL
04-Mar-2019 01:10 ESTHTMLON
Donnelley Financial EGV gopad0dc 8*ESS 0C
VDI-W7-PFD-037812.9.12.0
bar3
Page 1 of 2
> Corporate governance report
Remuneration implementation report
Executive Directors’ remuneration (audited)
Total remuneration of each Executive Director for the years ended 31 December 2018 and 2017.
Executive rewards Nathan Bostock(1)
Antonio Roman(2) (3)
Javier San Felix(3)
Total
2018 2017 2018 2017 2018 2017 2018 2017
£000 £000 £000 £000 £000 £000 £000 £000
Salary and fees 1,680 1,653 629 243 725 302 3,034 2,198
Taxable benefits (cash and non-cash) 50 55 5 17 632 329 687 401
Pension 588 581 157 61 – – 745 642
Bonus (paid and deferred) 2,317 2,425 1,077 400 1,800 861 5,194 3,686
Total remuneration 4,635 4,714 1,868 721 3,157 1,492 9,660 6,927
(1) Nathan Bostock’s remuneration does not include £1,800,000 (2017: £1,800,000) relating to a share based buy-out of deferred awards in respect of his
previous employment. This was the final payment under this award.
(2) This represents an allocation of 97% (2017: 90%) of Antonio Roman’s remuneration (for his time spent as a Director of the Company in the year) as he
spends 97% of his time on Company business. The remaining 3% (£57,785) (2017: 10% and £175,866) has been allocated to Abbey National Treasury
Services plc. This results in total remuneration of £1,926,181.
(3) Antonio Roman and Javier San Felix were appointed as Directors on 1 August 2017 and therefore 2017 remuneration is in respect of a part year. To
facilitate his move to the UK, Javier San Felix’s package includes certain expatriate benefits, including a housing allowance, life and accident insurance
and death and disability benefits, the costs of which are shared with Banco Santander. During 2018, Javier San Felix’s remuneration package was
restructured following his transfer out of the Banco Santander defined benefit pension scheme. Banco Santander contributed £231,922 into its defined
benefit pension scheme on his behalf in the period in 2017 in which he served as a Santander UK Executive Director. In 2018, Banco Santander paid
£215,403 in defined benefit pension scheme contributions, £205,669 to him in lieu of defined benefit pension contributions, and £243,673 other payments
in connection with the restructuring.
(4) Susan Allen was appointed as an Executive Director on 1 January 2019. Her remuneration will be disclosed in next year’s annual report.
Introduction
This section of the report outlines how
our Remuneration Policy was
implemented for 2018.
Variable Pay Plan
Our Executive Directors participate in
a single variable incentive plan. The
purpose of the plan is to align
participants’ reward with the financial
and non-financial performance of
Santander UK as measured over the
financial year. Multi-year deferral,
further performance testing and
delivery in Banco Santander SA
shares ensures that Executive
Directors’ interests are aligned to the
long-term interest of the Santander
UK Group. Payments to our Executive
Directors are made half in cash and
half in shares, spread over seven
years, with the final three tranches of
awards subject to further long-term
metrics which can reduce the level of
awards. Awards delivered in shares
are subject to an additional one-year
retention period from the point of
delivery.
The 2018 Variable Pay Plan pool was
determined based on a range of
metrics using a balanced scorecard
approach (explained further below):
Quantitative assessment
Measured using a balanced
scorecard approach of financial and
non-financial measures. The
measures are based on Santander
UK’s strategy and for 2018 were:
– Customers (Satisfaction and loyal
customers)
– Shareholders
– Risk (Cost of Credit Ratio and
NPL ratio)
– Capital (Contribution to Banco
Santander Group capital)
– Profitability (Net Profit and
Return on Risk Weighted
Assets)
– Employees (Employee Engagement
and Enablement Scores).
Threshold performance under the
Customer and Shareholder categories
must be achieved in order to access
payout under the Employee category.
Similarly, the Committee considers
a discretionary downward adjustment
to the Customer and Shareholder
categories if satisfactory performance
under the Employee category is not
achieved.
Qualitative assessment
This adds context to the quantitative
assessment of financial and
non-financial measures to ensure a
balanced assessment of performance
has been made.
Banco Santander Group Multiplier
This adjusts the pool upwards or
downwards to reflect overall Banco
Santander performance.
Exceptional Adjustment
Intended to cover unexpected factors
or additional targets not covered by the
quantitative or qualitative assessments.
This may also include adjustments not
covered in the qualitative assessments,
including major risk events. An
exceptional adjustment, including
additional targets, may be requested at
a Banco Santander or Santander UK
level.
UK-focused risk adjustment
Linked to Santander UK’s Risk
Appetite, this provides both a formula-
based assessment against Risk
Appetite and an additional qualitative
risk event assessment overlay
(including consideration of people,
culture, conduct and other relevant
factors) that can
result in a downward risk adjustment
of up to 100% of the bonus pool or
individual awards at the discretion of
the Committee. The 2018 Variable
Pay Plan operated under
our remuneration governance and
frameworks applicable prior to the
changes required as a result of the
ring-fencing rules under the Banking
Reform Act.
The Committee has considered,
reviewed and approved changes
required to remuneration governance
and frameworks in order to comply
with the relevant regulatory rules and
these will apply from the 2019
performance year.
2018 Business Performance and
Impact on Remuneration
Our management team has delivered
solid business performance this year,
delivering for our shareholders,
people, customers and communities.
Our business performance in 2018
showed selective growth in an
uncertain and competitive operating
environment.
The Committee approved payments
to Executive Directors under the
Santander UK Variable Pay Plan in
the context of this performance.

ˆ200G2Mlv!2Zk#S2gXŠ200G2Mlv!2Zk#S2gX
628340 TX 45SANTANDERFORM 20-F (SAN UK PL
04-Mar-2019 01:10 ESTHTMLON
Donnelley Financial EGV gopad0dc 8*ESS 0C
VDI-W7-PFD-037812.9.12.0
bar3
Page 2 of 2
Santander UK plc 45
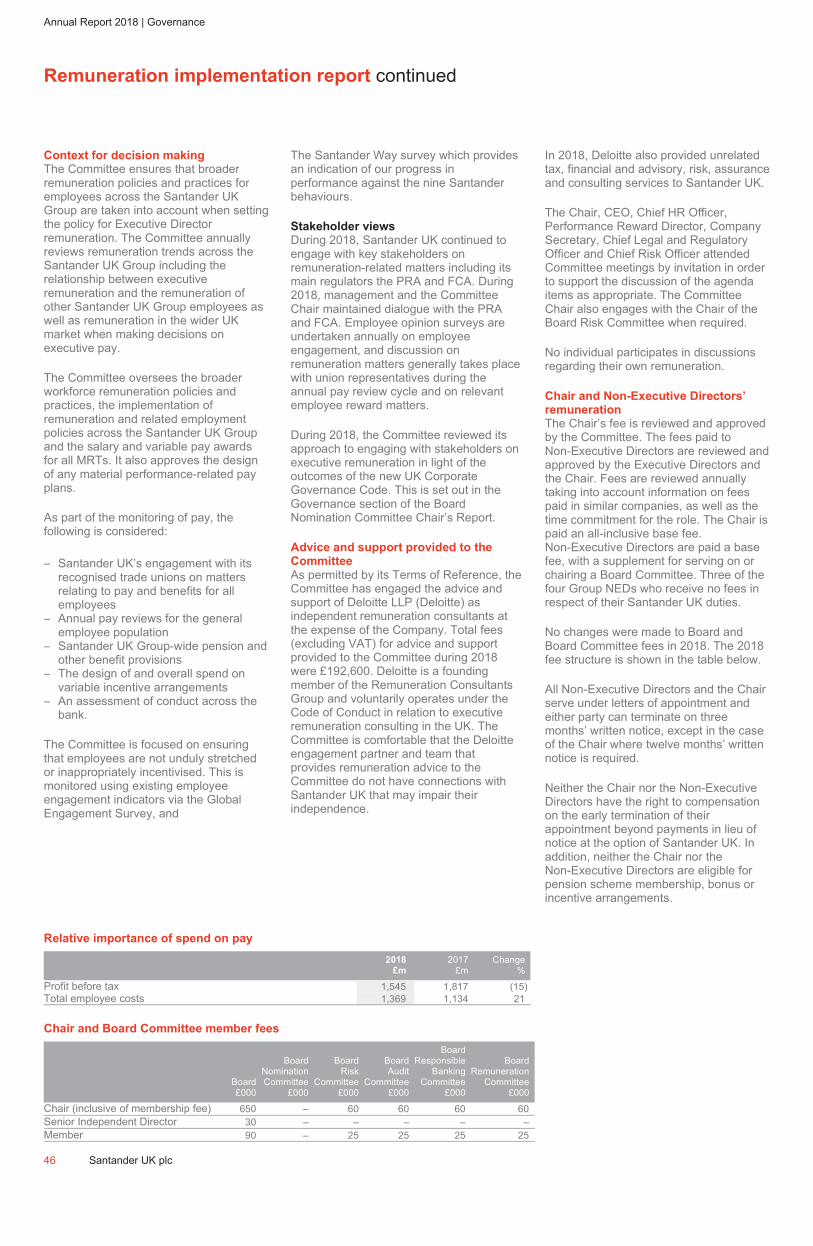
ˆ200G2Mlv!2=R&976SŠ200G2Mlv!2=R&976S
628340 TX 46SANTANDERFORM 20-F (SAN UK PL
04-Mar-2019 02:03 ESTHTMLON
Donnelley Financial EGV annas1dc 10*ESS 0C
VDI-W7-PFD-029812.9.12.0
Page 1 of 1
Annual Report 2018 | Governance
Remuneration implementation report continued
Relative importance of spend on pay
2018
£m
2017
£m
Change
%
Profit before tax 1,545 1,817 (15)
Total employee costs 1,369 1,134 21
Chair and Board Committee member fees
Board
£000
Board
Nomination
Committee
£000
Board
Risk
Committee
£000
Board
Audit
Committee
£000
Board
Responsible
Banking
Committee
£000
Board
Remuneration
Committee
£000
Chair (inclusive of membership fee) 650 – 60 60 60 60
Senior Independent Director 30 – – – – –
Member 90 – 25 25 25 25
46 Santander UK plc
Context for decision making
The Committee ensures that broader
remuneration policies and practices for
employees across the Santander UK
Group are taken into account when setting
the policy for Executive Director
remuneration. The Committee annually
reviews remuneration trends across the
Santander UK Group including the
relationship between executive
remuneration and the remuneration of
other Santander UK Group employees as
well as remuneration in the wider UK
market when making decisions on
executive pay.
The Committee oversees the broader
workforce remuneration policies and
practices, the implementation of
remuneration and related employment
policies across the Santander UK Group
and the salary and variable pay awards
for all MRTs. It also approves the design
of any material performance-related pay
plans.
As part of the monitoring of pay, the
following is considered:
– Santander UK’s engagement with its
recognised trade unions on matters
relating to pay and benefits for all
employees
– Annual pay reviews for the general
employee population
– Santander UK Group-wide pension and
other benefit provisions
– The design of and overall spend on
variable incentive arrangements
– An assessment of conduct across the
bank.
The Committee is focused on ensuring
that employees are not unduly stretched
or inappropriately incentivised. This is
monitored using existing employee
engagement indicators via the Global
Engagement Survey, and
The Santander Way survey which provides
an indication of our progress in
performance against the nine Santander
behaviours.
Stakeholder views
During 2018, Santander UK continued to
engage with key stakeholders on
remuneration-related matters including its
main regulators the PRA and FCA. During
2018, management and the Committee
Chair maintained dialogue with the PRA
and FCA. Employee opinion surveys are
undertaken annually on employee
engagement, and discussion on
remuneration matters generally takes place
with union representatives during the
annual pay review cycle and on relevant
employee reward matters.
During 2018, the Committee reviewed its
approach to engaging with stakeholders on
executive remuneration in light of the
outcomes of the new UK Corporate
Governance Code. This is set out in the
Governance section of the Board
Nomination Committee Chair’s Report.
Advice and support provided to the
Committee
As permitted by its Terms of Reference, the
Committee has engaged the advice and
support of Deloitte LLP (Deloitte) as
independent remuneration consultants at
the expense of the Company. Total fees
(excluding VAT) for advice and support
provided to the Committee during 2018
were £192,600. Deloitte is a founding
member of the Remuneration Consultants
Group and voluntarily operates under the
Code of Conduct in relation to executive
remuneration consulting in the UK. The
Committee is comfortable that the Deloitte
engagement partner and team that
provides remuneration advice to the
Committee do not have connections with
Santander UK that may impair their
independence.
In 2018, Deloitte also provided unrelated
tax, financial and advisory, risk, assurance
and consulting services to Santander UK.
The Chair, CEO, Chief HR Officer,
Performance Reward Director, Company
Secretary, Chief Legal and Regulatory
Officer and Chief Risk Officer attended
Committee meetings by invitation in order
to support the discussion of the agenda
items as appropriate. The Committee
Chair also engages with the Chair of the
Board Risk Committee when required.
No individual participates in discussions
regarding their own remuneration.
Chair and Non-Executive Directors’
remuneration
The Chair’s fee is reviewed and approved
by the Committee. The fees paid to
Non-Executive Directors are reviewed and
approved by the Executive Directors and
the Chair. Fees are reviewed annually
taking into account information on fees
paid in similar companies, as well as the
time commitment for the role. The Chair is
paid an all-inclusive base fee.
Non-Executive Directors are paid a base
fee, with a supplement for serving on or
chairing a Board Committee. Three of the
four Group NEDs who receive no fees in
respect of their Santander UK duties.
No changes were made to Board and
Board Committee fees in 2018. The 2018
fee structure is shown in the table below.
All Non-Executive Directors and the Chair
serve under letters of appointment and
either party can terminate on three
months’ written notice, except in the case
of the Chair where twelve months’ written
notice is required.
Neither the Chair nor the Non-Executive
Directors have the right to compensation
on the early termination of their
appointment beyond payments in lieu of
notice at the option of Santander UK. In
addition, neither the Chair nor the
Non-Executive Directors are eligible for
pension scheme membership, bonus or
incentive arrangements.
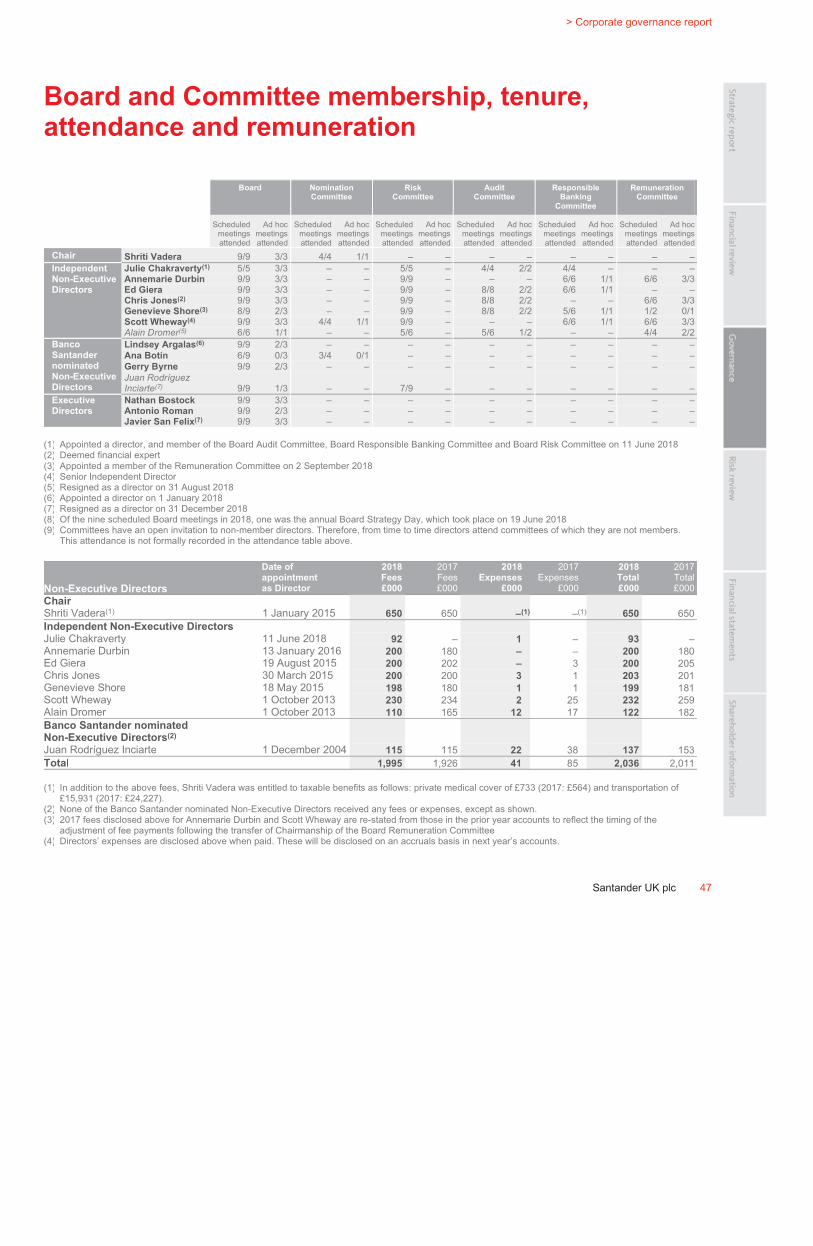
ˆ200G2Mlv!2=eS%rgzŠ200G2Mlv!2=eS%rgz
628340 TX 47SANTANDERFORM 20-F (SAN UK PL
04-Mar-2019 02:11 ESTHTMLON
Donnelley Financial EGV annas1dc 22*ESS 0C
VDI-W7-PFD-029812.9.12.0
bar3
Page 1 of 1
> Corporate governance report
Santander UK plc 47
Board and Committee membership, tenure,
attendance and remuneration
Board Nomination
Committee
Risk
Committee
Audit
Committee
Responsible
Banking
Committee
Remuneration
Committee
Scheduled
meetings
attended
Ad hoc
meetings
attended
Scheduled
meetings
attended
Ad hoc
meetings
attended
Scheduled
meetings
attended
Ad hoc
meetings
attended
Scheduled
meetings
attended
Ad hoc
meetings
attended
Scheduled
meetings
attended
Ad hoc
meetings
attended
Scheduled
meetings
attended
Ad hoc
meetings
attended
Chair Shriti Vadera 9/9 3/3 4/4 1/1 – – – – – – – –
Independent
Non-Executive
Directors
Julie Chakraverty(1) 5/5 3/3 – – 5/5 – 4/4 2/2 4/4 – – –
Annemarie Durbin 9/9 3/3 – – 9/9 – – – 6/6 1/1 6/6 3/3
Ed Giera 9/9 3/3 – – 9/9 – 8/8 2/2 6/6 1/1 – –
Chris Jones(2) 9/9 3/3 – – 9/9 – 8/8 2/2 – – 6/6 3/3
Genevieve Shore(3) 8/9 2/3 – – 9/9 – 8/8 2/2 5/6 1/1 1/2 0/1
Scott Wheway(4) 9/9 3/3 4/4 1/1 9/9 – – – 6/6 1/1 6/6 3/3
Alain Dromer(5) 6/6 1/1 – – 5/6 – 5/6 1/2 – – 4/4 2/2
Banco
Santander
nominated
Non-Executive
Directors
Lindsey Argalas(6) 9/9 2/3 – – – – – – – – – –
Ana Botín 6/9 0/3 3/4 0/1 – – – – – – – –
Gerry Byrne 9/9 2/3 – – – – – – – – – –
Juan Rodríguez
Inciarte(7) 9/9 1/3 – – 7/9 – – – – – – –
Executive
Directors
Nathan Bostock 9/9 3/3 – – – – – – – – – –
Antonio Roman 9/9 2/3 – – – – – – – – – –
Javier San Felix(7)
9/9 3/3 – – – – – – – – – –
(1) Appointed a director, and member of the Board Audit Committee, Board Responsible Banking Committee and Board Risk Committee on 11 June 2018
(2) Deemed financial expert
(3) Appointed a member of the Remuneration Committee on 2 September 2018
(4) Senior Independent Director
(5) Resigned as a director on 31 August 2018
(6) Appointed a director on 1 January 2018
(7) Resigned as a director on 31 December 2018
(8) Of the nine scheduled Board meetings in 2018, one was the annual Board Strategy Day, which took place on 19 June 2018
(9) Committees have an open invitation to non-member directors. Therefore, from time to time directors attend committees of which they are not members.
This attendance is not formally recorded in the attendance table above.
Non-Executive Directors
Date of
appointment
as Director
2018
Fees
£000
2017
Fees
£000
2018
Expenses
£000
2017
Expenses
£000
2018
Total
£000
2017
Total
£000
Chair
Shriti Vadera(1) 1 January 2015 650 650 –(1) –(1) 650 650
Independent Non-Executive Directors
Julie Chakraverty 11 June 2018 92 – 1 – 93 –
Annemarie Durbin 13 January 2016 200 180 – – 200 180
Ed Giera 19 August 2015 200 202 – 3 200 205
Chris Jones 30 March 2015 200 200 3 1 203 201
Genevieve Shore 18 May 2015 198 180 1 1 199 181
Scott Wheway 1 October 2013 230 234 2 25 232 259
Alain Dromer 1 October 2013 110 165 12 17 122 182
Banco Santander nominated
Non-Executive Directors(2)
Juan Rodríguez Inciarte 1 December 2004 115 115 22 38 137 153
Total 1,995 1,926 41 85 2,036 2,011
(1) In addition to the above fees, Shriti Vadera was entitled to taxable benefits as follows: private medical cover of £733 (2017: £564) and transportation of
£15,931 (2017: £24,227).
(2) None of the Banco Santander nominated Non-Executive Directors received any fees or expenses, except as shown.
(3) 2017 fees disclosed above for Annemarie Durbin and Scott Wheway are re-stated from those in the prior year accounts to reflect the timing of the
adjustment of fee payments following the transfer of Chairmanship of the Board Remuneration Committee
(4) Directors’ expenses are disclosed above when paid. These will be disclosed on an accruals basis in next year’s accounts.
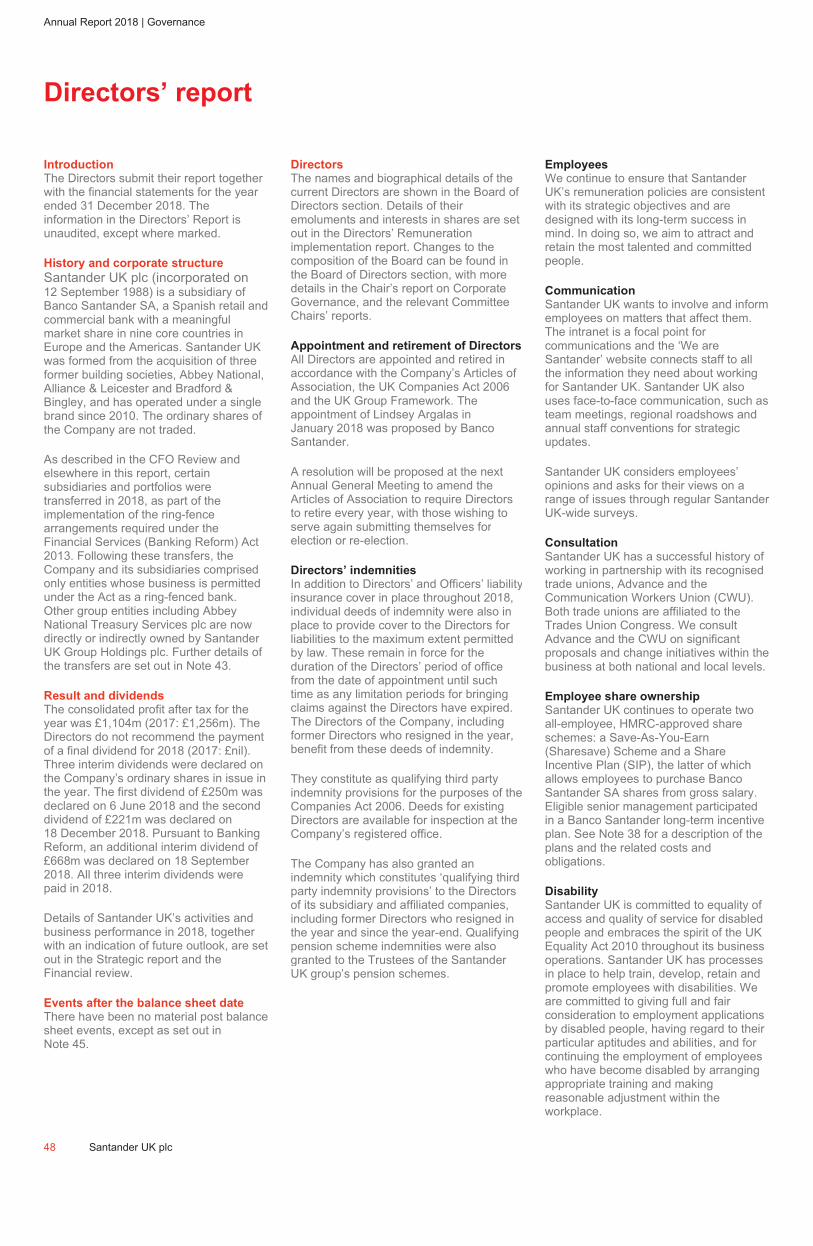
ˆ200G2Mlv!2Zk$bL6{Š200G2Mlv!2Zk$bL6{
628340 TX 48SANTANDERFORM 20-F (SAN UK PL
04-Mar-2019 01:10 ESTHTMLON
Donnelley Financial EGV gopad0dc 6*ESS 0C
VDI-W7-PFD-037812.9.12.0
Page 1 of 1
Annual Report 2018 | Governance
Directors’ report
48 Santander UK plc
Introduction
The Directors submit their report together
with the financial statements for the year
ended 31 December 2018. The
information in the Directors’ Report is
unaudited, except where marked.
History and corporate structure
Santander UK plc (incorporated on
12 September 1988) is a subsidiary of
Banco Santander SA, a Spanish retail and
commercial bank with a meaningful
market share in nine core countries in
Europe and the Americas. Santander UK
was formed from the acquisition of three
former building societies, Abbey National,
Alliance & Leicester and Bradford &
Bingley, and has operated under a single
brand since 2010. The ordinary shares of
the Company are not traded.
As described in the CFO Review and
elsewhere in this report, certain
subsidiaries and portfolios were
transferred in 2018, as part of the
implementation of the ring-fence
arrangements required under the
Financial Services (Banking Reform) Act
2013. Following these transfers, the
Company and its subsidiaries comprised
only entities whose business is permitted
under the Act as a ring-fenced bank.
Other group entities including Abbey
National Treasury Services plc are now
directly or indirectly owned by Santander
UK Group Holdings plc. Further details of
the transfers are set out in Note 43.
Result and dividends
The consolidated profit after tax for the
year was £1,104m (2017: £1,256m). The
Directors do not recommend the payment
of a final dividend for 2018 (2017: £nil).
Three interim dividends were declared on
the Company’s ordinary shares in issue in
the year. The first dividend of £250m was
declared on 6 June 2018 and the second
dividend of £221m was declared on
18 December 2018. Pursuant to Banking
Reform, an additional interim dividend of
£668m was declared on 18 September
2018. All three interim dividends were
paid in 2018.
Details of Santander UK’s activities and
business performance in 2018, together
with an indication of future outlook, are set
out in the Strategic report and the
Financial review.
Events after the balance sheet date
There have been no material post balance
sheet events, except as set out in
Note 45.
Directors
The names and biographical details of the
current Directors are shown in the Board of
Directors section. Details of their
emoluments and interests in shares are set
out in the Directors’ Remuneration
implementation report. Changes to the
composition of the Board can be found in
the Board of Directors section, with more
details in the Chair’s report on Corporate
Governance, and the relevant Committee
Chairs’ reports.
Appointment and retirement of Directors
All Directors are appointed and retired in
accordance with the Company’s Articles of
Association, the UK Companies Act 2006
and the UK Group Framework. The
appointment of Lindsey Argalas in
January 2018 was proposed by Banco
Santander.
A resolution will be proposed at the next
Annual General Meeting to amend the
Articles of Association to require Directors
to retire every year, with those wishing to
serve again submitting themselves for
election or re-election.
Directors’ indemnities
In addition to Directors’ and Officers’ liability
insurance cover in place throughout 2018,
individual deeds of indemnity were also in
place to provide cover to the Directors for
liabilities to the maximum extent permitted
by law. These remain in force for the
duration of the Directors’ period of office
from the date of appointment until such
time as any limitation periods for bringing
claims against the Directors have expired.
The Directors of the Company, including
former Directors who resigned in the year,
benefit from these deeds of indemnity.
They constitute as qualifying third party
indemnity provisions for the purposes of the
Companies Act 2006. Deeds for existing
Directors are available for inspection at the
Company’s registered office.
The Company has also granted an
indemnity which constitutes ‘qualifying third
party indemnity provisions’ to the Directors
of its subsidiary and affiliated companies,
including former Directors who resigned in
the year and since the year-end. Qualifying
pension scheme indemnities were also
granted to the Trustees of the Santander
UK group’s pension schemes.
Employees
We continue to ensure that Santander
UK’s remuneration policies are consistent
with its strategic objectives and are
designed with its long-term success in
mind. In doing so, we aim to attract and
retain the most talented and committed
people.
Communication
Santander UK wants to involve and inform
employees on matters that affect them.
The intranet is a focal point for
communications and the ‘We are
Santander’ website connects staff to all
the information they need about working
for Santander UK. Santander UK also
uses face-to-face communication, such as
team meetings, regional roadshows and
annual staff conventions for strategic
updates.
Santander UK considers employees’
opinions and asks for their views on a
range of issues through regular Santander
UK-wide surveys.
Consultation
Santander UK has a successful history of
working in partnership with its recognised
trade unions, Advance and the
Communication Workers Union (CWU).
Both trade unions are affiliated to the
Trades Union Congress. We consult
Advance and the CWU on significant
proposals and change initiatives within the
business at both national and local levels.
Employee share ownership
Santander UK continues to operate two
all-employee, HMRC-approved share
schemes: a Save-As-You-Earn
(Sharesave) Scheme and a Share
Incentive Plan (SIP), the latter of which
allows employees to purchase Banco
Santander SA shares from gross salary.
Eligible senior management participated
in a Banco Santander long-term incentive
plan. See Note 38 for a description of the
plans and the related costs and
obligations.
Disability
Santander UK is committed to equality of
access and quality of service for disabled
people and embraces the spirit of the UK
Equality Act 2010 throughout its business
operations. Santander UK has processes
in place to help train, develop, retain and
promote employees with disabilities. We
are committed to giving full and fair
consideration to employment applications
by disabled people, having regard to their
particular aptitudes and abilities, and for
continuing the employment of employees
who have become disabled by arranging
appropriate training and making
reasonable adjustment within the
workplace.

ˆ200G2Mlv!2PedQV6CŠ200G2Mlv!2PedQV6C
628340 TX 49SANTANDERFORM 20-F (SAN UK PL
02-Mar-2019 23:56 ESTHTMLON
Donnelley Financial EGV muthp0dc 6*ESS 0C
VDI-W7-PFD-011312.9.12.0
bar3
Page 1 of 2
> Directors’ report
CO2 emissions
In 2018 CO2 emissions, measured in
CO2 equivalent tonnes, decreased by
11% to 9,718 tonnes. CO2 from fuel
decreased by 3% to 5,121 tonnes,
CO2 from business travel decreased
by 19% to 4,598 tonnes and output
per employee reduced by 12% to 0.39
tonnes.
Ethical Code of Conduct
Santander UK is committed to
maintaining high ethical standards –
adhering to laws and regulations,
conducting business in a responsible
way, and treating all stakeholders with
honesty and integrity. These
principles are further reflected in
Santander UK’s Ethical Code of
Conduct, which sets out the standard
expected of all employees. Under
their terms and conditions of
employment, staff are required to act
at all times with the highest standards
of business conduct in order to
protect Santander UK’s reputation
and ensure a Company culture which
is free from any risk of corruption,
compromise or conflicts of interest.
Staff are also required to comply with
all Company policies, which require
employees to:
– Abide by all relevant laws and
regulations
– Act with integrity in all their
business actions on behalf of
Santander UK
– Not use their authority or office for
personal gain
– Conduct business relationships in a
transparent manner
– Reject all improper practices or
dealings to which they may be
exposed.
The SEC requires companies to
disclose whether they have a code of
ethics that applies to the Chief
Exective Officer and senior financial
officers which promotes honest and
ethical conduct, full, fair, accurate,
timely and understandable
disclosures, compliance with
applicable governmental laws, rules
and regulations, prompt internal
reporting of violations, and
accountability for adherence to such a
code of ethics.
The Santander UK group meets these
requirements through its Ethical Code
of Conduct, the Anti-Bribery and
Corruption Policy, the Whistleblowing
Policy, the FCA’s Principles for
Businesses, and the FCA’s
Statements of Principle and Code of
Practice for Approved Persons, with
which the CEO and senior financial
officers must comply. These include
requirements to manage conflicts of
interest appropriately and to disclose
Copies of these documents are
available to anyone, free of charge, on
application to Santander UK plc,
2 Triton Square, Regent’s Place,
London NW1 3AN.
Political contributions
In 2018 and 2017, no contributions
were made by the Company for
political purposes and no political
expenditure was incurred.
Share capital
Details about the structure of the
Company’s capital can be found in
Note 33.
For details of employee share schemes
and how rights are exercisable, see
Note 38.
The powers of the Directors in relation
to share capital are set out in the
Company’s Articles of Association as
determined by the Companies Act
2006.
Subsidiaries and branches
The Santander UK group consists of a
parent company, Santander UK plc,
incorporated in England and Wales,
and a number of directly and indirectly
held subsidiaries and associates. The
Company directly or indirectly holds
100% of the issued ordinary share
capital of its principal subsidiaries.
All companies operate principally in
their country of incorporation or
registration. For more information, see
Note 21.
Financial instruments
The financial risk management
objectives and policies of Santander
UK, the policy for hedging, and the
exposure of Santander UK to credit
risk, market risk and liquidity risk are
outlined in the Risk review.
Research and development
Santander UK has a comprehensive
product approval process and policy.
New products, campaigns and
business initiatives are reviewed by
Santander UK’s Proposition Approval
Forum.
Supervision and regulation
Santander UK is authorised by the
PRA and regulated by the FCA and the
PRA. Some of its subsidiaries and
associates are also authorised by the
PRA or the FCA, and regulated by the
FCA or both the FCA and the PRA.
While Santander UK operates primarily
in the UK, it is also subject to the laws
and regulations of the other
jurisdictions in which it operates, such
as the requirements of the SEC for its
activities in the US.
Internal controls
Risk management and internal
controls
The Board and its Committees are
responsible for reviewing and
ensuring the effectiveness of
management’s system of risk
management and internal controls.
We have carried out a robust
assessment of the principal risks
facing Santander UK (as set out in
‘How we define our risks’ in the Risk
governance section of the Risk
review) including those that would
threaten its business model, future
performance, solvency or liquidity. For
more details, see the Strategic report
and the Risk review.
Management’s report on internal
control over financial reporting
Internal control over financial
reporting is a component of an overall
system of internal control. Santander
UK’s internal control over financial
reporting is designed to provide
reasonable assurance regarding the
reliability of financial reporting, and
the preparation and fair presentation
of financial statements for external
purposes in accordance with
International Financial Reporting
Standards (IFRS) as issued by the
International Accounting Standards
Board (IASB) and endorsed by the
EU.
Santander UK’s internal control over
financial reporting includes:
– Policies and procedures that relate
to the maintenance of records that
fairly and accurately reflect
transactions and dispositions of
assets
– Controls providing reasonable
assurance that transactions are
recorded as necessary to permit
the preparation of financial
statements in accordance with
IFRS, and that receipts and
expenditures are being made only
as authorised by management
– Controls providing reasonable
assurance regarding prevention or
timely detection of unauthorised
acquisition, use or disposition of
assets that could have a material
effect on the financial statements.
Because of its inherent limitations,
internal control over financial
reporting may not prevent or detect
misstatements. In addition,
projections of any evaluation of
effectiveness to future periods are
subject to the risk that controls may
become inadequate because of
changes in conditions, or because the
degree of compliance with policies or
procedures may deteriorate.

ˆ200G2Mlv!2PedQV6CŠ200G2Mlv!2PedQV6C
628340 TX 49SANTANDERFORM 20-F (SAN UK PL
02-Mar-2019 23:56 ESTHTMLON
Donnelley Financial EGV muthp0dc 6*ESS 0C
VDI-W7-PFD-011312.9.12.0
bar3
Page 2 of 2
Santander UK plc 49
any information the FCA may want to
know about.
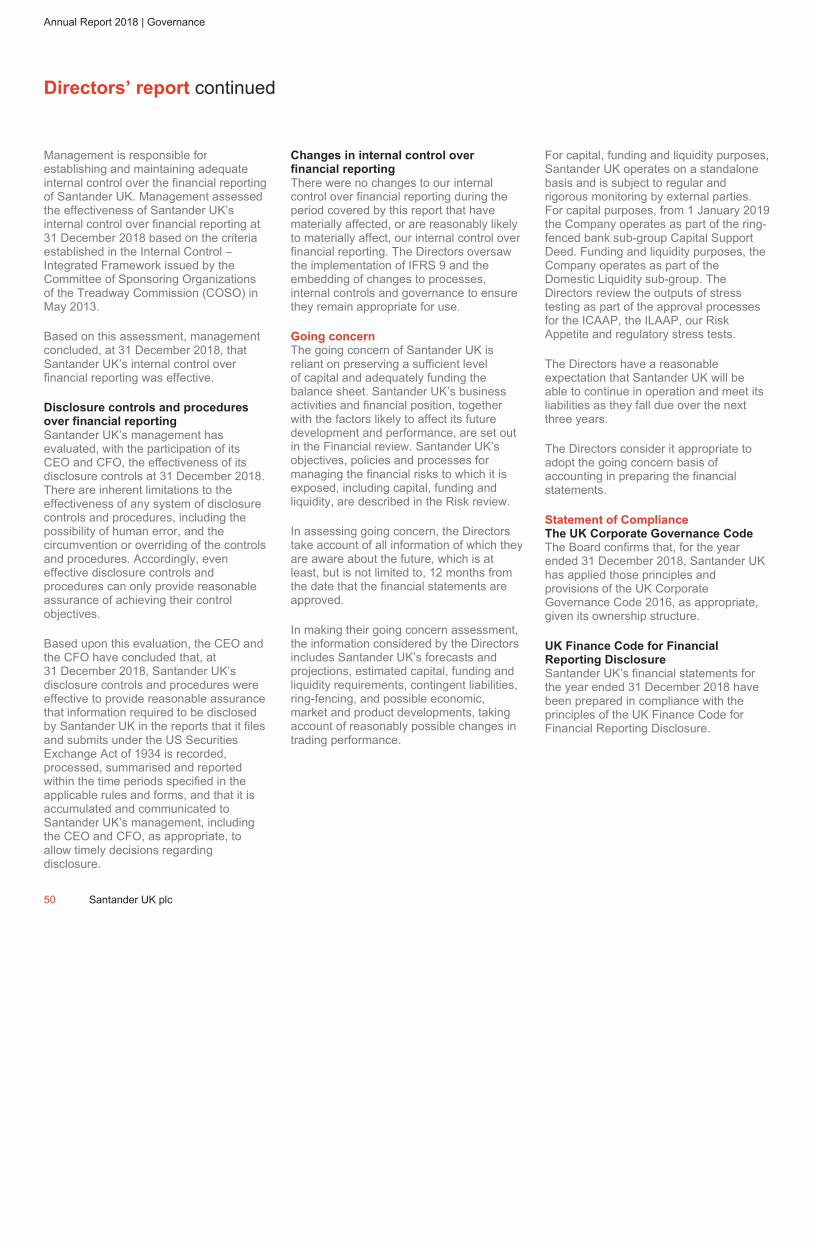
ˆ200G2Mlv!3HBe2t6qŠ200G2Mlv!3HBe2t6q
628340 TX 50SANTANDERFORM 20-F (SAN UK PL
06-Mar-2019 11:16 ESTHTMLON
Donnelley Financial EGV beagp0ln 6*ESS 0C
VDI-W7-PFD-043112.9.12.0
Page 1 of 1
Annual Report 2018 | Governance
Directors’ report continued
50 Santander UK plc
Management is responsible for
establishing and maintaining adequate
internal control over the financial reporting
of Santander UK. Management assessed
the effectiveness of Santander UK’s
internal control over financial reporting at
31 December 2018 based on the criteria
established in the Internal Control –
Integrated Framework issued by the
Committee of Sponsoring Organizations
of the Treadway Commission (COSO) in
May 2013.
Based on this assessment, management
concluded, at 31 December 2018, that
Santander UK’s internal control over
financial reporting was effective.
Disclosure controls and procedures
over financial reporting
Santander UK’s management has
evaluated, with the participation of its
CEO and CFO, the effectiveness of its
disclosure controls at 31 December 2018.
There are inherent limitations to the
effectiveness of any system of disclosure
controls and procedures, including the
possibility of human error, and the
circumvention or overriding of the controls
and procedures. Accordingly, even
effective disclosure controls and
procedures can only provide reasonable
assurance of achieving their control
objectives.
Based upon this evaluation, the CEO and
the CFO have concluded that, at
31 December 2018, Santander UK’s
disclosure controls and procedures were
effective to provide reasonable assurance
that information required to be disclosed
by Santander UK in the reports that it files
and submits under the US Securities
Exchange Act of 1934 is recorded,
processed, summarised and reported
within the time periods specified in the
applicable rules and forms, and that it is
accumulated and communicated to
Santander UK’s management, including
the CEO and CFO, as appropriate, to
allow timely decisions regarding
disclosure.
Changes in internal control over
financial reporting
There were no changes to our internal
control over financial reporting during the
period covered by this report that have
materially affected, or are reasonably likely
to materially affect, our internal control over
financial reporting. The Directors oversaw
the implementation of IFRS 9 and the
embedding of changes to processes,
internal controls and governance to ensure
they remain appropriate for use.
Going concern
The going concern of Santander UK is
reliant on preserving a sufficient level
of capital and adequately funding the
balance sheet. Santander UK’s business
activities and financial position, together
with the factors likely to affect its future
development and performance, are set out
in the Financial review. Santander UK’s
objectives, policies and processes for
managing the financial risks to which it is
exposed, including capital, funding and
liquidity, are described in the Risk review.
In assessing going concern, the Directors
take account of all information of which they
are aware about the future, which is at
least, but is not limited to, 12 months from
the date that the financial statements are
approved.
In making their going concern assessment,
the information considered by the Directors
includes Santander UK’s forecasts and
projections, estimated capital, funding and
liquidity requirements, contingent liabilities,
ring-fencing, and possible economic,
market and product developments, taking
account of reasonably possible changes in
trading performance.
For capital, funding and liquidity purposes,
Santander UK operates on a standalone
basis and is subject to regular and
rigorous monitoring by external parties.
For capital purposes, from 1 January 2019
the Company operates as part of the ring-
fenced bank sub-group Capital Support
Deed. Funding and liquidity purposes, the
Company operates as part of the
Domestic Liquidity sub-group. The
Directors review the outputs of stress
testing as part of the approval processes
for the ICAAP, the ILAAP, our Risk
Appetite and regulatory stress tests.
The Directors have a reasonable
expectation that Santander UK will be
able to continue in operation and meet its
liabilities as they fall due over the next
three years.
The Directors consider it appropriate to
adopt the going concern basis of
accounting in preparing the financial
statements.
Statement of Compliance
The UK Corporate Governance Code
The Board confirms that, for the year
ended 31 December 2018, Santander UK
has applied those principles and
provisions of the UK Corporate
Governance Code 2016, as appropriate,
given its ownership structure.
UK Finance Code for Financial
Reporting Disclosure
Santander UK’s financial statements for
the year ended 31 December 2018 have
been prepared in compliance with the
principles of the UK Finance Code for
Financial Reporting Disclosure.
ˆ200G2Mlv!2KlT9r6KŠ200G2Mlv!2KlT9r6K
628340 TX 51SANTANDERFORM 20-F (SAN UK PL
02-Mar-2019 11:13 ESTHTMLON
Donnelley Financial EGV yuraa0dc 7*ESS 0C
VDI-W7-PFL-140512.9.12.0
bar3f51
Page 1 of 1
> Directors’ report
Santander UK plc 51
Disclosure of information to
Auditors
Each of the Directors at the date of
approval of this report confirms that:
– So far as the Director is aware,
there is no relevant audit
information of which Santander
UK’s auditor is unaware
– The Director has taken all steps
that they ought to have taken as a
Director to make himself or herself
aware of any relevant audit
information and to establish that
Santander UK’s auditor is aware of
that information.
This confirmation is given and should
be interpreted in accordance with the
provisions of Section 418 of the UK
Companies Act 2006.
Auditor
PricewaterhouseCoopers LLP have
expressed their willingness to
continue in the office of auditor and a
resolution to reappoint them will be
proposed at the Company’s
forthcoming Annual General Meeting.
By Order of the Board
Marc Boston
Company Secretary
26 February 2019
2 Triton Square, Regent’s Place,
London NW1 3AN
ˆ200G2Mlv!2ZQXy=gÈŠ200G2Mlv!2ZQXy=g¨
628340 TX 52SANTANDERFORM 20-F (SAN UK PL
04-Mar-2019 00:46 ESTHTMLON
Donnelley Financial EGV gopad0dc 10*ESS 0C
VDI-W7-PFD-037812.9.12.0
Page 1 of 1
Annual Report 2018 | Risk review
Risk review
This Risk review consists of audited financial information except where it is
marked as unaudited.
The audited financial information is an integral part of our Consolidated
Financial Statements.
Contents
Risk governance 53
Introduction (unaudited) 53
Risk Framework 53
Risk Appetite (unaudited) 57
Stress Testing (unaudited) 58
How risk is distributed across our
business (unaudited) 58
Credit risk 59
Santander UK group level 59
Retail Banking 74
Other business segments 86
Market risk 96
Banking market risk 97
Trading market risk 100
Liquidity risk 103
Capital risk 111
Pension risk (unaudited) 114
Conduct and regulatory risk (unaudited) 117
Other key risks (unaudited) 120
Operational risk 120
Financial crime risk 123
Legal risk 125
Strategic risk 125
Reputational risk 126
Model risk 126
52 Santander UK plc

ˆ200G2Mlv!2Z%Fkn64Š200G2Mlv!2Z%Fkn64
628340 TX 53SANTANDERFORM 20-F (SAN UK PL
04-Mar-2019 01:36 ESTHTMLON
Donnelley Financial EGV gopad0dc 8*ESS 0C
VDI-W7-PFD-037812.9.12.0
bar4
Page 1 of 2
> Risk governance
Risk governance
INTRODUCTION (UNAUDITED)
Santander UK Group Holdings plc is the immediate parent company of Santander UK plc. The two companies operate on the basis of a
unified business strategy and have common Boards, albeit the principal business activities of the Santander UK Group Holdings plc group
are carried on by Santander UK plc and its subsidiaries.
The Santander UK Group Holdings plc Risk Frameworks have been adopted by the Company and its subsidiaries to ensure consistency of
application. Prior to November 2018, the Risk Frameworks were applied from the level of Santander UK plc across the Santander UK
group and adopted by Santander UK Group Holdings plc.
As a result, the review of the principal risks and uncertainties facing the Company, and the description of the Company’s risk management
arrangements, are integrated with those of Santander UK Group Holdings plc and are reported in this Annual Report as operating within
the Company for all periods presented.
As a financial services provider, managing risk is a core part of our day-to-day activities. To be able to manage our business effectively, it
is critical that we understand and control risk in everything we do. We aim to use a prudent approach and advanced risk management
techniques to help us deliver robust financial performance and build sustainable value for our stakeholders.
We aim to keep a predictable medium-low risk profile, consistent with our business model. This is key to achieving our strategic objectives.
RISK FRAMEWORK
Key elements (unaudited)
Our Risk Framework sets out how we manage and control risk. In 2018, we updated our Risk Framework partly in preparation for ring-
fencing to ensure it remains comprehensive and to improve our focus on key risk issues. This update reflected the establishment of a
Senior Management Committee, under the authority of the CEO, to focus on the responsibilities of the Executive Committee Senior
Management Function holders and how they are discharged.
How we define risk (unaudited)
Risk is any uncertainty about us being able to achieve our business objectives. It can be split into a set of key risk types, each of which
could affect our results and our financial resources. Enterprise wide risk is the aggregate view of all the key risk types described below:
Key risk types Description
Credit The risk of loss due to the default or credit quality deterioration of a customer or counterparty to which
we have provided credit, or for which we have assumed a financial obligation.
Market Banking market risk – the risk of loss of income or economic value due to changes to interest rates in
the banking book or to changes in exchange rates, where such changes would affect our net worth
through an adjustment to revenues, assets, liabilities and off-balance sheet exposures in the banking
book.
Trading market risk – the risk incurred as a result of changes in market factors that affect the value of
positions in the trading book.
Liquidity The risk that we do not have sufficient liquid financial resources available to meet our obligations as
they fall due, or we can only secure such resources at excessive cost.
Capital The risk that we do not have an adequate amount or quality of capital to meet our internal business
objectives, regulatory requirements, market expectations and dividend payments, including AT1
coupons.
Pension The risk caused by our contractual or other liabilities with respect to a pension scheme (whether
established for our employees or those of a related company or otherwise). It also refers to the risk that
we will need to make payments or other contributions with respect to a pension scheme due to a moral
obligation or for some other reason.
Conduct and
regulatory
Conduct risk – the risk that our decisions and behaviours lead to a detriment or poor outcome for our
customers. It also refers to the risk that we fail to maintain high standards of market behaviour and
integrity.
Regulatory risk – the risk of financial or reputational loss, or imposition or conditions on regulatory
permission, as a result of failing to comply with applicable codes, regulator’s rules, guidance and
regulatory expectations.
Other key risk types Operational risk – the risk of loss due to inadequate or failed internal processes, people and systems, or
external events. We give a particular focus to process and change management risk, third party risk and
cyber risk which we mitigate through our management of operational risk.
Financial crime risk – the risk that we are used to further financial crime, including money laundering,
sanctions evasion, terrorist financing, bribery and corruption. Failure to meet our legal and regulatory
obligations could result in criminal or civil penalties against Santander UK or individuals, as well as
negatively affecting our customers and the communities we serve.
Legal risk – the risk of an impact arising from legal deficiencies in contracts; failure to take appropriate
measures to protect assets; failure to manage legal disputes appropriately; failure to assess or
implement the requirements of a change of law; or failure to comply with law or regulation or to
discharge duties or responsibilities created by law or regulation.
Strategic risk – the risk of significant loss or damage arising from strategic decisions that impact the
long-term interests of our key stakeholders or from an inability to adapt to external developments.
Reputational risk – the risk of damage to the way our reputation and brand are perceived by the public,
clients, government, colleagues, investors or any other interested party.
Model risk – the risk that the results of our models may be inaccurate, causing us to make sub-optimal
decisions, or that a model may be used inappropriately.

ˆ200G2Mlv!2Z%Fkn64Š200G2Mlv!2Z%Fkn64
628340 TX 53SANTANDERFORM 20-F (SAN UK PL
04-Mar-2019 01:36 ESTHTMLON
Donnelley Financial EGV gopad0dc 8*ESS 0C
VDI-W7-PFD-037812.9.12.0
bar4
Page 2 of 2Santander UK plc 53

ˆ200G2Mlv!2K&f$1guŠ200G2Mlv!2K&f$1gu
628340 TX 54SANTANDERFORM 20-F (SAN UK PL
02-Mar-2019 12:04 ESTHTMLON
Donnelley Financial EGV vikuv0dc 9*ESS 0C
VDI-W7-PFL-136512.9.12.0
f54
Page 1 of 1
Annual Report 2018 | Risk review
How we approach risk – our culture and principles (unaudited)The complexity and importance of the financial services industry demands a strong risk culture. We have extensive systems, controls and safeguards in place to manage and control the risks we face, but it is also crucial that everyone takes personal responsibility for managing risk. Our risk culture plays a key role in our aim to be the best bank for our customers, shareholders, people and communities by acting responsibly. It is vital that everyone in our business understands this. To achieve this, our people have a strong, shared understanding of what risk is, and what their role is in helping to control it. We express this in our Risk Culture Statement:
Risk Culture Statement
Santander UK will only take risks that it understands and will always remain prudent in identifying, assessing, managing and reporting all risks. We proactively encourage our people to take personal responsibility for doing the right thing and to challenge without fear. We ensure decisions and actions take account of the best interests of all our stakeholders and are in line with The Santander Way.
The Board reviews and approves our Risk Culture Statement every year. The CEO, CRO, CLRO and other senior executives are responsible for promoting our risk culture from the top. They drive cultural change and increased accountability across the business. We reinforce our Risk Culture Statement and embed our risk culture in all our business units through our Risk Framework, Risk Certifications and other initiatives. This includes highlighting that:
– It is everyone’s personal responsibility to play their part in managing risk – We must Identify, Assess, Manage and Report risk quickly and accurately – We make risk part of how we assess our people’s performance and how we recruit, develop and reward them – Our internal control system is essential to make sure we manage and control risk in line with our principles, standards, Risk Appetite and policies.
We use Risk Certifications to confirm how we manage and control risks in line with our Risk Framework and within our Risk Appetite. As an example, every year, each member of our Executive Committee confirms in writing that they have managed risk in line with the Risk Framework in the part of the business for which they are responsible. Their certification lists any exceptions and the agreed actions to be taken to correct them. This is a tangible sign of the personal responsibility that is such a key part of our risk culture.
Our Risk Culture programme, I AM Risk, continues to play a key part in our aim to be the best bank for our people, customers, shareholders and communities. Our I AM Risk approach aims to make sure our people:
– Identify risks and opportunities – Assess their probability and impact – Manage the risks and suggest alternatives – Report, challenge, review, learn and ‘speak up’.
We use I AM Risk in our risk certifications, policies, frameworks and governance, and risk-related communications. We also include it in mandatory training and induction courses for our staff, in our codes of conduct and in reward arrangements. We embed behaviours we want to encourage in key processes and documents.
I AM Risk is how we make risk management part of everyone’s life as a Santander UK employee, from how we recruit them and manage their performance to how we develop and reward them. It is also how we encourage people to take personal responsibility for risk, to speak up and to come up with ideas. To support this, our learning website includes e-learning videos and factsheets. As part of I AM Risk, we include mandatory risk objectives for all our people in our performance management processes – from our Executive Committee to branch staff. The Executive Committee leads all our culture initiatives under the sponsorship of the CEO.
In our most recent employment engagement survey, over 90% of employees acknowledged their personal responsibility for the risks they face in their day-to-day work. This demonstrates how we have embedded risk management in our culture.
Our risk governance structure
We are committed to the highest standards of corporate governance in every part of our business. This includes risk management. For details of our governance, including the Board and its Committees, see the ‘Governance’ section of this Annual Report. The Board delegates certain responsibilities to Board Level Committees as needed and where appropriate. Our risk governance structure strengthens our ability to identify, assess, manage and report risks, as follows:
– Committees: A number of Board and Executive committees are responsible for specific parts of our Risk Framework – Key senior management roles with risk management responsibilities: Senior roles with specific responsibilities for risk – Risk organisational structure: We have ‘three lines of defence’ built into the way we run our business.
Committees
The Board Level Committee responsibilities for risk are:
Board Level Committee Main risk responsibilitiesThe Board – Has overall responsibility for business execution and for managing risk
– Reviews and approves the Risk Framework and Risk Appetite.
Board Risk Committee – Assesses the Risk Framework and recommends it to the Board for approval – Advises the Board on our overall Risk Appetite, tolerance and strategy – Oversees our exposure to risk and our strategy and advises the Board on both – Reviews the effectiveness of our risk management systems and internal controls.
Board Responsible Banking
Committee
– Responsible for culture and operational risks relating to conduct, compliance, competition, financial crime and legal matters
– Reviews reports from the CLRO on the adequacy and effectiveness of the compliance function – Ensures that adequate and effective control processes are in place to identify and manage reputational risks – Oversees our reputation and how this impacts our brand and market positioning.
Board Audit Committee – Monitors and reviews the integrity of the financial statements, and any formal announcements relating to the financial performance
– Reviews the adequacy and effectiveness of the internal financial controls and whistleblowing arrangements – Monitors and reviews the effectiveness of Santander UK’s internal audit function.
54 Santander UK plc
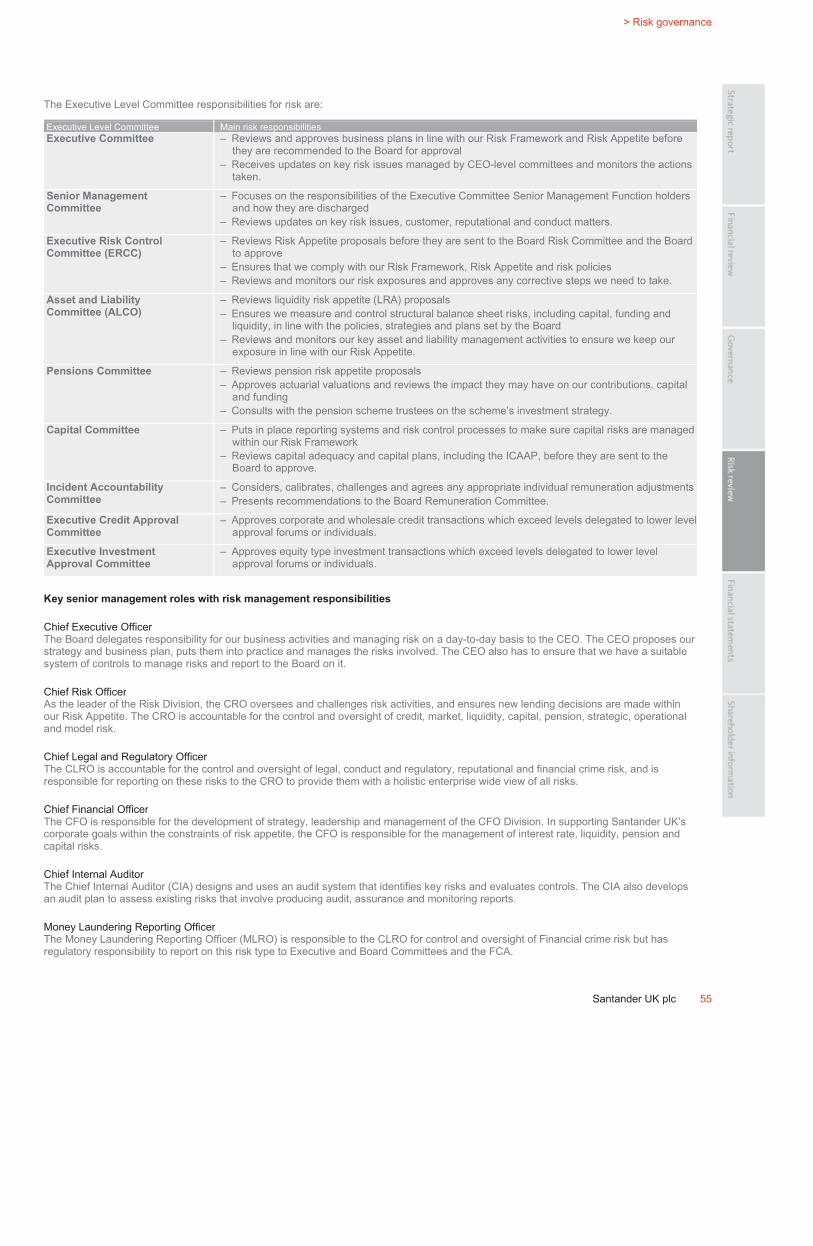
ˆ200G2Mlv!2K&bS3gÀŠ200G2Mlv!2K&bS3g
628340 TX 55SANTANDERFORM 20-F (SAN UK PL
02-Mar-2019 12:04 ESTHTMLON
Donnelley Financial EGV yuraa0dc 5*ESS 0C
VDI-W7-PFL-140512.9.12.0
bar4
Page 1 of 1
> Risk governance
Santander UK plc 55
The Executive Level Committee responsibilities for risk are:
Executive Level Committee Main risk responsibilitiesExecutive Committee – Reviews and approves business plans in line with our Risk Framework and Risk Appetite before
they are recommended to the Board for approval – Receives updates on key risk issues managed by CEO-level committees and monitors the actions
taken.
Senior Management
Committee
– Focuses on the responsibilities of the Executive Committee Senior Management Function holders and how they are discharged
– Reviews updates on key risk issues, customer, reputational and conduct matters.
Executive Risk Control
Committee (ERCC)
– Reviews Risk Appetite proposals before they are sent to the Board Risk Committee and the Board to approve
– Ensures that we comply with our Risk Framework, Risk Appetite and risk policies – Reviews and monitors our risk exposures and approves any corrective steps we need to take.
Asset and Liability
Committee (ALCO)
– Reviews liquidity risk appetite (LRA) proposals – Ensures we measure and control structural balance sheet risks, including capital, funding and
liquidity, in line with the policies, strategies and plans set by the Board – Reviews and monitors our key asset and liability management activities to ensure we keep our
exposure in line with our Risk Appetite.
Pensions Committee – Reviews pension risk appetite proposals – Approves actuarial valuations and reviews the impact they may have on our contributions, capital
and funding – Consults with the pension scheme trustees on the scheme’s investment strategy.
Capital Committee – Puts in place reporting systems and risk control processes to make sure capital risks are managed within our Risk Framework
– Reviews capital adequacy and capital plans, including the ICAAP, before they are sent to the Board to approve.
Incident Accountability
Committee
– Considers, calibrates, challenges and agrees any appropriate individual remuneration adjustments– Presents recommendations to the Board Remuneration Committee.
Executive Credit Approval
Committee
– Approves corporate and wholesale credit transactions which exceed levels delegated to lower level approval forums or individuals.
Executive Investment
Approval Committee
– Approves equity type investment transactions which exceed levels delegated to lower level approval forums or individuals.
Key senior management roles with risk management responsibilities
Chief Executive Officer The Board delegates responsibility for our business activities and managing risk on a day-to-day basis to the CEO. The CEO proposes our strategy and business plan, puts them into practice and manages the risks involved. The CEO also has to ensure that we have a suitable system of controls to manage risks and report to the Board on it.
Chief Risk Officer As the leader of the Risk Division, the CRO oversees and challenges risk activities, and ensures new lending decisions are made within our Risk Appetite. The CRO is accountable for the control and oversight of credit, market, liquidity, capital, pension, strategic, operational and model risk.
Chief Legal and Regulatory Officer The CLRO is accountable for the control and oversight of legal, conduct and regulatory, reputational and financial crime risk, and is responsible for reporting on these risks to the CRO to provide them with a holistic enterprise wide view of all risks.
Chief Financial Officer The CFO is responsible for the development of strategy, leadership and management of the CFO Division. In supporting Santander UK’s corporate goals within the constraints of risk appetite, the CFO is responsible for the management of interest rate, liquidity, pension and capital risks.
Chief Internal Auditor The Chief Internal Auditor (CIA) designs and uses an audit system that identifies key risks and evaluates controls. The CIA also develops an audit plan to assess existing risks that involve producing audit, assurance and monitoring reports.
Money Laundering Reporting Officer The Money Laundering Reporting Officer (MLRO) is responsible to the CLRO for control and oversight of Financial crime risk but has regulatory responsibility to report on this risk type to Executive and Board Committees and the FCA.
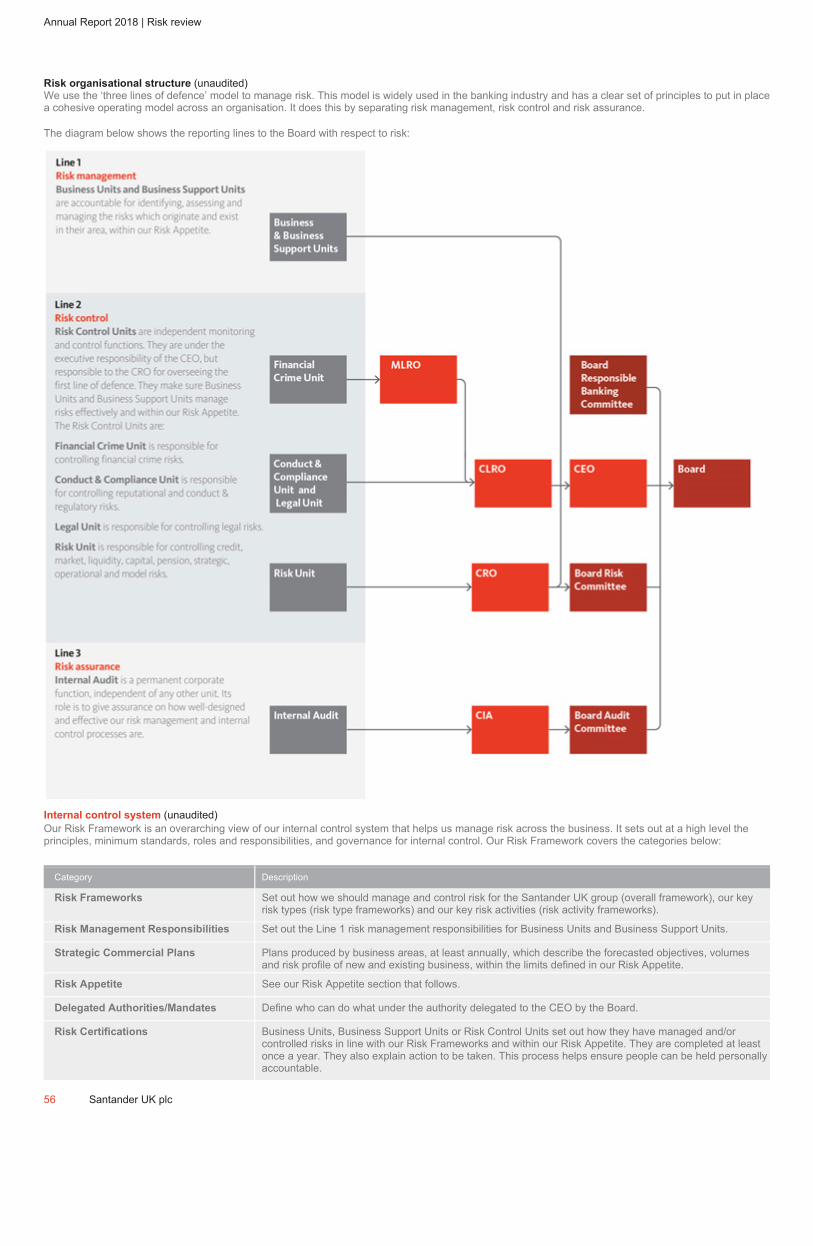
ˆ200G2Mlv!2LLR$p6IŠ200G2Mlv!2LLR$p6I
628340 TX 56SANTANDERFORM 20-F (SAN UK PL
02-Mar-2019 12:59 ESTHTMLON
Donnelley Financial EGV vikuv0dc 8*ESS 0C
VDI-W7-PFL-136512.9.12.0
f56
Page 1 of 1
Annual Report 2018 | Risk review
Risk organisational structure (unaudited)
We use the ‘three lines of defence’ model to manage risk. This model is widely used in the banking industry and has a clear set of principles to put in place
a cohesive operating model across an organisation. It does this by separating risk management, risk control and risk assurance.
The diagram below shows the reporting lines to the Board with respect to risk:
Internal control system (unaudited)
Our Risk Framework is an overarching view of our internal control system that helps us manage risk across the business. It sets out at a high level the
principles, minimum standards, roles and responsibilities, and governance for internal control. Our Risk Framework covers the categories below:
Category Description
Risk Frameworks Set out how we should manage and control risk for the Santander UK group (overall framework), our key
risk types (risk type frameworks) and our key risk activities (risk activity frameworks).
Risk Management Responsibilities Set out the Line 1 risk management responsibilities for Business Units and Business Support Units.
Strategic Commercial Plans Plans produced by business areas, at least annually, which describe the forecasted objectives, volumes
and risk profile of new and existing business, within the limits defined in our Risk Appetite.
Risk Appetite See our Risk Appetite section that follows.
Delegated Authorities/Mandates Define who can do what under the authority delegated to the CEO by the Board.
Risk Certifications Business Units, Business Support Units or Risk Control Units set out how they have managed and/or
controlled risks in line with our Risk Frameworks and within our Risk Appetite. They are completed at least
once a year. They also explain action to be taken. This process helps ensure people can be held personally
accountable.
56 Santander UK plc
ˆ200G2Mlv!2Z%NcB6iŠ200G2Mlv!2Z%NcB6i
628340 TX 57SANTANDERFORM 20-F (SAN UK PL
04-Mar-2019 01:36 ESTHTMLON
Donnelley Financial EGV gopad0dc 5*ESS 0C
VDI-W7-PFD-037812.9.12.0
bar4
Page 1 of 1
> Risk governance
Santander UK plc 57
RISK APPETITE (UNAUDITED)
How we control the risks we are prepared to take
When our Board sets our strategic objectives, it is important that we are clear about the risks we are prepared to take to achieve them. We
express this through our Risk Appetite Statement, which defines the amount and kind of risk we are willing to take. Our Risk Appetite and
strategy are closely linked and our strategy must be achievable within the limits set out in our Risk Appetite.
The principles of our Risk Appetite
Our Risk Appetite Statement lists ten principles that we use to set our Risk Appetite.
– We always aim to have enough financial resources to continue to do business in severe but plausible stressed economic and business
conditions, as well as to survive a very severe stress that would deplete our capital reserves
– We should be able to predict how our income and losses might vary – that is, how volatile they are. That applies to all our risks and
lines of business
– Our earnings and dividend payments should be stable, and in line with the return we aim to achieve
– We are an autonomous business, so we always aim to have strong capital and liquidity resources
– The way we fund our business should be based on diverse funding sources and duration. This helps us avoid relying too much on
wholesale markets
– We set controls on large concentrations of risk, like single customers or specific industries
– There are some key risks we take, but for which we do not actively seek any reward, like operational, conduct and regulatory, financial
crime, legal and reputational risk. We take a risk-averse approach to these risks
– We comply with all regulations – and aim to exceed the standards they set
– Our pay and bonus schemes should support these principles and our risk culture
– We always aim to earn the trust of our people, customers, shareholders and communities.
How we describe the limits in our Risk Appetite
Our Risk Appetite sets out detailed limits for different types of risk, using metrics and qualitative statements.
Metrics
We use metrics to set limits on losses, capital, liquidity and concentration. We set:
– Limits for losses for our most important risks, including credit, market, operational and conduct risk
– Capital limits, reflecting both the capital that regulators expect us to hold (regulatory capital) and our own internal measure (EC)
– Liquidity limits according to the most plausible stress scenario for our business
– Concentration limits, to determine the maximum concentration level that we are willing to accept.
These limits apply in normal business conditions, but also when we might be experiencing a far more difficult economic environment. A
good example of this might be when the UK economy is performing much worse than we expected. We refer to conditions like this as
being under stress. There is more on EC and stress scenarios later in this section.
Qualitative statements
For some types of risk we also use qualitative statements that describe in words the appetite we want to set. For example, in conduct risk,
we use them to describe our Risk Appetite for products, sales, after-sales service, and culture. We also use them to prohibit or restrict
exposure to certain sectors, types of customer and activities.
How we set our Risk Appetite, and stay within it
We control our Risk Appetite through our Risk Appetite Framework. Our Board approves and oversees our Risk Appetite Statement every
year. This ensures it is consistent with our strategy and reflects the markets in which we operate. Our ERCC is responsible for ensuring
that our risk profile (the level of risk we are prepared to accept) is consistent with our Risk Appetite Statement. To do this they monitor our
performance against our Risk Appetite, business plans and budgets each month. We also use stress testing to review how our business
plan performs against our Risk Appetite Statement. This shows us if we would stay within our Risk Appetite under stress conditions. It also
helps us to identify any adverse trends or inconsistencies.
We embed our Risk Appetite by setting more detailed risk limits for each business unit and key portfolio. These are set in a way so that if
we stay within each detailed limit, we will stay within our overall Risk Appetite. When we use qualitative statements to describe our appetite
for a risk, we link them to lower-level key risk indicators, so that we can monitor and report our performance against them.
We provide a programme of communication and training for our staff, including new joiners, which helps ensure that our Risk Appetite is
well understood.

ˆ200G2Mlv!2Z%Vis6eŠ200G2Mlv!2Z%Vis6e
628340 TX 58SANTANDERFORM 20-F (SAN UK PL
04-Mar-2019 01:36 ESTHTMLON
Donnelley Financial EGV gopad0dc 5*ESS 0C
VDI-W7-PFD-037812.9.12.0
Page 1 of 1
Annual Report 2018 | Risk review
STRESS TESTING (UNAUDITED)
Stress testing helps us understand how different events and economic conditions could affect our business plan, earnings and risk profile. This helps us
plan and manage our business better.
Scenarios for stress testing
To see how we might cope with difficult conditions, we regularly develop challenging scenarios that we might face. We consult a broad range of internal
stakeholders, including Board members, when we design and choose our most important scenarios. The scenarios cover a wide range of outcomes, risk
factors, time horizons and market conditions. They are designed to test:
– The impact of shocks affecting the economy as a whole or the markets we operate in
– Key potential vulnerabilities of our business model, and the processes and systems which support it
– Potential impacts on specific risk types.
We describe each scenario using a narrative setting out how events might unfold, as well as a market and/or economic context. For example the key
economic factors we reflect in our ICAAP scenarios include house prices, interest rates, unemployment levels and the size of the UK economy. One
scenario looks at what might happen in a recession where the output of the economy shrinks by around 5%, unemployment reaches over 9%, and house
prices fall by around 30% in a context of high inflation and interest rates rising rapidly. We use a comprehensive suite of stress scenarios to explore
sensitivities to market risk, including those based on historical market events.
How we use stress testing
We use stress testing to estimate the effect of these scenarios on our business and financial performance, including:
– Our business plan, and its assessment against our Risk Appetite
– Our capital strength, through our ICAAP
– Our liquidity position, through our ILAAP
– Impacts on other risk types.
We use a wide range of models, approaches and assumptions. These help us interpret the links between factors in markets and the economy, and our
financial performance. For example, one model looks at how changes to key macroeconomic variables like unemployment rates might affect the number
of customers who might fall into arrears on their mortgage.
Our stress testing models are subject to a formal review, independent validation and approval process. We highlight the key weaknesses and related
model assumptions in the approval process for each stress test. In some cases, we overlay expert judgement onto the results of our models. Where this is
material to the outcome of the stress test, the approving governance committee reviews it. We take a multi-layered approach to stress testing to capture
risks at various levels. This ranges from sensitivity analysis of a single factor to a portfolio, to wider exercises that cover all risks across our entire
business. We use stress test outputs to design plans that aim to mitigate damaging effects.
We also conduct reverse stress tests. These are tests in which we identify and assess scenarios that are most likely to cause our business model to fail.
Board oversight of stress testing
The ERCC approves the design of the scenarios in our ICAAP and ILAAP. The Board Risk Committee approves the stress testing framework. The Board
reviews stress test outputs as part of the approval processes for the ICAAP, ILAAP, Recovery and Resolution, our Risk Appetite and regulatory stress
tests.
Regulatory stress tests
We take part in a number of external stress testing exercises. These can include stress tests of the UK banking system conducted by the PRA. We also
contribute to stress tests of Banco Santander conducted by the European Banking Authority (EBA).
For more on capital and liquidity stress testing, see the ‘Capital risk’ and ‘Liquidity risk’ sections.
HOW RISK IS DISTRIBUTED ACROSS OUR BUSINESS (UNAUDITED)
Economic capital
As well as assessing how much regulatory capital we need to hold, we use an internal EC model to measure our risk. We use EC to get a consistent
measure across different risk types. EC also takes account of how concentrated our portfolios are, and how much diversification there is between our
various businesses. As a consequence we can use EC for a range of risk management activities. For example, we can use it to help us compare
requirements in our ICAAP or to get a risk-adjusted comparison of income from different activities.
Regulatory capital – risk-weighted assets
We hold regulatory capital against our credit, market and operational risks. In 2018, the largest category continued to be credit risk in Retail Banking,
which accounted for around half of our risk-weighted assets. This reflects our business strategy and balance sheet. Market risk decreased in 2018 as most
of our trading book activities were transferred to the Banco Santander London Branch as part of our ring-fencing plans.
58 Santander UK plc

ˆ200G2Mlv!2Z%baH6vŠ200G2Mlv!2Z%baH6v
628340 TX 59SANTANDERFORM 20-F (SAN UK PL
04-Mar-2019 01:36 ESTHTMLON
Donnelley Financial EGV gopad0dc 16*ESS 0C
VDI-W7-PFD-037812.9.12.0
bar4f59
Page 1 of 2
> Credit risk
Credit risk
Overview (unaudited) Key metrics (unaudited)
Credit risk is the risk of loss due to the default or credit quality deterioration of a customer or counterparty to which we provided credit, or for which we assumed a financial obligation.
Santander UK group level
We start by discussing credit risk at a Santander UK group level. We set out how our exposures arise, our types of customer and how we manage them, and our approach to credit risk across the credit risk lifecycle. We also discuss our ECL methodology and the key inputs to our ECL model. We then analyse our key metrics, as well as credit performance and forbearance.
Business segments
Then we cover Retail Banking separately from our other business segments – Corporate & Commercial Banking, Corporate & Investment Banking and Corporate Centre – in more detail.
NPL ratio improved to 1.21% (2017: 1.42%), partly due to the write-off of the Carillion plc exposures.
Loss allowances decreased to £807m (2017: £940m). Loss allowance increased by £211m to £1,151m on transition to IFRS 9 on 1 January 2018.
Average LTV of 63% (2017: 62%) on new mortgage lending.
Credit risk – Santander UK group level
SANTANDER UK GROUP LEVEL – CREDIT RISK MANAGEMENT Exposures
Exposures to credit risk arise in our business segments from:
Retail Banking Corporate & Commercial Banking Corporate & Investment Banking Corporate Centre
– Residential mortgages, business banking, consumer (auto) finance and other unsecured lending (credit cards, personal loans and overdrafts).
– Loans, bank accounts, treasury services, invoice discounting, cash transmission, trade finance and asset finance.
– Loans, treasury products, and treasury markets activities.
– Asset and liability management of our balance sheet, as well as our non-core and Legacy Portfolios being run down.
– We provide these to individuals and small businesses.
– We provide these to SMEs and mid corporates, Commercial Real Estate and Social Housing associations.
– We provide these to large corporates, as well as sovereigns and other international organisations.
– Exposures include sovereign and other international organisation assets that we hold for liquidity.
The segmental basis of presentation in this Annual Report has been changed, and the prior periods restated, to report our Jersey and Isle of Man branches in Corporate Centre rather than in Retail Banking as in previous years, as a result of their transfer from Santander UK plc to ANTS in 2018. See Note 2 for more information.
Our types of customers and how we manage them
We manage credit risk across all our business segments in line with the credit risk lifecycle that we show in the next section. We tailor the way we manage risk across the lifecycle to the type of customer. We classify our customers as standardised or non-standardised:
Standardised Non-standardised
– Mainly individuals and small businesses. Their transactions are for relatively small amounts of money, and share similar credit characteristics.
– Mainly medium and large corporate customers. Their transactions are for larger values, and have more diverse credit characteristics.
– In Retail Banking, Corporate & Commercial Banking (for some small, non-complex corporate clients) and Corporate Centre (for our non-core portfolios).
– In Retail Banking (for some business banking transactions), Corporate & Commercial Banking, Corporate & Investment Banking and Corporate Centre.
– We manage risk using automated decision-making tools. These are backed by teams of analysts who specialise in this type of risk.
– We manage risk through expert analysis. We support this with decision-making tools based on internal risk assessment models.
The adoption of IFRS 9
On 1 January 2018, IFRS 9 replaced IAS 39, and introduced new rules on how to classify and measure financial assets, as well as new concepts, principles and measures for credit impairment charges. Throughout 2018, we enhanced and refined our accounting processes and procedures, internal controls and governance framework to embed the new requirements of IFRS 9 into our business. IFRS 9 was a significant challenge to our Risk and Finance divisions as they had to analyse large volumes of data from various systems, as well as enhance their skills and expertise.
As IFRS 9 affects the timing of when we recognise credit impairment charges, but not the amount of credit write-offs, its adoption did not materially change our credit risk policies. Our Retail collections and recoveries procedures were unchanged, and we reviewed our risk-adjusted hurdle rates for Corporate lending, but this didn’t lead to a significant change in our credit policy. Our credit risk appetite in terms of target markets, market share and the credit quality of customers we want to lend to, were also not directly impacted.

ˆ200G2Mlv!2Z%baH6vŠ200G2Mlv!2Z%baH6v
628340 TX 59SANTANDERFORM 20-F (SAN UK PL
04-Mar-2019 01:36 ESTHTMLON
Donnelley Financial EGV gopad0dc 16*ESS 0C
VDI-W7-PFD-037812.9.12.0
bar4f59
Page 2 of 2
Santander UK plc 59
The main impacts were on how we monitor credit risk. As part of this, we began to monitor IFRS 9 metrics. These mainly centre on ECL and classification of exposures as Stages 1, 2 and 3. We expect to develop our metrics further in 2019 as how we embed IFRS 9 in our business continues to evolve. We also continued to monitor NPLs in 2018. Our disclosures reflect recommendations made by the DECL Taskforce where it is practical to do so, and we expect to enhance them further in future.

ˆ200G2Mlv!2LY!=R6nŠ200G2Mlv!2LY!=R6n
628340 TX 60SANTANDERFORM 20-F (SAN UK PL
02-Mar-2019 13:43 ESTHTMLON
Donnelley Financial EGV balad1dc 4*ESS 0C
VDI-W7-PFD-058412.9.12.0
f60
Page 1 of 1
Annual Report 2018 | Risk review
Our approach to credit risk
We manage our portfolios across the credit risk lifecycle (above), from drawing up our risk strategy, plans, budgets and limits to making sure the actual
risk profile of our exposures stays in line with our plans and within our Risk Appetite. We further tailor the way we manage risk across the lifecycle to the
type of product. We say more on this in the Credit risk – Retail Banking and the Credit risk – other business segments sections.
1. Risk strategy and planning
All relevant areas of the business work together to create our business plans. We aim to balance our strategy, business goals, and financial and technical
resources with our attitude to risk (our Risk Appetite). To do this, we focus particularly on economic and market conditions and forecasts, regulations,
conduct considerations, profitability, returns and market share. The result is an agreed set of targets and limits that help us direct our business.
2. Assessment and origination
Managing credit risk begins with lending responsibly. That means only lending to customers who can afford to pay us back, even if things get tighter for
them, and are committed to paying us back. We undertake a thorough risk assessment to make sure customers can meet their obligations before we
approve a credit application. We make these decisions with authority from the Board and we consider:
– The credit quality of the customer
– The underlying risk – and anything that mitigates it, such as netting or collateral
– Our risk policy, limits and appetite
– Whether we can balance the amount of risk we face with the returns we expect.
We also use stress testing, for example to estimate how a customer might be able to cope if interest rates increase.
3. Monitoring
We measure and monitor changes in our credit risk profile on a regular and systematic basis against budgets, limits and benchmarks. We monitor credit
performance by portfolio, segment, customer or transaction. If our portfolios do not perform as we expect, we investigate to understand the reasons. Then
we take action to mitigate it as far as possible and bring performance back on track. We monitor and review our risk profile through a formal structure of
governance and forums/committees across our business segments. These agree and track any steps we need to take to manage our portfolios, to make
sure the impact is prompt and effective. This structure is a vital feedback tool to coordinate issues, trends and developments across each part of the credit
risk lifecycle.
Credit concentrations
A core part of our monitoring and management is credit concentrations, such as the proportion of our lending that goes to specific borrowers, groups or
industries. We set concentration limits in line with our Risk Appetite and review them on a regular basis. We track how concentrated our portfolios are
using a range of criteria. These include geographies, economic sectors, products and groups of customers.
Geographical concentrations
We set exposure limits to countries and geographies, with reference to the country limits set by Banco Santander. These are determined according to how
the country is classified (whether it is a developed OECD country or not), its credit rating, its gross domestic product, and the products and services Banco
Santander wants to offer in that country. For more geographical information, see ‘Country risk exposures’.
Industry concentrations
We also set exposure limits by industry sector. These limits are set based on the industry outlook, our strategic aims and desired level of concentration,
and relevant limits set by Banco Santander. We analyse committed exposures in the ‘Credit risk review’.
4. Arrears management
Sometimes our customers face financial difficulty and they may fall into payment arrears or breach conditions of their credit facility. If this happens, we
work with them to get their account back on track. We aim to support our customers and keep our relationship with them. To do this, we:
– Find affordable and sustainable ways of repaying to fit their circumstances
– Monitor their finances and use models to predict how they will cope financially. This helps us put in place the right strategy to manage their debt
– Work with them to get their account back to normal as soon as possible in a way that works for them and us
– Monitor agreements we make to manage their debt so we know they are working.
For more, see the Forbearance section on the next page.
5. Debt recovery
Sometimes, even when we have taken all reasonable and responsible steps we can to manage arrears, they prove ineffective. If this happens, we have to
end our relationship with the customer and try to recover the whole debt, or as much of it as we can.
60 Santander UK plc
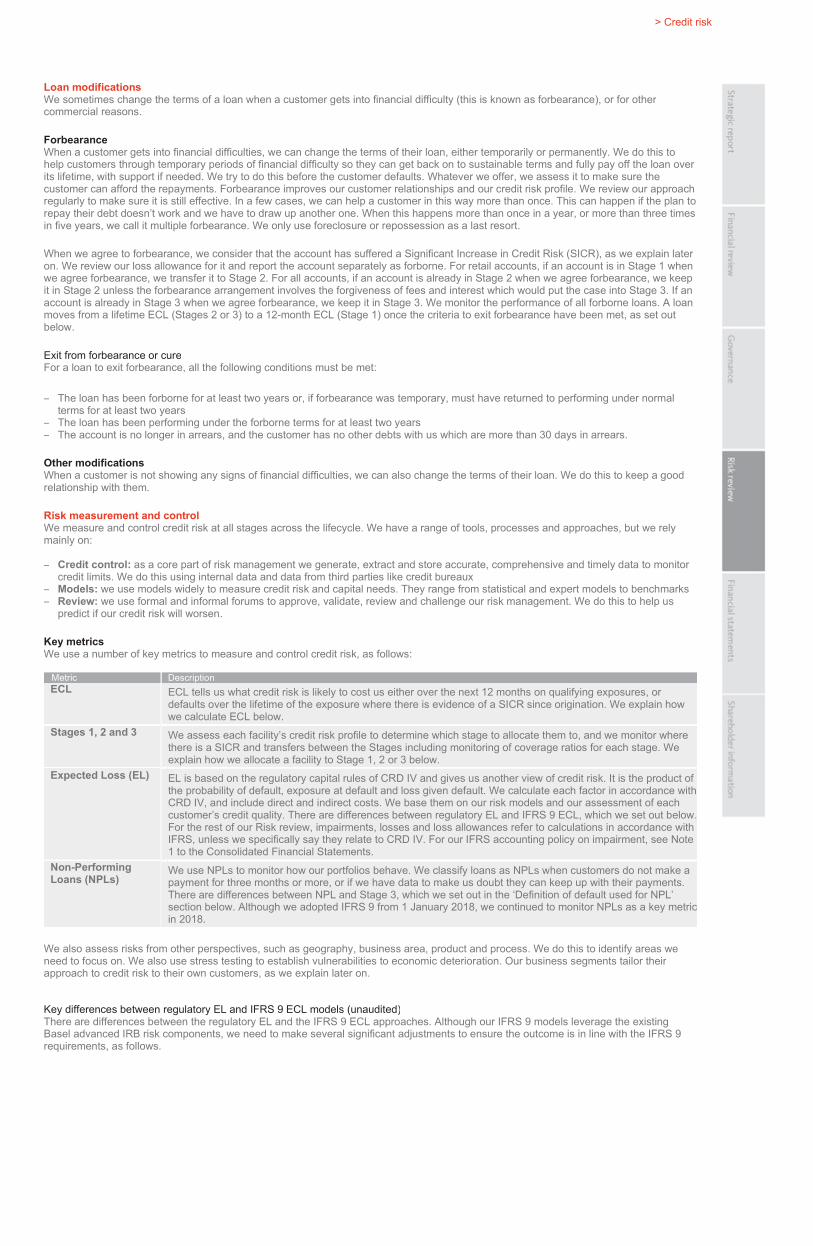
ˆ200G2Mlv!2Cwd4!gÀŠ200G2Mlv!2Cwd4!g
628340 TX 61SANTANDERFORM 20-F (SAN UK PL
02-Mar-2019 04:28 ESTHTMLON
Donnelley Financial EGV maria0dc 6*ESS 0C
VDI-W7-PFD-043912.9.12.0
bar4
Page 1 of 2
> Credit risk
Loan modifications
We sometimes change the terms of a loan when a customer gets into financial difficulty (this is known as forbearance), or for other
commercial reasons.
Forbearance
When a customer gets into financial difficulties, we can change the terms of their loan, either temporarily or permanently. We do this to
help customers through temporary periods of financial difficulty so they can get back on to sustainable terms and fully pay off the loan over
its lifetime, with support if needed. We try to do this before the customer defaults. Whatever we offer, we assess it to make sure the
customer can afford the repayments. Forbearance improves our customer relationships and our credit risk profile. We review our approach
regularly to make sure it is still effective. In a few cases, we can help a customer in this way more than once. This can happen if the plan to
repay their debt doesn’t work and we have to draw up another one. When this happens more than once in a year, or more than three times
in five years, we call it multiple forbearance. We only use foreclosure or repossession as a last resort.
When we agree to forbearance, we consider that the account has suffered a Significant Increase in Credit Risk (SICR), as we explain later
on. We review our loss allowance for it and report the account separately as forborne. For retail accounts, if an account is in Stage 1 when
we agree forbearance, we transfer it to Stage 2. For all accounts, if an account is already in Stage 2 when we agree forbearance, we keep
it in Stage 2 unless the forbearance arrangement involves the forgiveness of fees and interest which would put the case into Stage 3. If an
account is already in Stage 3 when we agree forbearance, we keep it in Stage 3. We monitor the performance of all forborne loans. A loan
moves from a lifetime ECL (Stages 2 or 3) to a 12-month ECL (Stage 1) once the criteria to exit forbearance have been met, as set out
below.
Exit from forbearance or cure
For a loan to exit forbearance, all the following conditions must be met:
– The loan has been forborne for at least two years or, if forbearance was temporary, must have returned to performing under normal
terms for at least two years
– The loan has been performing under the forborne terms for at least two years
– The account is no longer in arrears, and the customer has no other debts with us which are more than 30 days in arrears.
Other modifications
When a customer is not showing any signs of financial difficulties, we can also change the terms of their loan. We do this to keep a good
relationship with them.
Risk measurement and control
We measure and control credit risk at all stages across the lifecycle. We have a range of tools, processes and approaches, but we rely
mainly on:
– Credit control: as a core part of risk management we generate, extract and store accurate, comprehensive and timely data to monitor
credit limits. We do this using internal data and data from third parties like credit bureaux
– Models: we use models widely to measure credit risk and capital needs. They range from statistical and expert models to benchmarks
– Review: we use formal and informal forums to approve, validate, review and challenge our risk management. We do this to help us
predict if our credit risk will worsen.
Key metrics
We use a number of key metrics to measure and control credit risk, as follows:
Metric Description
ECLECL tells us what credit risk is likely to cost us either over the next 12 months on qualifying exposures, or
defaults over the lifetime of the exposure where there is evidence of a SICR since origination. We explain how
we calculate ECL below.
Stages 1, 2 and 3We assess each facility’s credit risk profile to determine which stage to allocate them to, and we monitor where
there is a SICR and transfers between the Stages including monitoring of coverage ratios for each stage. We
explain how we allocate a facility to Stage 1, 2 or 3 below.
Expected Loss (EL)EL is based on the regulatory capital rules of CRD IV and gives us another view of credit risk. It is the product of
the probability of default, exposure at default and loss given default. We calculate each factor in accordance with
CRD IV, and include direct and indirect costs. We base them on our risk models and our assessment of each
customer’s credit quality. There are differences between regulatory EL and IFRS 9 ECL, which we set out below.
For the rest of our Risk review, impairments, losses and loss allowances refer to calculations in accordance with
IFRS, unless we specifically say they relate to CRD IV. For our IFRS accounting policy on impairment, see Note
1 to the Consolidated Financial Statements.
Non-Performing
Loans (NPLs)
We use NPLs to monitor how our portfolios behave. We classify loans as NPLs when customers do not make a
payment for three months or more, or if we have data to make us doubt they can keep up with their payments.
There are differences between NPL and Stage 3, which we set out in the ‘Definition of default used for NPL’
section below. Although we adopted IFRS 9 from 1 January 2018, we continued to monitor NPLs as a key metric
in 2018.
We also assess risks from other perspectives, such as geography, business area, product and process. We do this to identify areas we
need to focus on. We also use stress testing to establish vulnerabilities to economic deterioration. Our business segments tailor their
approach to credit risk to their own customers, as we explain later on.
Key differences between regulatory EL and IFRS 9 ECL models (unaudited)
There are differences between the regulatory EL and the IFRS 9 ECL approaches. Although our IFRS 9 models leverage the existing
Basel advanced IRB risk components, we need to make several significant adjustments to ensure the outcome is in line with the IFRS 9
requirements, as follows.

ˆ200G2Mlv!2Cwd4!gÀŠ200G2Mlv!2Cwd4!g
628340 TX 61SANTANDERFORM 20-F (SAN UK PL
02-Mar-2019 04:28 ESTHTMLON
Donnelley Financial EGV maria0dc 6*ESS 0C
VDI-W7-PFD-043912.9.12.0
bar4
Page 2 of 2
Santander UK plc 61
Basel advanced IRB EL IFRS 9 ECL
Rating philosophy Mix of point-in-time, through-the-cycle or hybrid Point-in-time, forward-looking. Considers a range of
economic scenarios
Parameters calibration Contains regulatory floors and downturn calibration Unbiased estimate, based on conditions known at the
balance sheet date
Probability of Default
(PD)
Probability of default in the next 12 months Includes forward-looking economic information and
removes conservatism and bias. Adjusted to convert
from 12 months to lifetime for Stages 2 and 3
Loss Given Default (LGD) Lifetime LGD for defaults in the next 12 months Removal of regulatory floors and exclusion of indirect
costs
Exposure at Default (EAD) Exposure at the point of default if the customer
defaults in the next 12 months
Floored at amount owed, except on some revolving
facilities. Recognises ability for the exposure to
reduce from the balance sheet date to default date
SICR Does not include SICR concept Includes SICR concept
Discounting applied At the weighted average cost of capital to the default
date
At the effective interest rate (EIR) to the balance sheet
date

ˆ200G2Mlv!2GgS3Q6dŠ200G2Mlv!2GgS3Q6d
628340 TX 62SANTANDERFORM 20-F (SAN UK PL
02-Mar-2019 06:41 ESTHTMLON
Donnelley Financial EGV annas1dc 5*ESS 0C
VDI-W7-PFD-014312.9.12.0
Page 1 of 1
Annual Report 2018 | Risk review
Recognising ECL
The ECL approach estimates the credit losses arising from defaults in the next 12 months on qualifying exposures, or defaults over the lifetime of the
exposure where there is evidence of a SICR risk since the origination date. The ECL approach estimate takes into account forward-looking data, including
a range of possible outcomes, which should be unbiased and probability-weighted in order to reflect the likelihood of a loss being incurred even when it is
considered unlikely.
Multiple economic scenarios and probability weights
For all our portfolios, except CIB, we use five forward-looking economic scenarios. They consist of a central base case, two upside scenarios and two
downside scenarios. We use five scenarios to reflect a wide range of possible outcomes in the performance of the UK economy. For example, the
Downside 2 scenario reflects the possibility of a recession occurring. We believe that our five scenarios, in particular Downside 1 and Downside 2, reflect
the range of outcomes that Brexit may take, including a deal with a transition period or a no-deal Brexit. Our scenarios are also in line with a number of
scenarios that have been produced by, for example, the Bank of England and its disruptive scenario, and other economic forecasters no deal scenarios.
As such our scenarios and weights reflect the range of possible outcomes that the UK may face in 2019.
Base case
– Our base case assumes that the UK will negotiate an orderly exit with the EU that avoids a so-called ‘cliff-edge’ event when the UK leaves the EU and
that there will be a relatively smooth transition period.
– GDP forecast for 2018 was lowered in August to reflect disappointing Q1 results, which results in slower growth in the following years until reverting to
the long run annual growth of 1.6% in 2024.
– Unemployment continues its current trend over the forecast period, tightening labour markets further and pushing up average earnings growth. This
growth along with the expected fall in inflation result in positive real earnings growth for 2019 onwards.
– The UK’s net trade position is expected to fall back as sterling rallies against the dollar reducing the competitiveness of UK exports. Even though the
Brexit negotiations are likely to result in some increased trade costs between the EU and UK, these are not projected to significantly impact the
downwards trend in the share of UK exports going to the EU.
– For Bank Rate, the base case currently assumes one bank rate rise in 2019 and another in 2020.
– In the medium term, the forecast projections assume that current demographic and productivity trends will continue, causing a reduction in the UK’s
growth potential which is reflected in an average annual growth expectation of less than 2%.
– In summary, the base case assumes that activity will continue to run at this relatively sluggish pace. With CPI inflation likely to slow as we move
through 2019, and a positive increase in wage growth predicted, this will provide a boost to household spending power. However, the effect of this will
be softened by the continued impact of the UK Government’s welfare reforms and the projected slowing of employment growth. In addition, with the
household savings ratio at low levels and with credit conditions starting to tighten these two areas are unlikely to be able to compensate for any
downside effects to growth.
Our methodology to derive the scenarios relies on a set of parameters embodied in GDP fan charts published by the Office for Budget Responsibility
(OBR) twice a year. To avoid major changes to the scenarios due to changes in the OBR fan charts, we place more weight on the long-run trend of the fan
charts rather than relying on each individual release. We use the OBR fan charts to calculate our GDP paths for each individual scenario. These fan charts
reflect the probability distribution of a deviation from the OBR’s central forecast to illustrate the uncertainty regarding the outcome of a variable, in this
case GDP. We use the 0.6 and 0.7 fan chart paths for the upside scenarios, and the 0.3 path for Downside 1. However, for Downside 2 we use a blend of
the Downside 1 scenario and the recession of the early 1980s as this recession was less extreme than the 2008/09 recession and more in line with what
we think could happen. This means that in the longer run the GDP levels in our Downside 1 and 2 scenarios converge. In order to ensure that Downside 2
is kept consistent with any changes to the OBR fan charts, we calculate the Downside 2 GDP by taking the percentage difference between Downside 2
and Downside 1 GDP in the original forecast, and applying this difference to the new Downside 1.
Once the GDP paths have been forecast, we run them through the Oxford Global Economic Model (OGEM) to derive the other macroeconomic variables,
such as unemployment and house prices, and then impose the Bank Rate for each scenario. The forecasting period for GDP is 5 years and then we revert
back to the average trend growth over 3 years based on the OBR’s long-run GDP forecast.
The annual growth rates over the 5 year forecast for each of our scenarios are:
Assumption
Upside 2
%
Upside 1
%
Base case
%
Downside 1
%
Downside 2
%
House price index(1) 3.40 2.30 2.00 (2.00) (9.50)
GDP(1) 2.50 2.10 1.60 0.70 0.30
Unemployment rate 2.80 3.80 4.30 6.90 8.60
Interest rate 1.00 1.25 1.50 2.50 2.25
(1) Compound annual growth rate
To determine our initial scenario probability weightings, we give the highest weight to the base case, whilst the extreme scenarios typically attract lower
weights than the more moderate ones. In addition, due to the current economic position and policy concerns evidenced by the PRA and Financial Policy
Committee (FPC), and due to political concerns we have applied a higher weighting to the downside scenarios. We consider this appropriate in light of the
consensus view of future performance of the UK economy, including projections for GDP growth.
The probability weights we applied to the scenarios are:
Scenario type Probability %
Upside 2 5
Upside 1 15
Base case 40
Downside 1 30
Downside 2 10
As part of our review of the scenarios and weights that we use, we performed statistical analysis to assess whether the scenarios and weights we use
capture the non-linearity of losses implied by the results. The outcome of this analysis, which modelled a number of different scenarios, demonstrated that
there is a non-linear relationship between the ECLs based on the GDP growth paths for individual scenarios. In addition, the trend line modelled showed
that our base case, Downside 1 and Downside 2 scenarios provide a reasonable fit for the loss distribution.
62 Santander UK plc

ˆ200G2Mlv!2b$6&ygmŠ200G2Mlv!2b$6&ygm
628340 TX 63SANTANDERFORM 20-F (SAN UK PL
04-Mar-2019 04:35 ESTHTMLON
Donnelley Financial EGV annas1dc 24*ESS 0C
VDI-W7-PFD-029812.9.12.0
bar4
Page 1 of 2
> Credit risk
For our CIB portfolio, our approach was developed centrally by Banco Santander to ensure consistent treatment of these large and/or
international counterparties across the organisation. For CIB, we use three scenarios (base, upside and downside). Similar to the UK
scenarios, the base case uses the base scenario that has been developed and is used in other work that Banco Santander undertakes for
planning and stress testing purposes. To develop the downside scenario, the path of GDP for each country is calculated using the
distribution probability of GDP estimated using a Monte Carlo simulation. The path used is the one that falls into a percentile that sits half
way between the baseline and global stress we use for our ICAAP. For the upside, the distribution probability of GDP is again used, for
each country the GDP path is consistent with the symmetric percentile selected on the downside. This means that the scenarios maintain
the asymmetry that comes with the probabilities of distribution.
The average annual growth rates over a 4 year forecast for each of the scenarios for our CIB portfolio are:
Assumption
Upside
%
Base case
%
Downside
%
GDP 4.2 3.6 2.7
The probability weights we applied to the scenarios for our CIB portfolio are:
Scenario type Probability %
Upside 20
Base case 60
Downside 20
We update the baseline in our economic scenarios at least twice a year in line with our annual budgeting and three year planning
processes, or sooner if there is a material change in current or expected economic conditions. We refresh all our economic scenarios each
quarter to reflect the latest available data and OBR fan charts, which are then reviewed and approved by ALCO. Probability weights are
reassessed by ALCO at least quarterly. We aim to avoid embedding new economic scenarios into our models on a quarter-end month.
Instead, we aim to run the model with the new scenarios for two months before the quarter-end to ensure that we can fully validate the
output.
Significant Increase in Credit Risk (SICR)
Loans which have suffered a SICR since origination are subject to a lifetime ECL assessment which extends to a maximum of the
contractual maturity of the loan, or behavioural term for revolving facilities. Loans which have not experienced a SICR are subject to 12
month ECL. We assess each facility’s credit risk profile to determine which of three stages to allocate them to:
– Stage 1: when there has been no SICR since initial recognition. We apply a loss allowance equal to a 12 month ECL i.e. the proportion
of lifetime expected losses that relate to that default event expected in the next 12 months
– Stage 2: when there has been a SICR since initial recognition, but no credit impairment has materialised. We apply a loss allowance
equal to the lifetime ECL i.e. lifetime expected loss resulting from all possible defaults throughout the residual life of a facility
– Stage 3: when the exposure is considered credit impaired. We apply a loss allowance equal to the lifetime ECL. Objective evidence of
credit impairment is required. The definition of default (credit impaired) we use to identify an exposure as Stage 3 or NPL are different,
although the differences are not material. For more, see the section ‘Definition of default (Credit impaired)’ that follows. These criteria
are under review in parallel with the ongoing regulatory changes to the default definition.
We use a range of quantitative, qualitative and backstop criteria to identify exposures that have experienced a SICR. The Credit Risk
Provisions Forum (CRPF) reviews and approves our SICR thresholds periodically. The Board Audit Committee reviews and approves them
each year, or more often if we change them.
Quantitative criteria
We use quantitative criteria to identify where an exposure has increased in credit risk. The quantitative criteria we apply are based on
whether any increase in the lifetime PD since the recognition date exceeds a set threshold both in relative and absolute terms. We base
the value anticipated from the initial recognition on a similar set of assumptions and data to the ones we used at the reporting date,
adjusted to reflect the account surviving to that date. The comparison uses either an annualised lifetime PD, where the lifetime PD is
divided by the forecast period, or the absolute change in lifetime PD since initial recognition. For each portfolio, the quantitative criteria are:
Retail Banking(1)
Consumer (auto)
finance(2)
Other unsecured Corporate & Corporate &
Investment Banking Mortgages Personal loans(2) Credit cards Overdrafts Commercial Banking(2)
30bps 300bps 400bps 340bps 260bps 400bps Internal rating method
(1) In Business banking, for larger customers we apply the same criteria that we use for Corporate & Commercial Banking.
(2) Consumer (auto) finance, Personal loans and Corporate & Commercial Banking use the comparison of lifetime PDs to determine Stage allocation, unlike other products which first turn the lifetime
PD into an average yearly PD (annualised) and then do the comparison.
We also apply a relative threshold of 100% (doubling the PD) across all portfolios except CIB.
Qualitative criteria
We also use qualitative criteria to identify where an exposure has increased in credit risk, independent of any changes in PD. For each
portfolio, the qualitative criteria are:
Retail Banking(1)
Consumer (auto)
finance
Other unsecured Corporate & Corporate &
Investment Banking Mortgages Personal loans Credit cards Overdrafts Commercial Banking
In forbearance In forbearance In Collections In forbearance Fees suspended In forbearance
Default in last
24m
Deceased or
Insolvent
Default in last 12m Default in last 12m Default in last 12m Watchlist – proactive
management
Watchlist – proactive
management
>30 Days past
due (DPD) in
last 12m
Court ‘Return of
goods’ order or
Police watchlist
NPL in last 12m In Collections Debit dormant
>35 days
NPL in last 12m
Bankrupt Agreement
terminated
Default at proxy
origination
£100+ arrears Payment holiday £50+ arrears £100+ arrears Any excess in
month
Cash Collection Behaviour score <565
(1) In Business banking, for larger customers we apply the same criteria that we use for Corporate & Commercial Banking.
Backstop criteria
As a backstop, we classify all exposures more than 30 or 90 DPD in at least Stage 2 or in Stage 3, respectively. This means that we do not
rebut the backstop presumptions in IFRS 9 (i.e. credit risk has significantly increased if contractual payments are more than 30 days past
due) relating to either a SICR or default.

ˆ200G2Mlv!2b$6&ygmŠ200G2Mlv!2b$6&ygm
628340 TX 63SANTANDERFORM 20-F (SAN UK PL
04-Mar-2019 04:35 ESTHTMLON
Donnelley Financial EGV annas1dc 24*ESS 0C
VDI-W7-PFD-029812.9.12.0
bar4
Page 2 of 2
Santander UK plc 63

ˆ200G2Mlv!2K$a3m6-Š200G2Mlv!2K$a3m6-
628340 TX 64SANTANDERFORM 20-F (SAN UK PL
02-Mar-2019 11:58 ESTHTMLON
Donnelley Financial EGV krisr1dc 6*ESS 0C
VDI-W7-PFL-027512.9.12.0
Page 1 of 1
Annual Report 2018 | Risk review
Improvement in credit risk or cure
In some cases, instruments with a lifetime ECL (in Stage 2 or 3) may be transferred back to 12 month ECL (Stage 1). Financial assets in Stage 3 can only
be transferred to Stage 2 or Stage 1 when they are no longer considered to be credit impaired, as defined in the next section. Financial assets in Stage 2
can only be transferred to Stage 1 when they are no longer considered to have experienced a SICR. Where we identified a SICR using quantitative
criteria, the instruments automatically transfer back to Stage 1 when the original PD-based transfer criteria are no longer met. Where we identified a SICR
using qualitative criteria, the issues that led to the transfer must be cured before the instruments can be reclassified to Stage 1. For a loan in forbearance
to cure, it must meet the exit conditions set out in the earlier section ‘Forbearance’.
Definition of default (Credit impaired)
We define a financial instrument as in default (i.e. credit impaired) for purposes of calculating ECL if it is more than three months past due, or if we have
data to make us doubt they can keep up with their payments i.e. they are unlikely to pay. The data we have on customers varies across our business
segments. It typically includes where:
Retail Banking
– They have been reported bankrupt or insolvent
– Their loan term has ended, but they still owe us money more than three months later
– They have had forbearance while in default, but have not caught up with the payments they had missed before that, or they have had multiple
forbearance
– We have suspended their fees and interest because they are in financial difficulties
– We have repossessed the property.
Other business segments: Corporate & Commercial Banking, Corporate & Investment Banking and Corporate Centre
– They have had a winding up notice issued, or something happens that is likely to trigger insolvency – such as, another lender calls in a loan
– Something happens that makes them less likely to be able to pay us – such as they lose an important client or contract
– They have regularly missed or delayed payments, even though they have not gone over the three-month limit for default
– Their loan is unlikely to be refinanced or repaid in full on maturity
– Their loan has an excessive LTV that is unlikely to be resolved, such as by a change in planning policy, pay-downs, or increases in market values.
Where we use the advanced internal ratings-based basis for a portfolio in our capital calculations, we use the same default definitions for ECL purposes.
We review and approve the definition of default each quarter. The Board Audit Committee reviews and approves the definition each year, or more often if
we change it.
Definition of default used for NPL
The definition of default we use to identify NPLs is not significantly different to the definition of default we use to identify Stage 3 exposures. The only
difference relates to mortgages. For NPL, we classify a mortgage customer as bankrupt for at least two years after first being declared bankrupt before we
reassess their position. For Stage 3, the equivalent period is at least seven years before we reassess their position.
Measuring ECL
For accounts not in default at the reporting date, we estimate a monthly ECL for each exposure and for each month over the forecast period. The lifetime
ECL is the sum of the monthly ECLs over the forecast period, while the 12-month ECL is limited to the first 12 months. We calculate each monthly ECL as
the discounted value for the relevant forecast month of the product of the following factors:
Factor Description
Survival rate (SR) The probability that the exposure has not closed or defaulted since the reporting date.
PD The likelihood of a borrower defaulting in the following month, assuming it has not closed or defaulted since the reporting date. For
each month in the forecast period, we estimate the monthly PD from a range of factors. These include the current risk grade for the
exposure, which becomes less relevant further into the forecast period, as well as the expected evolution of the account risk with
maturity and factors for changing economics. We support this with historical data analysis.
EAD The amount we expect to be owed if a default event was to occur. We determine EAD for each month of the forecast period by the
expected payment profile, which varies by product type. For amortising products, we base it on the borrower’s contractual
repayments over the forecast period. We adjust this for any expected overpayments on Stage 1 accounts that the borrower may
make and for any arrears we expect if the account was to default. For revolving products, or amortising products with an off-
balance sheet element, we determine EAD using the balance at default and the contractual exposure limit. We vary these
assumptions by product type and base them on analysis of recent default data.
LGD Our expected loss if a default event were to occur. We express it as a percentage and calculate it as the expected loss divided by
EAD for each month of the forecast period. We base LGD on factors that impact the likelihood and value of any subsequent write-
offs, which vary according to whether the product is secured or unsecured. If the product is secured, we take into account collateral
values as well as the historical discounts to market/book values due to forced sales type.
We use the original effective interest rate as the discount rate. For accounts in default, we use the EAD as the reporting date balance. We also calculate
an LGD to reflect the default status of the account, considering the current DPD and loan to value. PD and SR are not required for accounts in default.
Forecast period
We base the forecast period for amortising facilities on the remaining contractual term. For revolving facilities, we use an analytical approach based on the
behavioural, rather than contractual, characteristics of the facility type. In some cases, we shorten the period to simplify the calculation. If we do this, we
apply a post model adjustment to reflect our view of the full lifetime ECL.
Forward-looking information
Our assessments of a SICR and the calculation of ECL both incorporate forward-looking information. We perform historical analysis and identify the key
economic variables that impact credit risk and ECL for each portfolio. These can include GDP, house prices and unemployment. Where applicable, we
incorporate these economic variables and their associated impacts into our models.
Grouping of instruments for losses measured on a collective basis
We measure ECL at the individual financial instrument level. However, we typically group instruments and assess them for impairment collectively where
they share risk characteristics (as described in Retail Banking – credit risk management) using one or more statistical models. Where we have used
internal capital or similar models as the basis for our IFRS 9 models, this typically results in a large number of relatively small homogenous groups which
are determined by the permutations of the underlying characteristics in the statistical models. We calculate separate collective provisions for instruments
in Stages 1, 2 and 3 where the instrument is not individually assessed.
64 Santander UK plc
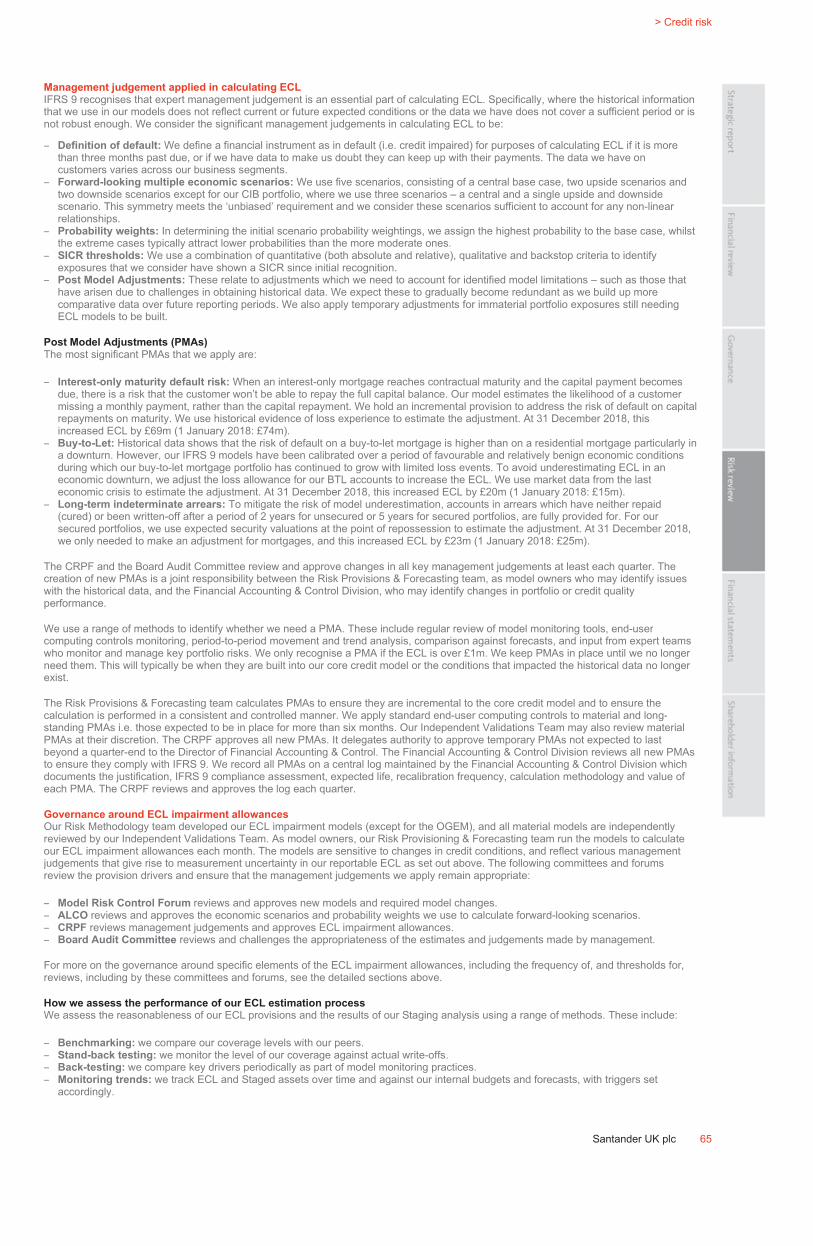
ˆ200G2Mlv!2HJY&Y6XŠ200G2Mlv!2HJY&Y6X
628340 TX 65SANTANDERFORM 20-F (SAN UK PL
02-Mar-2019 07:31 ESTHTMLON
Donnelley Financial EGV manra0dc 4*ESS 0C
VDI-W7-PFL-128212.9.12.0
bar4
Page 1 of 1
> Credit risk
Santander UK plc 65
Management judgement applied in calculating ECL
IFRS 9 recognises that expert management judgement is an essential part of calculating ECL. Specifically, where the historical information
that we use in our models does not reflect current or future expected conditions or the data we have does not cover a sufficient period or is
not robust enough. We consider the significant management judgements in calculating ECL to be:
– Definition of default: We define a financial instrument as in default (i.e. credit impaired) for purposes of calculating ECL if it is more
than three months past due, or if we have data to make us doubt they can keep up with their payments. The data we have on
customers varies across our business segments.
– Forward-looking multiple economic scenarios: We use five scenarios, consisting of a central base case, two upside scenarios and
two downside scenarios except for our CIB portfolio, where we use three scenarios – a central and a single upside and downside
scenario. This symmetry meets the ‘unbiased’ requirement and we consider these scenarios sufficient to account for any non-linear
relationships.
– Probability weights: In determining the initial scenario probability weightings, we assign the highest probability to the base case, whilst
the extreme cases typically attract lower probabilities than the more moderate ones.
– SICR thresholds: We use a combination of quantitative (both absolute and relative), qualitative and backstop criteria to identify
exposures that we consider have shown a SICR since initial recognition.
– Post Model Adjustments: These relate to adjustments which we need to account for identified model limitations – such as those that
have arisen due to challenges in obtaining historical data. We expect these to gradually become redundant as we build up more
comparative data over future reporting periods. We also apply temporary adjustments for immaterial portfolio exposures still needing
ECL models to be built.
Post Model Adjustments (PMAs)
The most significant PMAs that we apply are:
– Interest-only maturity default risk: When an interest-only mortgage reaches contractual maturity and the capital payment becomes
due, there is a risk that the customer won’t be able to repay the full capital balance. Our model estimates the likelihood of a customer
missing a monthly payment, rather than the capital repayment. We hold an incremental provision to address the risk of default on capital
repayments on maturity. We use historical evidence of loss experience to estimate the adjustment. At 31 December 2018, this
increased ECL by £69m (1 January 2018: £74m).
– Buy-to-Let: Historical data shows that the risk of default on a buy-to-let mortgage is higher than on a residential mortgage particularly in
a downturn. However, our IFRS 9 models have been calibrated over a period of favourable and relatively benign economic conditions
during which our buy-to-let mortgage portfolio has continued to grow with limited loss events. To avoid underestimating ECL in an
economic downturn, we adjust the loss allowance for our BTL accounts to increase the ECL. We use market data from the last
economic crisis to estimate the adjustment. At 31 December 2018, this increased ECL by £20m (1 January 2018: £15m).
– Long-term indeterminate arrears: To mitigate the risk of model underestimation, accounts in arrears which have neither repaid
(cured) or been written-off after a period of 2 years for unsecured or 5 years for secured portfolios, are fully provided for. For our
secured portfolios, we use expected security valuations at the point of repossession to estimate the adjustment. At 31 December 2018,
we only needed to make an adjustment for mortgages, and this increased ECL by £23m (1 January 2018: £25m).
The CRPF and the Board Audit Committee review and approve changes in all key management judgements at least each quarter. The
creation of new PMAs is a joint responsibility between the Risk Provisions & Forecasting team, as model owners who may identify issues
with the historical data, and the Financial Accounting & Control Division, who may identify changes in portfolio or credit quality
performance.
We use a range of methods to identify whether we need a PMA. These include regular review of model monitoring tools, end-user
computing controls monitoring, period-to-period movement and trend analysis, comparison against forecasts, and input from expert teams
who monitor and manage key portfolio risks. We only recognise a PMA if the ECL is over £1m. We keep PMAs in place until we no longer
need them. This will typically be when they are built into our core credit model or the conditions that impacted the historical data no longer
exist.
The Risk Provisions & Forecasting team calculates PMAs to ensure they are incremental to the core credit model and to ensure the
calculation is performed in a consistent and controlled manner. We apply standard end-user computing controls to material and long-
standing PMAs i.e. those expected to be in place for more than six months. Our Independent Validations Team may also review material
PMAs at their discretion. The CRPF approves all new PMAs. It delegates authority to approve temporary PMAs not expected to last
beyond a quarter-end to the Director of Financial Accounting & Control. The Financial Accounting & Control Division reviews all new PMAs
to ensure they comply with IFRS 9. We record all PMAs on a central log maintained by the Financial Accounting & Control Division which
documents the justification, IFRS 9 compliance assessment, expected life, recalibration frequency, calculation methodology and value of
each PMA. The CRPF reviews and approves the log each quarter.
Governance around ECL impairment allowances
Our Risk Methodology team developed our ECL impairment models (except for the OGEM), and all material models are independently
reviewed by our Independent Validations Team. As model owners, our Risk Provisioning & Forecasting team run the models to calculate
our ECL impairment allowances each month. The models are sensitive to changes in credit conditions, and reflect various management
judgements that give rise to measurement uncertainty in our reportable ECL as set out above. The following committees and forums
review the provision drivers and ensure that the management judgements we apply remain appropriate:
– Model Risk Control Forum reviews and approves new models and required model changes.
– ALCO reviews and approves the economic scenarios and probability weights we use to calculate forward-looking scenarios.
– CRPF reviews management judgements and approves ECL impairment allowances.
– Board Audit Committee reviews and challenges the appropriateness of the estimates and judgements made by management.
For more on the governance around specific elements of the ECL impairment allowances, including the frequency of, and thresholds for,
reviews, including by these committees and forums, see the detailed sections above.
How we assess the performance of our ECL estimation process
We assess the reasonableness of our ECL provisions and the results of our Staging analysis using a range of methods. These include:
– Benchmarking: we compare our coverage levels with our peers.
– Stand-back testing: we monitor the level of our coverage against actual write-offs.
– Back-testing: we compare key drivers periodically as part of model monitoring practices.
– Monitoring trends: we track ECL and Staged assets over time and against our internal budgets and forecasts, with triggers set
accordingly.

ˆ200G2Mlv!2NbLYngÅŠ200G2Mlv!2NbLYng¯
628340 TX 66SANTANDERFORM 20-F (SAN UK PL
02-Mar-2019 19:06 ESTHTMLON
Donnelley Financial EGV krisr1dc 13*ESS 0C
VDI-W7-PFL-027512.9.12.0
Page 1 of 1
Annual Report 2018 | Risk review
SANTANDER UK GROUP LEVEL – CREDIT RISK REVIEW
The introduction of IFRS 9
As set out in Note 44 ‘Transition to IFRS 9’ in the Consolidated Financial Statements, IFRS 9 replaced IAS 39 on 1 January 2018. IFRS 9 introduced a
new impairment methodology and rules around classification and measurement of financial assets. As a result of the change from IAS 39 to IFRS 9, some
2018 disclosures in this section are not comparable with prior periods because the methodologies for calculating incurred losses under IAS 39 and ECLs
under IFRS 9 are fundamentally different. This means that some IFRS 9 disclosures do not have prior period comparatives and some IAS 39 disclosures
are no longer relevant from 1 January 2018. We have included comparative tables at 1 January 2018 reflecting the adoption of IFRS 9, where available
and appropriate.
Our maximum and net exposure to credit risk
The tables below show the main differences between our maximum and net exposure to credit risk. They show the effects of collateral, netting, and risk
transfer to mitigate our exposure. The tables only show the financial assets that credit risk affects and to which the impairment requirements in IFRS 9
(2017: IAS 39) are applied.
For balance sheet assets, the maximum exposure to credit risk is the carrying value after impairment loss allowances. Off-balance sheet
exposures are mortgage offers, guarantees, formal standby facilities, credit lines and other commitments. For off-balance sheet
guarantees, the maximum exposure is the maximum amount that we would have to pay if the guarantees were called on. For formal
standby facilities, credit lines and other commitments that are irrevocable over the life of the facility, the maximum exposure is the total
amount of the commitment.
Maximum exposure
Balance sheet asset Off-balance sheet Collateral(1)
2018
Gross
amounts
£bn
Loss
allowance(2)
£bn
Net
amounts
£bn
Gross
amounts
£bn
Loss
allowance(2)
£bn
Net
amounts
£bn
Cash
£bn
Non-cash
£bn
Netting(3)
£bn
Net
exposure
£bn
Cash and balances at central banks 19.7 – 19.7 – – – – – – 19.7
Financial assets at amortised cost:
– Loans and advances to customers:(4)
– Loans secured on residential properties(5) 157.9 (0.2) 157.7 11.2 – 11.2 – (163.8) – 5.1
– Corporate loans 27.8 (0.2) 27.6 17.0 – 17.0 – (20.2) – 24.4
– Finance leases 6.8 (0.1) 6.7 0.2 – 0.2 (0.1) (6.1) – 0.7
– Other unsecured loans 7.6 (0.2) 7.4 11.6 (0.1) 11.5 – – – 18.9
– Amounts due from fellow Banco Santander
group subsidiaries and joint ventures
2.0 – 2.0 – – – – (0.6) – 1.4
– Total loans and advances to customers 202.1 (0.7) 201.4 40.0 (0.1) 39.9 (0.1) (190.7) – 50.5
– Loans and advances to banks 2.8 – 2.8 1.6 – 1.6 – – – 4.4
– Reverse repurchase agreements – non trading
(6) 21.1 – 21.1 – – – – (18.4) (2.7) –
– Other financial assets at amortised cost 7.2 – 7.2 – – – – – – 7.2
Total financial assets at amortised cost: 233.2 (0.7) 232.5 41.6 (0.1) 41.5 (0.1) (209.1) (2.7) 62.1
Financial assets at FVOCI
– Loans and advances to customers 0.1 – 0.1 0.1 – 0.1 – – – 0.2
– Debt securities 13.2 – 13.2 – – – – – – 13.2
Total financial assets at FVOCI 13.3 – 13.3 0.1 – 0.1 – – – 13.4
Total 266.2 (0.7) 265.5 41.7 (0.1) 41.6 (0.1) (209.1) (2.7) 95.2
2017
Cash and balances at central banks 32.8 – 32.8 – – – – 32.8
Loans and advances to customers:(4) (6)
– Advances secured on residential property(5) 155.4 (0.2) 155.2 12.4 – (167.4) – 0.2
– Corporate loans 30.9 (0.5) 30.4 17.1 – (21.8) – 25.7
– Finance leases 6.7 – 6.7 0.6 (0.1) (5.8) – 1.4
– Other unsecured loans 6.2 (0.2) 6.0 11.1 – (0.1) – 17.0
– Amounts due from fellow Banco Santander
group subsidiaries and joint ventures
1.2 – 1.2 – – – – 1.2
Total loans and advances to customers(6)
200.4 (0.9) 199.5 41.2 (0.1) (195.1) – 45.5
Loans and advances to banks(6)3.5 – 3.5 1.6 – – – 5.1
Reverse repurchase agreements – non trading(6) 2.6 – 2.6 – – (2.5) – 0.1
Financial investments:
– Loans and receivables securities(4) 2.2 – 2.2 0.7 – – – 2.9
– Available–for–sale debt securities 8.8 – 8.8 – – – – 8.8
– Held–to–maturity debt securities 6.5 – 6.5 – – – – 6.5
Total financial investments 17.5 – 17.5 0.7 – – – 18.2
Total 256.8 (0.9) 255.9 43.5 (0.1) (197.6) – 101.7
(1) The forms of collateral we take to reduce credit risk include: residential and commercial property; other physical assets, including motor vehicles; liquid securities, including those transferred under reverse repurchase
agreements; cash, including cash used as collateral for derivative transactions; and receivables. Charges on residential property are most of the collateral we take.
(2) Loss allowances for 2017 were on an incurred loss basis per IAS 39, whilst for 2018 they are on an ECL basis per IFRS 9. The loss allowance for off–balance sheet assets is classified in the balance sheet in provisions –
other liabilities.
(3) We can reduce credit risk exposures by applying netting. We do this mainly for derivative and repurchase transactions with financial institutions. For derivatives, we use standard master netting agreements. They allow us
to set off our credit risk exposure to a counterparty from a derivative against our obligations to the counterparty in the event of default. This gives us a lower net credit exposure. They may also reduce settlement
exposure. For more on this, see ‘Credit risk mitigation’ in the ‘Other business segments – credit risk management’ section.
(4) Balances include interest we have charged to the customer’s account and accrued interest that we have not charged to the account yet.
(5) The collateral value we have shown against advances secured on residential property is limited to the balance of each associated individual loan. It does not include the impact of over–collateralisation (where the
collateral has a higher value than the loan balance) and includes collateral we would receive on draw down of certain off–balance sheet commitments.
(6) From 1 January 2018, the non-trading reverse repurchase agreements that are held at amortised cost are now presented as separate lines in the balance sheet, as described in Note 1. Comparatives are re-presented
accordingly.
66 Santander UK plc
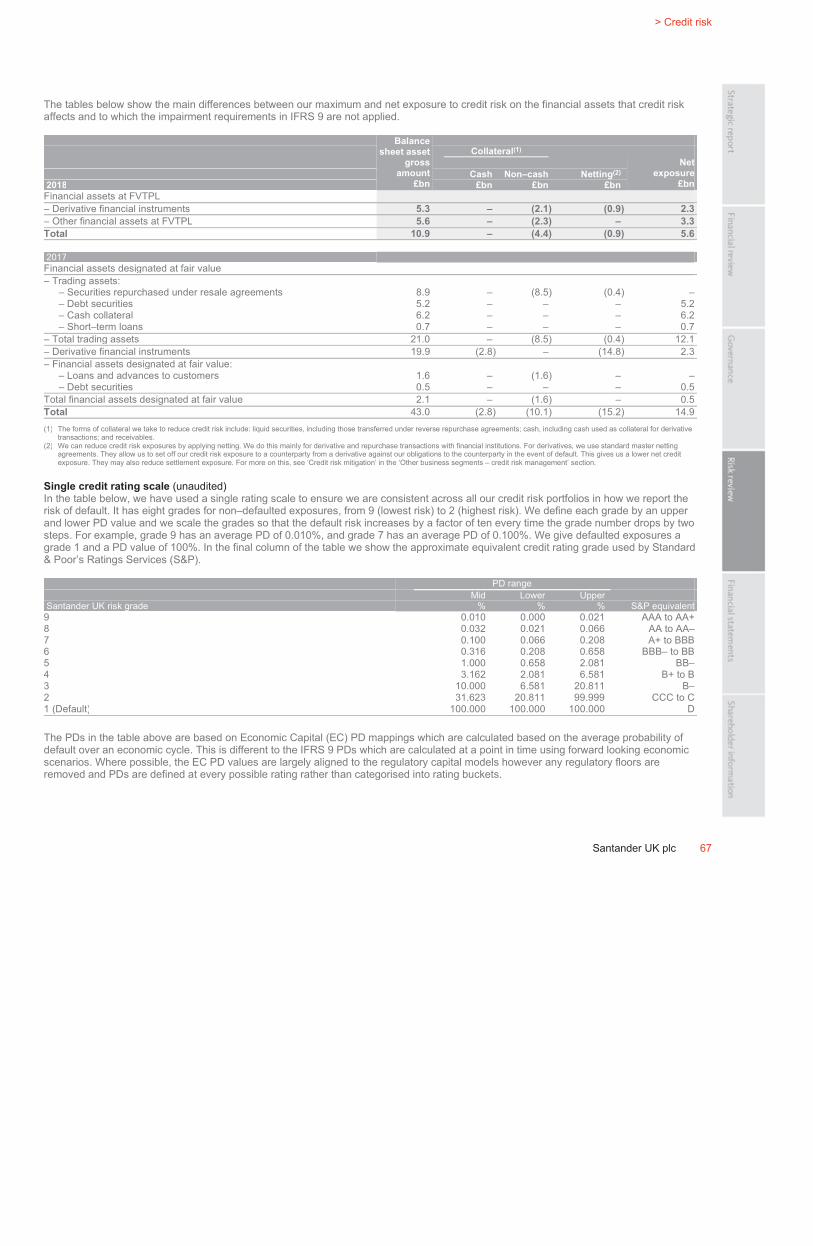
ˆ200G2Mlv!2MgSr#gpŠ200G2Mlv!2MgSr#gp
628340 TX 67SANTANDERFORM 20-F (SAN UK PL
02-Mar-2019 16:48 ESTHTMLON
Donnelley Financial EGV kumak0dc 11*ESS 0C
VDI-W7-PFD-033312.9.12.0
bar4
Page 1 of 1
> Credit risk
Santander UK plc 67
The tables below show the main differences between our maximum and net exposure to credit risk on the financial assets that credit risk
affects and to which the impairment requirements in IFRS 9 are not applied.
Balance
sheet asset
gross
amount
£bn
Collateral(1)
Net
exposure
£bn
Cash Non–cash Netting(2)
2018 £bn £bn £bn
Financial assets at FVTPL
– Derivative financial instruments 5.3 – (2.1) (0.9) 2.3
– Other financial assets at FVTPL 5.6 – (2.3) – 3.3
Total 10.9 – (4.4) (0.9) 5.6
2017
Financial assets designated at fair value
– Trading assets:
– Securities repurchased under resale agreements 8.9 – (8.5) (0.4) –
– Debt securities 5.2 – – – 5.2
– Cash collateral 6.2 – – – 6.2
– Short–term loans 0.7 – – – 0.7
– Total trading assets 21.0 – (8.5) (0.4) 12.1
– Derivative financial instruments 19.9 (2.8) – (14.8) 2.3
– Financial assets designated at fair value:
– Loans and advances to customers 1.6 – (1.6) – –
– Debt securities 0.5 – – – 0.5
Total financial assets designated at fair value 2.1 – (1.6) – 0.5
Total 43.0 (2.8) (10.1) (15.2) 14.9
(1) The forms of collateral we take to reduce credit risk include: liquid securities, including those transferred under reverse repurchase agreements; cash, including cash used as collateral for derivative
transactions; and receivables.
(2) We can reduce credit risk exposures by applying netting. We do this mainly for derivative and repurchase transactions with financial institutions. For derivatives, we use standard master netting
agreements. They allow us to set off our credit risk exposure to a counterparty from a derivative against our obligations to the counterparty in the event of default. This gives us a lower net credit
exposure. They may also reduce settlement exposure. For more on this, see ‘Credit risk mitigation’ in the ‘Other business segments – credit risk management’ section.
Single credit rating scale (unaudited)
In the table below, we have used a single rating scale to ensure we are consistent across all our credit risk portfolios in how we report the
risk of default. It has eight grades for non–defaulted exposures, from 9 (lowest risk) to 2 (highest risk). We define each grade by an upper
and lower PD value and we scale the grades so that the default risk increases by a factor of ten every time the grade number drops by two
steps. For example, grade 9 has an average PD of 0.010%, and grade 7 has an average PD of 0.100%. We give defaulted exposures a
grade 1 and a PD value of 100%. In the final column of the table we show the approximate equivalent credit rating grade used by Standard
& Poor’s Ratings Services (S&P).
PD range
Mid Lower Upper
Santander UK risk grade % % % S&P equivalent
9 0.010 0.000 0.021 AAA to AA+
8 0.032 0.021 0.066 AA to AA–
7 0.100 0.066 0.208 A+ to BBB
6 0.316 0.208 0.658 BBB– to BB
5 1.000 0.658 2.081 BB–
4 3.162 2.081 6.581 B+ to B
3 10.000 6.581 20.811 B–
2 31.623 20.811 99.999 CCC to C
1 (Default) 100.000 100.000 100.000 D
The PDs in the table above are based on Economic Capital (EC) PD mappings which are calculated based on the average probability of
default over an economic cycle. This is different to the IFRS 9 PDs which are calculated at a point in time using forward looking economic
scenarios. Where possible, the EC PD values are largely aligned to the regulatory capital models however any regulatory floors are
removed and PDs are defined at every possible rating rather than categorised into rating buckets.
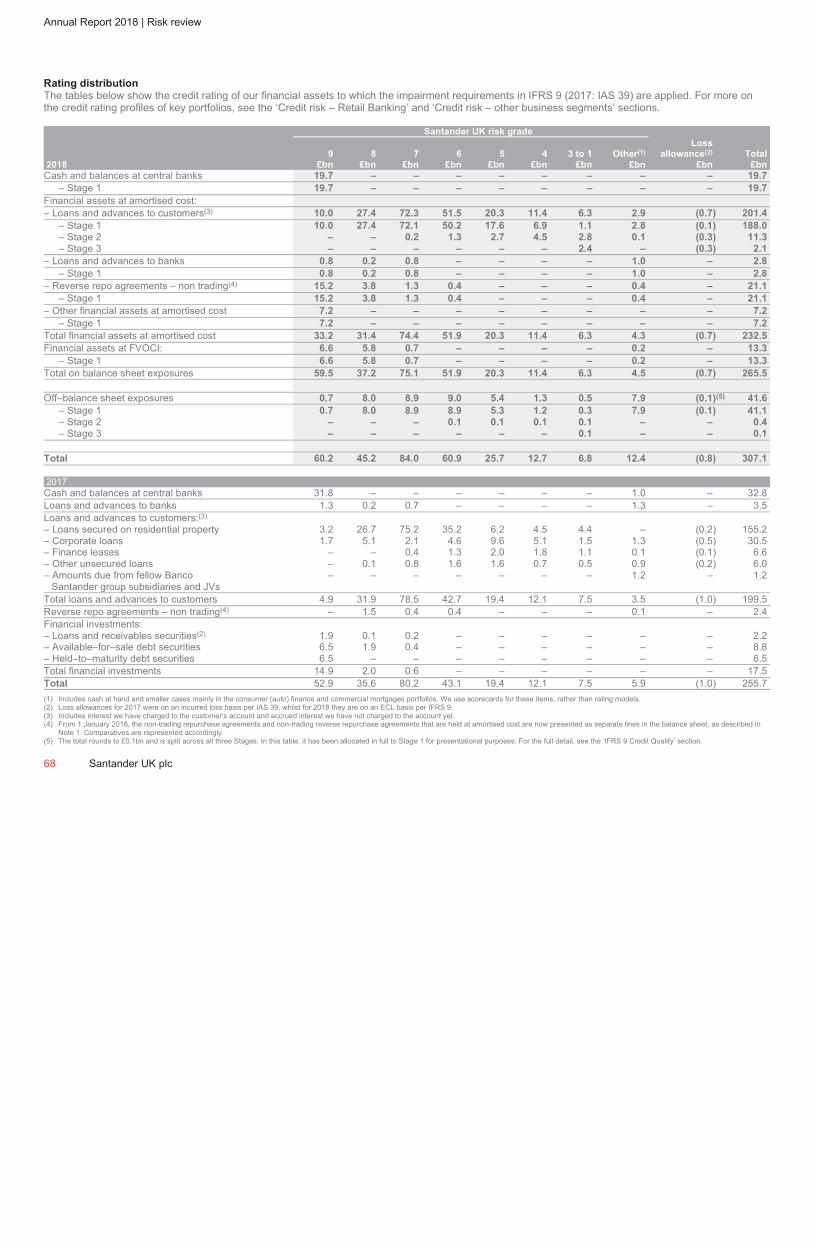
ˆ200G2Mlv!2KRcw#65Š200G2Mlv!2KRcw#65
628340 TX 68SANTANDERFORM 20-F (SAN UK PL
02-Mar-2019 10:30 ESTHTMLON
Donnelley Financial EGV yuraa0dc 5*ESS 0C
VDI-W7-PFL-140512.9.12.0
Page 1 of 1
Annual Report 2018 | Risk review
Rating distribution
The tables below show the credit rating of our financial assets to which the impairment requirements in IFRS 9 (2017: IAS 39) are applied. For more on
the credit rating profiles of key portfolios, see the ‘Credit risk – Retail Banking’ and ‘Credit risk – other business segments’ sections.
Santander UK risk grade
Loss
9 8 7 6 5 4 3 to 1 Other(1) allowance(2) Total
2018 £bn £bn £bn £bn £bn £bn £bn £bn £bn £bn
Cash and balances at central banks 19.7 – – – – – – – – 19.7
– Stage 1 19.7 – – – – – – – – 19.7
Financial assets at amortised cost:
– Loans and advances to customers(3) 10.0 27.4 72.3 51.5 20.3 11.4 6.3 2.9 (0.7) 201.4
– Stage 1 10.0 27.4 72.1 50.2 17.6 6.9 1.1 2.8 (0.1) 188.0
– Stage 2 – – 0.2 1.3 2.7 4.5 2.8 0.1 (0.3) 11.3
– Stage 3 – – – – – – 2.4 – (0.3) 2.1
– Loans and advances to banks 0.8 0.2 0.8 – – – – 1.0 – 2.8
– Stage 1 0.8 0.2 0.8 – – – – 1.0 – 2.8
– Reverse repo agreements – non trading(4) 15.2 3.8 1.3 0.4 – – – 0.4 – 21.1
– Stage 1 15.2 3.8 1.3 0.4 – – – 0.4 – 21.1
– Other financial assets at amortised cost 7.2 – – – – – – – – 7.2
– Stage 1 7.2 – – – – – – – – 7.2
Total financial assets at amortised cost 33.2 31.4 74.4 51.9 20.3 11.4 6.3 4.3 (0.7) 232.5
Financial assets at FVOCI: 6.6 5.8 0.7 – – – – 0.2 – 13.3
– Stage 1 6.6 5.8 0.7 – – – – 0.2 – 13.3
Total on balance sheet exposures 59.5 37.2 75.1 51.9 20.3 11.4 6.3 4.5 (0.7) 265.5
Off–balance sheet exposures 0.7 8.0 8.9 9.0 5.4 1.3 0.5 7.9 (0.1)(5) 41.6
– Stage 1 0.7 8.0 8.9 8.9 5.3 1.2 0.3 7.9 (0.1) 41.1
– Stage 2 – – – 0.1 0.1 0.1 0.1 – – 0.4
– Stage 3 – – – – – – 0.1 – – 0.1
Total 60.2 45.2 84.0 60.9 25.7 12.7 6.8 12.4 (0.8) 307.1
2017
Cash and balances at central banks 31.8 – – – – – – 1.0 – 32.8
Loans and advances to banks 1.3 0.2 0.7 – – – – 1.3 – 3.5
Loans and advances to customers:(3)
– Loans secured on residential property 3.2 26.7 75.2 35.2 6.2 4.5 4.4 – (0.2) 155.2
– Corporate loans 1.7 5.1 2.1 4.6 9.6 5.1 1.5 1.3 (0.5) 30.5
– Finance leases – – 0.4 1.3 2.0 1.8 1.1 0.1 (0.1) 6.6
– Other unsecured loans – 0.1 0.8 1.6 1.6 0.7 0.5 0.9 (0.2) 6.0
– Amounts due from fellow Banco – – – – – – – 1.2 – 1.2
Santander group subsidiaries and JVs
Total loans and advances to customers 4.9 31.9 78.5 42.7 19.4 12.1 7.5 3.5 (1.0) 199.5
Reverse repo agreements – non trading(4)
– 1.5 0.4 0.4 – – – 0.1 – 2.4
Financial investments:
– Loans and receivables securities(2)
1.9 0.1 0.2 – – – – – – 2.2
– Available–for–sale debt securities 6.5 1.9 0.4 – – – – – – 8.8
– Held–to–maturity debt securities 6.5 – – – – – – – – 6.5
Total financial investments 14.9 2.0 0.6 – – – – – – 17.5
Total 52.9 35.6 80.2 43.1 19.4 12.1 7.5 5.9 (1.0) 255.7
(1) Includes cash at hand and smaller cases mainly in the consumer (auto) finance and commercial mortgages portfolios. We use scorecards for these items, rather than rating models.
(2) Loss allowances for 2017 were on an incurred loss basis per IAS 39, whilst for 2018 they are on an ECL basis per IFRS 9.
(3) Includes interest we have charged to the customer’s account and accrued interest we have not charged to the account yet.
(4) From 1 January 2018, the non-trading repurchase agreements and non-trading reverse repurchase agreements that are held at amortised cost are now presented as separate lines in the balance sheet, as described in
Note 1. Comparatives are represented accordingly.
(5) The total rounds to £0.1bn and is split across all three Stages. In this table, it has been allocated in full to Stage 1 for presentational purposes. For the full detail, see the ‘IFRS 9 Credit Quality’ section.
68 Santander UK plc
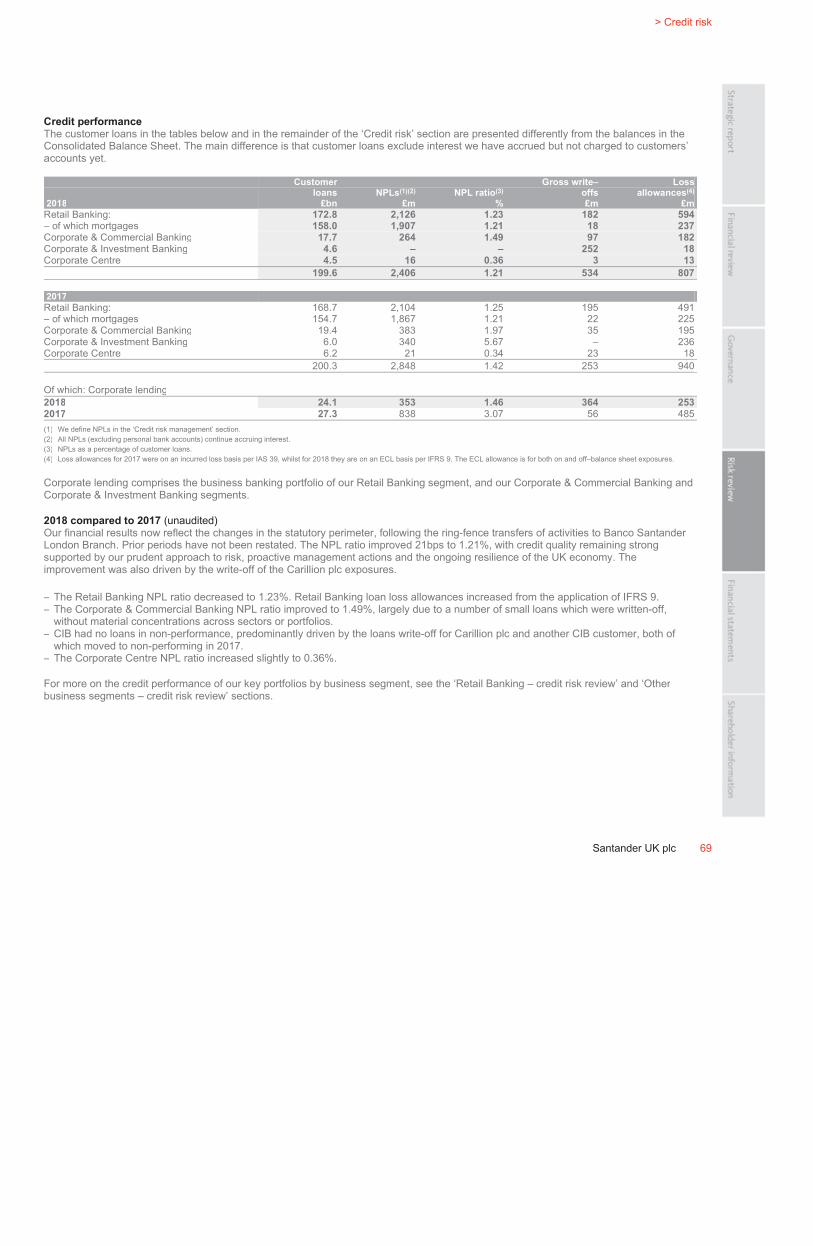
ˆ200G2Mlv!2aS=1lg^Š200G2Mlv!2aS=1lg^
628340 TX 69SANTANDERFORM 20-F (SAN UK PL
04-Mar-2019 02:56 ESTHTMLON
Donnelley Financial EGV shanv1dc 5*ESS 0C
VDI-W7-PFL-160412.9.12.0
bar4
Page 1 of 1
> Credit risk
Santander UK plc 69
Credit performance
The customer loans in the tables below and in the remainder of the ‘Credit risk’ section are presented differently from the balances in the
Consolidated Balance Sheet. The main difference is that customer loans exclude interest we have accrued but not charged to customers’
accounts yet.
Customer Gross write– Loss
loans NPLs(1)(2)
NPL ratio(3)
offs allowances(4)
2018 £bn £m % £m £m
Retail Banking: 172.8 2,126 1.23 182 594
– of which mortgages 158.0 1,907 1.21 18 237
Corporate & Commercial Banking 17.7 264 1.49 97 182
Corporate & Investment Banking 4.6 – – 252 18
Corporate Centre 4.5 16 0.36 3 13
199.6 2,406 1.21 534 807
2017
Retail Banking: 168.7 2,104 1.25 195 491
– of which mortgages 154.7 1,867 1.21 22 225
Corporate & Commercial Banking 19.4 383 1.97 35 195
Corporate & Investment Banking 6.0 340 5.67 – 236
Corporate Centre 6.2 21 0.34 23 18
200.3 2,848 1.42 253 940
Of which: Corporate lending
2018 24.1 353 1.46 364 253
2017 27.3 838 3.07 56 485
(1) We define NPLs in the ‘Credit risk management’ section.
(2) All NPLs (excluding personal bank accounts) continue accruing interest.
(3) NPLs as a percentage of customer loans.
(4) Loss allowances for 2017 were on an incurred loss basis per IAS 39, whilst for 2018 they are on an ECL basis per IFRS 9. The ECL allowance is for both on and off–balance sheet exposures.
Corporate lending comprises the business banking portfolio of our Retail Banking segment, and our Corporate & Commercial Banking and
Corporate & Investment Banking segments.
2018 compared to 2017 (unaudited)
Our financial results now reflect the changes in the statutory perimeter, following the ring-fence transfers of activities to Banco Santander
London Branch. Prior periods have not been restated. The NPL ratio improved 21bps to 1.21%, with credit quality remaining strong
supported by our prudent approach to risk, proactive management actions and the ongoing resilience of the UK economy. The
improvement was also driven by the write-off of the Carillion plc exposures.
– The Retail Banking NPL ratio decreased to 1.23%. Retail Banking loan loss allowances increased from the application of IFRS 9.
– The Corporate & Commercial Banking NPL ratio improved to 1.49%, largely due to a number of small loans which were written-off,
without material concentrations across sectors or portfolios.
– CIB had no loans in non-performance, predominantly driven by the loans write-off for Carillion plc and another CIB customer, both of
which moved to non-performing in 2017.
– The Corporate Centre NPL ratio increased slightly to 0.36%.
For more on the credit performance of our key portfolios by business segment, see the ‘Retail Banking – credit risk review’ and ‘Other
business segments – credit risk review’ sections.
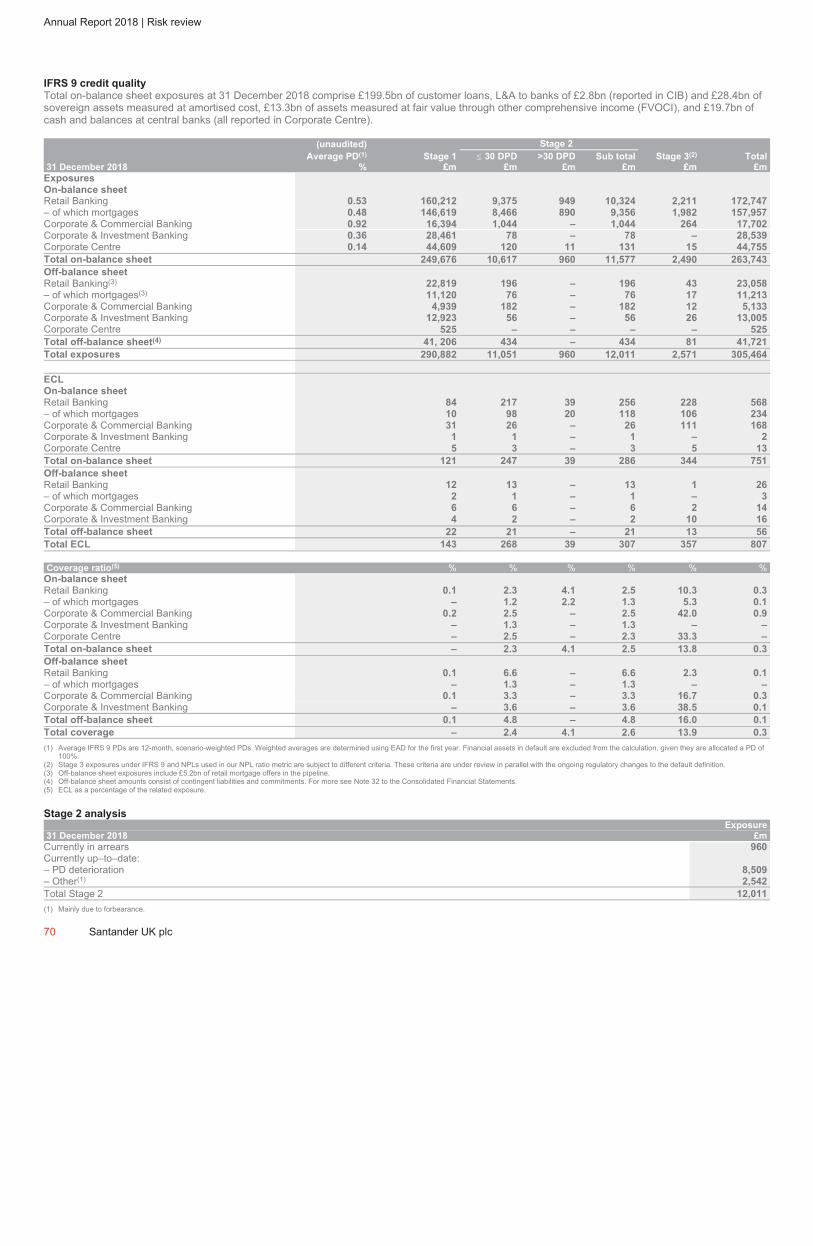
ˆ200G2Mlv!2L1RJ06*Š200G2Mlv!2L1RJ06*
628340 TX 70SANTANDERFORM 20-F (SAN UK PL
02-Mar-2019 12:15 ESTHTMLON
Donnelley Financial EGV krisr1dc 10*ESS 0C
VDI-W7-PFL-027512.9.12.0
Page 1 of 1
Annual Report 2018 | Risk review
IFRS 9 credit quality
Total on-balance sheet exposures at 31 December 2018 comprise £199.5bn of customer loans, L&A to banks of £2.8bn (reported in CIB) and £28.4bn of
sovereign assets measured at amortised cost, £13.3bn of assets measured at fair value through other comprehensive income (FVOCI), and £19.7bn of
cash and balances at central banks (all reported in Corporate Centre).
(unaudited) Stage 2
Average PD(1)
Stage 1 30 DPD >30 DPD Sub total Stage 3(2)
Total
31 December 2018 % £m £m £m £m £m £m
Exposures
On-balance sheet
Retail Banking 0.53 160,212 9,375 949 10,324 2,211 172,747
– of which mortgages 0.48 146,619 8,466 890 9,356 1,982 157,957
Corporate & Commercial Banking 0.92 16,394 1,044 – 1,044 264 17,702
Corporate & Investment Banking 0.36 28,461 78 – 78 – 28,539
Corporate Centre 0.14 44,609 120 11 131 15 44,755
Total on-balance sheet 249,676 10,617 960 11,577 2,490 263,743
Off-balance sheet
Retail Banking(3) 22,819 196 – 196 43 23,058
– of which mortgages(3)
11,120 76 – 76 17 11,213
Corporate & Commercial Banking 4,939 182 – 182 12 5,133
Corporate & Investment Banking 12,923 56 – 56 26 13,005
Corporate Centre 525 – – – – 525
Total off-balance sheet(4) 41, 206 434 – 434 81 41,721
Total exposures 290,882 11,051 960 12,011 2,571 305,464
ECL
On-balance sheet
Retail Banking 84 217 39 256 228 568
– of which mortgages 10 98 20 118 106 234
Corporate & Commercial Banking 31 26 – 26 111 168
Corporate & Investment Banking 1 1 – 1 – 2
Corporate Centre 5 3 – 3 5 13
Total on-balance sheet 121 247 39 286 344 751
Off-balance sheet
Retail Banking 12 13 – 13 1 26
– of which mortgages 2 1 – 1 – 3
Corporate & Commercial Banking 6 6 – 6 2 14
Corporate & Investment Banking 4 2 – 2 10 16
Total off-balance sheet 22 21 – 21 13 56
Total ECL 143 268 39 307 357 807
Coverage ratio(5)
% % % % % %
On-balance sheet
Retail Banking 0.1 2.3 4.1 2.5 10.3 0.3
– of which mortgages – 1.2 2.2 1.3 5.3 0.1
Corporate & Commercial Banking 0.2 2.5 – 2.5 42.0 0.9
Corporate & Investment Banking – 1.3 – 1.3 – –
Corporate Centre – 2.5 – 2.3 33.3 –
Total on-balance sheet – 2.3 4.1 2.5 13.8 0.3
Off-balance sheet
Retail Banking 0.1 6.6 – 6.6 2.3 0.1
– of which mortgages – 1.3 – 1.3 – –
Corporate & Commercial Banking 0.1 3.3 – 3.3 16.7 0.3
Corporate & Investment Banking – 3.6 – 3.6 38.5 0.1
Total off-balance sheet 0.1 4.8 – 4.8 16.0 0.1
Total coverage – 2.4 4.1 2.6 13.9 0.3
(1) Average IFRS 9 PDs are 12-month, scenario-weighted PDs. Weighted averages are determined using EAD for the first year. Financial assets in default are excluded from the calculation, given they are allocated a PD of
100%.
(2) Stage 3 exposures under IFRS 9 and NPLs used in our NPL ratio metric are subject to different criteria. These criteria are under review in parallel with the ongoing regulatory changes to the default definition.
(3) Off-balance sheet exposures include £5.2bn of retail mortgage offers in the pipeline.
(4) Off-balance sheet amounts consist of contingent liabilities and commitments. For more see Note 32 to the Consolidated Financial Statements.
(5) ECL as a percentage of the related exposure.
Stage 2 analysis
Exposure
31 December 2018 £m
Currently in arrears 960
Currently up–to–date:
– PD deterioration 8,509
– Other(1)
2,542
Total Stage 2 12,011
(1) Mainly due to forbearance.
70 Santander UK plc

ˆ200G2Mlv!2aXV28g}Š200G2Mlv!2aXV28g}
628340 TX 71SANTANDERFORM 20-F (SAN UK PL
04-Mar-2019 02:59 ESTHTMLON
Donnelley Financial EGV shanv1dc 9*ESS 0C
VDI-W7-PFL-160412.9.12.0
bar4
Page 1 of 1
> Credit risk
Santander UK plc 71
Total on-balance sheet exposures at 1 January 2018 comprise £200.3bn of customer loans, L&A to banks of £3.5bn (reported in CIB) and
£11.3bn of sovereign assets measured at amortised cost, £8.9bn of assets measured at FVOCI, and £32.8bn of cash and balances at
central banks (all reported in Corporate Centre).
(unaudited) Stage 2
Average PD(1) Stage 1 30 DPD >30 DPD Sub total Stage 3(2) Total
1 January 2018 % £m £m £m £m £m £m
Exposures
On-balance sheet
Retail Banking 0.61 155,845 9,537 1,120 10,657 2,222 168,724
– of which mortgages 0.55 142,940 8,765 991 9,756 1,986 154,682
Corporate & Commercial Banking 0.79 18,362 575 71 646 383 19,391
Corporate & Investment Banking 0.17 11,684 93 – 93 340 12,117
Corporate Centre 0.07 56,325 172 38 210 20 56,555
Total on-balance sheet 242,216 10,377 1,229 11,606 2,965 256,787
Off-balance sheet
Retail Banking(3) 23,133 223 5 228 41 23,402
– of which mortgages(3) 12,215 126 2 128 18 12,361
Corporate & Commercial Banking 4,055 211 9 220 5 4,280
Corporate & Investment Banking 14,899 16 – 16 32 14,947
Corporate Centre 830 40 – 40 – 870
Total off–balance sheet(4)42,917 490 14 504 78 43,499
Total exposures 285,133 10,867 1,243 12,110 3,043 300,286
ECL
On-balance sheet
Retail Banking 97 206 28 234 266 597
– of which mortgages 20 113 16 129 121 270
Corporate & Commercial Banking 38 17 8 25 173 236
Corporate & Investment Banking 8 – – – 242 250
Corporate Centre 7 2 2 4 8 19
Total on-balance sheet 150 225 38 263 689 1,102
Off-balance sheet
Retail Banking 13 13 – 13 2 28
– of which mortgages – 2 – 2 – 2
Corporate & Commercial Banking 5 8 – 8 – 13
Corporate & Investment Banking 8 – – – – 8
Total off-balance sheet 26 21 – 21 2 49
Total ECL 176 246 38 284 691 1,151
Coverage ratio(5) % % % % % %
On-balance sheet
Retail Banking 0.1 2.2 2.5 2.2 12.0 0.4
– of which mortgages – 1.3 1.6 1.3 6.1 0.2
Corporate & Commercial Banking 0.2 3.0 11.3 3.9 45.2 1.2
Corporate & Investment Banking 0.1 – – – 71.2 2.1
Corporate Centre – 1.2 5.3 1.9 40.0 –
Total on-balance sheet 0.1 2.2 3.1 2.3 23.2 0.4
Off-balance sheet
Retail Banking 0.1 5.8 – 5.7 4.9 0.1
– of which mortgages – 1.6 – 1.6 – –
Corporate & Commercial Banking 0.1 3.8 – 3.6 – 0.3
Corporate & Investment Banking 0.1 – – – – 0.1
Total off-balance sheet 0.1 4.3 – 4.2 2.6 0.1
Total coverage 0.1 2.3 3.1 2.3 22.7 0.4
(1) Average IFRS 9 PDs are 12-month, scenario-weighted PDs. Weighted averages are determined using EAD for the first year. Financial assets in default are excluded from the calculation, given they
are allocated a PD of 100%.
(2) Stage 3 exposures under IFRS 9 and NPLs used in our NPL ratio metric are subject to different criteria. These criteria are under review in parallel with the ongoing regulatory changes to the default
definition.
(3) Off-balance sheet exposures include £6.2bn of retail mortgage offers in the pipeline.
(4) Off-balance sheet amounts consist of contingent liabilities and commitments. For more, see Note 32 to the Consolidated Financial Statements.
(5) ECL as a percentage of the related exposure.
31 December 2018 compared to 1 January 2018 (unaudited)
Key movements in exposures and ECL in the year by Stage were:
– The increase in Stage 1 exposures was largely driven by reverse repurchase agreements – non trading in CIB. As part of our ring-
fencing implementation, reverse repurchase agreements – non trading are now accounted for at amortised cost, in line with our business
model for managing these assets as part of our overall funding and liquidity plans. Previously, similar transactions were mainly classified
as trading assets and accounted for at FVTPL. As the impairment requirements in IFRS 9 do not apply to FVTPL assets, they are not
included in this table and the change in treatment led to an increase in the Stage 1 CIB exposures. Reverse repurchase agreements
carry very low credit risk and the ECL at 31 December 2018 was not material. Stage 1 exposures also increased due to lending growth
in mortgages. The increase was partially offset by a decrease in cash and balances at central banks (reported in Corporate Centre) for
which the ECL was also not material, and transfers as part of our ring-fencing plans. Stage 1 ECLs decreased, reflecting our prudent
approach to lending.
– Stage 2 exposures and the corresponding ECLs were broadly unchanged from 1 January 2018, with a steady inflow and cure through
proactive management action.
– Stage 3 exposures decreased in part due to the write-off of the Carillion plc exposures and the corresponding ECL, alongside successful
refinancing and restructuring of several large cases in Corporate & Commercial Banking, but also as a result of our prudent approach to
risk, proactive management actions and the ongoing resilience of the UK economy.
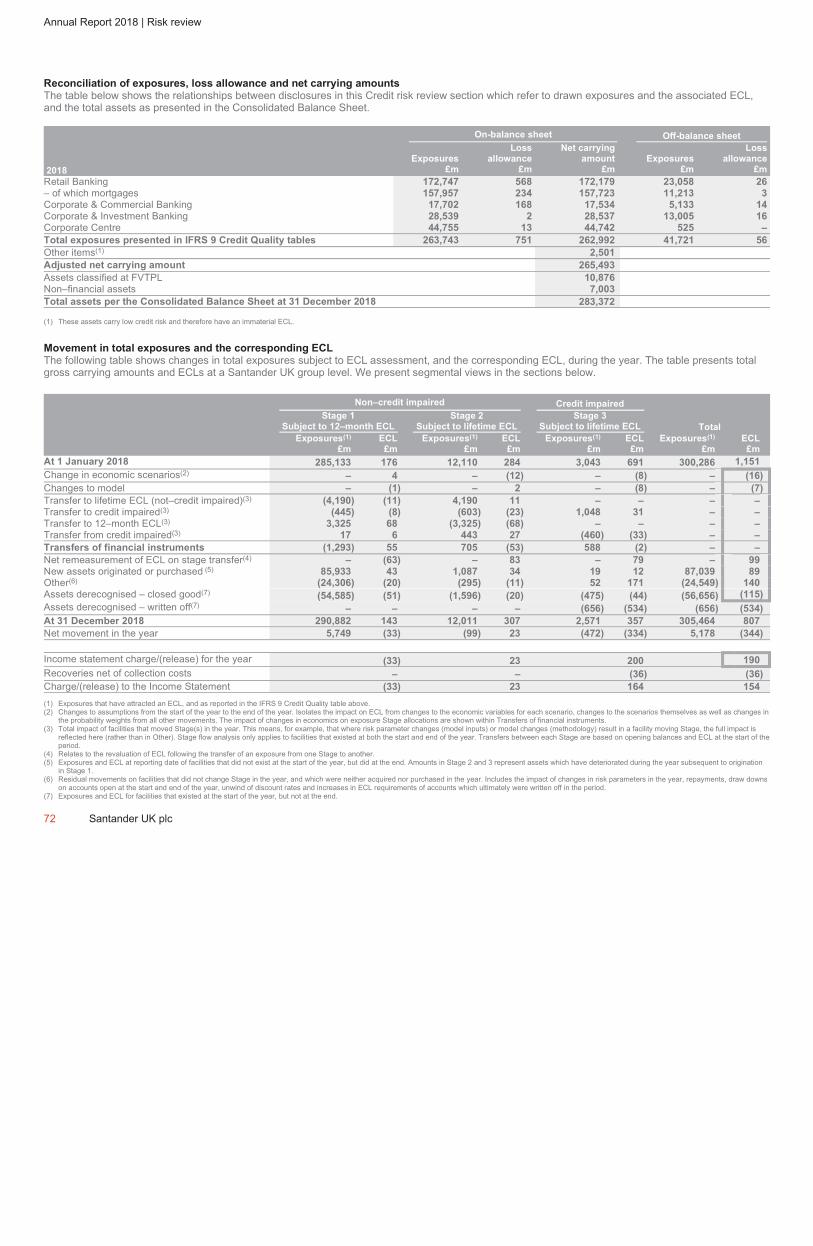
ˆ200G2Mlv!2MtPnn6fŠ200G2Mlv!2MtPnn6f
628340 TX 72SANTANDERFORM 20-F (SAN UK PL
02-Mar-2019 17:18 ESTHTMLON
Donnelley Financial EGV kumak0dc 7*ESS 0C
VDI-W7-PFD-033312.9.12.0
Page 1 of 1
Annual Report 2018 | Risk review
Reconciliation of exposures, loss allowance and net carrying amounts
The table below shows the relationships between disclosures in this Credit risk review section which refer to drawn exposures and the associated ECL,
and the total assets as presented in the Consolidated Balance Sheet.
On-balance sheet Off-balance sheet
2018
Exposures
£m
Loss
allowance
£m
Net carrying
amount
£m
Exposures
£m
Loss
allowance
£m
Retail Banking 172,747 568 172,179 23,058 26
– of which mortgages 157,957 234 157,723 11,213 3
Corporate & Commercial Banking 17,702 168 17,534 5,133 14
Corporate & Investment Banking 28,539 2 28,537 13,005 16
Corporate Centre 44,755 13 44,742 525 –
Total exposures presented in IFRS 9 Credit Quality tables 263,743 751 262,992 41,721 56
Other items(1)
2,501
Adjusted net carrying amount 265,493
Assets classified at FVTPL 10,876
Non–financial assets 7,003
Total assets per the Consolidated Balance Sheet at 31 December 2018 283,372
(1) These assets carry low credit risk and therefore have an immaterial ECL.
Movement in total exposures and the corresponding ECL
The following table shows changes in total exposures subject to ECL assessment, and the corresponding ECL, during the year. The table presents total
gross carrying amounts and ECLs at a Santander UK group level. We present segmental views in the sections below.
Non–credit impaired Credit impaired
Stage 1
Subject to 12–month ECL
Stage 2
Subject to lifetime ECL
Stage 3
Subject to lifetime ECL Total
Exposures(1)
£m
ECL
£m
Exposures(1)
£m
ECL
£m
Exposures(1)
£m
ECL
£m
Exposures(1)
£m
ECL
£m
At 1 January 2018 285,133 176 12,110 284 3,043 691 300,286 1,151
Change in economic scenarios(2)
– 4 – (12) – (8) – (16)
Changes to model – (1) – 2 – (8) – (7)
Transfer to lifetime ECL (not–credit impaired)(3) (4,190) (11) 4,190 11 – – – –
Transfer to credit impaired(3) (445) (8) (603) (23) 1,048 31 – –
Transfer to 12–month ECL(3) 3,325 68 (3,325) (68) – – – –
Transfer from credit impaired(3)
17 6 443 27 (460) (33) – –
Transfers of financial instruments (1,293) 55 705 (53) 588 (2) – –
Net remeasurement of ECL on stage transfer(4) – (63) – 83 – 79 – 99
New assets originated or purchased (5)
85,933 43 1,087 34 19 12 87,039 89
Other(6) (24,306) (20) (295) (11) 52 171 (24,549) 140
Assets derecognised – closed good(7)(54,585) (51) (1,596) (20) (475) (44) (56,656) (115)
Assets derecognised – written off(7)
– – – – (656) (534) (656) (534)
At 31 December 2018 290,882 143 12,011 307 2,571 357 305,464 807
Net movement in the year 5,749 (33) (99) 23 (472) (334) 5,178 (344)
Income statement charge/(release) for the year (33) 23 200 190
Recoveries net of collection costs – – (36) (36)
Charge/(release) to the Income Statement (33) 23 164 154
(1) Exposures that have attracted an ECL, and as reported in the IFRS 9 Credit Quality table above.
(2) Changes to assumptions from the start of the year to the end of the year. Isolates the impact on ECL from changes to the economic variables for each scenario, changes to the scenarios themselves as well as changes in
the probability weights from all other movements. The impact of changes in economics on exposure Stage allocations are shown within Transfers of financial instruments.
(3) Total impact of facilities that moved Stage(s) in the year. This means, for example, that where risk parameter changes (model inputs) or model changes (methodology) result in a facility moving Stage, the full impact is
reflected here (rather than in Other). Stage flow analysis only applies to facilities that existed at both the start and end of the year. Transfers between each Stage are based on opening balances and ECL at the start of the
period.
(4) Relates to the revaluation of ECL following the transfer of an exposure from one Stage to another.
(5) Exposures and ECL at reporting date of facilities that did not exist at the start of the year, but did at the end. Amounts in Stage 2 and 3 represent assets which have deteriorated during the year subsequent to origination
in Stage 1.
(6) Residual movements on facilities that did not change Stage in the year, and which were neither acquired nor purchased in the year. Includes the impact of changes in risk parameters in the year, repayments, draw downs
on accounts open at the start and end of the year, unwind of discount rates and increases in ECL requirements of accounts which ultimately were written off in the period.
(7) Exposures and ECL for facilities that existed at the start of the year, but not at the end.
72 Santander UK plc
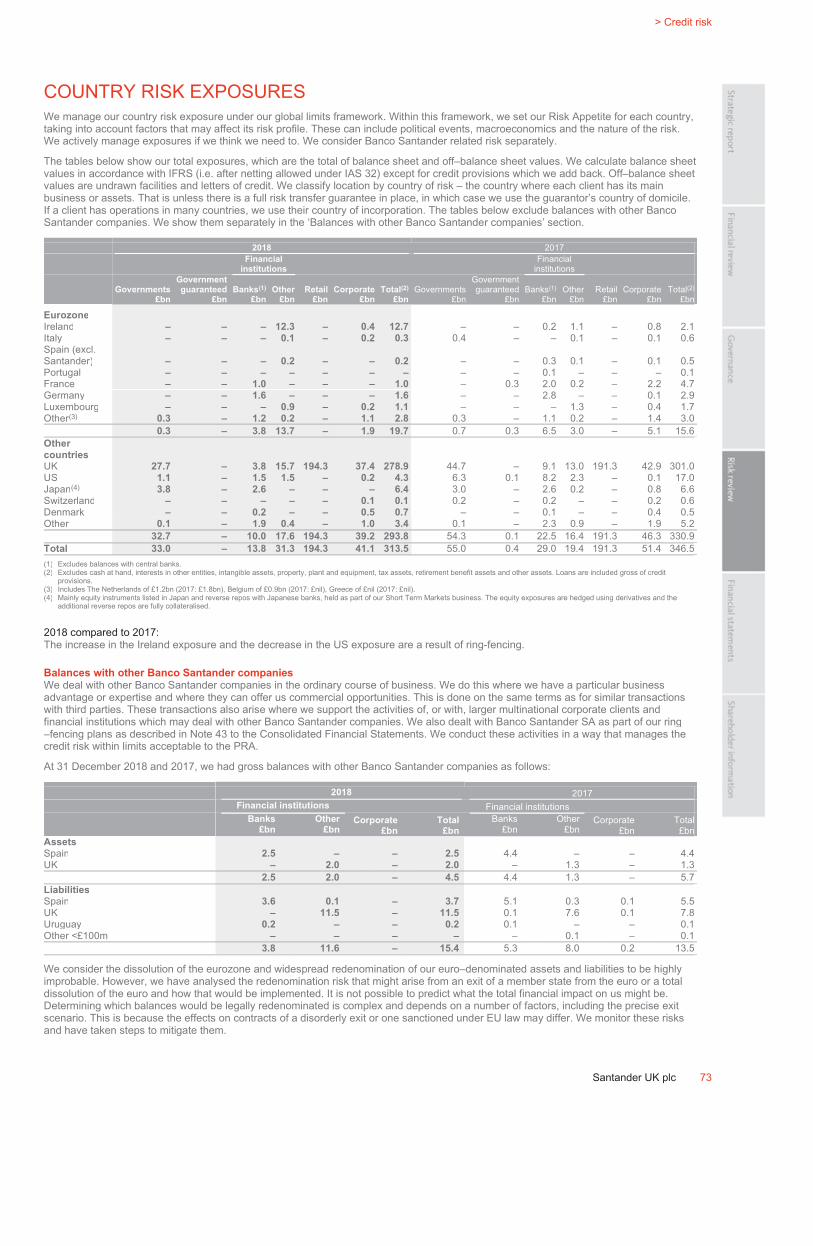
ˆ200G2Mlv!2KWV3J6\Š200G2Mlv!2KWV3J6\
628340 TX 73SANTANDERFORM 20-F (SAN UK PL
02-Mar-2019 10:41 ESTHTMLON
Donnelley Financial EGV manra0dc 10*ESS 0C
VDI-W7-PFL-128212.9.12.0
bar4
Page 1 of 1
> Credit risk
Santander UK plc 73
COUNTRY RISK EXPOSURES
We manage our country risk exposure under our global limits framework. Within this framework, we set our Risk Appetite for each country,
taking into account factors that may affect its risk profile. These can include political events, macroeconomics and the nature of the risk.
We actively manage exposures if we think we need to. We consider Banco Santander related risk separately.
The tables below show our total exposures, which are the total of balance sheet and off–balance sheet values. We calculate balance sheet
values in accordance with IFRS (i.e. after netting allowed under IAS 32) except for credit provisions which we add back. Off–balance sheet
values are undrawn facilities and letters of credit. We classify location by country of risk – the country where each client has its main
business or assets. That is unless there is a full risk transfer guarantee in place, in which case we use the guarantor’s country of domicile.
If a client has operations in many countries, we use their country of incorporation. The tables below exclude balances with other Banco
Santander companies. We show them separately in the ‘Balances with other Banco Santander companies’ section.
2018 2017
Financial
institutions
Financial
institutions
Governments
£bn
Government
guaranteed
£bn
Banks(1)
£bn
Other
£bn
Retail
£bn
Corporate
£bn
Total(2)
£bn
Governments
£bn
Government
guaranteed
£bn
Banks(1)
£bn
Other
£bn
Retail
£bn
Corporate
£bn
Total(2)
£bn
Eurozone
Ireland – – – 12.3 – 0.4 12.7 – – 0.2 1.1 – 0.8 2.1
Italy – – – 0.1 – 0.2 0.3 0.4 – – 0.1 – 0.1 0.6
Spain (excl.
Santander) – – – 0.2 – – 0.2 – – 0.3 0.1 – 0.1 0.5
Portugal – – – – – – – – – 0.1 – – – 0.1
France – – 1.0 – – – 1.0 – 0.3 2.0 0.2 – 2.2 4.7
Germany – – 1.6 – – – 1.6 – – 2.8 – – 0.1 2.9
Luxembourg – – – 0.9 – 0.2 1.1 – – – 1.3 – 0.4 1.7
Other(3) 0.3 – 1.2 0.2 – 1.1 2.8 0.3 – 1.1 0.2 – 1.4 3.0
0.3 – 3.8 13.7 – 1.9 19.7 0.7 0.3 6.5 3.0 – 5.1 15.6
Other
countries
UK 27.7 – 3.8 15.7 194.3 37.4 278.9 44.7 – 9.1 13.0 191.3 42.9 301.0
US 1.1 – 1.5 1.5 – 0.2 4.3 6.3 0.1 8.2 2.3 – 0.1 17.0
Japan(4) 3.8 – 2.6 – – – 6.4 3.0 – 2.6 0.2 – 0.8 6.6
Switzerland – – – – – 0.1 0.1 0.2 – 0.2 – – 0.2 0.6
Denmark – – 0.2 – – 0.5 0.7 – – 0.1 – – 0.4 0.5
Other 0.1 – 1.9 0.4 – 1.0 3.4 0.1 – 2.3 0.9 – 1.9 5.2
32.7 – 10.0 17.6 194.3 39.2 293.8 54.3 0.1 22.5 16.4 191.3 46.3 330.9
Total 33.0 – 13.8 31.3 194.3 41.1 313.5 55.0 0.4 29.0 19.4 191.3 51.4 346.5
(1) Excludes balances with central banks.
(2) Excludes cash at hand, interests in other entities, intangible assets, property, plant and equipment, tax assets, retirement benefit assets and other assets. Loans are included gross of credit
provisions.
(3) Includes The Netherlands of £1.2bn (2017: £1.8bn), Belgium of £0.9bn (2017: £nil), Greece of £nil (2017: £nil).
(4) Mainly equity instruments listed in Japan and reverse repos with Japanese banks, held as part of our Short Term Markets business. The equity exposures are hedged using derivatives and the
additional reverse repos are fully collateralised.
2018 compared to 2017:
The increase in the Ireland exposure and the decrease in the US exposure are a result of ring-fencing.
Balances with other Banco Santander companies
We deal with other Banco Santander companies in the ordinary course of business. We do this where we have a particular business
advantage or expertise and where they can offer us commercial opportunities. This is done on the same terms as for similar transactions
with third parties. These transactions also arise where we support the activities of, or with, larger multinational corporate clients and
financial institutions which may deal with other Banco Santander companies. We also dealt with Banco Santander SA as part of our ring
–fencing plans as described in Note 43 to the Consolidated Financial Statements. We conduct these activities in a way that manages the
credit risk within limits acceptable to the PRA.
At 31 December 2018 and 2017, we had gross balances with other Banco Santander companies as follows:
2018 2017
Financial institutions Financial institutions
Banks
£bn
Other
£bn
Corporate
£bn
Total
£bn
Banks
£bn
Other
£bn
Corporate
£bn
Total
£bn
Assets
Spain 2.5 – – 2.5 4.4 – – 4.4
UK – 2.0 – 2.0 – 1.3 – 1.3
2.5 2.0 – 4.5 4.4 1.3 – 5.7
Liabilities
Spain 3.6 0.1 – 3.7 5.1 0.3 0.1 5.5
UK – 11.5 – 11.5 0.1 7.6 0.1 7.8
Uruguay 0.2 – – 0.2 0.1 – – 0.1
Other <£100m – – – – – 0.1 – 0.1
3.8 11.6 – 15.4 5.3 8.0 0.2 13.5
We consider the dissolution of the eurozone and widespread redenomination of our euro–denominated assets and liabilities to be highly
improbable. However, we have analysed the redenomination risk that might arise from an exit of a member state from the euro or a total
dissolution of the euro and how that would be implemented. It is not possible to predict what the total financial impact on us might be.
Determining which balances would be legally redenominated is complex and depends on a number of factors, including the precise exit
scenario. This is because the effects on contracts of a disorderly exit or one sanctioned under EU law may differ. We monitor these risks
and have taken steps to mitigate them.
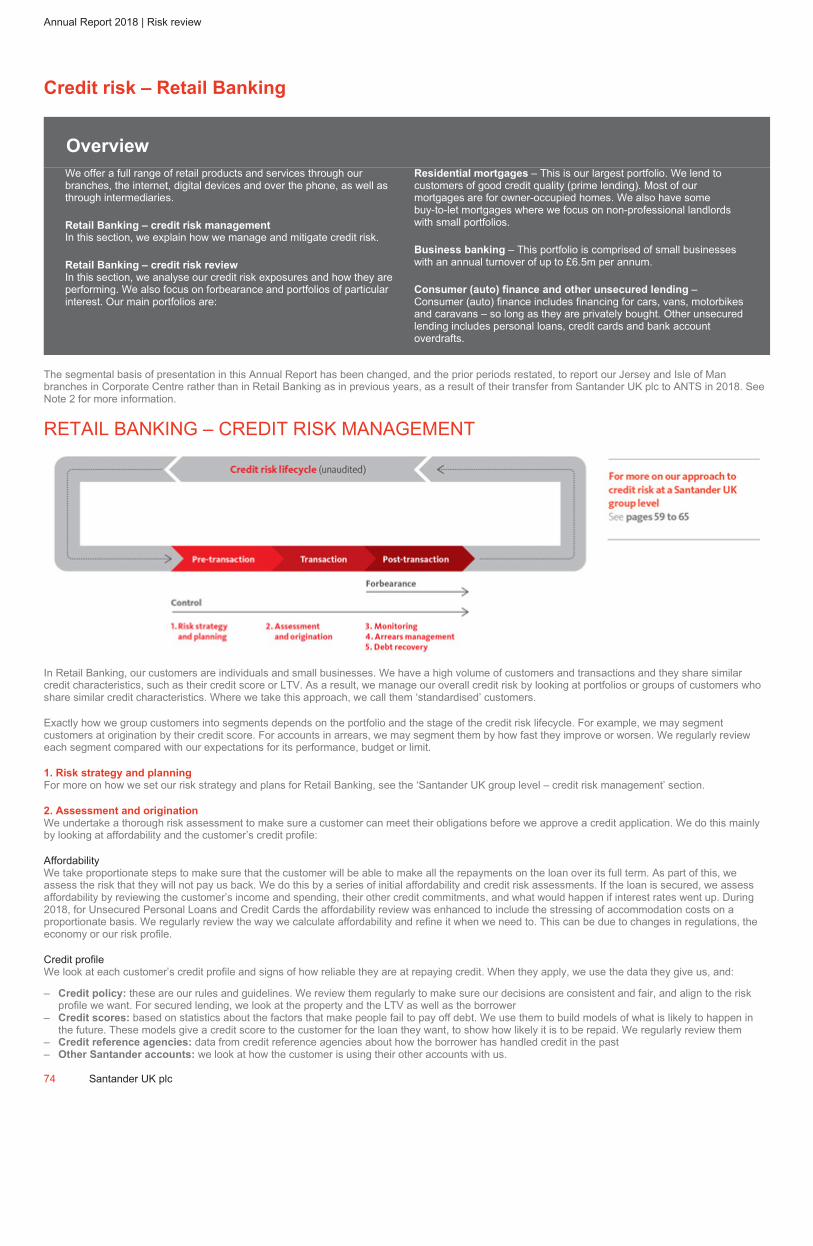
ˆ200G2Mlv!2Z%fmsgwŠ200G2Mlv!2Z%fmsgw
628340 TX 74SANTANDERFORM 20-F (SAN UK PL
04-Mar-2019 01:36 ESTHTMLON
Donnelley Financial EGV gopad0dc 10*ESS 0C
VDI-W7-PFD-037812.9.12.0
f74n
Page 1 of 1
Annual Report 2018 | Risk review
Credit risk – Retail Banking
Overview
We offer a full range of retail products and services through our
branches, the internet, digital devices and over the phone, as well as
through intermediaries.
Retail Banking – credit risk management
In this section, we explain how we manage and mitigate credit risk.
Retail Banking – credit risk review
In this section, we analyse our credit risk exposures and how they are
performing. We also focus on forbearance and portfolios of particular
interest. Our main portfolios are:
Residential mortgages – This is our largest portfolio. We lend to
customers of good credit quality (prime lending). Most of our
mortgages are for owner-occupied homes. We also have some
buy-to-let mortgages where we focus on non-professional landlords
with small portfolios.
Business banking – This portfolio is comprised of small businesses
with an annual turnover of up to £6.5m per annum.
Consumer (auto) finance and other unsecured lending –
Consumer (auto) finance includes financing for cars, vans, motorbikes
and caravans – so long as they are privately bought. Other unsecured
lending includes personal loans, credit cards and bank account
overdrafts.
The segmental basis of presentation in this Annual Report has been changed, and the prior periods restated, to report our Jersey and Isle of Man
branches in Corporate Centre rather than in Retail Banking as in previous years, as a result of their transfer from Santander UK plc to ANTS in 2018. See
Note 2 for more information.
RETAIL BANKING – CREDIT RISK MANAGEMENT
In Retail Banking, our customers are individuals and small businesses. We have a high volume of customers and transactions and they share similar
credit characteristics, such as their credit score or LTV. As a result, we manage our overall credit risk by looking at portfolios or groups of customers who
share similar credit characteristics. Where we take this approach, we call them ‘standardised’ customers.
Exactly how we group customers into segments depends on the portfolio and the stage of the credit risk lifecycle. For example, we may segment
customers at origination by their credit score. For accounts in arrears, we may segment them by how fast they improve or worsen. We regularly review
each segment compared with our expectations for its performance, budget or limit.
1. Risk strategy and planning
For more on how we set our risk strategy and plans for Retail Banking, see the ‘Santander UK group level – credit risk management’ section.
2. Assessment and origination
We undertake a thorough risk assessment to make sure a customer can meet their obligations before we approve a credit application. We do this mainly
by looking at affordability and the customer’s credit profile:
Affordability
We take proportionate steps to make sure that the customer will be able to make all the repayments on the loan over its full term. As part of this, we
assess the risk that they will not pay us back. We do this by a series of initial affordability and credit risk assessments. If the loan is secured, we assess
affordability by reviewing the customer’s income and spending, their other credit commitments, and what would happen if interest rates went up. During
2018, for Unsecured Personal Loans and Credit Cards the affordability review was enhanced to include the stressing of accommodation costs on a
proportionate basis. We regularly review the way we calculate affordability and refine it when we need to. This can be due to changes in regulations, the
economy or our risk profile.
Credit profile
We look at each customer’s credit profile and signs of how reliable they are at repaying credit. When they apply, we use the data they give us, and:
– Credit policy: these are our rules and guidelines. We review them regularly to make sure our decisions are consistent and fair, and align to the risk
profile we want. For secured lending, we look at the property and the LTV as well as the borrower
– Credit scores: based on statistics about the factors that make people fail to pay off debt. We use them to build models of what is likely to happen in
the future. These models give a credit score to the customer for the loan they want, to show how likely it is to be repaid. We regularly review them
– Credit reference agencies: data from credit reference agencies about how the borrower has handled credit in the past
– Other Santander accounts: we look at how the customer is using their other accounts with us.
74 Santander UK plc

ˆ200G2Mlv!2LCghR6zŠ200G2Mlv!2LCghR6z
628340 TX 75SANTANDERFORM 20-F (SAN UK PL
02-Mar-2019 12:46 ESTHTMLON
Donnelley Financial EGV krisr1dc 10*ESS 0C
VDI-W7-PFL-027512.9.12.0
bar4
Page 1 of 1
> Credit risk
Santander UK plc 75
How we make the decision
Many of our decisions are automated as our risk systems contain data about affordability and credit history. We tailor the process and how
we assess the application based on the type of product being taken. More complex transactions often need greater manual assessment.
This means we have to rely more on our credit underwriters’ skill and experience in making the decision. This is particularly true for
secured lending, where we might need to do more checks on the customer’s income, or get a property valuation from an approved
surveyor, for example.
Credit risk mitigation
The types of credit risk mitigation, including collateral, across each of our portfolios is:
Portfolio Description
Residential
mortgages
Collateral is in the form of a first legal charge over the property. Before we grant a mortgage, we have the
property valued. We have our own guidelines for surveyor valuations, which build on guidance from the Royal
Institution of Chartered Surveyors (RICS). But we also make use of automated valuation methodologies
where our confidence in the accuracy of this method is high.
Business banking Includes secured and unsecured lending. We can take mortgage debentures as collateral if the business is
incorporated. These are charges over a company’s assets. We can also take guarantees, but we do not treat
them as collateral, and we do not put a cash value on them unless they are secured against a tangible asset.
If a customer defaults, we work with them to consider debt restructuring options. We generally do not enforce
our security over their assets except as a last resort. In which case we might appoint an administrator or
receiver.
Consumer (auto)
finance
Collateral is in the form of legal ownership of the vehicle for most consumer (auto) finance loans, with the
customer being the registered keeper. Only a very small proportion of the consumer (auto) finance business
is underwritten as a personal loan. In these cases there is no collateral or security tied to the loan. We use a
leading vehicle valuation company to assess the LTV at the proposal stage.
Unsecured lending Unsecured lending means there is no collateral or security tied to the loan that can be used to mitigate any
potential loss if the customer does not pay us back.
3. Monitoring
Our risk assessment does not end once we have made the decision to lend. We monitor credit risk across the credit risk lifecycle, mainly
using IT systems. There are three main parts:
– Behaviour scoring: we use statistical models that help to predict whether the customer will have problems repaying, based on data
about how they use their accounts
– Credit reference agencies: we often use data from agencies on how the borrower is handling credit from other lenders in our
behaviour scoring models. We also buy services like proprietary scorecards or account alerts, which tell us as soon as the customer
does something that concerns us, such as missing a payment to another lender
– Other Santander accounts: every month, we also look at how the customer is using their other accounts with us, so we can identify
problems early.
For secured lending, our monitoring also takes account of changes in property prices. We estimate the property’s current value every three
months. We use statistical models based on recent sales prices and valuations in that local area. A lack of data can mean our confidence
in the model’s valuation drops below a certain minimum level, and in that case we use the House Price Index (HPI) instead.
The way we use our monitoring to manage risk varies by product. For revolving credit facilities like credit cards and overdrafts, it might lead
us to raise or lower credit limits. Our monitoring can also mean we change our minds about whether a product is still right for a customer.
This can influence whether we approve a refinancing application. In these ways we can balance a customer’s needs and their ability to
manage credit. If we find evidence that a customer is in financial difficulties, we contact them about arrears management including
forbearance, which we explain in more detail below.
Our day-to-day retail credit risk monitoring relies on a mix of product, customer and portfolio performance measures as described above.
However, changes in the wider UK macro-economy also have an impact on our retail portfolios. To reflect this, since 2017 we have used a
Retail Risk Playbook tolerance framework to enhance our day-to-day risk monitoring. This is a formal, structured framework that sets out
the macroeconomic variables that are most relevant to retail portfolio performance. We monitor these variables against the related
forecasts that we have used in our business plans. If the economy deviates materially from our forecasts, we will formally review and
reconsider our retail risk management policy and strategy. This framework remains in place and will continue to do so for as long as we
consider is necessary.
4. Arrears management
We have several strategies for managing arrears and these can be used before the customer has formally defaulted, or as early as the day
after a missed payment. We assess the problems a customer is having, so we can offer them the right help to bring their account
up-to-date as soon as possible. The most common way to bring an account up-to-date is to agree an affordable repayment plan with the
customer.
The strategy we use depends on the risk and the customer’s circumstances. We have a range of tools to help customers to reach an
affordable and acceptable solution. This could mean visiting the customer, offering debt counselling by a third party, or paying off the debt
using money from their other accounts with us, where we have the right to do so.
5. Debt recovery
When a customer cannot or will not keep to an agreement for paying off their arrears, we consider recovery options. We only do this once
we have tried to get the account back in order. To recover what we are owed, we may use a debt collection agency, sell the debt, or take
the customer to court.
For secured retail loans (most of which are mortgages), we can delay legal action. That can happen if the customer shows that they will be
able to pay off the loan or the arrears. We aim to repossess only as a last resort or if necessary to protect the property from damage or
third party claims.
We make sure our estimated losses from repossessed properties are realistic by getting two independent valuations on each property, as
well as the estimated cost of selling it. These form the basis of our loss allowances calculations. Where we do enforce the possession of
properties held as collateral, we use external agents to realise the value and settle the debt. During this process we do not own the
property but we do administer the sale process. Any surplus funds are returned to the borrower or are otherwise dealt with in accordance
with insolvency regulations.
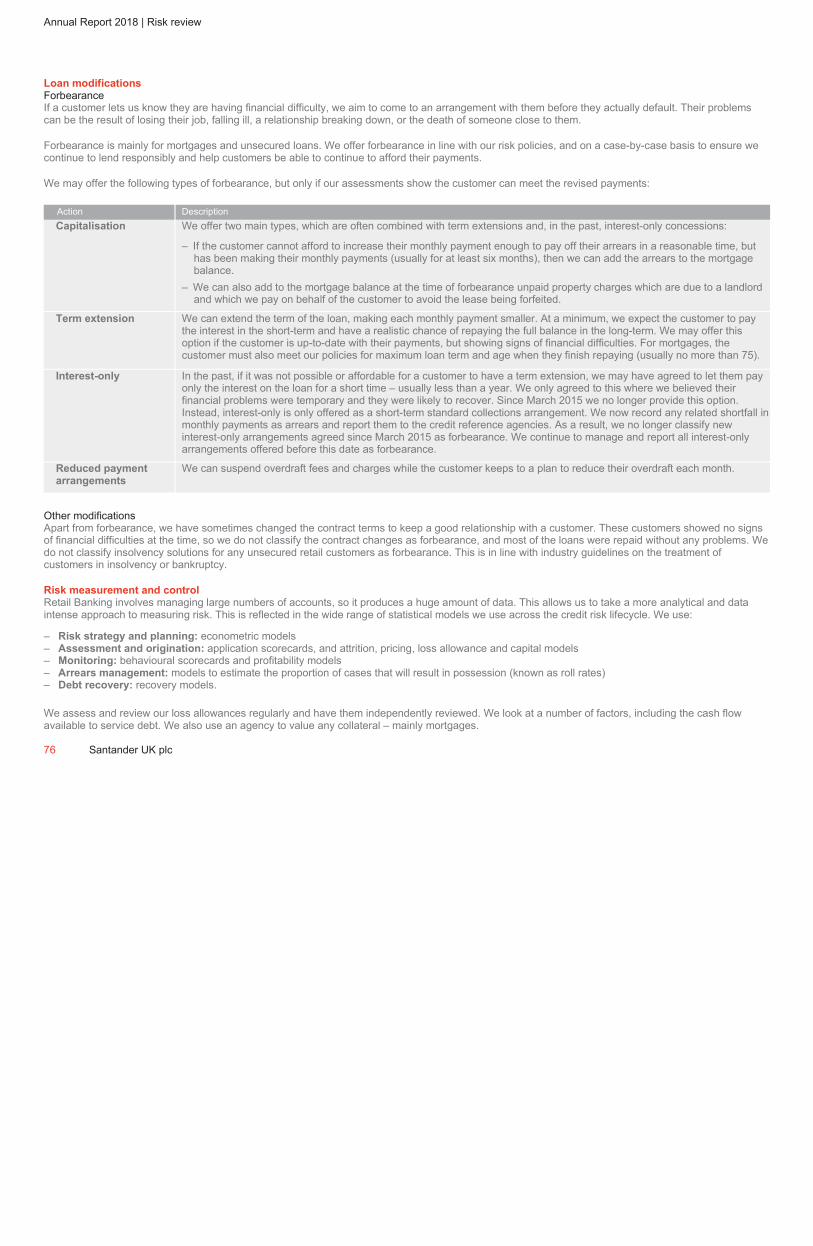
ˆ200G2Mlv!2LDXsB6;Š200G2Mlv!2LDXsB6;
628340 TX 76SANTANDERFORM 20-F (SAN UK PL
02-Mar-2019 12:49 ESTHTMLON
Donnelley Financial EGV krisr1dc 4*ESS 0C
VDI-W7-PFL-027512.9.12.0
Page 1 of 1
Annual Report 2018 | Risk review
Loan modifications
Forbearance If a customer lets us know they are having financial difficulty, we aim to come to an arrangement with them before they actually default. Their problems can be the result of losing their job, falling ill, a relationship breaking down, or the death of someone close to them.
Forbearance is mainly for mortgages and unsecured loans. We offer forbearance in line with our risk policies, and on a case-by-case basis to ensure we continue to lend responsibly and help customers be able to continue to afford their payments.
We may offer the following types of forbearance, but only if our assessments show the customer can meet the revised payments:
Action DescriptionCapitalisation We offer two main types, which are often combined with term extensions and, in the past, interest-only concessions:
– If the customer cannot afford to increase their monthly payment enough to pay off their arrears in a reasonable time, but has been making their monthly payments (usually for at least six months), then we can add the arrears to the mortgage balance.
– We can also add to the mortgage balance at the time of forbearance unpaid property charges which are due to a landlord and which we pay on behalf of the customer to avoid the lease being forfeited.
Term extension We can extend the term of the loan, making each monthly payment smaller. At a minimum, we expect the customer to pay the interest in the short-term and have a realistic chance of repaying the full balance in the long-term. We may offer this option if the customer is up-to-date with their payments, but showing signs of financial difficulties. For mortgages, the customer must also meet our policies for maximum loan term and age when they finish repaying (usually no more than 75).
Interest-only In the past, if it was not possible or affordable for a customer to have a term extension, we may have agreed to let them pay only the interest on the loan for a short time – usually less than a year. We only agreed to this where we believed their financial problems were temporary and they were likely to recover. Since March 2015 we no longer provide this option. Instead, interest-only is only offered as a short-term standard collections arrangement. We now record any related shortfall in monthly payments as arrears and report them to the credit reference agencies. As a result, we no longer classify new interest-only arrangements agreed since March 2015 as forbearance. We continue to manage and report all interest-only arrangements offered before this date as forbearance.
Reduced payment
arrangements
We can suspend overdraft fees and charges while the customer keeps to a plan to reduce their overdraft each month.
Other modifications Apart from forbearance, we have sometimes changed the contract terms to keep a good relationship with a customer. These customers showed no signs of financial difficulties at the time, so we do not classify the contract changes as forbearance, and most of the loans were repaid without any problems. We do not classify insolvency solutions for any unsecured retail customers as forbearance. This is in line with industry guidelines on the treatment of customers in insolvency or bankruptcy.
Risk measurement and control
Retail Banking involves managing large numbers of accounts, so it produces a huge amount of data. This allows us to take a more analytical and data intense approach to measuring risk. This is reflected in the wide range of statistical models we use across the credit risk lifecycle. We use:
– Risk strategy and planning: econometric models – Assessment and origination: application scorecards, and attrition, pricing, loss allowance and capital models – Monitoring: behavioural scorecards and profitability models – Arrears management: models to estimate the proportion of cases that will result in possession (known as roll rates) – Debt recovery: recovery models.
We assess and review our loss allowances regularly and have them independently reviewed. We look at a number of factors, including the cash flow available to service debt. We also use an agency to value any collateral – mainly mortgages.
76 Santander UK plc
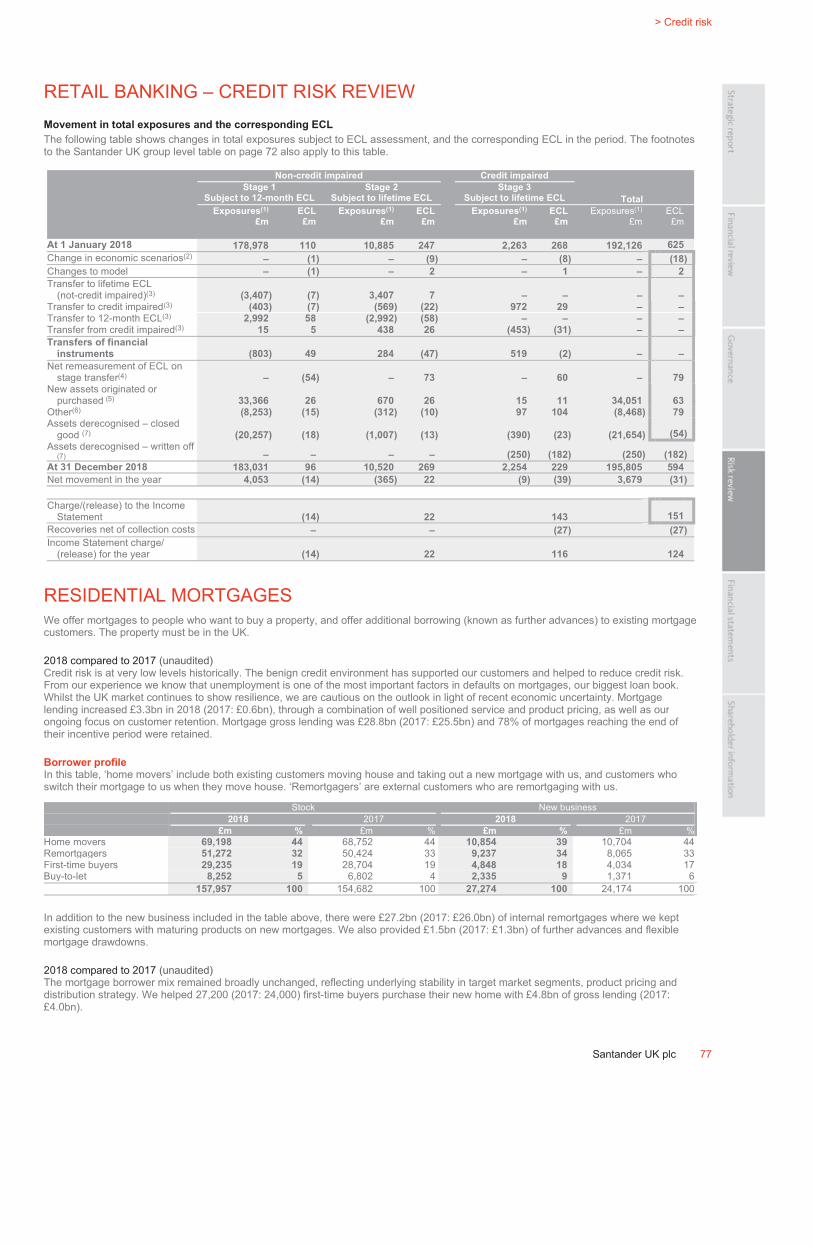
ˆ200G2Mlv!2NSdh76bŠ200G2Mlv!2NSdh76b
628340 TX 77SANTANDERFORM 20-F (SAN UK PL
02-Mar-2019 18:28 ESTHTMLON
Donnelley Financial EGV krisr1dc 10*ESS 0C
VDI-W7-PFL-027512.9.12.0
bar4
Page 1 of 1
> Credit risk
Santander UK plc 77
RETAIL BANKING – CREDIT RISK REVIEW
Movement in total exposures and the corresponding ECL
The following table shows changes in total exposures subject to ECL assessment, and the corresponding ECL in the period. The footnotes
to the Santander UK group level table on page 72 also apply to this table.
Non-credit impaired Credit impaired
Stage 1
Subject to 12-month ECL
Stage 2
Subject to lifetime ECL
Stage 3
Subject to lifetime ECL Total
Exposures(1)
£m
ECL
£m
Exposures(1)
£m
ECL
£m
Exposures(1)
£m
ECL
£m
Exposures(1)
£m
ECL
£m
At 1 January 2018 178,978 110 10,885 247 2,263 268 192,126 625
Change in economic scenarios(2)– (1) – (9) – (8) – (18)
Changes to model – (1) – 2 – 1 – 2
Transfer to lifetime ECL
(not-credit impaired)(3) (3,407) (7) 3,407 7 – – – –
Transfer to credit impaired(3) (403) (7) (569) (22) 972 29 – –
Transfer to 12-month ECL(3)
2,992 58 (2,992) (58) – – – –
Transfer from credit impaired(3)
15 5 438 26 (453) (31) – –
Transfers of financial
instruments (803) 49 284 (47) 519 (2) – –
Net remeasurement of ECL on
stage transfer(4) – (54) – 73 – 60 – 79
New assets originated or
purchased (5)
33,366 26 670 26 15 11 34,051 63
Other(6)
(8,253) (15) (312) (10) 97 104 (8,468) 79
Assets derecognised – closed
good (7) (20,257) (18) (1,007) (13) (390) (23) (21,654) (54)
Assets derecognised – written off
(7) – – – – (250) (182) (250) (182)
At 31 December 2018 183,031 96 10,520 269 2,254 229 195,805 594
Net movement in the year 4,053 (14) (365) 22 (9) (39) 3,679 (31)
Charge/(release) to the Income
Statement (14) 22 143 151
Recoveries net of collection costs – – (27) (27)
Income Statement charge/
(release) for the year (14) 22 116 124
RESIDENTIAL MORTGAGES
We offer mortgages to people who want to buy a property, and offer additional borrowing (known as further advances) to existing mortgage
customers. The property must be in the UK.
2018 compared to 2017 (unaudited)
Credit risk is at very low levels historically. The benign credit environment has supported our customers and helped to reduce credit risk.
From our experience we know that unemployment is one of the most important factors in defaults on mortgages, our biggest loan book.
Whilst the UK market continues to show resilience, we are cautious on the outlook in light of recent economic uncertainty. Mortgage
lending increased £3.3bn in 2018 (2017: £0.6bn), through a combination of well positioned service and product pricing, as well as our
ongoing focus on customer retention. Mortgage gross lending was £28.8bn (2017: £25.5bn) and 78% of mortgages reaching the end of
their incentive period were retained.
Borrower profile
In this table, ‘home movers’ include both existing customers moving house and taking out a new mortgage with us, and customers who
switch their mortgage to us when they move house. ‘Remortgagers’ are external customers who are remortgaging with us.
Stock New business
2018 2017 2018 2017
£m % £m % £m % £m %
Home movers 69,198 44 68,752 44 10,854 39 10,704 44
Remortgagers 51,272 32 50,424 33 9,237 34 8,065 33
First-time buyers 29,235 19 28,704 19 4,848 18 4,034 17
Buy-to-let 8,252 5 6,802 4 2,335 9 1,371 6
157,957 100 154,682 100 27,274 100 24,174 100
In addition to the new business included in the table above, there were £27.2bn (2017: £26.0bn) of internal remortgages where we kept
existing customers with maturing products on new mortgages. We also provided £1.5bn (2017: £1.3bn) of further advances and flexible
mortgage drawdowns.
2018 compared to 2017 (unaudited)
The mortgage borrower mix remained broadly unchanged, reflecting underlying stability in target market segments, product pricing and
distribution strategy. We helped 27,200 (2017: 24,000) first-time buyers purchase their new home with £4.8bn of gross lending (2017:
£4.0bn).

ˆ200G2Mlv!2abn@46sŠ200G2Mlv!2abn@46s
628340 TX 78SANTANDERFORM 20-F (SAN UK PL
04-Mar-2019 03:03 ESTHTMLON
Donnelley Financial EGV shanv1dc 10*ESS 0C
VDI-W7-PFL-160412.9.12.0
Page 1 of 1
Annual Report 2018 | Risk review
Interest rate profile
The interest rate profile of our mortgage asset stock was:
2018 2017
£m % £m %
Fixed rate 115,178 73 102,036 66
Variable rate 24,396 15 29,370 19
Standard Variable Rate (SVR) 18,383 12 23,276 15
157,957 100 154,682 100
2018 compared to 2017 (unaudited)
The SVR balances, which includes balances relating to our Follow-on-Rate product, declined by £4.9bn (2017: £5.5bn). We continue to see increased
customer refinancing into fixed rate products influenced by low mortgage rates and the competitive mortgage market.
Geographical distribution
The geographical distribution of our mortgage asset stock was:
Stock New business
2018 2017 2018 2017
UK region £bn £bn £bn £bn
London 39.0 37.6 7.1 5.8
Midlands and East Anglia 21.1 20.6 3.8 3.4
North 22.2 22.2 3.4 3.0
Northern Ireland 3.4 3.6 0.2 0.2
Scotland 6.7 6.8 1.0 1.0
South East excluding London 48.7 47.2 9.0 8.2
South West, Wales and other 16.9 16.7 2.8 2.6
158.0 154.7 27.3 24.2
Average loan size for new business £’000 £’000
South East including London 270 260
Rest of the UK 150 146
UK as a whole 203 196
2018 compared to 2017 (unaudited)
The geographical distribution of the portfolio continued to represent a broad footprint across the UK, whilst maintaining a concentration around London
and the South East, in line with the distribution of the population across the UK. The loan-to-income multiple of mortgage lending during the year,
representing average earnings of new business at inception, was 3.24 (2017: 3.16).
Larger loans
The mortgage asset stock of larger loans was:
South East including London UK
Individual mortgage loan size 2018 £m
2017
£m
2018
£m
2017
£m
<£0.25m 45,851 46,766 105,181 106,838
£0.25m to £0.50m 30,488 27,562 39,841 36,036
£0.50m to £1.0m 10,103 9,214 11,551 10,532
£1.0m to £2.0m 1,168 1,046 1,236 1,111
>£2.0m 146 163 148 165
87,756 84,751 157,957 154,682
At 31 December 2018, there were 57 (2017: 64) individual mortgages greater than £2.0m. In 2018, there were 9 (2017: 13) new mortgages over £2.0m.
Loan-to-value analysis
This table shows the LTV distribution for our mortgage stock, NPL stock and new business. We use our estimate of the property value at the balance
sheet date. We include fees that have been added to the loan in the LTV calculation. For flexible products, we only include the drawn amount, not
undrawn limits.
2018 2017
Of which: Of which:
Stock NPL stock New business Stock NPL stock New business
LTV % % % % % %
Up to 50% 45 43 20 49 44 19
>50-75% 41 35 41 39 34 43
>75-85% 9 8 22 7 8 19
>85-100% 4 7 17 4 7 19
>100% 1 7 – 1 7 –
100 100 100 100 100 100
Collateral value of residential properties(1) £157,787m £1,850m £27,274m £154,459m £1,823m £24,174m
% % % % % %
Simple average(2) LTV (indexed) 42 43 63 42 44 62
Valuation weighted average(3) LTV (indexed) 39 38 59 38 38 58
(1) Collateral value shown is limited to the balance of each associated loan. Excludes the impact of over-collateralisation (where the collateral is higher than the loan balance). Includes collateral against loans in negative
equity of £969m (2017: £1,248m).
(2) Total of all LTV% divided by the total of all accounts.
(3) Total of all loan values divided by the total of all valuations.
At 31 December 2018, the parts of loans in negative equity which were effectively uncollateralised before deducting loss allowances reduced to £170m
(2017: £223m).
78 Santander UK plc
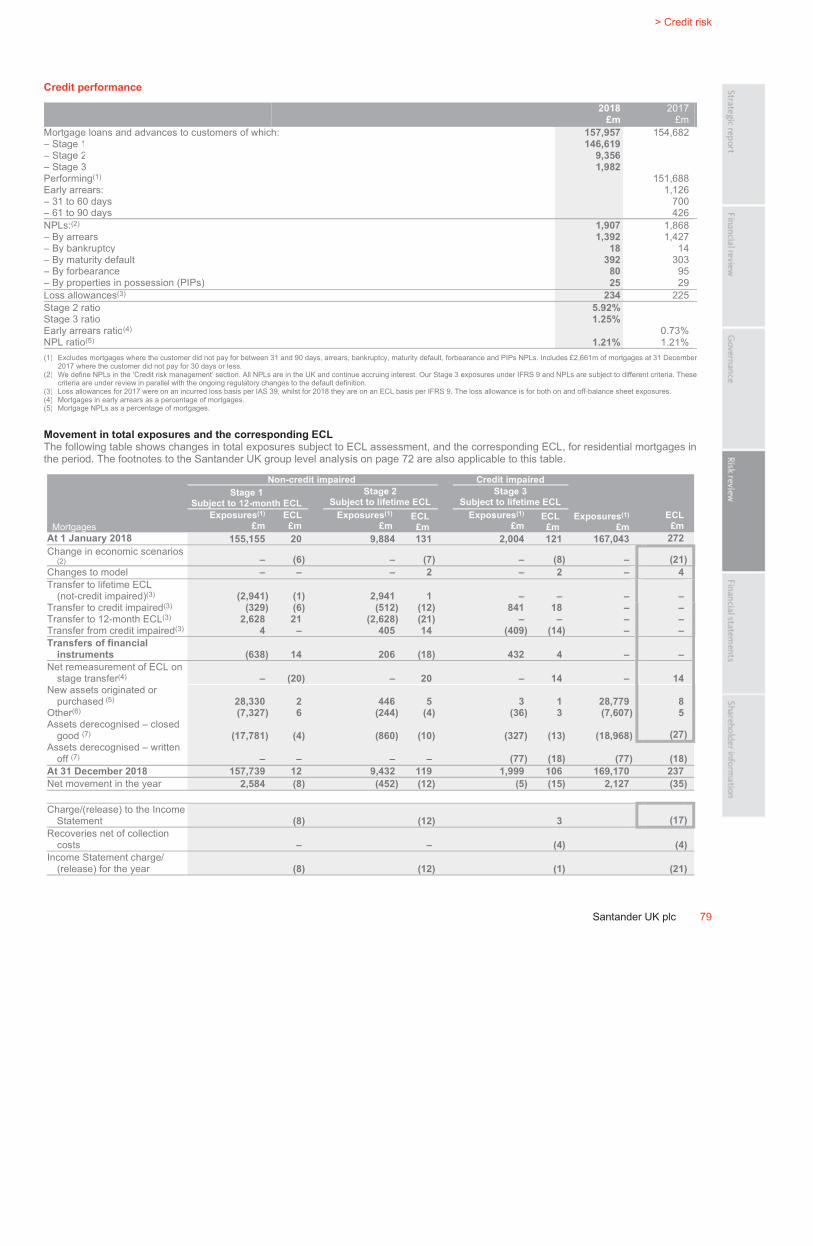
ˆ200G2Mlv!2NB&0Lg‹Š200G2Mlv!2NB&0Lg
628340 TX 79SANTANDERFORM 20-F (SAN UK PL
02-Mar-2019 17:59 ESTHTMLON
Donnelley Financial EGV kumak0dc 7*ESS 0C
VDI-W7-PFD-033312.9.12.0
bar4
Page 1 of 1
> Credit risk
Santander UK plc 79
Credit performance
2018
£m
2017
£m
Mortgage loans and advances to customers of which: 157,957 154,682
– Stage 1 146,619
– Stage 2 9,356
– Stage 3 1,982
Performing(1) 151,688
Early arrears: 1,126
– 31 to 60 days 700
– 61 to 90 days 426
NPLs:(2) 1,907 1,868
– By arrears 1,392 1,427
– By bankruptcy 18 14
– By maturity default 392 303
– By forbearance 80 95
– By properties in possession (PIPs) 25 29
Loss allowances(3) 234 225
Stage 2 ratio 5.92%
Stage 3 ratio 1.25%
Early arrears ratio(4) 0.73%
NPL ratio(5)1.21% 1.21%
(1) Excludes mortgages where the customer did not pay for between 31 and 90 days, arrears, bankruptcy, maturity default, forbearance and PIPs NPLs. Includes £2,661m of mortgages at 31 December
2017 where the customer did not pay for 30 days or less.
(2) We define NPLs in the ‘Credit risk management’ section. All NPLs are in the UK and continue accruing interest. Our Stage 3 exposures under IFRS 9 and NPLs are subject to different criteria. These
criteria are under review in parallel with the ongoing regulatory changes to the default definition.
(3) Loss allowances for 2017 were on an incurred loss basis per IAS 39, whilst for 2018 they are on an ECL basis per IFRS 9. The loss allowance is for both on and off-balance sheet exposures.
(4) Mortgages in early arrears as a percentage of mortgages.
(5) Mortgage NPLs as a percentage of mortgages.
Movement in total exposures and the corresponding ECL
The following table shows changes in total exposures subject to ECL assessment, and the corresponding ECL, for residential mortgages in
the period. The footnotes to the Santander UK group level analysis on page 72 are also applicable to this table.
Non-credit impaired Credit impaired
Stage 1
Subject to 12-month ECL
Stage 2
Subject to lifetime ECL
Stage 3
Subject to lifetime ECL
Mortgages
Exposures(1)
£m
ECL
£m
Exposures(1)
£m
ECL
£m
Exposures(1)
£m
ECL
£m
Exposures(1)
£m
ECL
£m
At 1 January 2018 155,155 20 9,884 131 2,004 121 167,043 272
Change in economic scenarios
(2) – (6) – (7) – (8) – (21)
Changes to model – – – 2 – 2 – 4
Transfer to lifetime ECL
(not-credit impaired)(3) (2,941) (1) 2,941 1 – – – –
Transfer to credit impaired(3) (329) (6) (512) (12) 841 18 – –
Transfer to 12-month ECL(3)
2,628 21 (2,628) (21) – – – –
Transfer from credit impaired(3)
4 – 405 14 (409) (14) – –
Transfers of financial
instruments (638) 14 206 (18) 432 4 – –
Net remeasurement of ECL on
stage transfer(4) – (20) – 20 – 14 – 14
New assets originated or
purchased (5)
28,330 2 446 5 3 1 28,779 8
Other(6) (7,327) 6 (244) (4) (36) 3 (7,607) 5
Assets derecognised – closed
good (7) (17,781) (4) (860) (10) (327) (13) (18,968) (27)
Assets derecognised – written
off (7) – – – – (77) (18) (77) (18)
At 31 December 2018 157,739 12 9,432 119 1,999 106 169,170 237
Net movement in the year 2,584 (8) (452) (12) (5) (15) 2,127 (35)
Charge/(release) to the Income
Statement (8) (12) 3 (17)
Recoveries net of collection
costs – – (4) (4)
Income Statement charge/
(release) for the year (8) (12) (1) (21)
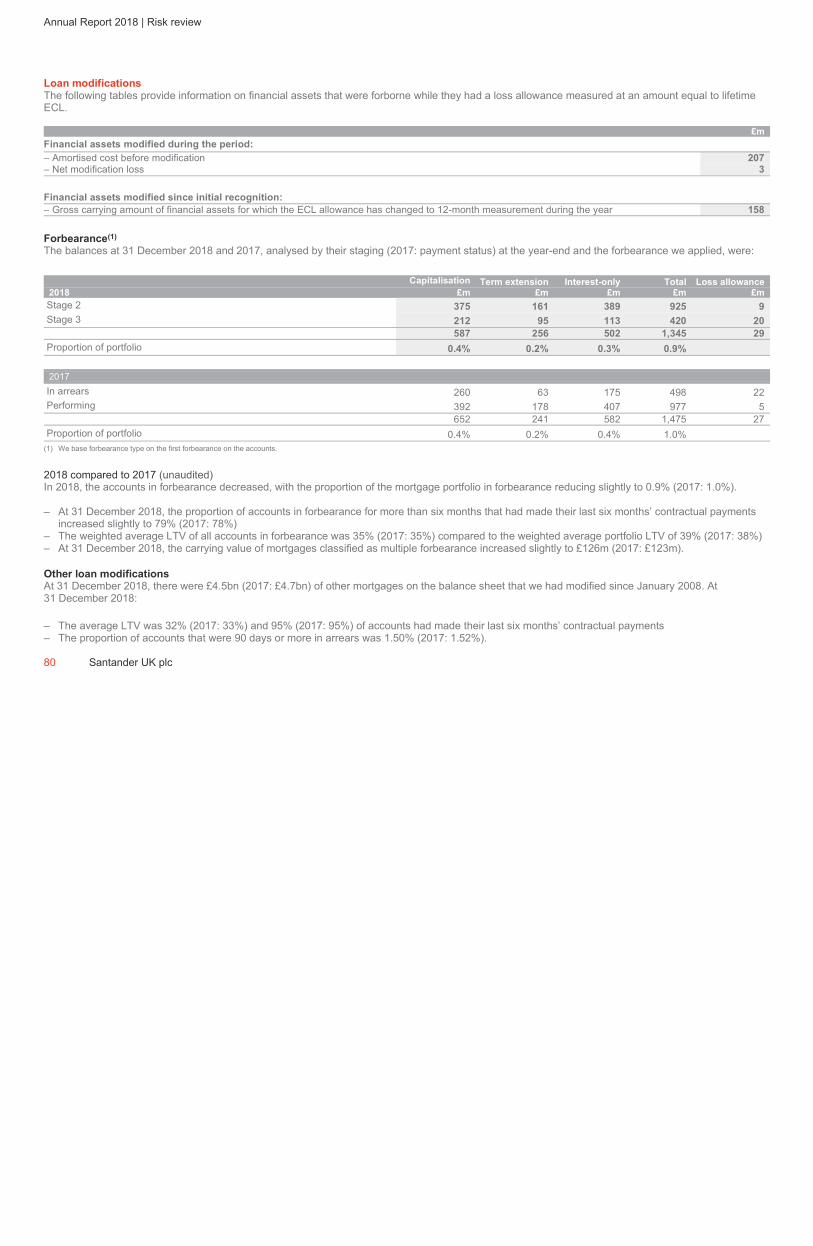
ˆ200G2Mlv!2Ck3b2g/Š200G2Mlv!2Ck3b2g/
628340 TX 80SANTANDERFORM 20-F (SAN UK PL
02-Mar-2019 04:18 ESTHTMLON
Donnelley Financial EGV marik1dc 3*ESS 0C
VDI-W7-PFL-146612.9.12.0
Page 1 of 1
Annual Report 2018 | Risk review
Loan modifications
The following tables provide information on financial assets that were forborne while they had a loss allowance measured at an amount equal to lifetime
ECL.
£m
Financial assets modified during the period:
– Amortised cost before modification 207
– Net modification loss 3
Financial assets modified since initial recognition:
– Gross carrying amount of financial assets for which the ECL allowance has changed to 12-month measurement during the year 158
Forbearance(1)
The balances at 31 December 2018 and 2017, analysed by their staging (2017: payment status) at the year-end and the forbearance we applied, were:
Capitalisation Term extension Interest-only Total Loss allowance
2018 £m £m £m £m £m
Stage 2 375 161 389 925 9
Stage 3 212 95 113 420 20
587 256 502 1,345 29
Proportion of portfolio 0.4% 0.2% 0.3% 0.9%
2017
In arrears 260 63 175 498 22
Performing 392 178 407 977 5
652 241 582 1,475 27
Proportion of portfolio 0.4% 0.2% 0.4% 1.0%
(1) We base forbearance type on the first forbearance on the accounts.
2018 compared to 2017 (unaudited)
In 2018, the accounts in forbearance decreased, with the proportion of the mortgage portfolio in forbearance reducing slightly to 0.9% (2017: 1.0%).
– At 31 December 2018, the proportion of accounts in forbearance for more than six months that had made their last six months’ contractual payments
increased slightly to 79% (2017: 78%)
– The weighted average LTV of all accounts in forbearance was 35% (2017: 35%) compared to the weighted average portfolio LTV of 39% (2017: 38%)
– At 31 December 2018, the carrying value of mortgages classified as multiple forbearance increased slightly to £126m (2017: £123m).
Other loan modifications
At 31 December 2018, there were £4.5bn (2017: £4.7bn) of other mortgages on the balance sheet that we had modified since January 2008. At
31 December 2018:
– The average LTV was 32% (2017: 33%) and 95% (2017: 95%) of accounts had made their last six months’ contractual payments
– The proportion of accounts that were 90 days or more in arrears was 1.50% (2017: 1.52%).
80 Santander UK plc
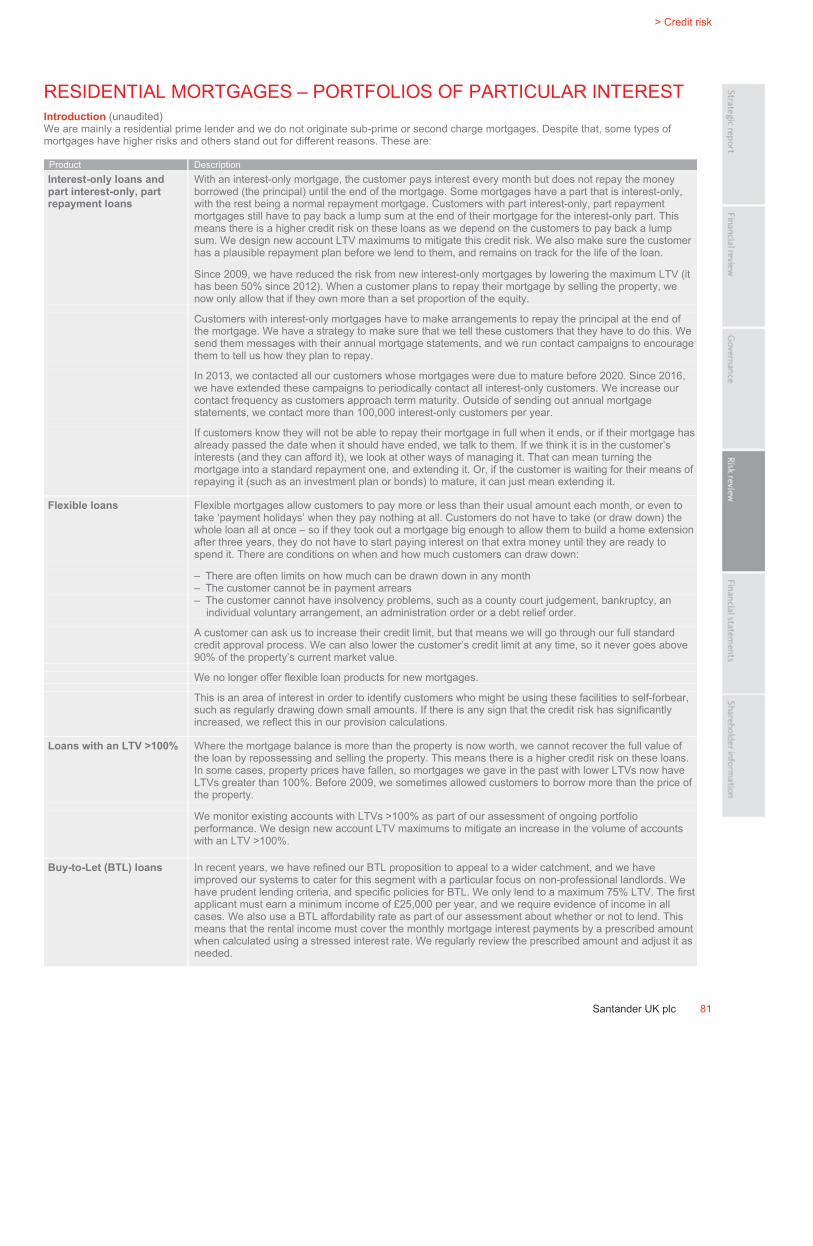
ˆ200G2Mlv!2Cn6v2g]Š200G2Mlv!2Cn6v2g]
628340 TX 81SANTANDERFORM 20-F (SAN UK PL
02-Mar-2019 04:20 ESTHTMLON
Donnelley Financial EGV marik1dc 3*ESS 0C
VDI-W7-PFL-146612.9.12.0
bar4
Page 1 of 1
> Credit risk
Santander UK plc 81
RESIDENTIAL MORTGAGES – PORTFOLIOS OF PARTICULAR INTEREST Introduction (unaudited)We are mainly a residential prime lender and we do not originate sub-prime or second charge mortgages. Despite that, some types of mortgages have higher risks and others stand out for different reasons. These are:
Product DescriptionInterest-only loans and
part interest-only, part
repayment loans
With an interest-only mortgage, the customer pays interest every month but does not repay the money borrowed (the principal) until the end of the mortgage. Some mortgages have a part that is interest-only, with the rest being a normal repayment mortgage. Customers with part interest-only, part repayment mortgages still have to pay back a lump sum at the end of their mortgage for the interest-only part. This means there is a higher credit risk on these loans as we depend on the customers to pay back a lump sum. We design new account LTV maximums to mitigate this credit risk. We also make sure the customer has a plausible repayment plan before we lend to them, and remains on track for the life of the loan.
Since 2009, we have reduced the risk from new interest-only mortgages by lowering the maximum LTV (it has been 50% since 2012). When a customer plans to repay their mortgage by selling the property, we now only allow that if they own more than a set proportion of the equity.
Customers with interest-only mortgages have to make arrangements to repay the principal at the end of the mortgage. We have a strategy to make sure that we tell these customers that they have to do this. We send them messages with their annual mortgage statements, and we run contact campaigns to encourage them to tell us how they plan to repay.
In 2013, we contacted all our customers whose mortgages were due to mature before 2020. Since 2016, we have extended these campaigns to periodically contact all interest-only customers. We increase our contact frequency as customers approach term maturity. Outside of sending out annual mortgage statements, we contact more than 100,000 interest-only customers per year.
If customers know they will not be able to repay their mortgage in full when it ends, or if their mortgage has already passed the date when it should have ended, we talk to them. If we think it is in the customer’s interests (and they can afford it), we look at other ways of managing it. That can mean turning the mortgage into a standard repayment one, and extending it. Or, if the customer is waiting for their means of repaying it (such as an investment plan or bonds) to mature, it can just mean extending it.
Flexible loans Flexible mortgages allow customers to pay more or less than their usual amount each month, or even to take ‘payment holidays’ when they pay nothing at all. Customers do not have to take (or draw down) the whole loan all at once – so if they took out a mortgage big enough to allow them to build a home extension after three years, they do not have to start paying interest on that extra money until they are ready to spend it. There are conditions on when and how much customers can draw down:
– There are often limits on how much can be drawn down in any month– The customer cannot be in payment arrears– The customer cannot have insolvency problems, such as a county court judgement, bankruptcy, an
individual voluntary arrangement, an administration order or a debt relief order.
A customer can ask us to increase their credit limit, but that means we will go through our full standard credit approval process. We can also lower the customer’s credit limit at any time, so it never goes above 90% of the property’s current market value.
We no longer offer flexible loan products for new mortgages.
This is an area of interest in order to identify customers who might be using these facilities to self-forbear, such as regularly drawing down small amounts. If there is any sign that the credit risk has significantly increased, we reflect this in our provision calculations.
Loans with an LTV >100% Where the mortgage balance is more than the property is now worth, we cannot recover the full value of the loan by repossessing and selling the property. This means there is a higher credit risk on these loans. In some cases, property prices have fallen, so mortgages we gave in the past with lower LTVs now have LTVs greater than 100%. Before 2009, we sometimes allowed customers to borrow more than the price of the property.
We monitor existing accounts with LTVs >100% as part of our assessment of ongoing portfolio performance. We design new account LTV maximums to mitigate an increase in the volume of accounts with an LTV >100%.
Buy-to-Let (BTL) loans In recent years, we have refined our BTL proposition to appeal to a wider catchment, and we have improved our systems to cater for this segment with a particular focus on non-professional landlords. We have prudent lending criteria, and specific policies for BTL. We only lend to a maximum 75% LTV. The first applicant must earn a minimum income of £25,000 per year, and we require evidence of income in all cases. We also use a BTL affordability rate as part of our assessment about whether or not to lend. This means that the rental income must cover the monthly mortgage interest payments by a prescribed amount when calculated using a stressed interest rate. We regularly review the prescribed amount and adjust it as needed.

ˆ200G2Mlv!2NC0!R6SŠ200G2Mlv!2NC0!R6S
628340 TX 82SANTANDERFORM 20-F (SAN UK PL
02-Mar-2019 17:59 ESTHTMLON
Donnelley Financial EGV kumak0dc 9*ESS 0C
VDI-W7-PFD-033312.9.12.0
Page 1 of 1
Annual Report 2018 | Risk review
Credit performance
Portfolio of particular interest(1)
2018
Total
£m
Interest-only
£m
Part interest-
only, part
repayment(2) (3)
£m
Flexible(3)
£m
LTV >100%
£m
Buy-to-let
£m
Other
portfolio
£m
Mortgage portfolio 157,957 38,035 13,201 12,926 1,140 8,252 101,158
– Stage 1 146,619 33,001 11,824 11,558 740 7,906 96,767
– Stage 2 9,356 4,029 1,115 1,082 273 317 3,802
– Stage 3 1,982 1,005 262 286 127 29 589
Stage 3 ratio 1.25% 2.64% 1.98% 2.21% 11.14% 0.35% 0.58%
PIPs 25 12 5 3 8 – 7
2017Mortgage portfolio 154,682 38,885 13,785 14,785 1,471 6,802 95,535 Performing 151,688 37,497 13,372 14,438 1,302 6,768 94,530 Early arrears:– 31 to 60 days 700 317 93 67 22 9 295 – 61 to 90 days 426 203 57 35 15 4 167 NPLs 1,868 868 263 245 132 21 543 NPL ratio 1.21% 2.23% 1.91% 1.66% 8.97% 0.31% 0.57% PIPs 29 17 5 3 10 1 6 (1) Where a loan falls into more than one category, we have included it in all the categories that apply. As a result, the sum of the mortgages in the segments of particular interest and the other portfolio does not agree to the
total mortgage portfolio.(2) Mortgage balance includes both the interest-only part of £9,756m (2017: £10,116m) and the non-interest-only part of the loan.(3) Includes legacy Alliance & Leicester flexible loans that work in a more limited way than our current Flexi loan product.
2018 compared to 2017 (unaudited)– In 2018, the value and proportion of interest-only loans together with part interest-only, part repayment and flexible loans reduced, reflecting our
strategy to manage down the overall exposure to these lending profiles.– Buy-to-Let (BTL) mortgage balances increased £1.5bn to £8.3bn (2017: £6.8bn). We continue to focus our BTL book on non-professional landlords, as
this segment is closely aligned with mortgages and accounts for the majority of the volume in the BTL market. In 2018, we completed 11,400 BTL mortgages (2017: 7,500), representing 9% of the value of our new business flow (2017: 6%), at an average LTV of 62% (2017: 61%).
Interest-only sub analysis (unaudited)Full interest-only new business in the year
2018 2017 £m £m
Full interest-only loans 3,810 2,698
Full interest-only maturity profile
Term
expired
Within
2 years
Between
2-5 years
Between
5-15 years
Greater than
15 years Total
2018 £m £m £m £m £m £m
Full interest-only portfolio 541 1,346 3,761 21,711 10,676 38,035
of which value weighted average LTV (indexed) is >75% 43 110 265 2,029 642 3,089
2017Full interest-only portfolio 508 1,586 3,508 21,795 11,488 38,885 of which value weighted average LTV (indexed) is >75% 47 147 255 2,318 948 3,715
2018 compared to 2017 (unaudited)For full interest-only mortgages, of the total £541m that was term expired at 31 December 2018, 89% continued to pay the interest due under the expired contract terms. Interest-only mortgages that matured in 2018 totalled £830m, of which: £418m was subsequently repaid, £5m was refinanced under normal credit terms, £73m was refinanced under forbearance arrangements and £334m remained unpaid and was classified as term expired at 31 December 2018.
At 31 December 2018, there were 84,773 (2017: 93,779) flexible mortgage customers, with undrawn facilities of £6,000m (2017: £6,192m). The portfolio’s value weighted LTV (indexed) was 28% (2017: 28%).
Forbearance(1)
The balances at 31 December 2018 and 2017 were:
Interest-only(2) Flexible LTV >100% Buy-to-Let£m £m £m £m
2018 229 32 10 9
– Stage 2 136 18 3 6
– Stage 3 93 14 7 3
2017 208 34 13 8(1) Where a loan falls into more than one category, we have included it in all the categories that apply. (2) Comprises full interest-only loans and part interest-only, part repayment loans.
82 Santander UK plc
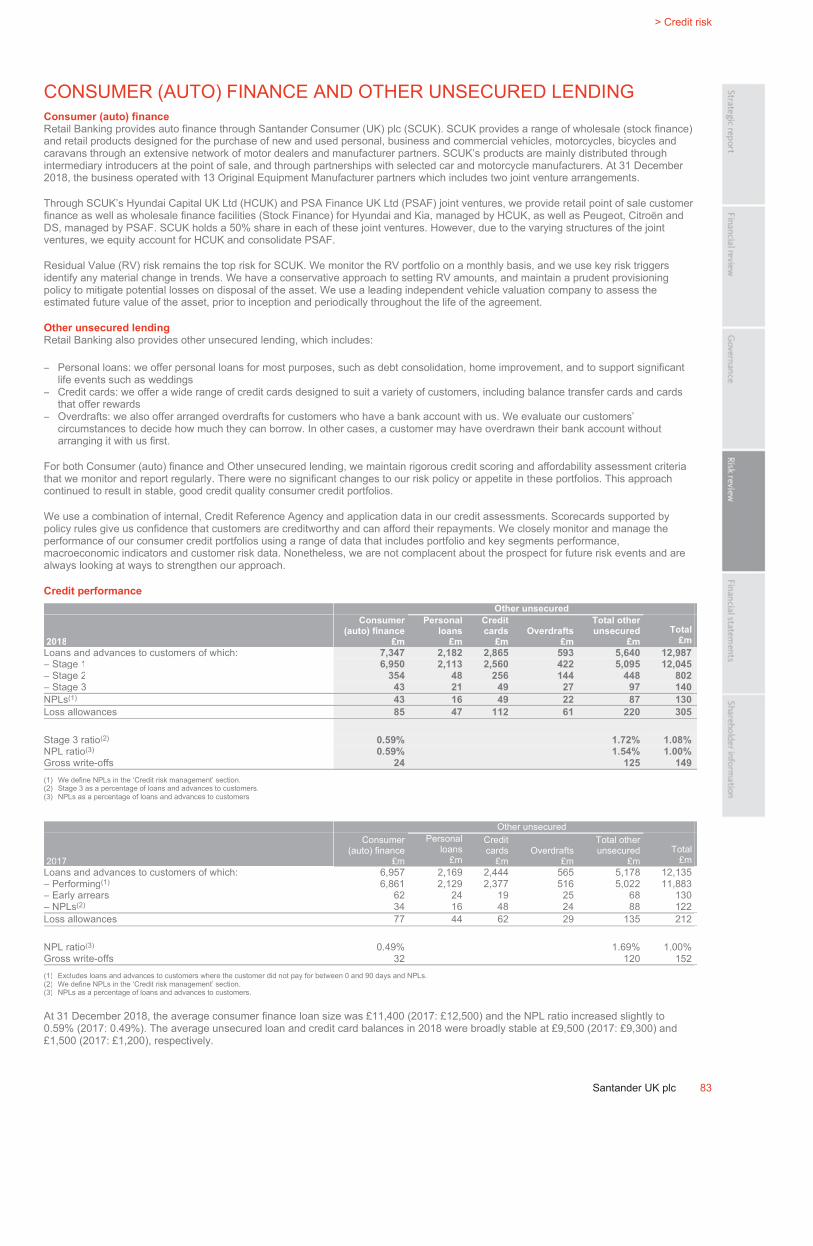
ˆ200G2Mlv!2LXYVP6tŠ200G2Mlv!2LXYVP6t
628340 TX 83SANTANDERFORM 20-F (SAN UK PL
02-Mar-2019 13:35 ESTHTMLON
Donnelley Financial EGV krisr1dc 5*ESS 0C
VDI-W7-PFL-027512.9.12.0
bar4
Page 1 of 1
> Credit risk
Santander UK plc 83
CONSUMER (AUTO) FINANCE AND OTHER UNSECURED LENDING Consumer (auto) finance
Retail Banking provides auto finance through Santander Consumer (UK) plc (SCUK). SCUK provides a range of wholesale (stock finance) and retail products designed for the purchase of new and used personal, business and commercial vehicles, motorcycles, bicycles and caravans through an extensive network of motor dealers and manufacturer partners. SCUK’s products are mainly distributed through intermediary introducers at the point of sale, and through partnerships with selected car and motorcycle manufacturers. At 31 December 2018, the business operated with 13 Original Equipment Manufacturer partners which includes two joint venture arrangements.
Through SCUK’s Hyundai Capital UK Ltd (HCUK) and PSA Finance UK Ltd (PSAF) joint ventures, we provide retail point of sale customer finance as well as wholesale finance facilities (Stock Finance) for Hyundai and Kia, managed by HCUK, as well as Peugeot, Citroën and DS, managed by PSAF. SCUK holds a 50% share in each of these joint ventures. However, due to the varying structures of the joint ventures, we equity account for HCUK and consolidate PSAF.
Residual Value (RV) risk remains the top risk for SCUK. We monitor the RV portfolio on a monthly basis, and we use key risk triggers identify any material change in trends. We have a conservative approach to setting RV amounts, and maintain a prudent provisioning policy to mitigate potential losses on disposal of the asset. We use a leading independent vehicle valuation company to assess the estimated future value of the asset, prior to inception and periodically throughout the life of the agreement.
Other unsecured lending
Retail Banking also provides other unsecured lending, which includes:
– Personal loans: we offer personal loans for most purposes, such as debt consolidation, home improvement, and to support significant life events such as weddings
– Credit cards: we offer a wide range of credit cards designed to suit a variety of customers, including balance transfer cards and cards that offer rewards
– Overdrafts: we also offer arranged overdrafts for customers who have a bank account with us. We evaluate our customers’ circumstances to decide how much they can borrow. In other cases, a customer may have overdrawn their bank account without arranging it with us first.
For both Consumer (auto) finance and Other unsecured lending, we maintain rigorous credit scoring and affordability assessment criteria that we monitor and report regularly. There were no significant changes to our risk policy or appetite in these portfolios. This approach continued to result in stable, good credit quality consumer credit portfolios.
We use a combination of internal, Credit Reference Agency and application data in our credit assessments. Scorecards supported by policy rules give us confidence that customers are creditworthy and can afford their repayments. We closely monitor and manage the performance of our consumer credit portfolios using a range of data that includes portfolio and key segments performance, macroeconomic indicators and customer risk data. Nonetheless, we are not complacent about the prospect for future risk events and are always looking at ways to strengthen our approach.
Credit performance
Other unsecured
2018
Consumer
(auto) finance
£m
Personal
loans
£m
Credit
cards
£m
Overdrafts
£m
Total other
unsecured
£m
Total
£m
Loans and advances to customers of which: 7,347 2,182 2,865 593 5,640 12,987
– Stage 1 6,950 2,113 2,560 422 5,095 12,045
– Stage 2 354 48 256 144 448 802
– Stage 3 43 21 49 27 97 140
NPLs(1) 43 16 49 22 87 130
Loss allowances 85 47 112 61 220 305
Stage 3 ratio(2) 0.59% 1.72% 1.08%
NPL ratio(3) 0.59% 1.54% 1.00%
Gross write-offs 24 125 149
(1) We define NPLs in the ‘Credit risk management’ section.(2) Stage 3 as a percentage of loans and advances to customers.(3) NPLs as a percentage of loans and advances to customers.
Other unsecured
2017
Consumer(auto) finance
£m
Personalloans
£m
Creditcards
£mOverdrafts
£m
Total otherunsecured
£mTotal
£m Loans and advances to customers of which: 6,957 2,169 2,444 565 5,178 12,135 – Performing(1) 6,861 2,129 2,377 516 5,022 11,883 – Early arrears 62 24 19 25 68 130 – NPLs(2) 34 16 48 24 88 122 Loss allowances 77 44 62 29 135 212
NPL ratio(3) 0.49% 1.69% 1.00% Gross write-offs 32 120 152 (1) Excludes loans and advances to customers where the customer did not pay for between 0 and 90 days and NPLs. (2) We define NPLs in the ‘Credit risk management’ section. (3) NPLs as a percentage of loans and advances to customers.
At 31 December 2018, the average consumer finance loan size was £11,400 (2017: £12,500) and the NPL ratio increased slightly to 0.59% (2017: 0.49%). The average unsecured loan and credit card balances in 2018 were broadly stable at £9,500 (2017: £9,300) and £1,500 (2017: £1,200), respectively.
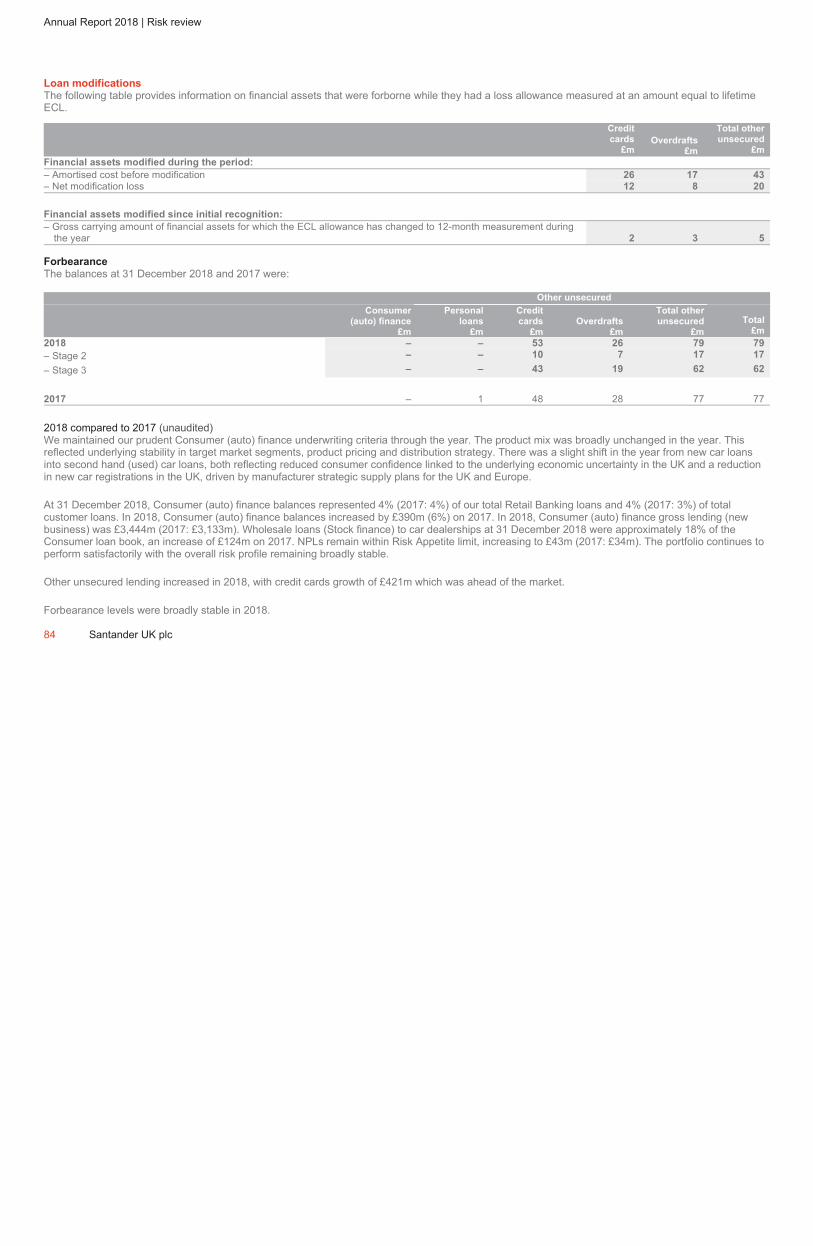
ˆ200G2Mlv!2LXwfk6iŠ200G2Mlv!2LXwfk6i
628340 TX 84SANTANDERFORM 20-F (SAN UK PL
02-Mar-2019 13:38 ESTHTMLON
Donnelley Financial EGV krisr1dc 7*ESS 0C
VDI-W7-PFL-027512.9.12.0
Page 1 of 1
Annual Report 2018 | Risk review
Loan modifications
The following table provides information on financial assets that were forborne while they had a loss allowance measured at an amount equal to lifetime
ECL.
Credit
cards
£m
Overdrafts
£m
Total other
unsecured
£m
Financial assets modified during the period:
– Amortised cost before modification 26 17 43
– Net modification loss 12 8 20
Financial assets modified since initial recognition:
– Gross carrying amount of financial assets for which the ECL allowance has changed to 12-month measurement during
the year 2 3 5
Forbearance
The balances at 31 December 2018 and 2017 were:
Other unsecured
Consumer
(auto) finance
£m
Personal
loans
£m
Credit
cards
£m
Overdrafts
£m
Total other
unsecured
£m
Total
£m
2018 – – 53 26 79 79
– Stage 2 – – 10 7 17 17
– Stage 3 – – 43 19 62 62
2017 – 1 48 28 77 77
2018 compared to 2017 (unaudited)
We maintained our prudent Consumer (auto) finance underwriting criteria through the year. The product mix was broadly unchanged in the year. This
reflected underlying stability in target market segments, product pricing and distribution strategy. There was a slight shift in the year from new car loans
into second hand (used) car loans, both reflecting reduced consumer confidence linked to the underlying economic uncertainty in the UK and a reduction
in new car registrations in the UK, driven by manufacturer strategic supply plans for the UK and Europe.
At 31 December 2018, Consumer (auto) finance balances represented 4% (2017: 4%) of our total Retail Banking loans and 4% (2017: 3%) of total
customer loans. In 2018, Consumer (auto) finance balances increased by £390m (6%) on 2017. In 2018, Consumer (auto) finance gross lending (new
business) was £3,444m (2017: £3,133m). Wholesale loans (Stock finance) to car dealerships at 31 December 2018 were approximately 18% of the
Consumer loan book, an increase of £124m on 2017. NPLs remain within Risk Appetite limit, increasing to £43m (2017: £34m). The portfolio continues to
perform satisfactorily with the overall risk profile remaining broadly stable.
Other unsecured lending increased in 2018, with credit cards growth of £421m which was ahead of the market.
Forbearance levels were broadly stable in 2018.
84 Santander UK plc
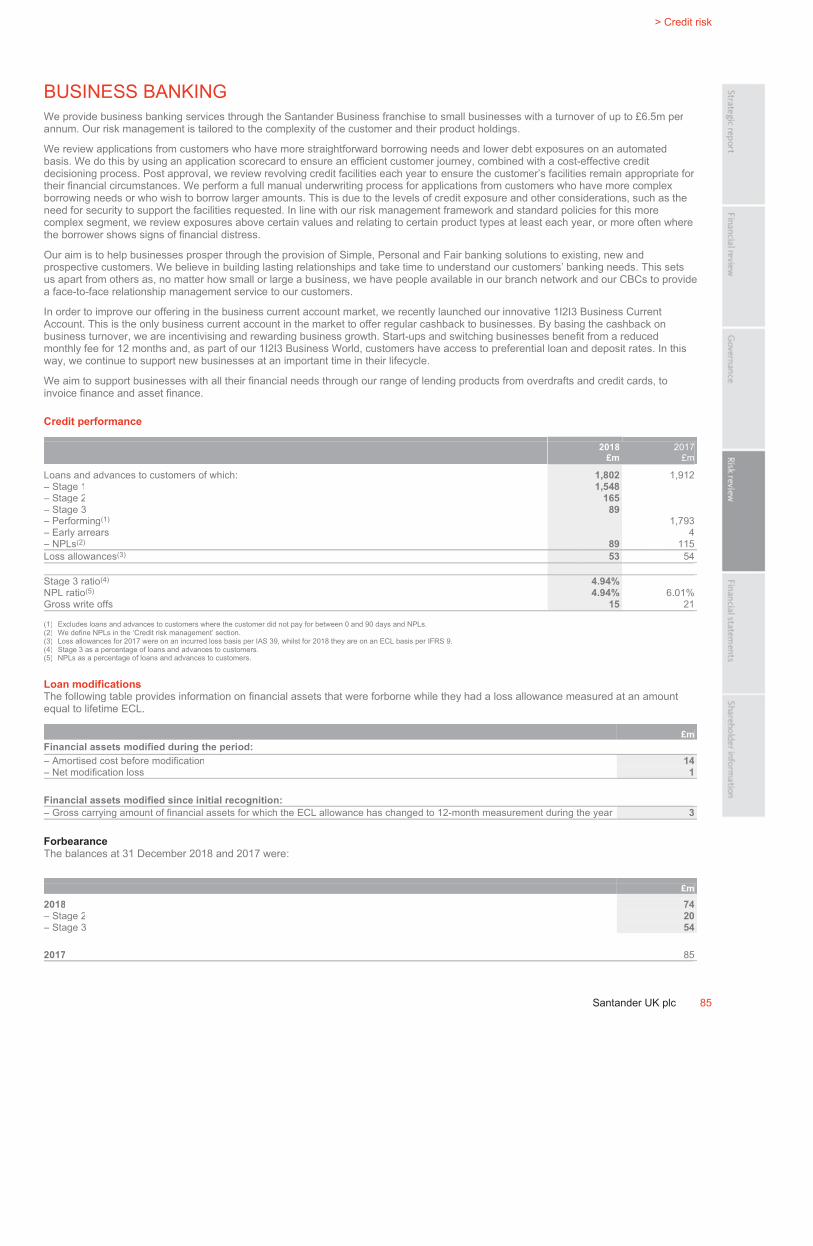
ˆ200G2Mlv!2LZ0%TgJŠ200G2Mlv!2LZ0%TgJ
628340 TX 85SANTANDERFORM 20-F (SAN UK PL
02-Mar-2019 13:43 ESTHTMLON
Donnelley Financial EGV krisr1dc 6*ESS 0C
VDI-W7-PFL-027512.9.12.0
bar4
Page 1 of 1
> Credit risk
Santander UK plc 85
BUSINESS BANKING
We provide business banking services through the Santander Business franchise to small businesses with a turnover of up to £6.5m per
annum. Our risk management is tailored to the complexity of the customer and their product holdings.
We review applications from customers who have more straightforward borrowing needs and lower debt exposures on an automated
basis. We do this by using an application scorecard to ensure an efficient customer journey, combined with a cost-effective credit
decisioning process. Post approval, we review revolving credit facilities each year to ensure the customer’s facilities remain appropriate for
their financial circumstances. We perform a full manual underwriting process for applications from customers who have more complex
borrowing needs or who wish to borrow larger amounts. This is due to the levels of credit exposure and other considerations, such as the
need for security to support the facilities requested. In line with our risk management framework and standard policies for this more
complex segment, we review exposures above certain values and relating to certain product types at least each year, or more often where
the borrower shows signs of financial distress.
Our aim is to help businesses prosper through the provision of Simple, Personal and Fair banking solutions to existing, new and
prospective customers. We believe in building lasting relationships and take time to understand our customers’ banking needs. This sets
us apart from others as, no matter how small or large a business, we have people available in our branch network and our CBCs to provide
a face-to-face relationship management service to our customers.
In order to improve our offering in the business current account market, we recently launched our innovative 1I2I3 Business Current
Account. This is the only business current account in the market to offer regular cashback to businesses. By basing the cashback on
business turnover, we are incentivising and rewarding business growth. Start-ups and switching businesses benefit from a reduced
monthly fee for 12 months and, as part of our 1I2I3 Business World, customers have access to preferential loan and deposit rates. In this
way, we continue to support new businesses at an important time in their lifecycle.
We aim to support businesses with all their financial needs through our range of lending products from overdrafts and credit cards, to
invoice finance and asset finance.
Credit performance
2018
£m
2017
£m
Loans and advances to customers of which: 1,802 1,912
– Stage 1 1,548
– Stage 2 165
– Stage 3 89
– Performing(1) 1,793
– Early arrears 4
– NPLs(2) 89 115
Loss allowances(3) 53 54
Stage 3 ratio(4) 4.94%
NPL ratio(5) 4.94% 6.01%
Gross write offs 15 21
(1) Excludes loans and advances to customers where the customer did not pay for between 0 and 90 days and NPLs.
(2) We define NPLs in the ‘Credit risk management’ section.
(3) Loss allowances for 2017 were on an incurred loss basis per IAS 39, whilst for 2018 they are on an ECL basis per IFRS 9.
(4) Stage 3 as a percentage of loans and advances to customers.
(5) NPLs as a percentage of loans and advances to customers.
Loan modifications
The following table provides information on financial assets that were forborne while they had a loss allowance measured at an amount
equal to lifetime ECL.
£m
Financial assets modified during the period:
– Amortised cost before modification 14
– Net modification loss 1
Financial assets modified since initial recognition:
– Gross carrying amount of financial assets for which the ECL allowance has changed to 12-month measurement during the year 3
Forbearance
The balances at 31 December 2018 and 2017 were:
£m
2018 74
– Stage 2 20
– Stage 3 54
2017 85
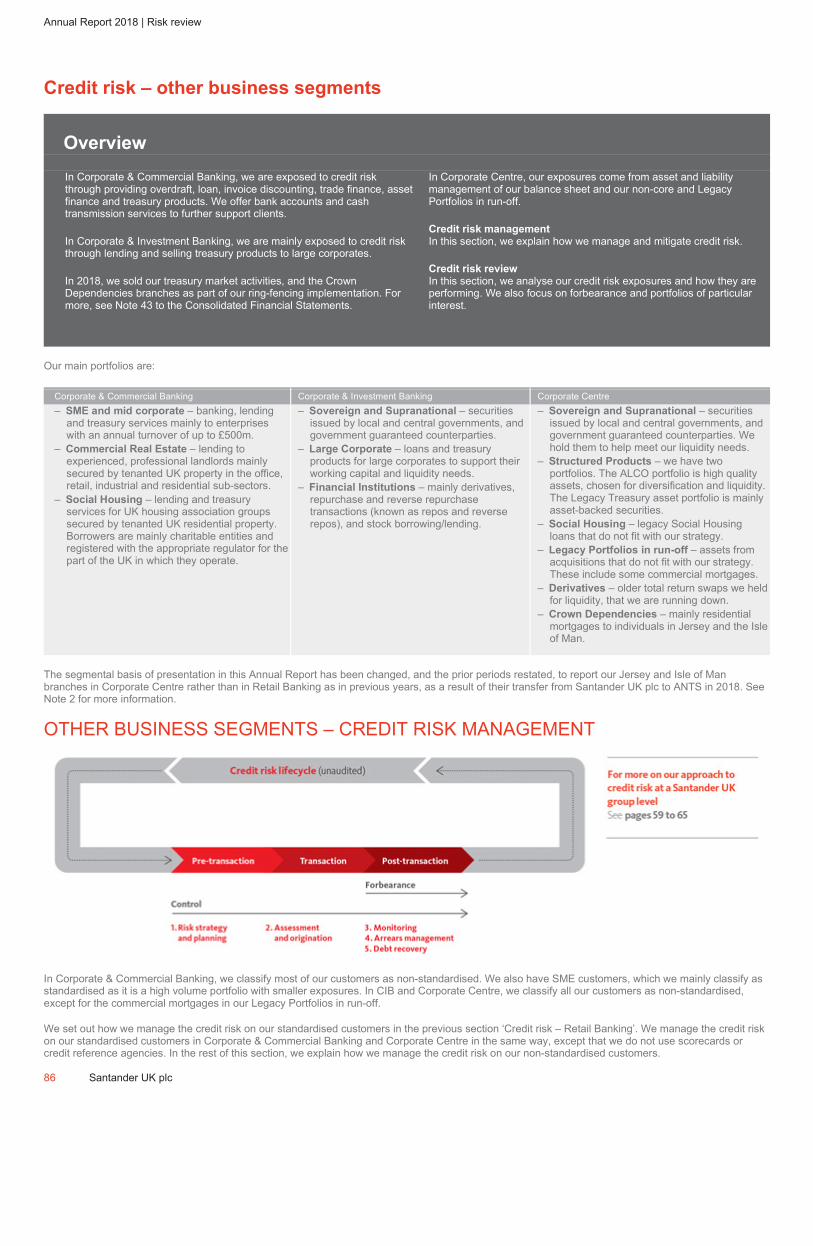
ˆ200G2Mlv!2Z%kKqgZŠ200G2Mlv!2Z%kKqgZ
628340 TX 86SANTANDERFORM 20-F (SAN UK PL
04-Mar-2019 01:36 ESTHTMLON
Donnelley Financial EGV gopad0dc 8*ESS 0C
VDI-W7-PFD-037812.9.12.0
f86n
Page 1 of 1
Annual Report 2018 | Risk review
Credit risk – other business segments
Overview
In Corporate & Commercial Banking, we are exposed to credit risk through providing overdraft, loan, invoice discounting, trade finance, asset finance and treasury products. We offer bank accounts and cash transmission services to further support clients.
In Corporate & Investment Banking, we are mainly exposed to credit risk through lending and selling treasury products to large corporates.
In 2018, we sold our treasury market activities, and the Crown Dependencies branches as part of our ring-fencing implementation. For more, see Note 43 to the Consolidated Financial Statements.
In Corporate Centre, our exposures come from asset and liability management of our balance sheet and our non-core and Legacy Portfolios in run-off.
Credit risk management
In this section, we explain how we manage and mitigate credit risk.
Credit risk review
In this section, we analyse our credit risk exposures and how they are performing. We also focus on forbearance and portfolios of particular interest.
Our main portfolios are:
Corporate & Commercial Banking Corporate & Investment Banking Corporate Centre– SME and mid corporate – banking, lending
and treasury services mainly to enterprises with an annual turnover of up to £500m.
– Commercial Real Estate – lending to experienced, professional landlords mainly secured by tenanted UK property in the office, retail, industrial and residential sub-sectors.
– Social Housing – lending and treasury services for UK housing association groups secured by tenanted UK residential property. Borrowers are mainly charitable entities and registered with the appropriate regulator for the part of the UK in which they operate.
– Sovereign and Supranational – securities issued by local and central governments, and government guaranteed counterparties.
– Large Corporate – loans and treasury products for large corporates to support their working capital and liquidity needs.
– Financial Institutions – mainly derivatives, repurchase and reverse repurchase transactions (known as repos and reverse repos), and stock borrowing/lending.
– Sovereign and Supranational – securities issued by local and central governments, and government guaranteed counterparties. We hold them to help meet our liquidity needs.
– Structured Products – we have two portfolios. The ALCO portfolio is high quality assets, chosen for diversification and liquidity. The Legacy Treasury asset portfolio is mainly asset-backed securities.
– Social Housing – legacy Social Housing loans that do not fit with our strategy.
– Legacy Portfolios in run-off – assets from acquisitions that do not fit with our strategy. These include some commercial mortgages.
– Derivatives – older total return swaps we held for liquidity, that we are running down.
– Crown Dependencies – mainly residential mortgages to individuals in Jersey and the Isle of Man.
The segmental basis of presentation in this Annual Report has been changed, and the prior periods restated, to report our Jersey and Isle of Man branches in Corporate Centre rather than in Retail Banking as in previous years, as a result of their transfer from Santander UK plc to ANTS in 2018. See Note 2 for more information.
OTHER BUSINESS SEGMENTS – CREDIT RISK MANAGEMENT
In Corporate & Commercial Banking, we classify most of our customers as non-standardised. We also have SME customers, which we mainly classify as standardised as it is a high volume portfolio with smaller exposures. In CIB and Corporate Centre, we classify all our customers as non-standardised, except for the commercial mortgages in our Legacy Portfolios in run-off.
We set out how we manage the credit risk on our standardised customers in the previous section ‘Credit risk – Retail Banking’. We manage the credit risk on our standardised customers in Corporate & Commercial Banking and Corporate Centre in the same way, except that we do not use scorecards or credit reference agencies. In the rest of this section, we explain how we manage the credit risk on our non-standardised customers.
86 Santander UK plc

ˆ200G2Mlv!2Lc5zhgYŠ200G2Mlv!2Lc5zhgY
628340 TX 87SANTANDERFORM 20-F (SAN UK PL
02-Mar-2019 13:50 ESTHTMLON
Donnelley Financial EGV krisr1dc 5*ESS 0C
VDI-W7-PFL-027512.9.12.0
bar4
Page 1 of 1
> Credit risk
Santander UK plc 87
1. Risk strategy and planning
For details of how we set risk strategy and plans, see the ‘Santander UK group level – credit risk management’ section. For treasury
products, we take credit risk up to limits for each client. We control, manage and report risks on a counterparty basis, regardless of which
part of our business takes the risk.
2. Assessment and origination
We do a thorough risk assessment to make sure customers can meet their obligations before we approve a credit application. We do this
mainly by assigning each customer a credit rating, using our internal rating scale (see ‘Credit quality’ in ‘Santander UK group level – credit
risk review’ section). To do this, we look at the customer’s financial history and trends in the economy – backed up by the expert
judgement of a risk analyst. We review our internal ratings at least every year. We also assess the underlying risk of the transaction, taking
into account any mitigating factors (see the following tables) – and how it fits with our risk policies, limits and Risk Appetite, as set by the
Board. We consider transactions in line with credit limits approved by the relevant credit authority. Our Executive Credit Approval
Committee is responsible for setting those limits. In CIB and Corporate Centre, a specialist analyst usually reviews a transaction at the
start and over its life. They base their review on the financial strength of the client, its position in its industry, and its management
strengths.
Credit risk mitigation
The types of credit risk mitigation, including collateral, across each of our portfolios are as follows.
Corporate & Commercial Banking:
Portfolio Description
SME and mid
corporate
Includes secured and unsecured lending. We can use covenants (financial or non-financial) to support a
customer’s credit rating. For example, we can set limits on how much they can spend or borrow, or how they
operate as a business. We can take mortgage debentures as collateral. These are charges over a company’s
assets. We can also take guarantees, but we do not treat them as collateral, and we do not put a cash value on
them unless they are secured against a tangible asset. If a customer defaults, we will work with them to consider
debt restructuring options. We generally do not take control of their assets except when restructuring options have
been exhausted or to protect our position in relation to third party claims. In this case, we might appoint an
administrator.
We also lend against assets (like vehicles and equipment) and invoices for some customers. For assets, we value
them before we lend. For invoices, we review the customer’s ledgers regularly and lend against debtors that meet
agreed criteria. If the customer defaults, we repossess and sell their assets or collect on their invoices.
Commercial Real
Estate
We take a first legal charge on commercial property as collateral. The loan is subject to strict criteria, including the
property condition, age and location, tenant quality, lease terms and length, and the sponsor’s experience and
creditworthiness. Before agreeing the loan, we visit the property and get an independent professional valuation
which assesses the property, the tenant and future demand (such as comparing market rent to current rent). Loan
agreements typically allow us to get revaluations every two to three years, or more often if it is likely covenants may
be breached, and to view the property each year.
Social Housing We take a first legal charge on portfolios of residential real estate owned and let by UK Housing Associations as
collateral, in most cases. We revalue this every three to five years (in line with industry practice), using the
standard methods for property used for Social Housing. The value would be considerably higher if we based it on
normal residential use. On average, the loan balance is 25% to 50% of the implied market value, using our LGD
methodology. We have not had a default, loss or repossession on Social Housing. Older Social Housing loans that
do not fit our current business strategy are managed and reported in Corporate Centre.
Corporate & Investment Banking:
Portfolio Description
Sovereign and
Supranational
In line with market practice, there is no collateral against these assets.
Large Corporate Most of these loans and products are unsecured, but we attach covenants to our credit agreements. We monitor
whether borrowers keep in line with them so we detect any financial distress early. We also have a small structured
finance portfolio, where we hold legal charges over the assets we finance.
Financial
Institutions
We use standard legal agreements to reduce credit risk on derivatives, repos and reverse repos, and stock
borrowing/lending. We also hold collateral and trade through central counterparties (CCPs) to reduce risk.
Netting – We use netting agreements where they have legal force – mainly in the UK, the rest of Europe and the
US. This means that if a counterparty defaults, we can legally offset what we owe them and what they owe us, and
settle the net amount. However, netting arrangements often do not mean we can offset assets and liabilities for
accounting purposes, as transactions are usually settled on a gross basis. In line with market practice, we use
standard legal agreements. For derivatives, we use ISDA Master Agreements; for repos and reverse repos, we use
Global Master Repurchase Agreements; and for stock borrowing/lending and other securities financing, we use
Global Master Securities Lending Agreements.
Collateral – We use the Credit Support Annex with the ISDA Master Agreement. This gives us collateral for our net
exposures. The collateral can be cash, securities or equities. For stock borrowing/lending and repos and reverse
repos, it includes high quality liquid debt securities and highly liquid equities listed on major developed markets. We
revalue our exposures and collateral daily, adjusting the collateral to reflect deficits or surpluses. We have
processes to control how we value and manage collateral, including documentation reviews and reporting.
Collateral has to meet our‘eligible collateral, haircuts and margining’ policy which controls the quality and how
much of any one kind of collateral we can hold. That gives us confidence we will be able to cash in the collateral if
a client defaults. We have these controls for equities and debt securities. The collateral held for reverse repos is
worth at least 100% of our exposure.
CCPs – These are intermediaries between a buyer and a seller – generally a clearing house. We use CCPs as a
way to reduce counterparty credit risk in derivatives.
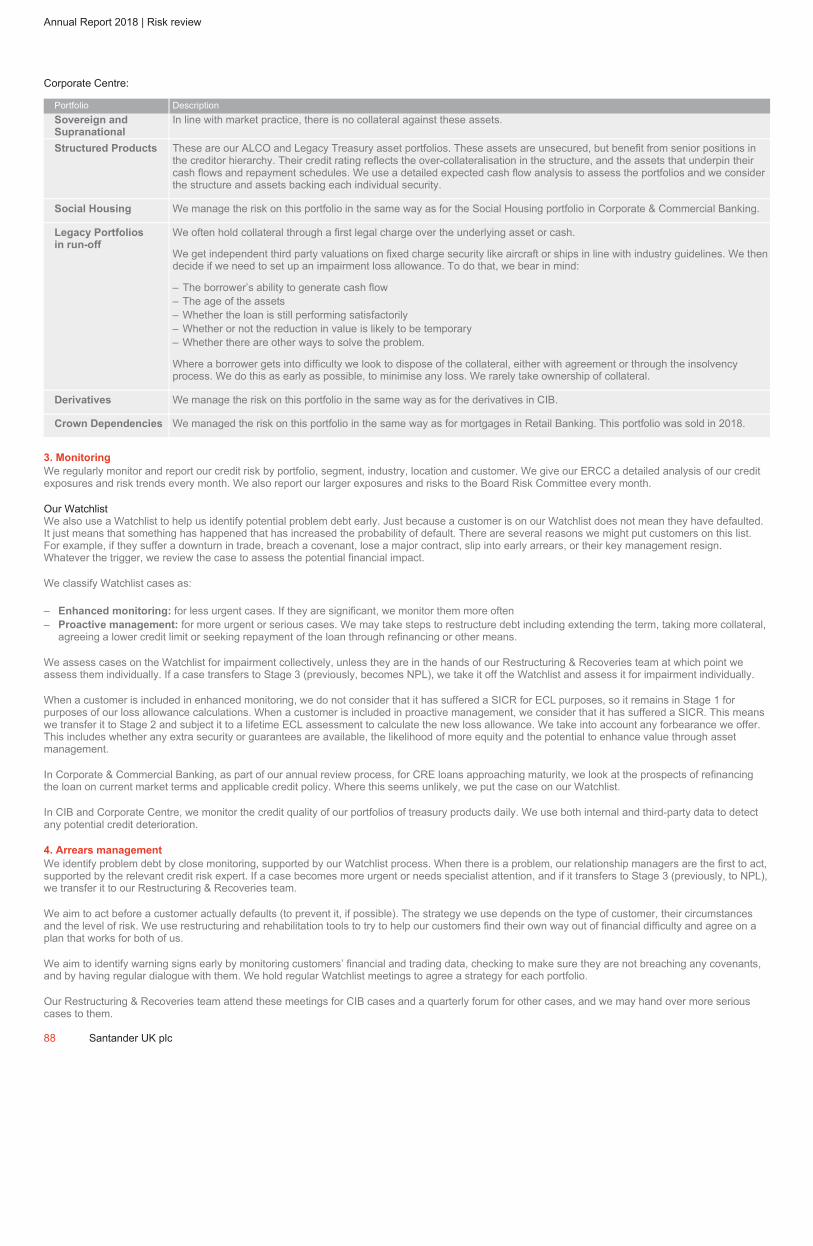
ˆ200G2Mlv!2NyBcygAŠ200G2Mlv!2NyBcygA
628340 TX 88SANTANDERFORM 20-F (SAN UK PL
02-Mar-2019 20:29 ESTHTMLON
Donnelley Financial EGV ramus0dc 5*ESS 0C
VDI-W7-PFD-008912.9.12.0
Page 1 of 1
Annual Report 2018 | Risk review
Corporate Centre:
Portfolio DescriptionSovereign and
Supranational
In line with market practice, there is no collateral against these assets.
Structured Products These are our ALCO and Legacy Treasury asset portfolios. These assets are unsecured, but benefit from senior positions in the creditor hierarchy. Their credit rating reflects the over-collateralisation in the structure, and the assets that underpin their cash flows and repayment schedules. We use a detailed expected cash flow analysis to assess the portfolios and we consider the structure and assets backing each individual security.
Social Housing We manage the risk on this portfolio in the same way as for the Social Housing portfolio in Corporate & Commercial Banking.
Legacy Portfolios
in run-off
We often hold collateral through a first legal charge over the underlying asset or cash.
We get independent third party valuations on fixed charge security like aircraft or ships in line with industry guidelines. We then decide if we need to set up an impairment loss allowance. To do that, we bear in mind:
– The borrower’s ability to generate cash flow– The age of the assets– Whether the loan is still performing satisfactorily– Whether or not the reduction in value is likely to be temporary– Whether there are other ways to solve the problem.
Where a borrower gets into difficulty we look to dispose of the collateral, either with agreement or through the insolvency process. We do this as early as possible, to minimise any loss. We rarely take ownership of collateral.
Derivatives We manage the risk on this portfolio in the same way as for the derivatives in CIB.
Crown Dependencies We managed the risk on this portfolio in the same way as for mortgages in Retail Banking. This portfolio was sold in 2018.
3. Monitoring
We regularly monitor and report our credit risk by portfolio, segment, industry, location and customer. We give our ERCC a detailed analysis of our credit exposures and risk trends every month. We also report our larger exposures and risks to the Board Risk Committee every month.
Our Watchlist We also use a Watchlist to help us identify potential problem debt early. Just because a customer is on our Watchlist does not mean they have defaulted. It just means that something has happened that has increased the probability of default. There are several reasons we might put customers on this list. For example, if they suffer a downturn in trade, breach a covenant, lose a major contract, slip into early arrears, or their key management resign. Whatever the trigger, we review the case to assess the potential financial impact.
We classify Watchlist cases as:
– Enhanced monitoring: for less urgent cases. If they are significant, we monitor them more often – Proactive management: for more urgent or serious cases. We may take steps to restructure debt including extending the term, taking more collateral,
agreeing a lower credit limit or seeking repayment of the loan through refinancing or other means.
We assess cases on the Watchlist for impairment collectively, unless they are in the hands of our Restructuring & Recoveries team at which point we assess them individually. If a case transfers to Stage 3 (previously, becomes NPL), we take it off the Watchlist and assess it for impairment individually.
When a customer is included in enhanced monitoring, we do not consider that it has suffered a SICR for ECL purposes, so it remains in Stage 1 for purposes of our loss allowance calculations. When a customer is included in proactive management, we consider that it has suffered a SICR. This means we transfer it to Stage 2 and subject it to a lifetime ECL assessment to calculate the new loss allowance. We take into account any forbearance we offer. This includes whether any extra security or guarantees are available, the likelihood of more equity and the potential to enhance value through asset management.
In Corporate & Commercial Banking, as part of our annual review process, for CRE loans approaching maturity, we look at the prospects of refinancing the loan on current market terms and applicable credit policy. Where this seems unlikely, we put the case on our Watchlist.
In CIB and Corporate Centre, we monitor the credit quality of our portfolios of treasury products daily. We use both internal and third-party data to detect any potential credit deterioration.
4. Arrears management
We identify problem debt by close monitoring, supported by our Watchlist process. When there is a problem, our relationship managers are the first to act, supported by the relevant credit risk expert. If a case becomes more urgent or needs specialist attention, and if it transfers to Stage 3 (previously, to NPL), we transfer it to our Restructuring & Recoveries team.
We aim to act before a customer actually defaults (to prevent it, if possible). The strategy we use depends on the type of customer, their circumstances and the level of risk. We use restructuring and rehabilitation tools to try to help our customers find their own way out of financial difficulty and agree on a plan that works for both of us.
We aim to identify warning signs early by monitoring customers’ financial and trading data, checking to make sure they are not breaching any covenants, and by having regular dialogue with them. We hold regular Watchlist meetings to agree a strategy for each portfolio.
Our Restructuring & Recoveries team attend these meetings for CIB cases and a quarterly forum for other cases, and we may hand over more serious cases to them.
88 Santander UK plc

ˆ200G2Mlv!2PY@!t69Š200G2Mlv!2PY@!t69
628340 TX 89SANTANDERFORM 20-F (SAN UK PL
02-Mar-2019 23:33 ESTHTMLON
Donnelley Financial EGV manra0dc 5*ESS 0C
VDI-W7-PFL-165312.9.12.0
bar4
Page 1 of 1
> Credit risk
Santander UK plc 89
5. Debt recovery
Consensual arrangements Where we cannot find a solution like any of the ones we describe above, we look for an exit. If we can, we aim to do this by agreeing with the borrower that they will sell some or all of their assets on a voluntary basis or agreeing to give them time to refinance their debt with another lender.
Enforcement and recovery Where we cannot find a way forward or reach a consensual arrangement, we consider recovery options. This can be through:
– The insolvency process – Enforcing over any collateral – Selling the debt on the secondary market – Considering other legal action available to recover what we are owed from debtors and guarantors.
If there is a shortfall, we write it off against loss allowances we hold, once the sale has gone through. In certain very rare instances we may act as mortgagee in possession of assets held as collateral against non-performing commercial lending. In such cases the assets are carried on our balance sheet and are classified according to our accounting policies.
Loan modifications
Forbearance If a customer is having financial difficulty, we will work with them before they actually default to see if the difficulty can be addressed through forbearance. Their problems might be clear from the results of covenant testing, reviews of trading and other data they give us under the terms of their loan or as part of our ongoing conversations with them.
We may offer the following types of forbearance. We only do this if our assessments indicate the customer can meet the revised payments:
Action Description
Term extension We can extend the term of the loan. At a minimum, we expect the customer to be able to pay the interest in the short-term and have a realistic chance of repaying the full balance in the long-term. We may offer this option if the customer is up-to-date with their payments, but showing signs of financial difficulties. We may also offer this option where the loan is about to mature and near-term refinancing is not possible on market terms.
Interest-only We can agree to let a customer pay only the interest on the loan for a short time – usually less than a year. We only agree to this if we believe their financial problems are temporary and they are going to recover. After the interest-only period, we expect the customer to go back to making full payments of interest and capital once they are in a stronger financial position. We regularly look at the customer’s financial situation to see when they can afford to do that.
Other payment
rescheduling
(including
capitalisation)
If a customer is having cash flow issues, we may agree to lower or stop their payments until they have had time to recover. We may:
– Reschedule payments to better match the customer’s cash flow – for example if the business is seasonal– Provide a temporary increase in facilities to cover peak demand ahead of the customer’s trading improving.
We might do this by adding their arrears to their loan balance (we call this arrears capitalisation) or drawing from an overdraft. We may also offer other types of forbearance, including providing new facilities, interest rate concessions, seasonal profiling and interest roll-up. In rare cases, we agree to forgive or reduce part of the debt.
Other forms of debt management When customers are in financial difficulty we can also manage debt in other ways, depending on the facts of the specific case:
Action DescriptionWaiving or changing
covenants
If a borrower breaks a covenant, we can either waive it or change it, taking their latest and future financial position into account. We may also add a condition on the use of any surplus cash (after operating costs) to pay down their debt to us.
Asking for more
collateral or
guarantees
If a borrower has unencumbered assets, we may accept new or extra collateral in return for revised financing terms. We may also take a guarantee from other companies in the same group and/or major shareholders. We only do this where we believe the guarantor will be able to meet their commitment.
Asking for more
equity
Where a borrower can no longer pay the interest on their debt, we may accept fresh equity capital from new or existing investors to change the capital structure in return for better terms on the existing debt.
Risk measurement and control
We measure the credit risk on treasury products by adding their potential future exposure to market movements over their lives to their fair value. Then we add it to any other exposure and measure the total against our credit limits for each client.
We assess our loss allowances regularly and have them independently reviewed. We look at a number of factors, including the:
– Cash flow available to service debt – Value of collateral, based on third-party professional valuations.

ˆ200G2Mlv!2Pby4=geŠ200G2Mlv!2Pby4=ge
628340 TX 90SANTANDERFORM 20-F (SAN UK PL
02-Mar-2019 23:50 ESTHTMLON
Donnelley Financial EGV manra0dc 10*ESS 0C
VDI-W7-PFL-165312.9.12.0
Page 1 of 1
Annual Report 2018 | Risk review
OTHER BUSINESS SEGMENTS – CREDIT RISK REVIEW
Movement in total exposures and the corresponding ECL
The following tables show changes in total exposures and ECL in the year. The footnotes to the Santander UK group level table on page 72 also apply to
these tables.
Non–credit impaired Credit impaired
Stage 1
Subject to 12–month ECL
Stage 2
Subject to lifetime ECL
Stage 3
Subject to lifetime ECL Total
Corporate & Commercial Banking
Exposures(1)
£m
ECL
£m
Exposures(1)
£m
ECL
£m
Exposures(1)
£m
ECL
£m
Exposures(1)
£m
ECL
£m
At 1 January 2018 22,417 43 866 33 388 173 23,671 249
Change in economic scenarios(2)– 5 – (3) – – – 2
Transfer to lifetime ECL (not–credit impaired)(3) (670) (3) 670 3 – – – –
Transfer to credit impaired(3) (41) – (31) (1) 72 1 – –
Transfer to 12–month ECL(3) 200 8 (200) (8) – – – –
Transfer from credit impaired(3) 2 1 2 1 (4) (2) – –
Transfers of financial instruments (509) 6 441 (5) 68 (1) – –
Net remeasurement of ECL on stage transfer(4) – (7) – 10 – 18 – 21
New assets originated or purchased (5) 9,115 12 281 5 3 1 9,399 18
Other(6) 879 (3) (58) (3) (2) 37 819 31
Assets derecognised – closed good (7)(10,569) (19) (304) (5) (76) (18) (10,949) (42)
Assets derecognised – written off (7)– – – – (105) (97) (105) (97)
At 31 December 2018 21,333 37 1,226 32 276 113 22,835 182
Net movement in the year (1,084) (6) 360 (1) (112) (60) (836) (67)
Charge/(release) to the Income Statement (6) (1) 37 30
Recoveries net of collection costs – – (7) (7)
Income statement charge/(release) for the year (6) (1) 30 23
Corporate & Investment Banking £m £m £m £m £m £m £m £m
At 1 January 2018 26,583 16 109 – 372 242 27,064 258
Changes to model – – – – – (9) – (9)
Transfer to lifetime ECL (not–credit impaired)(3) (2) – 2 – – – – –
New assets originated or purchased(5) 35,926 4 133 3 – – 36,059 7
Other(6) (2,306) (1) 83 1 (47) 29 (2,270) 29
Assets derecognised – closed good (7)(18,817) (14) (193) (1) – – (19,010) (15)
Assets derecognised – written off (7)– – – – (299) (252) (299) (252)
At 31 December 2018 41,384 5 134 3 26 10 41,544 18
Net movement in the year 14,801 (11) 25 3 (346) (232) 14,480 (240)
Charge/(release) to the Income Statement (11) 3 20 12
Recoveries net of collection costs – – 2 2
Income statement charge/(release) for the year (11) 3 22 14
Corporate Centre £m £m £m £m £m £m £m £m
At 1 January 2018 57,155 7 250 4 20 8 57,425 19
Change in economic scenarios(2)– 1 – – – – – 1
Transfer to lifetime ECL (not–credit impaired)(3) (111) (1) 111 1 – – – –
Transfer to credit impaired(3) – – (4) – 4 – – –
Transfer to 12–month ECL(3) 133 3 (133) (3) – – – –
Transfer from credit impaired(3) – – 3 1 (3) (1) – –
Transfers of financial instruments 22 2 (23) (1) 1 (1) – –
Net remeasurement of ECL on stage transfer(4) – (2) – – – 1 – (1)
New assets originated or purchased(5) 7,526 1 2 – 2 1 7,530 2
Other(6) (14,626) (2) (6) – 3 1 (14,629) (1)
Assets derecognised – closed good (7)(4,943) (2) (92) – (8) (2) (5,043) (4)
Assets derecognised – written off (7)– – – – (3) (3) (3) (3)
At 31 December 2018 45,134 5 131 3 15 5 45,280 13
Net movement in the year (12,021) (2) (119) (1) (5) (3) (12,145) (6)
Charge/(release) to the Income Statement (2) (1) – (3)
Recoveries net of collection costs – – (4) (4)
Income statement charge/(release) for the year (2) (1) (4) (7)
2018 compared to 2017 (unaudited)
Non trading reverse repurchase agreements increased to £21,127m at 31 December 2018 (2017: £2,614m), which reflected the revised classification of the
majority of our permitted non trading reverse repurchase agreements at amortised cost in line with our ring-fenced business model. We report reverse
repurchase agreements in CIB and the movement in the year is reported in the ‘New assets originated or purchased’ and ‘Assets derecognised – closed
good’ lines above.
Cash and balances at central banks, which are reported in Corporate Centre, decreased by £13,024m to £19,747m at 31 December 2018 (2017: £32,771m).
This movement is reported in the ‘Other’ line above. For more, see the Balance sheet review in the ‘Financial review’ section.
90 Santander UK plc
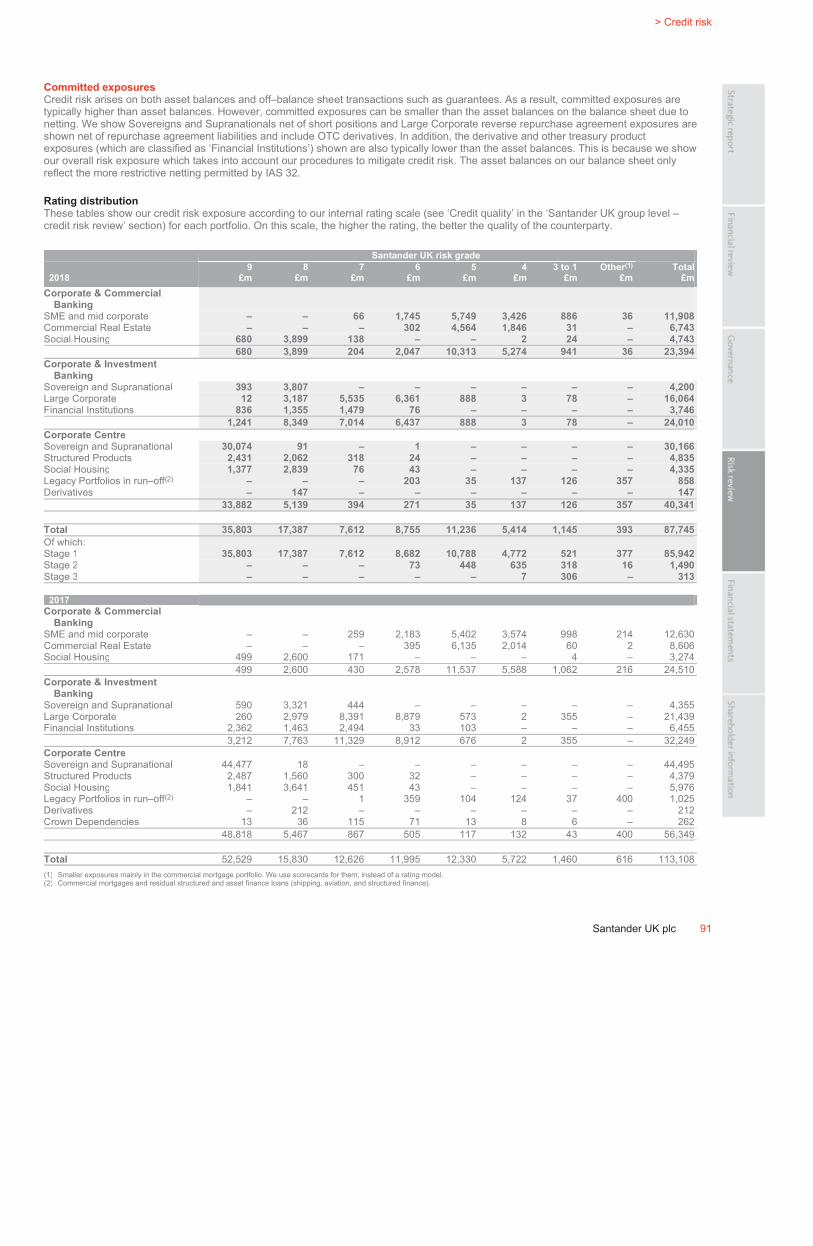
ˆ200G2Mlv!2aoMfe6OŠ200G2Mlv!2aoMfe6O
628340 TX 91SANTANDERFORM 20-F (SAN UK PL
04-Mar-2019 03:14 ESTHTMLON
Donnelley Financial EGV annas1dc 8*ESS 0C
VDI-W7-PFD-029812.9.12.0
bar4
Page 1 of 1
> Credit risk
Santander UK plc 91
Committed exposures
Credit risk arises on both asset balances and off–balance sheet transactions such as guarantees. As a result, committed exposures are
typically higher than asset balances. However, committed exposures can be smaller than the asset balances on the balance sheet due to
netting. We show Sovereigns and Supranationals net of short positions and Large Corporate reverse repurchase agreement exposures are
shown net of repurchase agreement liabilities and include OTC derivatives. In addition, the derivative and other treasury product
exposures (which are classified as ‘Financial Institutions’) shown are also typically lower than the asset balances. This is because we show
our overall risk exposure which takes into account our procedures to mitigate credit risk. The asset balances on our balance sheet only
reflect the more restrictive netting permitted by IAS 32.
Rating distribution
These tables show our credit risk exposure according to our internal rating scale (see ‘Credit quality’ in the ‘Santander UK group level –
credit risk review’ section) for each portfolio. On this scale, the higher the rating, the better the quality of the counterparty.
Santander UK risk grade
2018
9
£m
8
£m
7
£m
6
£m
5
£m
4
£m
3 to 1
£m
Other(1)
£m
Total
£m
Corporate & Commercial
Banking
SME and mid corporate – – 66 1,745 5,749 3,426 886 36 11,908
Commercial Real Estate – – – 302 4,564 1,846 31 – 6,743
Social Housing 680 3,899 138 – – 2 24 – 4,743
680 3,899 204 2,047 10,313 5,274 941 36 23,394
Corporate & Investment
Banking
Sovereign and Supranational 393 3,807 – – – – – – 4,200
Large Corporate 12 3,187 5,535 6,361 888 3 78 – 16,064
Financial Institutions 836 1,355 1,479 76 – – – – 3,746
1,241 8,349 7,014 6,437 888 3 78 – 24,010
Corporate Centre
Sovereign and Supranational 30,074 91 – 1 – – – – 30,166
Structured Products 2,431 2,062 318 24 – – – – 4,835
Social Housing 1,377 2,839 76 43 – – – – 4,335
Legacy Portfolios in run–off(2)
– – – 203 35 137 126 357 858
Derivatives – 147 – – – – – – 147
33,882 5,139 394 271 35 137 126 357 40,341
Total 35,803 17,387 7,612 8,755 11,236 5,414 1,145 393 87,745
Of which:
Stage 1 35,803 17,387 7,612 8,682 10,788 4,772 521 377 85,942
Stage 2 – – – 73 448 635 318 16 1,490
Stage 3 – – – – – 7 306 – 313
2017
Corporate & Commercial
Banking
SME and mid corporate – – 259 2,183 5,402 3,574 998 214 12,630
Commercial Real Estate – – – 395 6,135 2,014 60 2 8,606
Social Housing 499 2,600 171 – – – 4 – 3,274
499 2,600 430 2,578 11,537 5,588 1,062 216 24,510
Corporate & Investment
Banking
Sovereign and Supranational 590 3,321 444 – – – – – 4,355
Large Corporate 260 2,979 8,391 8,879 573 2 355 – 21,439
Financial Institutions 2,362 1,463 2,494 33 103 – – – 6,455
3,212 7,763 11,329 8,912 676 2 355 – 32,249
Corporate Centre
Sovereign and Supranational 44,477 18 – – – – – – 44,495
Structured Products 2,487 1,560 300 32 – – – – 4,379
Social Housing 1,841 3,641 451 43 – – – – 5,976
Legacy Portfolios in run–off(2) – – 1 359 104 124 37 400 1,025
Derivatives – 212 – – – – – – 212
Crown Dependencies 13 36 115 71 13 8 6 – 262
48,818 5,467 867 505 117 132 43 400 56,349
Total 52,529 15,830 12,626 11,995 12,330 5,722 1,460 616 113,108
(1) Smaller exposures mainly in the commercial mortgage portfolio. We use scorecards for them, instead of a rating model.
(2) Commercial mortgages and residual structured and asset finance loans (shipping, aviation, and structured finance).
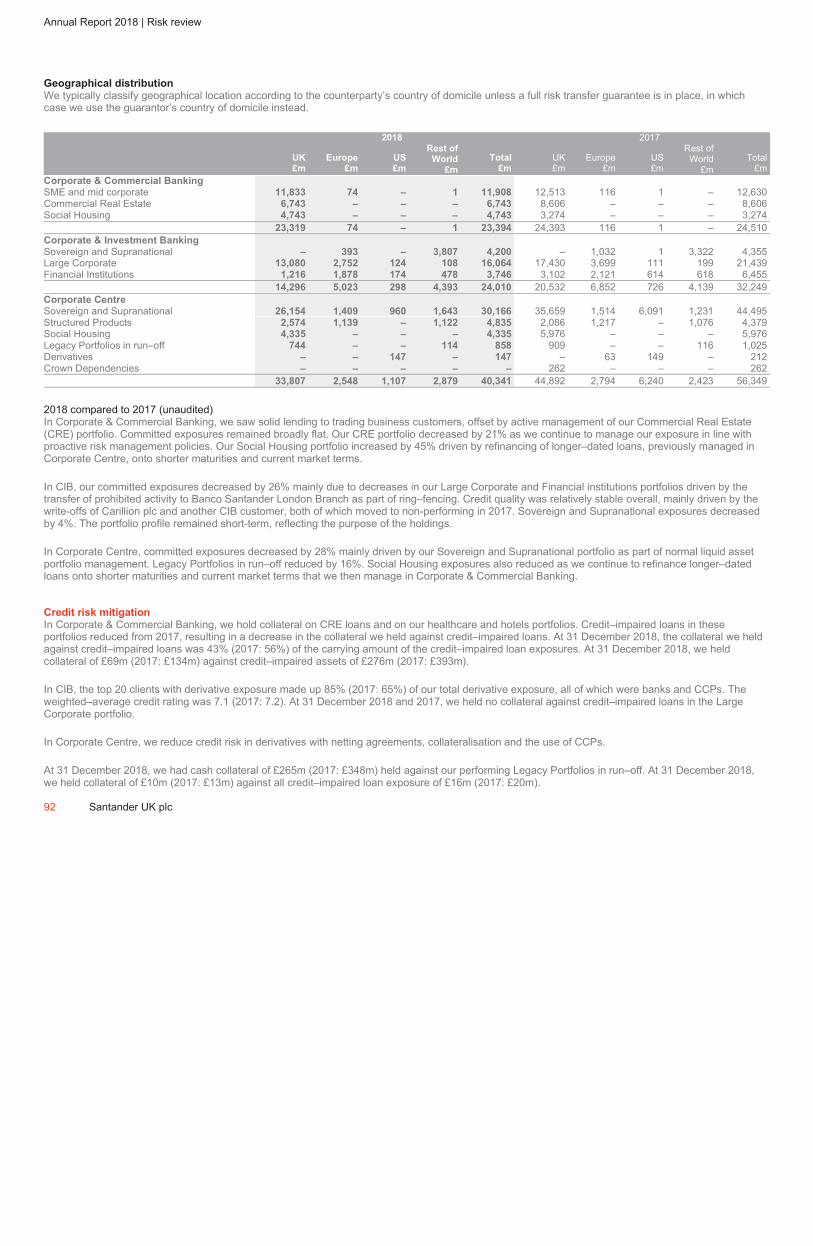
ˆ200G2Mlv!2P=p7w6PŠ200G2Mlv!2P=p7w6P
628340 TX 92SANTANDERFORM 20-F (SAN UK PL
02-Mar-2019 23:41 ESTHTMLON
Donnelley Financial EGV manra0dc 5*ESS 0C
VDI-W7-PFL-165312.9.12.0
Page 1 of 1
Annual Report 2018 | Risk review
Geographical distribution
We typically classify geographical location according to the counterparty’s country of domicile unless a full risk transfer guarantee is in place, in which
case we use the guarantor’s country of domicile instead.
2018 2017
UK
£m
Europe
£m
US
£m
Rest of
World
£m
Total
£m
UK
£m
Europe
£m
US
£m
Rest of
World
£m
Total
£m
Corporate & Commercial Banking
SME and mid corporate 11,833 74 – 1 11,908 12,513 116 1 – 12,630
Commercial Real Estate 6,743 – – – 6,743 8,606 – – – 8,606
Social Housing 4,743 – – – 4,743 3,274 – – – 3,274
23,319 74 – 1 23,394 24,393 116 1 – 24,510
Corporate & Investment Banking
Sovereign and Supranational – 393 – 3,807 4,200 – 1,032 1 3,322 4,355
Large Corporate 13,080 2,752 124 108 16,064 17,430 3,699 111 199 21,439
Financial Institutions 1,216 1,878 174 478 3,746 3,102 2,121 614 618 6,455
14,296 5,023 298 4,393 24,010 20,532 6,852 726 4,139 32,249
Corporate Centre
Sovereign and Supranational 26,154 1,409 960 1,643 30,166 35,659 1,514 6,091 1,231 44,495
Structured Products 2,574 1,139 – 1,122 4,835 2,086 1,217 – 1,076 4,379
Social Housing 4,335 – – – 4,335 5,976 – – – 5,976
Legacy Portfolios in run–off 744 – – 114 858 909 – – 116 1,025
Derivatives – – 147 – 147 – 63 149 – 212
Crown Dependencies – – – – – 262 – – – 262
33,807 2,548 1,107 2,879 40,341 44,892 2,794 6,240 2,423 56,349
2018 compared to 2017 (unaudited)
In Corporate & Commercial Banking, we saw solid lending to trading business customers, offset by active management of our Commercial Real Estate
(CRE) portfolio. Committed exposures remained broadly flat. Our CRE portfolio decreased by 21% as we continue to manage our exposure in line with
proactive risk management policies. Our Social Housing portfolio increased by 45% driven by refinancing of longer–dated loans, previously managed in
Corporate Centre, onto shorter maturities and current market terms.
In CIB, our committed exposures decreased by 26% mainly due to decreases in our Large Corporate and Financial institutions portfolios driven by the
transfer of prohibited activity to Banco Santander London Branch as part of ring–fencing. Credit quality was relatively stable overall, mainly driven by the
write-offs of Carillion plc and another CIB customer, both of which moved to non-performing in 2017. Sovereign and Supranational exposures decreased
by 4%. The portfolio profile remained short-term, reflecting the purpose of the holdings.
In Corporate Centre, committed exposures decreased by 28% mainly driven by our Sovereign and Supranational portfolio as part of normal liquid asset
portfolio management. Legacy Portfolios in run–off reduced by 16%. Social Housing exposures also reduced as we continue to refinance longer–dated
loans onto shorter maturities and current market terms that we then manage in Corporate & Commercial Banking.
Credit risk mitigation
In Corporate & Commercial Banking, we hold collateral on CRE loans and on our healthcare and hotels portfolios. Credit–impaired loans in these
portfolios reduced from 2017, resulting in a decrease in the collateral we held against credit–impaired loans. At 31 December 2018, the collateral we held
against credit–impaired loans was 43% (2017: 56%) of the carrying amount of the credit–impaired loan exposures. At 31 December 2018, we held
collateral of £69m (2017: £134m) against credit–impaired assets of £276m (2017: £393m).
In CIB, the top 20 clients with derivative exposure made up 85% (2017: 65%) of our total derivative exposure, all of which were banks and CCPs. The
weighted–average credit rating was 7.1 (2017: 7.2). At 31 December 2018 and 2017, we held no collateral against credit–impaired loans in the Large
Corporate portfolio.
In Corporate Centre, we reduce credit risk in derivatives with netting agreements, collateralisation and the use of CCPs.
At 31 December 2018, we had cash collateral of £265m (2017: £348m) held against our performing Legacy Portfolios in run–off. At 31 December 2018,
we held collateral of £10m (2017: £13m) against all credit–impaired loan exposure of £16m (2017: £20m).
92 Santander UK plc

ˆ200G2Mlv!2P=ykDgxŠ200G2Mlv!2P=ykDgx
628340 TX 93SANTANDERFORM 20-F (SAN UK PL
02-Mar-2019 23:42 ESTHTMLON
Donnelley Financial EGV manra0dc 7*ESS 0C
VDI-W7-PFL-165312.9.12.0
bar4
Page 1 of 1
> Credit risk
Santander UK plc 93
Credit performance
We monitor exposures that show potentially higher risk characteristics using our Watchlist process (described in ‘Monitoring’ in the ‘Credit
risk management’ section). The table below shows the exposures we monitor, and those we classify as non–performing by portfolio at
31 December 2018 and 2017.
Committed exposure
Watchlist
2018
Fully
performing
£m
Enhanced
monitoring
£m
Proactive
management
£m
Non–
performing
exposure(1)
£m
Total(2)
£m
Loss
allowances(3)
£m
Corporate & Commercial Banking
SME and mid corporate 10,350 972 333 253 11,908 160
Commercial Real Estate 6,426 247 47 23 6,743 22
Social Housing 4,626 117 – – 4,743 –
21,402 1,336 380 276 23,394 182
Corporate & Investment Banking
Sovereign and Supranational 4,200 – – – 4,200 –
Large Corporate 15,304 548 186 26 16,064 18
Financial Institutions 3,746 – – – 3,746 –
23,250 548 186 26 24,010 18
Corporate Centre
Sovereign and Supranational 30,166 – – – 30,166 –
Structured Products 4,835 – – – 4,835 –
Social Housing 4,313 22 – – 4,335 –
Legacy Portfolios in run–off 809 26 7 16 858 13
Derivatives 147 – – – 147 –
40,270 48 7 16 40,341 13
Total loss allowances(3)
213
2017
Corporate & Commercial Banking
SME and mid corporate 11,185 815 296 334 12,630 128
Commercial Real Estate 8,254 160 133 59 8,606 27
Social Housing 3,274 – – – 3,274 –
22,713 975 429 393 24,510 155
Corporate & Investment Banking
Sovereign and Supranational 4,355 – – – 4,355 –
Large Corporate 20,757 284 8 390 21,439 236
Financial Institutions 6,354 1 100 – 6,455 –
31,466 285 108 390 32,249 236
Corporate Centre
Sovereign and Supranational 44,495 – – – 44,495 –
Structured Products 4,379 – – – 4,379 –
Social Housing 5,972 4 – – 5,976 –
Legacy Portfolios in run–off 977 22 6 20 1,025 6
Derivatives 212 – – – 212 –
Crown Dependencies 261 – – 1 262 –
56,296 26 6 21 56,349 6
Total observed impairment loss
allowances 397
Allowance for IBNO(4) 52
Total loss allowances 449
(1) Non–performing exposure includes committed facilities and derivative exposures. So it can exceed NPLs which only include on-balance sheet amounts.
(2) Includes committed facilities and derivatives. We define ‘Enhanced Monitoring’ and ‘Proactive Management’ in the ‘Monitoring‘ section.
(3) Loss allowances for 2017 were on an incurred loss basis per IAS 39, whilst for 2018 they are on an ECL basis per IFRS 9. The ECL allowance is for both on and off–balance sheet exposures.
(4) Allowance for IBNO losses as described in Note 1 to the Consolidated Financial Statements.
2018 compared to 2017 (unaudited)
In Corporate & Commercial Banking, the SME and mid corporate portfolio and our CRE portfolio, non-performing exposures (NPEs)
reduced, largely due to the workout of a number of smaller loans reaching a conclusion resulting in partial write-offs, without material
concentrations across sectors or portfolios. Exposures subject to enhanced monitoring increased due to a social housing case
experiencing governance issues plus a small number of CRE cases approaching maturity where repayment or refinance arrangements
had yet to be confirmed.
In CIB, Large Corporate exposures subject to enhanced monitoring increased due to a small number of cases that were experiencing
performance issues. However, NPEs decreased predominantly due to loan write-offs for Carillion plc and another CIB customer, both of
which moved to non–performing in 2017. Financial Institutions exposures subject to proactive monitoring decreased, driven by the transfer
of one case to Banco Santander London Branch.
In Corporate Centre, Legacy Portfolios in run–off subject to enhanced monitoring and proactive management remained stable. NPEs
reduced driven by continuing exit of the legacy commercial mortgage portfolio.
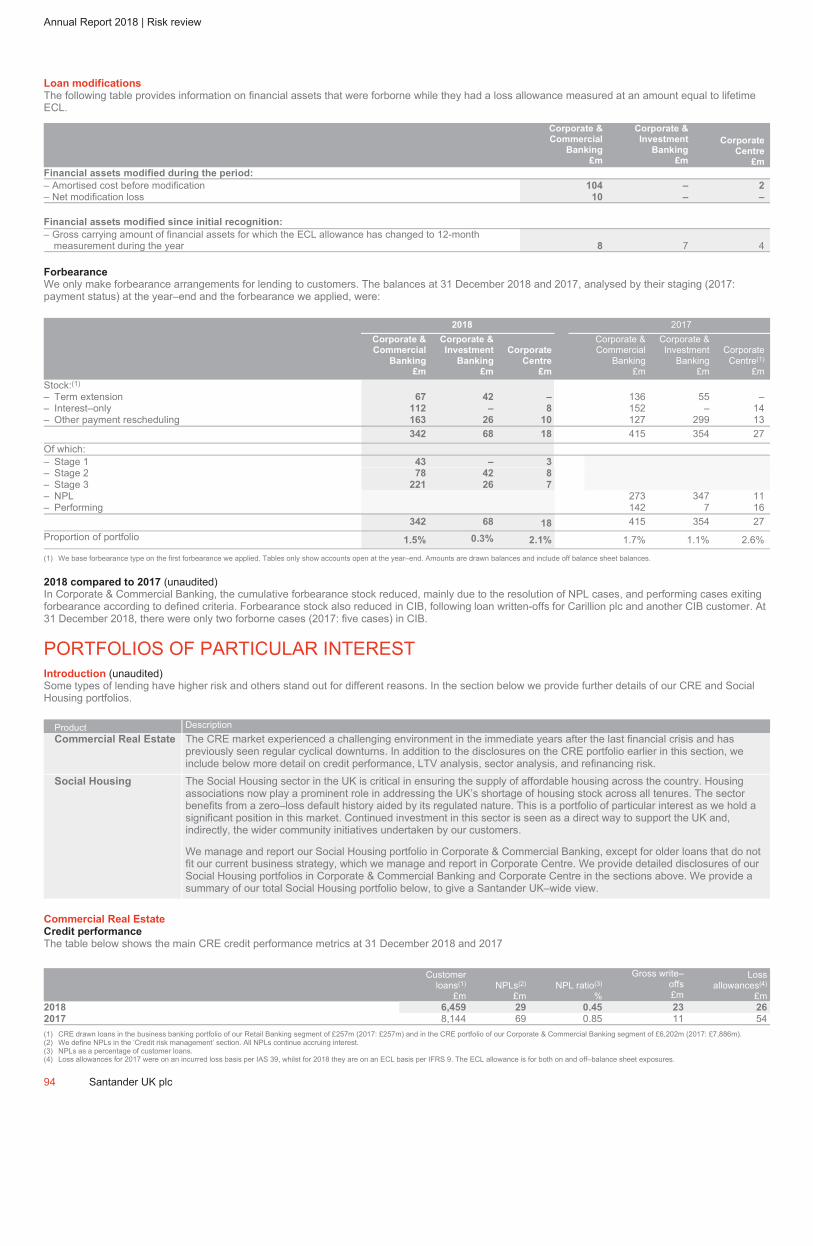
ˆ200G2Mlv!2aq14TgSŠ200G2Mlv!2aq14TgS
628340 TX 94SANTANDERFORM 20-F (SAN UK PL
04-Mar-2019 03:15 ESTHTMLON
Donnelley Financial EGV annas1dc 8*ESS 0C
VDI-W7-PFD-029812.9.12.0
Page 1 of 1
Annual Report 2018 | Risk review
Loan modifications
The following table provides information on financial assets that were forborne while they had a loss allowance measured at an amount equal to lifetime ECL.
Corporate &
Commercial
Banking
£m
Corporate &
Investment
Banking
£m
Corporate
Centre
£m
Financial assets modified during the period:
– Amortised cost before modification 104 – 2
– Net modification loss 10 – –
Financial assets modified since initial recognition:
– Gross carrying amount of financial assets for which the ECL allowance has changed to 12-month measurement during the year 8 7 4
Forbearance
We only make forbearance arrangements for lending to customers. The balances at 31 December 2018 and 2017, analysed by their staging (2017: payment status) at the year–end and the forbearance we applied, were:
2018 2017Corporate &
Commercial
Banking
£m
Corporate &
Investment
Banking
£m
Corporate
Centre
£m
Corporate &Commercial
Banking£m
Corporate &Investment
Banking£m
Corporate Centre(1)
£m Stock:(1)
– Term extension 67 42 – 136 55 – – Interest–only 112 – 8 152 – 14 – Other payment rescheduling 163 26 10 127 299 13
342 68 18 415 354 27 Of which:– Stage 1 43 – 3
– Stage 2 78 42 8
– Stage 3 221 26 7
– NPL 273 347 11 – Performing 142 7 16
342 68 18 415 354 27 Proportion of portfolio
1.5% 0.3% 2.1% 1.7% 1.1% 2.6%
(1) We base forbearance type on the first forbearance we applied. Tables only show accounts open at the year–end. Amounts are drawn balances and include off balance sheet balances.
2018 compared to 2017 (unaudited)In Corporate & Commercial Banking, the cumulative forbearance stock reduced, mainly due to the resolution of NPL cases, and performing cases exiting forbearance according to defined criteria. Forbearance stock also reduced in CIB, following loan written-offs for Carillion plc and another CIB customer. At 31 December 2018, there were only two forborne cases (2017: five cases) in CIB.
PORTFOLIOS OF PARTICULAR INTEREST Introduction (unaudited)Some types of lending have higher risk and others stand out for different reasons. In the section below we provide further details of our CRE and Social Housing portfolios.
Product DescriptionCommercial Real Estate The CRE market experienced a challenging environment in the immediate years after the last financial crisis and has
previously seen regular cyclical downturns. In addition to the disclosures on the CRE portfolio earlier in this section, we include below more detail on credit performance, LTV analysis, sector analysis, and refinancing risk.
Social Housing The Social Housing sector in the UK is critical in ensuring the supply of affordable housing across the country. Housing associations now play a prominent role in addressing the UK’s shortage of housing stock across all tenures. The sector benefits from a zero–loss default history aided by its regulated nature. This is a portfolio of particular interest as we hold a significant position in this market. Continued investment in this sector is seen as a direct way to support the UK and, indirectly, the wider community initiatives undertaken by our customers.
We manage and report our Social Housing portfolio in Corporate & Commercial Banking, except for older loans that do not fit our current business strategy, which we manage and report in Corporate Centre. We provide detailed disclosures of our Social Housing portfolios in Corporate & Commercial Banking and Corporate Centre in the sections above. We provide a summary of our total Social Housing portfolio below, to give a Santander UK–wide view.
Commercial Real Estate
Credit performance
The table below shows the main CRE credit performance metrics at 31 December 2018 and 2017
Customerloans(1)
£mNPLs(2)
£mNPL ratio(3)
%
Gross write–offs£m
Lossallowances(4)
£m2018 6,459 29 0.45 23 26
2017 8,144 69 0.85 11 54(1) CRE drawn loans in the business banking portfolio of our Retail Banking segment of £257m (2017: £257m) and in the CRE portfolio of our Corporate & Commercial Banking segment of £6,202m (2017: £7,886m). (2) We define NPLs in the ‘Credit risk management’ section. All NPLs continue accruing interest. (3) NPLs as a percentage of customer loans. (4) Loss allowances for 2017 were on an incurred loss basis per IAS 39, whilst for 2018 they are on an ECL basis per IFRS 9. The ECL allowance is for both on and off–balance sheet exposures.
94 Santander UK plc

ˆ200G2Mlv!2asZG&gqŠ200G2Mlv!2asZG&gq
628340 TX 95SANTANDERFORM 20-F (SAN UK PL
04-Mar-2019 03:18 ESTHTMLON
Donnelley Financial EGV annas1dc 7*ESS 0C
VDI-W7-PFD-029812.9.12.0
bar4
Page 1 of 1
> Credit risk
Santander UK plc 95
CRE loans written before 2009 totalled £190m (2017: £380m). The pre–2009 loans were written on market terms which, compared with
more recent times and following a significant tightening in our lending criteria, included higher original LTVs, lower interest coverage and
exposure to development risk, were more generous.
LTV analysis
The table below shows the LTV distribution for our CRE loan stock and NPL stock (based on the drawn balance and our latest estimate of
the property’s current value) of the portfolio at 31 December 2018 and 2017.
2018 2017
Total stock NPL stock Total Stock NPL stock
Loans and advances to
customers £m % £m % £m % £m %
<=50% 3,663 56 3 11 4,146 51 6 9
>50–70% 2,039 32 4 14 3,035 37 2 3
>70–100% 47 1 1 3 36 – 1 1
>100% i.e. negative equity 18 – 16 55 52 1 48 70
Standardised portfolio(1) 631 10 5 17 629 8 12 17
Total with collateral 6,398 99 29 100 7,898 97 69 100
Development loans 61 1 – – 246 3 – –
6,459 100 29 100 8,144 100 69 100
(1) Smaller value transactions, mainly commercial mortgages.
Sector analysis
2018 2017
Sector £m % £m %
Office 1,556 24 2,181 27
Retail 1,004 16 1,389 17
Industrial 888 14 1,176 14
Residential 927 14 1,001 12
Mixed use 932 14 1,146 14
Student accommodation 123 2 133 2
Hotels and leisure 309 5 304 4
Other 89 1 185 2
Standardised portfolio(1) 631 10 629 8
6,459 100 8,144 100
(1) Smaller value transactions, mainly commercial mortgages.
The CRE portfolio is well diversified across sectors, with no significant regional or single name concentration, representing 27% (2017:
30%) of our total lending to corporates and 3% (2017: 4%) of total customer loans. At 31 December 2018, the LTV profile of the portfolio
remained conservative with £5,702m (2017: £7,181m) of the non–standardised portfolio assets at or below 70% LTV.
Loans with development risk were only 1% (2017: 3%) of the total CRE portfolio. Development lending is typically on a non–speculative
basis with significant pre–lets and/or pre–sales in place. The average loan balance at 31 December 2018 was £3.2m (2017: £4.7m) and
the top ten exposures made up 11% (2017: 10%) of the total CRE portfolio exposure.
Refinancing risk
At 31 December 2018, CRE loans of £1,144m (2017: £1,090m) were due to mature within 12 months. Of these, £30m, i.e. 3% (2017:
£59m, i.e. 5%) had an LTV ratio higher than is acceptable under our current credit policy. At 31 December 2018, £10m of this (2017:
£53m) had been put on our Watchlist or recorded as Stage 3 and NPL, and had an impairment loss allowance of £5m (2017: £27m).
2018 compared to 2017 (unaudited)
In our CRE portfolio, customer loans decreased by 21% as we continue to manage our exposure in line with proactive risk management
policies. In 2018, we maintained a prudent lending approach, with no new business written above 70% LTV (2017: nil) and all new
business (2017: 91%) written at or below 60% LTV. The weighted average LTV on the CRE portfolio was 47% (2017: 48%).
Exposures subject to enhanced monitoring increased to £247m (2017: £160m). Exposures subject to proactive management decreased by
65% to £47m (2017: £133m) largely driven by a number of successful exits. Non–performing exposures reduced by 61% to £23m (2017:
£59m). CRE credit quality remained good with the improvement in the NPL ratio to 0.45% (2017: 0.85%) reflecting loan write-offs.
Social Housing
We manage and report our Social Housing portfolio in Corporate & Commercial Banking, except for older Social Housing loans that do not
fit our current business strategy, which we manage and report in Corporate Centre. We provide detailed disclosures of our Social Housing
portfolios in Corporate & Commercial Banking and Corporate Centre in the sections above. At 31 December 2018 and 2017, our total
Social Housing exposure in Corporate & Commercial Banking and Corporate Centre was:
2018 2017
On-balance
sheet
£m
Total
exposure
£m
On-balance
sheet
£m
Total
exposure
£m
Corporate & Commercial Banking 2,844 4,743 2,118 3,274
Corporate Centre 3,780 4,335 5,060 5,976
6,624 9,078 7,178 9,250
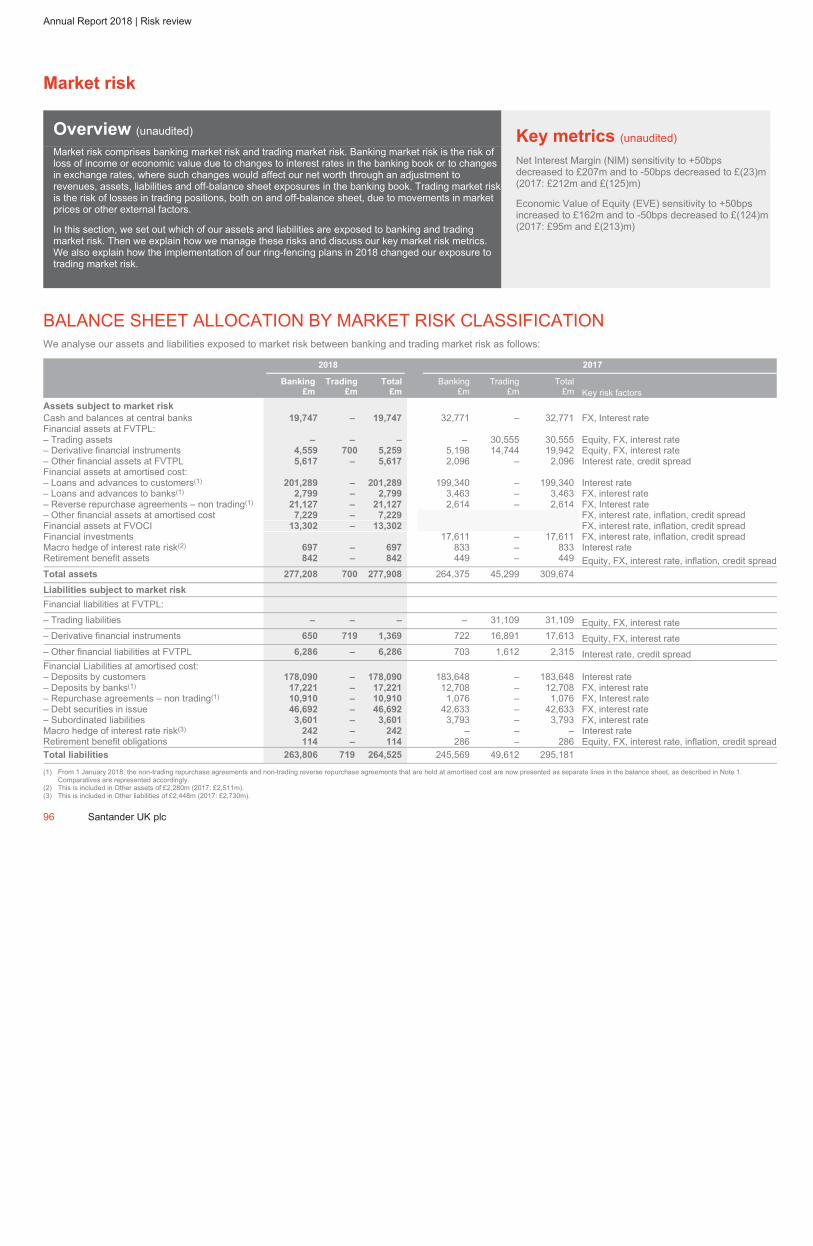
ˆ200G2Mlv!2Z%qqt6@Š200G2Mlv!2Z%qqt6@
628340 TX 96SANTANDERFORM 20-F (SAN UK PL
04-Mar-2019 01:37 ESTHTMLON
Donnelley Financial EGV gopad0dc 8*ESS 0C
VDI-W7-PFD-037812.9.12.0
Page 1 of 1
Annual Report 2018 | Risk review
Market risk
Overview (unaudited)Key metrics (unaudited)
Market risk comprises banking market risk and trading market risk. Banking market risk is the risk of
loss of income or economic value due to changes to interest rates in the banking book or to changes
in exchange rates, where such changes would affect our net worth through an adjustment to
revenues, assets, liabilities and off-balance sheet exposures in the banking book. Trading market risk
is the risk of losses in trading positions, both on and off-balance sheet, due to movements in market
prices or other external factors.
In this section, we set out which of our assets and liabilities are exposed to banking and trading
market risk. Then we explain how we manage these risks and discuss our key market risk metrics.
We also explain how the implementation of our ring-fencing plans in 2018 changed our exposure to
trading market risk.
Net Interest Margin (NIM) sensitivity to +50bps
decreased to £207m and to -50bps decreased to £(23)m
(2017: £212m and £(125)m)
Economic Value of Equity (EVE) sensitivity to +50bps
increased to £162m and to -50bps decreased to £(124)m
(2017: £95m and £(213)m)
BALANCE SHEET ALLOCATION BY MARKET RISK CLASSIFICATION
We analyse our assets and liabilities exposed to market risk between banking and trading market risk as follows:
2018 2017
Banking
£m
Trading
£m
Total
£m
Banking
£m
Trading
£m
Total
£m Key risk factors
Assets subject to market risk
Cash and balances at central banks 19,747 – 19,747 32,771 – 32,771 FX, Interest rate
Financial assets at FVTPL:
– Trading assets – – – – 30,555 30,555 Equity, FX, interest rate
– Derivative financial instruments 4,559 700 5,259 5,198 14,744 19,942 Equity, FX, interest rate
– Other financial assets at FVTPL 5,617 – 5,617 2,096 – 2,096 Interest rate, credit spread
Financial assets at amortised cost:
– Loans and advances to customers(1) 201,289 – 201,289 199,340 – 199,340 Interest rate
– Loans and advances to banks(1) 2,799 – 2,799 3,463 – 3,463 FX, interest rate
– Reverse repurchase agreements – non trading(1) 21,127 – 21,127 2,614 – 2,614 FX, Interest rate
– Other financial assets at amortised cost 7,229 – 7,229 FX, interest rate, inflation, credit spread
Financial assets at FVOCI 13,302 – 13,302 FX, interest rate, inflation, credit spread
Financial investments 17,611 – 17,611 FX, interest rate, inflation, credit spread
Macro hedge of interest rate risk(2) 697 – 697 833 – 833 Interest rate
Retirement benefit assets 842 – 842 449 – 449 Equity, FX, interest rate, inflation, credit spread
Total assets 277,208 700 277,908 264,375 45,299 309,674
Liabilities subject to market risk
Financial liabilities at FVTPL:
– Trading liabilities – – – – 31,109 31,109 Equity, FX, interest rate
– Derivative financial instruments 650 719 1,369 722 16,891 17,613 Equity, FX, interest rate
– Other financial liabilities at FVTPL 6,286 – 6,286 703 1,612 2,315 Interest rate, credit spread
Financial Liabilities at amortised cost:
– Deposits by customers 178,090 – 178,090 183,648 – 183,648 Interest rate
– Deposits by banks(1) 17,221 – 17,221 12,708 – 12,708 FX, interest rate
– Repurchase agreements – non trading(1) 10,910 – 10,910 1,076 – 1,076 FX, Interest rate
– Debt securities in issue 46,692 – 46,692 42,633 – 42,633 FX, interest rate
– Subordinated liabilities 3,601 – 3,601 3,793 – 3,793 FX, interest rate
Macro hedge of interest rate risk(3) 242 – 242 – – – Interest rate
Retirement benefit obligations 114 – 114 286 – 286 Equity, FX, interest rate, inflation, credit spread
Total liabilities 263,806 719 264,525 245,569 49,612 295,181
(1) From 1 January 2018, the non-trading repurchase agreements and non-trading reverse repurchase agreements that are held at amortised cost are now presented as separate lines in the balance sheet, as described in Note 1.
Comparatives are represented accordingly.
(2) This is included in Other assets of £2,280m (2017: £2,511m).
(3) This is included in Other liabilities of £2,448m (2017: £2,730m).
96 Santander UK plc
ˆ200G2Mlv!2Z%tu76DŠ200G2Mlv!2Z%tu76D
628340 TX 97SANTANDERFORM 20-F (SAN UK PL
04-Mar-2019 01:37 ESTHTMLON
Donnelley Financial EGV gopad0dc 5*ESS 0C
VDI-W7-PFD-037812.9.12.0
bar4
Page 1 of 1
> Market risk
Santander UK plc 97
We classify assets or liabilities as trading market risk (in total or just in part) as follows:
Balance sheet classification Market risk classification
Trading assets and liabilities We classify all our trading portfolios as trading market risk. Following the implementation of our ring-
fencing plans in 2018, the level of trading activity significantly reduced. Since then, we only classify
exposures from product sales or other activities with anticipated short holding periods, as well as any
related hedging, as trading market risk. For more, see Notes 11 and 23 to the Consolidated Financial
Statements.
Other financial assets and
liabilities at fair value through
profit or loss
We classify all our financial assets designated at fair value as banking market risk. We classify our
warrant programmes and structured customer deposits as trading market risk. This is because we
manage them on a fair value basis. We classify all our other financial liabilities designated at fair
value as banking market risk. For more, see Notes 13 and 24 to the Consolidated Financial
Statements.
Derivative financial instruments For accounting purposes, we classify derivatives as held for trading unless they are designated as
being in a hedging relationship. We treat derivatives that we do not manage on a trading intent basis
as banking market risk. For more, see Note 12 to the Consolidated Financial Statements.
BANKING MARKET RISK
OUR KEY BANKING MARKET RISKS (UNAUDITED)
Banking market risk mainly comes from providing banking products and services to our customers, as well as our structural balance sheet
exposures. It arises in all our business segments. In Retail Banking and Corporate & Commercial Banking, it is a by-product of us writing
customer business and we transfer most of these risks to Corporate Centre to manage. The only types of banking market risk that we keep
in Retail Banking and Corporate & Commercial Banking are short-term mismatches due to forecasting variances in prepayment and launch
risk. This is where customers repay their loans at a different point than their expected maturity date or do not take the expected volume of
new products. In Corporate & Investment Banking, it arises from short-term markets and lending to corporates, which we also transfer to
Corporate Centre to manage. Corporate Centre also manages our structural balance sheet exposures, such as foreign exchange and
Income Statement volatility risk.
Our key banking market risks are:
Key risks Description
Interest rate risk Yield curve risk: comes from timing mismatches in repricing fixed and variable rate assets, liabilities and
off-balance sheet instruments. It also comes from investing non-rate sensitive liabilities in interest-earning
assets. We mainly measure yield curve risk with NIM and EVE sensitivities, which are measures that are
commonly used in the financial services industry. We also use other risk measures, like stress testing and
VaR, which we explain in the ‘Trading market risk management’ section that follows. Our NIM and EVE
sensitivities cover all the material yield curve risk in our banking book balance sheet.
Basis risk: comes from pricing assets using a different rate index to the liabilities that fund them. We are
exposed to basis risks associated with Base Rate, reserve rate linked assets we deposit with central
banks, the Sterling Overnight Index Average (SONIA) rate, and LIBOR rates of different terms.
Spread risks Spread risk arises when the value of assets or liabilities which are accounted for at fair value (either
through Other Comprehensive Income or though Profit and Loss) are affected by changes in the spread.
We measure these spreads as the difference between the discount rate we use to value the asset or
liability, and an underlying interest rate curve. Spread risks can be split into Swap Spread (where the
instrument has been issued by a Sovereign counterparty) and Credit Spread (where the instrument has
been issued by for example a corporate or bank counterparty). It principally arises in the bond portfolios
we hold for liquidity purposes.
We measure spread risk with sensitivities, stress tests, and VaR measures.
Foreign exchange risk Our non-trading businesses operate mainly in sterling markets, so we do not create significant foreign
exchange exposures. The only exception to this is money we raise in foreign currencies. For more on this,
see ‘Wholesale funding’ in the ‘Liquidity risk’ section.
Income statement
volatility risk
We measure most of the assets and liabilities in our banking book balance sheet at amortised cost. We
sometimes manage their risk profile by using derivatives. As all derivatives are accounted for at fair value,
the mismatch in their accounting treatment can lead to volatility in our Income Statement. This happens
even if the derivative is an economic hedge of the asset or liability.
BANKING MARKET RISK MANAGEMENT
Risk appetite
Our framework for dealing with market risk is part of our overall Risk Framework. The banking market risk framework sets out our high-
level arrangements and standards to manage, control and oversee banking market risk. Our Risk Appetite sets the controls, risk limits and
key risk metrics for banking market risk. We articulate risk appetite by the income and value sensitivity limits we set in our Risk Appetite, at
both Santander UK and Banco Santander group levels.
Risk measurement (unaudited)
For banking market risk, we mainly measure our exposures with NIM and EVE sensitivity analysis. We support this with the risk measures
we explain in the ‘Trading market risk management’ section that follows. We also monitor our interest rate repricing gap.
ˆ200G2Mlv!2PtiY&6tŠ200G2Mlv!2PtiY&6t
628340 TX 98SANTANDERFORM 20-F (SAN UK PL
03-Mar-2019 00:42 ESTHTMLON
Donnelley Financial EGV ramus0dc 7*ESS 0C
VDI-W7-PFD-008912.9.12.0
Page 1 of 1
Annual Report 2018 | Risk review
NIM and EVE sensitivities
The calculations for NIM and EVE sensitivities involve many assumptions, including expected customer behaviour (such as early repayment of loans) and
how interest rates may move. These assumptions are a key part of our overall control framework, so we update and review them regularly. Our NIM and
EVE sensitivities include the interest rate risk from all our banking book positions. Our banking book positions generate almost all our reported net interest
income.
NIM sensitivity
– NIM sensitivity is an income-based measure we use to forecast the changes to interest income and interest expense in different scenarios. It gives us
a combined impact on net interest income over a given period – usually 12 or 36 months.
– We calculate NIM sensitivity by simulating the NIM using two yield curves. The difference between the two NIM totals is the NIM sensitivity.
– Our main model assumptions are that:
– The balance sheet is dynamic. This means that it includes the run-off of current assets and liabilities as well as retained and new business
– We use a behavioural balance sheet rather than contractual one. This means that we adjust balances for behavioural or assumed profile. We do
this with most retail products whose behavioural maturity is different to the contractual maturity. This is usually because customers are exercising
the option to withdraw or prepay early, or there is no contractual maturity.
EVE sensitivity
– We calculate EVE as the change in the net present value of all the interest rate sensitive items in the banking book balance sheet for a defined set of
instantaneous parallel and non-parallel shifts in the yield curve.
– We use a static balance sheet. This means that all balance sheet items run-off according to their contractual, behavioural or assumed run-off
behaviour (whichever is appropriate), and there is no retained or new business.
The limitations of sensitivities
We use sensitivities to measure the impact of standard, instantaneous, parallel shifts in relevant yield curves. The advantage of using standard parallel
shifts is they generally give us a constant measure of the size of our market risk exposure, with a simple and consistent stress. This compares to specific
scenarios like ‘flat rates’. The magnitude of flat rates depends on the shape of the current curve and the shift required to reach the flat rate scenario. There
is one exception to the relative simplicity of parallel shifts. In order to limit negative interest rates, the yield curve may be ‘floored’. Using material parallel
shocks does not always seem realistic, or it might not necessarily test the scenarios that have the most impact on us. So we run non-parallel stress tests
too, to calculate the impact of some plausible non-parallel scenarios, and over various time periods for income stresses (usually one or three years).
Other ways of measuring risk
As well as using sensitivities and stress tests, we can measure banking market risk using net notional positions. This can give us a simple expression of
our exposure, although it generally needs to be combined with other risk measures to cover all aspects of a risk profile, such as projected changes over
time.
Other metrics we can use include VaR and Earnings at Risk (EaR). VaR can be useful because it captures changes in economic values, as we describe in
the Trading market risk section below. However, VaR will not reflect the actual impact of most of our banking book assets and liabilities on our Income
Statement. This is because we account for them at amortised cost rather than fair value. EaR is similar to VaR but captures changes in income rather than
value. We use this approach mainly to generate a one-year EaR measure to assess Basis risk.
Stress testing
We use stress testing of market risk factors to complement the risk measurement we get from standard sensitivities.
Stress testing scenarios
Simple stress tests (like parallel shifts in relevant curves) give us clear measures of risk control and a consistent starting point for setting limits. More
complex, multi-factor and multi-time period stress tests can give us information about specific potential events. They can also test various outcomes that
we might not capture through parallel stresses or VaR-type measures because of data or model limitations. We can also use stress tests to estimate
losses in extreme market events beyond the confidence level used in VaR models. We can adapt our stress tests to reflect current concerns such as
Brexit and other macroeconomic events or changing market conditions quicker than we can with other risk measures, like VaR. We can include both
individual business area stresses and Santander UK-wide scenarios.
We can produce stress tests using either income or value measures. They cover one or more categories of exposures accounted for on an accruals basis
or at fair value. We use expert judgement to define appropriate hypothetical stress tests and any adjusting assumptions based on the balance sheet,
management actions and customer behaviour.
How we use stress testing
We discuss stress testing results at senior management committees. They affect Corporate Centre’s decisions by highlighting possible risks in the banking
book and the effectiveness of remedial actions we could take. We compare stress test results with stress limits and triggers set by our internal committees,
or against metrics set by the PRA. If the results are over our limits or triggers, we take remedial actions and follow an escalation process.
Risk mitigation (unaudited)
We mitigate Income Statement volatility mainly through hedge accounting. We monitor any hedge accounting ineffectiveness that might lead to Income
Statement volatility with a VaR measure and trigger, reported monthly. For our accounting policies for derivatives and hedge accounting, see Note 1 to the
Consolidated Financial Statements. We typically hedge the interest rate risk of the securities we hold for liquidity and investment purposes with interest
rate swaps, retaining spread exposures. These retained exposures are the key drivers of the VaR and stress tests we use to assess the risk of the
portfolio.
We hedge our foreign currency funding positions back to sterling, so our foreign exchange positions tend to be residual exposures that remain after
hedging. These positions could be, for example, to ‘spot’ foreign exchange rates or to cross currency basis. We monitor foreign exchange risk against
absolute net exposures and VaR-based limits and triggers. For more, see ‘Our funding strategy and structure’ and ‘Term issuance’ in the ‘Liquidity risk’
section.
Risk monitoring and reporting (unaudited)
We monitor the banking market risks of the portfolios we hold for liquidity and investment purposes using sensitivities, VaR and stress tests. We report
them against limits and triggers to senior management daily and to ALCO and ERCC each month. The VaR we report captures all key sources of volatility
(including interest rate and spread risks) to fully reflect the potential volatility.
98 Santander UK plc
ˆ200G2Mlv!2QFnr@6GŠ200G2Mlv!2QFnr@6G
628340 TX 99SANTANDERFORM 20-F (SAN UK PL
03-Mar-2019 02:00 ESTHTMLON
Donnelley Financial EGV shanv1dc 5*ESS 0C
VDI-W7-PFL-091012.9.12.0
bar4
Page 1 of 1
> Market risk
Santander UK plc 99
BANKING MARKET RISK REVIEW
2018 compared to 2017 (unaudited)
The reduction in NIM sensitivities in 2018 was largely driven by higher levels of the yield curve over the year and the base rate rise in
August 2018. The NIM sensitivities also reflect balance sheet management activities undertaken to manage the net structural position of
the business. Each year, we periodically review our risk models and metrics including underlying modelling assumptions to ensure they
continue to reflect the risks inherent in the current rate environment and incorporate regulatory expectations. These changes in our
underlying assumptions for risk measurement purposes also contributed to the movements in 2018.
The movement in EVE sensitivities in 2018 was mainly due to the balance sheet management activities, changes in our underlying
modelling assumptions for risk measurement purposes, and the yield curve movements mentioned above.
The basis risk EaR in 2018 remained broadly stable.
Interest rate risk
Yield curve risk
The table below shows how our base case income and valuation would be affected by a 50 basis point parallel shift (both up and down)
applied instantaneously to the yield curve at 31 December 2018 and 2017. Sensitivity to parallel shifts represents the amount of risk in a
way that we think is both simple and scalable. 50 basis points is the stress we typically focus on for banking market risk controls, although
we also monitor sensitivities to other parallel and non-parallel shifts as well as scenarios.
2018 2017
+50bps -50bps +50bps -50bps
£m £m £m £m
NIM sensitivity 207 (23) 212 (125)
EVE sensitivity (unaudited) 162 (124) 95 (213)
Basis risk (unaudited)
We report basis risk using the EaR approach.
2018 2017
£m £m
Basis risk EaR 25 24
Interest rate repricing gap (unaudited)
The table below shows the interest rate repricing gap of our balance sheet by repricing buckets.
3 months 1 year 3 years 5 years >5 years Not sensitive Total
2018 £m £m £m £m £m £m £m
Assets 128,173 46,354 61,946 26,048 13,705 16,607 292,833
Liabilities 194,362 16,762 23,987 13,508 23,345 23,845 295,809
Off-balance sheet 11,096 (12,204) (2,731) 6,870 (55) – 2,976
Net gap (55,093) 17,388 35,228 19,410 (9,695) (7,238) –
2017
Assets 142,195 34,661 59,253 18,746 15,453 16,782 287,090
Liabilities 178,179 18,003 25,487 17,746 25,559 24,801 289,775
Off-balance sheet (10,383) (3,025) 4,364 5,636 6,093 – 2,685
Net gap (46,367) 13,633 38,130 6,636 (4,013) (8,019) –
Spread risks (unaudited)
The table below shows the risk metrics covering the portfolios of securities held for liquidity and investment purposes.
2018 2017
£m £m
VaR 4 3
Worst three month stressed loss 190 193
ˆ200G2Mlv!2auvL$gÅŠ200G2Mlv!2auvL$g¯
628340 TX 100SANTANDERFORM 20-F (SAN UK PL
04-Mar-2019 03:21 ESTHTMLON
Donnelley Financial EGV annas1dc 7*ESS 0C
VDI-W7-PFD-029812.9.12.0
Page 1 of 1
Annual Report 2018 | Risk review
TRADING MARKET RISK
OUR KEY TRADING MARKET RISKS (UNAUDITED)
Our main exposure to trading market risk is in Corporate & Investment Banking and it is an inherent part of providing financial services for our customers. Our exposures are mainly affected by market movements in interest rates, credit spreads, and foreign exchange. We have no exposures in Retail Banking, Corporate & Commercial Banking or Corporate Centre. Trading market risk can reduce our net income. Its effect can be seen in our Consolidated Income Statement, where it appears in the ‘Net trading and other income’ line, under ‘Net trading and funding of other items by the trading book’.
The impact of ring-fencing
As part of our ring-fencing plans, activities that can no longer be served by a ring-fenced bank were migrated to the Banco Santander London Branch in 2018. This resulted in most of our market-making activity and the associated trading market risk being transferred outside of the Santander UK group. The implementation of ring-fencing changed our trading market risk profile at 31 December 2018, which can be seen in our VaR disclosures. At 31 December 2018, only a small amount of trading market risk from permitted products and permitted customers remains in the Santander UK ring-fenced bank.
The ring-fenced bank has two trading desks, the Link Desk and Retailed Structured Products (RSP) Desk. The Link Desk is a multi-asset trading desk facilitating the trading of ring-fenced bank permissible products (vanilla products) for those clients served by our CIB division. The aim of the desk is to provide a platform for CIB activity within the ring-fenced bank. The desk operates under an appropriate governance framework to ensure all activity adheres to ring-fencing legislation. The Link Desk will enter into hedging transactions with Relevant Financial Institutions, in accordance with ring-fencing legislation. The RSP desk provides a channel to sell CIB hedged investments (such as ISAs and other notes) to retail investors, through our UK branches and elsewhere. Notes are issued by Santander UK plc and hedged with Relevant Financial Institutions, in accordance with ring-fencing legislation. This RSP activity raises funding for the Santander UK group. There is low trading market risk associated with the trading activity as notes are hedged and a price is made before any client transaction which reflects the live execution prices of all hedge and funding unwinds.
Following the implementation of our ring-fencing plans, the majority of trading market risk is now from hedging activity and back-to-back trading, with generally smaller-sized client trading and negligible position-taking. As a result of this reduced activity, we expect to significantly reduce our trading market risk limits for 2019.
As a result of ring-fencing, and in response to the significant reduction in trading market risk in Santander UK and the corresponding reduction in market risk-related capital, we applied for and received approval from the ECB and PRA to decommission our Internal Model effective from 1 January 2019. The permission for an internal model was for certain trading book activity that has now been closed. For more on our Internal Model, see the ‘Capital requirement measures’ section below.
TRADING MARKET RISK MANAGEMENT Risk appetite
Our framework for dealing with market risk is part of our overall Risk Framework. The market risk Framework sets out our high-level arrangements and minimum standards for managing, controlling and overseeing trading market risk. Our Risk Appetite sets the controls, risk limits and key risk metrics for trading market risk. The key risk metrics include a stress economic loss limit and risk-factor stress scenarios. We report these key metrics to the BRC and the ERCC each month.
Risk measurement (unaudited)We have a range of ways of measuring trading market risk, but one of the most important is a statistical measure based on a historical simulation of events called ‘Value at Risk’ (VaR).
VaR
VaR
– VaR shows the losses that we might suffer because of unfavourable changes in the markets under normal non-stressed market conditions.
– To calculate VaR we run a historical simulation, at a given confidence level, over a specified time period. We use one or two years of daily price history, with each day given equal weighting.
– This means we include most market risk factors that could make a difference, and it gives us a consistent way of assessing risk for all these factors in all our portfolios.
– We work with three main types of VaR, which all use the same calculation models. They are Internal VaR, Regulatory VaR and Stressed VaR. We have governance and controls for all forms of VaR, and we regularly review and assess them.
Internal VaR
– We use this to calculate the total VaR in our trading book. It covers all the risk asset classes: interest rate, equity, credit (spread) and foreign exchange. We use two years of data for this simulation.
– Like the rest of Banco Santander, we use a time horizon of one day and a confidence level of 99%. For any given day’s trading position, we would expect to suffer losses greater than the VaR estimate 1% of the time – once every 100 trading days, or two to three times a year.
– For Internal VaR, we also calculate a time-weighted VaR using Banco Santander’s method. This gives more weight to the most recent days in the last two years, which means VaR changes more quickly in line with current market volatility. That gives us a better indication of how the market’s behaviour is changing, mitigating some limitations of VaR.
– We measure Internal VaR every day, comparing the equally-weighted result with the time-weighted result and report the higher against the Santander UK and business unit level limits. The Santander UK limits were previously approved by the ERCC. Following the completion of the ring-fencing transfer scheme and the significant reduction in trading book activity, the Santander UK limits are now approved by the Market and Structural Risk Control Forum rather than ERCC. We also report our equally weighted VaR against asset class and individual desk level limits. Whenever we find a limit has been exceeded, we report it, following the market risk framework. The main classes of risk that we measure Internal VaR on are interest rate, equity and credit spread risks.
100 Santander UK plc
ˆ200G2Mlv!2P%#yLg<Š200G2Mlv!2P%#yLg<
628340 TX 101SANTANDERFORM 20-F (SAN UK PL
03-Mar-2019 01:20 ESTHTMLON
Donnelley Financial EGV ramus0dc 4*ESS 0C
VDI-W7-PFD-008912.9.12.0
bar4
Page 1 of 2
> Market risk
Regulatory VaR and Stressed VaR
– We use these VaR models to calculate how much capital we need to hold for trading market risk. For these calculations, we only look at the factors for which we hold approval from the ECB and PRA (as we operate under their joint supervision). For credit and foreign exchange – factors which are not approved by the PRA for our VaR capital models – we use the standardised approach to calculate how much capital to hold. We also use the standardised approach for the ring-fenced bank. For more on this, see the ‘Capital requirement measures’ section.
– For Regulatory VaR, we use a time horizon of ten days and a confidence level of 99%. To calculate the ten-day time horizon, we use the one-day VaR multiplied by the square root of ten. This is the industry standard approach to scaling known as the ‘square root of time’ approach. We use the same two years of history as with Internal VaR. Stressed VaR is the same, except that we use only one year of history, from a time when markets were stressed relative to our current portfolio.
The limitations of VaR Whilst VaR is a useful and important market standard measure of risk it does however have some limitations, these include:
– VaR assumes what happened in the past is a reliable way to predict what will happen in the future, which may not always be the case. – VaR is based on positions at the end of the business day so it doesn’t include intra-day positions. – VaR gives no guide to how big the loss could be on the 1% of trading days that it is greater than the VaR. – Using a time horizon of one day means VaR does not tell us everything about exposures that we cannot liquidate or hedge within a day,
or products with infrequent pricing or whose structures are more complex.
Back-testing – comparing VaR estimates with reality In order to check that the way we estimate VaR is reasonable, we back-test our one day 99% Internal and Regulatory VaR each day by comparing them against both actual and hypothetical profits and losses, using a one-day time horizon.
Back-testing allows us to identify exceptions – times when the predictions were out of line with what happened. We can then look for trends in these exceptions, which can help us decide whether we need to recalibrate our VaR model. The CRR sets out criteria for how many exceptions are acceptable in the Regulatory VaR model. The PRA’s Supervisory Statements clarify the requirements further. If there are five or more exceptions in 250 days, then points are added to our capital requirement multiplier.
It is not normally possible to back-test Stressed VaR, because it is not intended to tell us anything about our performance in normal conditions.
Stress testing
Stress testing is an essential part of our risk management. It helps us to measure and evaluate the potential impact on portfolio values of more extreme, although plausible, events or market moves.
Stress testing scenarios The scenarios we use for stress testing are outlined in our trading market risk appetite and are central to the monthly Board Risk Appetite reporting. The scenarios are also part of our daily processes for setting and monitoring risk management limits. We calculate the impact of over 100 scenarios on our CIB trading books each day. Over half of these are reported against limits, and we escalate any breaches. This could lead to our front office being asked to reduce risk. The others are not calibrated to the same severity – for instance to a much longer holding period or for a completely artificial scenario - and so are not in the same limit structure.
The scenarios we create are partly inspired by past events, like the global financial crisis. They also include plausible ways that unusual market conditions could occur in the future that impact interest rates, equity prices, exchange rates and credit spreads. Stress testing helps us to see how different amounts of liquidity in the markets would affect us in a stress event, such as an equity crash. It is important to makesure that the stress result we report is as realistic as possible. For more on how we design our scenarios for stress testing see ‘Stress Testing’ in the Risk Governance section.
How we use stress testing We use limits to manage how much risk we take. They are expressed as how much we could lose in a stress event. We need to make surethe effects of potential poor market conditions do not exceed the Risk Appetite set by the Board. We regularly inform senior managers, including the ERCC, and the BRC about the results of our stress calculations, based on our current positions.
Capital requirement measures
Whenever we make changes to our models, we assess their effect on our capital requirements. Sometimes that means we need to tell the PRA and ECB and get their approval before we can make the change.
Method Description
The Internal Models
Approach (IMA)
The PRA has given us permission to use the IMA, in line with CRR, and every three months the PRA reviews what we are doing. The IMA means we can use Regulatory and Stressed VaR and RNIV to calculate the trading market risk capital requirement for the risk factors and businesses that we have ECB and PRA approval for.
Following the implementation of the Ring-Fence Transfer Scheme, we applied to the ECB and PRA and received approval for a reverse extension application in order to decommission our IMA model from 1 January 2019. We no longer have any trading book positions on which to calculate IMA capital requirements. All other trading book positions in the ring-fenced bank are calculated using the standardised approach.
The standardised approach For risk factors and businesses not included in the IMA, we use the standardised approach set out by the CRR and PRA Supervisory Statements. At 31 December 2018, this amounted to 34% (2017: 11%) of our total market risk capital requirement. The increase is due to the lower level of total market risk capital from the IMA reduction at the year end.
Risk mitigation (unaudited)We manage and control trading market risk within clear parameters. We measure and monitor our risk exposures against these limits. There are specific levels that trigger relevant teams to take action or alert people in other functions. This means we can limit the impact of any negative market movements, while also improving our earnings. We keep the business units that originate trading market risk separate from the functions responsible for managing, controlling and overseeing risk.
Risk monitoring and reporting (unaudited)We document and maintain a complete set of written policies, procedures and processes to help identify, assess, manage and report trading market risk.

ˆ200G2Mlv!2P%#yLg<Š200G2Mlv!2P%#yLg<
628340 TX 101SANTANDERFORM 20-F (SAN UK PL
03-Mar-2019 01:20 ESTHTMLON
Donnelley Financial EGV ramus0dc 4*ESS 0C
VDI-W7-PFD-008912.9.12.0
bar4
Page 2 of 2
Santander UK plc 101
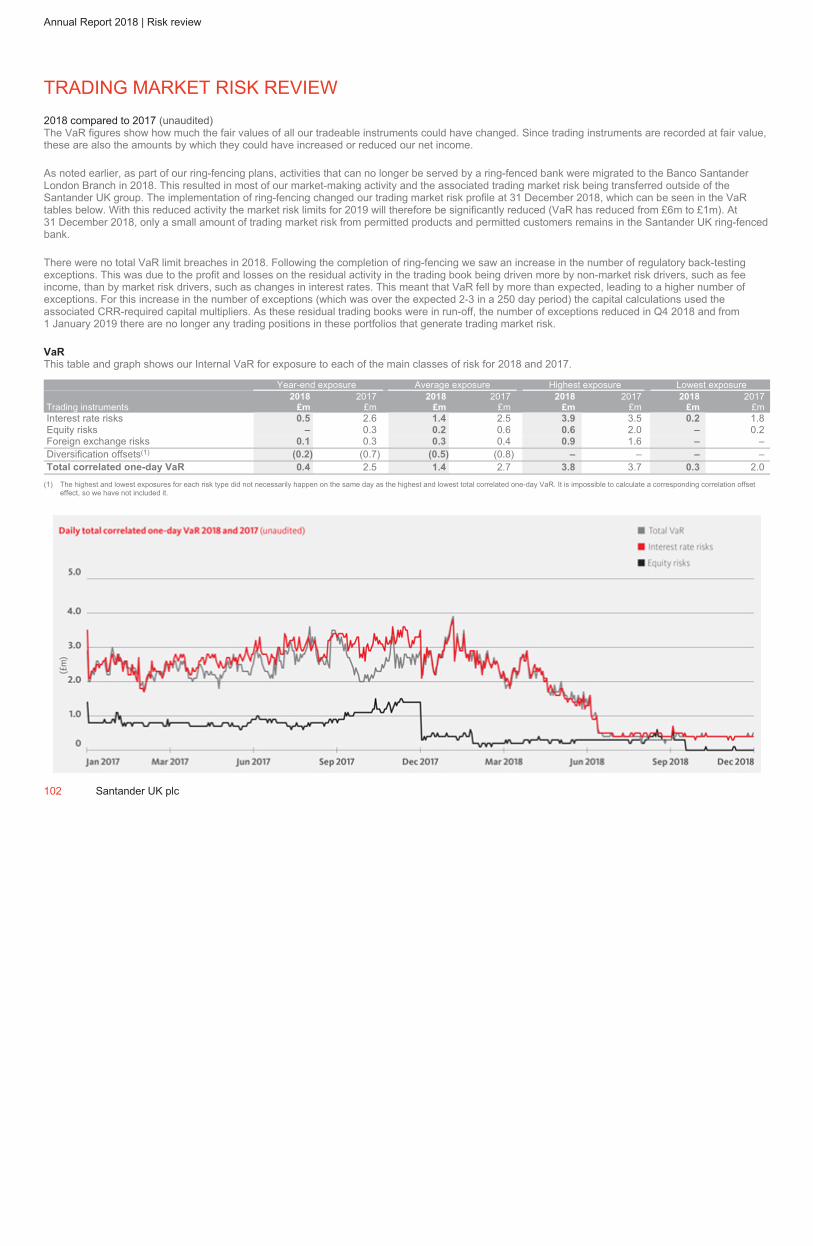
ˆ200G2Mlv!2Q345&gGŠ200G2Mlv!2Q345&gG
628340 TX 102SANTANDERFORM 20-F (SAN UK PL
03-Mar-2019 01:35 ESTHTMLON
Donnelley Financial EGV ramus0dc 5*ESS 0C
VDI-W7-PFD-008912.9.12.0
f102
Page 1 of 1
Annual Report 2018 | Risk review
TRADING MARKET RISK REVIEW
2018 compared to 2017 (unaudited)
The VaR figures show how much the fair values of all our tradeable instruments could have changed. Since trading instruments are recorded at fair value,
these are also the amounts by which they could have increased or reduced our net income.
As noted earlier, as part of our ring-fencing plans, activities that can no longer be served by a ring-fenced bank were migrated to the Banco Santander
London Branch in 2018. This resulted in most of our market-making activity and the associated trading market risk being transferred outside of the
Santander UK group. The implementation of ring-fencing changed our trading market risk profile at 31 December 2018, which can be seen in the VaR
tables below. With this reduced activity the market risk limits for 2019 will therefore be significantly reduced (VaR has reduced from £6m to £1m). At
31 December 2018, only a small amount of trading market risk from permitted products and permitted customers remains in the Santander UK ring-fenced
bank.
There were no total VaR limit breaches in 2018. Following the completion of ring-fencing we saw an increase in the number of regulatory back-testing
exceptions. This was due to the profit and losses on the residual activity in the trading book being driven more by non-market risk drivers, such as fee
income, than by market risk drivers, such as changes in interest rates. This meant that VaR fell by more than expected, leading to a higher number of
exceptions. For this increase in the number of exceptions (which was over the expected 2-3 in a 250 day period) the capital calculations used the
associated CRR-required capital multipliers. As these residual trading books were in run-off, the number of exceptions reduced in Q4 2018 and from
1 January 2019 there are no longer any trading positions in these portfolios that generate trading market risk.
VaR
This table and graph shows our Internal VaR for exposure to each of the main classes of risk for 2018 and 2017.
Year-end exposure Average exposure Highest exposure Lowest exposure
2018 2017 2018 2017 2018 2017 2018 2017
Trading instruments £m £m £m £m £m £m £m £m
Interest rate risks 0.5 2.6 1.4 2.5 3.9 3.5 0.2 1.8
Equity risks – 0.3 0.2 0.6 0.6 2.0 – 0.2
Foreign exchange risks 0.1 0.3 0.3 0.4 0.9 1.6 – –
Diversification offsets(1)
(0.2) (0.7) (0.5) (0.8) – – – –
Total correlated one-day VaR 0.4 2.5 1.4 2.7 3.8 3.7 0.3 2.0
(1) The highest and lowest exposures for each risk type did not necessarily happen on the same day as the highest and lowest total correlated one-day VaR. It is impossible to calculate a corresponding correlation offset
effect, so we have not included it.
102 Santander UK plc
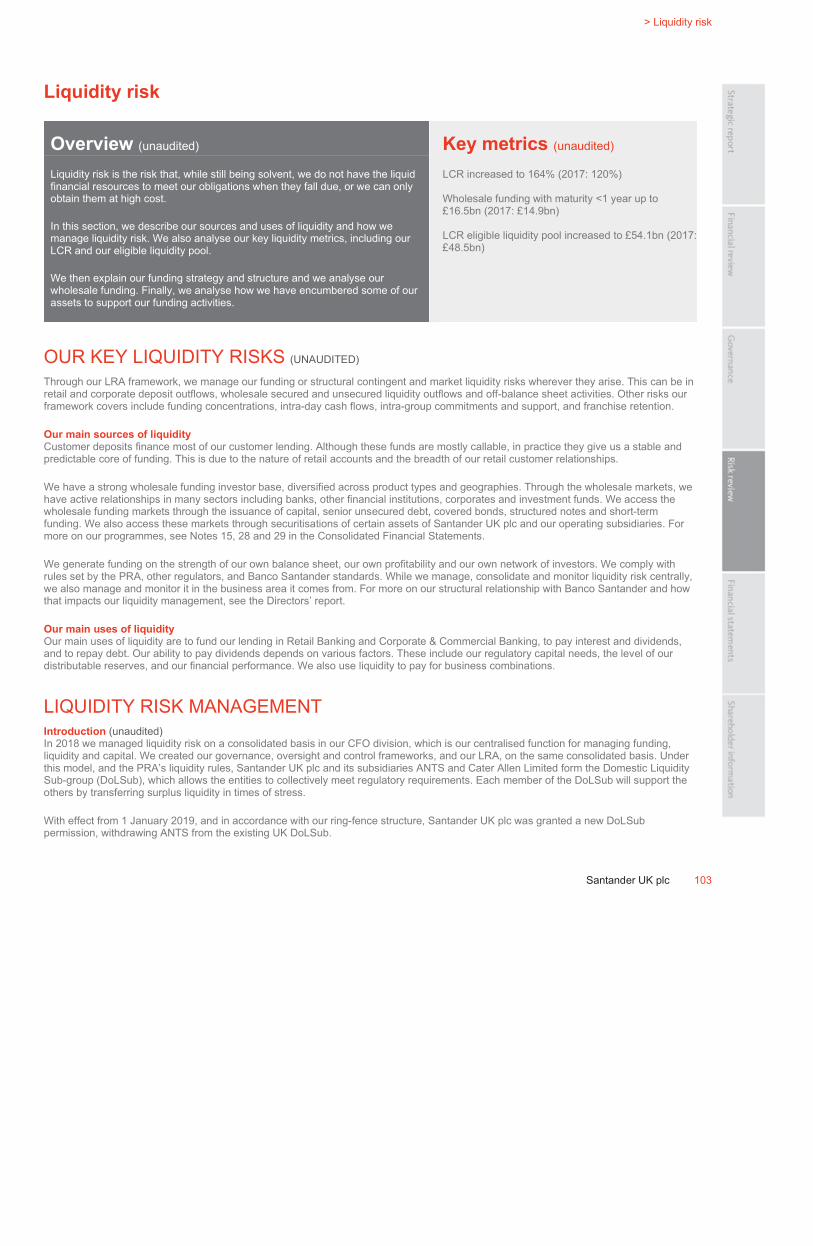
ˆ200G2Mlv!2aD@pGgJŠ200G2Mlv!2aD@pGgJ
628340 TX 103SANTANDERFORM 20-F (SAN UK PL
04-Mar-2019 02:45 ESTHTMLON
Donnelley Financial EGV annas1dc 9*ESS 0C
VDI-W7-PFD-029812.9.12.0
bar4
Page 1 of 1
> Liquidity risk
Santander UK plc 103
Liquidity risk
Overview (unaudited) Key metrics (unaudited)
Liquidity risk is the risk that, while still being solvent, we do not have the liquid
financial resources to meet our obligations when they fall due, or we can only
obtain them at high cost.
In this section, we describe our sources and uses of liquidity and how we
manage liquidity risk. We also analyse our key liquidity metrics, including our
LCR and our eligible liquidity pool.
We then explain our funding strategy and structure and we analyse our
wholesale funding. Finally, we analyse how we have encumbered some of our
assets to support our funding activities.
LCR increased to 164% (2017: 120%)
Wholesale funding with maturity <1 year up to
£16.5bn (2017: £14.9bn)
LCR eligible liquidity pool increased to £54.1bn (2017:
£48.5bn)
OUR KEY LIQUIDITY RISKS (UNAUDITED)
Through our LRA framework, we manage our funding or structural contingent and market liquidity risks wherever they arise. This can be in
retail and corporate deposit outflows, wholesale secured and unsecured liquidity outflows and off-balance sheet activities. Other risks our
framework covers include funding concentrations, intra-day cash flows, intra-group commitments and support, and franchise retention.
Our main sources of liquidity
Customer deposits finance most of our customer lending. Although these funds are mostly callable, in practice they give us a stable and
predictable core of funding. This is due to the nature of retail accounts and the breadth of our retail customer relationships.
We have a strong wholesale funding investor base, diversified across product types and geographies. Through the wholesale markets, we
have active relationships in many sectors including banks, other financial institutions, corporates and investment funds. We access the
wholesale funding markets through the issuance of capital, senior unsecured debt, covered bonds, structured notes and short-term
funding. We also access these markets through securitisations of certain assets of Santander UK plc and our operating subsidiaries. For
more on our programmes, see Notes 15, 28 and 29 in the Consolidated Financial Statements.
We generate funding on the strength of our own balance sheet, our own profitability and our own network of investors. We comply with
rules set by the PRA, other regulators, and Banco Santander standards. While we manage, consolidate and monitor liquidity risk centrally,
we also manage and monitor it in the business area it comes from. For more on our structural relationship with Banco Santander and how
that impacts our liquidity management, see the Directors’ report.
Our main uses of liquidity
Our main uses of liquidity are to fund our lending in Retail Banking and Corporate & Commercial Banking, to pay interest and dividends,
and to repay debt. Our ability to pay dividends depends on various factors. These include our regulatory capital needs, the level of our
distributable reserves, and our financial performance. We also use liquidity to pay for business combinations.
LIQUIDITY RISK MANAGEMENT
Introduction (unaudited)
In 2018 we managed liquidity risk on a consolidated basis in our CFO division, which is our centralised function for managing funding,
liquidity and capital. We created our governance, oversight and control frameworks, and our LRA, on the same consolidated basis. Under
this model, and the PRA’s liquidity rules, Santander UK plc and its subsidiaries ANTS and Cater Allen Limited form the Domestic Liquidity
Sub-group (DoLSub), which allows the entities to collectively meet regulatory requirements. Each member of the DoLSub will support the
others by transferring surplus liquidity in times of stress.
With effect from 1 January 2019, and in accordance with our ring-fence structure, Santander UK plc was granted a new DoLSub
permission, withdrawing ANTS from the existing UK DoLSub.
ˆ200G2Mlv!2R&BlD6ÈŠ200G2Mlv!2R&BlD6¨
628340 TX 104SANTANDERFORM 20-F (SAN UK PL
03-Mar-2019 06:09 ESTHTMLON
Donnelley Financial EGV dommj0dc 5*ESS 0C
VDI-W7-PFD-037612.9.12.0
Page 1 of 1
Annual Report 2018 | Risk review
Risk appetite
Our LRA statement is based on the principles of liquidity management we use to manage our balance sheet. It also supports our need to meet or exceed
the rules of our regulators. In line with our liquidity management principles, we avoid an over-reliance on funding from a single product, customer or
counterparty. We also maintain enough unencumbered customer assets to support current and future funding and collateral requirements, and maintain
enough capacity to monetise liquid assets and other counterbalancing capacity within an appropriate timeframe.
Our LRA is proposed to the Risk division and the Board, which is then approved under advice from the Board Risk Committee. Our LRA, in the context of
our overall Risk Appetite, is reviewed and approved by the Board each year, or more often if needed. From 1 January 2019, separate LRAs for Santander
UK plc and for ANTS plc have been approved. These are appropriate to their individual business models and consistent with the strategy of Santander UK
Group Holdings plc.
Risk measurement (unaudited)
We use a number of metrics to manage liquidity risk. These include metrics that show the difference between cash and collateral inflows and outflows in
different periods. They also include structural metrics, such as our level of encumbered assets.
Ongoing business management
Within our framework of prudent funding and liquidity management, we manage our activities to minimise our liquidity risk. We have clear responsibilities
for short-term funding, medium-term funding, encumbrance, collateral and liquid asset management. This ensures we manage liquidity risks as part of our
daily operations, strategy and planning.
Our liquidity management framework is split between short-term and strategic activities. Our short-term activities focus on intra-day collateral;
management and maintaining liquid assets to cover unexpected demands on cash in a stress scenario (such as large and unexpected deposit withdrawals
by customers and loss of wholesale funding). Our strategic activities focus on ensuring we are not over reliant on any one source for funding and that we
avoid excessive concentrations in the maturity of our funding.
We regularly test the liquidity of our eligible liquidity pool, in line with PRA and Basel rules. We do this by realising some of the assets through repurchase
or outright sale to the market. We make sure that over any 12-month period we realise a significant part of our eligible liquidity pool. As well as our eligible
liquidity pool, we hold a portfolio of unencumbered liquid assets at all times. Our LRA and PRA requirements determine the size and composition of this
portfolio. These assets give us a source of contingent liquidity, as we can realise some of them in a time of stress to create liquidity through repurchase or
outright sale to the market.
Stress testing
We have a liquidity stress test framework in place which is central to our LRA measurement and monitoring. It includes three severe but plausible stress
test scenarios. To fit with our risk appetite, the liquidity outflows that come from these stress tests must be fully covered with high-quality liquid assets,
other liquid assets and management actions sanctioned at the right level of governance. Additionally, a funding plan disruption stress scenario forms part
of our LRA monitoring.
Our Risk division runs a range of stress tests. Our LRA stress test is a combination of three test that cover idiosyncratic, market-wide and combined
scenarios. Our other tests consider scenarios such as a global economic slowdown that results in reduced confidence in the banking industry, a slowdown
in one of the major economies or a deterioration in the availability of liquidity. These are considered on both an acute and protracted basis. We also run
severe combined stress tests which look at both a deep and prolonged UK recession that results in a reduction in wholesale funding availability and a
simultaneous idiosyncratic shock that would lead to retail and commercial outflows.
We also conduct sensitivity analysis and reverse stress testing for instant liquidity shocks by each key liquidity risk. We do this to understand the impacts
they would have on our LRA and our regulatory liquidity metrics.
We monitor our LCR to ensure we continue to meet the requirements. Although the Basel Committee published its final Net Stable Funding Ratio (NSFR)
standards in October 2014, the NSFR has not yet been implemented within the EU (unlike the LCR). As such there is no formal NSFR requirement
applicable to UK or other EU banks until such time as the European Commission adopts appropriate regulatory and technical standards. Nonetheless, we
monitor our NSFR on an ongoing basis and stand ready to comply with the standards once agreed.
Risk mitigation (unaudited)
The Board aims to make our balance sheet resilient at all times and for it to be perceived as such by stakeholders. This preserves our short and long-term
viability. The Board recognises that as we are involved in maturity transformation, we cannot hold enough liquidity to cover all possible stress scenarios.
The Board requires us to hold enough liquidity to make sure we will survive three plausible but severe stress scenarios (our LRA stress). We do this by
maintaining a prudent balance sheet structure and approved liquid resources.
Recovery framework
In the event of a liquidity or capital stress, we have developed a series of actions outlined in our Recovery Plan. This enables us to respond to a wide
variety of stresses, from mild to severe, in a coordinated and efficient manner. Our Recovery Plan addresses how we would manage a capital or liquidity
stress. We would invoke it in response to triggers across a range of metrics falling outside threshold levels, or a qualitative assessment of potential serious
risks to our financial position and balance sheet strength. All of these metrics are part of our existing risk management processes. The Recovery Plan
would be invoked as early and proactively as possible in order to mitigate a stress with suitable actions.
The Recovery Plan is approved by the Board under advice from the Board Audit Committee and is subject to ongoing review and enhancement. The CFO
division manages the Recovery Plan and the operational continuity process.
Risk monitoring and reporting (unaudited)
We monitor liquidity risk daily, weekly and monthly. We do this through different committees and levels of management, including ALCO and the Board
Risk Committee.
104 Santander UK plc
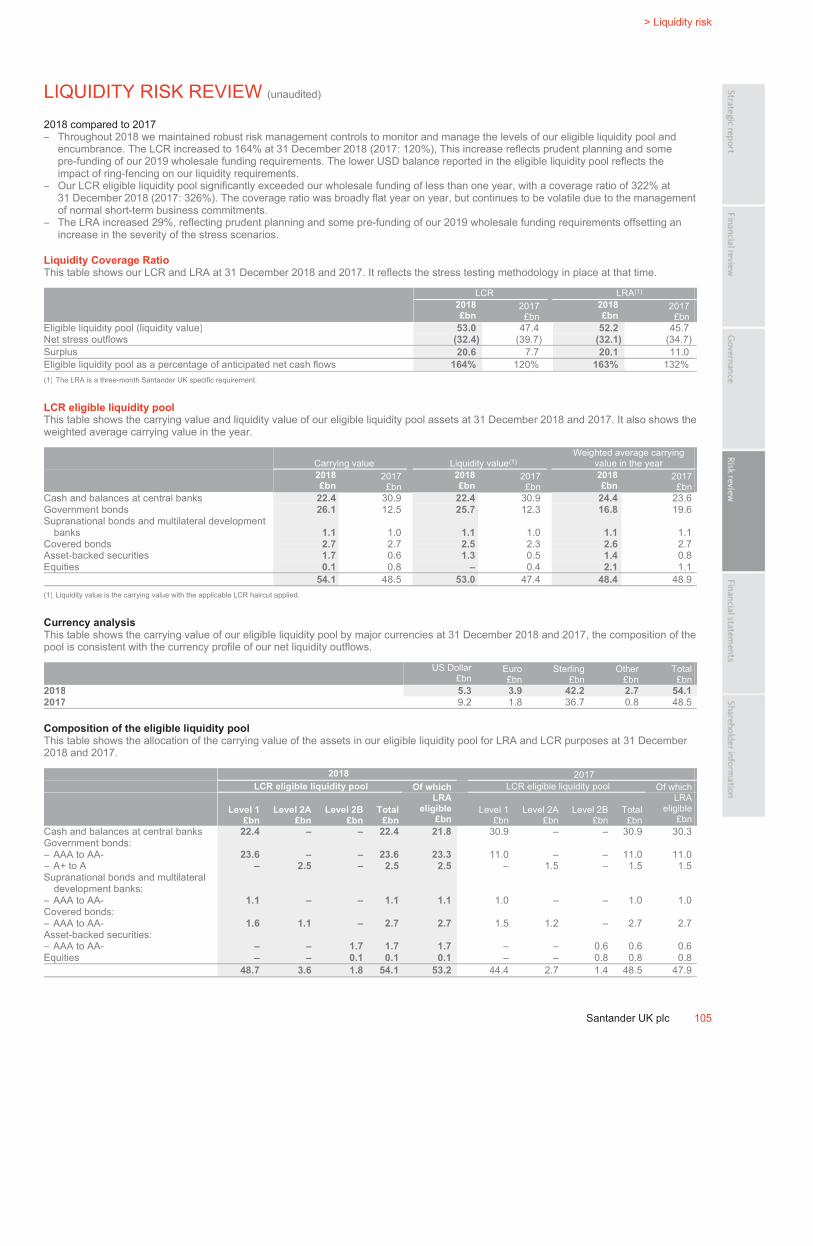
ˆ200G2Mlv!2QrdCK6OŠ200G2Mlv!2QrdCK6O
628340 TX 105SANTANDERFORM 20-F (SAN UK PL
03-Mar-2019 03:37 ESTHTMLON
Donnelley Financial EGV palap0dc 16*ESS 0C
VDI-W7-PFL-052912.9.12.0
bar4
Page 1 of 1
> Liquidity risk
Santander UK plc 105
LIQUIDITY RISK REVIEW (unaudited)
2018 compared to 2017 – Throughout 2018 we maintained robust risk management controls to monitor and manage the levels of our eligible liquidity pool and
encumbrance. The LCR increased to 164% at 31 December 2018 (2017: 120%), This increase reflects prudent planning and some pre-funding of our 2019 wholesale funding requirements. The lower USD balance reported in the eligible liquidity pool reflects the impact of ring-fencing on our liquidity requirements.
– Our LCR eligible liquidity pool significantly exceeded our wholesale funding of less than one year, with a coverage ratio of 322% at 31 December 2018 (2017: 326%). The coverage ratio was broadly flat year on year, but continues to be volatile due to the management of normal short-term business commitments.
– The LRA increased 29%, reflecting prudent planning and some pre-funding of our 2019 wholesale funding requirements offsetting an increase in the severity of the stress scenarios.
Liquidity Coverage Ratio
This table shows our LCR and LRA at 31 December 2018 and 2017. It reflects the stress testing methodology in place at that time.
LCR LRA(1)
2018
£bn
2017 £bn
2018
£bn
2017 £bn
Eligible liquidity pool (liquidity value) 53.0 47.4 52.2 45.7 Net stress outflows (32.4) (39.7) (32.1) (34.7) Surplus 20.6 7.7 20.1 11.0 Eligible liquidity pool as a percentage of anticipated net cash flows 164% 120% 163% 132% (1) The LRA is a three-month Santander UK specific requirement.
LCR eligible liquidity pool
This table shows the carrying value and liquidity value of our eligible liquidity pool assets at 31 December 2018 and 2017. It also shows the weighted average carrying value in the year.
Carrying value Liquidity value(1) Weighted average carrying
value in the year 2018
£bn
2017 £bn
2018
£bn
2017 £bn
2018
£bn
2017 £bn
Cash and balances at central banks 22.4 30.9 22.4 30.9 24.4 23.6 Government bonds 26.1 12.5 25.7 12.3 16.8 19.6 Supranational bonds and multilateral development
banks 1.1 1.0 1.1 1.0 1.1 1.1 Covered bonds 2.7 2.7 2.5 2.3 2.6 2.7 Asset-backed securities 1.7 0.6 1.3 0.5 1.4 0.8 Equities 0.1 0.8 – 0.4 2.1 1.1
54.1 48.5 53.0 47.4 48.4 48.9 (1) Liquidity value is the carrying value with the applicable LCR haircut applied.
Currency analysis
This table shows the carrying value of our eligible liquidity pool by major currencies at 31 December 2018 and 2017, the composition of the pool is consistent with the currency profile of our net liquidity outflows.
US Dollar£bn
Euro£bn
Sterling£bn
Other£bn
Total £bn
2018 5.3 3.9 42.2 2.7 54.1
2017 9.2 1.8 36.7 0.8 48.5
Composition of the eligible liquidity pool
This table shows the allocation of the carrying value of the assets in our eligible liquidity pool for LRA and LCR purposes at 31 December 2018 and 2017.
2018 2017LCR eligible liquidity pool Of which LCR eligible liquidity pool Of which
Level 1
£bn
Level 2A
£bn
Level 2B
£bn
Total
£bn
LRA
eligible
£bn
Level 1£bn
Level 2A£bn
Level 2B£bn
Total£bn
LRA eligible
£bn Cash and balances at central banks 22.4 – – 22.4 21.8 30.9 – – 30.9 30.3 Government bonds:– AAA to AA- 23.6 – – 23.6 23.3 11.0 – – 11.0 11.0 – A+ to A – 2.5 – 2.5 2.5 – 1.5 – 1.5 1.5 Supranational bonds and multilateral
development banks:– AAA to AA- 1.1 – – 1.1 1.1 1.0 – – 1.0 1.0 Covered bonds:– AAA to AA- 1.6 1.1 – 2.7 2.7 1.5 1.2 – 2.7 2.7 Asset-backed securities:– AAA to AA- – – 1.7 1.7 1.7 – – 0.6 0.6 0.6 Equities – – 0.1 0.1 0.1 – – 0.8 0.8 0.8
48.7 3.6 1.8 54.1 53.2 44.4 2.7 1.4 48.5 47.9
ˆ200G2Mlv!2R&TdPgUŠ200G2Mlv!2R&TdPgU
628340 TX 106SANTANDERFORM 20-F (SAN UK PL
03-Mar-2019 06:10 ESTHTMLON
Donnelley Financial EGV dommj0dc 6*ESS 0C
VDI-W7-PFD-037612.9.12.0
Page 1 of 1
Annual Report 2018 | Risk review
FUNDING RISK MANAGEMENT
Funding strategy (unaudited)
Our funding strategy continues to be based on maintaining a conservatively-structured balance sheet and diverse sources of funding to meet the need of
our business strategy and plans. The CFO Division maintains a funding plan and ensures it is compliant with the LRA and regulatory liquidity and capital
requirements.
Most of our funding comes from customer deposits. We source the rest from a mix of secured and unsecured funding in the wholesale markets. Overall,
this means that we do not rely too heavily on wholesale funds. We also have checks and controls to limit our asset encumbrance from our secured funding
operations. As part of maintaining a diverse funding base, we raise funding in a number of currencies, including euro and USD, and convert it into sterling
through currency swaps to fund our commercial assets which are largely sterling denominated.
Our base of stable retail and corporate deposits is a key funding source for us. We leverage our large and diverse customer base to offer products that
give us a long-term sustainable source of funding. We do this by focusing on building long-term relationships. Around 90% of our total core retail customer
liabilities are covered by the Financial Services Compensation Scheme (the FSCS).
Behavioural maturities
The contractual maturity of our balance sheet assets and liabilities highlights the maturity transformation that underpins the role of banks to lend long term,
but to fund themselves mainly with shorter-term liabilities, like customer deposits. We do this by diversifying our funding operations across a wide
customer base, both in numbers and by type of depositor. In practice, the behavioural profiles of many liabilities show more stability and longer maturity
than their contractual maturity. This is especially true of many types of retail and corporate deposits that, while they may be repayable on demand or at
short notice, have shown good stability even in times of stress. We model behaviour profiles using our experience of customer behaviour. We use this
data to determine the funds transfer pricing interest rates at which we reward and charge our business units for sources and uses of funds. We apply this
rate until a customer changes onto a different product or service offered by us or by one of our competitors.
We continue to improve the quality of our retail, commercial and wholesale deposits. We aim to deepen our customer relationships across all customer
segments. We do this to lengthen the contractual and behavioural profile of our liability base.
Deposit funding
We mainly fund our Retail Banking and Corporate & Commercial Banking activities by customer deposits. We fund the rest through wholesale markets.
Wholesale funding
Wholesale funding and issuance model (unaudited)
Banco Santander is a multiple point of entry resolution group. This means that should it fail, it would be split up into parts. Healthy parts might be sold or
be kept as a residual group without their distressed sister companies. The resolution or recapitalisation of the distressed parts might be effected via ‘bail
in’ of bonds that had been issued to the market by a regional intermediate holding company.
Santander UK is a single point of entry resolution group. This means that resolution would work downwards from the group’s holding company (i.e.
Santander UK Group Holdings plc). Losses in subsidiaries would first be transferred up to Santander UK Group Holdings plc. If the holding company is
bankrupt as a result, the group needs resolving. The ‘bail in’ tool is applied to the holding company, with the equity being written off and bonds written off
or converted into equity as needed to recapitalise the group. Those bondholders would become the new owners, and the group would stay together.
Santander UK Group Holdings plc is the immediate holding company of Santander UK plc and offers no guarantee to them. This structure is a Bank of
England recommended configuration which aims to resolve banks without disrupting the activities of their operating companies, thereby maintaining
continuity of services for customers.
Composition of wholesale funding (unaudited)
We are active in the wholesale markets and we have direct access to both money market and long-term investors through our funding programmes. This
makes our wholesale funding well diversified by product, maturity, geography and currency. This includes currencies available across a range of channels
from money markets, repo markets, senior unsecured, secured, medium-term and capital. For details of our main programmes, see the Funding
Information section of our website www.santander.co.uk/uk/about-santander-uk/investor-relations/funding-information.
Following the implementation of our ring-fencing plan, Santander UK plc is now our main operating company issuer of senior unsecured debt, structured
notes, short-term funding and covered bonds. Santander UK Group Holdings plc is the issuer of capital and MREL/Total Loss Absorbing Capacity (TLAC)
eligible senior unsecured debt.
We also access the wholesale markets through securitisations of certain assets of the Santander UK group’s operating subsidiaries. In addition, we have
access to UK Government funding schemes. Eligible collateral for these schemes includes all collateral that is eligible in the Bank of England’s Discount
Window Facility. We ensure that sufficient collateral is placed and available at the Discount Window.
106 Santander UK plc

ˆ200G2Mlv!2R&a2S63Š200G2Mlv!2R&a2S63
628340 TX 107SANTANDERFORM 20-F (SAN UK PL
03-Mar-2019 06:11 ESTHTMLON
Donnelley Financial EGV dommj0dc 9*ESS 0C
VDI-W7-PFD-037612.9.12.0
bar4
Page 1 of 1
> Liquidity risk
Santander UK plc 107
FUNDING RISK REVIEW
2018 compared to 2017 (unaudited)
– Together with our immediate parent, Santander UK Group Holdings plc, our overall funding strategy remains to develop and sustain a
diversified funding base. We also need to fulfil regulatory requirements as well as support our credit ratings. 2018 presented a
challenging market environment for issuance, debt capital markets experienced pockets of volatility throughout the year. However,
despite the continuing backdrop of global geo-political turbulence and the ongoing concerns around Brexit, the credit markets remained
open and we saw good demand from investors for high quality paper, though at wider credit spreads. The bulk of funding in 2018 was
done in the first half of the year, taking advantage of the more positive market conditions.
– In 2018, our total term funding was £17.1bn (2017: £11.8bn), of which £14.8bn (2017: £7.3bn) was medium-term issuance and £2.3bn
(2017: £4.0bn) was from the UK Government’s Term Funding Scheme (TFS).
– The £14.8bn medium-term funding included £2.7bn of downstreamed funding from issuances by our immediate parent (since 1 January
2019, Santander UK Group Holdings plc has downstreamed c.£8.7bn to Santander UK plc as ‘secondary non-preferential debt’ in line
with the MREL guidelines of the Bank of England, such debt is subordinated to our existing senior unsecured liabilities), £4.5bn of
senior unsecured notes, £4.3bn of covered bonds and £3.3bn of securitisations from the Company.
– Maturities in 2018 were £6.9bn (2017: £13.1bn). At 31 December 2018, 77% (2017: 75%) of wholesale funding had a maturity of
greater than one year, with an overall residual duration of 37 months (2017: 43 months). The total drawdown outstanding from the TFS
was £10.8bn (2017: £8.5bn) and the total drawdowns of UK Treasury Bills under the FLS were at £1.0bn (2017: £3.2bn).
– Our level of encumbrance from external and internal issuance of securitisations and covered bonds remained broadly static in 2018, as
planned.
Reconciliation of wholesale funding to the balance sheet
This table reconciles our wholesale funding to our balance sheet at 31 December 2018 and 2017.
Balance sheet line item
Repurchase Financial
Funding Deposits Deposits by
agreements
– non Trading
liabilities
designated
Debt
securities Subordinated Other equity
analysis by banks customers(1) trading(2) liabilities at fair value in issue liabilities instruments(3)
2018 £bn £bn £bn £bn £bn £bn £bn £bn £bn
Deposits 1.0 1.0 – – – – – – –
Certificates of deposit and
commercial paper 6.4 – – – – – 6.4 – –
Senior unsecured – public
benchmark 21.2 – 8.6 – – – 12.6 – –
– privately placed 4.0 – 0.1 – – 1.0 2.9 – –
Covered bonds 16.6 – – – – – 16.6 – –
Securitisation and structured
issuance 7.8 – 0.5 2.2 – – 5.1 – –
Term Funding Scheme 10.8 10.8 – – – – – – –
Subordinated liabilities and equity 5.0 – – – – – – 3.0 2.0
Total wholesale funding 72.8 11.8 9.2 2.2 – 1.0 43.6 3.0 2.0
Repos 10.8 – – 8.7 – 2.1 – – –
Foreign exchange and hedge
accounting 4.2 – 0.5 – – – 3.1 0.6 –
Other 8.6 5.4(4) – – – 3.2 – – –
Balance sheet total 96.4 17.2 9.7 10.9 – 6.3 46.7 3.6 2.0
2017
Deposits by banks 0.3 0.2 – – – 0.1 – – –
Certificates of deposit and
commercial paper 8.0 – – – – 0.4 7.6 – –
Senior unsecured – public
benchmark 17.8 – 6.0 – – – 11.8 – –
– privately placed 3.1 – – – – 1.1 2.0 – –
Covered bonds 14.2 – – – – – 14.2 – –
Securitisation and structured
issuance 5.5 – 0.5 1.0 – – 4.0 – –
Term Funding Scheme 8.5 8.5 – – – – – – –
Subordinated liabilities and equity 5.5 – – – – – – 3.2 2.3
Total wholesale funding 62.9 8.7 6.5 1.0 – 1.6 39.6 3.2 2.3
Repos 25.6 – – 0.1 25.5 – – – –
Foreign exchange and hedge
accounting 3.9 – 0.3 – – – 3.0 0.6 –
Other 10.3 4.0(4)
– – 5.6(5)
0.7 – – –
Balance sheet total 102.7 12.7 6.8 1.1 31.1 2.3 42.6 3.8 2.3
(1) This is included in our balance sheet total of £178,090m (2017: £183,648m).
(2) From 1 January 2018, the non-trading repurchase agreements that are held at amortised cost are now presented as separate lines in the balance sheet, as described in Note 1. Comparatives are
re-presented accordingly.
(3) Consists of £14m (2017: £14m) fixed/floating rate non-cumulative callable preference shares, £235m (2017: £235m) Step-up Callable Perpetual Reserve Capital Instruments and £1,756m (2017:
£2,046m) Perpetual Capital Securities. See Note 34 to the Consolidated Financial Statements.
(4) Other consists of items in the course of transmission and other deposits, excluding the TFS. See Note 26 to the Consolidated Financial Statements.
(5) Short positions in securities and unsettled trades, cash collateral and short-term deposits. See Note 23 to the Consolidated Financial Statements.
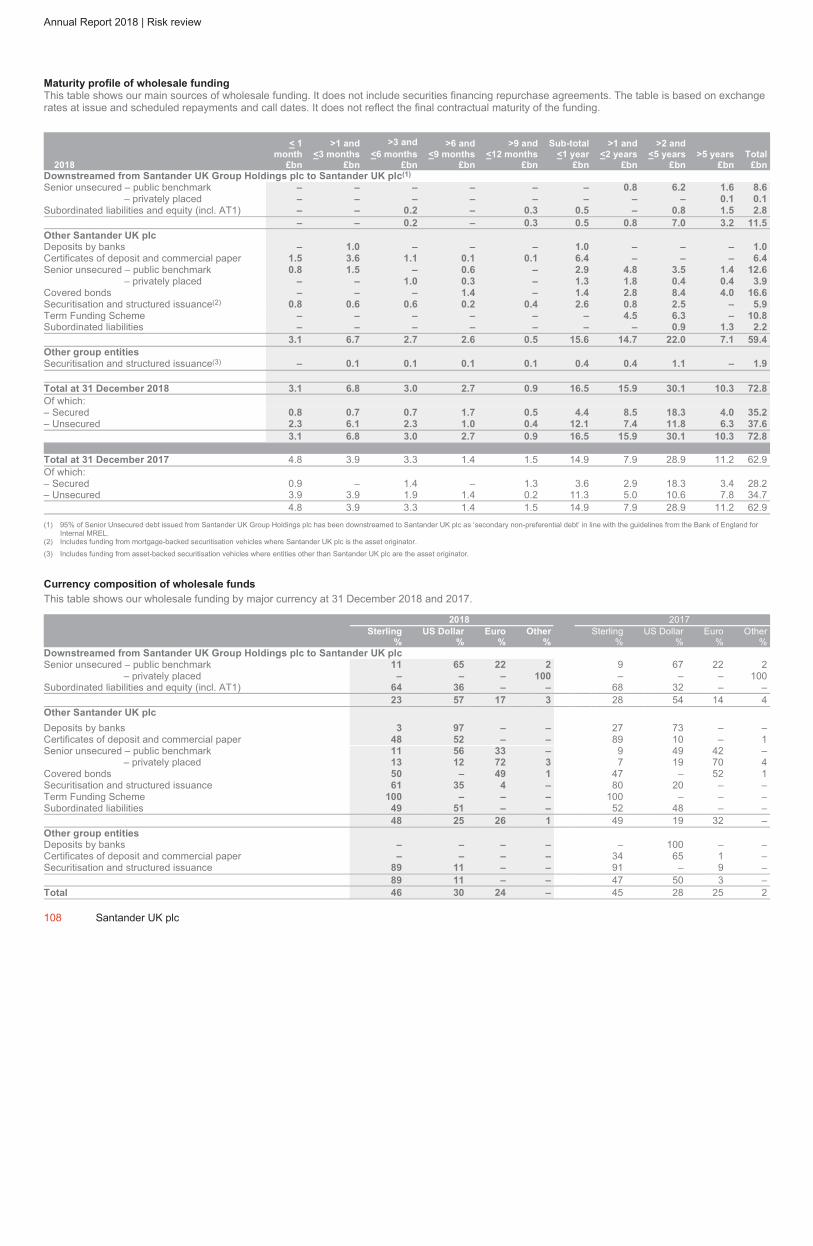
ˆ200G2Mlv!2S8eif6.Š200G2Mlv!2S8eif6.
628340 TX 108SANTANDERFORM 20-F (SAN UK PL
03-Mar-2019 06:29 ESTHTMLON
Donnelley Financial EGV dommj0dc 9*ESS 0C
VDI-W7-PFD-037612.9.12.0
Page 1 of 1
Annual Report 2018 | Risk review
Maturity profile of wholesale funding
This table shows our main sources of wholesale funding. It does not include securities financing repurchase agreements. The table is based on exchange
rates at issue and scheduled repayments and call dates. It does not reflect the final contractual maturity of the funding.
< 1 >1 and >3 and >6 and >9 and Sub-total >1 and >2 and
month <3 months <6 months <9 months <12 months <1 year <2 years <5 years >5 years Total
2018 £bn £bn £bn £bn £bn £bn £bn £bn £bn £bn
Downstreamed from Santander UK Group Holdings plc to Santander UK plc(1)
Senior unsecured – public benchmark – – – – – – 0.8 6.2 1.6 8.6
– privately placed – – – – – – – – 0.1 0.1
Subordinated liabilities and equity (incl. AT1) – – 0.2 – 0.3 0.5 – 0.8 1.5 2.8
– – 0.2 – 0.3 0.5 0.8 7.0 3.2 11.5
Other Santander UK plc
Deposits by banks – 1.0 – – – 1.0 – – – 1.0
Certificates of deposit and commercial paper 1.5 3.6 1.1 0.1 0.1 6.4 – – – 6.4
Senior unsecured – public benchmark 0.8 1.5 – 0.6 – 2.9 4.8 3.5 1.4 12.6
– privately placed – – 1.0 0.3 – 1.3 1.8 0.4 0.4 3.9
Covered bonds – – – 1.4 – 1.4 2.8 8.4 4.0 16.6
Securitisation and structured issuance(2)
0.8 0.6 0.6 0.2 0.4 2.6 0.8 2.5 – 5.9
Term Funding Scheme – – – – – – 4.5 6.3 – 10.8
Subordinated liabilities – – – – – – – 0.9 1.3 2.2
3.1 6.7 2.7 2.6 0.5 15.6 14.7 22.0 7.1 59.4
Other group entities
Securitisation and structured issuance(3) – 0.1 0.1 0.1 0.1 0.4 0.4 1.1 – 1.9
Total at 31 December 2018 3.1 6.8 3.0 2.7 0.9 16.5 15.9 30.1 10.3 72.8
Of which:
– Secured 0.8 0.7 0.7 1.7 0.5 4.4 8.5 18.3 4.0 35.2
– Unsecured 2.3 6.1 2.3 1.0 0.4 12.1 7.4 11.8 6.3 37.6
3.1 6.8 3.0 2.7 0.9 16.5 15.9 30.1 10.3 72.8
Total at 31 December 2017 4.8 3.9 3.3 1.4 1.5 14.9 7.9 28.9 11.2 62.9
Of which:
– Secured 0.9 – 1.4 – 1.3 3.6 2.9 18.3 3.4 28.2
– Unsecured 3.9 3.9 1.9 1.4 0.2 11.3 5.0 10.6 7.8 34.7
4.8 3.9 3.3 1.4 1.5 14.9 7.9 28.9 11.2 62.9
(1) 95% of Senior Unsecured debt issued from Santander UK Group Holdings plc has been downstreamed to Santander UK plc as ‘secondary non-preferential debt’ in line with the guidelines from the Bank of England for
Internal MREL.
(2) Includes funding from mortgage-backed securitisation vehicles where Santander UK plc is the asset originator.
(3) Includes funding from asset-backed securitisation vehicles where entities other than Santander UK plc are the asset originator.
Currency composition of wholesale funds
This table shows our wholesale funding by major currency at 31 December 2018 and 2017.
2018 2017
Sterling
%
US Dollar
%
Euro
%
Other
%
Sterling
%
US Dollar
%
Euro
%
Other
%
Downstreamed from Santander UK Group Holdings plc to Santander UK plc
Senior unsecured – public benchmark 11 65 22 2 9 67 22 2
– privately placed – – – 100 – – – 100
Subordinated liabilities and equity (incl. AT1) 64 36 – – 68 32 – –
23 57 17 3 28 54 14 4
Other Santander UK plc
Deposits by banks 3 97 – – 27 73 – –
Certificates of deposit and commercial paper 48 52 – – 89 10 – 1
Senior unsecured – public benchmark 11 56 33 – 9 49 42 –
– privately placed 13 12 72 3 7 19 70 4
Covered bonds 50 – 49 1 47 – 52 1
Securitisation and structured issuance 61 35 4 – 80 20 – –
Term Funding Scheme 100 – – – 100 – – –
Subordinated liabilities 49 51 – – 52 48 – –
48 25 26 1 49 19 32 –
Other group entities
Deposits by banks – – – – – 100 – –
Certificates of deposit and commercial paper – – – – 34 65 1 –
Securitisation and structured issuance 89 11 – – 91 – 9 –
89 11 – – 47 50 3 –
Total 46 30 24 – 45 28 25 2
108 Santander UK plc
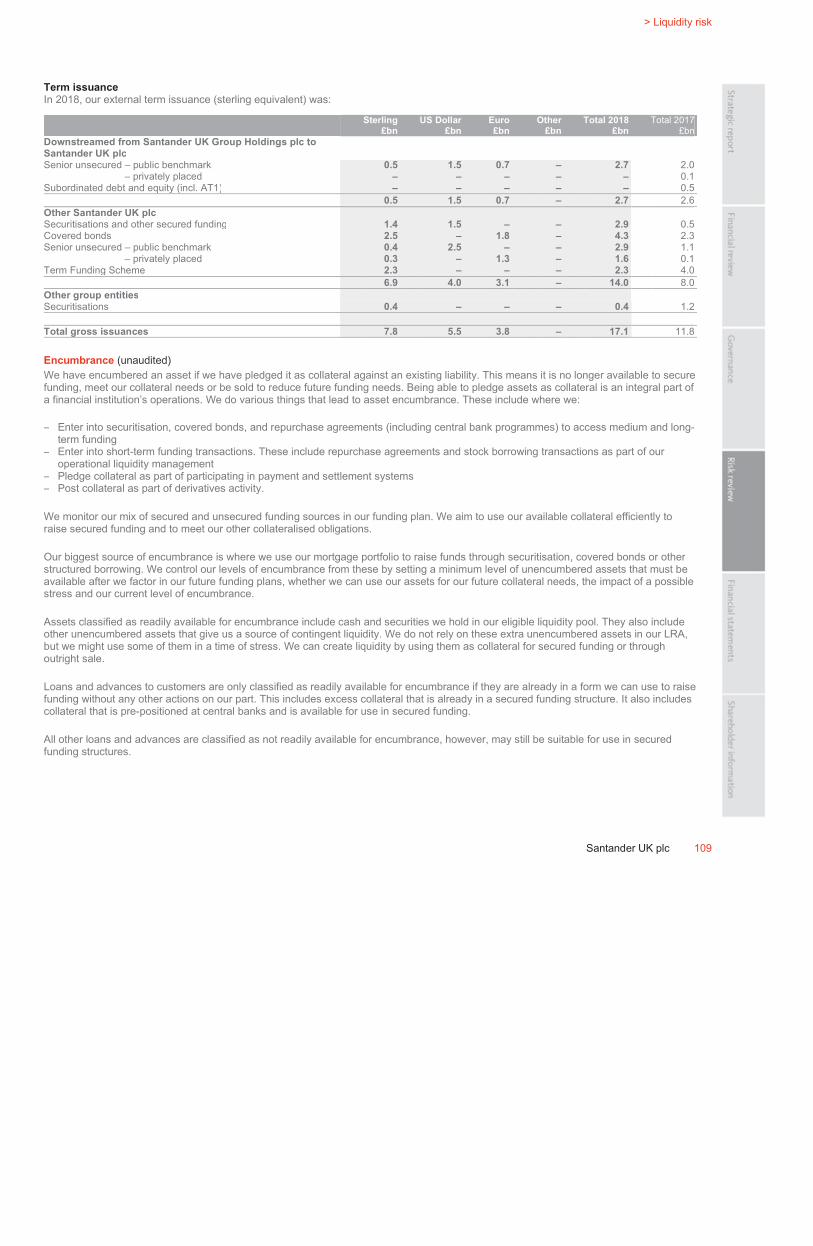
ˆ200G2Mlv!2Rmh@2g%Š200G2Mlv!2Rmh@2g%
628340 TX 109SANTANDERFORM 20-F (SAN UK PL
03-Mar-2019 05:32 ESTHTMLON
Donnelley Financial EGV manra0dc 9*ESS 0C
VDI-W7-PFL-165312.9.12.0
bar4
Page 1 of 1
> Liquidity risk
Santander UK plc 109
Term issuance
In 2018, our external term issuance (sterling equivalent) was:
Sterling
£bn
US Dollar
£bn
Euro
£bn
Other
£bn
Total 2018
£bn
Total 2017
£bn
Downstreamed from Santander UK Group Holdings plc to
Santander UK plc
Senior unsecured – public benchmark 0.5 1.5 0.7 – 2.7 2.0
– privately placed – – – – – 0.1
Subordinated debt and equity (incl. AT1) – – – – – 0.5
0.5 1.5 0.7 – 2.7 2.6
Other Santander UK plc
Securitisations and other secured funding 1.4 1.5 – – 2.9 0.5
Covered bonds 2.5 – 1.8 – 4.3 2.3
Senior unsecured – public benchmark 0.4 2.5 – – 2.9 1.1
– privately placed 0.3 – 1.3 – 1.6 0.1
Term Funding Scheme 2.3 – – – 2.3 4.0
6.9 4.0 3.1 – 14.0 8.0
Other group entities
Securitisations 0.4 – – – 0.4 1.2
Total gross issuances 7.8 5.5 3.8 – 17.1 11.8
Encumbrance (unaudited)
We have encumbered an asset if we have pledged it as collateral against an existing liability. This means it is no longer available to secure
funding, meet our collateral needs or be sold to reduce future funding needs. Being able to pledge assets as collateral is an integral part of
a financial institution’s operations. We do various things that lead to asset encumbrance. These include where we:
– Enter into securitisation, covered bonds, and repurchase agreements (including central bank programmes) to access medium and long-
term funding
– Enter into short-term funding transactions. These include repurchase agreements and stock borrowing transactions as part of our
operational liquidity management
– Pledge collateral as part of participating in payment and settlement systems
– Post collateral as part of derivatives activity.
We monitor our mix of secured and unsecured funding sources in our funding plan. We aim to use our available collateral efficiently to
raise secured funding and to meet our other collateralised obligations.
Our biggest source of encumbrance is where we use our mortgage portfolio to raise funds through securitisation, covered bonds or other
structured borrowing. We control our levels of encumbrance from these by setting a minimum level of unencumbered assets that must be
available after we factor in our future funding plans, whether we can use our assets for our future collateral needs, the impact of a possible
stress and our current level of encumbrance.
Assets classified as readily available for encumbrance include cash and securities we hold in our eligible liquidity pool. They also include
other unencumbered assets that give us a source of contingent liquidity. We do not rely on these extra unencumbered assets in our LRA,
but we might use some of them in a time of stress. We can create liquidity by using them as collateral for secured funding or through
outright sale.
Loans and advances to customers are only classified as readily available for encumbrance if they are already in a form we can use to raise
funding without any other actions on our part. This includes excess collateral that is already in a secured funding structure. It also includes
collateral that is pre-positioned at central banks and is available for use in secured funding.
All other loans and advances are classified as not readily available for encumbrance, however, may still be suitable for use in secured
funding structures.

ˆ200G2Mlv!2QFKBxg5Š200G2Mlv!2QFKBxg5
628340 TX 110SANTANDERFORM 20-F (SAN UK PL
03-Mar-2019 01:59 ESTHTMLON
Donnelley Financial EGV palap0dc 7*ESS 0C
VDI-W7-PFL-052912.9.12.0
Page 1 of 1
Annual Report 2018 | Risk review
Encumbrance of customer loans and advances
We have issued prime retail mortgage-backed and other asset-backed securitised products to a diverse investor base through our mortgage-backed and
other asset-backed funding programmes. We have raised funding with mortgage-backed notes, both issued to third parties and retained – the latter being
central bank eligible collateral for funding purposes in other Bank of England facilities. We also have a covered bond programme, under which we issue
securities to investors secured by a pool of residential mortgages.
For more on these programmes, see Notes 15 and 37 to the Consolidated Financial Statements.
On-balance sheet encumbered and unencumbered assets
Encumbered with counterparties other than
central banks Assets
Unencumbered assets not pre-positioned with central
banks
2018
Covered
bonds
£m
Securitis-
ations
£m
Other
£m
Total
£m
positioned
at central
banks(4)
£m
Readily
available
£m
Other
available
assets
£m
Cannot be
encumbered
£m
Total
£m
Total
assets
£m
Cash and balances at
central banks(1)(2)
– – 1,080 1,080 636 18,031 – – 18,667 19,747
Financial assets at FVTPL:
– Derivative financial
instruments – – – – – – – 5,259 5,259 5,259
– Other financial assets at
FVTPL – – – – – – – 5,617 5,617 5,617
Financial assets at
amortised cost:
– Loans and advances to
customers 21,240 14,454 256 35,950 52,497 71, 941 20,943 19,958 165,339 201,289
– Loans and advances to
banks – – 218 218 – – – 2,581 2,581 2,799
– Repurchase agreements-
non trading(3) – – – – – – – 21,127 21,127 21,127
– Other financial assets at
amortised cost – – 3,763 3,763 – 3,466 – – 3,466 7,229
Financial assets at FVOCI – – 5,825 5,825 – 7,477 – – 7,477 13,302
Interests in other entities – – – – – – – 88 88 88
Intangible assets – – – – – – – 1,808 1,808 1,808
Property, plant and
equipment – – – – – – 1,832 – 1,832 1,832
Current tax assets – – – – – – – 153 153 153
Retirement benefit assets – – – – – – – 842 842 842
Other assets – – – – – – – 2,280 2,280 2,280
Total assets 21,240 14,454 11,142 46,836 53,133 100,915 22,775 59,713 236,536 283,372
2017(5)
Cash and balances at
central banks(1)(2) – – 1,010 1,010 395 31,366 – – 31,761 32,771
Trading assets – – 17,092 17,092 – 903 – 12,560 13,463 30,555
Derivative financial
instruments – – – – – – – 19,942 19,942 19,942
Other financial assets at
FVTPL – – – – – 1,405 691 – 2,096 2,096
Loans and advances to
banks(3) – – 105 105 – – – 3,358 3,358 3,463
Loans and advances to
customers(3) 18,891 16,530 31 35,452 57,644 64,412 20,459 21,373 163,888 199,340
Repurchase agreements –
non trading(3)
– – – – – – – 2,614 2,614 2,614
Financial investments – – 6,755 6,755 – 10,856 – – 10,856 17,611
Interests in other entities – – – – – – – 73 73 73
Intangible assets – – – – – – – 1,742 1,742 1,742
Property, plant and
equipment – – – – – – 1,598 – 1,598 1,598
Retirement benefit assets – – – – – – – 449 449 449
Other assets – – – – – – – 2,511 2,511 2,511
Total assets 18,891 16,530 24,993 60,414 58,039 108,942 22,748 64,622 254,351 314,765
(1) Encumbered cash and balances at central banks include minimum cash balances we have to hold at central banks for regulatory purposes.
(2) Readily realisable cash and balances at central banks are amounts held at central banks as part of our liquidity management activities.
(3) From 1 January 2018, the non-trading repurchase agreements that are held at amortised cost are now presented as separate lines in the balance sheet, as described in Note 1. Comparatives are re-presented
accordingly.
(4) Comprises pre-positioned assets and encumbered assets.
(5) 2017 data has been restated as a result of enhancement to the internal methodology for reporting encumbered and unencumbered assets.
110 Santander UK plc
ˆ200G2Mlv!2Z%@utg=Š200G2Mlv!2Z%@utg=
628340 TX 111SANTANDERFORM 20-F (SAN UK PL
04-Mar-2019 01:37 ESTHTMLON
Donnelley Financial EGV gopad0dc 8*ESS 0C
VDI-W7-PFD-037812.9.12.0
bar4
Page 1 of 1
> Capital risk
Santander UK plc 111
Capital risk
Overview (unaudited) Key metrics (unaudited)
Capital risk is the risk that we do not have an adequate amount or quality
of capital to meet our internal business needs, regulatory requirements and
market expectations, including dividend and AT1 distributions.
In this section, we set out how we are regulated. We also give details of the
impact of IFRS 9 on regulatory capital. We explain how we manage capital
on a standalone basis as a subsidiary in the Banco Santander group.
We then analyse our capital resources and key capital ratios.
CET1 capital ratio of 13.2% (2017: 12.2%)
Total capital resources decreased to £15.9bn
(2017: £16.7bn)
THE SCOPE OF OUR CAPITAL ADEQUACY
Regulatory supervision
For capital purposes, we are subject to prudential supervision by the PRA, as a UK banking group, and by the European Central Bank
(ECB) as a member of the Banco Santander group. The ECB supervises Banco Santander as part of the Single Supervisory Mechanism
(SSM). Although we are part of the Banco Santander group, we do not have a guarantee from our ultimate parent Banco Santander SA
and we operate as an autonomous subsidiary. As we are part of the UK sub-group that is regulated by the PRA, we have to meet the PRA
capital requirements on a standalone basis. We also have to show the PRA that we can withstand capital stress tests without the support
of our parent. Reinforcing our corporate governance framework, the PRA exercises oversight through its rules and regulations on the
Board and senior management appointments. Santander UK Group Holdings plc is the holding company of Santander UK plc and is the
head of the Santander UK group for regulatory capital and leverage purposes. The basis of consolidation for our capital disclosures is
substantially the same as for our Consolidated Financial Statements. Following the implementation of our ring-fencing plans, with effect
from 1 January 2019 Santander UK plc is now the head of the ring-fenced bank sub-group and is subject to regulatory capital and leverage
rules.
CAPITAL RISK MANAGEMENT
The Board is responsible for capital management strategy and policy and ensuring that our capital resources are monitored and controlled
within regulatory and internal limits. We manage our funding and maintain capital adequacy on a standalone basis. We operate within the
capital risk framework and appetite approved by our Board. This reflects the commercial environment we operate in, our strategy for each
material risk and the potential impact of any adverse scenarios or stresses on our capital position.
Management of capital requirements
Our capital risk appetite aims to maintain capital levels appropriate to the level of stress applied, and the expected regulatory response. In:
– An adverse economic stress, which we might expect to occur once in 20 years, the firm should remain profitable and exceed all
regulatory capital minimums at all times.
– A very severe economic stress, which we might expect to occur once in 100 years, and which has been designed to test any specific
weaknesses of a firm’s business model, the firm should meet all regulatory capital minimums at all times. This is subject to the use of
regulatory buffers designed for such a stress.
Management of capital resources
We use a mix of regulatory and EC ratios and limits, internal buffers and restrictions to manage our capital resources. We also take
account of the costs of differing capital instruments and capital management techniques. We also use these to shape the best structure for
our capital needs. We decide how to allocate our capital resources as part of our strategic planning process. We base this in part on the
relative returns on capital using both economic and regulatory capital measures.
We plan for severe stresses and we set out what action we would take if an extremely severe stress threatened our viability and solvency.
This could include not paying dividends, selling assets, reducing our business and issuing more capital.
Risk measurement
We apply Banco Santander’s approach to capital measurement and risk management for CRD IV. As a result, Santander UK plc is
classified as a significant subsidiary of Banco Santander SA.
Key metrics (unaudited)
The main metrics we use to measure capital risk are:
Key risk metrics Description
CET1 capital ratio CET1 capital divided by RWAs.
Total capital ratio CRD IV end-point Tier 1 capital divided by RWAs.
Stress testing (unaudited)
Each year we create a capital plan, as part of our ICAAP. We also develop a series of macroeconomic scenarios to stress test our capital
needs, and confirm that we have enough regulatory capital to meet our projected and stressed capital needs and to meet our obligations
as they fall due. We augment our regulatory minimum capital with internally assigned buffers. We hold buffers to ensure we have enough
time to take action against unexpected movements.

ˆ200G2Mlv!2RSGc7gCŠ200G2Mlv!2RSGc7gC
628340 TX 112SANTANDERFORM 20-F (SAN UK PL
03-Mar-2019 04:57 ESTHTMLON
Donnelley Financial EGV shanv1dc 3*ESS 0C
VDI-W7-PFL-091012.9.12.0
Page 1 of 1
Annual Report 2018 | Risk review
Risk mitigation
We have designed our capital risk framework, policies and procedures to ensure that we operate within our risk appetite. We manage capital transferability
between our subsidiaries in line with our business strategy, our risk and capital management policies, and UK laws and regulations. There are no legal
restrictions on us moving capital resources promptly, or repaying liabilities, between the Company and its subsidiaries. For details on our Recovery
framework in the event of a capital stress, see the risk mitigation section in the ‘Liquidity risk’ section.
At 31 December 2018, Santander UK plc, ANTS and Cater Allen Limited, which are the three PRA-regulated entities within the Santander UK group, were
party to a capital support deed dated 23 December 2015 (the Capital Support Deed 2015) with Santander UK Group Holdings plc and certain other
non-regulated subsidiaries of Santander UK plc. The parties to the Capital Support Deed 2015 were permitted by the PRA to form a core UK group as
defined in the PRA Rulebook. Exposures of each of the three regulated entities to other members of the core UK group were exempt from large exposure
limits that would otherwise apply. The purpose of the Capital Support Deed 2015 was to facilitate the prompt transfer of available capital resources from,
or repayment of liabilities by, the non-regulated parties to any of the regulated parties in the event that one of the regulated parties breached or was at risk
of breaching its capital resources requirements or risk concentrations requirements.
The core UK group permission as supported by the Capital Support Deed 2015 expired on 31 December 2018. With effect from 1 January 2019, and in
accordance with our ring-fenced structure, Santander UK plc, Cater Allen Limited and certain other non-regulated subsidiaries within the ring-fenced bank
entered into a new Capital Support Deed dated 13 November 2018 (the RFB Sub-Group Capital Support Deed). From 1 January 2019, the parties to the
RFB Sub-Group Capital Support Deed were permitted by the PRA to form a new core UK group, a permission which will expire on 31 December 2021.
Other than the change of the entities in scope, the purpose of the RFB Sub-Group Capital Support Deed is the same as the Capital Support Deed 2015.
Risk monitoring and reporting
We monitor and report regularly against our capital plan. We do this to identify any change in our business performance that might affect our capital. Every
month, we also review the economic assumptions we use to create and stress test our capital plan. We do this to identify any potential reduction in our
capital.
112 Santander UK plc
ˆ200G2Mlv!2QfRvPg&Š200G2Mlv!2QfRvPg&
628340 TX 113SANTANDERFORM 20-F (SAN UK PL
03-Mar-2019 02:53 ESTHTMLON
Donnelley Financial EGV palap0dc 6*ESS 0C
VDI-W7-PFL-052912.9.12.0
bar4
Page 1 of 1
> Capital risk
Santander UK plc 113
CAPITAL RISK REVIEW
2018 compared to 2017 (unaudited)
Our CET1 capital ratio increased 100bps to 13.2% at 31 December 2018 (2017: 12.2%), with ongoing capital accretion and risk
management initiatives leaving us strongly capitalised in the current environment. CET1 capital was broadly in line with the prior year at
£10.4bn, with dividend payments largely offset by ongoing capital accretion through retained profits. Our total capital ratio increased to
20.3% at 31 December 2018 (2017: 19.2%).
Impact of IFRS 9 on regulatory capital
The implementation of IFRS 9 on 1 January 2018 resulted in an initial reduction in our CET1 capital ratio by 8 basis points to 12.13%
which, following the application of EU transitional arrangements for the capital impact of IFRS 9, reduced to 12.16%. As a result, the
adoption of IFRS 9 did not have a material impact on our capital position.
As our ECL methodology takes account of forward-looking data covering a range of possible economic outcomes, ECL-based provisioning
is expected to be more volatile than IAS 39 incurred loss-based provisioning and consequently is likely to impact our CET1 capital levels,
resulting in increased pro-cyclicality of risk-based capital and leverage ratios. However, the impact is currently mitigated by our surplus of
expected losses over provisions for exposures using IRB approaches. For such exposures (which include residential mortgages) the
adverse impact to CET1 capital of provision increases from reserve movements is offset by the associated reduction of the negative CET1
capital adjustment for regulatory expected loss amounts. Furthermore, the EU transitional arrangements for the capital impact of IFRS 9
mean that adverse CET1 effects from increases in ECL-based provisions from the level of such provisions at 1 January 2018 are partially
reduced until the end of 2022.
We reflect projections of ECL-based provisions in our capital position forecasting under base case and stress scenarios for ICAAP and
capital management purposes and consider the impact of the dynamics of ECL in how we assess, monitor and manage capital risk. We
expect IFRS 9 ECL charges to be more volatile than IAS 39 incurred losses. This could result in material favourable and unfavourable
swings to our Income Statement. Whilst the initial impacts of IFRS 9 were based on estimates prepared in a supportive economic
environment, a period of economic instability could significantly impact our Income Statement and the net carrying amount of our financial
assets. It could also impact the amount of capital we have to hold. We take into account the volatility of ECL in our capital planning
strategy.
Key capital ratios (unaudited)
2018
%
2017
%
CET1 capital ratio 13.2 12.2
AT1 2.2 2.4
Grandfathered Tier 1 0.8 0.8
Tier 2 4.1 3.8
Total capital ratio 20.3 19.2
The total subordination available to Santander UK plc bondholders was 20.3% (2017: 19.7%) of RWAs.
Regulatory capital resources
This table shows our regulatory capital.
2018
£m
2017
£m
CET1 capital 10,374 10,620
AT1 capital 2,349 2,762
Tier 1 capital 12,723 13,382
Tier 2 capital 3,223 3,334
Total regulatory capital(1) 15,946 16,716
(1) Capital resources include a transitional IFRS 9 benefit at 31 December 2018 of £21m (1 January 2018: £18m).
AT1 capital
These are preference shares and innovative/hybrid Tier 1 securities. None of the instruments we issued before 1 January 2014 fully meet
the CRD IV AT1 capital rules, which apply from that date. These instruments will be phased out by CRD IV rules which restrict their
recognition as capital. The £750m Perpetual Capital Securities (net of issuance costs), the £800m Perpetual Capital Securities and the
£500m Perpetual Capital Securities we issued since then fully meet the CRD IV AT1 capital rules.
Tier 2 capital
These are fully CRD IV eligible Tier 2 instruments and grandfathered Tier 2 instruments whose recognition as capital is being phased out
under CRD IV.

ˆ200G2Mlv!2Z%$oy6%Š200G2Mlv!2Z%$oy6%
628340 TX 114SANTANDERFORM 20-F (SAN UK PL
04-Mar-2019 01:37 ESTHTMLON
Donnelley Financial EGV gopad0dc 10*ESS 0C
VDI-W7-PFD-037812.9.12.0
Page 1 of 1
Annual Report 2018 | Risk review
Pension risk (unaudited)
Overview Key metrics
Pension risk is the risk caused by our contractual or other liabilities with respect to a
pension scheme (whether established for our employees or those of a related company
or otherwise). It also refers to the risk that we will need to make payments or other
contributions with respect to a pension scheme due to a moral obligation or for some
other reason.
In this section, we explain how we manage and mitigate pension risk, including our
investment and hedging strategies. We also discuss the accounting position.
Funding Deficit at Risk reduced to £1,410m (2017:
£1,540m)
Both interest rate and inflation hedge ratios on the
Funding basis improved, to 68% (2017: 57%) and 67%
(2017: 64%), respectively.
OUR KEY PENSION RISKS
Sources of risk
Pension risk is one of our key financial risks and arises mainly because Santander UK plc is the sponsor of the Santander (UK) Group Pension Scheme
(the Scheme), a defined benefit scheme. Our risk is that over the long-term the Scheme’s assets, together with future returns and future contributions,
might not be enough to meet its liabilities as they fall due. Where the value of the Scheme’s assets is lower than its liabilities, we could have to (or choose
to) make extra contributions. We might also need to hold more capital to reflect this risk.
The key pension risk factors the Scheme is exposed to are:
Key risks Description
Interest rate risk The risk that movements in (long-term) interest rates cause changes in the value of the Scheme’s liabilities that are not
matched by changes in the value of the Scheme’s assets.
Inflation risk The Scheme’s liabilities are impacted by inflation as annual pension increases are linked to RPI and CPI. The risk is that
movements in inflation causes changes in the value of the Scheme’s liabilities that are not matched by changes in the
value of the Scheme’s assets.
Longevity risk Due to the long-term nature of the obligation, the value of the Scheme’s liabilities are also impacted by changes to the
life expectancy of Scheme members over time. The Scheme’s liabilities are mainly in respect of current and past
employees and are expected to stretch beyond 2080.
Investment risk The risk that the return on Scheme’s assets (relative to Scheme’s liabilities) is less than anticipated.
Both our accounting and regulatory capital positions can be sensitive to changes in key economic data and the assumptions we have used in our
valuations. These include our accounting assumptions on discount rates, inflation rates and life expectancy.
For more on our defined benefit pension schemes, see Note 31 to the Consolidated Financial Statements. This includes a sensitivity analysis of our key
actuarial assumptions.
Defined contribution schemes
We also have defined contribution schemes for our employees. Benefits at retirement mainly depend on the contributions made (by both the employees
and us) and how well the investments (typically chosen by employees) perform. These schemes carry far less market risk exposure for us, although we
remain exposed to operational and reputational risks. To manage these risks, we monitor the performance of defined contribution investment funds and
we ensure our employees are given enough information about their investment choices.
For more on our defined contribution pension schemes, see Note 31 to the Consolidated Financial Statements.
114 Santander UK plc
ˆ200G2Mlv!2Nhd0Zg3Š200G2Mlv!2Nhd0Zg3
628340 TX 115SANTANDERFORM 20-F (SAN UK PL
02-Mar-2019 19:22 ESTHTMLON
Donnelley Financial EGV vaitp0dc 5*ESS 0C
VDI-W7-PFD-048412.9.12.0
bar4
Page 1 of 1
> Pension risk
Santander UK plc 115
PENSION RISK MANAGEMENT Scheme governance
The Scheme operates under a trust deed. The corporate trustee, Santander (UK) Group Pension Scheme Trustees Limited (the Trustee), is a wholly owned subsidiary of the Santander UK group. The Trustee is responsible for ensuring that the Scheme is run properly and that members’ benefits are secure. It delegates investment decisions to the board of Santander (CF Trustee) Limited (the CF Trustee) which meets each month. The CF Trustee meetings are the main forum for the CF Trustee to analyse and agree investment management strategies with input from us as and when needed.
Our Pensions Committee reviews our pension risk appetite and approves actuarial valuations. It also discusses and forms views on the Scheme’s investment strategy. The Pension Risk Forum, a Risk division management forum, monitors our pension risk within our approved risk framework, risk appetite and policies. Although we work with the Trustee to ensure the Scheme is adequately funded, our responsibilities are clearly segregated from those of the Trustee.
Risk appetite
Our pension risk appetite is reviewed by our Pensions Committee at least once a year. It is then sent to the Board for approval. We ensure that our risk appetite is a key consideration in all decisions and risk management activities related to the Scheme.
We measure pension risk on both a technical provisions (funding) basis and an accounting basis (in line with IAS 19 ‘Employee Benefits’). We manage and hedge pension risk on the funding basis. However, we also consider the impact on the accounting basis. Both the funding and the accounting bases are inputs into our capital calculations.
Risk measurement
Our key risk metrics include:
Key risk metrics Description
Funding Deficit at Risk We use a VaR and stress testing framework to model the Scheme’s assets and liabilities to show the potential deterioration in the current funding position. This ensures we adequately capture the risks, diversification benefits and liability matching characteristics of the obligations and investments of the Scheme. We use a time period of 1 year and a 95% confidence interval in our VaR model.
Required Return This estimates the return required from the Scheme’s assets each year to reach a pre-defined funding target by a fixed date in the future.
Pensions CET1 Volatility This measures the potential for capital volatility due to the pension risk related capital deduction.
We perform stress tests for regulators, including for ICAAPs and PRA stress tests. The stress testing framework allows us to also consider how Brexit and other macroeconomic events could impact the Scheme’s assets and liabilities. For more on our stress testing, see the Risk Governance section.
Risk mitigation
The key tools we use to mitigate pension risk are:
Key tools DescriptionInvestment strategies The Trustee has developed the following investment objectives:
– To act in the best interests of the Scheme by maintaining a diversified portfolio of assets of appropriate suitability, quality, security, liquidity and profitability which will generate income and capital growth to meet the cost of current and future benefits
– To limit the risk that the assets fail to meet the liabilities – To achieve the investment targets for each section, as agreed between the Trustee and the employer at
the most recent actuarial valuation or subsequent updates agreed by Santander UK and the Trustee – To minimise the Scheme’s long-term costs to us by maximising the return on the assets net of fees and
expenses, whilst having regard to the objectives above– To seek to control the long-term costs of the Scheme by achieving value for money in the fees paid to
investment managers and advisers and by minimising transaction costs.
The assets of the funded plans are held independently of the Santander UK group’s assets in separate trustee-administered funds. The investment strategy is kept under review.
The Trustee invests the Scheme’s assets in a diversified portfolio of UK and overseas equities, corporate and government bonds, property, infrastructure development opportunities and other assets.
Hedging strategies The Trustee has a hedging strategy to reduce key market risks. Hedging decisions are made, following discussions between the Trustee, CF Trustee and us, and executed by the CF Trustee.
The main reason for hedging liabilities is to manage the exposure of each of the Scheme’s sections to interest rate and inflation risk. This includes investing in suitable fixed income and inflation-linked assets, and entering into inflation and interest rate hedging instruments. The CF Trustee may also adopt other hedging to mitigate specific risks, such as equity hedging strategies which are used to reduce market risks from investing in public market equities. The latter can be achieved by using a range of derivatives strategies such as an equity put option, equity collar or other combinations of derivatives that provide downside protection.
Risk monitoring and reporting
We monitor pension risk each month and report on our metrics at ERCC, Pensions Committee and also, where thresholds are exceeded (or likely to be), to the Board Risk Committee and the Board in accordance with our pension risk appetite. Senior management will then decide what, if any, remedial action should be recommended, which we then discuss with the Trustee and, where relevant, the CF Trustee.
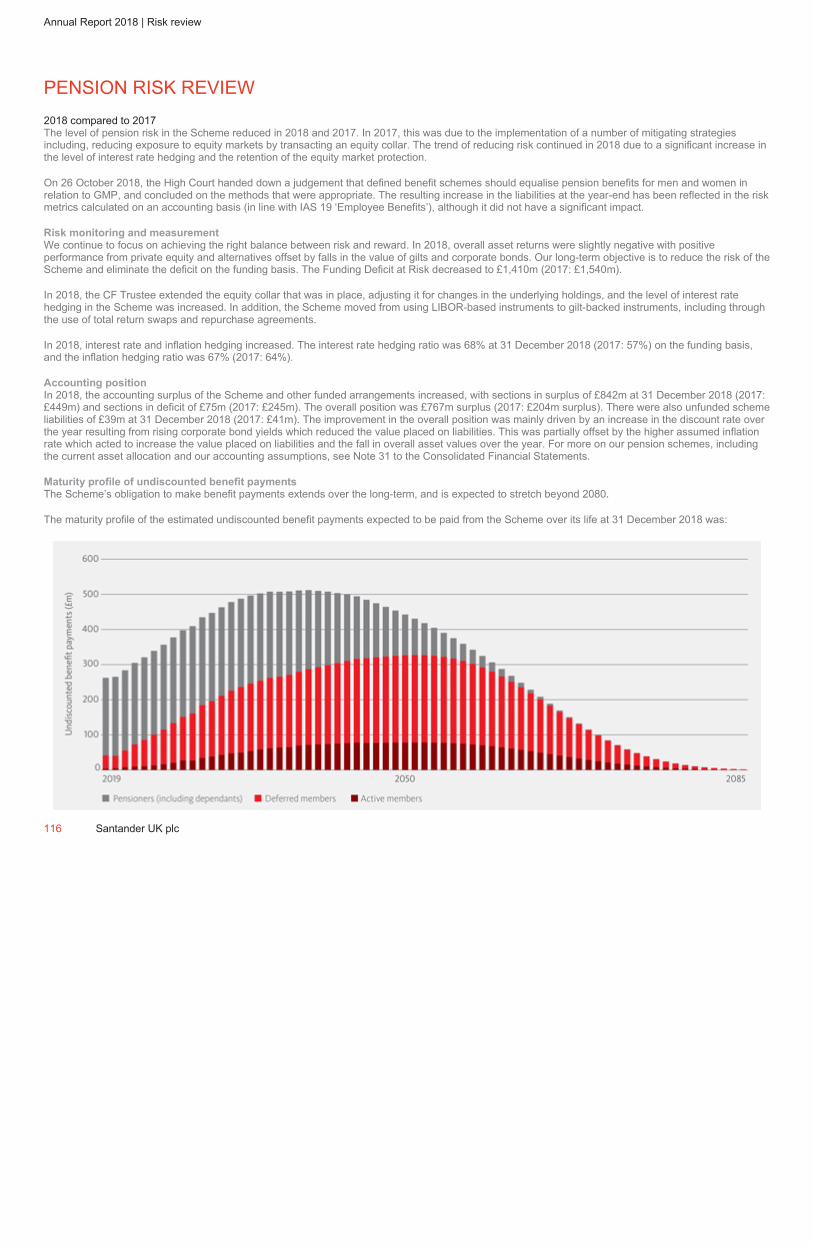
ˆ200G2Mlv!2NVd1V6#Š200G2Mlv!2NVd1V6#
628340 TX 116SANTANDERFORM 20-F (SAN UK PL
02-Mar-2019 18:36 ESTHTMLON
Donnelley Financial EGV vaitp0dc 3*ESS 0C
VDI-W7-PFD-048412.9.12.0
f116
Page 1 of 1
Annual Report 2018 | Risk review
PENSION RISK REVIEW
2018 compared to 2017
The level of pension risk in the Scheme reduced in 2018 and 2017. In 2017, this was due to the implementation of a number of mitigating strategies
including, reducing exposure to equity markets by transacting an equity collar. The trend of reducing risk continued in 2018 due to a significant increase in
the level of interest rate hedging and the retention of the equity market protection.
On 26 October 2018, the High Court handed down a judgement that defined benefit schemes should equalise pension benefits for men and women in
relation to GMP, and concluded on the methods that were appropriate. The resulting increase in the liabilities at the year-end has been reflected in the risk
metrics calculated on an accounting basis (in line with IAS 19 ‘Employee Benefits’), although it did not have a significant impact.
Risk monitoring and measurement
We continue to focus on achieving the right balance between risk and reward. In 2018, overall asset returns were slightly negative with positive
performance from private equity and alternatives offset by falls in the value of gilts and corporate bonds. Our long-term objective is to reduce the risk of the
Scheme and eliminate the deficit on the funding basis. The Funding Deficit at Risk decreased to £1,410m (2017: £1,540m).
In 2018, the CF Trustee extended the equity collar that was in place, adjusting it for changes in the underlying holdings, and the level of interest rate
hedging in the Scheme was increased. In addition, the Scheme moved from using LIBOR-based instruments to gilt-backed instruments, including through
the use of total return swaps and repurchase agreements.
In 2018, interest rate and inflation hedging increased. The interest rate hedging ratio was 68% at 31 December 2018 (2017: 57%) on the funding basis,
and the inflation hedging ratio was 67% (2017: 64%).
Accounting position
In 2018, the accounting surplus of the Scheme and other funded arrangements increased, with sections in surplus of £842m at 31 December 2018 (2017:
£449m) and sections in deficit of £75m (2017: £245m). The overall position was £767m surplus (2017: £204m surplus). There were also unfunded scheme
liabilities of £39m at 31 December 2018 (2017: £41m). The improvement in the overall position was mainly driven by an increase in the discount rate over
the year resulting from rising corporate bond yields which reduced the value placed on liabilities. This was partially offset by the higher assumed inflation
rate which acted to increase the value placed on liabilities and the fall in overall asset values over the year. For more on our pension schemes, including
the current asset allocation and our accounting assumptions, see Note 31 to the Consolidated Financial Statements.
Maturity profile of undiscounted benefit payments
The Scheme’s obligation to make benefit payments extends over the long-term, and is expected to stretch beyond 2080.
The maturity profile of the estimated undiscounted benefit payments expected to be paid from the Scheme over its life at 31 December 2018 was:
116 Santander UK plc
ˆ200G2Mlv!2Z&1d16uŠ200G2Mlv!2Z&1d16u
628340 TX 117SANTANDERFORM 20-F (SAN UK PL
04-Mar-2019 01:37 ESTHTMLON
Donnelley Financial EGV gopad0dc 8*ESS 0C
VDI-W7-PFD-037812.9.12.0
bar4
Page 1 of 1
> Conduct and regulatory risk
Santander UK plc 117
Conduct and regulatory risk (unaudited)
Overview Key metrics
We manage the conduct and non-financial regulatory risk types in one framework. We do this to reflect their similarities.
Conduct risk is the risk that our decisions and behaviours lead to a detriment or poor outcome for our customers. It also refers to the risk that we fail to hold and maintain high standards of market integrity.
Regulatory risk is the risk of financial or reputational loss, imposition or conditions on regulatory permission, as a result of failing to comply with applicable codes, regulator’s rules, guidance and regulatory expectations.
We are committed to ensuring conduct strategy is embedded in our business and that the fair treatment of our customers is at the heart of what we do.
In this section, we explain how we manage conduct and regulatory risk. We also describe our main conduct provisions, with a focus on PPI, and give some insight into how we are helping to combat financial abuse.
Our PPI provision at 31 December 2018 amounted to £246m (2017: £356m)
Other conduct provisions at 31 December 2018 amounted to £30m (2017: £47m)
OUR KEY CONDUCT AND REGULATORY RISKS We believe that delivering a Simple, Personal and Fair bank starts with meeting the needs and expectations of our customers. To achieve this we are committed to making sure that our strategy, proposition and initiative approval process, and systems, operations and controls are well designed and delivered.
We see our key exposure to conduct and regulatory risk through (i) the risk of errors in our product design, sales practices, post-sale servicing, operational processes, complaint handling and (ii) failure to supervise, monitor and control the activities of our employees. All of these may result in the risk that we do not meet our customers’ needs, align to the expectations of our regulators or deliver the expected outcomes or observe required standards of market behaviour.
Our Conduct and Regulatory Framework is built on the following underlying types of risk:
Key risks DescriptionRegulatory The risk that we fail to adhere with relevant laws, regulations and codes which could have serious
financial, reputational and customer impacts. This includes the risk that we may be adversely impacted by changes and related uncertainty around UK and international regulations. We categorise regulatory risk into financial and non-financial risk. This is aligned to our main regulators who are the PRA and FCA.
As well as being subject to UK regulation, as part of the Banco Santander group, we are impacted indirectly through regulation by the Banco de España (the Bank of Spain) and, at a corporate level, by the ECB through the SSM. We also fall within the scope of US regulation, including the Dodd-Frank Wall Street Reform and Consumer Protection Act. This restricts our activities both in the UK and the US. We also have to adhere to the rules and guidance of other regulators and voluntary codes in the UK.
Product The risk that we offer products and services that do not result in the right outcomes for our customers.
Sales The risk that we sell products and services to our customers without giving them enough information to make an informed decision or we do not provide correct advice.
After-sale and servicing The risk that failures of our operations, processes, servicing activity, IT or controls result in poor outcomes for our customers. This includes the risks that:– We do not give appropriate after-sale communications to customers, making it difficult for them to
contact us, or we fail to take account of a customer’s vulnerability– We do not have robust systems and controls to detect and prevent fraud or errors in the
customer experience.
Culture The risk that we do not maintain a culture that encourages the right behaviour and puts the customer at the heart of what we do.
Competition The risk of financial harm, criminal liability, customer harm or reputational damage that we may incur because we fail to comply with relevant competition law or being involved in any competition law investigation or proceedings.
Controls The risk that we do not supervise and monitor our employees effectively or do not have robust systems and controls in place to prevent and detect misconduct.
ˆ200G2Mlv!2PppRggEŠ200G2Mlv!2PppRggE
628340 TX 118SANTANDERFORM 20-F (SAN UK PL
03-Mar-2019 00:29 ESTHTMLON
Donnelley Financial EGV palap0dc 3*ESS 0C
VDI-W7-PFL-052912.9.12.0
Page 1 of 1
Annual Report 2018 | Risk review
CONDUCT AND REGULATORY RISK MANAGEMENT
Risk appetite
We aim to comply with all regulatory requirements and we have no appetite to make decisions or operate in a way that leads to unfair outcomes for our
customers or negatively impacts the market.
Our Board approves our risk appetite on an annual basis, or more often if events mean that we need to revise it, and we cascade it to our business units
through our risk framework and policies. We also have lower level risk tolerance thresholds that are agreed at least annually by the ERCC. Our material
conduct and regulatory risk exposures are subject to, and reported against, our conduct and regulatory risk appetite statements, as well as lower level
triggers and thresholds for management action.
Risk measurement
Due to the close links between our conduct, regulatory and operational risk frameworks, our tools to identify, assess, manage and report operational risks
also apply where such exposures and risks have a conduct and/or regulatory risk impact.
We support our conduct and regulatory risk framework and policies with tools that aim to identify and assess new and emerging conduct risks. These
include:
Key tools Description
Strategy and business
planning
Our Strategy and Corporate Development team help align our overall corporate strategy, financial plans, risk appetite and
operational capabilities through our annual process to set our strategy. We derive our business unit plans from our overall
corporate strategy and they contain a view of conduct and regulatory risk along with our other key risk types.
Sales quality assurance We subject our retail sales to internal quality assurance and, as appropriate, external monitoring to ensure the quality of our
sales and practices.
Operational risk and
control assessments
Our business and business support units assess our operational risks, systems and controls to give us a consolidated risk
view across all our business areas. We complete the assessments through a central tool to evaluate and manage our
residual risk exposures.
Scenario testing and
horizon scanning
We consider conduct and regulatory risk in our scenario testing. This reviews possible root causes and assumptions to
determine the likelihood and size of the impact, and actions to enhance our controls where required.
Conduct risk reporting We use dashboards to give us an end-to-end view of our conduct risks across our business. This allows us to apply a lens to
manage conduct risk and understand if it is in line with our risk appetite.
Compliance monitoring We carry out an annual assurance programme for conduct and regulatory risk which is approved by the Board and tracked
through the year.
Risk mitigation
Our conduct and regulatory risk framework and policies set out the principles, standards, roles and responsibilities and governance for conduct and
regulatory risk, such as:
Policies Description
Product approval Our product approval process aims to minimise our exposure to conduct, legal, regulatory or reputational risks in the
design, marketing, sales and service of new products and services. We assess all our products and services within a
formal framework to make sure they are within our risk appetite and agreed metrics, processes and controls are in place.
Suitable advice for
customers
We give guidance to advisers and staff on the key principles, minimum requirements and ethical behaviours they must
follow. This ensures our customers are sufficiently informed when they make a buying decision. In our Retail Banking
division, the main products we cover are mortgages, investments, savings and protection.
Training and
competence
In line with the expectations of our regulators, we train our staff and require them to maintain an appropriate level of
competence (in line with their role and responsibilities) to ensure customers achieve fair outcomes. We invest in all our
people to ensure that we achieve our mandatory risk objectives and that everyone acknowledges their personal
responsibility for risk management through our I AM Risk approach.
Treating vulnerable
customers fairly
Some customers may be impacted financially or personally as a result of their circumstances. Our Vulnerable Customer
Policy gives business areas a clear and consistent understanding of what vulnerability can mean and the types of
situations when customers may need more support. Our guidelines focus on identifying vulnerable customers, and the
support we can give to help them avoid financial difficulty. We work with key charities and other specialists to develop our
understanding of vulnerability.
In addition to mandatory training, we train our customer-facing colleagues using real customer scenarios to highlight
different vulnerable situations. This enables our colleagues to deal with a wide range of sensitive issues. We have also
developed an online Vulnerable Customer Support Tool for our colleagues to give them more information and guidance.
Our colleagues have access to our Specialist Support Team who can provide specific help and guidance for the most
complex vulnerable customer situations.
We consider vulnerability in every new initiative. Adapting our technology to the needs of customers with physical
disabilities is a key part of our design and testing stages and we work closely with the Digital Accessibility Centre. We
have seen the impact of this in areas such as the roll out of our voice-guided, contactless-enabled ATMs and the
development of our Mobile Banking app.
Risk monitoring and reporting
We consider conduct and regulatory risk as part of the governance around all our business decisions. We have specific forums and committees to make
decisions on conduct and regulatory risk matters and we ultimately report to the Board Responsible Banking Committee.
The data we report to senior management contains essential information that gives them a clear understanding of current and potential emerging conduct
and regulatory risks and issues.
Our risk and control forums support management to control risks in their business units. Reporting includes conduct risk dashboards, which take into
account a range of metrics across common areas. These include policy breaches logged, mystery shopping, quality assurance and complaints, as well as
commentary on trends and root causes. The dashboard enables management to take effective action.
As well as the reports issued by the business, our Legal and Regulatory function reports directly to the Board to give a view on legal, conduct and
regulatory, reputational and financial crime risks, and to escalate issues or any breach of our risk appetite.
118 Santander UK plc

ˆ200G2Mlv!2RrX!WgqŠ200G2Mlv!2RrX!Wgq
628340 TX 119SANTANDERFORM 20-F (SAN UK PL
03-Mar-2019 05:42 ESTHTMLON
Donnelley Financial EGV manra0dc 8*ESS 0C
VDI-W7-PFL-165312.9.12.0
bar4f119
Page 1 of 1
> Conduct and regulatory risk
Santander UK plc 119
CONDUCT AND REGULATORY RISK REVIEW
2018 compared to 2017
To make sure we fully consider customer impacts across our business, we maintained a strong focus on robust oversight and control over
our proposition, and maintaining Compliance teams across all our key business lines. We also embedded conduct risk frameworks across
all business divisions, and worked closely with Operational Risk, leveraging the risk toolkit to identify, assess, manage and report conduct
and regulatory risk.
In 2018, we developed tailored propositions across all of our customer segments. As part of this, we:
– Removed unarranged overdraft fees from fee-paying personal current accounts and reduced the monthly maximum charge for
unarranged fees
– Set up a Mortgage Taskforce to better support positive customer outcomes by empowering customer facing teams to deal with customer
queries at first point of contact
– Supported our colleagues with the introduction of the 1I2I3 Business Current Account, in line with our objective to help businesses
prosper
– Supported the launch of our Digital Investment Adviser which is a tool to make investment advice more accessible for our customers.
We also continued to build on the progress we made in 2017. As part of this, we:
– Continued to strengthen our governance from the top down following the establishment of the Board Responsible Banking Committee in
2017
– Managed technological change and increased digitalisation in line with new regulatory initiatives including Open Banking and PSD2
– Supported the integration of Santander Services and Santander Technology following their acquisition by Santander UK in 2018 to better
partner with colleagues across the business and truly deliver for our customers
– Developed a standardised conduct risk framework across our Corporate & Commercial Banking and Corporate & Investment Banking
divisions to ensure we manage the end-to-end client journey and potential market impacts more consistently
– Helped to support and implement our Ring-Fenced Bank business model, by performing conduct risk assessments, tracking mitigating
actions to completion and delivering a Compliance Framework for the new ring-fence model
– Enhanced our systems and processes due to the implementation of MiFID II, which introduced significant changes in financial market
infrastructure and practices. MiFID II requires more trading to take place on trading venues, greater price transparency, more detailed
reporting to regulators, and changes to investor protection practices. We continued to enhance these areas throughout 2018 in line with
further regulatory guidance. Senior management remains focused on this area
– Took steps to ensure we are well prepared for a likely end of LIBOR in 2021 and the transition away from LIBOR to (near) Risk Free
Reference Rates (RFR). We set up a Senior Management Steering Committee to ensure we are operationally ready for the transition.
The LIBOR Transition Programme Office supports the committee, and coordinates and facilitates the work of specific working groups,
and monitors how the LIBOR transition challenges and risks evolve. We participated in the first phase of the Sterling Risk Free
Reference Rate Working Group, facilitated by the regulatory authorities. We continue to support this initiative through participating in
RFR working groups and industry associations.
Conduct remediation provisions
The remaining provision for PPI redress and related costs was £246m (2017: £356m). We made no additional PPI charges in the year,
based on our recent claims experience, and having considered the FCA’s Consultation Paper 18/33 issued on 7 November 2018. We will
continue to monitor our provision levels, and take account of the impact of any further change in claims received and FCA guidance.
The remaining provision for other conduct issues was £30m (2017: £47m), which primarily relates to the sale of interest rate derivatives,
following an ongoing review of the regulatory classification of customers potentially eligible for redress. Following further analysis,
management assessed the provision requirements resulting in a release of £11m in Q2 2018.
Regulatory provisions
A £32.8m fine was levied by the FCA in December 2018. The fine relates to an investigation by the FCA into our historical probate and
bereavement practices. For details on how we have responded to this, see the ‘Operational risk’ section.
For more on our provisions, see Note 30 to the Consolidated Financial Statements.
Combatting financial abuse
Financial abuse is a very real and damaging form of abuse for many
people in the UK and commonly involves financial control or the
exploitation of a vulnerable person. We are working hard to look at
different ways we can better help and support victims and limit a
customer’s exposure to further abuse of this kind.
Since March 2017 we have worked closely with other members of UK
Finance, as part of the Financial Abuse Working Party, with a shared
vision to help victims regain control of their finances. Through this
collaboration we have agreed a Financial Abuse Code of Practice, which
we are now working to embed within our business as part of our overall
vulnerable customer strategy. As part of our work in this area, we have
designed specific training material for colleagues to raise awareness and
improve understanding around the devastating impacts of financial abuse
and how we can help. We are also looking to make it easier for victims to
ask for help and get the support they need to be released from joint
accounts they may hold with their abuser. Due to the very complex nature
of situations involving financial abuse, we also have a dedicated Specialist
Support Team that offers guidance to colleagues dealing with customers
who are victims and need tailored solutions to help them regain control of
their finances.
This kind of abuse can take a variety of forms within different relationships
including family, partner and carer relationships. While financial abuse can
happen to anyone, women are more likely to experience it and amongst
older people, those with dementia or reduced cognitive function are the
most vulnerable. Research shows that over one third of victims don’t tell
anyone at the time and that is why we are fully committed to raising
awareness and providing the right support so that customers feel able to
speak with us about their personal situation.
ˆ200G2Mlv!2Z&823gtŠ200G2Mlv!2Z&823gt
628340 TX 120SANTANDERFORM 20-F (SAN UK PL
04-Mar-2019 01:37 ESTHTMLON
Donnelley Financial EGV gopad0dc 5*ESS 0C
VDI-W7-PFD-037812.9.12.0
Page 1 of 1
Annual Report 2018 | Risk review
Other key risks (unaudited)
Overview
In this section, we describe how we manage our other key risks and discuss developments in the year.
Our other key risks are:
– Operational risk: the risk of direct, or indirect, loss due to inadequate or failed internal processes, people and systems, or external events.
– Financial crime risk: the risk that we are used to further financial crime, including money laundering, sanctions evasion, terrorist financing, bribery and corruption.
– Strategic risk: the risk of loss or damage due to decisions that impact the long-term interests of our key stakeholders, or from an inability to adapt to external developments.
– Legal risk: the risk of loss due to legal deficiencies in contracts; failure to take appropriate measures to protect assets; failure to manage legal disputes appropriately; failure to assess or implement the requirements of a change of law; or failure to comply with law or regulation or to discharge duties or responsibilities created by law or regulation.
– Reputational risk: the risk of damage to the way our reputation and brand are perceived by the public, clients, government, colleagues, investors, or any other interested party.
– Model risk: the risk of loss from decisions mainly based on results of models due to errors in their design, application or use.
OPERATIONAL RISK
OUR KEY OPERATIONAL RISKS Operational risk is inherent in our business. As a result, we aim to manage it down to as low a level as possible, rather than eliminate it entirely. Operational risk events can have a financial impact and can also affect our business objectives, customer service and regulatory obligations. These events can include product misselling, fraud, process failures, system downtime and damage to assets.
Our top three key operational risks are:
Key risks Description
Process and change
management
A key part of our business strategy is to develop and deliver new banking channels and products. These include mobile banking and third party payment products. The scale and pace of our plans increases our operational risk.
We are also implementing a large number of regulatory and legal changes, impacting all areas of our business. There is more on this in the ‘Regulatory risk’ section. Our business units are reporting operational issues due to the volume and complexity of these changes. These changes could have financial, customer, reputational and regulatory impacts if we do not manage them properly.
Outsourced and third
party supplier
management
We rely extensively on third parties, both within the Banco Santander group and outside of it, for a range of services and goods. These include outsourced services, such as IT infrastructure, software development and banking operations. Regulations require us to classify other legal entities in the Banco Santander group as external suppliers, so we manage them as third parties.
Third party risk is a key operational risk for us due to the number, complexity and criticality of the services provided by our third parties. Many are also shared across the sector and this could increase risk due to complexity and capacity issues at the suppliers. The failure of a supplier may cause operational disruption, breach of data security or regulations, negative customer impact, financial loss or reputational damage.
Cyber risk The use of technology and the internet have changed the way we live and work. They have allowed us to develop and improve the way we deal with our customers. It is critically important that we give our customers a secure environment in which to deal with us, especially when the threat from cyber criminals is so prevalent and more sophisticated than ever. Failure to protect the data assets of Santander UK and its customers against theft, damage or destruction from cyber-attacks could result in damage to our reputation and direct financial losses. Even small periods of disruption that deny access to our digital services can erode our customers’ trust in us. This applies not only to our own systems but also to those of our third party providers and counterparties in the market. It is therefore critical that we are resilient to cyber-attacks and can withstand and quickly recover from those events that do occur.
The UK referendum vote in June 2016 to leave the EU was followed by Article 50 being triggered in March 2017. This marked the start of the Brexit process, scheduled for March 2019. As anticipated, the process is impacting the economic, legal and regulatory environment for consumers, businesses and the financial services industry. Given the complexity of the process, we have put in place robust contingency plans and mitigating actions to address the potential risks that could arise across our business. We continue to actively monitor the key risks including operational, credit, market, liquidity, conduct and regulatory, legal, and reputational. As the process becomes clearer, we will update our plans and actions, and implement them if and when we need to.
While uncertainty around Brexit remains we are preparing for a number of outcomes in order to minimise the impact on our business. Our Brexit preparations are comprehensive and we have dedicated significant focus to ensure we can continue to serve our customers whatever the outcome. In particular we have taken account of the nationality and location of our people and customers, contract continuity, financial markets infrastructure such as clearing, access to Euro payment systems as well as third party services and flows of data into and out of the European Economic Area.
We expect the direct impact on our business to be somewhat lower than for other more diversified UK banks and corporates, given our UK focus. We also expect to benefit from being part of the Banco Santander group, the largest bank in the eurozone with major subsidiaries outside Europe, which will help us to continue to serve our customers’ domestic and international banking needs. The indirect impact on our business remains uncertain and will be linked to the wider UK economic outturn in the years ahead. Nonetheless, we believe we are well prepared and continue to be positioned prudently.
We are also exposed to tax risk which, even though it is a lower risk for us, is still a high profile risk and may include legacy items. We define tax risk as the risk that we fail to comply with domestic and international tax regulations because we misinterpret legislation, regulations or guidance, or we report to the tax authorities inaccurately or late. This could lead to financial penalties, additional tax charges or reputational damage. Santander UK adopted the Code of Practice on Taxation for Banks in 2010. For more on this, see our Tax Strategy.
120 Santander UK plc

ˆ200G2Mlv!2P<G6\Š200G2Mlv!2P<G6\
628340 TX 121SANTANDERFORM 20-F (SAN UK PL
03-Mar-2019 01:22 ESTHTMLON
Donnelley Financial EGV shanv1dc 5*ESS 0C
VDI-W7-PFL-091012.9.12.0
bar4
Page 1 of 2
> Other key risks
OPERATIONAL RISK MANAGEMENT
Risk appetite
We set our operational risk appetite at a Santander UK level and we express it through measures approved by the Board. These include
risk statements and metrics set against the seven CRD IV loss event types. We cascade our appetite across our business areas by setting
out lower level triggers and thresholds and processes by which risks and events must be managed and escalated, and by which they may
be formally accepted.
Risk measurement and mitigation
The key components of the operational risk toolset we use to measure and mitigate risk are:
Operational risk toolset Description
Operational risk and
control assessments
Our business units identify and assess their operational risks to ensure they manage and control them within
our operational risk appetite. They also ensure that we prioritise any actions needed. Every area has to
identify their risks, assess their controls for adequacy and then accept the risk or formulate a plan to address
any deficiencies.
Risk scenario analysis We perform this across all of our business units. It involves a top down assessment of our most significant
operational risks. Each business unit has a set of scenarios that it reviews and updates each year. The
analysis gives us insight into rare but high impact events. It also allows us to better understand the potential
impacts and to address any issues.
Key indicators Key indicators and their tolerance levels give us an objective view of the degree of risk exposure or the
strength of a control at any point in time. They also show trends over time and give us early warning of
potential increasing risk exposures. Our most common key indicators are key risk indicators, which highlight
the degree of risk, and key control indicators which show how strong and effective the controls are.
Operational risk losses Our operational risk loss appetite sets the level of total operational risk loss (expected and unexpected) in
any given year (on a 12 month rolling basis) that we consider to be acceptable. We track actual losses
against our appetite and we escalate as needed.
Operational risk event
management
Operational risk events occur when our controls do not operate as we planned and this leads to customer
impact, financial loss, regulatory impacts and/or damage to our reputation. We have processes to capture
and analyse loss events. We use data from these processes to identify and correct any control weaknesses.
We also use root cause analysis to identify emerging themes, to prevent or reduce the impacts of
recurrence and to support risk and control assessments, scenario analysis and risk reporting.
Risk based insurance Where appropriate, we use insurance to complement other risk mitigation measures.
We also mitigate our key operational risks in the following ways:
Key risks Risk mitigation
Process and change
management
Our operational risk exposure increases when we engage in new activities, develop new products, enter
new markets or change processes or systems. As a result, we assess the operational risk for material
change programmes and new products before they are allowed to go ahead.
Outsourced and third
party supplier
management
We place emphasis on a carefully controlled and managed Third Party Supplier Risk Framework, and are
enhancing our resources in this area in order to manage this risk. We aim to ensure that those with whom
we intend to conduct business meet our risk and control standards throughout the life of our relationship with
them. We also monitor and manage our ongoing supplier relationships to ensure our standards and
contracted service performance continue to be met.
Cyber riskOnline security and data breaches stories, along with many reports of scams and online fraud, continue to
feature strongly in headlines and political debate. As criminals become more sophisticated in their approach,
banks and other organisations are in an ongoing race to keep ahead of them. Cyber criminals persist in
attempts to deny our customers access to our digital channels, target our online services and data, or steal
online credentials by various methods, including social engineering.
Protecting our customers, systems and data remains a top priority for us. In 2018, we undertook a large
programme to enhance our resilience to cyber-disruption. This includes staff training, customer education
and IT improvements. Our cyber security training ensures all our staff understand the threats we face, and
that we all have the expertise, through practical assessment, to spot criminals’ emails and attacks on our IT
systems. We continue to work with other banks as members of the Cyber Defence Alliance, where we share
intelligence on cyber threats and effective mitigation strategies.
In 2018, we also launched a successful ‘Scam Avoidance School’ campaign to raise awareness and give
customers the knowledge they need to avoid becoming victims of fraud. We use robust technology to
protect our customers and we continually invest in the fight to counter scams. As part of this, we run
customer education campaigns, and we offer advice on our online security centre. We successfully prevent
the vast majority of fraud and protect our customers’ money. For more, see the ‘protecting our customers’
case study.
We operate a layered defence approach to cyber risk. This aims to prevent, detect, respond to and recover
from cyber-attack. We continually review how effective our controls are against globally-recognised security
standards. We also make use of maturity assessments and both internal and external threat analysis. Our
comprehensive approach to validating our controls includes tests designed to replicate real-world cyber-
attacks. Our test findings drive our ongoing improvement plans.
Risk monitoring and reporting
Reporting is a key part of how we manage risk. It ensures we identify, escalate and manage issues on a timely basis. We can identify
exposures through our operational risk and control assessments, risk scenario analysis, key indicators and incidents. We report exposures
for each business unit through regular risk and control reports. These include details on risk exposures and how we plan to mitigate them.
We prioritise and highlight events that have a material impact on our finances, reputation, or customers by reporting them to key
executives and committees. These include changes in our cyber risk profile.
We have a crisis management framework that covers all levels of the business. This includes the Board, Executive Committee, senior
management and business and support functions. Our framework identifies possible trigger events and sets out how we will manage a
crisis or major incident, and we test it at least annually. If an event occurs, we have business continuity plans in place to recover as quickly
as possible. These are aligned with our key customer journeys and delivery of critical IT services.
We use the standardised approach for Pillar 1 operational risk capital needs. We use an internal model aligned to the CRD IV advanced
measurement approach to assess our Pillar 2 capital needs. We also use it to model operational risk losses we might incur in a stress.

ˆ200G2Mlv!2P<G6\Š200G2Mlv!2P<G6\
628340 TX 121SANTANDERFORM 20-F (SAN UK PL
03-Mar-2019 01:22 ESTHTMLON
Donnelley Financial EGV shanv1dc 5*ESS 0C
VDI-W7-PFL-091012.9.12.0
bar4
Page 2 of 2Santander UK plc 121

ˆ200G2Mlv!2RPWh@6HŠ200G2Mlv!2RPWh@6H
628340 TX 122SANTANDERFORM 20-F (SAN UK PL
03-Mar-2019 04:52 ESTHTMLON
Donnelley Financial EGV ramus0dc 4*ESS 0C
VDI-W7-PFD-008912.9.12.0
Page 1 of 1
Annual Report 2018 | Risk review
OPERATIONAL RISK REVIEW
Operational risk event losses
The table below shows our operational losses in 2018 and 2017 for reportable events with an impact over £10,000, excluding conduct risk events (which
we discuss separately in the ‘Conduct and regulatory risk’ section), by CRD IV loss event types. We manage some of these risks using frameworks for
other risk types, including regulatory and financial crime risk even though we report them here.
2018 2017
Value
%
Volume
%
Value
%
Volume
%
Internal fraud 1 2 5 1
External fraud 4 48 37 49
Employment practices and workplace safety – 2 – 1
Clients, products, and business practices 3 18 24 22
Business disruption and system failures 1 1 1 –
Execution, delivery, and process management 91 29 33 27
100 100 100 100
2018 compared to 2017
We experienced a general uplift in the volume of non-financial events in 2018, largely due to new regulations and breach reporting requirements relating to
GDPR. The volume of losses against each category was broadly in line with 2017. We saw an overall reduction in the volume of financial losses in 2018
compared to 2017, although the proportion attributed to each category was broadly unchanged. In particular, enhancements to our anti-fraud controls
have led to a reduction in the number of external fraud losses. In 2018 we also invested in delivering improved solutions to help protect our customers
from Authorised Push Payment (APP) fraud and scams. These initiatives will support the new requirements set out by our regulators to help prevent
customers from falling victim to APP fraud. The value of losses showed a significant change in 2018, with a move away from conduct-related losses (such
as PPI) to those involving Execution, delivery and process management (events relating to historical system functionality and process issues).
The £32.8m fine levied by the FCA in December 2018, contributed to this. The fine relates to an investigation by the FCA into our historical probate and
bereavement practices. We acknowledged the findings of the FCA and apologised to the families and beneficiaries of deceased customers affected by
these failings. We have completed a comprehensive tracing exercise and transferred the majority of funds in deceased customers’ accounts to their
rightful beneficiaries, with compensatory interest where appropriate. We have also conducted a full review of our bereavement processes and made a
number of significant changes, including a complete overhaul of our processes, and creation of a centralised specialist bereavement team to provide the
best service. We now also facilitate necessary payments from a deceased customer’s accounts to cover funeral bills, probate fees and/or inheritance tax.
In 2018 we also provided £58m in relation to a systems-related historical issue, which has also contributed to the shift to losses relating to Execution,
Delivery and Process Management. As noted elsewhere, the provision is based on detailed reviews of systems regarding consumer credit business
operations, and relates to compliance with certain aspects of the Consumer Credit Act. For more, see Notes 30 and 32 to the Consolidated Financial
Statements.
We implemented cheque imaging ahead of the industry milestone of 30 November 2018. With cheque clearing activities in association with other UK
banks expected to increase during Q1 2019, our focus is on managing the related risks.
The Open Banking Initiative and the new PSD2, both of which introduced new requirements during 2018, together bring significant opportunity for us to
develop new products and services to enhance the ways customers use their data and pay for services. However, they also introduce a new layer of risk
to both customers and Santander UK. We continued to carry out detailed operational risk assessments in relation to these initiatives, in order to identify,
assess, manage and report the key risks involved. Our focus on managing these risks continues, with further assessments planned for 2019. In 2018 we
introduced a new early escalation process which has supported more proactive and coordinated incident management within the bank. We conducted one
internal crisis exercise and participated in the Bank of England regulatory Simulated Crisis Exercise, which was designed to test the resilience capabilities
of the UK financial sector. Additionally we increased our concurrent remote access capability to provide greater resiliency for staff to work away from their
office in the event of adverse weather or similar situations. We have also reviewed and responded to the joint regulatory discussion paper titled ‘Building
the UK financial sector’s operational resilience’.
In common with the whole financial services industry, change has been a constant feature in 2018 as it continues to gather pace and complexity. Key
parts of our change programme include the design and issue to market of innovative new products and services, such as the 1I2I3 Account for Small
Businesses; the changes necessary to meet regulatory requirements, not least GDPR; and that related to keeping Santander UK safe and running, and
delivering for our customers. We have continued to develop our governance processes to ensure that operational risk is limited to the absolute minimum
and we maintain strong mechanisms for oversight and challenge. A significant proportion of our governance is focused on our customers and doing for
them what we consider to be Simple, Personal and Fair.
Change is also a key factor in the management of our relationships with our key outsourcing partners (Third Party Service Providers), who form an
essential part of the service supply chain to our customers. Here too, the pace of change is dramatic. The demand for innovative solutions and the
provision of digital services which deliver on demand and at the right time and place for our customers means we must benefit from sharing intellectual
development with the best in business. This approach will ensure that we develop and prosper, particularly for our customers, the communities in which
we operate, and our staff. This brings additional risks, new technologies, widening spans of control across the supply chain, innovation and cyber threats.
To enable us to manage these challenges we have focused on further reviewing our governance processes and introducing new systems solutions which
provide information and focus on our supplier relationships and performance. This work will continue, develop and strengthen as we progress through the
coming year.
Cyber and information security remains a top priority for us, especially in light of the new GDPR regulations for which we completed a programme of work
to be able to manage related events. We continue to invest to ensure we have the right skills and resources to manage cyber and information security risk
effectively across all our lines of defence. In September 2018, we appointed a new Chief Information Security Officer to help enhance our capabilities and
ensure continued delivery of secure products and solutions for our customers and the communities that we serve.
Whilst we continue to be subject to cyber-attack, we did not suffer any material cyber or information security events during 2018 and we continue to
actively participate in the Cyber Defence Alliance along with industry peers to share cyber threat intelligence, expertise and experience to help identify
common features of cyber-attacks and effective mitigation strategies.
122 Santander UK plc
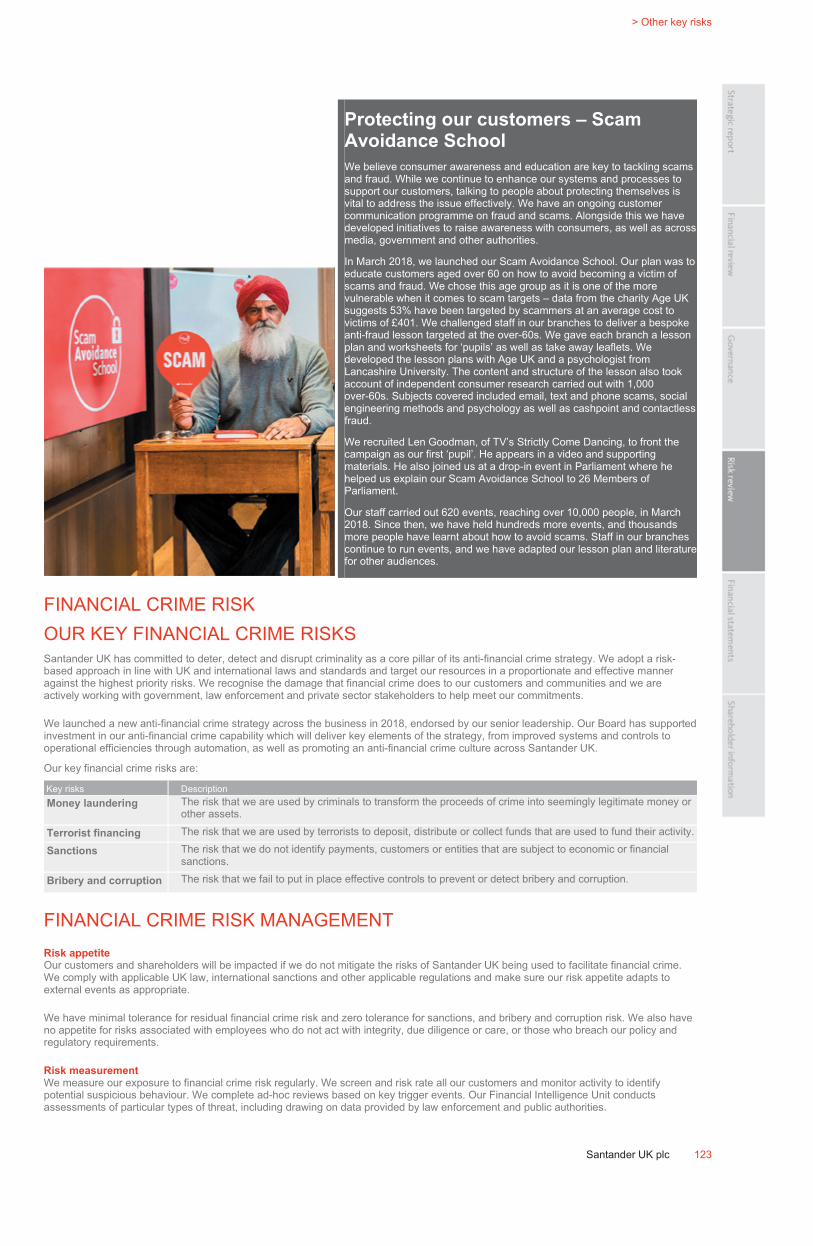
ˆ200G2Mlv!2Z&BNcgzŠ200G2Mlv!2Z&BNcgz
628340 TX 123SANTANDERFORM 20-F (SAN UK PL
04-Mar-2019 01:37 ESTHTMLON
Donnelley Financial EGV gopad0dc 7*ESS 0C
VDI-W7-PFD-037812.9.12.0
bar4f123
Page 1 of 1
> Other key risks
Santander UK plc 123
Protecting our customers – Scam
Avoidance School
We believe consumer awareness and education are key to tackling scams
and fraud. While we continue to enhance our systems and processes to
support our customers, talking to people about protecting themselves is
vital to address the issue effectively. We have an ongoing customer
communication programme on fraud and scams. Alongside this we have
developed initiatives to raise awareness with consumers, as well as across
media, government and other authorities.
In March 2018, we launched our Scam Avoidance School. Our plan was to
educate customers aged over 60 on how to avoid becoming a victim of
scams and fraud. We chose this age group as it is one of the more
vulnerable when it comes to scam targets – data from the charity Age UK
suggests 53% have been targeted by scammers at an average cost to
victims of £401. We challenged staff in our branches to deliver a bespoke
anti-fraud lesson targeted at the over-60s. We gave each branch a lesson
plan and worksheets for ‘pupils’ as well as take away leaflets. We
developed the lesson plans with Age UK and a psychologist from
Lancashire University. The content and structure of the lesson also took
account of independent consumer research carried out with 1,000
over-60s. Subjects covered included email, text and phone scams, social
engineering methods and psychology as well as cashpoint and contactless
fraud.
We recruited Len Goodman, of TV’s Strictly Come Dancing, to front the
campaign as our first ‘pupil’. He appears in a video and supporting
materials. He also joined us at a drop-in event in Parliament where he
helped us explain our Scam Avoidance School to 26 Members of
Parliament.
Our staff carried out 620 events, reaching over 10,000 people, in March
2018. Since then, we have held hundreds more events, and thousands
more people have learnt about how to avoid scams. Staff in our branches
continue to run events, and we have adapted our lesson plan and literature
for other audiences.
FINANCIAL CRIME RISK
OUR KEY FINANCIAL CRIME RISKS
Santander UK has committed to deter, detect and disrupt criminality as a core pillar of its anti-financial crime strategy. We adopt a risk-
based approach in line with UK and international laws and standards and target our resources in a proportionate and effective manner
against the highest priority risks. We recognise the damage that financial crime does to our customers and communities and we are
actively working with government, law enforcement and private sector stakeholders to help meet our commitments.
We launched a new anti-financial crime strategy across the business in 2018, endorsed by our senior leadership. Our Board has supported
investment in our anti-financial crime capability which will deliver key elements of the strategy, from improved systems and controls to
operational efficiencies through automation, as well as promoting an anti-financial crime culture across Santander UK.
Our key financial crime risks are:
Key risks Description
Money laundering The risk that we are used by criminals to transform the proceeds of crime into seemingly legitimate money or
other assets.
Terrorist financing The risk that we are used by terrorists to deposit, distribute or collect funds that are used to fund their activity.
Sanctions The risk that we do not identify payments, customers or entities that are subject to economic or financial
sanctions.
Bribery and corruption The risk that we fail to put in place effective controls to prevent or detect bribery and corruption.
FINANCIAL CRIME RISK MANAGEMENT
Risk appetite
Our customers and shareholders will be impacted if we do not mitigate the risks of Santander UK being used to facilitate financial crime.
We comply with applicable UK law, international sanctions and other applicable regulations and make sure our risk appetite adapts to
external events as appropriate.
We have minimal tolerance for residual financial crime risk and zero tolerance for sanctions, and bribery and corruption risk. We also have
no appetite for risks associated with employees who do not act with integrity, due diligence or care, or those who breach our policy and
regulatory requirements.
Risk measurement
We measure our exposure to financial crime risk regularly. We screen and risk rate all our customers and monitor activity to identify
potential suspicious behaviour. We complete ad-hoc reviews based on key trigger events. Our Financial Intelligence Unit conducts
assessments of particular types of threat, including drawing on data provided by law enforcement and public authorities.

ˆ200G2Mlv!2QcZ3m67Š200G2Mlv!2QcZ3m67
628340 TX 124SANTANDERFORM 20-F (SAN UK PL
03-Mar-2019 02:44 ESTHTMLON
Donnelley Financial EGV shanv1dc 4*ESS 0C
VDI-W7-PFL-091012.9.12.0
f124
Page 1 of 1
Annual Report 2018 | Risk review
Risk mitigation
We take a proactive approach to mitigating financial crime risk. Our Financial Crime Risk Framework is supported by policies and standards which explain
the requirements for mitigating money laundering, terrorist financing, sanctions and bribery & corruption risks. We update these regularly to ensure they
reflect all new external requirements and industry best practice. We support our colleagues to make sure they can make the right decisions at the right
time. We raise awareness and provide role specific technical training to build knowledge of emerging risks.
Key elements of our financial crime risk mitigation approach are that we:
– Complete due diligence of new-to-bank customers, where we seek to understand customers’ activities and banking requirements
– Complete risk assessments of customers, products, businesses, sectors and geographic risks to tailor our mitigation efforts
– Ensure all our staff complete mandatory Financial Crime training, supporting specialist training and learning opportunities
– Deploy new systems to better capture, analyse and act on data to mitigate bribery and corruption risks
– Partner with public authorities, Home Office and the wider financial services industry to pool expertise and data. We are also operationally involved in
partnerships such as the Joint Money Laundering Intelligence Taskforce (JMLIT) which supports public-private collaboration to tackle financial crime.
Risk monitoring and reporting
We use key risk indicators to monitor our exposure to financial crime risks, and we maintain strengthened governance across both first and second lines of
defence to make sure we report all issues in a timely manner. We work closely with relevant subject matter experts across the business on all risk
management and monitoring activities alongside more effective communication of policy changes. We have enhanced our target operating model to make
sure that our control environment evolves at pace, keeping up with new or amended laws, regulations or industry guidance.
Each month we report an analysis of the key financial crime risk indicators to the ERCC together with a directional indication of the risk profile and any
significant deterioration of the metrics. We are currently introducing an enhanced set of financial crime risk indicators. We also regularly report to the
Board Responsible Banking Committee on financial crime risk, the impact to Santander UK and the actions we are taking to mitigate the risk.
FINANCIAL CRIME RISK REVIEW
2018 compared to 2017
In 2018, we launched our new three year Anti-Financial Crime strategy. Our mission is built on three simple principles, committing to deter, detect and
disrupt financial crime.
In developing our strategy, we aligned to Santander UK’s commercial strategy and to the external landscape, listening to partners in the public sector,
wider industry and communities. We committed to embed our strategy using education, collaboration and innovation. As a result, we increased awareness
of financial crime and have encouraged our staff to use their judgement in doing the right thing and have empowered them to make responsible decisions.
Our new Anti-Financial Crime Academy seeks to further embed this, supporting colleagues through multiple channels to ensure we have the right tools to
tackle financial crime.
We embrace public and private partnership opportunities and actively collaborate with the public sector to address a number of financial crime challenges.
These mechanisms provide opportunities to pool our collective knowledge, experiences and skills. We actively participate in these collaborations with
industry and the UK Government to combat financial crime risk which also helps us further develop our internal capabilities. For example, in 2018 we
analysed external intelligence together with our own data to strengthen our controls for cash deposits.
In May 2018, we took part in the latest FCA Financial Crime ‘TechSprint’ where we won two awards showcasing innovation by using technological
advances around data sharing to disrupt criminals, whilst still protecting personal data. We are engaged on an ongoing basis with groups such as the
JMLIT and continue to see a real positive impact of our work, contributing to the UK’s security and prosperity.
In 2018, we introduced significant changes to our financial crime control environment and culture. We enhanced our strategic capabilities and supporting
infrastructure. Despite challenges, we are well positioned for 2019 where we expect to gain improved data-driven insights from these activities. We are
also embedding our new target operating model after restructuring our Financial Crime Compliance teams.
The financial crime landscape continues to be difficult and complex, with geo-political factors and continually evolving criminal methods influencing the
risks we face. We will continue to invest in our people and systems, deter the use of our services for financial crime, detect suspicious activity and disrupt
those seeking to benefit from financial crime.
Intelligence Partnerships
Our Financial Intelligence Unit works closely with the JMLIT. This is a government initiative
for public and private partnership between law enforcement and the financial industry to
combat high end money laundering.
In 2018, we worked with the JMLIT in a NCA operation to identify weapons being sent to
the UK from overseas. The NCA identified a specific weapons supplier from Eastern Europe
and the information was shared with the members of the JMLIT.
We completed intelligence investigations on transactions linked to this supplier and
identified significant results which were fed back to the NCA in real time, allowing swift
action to be taken. Arrests were made alongside the seizure of firearms at UK ports and at
addresses of the suspects we supplied data on. The intelligence we provided helped the
NCA to identify and seize significant amounts of firearms, ammunition and cash.
We received significant praise from the JMLIT, including feedback from the case officer
stating that the intelligence we supplied helped to prevent what they believed would be
further serious and potentially violent crime. We are committed to deterring, detecting and
disrupting financial crime. We will continue to work closely with the JMLIT to help prevent
and reduce our risk of facilitating organised crime.
124 Santander UK plc
ˆ200G2Mlv!2Z&Gb66&Š200G2Mlv!2Z&Gb66&
628340 TX 125SANTANDERFORM 20-F (SAN UK PL
04-Mar-2019 01:37 ESTHTMLON
Donnelley Financial EGV gopad0dc 5*ESS 0C
VDI-W7-PFD-037812.9.12.0
bar4
Page 1 of 1
> Other key risks
Santander UK plc 125
LEGAL RISK
Legal risk includes the legal consequences of operational risk (e.g. breach of contract) and operational risk with legal origins (e.g. a legally
defective contract). We manage legal risk as a standalone risk-type to reflect the continued pace and breadth of regulatory change across
financial services.
We define legal risk as losses or impacts arising from legal deficiencies in contracts or failure to: take appropriate measures to protect
assets; manage legal disputes appropriately; assess, implement or comply with law or regulation; or to discharge duties or responsibilities
created by law or regulation.
Legal risk management Description
Risk appetite We have no appetite to make decisions or operate in a way that leads to legal risk, we apply robust controls
to manage these risks. We have a low tolerance for residual legal risk.
Risk measurement Due to the close links between our legal and operational risk frameworks, our tools to identify, assess,
manage and report operational risks also apply where such exposures have a legal risk impact.
Risk mitigation The Legal team provides specialist advice and support to all business units to ensure we effectively manage
legal risk. They help to implement a strong legal risk culture throughout our business using guidelines,
policies and procedures and specific assistance on a product, service, transaction or arrangement basis and
make decisions on whether legal advice should be sourced internally or externally.
Risk monitoring and
reporting
We have developed our internal legal risk reporting framework to improve the visibility of the Santander
UK-wide legal risk profile. We provide regular updates of our key legal risks, issues or breaches, to senior
management and the Board through our Legal & Regulatory function. This is in addition to reports issued by
the business.
2018 compared to 2017
The legal risk profile of the Santander UK group was heightened but broadly stable during the course of 2018. In 2018 we reviewed our
panel of law firms we use to obtain external legal advice and services. We also refreshed the process for appointing a firm to the panel, to
provide greater control around such engagement. We also made significant progress throughout 2018 to implement or embed new
regulation, particularly in the following areas:
– Ensuring Santander UK’s structure, governance frameworks, policies and arrangements adhere to ring-fencing rules or, where
necessary, ensuring appropriate waivers are in place
– Meeting key milestones in the implementation of the PSD2 requirements
– The initial margin regime under European Market Infrastructure Regulation (EMIR) was implemented in International Swaps and
Derivatives Association (ISDA) master agreements with the applicable financial counterparties
– The revision of payment account terms and conditions to address the standardised terminology requirements under the Payment
Accounts Regulations.
We plan to continue to evolve and embed the legal risk framework in 2019, with a particular focus on improved legal risk reporting and
management.
STRATEGIC RISK
Strategic risk can adversely affect our long-term success as it could lead to our business model becoming out of date, ineffective, or
inconsistent with our strategic goals. This could arise if we:
– Have a partial picture of our operating environment. This can include the economy, new rules and regulations, shifting customer
expectations, competitor activity and changes in technology
– Misjudge our capabilities, or ability to implement our strategy
– Pursue initiatives like acquisitions that might not fit with our business model or miss opportunities that we could benefit from.
Strategic risk management Description
Risk appetite We have a low to moderate appetite for strategic risk. This limits the risks we are prepared to take to achieve
our strategic objectives and is aligned to our balanced, customer-centric business model.
Risk measurement Our Board and senior management regularly review potential risks associated with our operations and plans
to ensure we stay within our risk appetite.
Risk mitigation We manage strategic risk by having a clear and consistent strategy that takes account of both external factors
and our own capabilities. We have an effective planning process which ensures we refine, strengthen, and
adapt our strategy to reflect changes in the environment and identify key risks and opportunities.
Risk monitoring and
reporting
We closely track our business environment, including long-term trends that might affect us in the future. As
part of this, we report a range of indicators to track our performance.
2018 compared to 2017
Our business environment is always changing, and this affects how we do business.
– In 2018, the UK economy continued to perform better than many initial expectations following the EU referendum. However, significant
uncertainty still remains and there are a range of possible outcomes, including some which could have an adverse impact. As the UK’s
leading full-service scale challenger, with a resilient balance sheet and a record of achieving consistent profitability through uncertain
times, we believe we are well-placed to continue to deliver our strategy.
– Competitive pressure remained high in 2018. This was mainly from established players, but new technology-led entrants also made
progress and could disrupt the market in the longer term. We expect these trends to continue in 2019; however we believe our
customer-focused business model and strategy, together with our adaptable and innovative approach, will enable our continued
success. We continue to embrace new technology, for example through the launch of our new Digital Investment Advisor and by
regularly reviewing opportunities to partner with Fintech companies. This includes opportunities identified through Banco Santander’s
InnoVentures fund which invests in companies with proven expertise leveraging technology which could benefit our customers.
– Overall, we continue to embrace change and have made good progress towards our strategic goals.
ˆ200G2Mlv!2Z&K#ugqŠ200G2Mlv!2Z&K#ugq
628340 TX 126SANTANDERFORM 20-F (SAN UK PL
04-Mar-2019 01:37 ESTHTMLON
Donnelley Financial EGV gopad0dc 4*ESS 0C
VDI-W7-PFD-037812.9.12.0
Page 1 of 1
Annual Report 2018 | Risk review
REPUTATIONAL RISK
Our key reputational risks arise from failures in corporate governance or management, failing to treat our customers fairly, the actual or perceived way we
do business, and the sectors and countries we deal with. They also result from how our clients and those who act for us conduct themselves, and how
business is conducted in our industry. External factors may also present a reputational risk to us. These can include the macro environment and the
performance of the sector. Sustained damage to our reputation could have a material impact on our ability to operate fully. In turn, this could affect our
financial performance and prospects. Reputational risk is not static; today’s decisions may be judged by different standards tomorrow. We build this into
our risk culture, evaluation and sanction procedures.
Reputational risk management Description
Risk appetite We have a low appetite for reputational risk, which is agreed by the Board at least annually. We express it in terms of the risk
measures set out below.
Risk measurement We assess our exposure to reputational risk daily. We base this on professional judgement and analysis of social, print, and
broadcast media alongside the views of political and market commentators. We also commission independent third parties to
analyse our activities and those of our UK peers to identify significant reputational events, or a prolonged deterioration in our
reputation and any sector level or thematic issues that may impact our wider business. We also measure the perception of
Santander UK amongst key stakeholder groups through regular interactions, and perform annual reviews of staff sentiment.
We review our reputation daily through media and political interactions and updates, and through weekly reputation reports
provided by an external supplier.
Risk mitigation Our business units consider reputational risk as part of their operational risk and control assessments. We also consider it as
part of our new product assessments. Our Corporate Communications, Legal and Marketing team helps our business units
to mitigate reputational risk, and agree action plans as needed. They do this as part of their overall role to monitor, build and
protect our reputation and brand.
Risk monitoring and
reporting
We monitor and report reputational risks and issues on a timely basis. Our Reputational Risk Forum is responsible for
reviewing, monitoring and escalating to Board level key decisions around financial and non-financial reputational risks. It also
has regular and ad- hoc meetings to discuss the risks we face. We escalate them to the ERCC and Board Responsible
Banking Committee, as needed. Our Corporate Communications, Legal and Marketing team also reports regularly to our
Executive Committee on Corporate Social Responsibility, Sustainability and Public Affairs policies. They do this from an
environment, community and sector point of view.
2018 compared to 2017
In 2018, we considered the potential reputational risk impact arising from the FCA publishing their Final Notice announcing the results of their investigation
into the issues identified and the subsequent actions we took in relation to our historical probate and bereavement practices. This included the completion
of the operational improvements that started in 2015 to our Probate and Bereavement processes and which we describe in more detail in the ‘Operational
risk’ section. We further strengthened our approach to managing reputational risk across the business and have successfully embedded the Reputational
Risk Forum and wider framework, which was introduced in 2017. We enhanced our reputational risk appetite and agreed escalation processes. Our
Reputational Risk Forum, meet regularly to discuss any emerging or material risks we face. We also formalised a Reputational Risk Register, which helps
us to track and monitor live risks, and we embedded reputational risk input into the ERCC and the Board Responsible Banking Committee. This ensure
clear visibility and discussion of all material reputational risk issues at Board level.
Throughout 2018, we worked closely with the business on communication plans for key events such as preparing for the UK’s exit from the EU and
implementing our ring-fencing plans. We have made significant announcements in Milton Keynes and Bootle, Merseyside confirming our commitment to
these communities and investing in new campuses in both locations. We have continued to promote the community and wider society support that
Santander UK provides through our Corporate Social Responsibility work, and the Santander Cycles Schemes in London and Milton Keynes.
MODEL RISK
Our key model risks arise from potential flaws in our modelling techniques, or the incorrect use of a model. They include risks arising from model data,
systems, development, performance and governance. The most material models we use help us calculate our regulatory capital (IRB), perform stress
tests and estimate our credit impairments. Increased regulatory standards have influenced how we manage model risk. We have responded to this by
improving our governance documentation, investing in additional resources and improving systems for management and control activities.
Model risk management Description
Risk appetite We express our model risk appetite through the risk assessments of our most material risk models. The Board agrees this at
least annually.
Risk measurement We consider both the percentage of models that have been independently assessed, as well as the outcome of those
reviews, in our measurement of model risk.
Risk mitigation We mitigate model risk through controls over the use of models throughout their lifecycle. We maintain a central model
inventory that includes data on owners, uses and key dates. We assess how important each model is to our business. We
track recommendations from independent reviews through to resolution. We also maintain a clear approval path for new
models, updates and performance tracking.
Risk monitoring and
reporting
We report model risks and issues using model risk management and control forums. We escalate issues to the ERCC when
necessary, or if our risk appetite is breached.
2018 compared to 2017
The introduction of IFRS 9 in 2018 increased the level of model risk in our portfolio due to the development of new models. Our Risk division had
pre-existing Basel and behavioural scorecards. We created new variants of these models to deal with significant credit deterioration, lifetime expected
credit losses and forward economic guidance as required by IFRS 9. Our impairment models vary in complexity and inputs depending on the size of the
portfolio, the amount of data available and the sophistication of the market concerned. The risk modelling function followed our standard governance
processes for developing and independently validating new models.
In addition to our focus on developing new models for IFRS 9 purposes, we performed a self-assessment against the new regulatory policy and
supervisory statement issued by the PRA in 2018 related to stress test models. The principles are closely aligned to our existing model risk framework, so
we did not need to make any significant changes. We further clarified the roles of Model Owners and Model Users, and supplemented our Model Risk
Appetite with additional performance indicators. We maintain a risk-based approach to both management and control, for example focusing independent
model review on the more material models, such as those related to IFRS 9, or those with specific regulatory standards defined.
126 Santander UK plc
ˆ200G2Mlv!2ZQZV9g{Š200G2Mlv!2ZQZV9g{
628340 TX 127SANTANDERFORM 20-F (SAN UK PL
04-Mar-2019 00:46 ESTHTMLON
Donnelley Financial EGV gopad0dc 11*ESS 0C
VDI-W7-PFD-037812.9.12.0
bar5
Page 1 of 1
Financial statements
Contents
Audit report 128
Primary financial statements 134
Consolidated Income Statement 134
Consolidated Statement of Comprehensive
Income 135
Consolidated Balance Sheet 136
Consolidated Cash Flow Statement 137
Consolidated Statement of Changes in
Equity 138
Notes to the financial statements 142
Santander UK plc 127
ˆ200G2Mlv!4TwVcL6=Š200G2Mlv!4TwVcL6=
628340 TX 128SANTANDERFORM 20-F (SAN UK PL
11-Mar-2019 05:32 ESTHTMLON
Donnelley Financial EGV sring0dc 9*ESS 0C
VDI-W7-PFL-136512.9.12.0
Page 1 of 1
Annual Report 2018 | Financial statements
Report of Independent Registered Public Accounting Firm
To the Board of Directors and Shareholders of Santander UK plc
Opinion on the Financial Statements
We have audited the accompanying consolidated balance sheet of Santander UK plc and its subsidiaries (the “Company”) as of 31 December 2018 and
2017, and the related consolidated income statement, consolidated statement of comprehensive income, consolidated cash flow statement, and
consolidated statement of changes in equity for each of the three years in the period ended 31 December 2018, including the related notes (collectively
referred to as the “consolidated financial statements”). In our opinion, the consolidated financial statements present fairly, in all material respects, the
financial position of the Company as of 31 December 2018 and 2017, and the results of its operations and its cash flows for each of the three years in the
period ended 31 December 2018 in conformity with International Financial Reporting Standards as issued by the International Accounting Standards
Board and with International Financial Reporting Standards as adopted by the European Union.
Change in Accounting Principle
As discussed in Note 1 to the consolidated financial statements, the Company changed the manner in which it accounts for financial instruments in 2018.
Basis for Opinion
These consolidated financial statements are the responsibility of the Company’s management. Our responsibility is to express an opinion on the
Company’s consolidated financial statements based on our audits. We are a public accounting firm registered with the Public Company Accounting
Oversight Board (United States) (“PCAOB”) and are required to be independent with respect to the Company in accordance with the U.S. federal
securities laws and the applicable rules and regulations of the Securities and Exchange Commission and the PCAOB.
We conducted our audits of these consolidated financial statements in accordance with the standards of the PCAOB. Those standards require that we
plan and perform the audit to obtain reasonable assurance about whether the consolidated financial statements are free of material misstatement, whether
due to error or fraud. The Company is not required to have, nor were we engaged to perform, an audit of its internal control over financial reporting. As
part of our audits we are required to obtain an understanding of internal control over financial reporting but not for the purpose of expressing an opinion on
the effectiveness of the Company’s internal control over financial reporting. Accordingly, we express no such opinion.
Our audits included performing procedures to assess the risks of material misstatement of the consolidated financial statements, whether due to error or
fraud, and performing procedures that respond to those risks. Such procedures included examining, on a test basis, evidence regarding the amounts and
disclosures in the consolidated financial statements. Our audits also included evaluating the accounting principles used and significant estimates made by
management, as well as evaluating the overall presentation of the consolidated financial statements. We believe that our audits provide a reasonable
basis for our opinion.
PricewaterhouseCoopers LLP
London, UK
11 March 2019
We have served as the Company’s auditor since 2016.
128 Santander UK plc

ˆ200G2Mlv!2ZQfk16QŠ200G2Mlv!2ZQfk16Q
628340 TX 129SANTANDERFORM 20-F (SAN UK PL
04-Mar-2019 00:46 ESTHTMLON
Donnelley Financial EGV gopad0dc 3*ESS 0C
VDI-W7-PFD-037812.9.12.0
bar5
Page 1 of 1
> Audit Report
Santander UK plc 129
This page left intentionally blank

ˆ200G2Mlv!2L=KYr6;Š200G2Mlv!2L=KYr6;
628340 TX 130SANTANDERFORM 20-F (SAN UK PL
02-Mar-2019 13:47 ESTHTMLON
Donnelley Financial EGV bashs0dc 2*ESS 0C
VDI-W7-PFL-152112.9.12.0
Page 1 of 1
Annual Report 2018 | Financial statements
This page left intentionally blank
130 Santander UK plc

ˆ200G2Mlv!2LdcFug?Š200G2Mlv!2LdcFug?
628340 TX 131SANTANDERFORM 20-F (SAN UK PL
02-Mar-2019 13:56 ESTHTMLON
Donnelley Financial EGV bashs0dc 3*ESS 0C
VDI-W7-PFL-152112.9.12.0
bar5
Page 1 of 1
> Audit Report
Santander UK plc 131
This page left intentionally blank

ˆ200G2Mlv!2LdD5tgÄŠ200G2Mlv!2LdD5tg˜
628340 TX 132SANTANDERFORM 20-F (SAN UK PL
02-Mar-2019 13:53 ESTHTMLON
Donnelley Financial EGV bashs0dc 2*ESS 0C
VDI-W7-PFL-152112.9.12.0
Page 1 of 1
Annual Report 2018 | Financial statements
This page left intentionally blank
132 Santander UK plc

ˆ200G2Mlv!2Lg56i6@Š200G2Mlv!2Lg56i6@
628340 TX 133SANTANDERFORM 20-F (SAN UK PL
02-Mar-2019 13:58 ESTHTMLON
Donnelley Financial EGV bashs0dc 3*ESS 0C
VDI-W7-PFL-152112.9.12.0
bar5
Page 1 of 1
> Audit Report
Santander UK plc 133
This page left intentionally blank
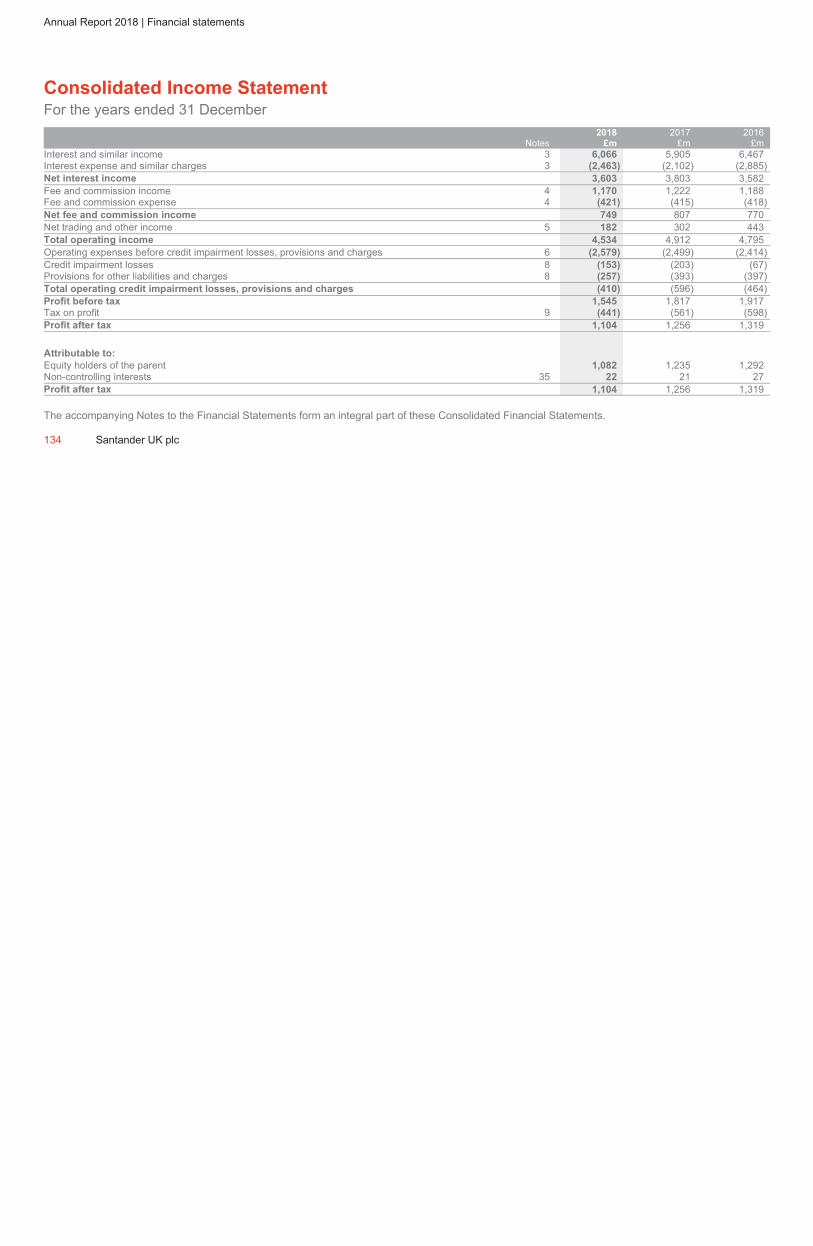
ˆ200G2Mlv!2=2@1u6†Š200G2Mlv!2=2@1u6
628340 TX 134SANTANDERFORM 20-F (SAN UK PL
04-Mar-2019 01:41 ESTHTMLON
Donnelley Financial EGV gopad0dc 10*ESS 0C
VDI-W7-PFD-037812.9.12.0
Page 1 of 1
Annual Report 2018 | Financial statements
Consolidated Income Statement
For the years ended 31 December
Notes
2018
£m
2017
£m
2016
£m
Interest and similar income 3 6,066 5,905 6,467
Interest expense and similar charges 3 (2,463) (2,102) (2,885)
Net interest income 3,603 3,803 3,582
Fee and commission income 4 1,170 1,222 1,188
Fee and commission expense 4 (421) (415) (418)
Net fee and commission income 749 807 770
Net trading and other income 5 182 302 443
Total operating income 4,534 4,912 4,795
Operating expenses before credit impairment losses, provisions and charges 6 (2,579) (2,499) (2,414)
Credit impairment losses 8 (153) (203) (67)
Provisions for other liabilities and charges 8 (257) (393) (397)
Total operating credit impairment losses, provisions and charges (410) (596) (464)
Profit before tax 1,545 1,817 1,917
Tax on profit 9 (441) (561) (598)
Profit after tax 1,104 1,256 1,319
Attributable to:
Equity holders of the parent 1,082 1,235 1,292
Non-controlling interests 35 22 21 27
Profit after tax 1,104 1,256 1,319
The accompanying Notes to the Financial Statements form an integral part of these Consolidated Financial Statements.
134 Santander UK plc

ˆ200G2Mlv!2=2#C3gpŠ200G2Mlv!2=2#C3gp
628340 TX 135SANTANDERFORM 20-F (SAN UK PL
04-Mar-2019 01:41 ESTHTMLON
Donnelley Financial EGV gopad0dc 11*ESS 0C
VDI-W7-PFD-037812.9.12.0
bar5
Page 1 of 1
> Primary financial statements
Santander UK plc 135
Consolidated Statement of Comprehensive Income
For the years ended 31 December
2018
£m
2017
£m
2016
£m
Profit after tax 1,104 1,256 1,319
Other comprehensive income:
Other comprehensive income that may be reclassified to profit or loss subsequently:
Available-for-sale securities:(1)
– Change in fair value 80 127
– Income statement transfers (54) (115)
– Taxation (6) (16)
20 (4)
Movement in fair value reserve (debt instruments):(1)
– Change in fair value (74)
– Income statement transfers 21
– Taxation 13
(40)
Cash flow hedges:
– Effective portion of changes in fair value 793 (238) 4,365
– Income statement transfers (752) (94) (4,076)
– Taxation (13) 89 (72)
28 (243) 217
Currency translation on foreign operations – – (3)
Net other comprehensive income that may be reclassified to profit or loss subsequently (12) (223) 210
Other comprehensive income that will not be reclassified to profit or loss subsequently:
Pension remeasurement:
– Change in fair value 470 (103) (528)
– Taxation (118) 26 133
352 (77) (395)
Own credit adjustment:
– Change in fair value 84 (29) –
– Taxation (21) 7 –
63 (22) –
Net other comprehensive income that will not be reclassified to profit or loss subsequently 415 (99) (395)
Total other comprehensive income net of tax 403 (322) (185)
Total comprehensive income 1,507 934 1,134
Attributable to:
Equity holders of the parent 1,486 913 1,107
Non-controlling interests 21 21 27
Total comprehensive income 1,507 934 1,134
(1) Following the adoption of IFRS 9, a fair value reserve was introduced to replace the available-for-sale reserve, as described in Note 1.
The accompanying Notes to the Financial Statements form an integral part of these Consolidated Financial Statements.

ˆ200G2Mlv!2aYaGNgPŠ200G2Mlv!2aYaGNgP
628340 TX 136SANTANDERFORM 20-F (SAN UK PL
04-Mar-2019 03:00 ESTHTMLON
Donnelley Financial EGV annas1dc 10*ESS 0C
VDI-W7-PFD-029812.9.12.0
Page 1 of 1
Annual Report 2018 | Financial statements
Consolidated Balance Sheet
At 31 December
Notes
2018
£m
2017
£m
Assets
Cash and balances at central banks 19,747 32,771
Financial assets at fair value through profit or loss:
– Trading assets 11 – 30,555
– Derivative financial instruments 12 5,259 19,942
– Other financial assets at fair value through profit or loss 13 5,617 2,096
Financial assets at amortised cost:
– Loans and advances to customers(1) 14 201,289 199,340
– Loans and advances to banks(1) 2,799 3,463
– Reverse repurchase agreements – non trading(1)
17 21,127 2,614
– Other financial assets at amortised cost(2)
18 7,229
Financial assets at fair value through other comprehensive income(2) 19 13,302
Financial investments(2) 20 17,611
Interests in other entities 21 88 73
Intangible assets 22 1,808 1,742
Property, plant and equipment 1,832 1,598
Current tax assets 9 153 –
Retirement benefit assets 31 842 449
Other assets 2,280 2,511
Total assets 283,372 314,765
Liabilities
Financial liabilities at fair value through profit or loss:
– Trading liabilities 23 – 31,109
– Derivative financial instruments 12 1,369 17,613
– Other financial liabilities at fair value through profit or loss 24 6,286 2,315
Financial liabilities at amortised cost:
– Deposits by customers 25 178,090 183,648
– Deposits by banks(1)
26 17,221 12,708
– Repurchase agreements – non trading(1) 27 10,910 1,076
– Debt securities in issue 28 46,692 42,633
– Subordinated liabilities 29 3,601 3,793
Other liabilities 2,448 2,730
Provisions 30 509 558
Current tax liabilities 9 – 3
Deferred tax liabilities 9 223 88
Retirement benefit obligations 31 114 286
Total liabilities 267,463 298,560
Equity
Share capital 33 3,119 3,119
Share premium 33 5,620 5,620
Other equity instruments 34 1,991 2,281
Retained earnings 4,744 4,732
Other reserves 284 301
Total shareholders’ equity 15,758 16,053
Non-controlling interests 35 151 152
Total equity 15,909 16,205
Total liabilities and equity 283,372 314,765
(1) From 1 January 2018, the non-trading repurchase agreements and non-trading reverse repurchase agreements that are held at amortised cost are now presented as separate lines in the balance sheet, as described in
Note 1. Comparatives are represented accordingly.
(2) On adoption of IFRS 9, the ‘financial investments’ balance sheet line item was split between ‘other financial assets at amortised cost’ and ‘financial assets at FVOCI’. This approach aligns the balance sheet line items to
the IFRS 9 accounting classifications and provides a clearer understanding of our financial position.
The accompanying Notes to the Financial Statements form an integral part of these Consolidated Financial Statements.
The Financial Statements were approved and authorised for issue by the Board on 26 February 2019 and signed on its behalf by:
Nathan Bostock Antonio Roman
Chief Executive Officer Chief Financial Officer
Company Registered Number: 2294747
136 Santander UK plc

ˆ200G2Mlv!2=318X6ÅŠ200G2Mlv!2=318X6¯
628340 TX 137SANTANDERFORM 20-F (SAN UK PL
04-Mar-2019 01:42 ESTHTMLON
Donnelley Financial EGV gopad0dc 12*ESS 0C
VDI-W7-PFD-037812.9.12.0
bar5
Page 1 of 1
> Primary financial statements
Santander UK plc 137
Consolidated Cash Flow Statement
For the years ended 31 December
Notes
2018
£m
2017
£m
2016
£m
Cash flows from operating activities
Profit after tax 1,104 1,256 1,319
Adjustments for:
Non-cash items included in profit:
– Depreciation and amortisation 375 354 322
– Provisions for other liabilities and charges 257 393 397
– Impairment losses 189 257 132
– Corporation tax charge 441 561 598
– Other non-cash items 238 (208) (599)
– Pension charge for defined benefit pension schemes 79 32 26
1,579 1,389 876
Net change in operating assets and liabilities:
– Cash and balances at central banks (255) (25) (30)
– Trading assets 24,528 (941) (2,049)
– Derivative assets 14,683 5,529 (4,560)
– Other financial assets at fair value through profit or loss (3,635) 25 257
– Loans and advances to banks and customers (9,129) (1,832) (2,265)
– Other assets (246) (246) (121)
– Deposits by banks and customers 926 10,900 14,434
– Derivative liabilities (16,244) (5,490) 1,595
– Trading liabilities (31,101) 15,017 2,837
– Other financial liabilities at fair value through profit or loss 4,106 717 336
– Debt securities in issue (2,524) 132 409
– Other liabilities (556) (1,397) 1,589
(19,447) 22,389 12,432
Corporation taxes paid (391) (484) (507)
Effects of exchange rate differences 1,750 (574) 3,885
Net cash flows from operating activities (15,405) 23,976 18,005
Cash flows from investing activities
Investments in other entities 21 (66) – –
Proceeds from disposal of subsidiaries(1) 348 – 149
Purchase of property, plant and equipment and intangible assets (696) (542) (374)
Proceeds from sale of property, plant and equipment and intangible assets 26 52 65
Purchase of financial investments (7,002) (726) (9,539)
Proceeds from sale and redemption of financial investments 3,708 2,032 2,359
Net cash flows from investing activities (3,682) 816 (7,340)
Cash flows from financing activities
Issue of AT1 Capital Securities 34 – 500 –
Issuance costs of AT1 Capital Securities – (4) –
Issue of debt securities and subordinated notes 10,642 6,645 5,547
Issuance costs of debt securities and subordinated notes (23) (15) (17)
Repayment of debt securities and subordinated notes (6,281) (13,763) (11,352)
Repurchase of preference shares and other equity instruments 34 (290) – (7)
Dividends paid on ordinary shares 10 (1,139) (829) (419)
Dividends paid on preference shares and other equity instruments (157) (152) (128)
Dividends paid on non-controlling interests (22) (19) (12)
Net cash flows from financing activities 2,730 (7,637) (6,388)
Change in cash and cash equivalents (16,357) 17,155 4,277
Cash and cash equivalents at beginning of the year 42,226 25,705 20,351
Effects of exchange rate changes on cash and cash equivalents 160 (634) 1,077
Cash and cash equivalents at the end of the year 26,029 42,226 25,705
Cash and cash equivalents consist of:
Cash and balances at central banks 19,747 32,771 17,107
Less: regulatory minimum cash balances (636) (395) (370)
19,111 32,376 16,737
Net trading other cash equivalents – 5,953 6,537
Net non-trading other cash equivalents 6,918 3,897 2,431
Cash and cash equivalents at the end of the year 26,029 42,226 25,705
(1) In 2018, the Santander UK group sold a number of subsidiaries for a cash consideration of £348m (2017: £nil, 2016: £149m). The carrying value of the net assets disposed of was £348m (2017: £nil,
2016: £138m).
The accompanying Notes to the Financial Statements form an integral part of these Consolidated Financial Statements.

ˆ200G2Mlv!2=365ugÀŠ200G2Mlv!2=365ug
628340 TX 138SANTANDERFORM 20-F (SAN UK PL
04-Mar-2019 01:42 ESTHTMLON
Donnelley Financial EGV gopad0dc 10*ESS 0C
VDI-W7-PFD-037812.9.12.0
Page 1 of 1
Annual Report 2018 | Financial statements
Consolidated Statement of Changes in Equity
For the years ended 31 December
Other reserves Non-
Share
capital
£m
Share
premium
£m
Other equity
instruments
£m
Available-
for-sale(1)
£m
Fair
value(1)
£m
Cash flow
hedging
£m
Currency
translation
£m
Retained
earnings
£m
Total
£m
controlling
interests
£m
Total
£m
At 31 December 2017 3,119 5,620 2,281 68 228 5 4,732 16,053 152 16,205
Adoption of IFRS 9 (see
Note 1) – – – (68) 63 – – (187) (192) – (192)
At 1 January 2018 3,119 5,620 2,281 – 63 228 5 4,545 15,861 152 16,013
Profit after tax – – – – – – 1,082 1,082 22 1,104
Other comprehensive income,
net of tax:
– Fair value reserve (debt
instruments) – – – (40) – – – (40) – (40)
– Cash flow hedges – – – – 28 – – 28 – 28
– Pension remeasurement – – – – – – 353 353 (1) 352
– Own credit adjustment – – – – – – 63 63 – 63
Total comprehensive income – – – (40) 28 – 1,498 1,486 21 1,507
Other – – – – – – (45) (45) – (45)
Repurchase of other equity
instruments – – (290) – – – – (290) – (290)
Dividends on ordinary shares – – – – – – (1,139) (1,139) – (1,139)
Dividends on preference
shares and other equity
instruments – – – – – – (157) (157) – (157)
Dividends on non-controlling
interests – – – – – – – – (22) (22)
Tax on other equity
instruments – – – – – – 42 42 – 42
At 31 December 2018 3,119 5,620 1,991 23 256 5 4,744 15,758 151 15,909
At 1 January 2017 3,119 5,620 1,785 48 471 5 4,255 15,303 150 15,453
Profit after tax – – – – – – 1,235 1,235 21 1,256
Other comprehensive income,
net of tax:
– Available-for-sale securities – – – 20 – – – 20 – 20
– Cash flow hedges – – – – (243) – – (243) – (243)
– Pension remeasurement – – – – – – (77) (77) – (77)
– Own credit adjustment – – – – – – (22) (22) – (22)
Total comprehensive income – – – 20 (243) – 1,136 913 21 934
Issue of AT1 Capital Securities – – 496 – – – – 496 – 496
Dividends on ordinary shares – – – – – – (553) (553) – (553)
Dividends on preference
shares and other equity
instruments – – – – – – (152) (152) – (152)
Dividends on non-controlling
interests – – – – – – – – (19) (19)
Tax on other equity
instruments – – – – – – 46 46 – 46
At 31 December 2017 3,119 5,620 2,281 68 228 5 4,732 16,053 152 16,205
At 1 January 2016 3,119 5,620 1,792 52 254 8 4,048 14,893 135 15,028
Profit after tax – – – – – – 1,292 1,292 27 1,319
Other comprehensive income,
net of tax:
– Available-for-sale securities – – – (4) – – – (4) – (4)
– Cash flow hedges – – – – 217 – – 217 – 217
– Pension remeasurement – – – – – – (395) (395) – (395)
– Currency translation on
foreign operations – – – – – (3) – (3) – (3)
Total comprehensive income – – – (4) 217 (3) 897 1,107 27 1,134
Repurchase of other equity
instruments – – (7) – – – – (7) – (7)
Dividends on ordinary shares – – – – – – (593) (593) – (593)
Dividends on preference
shares and other equity
instruments – – – – – – (128) (128) – (128)
Dividends on non-controlling
interests – – – – – – – – (12) (12)
Tax on other equity
instruments – – – – – – 31 31 – 31
At 31 December 2016 3,119 5,620 1,785 48 471 5 4,255 15,303 150 15,453
(1) Following the adoption of IFRS 9, a fair value reserve was introduced to replace the available-for-sale reserve, as described in Note 1.
The accompanying Notes to the Financial Statements form an integral part of these Consolidated Financial Statements.
138 Santander UK plc

ˆ200G2Mlv!2SM!D86<Š200G2Mlv!2SM!D86<
628340 TX 139SANTANDERFORM 20-F (SAN UK PL
03-Mar-2019 07:00 ESTHTMLON
Donnelley Financial EGV shanv1dc 4*ESS 0C
VDI-W7-PFL-091012.9.12.0
bar5
Page 1 of 1
> Primary financial statements
Santander UK plc 139
This page left intentionally blank

ˆ200G2Mlv!2SN0Lq6eŠ200G2Mlv!2SN0Lq6e
628340 TX 140SANTANDERFORM 20-F (SAN UK PL
03-Mar-2019 07:01 ESTHTMLON
Donnelley Financial EGV shanv1dc 4*ESS 0C
VDI-W7-PFL-091012.9.12.0
Page 1 of 1
Annual Report 2018 | Financial statements
This page left intentionally blank
140 Santander UK plc

ˆ200G2Mlv!2SN5id6DŠ200G2Mlv!2SN5id6D
628340 TX 141SANTANDERFORM 20-F (SAN UK PL
03-Mar-2019 07:01 ESTHTMLON
Donnelley Financial EGV shanv1dc 4*ESS 0C
VDI-W7-PFL-091012.9.12.0
bar5
Page 1 of 1
> Primary financial statements
Santander UK plc 141
This page left intentionally blank
ˆ200G2Mlv!2=37hZg-Š200G2Mlv!2=37hZg-
628340 TX 142SANTANDERFORM 20-F (SAN UK PL
04-Mar-2019 01:42 ESTHTMLON
Donnelley Financial EGV gopad0dc 7*ESS 0C
VDI-W7-PFD-037812.9.12.0
Page 1 of 1
Annual Report 2018 | Financial statements
1. ACCOUNTING POLICIES
These financial statements are prepared for Santander UK plc (the Company) and the Santander UK plc group (the Santander UK group) under the UK
Companies Act 2006. The principal activity of the Santander UK group is the provision of an extensive range of personal financial services, and a wide
range of banking and financial services to personal, business and corporate customers. Santander UK plc is a public company, limited by shares and
incorporated in England and Wales having a registered office at 2 Triton Square, Regent’s Place, London, NW1 3AN, phone number 0870-607-6000. It is
an operating company undertaking banking and financial services transactions.
Basis of preparation
These financial statements incorporate the financial statements of the Company and entities controlled by the Company (its subsidiaries) made up to
31 December each year. The Consolidated Financial Statements have been prepared on the going concern basis using the historical cost convention,
except for financial assets and liabilities that have been measured at fair value. An assessment of the appropriateness of the adoption of the going
concern basis of accounting is disclosed in the statement of going concern in the Directors’ Report.
Compliance with International Financial Reporting Standards
The Santander UK group Consolidated Financial Statements have been prepared in accordance with IFRSs as issued by the IASB, including
interpretations issued by the IFRS Interpretations Committee (IFRS IC) of the IASB (together IFRS). The Santander UK group has also complied with its
legal obligation to comply with IFRSs as adopted by the European Union as there are no applicable differences between the two frameworks for the
periods presented.
The Company financial statements have been prepared in accordance with IFRSs as adopted by the European Union and as applied in accordance with
the provision of the UK Companies Act 2006. Disclosures required by IFRS 7 ‘Financial Instruments: Disclosure’ relating to the nature and extent of risks
arising from financial instruments, and IAS 1 ‘Presentation of Financial Statements’ relating to objectives, policies and processes for managing capital, can
be found in the Risk review. Those disclosures form an integral part of these financial statements.
Recent accounting developments
On 1 January 2018, the Santander UK group adopted IFRS 9 ‘Financial Instruments’ (IFRS 9) and IFRS 15 ‘Revenue from Contracts with
Customers’ (IFRS 15). The new or revised accounting policies are set out below.
The impact of applying IFRS 9 is disclosed in Note 44. The accounting policy changes for IFRS 9, set out below, have been applied from 1 January 2018.
Comparatives have not been restated. As a result of the change from IAS 39 to IFRS 9, some disclosures presented in respect of certain financial assets
are not comparable because their classification may have changed between the two standards. This means that some IFRS 9 disclosures are not directly
comparable and some disclosures that relate to information presented on an IAS 39 basis are no longer relevant in the current period. As explained in
Note 44, the classification and measurement changes to financial assets that arose on adoption of IFRS 9 have been aligned to the presentation in the
balance sheet. The Santander UK group decided to continue adopting IAS 39 hedge accounting and consequently there have been no changes to the
hedge accounting policies and practices following the adoption of IFRS 9. However, additional hedge accounting disclosure requirements of IFRS 7
‘Financial Instruments: Disclosures’ (IFRS 7) have been included in these financial statements.
In addition, non-trading repurchase agreements and non-trading reverse repurchase agreements that are held at amortised cost are now presented as
separate lines in the balance sheet. Previously, non-trading reverse repurchase agreements were included in ‘Loans and advances to banks’ and ‘Loans
and advances to customers’, and non-trading repurchase agreements were included in ‘Deposits by banks’. The new presentation, which is considered to
be more relevant to an understanding of our financial position, was adopted with effect from 1 January 2018, and comparatives are re-presented
accordingly. For the Santander UK group, the impact of this re-presentation on the balance sheet at 1 January 2017 was to decrease loans and advances
to banks by £1,462m, increasing non trading reverse repurchase agreements by the same amount, and to decrease deposits by banks by £2,384m,
increasing non trading repurchase agreements by the same amount. For the Company, the impact of this re-presentation on the balance sheet at
1 January 2017 was to decrease loans and advances to banks by £476m, increasing non trading reverse repurchase agreements by the same amount,
and to decrease deposits by banks by £2,933m, and increase non trading repurchase agreements by the same amount.
The application of IFRS 15 had no material impact on the Santander UK group as there were no significant changes in the recognition of in-scope income.
The accounting policy changes for IFRS 15 are set out in the Revenue recognition policy below.
Future accounting developments
At 31 December 2018, the Santander UK group has not yet adopted the following significant new or revised standards and interpretations, and
amendments thereto, which have been issued but which are not yet effective for the Santander UK group:
– IFRS 16 ‘Leases’ (IFRS 16) – In January 2016, the IASB issued IFRS 16. The standard is effective for annual periods beginning on or after 1 January
2019. IFRS 16 sets out the principles for the recognition, measurement, presentation and disclosure of leases for both lessees and lessors. For lessee
accounting, IFRS 16 introduces a single lessee accounting model and requires a lessee to recognise a right-of-use (ROU) asset representing its right
to use the underlying leased asset and a lease liability representing its obligation to make lease payments for all leases with a term of more than 12
months, unless the underlying asset is of low value. For lessor accounting, IFRS 16 substantially carries forward the lessor accounting requirements
from the existing leasing standard (IAS 17) and a lessor continues to classify its leases as operating leases or finance leases and to account for those
two types of leases differently.
The Santander UK group has elected to apply the modified retrospective approach whereby the ROU asset at the date of initial application is measured
at an amount equal to the lease liability. The ROU asset is adjusted for any prepaid lease payments and incentives relating to the relevant leases that
were recognised on the balance sheet at 31 December 2018. It includes the estimated costs of restoring the underlying assets to the condition required
by the lease terms and conditions.
For the Santander UK group, the application of IFRS 16 at 1 January 2019 is expected to increase property, plant and equipment by £210m (being the
net increase in ROU assets referred to above), reduce other assets by £12m, increase other liabilities by £181m from recognising lease liabilities, and
increase provisions by £17m. There is expected to be no impact on shareholders’ equity. For the Company, the application of IFRS 16 is expected to
increase property, plant and equipment by £223m, reduce other assets by £12m, increase other liabilities by £194m, from recognising lease liabilities,
and increase provisions by £17m, with no impact on shareholders’ equity. In arriving at the estimated impact, as well as excluding leases whose terms
end within 12 months, the Santander UK group applies a single discount rate to a portfolio of leases with similar remaining lease terms. In addition to
the choice of transition approach, the determination of the discount rate is the most significant area of judgement. The Santander UK group applies an
incremental borrowing rate (based on 3-month GBP LIBOR plus a credit spread to reflect the cost of raising unsecured funding in the wholesale
markets) appropriate to the relevant remaining lease term. The lease liabilities shown above differ from the amount of operating lease commitments
disclosed in Note 32 due to the effects of discounting the lease liabilities and excluding short-term leases that are outside the scope of IFRS 16.
142 Santander UK plc

ˆ200G2Mlv!2Qx8hHgsŠ200G2Mlv!2Qx8hHgs
628340 TX 143SANTANDERFORM 20-F (SAN UK PL
03-Mar-2019 03:55 ESTHTMLON
Donnelley Financial EGV manra0dc 3*ESS 0C
VDI-W7-PFL-165312.9.12.0
bar5
Page 1 of 2
> Notes to the financial statements
– Amendment to IAS 12 ‘Income Taxes’ (part of ‘Annual Improvements to IFRS Standards 2015-2017 Cycle’) – In December 2017, as
part of its annual improvements project, the IASB issued an amendment to IAS 12 to clarify that the income tax consequences of
dividends on financial instruments classified as equity should be recognised according to where the past transactions or events that
generated distributable profits were recognised. This means that, to the extent that profits from which dividends on equity instruments
were recognised in the income statement, the income tax consequences would be similarly recognised in the same statement. The
amendment, which is applied retrospectively and is effective for annual reporting periods beginning on or after 1 January 2019, is
awaiting EU endorsement at the time of approving these Consolidated Financial Statements. The effects of the amendment are
expected to lead to a reduction in the effective tax rate where the tax relief on coupons in respect of AT1 capital securities would be
recognised in the income statement rather than in equity.
Comparative information
As required by US public company reporting requirements, these financial statements include two years of comparative information for the
consolidated income statement, consolidated statement of comprehensive income, consolidated statement of changes in equity,
consolidated statement of cash flows and related Notes.
Consolidation
a) Subsidiaries
The Consolidated Financial Statements incorporate the financial statements of the Company and entities (including structured entities)
controlled by it and its subsidiaries. Control is achieved where the Company has (i) power over the investee; (ii) is exposed, or has rights,
to variable returns from its involvement with the investee; and (iii) has the ability to use its power to affect its returns. The Company
reassesses whether or not it controls an investee if facts and circumstances indicate that there are changes to one or more of the three
elements of control listed above. When the Company has less than a majority of the voting rights of an investee, it has power over the
investee when the voting rights are sufficient to give it the practical ability to direct the relevant activities of the investee unilaterally. The
Company considers all relevant facts and circumstances in assessing whether or not the Company’s voting rights in an investee are
sufficient to give it power, including:
– The size of the Company’s holding of voting rights relative to the size and dispersion of holdings of the other vote holders
– Potential voting rights held by the Company, other vote holders or other parties
– Rights arising from other contractual arrangements
– Any additional facts and circumstances that indicate that the Company has, or does not have, the current ability to direct the relevant
activities at the time that decisions need to be made, including voting patterns at previous shareholders’ meetings.
Consolidation of a subsidiary begins when the Company obtains control over the subsidiary and ceases when the Company loses control
of the subsidiary. Specifically, the results of a subsidiary acquired or disposed of during the year are included in the consolidated income
statement and the consolidated statement of comprehensive income from the date the Company gains control until the date when the
Company ceases to control the subsidiary. Inter-company transactions, balances and unrealised gains on transactions between Santander
UK group companies are eliminated; unrealised losses are also eliminated unless the cost cannot be recovered.
The acquisition method of accounting is used to account for the acquisition of subsidiaries which meet the definition of a business. The
cost of an acquisition is measured at the fair value of the assets given up, shares issued or liabilities undertaken at the date of acquisition.
Acquisition-related costs are expensed as incurred. The excess of the cost of acquisition, as well as the fair value of any interest previously
held, over the fair value of the Santander UK group’s share of the identifiable net assets of the subsidiary at the date of acquisition is
recorded as goodwill. When the Santander UK group loses control of a subsidiary, the profit or loss on disposal is calculated as the
difference between (i) the aggregate of the fair value of the consideration received and the fair value of any retained interest and (ii) the
previous carrying amount of the assets (including goodwill), less liabilities of the subsidiary and any non-controlling interests. Amounts
previously recognised in other comprehensive income in relation to the subsidiary are accounted for (i.e. reclassified to profit or loss or
transferred directly to retained earnings) in the same manner as would be required if the relevant assets or liabilities are disposed of. The
fair value of any investment retained in a former subsidiary at the date when control is lost is regarded as the fair value on initial recognition
for subsequent accounting under IFRS 9 or, when applicable, the costs on initial recognition of an investment in an associate or joint
venture.
Business combinations between entities under common control (i.e. fellow subsidiaries of Banco Santander SA, the ultimate parent) are
outside the scope of IFRS 3 – ‘Business Combinations’, and there is no other guidance for such transactions under IFRS. The Santander
UK group elects to account for business combinations between entities under common control at their book values in the acquired entity by
including the acquired entity’s results from the date of the business combination and not restating comparatives. Reorganisations of
entities within the Santander UK group are also accounted for at their book values.
Interests in subsidiaries are eliminated during the preparation of the Consolidated Financial Statements. Interests in subsidiaries in the
Company unconsolidated financial statements are held at cost subject to impairment.
b) Joint ventures
Joint ventures are joint arrangements whereby the parties that have joint control of the arrangement have rights to its net assets. Joint
control is the contractually agreed sharing of control of an arrangement, which exists only when decisions about the relevant activities
require unanimous consent of the parties sharing control. Accounting policies of joint ventures have been aligned to the extent there are
differences from the Santander UK group’s policies. Investments in joint ventures are accounted for by the equity method of accounting
and are initially recorded at cost and adjusted each year to reflect the Santander UK group’s share of their post-acquisition results. When
the Santander UK group’s share of losses of a joint venture exceed its interest in that joint venture, the Santander UK group discontinues
recognising its share of further losses. Further losses are recognised only to the extent that the Santander UK group has incurred legal or
constructive obligations or made payments on behalf of the joint venture.
Foreign currency translation
Items included in the financial statements of each entity in the Santander UK group are measured using the currency that best reflects the
economic substance of the underlying events and circumstances relevant to that entity (the functional currency). The Consolidated
Financial Statements are presented in sterling, which is the functional currency of the Company.
Income statements and cash flows of foreign entities are translated into the Santander UK group’s presentation currency at average
exchange rates for the year and their balance sheets are translated at the exchange rates ruling on 31 December. Exchange differences
on the translation of the net investment in foreign entities are recognised in other comprehensive income. When a foreign entity is sold,
such exchange differences are recognised in the income statement as part of the gain or loss on sale.
Foreign currency transactions are translated into the functional currency of the entity involved at the exchange rates prevailing at the dates
of the transactions. Foreign exchange gains and losses resulting from the settlement of such transactions and from the translation of
monetary assets and liabilities denominated in foreign currencies are recognised in the income statement unless recognised in other
comprehensive income in connection with a cash flow hedge. Non-monetary items denominated in a foreign currency measured at
historical cost are not retranslated. Exchange rate differences arising on non-monetary items measured at fair value are recognised in the
consolidated income statement except for differences arising on equity securities measured at FVOCI (2017: available-for-sale), which are
recognised in other comprehensive income.

ˆ200G2Mlv!2Qx8hHgsŠ200G2Mlv!2Qx8hHgs
628340 TX 143SANTANDERFORM 20-F (SAN UK PL
03-Mar-2019 03:55 ESTHTMLON
Donnelley Financial EGV manra0dc 3*ESS 0C
VDI-W7-PFL-165312.9.12.0
bar5
Page 2 of 2Santander UK plc 143
ˆ200G2Mlv!2QxJHbgUŠ200G2Mlv!2QxJHbgU
628340 TX 144SANTANDERFORM 20-F (SAN UK PL
03-Mar-2019 03:55 ESTHTMLON
Donnelley Financial EGV manra0dc 3*ESS 0C
VDI-W7-PFL-165312.9.12.0
Page 1 of 1
Annual Report 2018 | Financial statements
Revenue recognition
a) Interest income and expense
Interest and similar income comprises interest income on financial assets measured at amortised cost, investments in debt instruments measured at
FVOCI (2017: available-for-sale) and interest income on hedging derivatives. Interest expense and similar charges comprises interest expense on
financial liabilities measured at amortised cost, and interest expense on hedging derivatives. Interest income on financial assets measured at amortised
cost, investments in debt instruments measured at FVOCI (2017: available-for-sale) and interest expense on financial liabilities other than those at fair
value through profit or loss (FVTPL) is determined using the effective interest rate method.
The effective interest rate is the rate that discounts the estimated future cash payments or receipts over the expected life of the instrument or, when
appropriate, a shorter period, to the gross carrying amount of the financial asset (i.e. its amortised cost before any impairment allowance) or to the
amortised cost of a financial liability. When calculating the effective interest rate, the future cash flows are estimated after considering all the contractual
terms of the instrument excluding expected credit losses. The calculation includes all amounts paid or received by the Santander UK group that are an
integral part of the overall return, direct incremental transaction costs related to the acquisition, issue or disposal of the financial instrument and all other
premiums or discounts.
Interest income is calculated by applying the effective interest rate to the gross carrying amount of financial assets, except for financial assets that have
subsequently become credit-impaired (or ‘stage 3’), for which interest revenue is calculated by applying the effective interest rate to their amortised cost
(i.e. net of the ECL provision). For more information on stage allocations of credit risk exposures, see ‘Significant increase in credit risk’ in the ‘Santander
UK group level – credit risk management’ section of the Risk Review
b) Fee and commission income and expense
Fees and commissions that are not an integral part of the effective interest rate are recognised when the service is performed. Most fee and commission
income is recognised at a point in time. Certain commitment, upfront and management fees are recognised over time but are not material. For retail and
corporate products, fee and commission income consists principally of collection services fees, commission on foreign currencies, commission and other
fees received from retailers for processing credit card transactions, fees received from other credit card issuers for providing cash advances for their
customers through the Santander UK group’s branch and ATM networks, annual fees payable by credit card holders and fees for non-banking financial
products.
For insurance products, fee and commission income consists principally of commissions and profit share arising from the sale of building and contents
insurance and life protection insurance. Commissions arising from the sale of buildings and contents insurance are recognised over the period of
insurance cover, adjusted to take account of cancelled policies. Profit share income from the sale of buildings and contents insurance which is not subject
to any adjustment is recognised when the profit share income is earned. Commissions and profit share arising from the sale of life protection insurance is
subject to adjustment for cancellations of policies within 3 years from inception.
Fee and commission income which forms an integral part of the effective interest rate of a financial instrument (for example certain loan commitment fees)
is recognised as an adjustment to the effective interest rate and recorded in ‘Interest income’.
c) Dividend income
Except for equity securities classified as trading assets or financial assets held at fair value through profit or loss, described below, dividend income is
recognised when the right to receive payment is established. This is the ex-dividend date for equity securities.
d) Net trading and other income
Net trading and other income includes all gains and losses from changes in the fair value of financial assets and liabilities held at fair value through profit
or loss (comprising financial assets and liabilities held for trading, trading derivatives and other financial assets and liabilities at fair value through profit or
loss), together with related interest income, expense, dividends and changes in fair value of any derivatives managed in conjunction with these assets and
liabilities. Changes in fair value of derivatives in a fair value hedging relationship are also recognised in net trading and other income. Net trading and
other income also includes income from operating lease assets, and profits and losses arising on the sales of property, plant and equipment and
subsidiary undertakings.
Borrowing costs
Borrowing costs directly attributable to the acquisition, construction or production of qualifying assets, including computer software, which are assets that
necessarily take a substantial period of time to develop for their intended use, are added to the cost of those assets, until the assets are substantially
ready for their intended use. All other borrowing costs are recognised in profit or loss in the period in which they occur.
Pensions and other post-retirement benefits
a) Defined benefit schemes
A defined benefit scheme is a pension scheme that guarantees an amount of pension benefit to be provided, usually as a function of one or more factors
such as age, years of service or compensation. Pension costs are charged to ‘Administration expenses’, within the line item ‘Operating expenses before
impairment losses, provisions and charges’ with the net interest on the defined benefit asset or liability included within ‘Net interest income’ in the income
statement. The asset or liability recognised in respect of defined benefit pension schemes is the present value of the defined benefit obligation at the
balance sheet date, less the fair value of scheme assets. The defined benefit obligation is calculated annually by independent actuaries using the
projected unit credit method. The assets of the schemes are measured at their fair values at the balance sheet date.
The present value of the defined benefit obligation is estimated by projecting forward the growth in current accrued pension benefits to reflect inflation and
salary growth to the date of pension payment, then discounted to present value using the yield applicable to high-quality AA rated corporate bonds of the
same currency and which have terms to maturity closest to the terms of the scheme liabilities, adjusted where necessary to match those terms. In
determining the value of scheme liabilities, demographic and financial assumptions are made by management about life expectancy, inflation, discount
rates, pension increases and earnings growth, based on past experience and future expectations. Financial assumptions are based on market conditions
at the balance sheet date and can generally be derived objectively.
Demographic assumptions require a greater degree of estimation and judgement to be applied to externally derived data. Any surplus or deficit of scheme
assets over liabilities is recognised in the balance sheet as an asset (surplus) or liability (deficit). An asset is only recognised to the extent that the surplus
can be recovered through reduced contributions in the future or through refunds from the scheme. The income statement includes the net interest
income/expense on the net defined benefit liability/asset, current service cost and any past service cost and gain or loss on settlement. Remeasurement of
defined benefit pension schemes, including return on scheme assets (excludes amounts included in net interest), actuarial gains and losses (arising from
changes in demographic assumptions, the impact of scheme experience and changes in financial assumptions) and the effect of the changes to the asset
ceiling (if applicable), are recognised in other comprehensive income. Remeasurement recognised in other comprehensive income will not be reclassified
to the income statement. Past-service costs are recognised as an expense in the income statement at the earlier of when the scheme amendment or
curtailment occurs and when the related restructuring costs or termination benefits are recognised. Curtailments include the impact of significant
reductions in the number of employees covered by a scheme, or amendments to the terms of the scheme so that a significant element of future service
will no longer qualify for benefits or will qualify only for reduced benefits. Curtailment gains and losses on businesses that meet the definition of
discontinued operations are included in profit or loss for the year from discontinued operations. Gains and losses on settlements are recognised when the
settlement occurs.
144 Santander UK plc
ˆ200G2Mlv!2SVPV=6LŠ200G2Mlv!2SVPV=6L
628340 TX 145SANTANDERFORM 20-F (SAN UK PL
03-Mar-2019 07:14 ESTHTMLON
Donnelley Financial EGV palap0dc 4*ESS 0C
VDI-W7-PFL-052912.9.12.0
bar5
Page 1 of 2
> Notes to the financial statements
b) Defined contribution plans
A defined contribution plan is a pension scheme under which the Santander UK group pays fixed contributions as they fall due into a
separate entity (a fund). The pension paid to the member at retirement is based on the amount in the separate fund for each member. The
Santander UK group has no legal or constructive obligations to pay further contributions into the fund to ‘top up’ benefits to a certain
guaranteed level. The regular contributions constitute net periodic costs for the year in which they are due and are included in staff costs
within Operating expenses in the income statement.
c) Post-retirement medical benefit plans
Post-retirement medical benefit liabilities are determined using the projected unit credit method, with actuarial valuations updated at each
year-end. The expected benefit costs are accrued over the period of employment using an accounting methodology similar to that for the
defined benefit pension scheme.
Share-based payments
The Santander UK group engages in cash-settled and equity-settled share-based payment transactions in respect of services received
from certain of its employees. Shares of the Santander UK group’s parent, Banco Santander SA are purchased in the open market by the
Santander UK group (for the Employee Sharesave scheme) or are purchased by Banco Santander SA or another Banco Santander
company (for awards granted under the Long-Term Incentive Plan and the Deferred Shares Bonus Plan) to satisfy share options or awards
as they vest.
Options granted under the Employee Sharesave scheme are accounted for as cash-settled share-based payment transactions. Awards
granted under the Long-Term Incentive Plan and Deferred Shares Bonus Plan are accounted for as equity-settled share-based payment
transactions.
The fair value of the services received is measured by reference to the fair value of the shares or share options initially on the date of the
grant for both the cash and equity settled share-based payments and then subsequently at each reporting date for the cash-settled share-
based payments. The cost of the employee services received in respect of the shares or share options granted is recognised in the income
statement in administration expenses over the period that the services are received i.e. the vesting period.
A liability equal to the portion of the services received is recognised at the fair value determined at each balance sheet date for cash-
settled share-based payments. A liability equal to the amount to be reimbursed to Banco Santander SA is recognised at the fair value
determined at the grant date for equity-settled share-based payments.
The fair value of the options granted under the Employee Sharesave scheme is determined using an option pricing model, which takes into
account the exercise price of the option, the current share price, the risk free interest rate, the expected volatility of the Banco Santander
SA share price over the life of the option and the dividend growth rate. The fair value of the awards granted for the Long-Term Incentive
Plan was determined at the grant date using an option pricing model, which takes into account the share price at grant date, the risk free
interest rate, the expected volatility of the Banco Santander SA share price over the life of the award and the dividend growth rate. Vesting
conditions included in the terms of the grant are not taken into account in estimating fair value, except for those that include terms related
to market conditions. Non-market vesting conditions are taken into account by adjusting the number of shares or share options included in
the measurement of the cost of employee service so that, ultimately, the amount recognised in the income statement reflects the number
of vested shares or share options. Where vesting conditions are related to market conditions, the charges for the services received are
recognised regardless of whether or not the market–related vesting conditions are met, provided that the non-market vesting conditions are
met.
Where an award has been modified, as a minimum, the expense of the original award continues to be recognised as if it had not been
modified. Where the effect of a modification is to increase the fair value of an award or increase the number of equity instruments, the
incremental fair value of the award or incremental fair value of the modification of the award is recognised in addition to the expense of the
original grant, measured at the date of modification, over the modified vesting period.
Cancellations in the vesting period are treated as an acceleration of vesting, and recognised immediately for the amount that would
otherwise have been recognised for services over the vesting period.
Goodwill and other intangible assets
Goodwill represents the excess of the cost of an acquisition, as well as the fair value of any interest previously held, over the fair value of
the share of the identifiable net assets of the acquired subsidiary, associate, or business at the date of acquisition. Goodwill on the
acquisition of subsidiaries and businesses is included in intangible assets. Goodwill on acquisitions of associates is included as part of
investment in associates. Goodwill is tested for impairment at each balance sheet date, or more frequently when events or changes in
circumstances dictate, and carried at cost less accumulated impairment losses. Gains and losses on the disposal of an entity or business
include the carrying amount of goodwill relating to the entity or business sold.
Other intangible assets are recognised if they arise from contractual or other legal rights or if they are capable of being separated or
divided from the Santander UK group and sold, transferred, licensed, rented or exchanged. The value of such intangible assets is
amortised on a straight-line basis over their useful economic life of three to seven years. Other intangible assets are reviewed annually for
impairment indicators and tested for impairment where indicators are present.
Software development costs are capitalised when they are direct costs associated with identifiable and unique software products that are
expected to provide future economic benefits and the cost of those products can be measured reliably. These costs include payroll,
materials, services and directly attributable overheads. Internally developed software meeting these criteria and externally purchased
software are classified in intangible assets on the balance sheet and amortised on a straight-line basis over their useful life of three to
seven years, unless the software is an integral part of the related computer hardware, in which case it is treated as property, plant and
equipment as described below. Capitalisation of costs ceases when the software is capable of operating as intended. Costs of maintaining
software are expensed as incurred.
Property, plant and equipment
Property, plant and equipment include owner-occupied properties (including leasehold properties), office fixtures and equipment and
computer software. Property, plant and equipment are carried at cost less accumulated depreciation and accumulated impairment losses.
A review for indications of impairment is carried out at each reporting date. Gains and losses on disposal are determined by reference to
the carrying amount and are reported in net trading and other income. Repairs and renewals are charged to the income statement when
the expenditure is incurred. Internally developed software meeting the criteria set out in ‘Goodwill and other intangible assets’ above and
externally purchased software are classified in property, plant and equipment where the software is an integral part of the related computer
hardware (for example operating system of a computer). Classes of property, plant and equipment are depreciated on a straight-line basis
over their useful life, as follows:
Owner-occupied properties Not exceeding 50 years
Office fixtures and equipment 3 to 15 years
Computer software 3 to 7 years
Depreciation is not charged on freehold land and assets under construction.

ˆ200G2Mlv!2SVPV=6LŠ200G2Mlv!2SVPV=6L
628340 TX 145SANTANDERFORM 20-F (SAN UK PL
03-Mar-2019 07:14 ESTHTMLON
Donnelley Financial EGV palap0dc 4*ESS 0C
VDI-W7-PFL-052912.9.12.0
bar5
Page 2 of 2Santander UK plc 145
ˆ200G2Mlv!2SeuVug_Š200G2Mlv!2SeuVug_
628340 TX 146SANTANDERFORM 20-F (SAN UK PL
03-Mar-2019 07:43 ESTHTMLON
Donnelley Financial EGV palap0dc 5*ESS 0C
VDI-W7-PFL-052912.9.12.0
Page 1 of 1
Annual Report 2018 | Financial statements
Financial instruments
a) Initial recognition and measurement
Financial assets and liabilities are initially recognised when the Santander UK group becomes a party to the contractual terms of the instrument. The
Santander UK group determines the classification of its financial assets and liabilities at initial recognition and measures a financial asset or financial
liability at its fair value plus or minus, in the case of a financial asset or financial liability not at FVTPL, transaction costs that are incremental and directly
attributable to the acquisition or issue of the financial asset or financial liability. Transaction costs of financial assets and financial liabilities carried at fair
value through profit or loss are expensed in profit or loss. Immediately after initial recognition, an expected credit loss (ECL) allowance is recognised for
financial assets measured at amortised cost and investments in debt instruments measured at FVOCI.
A regular way purchase is a purchase of a financial asset under a contract whose terms require delivery of the asset within the timeframe established
generally by regulation or convention in the market place concerned. Regular way purchases of financial assets classified as loans and receivables,
issues of equity or financial liabilities measured at amortised cost are recognised on settlement date; all other regular way purchases and issues are
recognised on trade date.
b) Financial assets and liabilities
i) Classification and subsequent measurement
From 1 January 2018, the Santander UK group has applied IFRS 9 Financial Instruments and classifies its financial assets in the measurement categories
of amortised cost, FVOCI and FVTPL.
Financial assets and financial liabilities are classified as FVTPL where there is a requirement to do so or where they are otherwise designated at FVTPL
on initial recognition. Financial assets and financial liabilities which are required to be held at FVTPL include:
– Financial assets and financial liabilities held for trading
– Debt instruments that do not have solely payments of principal and interest (SPPI) characteristics. Otherwise, such instruments are measured at
amortised cost or FVOCI, and
– Equity instruments that have not been designated as held at FVOCI.
Financial assets and financial liabilities are classified as held for trading if they are derivatives or if they are acquired or incurred principally for the purpose
of selling or repurchasing in the near-term, or form part of a portfolio of financial instruments that are managed together and for which there is evidence of
short-term profit taking.
In certain circumstances, other financial assets and financial liabilities are designated at FVTPL where this results in more relevant information. This may
arise because it significantly reduces a measurement inconsistency that would otherwise arise from measuring assets or liabilities or recognising the gains
or losses on them on a different basis, where the assets and liabilities are managed and their performance evaluated on a fair value basis or, in the case
of financial liabilities, where it contains one or more embedded derivatives which are not closely related to the host contract.
The classification and measurement requirements for financial asset debt and equity instruments and financial liabilities are set out below.
a) Financial assets: debt instruments
Debt instruments are those instruments that meet the definition of a financial liability from the issuer’s perspective, such as loans and government and
corporate bonds. Classification and subsequent measurement of debt instruments depend on the Santander UK group’s business model for managing the
asset, and the cash flow characteristics of the asset.
Business model
The business model reflects how the Santander UK group manages the assets in order to generate cash flows and, specifically, whether the Santander
UK group’s objective is solely to collect the contractual cash flows from the assets or is to collect both the contractual cash flows and cash flows arising
from the sale of the assets. If neither of these is applicable, such as where the financial assets are held for trading purposes, then the financial assets are
classified as part of an ‘other’ business model and measured at FVTPL. Factors considered in determining the business model for a group of assets
include past experience on how the cash flows for these assets were collected, how the assets’ performance is evaluated and reported to key
management personnel, and how risks are assessed and managed.
SPPI
Where the business model is to hold assets to collect contractual cash flows or to collect contractual cash flows and sell, the Santander UK group
assesses whether the assets’ cash flows represent SPPI. In making this assessment, the Santander UK group considers whether the contractual cash
flows are consistent with a basic lending arrangement (i.e. interest includes only consideration for the time value of money, credit risk, other basic lending
risks and a profit margin that is consistent with a basic lending arrangement). Where the contractual terms introduce exposure to risk or volatility that is
inconsistent with a basic lending arrangement, the related asset is classified and measured at FVTPL.
Financial assets with embedded derivatives are considered in their entirety when determining whether their cash flows are SPPI.
Based on these factors, the Santander UK group classifies its debt instruments into one of the following measurement categories:
– Amortised cost – Financial assets that are held for collection of contractual cash flows where those cash flows represent SPPI, and that are not
designated at FVTPL, are measured at amortised cost. The carrying amount of these assets is adjusted by any ECL recognised and measured as
presented in Note 14. Interest income from these financial assets is included in ‘Interest and similar income’ using the effective interest rate method.
When estimates of future cash flows are revised, the carrying amount of the respective financial assets or financial liabilities is adjusted to reflect the
new estimate discounted using the original effective interest rate. Any changes are recognised in the income statement.
– FVOCI – Financial assets that are held for collection of contractual cash flows and for selling the assets, where the assets’ cash flows represent SPPI,
and that are not designated at FVTPL, are measured at FVOCI. Movements in the carrying amount are recognised in OCI, except for the recognition of
impairment gains or losses, interest revenue and foreign exchange gains and losses on the instrument’s amortised cost which are recognised in profit
or loss. When the financial asset is derecognised, the cumulative gain or loss previously recognised in OCI is reclassified from equity to profit or loss
and recognised in ‘Net trading and other income’. Interest income from these financial assets is included in ‘Interest and similar income’ using the
effective interest rate method.
– FVTPL – Financial assets that do not meet the criteria for amortised cost or FVOCI are measured at FVTPL. A gain or loss on a debt instrument that is
subsequently measured at FVTPL, including any debt instruments designated at fair value, is recognised in profit or loss and presented in the income
statement in ‘Net trading and other income’ in the period in which it arises.
The Santander UK group reclassifies financial assets when and only when its business model for managing those assets changes. The reclassification
takes place from the start of the first reporting period following the change. Such changes are expected to be very infrequent.
146 Santander UK plc
ˆ200G2Mlv!2Se#t@gŠ200G2Mlv!2Se#t@g´
628340 TX 147SANTANDERFORM 20-F (SAN UK PL
03-Mar-2019 07:43 ESTHTMLON
Donnelley Financial EGV palap0dc 4*ESS 0C
VDI-W7-PFL-052912.9.12.0
bar5
Page 1 of 1
> Notes to the financial statements
Santander UK plc 147
b) Financial assets: equity instruments
Equity instruments are instruments that meet the definition of equity from the issuer’s perspective, being instruments that do not contain a
contractual obligation to pay cash and that evidence a residual interest in the issuer’s net assets. All equity investments are subsequently
measured at FVTPL, except where management has elected, at initial recognition, to irrevocably designate an equity investment at FVOCI.
When this election is used, fair value gains and losses are recognised in OCI and are not subsequently reclassified to profit or loss,
including on disposal. ECLs (and reversal of ECLs) are not reported separately from other changes in fair value. Dividends, when
representing a return on such investments, continue to be recognised in profit or loss as other income when the right to receive payments
is established. Gains and losses on equity investments at FVTPL are included in the ‘Net trading and other income’ line in the income
statement.
c) Financial liabilities
Financial liabilities are classified as subsequently measured at amortised cost, except for:
– Financial liabilities at fair value through profit or loss: this classification is applied to derivatives, financial liabilities held for trading and
other financial liabilities designated as such at initial recognition. Gains or losses on financial liabilities designated at fair value through
profit or loss are presented partially in other comprehensive income (the amount of change in the fair value of the financial liability that is
attributable to changes in the credit risk of that liability) and partially in profit or loss (the remaining amount of change in the fair value of
the liability)
– Financial liabilities arising from the transfer of financial assets which did not qualify for derecognition, whereby a financial liability is
recognised for the consideration received for the transfer. In subsequent periods, the Santander UK group recognises any expense
incurred on the financial liability, and
– Financial guarantee contracts and loan commitments.
Contracts involving the receipt of cash on which customers receive an index-linked return are accounted for as equity index-linked
deposits. The principal products are Capital Guaranteed/Protected Products which give the customers a limited participation in the upside
growth of an equity index. In the event the index falls in price, a cash principal element is guaranteed/protected. The equity index-linked
deposits contain embedded derivatives. These embedded derivatives, in combination with the principal cash deposit element, are
designed to replicate the investment performance profile tailored to the return agreed in the contracts with customers. The cash principal
element is accounted for as deposits by customers at amortised cost. The embedded derivatives are separated from the host instrument
and are separately accounted for as derivatives.
d) Sale and repurchase agreements (including stock borrowing and lending)
Securities sold subject to a commitment to repurchase them at a predetermined price (repos) under which substantially all the risks and
rewards of ownership are retained by the Santander UK group remain on the balance sheet and a liability is recorded in respect of the
consideration received. Securities purchased under commitments to resell (reverse repos) are not recognised on the balance sheet and
the consideration paid is recorded as an asset. The difference between the sale and repurchase price is treated as trading income in the
income statement, except where the repo is not treated as part of the trading book, in which case the difference is recorded in interest
income or expense.
Securities lending and borrowing transactions are generally secured, with collateral in the form of securities or cash advanced or received.
Securities lent or borrowed are not reflected on the balance sheet. Collateral in the form of cash received or advanced is recorded as a
deposit or a loan. Collateral in the form of securities is not recognised.
e) Day One profit adjustments
The fair value of a financial instrument on initial recognition is generally its transaction price (that is, the fair value of the consideration
given or received). However, sometimes the fair value will be based on other observable current market transactions in the same
instrument, without modification or repackaging, or on a valuation technique whose variables include only data from observable markets,
such as interest rate yield curves, option volatilities and currency rates. When such evidence exists, the Santander UK group recognises a
trading gain or loss at inception (Day One gain or loss), being the difference between the transaction price and the fair value. When
significant unobservable parameters are used, the entire Day One gain or loss is deferred and is recognised in the income statement over
the life of the transaction until the transaction matures, is closed out, the valuation inputs become observable or an offsetting transaction is
entered into.
ii) Impairment of debt instrument financial assets
The Santander UK group assesses on a forward-looking basis the ECL associated with its debt instrument assets carried at amortised cost
and FVOCI and with the exposure arising from financial guarantee contracts and loan commitments. The Santander UK group recognises
a loss allowance for such losses at each reporting date. The measurement of ECL reflects:
– An unbiased and probability-weighted amount that is determined by evaluating a range of possible outcomes
– The time value of money, and
– Reasonable and supportable information that is available without undue cost or effort at the reporting date about past events, current
conditions and forecasts of future economic conditions.
Grouping of instruments for losses measured on a collective basis
We typically group instruments and assess them for impairment collectively where they share risk characteristics (as described in Retail
Banking – credit risk management in the Risk review) using one or more statistical models. Where we have used internal capital or similar
models as the basis for our IFRS 9 models, this typically results in a large number of relatively small homogenous groups which are
determined by the permutations of the underlying characteristics in the statistical models. We calculate separate collective provisions for
instruments in Stages 1, 2 and 3 where the instrument is not individually assessed, as described below.
Individually assessed impairments (IAIs)
We assess significant Stage 3 cases individually. We do this for CIB and Corporate & Commercial Banking cases, but not for Business
Banking cases in Retail Banking which we assess collectively. To calculate the estimated loss, we estimate the future cash flows under
several scenarios each of which uses case-specific factors and circumstances. We then probability-weight the net present value of the
cash flows under each scenario to arrive at a weighted average provision requirement. We update our assessment process every quarter
and more frequently if there are changes in circumstances that might affect the scenarios, cash flows or probabilities we apply.
For more on how ECL is calculated, see the Credit risk section of the Risk review.
a) Write-off
For secured loans, a write-off is only made when all collection procedures have been exhausted and the security has been sold or from
claiming on any mortgage indemnity guarantee or other insurance. In the corporate portfolio, there may be occasions where a write-off
occurs for other reasons, such as following a consensual restructure or refinancing of the debt or where the debt is sold for strategic
reasons into the secondary market at a value lower than its face value.
ˆ200G2Mlv!2Se&6VgpŠ200G2Mlv!2Se&6Vgp
628340 TX 148SANTANDERFORM 20-F (SAN UK PL
03-Mar-2019 07:44 ESTHTMLON
Donnelley Financial EGV palap0dc 4*ESS 0C
VDI-W7-PFL-052912.9.12.0
Page 1 of 1
Annual Report 2018 | Financial statements
There is no threshold based on past due status beyond which all secured loans are written off as there can be significant variations in the time needed to
enforce possession and sale of the security, especially due to the different legal frameworks that apply in different regions of the UK. For unsecured loans,
a write-off is only made when all internal avenues of collecting the debt have been exhausted and the debt is passed over to external collection agencies.
A past due threshold is applied to unsecured debt where accounts that are 180 days past due are written off unless there is a dispute awaiting resolution.
Contact is made with customers with the aim to achieve a realistic and sustainable repayment arrangement. Litigation and/or enforcement of security is
usually carried out only when the steps described above have been undertaken without success.
All write-offs are assessed / made on a case-by-case basis, taking account of the exposure at the date of write-off, after accounting for the value from any
collateral or insurance held against the loan. The exception to this is in cases where fraud has occurred, where the exposure is written off once
investigations have been completed and the probability of recovery is minimal. The time span between discovery and write-off will be short and may not
result in an impairment loss allowance being raised. The write-off policy is regularly reviewed. Write-offs are charged against previously established loss
allowances.
b) Recoveries
Recoveries of credit impairment losses are not included in the impairment loss allowance, but are taken to income and offset against credit impairment
losses. Recoveries of credit impairment losses are classified in the income statement as ‘Credit impairment losses’.
iii) Modifications of financial assets
The treatment of a renegotiation or modification of the contractual cash flows of a financial asset normally depends upon whether the renegotiation or
modification is due to financial difficulties of the borrower or for other commercial reasons.
– Contractual modifications due to financial difficulties of the borrower: where Santander UK modifies the contractual conditions to enable the
borrower to fulfil their payment obligations, the asset is not derecognised. The gross carrying amount of the financial asset is recalculated as the
present value of the renegotiated/modified contractual cash flows that are discounted at the financial asset’s original EIR and any gain or loss arising
from the modification is recognised in the income statement.
– Contractual modifications for other commercial reasons: such modifications are treated as a new transaction resulting in derecognition of the
original financial asset, and the recognition of a ‘new’ financial asset. Any difference between the carrying amount of the derecognised asset and the
fair value of the new asset is recognised in the income statement as a gain or loss on derecognition.
Any other contractual modifications, such as where a regulatory authority imposes a change in certain contractual terms or due to legal reasons, are
assessed on a case-by-case basis to establish whether or not the financial asset should be derecognised.
iv) Derecognition other than on a modification
Financial assets are derecognised when the rights to receive cash flows have expired or the Santander UK group has transferred its contractual right to
receive the cash flows from the assets and either: (1) substantially all the risks and rewards of ownership have been transferred; or (2) the Santander UK
group has neither retained nor transferred substantially all of the risks and rewards, but has transferred control.
Financial liabilities are derecognised when extinguished, cancelled or expired.
c) Financial guarantee contracts and loan commitments
Financial guarantee contracts are contracts that require the issuer to make specified payments to reimburse the holder for a loss it incurs because a
specified debtor fails to make payments when due, in accordance with the terms of a debt instrument. Such financial guarantees are given to banks,
financial institutions and others on behalf of customers to secure loans, overdrafts and other banking facilities.
Financial guarantee contracts are initially measured at fair value and subsequently measured at the higher of the amount of the loss allowance, and the
premium received on initial recognition less income recognised in accordance with the principles of IFRS 15. Loan commitments are measured as the
amount of the loss allowance. The Santander UK group has not provided any commitment to provide loans at a below-market interest rate, or that can be
settled net in cash or by delivering or issuing another financial instrument.
For financial guarantee contracts and loan commitments, the loss allowance is recognised as a provision and charged to credit impairment losses in the
income statement. The loss allowance in respect of revolving facilities is classified in loans and advances to customers to the extent of any drawn
balances. The loss allowance in respect of undrawn amounts is classified in provisions. When amounts are drawn, any related loss allowance is
transferred from provisions to loans and advances to customers.
Derivative financial instruments (derivatives)
Derivatives are contracts or agreements whose value is derived from one or more underlying indices or asset values inherent in the contract or
agreement, which require no or little initial net investment and are settled at a future date. Transactions are undertaken in interest rate, cross currency,
equity, residential property and other index-related swaps, forwards, caps, floors, swaptions, as well as credit default and total return swaps, equity index
contracts and exchange traded interest rate futures, and equity index options.
Derivatives are held for risk management purposes. Derivatives are classified as held for trading unless they are designated as being in a hedge
accounting relationship. The Santander UK group chooses to designate certain derivatives as in a hedging relationship if they meet specific criteria, as
further described in ‘Hedge accounting’ below.
Derivatives are recognised initially (on the date on which a derivative contract is entered into), and are subsequently remeasured, at their fair value. Fair
values of exchange-traded derivatives are obtained from quoted market prices. Fair values of over-the-counter derivatives are estimated using valuation
techniques, including discounted cash flow and option pricing models.
Certain derivatives may be embedded in hybrid contracts, such as the conversion option in a convertible bond. If the hybrid contract contains a host that is
a financial asset, then the Santander UK group assesses the entire contract as described in the financial asset section above for classification and
measurement purposes. Otherwise, embedded derivatives are treated as separate derivatives when their economic characteristics and risks are not
closely related to those of the host contract; the terms of the embedded derivative would meet the definition of a stand-alone derivative if they were
contained in a separate contract; and the combined contract is not held for trading or designated at fair value. These embedded derivatives are measured
at fair value with changes in fair value recognised in the income statement.
Contracts containing embedded derivatives are not subsequently reassessed for separation unless either there has been a change in the terms of the
contract which significantly modifies the cash flows (in which case the contract is reassessed at the time of modification) or the contract has been
reclassified (in which case the contract is reassessed at the time of reclassification).
148 Santander UK plc

ˆ200G2Mlv!2Sf9s0g%Š200G2Mlv!2Sf9s0g%
628340 TX 149SANTANDERFORM 20-F (SAN UK PL
03-Mar-2019 07:45 ESTHTMLON
Donnelley Financial EGV palap0dc 4*ESS 0C
VDI-W7-PFL-052912.9.12.0
bar5
Page 1 of 1
> Notes to the financial statements
Santander UK plc 149
All derivatives are carried as assets when their fair value is positive and as liabilities when their fair value is negative, except where netting
is permitted. The method of recognising fair value gains and losses depends on whether derivatives are held for trading or are designated
as hedging instruments and, if the latter, the nature of the risks being hedged. Gains and losses from changes in the fair value of
derivatives held for trading are recognised in the income statement, and included within net trading and other income.
Offsetting financial assets and liabilities
Financial assets and liabilities including derivatives are offset and the net amount reported in the balance sheet when there is a legally
enforceable right to set off the recognised amounts and there is an intention to settle on a net basis, or realise the asset and settle the
liability simultaneously. The Santander UK group is party to a number of arrangements, including master netting arrangements under
industry standard agreements which facilitate netting of transactions in jurisdictions where netting agreements are recognised and have
legal force. The netting arrangements do not generally result in an offset of balance sheet assets and liabilities for accounting purposes, as
transactions are usually settled on a gross basis.
Hedge accounting
The Santander UK group applies hedge accounting to represent, to the maximum possible extent permitted under accounting standards,
the economic effects of its risk management strategies. Derivatives are used to hedge exposures to interest rates, exchange rates and
certain indices such as retail price indices.
At the time a financial instrument is designated as a hedge (i.e. at the inception of the hedge), the Santander UK group formally documents
the relationship between the hedging instrument(s) and hedged item(s), its risk management objective and strategy for undertaking the
hedge. The documentation includes the identification of each hedging instrument and respective hedged item, the nature of the risk being
hedged (including the benchmark interest rate being hedged in a hedge of interest rate risk) and how the hedging instrument’s
effectiveness in offsetting the exposure to changes in the hedged item’s fair value attributable to the hedged risk is to be assessed.
Accordingly, the Santander UK group formally assesses, both at the inception of the hedge and on an ongoing basis, whether the hedging
derivatives have been and will be highly effective in offsetting changes in the fair value attributable to the hedged risk during the period that
the hedge is designated. A hedge is normally regarded as highly effective if, at inception and throughout its life, the Santander UK group
can expect, and actual results indicate, that changes in the fair value or cash flow of the hedged items are effectively offset by changes in
the fair value or cash flow of the hedging instrument. If at any point it is concluded that it is no longer highly effective in achieving its
documented objective, hedge accounting is discontinued.
Where derivatives are held for risk management purposes, and when transactions meet the required criteria for documentation and hedge
effectiveness, the derivatives may be designated as either: (i) hedges of the change in fair value of recognised assets or liabilities or firm
commitments (fair value hedges); (ii) hedges of the variability in highly probable future cash flows attributable to a recognised asset or
liability, or a forecast transaction (cash flow hedges); or (iii) a hedge of a net investment in a foreign operation (net investment hedges).
The Santander UK group applies fair value and cash flow hedge accounting, but not hedging of a net investment in a foreign operation.
a) Fair value hedge accounting
Changes in the fair value of derivatives that are designated and qualify as fair value hedges are recorded in the income statement,
together with the changes in the fair value of the hedged asset or liability that are attributable to the hedged risk. Where the hedged item is
measured at amortised cost, the fair value changes due to the hedged risk adjust the carrying amount of the hedged asset or liability.
Changes in the fair value of portfolio hedged items are presented separately in the consolidated balance sheet in macro hedge of interest
rate risk and recognised in the income statement within net trading and other income. If the hedge no longer meets the criteria for hedge
accounting, changes in the fair value of the hedged item attributable to the hedged risk are no longer recognised in the income statement.
For fair value hedges of interest rate risk, the cumulative adjustment that has been made to the carrying amount of the hedged item is
amortised to the income statement using the effective interest method over the period to maturity. For portfolio hedged items, the
cumulative adjustment is amortised to the income statement using the straight line method over the period to maturity.
b) Cash flow hedge accounting
The effective portion of changes in the fair value of qualifying cash flow hedges is recognised in other comprehensive income in the cash
flow hedging reserve. The gain or loss relating to the ineffective portion is recognised immediately in the income statement. Amounts
accumulated in equity are reclassified to the income statement in the periods in which the hedged item affects profit or loss. When a
hedging instrument expires or is sold, or when a hedge no longer meets the criteria for hedge accounting, any cumulative gain or loss
existing in equity at that time remains in equity and is recognised in the income statement when the forecast transaction is ultimately
recognised in the income statement. When a forecast transaction is no longer expected to occur, the cumulative gain or loss that was
reported in equity is immediately transferred to the income statement. The Santander UK group is exposed to cash flow interest rate risk
on its floating rate assets and foreign currency risk on its fixed rate debt issuances denominated in foreign currency. Cash flow hedging is
used to hedge the variability in cash flows arising from both these risks.
Securitisation transactions
The Santander UK group has entered into arrangements where undertakings have issued mortgage-backed and other asset-backed
securities or have entered into funding arrangements with lenders in order to finance specific loans and advances to customers. As the
Santander UK group has retained substantially all the risks and rewards of the underlying assets, such financial instruments continue to be
recognised on the balance sheet, and a liability recognised for the proceeds of the funding transaction.
Impairment of non-financial assets
At each balance sheet date, or more frequently when events or changes in circumstances dictate, property plant and equipment (including
operating lease assets) and intangible assets (including goodwill) are assessed for indicators of impairment. If indications are present,
these assets are subject to an impairment review. The impairment review comprises a comparison of the carrying amount of the asset or
cash generating unit with its recoverable amount: the higher of the asset’s or cash-generating unit’s fair value less costs to sell and its
value in use. The cash-generating unit represents the lowest level at which non-financial assets including goodwill is monitored for internal
management purposes and is not larger than an operating segment.
The fair value is the price that would be received to sell an asset or paid to transfer a liability in an orderly transaction between market
participants at the measurement date. Value in use is calculated by discounting management’s expected future cash flows obtainable as a
result of the asset’s continued use, including those resulting from its ultimate disposal, at a market based discount rate on a pre-tax basis.
The recoverable amounts of goodwill have been based on value in use calculations.
The carrying values of property, plant and equipment, goodwill and other intangible assets are written down by the amount of any
impairment and the loss is recognised in the income statement in the period in which it occurs. A previously recognised impairment loss
relating to property, plant and equipment may be reversed in part or in full when a change in circumstances leads to a change in the
estimates used to determine the property, plant and equipment’s recoverable amount. The carrying amount of the property, plant and
equipment will only be increased up to the amount that would have been had the original impairment not been recognised. Impairment
losses on goodwill are not reversed. For conducting goodwill impairment reviews, cash generating units are the lowest level at which
management monitors the return on investment on assets.

ˆ200G2Mlv!2SfPgw6%Š200G2Mlv!2SfPgw6%
628340 TX 150SANTANDERFORM 20-F (SAN UK PL
03-Mar-2019 07:46 ESTHTMLON
Donnelley Financial EGV palap0dc 4*ESS 0C
VDI-W7-PFL-052912.9.12.0
Page 1 of 1
Annual Report 2018 | Financial statements
Leases
a) The Santander UK group as lessor
Operating lease assets are recorded at cost and depreciated over the life of the asset after taking into account anticipated residual value. Operating lease
rental income and depreciation is recognised on a straight-line basis over the life of the asset. Amounts due from lessees under finance leases and hire
purchase contracts are recorded as receivables at the amount of the Santander UK group’s net investment in the leases. Finance lease income is
allocated to accounting periods so as to reflect a constant periodic rate of return on the Santander UK group’s net investment outstanding in respect of the
leases and hire purchase contracts. A provision is recognised to reflect a reduction in any anticipated unguaranteed RV. A provision is also recognised for
voluntary termination of the contract by the customer, where appropriate.
b) The Santander UK group as lessee
The Santander UK group enters into operating leases for the rental of equipment or real estate. Payments made under such leases are charged to the
income statement on a straight-line basis over the period of the lease. When an operating lease is terminated before the lease period has expired, any
payment to be made to the lessor by way of penalty is recognised as an expense in the period in which termination takes place.
If the lease agreement transfers the risk and rewards of the asset, the lease is recorded as a finance lease and the related asset is capitalised. At
inception, the asset is recorded at the lower of the present value of the minimum lease payments or fair value and depreciated over the lower of the
estimated useful life and the life of the lease. The corresponding rental obligations are recorded as borrowings. The aggregate benefit of incentives, if any,
is recognised as a reduction of rental expense over the lease term on a straight-line basis.
Income taxes, including deferred taxes
The tax expense represents the sum of the income tax currently payable and deferred income tax.
Income tax payable on profits, based on the applicable tax law in each jurisdiction, is recognised as an expense in the period in which profits arise.
Taxable profit differs from net profit as reported in the income statement because it excludes items of income or expense that are taxable or deductible in
other years and it further excludes items that are never taxable or deductible. The liability for current tax is calculated using tax rates that have been
enacted or substantively enacted by the balance sheet date. Current taxes associated with the repurchase of equity instruments are reported directly in
equity.
A current tax liability for the current or prior period is measured at the amount expected to be paid to the tax authorities. Where the amount of the final tax
liability is uncertain or where a position is challenged by a taxation authority, the liability recognised is the most likely outcome. Where a most likely
outcome cannot be determined, a weighted average basis is applied.
Deferred income tax is the tax expected to be payable or recoverable on income tax losses available to carry forward and on temporary differences arising
between the tax bases of assets and liabilities and their carrying amounts in the Consolidated Financial Statements and is accounted for using the balance
sheet liability method. Deferred tax liabilities are generally recognised for all taxable temporary differences and deferred tax assets are recognised to the
extent that it is probable that taxable profits will be available against which the assets may be utilised as they reverse. Such deferred tax liabilities are not
recognised if the temporary difference arises from the initial recognition of goodwill. Deferred tax assets and liabilities are not recognised from the initial
recognition of other assets (other than in a business combination) and liabilities in a transaction that affects neither the taxable profit nor the accounting
profit.
Deferred tax is calculated at the tax rates that are expected to apply in the period when the liability is settled or the asset is realised based on rates
enacted or substantively enacted at the balance sheet date. Deferred tax is charged or credited in the income statement, except when it relates to items
recognised in other comprehensive income or directly in equity, in which case the deferred tax is also recognised in other comprehensive income or
directly in equity. Deferred tax liabilities are recognised for taxable temporary differences arising on investments in subsidiaries except where the
Santander UK group is able to control reversal of the temporary difference and it is probable that it will not reverse in the foreseeable future. The
Santander UK group reviews the carrying amount of deferred tax assets at each balance sheet date and reduces it to the extent that it is no longer
probable that sufficient taxable profits will be available to allow all or part of the asset to be recovered.
Deferred tax relating to actuarial gains and losses on defined benefits is recognised in other comprehensive income. Deferred tax relating to fair value
re-measurements of financial instruments accounted for at FVOCI and cash flow hedging instruments is charged or credited directly to other
comprehensive income and is subsequently recognised in the income statement when the deferred fair value gain or loss is recognised in the income
statement.
Deferred and current tax assets and liabilities are only offset when they arise in the same tax reporting group and where there is both the legal right and
the intention to settle on a net basis or to realise the asset and settle the liability simultaneously.
Cash and cash equivalents
For the purposes of the cash flow statement, cash and cash equivalents comprise balances with less than three months maturity from the date of
acquisition, including cash and non-restricted balances with central banks, treasury bills and other eligible bills, loans and advances to banks and short-
term investments in securities.
Balances with central banks represent amounts held at the Bank of England and, at 31 December 2017, the US Federal Reserve as part of the Santander
UK group’s liquidity management activities. In addition, it includes certain minimum cash balances held for regulatory purposes required to be maintained
with the Bank of England.
Provisions
Provisions are recognised for present obligations arising as consequences of past events where it is more likely than not that a transfer of economic
benefits will be necessary to settle the obligation, and it can be reliably estimated.
Conduct provisions are made for the estimated cost of making redress payments with respect to the past sales of products, based on conclusions
regarding the number of claims that will be received, including the number of those that will be upheld, the estimated average settlement per case and
other related costs. Provision is made for the anticipated cost of restructuring, including redundancy costs, when an obligation exists. An obligation exists
when the Santander UK group has a detailed formal plan for restructuring a business, has raised valid expectations in those affected by the restructuring,
and has started to implement the plan or announce its main features.
When a leasehold property ceases to be used in the business, provision is made where the unavoidable costs of the future obligations relating to the lease
are expected to exceed anticipated rental income. The net costs are discounted using market rates of interest to reflect the long-term nature of the cash
flows.
Provisions include amounts in respect of irrevocable loan commitments. The provision is the present value of the difference between the contractual cash
flows based on the expected drawdowns and the cash flows that the Santander UK group expects to receive.
Contingent liabilities are possible obligations whose existence will be confirmed only by certain future events or present obligations where the transfer of
economic benefit is uncertain or cannot be reliably measured. Contingent liabilities are not recognised but are disclosed unless they are remote.
150 Santander UK plc
ˆ200G2Mlv!2SfV#j6eŠ200G2Mlv!2SfV#j6e
628340 TX 151SANTANDERFORM 20-F (SAN UK PL
03-Mar-2019 07:46 ESTHTMLON
Donnelley Financial EGV palap0dc 3*ESS 0C
VDI-W7-PFL-052912.9.12.0
bar5
Page 1 of 1
> Notes to the financial statements
Santander UK plc 151
Share capital
a) Share issue costs
Incremental external costs directly attributable to the issue of new shares are deducted from equity net of related income taxes.
b) Dividends
Dividends on ordinary shares are recognised in equity in the period in which the right to receive payment is established.
Accounting policies relating to comparatives – IAS 39
On 1 January 2018, Santander UK group adopted IFRS 9, which replaced IAS 39. In accordance with the transition requirements of IFRS
9, comparatives were not restated. The accounting policies applied in accordance with IAS 39 for periods before the adoption of IFRS 9
are set out below:
Financial assets and liabilities – IAS 39
Financial assets and liabilities are initially recognised when the Santander UK group becomes a party to the contractual terms of the
instrument. The Santander UK group determines the classification of its financial assets and liabilities at initial recognition. Financial assets
are classified as financial assets at fair value through profit or loss, loans and receivables, available-for-sale financial assets and
held-to-maturity investments. Financial assets that are classified at fair value through profit or loss, which have not been designated as
such or are not accounted for as derivatives, or assets classified as available-for-sale, may subsequently in rare circumstances, be
reclassified from the fair value through profit or loss category to the loans and receivables, available-for-sale or held-to-maturity categories.
Financial liabilities are classified as fair value through profit or loss if they are either held for trading or otherwise designated at fair value
through profit or loss on initial recognition.
a) Financial assets and liabilities at fair value through profit or loss
Financial assets and financial liabilities are classified as FVTPL if they are either held for trading or otherwise designated at FVTPL on
initial recognition. Financial assets and financial liabilities are classified as held for trading if they are derivatives or if they are acquired or
incurred principally for the purpose of selling or repurchasing in the near-term, or form part of a portfolio of financial instruments that are
managed together and for which there is evidence of short-term profit taking. In certain circumstances, financial assets and financial
liabilities other than those that are held for trading are designated at FVTPL where this results in more relevant information because it
significantly reduces a measurement inconsistency that would otherwise arise from measuring assets or liabilities or recognising the gains
or losses on them on a different basis, where the assets or liabilities are managed and their performance evaluated on a fair value basis, or
where a financial asset or financial liability contains one or more embedded derivatives which are not closely related to the host contract.
Financial assets and financial liabilities classified as FVTPL are initially recognised at fair value and transaction costs are taken directly to
the income statement. Gains and losses arising from changes in fair value are included directly in the income statement except for gains
and losses on financial liabilities designated at FVTPL relating to own credit which are presented in other comprehensive income.
Derivative financial instruments, trading assets and liabilities and financial assets and liabilities designated at fair value are classified as
FVTPL.
b) Loans and receivables
Loans and receivables are non-derivative financial assets with fixed or determinable payments, that are not quoted in an active market and
which are not classified as available-for-sale or FVTPL. They arise when the Santander UK group provides money or services directly to a
customer with no intention of trading the loan. Loans and receivables are initially recognised at fair value including direct and incremental
transaction costs. They are subsequently valued at amortised cost, using the effective interest method. Loans and receivables consist of
loans and advances to banks, loans and advances to customers, and loans and receivables securities.
c) Available-for-sale financial assets
Available-for-sale financial assets are non-derivative financial assets that are designated as available-for-sale and are not categorised into
any of the other categories described. They are initially recognised at fair value including direct and incremental transaction costs, and
subsequently held at fair value. Gains and losses arising from changes in fair value are recognised in other comprehensive income until
sale or until determined to be impaired when the cumulative gain or loss or impairment losses are transferred to the income statement.
Where the financial asset is interest-bearing, interest is determined using the effective interest method. Income on investments in equity
shares, debt instruments and other similar interests is recognised in the income statement as and when dividends are declared and
interest is accrued. Impairment losses and foreign exchange translation differences on monetary items are recognised in the income
statement.
d) Held-to-maturity investments
Held-to-maturity investments are non-derivative financial assets with fixed or determinable payments and fixed maturities that the
Santander UK group’s management has the positive intention and ability to hold to maturity other than those that meet the definition of
loans and receivables or that the Santander UK group designates upon initial recognition as at fair value through profit or loss, or
available-for-sale. They are initially recognised at fair value including direct and incremental transaction costs and measured subsequently
at amortised cost, using the effective interest method, less any provision for impairment. A sale or reclassification of a more than
insignificant amount of held-to-maturity investments would result in the reclassification of all held-to-maturity investments to
available-for-sale financial assets.
Impairment of financial assets – IAS 39
At each balance sheet date, the Santander UK group assesses whether there is objective evidence that a financial asset or group of
financial assets is impaired. A financial asset or a group of financial assets is impaired and impairment losses are incurred only if there is
objective evidence of impairment as a result of one or more events that occurred after the initial recognition of the asset (a loss event) and
that loss event (or events) has an impact on the estimated future cash flows of the financial asset or group of financial assets that can be
reliably estimated. In the case of equity investments classified as available-for-sale, a significant or prolonged decline in the fair value of
the security below its cost is considered an indicator that the assets are impaired.
a) Assets carried at amortised cost
For loans and advances, loans and receivables securities and held-to-maturity investments, the amount of the loss is measured as the
difference between the asset’s carrying amount and the present value of estimated future cash flows (excluding future credit losses that
have not been incurred) discounted at the financial asset’s original effective interest rate. The carrying amount of the asset is reduced and
the amount of the loss is recognised in profit or loss. If a loan or held-to-maturity investment has a variable interest rate, the discount rate
for measuring any impairment loss is the current effective interest rate determined under the contract.
Subsequent to the recognition of an impairment loss on a financial asset or a group of financial assets, interest income continues to be
recognised on an effective interest rate basis, on the asset’s carrying value net of impairment provisions. If, in a subsequent period, the
amount of the impairment loss decreases and the decrease can be related objectively to an event occurring after the impairment was
recognised (such as an improvement in the debtor’s credit rating), the reversal of the previously recognised impairment loss is recognised
in profit or loss.

ˆ200G2Mlv!2SfwVY6>Š200G2Mlv!2SfwVY6>
628340 TX 152SANTANDERFORM 20-F (SAN UK PL
03-Mar-2019 07:47 ESTHTMLON
Donnelley Financial EGV palap0dc 4*ESS 0C
VDI-W7-PFL-052912.9.12.0
Page 1 of 1
Annual Report 2018 | Financial statements
Impairment allowances are assessed individually for financial assets that are individually significant. Impairment allowances for portfolios of smaller
balance homogenous loans such as most residential mortgages, personal loans and credit card balances that are below the individual assessment
thresholds, and for loan losses that have been incurred but not separately identified at the balance sheet date, are determined on a collective basis.
Individual assessment
For individually assessed assets, the Santander UK group measures the amount of the loss as the difference between the carrying amount of the asset
and the present value of the estimated future cash flows from the asset discounted at the asset’s original effective interest rate.
The factors considered in determining whether a loan is individually significant for the purpose of assessing impairment include the size of the loan, the
number of loans in the portfolio, the importance of the individual loan relationship and how this is managed. Potential indicators of loss events which may
be evidence of impairment for retail borrowers may include missed payments of capital and interest and borrowers notifying the Santander UK group of
current or likely financial stress.
For corporate assets, when a specific observed impairment is established, the asset is transferred to the Corporate & Commercial Banking
Restructuring & Recoveries team. As part of their impairment reviews, an assessment is undertaken of the expected future cash flows (including, where
appropriate, cash flows through enforcement of any applicable security held) in relation to the relevant asset, discounted at the loan’s original effective
interest rate. The result is compared to the current carrying value of the asset. Any shortfall evidenced as a result of such a review will be assessed and
recorded as an observed specific loss allowance.
Collective assessment
In making a collective assessment for impairment, financial assets are grouped together according to their credit risk characteristics. These can include
grouping by product, loan-to-value, brand, geography, type of customer and previous insolvency events. For each such portfolio or sub-segment of the
portfolio, future cash flows are estimated through the use of historical loss experience. The historical loss experience is adjusted to include the effects of
changes in current economic, behavioural and other conditions that cannot be successfully depicted solely from historical experience. The loss is
discounted at the effective interest rate, except where portfolios meet the criteria for short-term receivables. The unwind of the discount over time is
reported through interest and other similar income within the income statement, with an increase to the impairment loss allowances on the balance sheet.
Loans for which evidence of potential loss have been specifically identified are grouped together for the purpose of calculating an allowance for observed
losses. Loans for which no evidence of loss has been specifically identified on an individual basis are grouped together according to their credit risk
characteristics for the purpose of calculating an allowance for incurred but not observed (IBNO) losses. Such losses will only be individually identified in
the future.
Observed impairment loss allowance
An impairment loss allowance for observed losses is established for all NPLs where it is increasingly probable that some of the capital or interest will not
be repaid or recovered through enforcement of any applicable security. The allowance for observed losses is determined on a collective (or portfolio) basis
for groups of loans with similar credit risk characteristics. For more on the definition of NPLs, see ‘Credit risk management – risk measurement and
control’ in the Risk review.
For mortgages and other secured advances, the allowance for observed losses is calculated as the product of the account outstanding balance (exposure)
at the reporting date, the estimated proportion that will be repossessed (the loss propensity) and the percentage of exposure which will result in a loss (the
loss ratio). The loss propensities for the observed segment (i.e. where the loan is classified as non-performing) represent the percentage that will
ultimately be written off, or repossessed for secured advances. Loss propensities are based on recent historical experience, typically covering a period of
no more than the most recent 12 months in the year under review. The loss ratio is based on actual cases which have been repossessed and sold using
the most recent 12 month average data, segmented by LTV, and is then discounted using the effective interest rate.
IBNO impairment loss allowances
An allowance for IBNO losses is established for loans which are either:
– Performing and no evidence of loss has been specifically identified on an individual basis but because the loans that are not yet past due are known
from past experience to have deteriorated since the initial decision to lend was made (for example, where a borrower has not yet missed a payment but
is experiencing financial difficulties at the reporting date, for example due to a loss of employment, divorce or bereavement), or
– In arrears and not classified as non-performing.
The impairment loss calculation resembles the one explained above for the observed segment except that for the IBNO segment, where the account is
currently up to date, the loss propensity represents the percentage of such cases that are expected to miss a payment in the appropriate emergence
period and which will ultimately be written off. Where the account is delinquent, the loss propensity represents the percentage of such cases that will
ultimately be written off.
b) Loans and receivables securities and held-to-maturity investments
Loans and receivables securities and held-to-maturity investments are assessed individually for impairment. An impairment loss is incurred if there is
objective evidence that a loss event has occurred since initial recognition of the assets that has an impact on the estimated future cash flows of the asset.
Potential indicators of loss events include significant financial distress of the issuer and default or delinquency in interest and principal payments (breach
of contractual terms).
Loans and receivables securities and held-to-maturity investments are monitored for potential impairment through a detailed expected cash flow analysis,
where appropriate, taking into account the structure and underlying assets of each individual security. Once specific events give rise to a reasonable
expectation that future anticipated cash flows may not be received, the asset originating these doubtful cash flows will be deemed to be impaired with the
impairment loss being measured as the difference between the expected future cash flows discounted at the original effective interest rate and the
carrying value of the asset.
c) Assets classified as available-for-sale
The Santander UK group assesses at each balance sheet date whether there is objective evidence that an available-for-sale financial asset is impaired.
The assessment involves reviewing the financial circumstances (including creditworthiness) and future prospects of the issuer, assessing the future cash
flows expected to be realised and, in the case of equity shares, considering whether there has been a significant or prolonged decline in the fair value of
the security below its cost. The cumulative loss is measured as the difference between the acquisition cost and the current fair value, less any impairment
loss previously reported in the income statement and is removed from other comprehensive income and recognised in the income statement. For impaired
debt instruments, further impairment losses are recognised where there has been a further negative impact on expected future cash flows.
If, in a subsequent period, the fair value of a debt instrument classified as available-for-sale increases and the increase is due to an event occurring after
the impairment loss was recognised in the income statement (with objective evidence to support this), the impairment loss is reversed through the income
statement. If, in a subsequent period, the fair value of an equity instrument classified as available-for-sale increases, all such increases in the fair value
are treated as a revaluation, and are recognised in other comprehensive income. Impairment losses recognised on equity instruments are not reversed
through the income statement.
152 Santander UK plc

ˆ200G2Mlv!2StCSM65Š200G2Mlv!2StCSM65
628340 TX 153SANTANDERFORM 20-F (SAN UK PL
03-Mar-2019 08:11 ESTHTMLON
Donnelley Financial EGV palap0dc 4*ESS 0C
VDI-W7-PFL-052912.9.12.0
bar5
Page 1 of 1
> Notes to the financial statements
Santander UK plc 153
CRITICAL JUDGEMENTS AND ACCOUNTING ESTIMATES
The preparation of the Consolidated Financial Statements requires management to make judgements and accounting estimates that affect
the reported amount of assets and liabilities at the date of the Consolidated Financial Statements and the reported amount of income and
expenses during the reporting period. Management evaluates its judgements and accounting estimates, which are based on historical
experience and on various other factors that are believed to be reasonable under the circumstances, on an ongoing basis. Actual results
may differ from these accounting estimates under different assumptions or conditions.
In the course of preparing the Consolidated Financial Statements, no significant judgements have been made in the process of applying
the accounting policies, other than those involving estimations about credit impairment losses, conduct remediation and pensions as set
out below.
The following accounting estimates, as well as the judgements inherent within them, are considered important to the portrayal of the
Santander UK group’s financial results and financial condition because: (i) they are highly susceptible to change from period to period as
assumptions are made to calculate the estimates, and (ii) any significant difference between the estimated amounts and actual amounts
could have a material impact on the Santander UK group’s future financial results and financial condition.
In calculating each accounting estimate, a range of outcomes was calculated based principally on management’s conclusions regarding
the input assumptions relative to historical experience. The actual estimates were based on what management concluded to be the most
probable assumptions within the range of reasonably possible assumptions.
a) Credit impairment allowance
The application of the ECL impairment methodology for calculating credit impairment allowances is highly susceptible to change from
period to period. The methodology requires management to make a number of judgmental assumptions in determining the estimates. Any
significant difference between the estimated amounts and actual amounts could have a material impact on the Santander UK group’s
future financial results and financial condition.
Key areas of judgement in accounting estimates
The key judgements made by management in applying the ECL impairment methodology are set out below.
– Definition of default
– Forward-looking information
– Probability weights
– SICR
– Post model adjustments.
For more on each of these key judgements, see the ‘Credit risk – Santander UK group level – credit risk management’ section of the Risk
review.
Sensitivity of ECL allowance
At 31 December 2018, the probability-weighted ECL allowance totalled £807m, of which £789m related to exposures in Retail Banking,
Corporate & Commercial Banking and Corporate Centre, and £18m related to exposures in Corporate & Investment Banking. The ECL
allowance is sensitive to the methods, assumptions and estimates underlying its calculation. For example, management could have
applied different probability weights to the economic scenarios and, depending on the weights chosen, this could have a material effect on
the ECL allowance. In addition, the ECL allowance for residential mortgages, in particular, is significantly affected by the HPI assumptions
which determine the valuation of collateral used in the calculations.
Had management used different assumptions on probability weights and HPI, a larger or smaller ECL charge would have resulted that
could have had a material impact on the Santander UK group’s reported ECL allowance and profit before tax. Sensitivities to these
assumptions are set out below.
Probability weights
The amounts shown in the tables below illustrate the ECL allowances that would have arisen had management applied a 100% weighting
to each economic scenario. The allowances were calculated using a stage allocation appropriate to each economic scenario presented
and differs from the probability-weighted stage allocation used to determine the ECL allowance shown above. For exposures subject to
individual assessment, the distribution of ECL which could reasonably be expected has also been considered, assuming no change in the
number of cases subject to individual assessment, and within the context of a potential best to worst case outcome.
Retail Banking, Corporate & Commercial Banking and
Corporate Centre
Upside 2
£m
Upside 1
£m
Base case
£m
Downside 1
£m
Downside 2
£m
ECL 554 596 648 843 1,930
Corporate & Investment Banking(1)
Upside
£m
Base case
£m
Downside
£m
ECL 8 17 27
(1) As described in more detail in the ‘Santander UK Group Level – Credit Risk Management’ section, our Corporate & Investment Banking segment uses three forward-looking economic scenarios,
whereas our other segments use five scenarios. The results of the 100% weighting ECL for the Corporate & Investment Banking segment are therefore presented separately.
HPI
Given the relative size of our residential mortgage portfolio, management considers that changes in HPI assumptions underpinning the
calculation of the ECL allowance for residential mortgages of £237m at 31 December 2018 would have the most significant impact on the
ECL allowance. The table below shows the impact on profit before tax of applying an immediate and permanent house price increase /
decrease to our base case economic scenario, and assumes no changes to the staging allocation of exposures:
Increase/decrease in house prices
+20% +10% -10% -20%
£m £m £m
Increase/(decrease) in profit before tax 20 12 (20) (52)

ˆ200G2Mlv!2StXBb6^Š200G2Mlv!2StXBb6^
628340 TX 154SANTANDERFORM 20-F (SAN UK PL
03-Mar-2019 08:11 ESTHTMLON
Donnelley Financial EGV palap0dc 3*ESS 0C
VDI-W7-PFL-052912.9.12.0
Page 1 of 1
Annual Report 2018 | Financial statements
b) Provisions
(i) PPI conduct remediation
The most critical factor in determining the level of PPI provision is the volume of claims that fall in scope for Santander UK. The uphold rate is informed by
historical experience and the average cost of redress can be predicted reasonably accurately given that management is dealing with a high volume and
reasonably homogeneous population. In setting the provision, management estimated the total claims that were likely to be received to the end of the
time-bar period in August 2019.
Key areas of judgement in accounting estimates
The provision mainly represents management’s best estimate of Santander UK’s future liability in respect of misselling of PPI policies and Plevin
complaints. It requires significant judgement by management in determining appropriate assumptions, which include the level of complaints expected to be
received, of those, the number that will be upheld and redressed (reflecting legal and regulatory responsibilities, including the determination of liability and
the effect of the time bar), as well as the redress costs for each of the different populations of customers identified. These are described in more detail in
the ‘PPI assumptions’ section in Note 30.
Sensitivity of PPI conduct remediation provision
We made no additional provision charges for PPI conduct remediation relating to past activities and products sold recognised in 2018 (2017: £109m,
2016: £144m). The balance sheet provision amounted to £246m (2017: £356m, 2016: £457m). Detailed disclosures on the provision for PPI conduct
remediation can be found in Note 30.
Had management used different assumptions, a larger or smaller provision charge would have resulted that could have had a material impact on the
Santander UK group’s reported profit before tax. Detailed disclosures on the assumptions used, including sensitivities, can be found in Note 30.
(ii) Other
As set out in Note 30, an amount of £58m (2017: £nil) was charged in 2018 and arose from a systems-related historical issue identified by Santander UK,
relating to compliance with certain requirements of the Consumer Credit Act (CCA). This provision is based on detailed reviews of relevant systems
related to consumer credit business operations, supported by external legal and regulatory advice, and reflects our best estimate at 31 December 2018 of
potential costs in respect of the identified issue. However, as detailed in Note 32, these reviews and the related analysis are not yet complete, such that
the approach and timing to any remediation has not yet been finalised, although it is expected to commence in 2019.
c) Pensions
The Santander UK group operates a number of defined benefit pension schemes as described in Note 31 and estimates their position as described in the
accounting policy ‘Pensions and other post retirement benefits’.
Key areas of judgement in accounting estimates
Accounting for defined benefit pension schemes requires management to make assumptions principally about the discount rate adopted, but also about
price inflation, pension increases, life expectancy and earnings growth. Management’s assumptions are based on past experience and current economic
trends, which are not necessarily an indication of future experience. These are described in more detail in the ‘Actuarial assumptions’ section in Note 31.
Sensitivity of defined benefit pension scheme estimates
The defined benefit pension schemes which were in a net asset position at 31 December 2018 had a surplus of £842m (2017: £449m) and the defined
benefit pension schemes which were in a net liability position at 31 December 2018 had a deficit of £114m (2017: £286m).
Had management used different assumptions, a larger or smaller pension remeasurement gain or loss would have resulted that could have had a material
impact on the Santander UK group’s reported financial position. Detailed disclosures on the actuarial assumption sensitivities of the schemes can be
found in the ‘Actuarial assumption sensitivities’ section in Note 31.
154 Santander UK plc

ˆ200G2Mlv!2S%sxMghŠ200G2Mlv!2S%sxMgh
628340 TX 155SANTANDERFORM 20-F (SAN UK PL
03-Mar-2019 08:44 ESTHTMLON
Donnelley Financial EGV manra0dc 11*ESS 0C
VDI-W7-PFL-165312.9.12.0
bar5
Page 1 of 1
> Notes to the financial statements
Santander UK plc 155
2. SEGMENTS
Santander UK’s principal activity is financial services, mainly in the UK. The business is managed and reported on the basis of the
following segments, which are strategic business units that offer different products and services, have different customers and require
different technology and marketing strategies:
– Retail Banking offers a wide range of products and financial services to individuals and small businesses through a network of
branches and ATMs, as well as through telephony, digital and intermediary channels. Retail Banking includes business banking
customers, small businesses with an annual turnover up to £6.5m, and Santander Consumer Finance, predominantly a vehicle finance
business.
– Corporate & Commercial Banking To better align reporting to the nature of the business segment following ring-fence transfers,
Commercial Banking has been re-branded as Corporate & Commercial Banking. Corporate & Commercial Banking covers businesses
with an annual turnover of £6.5m to £500m. Corporate & Commercial Banking offers a wide range of products and financial services
provided by relationship teams that are based in a network of regional CBCs and through telephony and digital channels.
– Corporate & Investment Banking As part of a rebrand across the Banco Santander group, Global Corporate Banking (the UK
segment of Santander Global Corporate Banking) has been branded as Corporate & Investment Banking. CIB services corporate
clients with an annual turnover of £500m and above. CIB clients require specially tailored solutions and value-added services due to
their size, complexity and sophistication. We provide these clients with products to manage currency fluctuations, protect against
interest rate risk, and arrange capital markets finance and specialist trade finance solutions, as well as providing support to the rest of
Santander UK’s business segments.
– Corporate Centre mainly includes the treasury, non-core corporate and legacy portfolios, including Crown Dependencies. Corporate
Centre is also responsible for managing capital and funding, balance sheet composition, structure, pension and strategic liquidity risk.
To enable a more targeted and strategically aligned apportionment of capital and other resources, revenues and costs incurred in
Corporate Centre are allocated to the three business segments. The non-core corporate and legacy portfolios are being run-down
and/or managed for value.
The segmental data below is presented in a manner consistent with the internal reporting to the committee which is responsible for
allocating resources and assessing performance of the segments and has been identified as the chief operating decision maker. The
segmental data is prepared on a statutory basis of accounting, in line with the accounting policies set out in Note 1. Transactions between
segments are on normal commercial terms and conditions. Internal charges and internal UK transfer pricing adjustments are reflected in
the results of each segment. Revenue sharing agreements are used to allocate external customer revenues to a segment on a reasonable
basis. Funds are ordinarily reallocated between segments, resulting in funding cost transfers disclosed in operating income. Interest
charged for these funds is based on Santander UK’s cost of wholesale funding. Interest income and interest expense have not been
reported separately. The majority of segment revenues are interest income in nature and net interest income is relied on primarily to
assess segment performance and to make decisions on the allocation of segment resources.
The segmental basis of presentation in this Annual Report has been changed, and prior periods restated, to report our Jersey and Isle of
Man branches in Corporate Centre rather than in Retail Banking as in previous years, as a result of their transfer from Santander UK plc to
ANTS in December 2018. Prior periods have not been restated for the changes in our statutory perimeter in the third quarter of 2018,
following the ring-fence transfers to Banco Santander London Branch, as described in Note 43.
Results by segment
2018
Retail
Banking
£m
Corporate &
Commercial
Banking
£m
Corporate &
investment
Banking
£m
Corporate
Centre
£m
Total
£m
Net interest income 3,126 403 69 5 3,603
Non-interest income/(expense) 638 82 272 (61) 931
Total operating income/(expense) 3,764 485 341 (56) 4,534
Operating expenses before credit impairment losses, provisions and charges (1,929) (258) (262) (130) (2,579)
Credit impairment (losses)/releases (124) (23) (14) 8 (153)
Provisions for other liabilities and charges (230) (14) (8) (5) (257)
Total operating credit impairment losses, provisions and (charges)/releases(1) (354) (37) (22) 3 (410)
Profit/(loss) before tax 1,481 190 57 (183) 1,545
Revenue from external customers 4,421 638 386 (911) 4,534
Inter-segment revenue (657) (153) (45) 855 –
Total operating income/(expense) 3,764 485 341 (56) 4,534
Revenue from external customers includes the following fee and commission income
disaggregated by income type:(2)
– Current account and debit card fees 697 27 29 – 753
– Insurance, protection and investments 105 – – – 105
– Credit cards 85 – – – 85
– Non-banking and other fees(3) 75 62 87 3 227
Total fee and commission income 962 89 116 3 1,170
Fee and commission expense (382) (25) (14) – (421)
Net fee and commission income 580 64 102 3 749
Customer loans 172,747 17,702 4,613 4,524 199,586
Total assets(4) 201,261 17,702 27,569 36,840 283,372
Customer deposits 142,065 17,606 4,853 2,791 167,315
Total liabilities 142,839 17,634 8,480 98,510 267,463
Average number of staff 20,694 1,732 1,108 111 23,645
(1) Credit impairment losses for 2018 are calculated on an IFRS 9 basis and for 2017 and earlier on an IAS 39 basis. For more on this methodology change, see the IFRS 9 accounting policy changes
in Note 1 and the IFRS 9 transition disclosures in Note 44.
(2) The disaggregation of fees and commission income as shown above is not included in reports provided to the chief operating decision maker but is provided to show the split by reportable
segments.
(3) Non-banking and other fees include mortgages, consumer finance, commitment commission, asset finance, invoice finance and trade finance.
(4) Includes customer loans, net of credit impairment loss allowances.
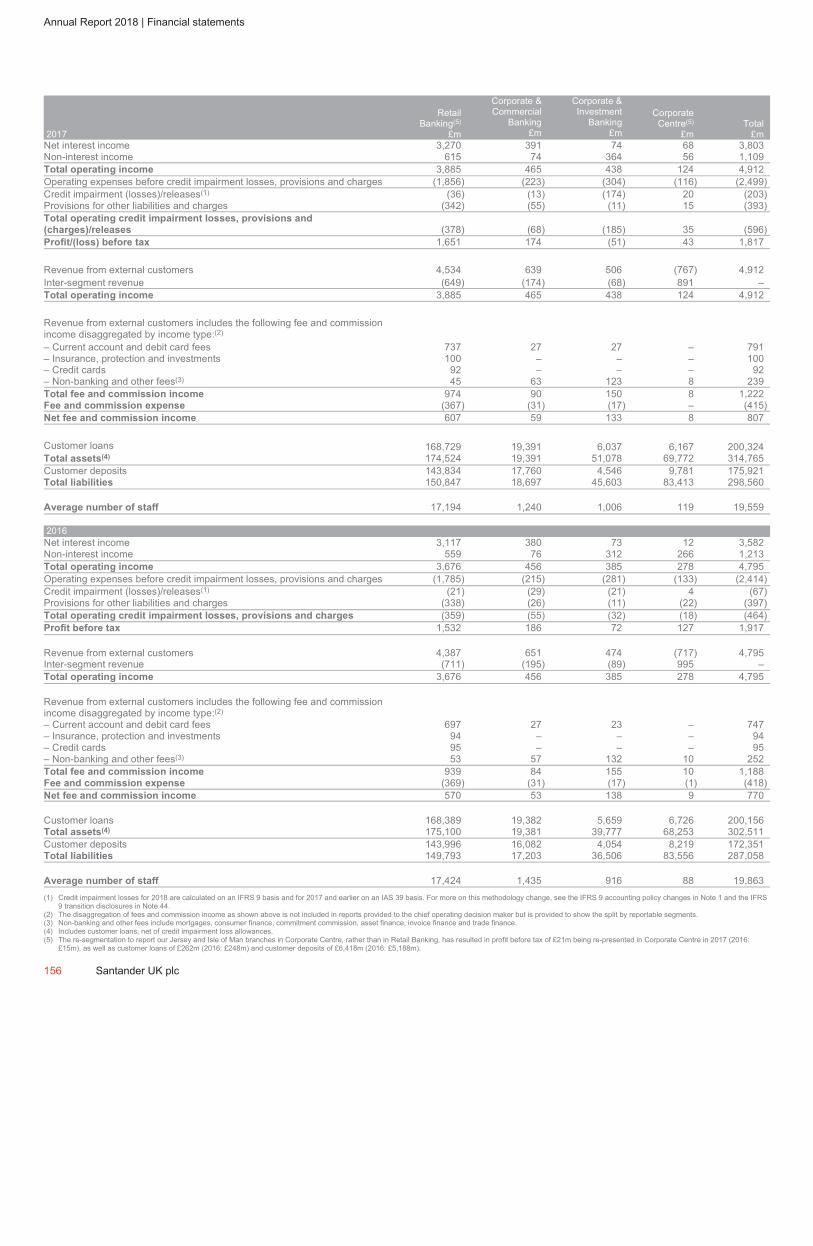
ˆ200G2Mlv!2S%wM26tŠ200G2Mlv!2S%wM26t
628340 TX 156SANTANDERFORM 20-F (SAN UK PL
03-Mar-2019 08:44 ESTHTMLON
Donnelley Financial EGV manra0dc 6*ESS 0C
VDI-W7-PFL-165312.9.12.0
Page 1 of 1
Annual Report 2018 | Financial statements
2017
Retail
Banking(5)
£m
Corporate &
Commercial
Banking
£m
Corporate &
Investment
Banking
£m
Corporate
Centre(5)
£m
Total
£m
Net interest income 3,270 391 74 68 3,803
Non-interest income 615 74 364 56 1,109
Total operating income 3,885 465 438 124 4,912
Operating expenses before credit impairment losses, provisions and charges (1,856) (223) (304) (116) (2,499)
Credit impairment (losses)/releases(1) (36) (13) (174) 20 (203)
Provisions for other liabilities and charges (342) (55) (11) 15 (393)
Total operating credit impairment losses, provisions and
(charges)/releases (378) (68) (185) 35 (596)
Profit/(loss) before tax 1,651 174 (51) 43 1,817
Revenue from external customers 4,534 639 506 (767) 4,912
Inter-segment revenue (649) (174) (68) 891 –
Total operating income 3,885 465 438 124 4,912
Revenue from external customers includes the following fee and commission
income disaggregated by income type:(2)
– Current account and debit card fees 737 27 27 – 791
– Insurance, protection and investments 100 – – – 100
– Credit cards 92 – – – 92
– Non-banking and other fees(3) 45 63 123 8 239
Total fee and commission income 974 90 150 8 1,222
Fee and commission expense (367) (31) (17) – (415)
Net fee and commission income 607 59 133 8 807
Customer loans 168,729 19,391 6,037 6,167 200,324
Total assets(4) 174,524 19,391 51,078 69,772 314,765
Customer deposits 143,834 17,760 4,546 9,781 175,921
Total liabilities 150,847 18,697 45,603 83,413 298,560
Average number of staff 17,194 1,240 1,006 119 19,559
2016
Net interest income 3,117 380 73 12 3,582
Non-interest income 559 76 312 266 1,213
Total operating income 3,676 456 385 278 4,795
Operating expenses before credit impairment losses, provisions and charges (1,785) (215) (281) (133) (2,414)
Credit impairment (losses)/releases(1) (21) (29) (21) 4 (67)
Provisions for other liabilities and charges (338) (26) (11) (22) (397)
Total operating credit impairment losses, provisions and charges (359) (55) (32) (18) (464)
Profit before tax 1,532 186 72 127 1,917
Revenue from external customers 4,387 651 474 (717) 4,795
Inter-segment revenue (711) (195) (89) 995 –
Total operating income 3,676 456 385 278 4,795
Revenue from external customers includes the following fee and commission
income disaggregated by income type:(2)
– Current account and debit card fees 697 27 23 – 747
– Insurance, protection and investments 94 – – – 94
– Credit cards 95 – – – 95
– Non-banking and other fees(3) 53 57 132 10 252
Total fee and commission income 939 84 155 10 1,188
Fee and commission expense (369) (31) (17) (1) (418)
Net fee and commission income 570 53 138 9 770
Customer loans 168,389 19,382 5,659 6,726 200,156
Total assets(4) 175,100 19,381 39,777 68,253 302,511
Customer deposits 143,996 16,082 4,054 8,219 172,351
Total liabilities 149,793 17,203 36,506 83,556 287,058
Average number of staff 17,424 1,435 916 88 19,863
(1) Credit impairment losses for 2018 are calculated on an IFRS 9 basis and for 2017 and earlier on an IAS 39 basis. For more on this methodology change, see the IFRS 9 accounting policy changes in Note 1 and the IFRS
9 transition disclosures in Note 44.
(2) The disaggregation of fees and commission income as shown above is not included in reports provided to the chief operating decision maker but is provided to show the split by reportable segments.
(3) Non-banking and other fees include mortgages, consumer finance, commitment commission, asset finance, invoice finance and trade finance.
(4) Includes customer loans, net of credit impairment loss allowances.
(5) The re-segmentation to report our Jersey and Isle of Man branches in Corporate Centre, rather than in Retail Banking, has resulted in profit before tax of £21m being re-presented in Corporate Centre in 2017 (2016:
£15m), as well as customer loans of £262m (2016: £248m) and customer deposits of £6,418m (2016: £5,188m).
156 Santander UK plc
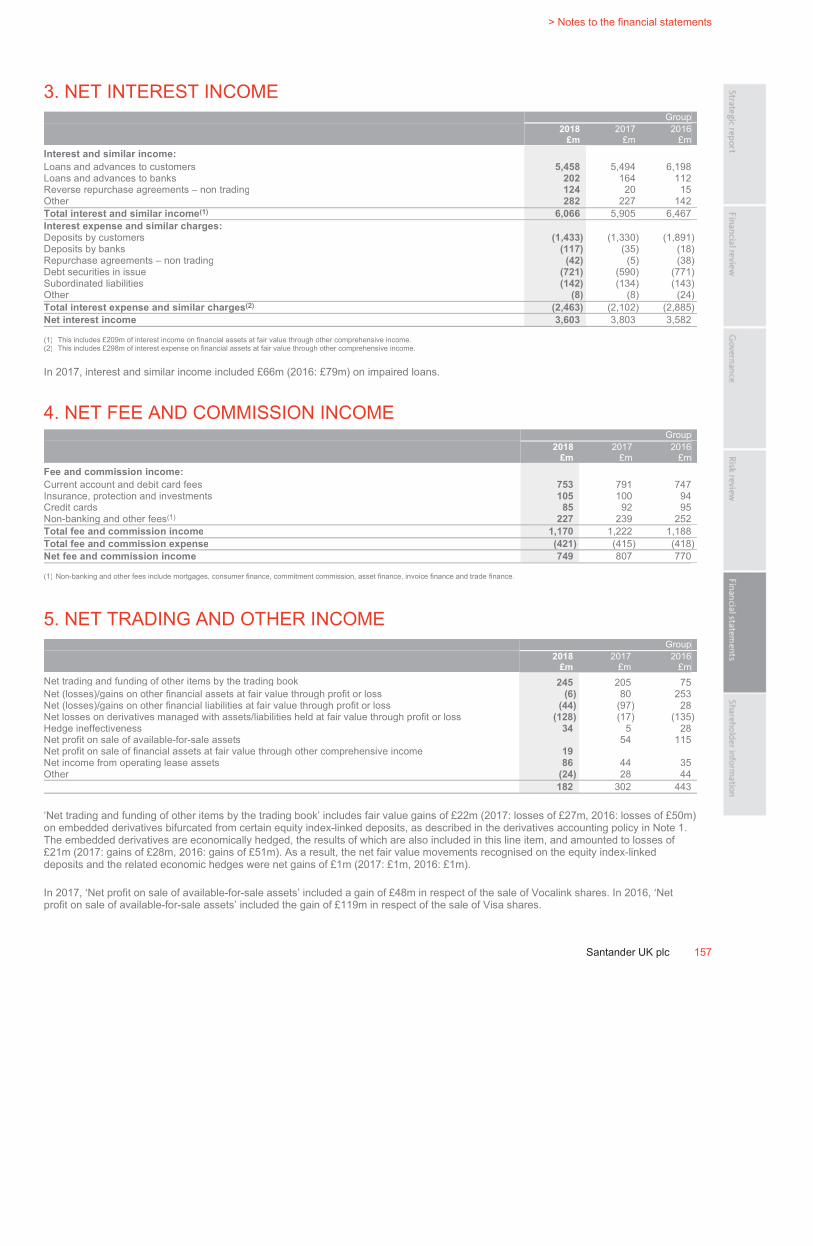
ˆ200G2Mlv!2S&oqN6‹Š200G2Mlv!2S&oqN6
628340 TX 157SANTANDERFORM 20-F (SAN UK PL
03-Mar-2019 08:47 ESTHTMLON
Donnelley Financial EGV dommj0dc 5*ESS 0C
VDI-W7-PFD-037612.9.12.0
bar5
Page 1 of 1
> Notes to the financial statements
Santander UK plc 157
3. NET INTEREST INCOME
Group
2018
£m
2017
£m
2016
£m
Interest and similar income:
Loans and advances to customers 5,458 5,494 6,198
Loans and advances to banks 202 164 112
Reverse repurchase agreements – non trading 124 20 15
Other 282 227 142
Total interest and similar income(1) 6,066 5,905 6,467
Interest expense and similar charges:
Deposits by customers (1,433) (1,330) (1,891)
Deposits by banks (117) (35) (18)
Repurchase agreements – non trading (42) (5) (38)
Debt securities in issue (721) (590) (771)
Subordinated liabilities (142) (134) (143)
Other (8) (8) (24)
Total interest expense and similar charges(2)
(2,463) (2,102) (2,885)
Net interest income 3,603 3,803 3,582
(1) This includes £209m of interest income on financial assets at fair value through other comprehensive income.
(2) This includes £298m of interest expense on financial assets at fair value through other comprehensive income.
In 2017, interest and similar income included £66m (2016: £79m) on impaired loans.
4. NET FEE AND COMMISSION INCOME
Group
2018
£m
2017
£m
2016
£m
Fee and commission income:
Current account and debit card fees 753 791 747
Insurance, protection and investments 105 100 94
Credit cards 85 92 95
Non-banking and other fees(1) 227 239 252
Total fee and commission income 1,170 1,222 1,188
Total fee and commission expense (421) (415) (418)
Net fee and commission income 749 807 770
(1) Non-banking and other fees include mortgages, consumer finance, commitment commission, asset finance, invoice finance and trade finance.
5. NET TRADING AND OTHER INCOME
Group
2018
£m
2017
£m
2016
£m
Net trading and funding of other items by the trading book 245 205 75
Net (losses)/gains on other financial assets at fair value through profit or loss (6) 80 253
Net (losses)/gains on other financial liabilities at fair value through profit or loss (44) (97) 28
Net losses on derivatives managed with assets/liabilities held at fair value through profit or loss (128) (17) (135)
Hedge ineffectiveness 34 5 28
Net profit on sale of available-for-sale assets 54 115
Net profit on sale of financial assets at fair value through other comprehensive income 19
Net income from operating lease assets 86 44 35
Other (24) 28 44
182 302 443
‘Net trading and funding of other items by the trading book’ includes fair value gains of £22m (2017: losses of £27m, 2016: losses of £50m)
on embedded derivatives bifurcated from certain equity index-linked deposits, as described in the derivatives accounting policy in Note 1.
The embedded derivatives are economically hedged, the results of which are also included in this line item, and amounted to losses of
£21m (2017: gains of £28m, 2016: gains of £51m). As a result, the net fair value movements recognised on the equity index-linked
deposits and the related economic hedges were net gains of £1m (2017: £1m, 2016: £1m).
In 2017, ‘Net profit on sale of available-for-sale assets’ included a gain of £48m in respect of the sale of Vocalink shares. In 2016, ‘Net
profit on sale of available-for-sale assets’ included the gain of £119m in respect of the sale of Visa shares.
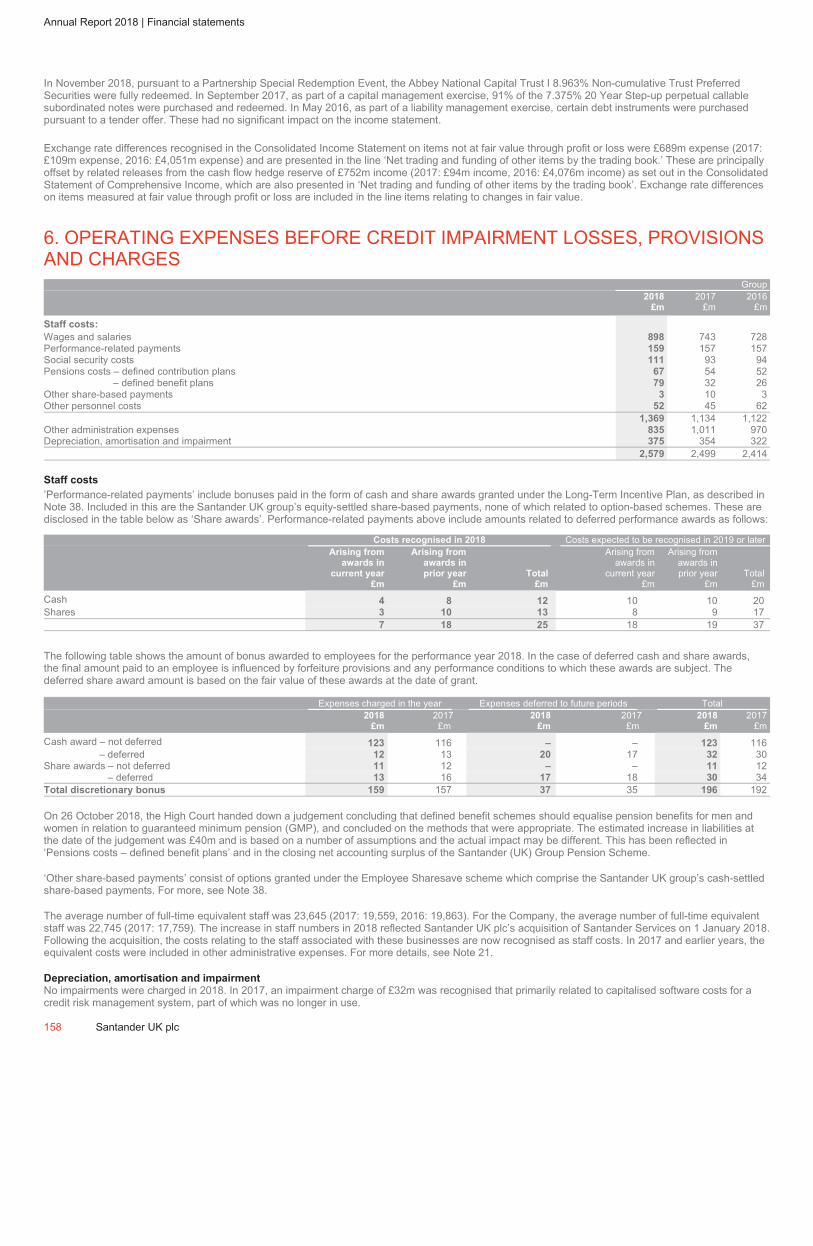
ˆ200G2Mlv!2TT1ng6oŠ200G2Mlv!2TT1ng6o
628340 TX 158SANTANDERFORM 20-F (SAN UK PL
03-Mar-2019 10:13 ESTHTMLON
Donnelley Financial EGV manra0dc 10*ESS 0C
VDI-W7-PFL-165312.9.12.0
Page 1 of 1
Annual Report 2018 | Financial statements
In November 2018, pursuant to a Partnership Special Redemption Event, the Abbey National Capital Trust I 8.963% Non-cumulative Trust Preferred
Securities were fully redeemed. In September 2017, as part of a capital management exercise, 91% of the 7.375% 20 Year Step-up perpetual callable
subordinated notes were purchased and redeemed. In May 2016, as part of a liability management exercise, certain debt instruments were purchased
pursuant to a tender offer. These had no significant impact on the income statement.
Exchange rate differences recognised in the Consolidated Income Statement on items not at fair value through profit or loss were £689m expense (2017:
£109m expense, 2016: £4,051m expense) and are presented in the line ‘Net trading and funding of other items by the trading book.’ These are principally
offset by related releases from the cash flow hedge reserve of £752m income (2017: £94m income, 2016: £4,076m income) as set out in the Consolidated
Statement of Comprehensive Income, which are also presented in ‘Net trading and funding of other items by the trading book’. Exchange rate differences
on items measured at fair value through profit or loss are included in the line items relating to changes in fair value.
6. OPERATING EXPENSES BEFORE CREDIT IMPAIRMENT LOSSES, PROVISIONS
AND CHARGES
Group
2018
£m
2017
£m
2016
£m
Staff costs:
Wages and salaries 898 743 728
Performance-related payments 159 157 157
Social security costs 111 93 94
Pensions costs – defined contribution plans 67 54 52
– defined benefit plans 79 32 26
Other share-based payments 3 10 3
Other personnel costs 52 45 62
1,369 1,134 1,122
Other administration expenses 835 1,011 970
Depreciation, amortisation and impairment 375 354 322
2,579 2,499 2,414
Staff costs
’Performance-related payments’ include bonuses paid in the form of cash and share awards granted under the Long-Term Incentive Plan, as described in
Note 38. Included in this are the Santander UK group’s equity-settled share-based payments, none of which related to option-based schemes. These are
disclosed in the table below as ‘Share awards’. Performance-related payments above include amounts related to deferred performance awards as follows:
Costs recognised in 2018 Costs expected to be recognised in 2019 or later
Arising from
awards in
current year
£m
Arising from
awards in
prior year
£m
Total
£m
Arising from
awards in
current year
£m
Arising from
awards in
prior year
£m
Total
£m
Cash 4 8 12 10 10 20
Shares 3 10 13 8 9 17
7 18 25 18 19 37
The following table shows the amount of bonus awarded to employees for the performance year 2018. In the case of deferred cash and share awards,
the final amount paid to an employee is influenced by forfeiture provisions and any performance conditions to which these awards are subject. The
deferred share award amount is based on the fair value of these awards at the date of grant.
Expenses charged in the year Expenses deferred to future periods Total
2018
£m
2017
£m
2018
£m
2017
£m
2018
£m
2017
£m
Cash award – not deferred 123 116 – – 123 116
– deferred 12 13 20 17 32 30
Share awards – not deferred 11 12 – – 11 12
– deferred 13 16 17 18 30 34
Total discretionary bonus 159 157 37 35 196 192
On 26 October 2018, the High Court handed down a judgement concluding that defined benefit schemes should equalise pension benefits for men and
women in relation to guaranteed minimum pension (GMP), and concluded on the methods that were appropriate. The estimated increase in liabilities at
the date of the judgement was £40m and is based on a number of assumptions and the actual impact may be different. This has been reflected in
‘Pensions costs – defined benefit plans’ and in the closing net accounting surplus of the Santander (UK) Group Pension Scheme.
‘Other share-based payments’ consist of options granted under the Employee Sharesave scheme which comprise the Santander UK group’s cash-settled
share-based payments. For more, see Note 38.
The average number of full-time equivalent staff was 23,645 (2017: 19,559, 2016: 19,863). For the Company, the average number of full-time equivalent
staff was 22,745 (2017: 17,759). The increase in staff numbers in 2018 reflected Santander UK plc’s acquisition of Santander Services on 1 January 2018.
Following the acquisition, the costs relating to the staff associated with these businesses are now recognised as staff costs. In 2017 and earlier years, the
equivalent costs were included in other administrative expenses. For more details, see Note 21.
Depreciation, amortisation and impairment
No impairments were charged in 2018. In 2017, an impairment charge of £32m was recognised that primarily related to capitalised software costs for a
credit risk management system, part of which was no longer in use.
158 Santander UK plc

ˆ200G2Mlv!2SHua56rŠ200G2Mlv!2SHua56r
628340 TX 159SANTANDERFORM 20-F (SAN UK PL
03-Mar-2019 06:50 ESTHTMLON
Donnelley Financial EGV palap0dc 3*ESS 0C
VDI-W7-PFL-052912.9.12.0
bar5
Page 1 of 1
> Notes to the financial statements
Santander UK plc 159
7. AUDIT AND OTHER SERVICES
Group
2018
£m
2017
£m
2016
£m
Audit fees:
Fees payable to the Company’s auditor and its associates for the audit of the Santander UK group’s
annual accounts 7.2 7.4 4.6
Fees payable to the Company’s auditor and its associates for other services to the Santander UK group:
– Audit of the Santander UK group’s subsidiaries 1.1 1.4 1.1
Total audit fees(1) 8.3 8.8 5.7
Non-audit fees:
Audit-related assurance services(2)
0.7 0.7 0.6
Taxation compliance services – – 0.1
Other assurance services 0.1 0.1 –
Other non-audit services 1.0 0.4 1.9
Total non-audit fees 1.8 1.2 2.6
(1) 2018 audit fees included £nil (2017: £0.6m) which related to the prior year.
(2) 2018 audit-related assurance services included £0.1m (2017: £0.1m) which related to the prior year.
Audit-related assurance services relate to services performed in connection with the statutory and regulatory filings of the Company and its
associates. Of this category, £0.1m (2017: £0.1m, 2016: £0.1m) accords with the definition of ‘Audit fees’ per US Securities and Exchange
Commission (SEC) guidance. The remaining £0.6m (2017: £0.6m, 2016: £0.5m) accords with the definition of ‘Audit-related fees’ per that
guidance and relates to services performed in connection with securitisation, debt issuance and related work and reporting to prudential
and conduct regulators.
Taxation compliance services accord with the SEC definition of ‘Tax fees’ and relate to compliance services performed in respect of US tax
returns and other similar tax compliance services.
Other assurance services and other non-audit services accord with the SEC definition of ‘All other fees’.
In 2018, the Company’s auditors also earned fees of £150,000 (2017: £45,000) payable by entities outside the Santander UK group for the
review of the financial position of corporate and other borrowers.
8. CREDIT IMPAIRMENT LOSSES AND PROVISIONS
Group
2018
£m
2017
£m
2016
£m
Credit impairment losses:
Loans and advances to customers (See Note 14) 189 257 132
Recoveries of loans and advances, net of collection costs (See Note 14) (42) (54) (65)
Off-balance sheet exposures (See Note 30) 6
153 203 67
Provisions for other liabilities and charges (excluding off-balance sheet credit exposures) (See Note 30) 257 385 397
Provisions for RV and voluntary termination (See Note 14) – 8 –
257 393 397
410 596 464
The credit impairment loss allowance requirements introduced by IFRS 9 mandated a change from recognising impairment losses on an
incurred loss basis (as reflected in 2017) to an expected credit loss (ECL) basis (as reflected in 2018). For more on this change in
methodology, see the IFRS 9 accounting policy changes in Note 1 and the IFRS 9 transition disclosures in Note 44. There were no
material credit impairment losses on loans and advances to banks, non-trading reverse repurchase agreements, other financial assets at
amortised cost and financial assets at fair value through other comprehensive income.
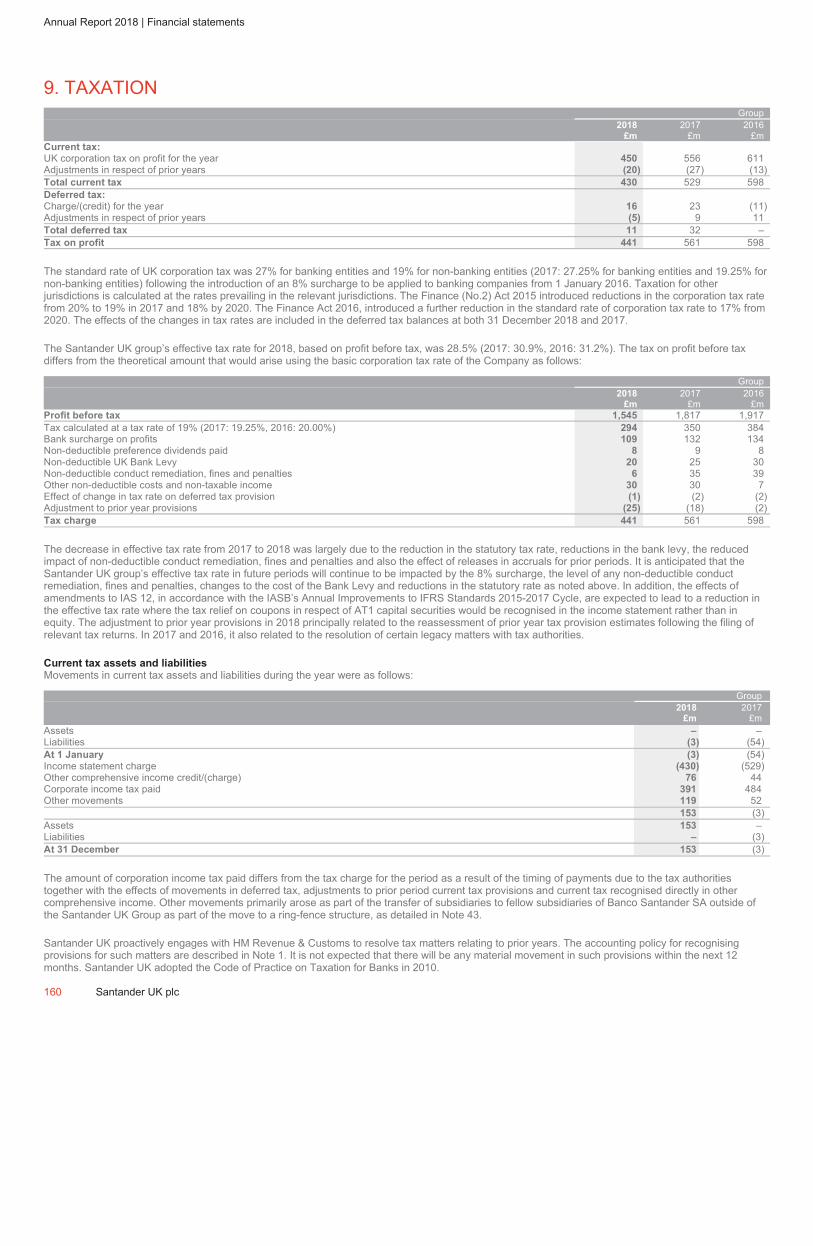
ˆ200G2Mlv!2T1xNd6yŠ200G2Mlv!2T1xNd6y
628340 TX 160SANTANDERFORM 20-F (SAN UK PL
03-Mar-2019 08:59 ESTHTMLON
Donnelley Financial EGV dommj0dc 4*ESS 0C
VDI-W7-PFD-037612.9.12.0
Page 1 of 1
Annual Report 2018 | Financial statements
9. TAXATION
Group
2018
£m
2017
£m
2016
£m
Current tax:
UK corporation tax on profit for the year 450 556 611
Adjustments in respect of prior years (20) (27) (13)
Total current tax 430 529 598
Deferred tax:
Charge/(credit) for the year 16 23 (11)
Adjustments in respect of prior years (5) 9 11
Total deferred tax 11 32 –
Tax on profit 441 561 598
The standard rate of UK corporation tax was 27% for banking entities and 19% for non-banking entities (2017: 27.25% for banking entities and 19.25% for
non-banking entities) following the introduction of an 8% surcharge to be applied to banking companies from 1 January 2016. Taxation for other
jurisdictions is calculated at the rates prevailing in the relevant jurisdictions. The Finance (No.2) Act 2015 introduced reductions in the corporation tax rate
from 20% to 19% in 2017 and 18% by 2020. The Finance Act 2016, introduced a further reduction in the standard rate of corporation tax rate to 17% from
2020. The effects of the changes in tax rates are included in the deferred tax balances at both 31 December 2018 and 2017.
The Santander UK group’s effective tax rate for 2018, based on profit before tax, was 28.5% (2017: 30.9%, 2016: 31.2%). The tax on profit before tax
differs from the theoretical amount that would arise using the basic corporation tax rate of the Company as follows:
Group
2018
£m
2017
£m
2016
£m
Profit before tax 1,545 1,817 1,917
Tax calculated at a tax rate of 19% (2017: 19.25%, 2016: 20.00%) 294 350 384
Bank surcharge on profits 109 132 134
Non-deductible preference dividends paid 8 9 8
Non-deductible UK Bank Levy 20 25 30
Non-deductible conduct remediation, fines and penalties 6 35 39
Other non-deductible costs and non-taxable income 30 30 7
Effect of change in tax rate on deferred tax provision (1) (2) (2)
Adjustment to prior year provisions (25) (18) (2)
Tax charge 441 561 598
The decrease in effective tax rate from 2017 to 2018 was largely due to the reduction in the statutory tax rate, reductions in the bank levy, the reduced
impact of non-deductible conduct remediation, fines and penalties and also the effect of releases in accruals for prior periods. It is anticipated that the
Santander UK group’s effective tax rate in future periods will continue to be impacted by the 8% surcharge, the level of any non-deductible conduct
remediation, fines and penalties, changes to the cost of the Bank Levy and reductions in the statutory rate as noted above. In addition, the effects of
amendments to IAS 12, in accordance with the IASB’s Annual Improvements to IFRS Standards 2015-2017 Cycle, are expected to lead to a reduction in
the effective tax rate where the tax relief on coupons in respect of AT1 capital securities would be recognised in the income statement rather than in
equity. The adjustment to prior year provisions in 2018 principally related to the reassessment of prior year tax provision estimates following the filing of
relevant tax returns. In 2017 and 2016, it also related to the resolution of certain legacy matters with tax authorities.
Current tax assets and liabilities
Movements in current tax assets and liabilities during the year were as follows:
Group
2018
£m
2017
£m
Assets – –
Liabilities (3) (54)
At 1 January (3) (54)
Income statement charge (430) (529)
Other comprehensive income credit/(charge) 76 44
Corporate income tax paid 391 484
Other movements 119 52
153 (3)
Assets 153 –
Liabilities – (3)
At 31 December 153 (3)
The amount of corporation income tax paid differs from the tax charge for the period as a result of the timing of payments due to the tax authorities
together with the effects of movements in deferred tax, adjustments to prior period current tax provisions and current tax recognised directly in other
comprehensive income. Other movements primarily arose as part of the transfer of subsidiaries to fellow subsidiaries of Banco Santander SA outside of
the Santander UK Group as part of the move to a ring-fence structure, as detailed in Note 43.
Santander UK proactively engages with HM Revenue & Customs to resolve tax matters relating to prior years. The accounting policy for recognising
provisions for such matters are described in Note 1. It is not expected that there will be any material movement in such provisions within the next 12
months. Santander UK adopted the Code of Practice on Taxation for Banks in 2010.
160 Santander UK plc

ˆ200G2Mlv!2SaqJWgbŠ200G2Mlv!2SaqJWgb
628340 TX 161SANTANDERFORM 20-F (SAN UK PL
03-Mar-2019 07:31 ESTHTMLON
Donnelley Financial EGV muthp0dc 4*ESS 0C
VDI-W7-PFD-011312.9.12.0
bar5
Page 1 of 1
> Notes to the financial statements
Santander UK plc 161
Deferred tax
The table below shows the deferred tax assets and liabilities including the movement in the deferred tax account during the year. Deferred
tax balances are presented in the balance sheet after offsetting assets and liabilities where the Santander UK group and Company has the
legal right to offset and intends to settle on a net basis.
Group
Fair value of
financial
instruments
£m
Pension
remeasurement
£m
Cash flow
hedges
£m
Available-
for-sale
£m
Fair value
reserve
£m
Tax losses
carried
forward
£m
Accelerated
tax
depreciation
£m
Other
temporary
differences
£m
Total
£m
At 31 December 2017 (41) (41) 3 (26) 25 (4) (4) (88)
Adoption of IFRS 9 (see Note 1) – – – 26 (26) – – 68 68
At 1 January 2018 (41) (41) 3 (26) 25 (4) 64 (20)
Income statement (charge)/credit (10) (24) – – (5) – 28 (11)
Transfers/reclassifications – – – – – (2) (18) (20)
Credited/(charged) to other
comprehensive income – (118) (46) 13 – – (21) (172)
At 31 December 2018 (51) (183) (43) (13) 20 (6) 53 (223)
At 1 January 2017 (31) (35) (50) (27) 5 (5) 15 (128)
Income statement (charge)/credit (10) (32) – – 20 1 (11) (32)
Transfers/reclassifications – – – 7 – – (7) –
Credited/(charged) to other
comprehensive income – 26 53 (6) – – (1) 72
At 31 December 2017 (41) (41) 3 (26) 25 (4) (4) (88)
The deferred tax assets and liabilities above have been recognised in both the Company and the Santander UK group on the basis that
sufficient future taxable profits are forecast within the foreseeable future, in excess of the profits arising from the reversal of existing
taxable temporary differences, to allow for the utilisation of the assets as they reverse. Based on the conditions at the balance sheet date,
management determined that a reasonably possible change in any of the key assumptions underlying the estimated future taxable profits
in the Santander UK group’s five-year plan (described in Note 22) would not cause a reduction in the deferred tax assets recognised. At
31 December 2018, both the Santander UK group and the Company had a recognised deferred tax asset in respect of UK capital losses
carried forward of £17m (2017: £21m) included within tax losses carried forward. There are no unrecognised deferred tax assets on capital
losses carried forward (2017: £nil).
In the November 2018 budget, the UK government proposed changes that could restrict the use of capital losses. Based on the changes
indicated, the Santander UK group does not believe that such changes would have a material impact on the recognition of deferred tax
assets on such capital losses once enacted.
In addition, the Santander UK group had net operating losses carried forward in the US of $nil (2017: $76m) as such losses expired on the
closure of the ANTS US Branch. A deferred tax asset was not previously recognised on these losses as the Santander UK group did not
anticipate being able to offset the losses against future profits or gains in order to realise any economic benefit in the foreseeable future.
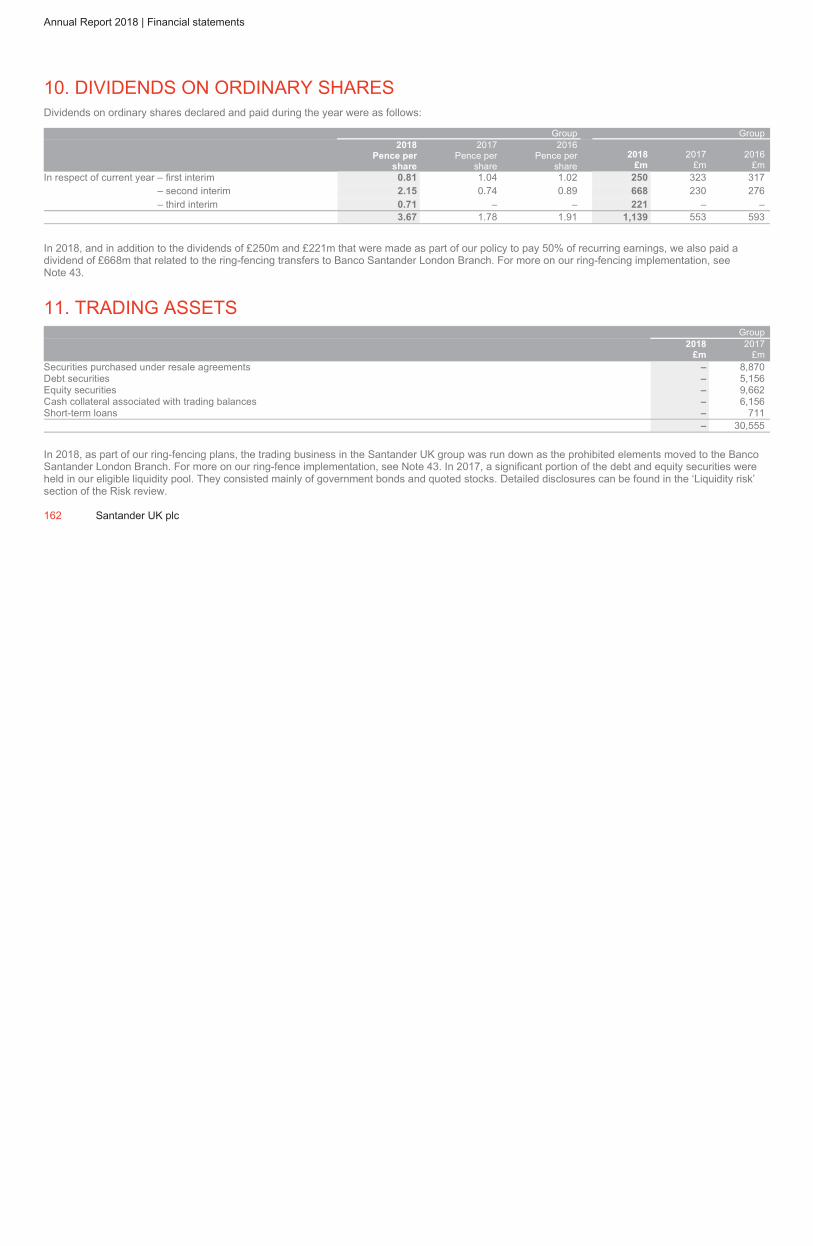
ˆ200G2Mlv!2T=XC86AŠ200G2Mlv!2T=XC86A
628340 TX 162SANTANDERFORM 20-F (SAN UK PL
03-Mar-2019 10:35 ESTHTMLON
Donnelley Financial EGV dommj0dc 7*ESS 0C
VDI-W7-PFD-037612.9.12.0
Page 1 of 1
Annual Report 2018 | Financial statements
10. DIVIDENDS ON ORDINARY SHARES
Dividends on ordinary shares declared and paid during the year were as follows:
Group Group
2018
Pence per
share
2017
Pence per
share
2016
Pence per
share
2018
£m
2017
£m
2016
£m
In respect of current year – first interim 0.81 1.04 1.02 250 323 317
– second interim 2.15 0.74 0.89 668 230 276
– third interim 0.71 – – 221 – –
3.67 1.78 1.91 1,139 553 593
In 2018, and in addition to the dividends of £250m and £221m that were made as part of our policy to pay 50% of recurring earnings, we also paid a
dividend of £668m that related to the ring-fencing transfers to Banco Santander London Branch. For more on our ring-fencing implementation, see
Note 43.
11. TRADING ASSETS
Group
2018
£m
2017
£m
Securities purchased under resale agreements – 8,870
Debt securities – 5,156
Equity securities – 9,662
Cash collateral associated with trading balances – 6,156
Short-term loans – 711
– 30,555
In 2018, as part of our ring-fencing plans, the trading business in the Santander UK group was run down as the prohibited elements moved to the Banco
Santander London Branch. For more on our ring-fence implementation, see Note 43. In 2017, a significant portion of the debt and equity securities were
held in our eligible liquidity pool. They consisted mainly of government bonds and quoted stocks. Detailed disclosures can be found in the ‘Liquidity risk’
section of the Risk review.
162 Santander UK plc
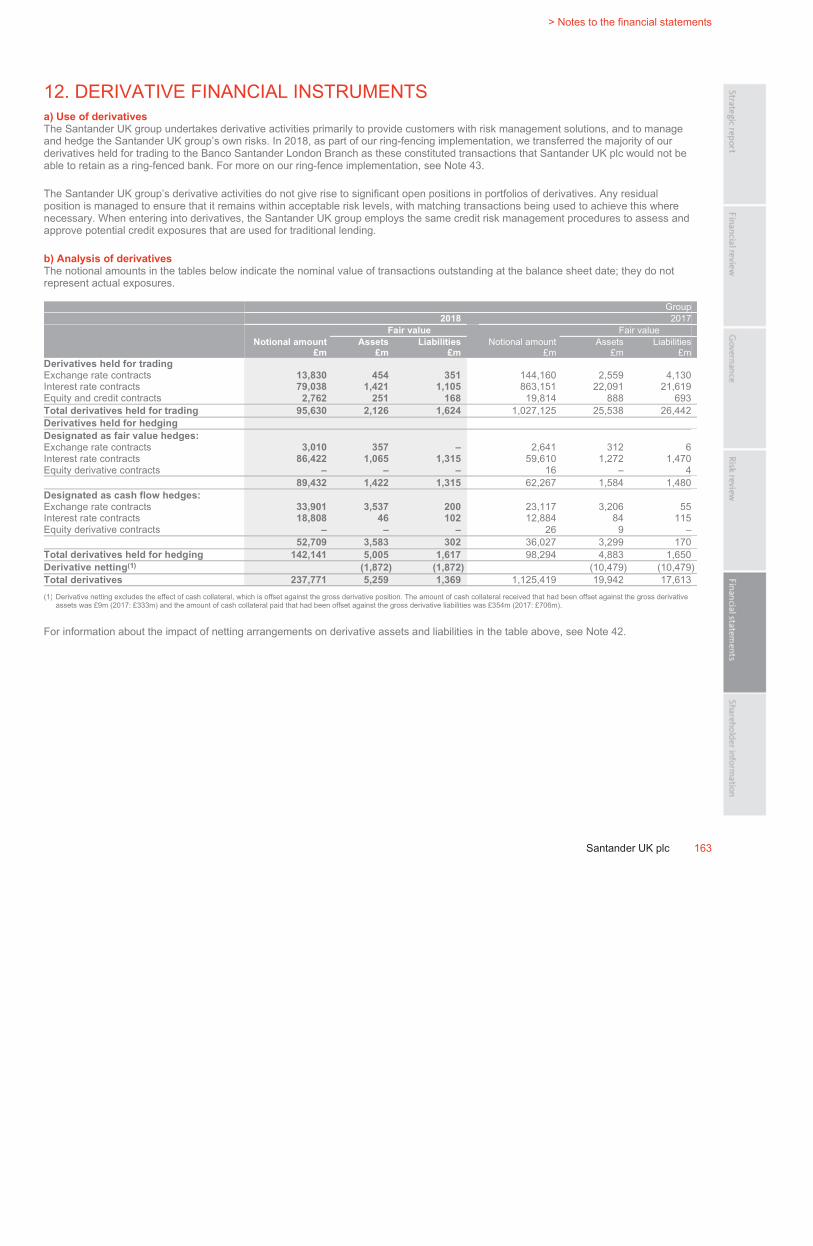
ˆ200G2Mlv!2Sf7=bglŠ200G2Mlv!2Sf7=bgl
628340 TX 163SANTANDERFORM 20-F (SAN UK PL
03-Mar-2019 07:45 ESTHTMLON
Donnelley Financial EGV muthp0dc 3*ESS 0C
VDI-W7-PFD-011312.9.12.0
bar5
Page 1 of 1
> Notes to the financial statements
Santander UK plc 163
12. DERIVATIVE FINANCIAL INSTRUMENTS
a) Use of derivatives
The Santander UK group undertakes derivative activities primarily to provide customers with risk management solutions, and to manage
and hedge the Santander UK group’s own risks. In 2018, as part of our ring-fencing implementation, we transferred the majority of our
derivatives held for trading to the Banco Santander London Branch as these constituted transactions that Santander UK plc would not be
able to retain as a ring-fenced bank. For more on our ring-fence implementation, see Note 43.
The Santander UK group’s derivative activities do not give rise to significant open positions in portfolios of derivatives. Any residual
position is managed to ensure that it remains within acceptable risk levels, with matching transactions being used to achieve this where
necessary. When entering into derivatives, the Santander UK group employs the same credit risk management procedures to assess and
approve potential credit exposures that are used for traditional lending.
b) Analysis of derivatives
The notional amounts in the tables below indicate the nominal value of transactions outstanding at the balance sheet date; they do not
represent actual exposures.
Group
2018 2017
Fair value Fair value
Notional amount
£m
Assets
£m
Liabilities
£m
Notional amount
£m
Assets
£m
Liabilities
£m
Derivatives held for trading
Exchange rate contracts 13,830 454 351 144,160 2,559 4,130
Interest rate contracts 79,038 1,421 1,105 863,151 22,091 21,619
Equity and credit contracts 2,762 251 168 19,814 888 693
Total derivatives held for trading 95,630 2,126 1,624 1,027,125 25,538 26,442
Derivatives held for hedging
Designated as fair value hedges:
Exchange rate contracts 3,010 357 – 2,641 312 6
Interest rate contracts 86,422 1,065 1,315 59,610 1,272 1,470
Equity derivative contracts – – – 16 – 4
89,432 1,422 1,315 62,267 1,584 1,480
Designated as cash flow hedges:
Exchange rate contracts 33,901 3,537 200 23,117 3,206 55
Interest rate contracts 18,808 46 102 12,884 84 115
Equity derivative contracts – – – 26 9 –
52,709 3,583 302 36,027 3,299 170
Total derivatives held for hedging 142,141 5,005 1,617 98,294 4,883 1,650
Derivative netting(1) (1,872) (1,872) (10,479) (10,479)
Total derivatives 237,771 5,259 1,369 1,125,419 19,942 17,613
(1) Derivative netting excludes the effect of cash collateral, which is offset against the gross derivative position. The amount of cash collateral received that had been offset against the gross derivative
assets was £9m (2017: £333m) and the amount of cash collateral paid that had been offset against the gross derivative liabilities was £354m (2017: £706m).
For information about the impact of netting arrangements on derivative assets and liabilities in the table above, see Note 42.
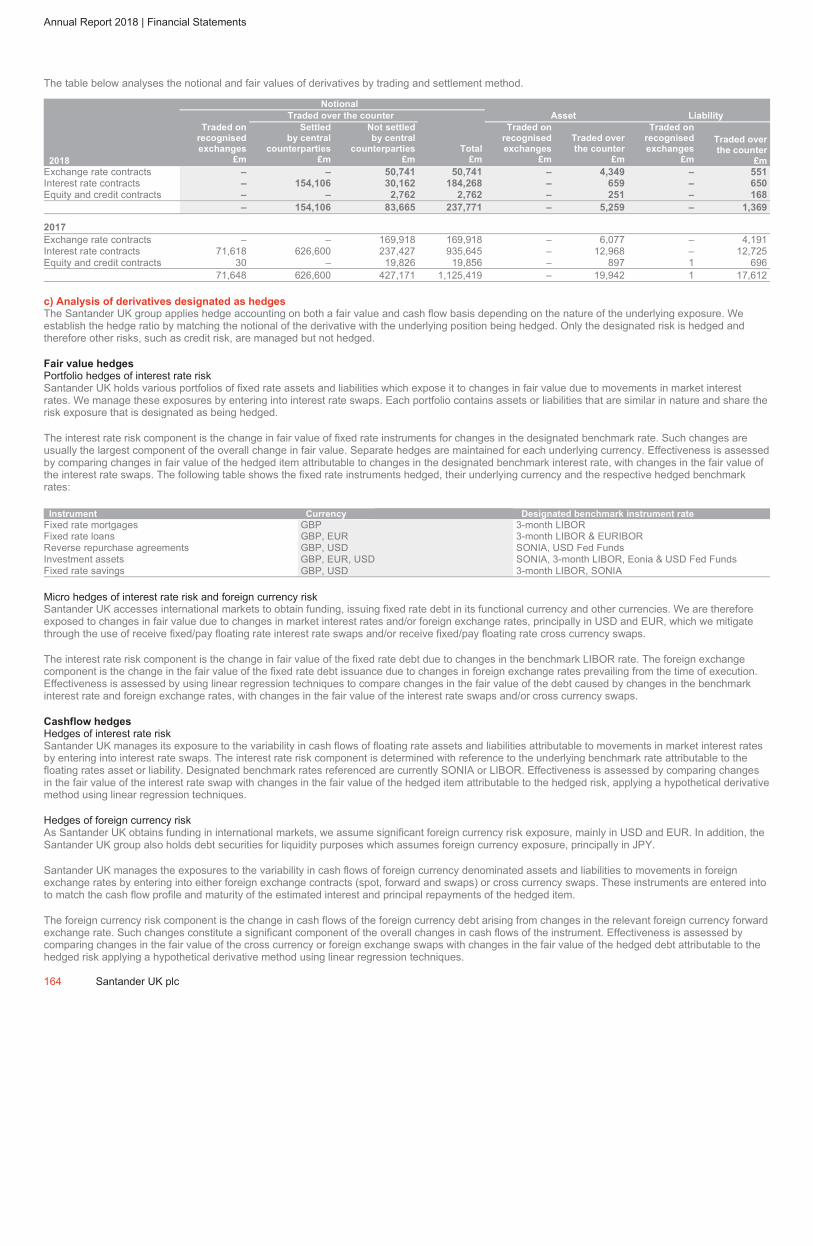
ˆ200G2Mlv!2T1be#gEŠ200G2Mlv!2T1be#gE
628340 TX 164SANTANDERFORM 20-F (SAN UK PL
03-Mar-2019 08:57 ESTHTMLON
Donnelley Financial EGV dommj0dc 6*ESS 0C
VDI-W7-PFD-037612.9.12.0
Page 1 of 1
Annual Report 2018 | Financial Statements
The table below analyses the notional and fair values of derivatives by trading and settlement method.
Notional
Traded over the counter Asset Liability
2018
Traded on
recognised
exchanges
£m
Settled
by central
counterparties
£m
Not settled
by central
counterparties
£m
Total
£m
Traded on
recognised
exchanges
£m
Traded over
the counter
£m
Traded on
recognised
exchanges
£m
Traded over
the counter
£m
Exchange rate contracts – – 50,741 50,741 – 4,349 – 551
Interest rate contracts – 154,106 30,162 184,268 – 659 – 650
Equity and credit contracts – – 2,762 2,762 – 251 – 168
– 154,106 83,665 237,771 – 5,259 – 1,369
2017
Exchange rate contracts – – 169,918 169,918 – 6,077 – 4,191
Interest rate contracts 71,618 626,600 237,427 935,645 – 12,968 – 12,725
Equity and credit contracts 30 – 19,826 19,856 – 897 1 696
71,648 626,600 427,171 1,125,419 – 19,942 1 17,612
c) Analysis of derivatives designated as hedges
The Santander UK group applies hedge accounting on both a fair value and cash flow basis depending on the nature of the underlying exposure. We
establish the hedge ratio by matching the notional of the derivative with the underlying position being hedged. Only the designated risk is hedged and
therefore other risks, such as credit risk, are managed but not hedged.
Fair value hedges
Portfolio hedges of interest rate risk
Santander UK holds various portfolios of fixed rate assets and liabilities which expose it to changes in fair value due to movements in market interest
rates. We manage these exposures by entering into interest rate swaps. Each portfolio contains assets or liabilities that are similar in nature and share the
risk exposure that is designated as being hedged.
The interest rate risk component is the change in fair value of fixed rate instruments for changes in the designated benchmark rate. Such changes are
usually the largest component of the overall change in fair value. Separate hedges are maintained for each underlying currency. Effectiveness is assessed
by comparing changes in fair value of the hedged item attributable to changes in the designated benchmark interest rate, with changes in the fair value of
the interest rate swaps. The following table shows the fixed rate instruments hedged, their underlying currency and the respective hedged benchmark
rates:
Instrument Currency Designated benchmark instrument rate
Fixed rate mortgages GBP 3-month LIBOR
Fixed rate loans GBP, EUR 3-month LIBOR & EURIBOR
Reverse repurchase agreements GBP, USD SONIA, USD Fed Funds
Investment assets GBP, EUR, USD SONIA, 3-month LIBOR, Eonia & USD Fed Funds
Fixed rate savings GBP, USD 3-month LIBOR, SONIA
Micro hedges of interest rate risk and foreign currency risk
Santander UK accesses international markets to obtain funding, issuing fixed rate debt in its functional currency and other currencies. We are therefore
exposed to changes in fair value due to changes in market interest rates and/or foreign exchange rates, principally in USD and EUR, which we mitigate
through the use of receive fixed/pay floating rate interest rate swaps and/or receive fixed/pay floating rate cross currency swaps.
The interest rate risk component is the change in fair value of the fixed rate debt due to changes in the benchmark LIBOR rate. The foreign exchange
component is the change in the fair value of the fixed rate debt issuance due to changes in foreign exchange rates prevailing from the time of execution.
Effectiveness is assessed by using linear regression techniques to compare changes in the fair value of the debt caused by changes in the benchmark
interest rate and foreign exchange rates, with changes in the fair value of the interest rate swaps and/or cross currency swaps.
Cashflow hedges
Hedges of interest rate risk
Santander UK manages its exposure to the variability in cash flows of floating rate assets and liabilities attributable to movements in market interest rates
by entering into interest rate swaps. The interest rate risk component is determined with reference to the underlying benchmark rate attributable to the
floating rates asset or liability. Designated benchmark rates referenced are currently SONIA or LIBOR. Effectiveness is assessed by comparing changes
in the fair value of the interest rate swap with changes in the fair value of the hedged item attributable to the hedged risk, applying a hypothetical derivative
method using linear regression techniques.
Hedges of foreign currency risk
As Santander UK obtains funding in international markets, we assume significant foreign currency risk exposure, mainly in USD and EUR. In addition, the
Santander UK group also holds debt securities for liquidity purposes which assumes foreign currency exposure, principally in JPY.
Santander UK manages the exposures to the variability in cash flows of foreign currency denominated assets and liabilities to movements in foreign
exchange rates by entering into either foreign exchange contracts (spot, forward and swaps) or cross currency swaps. These instruments are entered into
to match the cash flow profile and maturity of the estimated interest and principal repayments of the hedged item.
The foreign currency risk component is the change in cash flows of the foreign currency debt arising from changes in the relevant foreign currency forward
exchange rate. Such changes constitute a significant component of the overall changes in cash flows of the instrument. Effectiveness is assessed by
comparing changes in the fair value of the cross currency or foreign exchange swaps with changes in the fair value of the hedged debt attributable to the
hedged risk applying a hypothetical derivative method using linear regression techniques.
164 Santander UK plc
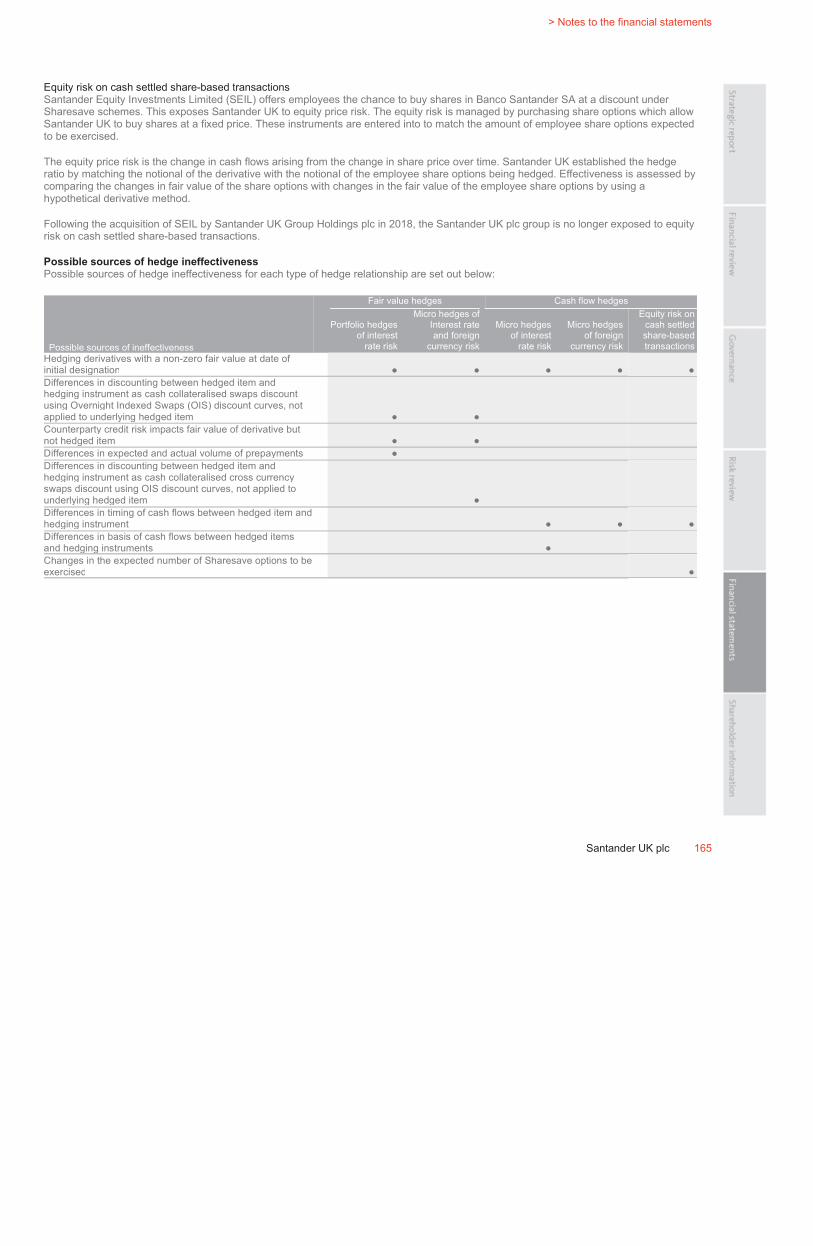
ˆ200G2Mlv!2T2J7Yg&Š200G2Mlv!2T2J7Yg&
628340 TX 165SANTANDERFORM 20-F (SAN UK PL
03-Mar-2019 09:00 ESTHTMLON
Donnelley Financial EGV dommj0dc 8*ESS 0C
VDI-W7-PFD-037612.9.12.0
bar5
Page 1 of 1
> Notes to the financial statements
Santander UK plc 165
Equity risk on cash settled share-based transactions
Santander Equity Investments Limited (SEIL) offers employees the chance to buy shares in Banco Santander SA at a discount under
Sharesave schemes. This exposes Santander UK to equity price risk. The equity risk is managed by purchasing share options which allow
Santander UK to buy shares at a fixed price. These instruments are entered into to match the amount of employee share options expected
to be exercised.
The equity price risk is the change in cash flows arising from the change in share price over time. Santander UK established the hedge
ratio by matching the notional of the derivative with the notional of the employee share options being hedged. Effectiveness is assessed by
comparing the changes in fair value of the share options with changes in the fair value of the employee share options by using a
hypothetical derivative method.
Following the acquisition of SEIL by Santander UK Group Holdings plc in 2018, the Santander UK plc group is no longer exposed to equity
risk on cash settled share-based transactions.
Possible sources of hedge ineffectiveness
Possible sources of hedge ineffectiveness for each type of hedge relationship are set out below:
Fair value hedges Cash flow hedges
Possible sources of ineffectiveness
Portfolio hedges
of interest
rate risk
Micro hedges of
Interest rate
and foreign
currency risk
Micro hedges
of interest
rate risk
Micro hedges
of foreign
currency risk
Equity risk on
cash settled
share-based
transactions
Hedging derivatives with a non-zero fair value at date of
initial designation ● ● ● ● ●Differences in discounting between hedged item and
hedging instrument as cash collateralised swaps discount
using Overnight Indexed Swaps (OIS) discount curves, not
applied to underlying hedged item ● ●Counterparty credit risk impacts fair value of derivative but
not hedged item ● ●Differences in expected and actual volume of prepayments ●Differences in discounting between hedged item and
hedging instrument as cash collateralised cross currency
swaps discount using OIS discount curves, not applied to
underlying hedged item ●Differences in timing of cash flows between hedged item and
hedging instrument ● ● ●Differences in basis of cash flows between hedged items
and hedging instruments ●Changes in the expected number of Sharesave options to be
exercised ●
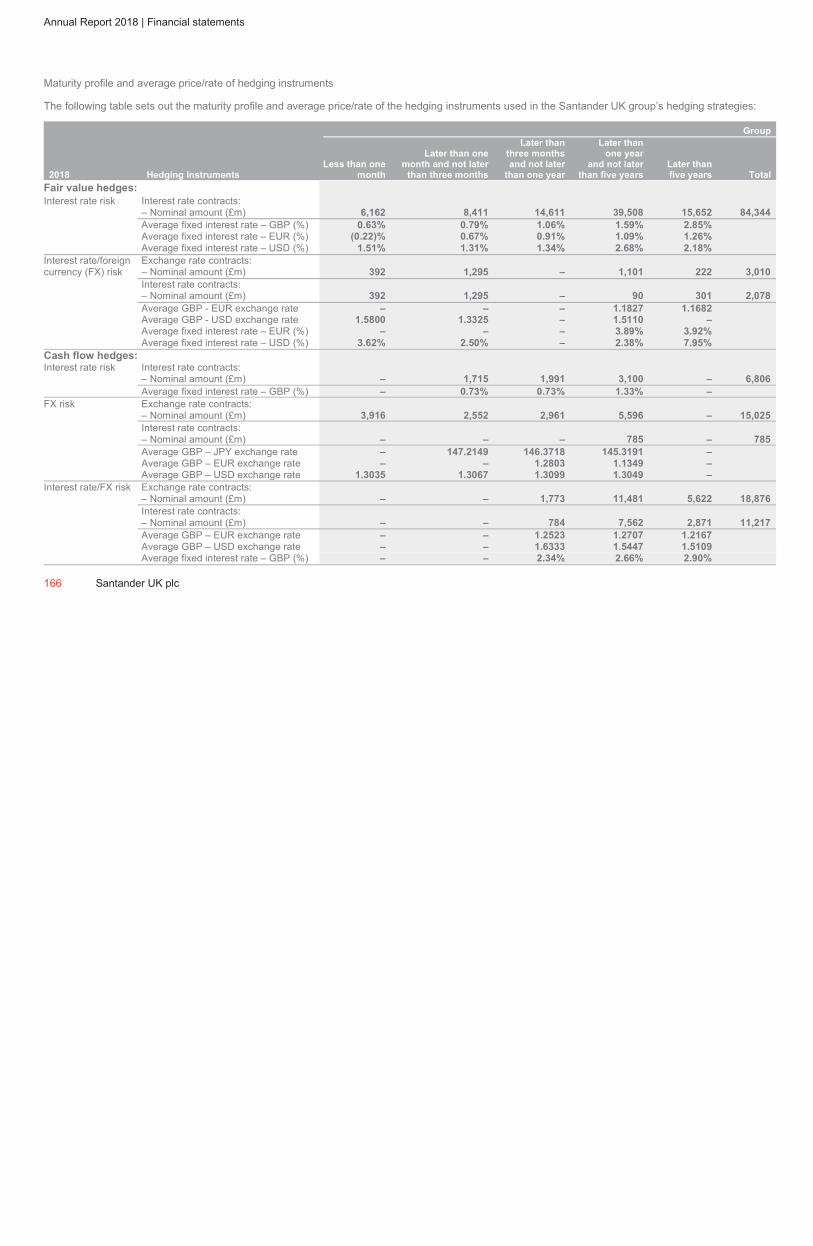
ˆ200G2Mlv!2bXskvgNŠ200G2Mlv!2bXskvgN
628340 TX 166SANTANDERFORM 20-F (SAN UK PL
04-Mar-2019 03:58 ESTHTMLON
Donnelley Financial EGV marik1dc 9*ESS 0C
VDI-W7-PFL-060212.9.12.0
Page 1 of 1
Annual Report 2018 | Financial statements
Maturity profile and average price/rate of hedging instruments
The following table sets out the maturity profile and average price/rate of the hedging instruments used in the Santander UK group’s hedging strategies:
Group
2018 Hedging Instruments
Less than one
month
Later than one
month and not later
than three months
Later than
three months
and not later
than one year
Later than
one year
and not later
than five years
Later than
five years Total
Fair value hedges:
Interest rate risk Interest rate contracts:
– Nominal amount (£m) 6,162 8,411 14,611 39,508 15,652 84,344
Average fixed interest rate – GBP (%) 0.63% 0.79% 1.06% 1.59% 2.85%
Average fixed interest rate – EUR (%) (0.22)% 0.67% 0.91% 1.09% 1.26%
Average fixed interest rate – USD (%) 1.51% 1.31% 1.34% 2.68% 2.18%
Interest rate/foreign Exchange rate contracts:
currency (FX) risk – Nominal amount (£m) 392 1,295 – 1,101 222 3,010
Interest rate contracts:
– Nominal amount (£m) 392 1,295 – 90 301 2,078
Average GBP - EUR exchange rate – – – 1.1827 1.1682
Average GBP - USD exchange rate 1.5800 1.3325 – 1.5110 –
Average fixed interest rate – EUR (%) – – – 3.89% 3.92%
Average fixed interest rate – USD (%) 3.62% 2.50% – 2.38% 7.95%
Cash flow hedges:
Interest rate risk Interest rate contracts:
– Nominal amount (£m) – 1,715 1,991 3,100 – 6,806
Average fixed interest rate – GBP (%) – 0.73% 0.73% 1.33% –
FX risk Exchange rate contracts:
– Nominal amount (£m) 3,916 2,552 2,961 5,596 – 15,025
Interest rate contracts:
– Nominal amount (£m) – – – 785 – 785
Average GBP – JPY exchange rate – 147.2149 146.3718 145.3191 –
Average GBP – EUR exchange rate – – 1.2803 1.1349 –
Average GBP – USD exchange rate 1.3035 1.3067 1.3099 1.3049 –
Interest rate/FX risk Exchange rate contracts:
– Nominal amount (£m) – – 1,773 11,481 5,622 18,876
Interest rate contracts:
– Nominal amount (£m) – – 784 7,562 2,871 11,217
Average GBP – EUR exchange rate – – 1.2523 1.2707 1.2167
Average GBP – USD exchange rate – – 1.6333 1.5447 1.5109
Average fixed interest rate – GBP (%) – – 2.34% 2.66% 2.90%
166 Santander UK plc

ˆ200G2Mlv!2Shlbeg-Š200G2Mlv!2Shlbeg-
628340 TX 167SANTANDERFORM 20-F (SAN UK PL
03-Mar-2019 07:55 ESTHTMLON
Donnelley Financial EGV dommj0dc 2*ESS 0C
VDI-W7-PFD-037612.9.12.0
bar5
Page 1 of 1
> Notes to the financial statements
Santander UK plc 167
This page left intentionally blank
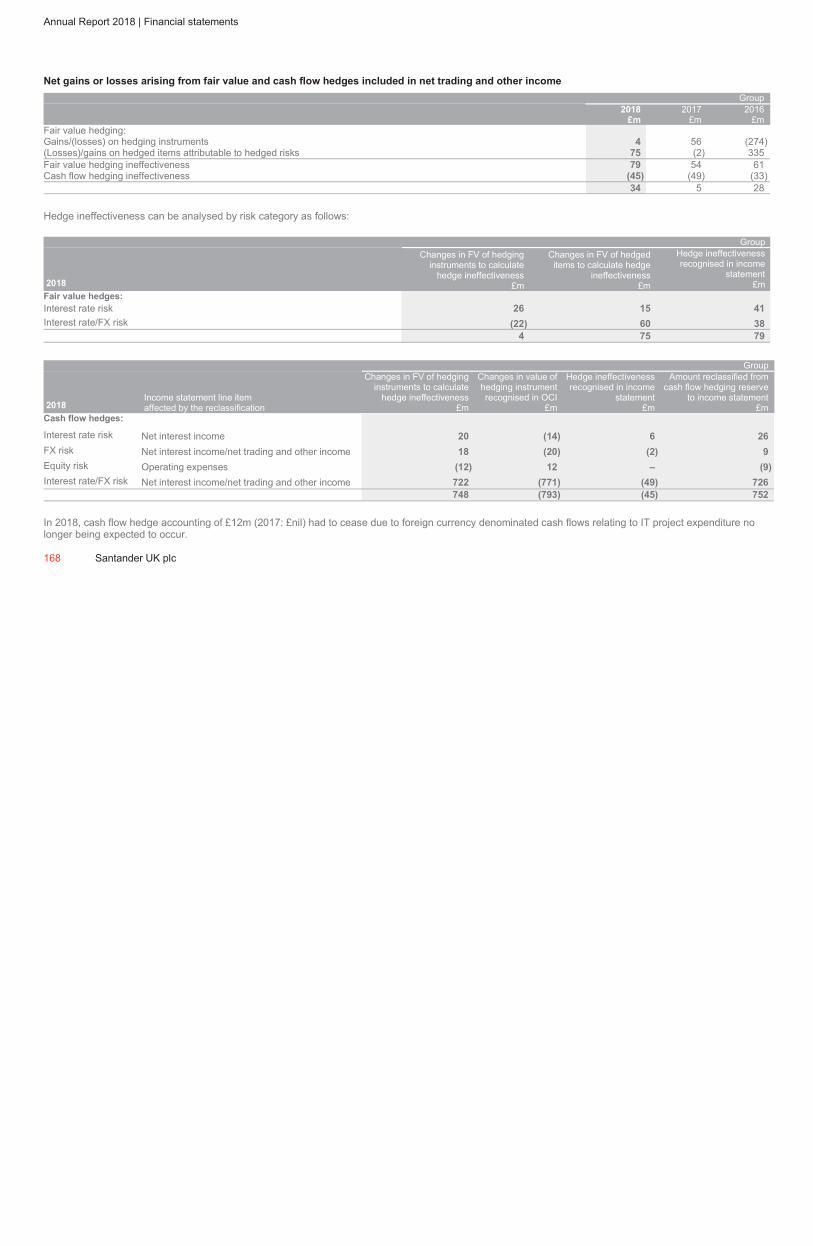
ˆ200G2Mlv!2XRQtX6aŠ200G2Mlv!2XRQtX6a
628340 TX 168SANTANDERFORM 20-F (SAN UK PL
03-Mar-2019 22:06 ESTHTMLON
Donnelley Financial EGV annas1dc 12*ESS 0C
VDI-W7-PFL-123312.9.12.0
Page 1 of 1
Annual Report 2018 | Financial statements
Net gains or losses arising from fair value and cash flow hedges included in net trading and other income
Group
2018
£m
2017
£m
2016
£m
Fair value hedging:
Gains/(losses) on hedging instruments 4 56 (274)
(Losses)/gains on hedged items attributable to hedged risks 75 (2) 335
Fair value hedging ineffectiveness 79 54 61
Cash flow hedging ineffectiveness (45) (49) (33)
34 5 28
Hedge ineffectiveness can be analysed by risk category as follows:
Group
2018
Changes in FV of hedging
instruments to calculate
hedge ineffectiveness
£m
Changes in FV of hedged
items to calculate hedge
ineffectiveness
£m
Hedge ineffectiveness
recognised in income
statement
£m
Fair value hedges:
Interest rate risk 26 15 41
Interest rate/FX risk (22) 60 38
4 75 79
Group
2018
Income statement line item
affected by the reclassification
Changes in FV of hedging
instruments to calculate
hedge ineffectiveness
£m
Changes in value of
hedging instrument
recognised in OCI
£m
Hedge ineffectiveness
recognised in income
statement
£m
Amount reclassified from
cash flow hedging reserve
to income statement
£m
Cash flow hedges:
Interest rate risk Net interest income 20 (14) 6 26
FX risk Net interest income/net trading and other income 18 (20) (2) 9
Equity risk Operating expenses (12) 12 – (9)
Interest rate/FX risk Net interest income/net trading and other income 722 (771) (49) 726
748 (793) (45) 752
In 2018, cash flow hedge accounting of £12m (2017: £nil) had to cease due to foreign currency denominated cash flows relating to IT project expenditure no
longer being expected to occur.
168 Santander UK plc
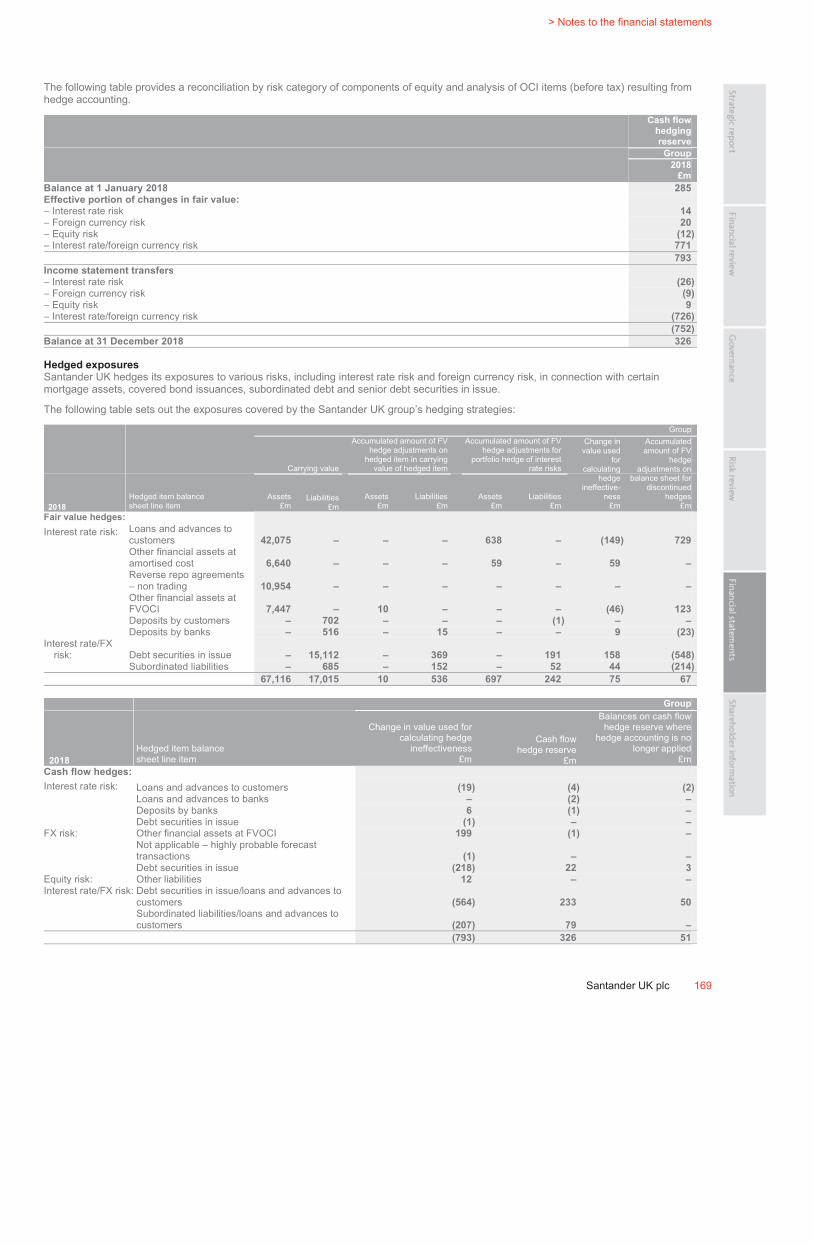
ˆ200G2Mlv!2XSta3gsŠ200G2Mlv!2XSta3gs
628340 TX 169SANTANDERFORM 20-F (SAN UK PL
03-Mar-2019 22:09 ESTHTMLON
Donnelley Financial EGV annas1dc 15*ESS 0C
VDI-W7-PFL-123312.9.12.0
bar5
Page 1 of 1
> Notes to the financial statements
Santander UK plc 169
The following table provides a reconciliation by risk category of components of equity and analysis of OCI items (before tax) resulting from
hedge accounting.
Cash flow
hedging
reserve
Group
2018
£m
Balance at 1 January 2018 285
Effective portion of changes in fair value:
– Interest rate risk 14
– Foreign currency risk 20
– Equity risk (12)
– Interest rate/foreign currency risk 771
793
Income statement transfers
– Interest rate risk (26)
– Foreign currency risk (9)
– Equity risk 9
– Interest rate/foreign currency risk (726)
(752)
Balance at 31 December 2018 326
Hedged exposures
Santander UK hedges its exposures to various risks, including interest rate risk and foreign currency risk, in connection with certain
mortgage assets, covered bond issuances, subordinated debt and senior debt securities in issue.
The following table sets out the exposures covered by the Santander UK group’s hedging strategies:
Group
Carrying value
Accumulated amount of FV
hedge adjustments on
hedged item in carrying
value of hedged item
Accumulated amount of FV
hedge adjustments for
portfolio hedge of interest
rate risks
Change in
value used
for
calculating
Accumulated
amount of FV
hedge
adjustments on
2018
Hedged item balance
sheet line item
Assets
£m
Liabilities
£m
Assets
£m
Liabilities
£m
Assets
£m
Liabilities
£m
hedge
ineffective-
ness
£m
balance sheet for
discontinued
hedges
£m
Fair value hedges:
Interest rate risk:Loans and advances to
customers 42,075 – – – 638 – (149) 729
Other financial assets at
amortised cost 6,640 – – – 59 – 59 –
Reverse repo agreements
– non trading 10,954 – – – – – – –
Other financial assets at
FVOCI 7,447 – 10 – – – (46) 123
Deposits by customers – 702 – – – (1) – –
Deposits by banks – 516 – 15 – – 9 (23)
Interest rate/FX
risk: Debt securities in issue – 15,112 – 369 – 191 158 (548)
Subordinated liabilities – 685 – 152 – 52 44 (214)
67,116 17,015 10 536 697 242 75 67
Group
2018
Hedged item balance
sheet line item
Change in value used for
calculating hedge
ineffectiveness
£m
Cash flow
hedge reserve
£m
Balances on cash flow
hedge reserve where
hedge accounting is no
longer applied
£m
Cash flow hedges:
Interest rate risk: Loans and advances to customers (19) (4) (2)
Loans and advances to banks – (2) –
Deposits by banks 6 (1) –
Debt securities in issue (1) – –
FX risk: Other financial assets at FVOCI 199 (1) –
Not applicable – highly probable forecast
transactions (1) – –
Debt securities in issue (218) 22 3
Equity risk: Other liabilities 12 – –
Interest rate/FX risk: Debt securities in issue/loans and advances to
customers (564) 233 50
Subordinated liabilities/loans and advances to
customers (207) 79 –
(793) 326 51
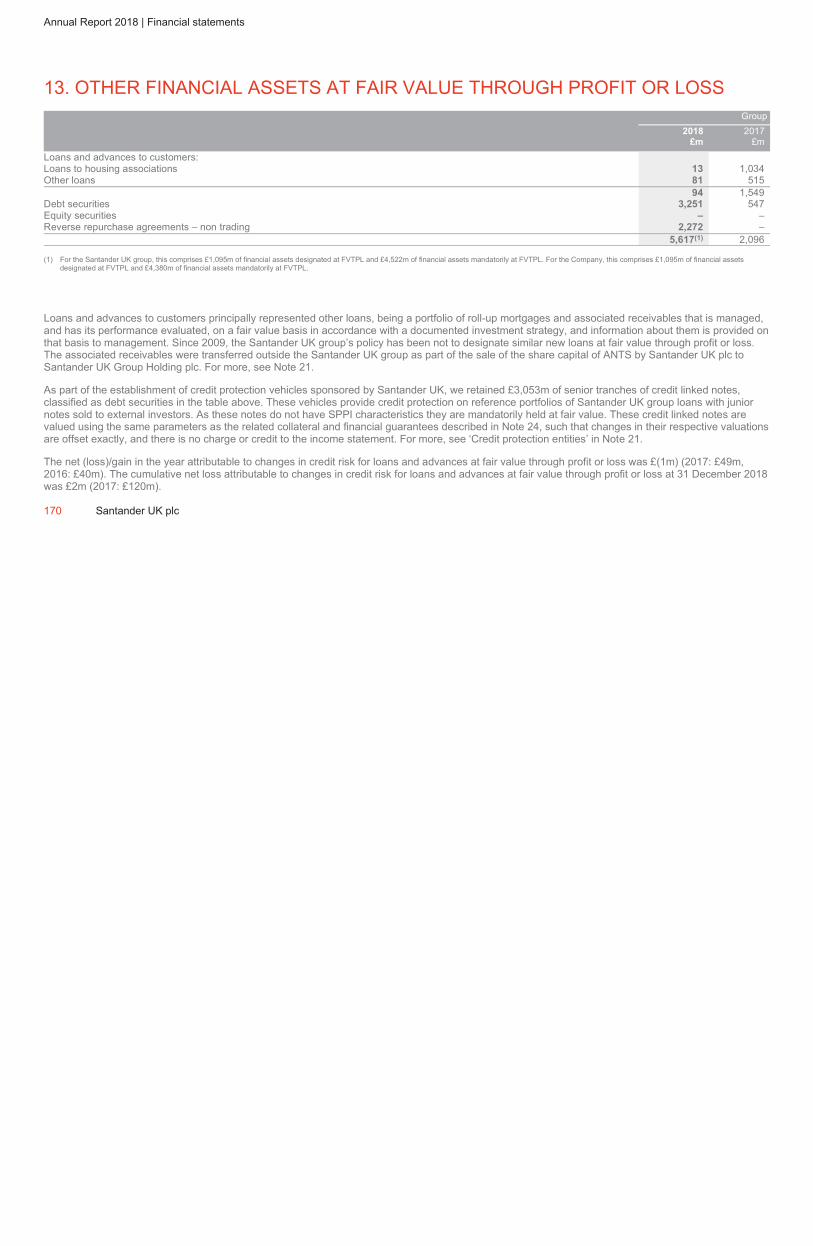
ˆ200G2Mlv!2SXFe!gÈŠ200G2Mlv!2SXFe!g¨
628340 TX 170SANTANDERFORM 20-F (SAN UK PL
03-Mar-2019 07:19 ESTHTMLON
Donnelley Financial EGV bashs0dc 5*ESS 0C
VDI-W7-PFL-112012.9.12.0
Page 1 of 1
Annual Report 2018 | Financial statements
13. OTHER FINANCIAL ASSETS AT FAIR VALUE THROUGH PROFIT OR LOSS
Group
2018
£m
2017
£m
Loans and advances to customers:
Loans to housing associations 13 1,034
Other loans 81 515
94 1,549
Debt securities 3,251 547
Equity securities – –
Reverse repurchase agreements – non trading 2,272 –
5,617(1) 2,096
(1) For the Santander UK group, this comprises £1,095m of financial assets designated at FVTPL and £4,522m of financial assets mandatorily at FVTPL. For the Company, this comprises £1,095m of financial assets
designated at FVTPL and £4,380m of financial assets mandatorily at FVTPL.
Loans and advances to customers principally represented other loans, being a portfolio of roll-up mortgages and associated receivables that is managed,
and has its performance evaluated, on a fair value basis in accordance with a documented investment strategy, and information about them is provided on
that basis to management. Since 2009, the Santander UK group’s policy has been not to designate similar new loans at fair value through profit or loss.
The associated receivables were transferred outside the Santander UK group as part of the sale of the share capital of ANTS by Santander UK plc to
Santander UK Group Holding plc. For more, see Note 21.
As part of the establishment of credit protection vehicles sponsored by Santander UK, we retained £3,053m of senior tranches of credit linked notes,
classified as debt securities in the table above. These vehicles provide credit protection on reference portfolios of Santander UK group loans with junior
notes sold to external investors. As these notes do not have SPPI characteristics they are mandatorily held at fair value. These credit linked notes are
valued using the same parameters as the related collateral and financial guarantees described in Note 24, such that changes in their respective valuations
are offset exactly, and there is no charge or credit to the income statement. For more, see ‘Credit protection entities’ in Note 21.
The net (loss)/gain in the year attributable to changes in credit risk for loans and advances at fair value through profit or loss was £(1m) (2017: £49m,
2016: £40m). The cumulative net loss attributable to changes in credit risk for loans and advances at fair value through profit or loss at 31 December 2018
was £2m (2017: £120m).
170 Santander UK plc

ˆ200G2Mlv!2X&zCZgÊ200G2Mlv!2X&zCZgˆ
628340 TX 171SANTANDERFORM 20-F (SAN UK PL
03-Mar-2019 23:04 ESTHTMLON
Donnelley Financial EGV marik1dc 5*ESS 0C
VDI-W7-PFL-060212.9.12.0
bar5
Page 1 of 1
> Notes to the financial statements
Santander UK plc 171
14. LOANS AND ADVANCES TO CUSTOMERS
Group
2018
£m
2017
£m
Loans secured on residential properties 157,957 155,355
Corporate loans 27,763 30,856
Finance leases 6,821 6,710
Secured advances – –
Other unsecured loans 7,554 6,230
Amounts due from fellow Banco Santander subsidiaries and joint ventures 1,997 1,199
Amounts due from Santander UK Group Holdings plc 17 8
Loans and advances to customers 202,109 200,358
Credit impairment loss allowances on loans and advances to customers (751) (940)
RV and voluntary termination provisions on finance leases (69) (78)
Net loans and advances to customers 201,289 199,340
Movement in credit impairment loss allowances:
Group
Loans secured
on residential
properties
£m
Corporate
loans
£m
Finance
leases
£m
Other
unsecured
loans
£m
Total
£m
At 31 December 2017 225 490 46 179 940
Adoption of IFRS 9 (see Note 1)(1) 47 99 11 54 211
Re-allocation of ECL on off-balance sheet exposures(1) (3) (25) – (22) (50)
At 1 January 2018 269 564 57 211 1,101
(Release)/charge to the income statement (see Note 8) (18) 17 51 139 189
Write-offs and other items(2)(3)(17) (355) (23) (144) (539)
At 31 December 2018 234 226 85 206 751
Recoveries, net of collection costs (see Note 8) 2 1 6 33 42
At 1 January 2017 279 382 45 215 921
(Release)/charge to the income statement (see Note 8) (37) 172 20 102 257
Write-offs and other items(2) (17) (64) (19) (138) (238)
At 31 December 2017 225 490 46 179 940
Of which:
– Observed 105 433 12 59 609
– Incurred but not yet observed 120 57 34 120 331
225 490 46 179 940
Recoveries, net of collection costs (see Note 8) 3 1 6 44 54
At 1 January 2016 424 395 20 269 1,108
(Release)/charge to the income statement (see Note 8) (116) 59 47 142 132
Write-offs and other items(2)
(29) (72) (22) (196) (319)
At 31 December 2016 279 382 45 215 921
Of which:
– Observed 130 287 13 73 503
– Incurred but not yet observed 149 95 32 142 418
279 382 45 215 921
Recoveries, net of collection costs (see Note 8) 4 3 2 56 65
(1) The adjustment for the adoption of IFRS 9 related to the re-measurement of loss allowances on loans and advances to customers at amortised cost. The re-allocation of ECL on off-balance sheet
exposures was a transfer to provisions following the adoption of a methodology to enable their separate identification from ECL on drawn exposures. See Note 30.
(2) Mortgage write-offs exclude the effect of the unwind over time of the discounting in estimating losses, as described in the accounting policy ‘Financial instruments’ in Note 1. Mortgage write-offs
including this effect were £18m (2017: £22m, 2016: £33m)
(3) The contractual amount outstanding on financial assets that were written off in the year, and are still subject to enforcement activity was £76m.

ˆ200G2Mlv!2Vk5mw6EŠ200G2Mlv!2Vk5mw6E
628340 TX 172SANTANDERFORM 20-F (SAN UK PL
03-Mar-2019 16:23 ESTHTMLON
Donnelley Financial EGV kumak0dc 4*ESS 0C
VDI-W7-PFL-105912.9.12.0
Page 1 of 1
Annual Report 2018 | Financial statements
Finance lease and hire purchase contract receivables may be analysed as follows:
Group
2018 2017
Gross
investment
£m
Unearned
finance income
£m
Net
investment
£m
Gross
investment
£m
Unearned
finance income
£m
Net
investment
£m
Not later than one year 3,730 (210) 3,520 3,633 (177) 3,456
Later than one year and not later than five years 3,415 (278) 3,137 3,316 (226) 3,090
Later than five years 210 (46) 164 214 (50) 164
7,355 (534) 6,821 7,163 (453) 6,710
At 31 December 2018 and 2017, the Company had no finance lease and hire purchase contract receivables. The Santander UK group enters into finance
leasing arrangements primarily for the financing of motor vehicles and a range of assets for its corporate customers. Included in the carrying value of net
investment in finance leases and hire purchase contracts is £1,034m (2017: £886m) of unguaranteed RV at the end of the current lease terms, which is
expected to be recovered through repayment, re-financing or sale. Contingent rent income of £nil (2017: £5m, 2016: £4m) was earned during the year,
which was classified in ‘Interest and similar income’.
Finance lease receivable balances are secured over the asset leased. The Santander UK group is not permitted to sell or repledge the asset in the
absence of default by the lessee. The Directors consider that the carrying amount of the finance lease receivables approximates to their fair value.
Included within loans and advances to customers are advances assigned to bankruptcy remote structured entities and Abbey Covered Bonds LLP. These
loans provide security to issues of covered bonds and mortgage-backed or other asset-backed securities issued by the Santander UK group. For more,
see Note 15.
172 Santander UK plc
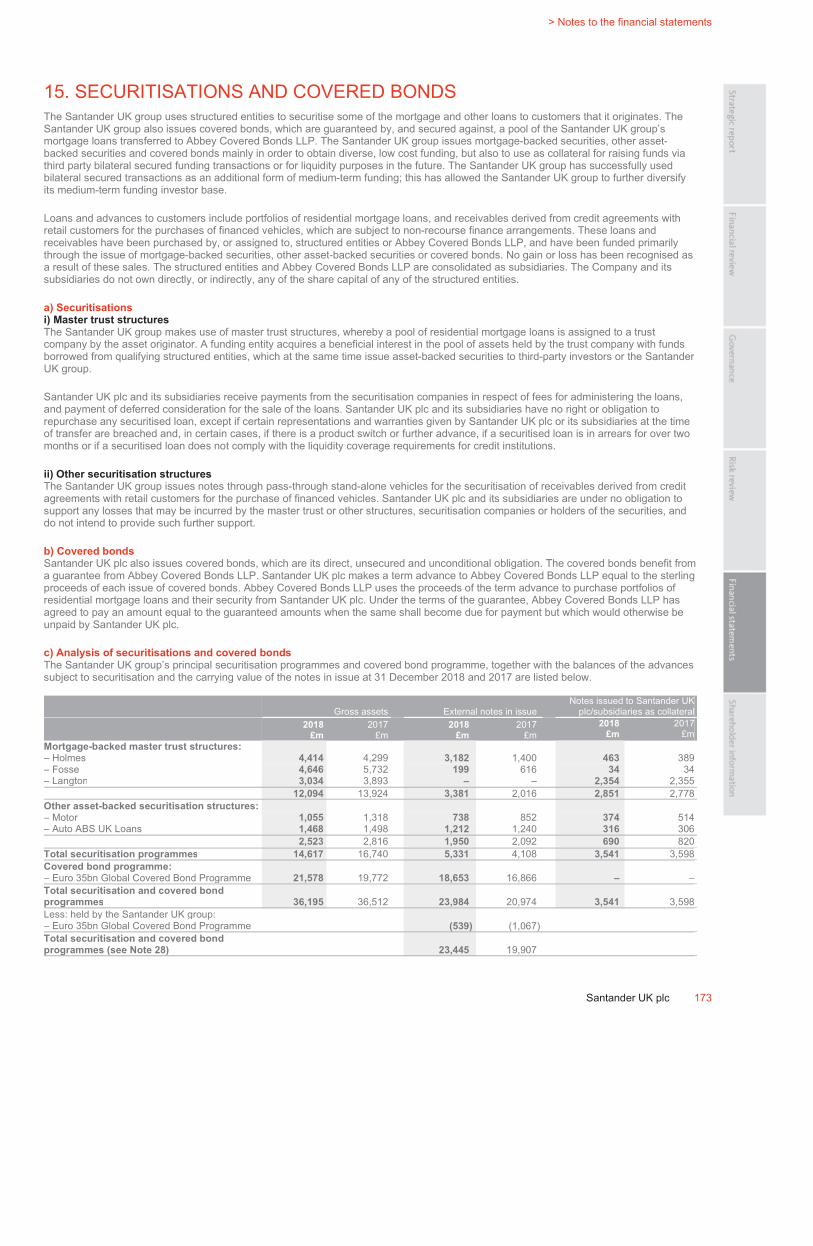
ˆ200G2Mlv!2Y51HegwŠ200G2Mlv!2Y51Hegw
628340 TX 173SANTANDERFORM 20-F (SAN UK PL
03-Mar-2019 23:14 ESTHTMLON
Donnelley Financial EGV marik1dc 5*ESS 0C
VDI-W7-PFL-060212.9.12.0
bar5
Page 1 of 1
> Notes to the financial statements
Santander UK plc 173
15. SECURITISATIONS AND COVERED BONDS
The Santander UK group uses structured entities to securitise some of the mortgage and other loans to customers that it originates. The
Santander UK group also issues covered bonds, which are guaranteed by, and secured against, a pool of the Santander UK group’s
mortgage loans transferred to Abbey Covered Bonds LLP. The Santander UK group issues mortgage-backed securities, other asset-
backed securities and covered bonds mainly in order to obtain diverse, low cost funding, but also to use as collateral for raising funds via
third party bilateral secured funding transactions or for liquidity purposes in the future. The Santander UK group has successfully used
bilateral secured transactions as an additional form of medium-term funding; this has allowed the Santander UK group to further diversify
its medium-term funding investor base.
Loans and advances to customers include portfolios of residential mortgage loans, and receivables derived from credit agreements with
retail customers for the purchases of financed vehicles, which are subject to non-recourse finance arrangements. These loans and
receivables have been purchased by, or assigned to, structured entities or Abbey Covered Bonds LLP, and have been funded primarily
through the issue of mortgage-backed securities, other asset-backed securities or covered bonds. No gain or loss has been recognised as
a result of these sales. The structured entities and Abbey Covered Bonds LLP are consolidated as subsidiaries. The Company and its
subsidiaries do not own directly, or indirectly, any of the share capital of any of the structured entities.
a) Securitisations
i) Master trust structures
The Santander UK group makes use of master trust structures, whereby a pool of residential mortgage loans is assigned to a trust
company by the asset originator. A funding entity acquires a beneficial interest in the pool of assets held by the trust company with funds
borrowed from qualifying structured entities, which at the same time issue asset-backed securities to third-party investors or the Santander
UK group.
Santander UK plc and its subsidiaries receive payments from the securitisation companies in respect of fees for administering the loans,
and payment of deferred consideration for the sale of the loans. Santander UK plc and its subsidiaries have no right or obligation to
repurchase any securitised loan, except if certain representations and warranties given by Santander UK plc or its subsidiaries at the time
of transfer are breached and, in certain cases, if there is a product switch or further advance, if a securitised loan is in arrears for over two
months or if a securitised loan does not comply with the liquidity coverage requirements for credit institutions.
ii) Other securitisation structures
The Santander UK group issues notes through pass-through stand-alone vehicles for the securitisation of receivables derived from credit
agreements with retail customers for the purchase of financed vehicles. Santander UK plc and its subsidiaries are under no obligation to
support any losses that may be incurred by the master trust or other structures, securitisation companies or holders of the securities, and
do not intend to provide such further support.
b) Covered bonds
Santander UK plc also issues covered bonds, which are its direct, unsecured and unconditional obligation. The covered bonds benefit from
a guarantee from Abbey Covered Bonds LLP. Santander UK plc makes a term advance to Abbey Covered Bonds LLP equal to the sterling
proceeds of each issue of covered bonds. Abbey Covered Bonds LLP uses the proceeds of the term advance to purchase portfolios of
residential mortgage loans and their security from Santander UK plc. Under the terms of the guarantee, Abbey Covered Bonds LLP has
agreed to pay an amount equal to the guaranteed amounts when the same shall become due for payment but which would otherwise be
unpaid by Santander UK plc.
c) Analysis of securitisations and covered bonds
The Santander UK group’s principal securitisation programmes and covered bond programme, together with the balances of the advances
subject to securitisation and the carrying value of the notes in issue at 31 December 2018 and 2017 are listed below.
Gross assets External notes in issue
Notes issued to Santander UK
plc/subsidiaries as collateral
2018
£m
2017
£m
2018
£m
2017
£m
2018
£m
2017
£m
Mortgage-backed master trust structures:
– Holmes 4,414 4,299 3,182 1,400 463 389
– Fosse 4,646 5,732 199 616 34 34
– Langton 3,034 3,893 – – 2,354 2,355
12,094 13,924 3,381 2,016 2,851 2,778
Other asset-backed securitisation structures:
– Motor 1,055 1,318 738 852 374 514
– Auto ABS UK Loans 1,468 1,498 1,212 1,240 316 306
2,523 2,816 1,950 2,092 690 820
Total securitisation programmes 14,617 16,740 5,331 4,108 3,541 3,598
Covered bond programme:
– Euro 35bn Global Covered Bond Programme 21,578 19,772 18,653 16,866 – –
Total securitisation and covered bond
programmes 36,195 36,512 23,984 20,974 3,541 3,598
Less: held by the Santander UK group:
– Euro 35bn Global Covered Bond Programme (539) (1,067)
Total securitisation and covered bond
programmes (see Note 28) 23,445 19,907
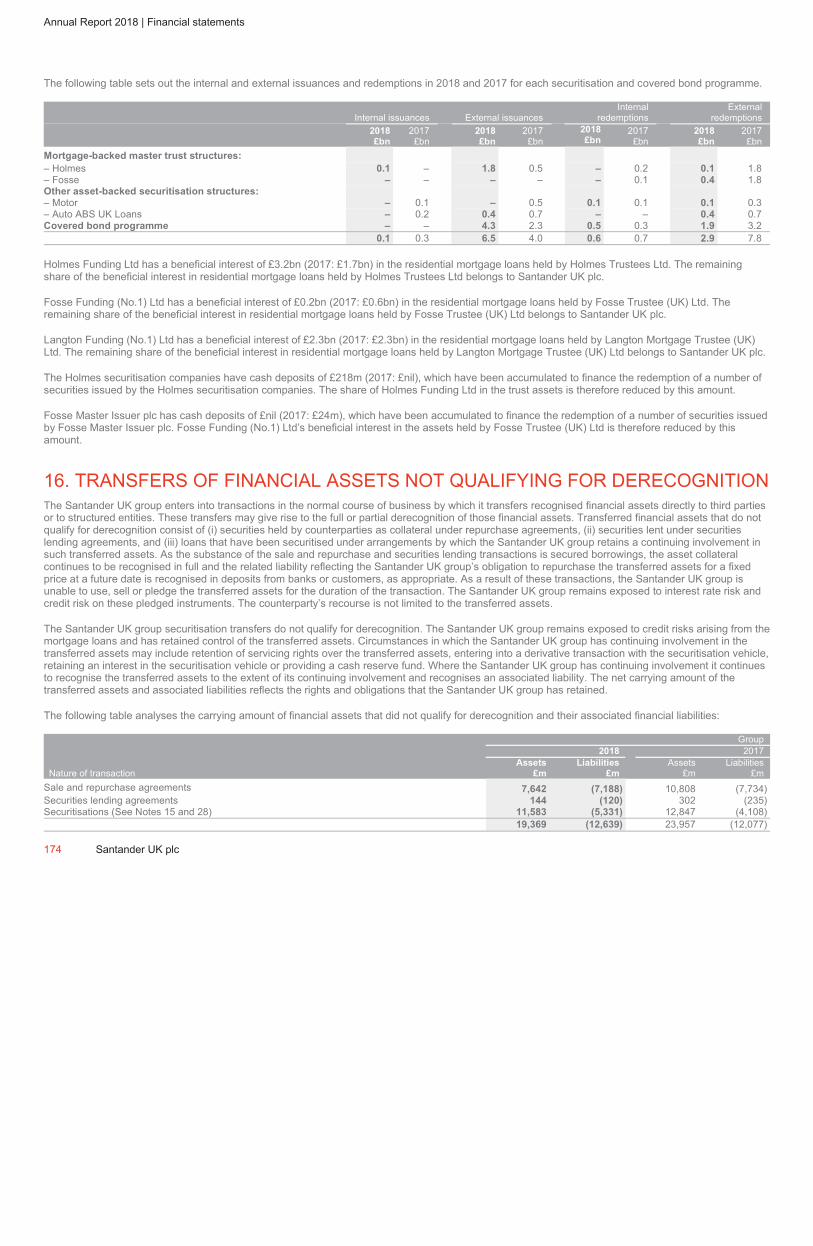
ˆ200G2Mlv!2TVwXM6&Š200G2Mlv!2TVwXM6&
628340 TX 174SANTANDERFORM 20-F (SAN UK PL
03-Mar-2019 10:18 ESTHTMLON
Donnelley Financial EGV dommj0dc 5*ESS 0C
VDI-W7-PFD-037612.9.12.0
Page 1 of 1
Annual Report 2018 | Financial statements
The following table sets out the internal and external issuances and redemptions in 2018 and 2017 for each securitisation and covered bond programme.
Internal issuances External issuances
Internal
redemptions
External
redemptions
2018
£bn
2017
£bn
2018
£bn
2017
£bn
2018
£bn
2017
£bn
2018
£bn
2017
£bn
Mortgage-backed master trust structures:
– Holmes 0.1 – 1.8 0.5 – 0.2 0.1 1.8
– Fosse – – – – – 0.1 0.4 1.8
Other asset-backed securitisation structures:
– Motor – 0.1 – 0.5 0.1 0.1 0.1 0.3
– Auto ABS UK Loans – 0.2 0.4 0.7 – – 0.4 0.7
Covered bond programme – – 4.3 2.3 0.5 0.3 1.9 3.2
0.1 0.3 6.5 4.0 0.6 0.7 2.9 7.8
Holmes Funding Ltd has a beneficial interest of £3.2bn (2017: £1.7bn) in the residential mortgage loans held by Holmes Trustees Ltd. The remaining
share of the beneficial interest in residential mortgage loans held by Holmes Trustees Ltd belongs to Santander UK plc.
Fosse Funding (No.1) Ltd has a beneficial interest of £0.2bn (2017: £0.6bn) in the residential mortgage loans held by Fosse Trustee (UK) Ltd. The
remaining share of the beneficial interest in residential mortgage loans held by Fosse Trustee (UK) Ltd belongs to Santander UK plc.
Langton Funding (No.1) Ltd has a beneficial interest of £2.3bn (2017: £2.3bn) in the residential mortgage loans held by Langton Mortgage Trustee (UK)
Ltd. The remaining share of the beneficial interest in residential mortgage loans held by Langton Mortgage Trustee (UK) Ltd belongs to Santander UK plc.
The Holmes securitisation companies have cash deposits of £218m (2017: £nil), which have been accumulated to finance the redemption of a number of
securities issued by the Holmes securitisation companies. The share of Holmes Funding Ltd in the trust assets is therefore reduced by this amount.
Fosse Master Issuer plc has cash deposits of £nil (2017: £24m), which have been accumulated to finance the redemption of a number of securities issued
by Fosse Master Issuer plc. Fosse Funding (No.1) Ltd’s beneficial interest in the assets held by Fosse Trustee (UK) Ltd is therefore reduced by this
amount.
16. TRANSFERS OF FINANCIAL ASSETS NOT QUALIFYING FOR DERECOGNITION
The Santander UK group enters into transactions in the normal course of business by which it transfers recognised financial assets directly to third parties
or to structured entities. These transfers may give rise to the full or partial derecognition of those financial assets. Transferred financial assets that do not
qualify for derecognition consist of (i) securities held by counterparties as collateral under repurchase agreements, (ii) securities lent under securities
lending agreements, and (iii) loans that have been securitised under arrangements by which the Santander UK group retains a continuing involvement in
such transferred assets. As the substance of the sale and repurchase and securities lending transactions is secured borrowings, the asset collateral
continues to be recognised in full and the related liability reflecting the Santander UK group’s obligation to repurchase the transferred assets for a fixed
price at a future date is recognised in deposits from banks or customers, as appropriate. As a result of these transactions, the Santander UK group is
unable to use, sell or pledge the transferred assets for the duration of the transaction. The Santander UK group remains exposed to interest rate risk and
credit risk on these pledged instruments. The counterparty’s recourse is not limited to the transferred assets.
The Santander UK group securitisation transfers do not qualify for derecognition. The Santander UK group remains exposed to credit risks arising from the
mortgage loans and has retained control of the transferred assets. Circumstances in which the Santander UK group has continuing involvement in the
transferred assets may include retention of servicing rights over the transferred assets, entering into a derivative transaction with the securitisation vehicle,
retaining an interest in the securitisation vehicle or providing a cash reserve fund. Where the Santander UK group has continuing involvement it continues
to recognise the transferred assets to the extent of its continuing involvement and recognises an associated liability. The net carrying amount of the
transferred assets and associated liabilities reflects the rights and obligations that the Santander UK group has retained.
The following table analyses the carrying amount of financial assets that did not qualify for derecognition and their associated financial liabilities:
Group
2018 2017
Assets Liabilities Assets Liabilities
Nature of transaction £m £m £m £m
Sale and repurchase agreements 7,642 (7,188) 10,808 (7,734)
Securities lending agreements 144 (120) 302 (235)
Securitisations (See Notes 15 and 28) 11,583 (5,331) 12,847 (4,108)
19,369 (12,639) 23,957 (12,077)
174 Santander UK plc
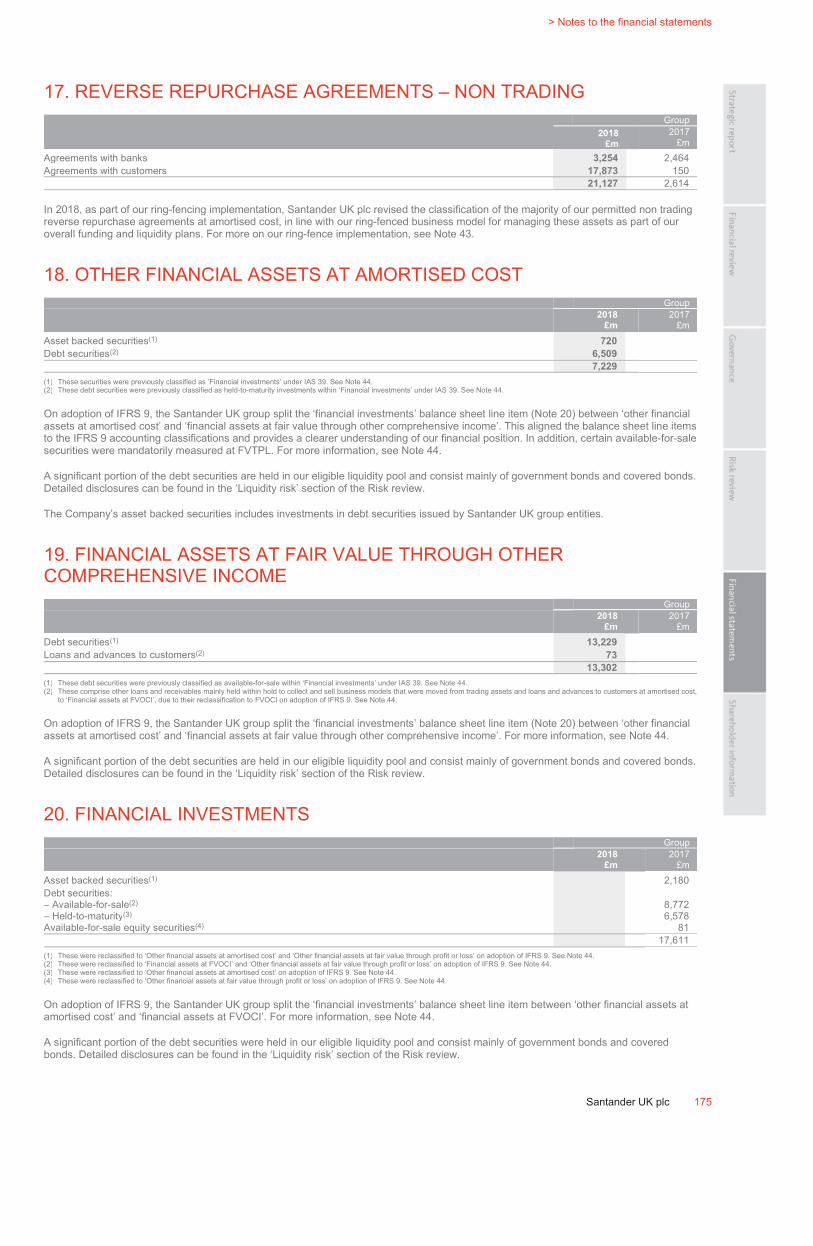
ˆ200G2Mlv!2Y3vPC6wŠ200G2Mlv!2Y3vPC6w
628340 TX 175SANTANDERFORM 20-F (SAN UK PL
03-Mar-2019 23:12 ESTHTMLON
Donnelley Financial EGV marik1dc 5*ESS 0C
VDI-W7-PFL-060212.9.12.0
bar5
Page 1 of 1
> Notes to the financial statements
Santander UK plc 175
17. REVERSE REPURCHASE AGREEMENTS – NON TRADING
Group
2018
£m
2017
£m
Agreements with banks 3,254 2,464
Agreements with customers 17,873 150
21,127 2,614
In 2018, as part of our ring-fencing implementation, Santander UK plc revised the classification of the majority of our permitted non trading
reverse repurchase agreements at amortised cost, in line with our ring-fenced business model for managing these assets as part of our
overall funding and liquidity plans. For more on our ring-fence implementation, see Note 43.
18. OTHER FINANCIAL ASSETS AT AMORTISED COST
Group
2018
£m
2017
£m
Asset backed securities(1)
720
Debt securities(2) 6,509
7,229
(1) These securities were previously classified as ‘Financial investments’ under IAS 39. See Note 44.
(2) These debt securities were previously classified as held-to-maturity investments within ‘Financial investments’ under IAS 39. See Note 44.
On adoption of IFRS 9, the Santander UK group split the ‘financial investments’ balance sheet line item (Note 20) between ‘other financial
assets at amortised cost’ and ‘financial assets at fair value through other comprehensive income’. This aligned the balance sheet line items
to the IFRS 9 accounting classifications and provides a clearer understanding of our financial position. In addition, certain available-for-sale
securities were mandatorily measured at FVTPL. For more information, see Note 44.
A significant portion of the debt securities are held in our eligible liquidity pool and consist mainly of government bonds and covered bonds.
Detailed disclosures can be found in the ‘Liquidity risk’ section of the Risk review.
The Company’s asset backed securities includes investments in debt securities issued by Santander UK group entities.
19. FINANCIAL ASSETS AT FAIR VALUE THROUGH OTHER
COMPREHENSIVE INCOME
Group
2018
£m
2017
£m
Debt securities(1) 13,229
Loans and advances to customers(2) 73
13,302
(1) These debt securities were previously classified as available-for-sale within ‘Financial investments’ under IAS 39. See Note 44.
(2) These comprise other loans and receivables mainly held within hold to collect and sell business models that were moved from trading assets and loans and advances to customers at amortised cost,
to ‘Financial assets at FVOCI’, due to their reclassification to FVOCI on adoption of IFRS 9. See Note 44.
On adoption of IFRS 9, the Santander UK group split the ‘financial investments’ balance sheet line item (Note 20) between ‘other financial
assets at amortised cost’ and ‘financial assets at fair value through other comprehensive income’. For more information, see Note 44.
A significant portion of the debt securities are held in our eligible liquidity pool and consist mainly of government bonds and covered bonds.
Detailed disclosures can be found in the ‘Liquidity risk’ section of the Risk review.
20. FINANCIAL INVESTMENTS
Group
2018
£m
2017
£m
Asset backed securities(1) 2,180
Debt securities:
– Available-for-sale(2) 8,772
– Held-to-maturity(3) 6,578
Available-for-sale equity securities(4) 81
17,611
(1) These were reclassified to ‘Other financial assets at amortised cost’ and ‘Other financial assets at fair value through profit or loss’ on adoption of IFRS 9. See Note 44.
(2) These were reclassified to ‘Financial assets at FVOCI’ and ‘Other financial assets at fair value through profit or loss’ on adoption of IFRS 9. See Note 44.
(3) These were reclassified to ‘Other financial assets at amortised cost’ on adoption of IFRS 9. See Note 44.
(4) These were reclassified to ‘Other financial assets at fair value through profit or loss’ on adoption of IFRS 9. See Note 44.
On adoption of IFRS 9, the Santander UK group split the ‘financial investments’ balance sheet line item between ‘other financial assets at
amortised cost’ and ‘financial assets at FVOCI’. For more information, see Note 44.
A significant portion of the debt securities were held in our eligible liquidity pool and consist mainly of government bonds and covered
bonds. Detailed disclosures can be found in the ‘Liquidity risk’ section of the Risk review.
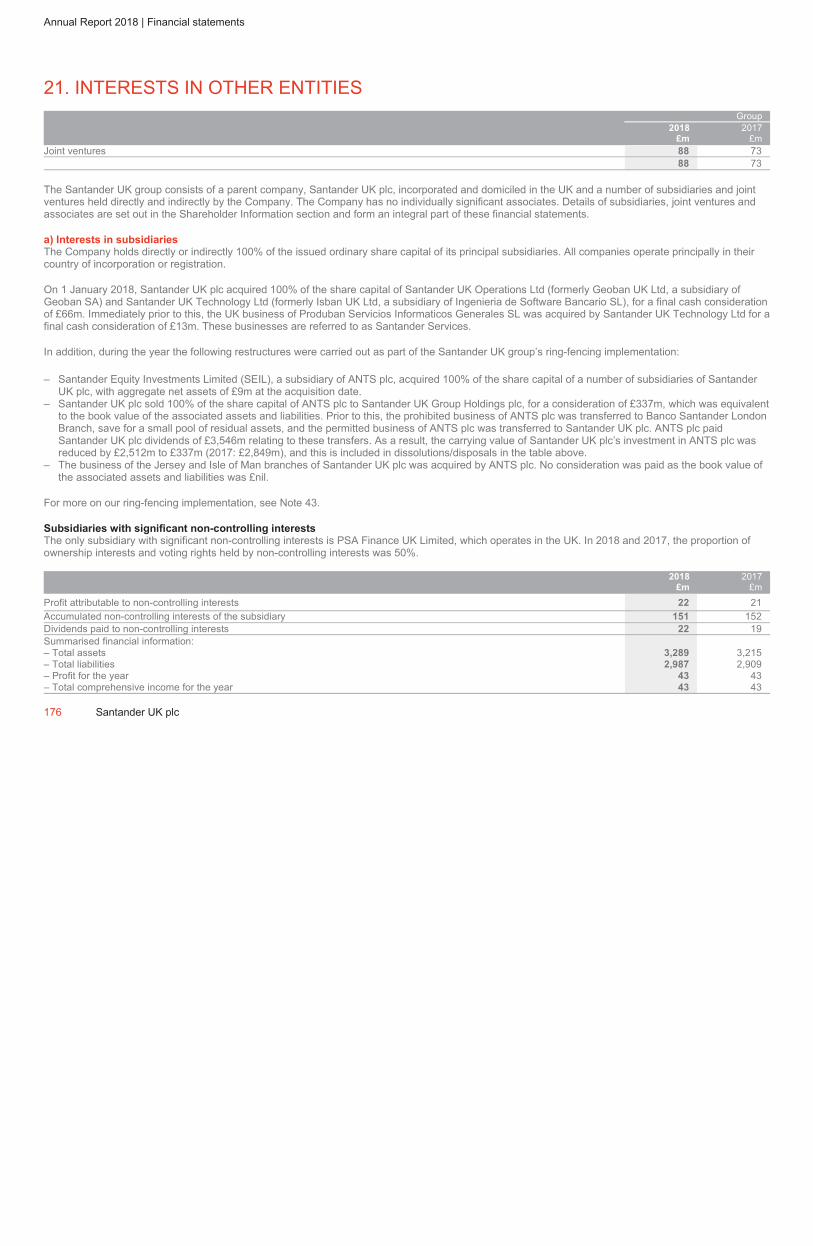
ˆ200G2Mlv!2TXWc1g=Š200G2Mlv!2TXWc1g=
628340 TX 176SANTANDERFORM 20-F (SAN UK PL
03-Mar-2019 10:26 ESTHTMLON
Donnelley Financial EGV dommj0dc 4*ESS 0C
VDI-W7-PFD-037612.9.12.0
Page 1 of 1
Annual Report 2018 | Financial statements
21. INTERESTS IN OTHER ENTITIES
Group
2018
£m
2017
£m
Joint ventures 88 73
88 73
The Santander UK group consists of a parent company, Santander UK plc, incorporated and domiciled in the UK and a number of subsidiaries and joint
ventures held directly and indirectly by the Company. The Company has no individually significant associates. Details of subsidiaries, joint ventures and
associates are set out in the Shareholder Information section and form an integral part of these financial statements.
a) Interests in subsidiaries
The Company holds directly or indirectly 100% of the issued ordinary share capital of its principal subsidiaries. All companies operate principally in their
country of incorporation or registration.
On 1 January 2018, Santander UK plc acquired 100% of the share capital of Santander UK Operations Ltd (formerly Geoban UK Ltd, a subsidiary of
Geoban SA) and Santander UK Technology Ltd (formerly Isban UK Ltd, a subsidiary of Ingenieria de Software Bancario SL), for a final cash consideration
of £66m. Immediately prior to this, the UK business of Produban Servicios Informaticos Generales SL was acquired by Santander UK Technology Ltd for a
final cash consideration of £13m. These businesses are referred to as Santander Services.
In addition, during the year the following restructures were carried out as part of the Santander UK group’s ring-fencing implementation:
– Santander Equity Investments Limited (SEIL), a subsidiary of ANTS plc, acquired 100% of the share capital of a number of subsidiaries of Santander
UK plc, with aggregate net assets of £9m at the acquisition date.
– Santander UK plc sold 100% of the share capital of ANTS plc to Santander UK Group Holdings plc, for a consideration of £337m, which was equivalent
to the book value of the associated assets and liabilities. Prior to this, the prohibited business of ANTS plc was transferred to Banco Santander London
Branch, save for a small pool of residual assets, and the permitted business of ANTS plc was transferred to Santander UK plc. ANTS plc paid
Santander UK plc dividends of £3,546m relating to these transfers. As a result, the carrying value of Santander UK plc’s investment in ANTS plc was
reduced by £2,512m to £337m (2017: £2,849m), and this is included in dissolutions/disposals in the table above.
– The business of the Jersey and Isle of Man branches of Santander UK plc was acquired by ANTS plc. No consideration was paid as the book value of
the associated assets and liabilities was £nil.
For more on our ring-fencing implementation, see Note 43.
Subsidiaries with significant non-controlling interests
The only subsidiary with significant non-controlling interests is PSA Finance UK Limited, which operates in the UK. In 2018 and 2017, the proportion of
ownership interests and voting rights held by non-controlling interests was 50%.
2018
£m
2017
£m
Profit attributable to non-controlling interests 22 21
Accumulated non-controlling interests of the subsidiary 151 152
Dividends paid to non-controlling interests 22 19
Summarised financial information:
– Total assets 3,289 3,215
– Total liabilities 2,987 2,909
– Profit for the year 43 43
– Total comprehensive income for the year 43 43
176 Santander UK plc
ˆ200G2Mlv!2Y4Qzh6HŠ200G2Mlv!2Y4Qzh6H
628340 TX 177SANTANDERFORM 20-F (SAN UK PL
03-Mar-2019 23:13 ESTHTMLON
Donnelley Financial EGV marik1dc 4*ESS 0C
VDI-W7-PFL-060212.9.12.0
bar5
Page 1 of 1
> Notes to the financial statements
Santander UK plc 177
Interests in consolidated structured entities
Structured entities are formed by Santander UK to accomplish specific and well-defined objectives. Santander UK consolidates these
structured entities when the substance of the relationship indicates control, as described in Note 1. In addition to the structured entities
disclosed in Note 15 which are used for securitisation and covered bond programmes, the only other structured entities consolidated by
Santander UK are described below. All the external assets in these entities are included in the financial statements and in relevant Notes.
Other than as set out below, no significant judgements were required with respect to control or significant influence.
i) Guaranteed Investment Products 1 PCC Limited (GIP)
GIP is a Guernsey-incorporated, closed-ended, protected cell company. The objective of each cell is to achieve capital growth for retail
investors. In order to achieve the investment objective, GIP, on behalf of the respective cells, has entered into transactions with Santander
UK plc. Santander Guarantee Company, a Santander UK group company, also guarantees the shareholders of cells a fixed return on their
investment and/or the investment amount. GIP has no third party assets. Although the share capital is owned by the retail investors,
Santander UK continues to have exposure to variable risks and returns through Santander Guarantee Company’s guarantee and has
therefore consolidated this entity.
ii) Santander UK Foundation Limited
Santander UK Foundation Limited supports disadvantaged people throughout the UK through the charitable priorities of education and
financial capability. The entity was set up by the Company, although its control was transferred to Santander UK Group Holdings plc in
June 2018, and it is therefore no longer consolidated by Santander UK plc from that date.
b) Interests in joint ventures
Santander UK does not have any individually material interests in joint ventures. As set out in the accounting policies in Note 1, interests in
joint ventures are accounted for using the equity method. In 2018, Santander UK’s share in the profit after tax of its joint ventures was
£15m (2017: £12m) before elimination of transactions between Santander UK and the joint ventures. At 31 December 2018, the carrying
amount of Santander UK’s interest was £88m (2017: £73m). At 31 December 2018 and 2017, the joint ventures had no commitments and
contingent liabilities.
c) Interests in unconsolidated structured entities
Structured entities sponsored by the Santander UK group
Santander UK has interests in structured entities which it sponsors but does not control. Santander UK considers itself a sponsor of a
structured entity when it facilitates the establishment of the structured entity. Other than as set out below, no significant judgements were
required with respect to control or significant influence. The structured entities sponsored but not consolidated by Santander UK are as
follows.
i) Santander (UK) Common Investment Fund
The Santander (UK) Common Investment Fund (the Fund) is a common investment fund that was established to hold the assets of the
Santander (UK) Group Pension Scheme. The Fund is not consolidated by Santander UK, but its assets of £11,433m (2017: £11,626m) are
accounted for as part of the defined benefit assets and obligations recognised on Santander UK’s balance sheet. For more on the Fund,
see Note 31. As the Fund holds the assets of the pension scheme, it is outside the scope of IFRS 10. Santander UK’s maximum exposure
to loss is the carrying amount of the assets held.
ii) Trust preferred entities
The trust preferred entities, Abbey National Capital Trust I and Abbey National Capital LP I were 100% owned finance subsidiaries (as
defined in Regulation S-X under the US Securities Act 1933, as amended) of Santander UK plc which were set up by Santander UK solely
to issue trust preferred securities to third parties and lend the funds on to other Santander UK companies. On 7 February 2000, Abbey
National Capital Trust I issued US$1bn of 8.963% Non-cumulative Trust Preferred Securities, which were registered under the US
Securities Act 1933, as amended. The trust preferred entities were not consolidated by Santander UK as Santander UK plc was not
exposed to variability of returns from them.
In 2018, following a Partnership Special Redemption Event, the outstanding US$104m Abbey National Capital Trust I 8.963%
Non-cumulative Trust Preferred Securities were redeemed in full in accordance with their terms. The trust preferred entities were liquidated
later in 2018.
iii) Credit protection entities
Santander UK has established three (2017: two) credit protection entities which are private limited companies incorporated in Ireland. Each
entity has issued a series of credit linked notes varying in seniority which reference portfolios of Santander UK group loans. Concurrently,
these entities sell credit protection to Santander UK in respect of the referenced loans and, in return for a fee, are liable to make protection
payments to Santander UK upon the occurrence of a credit event in relation to any of the referenced loans.
Senior credit linked notes, which amounted to £3,053m (2017: £830m), are issued to, and held by, Santander UK. These notes are
included within ‘Other financial assets at fair value through profit or loss’ on the balance sheet (see Note 13). Junior credit linked notes,
which amounted to £408m (2017: £187m), are all held by third party investors and suffer the first losses incurred in the referenced
portfolios. Funds raised by the sale of the credit linked notes are deposited with Santander UK as collateral for the credit protection.
Deposits and associated guarantees in respect of the senior credit linked notes are included within ‘Other financial liabilities at fair value
through profit or loss’ (see Note 24), and in respect of the junior credit linked notes are included within ‘Deposits by customers’ (see Note
25).
The entities are not consolidated by Santander UK because the third party investors have the exposure, or rights, to all of the variability of
returns from the performance of the entities. No assets are transferred to, or income received from, these vehicles. Because the credit
linked notes (including those held by Santander UK) are fully cash collateralised, Santander UK’s maximum exposure to loss is equal to
any unamortised fees paid to the credit protection entities in connection with the credit protection outlined above.
Structured entities not sponsored by the Santander UK group
Santander UK also has interests in structured entities which it does not sponsor or control. These largely relate to the legacy treasury asset
portfolio and consist of holdings of mortgage and other asset backed securities issued by entities that were established and/or sponsored
by other unrelated financial institutions. These securities comprise the asset backed securities included in Note 18. Management has
concluded that the Santander UK group has no control or significant influence over these entities and that the carrying value of the
interests held in these entities represents the maximum exposure to loss.

ˆ200G2Mlv!2TcHw9gYŠ200G2Mlv!2TcHw9gY
628340 TX 178SANTANDERFORM 20-F (SAN UK PL
03-Mar-2019 10:42 ESTHTMLON
Donnelley Financial EGV dommj0dc 5*ESS 0C
VDI-W7-PFD-037612.9.12.0
Page 1 of 1
Annual Report 2018 | Financial statements
22. INTANGIBLE ASSETS
a) Goodwill
Group
Cost
£m
Accumulated
impairment
£m
Net book value
£m
At 31 December 2017, 1 January 2018 and 31 December 2018 1,285 (82) 1,203
Impairment of goodwill
In 2018 and 2017, no impairment of goodwill was recognised. Impairment testing in respect of goodwill allocated to each cash-generating unit (CGU) is
performed annually or more frequently if there are impairment indicators present. For the purpose of impairment testing, the CGUs are based on customer
groups within the relevant business divisions. The cash flow projections for each CGU are based on the five-year plan prepared for regulatory purposes,
based on Santander UK’s 3-Year Plan and approved by the Santander UK plc Board. The assumptions included in the expected future cash flows for
each CGU take into consideration the UK economic environment and financial outlook within which the CGU operates. Key assumptions include projected
GDP growth rates, the level of interest rates and the level and change in unemployment rates in the UK. The rate used to discount the cash flows is based
on a pre-tax rate that reflects the weighted average cost of capital allocated by Santander UK to investments in the business division in which the CGU
operates. The growth rate used reflects management’s five-year forecasts, with a terminal growth rate for each year applied thereafter, in line with the
estimated long-term average UK GDP growth rate.
Based on the conditions at the balance sheet date, management determined that a reasonably possible change in any of the key assumptions described
above would not cause an impairment of goodwill to be recognised.
The following CGUs (all within Retail Banking) include in their carrying values goodwill that comprises the goodwill reported by Santander UK. The CGUs
do not carry on their balance sheets any other intangible assets with indefinite useful lives. The calculations have been based on value in use using cash
flows based on the five-year plan.
Goodwill Discount rate Growth rate(1)
CGU
2018
£m
2017
£m
2018
%
2017
%
2018
%
2017
%
Personal financial services 1,169 1,169 10.5 10.8 2 1
Private banking 30 30 10.5 10.8 2 1
Other 4 4 10.5 10.8 2 1
1,203 1,203
(1) Average growth rate based on the five-year plan for the first five years and a growth rate of 2.0 % (2017: 1.5%) applied thereafter.
In 2018, the discount rate decreased by 0.3 percentage points to 10.5% (2017: 10.8%). The decrease reflected changes in current market and economic
conditions. In 2018, the change in growth rates reflected Santander UK’s updated strategic priorities in the context of forecast economic conditions.
b) Other intangibles
Group
Cost
£m
Accumulated
amortisation/
impairment
£m
Net book value
£m
At 1 January 2018 962 (423) 539
Additions 204 – 204
Write offs (76) 76 –
Charge – (138) (138)
Sales – – –
At 31 December 2018 1,090 (485) 605
At 1 January 2017 760 (278) 482
Additions 205 – 205
Disposals (3) 3 –
Charge – (116) (116)
Impairment – (32) (32)
At 31 December 2017 962 (423) 539
Other intangibles consist of computer software. In 2017, impairments primarily related to capitalised software costs for a credit risk management system,
part of which was no longer in use.
178 Santander UK plc
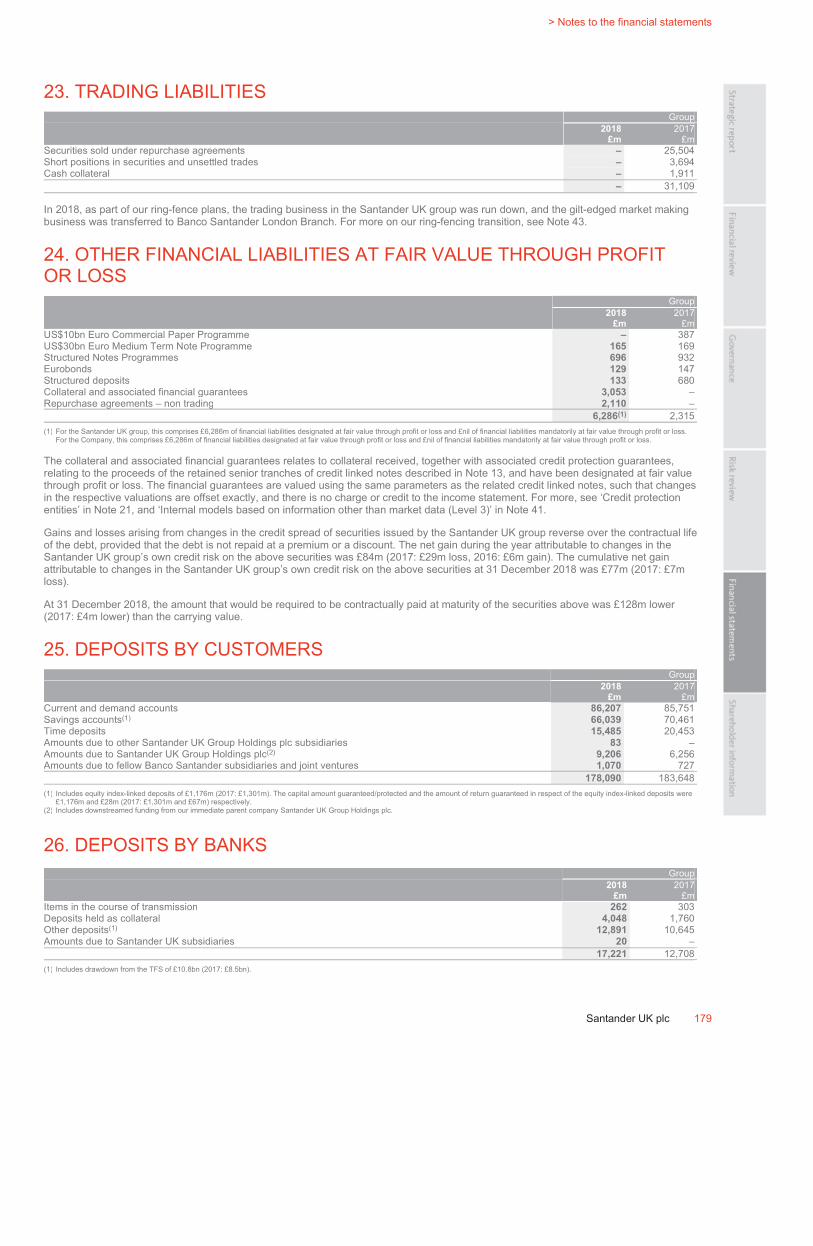
ˆ200G2Mlv!2RbwGVgxŠ200G2Mlv!2RbwGVgx
628340 TX 179SANTANDERFORM 20-F (SAN UK PL
03-Mar-2019 05:13 ESTHTMLON
Donnelley Financial EGV govik0cb 4*ESS 0C
VDI-W7-PFD-045812.9.12.0
bar5
Page 1 of 1
> Notes to the financial statements
Santander UK plc 179
23. TRADING LIABILITIES
Group
2018
£m
2017
£m
Securities sold under repurchase agreements – 25,504
Short positions in securities and unsettled trades – 3,694
Cash collateral – 1,911
– 31,109
In 2018, as part of our ring-fence plans, the trading business in the Santander UK group was run down, and the gilt-edged market making
business was transferred to Banco Santander London Branch. For more on our ring-fencing transition, see Note 43.
24. OTHER FINANCIAL LIABILITIES AT FAIR VALUE THROUGH PROFIT
OR LOSS
Group
2018
£m
2017
£m
US$10bn Euro Commercial Paper Programme – 387
US$30bn Euro Medium Term Note Programme 165 169
Structured Notes Programmes 696 932
Eurobonds 129 147
Structured deposits 133 680
Collateral and associated financial guarantees 3,053 –
Repurchase agreements – non trading 2,110 –
6,286(1) 2,315
(1) For the Santander UK group, this comprises £6,286m of financial liabilities designated at fair value through profit or loss and £nil of financial liabilities mandatorily at fair value through profit or loss.
For the Company, this comprises £6,286m of financial liabilities designated at fair value through profit or loss and £nil of financial liabilities mandatorily at fair value through profit or loss.
The collateral and associated financial guarantees relates to collateral received, together with associated credit protection guarantees,
relating to the proceeds of the retained senior tranches of credit linked notes described in Note 13, and have been designated at fair value
through profit or loss. The financial guarantees are valued using the same parameters as the related credit linked notes, such that changes
in the respective valuations are offset exactly, and there is no charge or credit to the income statement. For more, see ‘Credit protection
entities’ in Note 21, and ‘Internal models based on information other than market data (Level 3)’ in Note 41.
Gains and losses arising from changes in the credit spread of securities issued by the Santander UK group reverse over the contractual life
of the debt, provided that the debt is not repaid at a premium or a discount. The net gain during the year attributable to changes in the
Santander UK group’s own credit risk on the above securities was £84m (2017: £29m loss, 2016: £6m gain). The cumulative net gain
attributable to changes in the Santander UK group’s own credit risk on the above securities at 31 December 2018 was £77m (2017: £7m
loss).
At 31 December 2018, the amount that would be required to be contractually paid at maturity of the securities above was £128m lower
(2017: £4m lower) than the carrying value.
25. DEPOSITS BY CUSTOMERS
Group
2018
£m
2017
£m
Current and demand accounts 86,207 85,751
Savings accounts(1) 66,039 70,461
Time deposits 15,485 20,453
Amounts due to other Santander UK Group Holdings plc subsidiaries 83 –
Amounts due to Santander UK Group Holdings plc(2)
9,206 6,256
Amounts due to fellow Banco Santander subsidiaries and joint ventures 1,070 727
178,090 183,648
(1) Includes equity index-linked deposits of £1,176m (2017: £1,301m). The capital amount guaranteed/protected and the amount of return guaranteed in respect of the equity index-linked deposits were
£1,176m and £28m (2017: £1,301m and £67m) respectively.
(2) Includes downstreamed funding from our immediate parent company Santander UK Group Holdings plc.
26. DEPOSITS BY BANKS
Group
2018
£m
2017
£m
Items in the course of transmission 262 303
Deposits held as collateral 4,048 1,760
Other deposits(1)
12,891 10,645
Amounts due to Santander UK subsidiaries 20 –
17,221 12,708
(1) Includes drawdown from the TFS of £10.8bn (2017: £8.5bn).
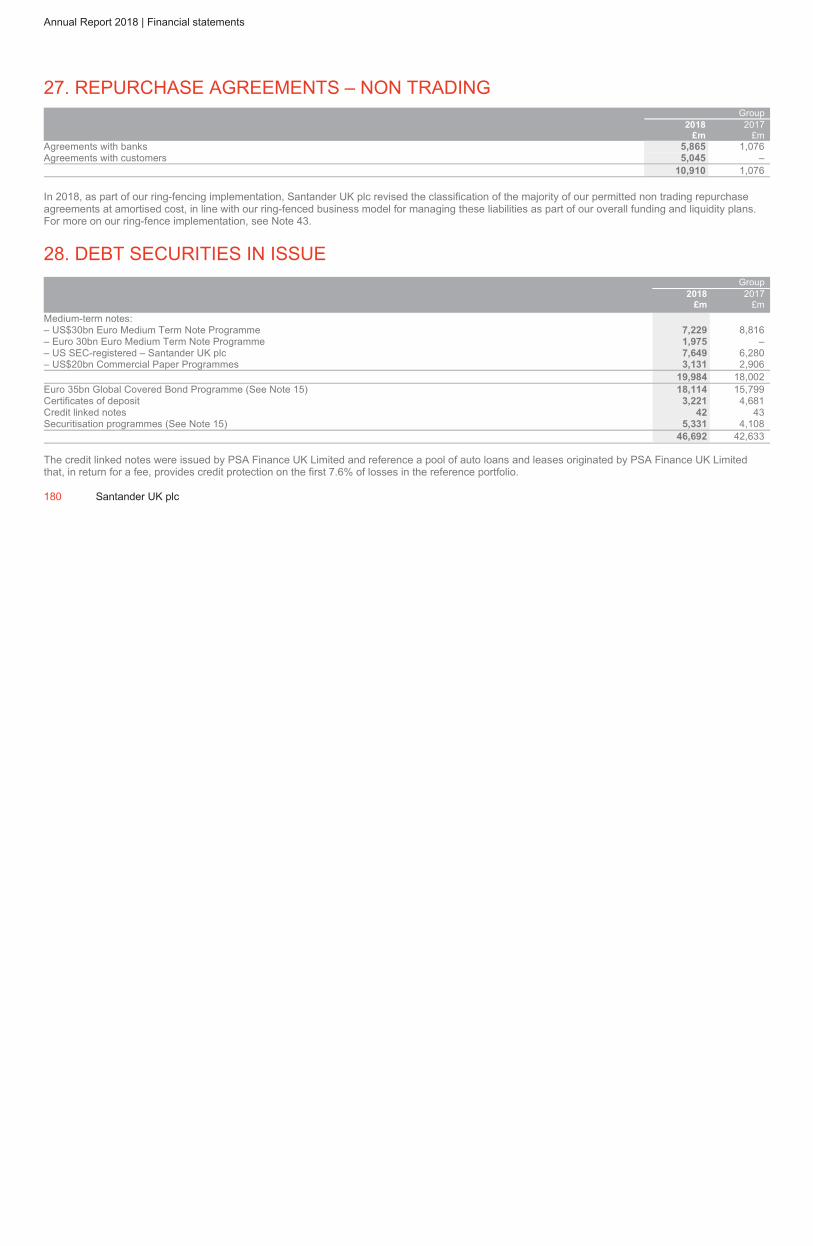
ˆ200G2Mlv!2S9dezg+Š200G2Mlv!2S9dezg+
628340 TX 180SANTANDERFORM 20-F (SAN UK PL
03-Mar-2019 06:33 ESTHTMLON
Donnelley Financial EGV shanv1dc 4*ESS 0C
VDI-W7-PFL-091012.9.12.0
Page 1 of 1
Annual Report 2018 | Financial statements
27. REPURCHASE AGREEMENTS – NON TRADING
Group
2018
£m
2017
£m
Agreements with banks 5,865 1,076
Agreements with customers 5,045 –
10,910 1,076
In 2018, as part of our ring-fencing implementation, Santander UK plc revised the classification of the majority of our permitted non trading repurchase
agreements at amortised cost, in line with our ring-fenced business model for managing these liabilities as part of our overall funding and liquidity plans.
For more on our ring-fence implementation, see Note 43.
28. DEBT SECURITIES IN ISSUE
Group
2018
£m
2017
£m
Medium-term notes:
– US$30bn Euro Medium Term Note Programme 7,229 8,816
– Euro 30bn Euro Medium Term Note Programme 1,975 –
– US SEC-registered – Santander UK plc 7,649 6,280
– US$20bn Commercial Paper Programmes 3,131 2,906
19,984 18,002
Euro 35bn Global Covered Bond Programme (See Note 15) 18,114 15,799
Certificates of deposit 3,221 4,681
Credit linked notes 42 43
Securitisation programmes (See Note 15) 5,331 4,108
46,692 42,633
The credit linked notes were issued by PSA Finance UK Limited and reference a pool of auto loans and leases originated by PSA Finance UK Limited
that, in return for a fee, provides credit protection on the first 7.6% of losses in the reference portfolio.
180 Santander UK plc
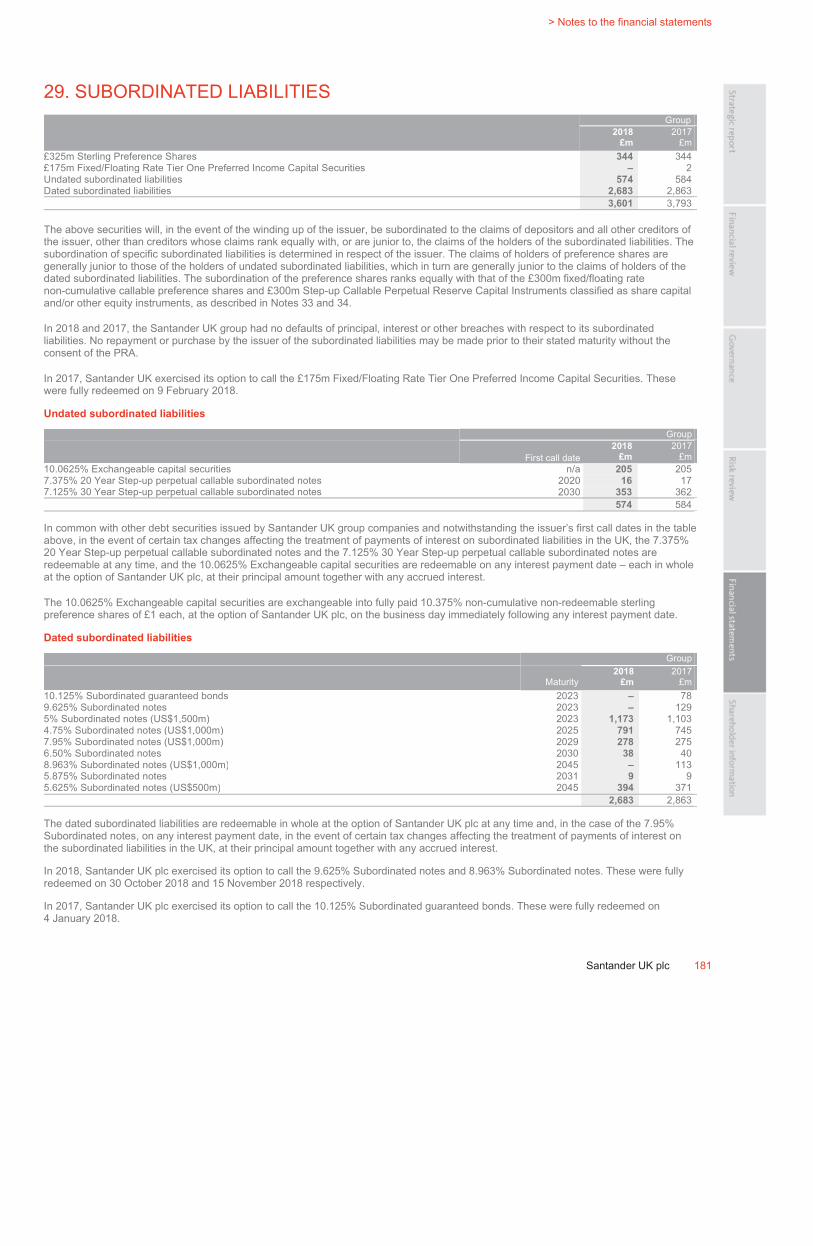
ˆ200G2Mlv!2SFybag7Š200G2Mlv!2SFybag7
628340 TX 181SANTANDERFORM 20-F (SAN UK PL
03-Mar-2019 06:41 ESTHTMLON
Donnelley Financial EGV shanv1dc 4*ESS 0C
VDI-W7-PFL-091012.9.12.0
bar5
Page 1 of 1
> Notes to the financial statements
Santander UK plc 181
29. SUBORDINATED LIABILITIES
Group
2018
£m
2017
£m
£325m Sterling Preference Shares 344 344
£175m Fixed/Floating Rate Tier One Preferred Income Capital Securities – 2
Undated subordinated liabilities 574 584
Dated subordinated liabilities 2,683 2,863
3,601 3,793
The above securities will, in the event of the winding up of the issuer, be subordinated to the claims of depositors and all other creditors of
the issuer, other than creditors whose claims rank equally with, or are junior to, the claims of the holders of the subordinated liabilities. The
subordination of specific subordinated liabilities is determined in respect of the issuer. The claims of holders of preference shares are
generally junior to those of the holders of undated subordinated liabilities, which in turn are generally junior to the claims of holders of the
dated subordinated liabilities. The subordination of the preference shares ranks equally with that of the £300m fixed/floating rate
non-cumulative callable preference shares and £300m Step-up Callable Perpetual Reserve Capital Instruments classified as share capital
and/or other equity instruments, as described in Notes 33 and 34.
In 2018 and 2017, the Santander UK group had no defaults of principal, interest or other breaches with respect to its subordinated
liabilities. No repayment or purchase by the issuer of the subordinated liabilities may be made prior to their stated maturity without the
consent of the PRA.
In 2017, Santander UK exercised its option to call the £175m Fixed/Floating Rate Tier One Preferred Income Capital Securities. These
were fully redeemed on 9 February 2018.
Undated subordinated liabilities
Group
First call date
2018
£m
2017
£m
10.0625% Exchangeable capital securities n/a 205 205
7.375% 20 Year Step-up perpetual callable subordinated notes 2020 16 17
7.125% 30 Year Step-up perpetual callable subordinated notes 2030 353 362
574 584
In common with other debt securities issued by Santander UK group companies and notwithstanding the issuer’s first call dates in the table
above, in the event of certain tax changes affecting the treatment of payments of interest on subordinated liabilities in the UK, the 7.375%
20 Year Step-up perpetual callable subordinated notes and the 7.125% 30 Year Step-up perpetual callable subordinated notes are
redeemable at any time, and the 10.0625% Exchangeable capital securities are redeemable on any interest payment date – each in whole
at the option of Santander UK plc, at their principal amount together with any accrued interest.
The 10.0625% Exchangeable capital securities are exchangeable into fully paid 10.375% non-cumulative non-redeemable sterling
preference shares of £1 each, at the option of Santander UK plc, on the business day immediately following any interest payment date.
Dated subordinated liabilities
Group
Maturity
2018
£m
2017
£m
10.125% Subordinated guaranteed bonds 2023 – 78
9.625% Subordinated notes 2023 – 129
5% Subordinated notes (US$1,500m) 2023 1,173 1,103
4.75% Subordinated notes (US$1,000m) 2025 791 745
7.95% Subordinated notes (US$1,000m) 2029 278 275
6.50% Subordinated notes 2030 38 40
8.963% Subordinated notes (US$1,000m) 2045 – 113
5.875% Subordinated notes 2031 9 9
5.625% Subordinated notes (US$500m) 2045 394 371
2,683 2,863
The dated subordinated liabilities are redeemable in whole at the option of Santander UK plc at any time and, in the case of the 7.95%
Subordinated notes, on any interest payment date, in the event of certain tax changes affecting the treatment of payments of interest on
the subordinated liabilities in the UK, at their principal amount together with any accrued interest.
In 2018, Santander UK plc exercised its option to call the 9.625% Subordinated notes and 8.963% Subordinated notes. These were fully
redeemed on 30 October 2018 and 15 November 2018 respectively.
In 2017, Santander UK plc exercised its option to call the 10.125% Subordinated guaranteed bonds. These were fully redeemed on
4 January 2018.

ˆ200G2Mlv!2X7d!C6XŠ200G2Mlv!2X7d!C6X
628340 TX 182SANTANDERFORM 20-F (SAN UK PL
03-Mar-2019 21:43 ESTHTMLON
Donnelley Financial EGV sraas0dc 6*ESS 0C
VDI-W7-PFL-035112.9.12.0
Page 1 of 1
Annual Report 2018 | Financial statements
30. PROVISIONS
Group
Conduct remediation
PPI
£m
Other
products
£m
FSCS and
Bank Levy
£m
Vacant
property
£m
Off-balance
sheet ECL
£m
Regulatory
and other
£m
Total
£m
At 31 December 2017 356 47 57 39 59 558
Reallocation of ECL on off-balance sheet exposures(1) – – – – 50 – 50
At 1 January 2018 356 47 57 39 50 59 608
Additional provisions (see Note 8) – – 69 12 6 209 296
Provisions released (see Note 8) – (14) (4) – – (15) (33)
Utilisation (110) (3) (91) (14) – (158) (376)
Other – – 14(2) – – – 14
At 31 December 2018 246 30 45 37 56 95 509
To be settled:
– Within 12 months 246 22 45 22 56 95 486
– In more than 12 months – 8 – 15 – – 23
246 30 45 37 56 95 509
At 1 January 2017 457 36 96 47 64 700
Additional provisions 109 35 93 4 144 385
Utilisation (210) (34) (132) (12) (149) (537)
Transfers – 10 – – – 10
At 31 December 2017 356 47 57 39 59 558
To be settled:
– Within 12 months 167 38 57 23 59 344
– In more than 12 months 189 9 – 16 – 214
356 47 57 39 59 558
(1) ECL on off-balance sheet exposures following the adoption of a methodology to enable their separate identification from ECL on drawn exposures. See Note 14.
(2) Santander UK plc recharged £14m (2017: £nil) in respect of the UK Bank Levy paid on behalf of other UK entities of Banco Santander SA.
a) Conduct remediation
The amounts in respect of conduct remediation comprise the estimated cost of making redress payments, including related costs, with respect to the past
sales or administration of products. The provision for conduct remediation represents management’s best estimate of the anticipated costs of related
customer contact and/or redress, including related costs.
182 Santander UK plc
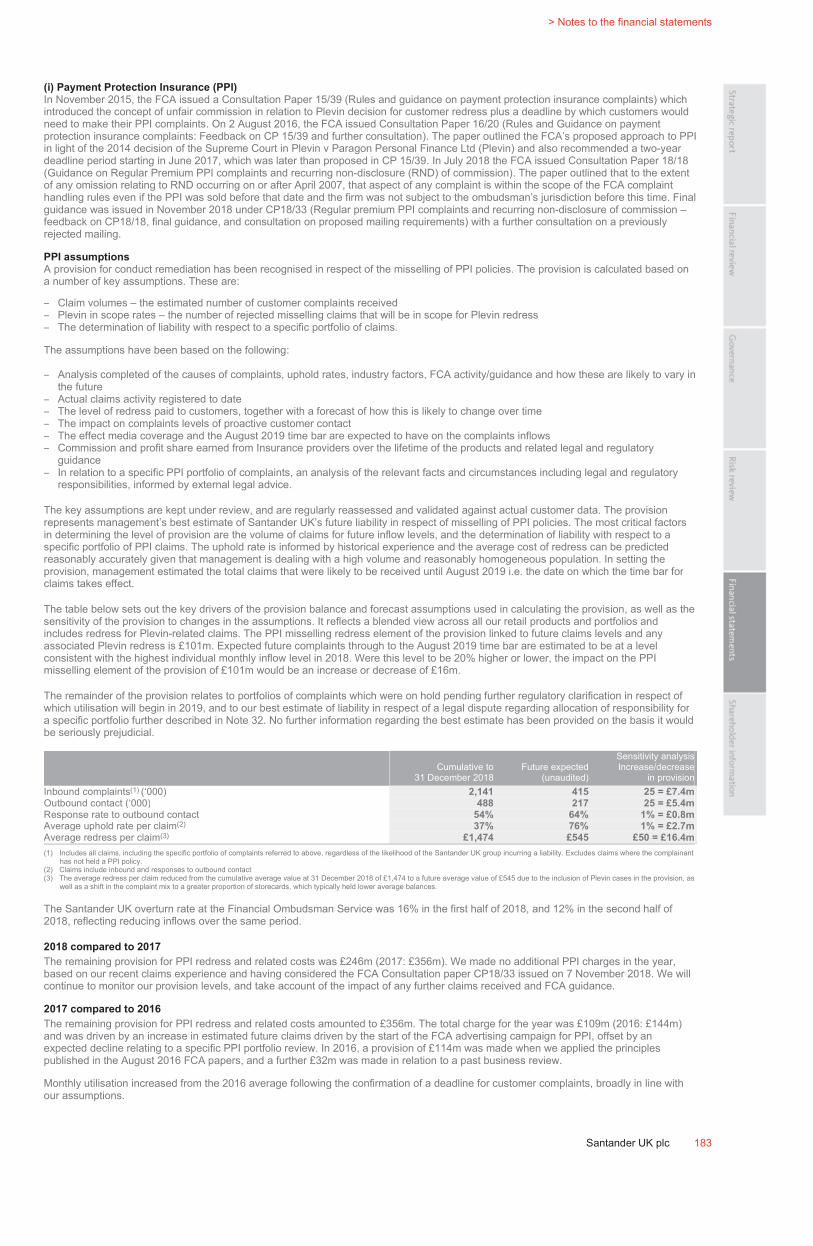
ˆ200G2Mlv!2SVM806(Š200G2Mlv!2SVM806(
628340 TX 183SANTANDERFORM 20-F (SAN UK PL
03-Mar-2019 07:14 ESTHTMLON
Donnelley Financial EGV shanv1dc 4*ESS 0C
VDI-W7-PFL-091012.9.12.0
bar5
Page 1 of 1
> Notes to the financial statements
Santander UK plc 183
(i) Payment Protection Insurance (PPI)
In November 2015, the FCA issued a Consultation Paper 15/39 (Rules and guidance on payment protection insurance complaints) which introduced the concept of unfair commission in relation to Plevin decision for customer redress plus a deadline by which customers would need to make their PPI complaints. On 2 August 2016, the FCA issued Consultation Paper 16/20 (Rules and Guidance on payment protection insurance complaints: Feedback on CP 15/39 and further consultation). The paper outlined the FCA’s proposed approach to PPI in light of the 2014 decision of the Supreme Court in Plevin v Paragon Personal Finance Ltd (Plevin) and also recommended a two-year deadline period starting in June 2017, which was later than proposed in CP 15/39. In July 2018 the FCA issued Consultation Paper 18/18 (Guidance on Regular Premium PPI complaints and recurring non-disclosure (RND) of commission). The paper outlined that to the extent of any omission relating to RND occurring on or after April 2007, that aspect of any complaint is within the scope of the FCA complaint handling rules even if the PPI was sold before that date and the firm was not subject to the ombudsman’s jurisdiction before this time. Final guidance was issued in November 2018 under CP18/33 (Regular premium PPI complaints and recurring non-disclosure of commission – feedback on CP18/18, final guidance, and consultation on proposed mailing requirements) with a further consultation on a previously rejected mailing.
PPI assumptions
A provision for conduct remediation has been recognised in respect of the misselling of PPI policies. The provision is calculated based on a number of key assumptions. These are:
– Claim volumes – the estimated number of customer complaints received – Plevin in scope rates – the number of rejected misselling claims that will be in scope for Plevin redress – The determination of liability with respect to a specific portfolio of claims.
The assumptions have been based on the following:
– Analysis completed of the causes of complaints, uphold rates, industry factors, FCA activity/guidance and how these are likely to vary in the future
– Actual claims activity registered to date – The level of redress paid to customers, together with a forecast of how this is likely to change over time – The impact on complaints levels of proactive customer contact – The effect media coverage and the August 2019 time bar are expected to have on the complaints inflows – Commission and profit share earned from Insurance providers over the lifetime of the products and related legal and regulatory
guidance – In relation to a specific PPI portfolio of complaints, an analysis of the relevant facts and circumstances including legal and regulatory
responsibilities, informed by external legal advice.
The key assumptions are kept under review, and are regularly reassessed and validated against actual customer data. The provision represents management’s best estimate of Santander UK’s future liability in respect of misselling of PPI policies. The most critical factors in determining the level of provision are the volume of claims for future inflow levels, and the determination of liability with respect to a specific portfolio of PPI claims. The uphold rate is informed by historical experience and the average cost of redress can be predicted reasonably accurately given that management is dealing with a high volume and reasonably homogeneous population. In setting the provision, management estimated the total claims that were likely to be received until August 2019 i.e. the date on which the time bar for claims takes effect.
The table below sets out the key drivers of the provision balance and forecast assumptions used in calculating the provision, as well as the sensitivity of the provision to changes in the assumptions. It reflects a blended view across all our retail products and portfolios and includes redress for Plevin-related claims. The PPI misselling redress element of the provision linked to future claims levels and any associated Plevin redress is £101m. Expected future complaints through to the August 2019 time bar are estimated to be at a level consistent with the highest individual monthly inflow level in 2018. Were this level to be 20% higher or lower, the impact on the PPI misselling element of the provision of £101m would be an increase or decrease of £16m.
The remainder of the provision relates to portfolios of complaints which were on hold pending further regulatory clarification in respect of which utilisation will begin in 2019, and to our best estimate of liability in respect of a legal dispute regarding allocation of responsibility for a specific portfolio further described in Note 32. No further information regarding the best estimate has been provided on the basis it would be seriously prejudicial.
Cumulative to31 December 2018
Future expected(unaudited)
Sensitivity analysisIncrease/decrease
in provisionInbound complaints(1) (‘000) 2,141 415 25 = £7.4m
Outbound contact (‘000) 488 217 25 = £5.4m
Response rate to outbound contact 54% 64% 1% = £0.8m
Average uphold rate per claim(2) 37% 76% 1% = £2.7m
Average redress per claim(3) £1,474 £545 £50 = £16.4m
(1) Includes all claims, including the specific portfolio of complaints referred to above, regardless of the likelihood of the Santander UK group incurring a liability. Excludes claims where the complainant has not held a PPI policy.
(2) Claims include inbound and responses to outbound contact.(3) The average redress per claim reduced from the cumulative average value at 31 December 2018 of £1,474 to a future average value of £545 due to the inclusion of Plevin cases in the provision, as
well as a shift in the complaint mix to a greater proportion of storecards, which typically held lower average balances.
The Santander UK overturn rate at the Financial Ombudsman Service was 16% in the first half of 2018, and 12% in the second half of 2018, reflecting reducing inflows over the same period.
2018 compared to 2017
The remaining provision for PPI redress and related costs was £246m (2017: £356m). We made no additional PPI charges in the year, based on our recent claims experience and having considered the FCA Consultation paper CP18/33 issued on 7 November 2018. We will continue to monitor our provision levels, and take account of the impact of any further claims received and FCA guidance.
2017 compared to 2016
The remaining provision for PPI redress and related costs amounted to £356m. The total charge for the year was £109m (2016: £144m) and was driven by an increase in estimated future claims driven by the start of the FCA advertising campaign for PPI, offset by an expected decline relating to a specific PPI portfolio review. In 2016, a provision of £114m was made when we applied the principles published in the August 2016 FCA papers, and a further £32m was made in relation to a past business review.
Monthly utilisation increased from the 2016 average following the confirmation of a deadline for customer complaints, broadly in line with our assumptions.

ˆ200G2Mlv!2XqMin6NŠ200G2Mlv!2XqMin6N
628340 TX 184SANTANDERFORM 20-F (SAN UK PL
03-Mar-2019 22:43 ESTHTMLON
Donnelley Financial EGV marik1dc 7*ESS 0C
VDI-W7-PFL-060212.9.12.0
Page 1 of 1
Annual Report 2018 | Financial statements
(ii) Other products
A provision for conduct remediation has also been recognised in respect of sales of other products. A number of uncertainties remain as to the eventual
costs with respect to conduct remediation in respect of these products given the inherent difficulties in determining the number of customers involved and
the amount of any redress to be provided to them.
The remaining provision for other conduct was £30m (2017: £47m), which primarily related to the sale of interest rate derivatives, following an ongoing
review of the regulatory classification of certain customers potentially eligible for redress. Following further analysis, management assessed the provision
requirements resulting in a release of £11m in the second quarter of 2018.
b) FSCS and Bank Levy
(I) Financial Services Compensation Scheme (FSCS)
The FSCS is the UK’s independent statutory compensation fund for customers of authorised financial services firms and pays compensation if a firm is
unable to pay claims against it. The FSCS is funded by levies on the industry (and recoveries and borrowings where appropriate). Following the default of
a number of deposit takers since 2008, the FSCS borrowed funds from HM Treasury to meet the compensation costs for customers of those firms. On
25 April 2017, following the sale of certain Bradford & Bingley mortgage assets, the amount that the FSCS owed to HM Treasury reduced to £4.7bn, from
£15.7bn. The interest payable on the loan, and the Santander UK group’s share of that interest, fell accordingly. Based on the latest estimates from the
FSCS the balance outstanding will be repaid earlier mostly through recoveries from asset sales, surplus cash flow or other recoveries in relation to the
assets of the firms that defaulted. According to the new estimates, the amount to be provided by the Santander UK group for the interest payable on the
loan was lower than initially expected. As a result, there was a release of £4m (2017: £1m charge, 2016: £34m charge) to bring the provision down to the
amount now expected to be charged for the remaining interest. The Santander UK group provided for a liability for the FSCS of £4m at 31 December 2018
(2017: £13m).
(ii) UK Bank Levy
In addition to changes in UK corporation tax rates, Finance (No.2) Act 2015 reduced the UK Bank Levy rate from 0.21% via subsequent annual reductions
to 0.10% from 1 January 2021. As a result, a rate of 0.16% applies for 2018 (2017: 0.17%). The cost of the UK Bank Levy for 2018 was £69m (2017:
£92m, 2016: £107m). The Santander UK group paid £86m in 2018 (2017: £109m) and provided for a liability of £40m at 31 December 2018 (2017: £44m).
c) Vacant property
Vacant property provisions are made by reference to an estimate of any expected sub-let income, compared to the head rent, and the possibility of
disposing of Santander UK’s interest in the lease, taking into account conditions in the property market. These provisions are reassessed on a semi-
annual basis and will normally run off over the period of the leases concerned. Where a property is disposed of earlier than anticipated, any remaining
provision relating to that property is released.
d) Off-balance sheet ECL
Following the adoption of IFRS 9 on 1 January 2018, provisions include expected credit losses relating to guarantees given to third parties and undrawn
loan commitments.
e) Regulatory and other
Regulatory and other provisions principally comprise amounts in respect of regulatory charges (including fines), operational loss and operational risk
provisions, restructuring charges and litigation and related expenses. A number of uncertainties exist with respect to these provisions given the
uncertainties inherent in operational, restructuring and litigation matters that affect the amount and timing of any potential outflows with respect to which
provisions have been established. These provisions are reviewed periodically.
Regulatory and other provisions charged in 2018 included the following items:
– In the fourth quarter of 2018, we were fined £33m by the FCA in relation to an investigation into our historical probate and bereavement practices. We
acknowledged the findings of the FCA and apologised to the families and beneficiaries of deceased customers affected by these failings. This amount
was charged and paid in the year.
– An amount of £58m (2017: £nil) that was charged in 2018 and arose from a systems related historical issue identified by Santander UK, relating to
compliance with certain requirements of the Consumer Credit Act (CCA). This provision is based on detailed reviews of relevant systems related to
consumer credit business operations, supported by external legal and regulatory advice, and reflects our best estimate at 31 December 2018 of
potential costs in respect of the identified issue. However, as detailed in Note 32, these reviews and the related analysis are not yet complete, such that
the approach and timing to any remediation has not yet been finalised, although it is expected to commence in 2019.
31. RETIREMENT BENEFIT PLANS
The amounts recognised in the balance sheet were as follows:
Group
2018
£m
2017
£m
Assets/(liabilities)
Funded defined benefit pension scheme – surplus 842 449
Funded defined benefit pension scheme – deficit (75) (245)
Unfunded defined benefit pension scheme (39) (41)
Total net assets 728 163
Remeasurement (gains)/losses recognised in other comprehensive income during the year were as follows:
Group
2018
£m
2017
£m
2016
£m
Pension remeasurement (470) 103 528
184 Santander UK plc
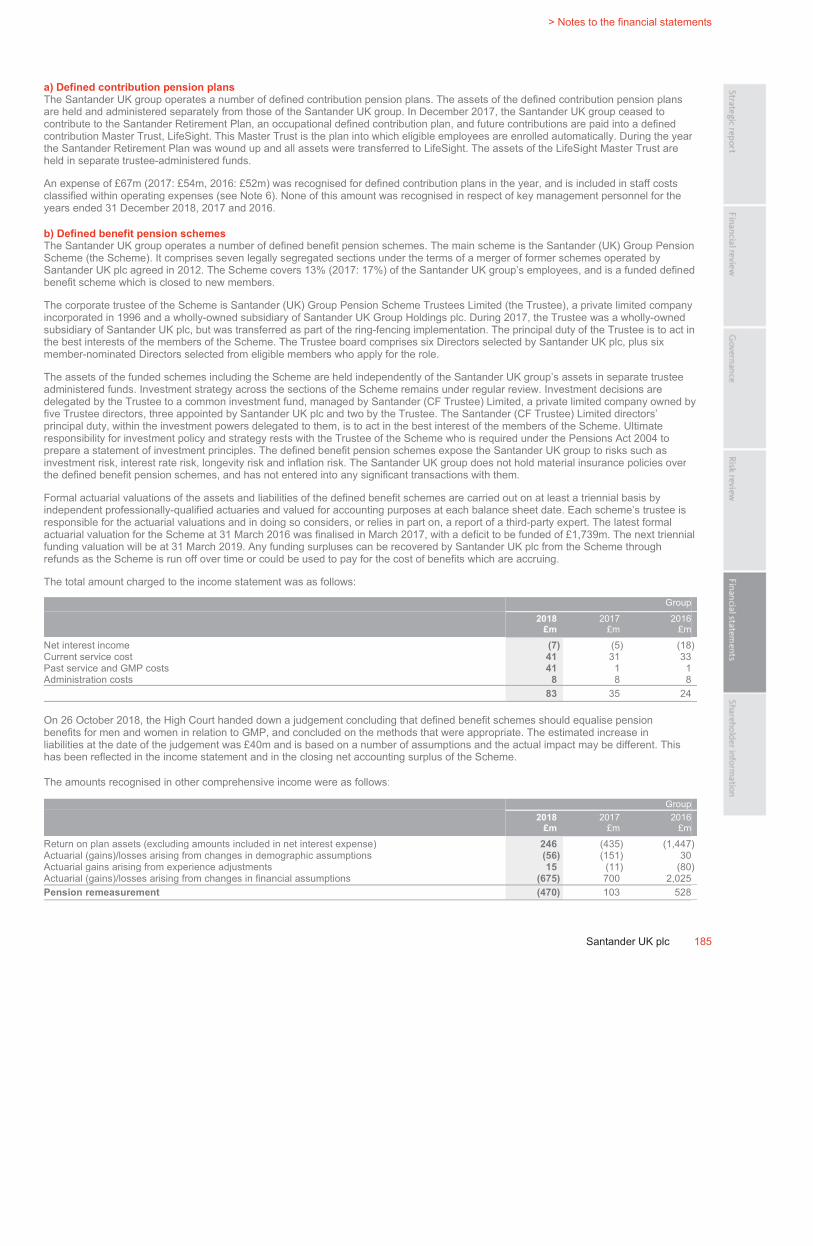
ˆ200G2Mlv!2VfwZXgŠ200G2Mlv!2VfwZXg´
628340 TX 185SANTANDERFORM 20-F (SAN UK PL
03-Mar-2019 15:58 ESTHTMLON
Donnelley Financial EGV kumak0dc 5*ESS 0C
VDI-W7-PFL-105912.9.12.0
bar5
Page 1 of 1
> Notes to the financial statements
Santander UK plc 185
a) Defined contribution pension plans
The Santander UK group operates a number of defined contribution pension plans. The assets of the defined contribution pension plans
are held and administered separately from those of the Santander UK group. In December 2017, the Santander UK group ceased to
contribute to the Santander Retirement Plan, an occupational defined contribution plan, and future contributions are paid into a defined
contribution Master Trust, LifeSight. This Master Trust is the plan into which eligible employees are enrolled automatically. During the year
the Santander Retirement Plan was wound up and all assets were transferred to LifeSight. The assets of the LifeSight Master Trust are
held in separate trustee-administered funds.
An expense of £67m (2017: £54m, 2016: £52m) was recognised for defined contribution plans in the year, and is included in staff costs
classified within operating expenses (see Note 6). None of this amount was recognised in respect of key management personnel for the
years ended 31 December 2018, 2017 and 2016.
b) Defined benefit pension schemes
The Santander UK group operates a number of defined benefit pension schemes. The main scheme is the Santander (UK) Group Pension
Scheme (the Scheme). It comprises seven legally segregated sections under the terms of a merger of former schemes operated by
Santander UK plc agreed in 2012. The Scheme covers 13% (2017: 17%) of the Santander UK group’s employees, and is a funded defined
benefit scheme which is closed to new members.
The corporate trustee of the Scheme is Santander (UK) Group Pension Scheme Trustees Limited (the Trustee), a private limited company
incorporated in 1996 and a wholly-owned subsidiary of Santander UK Group Holdings plc. During 2017, the Trustee was a wholly-owned
subsidiary of Santander UK plc, but was transferred as part of the ring-fencing implementation. The principal duty of the Trustee is to act in
the best interests of the members of the Scheme. The Trustee board comprises six Directors selected by Santander UK plc, plus six
member-nominated Directors selected from eligible members who apply for the role.
The assets of the funded schemes including the Scheme are held independently of the Santander UK group’s assets in separate trustee
administered funds. Investment strategy across the sections of the Scheme remains under regular review. Investment decisions are
delegated by the Trustee to a common investment fund, managed by Santander (CF Trustee) Limited, a private limited company owned by
five Trustee directors, three appointed by Santander UK plc and two by the Trustee. The Santander (CF Trustee) Limited directors’
principal duty, within the investment powers delegated to them, is to act in the best interest of the members of the Scheme. Ultimate
responsibility for investment policy and strategy rests with the Trustee of the Scheme who is required under the Pensions Act 2004 to
prepare a statement of investment principles. The defined benefit pension schemes expose the Santander UK group to risks such as
investment risk, interest rate risk, longevity risk and inflation risk. The Santander UK group does not hold material insurance policies over
the defined benefit pension schemes, and has not entered into any significant transactions with them.
Formal actuarial valuations of the assets and liabilities of the defined benefit schemes are carried out on at least a triennial basis by
independent professionally-qualified actuaries and valued for accounting purposes at each balance sheet date. Each scheme’s trustee is
responsible for the actuarial valuations and in doing so considers, or relies in part on, a report of a third-party expert. The latest formal
actuarial valuation for the Scheme at 31 March 2016 was finalised in March 2017, with a deficit to be funded of £1,739m. The next triennial
funding valuation will be at 31 March 2019. Any funding surpluses can be recovered by Santander UK plc from the Scheme through
refunds as the Scheme is run off over time or could be used to pay for the cost of benefits which are accruing.
The total amount charged to the income statement was as follows:
Group
2018
£m
2017
£m
2016
£m
Net interest income (7) (5) (18)
Current service cost 41 31 33
Past service and GMP costs 41 1 1
Administration costs 8 8 8
83 35 24
On 26 October 2018, the High Court handed down a judgement concluding that defined benefit schemes should equalise pension
benefits for men and women in relation to GMP, and concluded on the methods that were appropriate. The estimated increase in
liabilities at the date of the judgement was £40m and is based on a number of assumptions and the actual impact may be different. This
has been reflected in the income statement and in the closing net accounting surplus of the Scheme.
The amounts recognised in other comprehensive income were as follows:
Group
2018
£m
2017
£m
2016
£m
Return on plan assets (excluding amounts included in net interest expense) 246 (435) (1,447)
Actuarial (gains)/losses arising from changes in demographic assumptions (56) (151) 30
Actuarial gains arising from experience adjustments 15 (11) (80)
Actuarial (gains)/losses arising from changes in financial assumptions (675) 700 2,025
Pension remeasurement (470) 103 528
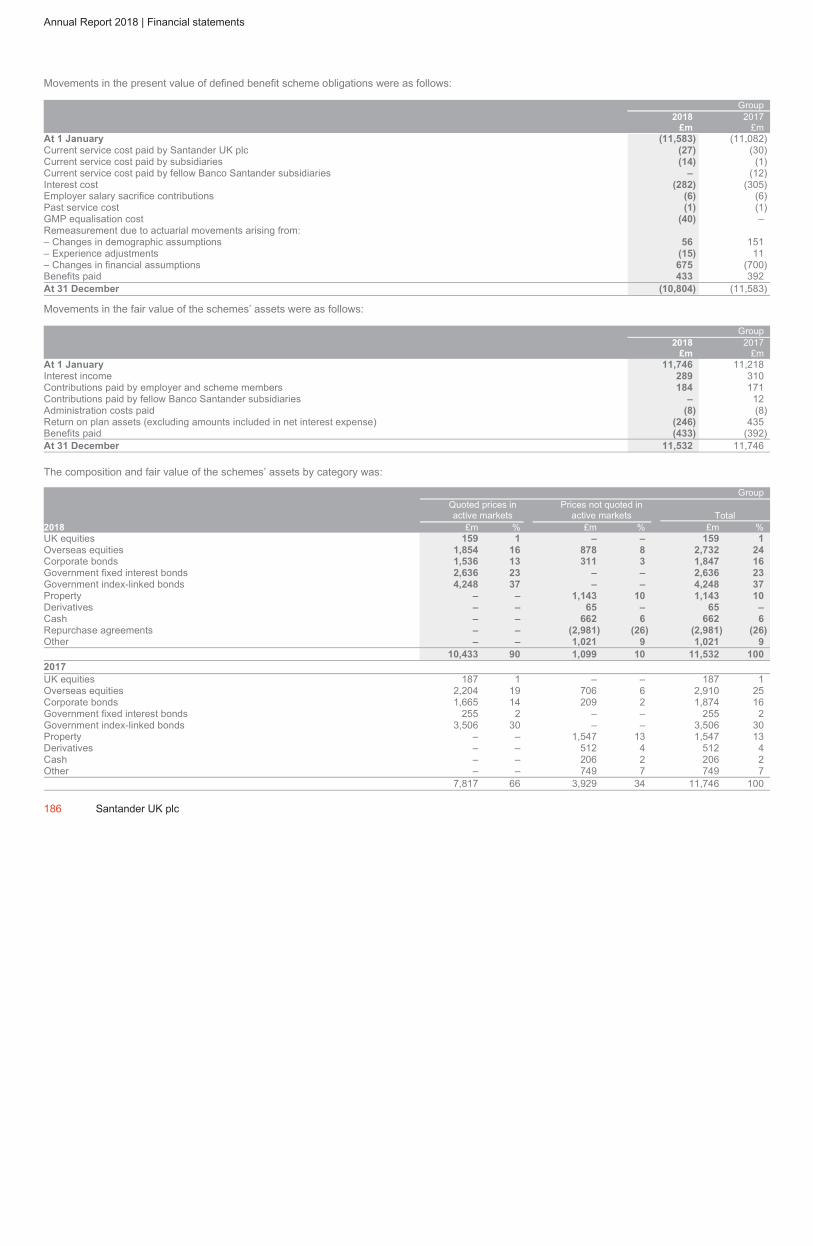
ˆ200G2Mlv!2VHZuZ6tŠ200G2Mlv!2VHZuZ6t
628340 TX 186SANTANDERFORM 20-F (SAN UK PL
03-Mar-2019 14:18 ESTHTMLON
Donnelley Financial EGV kumak0dc 7*ESS 0C
VDI-W7-PFL-105912.9.12.0
Page 1 of 1
Annual Report 2018 | Financial statements
Movements in the present value of defined benefit scheme obligations were as follows:
Group
2018
£m
2017
£m
At 1 January (11,583) (11,082)
Current service cost paid by Santander UK plc (27) (30)
Current service cost paid by subsidiaries (14) (1)
Current service cost paid by fellow Banco Santander subsidiaries – (12)
Interest cost (282) (305)
Employer salary sacrifice contributions (6) (6)
Past service cost (1) (1)
GMP equalisation cost (40) –
Remeasurement due to actuarial movements arising from:
– Changes in demographic assumptions 56 151
– Experience adjustments (15) 11
– Changes in financial assumptions 675 (700)
Benefits paid 433 392
At 31 December (10,804) (11,583)
Movements in the fair value of the schemes’ assets were as follows:
Group
2018
£m
2017
£m
At 1 January 11,746 11,218
Interest income 289 310
Contributions paid by employer and scheme members 184 171
Contributions paid by fellow Banco Santander subsidiaries – 12
Administration costs paid (8) (8)
Return on plan assets (excluding amounts included in net interest expense) (246) 435
Benefits paid (433) (392)
At 31 December 11,532 11,746
The composition and fair value of the schemes’ assets by category was:
Group
Quoted prices in
active markets
Prices not quoted in
active markets Total
2018 £m % £m % £m %
UK equities 159 1 – – 159 1
Overseas equities 1,854 16 878 8 2,732 24
Corporate bonds 1,536 13 311 3 1,847 16
Government fixed interest bonds 2,636 23 – – 2,636 23
Government index-linked bonds 4,248 37 – – 4,248 37
Property – – 1,143 10 1,143 10
Derivatives – – 65 – 65 –
Cash – – 662 6 662 6
Repurchase agreements – – (2,981) (26) (2,981) (26)
Other – – 1,021 9 1,021 9
10,433 90 1,099 10 11,532 100
2017
UK equities 187 1 – – 187 1
Overseas equities 2,204 19 706 6 2,910 25
Corporate bonds 1,665 14 209 2 1,874 16
Government fixed interest bonds 255 2 – – 255 2
Government index-linked bonds 3,506 30 – – 3,506 30
Property – – 1,547 13 1,547 13
Derivatives – – 512 4 512 4
Cash – – 206 2 206 2
Other – – 749 7 749 7
7,817 66 3,929 34 11,746 100
186 Santander UK plc

ˆ200G2Mlv!2Vfyq@gTŠ200G2Mlv!2Vfyq@gT
628340 TX 187SANTANDERFORM 20-F (SAN UK PL
03-Mar-2019 15:58 ESTHTMLON
Donnelley Financial EGV kumak0dc 5*ESS 0C
VDI-W7-PFL-105912.9.12.0
bar5
Page 1 of 1
> Notes to the financial statements
Santander UK plc 187
Scheme assets are stated at fair value based upon quoted prices in active markets with the exception of property funds, derivatives and
those classified under ‘Other’. The ‘Other’ category consists of asset-backed securities, annuities and funds (including private equity
funds). The property funds were valued using market valuations prepared by an independent expert. Investments in absolute return funds
that are included in the ‘Other’ category, and investments in foreign exchange, inflation, equity and interest rate derivatives that are
included in the ‘Derivatives’ category, were valued by investment managers by reference to market observable data. Private equity funds
were valued by reference to their latest published accounts whilst the insured annuities were valued by actuaries based on the liabilities
insured.
A strategy is in place to manage interest rate and inflation risk relating to the liabilities. In addition, the Scheme entered into an equity collar
in 2017 which was extended and resized in 2018. At 31 December 2018, the equity collar had a notional value of £1,795m (2017:
£2,000m). In addition, the level of interest rate hedging in the Scheme was increased, and the Scheme moved from using LIBOR-based
instruments to gilt-backed instruments, including through the use of total return swaps and repurchase agreements. At 31 December 2018,
repurchase agreements were entered into by the Scheme over an equivalent value of Government fixed interest and index-linked bonds
and have therefore been included in the table above. A strategy is also in place to manage currency risk.
The Santander UK group’s pension schemes did not directly hold any equity securities of the Company or any of its related parties at
31 December 2018 and 2017. The Santander UK group’s pension scheme assets do not include any property or other assets that are
occupied or used by the Santander UK group.
Funding
In March 2017, in compliance with the Pensions Act 2004, the Trustee and the Santander UK group agreed to a new recovery plan in
respect of the Scheme and schedule of contributions following the finalisation of the 31 March 2016 actuarial valuation. The funding target
for this actuarial valuation is for the Scheme to have sufficient assets to make payments to members in respect of the accrued benefits as
and when they fall due. In accordance with the terms of the Trustee agreement in place at the time, the Santander UK group contributed
£176m in 2018 (2017: £163m) to the Scheme, of which £123m (2017: £123m) was in respect of agreed deficit repair contributions. The
agreed schedule of the Santander UK group’s remaining contributions to the Scheme broadly comprises contributions of £119m each year
from 1 April 2017 increasing by 5% to 31 March 2026 plus contributions of £28m per annum increasing at 5% from 1 April 2021 to
31 March 2023 followed by £66m per annum increasing at 5% per annum from 1 April 2023 to 31 March 2026. In addition, the Santander
UK group has agreed to pay further contingent contributions should investment performance be worse than expected, or should the
funding position have fallen behind plan at the next formal actuarial valuation.
Actuarial assumptions
The principal actuarial assumptions used for the defined benefit schemes were:
Group
2018
%
2017
%
2016
%
To determine benefit obligations:
– Discount rate for scheme liabilities 2.9 2.5 2.8
– General price inflation 3.2 3.2 3.1
– General salary increase 1.0 1.0 1.0
– Expected rate of pension increase 2.9 2.9 2.9
Years Years Years
Longevity at 60 for current pensioners, on the valuation date:
– Males 27.3 27.4 27.8
– Females 30.1 30.1 30.3
Longevity at 60 for future pensioners currently aged 40, on the valuation date:
– Males 28.7 28.9 30.0
– Females 31.6 31.7 32.2

ˆ200G2Mlv!2XrVFMgmŠ200G2Mlv!2XrVFMgm
628340 TX 188SANTANDERFORM 20-F (SAN UK PL
03-Mar-2019 22:45 ESTHTMLON
Donnelley Financial EGV marik1dc 6*ESS 0C
VDI-W7-PFL-060212.9.12.0
Page 1 of 1
Annual Report 2018 | Financial statements
Discount rate for scheme liabilities
The rate used to discount the retirement benefit obligation is based on the annual yield at the balance sheet date of high quality corporate bonds on that
date. There are only a limited number of higher quality Sterling-denominated corporate bonds, particularly those that are longer-dated. Therefore, in order
to set a suitable discount rate, we need to construct a corporate bond yield curve. We consider a number of different data sources and methods of
projecting forward the corporate bond curve. When considering an appropriate assumption, we project forward the expected cash flows of the Scheme
and adopt a single equivalent cash flow weighted discount rate, subject to management judgement.
During 2018 we reduced the level of management adjustment to the discount rate, noting the expanded range of different models used by UK companies,
and the relatively higher discount rates being adopted. At 31 December 2018 this increased the discount rate applied and had a positive impact of £104m
on the accounting surplus.
General price inflation
Consistent with our discount rate methodology, we set the inflation assumption using the expected cash flows of the Scheme, fitting them to an inflation
curve to give a weighted average inflation assumption. We then deduct an inflation risk premium to reflect the compensation holders of fixed rate
instruments expect to receive for taking on the inflation risk. This premium is subject to a cap, to better reflect management’s view of inflation expectations.
During the year, the assumptions for setting the inflation risk premium were updated to reflect management’s current views of long term inflation. At
31 December 2018, this had a negative impact of £65m on the accounting surplus.
Expected rate of pension increase
During the year, the methodology for setting the expected rate of pension increases was changed to better represent the current expectations for inflation
volatility and the impact of caps and collars on pension increases. The revised pension increase assumption methodology uses a stochastic model, which
is calibrated to consider both the observed historical volatility term structure and derivative pricing. The model provides an improvement in estimate
because it allows for the likelihood that high or low inflation in one year feeds into inflation remaining high or low in the next year. At 31 December 2018
this had a negative impact of £85m on the accounting surplus.
Mortality assumptions
The mortality assumptions are based on an independent analysis of the Santander (UK) Group Pension Scheme’s actual mortality experience, carried out
as part of the triennial actuarial valuations, together with recent evidence from the Continuous Mortality Investigation Table ‘S2 Light’ mortality tables. An
allowance is then made for expected future improvements to life expectancy based on the Continuous Mortality Investigation Tables.
During 2018 we adopted the CMI 2017 projection model for future improvements in life expectancy with a long-term rate of future improvements to life
expectancy of 1.25% for male and female members. This model incorporates the latest available data on trends in life expectancy. At 31 December 2018,
this had a positive impact of £57m on the accounting surplus.
Actuarial assumption sensitivities
The sensitivity analyses below have been determined based on reasonably possible changes of the respective assumptions occurring at the end of the
reporting period, while holding all other assumptions constant.
Increase/(decrease)
Assumption Change in pension obligation at year-end from
2018
£m
2017
£m
Discount rate 25 bps increase (483) (550)
General price inflation 25 bps increase 350 365
General salary increase 25 bps increase n/a n/a
Mortality Each additional year of longevity assumed 335 367
The sensitivity analysis presented above may not be representative of the actual change in the defined benefit obligation as it is unlikely that the changes
in assumptions would occur in isolation of one another as some of the assumptions may be correlated. Furthermore, in presenting the sensitivity analysis,
the present value of the defined benefit obligation has been calculated using the projected unit credit method at the end of the reporting period, which is
the same method used to calculate the defined benefit obligation recognised in the balance sheet. There were no changes in the methods and
assumptions used in preparing the sensitivity analyses from prior years.
The benefits expected to be paid in each of the next five years, and in the aggregate for the five years thereafter are:
Year ending 31 December £m
2019 266
2020 269
2021 287
2022 309
2023 325
Five years ending 2028 1,903
The average duration of the defined benefit obligation at 31 December 2018 was 19.1 years (2017: 20.1 years).
188 Santander UK plc
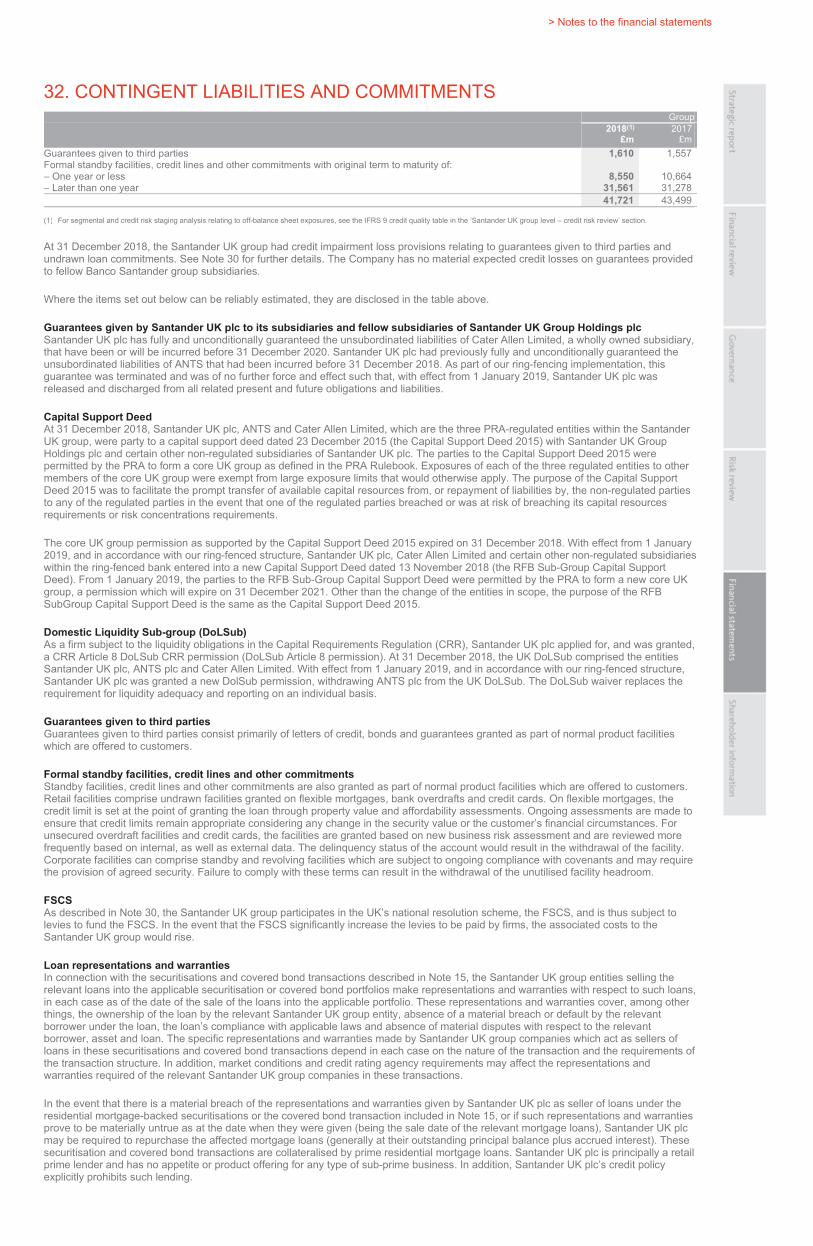
ˆ200G2Mlv!2Si3CHg_Š200G2Mlv!2Si3CHg_
628340 TX 189SANTANDERFORM 20-F (SAN UK PL
03-Mar-2019 07:56 ESTHTMLON
Donnelley Financial EGV dosss0dc 4*ESS 0C
VDI-W7-PFL-136512.9.12.0
bar5
Page 1 of 2
> Notes to the financial statements
32. CONTINGENT LIABILITIES AND COMMITMENTS
Group
2018(1)
£m
2017
£m
Guarantees given to third parties 1,610 1,557
Formal standby facilities, credit lines and other commitments with original term to maturity of:
– One year or less 8,550 10,664
– Later than one year 31,561 31,278
41,721 43,499
(1) For segmental and credit risk staging analysis relating to off-balance sheet exposures, see the IFRS 9 credit quality table in the ‘Santander UK group level – credit risk review’ section.
At 31 December 2018, the Santander UK group had credit impairment loss provisions relating to guarantees given to third parties and
undrawn loan commitments. See Note 30 for further details. The Company has no material expected credit losses on guarantees provided
to fellow Banco Santander group subsidiaries.
Where the items set out below can be reliably estimated, they are disclosed in the table above.
Guarantees given by Santander UK plc to its subsidiaries and fellow subsidiaries of Santander UK Group Holdings plc
Santander UK plc has fully and unconditionally guaranteed the unsubordinated liabilities of Cater Allen Limited, a wholly owned subsidiary,
that have been or will be incurred before 31 December 2020. Santander UK plc had previously fully and unconditionally guaranteed the
unsubordinated liabilities of ANTS that had been incurred before 31 December 2018. As part of our ring-fencing implementation, this
guarantee was terminated and was of no further force and effect such that, with effect from 1 January 2019, Santander UK plc was
released and discharged from all related present and future obligations and liabilities.
Capital Support Deed
At 31 December 2018, Santander UK plc, ANTS and Cater Allen Limited, which are the three PRA-regulated entities within the Santander
UK group, were party to a capital support deed dated 23 December 2015 (the Capital Support Deed 2015) with Santander UK Group
Holdings plc and certain other non-regulated subsidiaries of Santander UK plc. The parties to the Capital Support Deed 2015 were
permitted by the PRA to form a core UK group as defined in the PRA Rulebook. Exposures of each of the three regulated entities to other
members of the core UK group were exempt from large exposure limits that would otherwise apply. The purpose of the Capital Support
Deed 2015 was to facilitate the prompt transfer of available capital resources from, or repayment of liabilities by, the non-regulated parties
to any of the regulated parties in the event that one of the regulated parties breached or was at risk of breaching its capital resources
requirements or risk concentrations requirements.
The core UK group permission as supported by the Capital Support Deed 2015 expired on 31 December 2018. With effect from 1 January
2019, and in accordance with our ring-fenced structure, Santander UK plc, Cater Allen Limited and certain other non-regulated subsidiaries
within the ring-fenced bank entered into a new Capital Support Deed dated 13 November 2018 (the RFB Sub-Group Capital Support
Deed). From 1 January 2019, the parties to the RFB Sub-Group Capital Support Deed were permitted by the PRA to form a new core UK
group, a permission which will expire on 31 December 2021. Other than the change of the entities in scope, the purpose of the RFB
SubGroup Capital Support Deed is the same as the Capital Support Deed 2015.
Domestic Liquidity Sub-group (DoLSub)
As a firm subject to the liquidity obligations in the Capital Requirements Regulation (CRR), Santander UK plc applied for, and was granted,
a CRR Article 8 DoLSub CRR permission (DoLSub Article 8 permission). At 31 December 2018, the UK DoLSub comprised the entities
Santander UK plc, ANTS plc and Cater Allen Limited. With effect from 1 January 2019, and in accordance with our ring-fenced structure,
Santander UK plc was granted a new DolSub permission, withdrawing ANTS plc from the UK DoLSub. The DoLSub waiver replaces the
requirement for liquidity adequacy and reporting on an individual basis.
Guarantees given to third parties
Guarantees given to third parties consist primarily of letters of credit, bonds and guarantees granted as part of normal product facilities
which are offered to customers.
Formal standby facilities, credit lines and other commitments
Standby facilities, credit lines and other commitments are also granted as part of normal product facilities which are offered to customers.
Retail facilities comprise undrawn facilities granted on flexible mortgages, bank overdrafts and credit cards. On flexible mortgages, the
credit limit is set at the point of granting the loan through property value and affordability assessments. Ongoing assessments are made to
ensure that credit limits remain appropriate considering any change in the security value or the customer’s financial circumstances. For
unsecured overdraft facilities and credit cards, the facilities are granted based on new business risk assessment and are reviewed more
frequently based on internal, as well as external data. The delinquency status of the account would result in the withdrawal of the facility.
Corporate facilities can comprise standby and revolving facilities which are subject to ongoing compliance with covenants and may require
the provision of agreed security. Failure to comply with these terms can result in the withdrawal of the unutilised facility headroom.
FSCS
As described in Note 30, the Santander UK group participates in the UK’s national resolution scheme, the FSCS, and is thus subject to
levies to fund the FSCS. In the event that the FSCS significantly increase the levies to be paid by firms, the associated costs to the
Santander UK group would rise.
Loan representations and warranties
In connection with the securitisations and covered bond transactions described in Note 15, the Santander UK group entities selling the
relevant loans into the applicable securitisation or covered bond portfolios make representations and warranties with respect to such loans,
in each case as of the date of the sale of the loans into the applicable portfolio. These representations and warranties cover, among other
things, the ownership of the loan by the relevant Santander UK group entity, absence of a material breach or default by the relevant
borrower under the loan, the loan’s compliance with applicable laws and absence of material disputes with respect to the relevant
borrower, asset and loan. The specific representations and warranties made by Santander UK group companies which act as sellers of
loans in these securitisations and covered bond transactions depend in each case on the nature of the transaction and the requirements of
the transaction structure. In addition, market conditions and credit rating agency requirements may affect the representations and
warranties required of the relevant Santander UK group companies in these transactions.
In the event that there is a material breach of the representations and warranties given by Santander UK plc as seller of loans under the
residential mortgage-backed securitisations or the covered bond transaction included in Note 15, or if such representations and warranties
prove to be materially untrue as at the date when they were given (being the sale date of the relevant mortgage loans), Santander UK plc
may be required to repurchase the affected mortgage loans (generally at their outstanding principal balance plus accrued interest). These
securitisation and covered bond transactions are collateralised by prime residential mortgage loans. Santander UK plc is principally a retail
prime lender and has no appetite or product offering for any type of sub-prime business. In addition, Santander UK plc’s credit policy
explicitly prohibits such lending.

ˆ200G2Mlv!2Si3CHg_Š200G2Mlv!2Si3CHg_
628340 TX 189SANTANDERFORM 20-F (SAN UK PL
03-Mar-2019 07:56 ESTHTMLON
Donnelley Financial EGV dosss0dc 4*ESS 0C
VDI-W7-PFL-136512.9.12.0
bar5
Page 2 of 2
Santander UK plc 189
ˆ200G2Mlv!2R2Xj8glŠ200G2Mlv!2R2Xj8gl
628340 TX 190SANTANDERFORM 20-F (SAN UK PL
03-Mar-2019 04:27 ESTHTMLON
Donnelley Financial EGV sivam0dc 2*ESS 0C
VDI-W7-PFL-099312.9.12.0
Page 1 of 1
Annual Report 2018 | Financial statements
Similarly, under the auto loan securitisations in Note 15, in the event that there is a breach or inaccuracy in respect of a representation or warranty relating
to the loans, the relevant Santander UK group entity who sold the auto loans into the securitisation portfolio will be required to repurchase such loans from
the structure (also at their outstanding principal balance plus accrued interest). In addition to breaches of representation and warranties, under the auto
loan securitisations, the seller may also have a repurchase obligation if certain portfolio limits are breached (which include, amongst other things, limits as
to the size of a loan given to an individual customer, LTV ratio, average term to maturity and average seasoning). In the case of a repurchase of a loan
from the relevant securitisation or covered bond portfolio, the Santander UK group may bear any subsequent credit loss on such loan. The Santander UK
group manages and monitors its securitisation and covered bond activities closely to minimise potential claims.
Other legal actions and regulatory matters
Santander UK engages in discussion, and co-operates, with the FCA, PRA and other regulators and government agencies in various jurisdictions in their
supervision and review of Santander UK including reviews exercised under statutory powers, regarding its interaction with past and present customers,
both as part of general thematic work and in relation to specific products, services and activities. During the ordinary course of business, Santander UK is
also subject to complaints and threatened legal proceedings brought by or on behalf of current or former employees, customers, investors or other third
parties, in addition to legal and regulatory reviews, challenges and tax or enforcement investigations or proceedings in various jurisdictions. All such
matters are assessed periodically to determine the likelihood of Santander UK incurring a liability.
In those instances where it is concluded that it is not yet probable that a quantifiable payment will be made, for example because the facts are unclear or
further time is required to fully assess the merits of the case or to reasonably quantify the expected payment, no provision is made. In addition where it is
not currently practicable to estimate the possible financial effect of these matters, no provision is made.
Payment Protection Insurance
Note 30 details our provisions including those in relation to PPI. In relation to a specific PPI portfolio of complaints, a legal dispute regarding allocation of
liability is in its early stages. There are factual issues to be resolved which may have legal consequences including in relation to liability. These issues
create uncertainties which mean that it is difficult to reliably predict the resolution of the matter including timing or the significance of the possible impact.
The PPI provision includes our best estimate of Santander UK’s liability to the specific portfolio. Further information has not been provided on the basis
that it would be seriously prejudicial.
German dividend tax arbitrage transactions
Santander UK plc, ANTS and Cater Allen International Limited (all subsidiaries of Santander UK Group Holdings plc) are currently under investigation by
the Cologne Criminal Prosecution Office and the German Federal Tax Office in relation to historical involvement in German dividend tax arbitrage
transactions (known as cum/ex transactions). We are cooperating with the German authorities and are conducting our own internal investigation into the
matters in question. There are factual issues to be resolved which may have legal consequences including potentially material financial penalties. These
issues create uncertainties which mean that it is difficult to predict with reasonable certainty the resolution of the matter including timing or the significance
of the possible impact.
Consumer credit
The Santander UK group’s unsecured lending and other consumer credit business is governed by consumer credit law and related regulations, including
the CCA. Claims brought by customers in relation to potential breaches of these requirements could result in costs to the Santander UK group where such
potential breaches are not found to be de minimis. The CCA includes very detailed and prescriptive requirements for lenders, including in relation to post
contractual information.
As described in Note 30, other provisions includes an amount of £58m arising from a systems related historical issue identified by Santander UK, relating
to compliance with certain requirements of the CCA. This provision has been based on detailed reviews of relevant systems related to consumer credit
business operations, supported by external legal and regulatory advice, but these reviews are not yet complete, such that the approach and timing to any
remediation has not yet been finalised. As a result, the actual cost of customer compensation could differ materially from the amount provided, and it is not
currently practicable to provide a reliable estimate of the amount or timing of any additional financial effects.
Taxation
The Santander UK group engages in discussion, and co-operates, with HM Revenue & Customs in their oversight of the Santander UK group’s tax
matters. The Santander UK group adopted the UK’s Code of Practice on Taxation for Banks in 2010.
Other
On 2 November 2015, Visa Europe Ltd agreed to sell 100% of its share capital to Visa Inc. The deal closed on 21 June 2016. As a member and
shareholder of Visa Europe Ltd, Santander UK received upfront consideration made up of cash and convertible preferred stock. Additional deferred cash
consideration is also payable following the third anniversary of closing. Conversion of the preferred stock into Class A Common Stock of Visa Inc. depends
on the outcome of litigation against Visa involving UK & Ireland (UK&I) multilateral interchange fees (MIFs). Santander UK and certain other UK&I banks
have agreed to indemnify Visa Inc. in the event that the preferred stock is insufficient to meet the costs of this litigation. Visa Inc. has recourse to this
indemnity once more than €1bn of losses relating to UK&I MIFs have arisen or once the total value of the preferred stock issued to UK&I banks on closing
has been reduced to nil. In valuing the preferred stock, Santander UK makes adjustments for illiquidity and the potential for changes in conversion. Visa
Inc. may have recourse to a general indemnity in place under Visa Europe Operating Regulations for damages not satisfied through the above
mechanism.
As part of the sale of subsidiaries, and as is normal in such circumstances, Santander UK has given warranties and indemnities to the purchasers.
Obligations under stock borrowing and lending agreements
Obligations under stock borrowing and lending agreements represent contractual commitments to return stock borrowed. These obligations are offset by a
contractual right to receive stock under other contractual agreements. See Note 37.
190 Santander UK plc
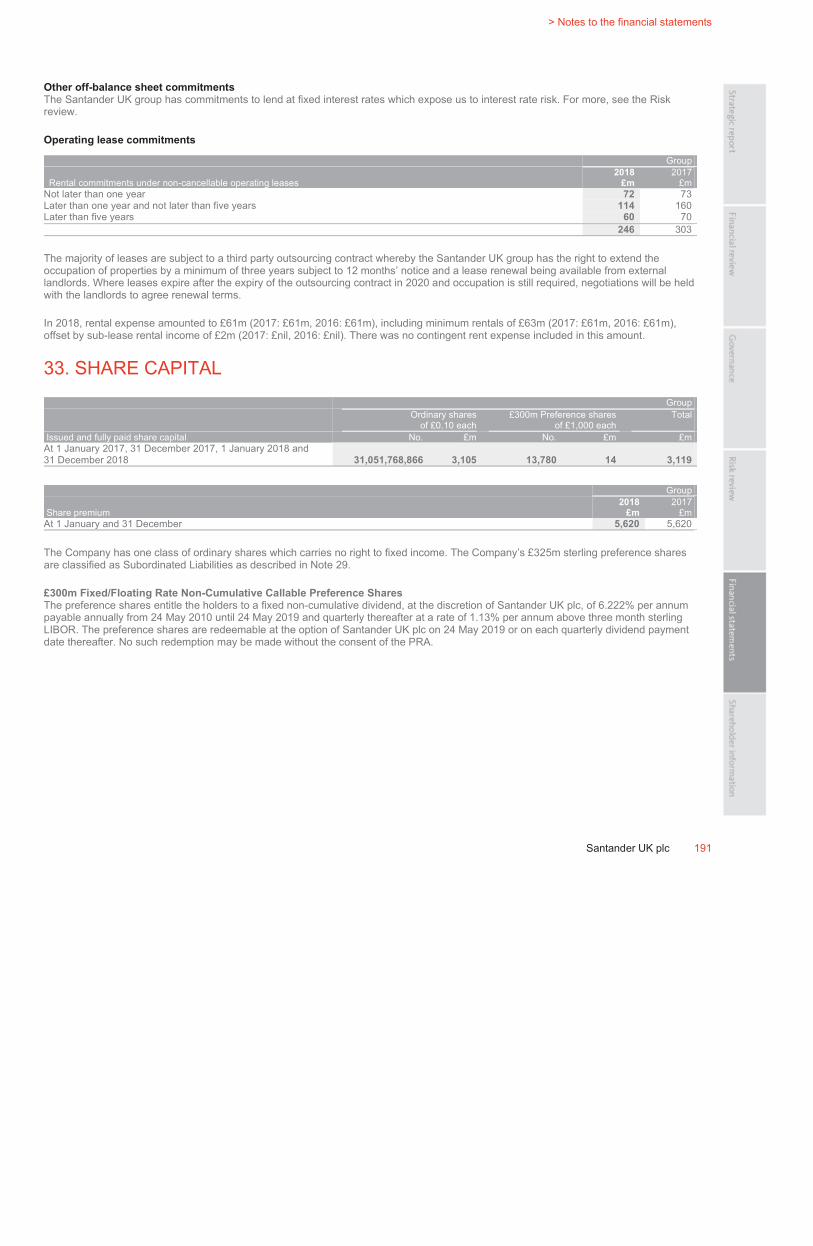
ˆ200G2Mlv!2XbLnlg[Š200G2Mlv!2XbLnlg[
628340 TX 191SANTANDERFORM 20-F (SAN UK PL
03-Mar-2019 22:26 ESTHTMLON
Donnelley Financial EGV shanv1dc 5*ESS 0C
VDI-W7-PFL-160412.9.12.0
bar5
Page 1 of 1
> Notes to the financial statements
Santander UK plc 191
Other off-balance sheet commitments
The Santander UK group has commitments to lend at fixed interest rates which expose us to interest rate risk. For more, see the Risk
review.
Operating lease commitments
Group
Rental commitments under non-cancellable operating leases
2018
£m
2017
£m
Not later than one year 72 73
Later than one year and not later than five years 114 160
Later than five years 60 70
246 303
The majority of leases are subject to a third party outsourcing contract whereby the Santander UK group has the right to extend the
occupation of properties by a minimum of three years subject to 12 months’ notice and a lease renewal being available from external
landlords. Where leases expire after the expiry of the outsourcing contract in 2020 and occupation is still required, negotiations will be held
with the landlords to agree renewal terms.
In 2018, rental expense amounted to £61m (2017: £61m, 2016: £61m), including minimum rentals of £63m (2017: £61m, 2016: £61m),
offset by sub-lease rental income of £2m (2017: £nil, 2016: £nil). There was no contingent rent expense included in this amount.
33. SHARE CAPITAL
Group
Ordinary shares
of £0.10 each
£300m Preference shares
of £1,000 each
Total
Issued and fully paid share capital No. £m No. £m £m
At 1 January 2017, 31 December 2017, 1 January 2018 and
31 December 2018 31,051,768,866 3,105 13,780 14 3,119
Group
Share premium
2018
£m
2017
£m
At 1 January and 31 December 5,620 5,620
The Company has one class of ordinary shares which carries no right to fixed income. The Company’s £325m sterling preference shares
are classified as Subordinated Liabilities as described in Note 29.
£300m Fixed/Floating Rate Non-Cumulative Callable Preference Shares
The preference shares entitle the holders to a fixed non-cumulative dividend, at the discretion of Santander UK plc, of 6.222% per annum
payable annually from 24 May 2010 until 24 May 2019 and quarterly thereafter at a rate of 1.13% per annum above three month sterling
LIBOR. The preference shares are redeemable at the option of Santander UK plc on 24 May 2019 or on each quarterly dividend payment
date thereafter. No such redemption may be made without the consent of the PRA.

ˆ200G2Mlv!2R2bG6gÆŠ200G2Mlv!2R2bG6g˘
628340 TX 192SANTANDERFORM 20-F (SAN UK PL
03-Mar-2019 04:28 ESTHTMLON
Donnelley Financial EGV sivam0dc 2*ESS 0C
VDI-W7-PFL-099312.9.12.0
Page 1 of 1
Annual Report 2018 | Financial statements
34. OTHER EQUITY INSTRUMENTS
Group
Initial interest rate
% First call date
2018
£m
2017
£m
£300m Step-up Callable Perpetual Reserve Capital Instruments 7.037 February 2026 235 235
AT1 securities:
– £500m Perpetual Capital Securities 6.75 June 2024 496 496
– £750m Perpetual Capital Securities 7.375 June 2022 750 750
– £300m Perpetual Capital Securities 7.60 December 2019 300 300
– £500m Perpetual Capital Securities 6.475 June 2019 210 500
1,991 2,281
Step-up Callable Perpetual Reserve Capital Instruments
These instruments are redeemable by Santander UK plc on 14 February 2026 or on any coupon payment date thereafter, subject to the prior approval of
the PRA. They are perpetual and pay interest annually. The coupon rate resets every five years, based on the UK five-year benchmark gilt rate. Interest
payments may be deferred by Santander UK plc. The instruments are not redeemable at the option of the holders and the holders do not have any rights
against other Santander UK group companies.
AT1 securities
The AT1 securities issued by the Company were subscribed by its immediate parent company, Santander UK Group Holdings plc, meet the CRD IV AT1
rules and are fully recognised as AT1 capital. The securities are perpetual and pay a distribution on 24 March, June, September and December. At each
distribution payment date, the Company can decide whether to pay the distribution, which is non-cumulative, in whole or in part. The distribution rate
resets every five years based on prevailing 5 year sterling mid swap rates. The securities will be automatically written down and the investors will lose their
entire investment in the securities should the CET1 capital ratio of the Santander UK prudential consolidation group fall below 7%. They are redeemable at
the option of the Company on their first call date or on any reset date thereafter in the cases of the 6.75% and 7.375% Perpetual Capital Securities, and
on any distribution payment date thereafter in the cases of the 7.60% and 6.475% Perpetual Capital Securities. No such redemption may be made without
the consent of the PRA.
During 2018, as part of a capital management exercise, Santander UK plc purchased and redeemed 58% of the 6.475% Perpetual Capital securities.
35. NON-CONTROLLING INTERESTS
2018
£m
2017
£m
PSA Finance UK Limited 151 152
151 152
PSA Finance UK Limited is the only subsidiary in the Santander UK group that gives rise to significant non-controlling interests. See Note 21 for
summarised financial information of PSA Finance UK Limited.
192 Santander UK plc

ˆ200G2Mlv!2Xd=63gÀŠ200G2Mlv!2Xd=63g
628340 TX 193SANTANDERFORM 20-F (SAN UK PL
03-Mar-2019 22:28 ESTHTMLON
Donnelley Financial EGV shanv1dc 9*ESS 0C
VDI-W7-PFL-160412.9.12.0
bar5
Page 1 of 1
> Notes to the financial statements
Santander UK plc 193
36. CHANGES IN LIABILITIES ARISING FROM FINANCING ACTIVITIES
The table below shows the changes in liabilities arising from financing activities.
Group
2018 2017
Balance sheet line item Balance sheet line item
Debt
securities Subordinated Other equity Dividends
Debt
securities Subordinated Other equity Dividends
in issue liabilities instruments paid Total in issue liabilities instruments paid Total
£m £m £m £m £m £m £m £m £m £m
At 1 January 42,633 3,793 2,281 – 48,707 50,346 4,303 1,785 – 56,434
Cash flows from
financing activities 4,615 (277) (290) (1,318) 2,730 (7,081) (52) 496 (1,000) (7,637)
Cash flows from
operating activities (2,522) 69 – – (2,453) 115 254 – – 369
Non-cash changes:
– Unrealised foreign
exchange 1,371 149 – – 1,520 (255) (235) – – (490)
– Other changes 595 (133) – 1,318 1,780 (492) (477) – 1,000 31
At 31 December 46,692 3,601 1,991 – 52,284 42,633 3,793 2,281 – 48,707
37. ASSETS CHARGED AS SECURITY FOR LIABILITIES AND
COLLATERAL ACCEPTED AS SECURITY FOR ASSETS
The following transactions are conducted under terms that are usual and customary to collateralised transactions including, where
relevant, standard securities lending and repurchase agreements.
a) Assets charged as security for liabilities
The financial assets below are analysed between those assets accounted for on-balance sheet and off-balance sheet.
Group
2018
£m
2017
£m
On-balance sheet:
Cash and balances at central banks 1,080 1,010
Trading assets – 17,092
Loans and advances to customers – securitisations and covered bonds (See Note 15) 35,694 35,421
Loans and advances to customers – other 15,175 15,078
Loans and advances to banks 218 105
Other financial assets at amortised cost 3,763
Financial assets at fair value through other comprehensive income 5,825
Financial investments 6,755
Total on-balance sheet 61,755 75,461
Total off-balance sheet 15,220 33,013

ˆ200G2Mlv!2VVgJmgŠ200G2Mlv!2VVgJmg´
628340 TX 194SANTANDERFORM 20-F (SAN UK PL
03-Mar-2019 14:57 ESTHTMLON
Donnelley Financial EGV kumak0dc 3*ESS 0C
VDI-W7-PFL-105912.9.12.0
Page 1 of 1
Annual Report 2018 | Financial statements
The Santander UK group provides assets as collateral in the following areas of the business.
Sale and repurchase agreements
The Santander UK group enters into sale and repurchase agreements and similar transactions of equity and debt securities, which are accounted for as
secured borrowings. Upon entering into such transactions, the Santander UK group provides collateral in excess of the borrowed amount. The carrying
amount of assets that were so provided at 31 December 2018 was £17,485m (2017: £34,310m), of which £2,383m (2017: £2,931m) was classified within
‘Loans and advances to customers – securitisations and covered bonds’ in the table above.
Securitisations and covered bonds
As described in Note 15, Santander UK plc and certain of its subsidiaries issue securitisations and covered bonds. At 31 December 2018, there were
£36,195m (2017: £36,512m) of gross assets in these secured programmes and £501m (2017: £1,091m) of these related to internally retained issuances
and were available for use as collateral for liquidity purposes in the future.
At 31 December 2018, a total of £4,039m (2017: £4,359m) of notes issued under securitisation and covered bond programmes had been retained
internally, a proportion of which had been used as collateral for raising funds via third party bilateral secured funding transactions, which totalled £1,834m
at 31 December 2018 (2017: £1,834m), or for use as collateral for liquidity purposes in the future.
Stock borrowing and lending agreements
Asset balances under stock borrowing and lending agreements represent stock lent by the Santander UK group. These balances amounted to £24,714m
at 31 December 2018 (2017: £38,016m) and are offset by contractual commitments to return stock borrowed or cash received.
Derivatives business
In addition to the arrangements described, collateral is also provided in the normal course of derivative business to counterparties. At 31 December 2018,
£1,465m (2017: £3,658m) of such collateral in the form of cash had been provided by the Santander UK group and is included in the table.
b) Collateral accepted as security for assets
The collateral held as security for assets, analysed between those liabilities accounted for on balance sheet and off-balance sheet, was:
Group
2018
£m
2017
£m
On-balance sheet:
Trading liabilities – 1,911
Deposits by customers – 8
Deposits by banks 4,048 1,760
Total on-balance sheet 4,048 3,679
Total off-balance sheet 23,236 38,655
Purchase and resale agreements
The Santander UK group also enters into purchase and resale agreements and similar transactions of equity and debt securities, which are accounted for
as collateralised loans. Upon entering into such transactions, the Santander UK group receives collateral in excess of the loan amount. The level of
collateral held is monitored daily and if required, further calls are made to ensure the market values of collateral remains at least equal to the loan balance.
The subsidiaries are permitted to sell or repledge the collateral held in the absence of default. At 31 December 2018, the fair value of such collateral
received was £15,728m (2017: £16,356m). Of the collateral received, almost all was sold or repledged. The subsidiaries have an obligation to return
collateral that they have sold or pledged.
Stock borrowing and lending agreements
Obligations representing contractual commitments to return stock borrowed by the Santander UK group amounted to £7,508m at 31 December 2018
(2017: £22,299m) and are offset by a contractual right to receive stock lent.
Derivatives business
In addition to the arrangements described, collateral is also received from counterparties in the normal course of derivative business. At 31 December
2018, £4,048m (2017: £3,679m) of such collateral in the form of cash had been received by the Santander UK group and is included in the table.
Lending activities
In addition to the collateral held as security for assets, the Santander UK group may obtain a charge over a customer’s property in connection with its
lending activities. Details of these arrangements are set out in the ‘Credit risk’ section of the Risk review.
194 Santander UK plc
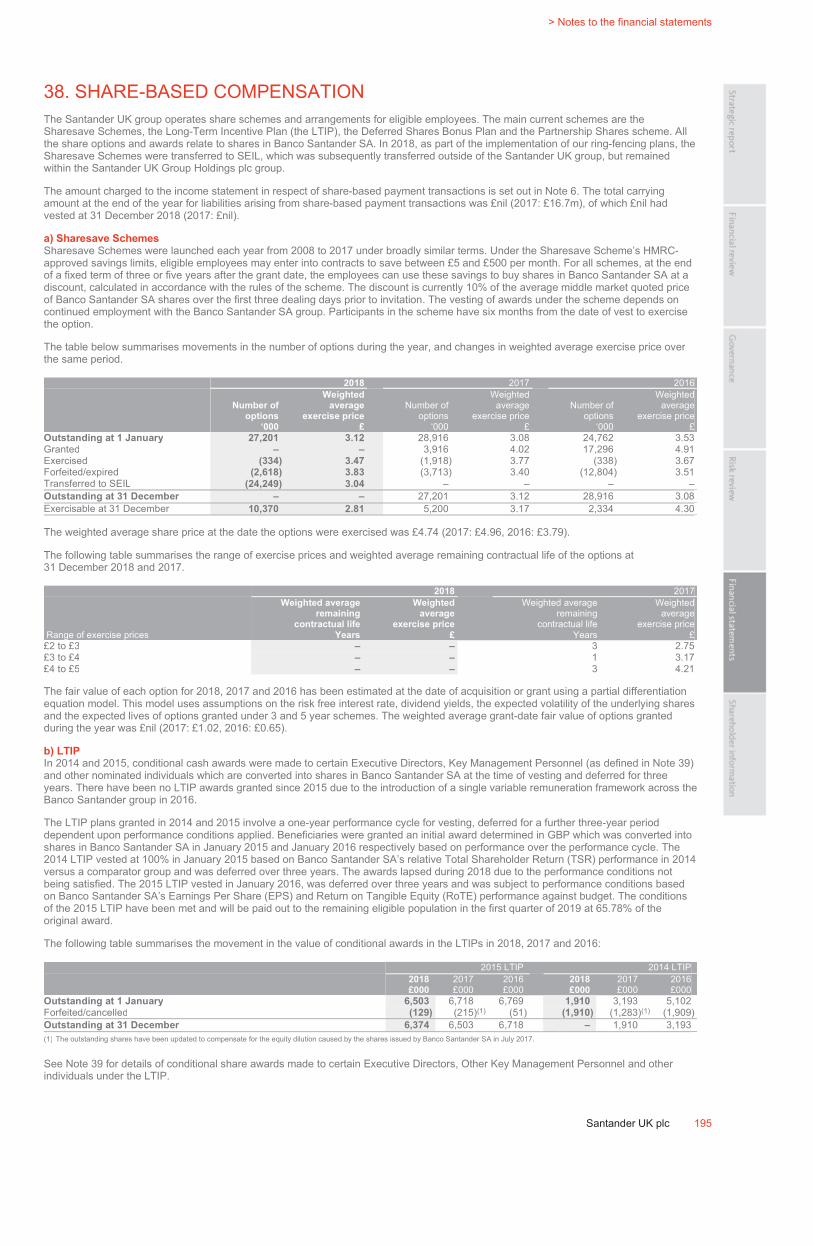
ˆ200G2Mlv!2Xi=bxg_Š200G2Mlv!2Xi=bxg_
628340 TX 195SANTANDERFORM 20-F (SAN UK PL
03-Mar-2019 22:37 ESTHTMLON
Donnelley Financial EGV shanv1dc 8*ESS 0C
VDI-W7-PFL-160412.9.12.0
bar5
Page 1 of 1
> Notes to the financial statements
Santander UK plc 195
38. SHARE-BASED COMPENSATION
The Santander UK group operates share schemes and arrangements for eligible employees. The main current schemes are the
Sharesave Schemes, the Long-Term Incentive Plan (the LTIP), the Deferred Shares Bonus Plan and the Partnership Shares scheme. All
the share options and awards relate to shares in Banco Santander SA. In 2018, as part of the implementation of our ring-fencing plans, the
Sharesave Schemes were transferred to SEIL, which was subsequently transferred outside of the Santander UK group, but remained
within the Santander UK Group Holdings plc group.
The amount charged to the income statement in respect of share-based payment transactions is set out in Note 6. The total carrying
amount at the end of the year for liabilities arising from share-based payment transactions was £nil (2017: £16.7m), of which £nil had
vested at 31 December 2018 (2017: £nil).
a) Sharesave Schemes
Sharesave Schemes were launched each year from 2008 to 2017 under broadly similar terms. Under the Sharesave Scheme’s HMRC-
approved savings limits, eligible employees may enter into contracts to save between £5 and £500 per month. For all schemes, at the end
of a fixed term of three or five years after the grant date, the employees can use these savings to buy shares in Banco Santander SA at a
discount, calculated in accordance with the rules of the scheme. The discount is currently 10% of the average middle market quoted price
of Banco Santander SA shares over the first three dealing days prior to invitation. The vesting of awards under the scheme depends on
continued employment with the Banco Santander SA group. Participants in the scheme have six months from the date of vest to exercise
the option.
The table below summarises movements in the number of options during the year, and changes in weighted average exercise price over
the same period.
2018 2017 2016
Number of
options
‘000
Weighted
average
exercise price
£
Number of
options
‘000
Weighted
average
exercise price
£
Number of
options
‘000
Weighted
average
exercise price
£
Outstanding at 1 January 27,201 3.12 28,916 3.08 24,762 3.53
Granted – – 3,916 4.02 17,296 4.91
Exercised (334) 3.47 (1,918) 3.77 (338) 3.67
Forfeited/expired (2,618) 3.83 (3,713) 3.40 (12,804) 3.51
Transferred to SEIL (24,249) 3.04 – – – –
Outstanding at 31 December – – 27,201 3.12 28,916 3.08
Exercisable at 31 December 10,370 2.81 5,200 3.17 2,334 4.30
The weighted average share price at the date the options were exercised was £4.74 (2017: £4.96, 2016: £3.79).
The following table summarises the range of exercise prices and weighted average remaining contractual life of the options at
31 December 2018 and 2017.
2018 2017
Range of exercise prices
Weighted average
remaining
contractual life
Years
Weighted
average
exercise price
£
Weighted average
remaining
contractual life
Years
Weighted
average
exercise price
£
£2 to £3 – – 3 2.75
£3 to £4 – – 1 3.17
£4 to £5 – – 3 4.21
The fair value of each option for 2018, 2017 and 2016 has been estimated at the date of acquisition or grant using a partial differentiation
equation model. This model uses assumptions on the risk free interest rate, dividend yields, the expected volatility of the underlying shares
and the expected lives of options granted under 3 and 5 year schemes. The weighted average grant-date fair value of options granted
during the year was £nil (2017: £1.02, 2016: £0.65).
b) LTIP
In 2014 and 2015, conditional cash awards were made to certain Executive Directors, Key Management Personnel (as defined in Note 39)
and other nominated individuals which are converted into shares in Banco Santander SA at the time of vesting and deferred for three
years. There have been no LTIP awards granted since 2015 due to the introduction of a single variable remuneration framework across the
Banco Santander group in 2016.
The LTIP plans granted in 2014 and 2015 involve a one-year performance cycle for vesting, deferred for a further three-year period
dependent upon performance conditions applied. Beneficiaries were granted an initial award determined in GBP which was converted into
shares in Banco Santander SA in January 2015 and January 2016 respectively based on performance over the performance cycle. The
2014 LTIP vested at 100% in January 2015 based on Banco Santander SA’s relative Total Shareholder Return (TSR) performance in 2014
versus a comparator group and was deferred over three years. The awards lapsed during 2018 due to the performance conditions not
being satisfied. The 2015 LTIP vested in January 2016, was deferred over three years and was subject to performance conditions based
on Banco Santander SA’s Earnings Per Share (EPS) and Return on Tangible Equity (RoTE) performance against budget. The conditions
of the 2015 LTIP have been met and will be paid out to the remaining eligible population in the first quarter of 2019 at 65.78% of the
original award.
The following table summarises the movement in the value of conditional awards in the LTIPs in 2018, 2017 and 2016:
2015 LTIP 2014 LTIP
2018
£000
2017
£000
2016
£000
2018
£000
2017
£000
2016
£000
Outstanding at 1 January 6,503 6,718 6,769 1,910 3,193 5,102
Forfeited/cancelled (129) (215)(1) (51) (1,910) (1,283)(1) (1,909)
Outstanding at 31 December 6,374 6,503 6,718 – 1,910 3,193
(1) The outstanding shares have been updated to compensate for the equity dilution caused by the shares issued by Banco Santander SA in July 2017.
See Note 39 for details of conditional share awards made to certain Executive Directors, Other Key Management Personnel and other
individuals under the LTIP.
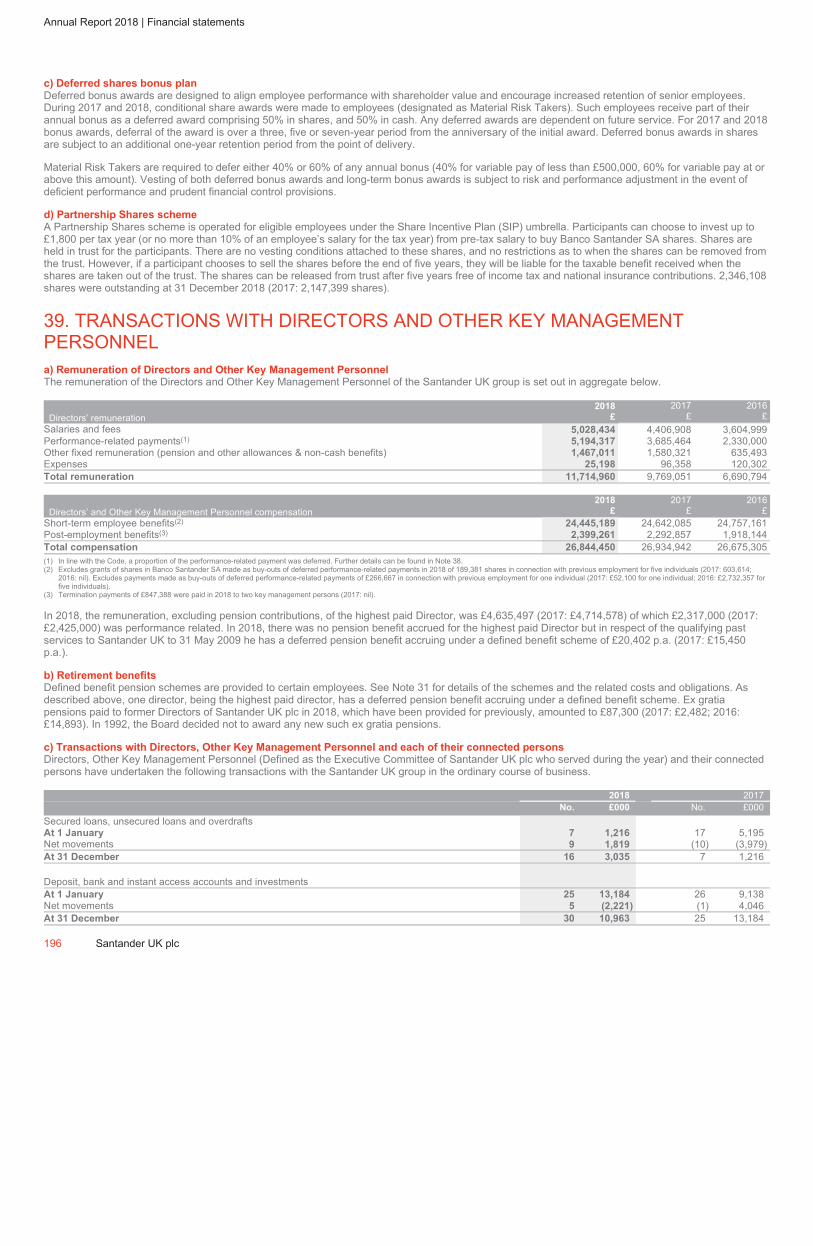
ˆ200G2Mlv!3&TqSTg5Š200G2Mlv!3&TqSTg5
628340 TX 196SANTANDERFORM 20-F (SAN UK PL
08-Mar-2019 12:39 ESTHTMLON
Donnelley Financial EGV corng0ln 8*ESS 0C
VDI-W7-PFL-091912.9.12.0
Page 1 of 1
Annual Report 2018 | Financial statements
c) Deferred shares bonus plan
Deferred bonus awards are designed to align employee performance with shareholder value and encourage increased retention of senior employees.
During 2017 and 2018, conditional share awards were made to employees (designated as Material Risk Takers). Such employees receive part of their
annual bonus as a deferred award comprising 50% in shares, and 50% in cash. Any deferred awards are dependent on future service. For 2017 and 2018
bonus awards, deferral of the award is over a three, five or seven-year period from the anniversary of the initial award. Deferred bonus awards in shares
are subject to an additional one-year retention period from the point of delivery.
Material Risk Takers are required to defer either 40% or 60% of any annual bonus (40% for variable pay of less than £500,000, 60% for variable pay at or
above this amount). Vesting of both deferred bonus awards and long-term bonus awards is subject to risk and performance adjustment in the event of
deficient performance and prudent financial control provisions.
d) Partnership Shares scheme
A Partnership Shares scheme is operated for eligible employees under the Share Incentive Plan (SIP) umbrella. Participants can choose to invest up to
£1,800 per tax year (or no more than 10% of an employee’s salary for the tax year) from pre-tax salary to buy Banco Santander SA shares. Shares are
held in trust for the participants. There are no vesting conditions attached to these shares, and no restrictions as to when the shares can be removed from
the trust. However, if a participant chooses to sell the shares before the end of five years, they will be liable for the taxable benefit received when the
shares are taken out of the trust. The shares can be released from trust after five years free of income tax and national insurance contributions. 2,346,108
shares were outstanding at 31 December 2018 (2017: 2,147,399 shares).
39. TRANSACTIONS WITH DIRECTORS AND OTHER KEY MANAGEMENT
PERSONNEL
a) Remuneration of Directors and Other Key Management Personnel
The remuneration of the Directors and Other Key Management Personnel of the Santander UK group is set out in aggregate below.
Directors’ remuneration
2018
£
2017
£
2016
£
Salaries and fees 5,028,434 4,406,908 3,604,999
Performance-related payments(1) 5,194,317 3,685,464 2,330,000
Other fixed remuneration (pension and other allowances & non-cash benefits) 1,467,011 1,580,321 635,493
Expenses 25,198 96,358 120,302
Total remuneration 11,714,960 9,769,051 6,690,794
Directors’ and Other Key Management Personnel compensation
2018
£
2017
£
2016
£
Short-term employee benefits(2) 24,445,189 24,642,085 24,757,161
Post-employment benefits(3) 2,399,261 2,292,857 1,918,144
Total compensation 26,844,450 26,934,942 26,675,305
(1) In line with the Code, a proportion of the performance-related payment was deferred. Further details can be found in Note 38.
(2) Excludes grants of shares in Banco Santander SA made as buy-outs of deferred performance-related payments in 2018 of 189,381 shares in connection with previous employment for five individuals (2017: 603,614;
2016: nil). Excludes payments made as buy-outs of deferred performance-related payments of £266,667 in connection with previous employment for one individual (2017: £52,100 for one individual; 2016: £2,732,357 for
five individuals).
(3) Termination payments of £847,388 were paid in 2018 to two key management persons (2017: nil).
In 2018, the remuneration, excluding pension contributions, of the highest paid Director, was £4,635,497 (2017: £4,714,578) of which £2,317,000 (2017:
£2,425,000) was performance related. In 2018, there was no pension benefit accrued for the highest paid Director but in respect of the qualifying past
services to Santander UK to 31 May 2009 he has a deferred pension benefit accruing under a defined benefit scheme of £20,402 p.a. (2017: £15,450
p.a.).
b) Retirement benefits
Defined benefit pension schemes are provided to certain employees. See Note 31 for details of the schemes and the related costs and obligations. As
described above, one director, being the highest paid director, has a deferred pension benefit accruing under a defined benefit scheme. Ex gratia
pensions paid to former Directors of Santander UK plc in 2018, which have been provided for previously, amounted to £87,300 (2017: £2,482; 2016:
£14,893). In 1992, the Board decided not to award any new such ex gratia pensions.
c) Transactions with Directors, Other Key Management Personnel and each of their connected persons
Directors, Other Key Management Personnel (Defined as the Executive Committee of Santander UK plc who served during the year) and their connected
persons have undertaken the following transactions with the Santander UK group in the ordinary course of business.
2018 2017
No. £000 No. £000
Secured loans, unsecured loans and overdrafts
At 1 January 7 1,216 17 5,195
Net movements 9 1,819 (10) (3,979)
At 31 December 16 3,035 7 1,216
Deposit, bank and instant access accounts and investments
At 1 January 25 13,184 26 9,138
Net movements 5 (2,221) (1) 4,046
At 31 December 30 10,963 25 13,184
196 Santander UK plc
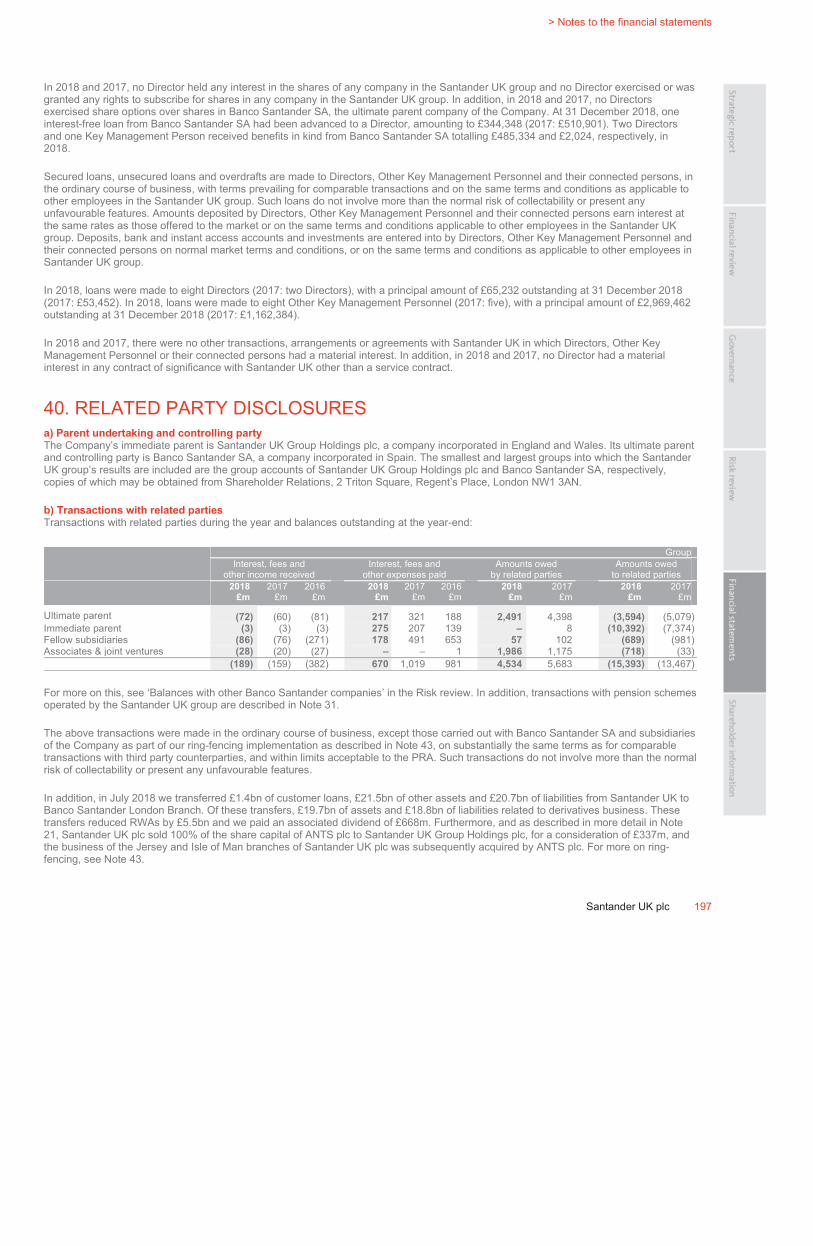
ˆ200G2Mlv!2T0YlHgNŠ200G2Mlv!2T0YlHgN
628340 TX 197SANTANDERFORM 20-F (SAN UK PL
03-Mar-2019 08:52 ESTHTMLON
Donnelley Financial EGV manra0dc 7*ESS 0C
VDI-W7-PFL-165312.9.12.0
bar5
Page 1 of 1
> Notes to the financial statements
Santander UK plc 197
In 2018 and 2017, no Director held any interest in the shares of any company in the Santander UK group and no Director exercised or was
granted any rights to subscribe for shares in any company in the Santander UK group. In addition, in 2018 and 2017, no Directors
exercised share options over shares in Banco Santander SA, the ultimate parent company of the Company. At 31 December 2018, one
interest-free loan from Banco Santander SA had been advanced to a Director, amounting to £344,348 (2017: £510,901). Two Directors
and one Key Management Person received benefits in kind from Banco Santander SA totalling £485,334 and £2,024, respectively, in
2018.
Secured loans, unsecured loans and overdrafts are made to Directors, Other Key Management Personnel and their connected persons, in
the ordinary course of business, with terms prevailing for comparable transactions and on the same terms and conditions as applicable to
other employees in the Santander UK group. Such loans do not involve more than the normal risk of collectability or present any
unfavourable features. Amounts deposited by Directors, Other Key Management Personnel and their connected persons earn interest at
the same rates as those offered to the market or on the same terms and conditions applicable to other employees in the Santander UK
group. Deposits, bank and instant access accounts and investments are entered into by Directors, Other Key Management Personnel and
their connected persons on normal market terms and conditions, or on the same terms and conditions as applicable to other employees in
Santander UK group.
In 2018, loans were made to eight Directors (2017: two Directors), with a principal amount of £65,232 outstanding at 31 December 2018
(2017: £53,452). In 2018, loans were made to eight Other Key Management Personnel (2017: five), with a principal amount of £2,969,462
outstanding at 31 December 2018 (2017: £1,162,384).
In 2018 and 2017, there were no other transactions, arrangements or agreements with Santander UK in which Directors, Other Key
Management Personnel or their connected persons had a material interest. In addition, in 2018 and 2017, no Director had a material
interest in any contract of significance with Santander UK other than a service contract.
40. RELATED PARTY DISCLOSURES
a) Parent undertaking and controlling party
The Company’s immediate parent is Santander UK Group Holdings plc, a company incorporated in England and Wales. Its ultimate parent
and controlling party is Banco Santander SA, a company incorporated in Spain. The smallest and largest groups into which the Santander
UK group’s results are included are the group accounts of Santander UK Group Holdings plc and Banco Santander SA, respectively,
copies of which may be obtained from Shareholder Relations, 2 Triton Square, Regent’s Place, London NW1 3AN.
b) Transactions with related parties
Transactions with related parties during the year and balances outstanding at the year-end:
Group
Interest, fees and
other income received
Interest, fees and
other expenses paid
Amounts owed
by related parties
Amounts owed
to related parties
2018
£m
2017
£m
2016
£m
2018
£m
2017
£m
2016
£m
2018
£m
2017
£m
2018
£m
2017
£m
Ultimate parent (72) (60) (81) 217 321 188 2,491 4,398 (3,594) (5,079)
Immediate parent (3) (3) (3) 275 207 139 – 8 (10,392) (7,374)
Fellow subsidiaries (86) (76) (271) 178 491 653 57 102 (689) (981)
Associates & joint ventures (28) (20) (27) – – 1 1,986 1,175 (718) (33)
(189) (159) (382) 670 1,019 981 4,534 5,683 (15,393) (13,467)
For more on this, see ‘Balances with other Banco Santander companies’ in the Risk review. In addition, transactions with pension schemes
operated by the Santander UK group are described in Note 31.
The above transactions were made in the ordinary course of business, except those carried out with Banco Santander SA and subsidiaries
of the Company as part of our ring-fencing implementation as described in Note 43, on substantially the same terms as for comparable
transactions with third party counterparties, and within limits acceptable to the PRA. Such transactions do not involve more than the normal
risk of collectability or present any unfavourable features.
In addition, in July 2018 we transferred £1.4bn of customer loans, £21.5bn of other assets and £20.7bn of liabilities from Santander UK to
Banco Santander London Branch. Of these transfers, £19.7bn of assets and £18.8bn of liabilities related to derivatives business. These
transfers reduced RWAs by £5.5bn and we paid an associated dividend of £668m. Furthermore, and as described in more detail in Note
21, Santander UK plc sold 100% of the share capital of ANTS plc to Santander UK Group Holdings plc, for a consideration of £337m, and
the business of the Jersey and Isle of Man branches of Santander UK plc was subsequently acquired by ANTS plc. For more on ring-
fencing, see Note 43.

ˆ200G2Mlv!2ScfRd6xŠ200G2Mlv!2ScfRd6x
628340 TX 198SANTANDERFORM 20-F (SAN UK PL
03-Mar-2019 07:36 ESTHTMLON
Donnelley Financial EGV shanv1dc 4*ESS 0C
VDI-W7-PFL-091012.9.12.0
Page 1 of 1
Annual Report 2018 | Financial statements
41. FINANCIAL INSTRUMENTS
a) Measurement basis of financial assets and liabilities
Financial assets and financial liabilities are measured on an ongoing basis either at fair value or at amortised cost. Note 1 describes how the classes of
financial instruments are measured, and how income and expenses, including fair value gains and losses, are recognised.
b) Fair value measurement and hierarchy
(i) Fair value measurement
The fair value of financial instruments is the price that would be received to sell an asset or paid to transfer a liability in an orderly transaction between
market participants at the measurement date in the principal, or in its absence, the most advantageous market to which Santander UK has access at that
date. The fair value of a liability reflects its non-performance risk.
Financial instruments valued using observable market prices
If a quoted market price in an active market is available for an instrument, the fair value is calculated as the current bid price multiplied by the number of
units of the instrument held.
Financial instruments valued using a valuation technique
In the absence of a quoted market price in an active market, management uses internal models to make its best estimate of the price that the market
would set for that financial instrument. In order to make these estimations, various techniques are employed, including extrapolation from observable
market data and observation of similar financial instruments with similar characteristics. Wherever possible, valuation parameters for each product are
based on prices directly observable in active markets or that can be derived from directly observable market prices. Chosen valuation techniques
incorporate all the factors that market participants would take into account in pricing transactions.
Santander UK manages certain groups of financial assets and liabilities on the basis of its net exposure to either market risks or credit risk. As a result it
has elected to use the exception under IFRS 13 which permits the fair value measurement of a group of financial assets and financial liabilities on the
basis of the price that would be received to sell a net long position for a particular risk exposure or paid to transfer a net short position for a particular risk
exposure in an orderly transaction between market participants at the measurement date under current market conditions.
(ii) Fair value hierarchy
Santander UK applies the following fair value hierarchy that prioritises the inputs to valuation techniques used in measuring fair value. The hierarchy
establishes three categories for valuing financial instruments, giving the highest priority to unadjusted quoted prices in active markets for identical assets
or liabilities and the lowest priority to unobservable inputs. The three categories are: quoted prices in active markets (Level 1), internal models based on
observable market data (Level 2) and internal models based on other than observable market data (Level 3). If the inputs used to measure an asset or a
liability fall to different levels within the hierarchy, the classification of the entire asset or liability will be based on the lowest level input that is significant to
the overall fair value measurement of the asset or liability.
Santander UK categorises assets and liabilities measured at fair value within the fair value hierarchy based on the inputs to the valuation techniques as
follows:
Level 1 Unadjusted quoted prices for identical assets or liabilities in an active market that Santander UK can access at the measurement date. Level 1
positions include debt securities, equity securities, exchange traded derivatives and short positions in securities. Active markets are assessed
by reference to average daily trading volumes in absolute terms and, where applicable, by reference to market capitalisation for the instrument.
Level 2 Quoted prices in inactive markets, quoted prices for similar assets or liabilities, recent market transactions, inputs other than quoted market
prices for the asset or liability that are observable either directly or indirectly for substantially the full term, and inputs to valuation techniques
that are derived principally from or corroborated by observable market data through correlation or other statistical means for substantially the full
term of the asset or liability. Level 2 positions include loans and advances to banks, loans and advances to customers, equity securities,
exchange rate derivatives, interest rate derivatives, equity and credit derivatives, debt securities, deposits by banks and debt securities in issue.
Level 3 Significant inputs to the pricing or valuation techniques are unobservable. These unobservable inputs reflect the assumptions that market
participants would use when pricing assets or liabilities and are considered significant to the overall valuation. Level 3 positions include
exchange rate derivatives, property related derivatives, loans and advances to customers, debt securities, equity securities, deposits by
customers and debt securities in issue.
Changes in the observability of significant valuation inputs during the reporting period may result in a transfer of assets and liabilities within the fair value
hierarchy. The Santander UK group recognises transfers between levels of the fair value hierarchy when there is a significant change in either its principal
market or the level of observability of the inputs to the valuation techniques as at the end of the reporting period.
198 Santander UK plc
ˆ200G2Mlv!2SGCgFg<Š200G2Mlv!2SGCgFg<
628340 TX 199SANTANDERFORM 20-F (SAN UK PL
03-Mar-2019 06:42 ESTHTMLON
Donnelley Financial EGV manra0dc 3*ESS 0C
VDI-W7-PFL-165312.9.12.0
bar5
Page 1 of 1
> Notes to the financial statements
Santander UK plc 199
c) Valuation techniques
The main valuation techniques employed in internal models to measure the fair value of the financial instruments at 31 December 2018
and 2017 are set out below. In substantially all cases, the principal inputs into these models are derived from observable market data.
Santander UK did not make any material changes to the valuation techniques and internal models it used in 2018, 2017 and 2016.
A In the valuation of financial instruments requiring static hedging (for example interest rate, currency derivatives and commodity swaps)
and in the valuation of loans and advances and deposits, the ‘present value’ method is used. Expected future cash flows are
discounted using the interest rate curves of the applicable currencies or forward commodity prices, as well as credit spreads. The
interest rate curves are generally observable market data and reference yield curves derived from quoted interest rates in appropriate
time bandings, which match the timings of the cash flows and maturities of the instruments. The forward commodity prices are
generally observable market data.
B In the valuation of equity financial instruments requiring dynamic hedging (principally equity securities, options and other structured
instruments), proprietary local volatility and stochastic volatility models are used. These types of models are widely accepted in the
financial services industry. Observable market inputs used in these models include the bid-offer spread, foreign currency exchange
rates, volatility and correlation between indices. In limited circumstances, other inputs may be used in these models that are based on
unobservable market data, such as the Halifax’s UK HPI volatility, HPI forward growth, HPI spot rate, mortality, mean reversion and
contingent litigation risk.
C In the valuation of financial instruments exposed to interest rate risk that require either static or dynamic hedging (such as interest rate
futures, caps and floors, and options), the present value method (futures), Black’s model (caps/floors) and the Hull/White and Markov
functional models (Bermudan options) are used. These types of models are widely accepted in the financial services industry. The
significant inputs used in these models are observable market data, including appropriate interest rate curves, volatilities, correlations
and exchange rates. In limited circumstances, other inputs may be used in these models that are based on unobservable market data,
such as HPI volatility, HPI forward growth, HPI spot rate and mortality.
D In the valuation of linear instruments such as credit risk and fixed-income derivatives, credit risk is measured using dynamic models
similar to those used in the measurement of interest rate risk. In the case of non-linear instruments, if the portfolio is exposed to credit
risk such as credit derivatives, the probability of default is determined using the credit default spread market. The main inputs used to
determine the underlying cost of credit of credit derivatives are quoted credit risk premiums and the correlation between the quoted
credit derivatives of various issuers.
The fair values of the financial instruments arising from Santander UK’s internal models take into account, among other things, contract
terms and observable market data, which include such factors as bid-offer spread, interest rates, credit risk, exchange rates, the quoted
market price of raw materials and equity securities, volatility and prepayments. In all cases, when it is not possible to derive a valuation for
a particular feature of an instrument, management uses judgement to determine the fair value of the particular feature. In exercising this
judgement, a variety of tools are used including proxy observable data, historical data and extrapolation techniques. Extrapolation
techniques take into account behavioural characteristics of equity markets that have been observed over time, and for which there is a
strong case to support an expectation of a continuing trend in the future. Estimates are calibrated to observable market prices when they
become available.
Santander UK believes its valuation methods are appropriate and consistent with other market participants. Nevertheless, the use of
different valuation methods or assumptions, including imprecision in estimating unobservable market inputs, to determine the fair value of
certain financial instruments could result in different estimates of fair value at the reporting date and the amount of gain or loss recorded for
a particular instrument. Most of the valuation models are not significantly subjective, because they can be tested and, if necessary,
recalibrated by the internal calculation of and subsequent comparison to market prices of actively traded securities, where available.
d) Control framework
Fair values are subject to a control framework designed to ensure that they are either determined or validated by a function independent of
the risk-taker. To this end, ultimate responsibility for the determination of fair values lies with the Risk Department. For all financial
instruments where fair values are determined by reference to externally quoted prices or observable pricing inputs to models, independent
price determination or validation is utilised. In inactive markets, direct observation of a traded price may not be possible. In these
circumstances, Santander UK will source alternative market information to validate the financial instrument’s fair value, with greater weight
given to information that is considered to be more relevant and reliable.
The factors that are considered in this regard include:
– The extent to which prices may be expected to represent genuine traded or tradeable prices
– The degree of similarity between financial instruments
– The degree of consistency between different sources
– The process followed by the pricing provider to derive the data
– The elapsed time between the date to which the market data relates and the balance sheet date
– The manner in which the data was sourced.
The source of pricing data is considered as part of the process that determines the classification of the level of a financial instrument.
Consideration is given to the quality of the information available that provides the current mark-to-model valuation and estimates of how
different these valuations could be on an actual trade, taking into consideration how active the market is. For spot assets that cannot be
sold due to illiquidity, forward estimates are discounted to estimate a realisable value over time. Adjustments for illiquid positions are
regularly reviewed to reflect changing market conditions.
For fair values determined using a valuation model, the control framework may include, as applicable, independent development and / or
validation of: (i) the logic within the models; (ii) the inputs to those models; and (iii) any adjustments required outside the models. Internal
valuation models are validated independently within the Risk Department. A validation report is produced for each model-derived valuation
that assesses the mathematical assumptions behind the model, the implementation of the model and its integration within the trading
system. The results of the independent valuation process and any changes to the fair value adjustments methodology are approved in line
with the model risk framework and policy.
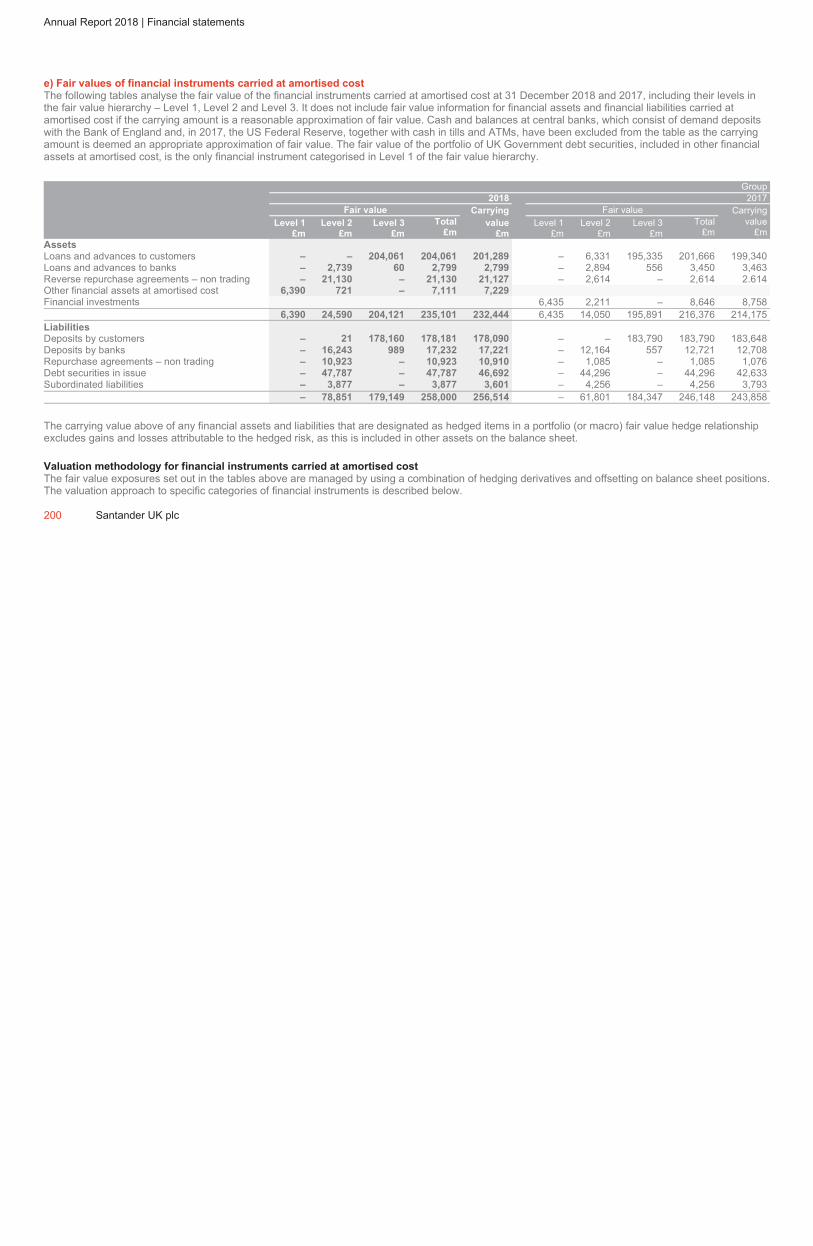
ˆ200G2Mlv!2XsWubgMŠ200G2Mlv!2XsWubgM
628340 TX 200SANTANDERFORM 20-F (SAN UK PL
03-Mar-2019 22:48 ESTHTMLON
Donnelley Financial EGV shanv1dc 12*ESS 0C
VDI-W7-PFL-160412.9.12.0
Page 1 of 1
Annual Report 2018 | Financial statements
e) Fair values of financial instruments carried at amortised cost
The following tables analyse the fair value of the financial instruments carried at amortised cost at 31 December 2018 and 2017, including their levels in
the fair value hierarchy – Level 1, Level 2 and Level 3. It does not include fair value information for financial assets and financial liabilities carried at
amortised cost if the carrying amount is a reasonable approximation of fair value. Cash and balances at central banks, which consist of demand deposits
with the Bank of England and, in 2017, the US Federal Reserve, together with cash in tills and ATMs, have been excluded from the table as the carrying
amount is deemed an appropriate approximation of fair value. The fair value of the portfolio of UK Government debt securities, included in other financial
assets at amortised cost, is the only financial instrument categorised in Level 1 of the fair value hierarchy.
Group
2018 2017
Fair value Carrying Fair value Carrying
Level 1
£m
Level 2
£m
Level 3
£m
Total
£m
value
£m
Level 1
£m
Level 2
£m
Level 3
£m
Total
£m
value
£m
Assets
Loans and advances to customers – – 204,061 204,061 201,289 – 6,331 195,335 201,666 199,340
Loans and advances to banks – 2,739 60 2,799 2,799 – 2,894 556 3,450 3,463
Reverse repurchase agreements – non trading – 21,130 – 21,130 21,127 – 2,614 – 2,614 2.614
Other financial assets at amortised cost 6,390 721 – 7,111 7,229
Financial investments 6,435 2,211 – 8,646 8,758
6,390 24,590 204,121 235,101 232,444 6,435 14,050 195,891 216,376 214,175
Liabilities
Deposits by customers – 21 178,160 178,181 178,090 – – 183,790 183,790 183,648
Deposits by banks – 16,243 989 17,232 17,221 – 12,164 557 12,721 12,708
Repurchase agreements – non trading – 10,923 – 10,923 10,910 – 1,085 – 1,085 1,076
Debt securities in issue – 47,787 – 47,787 46,692 – 44,296 – 44,296 42,633
Subordinated liabilities – 3,877 – 3,877 3,601 – 4,256 – 4,256 3,793
– 78,851 179,149 258,000 256,514 – 61,801 184,347 246,148 243,858
The carrying value above of any financial assets and liabilities that are designated as hedged items in a portfolio (or macro) fair value hedge relationship
excludes gains and losses attributable to the hedged risk, as this is included in other assets on the balance sheet.
Valuation methodology for financial instruments carried at amortised cost
The fair value exposures set out in the tables above are managed by using a combination of hedging derivatives and offsetting on balance sheet positions.
The valuation approach to specific categories of financial instruments is described below.
200 Santander UK plc
ˆ200G2Mlv!2SgZY@g-Š200G2Mlv!2SgZY@g-
628340 TX 201SANTANDERFORM 20-F (SAN UK PL
03-Mar-2019 07:49 ESTHTMLON
Donnelley Financial EGV shanv1dc 4*ESS 0C
VDI-W7-PFL-091012.9.12.0
bar5
Page 1 of 1
> Notes to the financial statements
Santander UK plc 201
Assets:
Loans and advances to customers
The approach to estimating the fair value of loans and advances to customers has been determined by discounting expected cash flows to
reflect current market rates for lending of a similar credit quality. The determination of their fair values is an area of considerable estimation
and uncertainty as there is no observable market and values are significantly affected by customer behaviour.
i) Advances secured on residential property
The fair value of the mortgage portfolio is calculated by discounting contractual cash flows by different spreads, each representing a LTV
band, after taking account of expected customer prepayment rates. The spread is based on new business interest rates derived from
competitor market information. Further discounting is applied for certain higher risk mortgage portfolios.
ii) Corporate loans
The corporate loan portfolio is stratified by product. The determination of the fair values of performing loans takes account of the differential
between existing margins and estimated new business rates for similar loans in terms of segment, maturity and structure. Provisions are
considered appropriate for the book that is not impaired. A discount has been applied to impaired loans. Although exits have generally
been achieved at carrying value, this does not reflect the discount a purchaser would require. A discount has therefore been applied based
on the target return sought by distressed bond funds, who are the typical purchaser of the assets.
iii) Other loans
These consist of unsecured personal loans, credit cards, overdrafts and consumer (auto) finance. The weighted average lives of these
portfolios are short, and the business was written relatively recently. As a result, contractual interest rates approximate new business
interest rates, and therefore no mark-to-market surplus or deficit has been recorded with respect to the performing book with the exception
of unsecured personal loans where a small surplus or deficit has been recognised based on the differential between existing margins and
an estimate of new business rates for similar loans. A discount has been applied to the impaired part of the book.
Loans and advances to banks
These comprise secured loans, short-term placements with banks including collateral and unsettled financial transactions. The secured
loans have been valued on the basis of spreads on credit default swaps for the term of the loans using valuation technique A as described
above. The carrying amount of the other items is deemed a reasonable approximation of their fair value, as the transactions are very short-
term in duration.
Reverse repurchase agreements – non trading
The fair value of the reverse repurchase agreements – non trading has been estimated using valuation technique A as described above.
Other financial assets at amortised cost and financial investments
These consist of asset backed securities and debt securities. The asset backed securities are complex products and in some instances are
valued with the assistance of an independent, specialist valuation firm. These fair values are determined using industry-standard valuation
techniques, including discounted cash flow models. The inputs to these models used in these valuation techniques include quotes from
market makers, prices of similar assets, adjustments for differences in credit spreads, and additional quantitative and qualitative research.
The debt security investments consist of a portfolio of government debt securities. The fair value of this portfolio has been determined
using valuation technique A as described above.
Liabilities:
Deposits by customers
The majority of deposit liabilities are payable on demand and therefore can be deemed short-term in nature with the fair value equal to the
carrying value. Certain of the deposit liabilities are at a fixed rate until maturity. The deficit/surplus of fair value over carrying value of these
liabilities has been estimated by reference to the market rates available at the balance sheet date for similar deposit liabilities of similar
maturities. The fair value of such deposit liabilities has been estimated using valuation technique A as described above.
Deposits by banks
The fair value of deposits by banks, including repos, has been estimated using valuation technique A as described above.
Debt securities in issue and subordinated liabilities
Where reliable prices are available, the fair value of debt securities in issue and subordinated liabilities has been calculated using quoted
market prices. Other market values have been determined using valuation technique A as described above.
Repurchase agreements – non trading
The fair value of the repurchase agreements – non trading has been estimated using valuation technique A as described above.
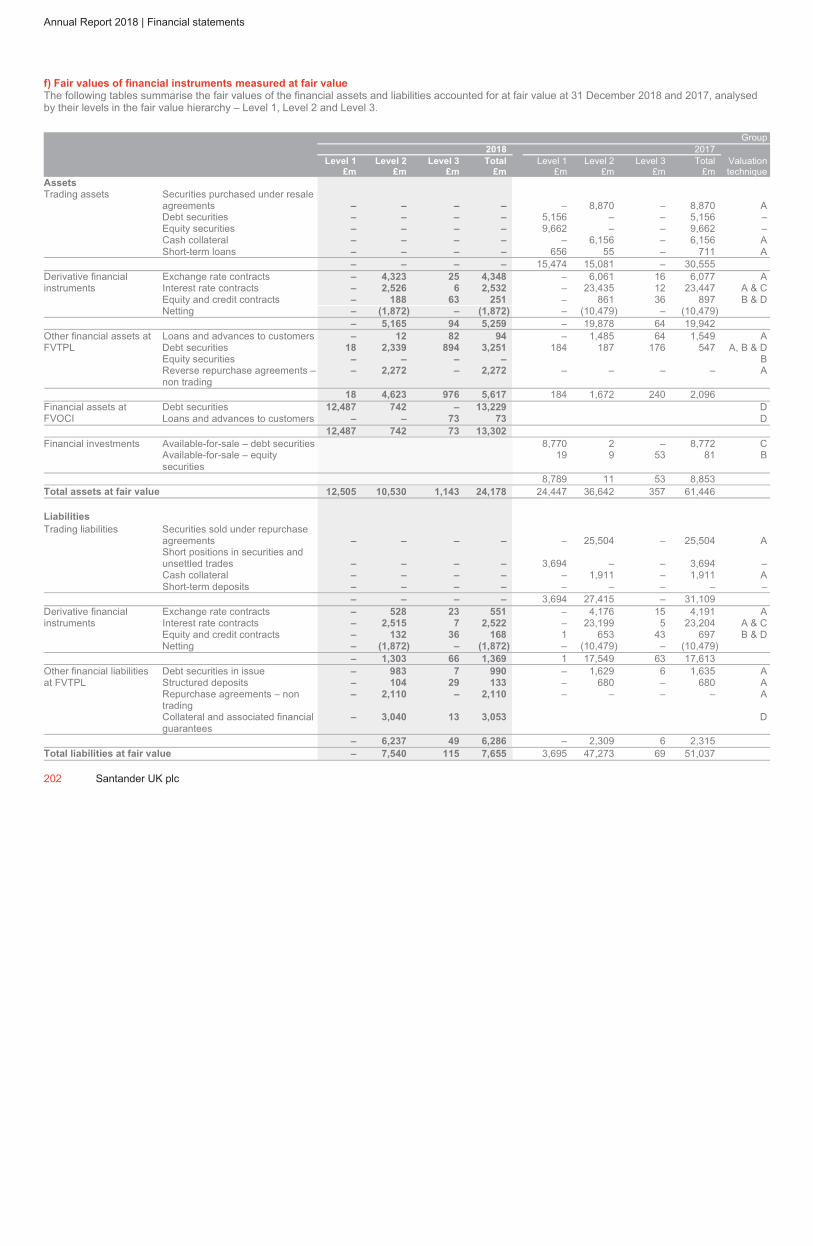
ˆ200G2Mlv!2YBBX!61Š200G2Mlv!2YBBX!61
628340 TX 202SANTANDERFORM 20-F (SAN UK PL
03-Mar-2019 23:23 ESTHTMLON
Donnelley Financial EGV sraas0dc 7*ESS 0C
VDI-W7-PFL-035112.9.12.0
Page 1 of 1
Annual Report 2018 | Financial statements
f) Fair values of financial instruments measured at fair value
The following tables summarise the fair values of the financial assets and liabilities accounted for at fair value at 31 December 2018 and 2017, analysed
by their levels in the fair value hierarchy – Level 1, Level 2 and Level 3.
Group
2018 2017
Level 1
£m
Level 2
£m
Level 3
£m
Total
£m
Level 1
£m
Level 2
£m
Level 3
£m
Total
£m
Valuation
technique
Assets
Trading assets Securities purchased under resale
agreements – – – – – 8,870 – 8,870 A
Debt securities – – – – 5,156 – – 5,156 –
Equity securities – – – – 9,662 – – 9,662 –
Cash collateral – – – – – 6,156 – 6,156 A
Short-term loans – – – – 656 55 – 711 A
– – – – 15,474 15,081 – 30,555
Derivative financial Exchange rate contracts – 4,323 25 4,348 – 6,061 16 6,077 A
instruments Interest rate contracts – 2,526 6 2,532 – 23,435 12 23,447 A & C
Equity and credit contracts – 188 63 251 – 861 36 897 B & D
Netting – (1,872) – (1,872) – (10,479) – (10,479)
– 5,165 94 5,259 – 19,878 64 19,942
Other financial assets at Loans and advances to customers – 12 82 94 – 1,485 64 1,549 A
FVTPL Debt securities 18 2,339 894 3,251 184 187 176 547 A, B & D
Equity securities – – – – B
Reverse repurchase agreements – – 2,272 – 2,272 – – – – A
non trading
18 4,623 976 5,617 184 1,672 240 2,096
Financial assets at Debt securities 12,487 742 – 13,229 D
FVOCI Loans and advances to customers – – 73 73 D
12,487 742 73 13,302
Financial investments Available-for-sale – debt securities 8,770 2 – 8,772 C
Available-for-sale – equity 19 9 53 81 B
securities
8,789 11 53 8,853
Total assets at fair value 12,505 10,530 1,143 24,178 24,447 36,642 357 61,446
Liabilities
Trading liabilities Securities sold under repurchase
agreements – – – – – 25,504 – 25,504 A
Short positions in securities and
unsettled trades – – – – 3,694 – – 3,694 –
Cash collateral – – – – – 1,911 – 1,911 A
Short-term deposits – – – – – – – – –
– – – – 3,694 27,415 – 31,109
Derivative financial Exchange rate contracts – 528 23 551 – 4,176 15 4,191 A
instruments Interest rate contracts – 2,515 7 2,522 – 23,199 5 23,204 A & C
Equity and credit contracts – 132 36 168 1 653 43 697 B & D
Netting – (1,872) – (1,872) – (10,479) – (10,479)
– 1,303 66 1,369 1 17,549 63 17,613
Other financial liabilities Debt securities in issue – 983 7 990 – 1,629 6 1,635 A
at FVTPL Structured deposits – 104 29 133 – 680 – 680 A
Repurchase agreements – non – 2,110 – 2,110 – – – – A
trading
Collateral and associated financial – 3,040 13 3,053 D
guarantees
– 6,237 49 6,286 – 2,309 6 2,315
Total liabilities at fair value – 7,540 115 7,655 3,695 47,273 69 51,037
202 Santander UK plc

ˆ200G2Mlv!2RocqRgÈŠ200G2Mlv!2RocqRg¨
628340 TX 203SANTANDERFORM 20-F (SAN UK PL
03-Mar-2019 05:34 ESTHTMLON
Donnelley Financial EGV ayyar0dc 3*ESS 0C
VDI-W7-PFD-036312.9.12.0
bar5
Page 1 of 1
> Notes to the financial statements
Santander UK plc 203
Transfers between levels of the fair value hierarchy
Transfers between levels of the fair value hierarchy are reported at the beginning of the period in which they occur. In 2018, there were no
significant (2017: none) transfers of financial instruments between Levels 1 and 2. In 2018, the main transfers of financial instruments
between Levels 2 and 3 were Derivatives assets of £35m and Derivative liabilities of £31m which were transferred from Level 2 to Level 3
following enhancements to the fair value hierarchy classification process.
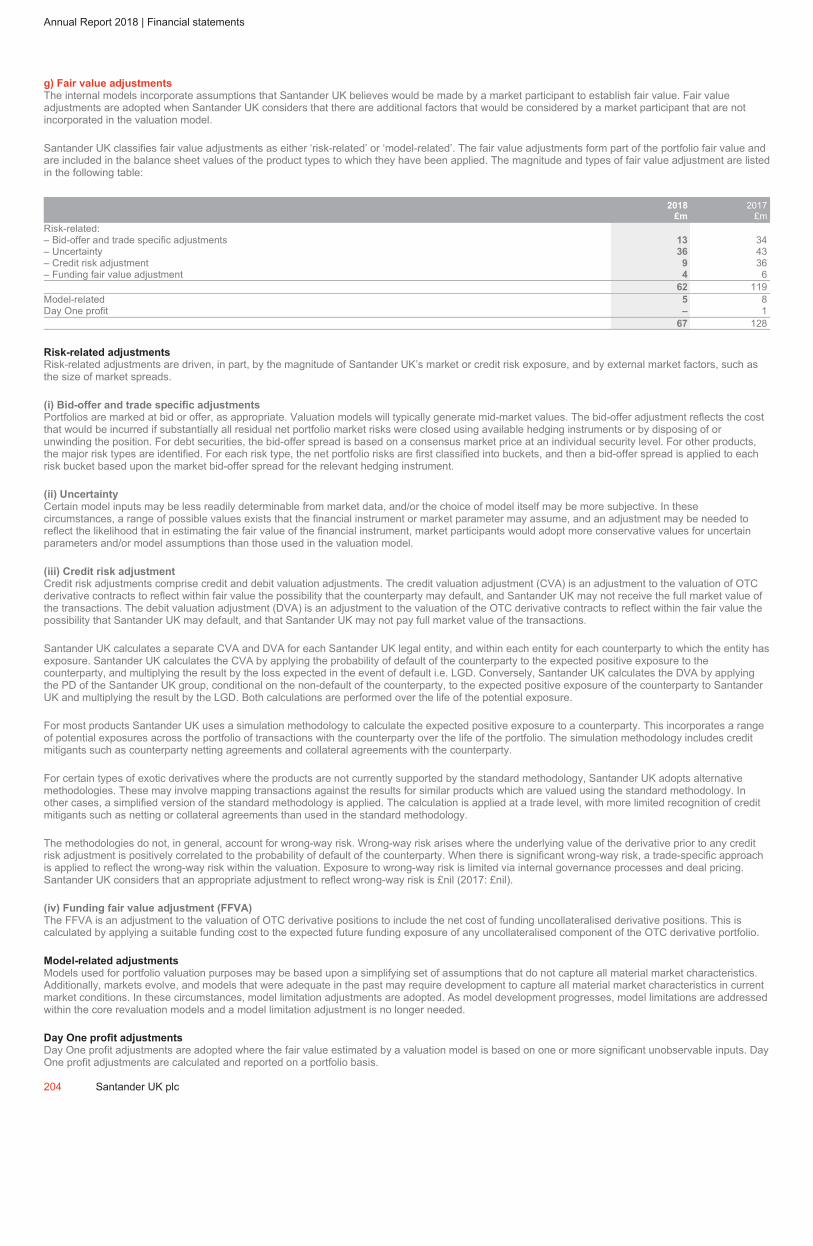
ˆ200G2Mlv!2VNm&D6ÈŠ200G2Mlv!2VNm&D6¨
628340 TX 204SANTANDERFORM 20-F (SAN UK PL
03-Mar-2019 14:38 ESTHTMLON
Donnelley Financial EGV kumak0dc 3*ESS 0C
VDI-W7-PFL-105912.9.12.0
Page 1 of 1
Annual Report 2018 | Financial statements
g) Fair value adjustments
The internal models incorporate assumptions that Santander UK believes would be made by a market participant to establish fair value. Fair value
adjustments are adopted when Santander UK considers that there are additional factors that would be considered by a market participant that are not
incorporated in the valuation model.
Santander UK classifies fair value adjustments as either ‘risk-related’ or ‘model-related’. The fair value adjustments form part of the portfolio fair value and
are included in the balance sheet values of the product types to which they have been applied. The magnitude and types of fair value adjustment are listed
in the following table:
2018
£m
2017
£m
Risk-related:
– Bid-offer and trade specific adjustments 13 34
– Uncertainty 36 43
– Credit risk adjustment 9 36
– Funding fair value adjustment 4 6
62 119
Model-related 5 8
Day One profit – 1
67 128
Risk-related adjustments
Risk-related adjustments are driven, in part, by the magnitude of Santander UK’s market or credit risk exposure, and by external market factors, such as
the size of market spreads.
(i) Bid-offer and trade specific adjustments
Portfolios are marked at bid or offer, as appropriate. Valuation models will typically generate mid-market values. The bid-offer adjustment reflects the cost
that would be incurred if substantially all residual net portfolio market risks were closed using available hedging instruments or by disposing of or
unwinding the position. For debt securities, the bid-offer spread is based on a consensus market price at an individual security level. For other products,
the major risk types are identified. For each risk type, the net portfolio risks are first classified into buckets, and then a bid-offer spread is applied to each
risk bucket based upon the market bid-offer spread for the relevant hedging instrument.
(ii) Uncertainty
Certain model inputs may be less readily determinable from market data, and/or the choice of model itself may be more subjective. In these
circumstances, a range of possible values exists that the financial instrument or market parameter may assume, and an adjustment may be needed to
reflect the likelihood that in estimating the fair value of the financial instrument, market participants would adopt more conservative values for uncertain
parameters and/or model assumptions than those used in the valuation model.
(iii) Credit risk adjustment
Credit risk adjustments comprise credit and debit valuation adjustments. The credit valuation adjustment (CVA) is an adjustment to the valuation of OTC
derivative contracts to reflect within fair value the possibility that the counterparty may default, and Santander UK may not receive the full market value of
the transactions. The debit valuation adjustment (DVA) is an adjustment to the valuation of the OTC derivative contracts to reflect within the fair value the
possibility that Santander UK may default, and that Santander UK may not pay full market value of the transactions.
Santander UK calculates a separate CVA and DVA for each Santander UK legal entity, and within each entity for each counterparty to which the entity has
exposure. Santander UK calculates the CVA by applying the probability of default of the counterparty to the expected positive exposure to the
counterparty, and multiplying the result by the loss expected in the event of default i.e. LGD. Conversely, Santander UK calculates the DVA by applying
the PD of the Santander UK group, conditional on the non-default of the counterparty, to the expected positive exposure of the counterparty to Santander
UK and multiplying the result by the LGD. Both calculations are performed over the life of the potential exposure.
For most products Santander UK uses a simulation methodology to calculate the expected positive exposure to a counterparty. This incorporates a range
of potential exposures across the portfolio of transactions with the counterparty over the life of the portfolio. The simulation methodology includes credit
mitigants such as counterparty netting agreements and collateral agreements with the counterparty.
For certain types of exotic derivatives where the products are not currently supported by the standard methodology, Santander UK adopts alternative
methodologies. These may involve mapping transactions against the results for similar products which are valued using the standard methodology. In
other cases, a simplified version of the standard methodology is applied. The calculation is applied at a trade level, with more limited recognition of credit
mitigants such as netting or collateral agreements than used in the standard methodology.
The methodologies do not, in general, account for wrong-way risk. Wrong-way risk arises where the underlying value of the derivative prior to any credit
risk adjustment is positively correlated to the probability of default of the counterparty. When there is significant wrong-way risk, a trade-specific approach
is applied to reflect the wrong-way risk within the valuation. Exposure to wrong-way risk is limited via internal governance processes and deal pricing.
Santander UK considers that an appropriate adjustment to reflect wrong-way risk is £nil (2017: £nil).
(iv) Funding fair value adjustment (FFVA)
The FFVA is an adjustment to the valuation of OTC derivative positions to include the net cost of funding uncollateralised derivative positions. This is
calculated by applying a suitable funding cost to the expected future funding exposure of any uncollateralised component of the OTC derivative portfolio.
Model-related adjustments
Models used for portfolio valuation purposes may be based upon a simplifying set of assumptions that do not capture all material market characteristics.
Additionally, markets evolve, and models that were adequate in the past may require development to capture all material market characteristics in current
market conditions. In these circumstances, model limitation adjustments are adopted. As model development progresses, model limitations are addressed
within the core revaluation models and a model limitation adjustment is no longer needed.
Day One profit adjustments
Day One profit adjustments are adopted where the fair value estimated by a valuation model is based on one or more significant unobservable inputs. Day
One profit adjustments are calculated and reported on a portfolio basis.
204 Santander UK plc
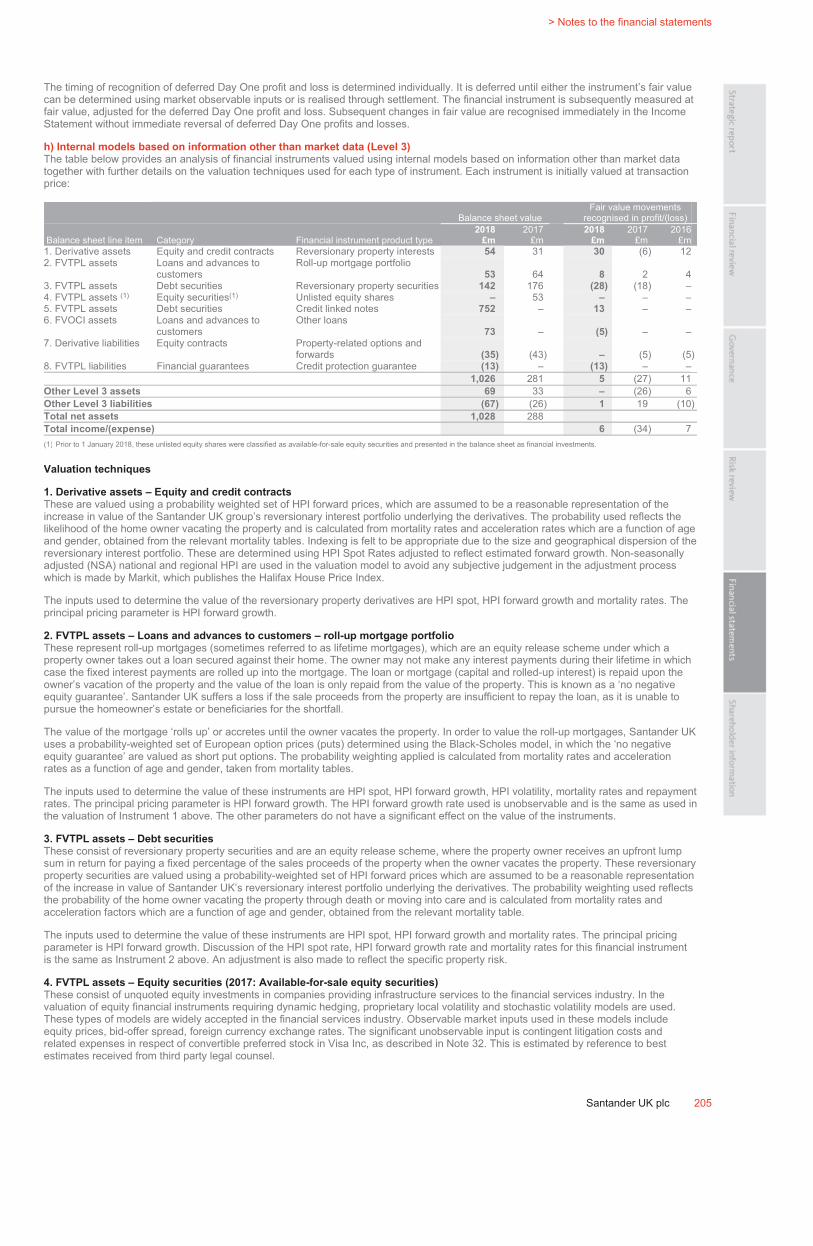
ˆ200G2Mlv!2bSwzdgqŠ200G2Mlv!2bSwzdgq
628340 TX 205SANTANDERFORM 20-F (SAN UK PL
04-Mar-2019 03:55 ESTHTMLON
Donnelley Financial EGV yuraa0dc 6*ESS 0C
VDI-W7-PFL-143912.9.12.0
bar5
Page 1 of 1
> Notes to the financial statements
Santander UK plc 205
The timing of recognition of deferred Day One profit and loss is determined individually. It is deferred until either the instrument’s fair value
can be determined using market observable inputs or is realised through settlement. The financial instrument is subsequently measured at
fair value, adjusted for the deferred Day One profit and loss. Subsequent changes in fair value are recognised immediately in the Income
Statement without immediate reversal of deferred Day One profits and losses.
h) Internal models based on information other than market data (Level 3)
The table below provides an analysis of financial instruments valued using internal models based on information other than market data
together with further details on the valuation techniques used for each type of instrument. Each instrument is initially valued at transaction
price:
Balance sheet value
Fair value movements
recognised in profit/(loss)
Balance sheet line item Category Financial instrument product type
2018
£m
2017
£m
2018
£m
2017
£m
2016
£m
1. Derivative assets Equity and credit contracts Reversionary property interests 54 31 30 (6) 12
2. FVTPL assets Loans and advances to
customers
Roll-up mortgage portfolio
53 64 8 2 4
3. FVTPL assets Debt securities Reversionary property securities 142 176 (28) (18) –
4. FVTPL assets (1)
Equity securities(1)
Unlisted equity shares – 53 – – –
5. FVTPL assets Debt securities Credit linked notes 752 – 13 – –
6. FVOCI assets Loans and advances to
customers
Other loans
73 – (5) – –
7. Derivative liabilities Equity contracts Property-related options and
forwards (35) (43) – (5) (5)
8. FVTPL liabilities Financial guarantees Credit protection guarantee (13) – (13) – –
1,026 281 5 (27) 11
Other Level 3 assets 69 33 – (26) 6
Other Level 3 liabilities (67) (26) 1 19 (10)
Total net assets 1,028 288
Total income/(expense) 6 (34) 7
(1) Prior to 1 January 2018, these unlisted equity shares were classified as available-for-sale equity securities and presented in the balance sheet as financial investments.
Valuation techniques
1. Derivative assets – Equity and credit contracts
These are valued using a probability weighted set of HPI forward prices, which are assumed to be a reasonable representation of the
increase in value of the Santander UK group’s reversionary interest portfolio underlying the derivatives. The probability used reflects the
likelihood of the home owner vacating the property and is calculated from mortality rates and acceleration rates which are a function of age
and gender, obtained from the relevant mortality tables. Indexing is felt to be appropriate due to the size and geographical dispersion of the
reversionary interest portfolio. These are determined using HPI Spot Rates adjusted to reflect estimated forward growth. Non-seasonally
adjusted (NSA) national and regional HPI are used in the valuation model to avoid any subjective judgement in the adjustment process
which is made by Markit, which publishes the Halifax House Price Index.
The inputs used to determine the value of the reversionary property derivatives are HPI spot, HPI forward growth and mortality rates. The
principal pricing parameter is HPI forward growth.
2. FVTPL assets – Loans and advances to customers – roll-up mortgage portfolio
These represent roll-up mortgages (sometimes referred to as lifetime mortgages), which are an equity release scheme under which a
property owner takes out a loan secured against their home. The owner may not make any interest payments during their lifetime in which
case the fixed interest payments are rolled up into the mortgage. The loan or mortgage (capital and rolled-up interest) is repaid upon the
owner’s vacation of the property and the value of the loan is only repaid from the value of the property. This is known as a ‘no negative
equity guarantee’. Santander UK suffers a loss if the sale proceeds from the property are insufficient to repay the loan, as it is unable to
pursue the homeowner’s estate or beneficiaries for the shortfall.
The value of the mortgage ‘rolls up’ or accretes until the owner vacates the property. In order to value the roll-up mortgages, Santander UK
uses a probability-weighted set of European option prices (puts) determined using the Black-Scholes model, in which the ‘no negative
equity guarantee’ are valued as short put options. The probability weighting applied is calculated from mortality rates and acceleration
rates as a function of age and gender, taken from mortality tables.
The inputs used to determine the value of these instruments are HPI spot, HPI forward growth, HPI volatility, mortality rates and repayment
rates. The principal pricing parameter is HPI forward growth. The HPI forward growth rate used is unobservable and is the same as used in
the valuation of Instrument 1 above. The other parameters do not have a significant effect on the value of the instruments.
3. FVTPL assets – Debt securities
These consist of reversionary property securities and are an equity release scheme, where the property owner receives an upfront lump
sum in return for paying a fixed percentage of the sales proceeds of the property when the owner vacates the property. These reversionary
property securities are valued using a probability-weighted set of HPI forward prices which are assumed to be a reasonable representation
of the increase in value of Santander UK’s reversionary interest portfolio underlying the derivatives. The probability weighting used reflects
the probability of the home owner vacating the property through death or moving into care and is calculated from mortality rates and
acceleration factors which are a function of age and gender, obtained from the relevant mortality table.
The inputs used to determine the value of these instruments are HPI spot, HPI forward growth and mortality rates. The principal pricing
parameter is HPI forward growth. Discussion of the HPI spot rate, HPI forward growth rate and mortality rates for this financial instrument
is the same as Instrument 2 above. An adjustment is also made to reflect the specific property risk.
4. FVTPL assets – Equity securities (2017: Available-for-sale equity securities)
These consist of unquoted equity investments in companies providing infrastructure services to the financial services industry. In the
valuation of equity financial instruments requiring dynamic hedging, proprietary local volatility and stochastic volatility models are used.
These types of models are widely accepted in the financial services industry. Observable market inputs used in these models include
equity prices, bid-offer spread, foreign currency exchange rates. The significant unobservable input is contingent litigation costs and
related expenses in respect of convertible preferred stock in Visa Inc, as described in Note 32. This is estimated by reference to best
estimates received from third party legal counsel.
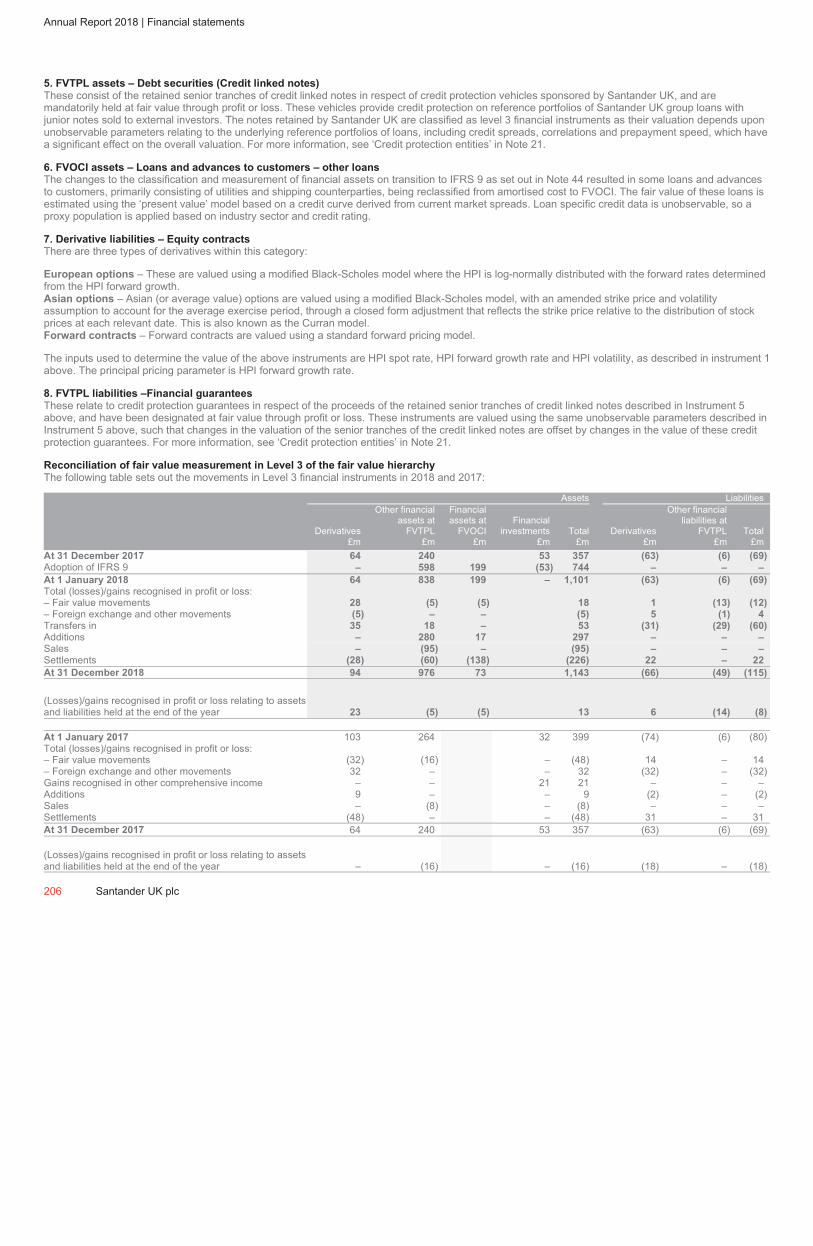
ˆ200G2Mlv!2YBH1y6MŠ200G2Mlv!2YBH1y6M
628340 TX 206SANTANDERFORM 20-F (SAN UK PL
03-Mar-2019 23:24 ESTHTMLON
Donnelley Financial EGV annas1dc 6*ESS 0C
VDI-W7-PFD-029812.9.12.0
Page 1 of 1
Annual Report 2018 | Financial statements
5. FVTPL assets – Debt securities (Credit linked notes)
These consist of the retained senior tranches of credit linked notes in respect of credit protection vehicles sponsored by Santander UK, and are
mandatorily held at fair value through profit or loss. These vehicles provide credit protection on reference portfolios of Santander UK group loans with
junior notes sold to external investors. The notes retained by Santander UK are classified as level 3 financial instruments as their valuation depends upon
unobservable parameters relating to the underlying reference portfolios of loans, including credit spreads, correlations and prepayment speed, which have
a significant effect on the overall valuation. For more information, see ‘Credit protection entities’ in Note 21.
6. FVOCI assets – Loans and advances to customers – other loans
The changes to the classification and measurement of financial assets on transition to IFRS 9 as set out in Note 44 resulted in some loans and advances
to customers, primarily consisting of utilities and shipping counterparties, being reclassified from amortised cost to FVOCI. The fair value of these loans is
estimated using the ‘present value’ model based on a credit curve derived from current market spreads. Loan specific credit data is unobservable, so a
proxy population is applied based on industry sector and credit rating.
7. Derivative liabilities – Equity contracts
There are three types of derivatives within this category:
European options – These are valued using a modified Black-Scholes model where the HPI is log-normally distributed with the forward rates determined
from the HPI forward growth.
Asian options – Asian (or average value) options are valued using a modified Black-Scholes model, with an amended strike price and volatility
assumption to account for the average exercise period, through a closed form adjustment that reflects the strike price relative to the distribution of stock
prices at each relevant date. This is also known as the Curran model.
Forward contracts – Forward contracts are valued using a standard forward pricing model.
The inputs used to determine the value of the above instruments are HPI spot rate, HPI forward growth rate and HPI volatility, as described in instrument 1
above. The principal pricing parameter is HPI forward growth rate.
8. FVTPL liabilities –Financial guarantees
These relate to credit protection guarantees in respect of the proceeds of the retained senior tranches of credit linked notes described in Instrument 5
above, and have been designated at fair value through profit or loss. These instruments are valued using the same unobservable parameters described in
Instrument 5 above, such that changes in the valuation of the senior tranches of the credit linked notes are offset by changes in the value of these credit
protection guarantees. For more information, see ‘Credit protection entities’ in Note 21.
Reconciliation of fair value measurement in Level 3 of the fair value hierarchy
The following table sets out the movements in Level 3 financial instruments in 2018 and 2017:
Assets Liabilities
Derivatives
£m
Other financial
assets at
FVTPL
£m
Financial
assets at
FVOCI
£m
Financial
investments
£m
Total
£m
Derivatives
£m
Other financial
liabilities at
FVTPL
£m
Total
£m
At 31 December 2017 64 240 53 357 (63) (6) (69)
Adoption of IFRS 9 – 598 199 (53) 744 – – –
At 1 January 2018 64 838 199 – 1,101 (63) (6) (69)
Total (losses)/gains recognised in profit or loss:
– Fair value movements 28 (5) (5) 18 1 (13) (12)
– Foreign exchange and other movements (5) – – (5) 5 (1) 4
Transfers in 35 18 – 53 (31) (29) (60)
Additions – 280 17 297 – – –
Sales – (95) – (95) – – –
Settlements (28) (60) (138) (226) 22 – 22
At 31 December 2018 94 976 73 1,143 (66) (49) (115)
(Losses)/gains recognised in profit or loss relating to assets
and liabilities held at the end of the year 23 (5) (5) 13 6 (14) (8)
At 1 January 2017 103 264 32 399 (74) (6) (80)
Total (losses)/gains recognised in profit or loss:
– Fair value movements (32) (16) – (48) 14 – 14
– Foreign exchange and other movements 32 – – 32 (32) – (32)
Gains recognised in other comprehensive income – – 21 21 – – –
Additions 9 – – 9 (2) – (2)
Sales – (8) – (8) – – –
Settlements (48) – – (48) 31 – 31
At 31 December 2017 64 240 53 357 (63) (6) (69)
(Losses)/gains recognised in profit or loss relating to assets
and liabilities held at the end of the year – (16) – (16) (18) – (18)
206 Santander UK plc
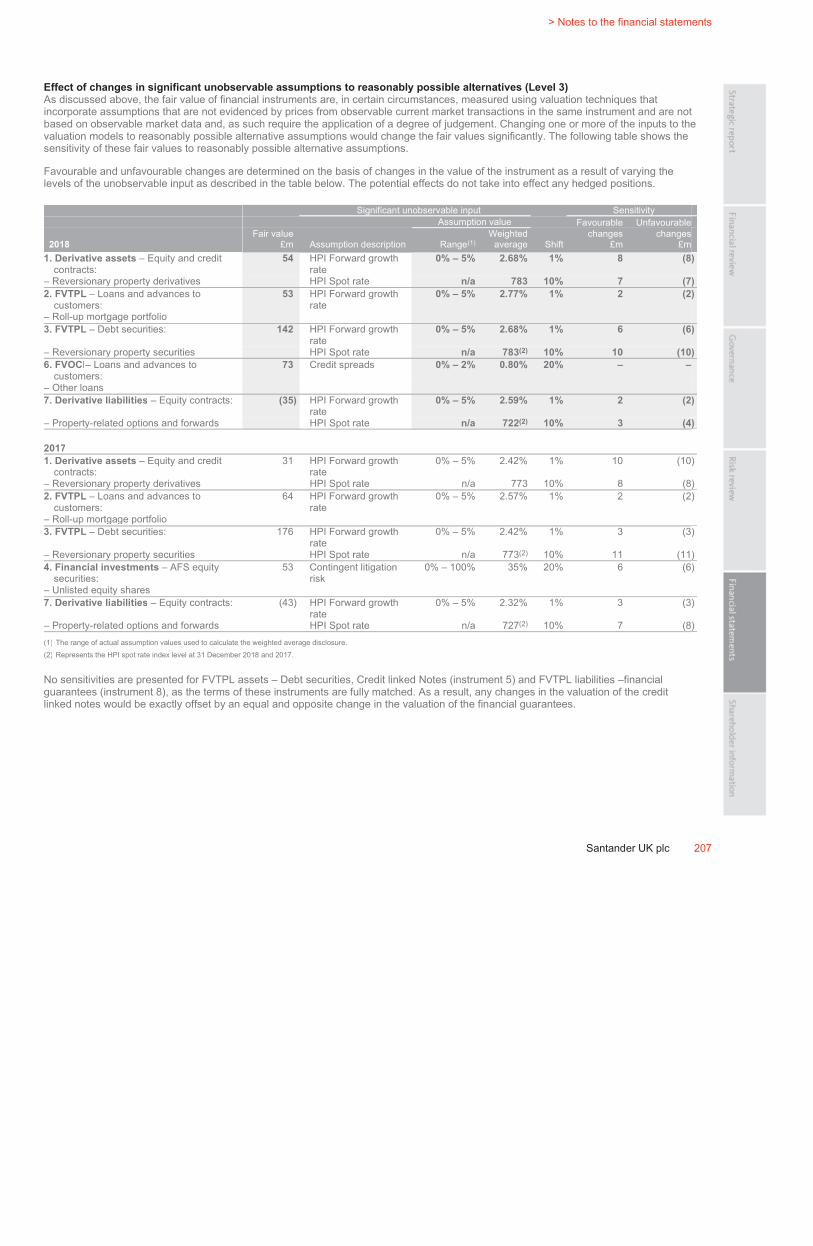
ˆ200G2Mlv!2YG4mc6NŠ200G2Mlv!2YG4mc6N
628340 TX 207SANTANDERFORM 20-F (SAN UK PL
03-Mar-2019 23:29 ESTHTMLON
Donnelley Financial EGV annas1dc 7*ESS 0C
VDI-W7-PFD-029812.9.12.0
bar5
Page 1 of 1
> Notes to the financial statements
Santander UK plc 207
Effect of changes in significant unobservable assumptions to reasonably possible alternatives (Level 3)
As discussed above, the fair value of financial instruments are, in certain circumstances, measured using valuation techniques that
incorporate assumptions that are not evidenced by prices from observable current market transactions in the same instrument and are not
based on observable market data and, as such require the application of a degree of judgement. Changing one or more of the inputs to the
valuation models to reasonably possible alternative assumptions would change the fair values significantly. The following table shows the
sensitivity of these fair values to reasonably possible alternative assumptions.
Favourable and unfavourable changes are determined on the basis of changes in the value of the instrument as a result of varying the
levels of the unobservable input as described in the table below. The potential effects do not take into effect any hedged positions.
Significant unobservable input Sensitivity
Assumption value Favourable Unfavourable
2018
Fair value
£m Assumption description Range(1)
Weighted
average Shift
changes
£m
changes
£m
1. Derivative assets – Equity and credit
contracts:
54 HPI Forward growth
rate
0% – 5% 2.68% 1% 8 (8)
– Reversionary property derivatives HPI Spot rate n/a 783 10% 7 (7)
2. FVTPL – Loans and advances to
customers:
53 HPI Forward growth
rate
0% – 5% 2.77% 1% 2 (2)
– Roll-up mortgage portfolio
3. FVTPL – Debt securities: 142 HPI Forward growth
rate
0% – 5% 2.68% 1% 6 (6)
– Reversionary property securities HPI Spot rate n/a 783(2) 10% 10 (10)
6. FVOCI– Loans and advances to
customers:
73 Credit spreads 0% – 2% 0.80% 20% – –
– Other loans
7. Derivative liabilities – Equity contracts: (35) HPI Forward growth
rate
0% – 5% 2.59% 1% 2 (2)
– Property-related options and forwards HPI Spot rate n/a 722(2) 10% 3 (4)
2017
1. Derivative assets – Equity and credit
contracts:
31 HPI Forward growth
rate
0% – 5% 2.42% 1% 10 (10)
– Reversionary property derivatives HPI Spot rate n/a 773 10% 8 (8)
2. FVTPL – Loans and advances to
customers:
64 HPI Forward growth
rate
0% – 5% 2.57% 1% 2 (2)
– Roll-up mortgage portfolio
3. FVTPL – Debt securities: 176 HPI Forward growth
rate
0% – 5% 2.42% 1% 3 (3)
– Reversionary property securities HPI Spot rate n/a 773(2) 10% 11 (11)
4. Financial investments – AFS equity
securities:
53 Contingent litigation
risk
0% – 100% 35% 20% 6 (6)
– Unlisted equity shares
7. Derivative liabilities – Equity contracts: (43) HPI Forward growth
rate
0% – 5% 2.32% 1% 3 (3)
– Property-related options and forwards HPI Spot rate n/a 727(2) 10% 7 (8)
(1) The range of actual assumption values used to calculate the weighted average disclosure.
(2) Represents the HPI spot rate index level at 31 December 2018 and 2017.
No sensitivities are presented for FVTPL assets – Debt securities, Credit linked Notes (instrument 5) and FVTPL liabilities –financial
guarantees (instrument 8), as the terms of these instruments are fully matched. As a result, any changes in the valuation of the credit
linked notes would be exactly offset by an equal and opposite change in the valuation of the financial guarantees.

ˆ200G2Mlv!2XsJS6goŠ200G2Mlv!2XsJS6go
628340 TX 208SANTANDERFORM 20-F (SAN UK PL
03-Mar-2019 22:47 ESTHTMLON
Donnelley Financial EGV marik1dc 5*ESS 0C
VDI-W7-PFL-060212.9.12.0
Page 1 of 1
Annual Report 2018 | Financial statements
i) Maturities of financial liabilities and off-balance sheet commitments
The table below analyses the maturities of the undiscounted cash flows relating to financial liabilities and off-balance sheet commitments of Santander UK
based on the remaining period to the contractual maturity date at the balance sheet date. Deposits by customers largely consist of retail deposits. This
table is not intended to show the liquidity of Santander UK.
Group
2018
On demand
£m
Not later than
3 months
£m
Later than
3 months
and not later
than 1 year
£m
Later than
1 year
and not later
than 5 years
£m
Later than
5 years
£m
Total
£m
Financial liabilities
Trading liabilities – – – – – –
Derivative financial instruments – 431 57 41 1,003 1,532
Other financial liabilities at fair value through profit or loss 11 2,146 76 408 3,855 6,496
Deposits by customers 159,009 3,422 9,491 5,216 1,305 178,443
Deposits by banks 5,096 1,100 90 11,100 52 17,438
Repurchase agreements – non trading 2 9,101 972 849 517 11,441
Debt securities in issue – 9,157 5,520 23,051 10,921 48,649
Subordinated liabilities – 255 134 709 5,279 6,377
Total financial liabilities 164,118 25,612 16,340 41,374 22,932 270,376
Off-balance sheet commitments given 1,106 5,843 670 13,413 18,987 40,019
2017
Financial liabilities
Trading liabilities 1,520 26,914 152 161 2,580 31,327
Derivative financial instruments 15 631 1,230 2,925 14,001 18,802
Other financial liabilities at fair value through profit or loss 7 545 222 789 814 2,377
Deposits by customers 154,114 4,764 13,869 6,720 4,604 184,071
Deposits by banks 2,452 1,465 82 8,626 208 12,833
Repurchase agreements – non trading – 1 832 248 – 1,081
Debt securities in issue – 8,395 4,821 22,927 7,933 44,076
Subordinated liabilities – 289 147 783 5,571 6,790
Total financial liabilities 158,108 43,004 21,355 43,179 35,711 301,357
Off-balance sheet commitments given 2,082 6,874 1,844 12,399 18,860 42,059
As the above table is based on contractual maturities, no account is taken of call features related to subordinated liabilities. In addition, the repayment
terms of debt securities may be accelerated in line with the covenants described in Note 29. Further, no account is taken of the possible early repayment
of Santander UK’s mortgage-backed non-recourse finance which is redeemed by Santander UK as funds become available from redemptions of the
residential mortgages. Santander UK has no control over the timing and amount of redemptions of residential mortgages.
208 Santander UK plc
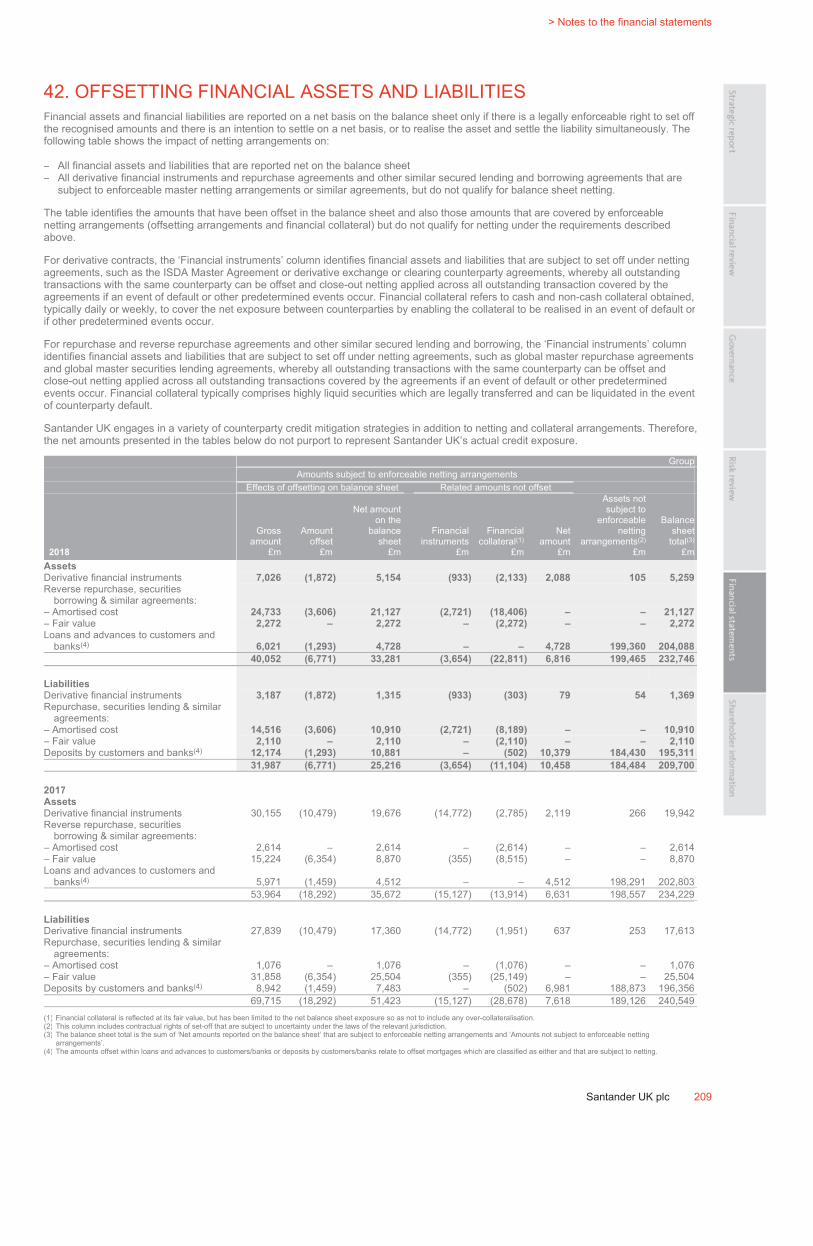
ˆ200G2Mlv!2WV#&P6KŠ200G2Mlv!2WV#&P6K
628340 TX 209SANTANDERFORM 20-F (SAN UK PL
03-Mar-2019 18:40 ESTHTMLON
Donnelley Financial EGV samym0dc 4*ESS 0C
VDI-W7-PFL-017112.9.12.0
bar5
Page 1 of 1
> Notes to the financial statements
Santander UK plc 209
42. OFFSETTING FINANCIAL ASSETS AND LIABILITIES
Financial assets and financial liabilities are reported on a net basis on the balance sheet only if there is a legally enforceable right to set off
the recognised amounts and there is an intention to settle on a net basis, or to realise the asset and settle the liability simultaneously. The
following table shows the impact of netting arrangements on:
– All financial assets and liabilities that are reported net on the balance sheet
– All derivative financial instruments and repurchase agreements and other similar secured lending and borrowing agreements that are
subject to enforceable master netting arrangements or similar agreements, but do not qualify for balance sheet netting.
The table identifies the amounts that have been offset in the balance sheet and also those amounts that are covered by enforceable
netting arrangements (offsetting arrangements and financial collateral) but do not qualify for netting under the requirements described
above.
For derivative contracts, the ‘Financial instruments’ column identifies financial assets and liabilities that are subject to set off under netting
agreements, such as the ISDA Master Agreement or derivative exchange or clearing counterparty agreements, whereby all outstanding
transactions with the same counterparty can be offset and close-out netting applied across all outstanding transaction covered by the
agreements if an event of default or other predetermined events occur. Financial collateral refers to cash and non-cash collateral obtained,
typically daily or weekly, to cover the net exposure between counterparties by enabling the collateral to be realised in an event of default or
if other predetermined events occur.
For repurchase and reverse repurchase agreements and other similar secured lending and borrowing, the ‘Financial instruments’ column
identifies financial assets and liabilities that are subject to set off under netting agreements, such as global master repurchase agreements
and global master securities lending agreements, whereby all outstanding transactions with the same counterparty can be offset and
close-out netting applied across all outstanding transactions covered by the agreements if an event of default or other predetermined
events occur. Financial collateral typically comprises highly liquid securities which are legally transferred and can be liquidated in the event
of counterparty default.
Santander UK engages in a variety of counterparty credit mitigation strategies in addition to netting and collateral arrangements. Therefore,
the net amounts presented in the tables below do not purport to represent Santander UK’s actual credit exposure.
Group
Amounts subject to enforceable netting arrangements
Effects of offsetting on balance sheet Related amounts not offset
2018
Gross
amount
£m
Amount
offset
£m
Net amount
on the
balance
sheet
£m
Financial
instruments
£m
Financial
collateral(1)
£m
Net
amount
£m
Assets not
subject to
enforceable
netting
arrangements(2)
£m
Balance
sheet
total(3)
£m
Assets
Derivative financial instruments 7,026 (1,872) 5,154 (933) (2,133) 2,088 105 5,259
Reverse repurchase, securities
borrowing & similar agreements:
– Amortised cost 24,733 (3,606) 21,127 (2,721) (18,406) – – 21,127
– Fair value 2,272 – 2,272 – (2,272) – – 2,272
Loans and advances to customers and
banks(4) 6,021 (1,293) 4,728 – – 4,728 199,360 204,088
40,052 (6,771) 33,281 (3,654) (22,811) 6,816 199,465 232,746
Liabilities
Derivative financial instruments 3,187 (1,872) 1,315 (933) (303) 79 54 1,369
Repurchase, securities lending & similar
agreements:
– Amortised cost 14,516 (3,606) 10,910 (2,721) (8,189) – – 10,910
– Fair value 2,110 – 2,110 – (2,110) – – 2,110
Deposits by customers and banks(4)
12,174 (1,293) 10,881 – (502) 10,379 184,430 195,311
31,987 (6,771) 25,216 (3,654) (11,104) 10,458 184,484 209,700
2017
Assets
Derivative financial instruments 30,155 (10,479) 19,676 (14,772) (2,785) 2,119 266 19,942
Reverse repurchase, securities
borrowing & similar agreements:
– Amortised cost 2,614 – 2,614 – (2,614) – – 2,614
– Fair value 15,224 (6,354) 8,870 (355) (8,515) – – 8,870
Loans and advances to customers and
banks(4) 5,971 (1,459) 4,512 – – 4,512 198,291 202,803
53,964 (18,292) 35,672 (15,127) (13,914) 6,631 198,557 234,229
Liabilities
Derivative financial instruments 27,839 (10,479) 17,360 (14,772) (1,951) 637 253 17,613
Repurchase, securities lending & similar
agreements:
– Amortised cost 1,076 – 1,076 – (1,076) – – 1,076
– Fair value 31,858 (6,354) 25,504 (355) (25,149) – – 25,504
Deposits by customers and banks(4)
8,942 (1,459) 7,483 – (502) 6,981 188,873 196,356
69,715 (18,292) 51,423 (15,127) (28,678) 7,618 189,126 240,549
(1) Financial collateral is reflected at its fair value, but has been limited to the net balance sheet exposure so as not to include any over-collateralisation.
(2) This column includes contractual rights of set-off that are subject to uncertainty under the laws of the relevant jurisdiction.
(3) The balance sheet total is the sum of ‘Net amounts reported on the balance sheet’ that are subject to enforceable netting arrangements and ‘Amounts not subject to enforceable netting
arrangements’.
(4) The amounts offset within loans and advances to customers/banks or deposits by customers/banks relate to offset mortgages which are classified as either and that are subject to netting.

ˆ200G2Mlv!2YKd5@gzŠ200G2Mlv!2YKd5@gz
628340 TX 210SANTANDERFORM 20-F (SAN UK PL
03-Mar-2019 23:38 ESTHTMLON
Donnelley Financial EGV annas1dc 3*ESS 0C
VDI-W7-PFD-029812.9.12.0
Page 1 of 1
Annual Report 2018 | Financial statements
This page left intentionally blank
210 Santander UK plc

ˆ200G2Mlv!2Yp&i$gDŠ200G2Mlv!2Yp&i$gD
628340 TX 211SANTANDERFORM 20-F (SAN UK PL
04-Mar-2019 00:09 ESTHTMLON
Donnelley Financial EGV annas1dc 5*ESS 0C
VDI-W7-PFD-029812.9.12.0
bar5
Page 1 of 1
> Notes to the financial statements
Santander UK plc 211
43. RING-FENCING
Regulation
The Financial Services (Banking Reform) Act 2013 inserted provisions into the Financial Services and Markets Act 2000 (FSMA) and
related legislation (the Banking Reform Legislation) requiring the Santander UK group amongst a number of other UK banking groups, to
operationally and legally separate certain retail banking activities from certain wholesale or investment banking activities by 1 January
2019. This is known as ‘ring-fencing’. The Banking Reform Legislation specifies:
– Certain banking services or activities (principally deposit taking from individuals and SMEs) which must be undertaken by a ring-fenced
bank.
– Certain banking services and activities, along with certain types of credit risk exposure or off-balance sheet items, which a ring-fenced
bank will be prohibited from carrying on or incurring (prohibited business).
As a result, under the ring-fencing regime, a ring-fenced bank is only permitted to carry on banking services or activities that are not
prohibited (permitted business).
Santander UK group model
Our ring-fence structure was completed ahead of the 1 January 2019 regulatory deadline. Its implementation involved a ring-fencing
transfer scheme (RFTS) between Santander UK plc, ANTS and Banco Santander SA, as well as asset sales and the rundown of certain
short-term positions. Under our chosen model:
– Santander UK plc is the primary ring-fenced bank within a ring-fenced bank sub-group and serves all of our personal customers in the
UK, and the majority of our business banking customers. Santander UK plc also broadly, to the extent allowed by the legislation,
continues to hold and serve Santander’s corporate banking business in the UK. Any products Santander UK can’t offer, or customers it
can’t serve, from within the ring-fenced bank (which includes some Corporate & Investment Banking business and some Corporate &
Commercial Banking customers) are, in most cases, provided or served by the wider Banco Santander group, notably through its Banco
Santander London Branch. Santander UK plc continues to be a subsidiary of Santander UK Group Holdings plc, and is the holding
company of the Santander UK ring-fenced bank sub-group. Cater Allen Limited is also a ring-fenced bank and part of the Santander UK
ring-fenced bank sub-group. Neither Santander UK plc nor Cater Allen Limited conduct prohibited business.
– ANTS was emptied of most assets and liabilities, except for a small pool of residual assets and liabilities, and became a wholly-owned
direct subsidiary of Santander UK Group Holdings plc, outside the ring-fenced bank. The prohibited business of ANTS, which principally
included our derivatives business with financial institutions, certain corporates and our short term markets business, was either
transferred to Banco Santander London Branch or, in the case of the majority of our short term markets business, was run down. The
majority of the permitted business of ANTS transferred to Santander UK plc, with a small amount of the permitted business of ANTS
transferring to Banco Santander London Branch.
– The business of the Crown Dependency branches (Jersey and Isle of Man) of Santander UK plc was sold to ANTS pursuant to transfer
schemes effected under relevant Jersey and Isle of Man law, and therefore transferred out of the ring-fenced bank.
Any associated business transfers to Banco Santander London Branch were made for a cash consideration equivalent to the book value of
the associated assets and liabilities, which represents a fair value for the Santander UK group. Costs to sell were immaterial. Our ring-
fence structure is now in place with all required transfers completed. Compliance with ring-fencing legislation has involved significant effort
over a number of years, with a total cost of c£240m.
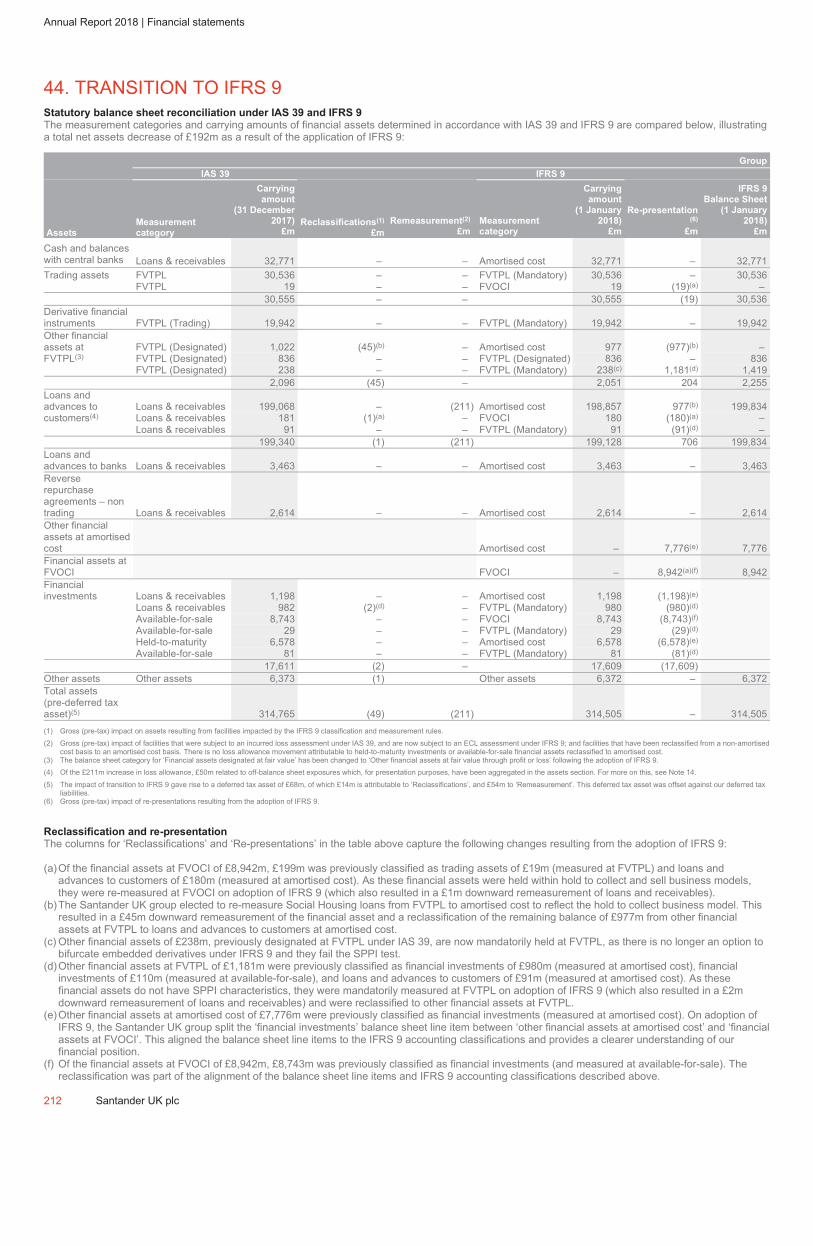
ˆ200G2Mlv!2Y@pb56!Š200G2Mlv!2Y@pb56!
628340 TX 212SANTANDERFORM 20-F (SAN UK PL
04-Mar-2019 00:18 ESTHTMLON
Donnelley Financial EGV annas1dc 13*ESS 0C
VDI-W7-PFD-029812.9.12.0
Page 1 of 1
Annual Report 2018 | Financial statements
44. TRANSITION TO IFRS 9
Statutory balance sheet reconciliation under IAS 39 and IFRS 9
The measurement categories and carrying amounts of financial assets determined in accordance with IAS 39 and IFRS 9 are compared below, illustrating
a total net assets decrease of £192m as a result of the application of IFRS 9:
Group
IAS 39 IFRS 9
Assets
Measurement
category
Carrying
amount
(31 December
2017)
£m
Reclassifications(1)
£m
Remeasurement(2)
£m
Measurement
category
Carrying
amount
(1 January
2018)
£m
Re-presentation
(6)
£m
IFRS 9
Balance Sheet
(1 January
2018)
£m
Cash and balances
with central banks Loans & receivables 32,771 – – Amortised cost 32,771 – 32,771
Trading assets FVTPL 30,536 – – FVTPL (Mandatory) 30,536 – 30,536
FVTPL 19 – – FVOCI 19 (19)(a) –
30,555 – – 30,555 (19) 30,536
Derivative financial
instruments FVTPL (Trading) 19,942 – – FVTPL (Mandatory) 19,942 – 19,942
Other financial
assets at FVTPL (Designated) 1,022 (45)(b)
– Amortised cost 977 (977)(b)
–
FVTPL(3)
FVTPL (Designated) 836 – – FVTPL (Designated) 836 – 836
FVTPL (Designated) 238 – – FVTPL (Mandatory) 238(c) 1,181(d) 1,419
2,096 (45) – 2,051 204 2,255
Loans and
advances to Loans & receivables 199,068 – (211) Amortised cost 198,857 977(b) 199,834
customers(4) Loans & receivables 181 (1)(a) – FVOCI 180 (180)(a) –
Loans & receivables 91 – – FVTPL (Mandatory) 91 (91)(d)
–
199,340 (1) (211) 199,128 706 199,834
Loans and
advances to banks Loans & receivables 3,463 – – Amortised cost 3,463 – 3,463
Reverse
repurchase
agreements – non
trading Loans & receivables 2,614 – – Amortised cost 2,614 – 2,614
Other financial
assets at amortised
cost Amortised cost – 7,776(e)
7,776
Financial assets at
FVOCI FVOCI – 8,942(a)(f)
8,942
Financial
investments Loans & receivables 1,198 – – Amortised cost 1,198 (1,198)(e)
Loans & receivables 982 (2)(d) – FVTPL (Mandatory) 980 (980)(d)
Available-for-sale 8,743 – – FVOCI 8,743 (8,743)(f)
Available-for-sale 29 – – FVTPL (Mandatory) 29 (29)(d)
Held-to-maturity 6,578 – – Amortised cost 6,578 (6,578)(e)
Available-for-sale 81 – – FVTPL (Mandatory) 81 (81)(d)
17,611 (2) – 17,609 (17,609)
Other assets Other assets 6,373 (1) Other assets 6,372 – 6,372
Total assets
(pre-deferred tax
asset)(5) 314,765 (49) (211) 314,505 – 314,505
(1) Gross (pre-tax) impact on assets resulting from facilities impacted by the IFRS 9 classification and measurement rules.
(2) Gross (pre-tax) impact of facilities that were subject to an incurred loss assessment under IAS 39, and are now subject to an ECL assessment under IFRS 9; and facilities that have been reclassified from a non-amortised
cost basis to an amortised cost basis. There is no loss allowance movement attributable to held-to-maturity investments or available-for-sale financial assets reclassified to amortised cost.
(3) The balance sheet category for ‘Financial assets designated at fair value’ has been changed to ‘Other financial assets at fair value through profit or loss’ following the adoption of IFRS 9.
(4) Of the £211m increase in loss allowance, £50m related to off-balance sheet exposures which, for presentation purposes, have been aggregated in the assets section. For more on this, see Note 14.
(5) The impact of transition to IFRS 9 gave rise to a deferred tax asset of £68m, of which £14m is attributable to ‘Reclassifications’, and £54m to ‘Remeasurement’. This deferred tax asset was offset against our deferred tax
liabilities.
(6) Gross (pre-tax) impact of re-presentations resulting from the adoption of IFRS 9.
Reclassification and re-presentation
The columns for ‘Reclassifications’ and ‘Re-presentations’ in the table above capture the following changes resulting from the adoption of IFRS 9:
(a)Of the financial assets at FVOCI of £8,942m, £199m was previously classified as trading assets of £19m (measured at FVTPL) and loans and
advances to customers of £180m (measured at amortised cost). As these financial assets were held within hold to collect and sell business models,
they were re-measured at FVOCI on adoption of IFRS 9 (which also resulted in a £1m downward remeasurement of loans and receivables).
(b)The Santander UK group elected to re-measure Social Housing loans from FVTPL to amortised cost to reflect the hold to collect business model. This
resulted in a £45m downward remeasurement of the financial asset and a reclassification of the remaining balance of £977m from other financial
assets at FVTPL to loans and advances to customers at amortised cost.
(c) Other financial assets of £238m, previously designated at FVTPL under IAS 39, are now mandatorily held at FVTPL, as there is no longer an option to
bifurcate embedded derivatives under IFRS 9 and they fail the SPPI test.
(d)Other financial assets at FVTPL of £1,181m were previously classified as financial investments of £980m (measured at amortised cost), financial
investments of £110m (measured at available-for-sale), and loans and advances to customers of £91m (measured at amortised cost). As these
financial assets do not have SPPI characteristics, they were mandatorily measured at FVTPL on adoption of IFRS 9 (which also resulted in a £2m
downward remeasurement of loans and receivables) and were reclassified to other financial assets at FVTPL.
(e)Other financial assets at amortised cost of £7,776m were previously classified as financial investments (measured at amortised cost). On adoption of
IFRS 9, the Santander UK group split the ‘financial investments’ balance sheet line item between ‘other financial assets at amortised cost’ and ‘financial
assets at FVOCI’. This aligned the balance sheet line items to the IFRS 9 accounting classifications and provides a clearer understanding of our
financial position.
(f) Of the financial assets at FVOCI of £8,942m, £8,743m was previously classified as financial investments (and measured at available-for-sale). The
reclassification was part of the alignment of the balance sheet line items and IFRS 9 accounting classifications described above.
212 Santander UK plc

ˆ200G2Mlv!2SMf%CgÉŠ200G2Mlv!2SMf%Cg
628340 TX 213SANTANDERFORM 20-F (SAN UK PL
03-Mar-2019 06:58 ESTHTMLON
Donnelley Financial EGV shanv1dc 3*ESS 0C
VDI-W7-PFL-091012.9.12.0
bar5
Page 1 of 1
> Notes to the financial statements
Santander UK plc 213
Reclassifications of debt instruments
For financial assets that were reclassified on transition to IFRS 9, the following table shows their fair value at 31 December 2018 and the
fair value gain or loss that would have been recognised if these financial assets had not been reclassified:
Group
2018
£m
To amortised cost from FVTPL:
Fair value at 31 December 2018 1,347
Fair value gain that would have been recognised during the year if the financial asset had not been reclassified 120
The effective interest rate of these debt instruments on the date of initial application of IFRS 9 was 3.35%. In 2018, interest income of
£21m was recognised for these debt instruments.

ˆ200G2Mlv!2SMc!xgpŠ200G2Mlv!2SMc!xgp
628340 TX 214SANTANDERFORM 20-F (SAN UK PL
03-Mar-2019 06:57 ESTHTMLON
Donnelley Financial EGV shanv1dc 3*ESS 0C
VDI-W7-PFL-091012.9.12.0
Page 1 of 1
Annual Report 2018 | Financial statements
45. EVENTS AFTER THE BALANCE SHEET DATE
There have been no significant events between 31 December 2018 and the date of approval of these financial statements which would require a change
to or additional disclosure in the financial statements, except for the following:
In January 2019, we announced plans to reshape our branch network and close 140 branches in response to changes in how customers are choosing to
carry out their banking. Our future branch network, with approximately 615 branches, will be made up of a combination of larger branches offering
improved community facilities to support local businesses and customers, and smaller branches using the latest technology to offer customers more
convenient access to banking services. Furthermore, in order to deliver a branch network for the future, 100 branches will be refurbished over the next two
years through an investment of £55m. At 31 December 2018, no provision was recognised in respect of these plans as the relevant criteria under IAS 37
‘Provisions, contingent liabilities and contingent assets’ had not been met.
214 Santander UK plc

ˆ200G2Mlv!2=Pt99g!Š200G2Mlv!2=Pt99g!
628340 TX 215SANTANDERFORM 20-F (SAN UK PL
04-Mar-2019 02:01 ESTHTMLON
Donnelley Financial EGV gopad0dc 9*ESS 0C
VDI-W7-PFD-037812.9.12.0
bar6n
Page 1 of 1
Shareholder information
Contents
Selected financial data 216
Subsidiaries, joint ventures and
associates 218
Forward-looking statements 220
Santander UK plc 215
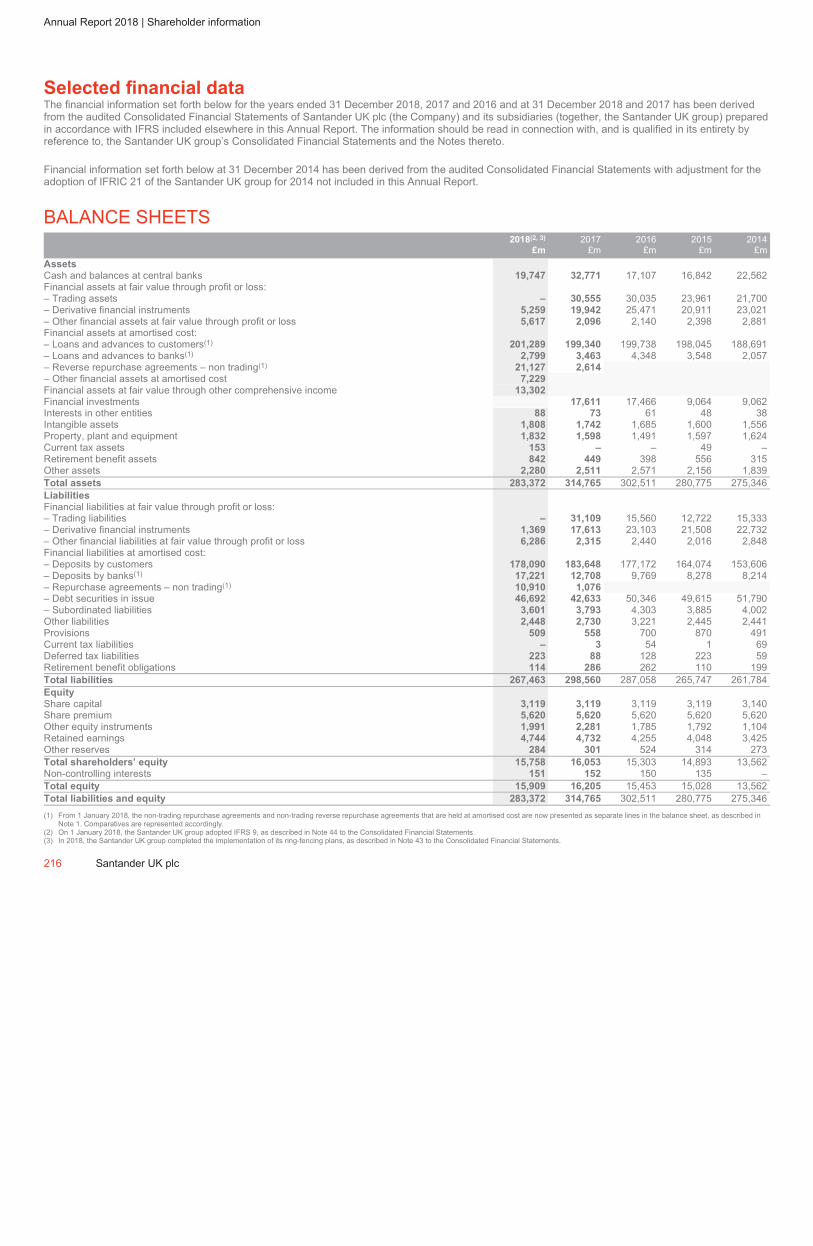
ˆ200G2Mlv!2=4nZ26wŠ200G2Mlv!2=4nZ26w
628340 TX 216SANTANDERFORM 20-F (SAN UK PL
04-Mar-2019 01:43 ESTHTMLON
Donnelley Financial EGV gopad0dc 8*ESS 0C
VDI-W7-PFD-037812.9.12.0
Page 1 of 1
Annual Report 2018 | Shareholder information
Selected financial data
The financial information set forth below for the years ended 31 December 2018, 2017 and 2016 and at 31 December 2018 and 2017 has been derived
from the audited Consolidated Financial Statements of Santander UK plc (the Company) and its subsidiaries (together, the Santander UK group) prepared
in accordance with IFRS included elsewhere in this Annual Report. The information should be read in connection with, and is qualified in its entirety by
reference to, the Santander UK group’s Consolidated Financial Statements and the Notes thereto.
Financial information set forth below at 31 December 2014 has been derived from the audited Consolidated Financial Statements with adjustment for the
adoption of IFRIC 21 of the Santander UK group for 2014 not included in this Annual Report.
BALANCE SHEETS
2018(2, 3)
£m
2017
£m
2016
£m
2015
£m
2014
£m
Assets
Cash and balances at central banks 19,747 32,771 17,107 16,842 22,562
Financial assets at fair value through profit or loss:
– Trading assets – 30,555 30,035 23,961 21,700
– Derivative financial instruments 5,259 19,942 25,471 20,911 23,021
– Other financial assets at fair value through profit or loss 5,617 2,096 2,140 2,398 2,881
Financial assets at amortised cost:
– Loans and advances to customers(1) 201,289 199,340 199,738 198,045 188,691
– Loans and advances to banks(1) 2,799 3,463 4,348 3,548 2,057
– Reverse repurchase agreements – non trading(1) 21,127 2,614
– Other financial assets at amortised cost 7,229
Financial assets at fair value through other comprehensive income 13,302
Financial investments 17,611 17,466 9,064 9,062
Interests in other entities 88 73 61 48 38
Intangible assets 1,808 1,742 1,685 1,600 1,556
Property, plant and equipment 1,832 1,598 1,491 1,597 1,624
Current tax assets 153 – – 49 –
Retirement benefit assets 842 449 398 556 315
Other assets 2,280 2,511 2,571 2,156 1,839
Total assets 283,372 314,765 302,511 280,775 275,346
Liabilities
Financial liabilities at fair value through profit or loss:
– Trading liabilities – 31,109 15,560 12,722 15,333
– Derivative financial instruments 1,369 17,613 23,103 21,508 22,732
– Other financial liabilities at fair value through profit or loss 6,286 2,315 2,440 2,016 2,848
Financial liabilities at amortised cost:
– Deposits by customers 178,090 183,648 177,172 164,074 153,606
– Deposits by banks(1)
17,221 12,708 9,769 8,278 8,214
– Repurchase agreements – non trading(1)
10,910 1,076
– Debt securities in issue 46,692 42,633 50,346 49,615 51,790
– Subordinated liabilities 3,601 3,793 4,303 3,885 4,002
Other liabilities 2,448 2,730 3,221 2,445 2,441
Provisions 509 558 700 870 491
Current tax liabilities – 3 54 1 69
Deferred tax liabilities 223 88 128 223 59
Retirement benefit obligations 114 286 262 110 199
Total liabilities 267,463 298,560 287,058 265,747 261,784
Equity
Share capital 3,119 3,119 3,119 3,119 3,140
Share premium 5,620 5,620 5,620 5,620 5,620
Other equity instruments 1,991 2,281 1,785 1,792 1,104
Retained earnings 4,744 4,732 4,255 4,048 3,425
Other reserves 284 301 524 314 273
Total shareholders’ equity 15,758 16,053 15,303 14,893 13,562
Non-controlling interests 151 152 150 135 –
Total equity 15,909 16,205 15,453 15,028 13,562
Total liabilities and equity 283,372 314,765 302,511 280,775 275,346
(1) From 1 January 2018, the non-trading repurchase agreements and non-trading reverse repurchase agreements that are held at amortised cost are now presented as separate lines in the balance sheet, as described in
Note 1. Comparatives are represented accordingly.
(2) On 1 January 2018, the Santander UK group adopted IFRS 9, as described in Note 44 to the Consolidated Financial Statements.
(3) In 2018, the Santander UK group completed the implementation of its ring-fencing plans, as described in Note 43 to the Consolidated Financial Statements.
216 Santander UK plc
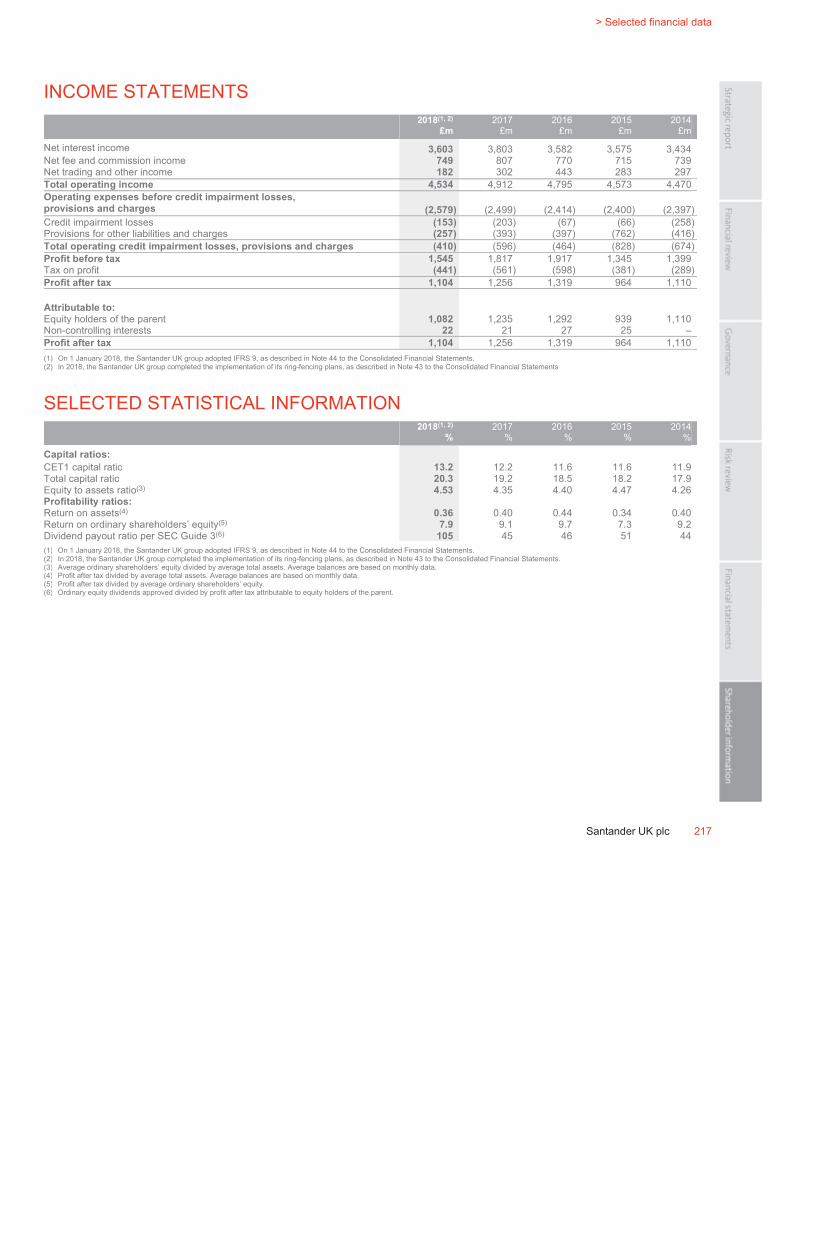
ˆ200G2Mlv!3FimMz6eŠ200G2Mlv!3FimMz6e
628340 TX 217SANTANDERFORM 20-F (SAN UK PL
06-Mar-2019 08:06 ESTHTMLON
Donnelley Financial EGV beagp0ln 9*ESS 0C
VDI-W7-PFD-043112.9.12.0
bar6n
Page 1 of 1
> Selected financial data
Santander UK plc 217
INCOME STATEMENTS 2018(1, 2)
£m
2017 £m
2016 £m
2015 £m
2014 £m
Net interest income 3,603 3,803 3,582 3,575 3,434Net fee and commission income 749 807 770 715 739Net trading and other income 182 302 443 283 297Total operating income 4,534 4,912 4,795 4,573 4,470Operating expenses before credit impairment losses,
provisions and charges (2,579) (2,499) (2,414) (2,400) (2,397) Credit impairment losses (153) (203) (67) (66) (258) Provisions for other liabilities and charges (257) (393) (397) (762) (416) Total operating credit impairment losses, provisions and charges (410) (596) (464) (828) (674) Profit before tax 1,545 1,817 1,917 1,345 1,399Tax on profit (441) (561) (598) (381) (289) Profit after tax 1,104 1,256 1,319 964 1,110
Attributable to:
Equity holders of the parent 1,082 1,235 1,292 939 1,110Non-controlling interests 22 21 27 25 –Profit after tax 1,104 1,256 1,319 964 1,110(1) On 1 January 2018, the Santander UK group adopted IFRS 9, as described in Note 44 to the Consolidated Financial Statements.(2) In 2018, the Santander UK group completed the implementation of its ring-fencing plans, as described in Note 43 to the Consolidated Financial Statements.
SELECTED STATISTICAL INFORMATION2018
(1, 2)
%
2017%
2016%
2015%
2014%
Capital ratios:
CET1 capital ratio 13.2 12.2 11.6 11.6 11.9Total capital ratio 20.3 19.2 18.5 18.2 17.9Equity to assets ratio(3)
4.53 4.35 4.40 4.47 4.26Profitability ratios:
Return on assets(4) 0.36 0.40 0.44 0.34 0.40Return on ordinary shareholders’ equity(5) 7.9 9.1 9.7 7.3 9.2Dividend payout ratio per SEC Guide 3(6) 105 45 46 51 44(1) On 1 January 2018, the Santander UK group adopted IFRS 9, as described in Note 44 to the Consolidated Financial Statements. (2) In 2018, the Santander UK group completed the implementation of its ring-fencing plans, as described in Note 43 to the Consolidated Financial Statements. (3) Average ordinary shareholders’ equity divided by average total assets. Average balances are based on monthly data. (4) Profit after tax divided by average total assets. Average balances are based on monthly data. (5) Profit after tax divided by average ordinary shareholders’ equity. (6) Ordinary equity dividends approved divided by profit after tax attributable to equity holders of the parent.
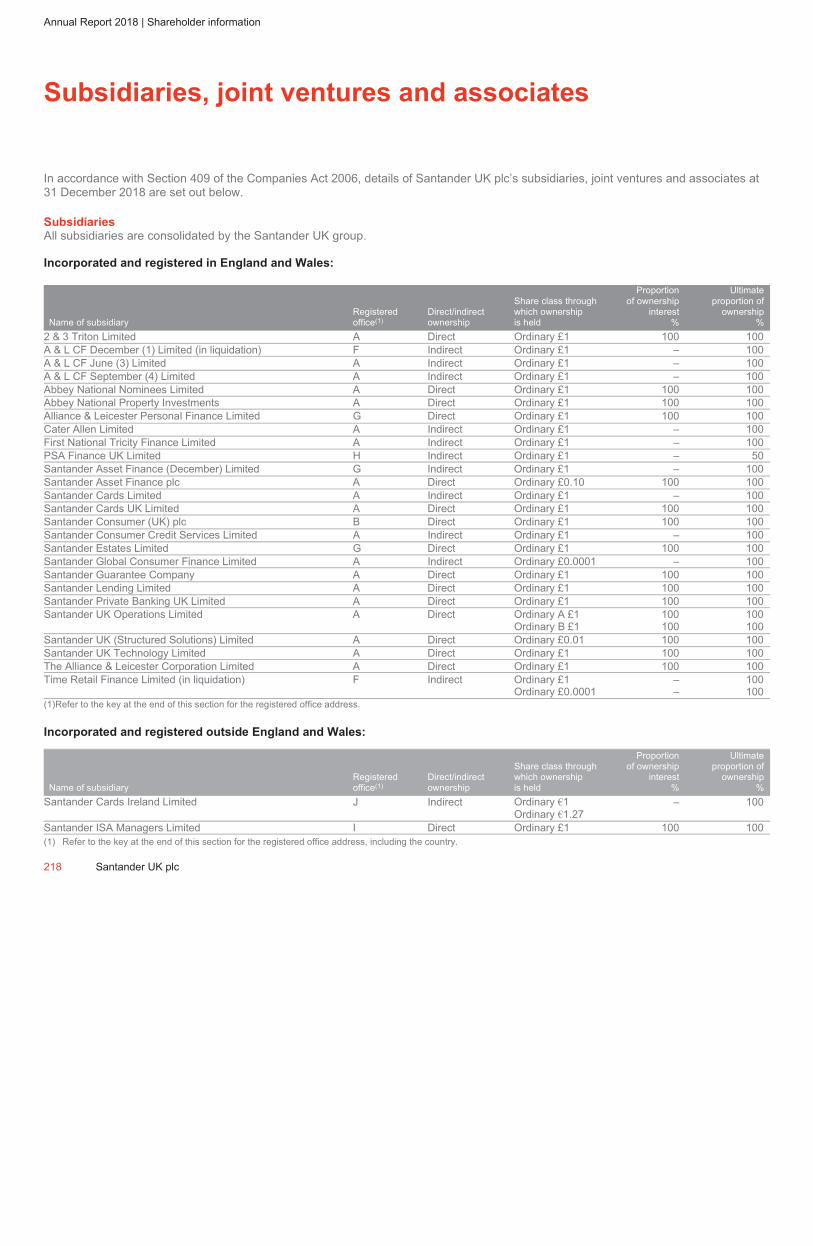
ˆ200G2Mlv!2dxgfL6PŠ200G2Mlv!2dxgfL6P
628340 TX 218SANTANDERFORM 20-F (SAN UK PL
04-Mar-2019 06:25 ESTHTMLON
Donnelley Financial EGV ramus0dc 11*ESS 0C
VDI-W7-PFD-036412.9.12.0
Page 1 of 1
Annual Report 2018 | Shareholder information
Subsidiaries, joint ventures and associates
In accordance with Section 409 of the Companies Act 2006, details of Santander UK plc’s subsidiaries, joint ventures and associates at
31 December 2018 are set out below.
Subsidiaries
All subsidiaries are consolidated by the Santander UK group.
Incorporated and registered in England and Wales:
Name of subsidiary
Registered
office(1)
Direct/indirect
ownership
Share class through
which ownership
is held
Proportion
of ownership
interest
%
Ultimate
proportion of
ownership
%
2 & 3 Triton Limited A Direct Ordinary £1 100 100
A & L CF December (1) Limited (in liquidation) F Indirect Ordinary £1 – 100
A & L CF June (3) Limited A Indirect Ordinary £1 – 100
A & L CF September (4) Limited A Indirect Ordinary £1 – 100
Abbey National Nominees Limited A Direct Ordinary £1 100 100
Abbey National Property Investments A Direct Ordinary £1 100 100
Alliance & Leicester Personal Finance Limited G Direct Ordinary £1 100 100
Cater Allen Limited A Indirect Ordinary £1 – 100
First National Tricity Finance Limited A Indirect Ordinary £1 – 100
PSA Finance UK Limited H Indirect Ordinary £1 – 50
Santander Asset Finance (December) Limited G Indirect Ordinary £1 – 100
Santander Asset Finance plc A Direct Ordinary £0.10 100 100
Santander Cards Limited A Indirect Ordinary £1 – 100
Santander Cards UK Limited A Direct Ordinary £1 100 100
Santander Consumer (UK) plc B Direct Ordinary £1 100 100
Santander Consumer Credit Services Limited A Indirect Ordinary £1 – 100
Santander Estates Limited G Direct Ordinary £1 100 100
Santander Global Consumer Finance Limited A Indirect Ordinary £0.0001 – 100
Santander Guarantee Company A Direct Ordinary £1 100 100
Santander Lending Limited A Direct Ordinary £1 100 100
Santander Private Banking UK Limited A Direct Ordinary £1 100 100
Santander UK Operations Limited A Direct Ordinary A £1 100 100
Ordinary B £1 100 100
Santander UK (Structured Solutions) Limited A Direct Ordinary £0.01 100 100
Santander UK Technology Limited A Direct Ordinary £1 100 100
The Alliance & Leicester Corporation Limited A Direct Ordinary £1 100 100
Time Retail Finance Limited (in liquidation) F Indirect Ordinary £1 – 100
Ordinary £0.0001 – 100
(1)Refer to the key at the end of this section for the registered office address.
Incorporated and registered outside England and Wales:
Name of subsidiary
Registered
office(1)
Direct/indirect
ownership
Share class through
which ownership
is held
Proportion
of ownership
interest
%
Ultimate
proportion of
ownership
%
Santander Cards Ireland Limited J Indirect Ordinary €1 – 100
Ordinary €1.27
Santander ISA Managers Limited I Direct Ordinary £1 100 100
(1) Refer to the key at the end of this section for the registered office address, including the country.
218 Santander UK plc
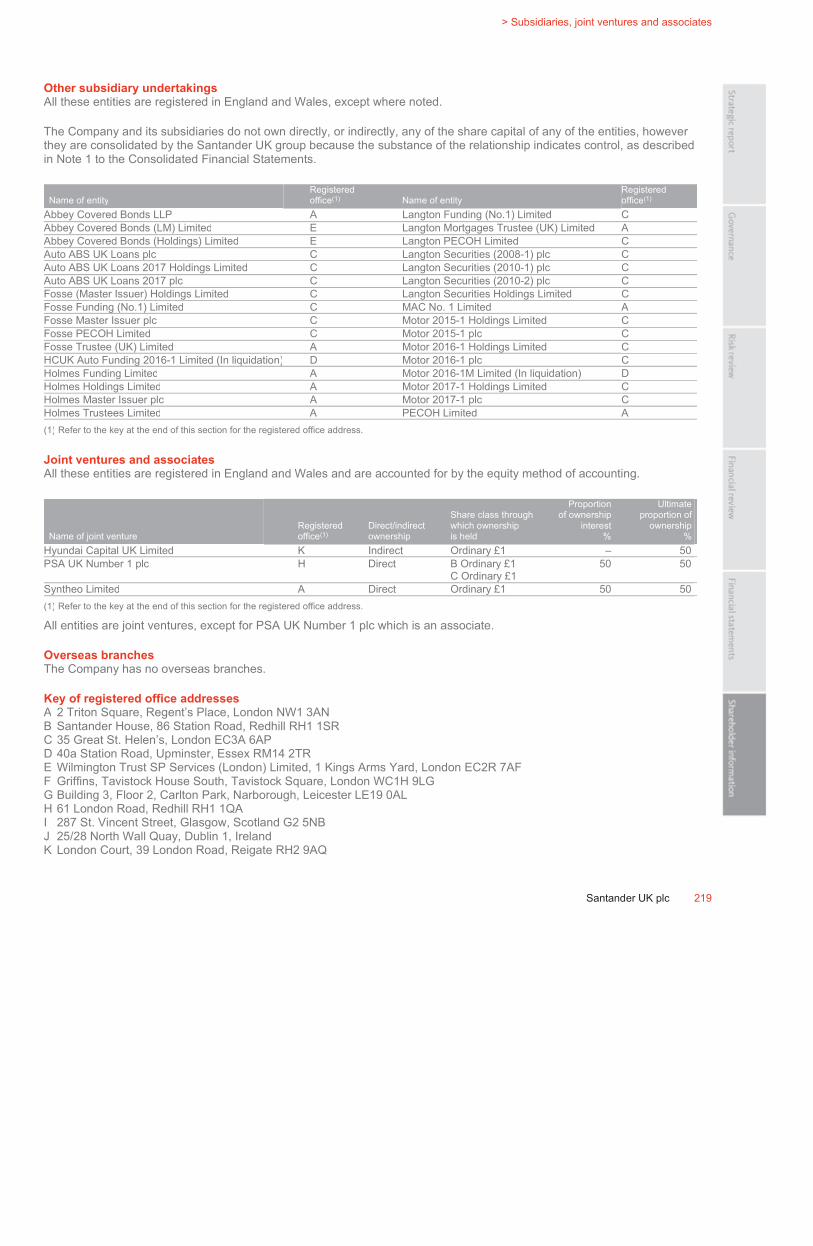
ˆ200G2Mlv!2aVt2PgÆŠ200G2Mlv!2aVt2Pg˘
628340 TX 219SANTANDERFORM 20-F (SAN UK PL
04-Mar-2019 02:58 ESTHTMLON
Donnelley Financial EGV annas1dc 8*ESS 0C
VDI-W7-PFD-029812.9.12.0
bar6
Page 1 of 1
> Subsidiaries, joint ventures and associates
Santander UK plc 219
Other subsidiary undertakings
All these entities are registered in England and Wales, except where noted.
The Company and its subsidiaries do not own directly, or indirectly, any of the share capital of any of the entities, however
they are consolidated by the Santander UK group because the substance of the relationship indicates control, as described
in Note 1 to the Consolidated Financial Statements.
Name of entity
Registered
office(1)
Name of entity
Registered
office(1)
Abbey Covered Bonds LLP A Langton Funding (No.1) Limited C
Abbey Covered Bonds (LM) Limited E Langton Mortgages Trustee (UK) Limited A
Abbey Covered Bonds (Holdings) Limited E Langton PECOH Limited C
Auto ABS UK Loans plc C Langton Securities (2008-1) plc C
Auto ABS UK Loans 2017 Holdings Limited C Langton Securities (2010-1) plc C
Auto ABS UK Loans 2017 plc C Langton Securities (2010-2) plc C
Fosse (Master Issuer) Holdings Limited C Langton Securities Holdings Limited C
Fosse Funding (No.1) Limited C MAC No. 1 Limited A
Fosse Master Issuer plc C Motor 2015-1 Holdings Limited C
Fosse PECOH Limited C Motor 2015-1 plc C
Fosse Trustee (UK) Limited A Motor 2016-1 Holdings Limited C
HCUK Auto Funding 2016-1 Limited (In liquidation) D Motor 2016-1 plc C
Holmes Funding Limited A Motor 2016-1M Limited (In liquidation) D
Holmes Holdings Limited A Motor 2017-1 Holdings Limited C
Holmes Master Issuer plc A Motor 2017-1 plc C
Holmes Trustees Limited A PECOH Limited A
(1) Refer to the key at the end of this section for the registered office address.
Joint ventures and associates
All these entities are registered in England and Wales and are accounted for by the equity method of accounting.
Name of joint venture
Registered
office(1)
Direct/indirect
ownership
Share class through
which ownership
is held
Proportion
of ownership
interest
%
Ultimate
proportion of
ownership
%
Hyundai Capital UK Limited K Indirect Ordinary £1 – 50
PSA UK Number 1 plc H Direct B Ordinary £1 50 50
C Ordinary £1
Syntheo Limited A Direct Ordinary £1 50 50
(1) Refer to the key at the end of this section for the registered office address.
All entities are joint ventures, except for PSA UK Number 1 plc which is an associate.
Overseas branches
The Company has no overseas branches.
Key of registered office addresses
A 2 Triton Square, Regent’s Place, London NW1 3AN
B Santander House, 86 Station Road, Redhill RH1 1SR
C 35 Great St. Helen’s, London EC3A 6AP
D 40a Station Road, Upminster, Essex RM14 2TR
E Wilmington Trust SP Services (London) Limited, 1 Kings Arms Yard, London EC2R 7AF
F Griffins, Tavistock House South, Tavistock Square, London WC1H 9LG
G Building 3, Floor 2, Carlton Park, Narborough, Leicester LE19 0AL
H 61 London Road, Redhill RH1 1QA
I 287 St. Vincent Street, Glasgow, Scotland G2 5NB
J 25/28 North Wall Quay, Dublin 1, Ireland
K London Court, 39 London Road, Reigate RH2 9AQ
ˆ200G2Mlv!2=54Qy6nŠ200G2Mlv!2=54Qy6n
628340 TX 220SANTANDERFORM 20-F (SAN UK PL
04-Mar-2019 01:43 ESTHTMLON
Donnelley Financial EGV gopad0dc 6*ESS 0C
VDI-W7-PFD-037812.9.12.0
Page 1 of 1
Annual Report 2018 | Shareholder information
Forward-looking statements
Santander UK may from time to time make written or oral forward-looking statements. Santander UK makes written forward-looking statements in this Annual Report
and may also make forward-looking statements in its periodic reports to the SEC on Forms 20-F and 6-K, in its offering circulars and prospectuses, in press releases
and other written materials and in oral statements made by its officers, directors or employees to third parties. Examples of such forward-looking statements include,
but are not limited to: projections or expectations of revenues, costs, profit (or loss), earnings (or loss) per share, dividends, capital structure or other financial items
or ratios; statements of plans, objectives or goals of Santander UK or its management, including those related to products or services; statements of future economic
performance; and statements of assumptions underlying such statements.
Words such as ‘believes’, ‘anticipates’, ‘expects’, ‘intends’, ‘aims’, ‘plans’, ‘targets’ and similar expressions are intended to identify forward-looking statements, but
are not the exclusive means of identifying such statements. By their very nature, forward-looking statements are not statements of historical or current facts; they
cannot be objectively verified, are speculative and involve inherent risks and uncertainties, both general and specific, and risks exist that the predictions, forecasts,
projections and other forward-looking statements will not be achieved. Santander UK cautions readers that a number of important factors could cause actual results
to differ materially from the plans, objectives, expectations, estimates and intentions expressed in such forward-looking statements made by Santander UK or on its
behalf. Some of these factors, which could affect Santander UK’s business, financial condition and/or results of operation, are considered in detail in the Risk review,
and they include:
– the disruptions and volatility in the global financial markets
– the effects of UK economic conditions
– Santander UK’s exposure to UK political developments, including the outcome of the ongoing UK EU Article 50 negotiations on Brexit
– the effects of the financial services laws, regulations, governmental oversight, administrative actions and policies and any changes thereto in each location or
market in which Santander UK operates
– the effects of any new reforms to the UK mortgage lending market
– Santander UK’s exposure to any risk of loss from legal and regulatory proceedings
– the power of the FCA, the PRA, the CMA or an overseas regulator to potentially intervene in response to e.g. attempts by customers to seek redress from
financial service institutions, including Santander UK, in case of industry-wide issues
– the effects which the Banking Act 2009 may have on Santander UK’s business and the value of securities issued
– the effects which the bail-in and write down powers under the Banking Act 2009 and the BRRD may have on Santander UK’s business and the value of securities
issued
– the extent to which regulatory capital and leverage requirements and any changes to these requirements may limit and adversely affect Santander UK’s
operations
– Santander UK’s ability to access liquidity and funding on acceptable financial terms
– the extent to which liquidity requirements and any changes to these requirements may limit and adversely affect Santander UK’s operations
– Santander UK’s exposure to UK Government debt
– the effects of the ongoing political, economic and sovereign debt tensions in the eurozone
– Santander UK’s exposure to risks faced by other financial institutions
– the effects of an adverse movement in external credit rating assigned to Santander UK, any Santander UK member or any of their respective debt securities
– the effects of fluctuations in interest rates and other market risks
– the extent to which Santander UK may be required to record negative fair value adjustments for its financial assets due to changes in market conditions
– the risk of failing to successfully implement and continue to improve Santander UK’s credit risk management systems
– the risks associated with Santander UK’s derivative transactions
– the extent to which Santander UK may be exposed to operational risks, including risks relating to data and information collection, processing, storage and
security
– the risk of third parties using Santander UK as a conduit for illegal or improper activities without Santander UK’s knowledge
– the risk of failing to effectively improve or upgrade Santander UK’s information technology infrastructure and management information systems in a timely
manner
– Santander UK’s exposure to unidentified or unanticipated risks despite its risk management policies, procedures and methods
– the effects of competition with other financial institutions
– the various risks facing Santander UK as it expands its range of products and services (e.g. risk of new products and services not being responsive to customer
demands or successful, risk of changing customer needs)
– Santander UK’s ability to control the level of non-performing or poor credit quality loans and whether Santander UK’s loan loss reserves are sufficient to cover
loan losses
– the extent to which Santander UK’s loan portfolio is subject to prepayment risk
– the risk that the value of the collateral, including real estate, securing Santander UK’s loans may not be sufficient and Santander UK may be unable to realise the
full value of the collateral securing its loan portfolio
– the ability of Santander UK to realise the anticipated benefits of its organic growth or business combinations and the exposure, if any, of Santander UK to any
unknown liabilities or goodwill impairments relating to acquired businesses
– the extent to which members of Santander UK may be responsible for contributing to compensation schemes in the UK in respect of banks and other authorised
financial services firms that are unable to meet their obligations to customers
– the effects of taxation requirements and other assessments and any changes thereto in each location in which Santander UK operates
– the effects of any changes in the pension liabilities and obligations of Santander UK
– the ability of Santander UK to recruit, retain and develop appropriate senior management and skilled personnel
– the effects of any changes to the reputation of Santander UK, any Santander UK member or any affiliate operating under the Santander UK brands
– the basis of the preparation of the Company’s and Santander UK’s financial statements and information available about Santander UK, including the extent to
which assumptions and estimates made during such preparation are accurate
– the extent to which disclosure controls and procedures over financial reporting may not prevent or detect all errors or acts of fraud
– the extent to which changes in accounting standards could impact Santander UK’s reported earnings
– the extent to which Santander UK relies on third parties and affiliates for important infrastructure support, products and services
– the possibility of risk arising in the future in relation to transactions between the Company and its parent, subsidiaries or affiliates
– the extent to which different disclosure and accounting principles between the UK and the US may provide you with different or less information about us than
you expected
– the risk associated with enforcement of judgements in the US.
Please refer to our latest filings with the SEC (including, without limitation, our Annual Report on Form 20-F for the year ended 31 December 2018) for a discussion
of certain risk factors and forward-looking statements. Undue reliance should not be placed on forward-looking statements when making decisions with respect to
any Santander UK member and/or its securities. Investors and others should take into account the inherent risks and uncertainties of forward-looking statements and
should carefully consider the foregoing non-exhaustive list of important factors. Forward-looking statements speak only as of the date on which they are made and
are based on the knowledge, information available and views taken on the date on which they are made; such knowledge, information and views may change at any
time. Santander UK does not undertake any obligation to update or revise any forward-looking statement, whether as a result of new information, future events or
otherwise.
220 Santander UK plc

ˆ200G2Mlv!2a$dr9gOŠ200G2Mlv!2a$dr9gO
628340 TX 221SANTANDERFORM 20-F (SAN UK PL
04-Mar-2019 03:28 ESTHTMLON
Donnelley Financial EGV annas1dc 8*ESS 0C
VDI-W7-PFD-029812.9.12.0
bar6
Page 1 of 1
Other information for US
investors
Contents
Risk factors 222
Articles of Association 245
Iran Threat Reduction and Syria
Human Rights Act (ITRA) 246
New York Stock Exchange (NYSE)
Corporate Governance 247
Other information 248
Additional balance sheet analysis 249
Taxation for US investors 261
Glossary of financial services
industry terms 262
Cross-reference to Form 20-F 266
Santander UK plc 221
ˆ200G2Mlv!2=8Juu64Š200G2Mlv!2=8Juu64
628340 TX 222SANTANDERFORM 20-F (SAN UK PL
04-Mar-2019 01:46 ESTHTMLON
Donnelley Financial EGV gopad0dc 3*ESS 0C
VDI-W7-PFD-037812.9.12.0
Page 1 of 1
Annual Report 2018 | Other information for US investors
Risk factors
An investment in Santander UK plc (the Company) and its subsidiaries (us, we, our or the Santander UK group) involves a number of risks, the material
ones of which are set out below.
We are vulnerable to disruptions and volatility in the global financial markets
Over the past 10 years, financial systems worldwide have experienced difficult credit and liquidity conditions and disruptions leading to periods of reduced
liquidity and greater volatility (including volatility in spreads). Uncertainties remain concerning the outlook and the future economic environment despite
recent improvements in certain segments of the global economy. Investors remain cautious and a slowing or failing of the global economic recovery would
likely aggravate the adverse effects of difficult economic and market conditions on us and on others in the financial services industry.
Financial markets over the past three years have been affected, and still are, by a series of political events, which include the United Kingdom’s (UK) vote
in June 2016 to leave the European Union (EU), and the general election in the UK in June 2017, which caused significant volatility in the global stock and
foreign exchange markets (for more information, see the risk factor entitled ‘Exposure to UK political developments, including the ongoing negotiations
between the UK and EU, could have a material adverse effect on us’). Further, there continues to be significant uncertainty as to the respective legal and
regulatory environments in which we and our subsidiaries will operate going forward as a result of the UK’s vote to leave the EU, as the delay in any
agreement continues. Such uncertainties have had, and may continue to have, a negative impact on macroeconomic conditions and our operations,
financial condition and prospects, and the global economic environment may continue to be adversely affected by political developments (for more
information, see the risk factor entitled ‘We may suffer adverse effects as a result of the political, economic and sovereign debt tensions in the eurozone’).
Continued or worsening disruption and volatility in the global financial markets could have a material adverse effect on us, including our ability to access
capital and liquidity on financial terms acceptable to us, if at all. If capital markets financing ceases to become available, or becomes excessively
expensive, we may be forced to raise the rates we pay on deposits to attract more customers, particularly if interest rates continue to rise in 2019 following
repeated comments by the Bank of England (BoE) to raise rates, “at a gradual pace and to a limited extent”. Any such increase in capital markets funding
costs or deposit rates could have a material adverse effect on our interest margins, liquidity and profitability, particularly given the sustained low interest
rate environment expected in the medium term.
Our operations, financial condition and prospects may be materially impacted by economic conditions in the UK
Our business activities are concentrated in the UK, where we offer a range of banking and financial products and services to UK retail and corporate
customers. As a consequence, our operations, financial condition and prospects are significantly affected by the general economic conditions in the UK.
Our financial performance is intrinsically linked to the UK economy and the economic prosperity and confidence of consumers and businesses. The state
of the UK economy, along with its related impacts on our profitability, remains a risk. Conversely, a strengthened UK economic performance may increase
the possibility of a higher interest rate environment and we note that the BoE has commented that it expects to continue to raise interest rates at a steady
pace if the economy performs in line with its expectations. In such a scenario, there is a risk that other market participants might offer more competitive
product pricing resulting in increased customer attrition and the potential for an increase in defaults on our mortgage and/or loan repayments.
In particular, we may face, among others, the following risks related to any future economic downturn:
– Increased regulation of our industry. Compliance with such regulation will continue to increase our costs, may affect the pricing of our products and
services, increase our conduct and regulatory risks related to non-compliance, reduce investment available to enhance our product offerings, limit our
ability to pursue business opportunities and impact our strategy
– Reduced demand for our products and services
– Inability of our borrowers to comply fully or in a timely manner with their existing obligations
– The process we use to estimate losses inherent in our credit exposure requires complex judgements and assumptions, including forecasts of economic
conditions and how such economic conditions may impair the ability of our borrowers to repay their loans
– The degree of uncertainty concerning economic conditions may adversely affect the accuracy of our estimates, which may, in turn, impact the reliability
of the process and the sufficiency of our loan loss allowances
– The value and liquidity of the portfolio of investment securities that we hold may be adversely affected
– The recovery of the international financial industry may be delayed and impact our operations, financial condition and prospects
– Adverse macroeconomic shocks may negatively impact the household income of our retail customers and the profitability of our business customers,
which may adversely affect the recoverability of our loans and other extensions of credit and result in increased credit losses.
The possibility of a renewed economic downturn resulting in negative economic growth in the UK remains a real risk, particularly given an agreement for
exiting the EU has yet to be reached. This has, to a certain extent, been reflected in the downgrade of the Office for Budget Responsibility (OBR) forecasts
for economic growth for 2018, published with the Budget at the end of October 2018 and the downgrade of the UK’s sovereign credit rating in September
2017 (for more information, see the risk factor entitled ‘An adverse movement in our external credit rating would likely increase our cost of funding, require
us to post additional collateral or take other actions under some of our derivative contracts and adversely affect our operations, financial condition and
prospects’). Uncertainty surrounding the future of the eurozone is less acute than before, but a slow increase in growth may pose a risk of a further
slowdown in the UK’s principal export markets which would have an adverse effect on the broader UK economy, and could cause uncertainty in relation to
the terms of the UK’s exit from the EU. The future trading arrangements agreed between the EU and the UK could also have an adverse impact,
particularly if the UK has to resort to using World Trade Organization (WTO) rules from the EU. The future trading arrangements agreed between the EU
and the UK could also have an adverse impact, particularly if the UK has to resort to using WTO rules.
Adverse changes in the credit quality of our borrowers and counterparties or a general deterioration in UK, EU or global economic conditions could reduce
the recoverability and value of our assets and require an increase in our level of provisions for bad and doubtful debts. There can be no assurance that we
will not have to increase our provisions for loan losses in the future as a result of increases in non-performing loans and/or for other reasons beyond our
control. Material increases in our provisions for loan losses and write-offs or charge-offs could have an adverse effect on our operations, financial
condition and prospects. Any significant related reduction in the demand for our products and services could have a material adverse effect on our
operations, financial condition and prospects.
222 Santander UK plc
ˆ200G2Mlv!2SWy%dgDŠ200G2Mlv!2SWy%dgD
628340 TX 223SANTANDERFORM 20-F (SAN UK PL
03-Mar-2019 07:18 ESTHTMLON
Donnelley Financial EGV manra0dc 2*ESS 0C
VDI-W7-PFL-165312.9.12.0
bar6
Page 1 of 1
> Risk factors
Santander UK plc 223
Exposure to UK political developments, including the ongoing negotiations between the UK and EU, could have a material
adverse effect on us
On 23 June 2016, the UK held a referendum (the UK EU Referendum) on its membership of the EU, in which a majority voted for the UK to
leave the EU. Immediately following the result, the UK and global stock and foreign exchange markets commenced a period of significant
volatility, including a steep devaluation of the pound sterling. There remains significant uncertainty relating to the UK’s exit from, and future
relationship with, the EU and the basis of the UK’s future trading relationship with the rest of the world.
On 29 March 2017, the UK Prime Minister gave notice under Article 50(2) of the Treaty on European Union of the UK’s intention to
withdraw from the EU. The delivery of the Article 50(2) notice triggered a two year period of negotiation to determine the terms on which
the UK will exit the EU and the framework for the UK’s future relationship with the EU. Unless extended, the UK’s EU membership will
cease after this two year period.
There is a possibility that the UK’s EU membership ends at such time without reaching any agreement on the terms of its relationship with
the EU going forward, and currently the Withdrawal Agreement, which provides for a transitional period whilst the Future Relationship is
negotiated, has not been ratified by the UK Parliament.
A general election in the UK was held on 8 June 2017 (the General Election). The General Election resulted in a hung parliament with no
political party obtaining the majority required to form an outright government. On 26 June 2017 it was announced that the Conservative
party had reached an agreement with the Democratic Unionist Party (the DUP) in order for the Conservative party to form a minority
government with legislative support (‘confidence and supply’) from the DUP. There is an ongoing possibility of an early general election
ahead of 2022 and of a change of government.
The continuing uncertainty surrounding the Brexit outcome has had an effect on the UK economy, particularly towards the end of 2018,
and this may continue into 2019. Consumer and Business confidence indicators have continued to fall, for example the GfK consumer
confidence index fell to -14 in January 2019, and this has had a significant impact on consumer spending and investment, both of which
are vital components of economic growth.
The outcome of Brexit remains unclear, however, a UK exit from the EU with a no-deal continues to remain a possibility and the consensus
view is that this would have a negative impact on the UK economy, affecting its growth prospects, based on scenarios put forward by such
institutions as the BoE, HM Government and other economic forecasters.
While the longer term effects of the UK’s imminent departure from the EU are difficult to predict, there is short term political and economic
uncertainty. The Governor of the BoE warned that the UK exiting the EU without a deal could lead to considerable financial instability, a
very significant fall in property prices, rising unemployment, depressed economic growth, higher inflation and interest rates. The Governor
also warned that the Bank would not be able to apply interest rate reductions. This could inevitably affect the UK’s attractiveness as a
global investment centre, and would likely have a detrimental impact on UK economic growth.
If a no-deal Brexit did occur it would be likely that the UK’s economic growth would slow significantly, and it would be possible that there
would be severely adverse economic effects.
The UK’s imminent departure from the EU has also given rise to further calls for a second referendum on Scottish independence and
raised questions over the future status of Northern Ireland. These developments, or the perception that they could occur, could have a
material adverse effect on economic conditions and the stability of financial markets, and could significantly reduce market liquidity and
restrict the ability of key market participants to operate in certain financial markets (for more information, see the risk factor entitled ‘We are
vulnerable to disruptions and volatility in the global financial markets’).
Asset valuations, currency exchange rates and credit ratings may be particularly subject to increased market volatility if the negotiation of
the UK’s exit from the EU continues in the run-up to 29 March 2019 as a result of Parliament’s non-ratification of the Withdrawal
Agreement. The major credit rating agencies changed their outlook to negative on the UK’s sovereign credit rating following the UK EU
Referendum, and that has not changed (for more information, see the risk factor entitled ‘An adverse movement in our external credit
rating would likely increase our cost of funding, require us to post additional collateral or take other actions under some of our derivative
contracts and adversely affect our operations, financial condition and prospects’). In addition, we are subject to substantial EU-derived
regulation and oversight. Although legislation has now been passed transferring the EU acquis into UK law, there remains significant
uncertainty as to the respective legal and regulatory environments in which we and our subsidiaries will operate when the UK is no longer
a member of the EU, and the basis on which cross-border financial business will take place after the UK leaves the EU.
Operationally, we and other financial institutions may no longer be able to rely on the European passporting framework for financial
services, and it is unclear what alternative regime may be in place following the UK’s departure from the EU. This uncertainty, and any
actions taken as a result of this uncertainty, as well as new or amended rules, may have a significant impact on our operating results,
financial condition and prospects.
Ongoing uncertainty within the UK Government and Parliament, and the rejection of the Withdrawal Agreement by the House of Commons,
and the risk that this results in the Government falling could cause significant market and economic disruption, which could have a material
adverse effect on our operations, financial condition and prospects.
Continued ambiguity relating to the UK’s withdrawal from the EU, along with any further changes in government structure and policies, may
lead to further market volatility and changes to the fiscal, monetary and regulatory landscape in which we operate and could have a
material adverse effect on us, including our ability to access capital and liquidity on financial terms acceptable to us and, more generally,
on our operations, financial condition and prospects.

ˆ200G2Mlv!2SW#1xg$Š200G2Mlv!2SW#1xg$
628340 TX 224SANTANDERFORM 20-F (SAN UK PL
03-Mar-2019 07:18 ESTHTMLON
Donnelley Financial EGV manra0dc 2*ESS 0C
VDI-W7-PFL-165312.9.12.0
Page 1 of 1
Annual Report 2018 | Other information for US investors
We are subject to substantial regulation and governmental oversight which could adversely affect our operations, financial condition and
prospects
Supervision and new regulation
As a financial services group, we are subject to extensive financial services laws, regulations, administrative actions and policies in the UK, the EU and in
each other location in which we operate. As well as being subject to UK regulation, as part of the Banco Santander group, we are also impacted through
regulation by the Banco de España (the Bank of Spain) and, at a corporate level, by the European Central Bank (ECB), and various legal and regulatory
regimes (including the US) that have extra-territorial effect.
The laws, regulations and policies to which we are subject may be changed at any time. In addition, the interpretation and the application of those laws,
regulations and policies by regulators are also subject to change. Furthermore, there is uncertainty regarding the on-shoring of EU regulations into the UK
upon the UK’s exit from the EU and the changes that will be implemented in that process (including the further powers that will be given to UK regulators),
as well as regarding the level of convergence or divergence with EU regulations, initiatives and reforms (including during any transitional period).
Extensive legislation and implementing regulations affecting the financial services industry have recently been adopted in regions that directly or indirectly
affect our business, including Spain, the US, the EU, Latin America and other jurisdictions.
The manner in which financial services laws, regulations and policies are applied to the operations of financial institutions is still evolving. Moreover, to the
extent these laws, regulations and policies apply to us, we may face higher compliance costs. Any legislative or regulatory actions and any required
changes to our business operations resulting from such laws, regulations and policies as well as any deficiencies in our compliance with such laws,
regulations and policies, could result in significant loss of revenue, impact our strategy, limit our ability to pursue business opportunities in which we might
otherwise consider engaging and limit our ability to provide certain products and services. They may also affect the value of assets that we hold, requiring
us to increase our prices and therefore reduce demand for our products, impose additional compliance and other costs on us or otherwise adversely affect
our operations, financial condition and prospects. Accordingly, there can be no assurance that future changes in laws, regulations and policies or in their
interpretation or application will not adversely affect us.
During periods of market turmoil in the past 10 years, there have been unprecedented levels of government and regulatory intervention and scrutiny, and
changes to the regulations governing financial institutions and the conduct of business. In addition, regulatory and governmental authorities have
continued to consider further enhanced or new legal or regulatory requirements intended to reduce the probability and impact of future crises or otherwise
assure the stability of institutions under their supervision. This intensive approach to supervision is maintained by the Prudential Regulation Authority
(PRA), the Financial Conduct Authority (FCA), the Payment Systems Regulator (PSR) and the Competition and Markets Authority (CMA).
Recent proposals and measures taken by governmental, tax and regulatory authorities and further future changes in supervision and regulation (in
particular in the UK), which are beyond our control, could materially affect our business, the value of assets and operations and result in significant
increases in operational and compliance costs. Products and services offered by us could also be affected. Changes in UK legislation and regulation to
address the stability of the financial sector may also affect our competitive position, particularly if such changes are implemented before international
consensus is reached on key issues affecting the industry. Although we work closely with our regulators and continually monitor the situation, future
changes in law, regulation, fiscal or other policies can be unpredictable and are beyond our control. No assurance can be given generally that laws or
regulations will be adopted, enforced or interpreted in a manner that will not have a material adverse effect on our operations, financial condition and
prospects.
Banking Reform
The Financial Services (Banking Reform) Act 2013 (the Banking Reform Act) established a ring-fencing framework under the Financial Services and
Markets Act 2000 (FSMA) pursuant to which UK banking groups that hold significant retail deposits were required to separate or ‘ring-fence’ their retail
banking activities from their wholesale banking activities by 1 January 2019. The Santander UK group is subject to the ring-fencing regulatory regime
introduced under the Banking Reform Act and adopted through secondary legislation which it is required to comply with from 1 January 2019. Accordingly,
the Santander UK group has implemented the separation – or ring-fencing – of its core retail and small business deposit taking activities from its
wholesale markets and investment banking activities.
The Company, being the main banking entity within the ring-fenced part of the UK group, will serve our retail, commercial and corporate customers. The
majority of our customer loans and assets as well as customer deposits and liabilities will remain within the Company or Cater Allen Limited, which is also
a ring-fenced bank. Wholesale markets and investment banking activities which, from 1 January 2019, are prohibited from being transacted within the ring-
fenced bank principally included our derivatives business with financial institutions and certain corporates, elements of our short term markets business,
the Company’s branches in Jersey and the Isle of Man, and the United States (US) branch of Abbey National Treasury Services plc (ANTS).
Implementation of ring-fencing has involved material structural and operational changes to the Company’s business and the corporate group structure in
the UK during 2018. Following consent from the PRA to the application to the High Court of England and Wales (the Court) for approval of our ring-fencing
transfer scheme (the Scheme), our Scheme was approved by the Court on 12 June 2018.
In accordance with the Scheme: (i) ANTS has transferred the majority of its business; with products, transactions, arrangements and customers and other
stakeholders which are permitted in the ring fence transferred to the Company and products, transactions, arrangements and customers and other
stakeholders which are prohibited within the ring-fence transferred to the London branch of Banco Santander SA; and (ii) the Company has transferred its
prohibited business and certain specified business that is permitted within the ring-fence to the London branch of Banco Santander SA. These transfers of
business were implemented during July 2018.
On 11 December 2018, the Royal Court of Jersey approved the transfer of the business of the Jersey branch of the Company to a new Jersey branch
of ANTS, which is a member of the Santander UK Group Holdings plc group outside the ring-fence, by way of a court-sanctioned transfer scheme under
Jersey law (the Jersey Scheme). On 13 December 2018, the Isle of Man High Court of Justice approved the transfer of the business of the Isle of Man
branch of the Company to a new Isle of Man branch of ANTS, by way of a court-sanctioned transfer scheme under Isle of Man law (the Isle of Man
Scheme). The effective date of the Jersey Scheme and the Isle of Man Scheme was 17 December 2018.
ANTS has ceased the activities of its US branch, and surrendered its US licence with effect from 14 December 2018.
We completed our ring-fencing plans in advance of the legislative deadline of 1 January 2019. However, given the complexity of the ring-fencing
regulatory regime and the material impact on the way the group now conducts its business operations in the UK, there is a risk that the Company and/or
Cater Allen Limited may be found to be in breach of one or more ring-fencing requirements. This might occur, for example, if prohibited business activities
are found to be taking place within the ring-fence or core, mandated retail banking activities are found being carried on in a UK entity outside the ring-
fenced part of the group.
224 Santander UK plc

ˆ200G2Mlv!2SW$dbg‹Š200G2Mlv!2SW$dbg
628340 TX 225SANTANDERFORM 20-F (SAN UK PL
03-Mar-2019 07:18 ESTHTMLON
Donnelley Financial EGV manra0dc 2*ESS 0C
VDI-W7-PFL-165312.9.12.0
bar6
Page 1 of 1
> Risk factors
Santander UK plc 225
From 1 January 2019, if the Santander UK group were found to be in breach of any of the ring-fencing requirements placed upon it under
the ring-fencing regime, it could be subject to enforcement action by the PRA, the consequences of which might include substantial
financial penalties, imposition of a suspension or restriction on the group’s UK activities or, in the most serious of cases, forced
restructuring of the UK group, entitling the PRA (subject to the consent of the UK Government) to require the sale of a Santander ring-
fenced bank or other parts of the UK group. Any of those sanctions could, if imposed, have a material adverse effect on our operations,
financial condition and prospects.
The restructuring activities and migrations of businesses, assets and customer relationships mentioned above have had a material impact
on how the Santander UK group conducts its business. While it has sought to implement each of the required changes with minimal impact
on customers, the Santander UK group is unable to predict with certainty the attitudes and reaction of its customers. The structural
changes which have been required could have a material adverse effect on our operations, financial condition and prospects.
EU fiscal and banking union
The European banking union is expected to be achieved through new harmonised banking rules (in a single rulebook) and a new
institutional framework with stronger systems for both banking supervision and resolution that will be managed at a European level. Its two
main pillars are the Single Supervisory Mechanism (SSM) and the Single Resolution Mechanism (SRM).
The SSM (comprising both the ECB and the national competent authorities) is designed to assist in making the banking sector more
transparent, unified and safer. On 4 November 2014, the ECB fully assumed its new supervisory responsibilities within the SSM, in
particular direct supervision of 119 significant banks (at 5 December 2017) in the eurozone, including Banco Santander SA.
Regulation (EU) No. 806/2014 of the European Parliament and the Council of the EU (the SRM Regulation) became effective from
1 January 2015 and establishes uniform rules and a uniform procedure for the resolution of credit institutions and certain investment firms
in the framework of the SRM and Single Resolution Fund (SRF). The new Single Resolution Board (SRB), which is the central decision-
making body of the SRM fully assumed its resolution powers on 1 January 2016. The SRB is responsible for managing the SRF.
Further, regulations adopted towards achieving a banking and/or fiscal union in the EU and decisions adopted by the ECB in its capacity
as Banco Santander SA’s main supervisory authority may have a material impact on our operations, financial condition and prospects and
may be impacted by the terms of the UK’s exit from the EU (for more information, see the risk factor entitled ‘Exposure to UK political
developments, including the ongoing negotiations between the UK and EU, could have a material adverse effect on us’).
Other regulatory reforms adopted or proposed in the wake of the financial crisis
The revised and re-enacted Markets in Financial Instruments legislation (MiFID) replaces the existing MiFID framework and comprises the
Directive 2014/65 of the European Parliament and of the Council, of 15 May 2014 and amending Directive 2002/92/EC and Directive
2011/61/EU (MiFID2) and the Regulation 600/2014 of the European Parliament and of the Council of 15 May 2014 and amending
Regulation (EU) No 648/2012 (MiFIR). The substantive provisions of MiFID came into force on 3 January 2018 and introduced an
obligation to trade certain classes of Over-the-Counter (OTC) derivative contracts on trading venues. Certain details remain to be clarified
in further binding technical standards to be adopted by the European Commission (the Commission). MiFID2 and MiFIR may lead to
changes which negatively impact our profit margins, require us to adjust our business practices or increase our costs (including compliance
costs). It is possible that the measures and procedures we have introduced might, in future, be deemed to be misaligned with MiFID
obligations, or that individuals within the business may not fully comply with the new procedures. If there are breaches of our MiFID
obligations or of other existing laws and regulations relating to financial crime, we could face significant administrative, regulatory and
criminal sanctions and restrictions on the conduct of our business and operations, as well as reputational damage. Therefore, any such
breaches could have a material adverse effect on our operations, financial condition and prospects.
US regulation
In the US, the Dodd-Frank Wall Street Reform and Consumer Protection Act (the Dodd-Frank Act) enacted in 2010, has been implemented
in part and continues to be implemented by various US federal regulatory agencies. The Dodd-Frank Act, among other things, imposes a
regulatory framework on swap transactions, including swaps of the sort that we enter into, requires regulators to adopt new rules governing
the retention of credit risk by securitisers or originators of securitisations and significantly expands the coverage and scope of regulations
that limit affiliate transactions within a banking organisation. The US Commodity Futures Trading Commission (the CFTC) and other US
regulators have adopted a host of new regulations for swaps markets, including swap dealer registration, business conduct, mandatory
clearing, exchange trading and margin regulations. Most of these regulations are already effective, although regulations applicable to
‘security-based swaps’ (i.e., swaps based on securities or narrow-based security indices) required to be implemented by the US Securities
and Exchange Commission (SEC)) are generally not yet effective, but many of those requirements are expected to come into effect in
2019. Abbey National Treasury Services plc, which became provisionally registered as a swap dealer with the CFTC on 4 November 2013,
is currently subject to swaps regulations for its US facing swaps activities. These rules have already increased the costs associated with
our swaps business, and continued compliance with those rules, as well as pending SEC security-based swaps rules, could further
increase those costs. In addition, certain cross-border regulatory conflicts could adversely affect the profitability of our swaps business by
reducing the range of counterparties with which we can trade effectively.
In October 2014, US regulators adopted a joint final rule requiring sponsors of asset-backed securitisation transactions, which includes the
Company Santander UK plc in relation to its residential mortgage-backed securities programmes, to retain 5% of the credit risk of the
assets subject to the securitisation. The rule permits sponsors to satisfy the risk retention requirement through the acquisition and retention
of either 5% (measured by fair value) of the most subordinated interest in the securitisation, or 5% (measured by nominal value) of each
tranche of interests issued by the securitisation, or some combination of the two. The rule also permits certain exceptions and methods of
compliance in respect of specific types of asset-backed securities transactions.
Within the Dodd-Frank Act, the so-called Volcker Rule prohibits ‘banking entities’, including the Santander UK group, from engaging in
certain forms of proprietary trading or from sponsoring or investing in certain covered funds, in each case subject to certain exemptions,
including exemptions permitting foreign banking entities to engage in trading and fund activities that take place solely outside of the US.
The final rules contain exclusions and certain exemptions for market-making, hedging, underwriting, trading in US government and agency
obligations as well as certain foreign government obligations, trading solely outside the US, and also permit ownership interests in certain
types of funds to be retained. The Santander UK group was generally required to come into compliance with the Volcker Rule by July
2015, although the Federal Reserve extended the conformance deadline for pre-2014 ‘legacy’ investments in and relationships with private
equity funds and hedge funds until 21 July 2017 and additional extensions for illiquid funds may be requested. On 30 May 2018, the
Federal Reserve and other federal regulators requested comment on proposed modifications to the Volcker Rule, including modifications
to the scope of restrictions on proprietary trading and investments in covered funds. It cannot be predicted at this time what, if any,
modifications to the Volcker Rule may be adopted or what the impact of such changes would be for us.

ˆ200G2Mlv!2SW&Yg6oŠ200G2Mlv!2SW&Yg6o
628340 TX 226SANTANDERFORM 20-F (SAN UK PL
03-Mar-2019 07:18 ESTHTMLON
Donnelley Financial EGV manra0dc 2*ESS 0C
VDI-W7-PFL-165312.9.12.0
Page 1 of 1
Annual Report 2018 | Other information for US investors
Each of these aspects of the Dodd-Frank Act, as well as the changes in US banking regulations, and increased uncertainty surrounding future changes,
may directly and indirectly impact various aspects of our business. The full spectrum of risks that the Dodd-Frank Act (including the Volcker Rule and any
modifications to it) poses to us is not yet known, however, such risks could be significant and we could be materially and adversely affected by them.
Competition
In the UK and elsewhere, there is continuing political, competitive and regulatory scrutiny of the banking industry. Political involvement in the regulatory
process, in the behaviour and governance of the UK banking sector and in the major financial institutions in which the UK Government has a direct
financial interest is likely to continue. The Competition and Markets Authority (CMA) is the UK’s main competition authority responsible for ensuring that
competition and markets work well for consumers. In addition, under the Banking Reform Act, as of 1 April 2015, the FCA has the power to enforce
against breaches of the Competition Act 1998 and to refer markets to the CMA for in-depth investigation in the areas of financial services in the UK. As of
1 April 2015, the PSR also has an objective and powers equivalent to those of the FCA to promote competition in the payments industry.
In August 2016, the CMA published the final report in its market investigation into competition in the personal current account and SME retail banking
markets, which identified a number of features of the markets for the supply of personal current accounts, business current accounts and SME lending
that, in combination, were having an adverse effect on competition. The CMA is currently implementing a comprehensive package of remedies including,
among other things, Open Banking and the introduction of requirements to prompt customers to review the services that they receive from their bank at
certain trigger points and to promote customer awareness of account switching.
Further work on overdraft charges – which remain under political scrutiny – is ongoing by the FCA. In December 2018, the FCA published a consultation
and policy paper regarding overdraft charges, which included final rules and guidance to address low awareness and engagement in this market and a
consultation on proposals to reform the ways banks and building societies charge for overdrafts. The FCA is also undertaking more general work on fair
pricing in financial services, including in relation to savings, mortgages and insurance. This is also an area of priority for the CMA, which made
recommendations for further work by the FCA in its December 2018 response to a super-complaint by Citizens Advice.
The FCA is conducting a Strategic Review of Retail Banking Business Models, looking at the potential effect of technological change, increased
digitalisation and free-if-in-credit banking on firms’ business models. It is also looking to secure an appropriate degree of consumer protection for
consumers in vulnerable circumstances. This review will inform the FCA’s ongoing policy work in retail banking and related areas. There can be no
assurance that we will not be required to make changes to our business model as a result of this review or related work, and that such changes would not
materially and adversely affect us.
In addition, the FCA and PSR continue to undertake a number of competition related studies and reviews across a number of our businesses. Intervention
as a result of these studies and reviews, in addition to regulatory reforms, investigations and court cases affecting the UK financial services industry, could
have an adverse effect on our operations, financial condition and prospects, or on our relations with our customers and potential customers.
Payments
The Second Payment Services Directive (PSD2) is a fundamental piece of payments-related legislation in Europe, the first part of which came into force in
January 2018. The regulation aims to harmonise payment processing across Europe, and is being implemented in the UK by the FCA.
In the UK, PSD2 introduced Open Banking, which opened up access to customers’ online account and payments data to third party providers (TPPs).
Customers are able to give secure access to certain TPPs authorised by the FCA or other European regulators to access account information and to
make payments from current accounts. Following the CMA’s retail banking market investigation, the nine largest current account providers in the UK (the
CMA-9) were required to accelerate certain of the PSD2 requirements and implement Open Banking by 13 January 2018.
The access method for customer accounts by TPPs is via an established Application Programme Interface (API) and, as one of the CMA-9, we have been
required to undertake significant technical build to create these APIs and extend them to all categories of customers, account types and currencies.
Open Banking and PSD2 both have the potential to exacerbate a number of existing risks including data loss/data protection, cyber security, fraud and
wider financial crime risk, which in turn could give rise to increased costs, litigation risk and risk of regulatory investigation and enforcement activity.
Examples of the heightened risk include the risk of fraud relating to activities of a TPP pursuant to which funds are redirected to a third party not chosen by
the customer; and the risk of data misuse by a TPP/other third party where the TPP has requested the data from Santander and this is provided to the
TPP.
If the arrangements that we have made to comply with our Open Banking obligation prove to be inadequate or incompatible with legal and regulatory
requirements or expectations, we could be required to make extensive and costly changes to our systems and controls, policies, and practices. We might
also be fined by regulators, sued by customers, and might suffer reputational damage. Any requirement to make such changes, any liability to customers,
any regulatory fines, or any reputational damage suffered, could have a material adverse effect on our operations, financial condition and prospects.
Financial Crime
A number of EU and UK regulatory measures targeted at preventing and countering financial crime (including anti-money laundering (AML) and
countering the financing of terrorism (CTF) provisions) came into effect in 2017 and 2018.
As part of the EU’s revision of its AML/CTF rules, Directive (EU) No 2015/849 (the Fourth EU Money Laundering Directive) and Regulation (EU) No
847/2015 (the EU Wire Transfer Regulation) came into effect on 26 June 2017. The Fourth EU Money Laundering Directive replaced Directive (EC) No
60/2005 and significantly expanded the existing AML/CTF regime applicable to financial institutions by, among other things:
– Increasing the customer due diligence checks required for particular transactions
– Introducing a requirement to take appropriate steps to identify and assess the risks of money laundering and terrorist financing and to have in place
policies, controls and procedures to mitigate and manage those risks effectively
– Having EU Member States hold beneficial ownership details on a central register for entities incorporated within their territory
– Applying the UK’s AML/CTF requirements to the branches and majority-owned subsidiaries of financial institutions that are located in non-EEA
countries with less strict regimes.
226 Santander UK plc
ˆ200G2Mlv!2TYpY7gÁŠ200G2Mlv!2TYpY7g`
628340 TX 227SANTANDERFORM 20-F (SAN UK PL
03-Mar-2019 10:31 ESTHTMLON
Donnelley Financial EGV manra0dc 3*ESS 0C
VDI-W7-PFL-165312.9.12.0
bar6
Page 1 of 1
> Risk factors
Santander UK plc 227
On 22 June 2017, the final text of the Money Laundering, Terrorist Financing and Transfer of Funds (Information on the Payer) Regulations
2017 was published in the UK, which came into force on 26 June 2017 and implemented the requirements of the Fourth EU Money
Laundering Directive and the EU Wire Transfer Regulation into UK law.
On 30 May 2018, the Council of EU and the European Parliament reached a political agreement on the EU Commission’s proposal to
amend the Fourth Anti-Money Laundering Directive (the Directive). The amended directive (5th AMLD) seeks to prevent large scale
concealment of funds and to introduce increased corporate transparency rules, whereby corporate and other legal entities will be required
by law to publicly disclose information on beneficial ownership. The amended directive also introduces the application of AML rules to firms
providing services associated with virtual currencies and further extends enhanced due diligence requirements to all transactions with
natural persons or legal entities established in third countries identified as high risk countries pursuant to Article 9(2) of the Directive. The
UK Government has confirmed their intention to implement the 5th AMLD into UK law as the EU deadline of 10 January 2020 for
transposition falls within the expected transition period of Brexit.
The UK Sanctions and AML Act received Royal Assent on 23 May 2018. The Act enables the UK to continue to implement United Nations
sanctions regimes. The Act also gives the UK the ability to impose its own sanctions regime plan which is likely to follow the approach of
the EU but could deviate in some areas. The Act also introduces certain new measures to address money laundering, including in relation
to company ownership information. The Act also provides powers to take actions against ‘human rights abusers’.
The current US administration has increased the use of sanctions against individuals, entities and countries, which in many instances have
been different to the policy approach of the EU and UK. In particular the re-introduction of primary and secondary sanctions against Iran
which occurred in November 2018, following the US withdrawal from the Joint Comprehensive Plan of Action (JCPOA), has been most
significant. These sanctions are substantially similar to those that were in force in 2013, prior to the initial Iran nuclear agreement, though
the secondary sanctions are broader in scope in some areas. In response the EU amended the EU Blocking Regulation, reflecting its
support for the continuation of the JCPOA, making it a potential criminal offence in the UK to comply with the re-introduced US sanctions
on Iran. The UK Government has indicated that it will reflect the Blocking Regulation into UK law post-Brexit, though the precise details of
this are yet to be seen.
The UK Policing and Crime Act 2017 strengthened the measures for the enforcement of financial sanctions, including in relation to the
criminal enforcement and civil powers. Under the Act the Office of Financial Sanctions Implementation (OFSI) has powers to fine
institutions a maximum of £1 million or 50% of the estimated value of the funds or resources, whichever is greater. Separately, the Criminal
Finances Act 2017 updated the primary UK legislation in respect of investigation and enforcement against money laundering and terrorist
financing. The Act provided law enforcement with new powers in regard to asset recovery and introduced ‘Unexplained Wealth Orders’.
The Act also created a new corporate offence relating to failure to prevent the criminal facilitation of tax evasion. The UK Government also
asked the Law Commission to conduct a review of the legislation relating to the ‘Suspicious Activity Reporting’ regime (SAR), which review
is expected to be completed in late 2019.
The UK Parliament Treasury Select Committee is concluding an Inquiry into Economic Crime, with the report expected in the first half of
2019. The Foreign Affairs Committee has also initiated an Inquiry into UK Sanctions post-Brexit. The Select Committees may make
recommendations for further legislative change or Government policy change in these areas.
The implementation of new UK legislation related to financial crime has required substantial amendments to our AML/CTF procedures and
policies, with additional training and guidance required for employees. Further such amendments will likely be required in 2019 to reflect
changes to UK laws and Government policy post-Brexit. The changes could adversely impact our business by increasing our operational
and compliance costs and reducing the value of our assets and operations.
The complexity in the area of financial crime policy is a significant challenge, involving overlapping requirements between different
legislation, and, in some instances, conflicts of laws. The divergence of policy approaches between the EU/UK and US in the area of
financial sanctions is exacerbated by the lack of clear guidance from the OFSI.
The growing complexity increases the risk that the required measures will not be implemented correctly or on time or that individuals within
the business will not be fully compliant with the new procedures. If there are breaches of these measures or existing law and regulation
relating to financial crime, we could face significant administrative, regulatory and criminal sanctions and restrictions on the conduct of our
business and operations, as well as reputational damage. The civil and criminal penalties for failures have increased and any such
breaches could have a material adverse effect on our operations, financial condition and prospects.
EU General Data Protection Regulation
The EU General Data Protection Regulation (the GDPR) came into direct effect in all EU Member States on 25 May 2018, replacing
previous EU data privacy laws. Although a number of basic existing principles have remained the same, the GDPR has introduced new
obligations on data controllers and rights for data subjects.
The GDPR has also introduced new fines and penalties for a breach of requirements, including fines for systematic breaches of up to the
higher of 4% of annual worldwide turnover or €20m and fines of up to the higher of 2% of annual worldwide turnover or €10m (whichever is
highest) for other specified infringements. The GDPR identifies a list of points to consider when imposing fines (including the nature,
gravity and duration of the infringement).
The implementation of the GDPR has required substantial and ongoing amendments to our procedures and policies. The changes have
impacted, and could further adversely impact, our business by increasing our operational and compliance costs. If there are breaches of
the GDPR obligations, we could face significant administrative and monetary sanctions as well as reputational damage which could have a
material adverse effect on our operations, financial condition and prospects.
ˆ200G2Mlv!2SX4tT6YŠ200G2Mlv!2SX4tT6Y
628340 TX 228SANTANDERFORM 20-F (SAN UK PL
03-Mar-2019 07:18 ESTHTMLON
Donnelley Financial EGV manra0dc 2*ESS 0C
VDI-W7-PFL-165312.9.12.0
Page 1 of 1
Annual Report 2018 | Other information for US investors
Further reforms to the mortgage lending market could require significant implementation costs or changes to our business strategy
Mortgage Lending
The final rules in relation to the FCA Mortgage Market Review (MMR) came into force on 26 April 2014. These rules required a number of material
changes to the mortgages sales process, both in terms of advice provision in nearly all scenarios and significantly enhanced affordability assessment and
evidencing. The rules permit interest-only loans. However, there is a clear requirement for a clearly understood and credible strategy for repaying the
capital (evidence of which the lender must obtain before making the loan).
The Santander UK group has implemented certain changes to implement the MMR requirements. The FCA continues to assess firms’ implementation of
the rules introduced as a result of the MMR and commenced a review of responsible lending practices in April 2015, publishing its report in May 2016.
This is in addition to regulatory reforms being made as a result of the implementation of the Mortgage Credit Directive from 21 March 2016. In December
2016, the FCA published terms of reference for a market study into competition in the mortgages sector, which will focus on consumers’ ability to make
effective decisions and whether commercial arrangements between lenders, brokers and other players leads to conflicts of interest or misaligned
incentives to the detriment of consumers. Following a deferral, the FCA published its interim report setting out its preliminary conclusions in May 2018.
The FCA has stated that it will publish its final report in Q1 2019.
It is possible that further changes may be made to the FCA’s Mortgage Conduct of Business (MCOB) rules as a result of these reviews and other related
future regulatory reforms. To the extent that any new rules do apply to any of the loans, failure to comply with these rules may entitle a borrower to claim
damages for loss suffered or set-off the amount of the claim against the amount owing under the loan. Any further changes to the FCA’s MCOB rules or to
MCOB or the FSMA or changes in the regulatory structure or the Financial Services Act 2012, may adversely affect the Santander UK group’s operating
results, financial condition and prospects. There can be no assurance that the Santander UK group will not make any future changes to its mortgage
lending business, whether as a result of the MMR or other mortgage lending reforms, and that such changes would not adversely affect the Santander UK
group.
Consumer credit
On 1 April 2014, consumer credit regulation was transferred from the OFT to the FCA in accordance with the Financial Services Act 2012. Firms that held
an OFT licence and had registered with the FCA by 31 March 2014, including Santander UK, were granted an interim permission under the new regime
and had to apply to the FCA for full authorisation during an application period notified by the FCA. Under the new regime: (i) carrying on certain credit-
related activities (including in relation to servicing credit agreements) otherwise than in accordance with permission from the FCA will render the credit
agreement unenforceable without FCA approval; and (ii) the FCA has the power to make rules providing that contracts made in contravention of its rules
on cost and duration of credit agreements, or in contravention of its product intervention rules, are unenforceable. Santander UK is fully authorised to carry
out consumer credit-related regulated activities, however, if the FCA were to impose conditions on that authorisation and/or make changes to the FCA
rules applicable to authorised firms with consumer credit permissions, this could have an adverse effect on the Santander UK group’s operations, financial
condition and prospects.
We are exposed to risk of loss and damage from civil litigation and/or criminal legal and regulatory proceedings
We face various legal and regulatory issues that may give rise to civil or criminal litigation, arbitration, and/or criminal, tax, administrative and/or regulatory
investigations, inquiries or proceedings. Failure to adequately manage the risks arising in connection with legal and regulatory issues, including our
obligations under existing applicable law and regulation or our contractual obligations including arrangements with suppliers, or failing to properly
implement new applicable law and regulation could result in significant loss or damage including reputational damage, all of which could have a material
adverse effect on our operations, financial condition and prospects. Additionally, the current regulatory environment, with the continuing heightened
supervisory focus and associated enforcement activity, combined with uncertainty about the evolution of the regulatory regime, may lead to material
operational and compliance costs. Relevant risks include:
– Regulators, agencies and authorities with jurisdiction over us, including the BoE, the PRA and the FCA, HM Treasury, HM Revenue & Customs
(HMRC), the CMA, the Commission, the Information Commissioner’s Office, the Financial Ombudsman Service (FOS), the PSR, the Serious Fraud
Office (SFO), the National Crime Agency (NCA) or the Courts, may determine that certain aspects of our business have not been or are not being
conducted in accordance with applicable laws or regulations, or, in the case of the FOS, with what is fair and reasonable in the FOS’s opinion.
Proposed changes in policy, law and regulation including in relation to SME dispute resolution and liability for authorised push payment fraud and
unauthorised payment fraud, may have significant consequences and lead to material operational and compliance costs.
– An adverse finding by a regulator, agency or authority could result in the need for extensive changes in systems and controls, business policies, and
practices coupled with suspension of sales, restrictions on conduct of business and operations, withdrawal of services, customer redress, fines and
reputational damage.
– The increased focus on competition law in financial services and concurrent competition enforcement powers for the FCA and PSR may increase the
likelihood of competition law related inquiries or investigations.
– The alleged historical or current misselling of financial products, such as Payment Protection Insurance (PPI), including as a result of having sales
practices and/or rewards structures that are deemed to have been inappropriate, presents a risk of civil litigation (including claims management
company driven legal campaigns) and/or in enforcement action or requires us to amend sales processes, withdraw products or provide restitution to
affected customers, all of which may require additional provisions to be recorded in our financial statements and could adversely impact future
revenues from affected products.
– We hold bank accounts for entities that might be or are subject to scrutiny from various regulators and authorities, including the SFO, the NCA and
regulators in the US and elsewhere, which could lead to our conduct being reviewed as part of any such scrutiny.
– We may be liable for damages to third parties harmed by the conduct of our business. For competition law, there are efforts by governments across
Europe to promote private enforcement as a means of obtaining redress for harm suffered as a result of competition law breaches. Under the
Consumer Rights Act, there is scope for class actions to be used to allow the claims of a whole class of claimants to be heard in a single action in both
follow-on and standalone competition cases.
We are from time to time subject to certain legal or regulatory investigations, inquiries or proceedings in the normal course of our business, including in
connection with our lending and payment activities, treatment of customers, relationships with our employees, financial crime, and other commercial or tax
matters. These may be brought against us under UK legal or regulatory processes, or under legal or regulatory processes in other jurisdictions, such as
the EU and the US, where overseas regulators and authorities may have jurisdiction by virtue of our activities or operations. In view of the inherent
difficulty of predicting the outcome of legal or regulatory proceedings, particularly where opportunistic claimants seek very large or indeterminate
damages, cases present novel legal theories, involve a large number of parties or are in the early stages of discovery, or where the approaches of
regulators or authorities to legal or regulatory issues and sanctions applied are subject to change, we cannot state with confidence what the eventual
outcome of any pending matters will be and any such pending matters are not disclosed by name because they are under assessment. Our provisions in
respect of any pending legal or regulatory proceedings are made in accordance with relevant accounting requirements. These provisions are reviewed
periodically. However, in light of the uncertainties involved in such legal or regulatory proceedings, there can be no assurance that the ultimate resolution
of these matters will not exceed the provisions currently accrued by us.
As a result, the outcome of a particular matter (whether currently provided or otherwise) may be material to our operating results for a particular period,
depending upon, among other factors, the size of the loss or liability imposed and our level of income for that period.
228 Santander UK plc
ˆ200G2Mlv!2=0s5BgÊ200G2Mlv!2=0s5Bgˆ
628340 TX 229SANTANDERFORM 20-F (SAN UK PL
04-Mar-2019 01:39 ESTHTMLON
Donnelley Financial EGV annas1dc 10*ESS 0C
VDI-W7-PFD-029812.9.12.0
bar6
Page 1 of 1
> Risk factors
Santander UK plc 229
Potential intervention by the FCA, the PRA, the CMA or an overseas regulator may occur, particularly in response to customer
complaints
The PRA and the FCA continue to have an outcome-focused regulatory approach. This involves proactive intervention, investigation and
enforcement, and punitive penalties for infringement. As a result, we and other PRA-authorised or FCA-authorised firms continue to face
increased supervisory intrusion and scrutiny (resulting in higher costs, including supervision fees), and in the event of a breach of relevant
law or regulation, we are likely to face more stringent penalties and regulatory actions.
The developing legal and regulatory regime in which we operate requires us to be compliant across all aspects of our business, including
the training, authorisation and supervision of personnel, systems, processes and documentation. If we fail to be compliant with relevant law
or regulation, there is a risk of an adverse impact on our business from more proactive regulatory intervention (including by any overseas
regulator which establishes jurisdiction), investigation and enforcement activity leading to sanctions, fines, civil or criminal penalties, or
other action imposed by or agreed with the regulatory authorities, as well as increased costs associated with responding to regulatory
inquiries and defending regulatory actions. Customers of financial services institutions, including our customers, may seek redress if they
consider that they have suffered loss for example as a result of the misselling of a particular product, or through incorrect application or
enforcement of the terms and conditions of a particular product or in connection with a competition law infringement.
In particular, the FCA has operational objectives to protect consumers and to promote competition, and it is taking a more interventionist
approach in its increasing scrutiny of product terms and conditions and monitoring compliance with competition law. FSMA (as amended
by the Financial Services Act 2012) gives the FCA the power to make temporary product intervention rules either to improve a firm’s
systems and controls in relation to product design, product management and implementation, or to address problems identified with
products which may potentially cause significant detriment to consumers because of certain product features or firms’ flawed governance
and distribution strategies. Such rules may prevent firms from entering into product agreements with consumers until such problems have
been rectified. Since April 2015 the FCA (and the PSR) also has concurrent competition law enforcement powers. This is in addition to the
CMA, the UK’s main competition authority, and the Commission which continue to have jurisdiction, respectively, to enforce competition
law infringements in the UK or which have an effect on trade between EU Member States. Following a report by the National Audit Office,
the CMA has stated it will seek to shift its focus toward enforcement of competition law breaches. As a result, the UK financial services
sector now operates in an environment of heightened competition law scrutiny. Under the Financial Services Act 2010, the FCA also has
the power to impose its own customer redress scheme on authorised firms, including us, if it considers that consumers have suffered loss
or damage as a consequence of a regulatory failing, including misselling.
In recent years there has been FCA focus on the misselling of PPI. In November 2015, the FCA issued a consultation paper (CP15/39)
outlining its proposed approach to PPI in light of the 2014 decision of the Supreme Court in Plevin v Paragon Personal Finance Ltd (Plevin)
and its proposal to set a two year deadline for PPI claims. In Plevin, the Supreme Court ruled that a failure to disclose a large commission
payment on a single premium PPI policy sold in connection with a secured personal loan made the relationship between the lender and the
borrower unfair under section 140A of the Consumer Credit Act 1974 (CCA).
On 2 March 2017, the FCA published its policy statement (PS17/3) and final rules and guidance, confirming that there would be a two year
deadline for PPI complaints, and that this would take effect from 29 August 2017, and include the commencement of a consumer
communications campaign. The FCA’s approach to Plevin/unfair relationships under s140A CCA remains largely as set out in CP16/20, so
profit share is included in the FCA’s approach to the assessment of fairness and redress. In addition, firms were required to write to
customers whose misselling complaints were previously rejected, and who are within scope of s140A CCA, to inform them of their right to
complain again in light of Plevin. The PPI provision was increased by a further £32m in March 2017 to take account of PS17/3 and the
FCA’s final rules and guidance. In June 2017, we made a further net charge of £37m, following a review of claims handling procedures in
relation to a specific PPI portfolio including the impact of a past business review. In Q4 2017, we made a further PPI provision of £40m,
relating to an increase in estimated future claims activity following the commencement of the FCA advertising campaign for PPI. The
ultimate financial impact on us of the claims arising from PPI complaints is still uncertain and will depend on a number of factors, including
the rate at which new complaints arise, the length of any complaints, the content and quality of the complaints (including the availability of
supporting evidence) and the average uphold rates and redress costs. We can make no assurance that expenses associated with PPI
complaints will not exceed the provisions made relating to these claims. More generally, we can make no assurance that estimates for
potential liabilities, based on the key assumptions used, are correct, and the reserves taken as a result may prove inadequate. If additional
expenses that exceed provisions for PPI liabilities or other provisions were to be incurred, these expenses could have a material adverse
effect on our operations, financial condition and prospects. If additional expenses that exceed provisions for PPI liabilities or other
provisions were to be incurred, these expenses could have a material adverse effect on our operations, financial condition and prospects.
For further information about the provisions for PPI complaint liabilities and other conduct remediation, see Note 30 to the Consolidated
Financial Statements. The potential financial impact may be relevant to any future industry-wide misselling or other infringement that could
affect our businesses. Any such issues may lead from time to time to: (i) significant costs or liabilities; and (ii) changes in the practices of
such businesses which benefit customers at a cost to shareholders. Decisions taken by the FOS (or any equivalent overseas regulator that
has jurisdiction) could, if applied to a wider class or grouping of customers, have a material adverse effect on our operations, financial
condition and prospects.
The Financial Services and Markets Act 2000 (Designated Consumer Bodies) Order 2013 (the Designated Consumer Bodies Order) was
made on 16 December 2013 and came into force on 1 January 2014. The Designated Consumer Bodies Order designates the National
Association of Citizens Advice Bureaux, the Consumers’ Association, the General Consumer Council for Northern Ireland and the National
Federation of Self Employed and Small Businesses as consumer bodies that may submit a ‘super-complaint’ to the FCA. A ‘super-
complaint’ is a complaint made by any of these designated consumer bodies to the FCA on behalf of consumers of financial services
where it considers that a feature, or a combination of features, of the market for financial services in the UK is seriously damaging the
interests of these customers. Complaints about damage to the interests of individual consumers will continue to be dealt with by the FOS.
If a ‘super-complaint’ were to be made against a Santander UK group entity by a designated consumer body under the Designated
Consumer Bodies Order, any response published or action taken by the FCA could have a material adverse effect on our operations,
financial condition and prospects.
Given the: (i) requirement for compliance with an increasing volume of relevant laws and regulation; (ii) more proactive regulatory
intervention and enforcement and more punitive sanctions and penalties for infringement; (iii) inherent unpredictability of litigation; and
(iv) evolution of the jurisdiction of FOS and related impacts (including the changes identified by the FCA in the policy statements (PS
18/21) on 16 October 2018 and (PS18/22) on 14 December 2018, setting out changes to the eligibility criteria to access FOS), it is possible
that related costs or liabilities could have a material adverse effect on our operations, financial condition and prospects.
The Banking Act may adversely affect our business
The Banking Act came into force on 21 February 2009. The special resolution regime set out in the Banking Act provides HM Treasury, the
BoE, the PRA and the FCA (and their successor bodies) with a variety of powers for dealing with UK deposit taking institutions (and, in
certain circumstances, their holding companies) that are failing or likely to fail, including: (i) to take a bank or bank holding company into
temporary public ownership; (ii) to transfer all or part of the business of a bank to a private sector purchaser; or (iii) to transfer all or part of
the business of a bank to a ‘bridge bank’. The special resolution regime also comprises a separate insolvency procedure and
administration procedure each of which is of specific application to banks. These insolvency and administration measures may be invoked
prior to the point at which an application for insolvency proceedings with respect to a relevant institution could be made.
ˆ200G2Mlv!2SX7ZLgwŠ200G2Mlv!2SX7ZLgw
628340 TX 230SANTANDERFORM 20-F (SAN UK PL
03-Mar-2019 07:18 ESTHTMLON
Donnelley Financial EGV manra0dc 2*ESS 0C
VDI-W7-PFL-165312.9.12.0
Page 1 of 1
Annual Report 2018 | Other information for US investors
In addition, pursuant to amendments made to the Banking Act, which came into force on 1 August 2014, provision has been made for various tools to be
used in respect of a wider range of UK entities, including investment firms and certain banking group companies, provided that certain conditions are met.
Secondary legislation specifies that the Banking Act powers can be applied to investment firms that are required to hold initial capital of €730,000 or more
and to certain UK incorporated non-bank companies in the Santander UK group.
If an instrument or order were made under the Banking Act in respect of the Company or another Santander UK group entity, such instrument or order (as
the case may be) may, among other things: (i) result in a compulsory transfer of shares or other securities or property of the Company or such other entity;
(ii) impact on the rights of the holders of shares or other securities in the Company or such other entity or result in the nullification or modification of the
terms and conditions of such shares or securities; or (iii) result in the de-listing of the shares and/or other securities of the Company or such other entity in
the Santander UK group. In addition, such an order may affect matters in respect of the Company or such other entity and/or other aspects of the shares
or other securities of the Company or such other entity in the Santander UK group, which may negatively affect the ability of the Company or such other
entity to meet its obligations in respect of such shares or securities.
Further, amendments to the Insolvency Act 1986 and secondary legislation have introduced changes to the treatment and ranking of certain debts with the
result that certain eligible deposits will rank in priority to the claims of ordinary (i.e. non-preferred) unsecured creditors in the event of an insolvency. This
may negatively affect the ability of the Company or another Santander UK group entity to meet its obligations in respect of its unsecured creditors in an
insolvency scenario.
Bail-in and write down powers under the Banking Act and the BRRD may adversely affect our business and the value of securities we may
issue
The Banking Reform Act as of 31 December 2014 amended the Banking Act to introduce a UK ‘bail-in power’. On 6 May 2014, the Council adopted the
EU Bank Recovery and Resolution Directive (BRRD), which contains a similar bail-in power and requires EU Member States to provide resolution
authorities with the power to write down the claims of unsecured creditors of a failing institution and to convert unsecured claims to equity (subject to
certain parameters). The UK Government decided to implement the BRRD bail-in power from 1 January 2015, with the final phase of rules implemented
on 1 January 2016.
The UK bail-in power is an additional power available to the UK resolution authorities under the special resolution regime provided for in the Banking Act.
This enables them to recapitalise a failed institution by allocating losses to such institution’s shareholders and unsecured creditors, subject to the rights of
such shareholders and unsecured creditors to be compensated under a bail-in compensation order. Such an order would be based on the principle that
such creditors should receive no less favourable treatment than they would have received had the bank entered into insolvency immediately before the
coming into effect of the bail-in power. The bail-in power includes the power to cancel or write down (in whole or in part) certain liabilities or to modify the
terms of certain contracts for the purposes of reducing or deferring the liabilities of a relevant institution under resolution and the power to convert certain
liabilities into shares (or other instruments of ownership) of the relevant institution. The conditions for use of the UK bail-in power are generally that (i) the
regulator determines the relevant institution is failing or likely to fail; (ii) it is not reasonably likely that any other action can be taken to avoid such relevant
institution’s failure; and (iii) the relevant UK resolution authority determines that it is in the public interest to exercise the bail-in power. Certain liabilities are
excluded from the scope of the bail-in powers, including liabilities to the extent that they are secured.
According to the Banking Act, as well as similar principles in the BRRD, the relevant UK resolution authority should have regard to the insolvency
treatment principles when exercising the UK bail-in power. The insolvency treatment principles are that: (i) the exercise of the UK bail-in power should be
consistent with treating all liabilities of the relevant bank in accordance with the priority that they would enjoy on a liquidation; and (ii) any creditors who
would have equal priority on a liquidation should bear losses on an equal footing with each other. HM Treasury may, by order, specify further matters or
principles to which the relevant UK resolution authority must have regard when exercising the UK bail-in power. These principles may be specified in
addition to, or instead of, the insolvency treatment principles. If the relevant UK resolution authority departs from the insolvency treatment principles when
exercising the UK bail-in power, it must report to the Chancellor of the Exchequer stating the reasons for its departure.
The bail-in power under the Banking Act and the BRRD may potentially be exercised in respect of any unsecured debt securities issued by a financial
institution under resolution or by a relevant member of the Santander UK group, regardless of when they were issued. Accordingly, the bail-in power under
the Banking Act and the BRRD could be exercised in respect of our debt securities. Public financial support would only be used as a last resort, if at all,
after having assessed and exploited, to the maximum extent practicable, the resolution tools including the bail-in tool, and the occurrence of
circumstances in which bail-in powers would need to be exercised in respect of us would have a material adverse effect on our operations, financial
condition and prospects.
The BRRD also contains a mandatory write down power which requires EU Member States to grant powers to resolution authorities to recapitalise
institutions and/or their EEA parent holding companies that are in severe financial difficulty or at the point of non-viability by permanently writing down Tier
1 and Tier 2 capital instruments issued by such institutions and/or their EEA parent holding companies, or converting those capital instruments into shares
(or other instruments of ownership). The mandatory write down provision has been implemented in the UK through the Banking Act. Before taking any
form of resolution action or applying any resolution power set out in the BRRD, the UK resolution authorities have the power (and are obliged when
specified conditions are determined to have been met) to write down, or convert Tier 1 and Tier 2 capital instruments issued by the relevant institution into
CET1 capital instruments before, or simultaneously with, the entry into resolution of the relevant entity. These measures could be applied to certain of our
debt securities. The occurrence of circumstances in which write down powers would need to be exercised in respect of us would be likely to have a
negative impact on our business.
In contrast to the creditor protections afforded in the event of the bail-in powers being exercised, holders of capital instruments will not be entitled to the
‘no creditor worse-off’ protections under the Banking Act in the event that their capital instruments are written down or converted to equity under the
mandatory write-down tool (unless the mandatory write-down tool were to be used alongside a bail-in). Furthermore, in circumstances where capital
instruments are converted into equity securities by application of the mandatory write-down tool, those equity securities may be subjected to the bail-in
powers in resolution, resulting in their cancellation, significant dilution or transfer away from the investors therein.
In addition, the BRRD provides for resolution authorities to have the power to require institutions and groups to make structural changes to ensure legal
and operational separation of ‘critical functions’ from other functions where necessary, or to require institutions to limit or cease existing or proposed
activities in certain circumstances. As a result of changes to the PRA Rulebook made to implement the BRRD, the Company is now required to identify
such ‘critical functions’ as part of its resolution and recovery planning. If used in respect of us, these ex ante powers would have a material adverse effect
on our operations, financial condition and prospects.
230 Santander UK plc
ˆ200G2Mlv!2YdMxvgxŠ200G2Mlv!2YdMxvgx
628340 TX 231SANTANDERFORM 20-F (SAN UK PL
03-Mar-2019 23:56 ESTHTMLON
Donnelley Financial EGV marik1dc 4*ESS 0C
VDI-W7-PFL-060212.9.12.0
bar6
Page 1 of 1
> Risk factors
Santander UK plc 231
We are subject to regulatory capital and leverage requirements that could limit our operations, and changes to these
requirements may further limit and adversely affect our operations, financial condition and prospects
We are subject to capital adequacy requirements applicable to banks and banking groups under directly applicable EU legislation and as
adopted by the PRA. We are required to maintain a minimum ratio of Common Equity Tier 1 (CET1) capital to risk-weighted assets, Tier 1
capital to risk-weighted assets, total capital to risk-weighted assets and Tier 1 capital to total adjusted assets for leverage monitoring
purposes. Any failure by us to maintain such ratios above prescribed regulatory minimum levels may result in administrative actions or
sanctions. These could potentially include requirements on us to cease all or certain lines of new business, to raise new capital resources
or, in certain circumstances, a requirement for our existing capital instruments (potentially including our debt securities) to be subjected to
bail-in or write down (for more information, see the risk factor entitled ‘Bail-in and write down powers under the Banking Act and the BRRD
may adversely affect our business and the value of securities we may issue’).
The Capital Requirements Directive IV (CRD IV Directive) and the Capital Requirements Regulation (the CRR and together with the CRD
IV Directive, CRD IV) implemented changes proposed by the Basel Committee on Banking Supervision (the Basel Committee) to the
capital adequacy framework, known as ‘Basel III’ in the EU. The CRR is directly applicable in each EU Member State and does not
therefore require national implementing measures, whilst the CRD IV Directive has been implemented by EU Member States through
national legislative processes. CRD IV was published in the Official Journal on 27 June 2013 and came into effect on 1 January 2014, with
particular requirements expected to be fully effective by the end of 2019. CRD IV substantially reflects the Basel III capital and liquidity
standards and facilitates the applicable implementation timeframes. On 19 December 2013, the PRA published the initial version of its
rules and supervisory statements associated with the implementation of CRD IV, which cover prudential rules for banks, building societies
and investment firms. Binding technical standards adopted by the European Commission have also impacted, and may further impact, the
capital requirements which apply under CRD IV.
Under the ‘Pillar 2’ framework, the PRA requires the capital resources of UK banks to be maintained at levels which exceed the base
capital requirements prescribed by CRD IV and to cover relevant risks in their business. In addition, a series of capital buffers have been
established under CRD IV and PRA rules to ensure a bank can withstand a period of stress. These buffers, which must be met by CET1
capital, include the counter-cyclical capital buffer, sectoral capital requirements, a PRA buffer and the capital conservation buffer. The total
size of the capital buffers will be informed by the results of the annual concurrent UK stress testing exercises. The BoE’s approach to
stress testing the UK banking system was outlined in October 2015. The BoE is aiming to develop an approach that is explicitly counter-
cyclical, with the severity of the stress test and the associated regulatory capital buffers varying systematically with the state of the financial
cycle. Furthermore, the framework is aiming to support a continued improvement in UK banks’ risk management and capital planning
capabilities, and the BoE expects participating UK banks to demonstrate sustained improvements in their capabilities over time. The PRA
can take action if a bank fails to meet the required capital ratio hurdle rates in the stress testing exercise, and the banks which fail to do so
will be required to take action to strengthen their capital position over an appropriate timeframe. If a bank does not meet expectations in its
risk management and capital planning capabilities in the stress testing exercise, this may inform the setting of its capital buffers. In March
2018, the BoE published its guidance on its 2018 stress tests, which contained the annual cyclical scenario. The BoE published results of
the stress test in November 2018.
Though the results of the PRA’s 2018 stress test did not impact on the level of capital that we are required to hold, the PRA could, in the
future, as a result of stress testing exercises (both in the UK and EU wide) and as part of the exercise of UK macro-prudential capital
regulation tools, or through supervisory actions (beyond the changes described below), require UK banks and banking groups, including
us, to increase our/their capital resources further.
The Financial Services Act 2012 (the FS Act) empowers the Financial Policy Committee of the BoE (FPC), which is a sub-committee of the
Court of Directors of the BoE, to give directions to the PRA and the FCA so as to ensure implementation of macroprudential measures
intended to manage systemic risk. For the UK, the FPC sets the countercyclical capital buffer rate on a quarterly basis. Following its
meeting in June 2017, the FPC announced that the UK countercyclical capital buffer rate would be increased from 0% to 0.5%, with
binding effect from June 2018. On 28 November 2017, it further increased the level to 1% with binding effect from November 2018.
Following its meetings on 20 and 27 November 2018, the FPC maintained the UK countercyclical buffer rate at 1% and indicated it stood
ready to move the rate in either direction as the risk environment evolved.
The FS Act also provides the FPC with certain other macro-prudential tools for the management of systemic risk. Since 6 April 2015, these
tools have included powers of direction relating to leverage ratios. In July 2015, the FPC made certain directions to the PRA in relation to
the leverage ratio. In December 2015, the PRA issued a policy statement setting out how it would implement the FPC’s direction and
recommendations on the leverage ratio. All major UK banks and banking groups (including us) are required to hold enough Tier 1 capital
(75% of which must be CET1 capital) to satisfy a minimum leverage requirement of 3.25% (following the PRA’s decision to increase the
leverage ratio requirement from 3% to 3.25%, announced in October 2017) and enough CET1 capital to satisfy a countercyclical leverage
ratio buffer of 35% of each bank’s institution-specific countercyclical capital buffer rate. The FPC has also previously directed the PRA to
require UK globally systemically important banks (G-SIBs) and domestically systemically important banks, building societies and
PRA-regulated investment firms (including us) to hold enough CET1 capital to meet a supplementary leverage ratio buffer of 35% of the
institution-specific G-SIB buffer rate or Systemic Risk Buffer (SRBF) for domestically systemically important banks. The supplementary
leverage ratio buffer was implemented on 1 January 2016, in line with the G-SIB buffer rate imposed by the Financial Stability Board
(FSB), with the SRBF to be applicable from 1 January 2019. The FPC finalised and published its SRBF framework on 25 May 2016.
Systemic importance is measured using the total assets of ring-fenced bank sub-groups in scope of the SRBF, with higher SRBF rates
applicable as total assets increase. In December 2016, the PRA published its statement of policy on the SRBF relevant to ring-fenced
bodies and in November 2018 published its statement of policy for reflecting the SRBF for the UK Leverage Ratio. The FPC can also direct
the PRA to adjust capital requirements in relation to particular sectors through the imposition of sectoral capital requirements. Action taken
in the future by the FPC in exercise of any of its powers could result in the regulatory capital requirements applied to us being further
increased.
Regulators in the UK and worldwide have also proposed that additional loss absorbency requirements should be applied to systemically
important institutions to ensure that there is sufficient loss absorbing and recapitalisation capacity available in resolution. The BRRD
requires that EU Member States ensure that EU banks meet a Minimum Requirement for Eligible Liabilities (MREL). The BRRD was
transposed into UK law in January 2015, with the provisions on MREL taking effect from 1 January 2016.
The BoE’s approach to setting a minimum requirement for own funds and eligible liabilities (MREL) Policy Statement was published in
November 2016 and was subsequently updated in June 2018.
This sets out how the BoE expects to use its power to direct a ‘relevant person’ to maintain a minimum requirement for own funds and
eligible liabilities (MREL). The Bank is required to set MREL for all institutions and will set the loss absorption amount to cover the losses
that would need to be absorbed up to and in resolution. MREL eligible liabilities should be issued externally from the resolution entity.

ˆ200G2Mlv!2SHsFg60Š200G2Mlv!2SHsFg60
628340 TX 232SANTANDERFORM 20-F (SAN UK PL
03-Mar-2019 06:50 ESTHTMLON
Donnelley Financial EGV anana3dc 2*ESS 0C
VDI-W7-PFL-151812.9.12.0
Page 1 of 1
Annual Report 2018 | Other information for US investors
There are two types of MREL: ‘external MREL’, issued by a resolution entity, and internal MREL, issued by legal entities in a group that are not
themselves resolution entities. Should a firm fail, external MREL helps to ensure that the firm’s own financial resources can be used to absorb losses and
recapitalise the business, so that it can continue to provide critical functions without relying on public funds. Internal MREL provides for the recapitalisation
of subsidiaries and has the effect of passing up losses within the group, so that they can be absorbed by the shareholders and creditors of the resolution
entity through the use of resolution tools.
The BoE expects banks to comply with end-state MREL requirements by 1 January 2022, with the following interim transition (noting scalars may apply to
internal MREL amounts):
From 1 January 2019 UK resolution entities that are G-SIBs will be required to meet the minimum requirements set out in the FSB TLAC standard, being
the higher of 16% of RWAs or 6% of leverage exposures. The Santander UK group is part of a G-SIB Banking Group and as such will need to meet these
minimum requirements.
From 1 January 2020 UK resolution entities that are G-SIBs or D-SIBs will be required to maintain MREL equal to the higher of: two times their Pillar 1
capital requirements and one times their Pillar 2A add-ons or if subject to a leverage ratio requirement, two times the applicable requirement.
From 1 January 2022: G-SIBs will be required to meet an external MREL equivalent to the higher of: two times the sum of Pillar 1 and Pillar 2A, or the
higher of two times the applicable leverage ratio requirement or 6.75% of leverage exposures.
The BoE intends to take forward for internal MREL eligible liabilities the requirement that they be issued with a contractual trigger that provides the
resolution authority of the material subsidiary with the opportunity to direct a write-down and/or conversion in the circumstances specified in the Policy
Statement.
On 23 November 2016, the European Commission also published legislative proposals for amendments to CRD IV, the BRRD and the SRM and proposed
an additional amending directive to facilitate the creation of a new asset class of ‘nonpreferred’ senior debt. The package of reforms is aimed at further
strengthening the resilience of EU credit institutions and is expected to be finalised in 2019 with entry into force (with certain exceptions) no earlier than
2020. Among other things, the proposed package of reforms includes proposals to introduce a binding 3% leverage ratio and a requirement for institutions
that trade in securities and derivatives to have more risk-sensitive own funds. In line with the BoE’s Policy Statement and the PRA consultation, the
proposed reforms also include measures to align the MREL requirements with the FSB TLAC standards. The proposed reforms are to be considered by
the European Parliament and the Council of the EU and remain subject to change, although Directive 2017/2399 amending Directive 2014/59/EU,
implementing the ‘non-preferred’ senior debt class came into force in December 2017. The final package of reforms may not include all elements of the
proposals and new or amended elements may be introduced. Until the proposals are in final form, it is uncertain how they will affect us.
Further, since 31 December 2014, the PRA has had the power under the FSMA to make rules requiring a parent undertaking of a bank to make
arrangements to facilitate the exercise of resolution powers, including a power to require a group to issue debt instruments. Such powers could have an
impact on the liquidity of our debt instruments and could materially increase our cost of funding. Since 1 January 2014, we have also been subject to
certain recovery and resolution planning requirements (popularly known as ‘living wills’) for banks and other financial institutions as set out in the PRA
Rulebook. These requirements were updated in January 2015 to implement the recovery and resolution framework under the BRRD. The updated
requirements impose more regular and detailed reporting obligations, including the requirement to submit recovery plans and resolution packs to the PRA
and to keep them up to date.
In addition to the above, regulators in the UK and worldwide have produced a range of proposals for future legislative and regulatory changes which could
force us to comply with certain operational restrictions or take steps to raise further capital, or could increase our expenses, or otherwise adversely affect
our operations, financial condition and prospects. These changes, which could affect the Santander UK group as a whole, include the EU implementation
of the Basel Committee’s new market risk framework, which reflects rules made as a result of the Basel Committee’s fundamental review of the trading
book. In addition, in December 2017 the Basel Committee published their finalisation of the Basel III framework, with proposed implementation from
1 January 2022. This includes the following elements:
– Revisions to the standardised approach for credit risk, credit valuation adjustment risk and operational risk to address certain weaknesses identified by
the Basel Committee
– Additional constraints on the use of internal model approaches for credit risk, and removing the use of internal model approaches for credit valuation
adjustment risk and operational risk
– The use of an output floor based on standardised approaches
– The introduction of a leverage ratio buffer for global systemically important banks and refinements to the definition of the leverage ratio exposure
measure.
The foregoing measures could have a material adverse effect on our operating results, and consequently, on our financial condition and prospects. There
is a risk that changes to the UK’s capital adequacy regime (including any increase to minimum leverage ratios) may result in increased minimum capital
requirements, which could reduce available capital for business purposes and thereby adversely affect our cost of funding, profitability and ability to pay
dividends, continue organic growth (including increased lending), or pursue acquisitions or other strategic opportunities (alternatively we could restructure
our balance sheet to reduce the capital charges incurred pursuant to the PRA’s rules in relation to the assets held, or raise additional capital but at
increased cost and subject to prevailing market conditions). In addition, changes to the eligibility criteria for Tier 1 and Tier 2 capital may affect our ability
to raise Tier 1 and Tier 2 capital and impact the recognition of existing Tier 1 and Tier 2 capital resources in the calculation of our capital position.
Furthermore increased capital requirements may negatively affect our return on equity and other financial performance indicators.
Our business could be affected if our capital is not managed effectively or if these measures limit our ability to manage our balance sheet and capital
resources effectively or to access funding on commercially acceptable terms. Effective management of our capital position is important to our ability to
operate our business, to continue to grow organically and to pursue our business strategy. For more on our capital position and capital management, see
‘Risk review – Capital risk’ on pages 111 to 113.
Liquidity and funding risks are inherent in our business and could have a material adverse effect on us
Liquidity risk is the risk that we, although otherwise solvent, either do not have available sufficient financial resources to meet our obligations as they fall
due or can secure them only at excessive cost. This risk is inherent in any retail and commercial banking business and can be heightened by a number of
enterprise-specific factors, including over-reliance on a particular source of funding, changes in credit ratings or market-wide phenomena such as market
dislocation. While we implement liquidity management processes to seek to mitigate and control these risks, unforeseen systemic market factors in
particular make it difficult to eliminate completely these risks. During the period 2008 to 2013, continued constraints in the supply of liquidity, including
inter-bank lending, materially and adversely affected the cost of
232 Santander UK plc

ˆ200G2Mlv!2YeJ!5g?Š200G2Mlv!2YeJ!5g?
628340 TX 233SANTANDERFORM 20-F (SAN UK PL
03-Mar-2019 23:57 ESTHTMLON
Donnelley Financial EGV marik1dc 4*ESS 0C
VDI-W7-PFL-060212.9.12.0
bar6
Page 1 of 2
> Risk factors
funding our business. There can be no assurance that such constraints will not reoccur. Extreme liquidity constraints may affect our
operations and our ability to fulfil regulatory liquidity requirements, as well as limit growth possibilities. Disruption and volatility in the global
financial markets could have a material adverse effect on our ability to access capital and liquidity on financial terms acceptable to us.
Our cost of funding is directly related to prevailing interest rates and to our credit spreads. Increases in interest rates and our credit
spreads can significantly increase the cost of our funding. Changes in our credit spreads are market-driven and may be influenced by
market perceptions of our creditworthiness. Changes to interest rates and our credit spreads occur continuously and may be unpredictable
and highly volatile.
If wholesale markets financing ceases to be available, or becomes excessively expensive, we may be forced to raise the rates we pay on
deposits, with a view to attracting more customers, and/or to sell assets, potentially at depressed prices. The persistence or worsening of
these adverse market conditions or an increase in base interest rates could have a material adverse effect on our ability to access liquidity
and cost of funding (whether directly or indirectly) and therefore on our operations, financial condition and prospects.
In response to the financial crisis, central banks around the world, including the BoE, US Federal Reserve Bank (the Fed) and the ECB,
made coordinated efforts to increase liquidity in the financial markets by taking measures such as increasing the amounts they lend directly
to financial institutions, lowering interest rates and ensuring that currency swaps markets remain liquid. Over the course of 2018 central
banks have either started or continued to unwinding such stimulus, however towards the end of 2018 was that the near-term outlook for
global growth had started to show signs of softening, this could lead to a slowdown in the expected tightening of global monetary policy.
The BoE increased their Base Rate in August 2018 to 0.75%, this was the only UK rate rise in 2018. Additionally the BoE voted to maintain
the stock of the quantitative easing programme of £445bn of assets, comprising £10bn of corporate bonds and £435bn of gilts. In
December 2018, the ECB confirmed that it would end its asset purchase programme. In the US, the Fed increased its short-term interest
rate by 25 basis points in each of March 2018, June 2018, September 2018 and December 2018 to 2.50%, and has forecast gradual
additional interest rate increases in 2019. A rapid removal or significant reduction, in outstanding quantitative easing asset purchase
programmes could have an adverse effect on our ability to access liquidity and on our funding costs.
In October 2013, the BoE updated its Sterling Monetary Framework to provide more transparent liquidity insurance support in exceptional
circumstances. The Indexed Long-Term Repo Facility will now be available to support regular bank requirements for liquidity while the
Discount Window Facility has been reinforced as support for banks experiencing idiosyncratic stress. The Collateralised Term Repo
Facility will be made available to support markets in the event of a market wide liquidity stress. On 28 February 2018, the drawdown period
closed for the BoE’s Term Funding Scheme(1) (TFS), which allowed participants to borrow central bank reserves in exchange for eligible
collateral. At 31 December 2018, we had drawn £10.8bn under the TFS. In addition to the TFS, we participated in the Funding for Lending
Scheme (FLS). At 31 December 2018, we had drawn £1.0bn of UK treasury bills under the FLS.
To the extent that we have made use of these BoE facilities described above, any significant reduction or withdrawal of those facilities
could increase our funding costs.
Each of the factors described above (the persistence or worsening of adverse market conditions, and the lack of availability, or withdrawal,
of such central bank quantitative easing and/or lending schemes or an increase in base interest rates) could have a material adverse effect
on us, including our ability to access capital and liquidity on financial terms acceptable to us and, more generally, on our operations,
financial condition and prospects.
Further, we aim for a funding structure that is consistent with our assets, avoids excessive reliance on short-term wholesale funding,
attracts enduring commercial deposits and provides diversification in products and tenor. We therefore rely, and will continue to rely, on
commercial deposits to fund a significant proportion of lending activities. The ongoing availability of this type of funding is sensitive to a
variety of factors outside our control, such as general economic conditions and the confidence of commercial depositors in the economy in
the financial services industry in general, confidence in the company specifically, the Company’s credit rating and the availability and
extent of deposit guarantees, as well as competition between banks for deposits or competition with other products, such as mutual funds.
A change in any of these factors could significantly increase the amount of commercial deposit withdrawals in a short period of time,
thereby reducing our ability to access commercial deposit funding on appropriate terms, or at all, in the future, and therefore have a
material adverse effect on our operations, financial condition and prospects.
In our liquidity planning we assume that our customers will continue to make a volume of deposits with us (particularly demand deposits
and short-term time deposits), and we intend to maintain our emphasis on the use of banking deposits as a source of funds. The short-
term nature of some deposits could cause liquidity problems for us in the future if deposits are not made in the volumes we expect or are
withdrawn at short notice or are not renewed. If a substantial number of our depositors withdraw their demand deposits or do not roll over
their time deposits upon maturity, there may be a material adverse effect on our operations, financial condition and prospects. For
additional information about our liquidity position and other liquidity matters, including the policies and procedures we use to manage our
liquidity risks, see ‘Risk review – Liquidity risk’ on pages 103 to 105.
A sudden or unexpected shortage of funds in the banking system could threaten the stability of the banking system, and lead to increased
funding costs, a reduction in the term of funding instruments or require us to liquidate certain assets, thereby impacting our liquidity
position and ability to pay our debts. If these circumstances were to arise, this could have a material adverse effect on our operations,
financial condition and prospects.
We are subject to liquidity requirements that could limit our operations, and changes to these requirements may further limit and
adversely affect our operations, financial condition and prospects
The PRA has responsibility for the micro-prudential regulation of banks and certain other financial institutions. In June 2015, the PRA
issued its policy statement on the transfer of the liquidity regime to the CRD IV standard, confirming that the existing regime under BIPRU
12 would cease to apply with effect from 1 October 2015, although certain of the BIPRU requirements are reflected in the new regime.
Under CRD IV, banks are, or under transitional measures will be, required to meet two new liquidity standards, consisting of the Liquidity
Coverage Ratio (LCR) and the Net Stable Funding Ratio (NSFR) metrics, which are aimed to promote:
– The short-term resilience of banks’ liquidity risk profiles by ensuring they have sufficient high-quality liquid assets to survive a significant
stress scenario
– A longer-term resilience by creating incentives for banks to fund their activities with more stable sources of funding on an ongoing basis.
(1) The drawdown period under the TFS ran from 19 September 2016 to 28 February 2018. The TFS was made available to banks and building societies that
are participants in the Bank of England’s Sterling Monetary Framework and signed up to the Discount Window Facility.

ˆ200G2Mlv!2YeJ!5g?Š200G2Mlv!2YeJ!5g?
628340 TX 233SANTANDERFORM 20-F (SAN UK PL
03-Mar-2019 23:57 ESTHTMLON
Donnelley Financial EGV marik1dc 4*ESS 0C
VDI-W7-PFL-060212.9.12.0
bar6
Page 2 of 2Santander UK plc 233

ˆ200G2Mlv!2Xm2yjgpŠ200G2Mlv!2Xm2yjgp
628340 TX 234SANTANDERFORM 20-F (SAN UK PL
03-Mar-2019 22:42 ESTHTMLON
Donnelley Financial EGV gopad0dc 3*ESS 0C
VDI-W7-PFD-037812.9.12.0
Page 1 of 1
Annual Report 2018 | Other information for US investors
LCR
The LCR is intended to ensure that a bank maintains an adequate level of unencumbered, high quality liquid assets which can be used to offset the net
cash outflows the bank could encounter under a short-term significant liquidity stress scenario. The current minimum requirement for LCR is set at 100%.
Our current liquidity position is in excess of the minimum requirements set by the PRA, however there can be no assurance that future changes to the
applicable liquidity requirements would not have an adverse effect on our financial performance.
NSFR
In October 2014, the Basel Committee published its final NSFR standard. The NSFR has not yet been implemented within Europe (unlike the LCR). As
such there is no formal NSFR requirement applicable to UK or other EU banks until such time as the European Commission adopts appropriate
regulatory/technical standards. The NSFR is defined as the amount of available stable funding relative to the amount of required stable funding. Banks are
expected to hold an NSFR of at least 100% on an ongoing basis and report its NSFR at least quarterly. Ahead of its planned implementation, the NSFR
will remain subject to an observation period. Santander UK monitors its NSFR on an ongoing basis and stands ready to comply with the standards once
agreed.
There is a risk that implementing and maintaining existing and new liquidity requirements, such as through enhanced liquidity risk management systems,
may incur significant costs, and more stringent requirements to hold liquid assets may materially affect our lending business as more funds may be
required to acquire or maintain a liquidity buffer, thereby reducing future profitability. This could in turn adversely impact our operations, financial condition
and prospects.
Exposure to UK Government debt could have a material adverse effect on us
Like many other UK banks, we invest in debt securities of the UK Government, largely for liquidity purposes. At 31 December 2018, approximately 2% of
our total assets and 36% of our securities portfolio were comprised of debt securities issued by the UK Government. Any failure by the UK Government to
make timely payments under the terms of these securities, or a significant decrease in their market value, will have a material adverse effect on our
operations, financial condition and prospects.
We may suffer adverse effects as a result of the political, economic and sovereign debt tensions in the eurozone
Conditions in the capital markets and the economy generally in the eurozone, though improving recently, continue to show signs of fragility and volatility.
Interest rate differentials among eurozone countries are affecting government finance and borrowing rates in those economies. This could have a material
adverse effect on our operations, financial condition and prospects.
The UK EU Referendum caused significant volatility in the global stock and foreign exchange markets (for more information, see the risk factor entitled
‘We are vulnerable to disruptions and volatility in the global financial markets’ and ‘Exposure to UK political developments, including the ongoing
negotiations between the UK and EU, could have a material adverse effect on us’). This volatility could re-occur depending on the outcome of the
continuing exit negotiations.
In the past, the ECB and European Council have taken actions with the aim of reducing the risk of contagion in the eurozone and beyond and improving
economic and financial stability. Notwithstanding these measures, a significant number of financial institutions throughout Europe have substantial
exposures to sovereign debt issued by the eurozone (and other) nations, which may be under financial stress. Should any of those nations default on their
debt, or experience a significant widening of credit spreads, major financial institutions and banking systems throughout Europe could be adversely
affected, with wider possible adverse consequences for global financial market conditions.
Although we conduct the majority of our business in the UK, we have direct and indirect exposure to financial and economic conditions throughout the
eurozone economies, including as a result of Banco Santander SA, and other affiliates being situated in the eurozone. Concerns relating to sovereign
defaults or a partial or complete break-up of the European Monetary Union, including potential accompanying redenomination risks and uncertainties, may
recur in light of the political and economic factors mentioned above. For a further description of our country risk exposures, including eurozone and
peripheral eurozone exposures and redenomination risk, see ‘Risk review – Country risk exposure’ on page 73. In addition, general financial and
economic conditions in the UK, which directly affect our operations, financial condition and prospects, may deteriorate as a result of conditions in the
eurozone.
We are exposed to risks faced by other financial institutions
We routinely transact with counterparties in the financial services industry, including brokers and dealers, commercial banks, investment banks, mutual
funds, hedge funds and other institutional clients. Defaults by, and even rumours or questions about the solvency of certain financial institutions and the
financial services industry generally, have led to incidents of market-wide liquidity problems over the last 10 years and could lead to losses or defaults by
other institutions. Many of the routine transactions we enter into expose us to significant credit risk in the event of default by one of our significant
counterparties. A default by a significant financial counterparty, or liquidity problems in the financial services industry generally, could have a material
adverse effect on our operations, financial condition and prospects.
An adverse movement in our external credit rating would likely increase our cost of funding, require us to post additional collateral or take
other actions under some of our derivative contracts and adversely affect our operations, financial condition and prospects
Credit ratings affect the cost and other terms upon which we are able to obtain funding. Credit rating agencies regularly evaluate us, and their credit
ratings of our institution and our debt in issue are based on a number of factors, including our financial strength, the strength of the UK economy and
conditions affecting the financial services industry generally.
Any downgrade in the external credit ratings assigned to us or any of our debt securities could have an adverse impact on us. In particular, such
downgrade in our credit ratings could increase our borrowing costs and could require us to post additional collateral or take other actions under some of
our derivative contracts, and could limit our access to capital markets and adversely affect our operations, financial condition and prospects. For example,
a credit rating downgrade could have a material adverse effect on our ability to sell or market certain of our products, engage in certain longer-term
transactions and derivatives transactions and retain our customers, particularly customers who need a minimum rating threshold in order to invest.
In addition, under the terms of certain of our derivative contracts and other financial commitments, we may be required to maintain a minimum credit rating
or otherwise our counterparties may be able to terminate such contracts or require the posting of collateral. Any of these results of a credit rating
downgrade could, in turn, result in outflows and reduce our liquidity and have an adverse effect on us, including our operations, financial condition and
prospects. For example, we estimate that at 31 December 2018, if Fitch, Moody’s and Standard & Poor’s were concurrently to downgrade the long-term
credit ratings of the Company by one notch, and thereby trigger a short-term credit rating downgrade, this could result in an outflow of £3.6bn of cash and
collateral (2017: £3.9bn). A hypothetical two notch downgrade would result in a further outflow of £0.2bn of cash and collateral at 31 December 2018
(2017: £0.2bn). These potential outflows are captured under the LCR regime. However, while certain potential impacts are contractual and quantifiable,
the full consequences of a credit rating downgrade are inherently uncertain, as they
234 Santander UK plc

ˆ200G2Mlv!2Xr#!&6†Š200G2Mlv!2Xr#!&6
628340 TX 235SANTANDERFORM 20-F (SAN UK PL
03-Mar-2019 22:46 ESTHTMLON
Donnelley Financial EGV gopad0dc 3*ESS 0C
VDI-W7-PFD-037812.9.12.0
bar6
Page 1 of 1
> Risk factors
Santander UK plc 235
depend upon numerous dynamic, complex and inter-related factors and assumptions, including market conditions at the time of any
downgrade, whether any downgrade of a firm’s long-term credit rating precipitates downgrades to its short-term credit rating, whether any
downgrade precipitates changes to the way that the financial institutions sector is rated, and assumptions about the ratings of other
financial institutions and the potential behaviours of various customers, investors and counterparties. Actual outflows will also depend upon
certain other factors including any management or restructuring actions that could be taken to reduce cash outflows and the potential
liquidity impact from a loss of unsecured funding (such as from money market funds) or loss of secured funding capacity.
Although unsecured and secured funding stresses are included in our stress testing scenarios and a portion of our total liquid assets is
held against these risks, it is still the case that a credit rating downgrade could have a material adverse effect on us. In addition, if certain
counterparties terminated derivative contracts with us and we were unable to replace such contracts, our market risk profile could be
altered.
Santander UK Group Holdings plc’s long-term debt is currently rated investment grade by the major rating agencies: Baa1 with positive
outlook by Moody’s Investors Service, BBB with stable outlook by S&P Global Ratings and A with stable outlook by Fitch Ratings. The
Company’s long-term debt is currently rated investment grade by the major rating agencies: Aa3 with positive outlook by Moody’s Investors
Service, A with stable outlook by S&P Global Ratings and A+ with stable outlook by Fitch Ratings. If a downgrade of any Santander UK
group member’s long-term credit ratings were to occur, it could also impact the short-term credit ratings of other members of the Santander
UK group.
There can be no assurance that the credit rating agencies will maintain our current credit ratings or outlooks. A failure to maintain
favourable credit ratings and outlooks could increase our cost of funding, adversely affect our interest margins, and reduce our ability to
secure both long term and short term funding, any of which could have a material adverse effect on our operations, financial condition and
prospects.
Negative changes to the UK sovereign credit rating, or the perception that further negative changes may occur, could have a material
adverse effect on our operating results, financial condition, prospects and the marketability and trading value of our securities. This might
also impact on our own credit rating, borrowing costs and our ability to secure funding. Negative changes to the UK sovereign credit rating,
or the perception that further negative changes may occur, could also have a material effect in depressing consumer confidence, restricting
the availability, and increasing the cost, of funding for individuals and companies, further depressing economic activity, increasing
unemployment and/or reducing asset prices.
Our financial results are constantly exposed to market risk. We are subject to fluctuations in interest rates and other market
risks, which may materially adversely affect us and our profitability
Market risk refers to the probability of variations in our net interest income or in the market value of our assets and liabilities due to volatility
of interest rates, exchange rates or equity prices.
Changes in interest rates would affect the following areas, among others, of our business:
– Net interest income
– The value of our derivatives transactions
– The market value of our securities holdings
– The value of our loans and deposits
– The volume of loans originated.
Interest rates are highly sensitive to many factors beyond our control, including increased regulation of the financial sector, monetary
policies, domestic and international economic and political conditions and other factors. Variations in interest rates could affect the interest
earned on our assets and the interest paid on our borrowings, thereby affecting our net interest income, which comprises the majority of
our revenue, reducing our growth rate and potentially resulting in losses. In addition, costs we incur as we implement strategies to reduce
interest rate exposure could increase in the future (which, in turn, will impact our results).
Increases in interest rates may reduce the volume of loans we originate. Sustained high interest rates have historically discouraged
customers from borrowing and have resulted in increased delinquencies in outstanding loans and deterioration in the quality of assets.
Increases in interest rates may also reduce the propensity of our customers to prepay or refinance fixed-rate loans, reduce the value of our
financial assets and reduce gains or require us to record losses on sales of our loans or securities.
Due to the historically low interest rate environment in the UK in recent years, the rates on many of our interest-bearing deposit products
have been priced at or near zero, which may limit our ability to further reduce customer rates in the event of further cuts in BoE Base Rate
and thus negatively impacting our margins. Notwithstanding the August 2018 increase in BoE Base Rate to 0.75%, if a generally low
interest rate environment in the UK persists in the long term, it may be difficult to increase our net interest income, which will impact our
results.
LIBOR and other benchmarks are subject to national, international and other regulatory guidance and proposals for reform and transition to
alternative rates. On 29 November 2017, the FCA announced that its Working Group on Sterling Risk-Free Rates will be mandated with
implementing a broad-based transition to the Sterling Overnight Index Average (“SONIA”) over the next four years across sterling bond,
loan and derivative markets, so that SONIA is established as the primary sterling interest rate benchmark. As set out in Andrew Bailey’s
speech on 12 July 2018, the introduction of SONIA as the primary sterling interest rate benchmark is planned to take place before the end
of 2021.
Any such changes to, or replacement of benchmarks may cause them to perform differently than in the past, or may have other
consequential effects on any of our rights and obligations which depend on such benchmarks. In particular, the potential transition from
LIBOR to SONIA or the elimination of the LIBOR benchmark, or changes in the manner of administration of such benchmark, could require
an adjustment to the terms of financial instruments to which the Santander UK group is a party and to such contractual obligations of the
Santander UK group which relate to LIBOR. This could have a material adverse effect on our operations, financial condition and prospects.
It is not yet clear whether LIBOR will cease to exist entirely before the end of 2021, whether the use of LIBOR will be made unlawful or
impermissible in future, and whether there will be any transitional arrangements set out by law, regulation or market practice. In particular,
it is not yet clear what the effect will be on legacy contracts and agreements. If LIBOR were to be discontinued or replaced without the
regulators making clear provision for automatically transitioning legacy contracts and agreements, this could have a material adverse effect
on our business.
ˆ200G2Mlv!2S8yZ76pŠ200G2Mlv!2S8yZ76p
628340 TX 236SANTANDERFORM 20-F (SAN UK PL
03-Mar-2019 06:31 ESTHTMLON
Donnelley Financial EGV bashs0dc 2*ESS 0C
VDI-W7-PFL-112012.9.12.0
Page 1 of 1
Annual Report 2018 | Other information for US investors
If LIBOR is replaced, ceases to exist or if the methodology for calculating LIBOR changes for any reason, interest rates on our floating rate obligations,
loans, deposits, derivatives, and other financial instruments linked to LIBOR rates, as well as the revenue and expenses associated with those financial
instruments, may be adversely affected. In addition, any uncertainty regarding the continued use and reliability of LIBOR as a benchmark interest rate
could adversely affect the value of our floating rate obligations, loans, deposits, derivatives, and other financial instruments linked to LIBOR rates. Any
such issues relating to LIBOR or other benchmarks (including SONIA) could have a material adverse effect on our operations, financial condition and
prospects.
We are also exposed to foreign exchange rate risk as a result of mismatches between assets and liabilities denominated in different currencies.
Fluctuations in the exchange rate between currencies may negatively affect our earnings and value of our assets and securities. Our capital resource is
stated in pounds sterling and we do not fully hedge our capital position against changes in currency exchange rates. Although we seek to hedge most of
our currency risk, through hedging and the purchase of cross-currency swaps, these hedges do not eliminate currency risk and we can make no
assurance that we will not suffer adverse financial consequences as a result of currency fluctuations. The volatility in the value of the pound sterling
following the result of the UK EU Referendum may persist as negotiations for exit continue and continued significant exchange rate volatility and the
depreciation of the pound sterling in particular could have an adverse impact on our operating results and our ability to meet our US dollar and euro-
denominated obligations, and which could have a material adverse effect on our operations, financial condition and prospects.
We are also exposed to price risk in our investments in equity and debt securities. The performance of financial markets may cause changes in the value
of our investment portfolios. The volatility of world equity markets, due to the continued economic uncertainty and sovereign debt tensions, has had a
particularly strong impact on the financial sector.
Continued volatility may affect the value of our investments in equity and debt securities and, depending on their fair value and future recovery
expectations, could become a permanent impairment, which would be subject to write-offs against our results. To the extent any of these risks materialise,
our net interest income or the market value of our assets and liabilities could be adversely affected.
Market conditions have resulted in, and could continue to result in, material changes to the estimated fair values of our financial assets.
Negative fair value adjustments could have a material adverse effect on our operations, financial condition and prospects
In the past 10 years, financial markets have been subject to periods of significant stress resulting in steep falls in perceived or actual financial asset
values, particularly due to volatility in global financial markets and the resulting widening of credit spreads. We have material exposures to securities,
loans, derivatives and other investments that are recorded at fair value and are therefore exposed to potential negative fair value adjustments. Asset
valuations in future periods, reflecting the prevailing market conditions, may result in negative changes in the fair values of our financial assets. In addition,
the value ultimately realised by us on disposal may be lower than the current fair value. Any of these factors could require us to record negative fair value
adjustments, which could have a material adverse effect on our operations, financial condition and prospects. In addition, to the extent that fair values are
determined using financial valuation models, such values may be inaccurate or subject to change, as the data used by such models may not be available
or may become unavailable due to changes in market conditions, particularly for illiquid assets and in times of economic instability. In such circumstances,
our valuation methodologies require us to make assumptions, judgements and estimates in order to establish fair value.
Reliable assumptions are difficult to make and are inherently uncertain. Moreover, valuation models are complex, making them inherently imperfect
predictors of actual results. Any consequential impairments or write-downs could have a material adverse effect on our operations, financial condition and
prospects.
Failure to successfully implement and continue to improve our credit risk management systems could materially and adversely affect our
business
As a commercial banking group, one of the main types of risks inherent in our business is credit risk. For example, an important feature of our credit risk
management system is to employ our own credit rating system to assess the particular risk profile of a customer. This system is primarily generated
internally, but, in the case of counterparties with a global presence, also builds off the credit assessment assigned by other Banco Santander group
members. As this process involves detailed analyses of the customer or credit risk, taking into account both quantitative and qualitative factors, it is
subject to human and IT systems errors. In exercising their judgement on current or future credit risk behaviour of our customers, our employees may not
always be able to assign a correct credit rating, which may result in a larger exposure to higher credit risks than indicated by our risk rating system.
In addition, we continuously refine our credit policies and guidelines to address potential risks associated with particular industries or types of customers.
However, we may not be able to detect all possible risks before they occur, or our employees may not be able to effectively implement our credit policies
and guidelines due to limited tools available to us, which may increase our credit risk.
Any failure to effectively implement, consistently monitor and refine our credit risk management systems may result in an increase in the level of
non-performing loans and higher losses than expected, which could have a material adverse effect on our operations, financial condition and prospects.
We are subject to various risks associated with our derivative transactions that could have a material adverse effect on our operations,
financial condition and prospects
We enter into derivative transactions for trading purposes as well as for hedging purposes. We are subject to various risks associated with these
transactions, including market risk, operational risk, basis risk (the risk of loss associated with variations in the spread between the asset yield and the
funding and/or hedge cost) and credit or counterparty risk (the risk of insolvency or other inability of the counterparty to a particular transaction to perform
its obligations thereunder, including providing sufficient collateral).
Market practices and documentation for derivative transactions in the UK may differ from those in other countries. In addition, the execution and
performance of these transactions depend on our ability to develop adequate control and administration systems and to hire and retain qualified
personnel. Moreover, our ability to adequately monitor, analyse and report derivative transactions continues to depend, largely, on our information
technology systems. These factors further increase the risks associated with these transactions and could have a material adverse effect on our
operations, financial condition and prospects.
236 Santander UK plc
ˆ200G2Mlv!2YhxNCg_Š200G2Mlv!2YhxNCg_
628340 TX 237SANTANDERFORM 20-F (SAN UK PL
04-Mar-2019 00:00 ESTHTMLON
Donnelley Financial EGV marik1dc 4*ESS 0C
VDI-W7-PFL-060212.9.12.0
bar6
Page 1 of 1
> Risk factors
Santander UK plc 237
Operational risks, including risks relating to data and information collection, processing, storage and security, are inherent in
our business
Like other financial institutions with a large customer base, we manage and hold confidential personal information of customers in the
conduct of our banking operations, as well as the personal information of other individuals, such as staff, and a large number of assets.
Accordingly, our business depends on the ability to process a large number of transactions efficiently and accurately, and on our people,
digital technologies, computer and email services, software and networks. We also rely on the secure processing, storage and
transmission of confidential, sensitive personal data and other information using our computer systems and networks, and through the
adoption of cloud computing services. The proper functioning of financial control, accounting or other data collection and processing
systems is critical to our businesses and to our ability to compete effectively. Losses can result from inadequate personnel, human error,
inadequate or failed internal control processes and systems or from external events that interrupt normal business operations. We also
face the risk that our controls and procedures prove to be designed inadequately or are circumvented such that our data and/or client
records are incomplete, not recoverable or not securely stored. Although we work with our clients, vendors, service providers,
counterparties and other third parties to develop secure data and information processing, storage and transmission capabilities to prevent
against information security risk, we routinely exchange personal, confidential and proprietary information by electronic means, and we
may be the target of attempted hacking. Adoption of cloud based computing services in order to improve technological resilience and cost-
effectiveness could bring with it risks to the information we process if we do not take care to implement appropriate controls such as strong
authentication and encryption. If we cannot maintain an effective and secure electronic data and information, management and processing
system or if we fail to maintain complete physical and electronic records, this could result in regulatory sanctions, including under the
General Data Protection Regulation, which came into force on 25 May 2018. Any such failures or sanctions could result in serious
reputational or financial harm to us, as well as to those whose data we hold, and could have a material adverse effect on our operations,
financial condition and prospects.
Infrastructure and technology resilience
We take protective measures and continuously monitor and develop our systems to safeguard our technology infrastructure, data and
information from misappropriation or corruption, but our systems, software and networks nevertheless may be vulnerable to unauthorised
access, misuse, computer viruses or other malicious code and other events that could have a security impact. An interception, misuse or
mishandling of personal, confidential or proprietary information sent to or received from a client, vendor, service provider, counterparty or
third party could result in legal liability, regulatory action and reputational harm, and therefore have a material adverse effect on our
operations, financial condition and prospects. Furthermore, we may be required to expend significant additional resources to modify our
protective measures or to investigate and remediate vulnerabilities or other exposures. We expect our programmes of change to have an
effect on our risk profile, both technological and regulatory. Whether it is the opportunities from adoption of cloud technology, systems to
support important regulatory initiatives, or the desire to identify, prioritise and remove obsolete systems from operations, the operational
risk associated with systems change is likely to increase and this will therefore remain an area of key focus in our risk management. There
can be no assurance that we will not suffer material losses from such operational risks in the future, including those relating to any security
breaches, which could have a material adverse effect on our operations, financial condition and prospects.
Cyber security
In particular, we have seen in recent years the computer systems of companies and organisations targeted, not only by cyber criminals,
but also by activists and rogue nation states. In common with other financial institutions, we manage and hold confidential personal
information of customers in the conduct of our banking operations, as well as a large number of assets. Accordingly we have been and
continue to be subject to a range of cyber-attacks, such as malware, phishing and denial of service.
Cyber-attacks could give rise to the loss of significant amounts of customer data and other sensitive information, as well as significant
levels of liquid assets (including cash). In addition, cyber-attacks could give rise to the disablement of our electronic systems used to
service our customers. As attempted attacks continue to evolve in scope and sophistication, we may incur significant costs in order to
modify or enhance our protective measures against such attacks, or to investigate or remediate any vulnerability or resulting breach, or in
communicating cyber-attacks to our customers. If we fail to effectively manage our cyber security risk, the impact could be significant and
may include harm to our reputation and have an adverse effect on our operations, financial condition and prospects through the payment
of customer compensation, regulatory penalties and fines and/or through the loss of assets. Factors such as failing to apply critical security
patches from our technology providers, to manage out obsolete technology or to update our processes in response to new threats could
give rise to these impacts.
In addition, we may also be impacted by cyber-attacks against national critical infrastructures in the UK, for example, the
telecommunications network. In common with other financial institutions we are dependent on such networks and any cyber-attack against
these networks could negatively affect our ability to service our customers. As we do not operate these networks, we have limited ability to
protect our business from the adverse effects of cyber-attack against them.
Further, the domestic and global financial services industry, including key financial market infrastructure, may be the target of cyber
disruption and attack by cyber criminals, activists and rogue states looking to cause economic instability. We have limited ability to protect
our business from the adverse effects of cyber disruption or attack against our counterparties and key financial market infrastructure. If
such a disruption or attack were to occur it could cause serious operational and financial harm to us.
Procedure and policy compliance
We also manage and hold confidential personal information of customers in the conduct of our banking operations. Although we have
procedures and controls to safeguard personal information in our possession, unauthorised disclosures could subject us to legal actions
and administrative sanctions as well as damages and reputational harm that could materially and adversely affect our operations, financial
condition and prospects. Further, our business is exposed to risk from potential non-compliance with policies, employee misconduct or
negligence and fraud, which could result in regulatory sanctions and cause serious reputational or financial harm. In recent years, a
number of multinational financial institutions have suffered material losses due to the actions of ‘rogue traders’ or other employees. It is not
always possible to deter or prevent employee misconduct, and the precautions we take to detect and prevent this activity may not always
be effective. We may be required to report events related to information security issues (including any cyber security issues), events where
customer information may be compromised, unauthorised access and other security breaches, to the relevant regulatory authorities. Any
material disruption or slowdown of our systems could cause information, including data related to customer requests, to be lost or to be
delivered to our clients with delays or errors, which could reduce demand for our services and products and could have a material adverse
effect on our operations, financial condition and prospects.
ˆ200G2Mlv!2SGPa%g>Š200G2Mlv!2SGPa%g>
628340 TX 238SANTANDERFORM 20-F (SAN UK PL
03-Mar-2019 06:43 ESTHTMLON
Donnelley Financial EGV bashs0dc 2*ESS 0C
VDI-W7-PFL-112012.9.12.0
Page 1 of 1
Annual Report 2018 | Other information for US investors
We may fail to detect or prevent money laundering and other financial crime activities due to not correctly identifying our financial crime risks,
failing to implement effective systems and controls to mitigate those risks or failing to recruit and retain resource with the necessary skills and
experience. This could expose us to significant fines, additional regulatory scrutiny, restrictions on the conduct of our business and
operations, increased liability, civil claims, criminal actions and reputational risk
We are obligated to comply with applicable anti-money laundering (AML), anti-terrorism, anti-bribery and corruption, sanctions, anti-tax evasion and other
laws and regulations in the jurisdictions in which we operate. These laws and regulations require us, among other things, to conduct customer due
diligence (including in respect of sanctions and politically-exposed person screening), ensure account and transaction information is kept up to date and
implement effective financial crime policies and procedures detailing what is required from those responsible in order to counter financial crime risks. We
are also required to conduct financial crime training for our staff and to report suspicious transactions and activity to appropriate law enforcement.
Over the last decade, financial crime risk has become the subject of enhanced regulatory scrutiny and supervision by regulators globally. AML/CTF, anti-
bribery and corruption and sanctions laws and regulations are increasingly complex and detailed and have become the subject of enhanced regulatory
supervision, requiring improved systems, sophisticated monitoring and skilled compliance personnel. Political and policy maker focus on the topic in the
UK, EU and within international bodies has intensified over the past year. For more information, see the risk factor entitled ‘We are subject to substantial
regulation and governmental oversight which could adversely affect our operations, financial condition and prospects’.
We have developed policies and procedures designed to detect and prevent the use of our banking network for money laundering and financial crime
related activities, which are reviewed to ensure that all current requirements are fully reflected. The approach is also informed by intelligence assessment
and risk assessment, including the recent UK Government National Risk Assessment of Money Laundering and Terrorist Financing.
The policies and procedures require the implementation and embedding within the business of effective controls and monitoring, which requires ongoing
changes to systems, technology and operational activities. Comprehensive and risk based financial crime training at a bank wide and business unit level is
a key element of this, with the FCA providing guidance on expectations within its Financial Crime Guide. Financial crime is continually evolving, and the
expectation of regulators is increasing (for more information, see the risk factor entitled ‘We are subject to substantial regulation and governmental
oversight which could adversely affect our operations, financial condition and prospects’). This requires proactive and adaptable responses from us so that
we are able to deter threats and criminality effectively. Even known threats can never be fully eliminated, and there will be instances where we may be
used by other parties to engage in money laundering and other illegal or improper activities. In addition, we rely heavily on our staff to assist us by
identifying such activities and reporting them, and our staff have varying degrees of experience in recognising criminal tactics and understanding the level
of sophistication of criminal organisations. Where we outsource any of our customer due diligence, customer screening or anti financial crime operations,
we remain responsible and accountable for full compliance and any breaches. If we are unable to apply the necessary scrutiny and oversight there
remains a risk of regulatory breach and this could have a material adverse effect on our operations, financial condition and prospects.
If we are unable to fully comply with applicable laws, regulations and expectations, our regulators and relevant law enforcement agencies have the ability
and authority to pursue civil and criminal proceedings against us, to impose significant fines and other penalties on us, including requiring a complete
review of our business systems, day-to-day supervision by external consultants, imposing restrictions on the conduct of our business and operations and
ultimately the revocation of our banking licence, which could have a material adverse effect on our operations, financial condition and prospects. The
reputational damage to our business and brand could be severe if we were found to have materially breached AML, anti-bribery and corruption or
sanctions requirements. Our reputation could also suffer if we are unable to protect our customers or our business from being used by criminals for illegal
or improper purposes.
In addition, while we review our relevant counterparties’ internal policies and procedures (for example, under our correspondent banking relationships)
with respect to such matters, we, to a large degree, rely upon our relevant counterparties to maintain and properly apply their own appropriate anti-
financial-crime procedures. Such measures, procedures and compliance may not be completely effective in preventing third parties from using our (and
our relevant counterparties’) services as a conduit for money laundering (including illegal cash operations) without our (or our relevant counterparties’)
knowledge. There are also risks that other third parties, such as suppliers, could be involved in financial crime. If we are associated with, or even accused
of being associated with, financial crime (or a business involved in financial crime), then our reputation could suffer and/or we could become subject to civil
or criminal proceedings that could result in penalties, sanctions and/or legal enforcement (including being added to ‘black lists’ that would prohibit certain
parties from engaging in transactions with us), any one of which could have a material adverse effect on our operations, financial condition and prospects.
As described in the risk factor entitled ‘We are subject to substantial regulation and governmental oversight which could adversely affect our operations,
financial condition and prospects’, there were a number of changes and updates to UK law in 2018 for financial crime. The divergence between the UK/EU
and the US in regard to sanctions policy adds to the complexity in this area and poses potential risks. Constant monitoring of external laws and regulations
is therefore a key area of focus to ensure internal policies, procedures and training are up to date with emerging requirements.
At an operational level, geo-political, economic and social changes can provide opportunities to financial criminals and alter the risks posed to banks.
Effective intelligence and monitoring systems within strengthened public/private partnerships to share knowledge on emerging risks are required to help
mitigate these risks. However, there can be no guarantee that any intelligence shared by public authorities or other financial institutions will be accurate or
effective in helping us to combat financial crime, and if, as a result, we fail to combat financial crime effectively then this could have a material adverse
effect on our operations, financial condition and prospects.
238 Santander UK plc
ˆ200G2Mlv!2Z&Nho6&Š200G2Mlv!2Z&Nho6&
628340 TX 239SANTANDERFORM 20-F (SAN UK PL
04-Mar-2019 01:37 ESTHTMLON
Donnelley Financial EGV marik1dc 6*ESS 0C
VDI-W7-PFL-060212.9.12.0
bar6
Page 1 of 1
> Risk factors
Santander UK plc 239
Any failure to effectively improve or upgrade our information technology infrastructure and management information systems in
a timely manner could have a material adverse effect on our operations, financial condition and prospects
Our businesses and our ability to remain competitive depends to a significant extent upon the functionality of our information technology
systems (including Partenon, the global banking information technology platform utilised by the Santander UK group and Banco Santander
SA), and on our ability to upgrade and expand the capacity of our information technology on a timely and cost-effective basis. The proper
functioning of our financial control, risk management, credit analysis and reporting, accounting, customer service, financial crime, conduct
and compliance and other information technology systems, as well as the communication networks between branches and main data
processing centres, are critical to our businesses and our ability to compete. Investments and improvements in our information technology
infrastructure are regularly required in order to remain competitive. We cannot be certain that in the future we will be able to maintain the
level of capital expenditure necessary to support the improvement, expansion or upgrading of our information technology infrastructure as
effectively as our competitors; this may result in a loss of any competitive advantages that our information technology systems provide.
Any failure to effectively improve, expand or upgrade our information technology infrastructure and management information systems in a
timely manner could have a material adverse effect on our operations, financial condition and prospects.
We may be exposed to unidentified or unanticipated risks despite our risk management policies, procedures and methods and to
risk related to errors in our modelling
The management of risk is an integral part of our activities. We seek to monitor and manage our risk exposure through a variety of risk
reporting systems. For a further description of our risk management framework see the ‘Risk review’ on pages 52 to 126. While we employ
a broad and diversified set of risk monitoring and risk mitigation techniques, such techniques and strategies may not be fully effective in
mitigating our risk exposure in all economic market environments or against all types of risk, including risks that we fail to identify or
anticipate.
Some of our tools and metrics for managing risk are based upon our use of observed historical market behaviour. We apply statistical and
other tools to these observations to arrive at quantifications of our risk exposures. These tools and metrics may fail to predict future risk
exposures. These risk exposures could, for example, arise from factors we did not anticipate or correctly evaluate in our statistical models.
This would limit our ability to manage our risks. Our losses thus could be significantly greater than the historical measures indicate. In
addition, our quantified modelling does not take all risks into account. Our more qualitative approach to managing those risks could prove
insufficient, exposing us to material, unanticipated losses. We could face adverse consequences as a result of decisions, which may lead
to actions by management, based on models that include errors or are otherwise poorly developed, implemented or used, or as a result of
the modelled outcome being misunderstood. If existing or potential customers or counterparties believe our risk management is
inadequate, they could take their business elsewhere or seek to limit their transactions with us. This could have a material adverse effect
on our operations, financial condition and prospects.
Competition with other financial institutions could adversely affect us
The markets for UK financial services are very competitive and we have seen strong competition from incumbent banks and large building
societies. In addition, we face competition from a number of new entrants, non-banks and other providers. Management expects such
competition to continue or intensify as a result of customer behaviour and trends, technological changes, competitor behaviour, new
entrants (including non-traditional financial services providers such as large retail or technology companies or financial technology
companies), new lending models and changes in regulation (including the recent introduction of Open Banking and changes arising from
PSD2).
We consider our competitive position in our management actions as appropriate, such as pricing and product decisions. Increasing
competition could mean that we increase our rates offered on deposits or lower the rates we charge on loans, which could also have a
material adverse effect on our profitability, operations, financial condition and prospects. It may also negatively affect our operations,
financial condition and prospects by, among other things, limiting our ability to increase our customer base and expand our operations and
increasing competition for investment opportunities.
Our ability to maintain our competitive position depends, in part, on the success of new products and services we offer our
customers and our ability to continue offering products and services from third parties, and we may not be able to manage
various risks we face as we expand our range of products and services that could have a material adverse effect on our
operations, financial condition and prospects
The success of our operations and our profitability depends, in part, on the success of new products and services we offer our customers.
However, we cannot guarantee that our new products and services will be responsive to customer demands or that they will be successful
once they are offered to our customers. In addition, our customers’ needs or desires may change over time, and such changes may render
our products and services obsolete, outdated or unattractive, and we may not be able to develop new products that meet our customers’
changing needs.
Our success is also dependent on our ability to anticipate and leverage new and existing technologies that may have an impact on
products and services in the banking industry. Technological changes may further intensify and complicate the competitive landscape and
influence customer choices.
If we cannot respond in a timely fashion to the changing needs of our customers, we may lose customers, which could in turn materially
and adversely impact our operations, financial condition and prospects.
Further, our customers may raise complaints and seek redress if they consider that they have suffered loss from our products and
services; for example, as a result of any alleged misselling or incorrect application of the terms and conditions of a particular product. This
could in turn subject us to risks of potential legal action by our customers, or to intervention by our regulators.
As we expand the range of our products and services, some of which may be at an early stage of development in the UK market, we will
be exposed to known, new and potentially increasingly complex risks, including conduct risk, and development expenses. Our employees
and risk management systems, as well as our experience and that of our partners, may not be sufficient or adequate to enable us to
properly handle or manage such risks. In addition, the cost of developing products that are not launched is likely to affect our operating
results.
Any or all of the above factors, individually or collectively, could have a material adverse effect on our operations, financial condition and
prospects.

ˆ200G2Mlv!2SH%Vw6tŠ200G2Mlv!2SH%Vw6t
628340 TX 240SANTANDERFORM 20-F (SAN UK PL
03-Mar-2019 06:50 ESTHTMLON
Donnelley Financial EGV bashs0dc 2*ESS 0C
VDI-W7-PFL-112012.9.12.0
Page 1 of 1
Annual Report 2018 | Other information for US investors
If the level of non-performing loans increases or the credit quality of our loans deteriorates in the future, or if our loan loss reserves are
insufficient to cover loan losses, this could have a material adverse effect on our operations, financial condition and prospects
Risks arising from changes in credit quality and the recoverability of loans and amounts due from counterparties are inherent in a wide range of our
businesses. Non-performing or low credit quality loans have in the past, and could continue to, negatively impact our operations, financial condition and
prospects.
In particular, the amount of our reported non-performing loans may increase in the future as a result of growth in our total loan portfolio, including as a
result of loan portfolios that we may acquire in the future (the credit quality of which may turn out to be worse than we had anticipated), or factors beyond
our control, such as adverse changes in the credit quality of our borrowers and counterparties, a general deterioration in the UK or global economic
conditions, the impact of political events, events affecting certain industries or events affecting financial markets and global economies.
We cannot be sure that we will be able to effectively control the level of impaired loans in, or the credit quality of, our total loan portfolio, which could have
a material adverse effect on our operations, financial condition and prospects. Interest rates payable on a significant portion of our outstanding mortgage
loan products fluctuate over time due to, among other factors, changes in the BoE Base Rate. As a result, borrowers with variable interest rate mortgage
loans are exposed to increased monthly payments when the related mortgage interest rate adjusts upward. Similarly, borrowers of mortgage loans with
fixed or introductory rates adjusting to variable rates after an initial period are exposed to the risk of increased monthly payments at the end of this period.
This risk may be slightly greater following the BoE Base Rate increases in 2017 and 2018. Over the last few years both variable and fixed interest rates
have been at historically low levels, which has benefited borrowers of new loans and those repaying existing variable rate loans regardless of special or
introductory rates. Future increases in borrowers’ required monthly payments may result in higher delinquency rates and losses related to non-performing
loans in the future. Borrowers seeking to avoid these increased monthly payments by refinancing their mortgage loans may no longer be able to find
available replacement loans at comparably low interest rates. These events, alone or in combination, may contribute to higher delinquency rates and
losses for the Santander UK group, which could have a material adverse effect on our operations, financial condition and prospects.
Our current loan loss reserves may not be adequate to cover an increase in the amount of non-performing loans or any future deterioration in the overall
credit quality of our total loan portfolio. Our loan loss reserves are based on our current assessment of various factors affecting the quality of our loan
portfolio, including our borrowers’ financial condition, repayment abilities, the realisable value of any collateral, the prospects for support from any
guarantor, government macroeconomic policies, interest rates and the legal and regulatory environment. As the global financial crisis demonstrated, many
of these factors are beyond our control. As a result, there is no precise method for predicting loan and credit losses, and we cannot provide any assurance
that our current or future loan loss reserves will be sufficient to cover actual losses.
If our assessment of and expectations concerning the above mentioned factors differ from actual developments we may need to increase our loan loss
reserves, which may adversely affect our operations, financial condition and prospects. Additionally, in calculating our loan loss reserves, we employ
qualitative tools and statistical models which may not be reliable in all circumstances and which are dependent upon data that may not be complete. If we
are unable to control or reduce the level of our non-performing or poor credit quality loans, this could have a material adverse effect on our operations,
financial condition and prospects.
Our loan portfolio is subject to risk of prepayment, which could have a material adverse effect on our operations, financial condition and
prospects
Our loan portfolio is subject to prepayment risk resulting from the ability of a borrower or issuer to pay a debt obligation prior to maturity. Generally, in a
low interest rate environment, prepayment activity increases, which reduces the weighted average lives of our earning assets and could have a material
adverse effect on our operations, financial condition and prospects. As a result we could be required to amortise net premiums into income over a shorter
period of time, thereby reducing the corresponding asset yield and net interest income and there is a risk that we are not able to accurately forecast
amortisation schedules for these purposes which may affect our profitability. Prepayment risk also has a significant adverse impact on credit card and
collateralised mortgage loans, since prepayments could shorten the weighted average life of these assets, which may result in a mismatch in our funding
obligations and reinvestment at lower yields. The risk of prepayment and our ability to accurately forecast amortisation schedules is inherent to our
commercial activity and an increase in prepayments or a failure to accurately forecast amortisation schedules could have a material adverse effect on our
operations, financial condition and prospects.
The value of the collateral, including real estate, securing our loans may not be sufficient, and we may be unable to realise the full value of the
collateral securing our loan portfolio
The value of the collateral securing our loan portfolio may significantly fluctuate or decline due to factors beyond our control, including macroeconomic
factors affecting the UK’s economy. Our residential mortgage loan portfolio is one of our principal assets, comprising 79% of our loan portfolio at
31 December 2018. As a result, we are highly exposed to developments in the residential property market in the UK.
House price growth has slowed since the UK EU Referendum, most noticeably in London, although UK house prices have generally continued to be
supported by certain economic fundamentals including low mortgage rates (notwithstanding the recent BoE Base Rate increase to 0.75%) and low
unemployment rates. Nevertheless, any increase in house prices may be limited given low levels of consumer confidence and low levels of real earnings
growth. The depth of the previous house price declines as well as the continuing uncertainty as to the extent and sustainability of the UK economic
recovery will mean that losses could be incurred on loans should they go into possession.
The value of the collateral securing our loan portfolio may also be adversely affected by force majeure events such as natural disasters like floods or
landslides. Any force majeure event may cause widespread damage and could have an adverse impact on the economy of the affected region and may
therefore impair the asset quality of our loan portfolio in that area.
We may also not have sufficiently up-to-date information on the value of collateral, which may result in an inaccurate assessment for impairment losses of
our loans secured by such collateral.
If any of the above were to occur, we may need to make additional provisions to cover actual impairment losses of our loans, which may materially and
adversely affect our operations, financial condition and prospects.
240 Santander UK plc
ˆ200G2Mlv!2SmBS#gnŠ200G2Mlv!2SmBS#gn
628340 TX 241SANTANDERFORM 20-F (SAN UK PL
03-Mar-2019 08:01 ESTHTMLON
Donnelley Financial EGV dommj0dc 4*ESS 0C
VDI-W7-PFD-037612.9.12.0
bar6
Page 1 of 1
> Risk factors
Santander UK plc 241
If we are unable to manage the growth of our operations, this could have a material adverse impact on our profitability
We allocate management and planning resources to develop strategic plans for organic growth, and to identify possible acquisitions and
disposals and areas for restructuring our businesses when necessary. From time to time, we evaluate acquisition, disposal, and
partnership opportunities that we believe could offer additional value to our shareholders and are consistent with our business strategy.
However, we may not be able to identify suitable acquisition or partnership candidates, and we may not be able to acquire promising
targets or form partnerships on favourable terms, or at all. Furthermore, preparations for acquisitions that we do not complete can be
disruptive. We base our assessment of potential acquisitions and partnerships on limited and potentially inexact information and on
assumptions with respect to value, operations, profitability and other matters that may prove to be incorrect. Our ability to benefit from any
such acquisitions and partnerships will depend in part on our successful integration of those businesses. Such integration entails
significant risks such as challenges in retaining the customers and employees of the acquired businesses, unforeseen difficulties in
integrating operations and systems and unexpected liabilities or contingencies relating to the acquired businesses, including legal claims
and regulatory investigations. We can give no assurances that our expectations with regards to integration and synergies will materialise.
We cannot provide assurance that we will, in all cases, be able to manage our growth effectively or deliver our strategic growth decisions
including our ability to:
– Manage efficiently our operations and employees of expanding businesses
– Maintain or grow our existing customer base
– Formulate and execute our strategy
– Fully due diligence and assess the value, strengths and weaknesses of investment or acquisition candidates
– Finance strategic opportunities, investments or acquisitions
– Fully integrate strategic investments, or newly-established entities or acquisitions, in line with our strategy
– Align our current information technology systems adequately with those of an enlarged group
– Apply our risk management policy effectively to an enlarged group
– Manage a growing number of entities without over-committing management or losing key personnel.
Any failure to manage growth effectively, including any or all of the above challenges associated with our growth plans, could have a
material adverse effect on our operations, financial condition and prospects. In addition, any acquisition, disposal or partnership could
result in the loss of key employees and inconsistencies in standards, controls, procedures and policies. Moreover, the success of the
acquisition or venture will at least in part be subject to a number of political, economic and other factors that are beyond our control. Any or
all of these factors, individually or collectively, could have a material adverse effect on our operations, financial condition and prospects.
Goodwill impairments may be required in relation to businesses acquired from third parties
We have made business acquisitions from third parties in past years and may make further acquisitions in the future. It is possible that the
goodwill which has been attributed, or may be attributed, to these businesses may have to be written-down if our valuation assumptions
are required to be reassessed as a result of any deterioration in their underlying profitability, asset quality and other relevant matters.
Impairment testing in respect of goodwill is performed annually, and more frequently if there are impairment indicators present, and
comprises a comparison of the carrying amount of the cash-generating unit with its recoverable amount. Goodwill impairment does not
however affect our regulatory capital. Whilst no impairment of goodwill was recognised in the current period and prior periods presented,
there can be no assurances that we will not have to write down the value attributed to goodwill in the future, which could adversely affect
our results and net assets.
We are responsible for contributing to compensation schemes in the UK in respect of banks and other authorised financial
services firms that are unable to meet their obligations to customers
The UK’s Financial Services Compensation Scheme (FSCS) is the UK’s compensation fund of last resort for customers of authorised
financial services firms. It may pay compensation if a firm is unable, or likely to be unable, to pay claims against it. This is usually because
it has stopped trading or has been declared in default. The FSCS is funded by levies on firms authorised by the PRA or the FCA (i.e.
participant firms), including members of the Santander UK group.
Following the default of a number of authorised financial services firms since 2008, the FSCS borrowed funds totalling approximately
£18bn from HM Treasury to meet the compensation costs for customers of those firms. The substantial majority of the principal should be
repaid from funds the FSCS levies from asset sales, surplus cash flow or other recoveries in relation to assets of the firms that defaulted.
However, the FSCS estimates that the assets of these failed institutions are insufficient, and, to the extent that there remains a shortfall,
the FSCS is recovering this shortfall by levying firms authorised by the PRA or the FCA in instalments. The first instalment was in scheme
year 2013/14, and we made a capital contribution in each of 2013, 2014, 2015 and 2016. In the year ending 31 December 2017, our
contribution was £23m. For the year ended 31 December 2018, we made a contribution of £5m to the interest cost of the levy, and, on our
income statement, released £4m of provisions to reflect the reduced amount now expected to be charged for the remaining interest.
However, in the event that the FSCS raises further funds from participant firms or increases the levies to be paid by such firms or the
frequency at which the levies are to be paid, the associated cost to us could have a material adverse effect on our operations, financial
condition and prospects. Since 2008, measures taken to protect the depositors of deposit-taking institutions involving the FSCS, such as
the borrowing from HM Treasury mentioned above, have resulted in a significant increase in the levies made by the FSCS on the industry
and such levies may continue to go up if similar measures are required to protect depositors of other institutions. In addition, following
amendments to the preferred credit status of depositors that came into force on 31 December 2014, the FSCS stands in the place of
depositors of a failing institution but has preferred status over an institution’s other creditors.
FSCS levies are collected by the FCA as part of a single payment by firms covering the FCA, the PRA, the FOS and the FSCS fees. It is
possible that future policy of the FSCS and future levies on the firms authorised by the FCA or PRA may differ from those at present and
that this could lead to a period of some uncertainty for members of the Santander UK group. The levies may also increase. In addition, it is
possible that other jurisdictions where we operate could introduce or amend their similar compensation, contributory or reimbursement
schemes. As a result of any such developments, we may incur additional costs and liabilities which may adversely affect our operations,
financial condition and prospects.
ˆ200G2Mlv!2SmNMngGŠ200G2Mlv!2SmNMngG
628340 TX 242SANTANDERFORM 20-F (SAN UK PL
03-Mar-2019 08:01 ESTHTMLON
Donnelley Financial EGV dommj0dc 3*ESS 0C
VDI-W7-PFD-037612.9.12.0
Page 1 of 1
Annual Report 2018 | Other information for US investors
Changes in taxes and other assessments may adversely affect us
The tax and other assessment regimes to which our customers and we are subject are regularly reformed, or subject to proposed reforms. Such reforms
include changes in the rate of assessments and, occasionally, enactment of temporary taxes, the proceeds of which may be earmarked for designated
governmental purposes. Some of these changes may be specific to the banking/financial services sectors and therefore result in us incurring an additional
tax burden when compared to other industry sectors. The effects of these changes and any other changes that result from enactment of additional tax
reforms have not been, and cannot be, quantified and there can be no assurance that these reforms will not, once implemented, have an adverse effect
upon our business. Furthermore, such changes may produce uncertainty in the financial system, increasing the cost of borrowing and contributing to the
increase in our non-performing credit portfolio.
The following paragraphs discuss five major reforms (the Bank Levy, Restriction of Tax Deductions for Compensation Payments, Corporation Tax
Surcharge and two possible future changes in the taxation of banking groups in the EU) which could have a material adverse effect on our operations,
financial condition and prospects, and the competitive position of UK banking groups, including us.
Bank Levy
HM Treasury introduced an annual UK bank levy (the Bank Levy) via legislation in the Finance Act 2011. The Bank Levy is imposed on (among other
entities) UK banking groups and subsidiaries, and therefore applies to us. The amount of the Bank Levy is based on a bank’s total liabilities, excluding
(among other things) Tier 1 capital, insured retail deposits and repos secured on sovereign debt. With effect from 1 April 2015, the Finance Act 2015
increased the rate (for short-term liabilities) to 0.21% (a reduced rate is applied to long-term equity and liabilities). Subsequently the Finance (No.2) Act
2015 (Finance No.2 Act), which was enacted on 18 November 2015, reduced the Bank Levy rate from 0.21% to 0.18% from 1 January 2016 with
subsequent annual reductions to 0.1% from 1 January 2021.
Restriction of Tax Deductions for Compensation Payments
The Finance (No.2) Act implemented measures so that certain compensation expenditure incurred by banking companies (including ANTS and the
Company) on or after 7 July 2015 is: (i) no longer deductible for corporation tax purposes; and (ii) subject to a deemed taxable receipt equivalent to 10%
of such compensation expenditure.
Corporation Tax Surcharge
With effect from 1 January 2016, banks (as defined in the Corporation Tax Act 2010 and including the Company, ANTS and Cater Allen Limited) are
subject to a surcharge at a rate of 8% on their taxable profits for corporation tax purposes (with certain reliefs added back and subject to annual
allowance).
European Taxation
On 14 February 2013, the Commission published a proposal (the Commission Proposal) for a directive for a common system of financial transactions tax
(FTT) in Belgium, Germany, Estonia, Greece, Spain, France, Italy, Austria, Portugal, Slovenia and Slovakia (the Participating Member States). However,
Estonia has since stated that it will not participate.
The FTT may give rise to tax liabilities for Santander UK plc or Santander UK Group Holdings plc with respect to certain transactions (including concluding
swap transactions and/or purchases or sales of securities (such as authorised investments)) if it is adopted based on the Commission’s Proposal.
Under the Commission’s proposal, the FTT could apply in certain circumstances to persons both within and outside of the Participating Member States.
Whilst the UK is not a Participating Member State, the Commission’s proposal is broad and as such may impact transactions completed by financial
institutions operating in non-Participating Member States.
Media reports have increasingly focused on how revenues raised by the EU FTT could constitute an independent revenue stream for the Participating
Member States, potentially offsetting their contributions to the EU and/or providing a new income stream for the EU. This is seen as important in the
context of the UK’s financial contributions ceasing in connection with its exit from the EU. Recent reports suggest the European Commission is intending
to publish a revised legislative proposal with only share transactions being subject to the EU FTT. As such, the EU FTT appears likely to remain on the
ECOFIN agenda for the foreseeable future.
Separately, the European Commission wrote to the Netherlands on 22 June 2018 to inform them that it is their view that the Netherlands domestic tax
legislation, which gives tax deductions for coupons paid on conditionally convertible bonds issued by financial institutions, may be non-compliant with the
EU’s State Aid regime as the Netherlands legislation only applies to financial institutions and thus gives preference to one sector over others.
Santander UK benefits from tax deductions on certain of its capital instruments under UK domestic law. The relevant UK law also restricts tax deductibility
to instruments issued specifically by the regulated sector and thus could be subject to a similar EU challenge. This potential EU State Aid vulnerability has
now been largely addressed by the Budget day announcement on the 29 October 2018 and accompanying draft legislation that will repeal the sector
specific legislation and replace with new tax rules for hybrid capital instrument that can be issued by any sector. This new legislation should ensure that,
subject to these instruments meeting certain specified conditions, any interest payable will be deductible. This should reduce this risk although there can
be no guarantee that the EU will not successfully challenge the relevant UK law. Any removal of this tax deductibility might have a material adverse effect
on our operations, financial condition and prospects.
Changes in our pension liabilities and obligations could have a materially adverse effect on our operations, financial condition and prospects
The majority of current employees are provided with pension benefits through defined contribution arrangements. Under these arrangements our legal
obligation is limited to the cash contributions paid. We provide retirement benefits for many of our former and current employees in the UK through a
number of defined benefit pension schemes established under trust. We are the principal employer under the majority of these schemes, but we have only
limited control over the rate at which we pay into such schemes. Under the UK statutory funding requirements employers are usually required to contribute
to the schemes at the rate they agree with the scheme trustees although, if they cannot agree, the rate can be set by the Pensions Regulator. The scheme
trustees may, in the course of discussions about future valuations, seek higher employer contributions. The scheme trustees’ power in relation to the
payment of pension contributions depends on the terms of the trust deed and rules governing the pension schemes, but, in some cases, the scheme
trustees may have the unilateral right to set our relevant contribution.
The Pensions Regulator has the power to issue a financial support direction to companies within a group in respect of the liability of employers
participating in the UK defined benefit pension schemes where that employer is a service company, or is otherwise ‘insufficiently resourced’ (as defined for
the purposes of the relevant legislation). As some of the employers within the Santander UK group are service companies, if the Pensions Regulator
determines that they have become insufficiently resourced and no suitable mitigating action is undertaken, other companies within the Santander UK
group which are connected with or an associate of those employers are at risk of a financial support direction in respect of those employers’ liabilities to
the defined benefit pension schemes in circumstances where the Pensions Regulator properly considers it reasonable to issue one. Such a financial
support direction could require the companies to guarantee or provide security for the pension liabilities of those employers, or could require additional
amounts to be paid into the relevant pension schemes in respect of them.
242 Santander UK plc

ˆ200G2Mlv!2SmYw46KŠ200G2Mlv!2SmYw46K
628340 TX 243SANTANDERFORM 20-F (SAN UK PL
03-Mar-2019 08:01 ESTHTMLON
Donnelley Financial EGV dommj0dc 4*ESS 0C
VDI-W7-PFD-037612.9.12.0
bar6
Page 1 of 1
> Risk factors
Santander UK plc 243
The Pensions Regulator can also issue contribution notices if it is of the opinion that an employer has taken actions, or failed to take
actions, deliberately designed to avoid meeting its pension promises or which are materially detrimental to the scheme’s ability to meet its
pension promises. A contribution notice can be issued to any company or individual that is connected with or an associate of such
employer in circumstances where the Pensions Regulator considers it reasonable to issue and multiple notices could be issued to
connected companies or individuals for the full amount of the debt. The risk of a contribution notice being imposed may inhibit our freedom
to restructure or to undertake certain corporate activities.
Should the value of assets to liabilities in respect of the defined benefit schemes operated by us record a deficit or an increased deficit (as
appropriate), due to either a reduction in the value of the pension fund assets (depending on the performance of financial markets) and/or
an increase in the scheme liabilities due to changes in legislation, mortality assumptions, discount rate assumptions, inflation, market
variables such as exchange rates or equity prices, the expected rate of return on scheme assets, or other factors, or there is a change in
the actual or perceived strength of the employer’s covenant, this could result in us having to make increased contributions to reduce or
satisfy the deficits which would divert resources from use in other areas of our business and reduce our capital resources. While we can
control a number of the above factors, there are some over which we have no or limited control. Although the trustees of the defined
benefit pension schemes are obliged to consult with us before changing the pension schemes’ investment strategy, the trustees have the
final say and ultimate responsibility for investment strategy rests with them.
Our principal defined pension scheme is the Santander (UK) Group Pension Scheme and its corporate trustee is Santander (UK) Group
Pension Scheme Trustees Limited (the Pension Scheme Trustee), a wholly-owned subsidiary of Santander UK Group Holdings plc.
Investment decisions are delegated by the Pension Scheme Trustee to Santander (CF Trustee) Limited, a private limited company owned
by the Santander (CF Trustee) Limited directors. The Santander (CF Trustee) Limited directors’ principal duty, within the investment
powers delegated to them, is to act in the best interest of the members of the Santander (UK) Group Pension Scheme and not that of
Santander UK Group Holdings plc. Any increase in our pension liabilities and obligations could have a material adverse effect on our
operations, financial condition and prospects.
The ongoing changes in the UK supervision and regulatory regime and particularly the implementation of the ICB’s recommendations may
require us to make changes to our structure and business which could have an impact on our pension schemes or liabilities. (For a
discussion of the ICB’s recommendations see ‘We are subject to substantial regulation and governmental oversight which could adversely
affect our operations, financial condition and prospects’.)
We rely on recruiting, retaining and developing appropriate senior management and skilled personnel
Our continued success depends in part on the continued service of key members of our senior executive team and other key employees.
The ability to continue to attract, train, motivate and retain highly qualified and talented professionals is a key element of our strategy. The
successful implementation of our growth strategy and of a culture of Simple, Personal and Fair depends on the availability of skilled and
appropriate management, both at our head office and in each of our business units. There is also an increasing demand for Santander to
hire individuals with digital skills such as data scientist, engineering and designer skill sets in the future. Such individuals are very sought
after by all organisations, not just the banking industry, and thus our ability to attract and hire this talent will determine how quickly we
transform to a digital bank. If we or one of our business units or other functions fails to staff its operations appropriately, or loses one or
more of its key senior executives or other key employees and fails to replace them in a satisfactory and timely manner, our operations,
financial condition and prospects, including control and operational risks, may be adversely affected.
In addition, the financial services industry has and may continue to experience more stringent regulation of employee compensation, which
could have an adverse effect on our ability to hire or retain the most qualified employees. If we fail or are unable to attract and
appropriately train, motivate and retain qualified professionals, our operations, financial condition and prospects could be adversely
affected.
Damage to our reputation could cause harm to our business prospects
Maintaining a positive reputation is critical to attracting and retaining customers, investors and employees and conducting business
transactions with counterparties. Damage to the reputation of the Santander UK group or Banco Santander SA (as the majority
shareholder in the Company), the reputation of affiliates operating under the ‘Santander’ brand or any of our other brands could therefore
cause significant harm to our business and prospects. Harm to our reputation can arise directly or indirectly from numerous sources,
including, among others, employee misconduct (including the possibility of employee fraud), litigation, regulatory interventions
and enforcement action, failure to deliver minimum standards of service and quality, disruption to service due to a cyber-attack, wider IT
failures, compliance failures, third party fraud, financial crime, breach of legal or regulatory requirements, unethical behaviour (including
adopting inappropriate sales and trading practices), and the activities of customers, suppliers and counterparties. Further, negative
publicity regarding us, whether true or not, may result in harm to our operations, financial condition and prospects.
Actions by the financial services industry generally or by certain members of, or individuals in, the industry can also affect our reputation.
For example, the role played by financial services firms in the financial crisis has caused public perception of us and others in the financial
services industry to decline.
We could suffer significant reputational harm if we fail to identify and manage potential conflicts of interest properly. The failure, or
perceived failure, to adequately address conflicts of interest could affect the willingness of customers to deal with us, or give rise to
litigation or regulatory enforcement actions against us. Therefore, there can be no assurance that conflicts of interest will not arise in the
future that could cause material harm to our operations, financial condition and prospects.
Our financial statements are based in part on judgements and accounting estimates which, if inaccurate, could cause material
misstatement of our future financial results and financial condition
The preparation of the Consolidated Financial Statements requires management to make judgements and accounting estimates that affect
the reported amounts of assets and liabilities at the date of the financial statements and the reported amount of income and expenses
during the reporting period. Management evaluates its judgements and accounting estimates, which are based on historical experience
and on various other factors that are believed to be reasonable under the circumstances, on an ongoing basis. Actual amounts may differ
from these accounting estimates under different assumptions or conditions. Revisions to accounting estimates are recognised in the period
in which the estimate is revised and in any future periods affected.
As explained in Note 1 to the Consolidated Financial Statements, no significant judgements have been made in the process of applying our
accounting policies, other than those involving estimations about credit impairment losses, conduct remediation and pensions. Those
accounting estimates, as well as the judgements inherent within them, are considered important to the portrayal of the financial results and
financial condition because: (i) they are highly susceptible to change from period to period as assumptions are made to calculate the
estimates; and (ii) any significant difference between the estimated amounts and actual amounts could have a material impact on the
future financial results and financial condition.
ˆ200G2Mlv!2Smh006(Š200G2Mlv!2Smh006(
628340 TX 244SANTANDERFORM 20-F (SAN UK PL
03-Mar-2019 08:02 ESTHTMLON
Donnelley Financial EGV dommj0dc 3*ESS 0C
VDI-W7-PFD-037612.9.12.0
Page 1 of 1
Annual Report 2018 | Other information for US investors
Disclosure controls and procedures over financial reporting may not prevent or detect all errors or acts of fraud
Disclosure controls and procedures over financial reporting are designed to provide reasonable assurance that information required to be disclosed by us
within our financial statements or under other accounting, regulatory, supervisory or listing authority requirements, including in reports filed or submitted
under the US Securities Exchange Act of 1934, as amended (the Exchange Act), is accumulated and communicated to management, and recorded,
processed, summarised and reported within the time periods specified in the US Securities and Exchange Commission’s rules and forms and other
applicable accounting, regulatory, supervisory or listing authority requirements. Our control framework is based on the Committee of Sponsoring
Organisations of the Treadway Commission 2013 internal control – integrated framework which is designed to recognise the many changes in business
and operating environments since the issuance of the original framework and is intended to broaden and enhance the application of controls over financial
reporting.
However, there are inherent limitations to the effectiveness of any system of disclosure controls and procedures, including the possibility of human error
and the circumvention or overriding of the controls and procedures. Accordingly, even effective disclosure controls and procedures can only provide
reasonable assurance of achieving their control objectives.
Consequently, our business is exposed to risk from potential non-compliance with policies, employee misconduct or negligence and fraud, which could
result in regulatory sanctions, regulatory and law enforcement investigations, civil claims and serious reputational or financial harm. In recent years, a
number of multinational financial institutions have suffered material losses due to the actions of ‘rogue traders’ or other employees. It is not always
possible to deter or detect employee misconduct in a timely manner and the precautions we take to prevent and detect this activity may not always be
effective. As a result of the inherent limitations in the control system, misstatements due to error or fraud may occur and not be detected.
Changes in accounting standards could impact reported earnings
The accounting standard setters and other regulatory bodies periodically change the financial accounting and reporting standards that govern the
preparation of our consolidated financial statements. These changes can materially impact how we record and report our financial condition and operating
results. In some cases, we could be required to apply a new or revised standard retroactively, resulting in the restatement of prior period financial
statements. For further information about future accounting developments, see Note 1 to the Consolidated Financial Statements.
We rely on third parties and affiliates for important infrastructure support, products and services
TPPs and certain affiliates provide key components of our business infrastructure such as loan and deposit servicing systems, back office and business
process support, information technology production and support, internet connections and network access. Relying on these TPPs and affiliates is a
source of operational and regulatory risk to us, including with respect to security breaches affecting such parties. We are also subject to risk with respect
to security breaches affecting our TPPs and affiliates, and other parties that interact with these parties. As our interconnectivity with these third parties and
affiliates increases, including through the use of cloud based services, we increasingly face the risk of operational failure with respect to their systems. We
may be required to take steps to protect the integrity of our operational systems, thereby increasing our operational costs and potentially decreasing
customer satisfaction. In addition, any problems caused by these third parties or affiliates, including as a result of them not providing us their services for
any reason, or performing their services poorly, could adversely affect our ability to deliver products and services to customers and otherwise conduct our
business, which could lead to reputational damage and regulatory investigations and intervention. Replacing these third party vendors or affiliates could
also entail significant delays and expense. Further, the operational and regulatory risk we face as a result of these arrangements may be increased to the
extent that we restructure such arrangements. Any restructuring could involve significant expense to us and entail significant delivery and execution risk
which could have a material adverse effect on our operations, financial condition and prospects.
We are part of a group and we may engage in transactions with our subsidiaries or affiliates
We and our subsidiaries and affiliates have entered into a number of services agreements pursuant to which we render services, such as administrative,
accounting, finance, treasury, legal and other services. Also, we rely upon certain outsourced services (including information technology support,
maintenance, and consultancy services) provided by certain other members of the Banco Santander group (for more information, see the risk factor
entitled ‘We rely on third parties and affiliates for important infrastructure support, products and services’). In addition, we are utilising a ring-fencing
transfer scheme and other agreements with our subsidiaries and affiliates to implement the ring-fencing requirements of the Banking Reform Act (for more
information, see the risk factor entitled ‘We are subject to substantial regulation and governmental oversight which could adversely affect our operations,
financial condition and prospects’). The foregoing arrangements may be considered by some not to be on an arms-length basis.
English law applicable to public companies and financial groups and institutions, as well as our articles of association, provide for several procedures
designed to ensure that the transactions entered into, with or among our financial subsidiaries, do not deviate from prevailing market conditions for those
types of transactions. We are likely to continue to engage in transactions with our subsidiaries or affiliates. Future conflicts of interests between us and any
of our subsidiaries or affiliates, or between our subsidiaries and affiliates, may arise, which conflicts are not required to be and may not be resolved in our
favour.
Different disclosure and accounting principles between the UK and the US may provide different or less information about us than you
expected
There may be less publicly available information about us than is regularly published about companies in the US. Issuers of securities in the UK are
required to make public disclosures that are different from, and that may be reported under presentations that are not consistent with, disclosures required
in countries with a relatively more developed capital market, including the US. While we are subject to the periodic reporting requirements of the Exchange
Act, we are not subject to the same disclosure requirements in the US as a domestic US registrant under the Exchange Act, including the requirements to
prepare and issue quarterly reports, or the proxy rules applicable to domestic US registrants under Section 14 of the Exchange Act or the insider reporting
and short-swing profit rules under Section 16 of the Exchange Act. Accordingly, the information about us available will not be the same as the information
available to holders of securities of a US company and may be reported in a manner that is not familiar.
Risks concerning enforcement of judgements made in the US
The Company is a public limited company registered in England and Wales. Most of the Company’s directors and officers named herein are residents of
the UK, and there is no assurance that any director of the Company will live in the US at any given time in the future. As a result, it may not be possible to
serve process on such persons in the US or to enforce judgements obtained in US courts against them or us based on the civil liability provisions of the
US federal securities laws or other laws of the US or any state thereof.
244 Santander UK plc
ˆ200G2Mlv!2=8LoyguŠ200G2Mlv!2=8Loygu
628340 TX 245SANTANDERFORM 20-F (SAN UK PL
04-Mar-2019 01:46 ESTHTMLON
Donnelley Financial EGV gopad0dc 5*ESS 0C
VDI-W7-PFD-037812.9.12.0
bar6
Page 1 of 1
> Articles of Association
Santander UK plc 245
Articles of Association
The following is a summary of the Articles of Association (the Articles) of the Company.
Santander UK plc is a public limited company incorporated and registered in England and Wales under the Companies Act 2006, with
registered number 2294747. The Articles specifically state and limit the objects of the Company which are therefore restricted.
A Director shall not vote on, or be counted in the quorum in relation to, any resolution of the Directors in respect of any contract in which he
has an interest, except if no conflict of interest could reasonably be expected to arise from that interest, or any resolution of the Directors
concerning his own appointment, or the settlement or variation of the terms or the termination of his or her appointment. Directors are
entitled to such remuneration as the directors determine for their services to the Company as directors and for any other service which they
undertake for the Company. Directors may delegate to a person or committee the determination of any fee, remuneration or other benefit
which may be paid or provided to any Director. No Director is required to retire by reason of his or her age, nor do any special formalities
apply to the appointment or re-election of any Director who is over any age limit. No shareholding qualification for Directors is required.
The Company may issue shares with such rights or restrictions as may be determined by ordinary resolution or, if no such resolution has
been passed or so far as the resolution does not make specific provision, as the Directors may decide. The Company may by ordinary
resolution declare dividends, and the Directors may decide to declare or pay interim dividends. No dividend may be declared or paid
unless it is in accordance with shareholders’ respective rights. If dividends are unclaimed for twelve years, the right to the dividend ceases.
All dividends or other sums which are payable in respect of shares, and unclaimed after having been declared or become payable, may be
invested or otherwise made use of by the Directors for the benefit of the Company until claimed.
Preference shares entitle the holder to receive a preferential dividend payment at a fixed or variable rate, such dividend to be payable on a
date determined by the Board prior to the allotment of the shares. The Board will also determine whether these dividend rights are
cumulative or non-cumulative. The holders of any series of preference shares will only be entitled to receive notice of and to attend any
general meeting of the Company if the preference dividend on the preference shares of such series has not, at the date of the notice of the
general meeting, been paid in full in respect of such dividend periods as the Board may prior to allotment determine, in which case the
holders of the preference shares will be entitled to speak and/or vote upon any resolution proposed; or, if a resolution is proposed at
the general meeting for, or in relation to, the winding up of the Company, or varying, altering or abrogating any of the rights, privileges,
limitations or restrictions attached to the preference shares of such series, in which case the holders of the preference shares of such
series will be entitled to speak and/or vote only upon such resolution; or in such other circumstances, and upon and subject to such terms,
as the Board may determine prior to allotment. Unless the Board determines, prior to allotment, that the series of preference shares shall
be non-redeemable, each series shall be redeemable at the option of the Company on any date as the Board may determine prior to the
date of allotment. On redemption the Company shall pay the amount due. The formula for calculation of any relevant redemption premium
is set out in the Articles of Association.
On a distribution of assets on winding up of the Company or return of capital (other than on a redemption or purchase by the Company of
any of its share capital), members holding preference shares shall in respect thereof be entitled to receive, out of the surplus assets
remaining after payment of the Company’s liabilities, an amount equal to the amount paid up or credited as paid up on the preference
shares together with such premium (if any) as may be determined by the Board prior to allotment thereof (and so that the Board may
determine that such premium is payable only in specified circumstances).
Ordinary shares are transferable. Holders of ordinary shares are entitled to receive notice of and to attend any general meeting of the
Company. Subject to any special terms as to voting upon which any shares may be issued or may for the time being be held, or any
suspension or any abrogation of special rights, as set out in the Articles of Association, on a show of hands every member who is present
in person at a general meeting of the Company shall have one vote and every proxy present who has been duly appointed by a member
shall have one vote. On a poll every member who is present in person or by proxy shall have one vote for every share of which he is the
holder.
Subject to the prior rights of holders of preference shares, the Company pays dividends on its ordinary shares only out of its distributable
profits and not out of share capital. Dividends are determined by the Board.
The Company’s Articles of Association authorise it to issue redeemable shares, but the Company’s ordinary shares are not redeemable.
Where the shares are partly paid, the Board may make further calls upon the holders in respect of any sum whether in respect of nominal
value or premium that is unpaid on their shares. There are no provisions discriminating against any existing or prospective shareholder as
a result of such shareholder owning a substantial number of shares of any class. Subject to the provisions of the UK Companies Act 2006,
all or any of the rights attached to any class of shares (whether or not the Company is being wound up) may be varied with the consent in
writing of the holders of not less than three-quarters in nominal value of the issued shares of that class or with the sanction of a special
resolution passed at a separate general meeting of the holders of those shares. Additional quorum and voting requirements apply to such
meeting.
General meetings shall be called by at least 14 clear days’ notice (that is, excluding the day of the general meeting and the day on which
the notice is given). A general meeting may be called by shorter notice if it is so agreed, in the case of an annual general meeting, by all
the shareholders having a right to attend and vote, or in other cases, by a majority in number of the shareholders having a right to attend
and vote, being a majority together holding not less than 95% in nominal value of the shares giving the right. The notice shall specify the
date, time and place of the meeting and the general nature of the business to be transacted.
There are no restrictions on the rights to own securities for either resident or non-resident shareholders, other than those to which they
may be subject as a result of laws and regulations in their home jurisdiction.

ˆ200G2Mlv!2=8PsDg0Š200G2Mlv!2=8PsDg0
628340 TX 246SANTANDERFORM 20-F (SAN UK PL
04-Mar-2019 01:46 ESTHTMLON
Donnelley Financial EGV gopad0dc 5*ESS 0C
VDI-W7-PFD-037812.9.12.0
Page 1 of 1
Annual Report 2018 | Other information for US investors
Disclosure pursuant to Section 219 of the Iran Threat
Reduction and Syria Human Rights Act
Pursuant to Section 219 of the Iran Threat Reduction and Syria Human Rights Act of 2012, which added Section 13(r) to the Securities Exchange Act of
1934, as amended (the Exchange Act), an issuer is required to disclose in its annual or quarterly reports, as applicable, whether it or any of its affiliates
knowingly engaged in certain activities, transactions or dealings relating to Iran or with individuals or entities designated pursuant to certain Executive
Orders. Disclosure is generally required even where the activities, transactions or dealings were conducted in compliance with applicable law.
The following activities are disclosed in response to Section 13(r) with respect to the Company and its affiliates within the Banco Santander group:
(a) Santander UK holds two savings accounts and one current account for two customers. Both of the customers, who are resident in the UK, are
currently designated by the US under the Specially Designated Global Terrorist (SDGT) sanctions program. Revenues and profits generated by Santander
UK on these accounts in the year ended 31 December 2018 were negligible relative to the overall profits of Santander UK.
(b) During the period covered by this annual report, Santander UK held one savings account with a balance of £1.24, and one current account with a
balance of £1,884.53 for another customer resident in the UK who is currently designated by the US under the SDGT sanctions program. The customer
relationship pre-dates the designations of the customer under these sanctions. The United Nations and European Union removed this customer from their
equivalent sanctions lists in 2008. Santander UK determined to put a block on these accounts, and the accounts were subsequently closed on 14 January
2019. Revenues and profits generated by Santander UK on these accounts in the year ended 31 December 2018 were negligible relative to the overall
profits of Santander UK.
(c) Santander UK holds two frozen current accounts for two UK nationals who are designated by the US under the SDGT sanctions programme. The
accounts held by each customer have been frozen since their designation and have remained frozen through 2018. The accounts are in arrears
(£1,844.73 in debit combined) and are currently being managed by Santander UK Collections & Recoveries department. No revenues or profits were
generated by Santander UK on these accounts in the year ended 31 December 2018.
(d) The Banco Santander group also has certain legacy performance guarantees for the benefit of Bank Sepah and Bank Mellat (stand-by letters of
credit to guarantee the obligations – either under tender documents or under contracting agreements – of contractors who participated in public bids in
Iran) that were in place prior to April 27, 2007.
In the aggregate, all of the transactions described above resulted in gross revenues and net profits in the year ended 31 December 2018 that were
negligible relative to the overall revenues and profits of the Banco Santander group. The Banco Santander group has undertaken significant steps to
withdraw from the Iranian market such as closing its representative office in Iran and ceasing all banking activities therein, including correspondent
relationships, deposit taking from Iranian entities and issuing export letters of credit, except for the legacy transactions described above. The Banco
Santander group is not contractually permitted to cancel these arrangements without either: (i) paying the guaranteed amount (in the case of the
performance guarantees); or (ii) forfeiting the outstanding amounts due to it (in the case of the export credits). As such, the Banco Santander group
intends to continue to provide the guarantees and hold these assets in accordance with company policy and applicable laws.
246 Santander UK plc

ˆ200G2Mlv!2=8SY66DŠ200G2Mlv!2=8SY66D
628340 TX 247SANTANDERFORM 20-F (SAN UK PL
04-Mar-2019 01:46 ESTHTMLON
Donnelley Financial EGV gopad0dc 5*ESS 0C
VDI-W7-PFD-037812.9.12.0
bar6
Page 1 of 1
> New York Stock Exchange (NYSE) Corporate Governance – differences in UK and NYSE corporate governance practice
Santander UK plc 247
New York Stock Exchange (NYSE) Corporate Governance – differences in
UK and NYSE corporate governance practice
The Company issues notes in the US from time to time pursuant to a shelf registration statement filed with the SEC. As these notes are
listed on the NYSE, the Company is required to comply with NYSE corporate governance standards. Under the NYSE corporate
governance standards, the Company must disclose any significant ways in which its corporate governance practices differ from those
followed by US companies under the NYSE corporate governance standards. We believe the following to be the significant differences
between our current corporate governance practices and those applicable to US companies under the NYSE corporate governance
standards.
Under the NYSE corporate governance standards, independent directors must comprise a majority of the Board. As at 31 December 2018,
our Board was comprised of a Chair (who is also a Non-Executive Director), three Executive Directors and ten other Non-Executive
Directors. The Chair, Shriti Vadera, and six of the other Non-Executive Directors, Julie Chakraverty, Annemarie Durbin, Ed Giera, Chris
Jones, Genevieve Shore and Scott Wheway, were independent as defined in the NYSE corporate governance standards. The other four
Non-Executive Directors were not independent according to NYSE corporate governance standards as they are representatives of the
ultimate parent company, Banco Santander SA. Directors as at 31 December 2018 include Juan Inciarte, who resigned on 31 December
2018, see the ‘Board and Committee membership, tenure, attendance and remuneration’ section. Following his resignation, there will be
nine other Non-Executive Directors in addition to the Chair and three Non-Executive Directors who are not independent according to NYSE
corporate governance standards.
The NYSE corporate governance standards require that listed US companies have a nominating or corporate governance committee
composed entirely of independent directors and with a written charter addressing certain corporate governance matters. Applicable UK
rules do not require companies without equity shares listed on the London Stock Exchange, such as the Company, to have a nominating
committee. However, the Company has a Board Nomination Committee, which leads the process for Board appointments. This Committee
has written Terms of Reference setting out its role to identify and nominate candidates for Board and Board Committee appointments. As
at 31 December 2018, the following Directors made up the Board Nomination Committee: Shriti Vadera (Chair), Ana Botín and
Scott Wheway. Of these Directors, Shriti Vadera and Scott Wheway were independent according to NYSE corporate governance
standards as at 31 December 2018.
In addition, the Board is responsible for monitoring the effectiveness of the Company’s governance practices and making changes as
needed to ensure the alignment of the Company’s governance system with current best practices. The Board monitors and manages
potential conflicts of interest of management, Board members, shareholders, external advisors and other service providers, including
misuse of corporate assets and abuse in related party transactions.
The NYSE corporate governance standards require that listed US companies have a compensation committee composed entirely of
independent directors and with a written charter addressing certain corporate governance matters. Under its written Terms of Reference,
the Company’s Board Remuneration Committee is primarily responsible for overseeing and supervising Santander UK’s policies and
frameworks covering remuneration and reward. As at 31 December 2018, the Board Remuneration Committee was made up of four
independent Non-Executive Directors according to NYSE corporate governance standards (Annemarie Durbin (Chair), Chris Jones,
Genevieve Shore and Scott Wheway).
The NYSE corporate governance standards require that listed US companies have an audit committee that satisfies the requirements of
Rule 10A-3 under the US Securities Exchange Act of 1934, as amended (Rule 10A-3), with a written charter addressing certain corporate
governance matters, and whose members are all independent as defined in Rule 10A-3. As a wholly-owned subsidiary of a parent that
satisfies the requirements of Rule 10A-3(c)(2), the Company is exempt from the requirements of Rule 10A-3. However, the Company does
have a Board Audit Committee. As at 31 December 2018, the Board Audit Committee was made up of four Non-Executive Directors: Chris
Jones (Chair), Julie Chakraverty, Ed Giera and Genevieve Shore. All four members were independent in 2018 as defined in Rule 10A-3.
The scope of the Board Audit Committee’s Terms of Reference as well as the duties and responsibilities of such committee are more
limited than that required of audit committees under the NYSE corporate governance standards. For example, the Board Audit Committee
does not provide an audit committee report as required by the NYSE corporate governance standards to be included in the Company’s
annual proxy statement.
The NYSE corporate governance standards require that listed US companies adopt and disclose corporate governance guidelines,
including with respect to the qualification, training and evaluation of their Directors. The NYSE corporate governance standards also
require that the Board conducts a self-evaluation at least annually to determine whether it and its committees are functioning effectively.
The Board has undertaken regular reviews of Board effectiveness primarily through an internal process led by the Chair. The Board
undertook an external review of Board effectiveness in 2016 and agreed on a plan for continuous improvement. In 2018, we reviewed the
progress made on implementing the recommendations from 2016’s extensive external evaluation of Board effectiveness and carried out an
internal assessment of effectiveness.
A CEO of a US company listed on the NYSE must annually certify that he or she is not aware of any violation by the company of NYSE
corporate government standards. In accordance with NYSE corporate governance standards applicable to foreign private issuers, our CEO
is not required to provide the NYSE with such an annual compliance certification.
In addition, as a wholly-owned subsidiary of an NYSE-listed company, the Company is exempt from two NYSE listing standards otherwise
applicable to foreign companies listed on the NYSE as well as US companies listed on the NYSE. The first requires the CEO of any NYSE-
listed foreign company to notify promptly the NYSE in writing after any executive of the issuer becomes aware of any material
non-compliance with any applicable NYSE corporate governance standards. The second requires NYSE-listed foreign companies to
submit executed written affirmations annually to the NYSE.

ˆ200G2Mlv!2=8TgPgpŠ200G2Mlv!2=8TgPgp
628340 TX 248SANTANDERFORM 20-F (SAN UK PL
04-Mar-2019 01:46 ESTHTMLON
Donnelley Financial EGV gopad0dc 5*ESS 0C
VDI-W7-PFD-037812.9.12.0
Page 1 of 1
Annual Report 2018 | Other information for US investors
Other information
Designated agent
The designated agent for service of process on Santander UK in the United States is CT Corporation System, 111 Eighth Avenue, New York, New York.
Trustee/paying agent
The names and addresses of the Trustee/Paying Agent for each class of security registered are set out below:
– Senior: Wells Fargo Bank, National Association, 150 East 42nd Street, 40th Floor, New York, New York 10017, United States
– With respect to certain earlier outstanding senior notes: The Bank of New York Mellon, 240 Greenwich Street, Floor 7E, New York 10286, United
States (US80283LAK98, US80283LAL71, US80283LAH69, US80283LAN38, US80283LAJ26)
– With respect to 7.95% Term Subordinated Securities due October 26, 2029 (US002920AC09): Trustee: The Bank of New York Mellon, One Canada
Square, London, E14 5AL and Paying Agent: Citibank, N.A. 13th Floor, Citigroup Centre, Canada Square, London E14 5LB
Documents on display
The Company is subject to the information requirements of the US Securities Exchange Act of 1934. In accordance with these requirements, the Company
files its Annual Report and other related documents with the US Securities and Exchange Commission. These documents may be inspected by US
investors at the US Securities and Exchange Commission’s public reference rooms, which are located at 100 F Street NE, Washington, DC 20549.
Information on the operation of the public reference rooms can be obtained by calling the US Securities and Exchange Commission on +1-202-551-8090
or by looking at the US Securities and Exchange Commission’s website. The US Securities and Exchange Commission maintains an internet site that
contains reports, proxy and information statements, and other information regarding issuers that file electronically with it. This is accessible at
www.sec.gov.
None of the websites referred to in this Annual Report on Form 20-F for the year ended 31 December 2018 (the Form 20-F), including where a link is
provided, nor any of the information contained on such websites is incorporated by reference in the Form 20-F.
Legal proceedings
We are party to various legal proceedings in the ordinary course of business. See Notes 30 and 32 to the Consolidated Financial Statements.
Material contracts
We are party to various contracts in the ordinary course of business. For the two years ended 31 December 2018, there have been no material contracts
entered into outside the ordinary course of business.
Audit fees
See Note 7 to the Consolidated Financial Statements.
Accounting developments under IFRS
See Note 1 to the Consolidated Financial Statements.
Share capital
Details of the Company’s share capital are set out in Note 33 to the Consolidated Financial Statements.
Major shareholders
At 31 December 2018, the Company was a subsidiary of Santander UK Group Holdings plc. On 12 November 2004, Banco Santander SA acquired the
then entire issued ordinary share capital of 1,485,893,636 ordinary shares of 10 pence each. On 12 October 2008, a further 10 billion ordinary shares of
10 pence each were issued to Banco Santander SA and an additional 12,631,375,230 ordinary shares of 10 pence each were issued to Banco Santander
SA on 9 January 2009. On 3 August 2010, 6,934,500,000 ordinary shares of 10 pence each were issued to Santusa Holding SL. With effect from
10 January 2014, Santander UK Group Holdings Limited, a subsidiary of Banco Santander SA and Santusa Holding SL, became the beneficial owner of
31,051,768,866 of 10 pence each, being the entire issued ordinary share capital of the Company, by virtue of a share exchange agreement between
Santander UK Group Holdings Limited, Banco Santander SA and Santusa Holding SL. Santander UK Group Holdings Ltd became the legal owner of the
entire issued ordinary share capital of the Company on 1 April 2014 and on 25 March 2015 became a public limited company and changed its name from
Santander UK Group Holdings Ltd to Santander UK Group Holdings plc.
Exchange controls
There are no UK laws, decrees or regulations that restrict our export or import of capital, including the availability of cash and cash equivalents for use by
us, or that affect the remittance of dividends or other shareholder payments to non-UK holders of Company shares, except as outlined in the section on
Taxation for US Investors below.
248 Santander UK plc
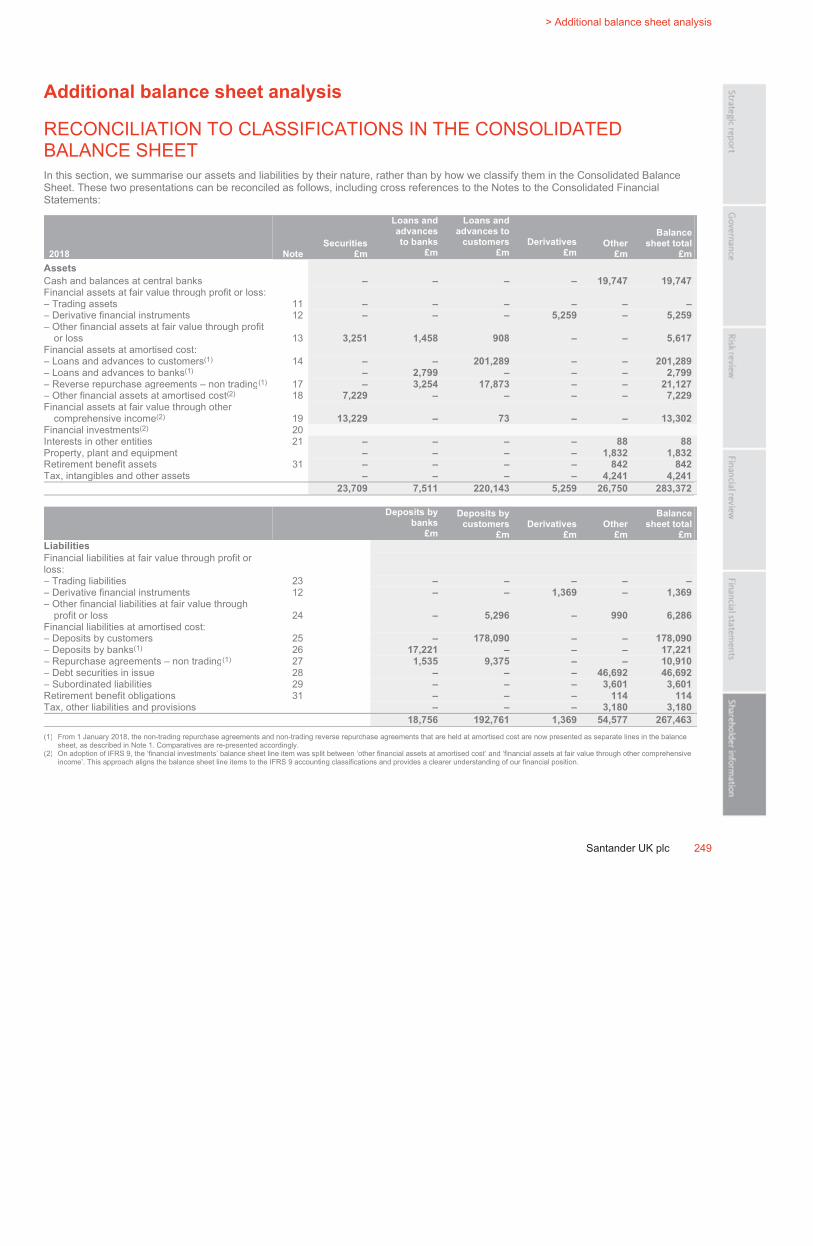
ˆ200G2Mlv!2=8YVZgYŠ200G2Mlv!2=8YVZgY
628340 TX 249SANTANDERFORM 20-F (SAN UK PL
04-Mar-2019 01:46 ESTHTMLON
Donnelley Financial EGV gopad0dc 6*ESS 0C
VDI-W7-PFD-037812.9.12.0
bar6
Page 1 of 1
> Additional balance sheet analysis
Santander UK plc 249
Additional balance sheet analysis
RECONCILIATION TO CLASSIFICATIONS IN THE CONSOLIDATED
BALANCE SHEET
In this section, we summarise our assets and liabilities by their nature, rather than by how we classify them in the Consolidated Balance
Sheet. These two presentations can be reconciled as follows, including cross references to the Notes to the Consolidated Financial
Statements:
2018 Note
Securities
£m
Loans and
advances
to banks
£m
Loans and
advances to
customers
£m
Derivatives
£m
Other
£m
Balance
sheet total
£m
Assets
Cash and balances at central banks – – – – 19,747 19,747
Financial assets at fair value through profit or loss:
– Trading assets 11 – – – – – –
– Derivative financial instruments 12 – – – 5,259 – 5,259
– Other financial assets at fair value through profit
or loss 13 3,251 1,458 908 – – 5,617
Financial assets at amortised cost:
– Loans and advances to customers(1) 14 – – 201,289 – – 201,289
– Loans and advances to banks(1)
– 2,799 – – – 2,799
– Reverse repurchase agreements – non trading(1)
17 – 3,254 17,873 – – 21,127
– Other financial assets at amortised cost(2) 18 7,229 – – – – 7,229
Financial assets at fair value through other
comprehensive income(2) 19 13,229 – 73 – – 13,302
Financial investments(2) 20
Interests in other entities 21 – – – – 88 88
Property, plant and equipment – – – – 1,832 1,832
Retirement benefit assets 31 – – – – 842 842
Tax, intangibles and other assets – – – – 4,241 4,241
23,709 7,511 220,143 5,259 26,750 283,372
Deposits by
banks
£m
Deposits by
customers
£m
Derivatives
£m
Other
£m
Balance
sheet total
£m
Liabilities
Financial liabilities at fair value through profit or
loss:
– Trading liabilities 23 – – – – –
– Derivative financial instruments 12 – – 1,369 – 1,369
– Other financial liabilities at fair value through
profit or loss 24 – 5,296 – 990 6,286
Financial liabilities at amortised cost:
– Deposits by customers 25 – 178,090 – – 178,090
– Deposits by banks(1) 26 17,221 – – – 17,221
– Repurchase agreements – non trading(1) 27 1,535 9,375 – – 10,910
– Debt securities in issue 28 – – – 46,692 46,692
– Subordinated liabilities 29 – – – 3,601 3,601
Retirement benefit obligations 31 – – – 114 114
Tax, other liabilities and provisions – – – 3,180 3,180
18,756 192,761 1,369 54,577 267,463
(1) From 1 January 2018, the non-trading repurchase agreements and non-trading reverse repurchase agreements that are held at amortised cost are now presented as separate lines in the balance
sheet, as described in Note 1. Comparatives are re-presented accordingly.
(2) On adoption of IFRS 9, the ‘financial investments’ balance sheet line item was split between ‘other financial assets at amortised cost’ and ‘financial assets at fair value through other comprehensive
income’. This approach aligns the balance sheet line items to the IFRS 9 accounting classifications and provides a clearer understanding of our financial position.
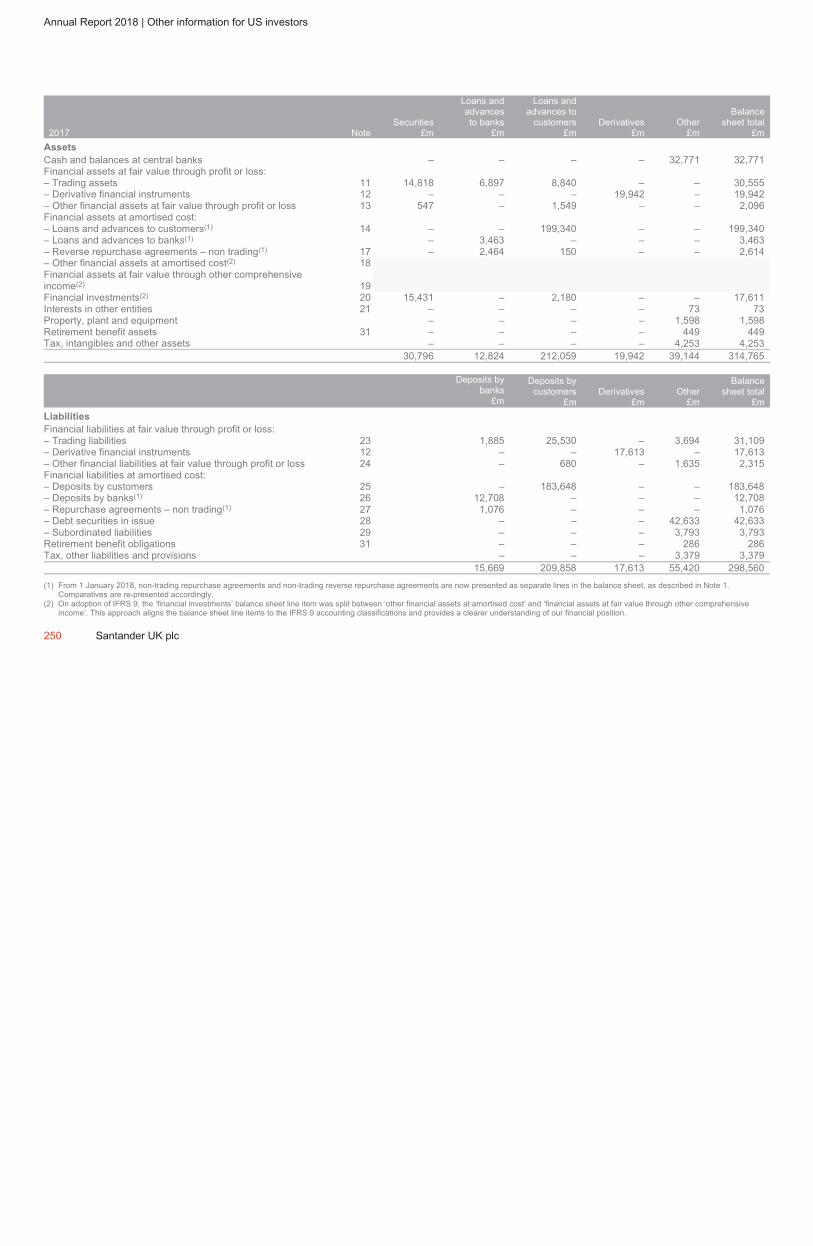
ˆ200G2Mlv!2=CnmdgÁŠ200G2Mlv!2=Cnmdg`
628340 TX 250SANTANDERFORM 20-F (SAN UK PL
04-Mar-2019 01:50 ESTHTMLON
Donnelley Financial EGV shanv1dc 4*ESS 0C
VDI-W7-PFL-160412.9.12.0
Page 1 of 1
Annual Report 2018 | Other information for US investors
2017 Note
Securities
£m
Loans and
advances
to banks
£m
Loans and
advances to
customers
£m
Derivatives
£m
Other
£m
Balance
sheet total
£m
Assets
Cash and balances at central banks – – – – 32,771 32,771
Financial assets at fair value through profit or loss:
– Trading assets 11 14,818 6,897 8,840 – – 30,555
– Derivative financial instruments 12 – – – 19,942 – 19,942
– Other financial assets at fair value through profit or loss 13 547 – 1,549 – – 2,096
Financial assets at amortised cost:
– Loans and advances to customers(1) 14 – – 199,340 – – 199,340
– Loans and advances to banks(1) – 3,463 – – – 3,463
– Reverse repurchase agreements – non trading(1)
17 – 2,464 150 – – 2,614
– Other financial assets at amortised cost(2) 18
Financial assets at fair value through other comprehensive
income(2) 19
Financial investments(2) 20 15,431 – 2,180 – – 17,611
Interests in other entities 21 – – – – 73 73
Property, plant and equipment – – – – 1,598 1,598
Retirement benefit assets 31 – – – – 449 449
Tax, intangibles and other assets – – – – 4,253 4,253
30,796 12,824 212,059 19,942 39,144 314,765
Deposits by
banks
£m
Deposits by
customers
£m
Derivatives
£m
Other
£m
Balance
sheet total
£m
Liabilities
Financial liabilities at fair value through profit or loss:
– Trading liabilities 23 1,885 25,530 – 3,694 31,109
– Derivative financial instruments 12 – – 17,613 – 17,613
– Other financial liabilities at fair value through profit or loss 24 – 680 – 1,635 2,315
Financial liabilities at amortised cost:
– Deposits by customers 25 – 183,648 – – 183,648
– Deposits by banks(1) 26 12,708 – – – 12,708
– Repurchase agreements – non trading(1) 27 1,076 – – – 1,076
– Debt securities in issue 28 – – – 42,633 42,633
– Subordinated liabilities 29 – – – 3,793 3,793
Retirement benefit obligations 31 – – – 286 286
Tax, other liabilities and provisions – – – 3,379 3,379
15,669 209,858 17,613 55,420 298,560
(1) From 1 January 2018, non-trading repurchase agreements and non-trading reverse repurchase agreements are now presented as separate lines in the balance sheet, as described in Note 1.
Comparatives are re-presented accordingly.
(2) On adoption of IFRS 9, the ‘financial investments’ balance sheet line item was split between ‘other financial assets at amortised cost’ and ‘financial assets at fair value through other comprehensive
income’. This approach aligns the balance sheet line items to the IFRS 9 accounting classifications and provides a clearer understanding of our financial position.
250 Santander UK plc
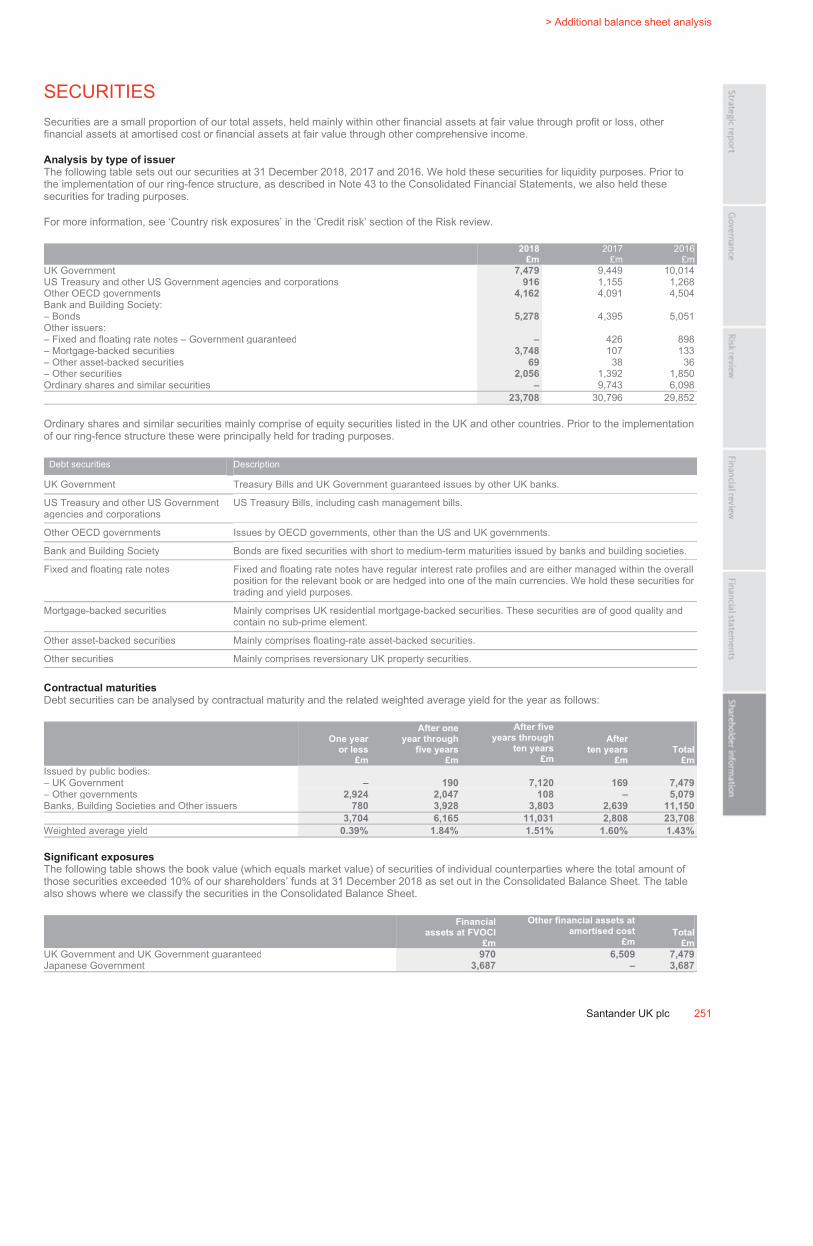
ˆ200G2Mlv!2ZhtPv6?Š200G2Mlv!2ZhtPv6?
628340 TX 251SANTANDERFORM 20-F (SAN UK PL
04-Mar-2019 01:07 ESTHTMLON
Donnelley Financial EGV annas1dc 4*ESS 0C
VDI-W7-PFD-029812.9.12.0
bar6
Page 1 of 1
> Additional balance sheet analysis
Santander UK plc 251
SECURITIES
Securities are a small proportion of our total assets, held mainly within other financial assets at fair value through profit or loss, other
financial assets at amortised cost or financial assets at fair value through other comprehensive income.
Analysis by type of issuer
The following table sets out our securities at 31 December 2018, 2017 and 2016. We hold these securities for liquidity purposes. Prior to
the implementation of our ring-fence structure, as described in Note 43 to the Consolidated Financial Statements, we also held these
securities for trading purposes.
For more information, see ‘Country risk exposures’ in the ‘Credit risk’ section of the Risk review.
2018
£m
2017
£m
2016
£m
UK Government 7,479 9,449 10,014
US Treasury and other US Government agencies and corporations 916 1,155 1,268
Other OECD governments 4,162 4,091 4,504
Bank and Building Society:
– Bonds 5,278 4,395 5,051
Other issuers:
– Fixed and floating rate notes – Government guaranteed – 426 898
– Mortgage-backed securities 3,748 107 133
– Other asset-backed securities 69 38 36
– Other securities 2,056 1,392 1,850
Ordinary shares and similar securities – 9,743 6,098
23,708 30,796 29,852
Ordinary shares and similar securities mainly comprise of equity securities listed in the UK and other countries. Prior to the implementation
of our ring-fence structure these were principally held for trading purposes.
Debt securities Description
UK Government Treasury Bills and UK Government guaranteed issues by other UK banks.
US Treasury and other US Government
agencies and corporations
US Treasury Bills, including cash management bills.
Other OECD governments Issues by OECD governments, other than the US and UK governments.
Bank and Building Society Bonds are fixed securities with short to medium-term maturities issued by banks and building societies.
Fixed and floating rate notes Fixed and floating rate notes have regular interest rate profiles and are either managed within the overall
position for the relevant book or are hedged into one of the main currencies. We hold these securities for
trading and yield purposes.
Mortgage-backed securities Mainly comprises UK residential mortgage-backed securities. These securities are of good quality and
contain no sub-prime element.
Other asset-backed securities Mainly comprises floating-rate asset-backed securities.
Other securities Mainly comprises reversionary UK property securities.
Contractual maturities
Debt securities can be analysed by contractual maturity and the related weighted average yield for the year as follows:
One year
or less
£m
After one
year through
five years
£m
After five
years through
ten years
£m
After
ten years
£m
Total
£m
Issued by public bodies:
– UK Government – 190 7,120 169 7,479
– Other governments 2,924 2,047 108 – 5,079
Banks, Building Societies and Other issuers 780 3,928 3,803 2,639 11,150
3,704 6,165 11,031 2,808 23,708
Weighted average yield 0.39% 1.84% 1.51% 1.60% 1.43%
Significant exposures
The following table shows the book value (which equals market value) of securities of individual counterparties where the total amount of
those securities exceeded 10% of our shareholders’ funds at 31 December 2018 as set out in the Consolidated Balance Sheet. The table
also shows where we classify the securities in the Consolidated Balance Sheet.
Financial
assets at FVOCI
£m
Other financial assets at
amortised cost
£m
Total
£m
UK Government and UK Government guaranteed 970 6,509 7,479
Japanese Government 3,687 – 3,687

ˆ200G2Mlv!2=F@&06pŠ200G2Mlv!2=F@&06p
628340 TX 252SANTANDERFORM 20-F (SAN UK PL
04-Mar-2019 01:53 ESTHTMLON
Donnelley Financial EGV sraas0dc 6*ESS 0C
VDI-W7-PFL-035112.9.12.0
Page 1 of 1
Annual Report 2018 | Other information for US investors
LOANS AND ADVANCES TO BANKS
Loans and advances to banks include loans to banks and building societies and balances with central banks (excluding central bank balances which can
be withdrawn on demand). The balances include loans and advances to banks classified in the balance sheet as reverse repurchase agreements – non
trading. Prior to the implementation of our ring-fence structure it also included loans and advances to banks classified as trading assets.
2018 2017 2016 2015 2014
£m £m £m £m £m
Loans and advances to banks 7,511 12,824 11,828 8,982 8,002
Maturity analysis
The following table shows loans and advances to banks by maturity at 31 December 2018.
On demand
Not later than
three months
Later than
three months
and not later
than one year
Later than
one year
and not later
than five years
Later than
five years
and not later
than ten years
Later than
ten years Total
£m £m £m £m £m £m £m
Fixed interest rate 228 2,637 103 1 – 52 3,021
Variable interest rate 1,732 251 516 1,983 – 8 4,490
1,960 2,888 619 1,984 – 60 7,511
LOANS AND ADVANCES TO CUSTOMERS
We provide lending facilities primarily to personal customers in the form of mortgages secured on residential properties and lending facilities to corporate
customers. Purchase and resale agreements represent business with professional non-bank customers as part of the liquidity risk management function.
The balances are stated before deducting impairment loss allowances and RV and voluntary termination provisions, and include loans and advances to
customers classified in the balance sheet other financial assets at fair value through profit or loss, reverse repurchase agreements – non trading and
financial assets at fair value through other comprehensive income. Prior to the implementation of our ring-fence structure they also included loans and
advances to customers classified as trading assets.
2018 2017 2016 2015 2014
£m £m £m £m £m
Loans secured on residential properties 157,957 155,355 154,727 153,261 150,440
Corporate loans 27,877 32,555 33,709 33,801 32,262
Finance leases 6,821 6,710 6,730 6,306 2,639
Secured advances – – 10 13 15
Other unsecured loans 7,554 7,334 8,533 7,951 7,043
Purchase and resale agreements 18,740 7,736 7,955 4,352 2,200
Loans and receivables securities – 2,180 255 51 109
Amounts due from immediate parent 17 – – – –
Amounts due from fellow subsidiaries and joint ventures 1,997 1,207 1,117 1,369 797
Loans and advances to customers 220,963 213,077 213,036 207,104 195,505
Impairment loss allowances (751) (940) (921) (1,108) (1,415)
RV and voluntary termination provisions on finance leases (69) (78) (68) (49) (24)
Net loans and advances to customers 220,143 212,059 212,047 205,947 194,066
No single concentration of loans and advances above, except for loans secured on residential properties and corporate loans, is more than 10% of total
loans and advances, and no individual country, except the UK, is more than 5% of total loans and advances.
252 Santander UK plc
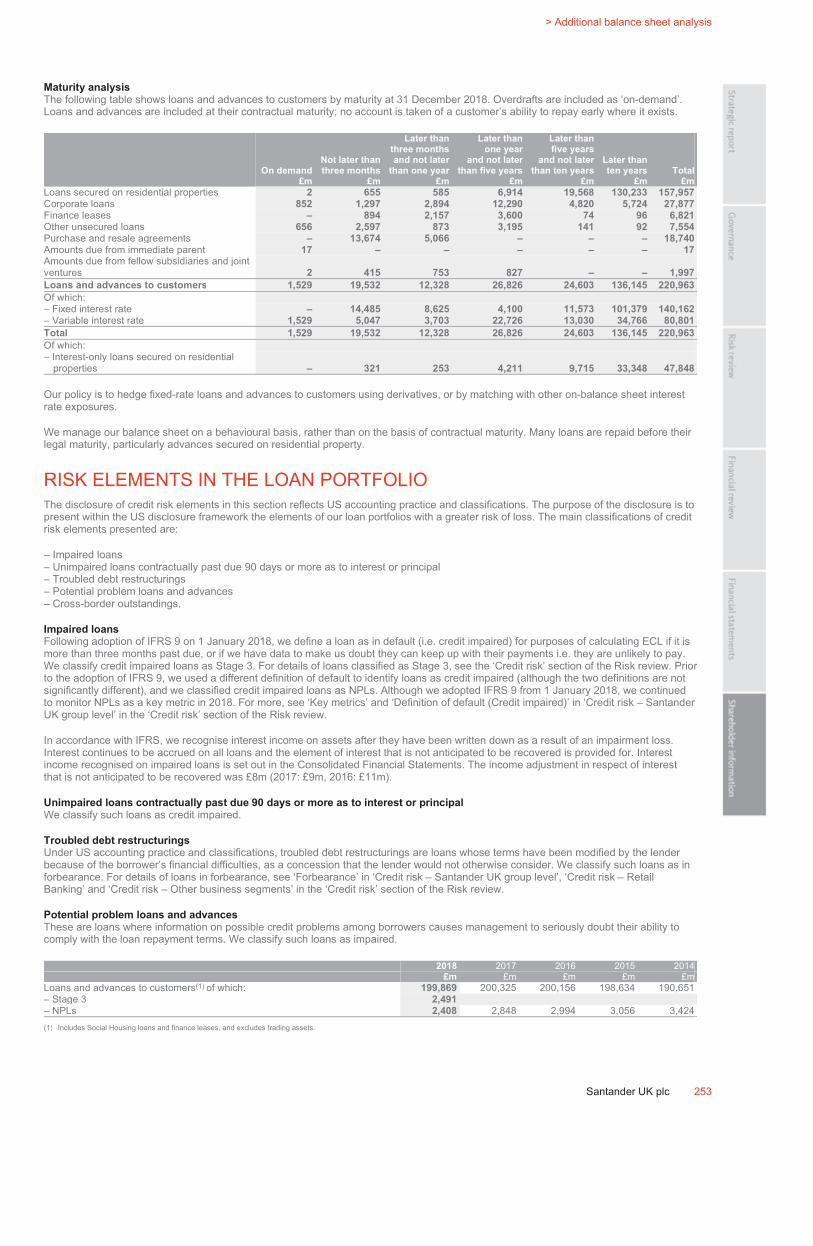
ˆ200G2Mlv!2=$n5M6{Š200G2Mlv!2=$n5M6{
628340 TX 253SANTANDERFORM 20-F (SAN UK PL
04-Mar-2019 02:32 ESTHTMLON
Donnelley Financial EGV shanv1dc 6*ESS 0C
VDI-W7-PFL-160412.9.12.0
bar6
Page 1 of 1
> Additional balance sheet analysis
Santander UK plc 253
Maturity analysis
The following table shows loans and advances to customers by maturity at 31 December 2018. Overdrafts are included as ‘on-demand’.
Loans and advances are included at their contractual maturity; no account is taken of a customer’s ability to repay early where it exists.
On demand
Not later than
three months
Later than
three months
and not later
than one year
Later than
one year
and not later
than five years
Later than
five years
and not later
than ten years
Later than
ten years Total
£m £m £m £m £m £m £m
Loans secured on residential properties 2 655 585 6,914 19,568 130,233 157,957
Corporate loans 852 1,297 2,894 12,290 4,820 5,724 27,877
Finance leases – 894 2,157 3,600 74 96 6,821
Other unsecured loans 656 2,597 873 3,195 141 92 7,554
Purchase and resale agreements – 13,674 5,066 – – – 18,740
Amounts due from immediate parent 17 – – – – – 17
Amounts due from fellow subsidiaries and joint
ventures 2 415 753 827 – – 1,997
Loans and advances to customers 1,529 19,532 12,328 26,826 24,603 136,145 220,963
Of which:
– Fixed interest rate – 14,485 8,625 4,100 11,573 101,379 140,162
– Variable interest rate 1,529 5,047 3,703 22,726 13,030 34,766 80,801
Total 1,529 19,532 12,328 26,826 24,603 136,145 220,963
Of which:
– Interest-only loans secured on residential
properties – 321 253 4,211 9,715 33,348 47,848
Our policy is to hedge fixed-rate loans and advances to customers using derivatives, or by matching with other on-balance sheet interest
rate exposures.
We manage our balance sheet on a behavioural basis, rather than on the basis of contractual maturity. Many loans are repaid before their
legal maturity, particularly advances secured on residential property.
RISK ELEMENTS IN THE LOAN PORTFOLIO
The disclosure of credit risk elements in this section reflects US accounting practice and classifications. The purpose of the disclosure is to
present within the US disclosure framework the elements of our loan portfolios with a greater risk of loss. The main classifications of credit
risk elements presented are:
– Impaired loans
– Unimpaired loans contractually past due 90 days or more as to interest or principal
– Troubled debt restructurings
– Potential problem loans and advances
– Cross-border outstandings.
Impaired loans
Following adoption of IFRS 9 on 1 January 2018, we define a loan as in default (i.e. credit impaired) for purposes of calculating ECL if it is
more than three months past due, or if we have data to make us doubt they can keep up with their payments i.e. they are unlikely to pay.
We classify credit impaired loans as Stage 3. For details of loans classified as Stage 3, see the ‘Credit risk’ section of the Risk review. Prior
to the adoption of IFRS 9, we used a different definition of default to identify loans as credit impaired (although the two definitions are not
significantly different), and we classified credit impaired loans as NPLs. Although we adopted IFRS 9 from 1 January 2018, we continued
to monitor NPLs as a key metric in 2018. For more, see ‘Key metrics’ and ‘Definition of default (Credit impaired)’ in ‘Credit risk – Santander
UK group level’ in the ‘Credit risk’ section of the Risk review.
In accordance with IFRS, we recognise interest income on assets after they have been written down as a result of an impairment loss.
Interest continues to be accrued on all loans and the element of interest that is not anticipated to be recovered is provided for. Interest
income recognised on impaired loans is set out in the Consolidated Financial Statements. The income adjustment in respect of interest
that is not anticipated to be recovered was £8m (2017: £9m, 2016: £11m).
Unimpaired loans contractually past due 90 days or more as to interest or principal
We classify such loans as credit impaired.
Troubled debt restructurings
Under US accounting practice and classifications, troubled debt restructurings are loans whose terms have been modified by the lender
because of the borrower’s financial difficulties, as a concession that the lender would not otherwise consider. We classify such loans as in
forbearance. For details of loans in forbearance, see ‘Forbearance’ in ‘Credit risk – Santander UK group level’, ‘Credit risk – Retail
Banking’ and ‘Credit risk – Other business segments’ in the ‘Credit risk’ section of the Risk review.
Potential problem loans and advances
These are loans where information on possible credit problems among borrowers causes management to seriously doubt their ability to
comply with the loan repayment terms. We classify such loans as impaired.
2018 2017 2016 2015 2014
£m £m £m £m £m
Loans and advances to customers(1) of which: 199,869 200,325 200,156 198,634 190,651
– Stage 3 2,491
– NPLs 2,408 2,848 2,994 3,056 3,424
(1) Includes Social Housing loans and finance leases, and excludes trading assets.

ˆ200G2Mlv!2=RVzrg]Š200G2Mlv!2=RVzrg]
628340 TX 254SANTANDERFORM 20-F (SAN UK PL
04-Mar-2019 02:02 ESTHTMLON
Donnelley Financial EGV sraas0dc 6*ESS 0C
VDI-W7-PFL-035112.9.12.0
Page 1 of 1
Annual Report 2018 | Other information for US investors
Cross-border outstandings
The disclosure of cross border outstandings in this section reflects US accounting practice and classifications. Cross border outstandings, as defined by
bank regulatory rules, are amounts payable to us by residents of foreign countries, regardless of the currency in which the claim is denominated, and local
country claims in excess of local country obligations. Cross border outstandings consist mainly of loans and advances to customers and banks, finance
lease debtors, interest-bearing investments and other monetary assets.
In addition to credit risk, cross border outstandings have the risk that, as a result of political or economic conditions in a country, borrowers may be unable
to meet their contractual payment obligations of principal and or interest when due because of the unavailability of, or restrictions on, foreign exchange
needed by borrowers to repay their obligations. These cross border outstandings are controlled through a well-developed system of country limits, which
are reviewed to avoid concentrations of transfer, economic or political risks.
For more on our country risk exposures, see ‘Country risk exposures’ in the ‘Credit risk’ section of the Risk review.
(i) Cross border outstandings exceeding 1% of total assets
At 31 December 2018, 2017 and 2016 cross border outstandings exceeding 1% of total assets were as follows:
2018
Governments
and official
institutions
£bn
Banks and other
financial
institutions
£bn
Other
£bn
Total
£bn
US 1.1 3.0 0.2 4.3
Japan 3.8 2.6 – 6.4
Ireland – 12.3 0.4 12.7
2017
US 6.4 10.5 0.1 17.0
Japan 3.0 2.8 0.8 6.6
Spain – 4.8 0.1 4.9
France 0.3 2.2 2.2 4.7
2016
US 5.0 13.1 0.1 18.2
Japan 2.8 3.3 1.4 7.5
(ii) Cross border outstandings between 0.75% and 1% of total assets
At 31 December 2018, 2017 and 2016, cross border outstandings between 0.75% and 1% of total assets were as follows:
Governments
and official
institutions
Banks and
other financial
institutions Other Total
2018£bn £bn £bn £bn
Spain – 2.5 0.2 2.7
2017
Germany – 2.8 0.1 2.9
2016
Spain – 2.5 0.2 2.7
Luxembourg – 2.3 0.3 2.6
Germany – 2.5 – 2.5
France 0.4 2.0 0.1 2.5
(iii) Cross border outstandings between 0.5% and 0.75% of total assets
At 31 December 2018, 2017 and 2016, cross border outstandings between 0.5% and 0.75% of total assets were as follows:
Governments
and official
institutions
Banks and
other financial
institutions Other Total
2018£bn £bn £bn £bn
Germany – 1.6 – 1.6
2017
Ireland – 1.3 0.8 2.1
Netherlands – 0.6 1.2 1.8
Luxembourg – 1.3 0.4 1.7
There were no cross border outstandings between 0.5% and 0.75% of total assets at 31 December 2016.
254 Santander UK plc

ˆ200G2Mlv!2a7dKP6+Š200G2Mlv!2a7dKP6+
628340 TX 255SANTANDERFORM 20-F (SAN UK PL
04-Mar-2019 02:40 ESTHTMLON
Donnelley Financial EGV shanv1dc 6*ESS 0C
VDI-W7-PFL-160412.9.12.0
bar6
Page 1 of 1
> Additional balance sheet analysis
Santander UK plc 255
Credit impairment loss allowances on loans and advances to customers
An analysis of impairment loss allowances on loans and advances to customers is presented below.
2018 2017 2016 2015 2014
£m £m £m £m £m
Total credit impairment loss allowances:
– Loans secured on residential properties 234 225 279 424 579
– Corporate loans 226 490 382 395 558
– Finance leases 85 46 45 20 30
– Other unsecured advances 206 179 215 269 248
Total credit impairment loss allowances 751 940 921 1,108 1,415
Movements in credit impairment loss allowances on loans and advances to customers
An analysis of movements in impairment loss allowances on loans and advances to customers is presented below.
2018 2017 2016 2015 2014
£m £m £m £m £m
Credit impairment loss allowances at 31 December 940 921 1,108 1,415 1,538
Adoption of IFRS 9 (see Note 1 to the Consolidated Financial Statements) 211
Reallocation of ECL on off balance sheet exposures(1) (50)
Credit impairment loss allowances at 1 January 1,101 921 1,108 1,415 1,538
Amounts written off:
– Loans secured on residential properties (17) (17) (29) (32) (56)
– Corporate loans (355) (64) (72) (157) (150)
– Finance leases (23) (19) (22) (30) (14)
– Other unsecured advances (144) (138) (196) (244) (272)
Total amounts written off (539) (238) (319) (463) (492)
Credit impairment losses (released)/charged against profit:
– Loans secured on residential properties (18) (37) (116) (123) 42
– Corporate loans 17 172 59 (6) 75
– Finance leases 51 20 47 20 17
– Other unsecured advances 139 102 142 265 235
Total credit impairment losses charged against profit 189 257 132 156 369
Credit impairment loss allowances at 31 December 751 940 921 1,108 1,415
(1) This relates to ECL on off-balance sheet exposures following the adoption of a methodology to enable their separate identification from ECL on drawn exposures.
% % % % %
Ratio of amounts written off to average loans during the year 0.27 0.12 0.15 0.22 0.26
Recoveries, net of collection costs
An analysis of recoveries, net of collection costs is presented below.
2018 2017 2016 2015 2014
£m £m £m £m £m
Loans secured on residential properties 2 3 4 2 3
Corporate loans 1 1 3 3 4
Finance leases 6 6 2 2 2
Other unsecured advances 33 44 56 83 102
Total amount recovered 42 54 65 90 111
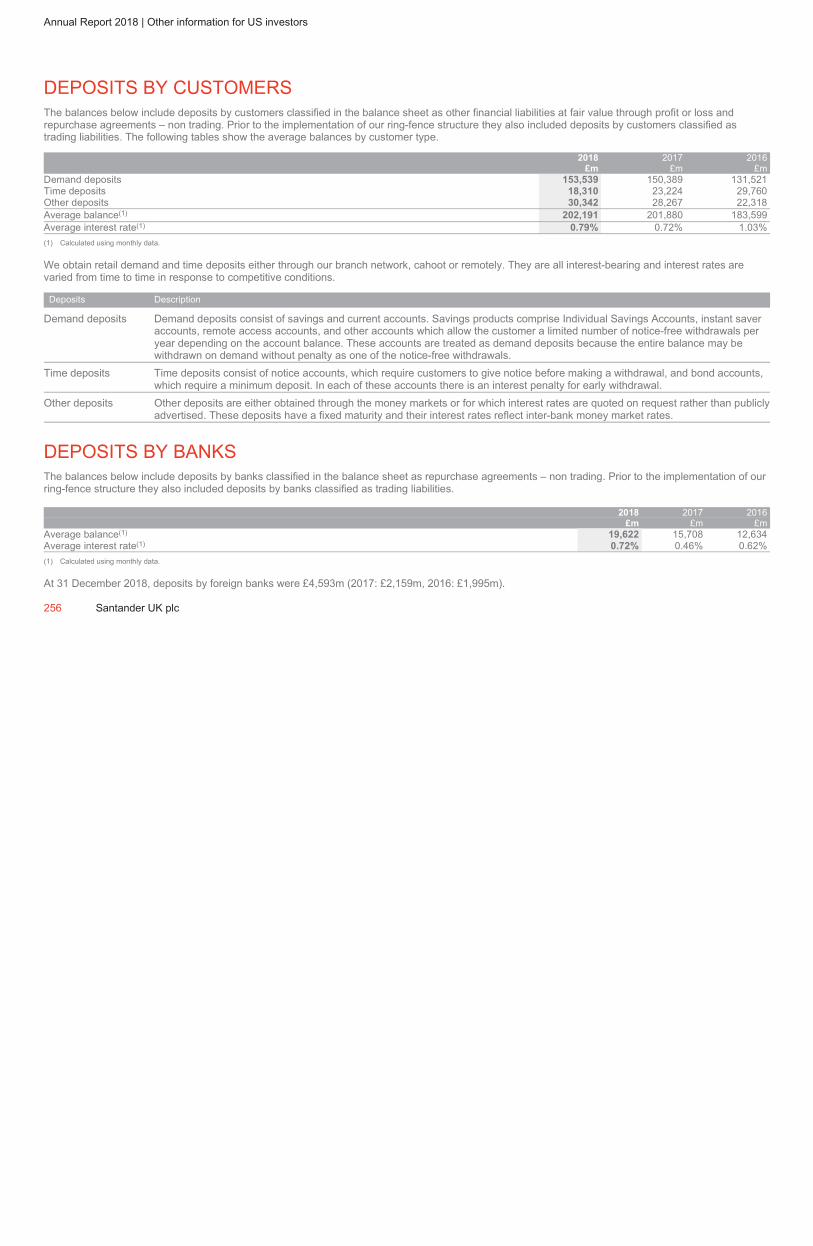
ˆ200G2Mlv!2ZlYe46^Š200G2Mlv!2ZlYe46^
628340 TX 256SANTANDERFORM 20-F (SAN UK PL
04-Mar-2019 01:11 ESTHTMLON
Donnelley Financial EGV annas1dc 3*ESS 0C
VDI-W7-PFD-029812.9.12.0
Page 1 of 1
Annual Report 2018 | Other information for US investors
DEPOSITS BY CUSTOMERS
The balances below include deposits by customers classified in the balance sheet as other financial liabilities at fair value through profit or loss and
repurchase agreements – non trading. Prior to the implementation of our ring-fence structure they also included deposits by customers classified as
trading liabilities. The following tables show the average balances by customer type.
2018 2017 2016
£m £m £m
Demand deposits 153,539 150,389 131,521
Time deposits 18,310 23,224 29,760
Other deposits 30,342 28,267 22,318
Average balance(1)
202,191 201,880 183,599
Average interest rate(1) 0.79% 0.72% 1.03%
(1) Calculated using monthly data.
We obtain retail demand and time deposits either through our branch network, cahoot or remotely. They are all interest-bearing and interest rates are
varied from time to time in response to competitive conditions.
Deposits Description
Demand deposits Demand deposits consist of savings and current accounts. Savings products comprise Individual Savings Accounts, instant saver
accounts, remote access accounts, and other accounts which allow the customer a limited number of notice-free withdrawals per
year depending on the account balance. These accounts are treated as demand deposits because the entire balance may be
withdrawn on demand without penalty as one of the notice-free withdrawals.
Time deposits Time deposits consist of notice accounts, which require customers to give notice before making a withdrawal, and bond accounts,
which require a minimum deposit. In each of these accounts there is an interest penalty for early withdrawal.
Other deposits Other deposits are either obtained through the money markets or for which interest rates are quoted on request rather than publicly
advertised. These deposits have a fixed maturity and their interest rates reflect inter-bank money market rates.
DEPOSITS BY BANKS
The balances below include deposits by banks classified in the balance sheet as repurchase agreements – non trading. Prior to the implementation of our
ring-fence structure they also included deposits by banks classified as trading liabilities.
2018 2017 2016
£m £m £m
Average balance(1)
19,622 15,708 12,634
Average interest rate(1)
0.72% 0.46% 0.62%
(1) Calculated using monthly data.
At 31 December 2018, deposits by foreign banks were £4,593m (2017: £2,159m, 2016: £1,995m).
256 Santander UK plc
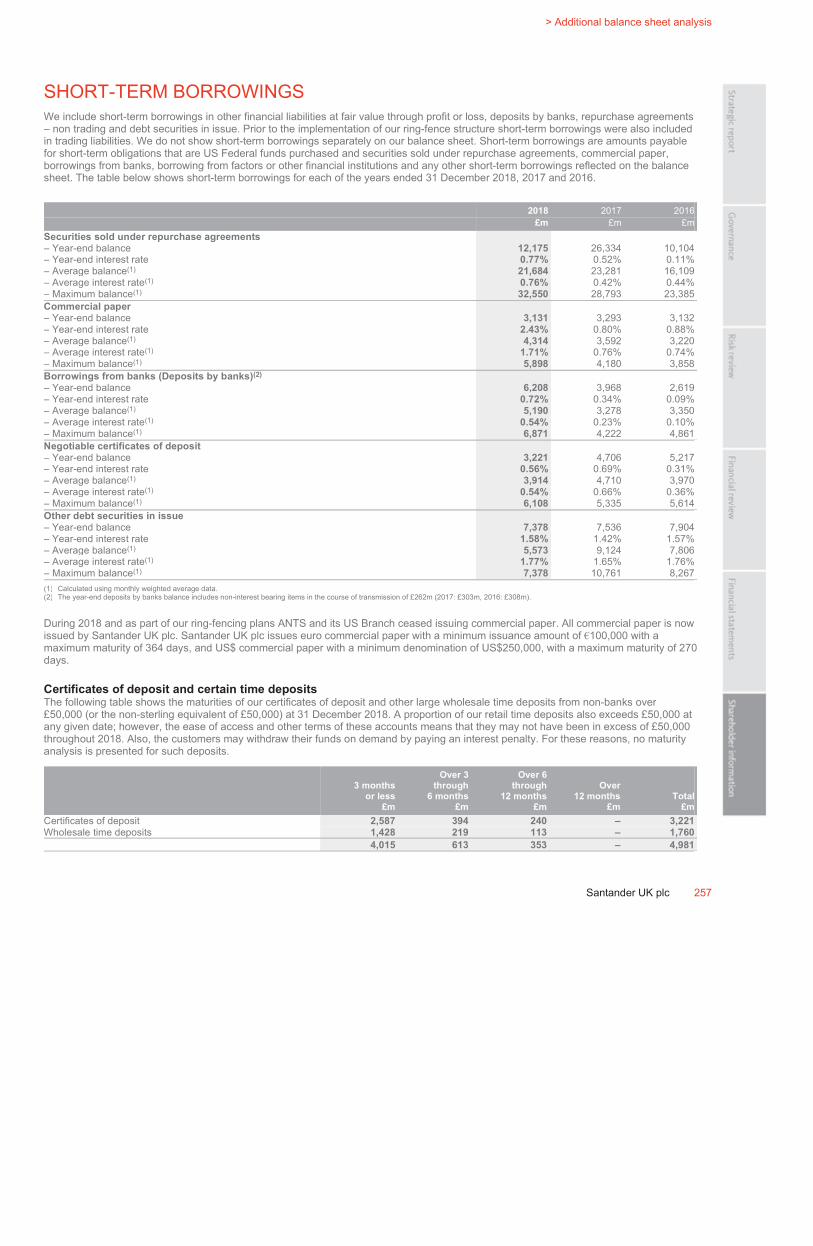
ˆ200G2Mlv!2==ok%g%Š200G2Mlv!2==ok%g%
628340 TX 257SANTANDERFORM 20-F (SAN UK PL
04-Mar-2019 02:07 ESTHTMLON
Donnelley Financial EGV sraas0dc 7*ESS 0C
VDI-W7-PFL-035112.9.12.0
bar6
Page 1 of 1
> Additional balance sheet analysis
Santander UK plc 257
SHORT-TERM BORROWINGS
We include short-term borrowings in other financial liabilities at fair value through profit or loss, deposits by banks, repurchase agreements
– non trading and debt securities in issue. Prior to the implementation of our ring-fence structure short-term borrowings were also included
in trading liabilities. We do not show short-term borrowings separately on our balance sheet. Short-term borrowings are amounts payable
for short-term obligations that are US Federal funds purchased and securities sold under repurchase agreements, commercial paper,
borrowings from banks, borrowing from factors or other financial institutions and any other short-term borrowings reflected on the balance
sheet. The table below shows short-term borrowings for each of the years ended 31 December 2018, 2017 and 2016.
2018 2017 2016
£m £m £m
Securities sold under repurchase agreements
– Year-end balance 12,175 26,334 10,104
– Year-end interest rate 0.77% 0.52% 0.11%
– Average balance(1) 21,684 23,281 16,109
– Average interest rate(1) 0.76% 0.42% 0.44%
– Maximum balance(1) 32,550 28,793 23,385
Commercial paper
– Year-end balance 3,131 3,293 3,132
– Year-end interest rate 2.43% 0.80% 0.88%
– Average balance(1)
4,314 3,592 3,220
– Average interest rate(1) 1.71% 0.76% 0.74%
– Maximum balance(1) 5,898 4,180 3,858
Borrowings from banks (Deposits by banks)(2)
– Year-end balance 6,208 3,968 2,619
– Year-end interest rate 0.72% 0.34% 0.09%
– Average balance(1) 5,190 3,278 3,350
– Average interest rate(1)
0.54% 0.23% 0.10%
– Maximum balance(1)
6,871 4,222 4,861
Negotiable certificates of deposit
– Year-end balance 3,221 4,706 5,217
– Year-end interest rate 0.56% 0.69% 0.31%
– Average balance(1) 3,914 4,710 3,970
– Average interest rate(1) 0.54% 0.66% 0.36%
– Maximum balance(1) 6,108 5,335 5,614
Other debt securities in issue
– Year-end balance 7,378 7,536 7,904
– Year-end interest rate 1.58% 1.42% 1.57%
– Average balance(1)
5,573 9,124 7,806
– Average interest rate(1) 1.77% 1.65% 1.76%
– Maximum balance(1) 7,378 10,761 8,267
(1) Calculated using monthly weighted average data.
(2) The year-end deposits by banks balance includes non-interest bearing items in the course of transmission of £262m (2017: £303m, 2016: £308m).
During 2018 and as part of our ring-fencing plans ANTS and its US Branch ceased issuing commercial paper. All commercial paper is now
issued by Santander UK plc. Santander UK plc issues euro commercial paper with a minimum issuance amount of €100,000 with a
maximum maturity of 364 days, and US$ commercial paper with a minimum denomination of US$250,000, with a maximum maturity of 270
days.
Certificates of deposit and certain time deposits
The following table shows the maturities of our certificates of deposit and other large wholesale time deposits from non-banks over
£50,000 (or the non-sterling equivalent of £50,000) at 31 December 2018. A proportion of our retail time deposits also exceeds £50,000 at
any given date; however, the ease of access and other terms of these accounts means that they may not have been in excess of £50,000
throughout 2018. Also, the customers may withdraw their funds on demand by paying an interest penalty. For these reasons, no maturity
analysis is presented for such deposits.
3 months
or less
£m
Over 3
through
6 months
£m
Over 6
through
12 months
£m
Over
12 months
£m
Total
£m
Certificates of deposit 2,587 394 240 – 3,221
Wholesale time deposits 1,428 219 113 – 1,760
4,015 613 353 – 4,981

ˆ200G2Mlv!2=9wlRg=Š200G2Mlv!2=9wlRg=
628340 TX 258SANTANDERFORM 20-F (SAN UK PL
04-Mar-2019 01:47 ESTHTMLON
Donnelley Financial EGV sraas0dc 6*ESS 0C
VDI-W7-PFL-035112.9.12.0
Page 1 of 1
Annual Report 2018 | Other information for US investors
CONTRACTUAL OBLIGATIONS
For the amounts and maturities of contractual obligations in respect of guarantees, see Notes 32 and 41 to the Consolidated Financial Statements. Other
contractual obligations, including payments of principal and interest where applicable, are shown in the table below. Interest payments are included in the
maturity column of the interest payments themselves, and are calculated using current interest rates.
Payments due by period
Less than
1 year
£m
1–3 years
£m
3–5 years
£m
More than
5 years
£m
Total
£m
Derivative financial instruments 501 70 11 787 1,369
Deposits by customers(1) 177,641 4,496 1,132 3,839 187,108
Deposits by banks(1) 12,559 9,362 2,269 219 24,409
Debt securities in issue(2) 14,219 18,887 3,757 10,819 47,682
Subordinated liabilities – – 1,173 2,428 3,601
Retirement benefit obligations 266 556 634 9,348 10,804
Operating lease obligations 72 85 29 60 246
Purchase obligations 276 – – – 276
205,534 33,456 9,005 27,500 275,495
(1) Includes deposits by banks and deposits by customers classified in the balance sheet as trading liabilities, other financial liabilities at fair value through profit or loss and financial liabilities at amortised cost (including
repurchase agreements – non trading).
(2) Includes debt securities in issue classified in the balance sheet as trading liabilities and other financial liabilities at fair value through profit or loss.
The table is based on contractual maturities, so it takes no account of call features in our subordinated liabilities. The repayment terms of the debt
securities may be accelerated in line with the covenants in the loan agreements.
For details of deposits by customers, deposits by banks, and repurchase agreements - non trading, see Notes 25, 26 and 27 to the Consolidated Financial
Statements. We have entered into outsourcing contracts where, in some cases, there is no minimum specified spending requirement. In these cases,
anticipated spending volumes have been included in purchase obligations.
Under current conditions, our working capital is expected to be sufficient for our present needs and to pursue our planned business strategies.
OFF-BALANCE SHEET ARRANGEMENTS
In the ordinary course of business, we issue guarantees on behalf of customers. The main guarantees we issue are standby letters of credit and
performance bonds under which we take on credit on behalf of customers when actual funding is not required. This is normally because a third party will
not accept the credit risk of the customer. We include these guarantees in our impairment loss allowance assessment with other forms of credit exposure.
In addition, we give representations, indemnities and warranties on the sale of our subsidiaries, businesses and other assets, as is normal in such activity.
The maximum potential amount of any claims made against these is usually much higher than actual settlements. We make provisions for our best
estimate of the likely outcome, either at the time of sale, or later if we receive more information. See Note 32 to the Consolidated Financial Statements for
more information on our guarantees, commitments and contingencies. See Note 21 to the Consolidated Financial Statements for more information on our
off-balance sheet arrangements.
In the ordinary course of business, we also enter into securitisation transactions as set out in Note 15 to the Consolidated Financial Statements. We
consolidate the securitisation companies and we continue to administer the assets. The securitisation companies provide us with an important source of
long-term funding and/or the ability to manage capital efficiently.
258 Santander UK plc
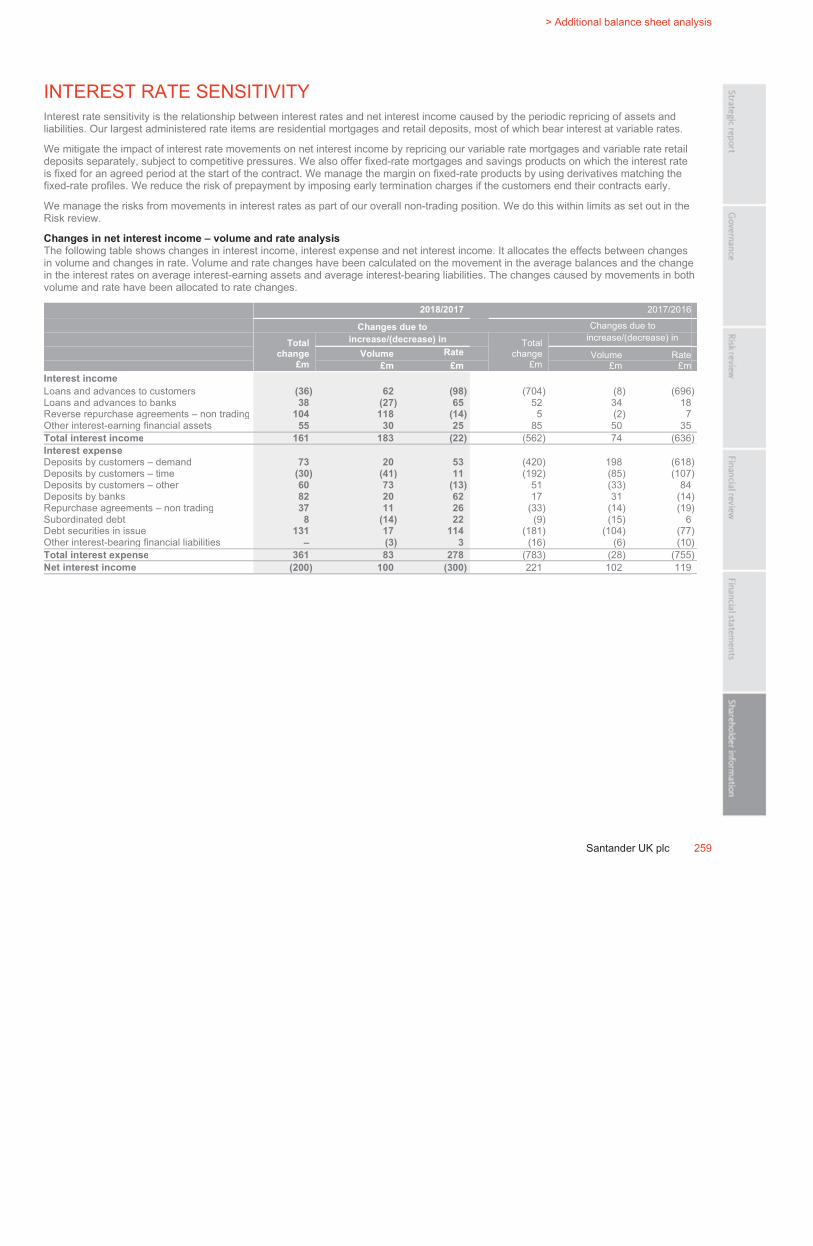
ˆ200G2Mlv!2Z=nl#gyŠ200G2Mlv!2Z=nl#gy
628340 TX 259SANTANDERFORM 20-F (SAN UK PL
04-Mar-2019 00:56 ESTHTMLON
Donnelley Financial EGV marik1dc 7*ESS 0C
VDI-W7-PFL-060212.9.12.0
bar6
Page 1 of 1
> Additional balance sheet analysis
Santander UK plc 259
INTEREST RATE SENSITIVITY
Interest rate sensitivity is the relationship between interest rates and net interest income caused by the periodic repricing of assets and
liabilities. Our largest administered rate items are residential mortgages and retail deposits, most of which bear interest at variable rates.
We mitigate the impact of interest rate movements on net interest income by repricing our variable rate mortgages and variable rate retail
deposits separately, subject to competitive pressures. We also offer fixed-rate mortgages and savings products on which the interest rate
is fixed for an agreed period at the start of the contract. We manage the margin on fixed-rate products by using derivatives matching the
fixed-rate profiles. We reduce the risk of prepayment by imposing early termination charges if the customers end their contracts early.
We manage the risks from movements in interest rates as part of our overall non-trading position. We do this within limits as set out in the
Risk review.
Changes in net interest income – volume and rate analysis
The following table shows changes in interest income, interest expense and net interest income. It allocates the effects between changes
in volume and changes in rate. Volume and rate changes have been calculated on the movement in the average balances and the change
in the interest rates on average interest-earning assets and average interest-bearing liabilities. The changes caused by movements in both
volume and rate have been allocated to rate changes.
2018/2017 2017/2016
Changes due to Changes due to
Total
change
£m
increase/(decrease) in Total
change
£m
increase/(decrease) in
Volume RateVolume Rate
£m £m £m £m
Interest income
Loans and advances to customers (36) 62 (98) (704) (8) (696)
Loans and advances to banks 38 (27) 65 52 34 18
Reverse repurchase agreements – non trading 104 118 (14) 5 (2) 7
Other interest-earning financial assets 55 30 25 85 50 35
Total interest income 161 183 (22) (562) 74 (636)
Interest expense
Deposits by customers – demand 73 20 53 (420) 198 (618)
Deposits by customers – time (30) (41) 11 (192) (85) (107)
Deposits by customers – other 60 73 (13) 51 (33) 84
Deposits by banks 82 20 62 17 31 (14)
Repurchase agreements – non trading 37 11 26 (33) (14) (19)
Subordinated debt 8 (14) 22 (9) (15) 6
Debt securities in issue 131 17 114 (181) (104) (77)
Other interest-bearing financial liabilities – (3) 3 (16) (6) (10)
Total interest expense 361 83 278 (783) (28) (755)
Net interest income (200) 100 (300) 221 102 119
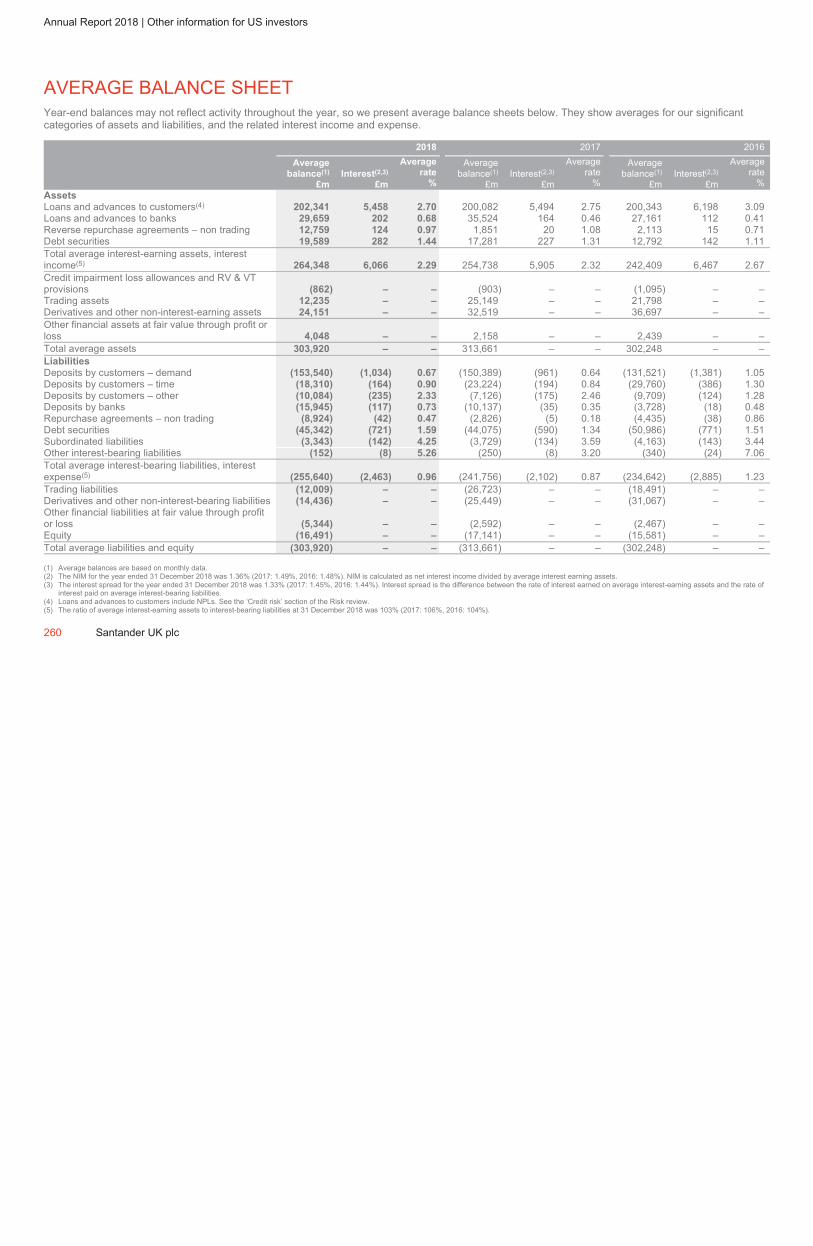
ˆ200G2Mlv!2XXLKxgIŠ200G2Mlv!2XXLKxgI
628340 TX 260SANTANDERFORM 20-F (SAN UK PL
03-Mar-2019 22:17 ESTHTMLON
Donnelley Financial EGV maria0dc 5*ESS 0C
VDI-W7-PFD-020712.9.12.0
Page 1 of 1
Annual Report 2018 | Other information for US investors
AVERAGE BALANCE SHEET
Year-end balances may not reflect activity throughout the year, so we present average balance sheets below. They show averages for our significant
categories of assets and liabilities, and the related interest income and expense.
2018 2017 2016
Average
balance(1)
£m
Interest(2,3)
£m
Average
rate
%
Average
balance(1)
£m
Interest(2,3)
£m
Average
rate
%
Average
balance(1)
£m
Interest(2,3)
£m
Average
rate
%
Assets
Loans and advances to customers(4) 202,341 5,458 2.70 200,082 5,494 2.75 200,343 6,198 3.09
Loans and advances to banks 29,659 202 0.68 35,524 164 0.46 27,161 112 0.41
Reverse repurchase agreements – non trading 12,759 124 0.97 1,851 20 1.08 2,113 15 0.71
Debt securities 19,589 282 1.44 17,281 227 1.31 12,792 142 1.11
Total average interest-earning assets, interest
income(5) 264,348 6,066 2.29 254,738 5,905 2.32 242,409 6,467 2.67
Credit impairment loss allowances and RV & VT
provisions (862) – – (903) – – (1,095) – –
Trading assets 12,235 – – 25,149 – – 21,798 – –
Derivatives and other non-interest-earning assets 24,151 – – 32,519 – – 36,697 – –
Other financial assets at fair value through profit or
loss 4,048 – – 2,158 – – 2,439 – –
Total average assets 303,920 – – 313,661 – – 302,248 – –
Liabilities
Deposits by customers – demand (153,540) (1,034) 0.67 (150,389) (961) 0.64 (131,521) (1,381) 1.05
Deposits by customers – time (18,310) (164) 0.90 (23,224) (194) 0.84 (29,760) (386) 1.30
Deposits by customers – other (10,084) (235) 2.33 (7,126) (175) 2.46 (9,709) (124) 1.28
Deposits by banks (15,945) (117) 0.73 (10,137) (35) 0.35 (3,728) (18) 0.48
Repurchase agreements – non trading (8,924) (42) 0.47 (2,826) (5) 0.18 (4,435) (38) 0.86
Debt securities (45,342) (721) 1.59 (44,075) (590) 1.34 (50,986) (771) 1.51
Subordinated liabilities (3,343) (142) 4.25 (3,729) (134) 3.59 (4,163) (143) 3.44
Other interest-bearing liabilities (152) (8) 5.26 (250) (8) 3.20 (340) (24) 7.06
Total average interest-bearing liabilities, interest
expense(5) (255,640) (2,463) 0.96 (241,756) (2,102) 0.87 (234,642) (2,885) 1.23
Trading liabilities (12,009) – – (26,723) – – (18,491) – –
Derivatives and other non-interest-bearing liabilities (14,436) – – (25,449) – – (31,067) – –
Other financial liabilities at fair value through profit
or loss (5,344) – – (2,592) – – (2,467) – –
Equity (16,491) – – (17,141) – – (15,581) – –
Total average liabilities and equity (303,920) – – (313,661) – – (302,248) – –
(1) Average balances are based on monthly data.
(2) The NIM for the year ended 31 December 2018 was 1.36% (2017: 1.49%, 2016: 1.48%). NIM is calculated as net interest income divided by average interest earning assets.
(3) The interest spread for the year ended 31 December 2018 was 1.33% (2017: 1.45%, 2016: 1.44%). Interest spread is the difference between the rate of interest earned on average interest-earning assets and the rate of
interest paid on average interest-bearing liabilities.
(4) Loans and advances to customers include NPLs. See the ‘Credit risk’ section of the Risk review.
(5) The ratio of average interest-earning assets to interest-bearing liabilities at 31 December 2018 was 103% (2017: 106%, 2016: 104%).
260 Santander UK plc

ˆ200G2Mlv!2=8Zdo6#Š200G2Mlv!2=8Zdo6#
628340 TX 261SANTANDERFORM 20-F (SAN UK PL
04-Mar-2019 01:46 ESTHTMLON
Donnelley Financial EGV gopad0dc 6*ESS 0C
VDI-W7-PFD-037812.9.12.0
bar6
Page 1 of 1
> Taxation for US investors
Santander UK plc 261
Taxation for US investors
The following is a summary, under current law, of the main UK tax considerations relating to the beneficial ownership by a US taxpayer of
the shares of the Company. This summary is provided for general guidance and does not address investors that are subject to special
rules or that do not hold the shares as capital assets. US residents should consult their local tax advisers, particularly in connection with
any potential liability to pay US taxes on disposal, lifetime gift or bequest of their shares.
UK taxation on dividends
Under UK law, income tax is not withheld from dividends paid by UK companies. Shareholders, whether resident in the UK or not, receive
the full amount of the dividend actually declared.
UK taxation on capital gains
Under UK law, when you sell shares you may be liable to pay either capital gains tax or corporation tax on chargeable gains. However if
you are either:
– An individual who is not resident in the UK or
– A company which is not resident in the UK,
you will not be liable to UK tax on any capital gains made on disposal of your shares. The exception is if the shares are held in connection
with a trade or business that is conducted in the UK through a branch or agency (for capital gains tax purposes) or a permanent
establishment (for corporation tax purposes).
UK inheritance tax
Under the current estate and gift tax convention between the US and the UK, shares held by an individual shareholder who is:
– Domiciled for the purposes of the convention in the US and
– Is not for the purposes of the convention a national of the UK
will not be subject to UK inheritance tax on:
– The individual’s death or
– On a gift of the shares during the individual’s lifetime.
The exception is if the shares are part of the business property of a permanent establishment of the individual in the UK or, in the case of a
shareholder who performs independent personal services, pertain to a fixed base situated in the UK.
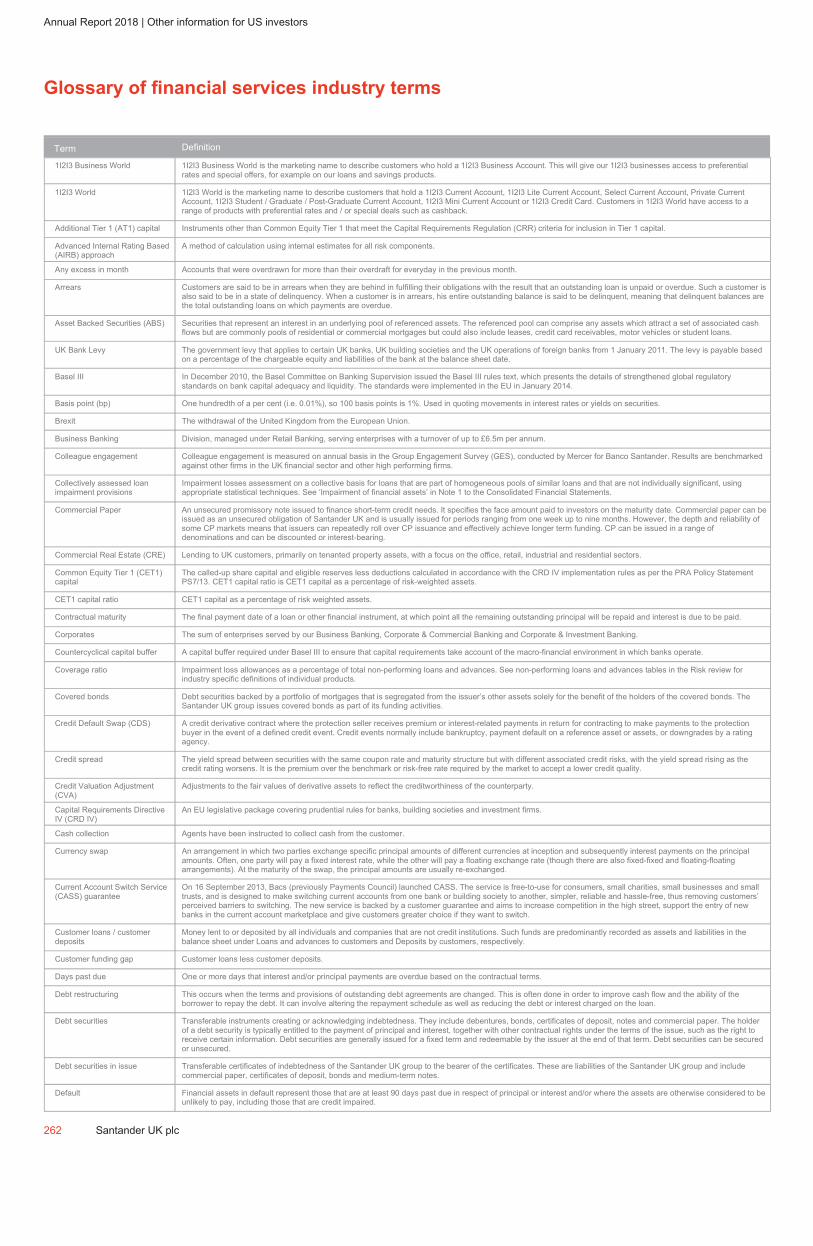
ˆ200G2Mlv!2ap#=Wg<Š200G2Mlv!2ap#=Wg<
628340 TX 262SANTANDERFORM 20-F (SAN UK PL
04-Mar-2019 03:15 ESTHTMLON
Donnelley Financial EGV yuraa0dc 5*ESS 0C
VDI-W7-PFL-143912.9.12.0
Page 1 of 1
Annual Report 2018 | Other information for US investors
Glossary of financial services industry terms
Term Definition
1I2I3 Business World 1I2I3 Business World is the marketing name to describe customers who hold a 1I2I3 Business Account. This will give our 1I2I3 businesses access to preferential
rates and special offers, for example on our loans and savings products.
1I2I3 World 1I2I3 World is the marketing name to describe customers that hold a 1I2I3 Current Account, 1I2I3 Lite Current Account, Select Current Account, Private Current
Account, 1I2I3 Student / Graduate / Post-Graduate Current Account, 1I2I3 Mini Current Account or 1I2I3 Credit Card. Customers in 1I2I3 World have access to a
range of products with preferential rates and / or special deals such as cashback.
Additional Tier 1 (AT1) capital Instruments other than Common Equity Tier 1 that meet the Capital Requirements Regulation (CRR) criteria for inclusion in Tier 1 capital.
Advanced Internal Rating Based
(AIRB) approach
A method of calculation using internal estimates for all risk components.
Any excess in month Accounts that were overdrawn for more than their overdraft for everyday in the previous month.
Arrears Customers are said to be in arrears when they are behind in fulfilling their obligations with the result that an outstanding loan is unpaid or overdue. Such a customer is
also said to be in a state of delinquency. When a customer is in arrears, his entire outstanding balance is said to be delinquent, meaning that delinquent balances are
the total outstanding loans on which payments are overdue.
Asset Backed Securities (ABS) Securities that represent an interest in an underlying pool of referenced assets. The referenced pool can comprise any assets which attract a set of associated cash
flows but are commonly pools of residential or commercial mortgages but could also include leases, credit card receivables, motor vehicles or student loans.
UK Bank Levy The government levy that applies to certain UK banks, UK building societies and the UK operations of foreign banks from 1 January 2011. The levy is payable based
on a percentage of the chargeable equity and liabilities of the bank at the balance sheet date.
Basel III In December 2010, the Basel Committee on Banking Supervision issued the Basel III rules text, which presents the details of strengthened global regulatory
standards on bank capital adequacy and liquidity. The standards were implemented in the EU in January 2014.
Basis point (bp) One hundredth of a per cent (i.e. 0.01%), so 100 basis points is 1%. Used in quoting movements in interest rates or yields on securities.
Brexit The withdrawal of the United Kingdom from the European Union.
Business Banking Division, managed under Retail Banking, serving enterprises with a turnover of up to £6.5m per annum.
Colleague engagement Colleague engagement is measured on annual basis in the Group Engagement Survey (GES), conducted by Mercer for Banco Santander. Results are benchmarked
against other firms in the UK financial sector and other high performing firms.
Collectively assessed loan
impairment provisions
Impairment losses assessment on a collective basis for loans that are part of homogeneous pools of similar loans and that are not individually significant, using
appropriate statistical techniques. See ‘Impairment of financial assets’ in Note 1 to the Consolidated Financial Statements.
Commercial Paper An unsecured promissory note issued to finance short-term credit needs. It specifies the face amount paid to investors on the maturity date. Commercial paper can be
issued as an unsecured obligation of Santander UK and is usually issued for periods ranging from one week up to nine months. However, the depth and reliability of
some CP markets means that issuers can repeatedly roll over CP issuance and effectively achieve longer term funding. CP can be issued in a range of
denominations and can be discounted or interest-bearing.
Commercial Real Estate (CRE) Lending to UK customers, primarily on tenanted property assets, with a focus on the office, retail, industrial and residential sectors.
Common Equity Tier 1 (CET1)
capital
The called-up share capital and eligible reserves less deductions calculated in accordance with the CRD IV implementation rules as per the PRA Policy Statement
PS7/13. CET1 capital ratio is CET1 capital as a percentage of risk-weighted assets.
CET1 capital ratio CET1 capital as a percentage of risk weighted assets.
Contractual maturity The final payment date of a loan or other financial instrument, at which point all the remaining outstanding principal will be repaid and interest is due to be paid.
Corporates The sum of enterprises served by our Business Banking, Corporate & Commercial Banking and Corporate & Investment Banking.
Countercyclical capital buffer A capital buffer required under Basel III to ensure that capital requirements take account of the macro-financial environment in which banks operate.
Coverage ratio Impairment loss allowances as a percentage of total non-performing loans and advances. See non-performing loans and advances tables in the Risk review for
industry specific definitions of individual products.
Covered bonds Debt securities backed by a portfolio of mortgages that is segregated from the issuer’s other assets solely for the benefit of the holders of the covered bonds. The
Santander UK group issues covered bonds as part of its funding activities.
Credit Default Swap (CDS) A credit derivative contract where the protection seller receives premium or interest-related payments in return for contracting to make payments to the protection
buyer in the event of a defined credit event. Credit events normally include bankruptcy, payment default on a reference asset or assets, or downgrades by a rating
agency.
Credit spread The yield spread between securities with the same coupon rate and maturity structure but with different associated credit risks, with the yield spread rising as the
credit rating worsens. It is the premium over the benchmark or risk-free rate required by the market to accept a lower credit quality.
Credit Valuation Adjustment
(CVA)
Adjustments to the fair values of derivative assets to reflect the creditworthiness of the counterparty.
Capital Requirements Directive
IV (CRD IV)
An EU legislative package covering prudential rules for banks, building societies and investment firms.
Cash collection Agents have been instructed to collect cash from the customer.
Currency swap An arrangement in which two parties exchange specific principal amounts of different currencies at inception and subsequently interest payments on the principal
amounts. Often, one party will pay a fixed interest rate, while the other will pay a floating exchange rate (though there are also fixed-fixed and floating-floating
arrangements). At the maturity of the swap, the principal amounts are usually re-exchanged.
Current Account Switch Service
(CASS) guarantee
On 16 September 2013, Bacs (previously Payments Council) launched CASS. The service is free-to-use for consumers, small charities, small businesses and small
trusts, and is designed to make switching current accounts from one bank or building society to another, simpler, reliable and hassle-free, thus removing customers’
perceived barriers to switching. The new service is backed by a customer guarantee and aims to increase competition in the high street, support the entry of new
banks in the current account marketplace and give customers greater choice if they want to switch.
Customer loans / customer
deposits
Money lent to or deposited by all individuals and companies that are not credit institutions. Such funds are predominantly recorded as assets and liabilities in the
balance sheet under Loans and advances to customers and Deposits by customers, respectively.
Customer funding gap Customer loans less customer deposits.
Days past due One or more days that interest and/or principal payments are overdue based on the contractual terms.
Debt restructuring This occurs when the terms and provisions of outstanding debt agreements are changed. This is often done in order to improve cash flow and the ability of the
borrower to repay the debt. It can involve altering the repayment schedule as well as reducing the debt or interest charged on the loan.
Debt securities Transferable instruments creating or acknowledging indebtedness. They include debentures, bonds, certificates of deposit, notes and commercial paper. The holder
of a debt security is typically entitled to the payment of principal and interest, together with other contractual rights under the terms of the issue, such as the right to
receive certain information. Debt securities are generally issued for a fixed term and redeemable by the issuer at the end of that term. Debt securities can be secured
or unsecured.
Debt securities in issue Transferable certificates of indebtedness of the Santander UK group to the bearer of the certificates. These are liabilities of the Santander UK group and include
commercial paper, certificates of deposit, bonds and medium-term notes.
Default Financial assets in default represent those that are at least 90 days past due in respect of principal or interest and/or where the assets are otherwise considered to be
unlikely to pay, including those that are credit impaired.
262 Santander UK plc
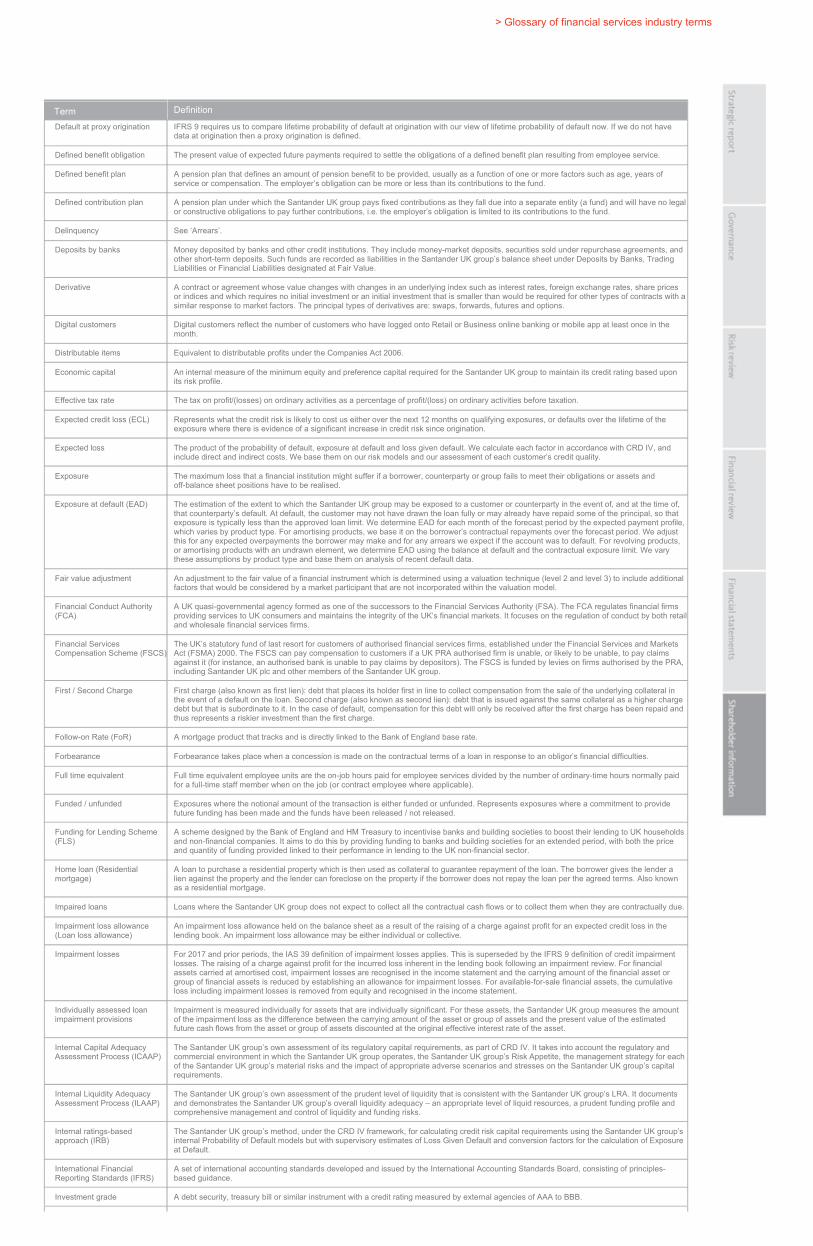
ˆ200G2Mlv!2baypM6DŠ200G2Mlv!2baypM6D
628340 TX 263SANTANDERFORM 20-F (SAN UK PL
04-Mar-2019 04:06 ESTHTMLON
Donnelley Financial EGV shanv1dc 3*ESS 0C
VDI-W7-PFL-160412.9.12.0
bar6
Page 1 of 2
> Glossary of financial services industry terms
Term Definition
Default at proxy origination IFRS 9 requires us to compare lifetime probability of default at origination with our view of lifetime probability of default now. If we do not have
data at origination then a proxy origination is defined.
Defined benefit obligation The present value of expected future payments required to settle the obligations of a defined benefit plan resulting from employee service.
Defined benefit plan A pension plan that defines an amount of pension benefit to be provided, usually as a function of one or more factors such as age, years of
service or compensation. The employer’s obligation can be more or less than its contributions to the fund.
Defined contribution plan A pension plan under which the Santander UK group pays fixed contributions as they fall due into a separate entity (a fund) and will have no legal
or constructive obligations to pay further contributions, i.e. the employer’s obligation is limited to its contributions to the fund.
Delinquency See ‘Arrears’.
Deposits by banks Money deposited by banks and other credit institutions. They include money-market deposits, securities sold under repurchase agreements, and
other short-term deposits. Such funds are recorded as liabilities in the Santander UK group’s balance sheet under Deposits by Banks, Trading
Liabilities or Financial Liabilities designated at Fair Value.
Derivative A contract or agreement whose value changes with changes in an underlying index such as interest rates, foreign exchange rates, share prices
or indices and which requires no initial investment or an initial investment that is smaller than would be required for other types of contracts with a
similar response to market factors. The principal types of derivatives are: swaps, forwards, futures and options.
Digital customers Digital customers reflect the number of customers who have logged onto Retail or Business online banking or mobile app at least once in the
month.
Distributable items Equivalent to distributable profits under the Companies Act 2006.
Economic capital An internal measure of the minimum equity and preference capital required for the Santander UK group to maintain its credit rating based upon
its risk profile.
Effective tax rate The tax on profit/(losses) on ordinary activities as a percentage of profit/(loss) on ordinary activities before taxation.
Expected credit loss (ECL) Represents what the credit risk is likely to cost us either over the next 12 months on qualifying exposures, or defaults over the lifetime of the
exposure where there is evidence of a significant increase in credit risk since origination.
Expected loss The product of the probability of default, exposure at default and loss given default. We calculate each factor in accordance with CRD IV, and
include direct and indirect costs. We base them on our risk models and our assessment of each customer’s credit quality.
Exposure The maximum loss that a financial institution might suffer if a borrower, counterparty or group fails to meet their obligations or assets and
off-balance sheet positions have to be realised.
Exposure at default (EAD) The estimation of the extent to which the Santander UK group may be exposed to a customer or counterparty in the event of, and at the time of,
that counterparty’s default. At default, the customer may not have drawn the loan fully or may already have repaid some of the principal, so that
exposure is typically less than the approved loan limit. We determine EAD for each month of the forecast period by the expected payment profile,
which varies by product type. For amortising products, we base it on the borrower’s contractual repayments over the forecast period. We adjust
this for any expected overpayments the borrower may make and for any arrears we expect if the account was to default. For revolving products,
or amortising products with an undrawn element, we determine EAD using the balance at default and the contractual exposure limit. We vary
these assumptions by product type and base them on analysis of recent default data.
Fair value adjustment An adjustment to the fair value of a financial instrument which is determined using a valuation technique (level 2 and level 3) to include additional
factors that would be considered by a market participant that are not incorporated within the valuation model.
Financial Conduct Authority
(FCA)
A UK quasi-governmental agency formed as one of the successors to the Financial Services Authority (FSA). The FCA regulates financial firms
providing services to UK consumers and maintains the integrity of the UK’s financial markets. It focuses on the regulation of conduct by both retail
and wholesale financial services firms.
Financial Services
Compensation Scheme (FSCS)
The UK’s statutory fund of last resort for customers of authorised financial services firms, established under the Financial Services and Markets
Act (FSMA) 2000. The FSCS can pay compensation to customers if a UK PRA authorised firm is unable, or likely to be unable, to pay claims
against it (for instance, an authorised bank is unable to pay claims by depositors). The FSCS is funded by levies on firms authorised by the PRA,
including Santander UK plc and other members of the Santander UK group.
First / Second Charge First charge (also known as first lien): debt that places its holder first in line to collect compensation from the sale of the underlying collateral in
the event of a default on the loan. Second charge (also known as second lien): debt that is issued against the same collateral as a higher charge
debt but that is subordinate to it. In the case of default, compensation for this debt will only be received after the first charge has been repaid and
thus represents a riskier investment than the first charge.
Follow-on Rate (FoR) A mortgage product that tracks and is directly linked to the Bank of England base rate.
Forbearance Forbearance takes place when a concession is made on the contractual terms of a loan in response to an obligor’s financial difficulties.
Full time equivalent Full time equivalent employee units are the on-job hours paid for employee services divided by the number of ordinary-time hours normally paid
for a full-time staff member when on the job (or contract employee where applicable).
Funded / unfunded Exposures where the notional amount of the transaction is either funded or unfunded. Represents exposures where a commitment to provide
future funding has been made and the funds have been released / not released.
Funding for Lending Scheme
(FLS)
A scheme designed by the Bank of England and HM Treasury to incentivise banks and building societies to boost their lending to UK households
and non-financial companies. It aims to do this by providing funding to banks and building societies for an extended period, with both the price
and quantity of funding provided linked to their performance in lending to the UK non-financial sector.
Home loan (Residential
mortgage)
A loan to purchase a residential property which is then used as collateral to guarantee repayment of the loan. The borrower gives the lender a
lien against the property and the lender can foreclose on the property if the borrower does not repay the loan per the agreed terms. Also known
as a residential mortgage.
Impaired loans Loans where the Santander UK group does not expect to collect all the contractual cash flows or to collect them when they are contractually due.
Impairment loss allowance
(Loan loss allowance)
An impairment loss allowance held on the balance sheet as a result of the raising of a charge against profit for an expected credit loss in the
lending book. An impairment loss allowance may be either individual or collective.
Impairment losses For 2017 and prior periods, the IAS 39 definition of impairment losses applies. This is superseded by the IFRS 9 definition of credit impairment
losses. The raising of a charge against profit for the incurred loss inherent in the lending book following an impairment review. For financial
assets carried at amortised cost, impairment losses are recognised in the income statement and the carrying amount of the financial asset or
group of financial assets is reduced by establishing an allowance for impairment losses. For available-for-sale financial assets, the cumulative
loss including impairment losses is removed from equity and recognised in the income statement.
Individually assessed loan
impairment provisions
Impairment is measured individually for assets that are individually significant. For these assets, the Santander UK group measures the amount
of the impairment loss as the difference between the carrying amount of the asset or group of assets and the present value of the estimated
future cash flows from the asset or group of assets discounted at the original effective interest rate of the asset.
Internal Capital Adequacy
Assessment Process (ICAAP)
The Santander UK group’s own assessment of its regulatory capital requirements, as part of CRD IV. It takes into account the regulatory and
commercial environment in which the Santander UK group operates, the Santander UK group’s Risk Appetite, the management strategy for each
of the Santander UK group’s material risks and the impact of appropriate adverse scenarios and stresses on the Santander UK group’s capital
requirements.
Internal Liquidity Adequacy
Assessment Process (ILAAP)
The Santander UK group’s own assessment of the prudent level of liquidity that is consistent with the Santander UK group’s LRA. It documents
and demonstrates the Santander UK group’s overall liquidity adequacy – an appropriate level of liquid resources, a prudent funding profile and
comprehensive management and control of liquidity and funding risks.
Internal ratings-based
approach (IRB)
The Santander UK group’s method, under the CRD IV framework, for calculating credit risk capital requirements using the Santander UK group’s
internal Probability of Default models but with supervisory estimates of Loss Given Default and conversion factors for the calculation of Exposure
at Default.
International Financial
Reporting Standards (IFRS)
A set of international accounting standards developed and issued by the International Accounting Standards Board, consisting of principles-
based guidance.
Investment grade A debt security, treasury bill or similar instrument with a credit rating measured by external agencies of AAA to BBB.

ˆ200G2Mlv!2baypM6DŠ200G2Mlv!2baypM6D
628340 TX 263SANTANDERFORM 20-F (SAN UK PL
04-Mar-2019 04:06 ESTHTMLON
Donnelley Financial EGV shanv1dc 3*ESS 0C
VDI-W7-PFL-160412.9.12.0
bar6
Page 2 of 2
Santander UK plc 263
ISDA Master agreement Standardised contract developed by ISDA (International Swaps and Derivatives Association) used as an umbrella under which bilateral
derivatives contracts are entered into.
Lending to corporates The sum of our Business banking, Corporate & Commercial Banking and Corporate & Investment Banking loan balances.
Level 1 The fair value of these financial instruments is based on unadjusted quoted prices for identical assets or liabilities in an active market that the
Santander UK group has the ability to access at the measurement date.
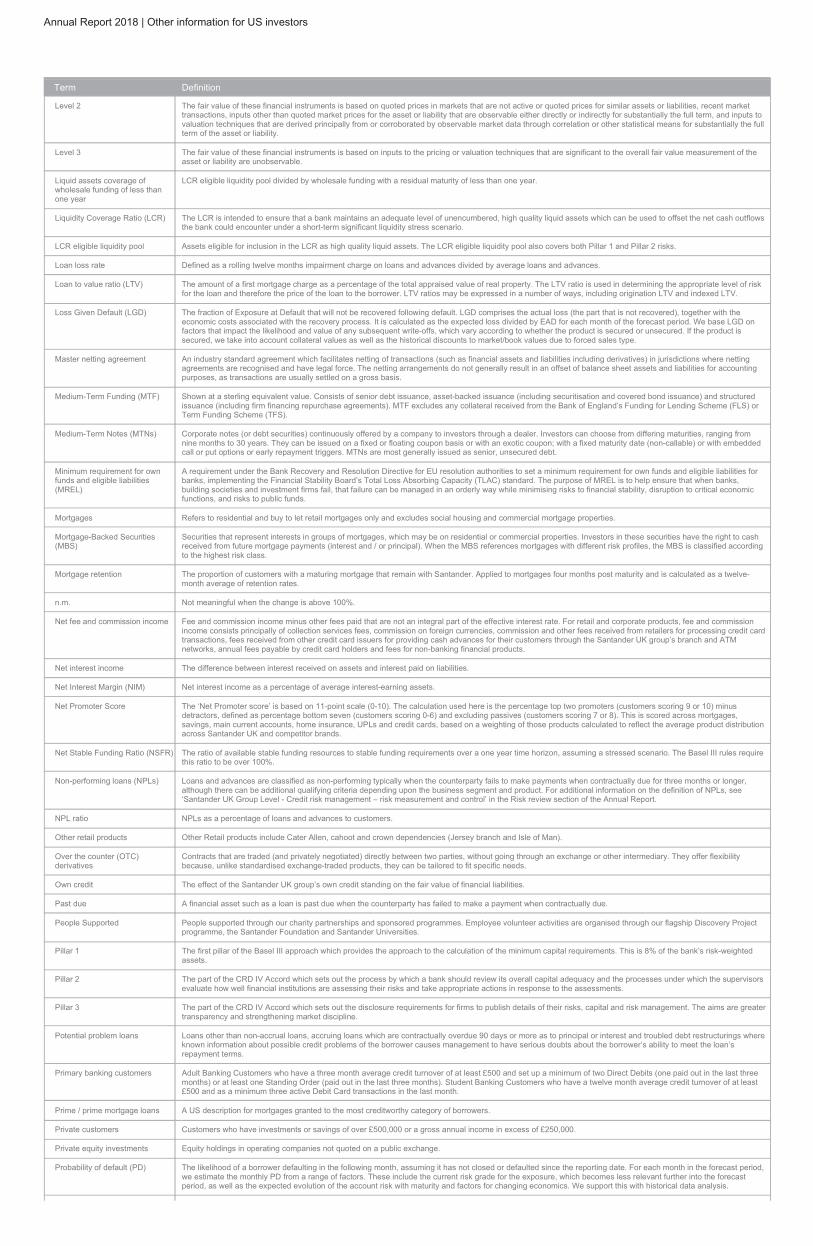
ˆ200G2Mlv!2asxsp6jŠ200G2Mlv!2asxsp6j
628340 TX 264SANTANDERFORM 20-F (SAN UK PL
04-Mar-2019 03:18 ESTHTMLON
Donnelley Financial EGV yuraa0dc 4*ESS 0C
VDI-W7-PFL-143912.9.12.0
Page 1 of 2
Annual Report 2018 | Other information for US investors
Term Definition
Level 2 The fair value of these financial instruments is based on quoted prices in markets that are not active or quoted prices for similar assets or liabilities, recent market
transactions, inputs other than quoted market prices for the asset or liability that are observable either directly or indirectly for substantially the full term, and inputs to
valuation techniques that are derived principally from or corroborated by observable market data through correlation or other statistical means for substantially the full
term of the asset or liability.
Level 3 The fair value of these financial instruments is based on inputs to the pricing or valuation techniques that are significant to the overall fair value measurement of the
asset or liability are unobservable.
Liquid assets coverage of
wholesale funding of less than
one year
LCR eligible liquidity pool divided by wholesale funding with a residual maturity of less than one year.
Liquidity Coverage Ratio (LCR) The LCR is intended to ensure that a bank maintains an adequate level of unencumbered, high quality liquid assets which can be used to offset the net cash outflows
the bank could encounter under a short-term significant liquidity stress scenario.
LCR eligible liquidity pool Assets eligible for inclusion in the LCR as high quality liquid assets. The LCR eligible liquidity pool also covers both Pillar 1 and Pillar 2 risks.
Loan loss rate Defined as a rolling twelve months impairment charge on loans and advances divided by average loans and advances.
Loan to value ratio (LTV) The amount of a first mortgage charge as a percentage of the total appraised value of real property. The LTV ratio is used in determining the appropriate level of risk
for the loan and therefore the price of the loan to the borrower. LTV ratios may be expressed in a number of ways, including origination LTV and indexed LTV.
Loss Given Default (LGD) The fraction of Exposure at Default that will not be recovered following default. LGD comprises the actual loss (the part that is not recovered), together with the
economic costs associated with the recovery process. It is calculated as the expected loss divided by EAD for each month of the forecast period. We base LGD on
factors that impact the likelihood and value of any subsequent write-offs, which vary according to whether the product is secured or unsecured. If the product is
secured, we take into account collateral values as well as the historical discounts to market/book values due to forced sales type.
Master netting agreement An industry standard agreement which facilitates netting of transactions (such as financial assets and liabilities including derivatives) in jurisdictions where netting
agreements are recognised and have legal force. The netting arrangements do not generally result in an offset of balance sheet assets and liabilities for accounting
purposes, as transactions are usually settled on a gross basis.
Medium-Term Funding (MTF) Shown at a sterling equivalent value. Consists of senior debt issuance, asset-backed issuance (including securitisation and covered bond issuance) and structured
issuance (including firm financing repurchase agreements). MTF excludes any collateral received from the Bank of England’s Funding for Lending Scheme (FLS) or
Term Funding Scheme (TFS).
Medium-Term Notes (MTNs) Corporate notes (or debt securities) continuously offered by a company to investors through a dealer. Investors can choose from differing maturities, ranging from
nine months to 30 years. They can be issued on a fixed or floating coupon basis or with an exotic coupon; with a fixed maturity date (non-callable) or with embedded
call or put options or early repayment triggers. MTNs are most generally issued as senior, unsecured debt.
Minimum requirement for own
funds and eligible liabilities
(MREL)
A requirement under the Bank Recovery and Resolution Directive for EU resolution authorities to set a minimum requirement for own funds and eligible liabilities for
banks, implementing the Financial Stability Board’s Total Loss Absorbing Capacity (TLAC) standard. The purpose of MREL is to help ensure that when banks,
building societies and investment firms fail, that failure can be managed in an orderly way while minimising risks to financial stability, disruption to critical economic
functions, and risks to public funds.
Mortgages Refers to residential and buy to let retail mortgages only and excludes social housing and commercial mortgage properties.
Mortgage-Backed Securities
(MBS)
Securities that represent interests in groups of mortgages, which may be on residential or commercial properties. Investors in these securities have the right to cash
received from future mortgage payments (interest and / or principal). When the MBS references mortgages with different risk profiles, the MBS is classified according
to the highest risk class.
Mortgage retention The proportion of customers with a maturing mortgage that remain with Santander. Applied to mortgages four months post maturity and is calculated as a twelve-
month average of retention rates.
n.m. Not meaningful when the change is above 100%.
Net fee and commission income Fee and commission income minus other fees paid that are not an integral part of the effective interest rate. For retail and corporate products, fee and commission
income consists principally of collection services fees, commission on foreign currencies, commission and other fees received from retailers for processing credit card
transactions, fees received from other credit card issuers for providing cash advances for their customers through the Santander UK group’s branch and ATM
networks, annual fees payable by credit card holders and fees for non-banking financial products.
Net interest income The difference between interest received on assets and interest paid on liabilities.
Net Interest Margin (NIM) Net interest income as a percentage of average interest-earning assets.
Net Promoter Score The ‘Net Promoter score’ is based on 11-point scale (0-10). The calculation used here is the percentage top two promoters (customers scoring 9 or 10) minus
detractors, defined as percentage bottom seven (customers scoring 0-6) and excluding passives (customers scoring 7 or 8). This is scored across mortgages,
savings, main current accounts, home insurance, UPLs and credit cards, based on a weighting of those products calculated to reflect the average product distribution
across Santander UK and competitor brands.
Net Stable Funding Ratio (NSFR) The ratio of available stable funding resources to stable funding requirements over a one year time horizon, assuming a stressed scenario. The Basel III rules require
this ratio to be over 100%.
Non-performing loans (NPLs) Loans and advances are classified as non-performing typically when the counterparty fails to make payments when contractually due for three months or longer,
although there can be additional qualifying criteria depending upon the business segment and product. For additional information on the definition of NPLs, see
‘Santander UK Group Level - Credit risk management – risk measurement and control’ in the Risk review section of the Annual Report.
NPL ratio NPLs as a percentage of loans and advances to customers.
Other retail products Other Retail products include Cater Allen, cahoot and crown dependencies (Jersey branch and Isle of Man).
Over the counter (OTC)
derivatives
Contracts that are traded (and privately negotiated) directly between two parties, without going through an exchange or other intermediary. They offer flexibility
because, unlike standardised exchange-traded products, they can be tailored to fit specific needs.
Own credit The effect of the Santander UK group’s own credit standing on the fair value of financial liabilities.
Past due A financial asset such as a loan is past due when the counterparty has failed to make a payment when contractually due.
People Supported People supported through our charity partnerships and sponsored programmes. Employee volunteer activities are organised through our flagship Discovery Project
programme, the Santander Foundation and Santander Universities.
Pillar 1 The first pillar of the Basel III approach which provides the approach to the calculation of the minimum capital requirements. This is 8% of the bank’s risk-weighted
assets.
Pillar 2 The part of the CRD IV Accord which sets out the process by which a bank should review its overall capital adequacy and the processes under which the supervisors
evaluate how well financial institutions are assessing their risks and take appropriate actions in response to the assessments.
Pillar 3 The part of the CRD IV Accord which sets out the disclosure requirements for firms to publish details of their risks, capital and risk management. The aims are greater
transparency and strengthening market discipline.
Potential problem loans Loans other than non-accrual loans, accruing loans which are contractually overdue 90 days or more as to principal or interest and troubled debt restructurings where
known information about possible credit problems of the borrower causes management to have serious doubts about the borrower’s ability to meet the loan’s
repayment terms.
Primary banking customers Adult Banking Customers who have a three month average credit turnover of at least £500 and set up a minimum of two Direct Debits (one paid out in the last three
months) or at least one Standing Order (paid out in the last three months). Student Banking Customers who have a twelve month average credit turnover of at least
£500 and as a minimum three active Debit Card transactions in the last month.
Prime / prime mortgage loans A US description for mortgages granted to the most creditworthy category of borrowers.
Private customers Customers who have investments or savings of over £500,000 or a gross annual income in excess of £250,000.
Private equity investments Equity holdings in operating companies not quoted on a public exchange.
Probability of default (PD) The likelihood of a borrower defaulting in the following month, assuming it has not closed or defaulted since the reporting date. For each month in the forecast period,
we estimate the monthly PD from a range of factors. These include the current risk grade for the exposure, which becomes less relevant further into the forecast
period, as well as the expected evolution of the account risk with maturity and factors for changing economics. We support this with historical data analysis.

ˆ200G2Mlv!2asxsp6jŠ200G2Mlv!2asxsp6j
628340 TX 264SANTANDERFORM 20-F (SAN UK PL
04-Mar-2019 03:18 ESTHTMLON
Donnelley Financial EGV yuraa0dc 4*ESS 0C
VDI-W7-PFL-143912.9.12.0
Page 2 of 2Prudential Regulation Authority The UK financial services regulator formed as one of the successors to the FSA. The PRA is part of the Bank of England and is responsible for the prudential
regulation and supervision of
264 Santander UK plc
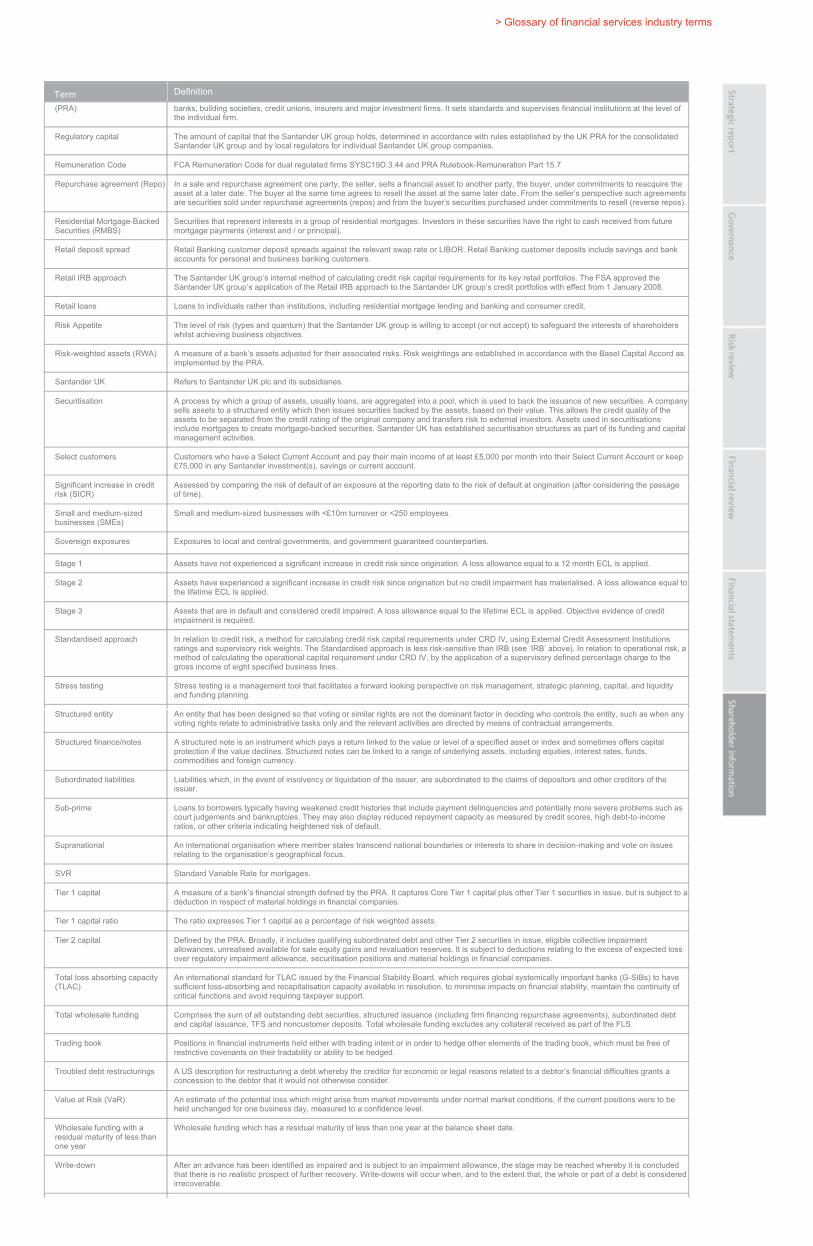
ˆ200G2Mlv!2TS0Zsg1Š200G2Mlv!2TS0Zsg1
628340 TX 265SANTANDERFORM 20-F (SAN UK PL
03-Mar-2019 10:08 ESTHTMLON
Donnelley Financial EGV kumak0dc 2*ESS 0C
VDI-W7-PFL-105912.9.12.0
bar6
Page 1 of 2
> Glossary of financial services industry terms
TermDefinition
(PRA) banks, building societies, credit unions, insurers and major investment firms. It sets standards and supervises financial institutions at the level of
the individual firm.
Regulatory capital The amount of capital that the Santander UK group holds, determined in accordance with rules established by the UK PRA for the consolidated
Santander UK group and by local regulators for individual Santander UK group companies.
Remuneration Code FCA Remuneration Code for dual regulated firms SYSC19D.3.44 and PRA Rulebook-Remuneration Part 15.7
Repurchase agreement (Repo) In a sale and repurchase agreement one party, the seller, sells a financial asset to another party, the buyer, under commitments to reacquire the
asset at a later date. The buyer at the same time agrees to resell the asset at the same later date. From the seller’s perspective such agreements
are securities sold under repurchase agreements (repos) and from the buyer’s securities purchased under commitments to resell (reverse repos).
Residential Mortgage-Backed
Securities (RMBS)
Securities that represent interests in a group of residential mortgages. Investors in these securities have the right to cash received from future
mortgage payments (interest and / or principal).
Retail deposit spread Retail Banking customer deposit spreads against the relevant swap rate or LIBOR. Retail Banking customer deposits include savings and bank
accounts for personal and business banking customers.
Retail IRB approach The Santander UK group’s internal method of calculating credit risk capital requirements for its key retail portfolios. The FSA approved the
Santander UK group’s application of the Retail IRB approach to the Santander UK group’s credit portfolios with effect from 1 January 2008.
Retail loans Loans to individuals rather than institutions, including residential mortgage lending and banking and consumer credit.
Risk Appetite The level of risk (types and quantum) that the Santander UK group is willing to accept (or not accept) to safeguard the interests of shareholders
whilst achieving business objectives.
Risk-weighted assets (RWA) A measure of a bank’s assets adjusted for their associated risks. Risk weightings are established in accordance with the Basel Capital Accord as
implemented by the PRA.
Santander UK Refers to Santander UK plc and its subsidiaries.
Securitisation A process by which a group of assets, usually loans, are aggregated into a pool, which is used to back the issuance of new securities. A company
sells assets to a structured entity which then issues securities backed by the assets, based on their value. This allows the credit quality of the
assets to be separated from the credit rating of the original company and transfers risk to external investors. Assets used in securitisations
include mortgages to create mortgage-backed securities. Santander UK has established securitisation structures as part of its funding and capital
management activities.
Select customers Customers who have a Select Current Account and pay their main income of at least £5,000 per month into their Select Current Account or keep
£75,000 in any Santander investment(s), savings or current account.
Significant increase in credit
risk (SICR)
Assessed by comparing the risk of default of an exposure at the reporting date to the risk of default at origination (after considering the passage
of time).
Small and medium-sized
businesses (SMEs)
Small and medium-sized businesses with <£10m turnover or <250 employees.
Sovereign exposures Exposures to local and central governments, and government guaranteed counterparties.
Stage 1 Assets have not experienced a significant increase in credit risk since origination. A loss allowance equal to a 12 month ECL is applied.
Stage 2 Assets have experienced a significant increase in credit risk since origination but no credit impairment has materialised. A loss allowance equal to
the lifetime ECL is applied.
Stage 3 Assets that are in default and considered credit impaired. A loss allowance equal to the lifetime ECL is applied. Objective evidence of credit
impairment is required.
Standardised approach In relation to credit risk, a method for calculating credit risk capital requirements under CRD IV, using External Credit Assessment Institutions
ratings and supervisory risk weights. The Standardised approach is less risk-sensitive than IRB (see ‘IRB’ above). In relation to operational risk, a
method of calculating the operational capital requirement under CRD IV, by the application of a supervisory defined percentage charge to the
gross income of eight specified business lines.
Stress testing Stress testing is a management tool that facilitates a forward looking perspective on risk management, strategic planning, capital, and liquidity
and funding planning.
Structured entity An entity that has been designed so that voting or similar rights are not the dominant factor in deciding who controls the entity, such as when any
voting rights relate to administrative tasks only and the relevant activities are directed by means of contractual arrangements.
Structured finance/notes A structured note is an instrument which pays a return linked to the value or level of a specified asset or index and sometimes offers capital
protection if the value declines. Structured notes can be linked to a range of underlying assets, including equities, interest rates, funds,
commodities and foreign currency.
Subordinated liabilities Liabilities which, in the event of insolvency or liquidation of the issuer, are subordinated to the claims of depositors and other creditors of the
issuer.
Sub-prime Loans to borrowers typically having weakened credit histories that include payment delinquencies and potentially more severe problems such as
court judgements and bankruptcies. They may also display reduced repayment capacity as measured by credit scores, high debt-to-income
ratios, or other criteria indicating heightened risk of default.
Supranational An international organisation where member states transcend national boundaries or interests to share in decision-making and vote on issues
relating to the organisation’s geographical focus.
SVR Standard Variable Rate for mortgages.
Tier 1 capital A measure of a bank’s financial strength defined by the PRA. It captures Core Tier 1 capital plus other Tier 1 securities in issue, but is subject to a
deduction in respect of material holdings in financial companies.
Tier 1 capital ratio The ratio expresses Tier 1 capital as a percentage of risk weighted assets.
Tier 2 capital Defined by the PRA. Broadly, it includes qualifying subordinated debt and other Tier 2 securities in issue, eligible collective impairment
allowances, unrealised available for sale equity gains and revaluation reserves. It is subject to deductions relating to the excess of expected loss
over regulatory impairment allowance, securitisation positions and material holdings in financial companies.
Total loss absorbing capacity
(TLAC)
An international standard for TLAC issued by the Financial Stability Board, which requires global systemically important banks (G-SIBs) to have
sufficient loss-absorbing and recapitalisation capacity available in resolution, to minimise impacts on financial stability, maintain the continuity of
critical functions and avoid requiring taxpayer support.
Total wholesale funding Comprises the sum of all outstanding debt securities, structured issuance (including firm financing repurchase agreements), subordinated debt
and capital issuance, TFS and noncustomer deposits. Total wholesale funding excludes any collateral received as part of the FLS.
Trading book Positions in financial instruments held either with trading intent or in order to hedge other elements of the trading book, which must be free of
restrictive covenants on their tradability or ability to be hedged.
Troubled debt restructurings A US description for restructuring a debt whereby the creditor for economic or legal reasons related to a debtor’s financial difficulties grants a
concession to the debtor that it would not otherwise consider.
Value at Risk (VaR) An estimate of the potential loss which might arise from market movements under normal market conditions, if the current positions were to be
held unchanged for one business day, measured to a confidence level.
Wholesale funding with a
residual maturity of less than
one year
Wholesale funding which has a residual maturity of less than one year at the balance sheet date.
Write-down After an advance has been identified as impaired and is subject to an impairment allowance, the stage may be reached whereby it is concluded
that there is no realistic prospect of further recovery. Write-downs will occur when, and to the extent that, the whole or part of a debt is considered
irrecoverable.

ˆ200G2Mlv!2TS0Zsg1Š200G2Mlv!2TS0Zsg1
628340 TX 265SANTANDERFORM 20-F (SAN UK PL
03-Mar-2019 10:08 ESTHTMLON
Donnelley Financial EGV kumak0dc 2*ESS 0C
VDI-W7-PFL-105912.9.12.0
bar6
Page 2 of 2
Santander UK plc 265
Wrong-way risk An aggravated form of concentration risk and arises when there is an adverse correlation between the counterparty’s probability of default and
the mark-to-market value of the underlying transaction.
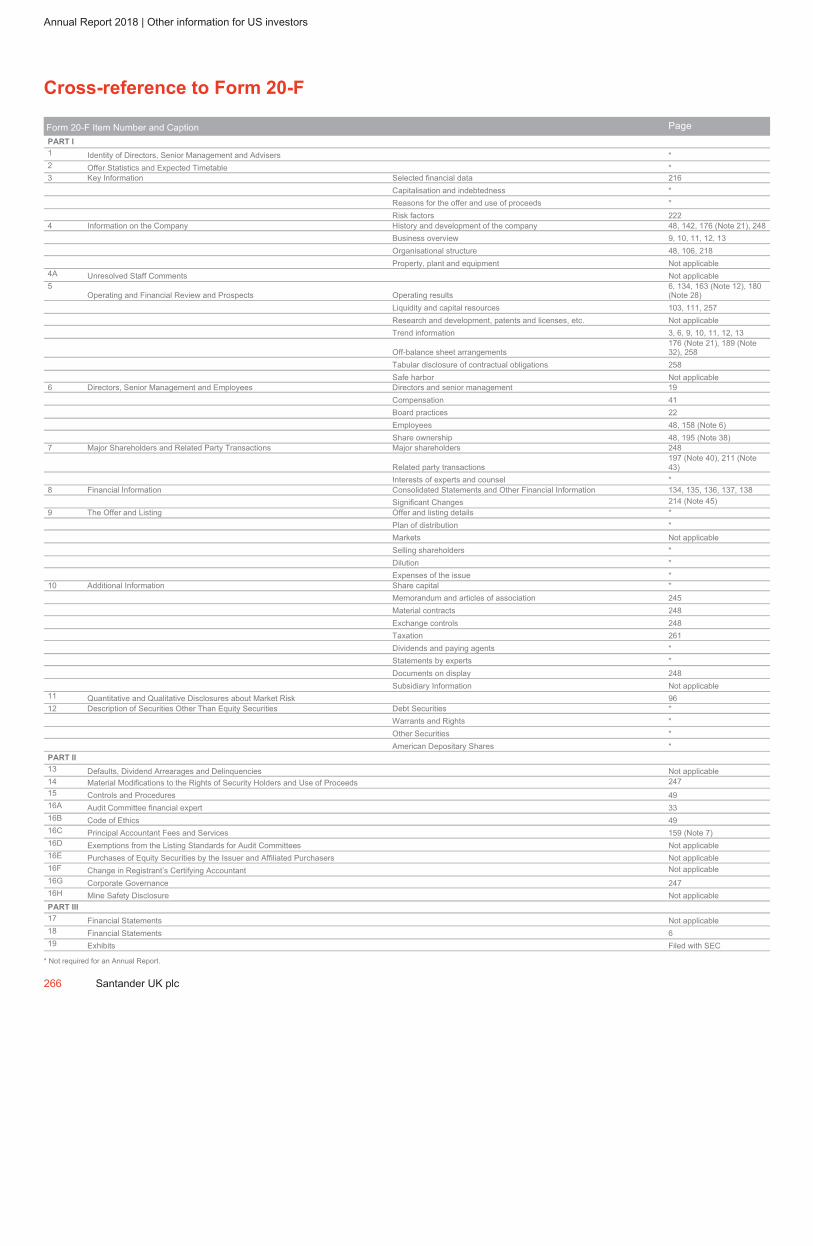
ˆ200G2Mlv!3@Haz3g&Š200G2Mlv!3@Haz3g&
628340 TX 266SANTANDERFORM 20-F (SAN UK PL
08-Mar-2019 08:09 ESTHTMLON
Donnelley Financial EGV beagp0ln 11*ESS 0C
VDI-W7-PFD-004612.9.12.0
Page 1 of 1
Annual Report 2018 | Other information for US investors
Cross-reference to Form 20-F
Form 20-F Item Number and Caption Page
PART I
1Identity of Directors, Senior Management and Advisers *
2Offer Statistics and Expected Timetable *
3 Key Information Selected financial data 216
Capitalisation and indebtedness *
Reasons for the offer and use of proceeds *
Risk factors 222
4 Information on the Company History and development of the company 48, 142, 176 (Note 21), 248
Business overview 9, 10, 11, 12, 13
Organisational structure 48, 106, 218
Property, plant and equipment Not applicable
4AUnresolved Staff Comments Not applicable
5
Operating and Financial Review and Prospects Operating results
6, 134, 163 (Note 12), 180
(Note 28)
Liquidity and capital resources 103, 111, 257
Research and development, patents and licenses, etc. Not applicable
Trend information 3, 6, 9, 10, 11, 12, 13
Off-balance sheet arrangements
176 (Note 21), 189 (Note
32), 258
Tabular disclosure of contractual obligations 258
Safe harbor Not applicable
6 Directors, Senior Management and Employees Directors and senior management 19
Compensation 41
Board practices 22
Employees 48, 158 (Note 6)
Share ownership 48, 195 (Note 38)
7 Major Shareholders and Related Party Transactions Major shareholders 248
Related party transactions
197 (Note 40), 211 (Note
43)
Interests of experts and counsel *
8 Financial Information Consolidated Statements and Other Financial Information 134, 135, 136, 137, 138
Significant Changes 214 (Note 45)
9 The Offer and Listing Offer and listing details *
Plan of distribution *
Markets Not applicable
Selling shareholders *
Dilution *
Expenses of the issue *
10 Additional Information Share capital *
Memorandum and articles of association 245
Material contracts 248
Exchange controls 248
Taxation 261
Dividends and paying agents *
Statements by experts *
Documents on display 248
Subsidiary Information Not applicable
11Quantitative and Qualitative Disclosures about Market Risk 96
12 Description of Securities Other Than Equity Securities Debt Securities *
Warrants and Rights *
Other Securities *
American Depositary Shares *
PART II
13Defaults, Dividend Arrearages and Delinquencies Not applicable
14 Material Modifications to the Rights of Security Holders and Use of Proceeds 247
15Controls and Procedures 49
16AAudit Committee financial expert 33
16BCode of Ethics 49
16CPrincipal Accountant Fees and Services 159 (Note 7)
16DExemptions from the Listing Standards for Audit Committees Not applicable
16EPurchases of Equity Securities by the Issuer and Affiliated Purchasers Not applicable
16FChange in Registrant’s Certifying Accountant Not applicable
16GCorporate Governance 247
16HMine Safety Disclosure Not applicable
PART III
17Financial Statements Not applicable
18Financial Statements 6
19Exhibits Filed with SEC
* Not required for an Annual Report.
266 Santander UK plc
ˆ200G2Mlv!2a#R5@63Š200G2Mlv!2a#R5@63
628340 TX 267SANTANDERFORM 20-F (SAN UK PL
04-Mar-2019 03:27 ESTHTMLON
Donnelley Financial EGV munus0dc 8*ESS 0C
VDI-W7-PFL-141812.9.12.0
endmobileendtab
Page 1 of 1
Further Information
Designed and produced by
CONRAN DESIGN GROUP
Contact us
Customer services
For more information on our products and
services, please visit our website:
santander.co.uk
+44 (0)800 389 7000
Shareholders
Information for UK shareholders of Banco
Santander can be found at our website:
santandershareview.com
By post, please write to:
Santander Nominee Service
Aspect House
Spencer Road
Lancing BN99 6DA
+44 (0)371 384 2000
+44 (0)121 415 7188
(From outside the UK)
Key dates
30 April 2019 Q1 2019 results
24 July 2019 Q2 2019 results
31 October 2019 Q3 2019 results
Community involvement
To find out more about applying for
donations and the Santander UK
Foundation, please visit our website:
santanderfoundation.org.uk
Media centre
Contacts for the media relations team are
available at our website via the media
section:
aboutsantander.co.uk
Investor relations
For financial results and presentations,
stock exchange announcements, credit
ratings and information for debt investors,
please visit the investor relations section
of our website:
aboutsantander.co.uk
Registered address
Santander UK
2 Triton Square
Regent’s Place
London NW1 3AN

ˆ200G2Mlv!2b2tYbgqŠ200G2Mlv!2b2tYbgq
628340 TX 268SANTANDERFORM 20-F (SAN UK PL
04-Mar-2019 03:33 ESTHTMLON
Donnelley Financial EGV munus0dc 6*ESS 0C
VDI-W7-PFL-141812.9.12.0
last
Page 1 of 1
santander.co.uk
Santander UK
2 Triton Square
Regent’s Place
London NW1 3AN

ˆ200G2Mlv!3LF4czgbŠ200G2Mlv!3LF4czgb
628340 EXIND 1SANTANDERFORM 20-F (SAN UK PL
06-Mar-2019 15:19 ESTHTMLON
Donnelley Financial EGV corng0ln 13*ESS 0C
VDI-W7-PFL-024412.9.12.0
Page 1 of 1
EXHIBIT INDEX
Exhibits1
1.1 Articles of Association of Santander UK plc (incorporated by reference to Santander UK plc’s Form 6-K
furnished with the Securities and Exchange Commission on 10 March 2010)
8.1 List of Subsidiaries of Santander UK plc – the list of subsidiaries can be found in ‘Subsidiaries, joint ventures
and associates’ in the Shareholder information section of the Form 20-F
12.1 CEO Certificate pursuant to Section 302 of the Sarbanes-Oxley Act of 2002
12.2 CFO Certificate pursuant to Section 302 of the Sarbanes-Oxley Act of 2002
13.1 Certificate pursuant to Section 906 of the Sarbanes-Oxley Act of 2002
15.1 Consent of PricewaterhouseCoopers LLP2
101.INS* XBRL Instance Document
101.SCH* XBRL Taxonomy Extension Schema Document
101.CAL* XBRL Taxonomy Extension Calculation Linkbase Document
101.DEF* XBRL Taxonomy Extension Definition Linkbase Document
101.LAB* XBRL Taxonomy Extension Label Linkbase Document
101.PRE* XBRL Taxonomy Extension Presentation Linkbase Document
1 Documents concerning Santander UK plc referred to within the Annual Report on Form 20-F for the year ended
31 December, 2018 may be inspected at 2 Triton Square, Regent’s Place, London NW1 3AN, the principal executive
offices and registered address of Santander UK plc.
2 Incorporated by reference into Registration Statement Nos. 333-10232, 333-190509 and 333-213861 on Form F-3.
* In accordance with Rule 402 of Regulation S-T, the information in these exhibits shall not be deemed to be “filed” for
purposes of Section 18 of the Exchange Act, or otherwise subject to the liability of that section, and shall not be
incorporated by reference into any registration statement or other document filed under the Securities Act, or the
Exchange Act, except as shall be expressly set forth by specific reference in such filing.

ˆ200G2Mlv!4TwkCJg}Š200G2Mlv!4TwkCJg}
628340 SIG 1SANTANDERFORM 20-F (SAN UK PL
11-Mar-2019 05:33 ESTHTMLON
Donnelley Financial EGV sring0dc 7*ESS 0C
VDI-W7-PFL-136512.9.12.0
Page 1 of 1
SIGNATURE
The registrant hereby certifies that it meets all the requirements for filing on Form 20-F and that it has duly caused and
authorized the undersigned to sign this annual report on its behalf.
SANTANDER UK plc
By: /s/ Nathan Bostock
Nathan Bostock
Chief Executive Officer
Dated: 11 March, 2019

ˆ200G2Mlv!2NuJMJg#Š200G2Mlv!2NuJMJg#
628340 EX12_1 1SANTANDERFORM 20-F (SAN UK PL
02-Mar-2019 19:56 ESTHTMLON
Donnelley Financial EGV pf_rend 8*ESS 0C
FWPAXE-EGVRS3012.9.12.0
Page 1 of 1
Exhibit 12.1
I, Nathan Bostock, certify that:
1. I have reviewed this annual report on Form 20-F of Santander UK plc;
2. Based on my knowledge, this report does not contain any untrue statement of a material fact or omit to state a material fact
necessary to make the statements made, in light of the circumstances under which such statements were made, not misleading with
respect to the period covered by this report;
3. Based on my knowledge, the financial statements, and other financial information included in this report, fairly present in all
material respects the financial condition, results of operations and cash flows of the company as of, and for, the periods presented
in this report;
4. The company’s other certifying officer and I are responsible for establishing and maintaining disclosure controls and procedures
(as defined in Exchange Act Rules 13a-15(e) and 15d-15(e)) and internal control over financial reporting (as defined in Exchange
Act Rules 13a-15(f) and 15d-15(f)) for the company and have:
(a) Designed such disclosure controls and procedures, or caused such disclosure controls and procedures to be designed
under our supervision, to ensure that material information relating to the company, including its consolidated
subsidiaries, is made known to us by others within those entities, particularly during the period in which this report is
being prepared;
(b) Designed such internal control over financial reporting, or caused such internal control over financial reporting to be
designed under our supervision, to provide reasonable assurance regarding the reliability of financial reporting and the
preparation of financial statements for external purposes in accordance with generally accepted accounting principles;
(c) Evaluated the effectiveness of the company’s disclosure controls and procedures and presented in this report our
conclusions about the effectiveness of the disclosure controls and procedures, as of the end of the period covered by
this report based on such evaluation; and

ˆ200G2Mlv!4Tx9vi6XŠ200G2Mlv!4Tx9vi6X
628340 EX12_1 2SANTANDERFORM 20-F (SAN UK PL
11-Mar-2019 05:34 ESTHTMLON
Donnelley Financial EGV sring0dc 10*ESS 0C
VDI-W7-PFL-136512.9.12.0
Page 1 of 1
(d) Disclosed in this report any change in the company’s internal control over financial reporting that occurred during the
period covered by the annual report that has materially affected, or is reasonably likely to materially affect, the
company’s internal control over financial reporting; and
5. The company’s other certifying officer and I have disclosed, based on our most recent evaluation of internal control over financial
reporting, to the company’s auditors and the audit committee of the company’s board of directors (or persons performing the
equivalent functions):
(a) All significant deficiencies and material weaknesses in the design or operation of internal control over financial
reporting which are reasonably likely to adversely affect the company’s ability to record, process, summarize and
report financial information; and
(b) Any fraud, whether or not material, that involves management or other employees who have a significant role in the
company’s internal control over financial reporting.
Dated: 11 March, 2019 By: /s/ Nathan Bostock
Nathan Bostock
Chief Executive Officer

ˆ200G2Mlv!2NuQTygiŠ200G2Mlv!2NuQTygi
628340 EX12_2 1SANTANDERFORM 20-F (SAN UK PL
02-Mar-2019 19:56 ESTHTMLON
Donnelley Financial EGV pf_rend 9*ESS 0C
FWPAXE-EGVRS0212.9.12.0
Page 1 of 1
Exhibit 12.2
I, Antonio Roman, certify that:
1. I have reviewed this annual report on Form 20-F of Santander UK plc;
2. Based on my knowledge, this report does not contain any untrue statement of a material fact or omit to state a material fact
necessary to make the statements made, in light of the circumstances under which such statements were made, not misleading with
respect to the period covered by this report;
3. Based on my knowledge, the financial statements, and other financial information included in this report, fairly present in all
material respects the financial condition, results of operations and cash flows of the company as of, and for, the periods presented
in this report;
4. The company’s other certifying officer and I are responsible for establishing and maintaining disclosure controls and procedures
(as defined in Exchange Act Rules 13a-15(e) and 15d-15(e)) and internal control over financial reporting (as defined in Exchange
Act Rules 13a-15(f) and 15d-15(f)) for the company and have:
(a) Designed such disclosure controls and procedures, or caused such disclosure controls and procedures to be designed
under our supervision, to ensure that material information relating to the company, including its consolidated
subsidiaries, is made known to us by others within those entities, particularly during the period in which this report is
being prepared;
(b) Designed such internal control over financial reporting, or caused such internal control over financial reporting to be
designed under our supervision, to provide reasonable assurance regarding the reliability of financial reporting and the
preparation of financial statements for external purposes in accordance with generally accepted accounting principles;
(c) Evaluated the effectiveness of the company’s disclosure controls and procedures and presented in this report our
conclusions about the effectiveness of the disclosure controls and procedures, as of the end of the period covered by
this report based on such evaluation; and

ˆ200G2Mlv!4TxFKQgOŠ200G2Mlv!4TxFKQgO
628340 EX12_2 2SANTANDERFORM 20-F (SAN UK PL
11-Mar-2019 05:34 ESTHTMLON
Donnelley Financial EGV sring0dc 11*ESS 0C
VDI-W7-PFL-136512.9.12.0
Page 1 of 1
(d) Disclosed in this report any change in the company’s internal control over financial reporting that occurred during the
period covered by the annual report that has materially affected, or is reasonably likely to materially affect, the
company’s internal control over financial reporting; and
5. The company’s other certifying officer and I have disclosed, based on our most recent evaluation of internal control over financial
reporting, to the company’s auditors and the audit committee of the company’s board of directors (or persons performing the
equivalent functions):
(a) All significant deficiencies and material weaknesses in the design or operation of internal control over financial
reporting which are reasonably likely to adversely affect the company’s ability to record, process, summarize and
report financial information; and
(b) Any fraud, whether or not material, that involves management or other employees who have a significant role in the
company’s internal control over financial reporting.
Dated: 11 March, 2019 By: /s/ Antonio Roman
Antonio Roman
Chief Financial Officer

ˆ200G2Mlv!4TxWr5guŠ200G2Mlv!4TxWr5gu
628340 EX13_1 1SANTANDERFORM 20-F (SAN UK PL
11-Mar-2019 05:35 ESTHTMLON
Donnelley Financial EGV sring0dc 11*ESS 0C
VDI-W7-PFL-136512.9.12.0
Page 1 of 1
Exhibit 13.1
Annual Certification
Pursuant to Section 906 of the SOx Act of 2002
Pursuant to section 906 of the Sarbanes-Oxley Act of 2002 (subsections (a) and (b) of Section 1350, Chapter 63 of Title 18,
United States Code), each of the undersigned officers of Santander UK plc (the “Company”), does hereby certify, to such officer’s
knowledge, that:
The Annual Report on Form 20-F for the year ended 31 December 2018 (the “Form 20-F”) of the Company fully complies with
the requirements of section 13(a) and 15(d) of the Securities Exchange Act of 1934 and information contained in the Form 20-F fairly
presents, in all material respects, the financial condition and results of operations of the Company.
Dated: 11 March, 2019 By: /s/ Nathan Bostock
Nathan Bostock
Chief Executive Officer
Dated: 11 March, 2019 By: /s/ Antonio Roman
Antonio Roman
Chief Financial Officer

ˆ200G2Mlv!4Txech6FŠ200G2Mlv!4Txech6F
628340 EX15_1 1SANTANDERFORM 20-F (SAN UK PL
11-Mar-2019 05:35 ESTHTMLON
Donnelley Financial EGV sring0dc 11*ESS 0C
VDI-W7-PFL-136512.9.12.0
Page 1 of 1
Exhibit 15.1
Consent of Independent Registered Public Accounting Firm
We hereby consent to the incorporation by reference in Registration Statement on Form F-3 (Nos. 333-10232, 333-190509
and 333-213861) of Santander UK plc of our report dated 11 March, 2019 relating to the financial statements, which appears in this
Form 20-F.
/s/ PRICEWATERHOUSECOOPERS LLP
London, United Kingdom
11 March, 2019