FORM 18-K - KfW Bankengruppe · policies,” and “KfW—Financial Section—Notes to Financial...
213
UNITED STATES SECURITIES AND EXCHANGE COMMISSION Washington, D.C. 20549 FORM 18-K For Foreign Governments and Political Subdivisions Thereof ANNUAL REPORT of KfW (Name of Registrant) Date of end of last fiscal year: December 31, 2009 SECURITIES REGISTERED (As of the close of the fiscal year)* * The registrant files annual reports on Form 18-K on a voluntary basis. Name and address of person authorized to receive notices and communications from the Securities and Exchange Commission: KRYSTIAN CZERNIECKI Sullivan & Cromwell LLP Neue Mainzer Straße 52 60311 Frankfurt am Main, Germany AMOUNT AS TO WHICH REGISTRATION IS NAMES OF EXCHANGES ON TITLE OF ISSUE EFFECTIVE WHICH REGISTERED N/A N/A N/A
Transcript of FORM 18-K - KfW Bankengruppe · policies,” and “KfW—Financial Section—Notes to Financial...

UNITED STATES SECURITIES AND EXCHANGE COMMISSION
Washington, D.C. 20549
FORM 18-K For Foreign Governments and Political Subdivisions Thereof
ANNUAL REPORT of
KfW (Name of Registrant)
Date of end of last fiscal year: December 31, 2009
SECURITIES REGISTERED (As of the close of the fiscal year)*
* The registrant files annual reports on Form 18-K on a voluntary basis.
Name and address of person authorized to receive notices and communications from the Securities and Exchange Commission:
KRYSTIAN CZERNIECKI Sullivan & Cromwell LLP Neue Mainzer Straße 52
60311 Frankfurt am Main, Germany
AMOUNT AS TO WHICH REGISTRATION IS NAMES OF EXCHANGES ON TITLE OF ISSUE EFFECTIVE WHICH REGISTERED
N/A N/A N/A

TABLE OF CONTENTS
SIGNATURESEXHIBIT INDEXExhibit (d)Exhibit (e)Exhibit (f)

EXPLANATORY NOTE
This annual report on Form 18-K for the fiscal year ended December 31, 2009 is filed by KfW, also known as Kreditanstalt für Wiederaufbau, an institution organized under public law of the Federal Republic of Germany (the “Federal Republic”). This annual report on Form 18-K, as subsequently amended, is intended to be incorporated by reference into the prospectus dated April 2, 2009 of KfW and any future prospectus filed by KfW with the Securities and Exchange Commission to the extent such prospectus indicates that it intends this report to be incorporated by reference.
In this annual report, references to “€€ ”, “euro” and “EUR” are to the single European currency of the member States of the European Union participating in the euro, including the Federal Republic of Germany. References to “U.S. dollars”, “$” or “USD” are to United States dollars.
FORM 18–K
-2-
1. In respect of each issue of securities of KfW registered, a brief statement as to:
(a) The general effect of any material modifications, not previously reported, of the rights of the holders of such securities.
Not applicable.
(b) The title and the material provisions of any law, decree or administrative action, not previously reported, by reason of which the security is not being serviced in accordance with the terms thereof.
Not applicable.
(c) The circumstances of any other failure, not previously reported, to pay principal, interest or any sinking fund or amortization installment.
Not applicable.

KFW
As of December 31, 2009, KfW held own debt securities (registered and non-registered) in a principal amount of EUR 9.5 billion. The amount of registered debt securities included in these holdings did not exceed 3% of the total volume of outstanding registered debt securities, and thus, is not substantial.
-3-
2. A statement as of the close of the last fiscal year of KfW giving the total outstanding of:
(a) Internal funded debt of KfW. (Total to be stated in the currency of the registrant. If any internal funded debt is payable in a foreign currency, it should not be included under paragraph (a), but under paragraph (b) of this item.)
The total principal amount of internal funded debt of KfW, which is defined as euro denominated debt with an initial maturity of more than one year (bonds and other fixed-income securities, other borrowings, and subordinated liabilities), outstanding as of December 31, 2009 was EUR 145.4 billion.
(b) External funded debt of KfW. (Totals to be stated in the respective currencies in which payable. No statement need be furnished as to intergovernmental debt.)
For the principal amount of external funded debt of KfW, which is defined as non-euro denominated debt with an initial maturity of more than one year (bonds and other fixed-income securities, other borrowings, and subordinated liabilities), see “KfW—Business—Financial Markets—Funding—Financial-Market Funds—Capital-Market Funding—Information on Issues of Funded Debt of KfW Bankengruppe (as of December 31, 2009),” p. 34 of Exhibit (d), which is hereby incorporated by reference herein.
3. A statement giving the title, date of issue, date of maturity, interest rate and amount outstanding, together with the currency or currencies in which payable, of each issue of funded debt of KfW outstanding as of the close of the last fiscal year of KfW.
See “KfW—Business—Financial Markets—Funding—Financial—Market Funds—Capital-Market Funding—Information on Issues of Funded Debt of KfW Bankengruppe (as of December 31, 2009),” p. 34 of Exhibit (d), which is hereby incorporated by reference herein.
4. (a) As to each issue of securities of KfW which is registered, there should be furnished a breakdown of the total amount outstanding, as shown in Item 3, into the following:
(1) Total amount held by or for the account of KfW.
(2) Total estimated amount held by nationals of the Federal Republic of Germany; this estimate need be furnished only if it is practicable to do so.

Not practicable.
-4-
(3) Total amount otherwise outstanding.
Not applicable.
(b) If a substantial amount is set forth in answer to paragraph (a)(1) above, describe briefly the method employed by KfW to reacquire such securities.
Not applicable.
5. A statement as of the close of the last fiscal year of KfW giving the estimated total of:
(a) Internal floating indebtedness of KfW. (Total to be stated in the currency of the registrant.)
The total principal amount of internal floating indebtedness of KfW, which is defined as euro denominated debt with an initial maturity of one year or less (short-term funds), outstanding as of December 31, 2009 was EUR 6.5 billion.
(b) External floating indebtedness of KfW. (Total to be stated in the respective currencies in which payable.)
The principal amount of external floating indebtedness of KfW, which is defined as non-euro denominated debt with an initial maturity of one year or less (short-term funds), outstanding as of December 31, 2009 was:
Equivalent in euro with Principal amount outstanding conversion rate as ofCurrency in currency December 31, 2009
AUD 409.300.000,00 255.684.657,67CAD 94.100.000,00 62.202.538,34CHF 68.000.000,00 45.834.456,73EGP 925.000.000,00 117.068.898,53GBP 2.107.772.000,00 2.373.349.847,99JPY 300.000.000,00 2.252.928,81NZD 372.500.000,00 44.879.518,06 SEK 236.000.000,00 119.173.862,55SGD 15.000.000,00 7.427.948,90USD 39.072.059.709,56 27.122.073.934,33Total 30.149.948.591,91

See “KfW—Financial Section—Financial Review—Development of Earnings Position,” “KfW—Financial Section—Financial Statements of KfW Bankengruppe—Income Statement;” “KfW—Financial Section—Notes to Financial Statements—Accounting policies,” and “KfW—Financial Section—Notes to Financial Statements—Notes to the Statement of Comprehensive Income,” pp. 49 to 52, 71 and 80 to 112 of Exhibit (d), which are hereby incorporated by reference herein.
Not applicable.
Not applicable.
-5-
6. Statements of the receipts, classified by source, and of the expenditures, classified by purpose, of KfW for each fiscal year of KfW ended since the close of the latest fiscal year for which such information was previously reported. These statements should be so itemized as to be reasonably informative and should cover both ordinary and extraordinary receipts and expenditures; there should be indicated separately, if practicable, the amount of receipts pledged or otherwise specifically allocated to any issue registered, indicating the issue.
7. (a) If any foreign exchange control, not previously reported, has been established by the Federal Republic, briefly describe such foreign exchange control.
No foreign exchange control not previously reported was established by the government of the Federal Republic during 2009.
(b) If any foreign exchange control previously reported has been discontinued or materially modified, briefly describe the effect of any such action, not previously reported.
No foreign exchange control previously reported was discontinued or materially modified by the government of the Federal Republic during 2009.
8. Brief statements as of a date reasonably close to the date of the filing of this report (indicating such date), in respect of the note issue and gold reserves of the central bank of issue of the Registrant, and of any further gold stocks held by the registrant.
9. Statements of imports and exports of merchandise for each year ended since the close of the latest year for which information was previously reported. Such statements should be reasonably itemized so far as practicable as to commodities and as to countries. They should be set forth in terms of value and of weight or quantity; if statistics have been established only in terms of value, such will suffice.
Not applicable.
-6-
10. The balance of international payments of KfW for each year ended since the close of the latest year for which such information was previously reported. The statements of such balances should conform, if possible, to the nomenclature and form used in the “Statistical Handbook of the League of Nations”. (These statements need be furnished only if KfW has published balances of international payments.)

Federal Republic of Germany
See “Tables and Supplementary Information—I. Direct Debt of the Federal Government”, pp. G-34 to G-38 of Exhibit (d), which are hereby incorporated by reference herein.
Not applicable.
-7-
2. A statement as of December 31, 2009 giving the total outstanding of:
(a) Internal funded debt of the Federal Republic. (Total to be stated in the currency of the Federal Republic. If any internal funded debt is payable in a foreign currency, it should not be included under paragraph (a), but under paragraph (b) of this item.)
The total principal amount of internal funded indebtedness of the Federal Republic outstanding as of December 31, 2009 was EUR 1,017.7 billion. (Source: Estimate of the Ministry of Finance of the Federal Republic.) For information on the total debt of the Federal Republic, see “Tables and Supplementary Information—I. Direct Debt of the Federal Government—Summary”, p. G-34 of Exhibit (d), which is hereby incorporated by reference herein.
(b) External funded debt of the Federal Republic. (Totals to be stated in the respective currencies in which payable. No statement need be furnished as to intergovernmental debt.)
As of December 31, 2009, the Federal Republic had external funded non-euro denominated indebtedness of US $9.0 billion, GBP 0.01 billion, SEK 0.02 billion and CHF 0.02 billion.
3. A statement giving the title, date of issue, date of maturity, interest rate and amount outstanding, together with the currency or currencies in which payable, of each issue of funded debt of the Federal Republic outstanding as of the close of the last fiscal year of the Federal Republic.
4. (a) As to each issue of securities of the Federal Republic which is registered, there should be furnished a breakdown of the total amount outstanding as shown in Item 3, into the following:
(1) Total amount held by or for the account of the Federal Republic.

Not applicable.
Not applicable.
Not applicable.
See “The Federal Republic of Germany—Public Finance”, pp. G-27 to G-33 of Exhibit (d), which are hereby incorporated by reference herein.
-8-
(2) Total estimated amount held by nationals of the Federal Republic; this estimate need be furnished only if it is practicable to do so.
(3) Total amount otherwise outstanding.
(b) If a substantial amount is set forth in answer to paragraph (a)(1) above, describe briefly the method employed by the Federal Republic to reacquire such securities.
5. A statement as of the close of the last fiscal year of the Federal Republic giving the estimated total of:
(a) Internal floating indebtedness of the Federal Republic. (Total to be stated in the currency of the Federal Republic.)
The total amount of internal floating indebtedness of the Federal Republic, which is defined as euro denominated debt with an initial maturity of less than one year (Treasury Discount Papers and Schuldscheindarlehen), outstanding as of December 31, 2009 was EUR 103.3 billion. (Source: Estimate of the Ministry of Finance of the Federal Republic.)
(b) External floating indebtedness of the Federal Republic. (Total to be stated in the respective currencies in which payable.)
None.
6. Statements of the receipts, classified by source, and of the expenditures, classified by purpose, of the Federal Republic for each fiscal year of the Federal Republic ended since the close of the latest fiscal year for which such information was previously reported. These statements should be so itemized as to be reasonably informative and should cover both ordinary and extraordinary receipts and expenditures; there should be indicated separately, if practicable, the amount of receipts pledged or otherwise specifically allocated to any issue registered, indicating the issue.

No foreign exchange control not previously reported was established by the Federal Republic during 2009.
See “The Federal Republic of Germany—Monetary and Financial System—Monetary Policy Strategy and Prices” and “The Federal Republic of Germany – Monetary and Financial System—Official Foreign Exchange Reserves,” pp. G-20 to G-21 of Exhibit (d), which are hereby incorporated by reference herein.
See “The Federal Republic of Germany—The Economy—International Economic Relations,” pp. G-16 to G-19 of Exhibit (d), which are hereby incorporated by reference herein.
See “The Federal Republic of Germany—The Economy—International Economic Relations,” pp. G-16 to G-19 of Exhibit (d), which are hereby incorporated by reference herein.
-9-
7. (a) If any foreign exchange control, not previously reported, has been established by the Federal Republic, briefly describe such foreign exchange control.
(b) If any foreign exchange control previously reported has been discontinued or materially modified, briefly describe the effect of any such action, not previously reported.
No foreign exchange control previously reported was discontinued or materially modified during 2009.
8. Brief statements as of a date reasonably close to the date of the filing of this report (indicating such date), in respect of the note issue and gold reserves of the central bank of issue of the Federal Republic, and of any further gold stocks held by the Federal Republic.
9. Statements of imports and exports of merchandise for each year ended since the close of the latest year for which such information was previously reported. The statements should be reasonably itemized so far as practicable as to commodities and as to countries. They should be set forth in terms of value and of weight or quantity; if statistics have been established in terms of value, such will suffice.
10. The balance of international payments of the Federal Republic for each year ended since the close of the latest year for which such information was previously reported. The statements for such balances should conform, if possible, to the nomenclature and form used in the “Statistical Handbook of the League of Nations”. (These statements need be furnished only if the Federal Republic has published balances of international payments.)

This annual report comprises:
This annual report is filed subject to the Instructions for Form 18-K for Foreign Governments and Political Subdivisions thereof.
-10-
(a) Pages numbered 1 to 11, consecutively.
(b) The following exhibits: Exhibit (a) - None. Exhibit (b) - None. Exhibit (c) - The latest annual budget for the Federal Republic of Germany (pp. G-27 to G-33 of Exhibit (d) hereto). Exhibit (d) - Description of KfW and the Federal Republic of Germany, dated May 17, 2010. Exhibit (e) - Consent of KPMG AG Wirtschaftsprüfungsgesellschaft. Exhibit (f) - Consent of the Federal Republic of Germany.

SIGNATURES
Pursuant to the requirements of the Securities and Exchange Act of 1934, the registrant KfW has duly caused this amendment to be signed on its behalf by the undersigned, thereunto duly authorized in Frankfurt/Main, Germany on May 17, 2010, KfW
By: /s/ BERND LOEWEN Name: Bernd Loewen Title: Managing Director By: /s/ Dr. GÜNTHER BRÄUNIG Name: Dr. Günther Bräunig Title: Managing Director
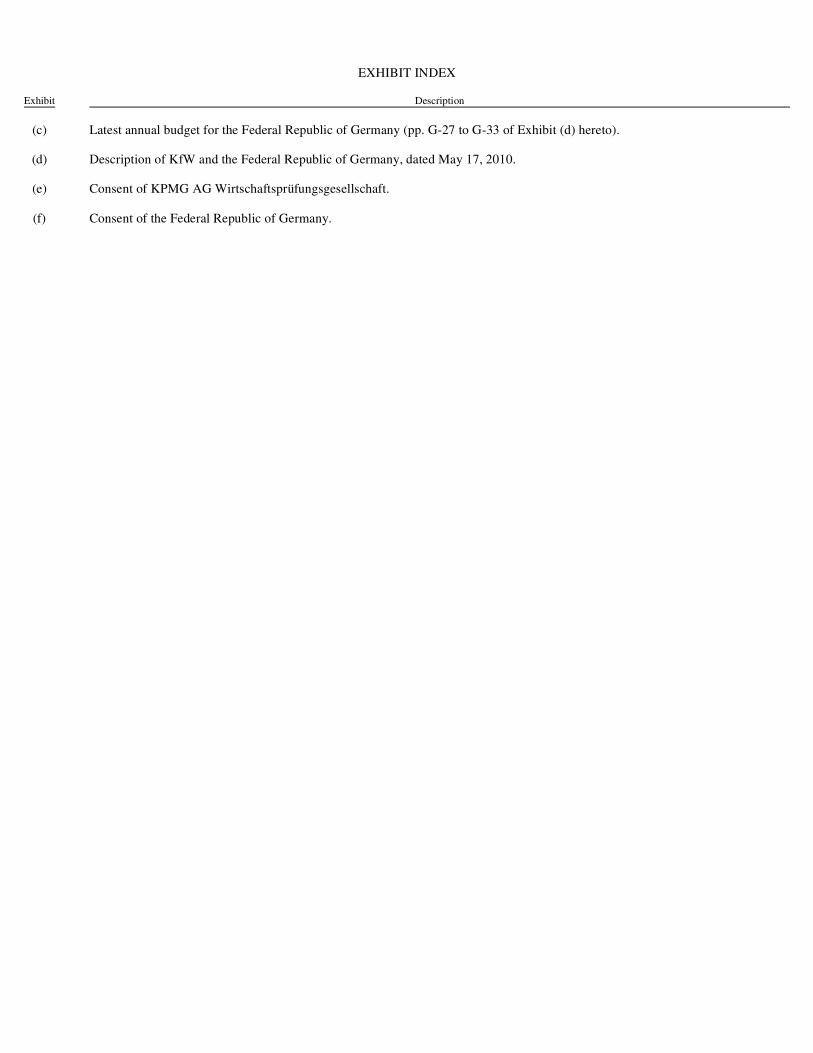
EXHIBIT INDEX Exhibit Description
(c) Latest annual budget for the Federal Republic of Germany (pp. G-27 to G-33 of Exhibit (d) hereto).
(d) Description of KfW and the Federal Republic of Germany, dated May 17, 2010.
(e) Consent of KPMG AG Wirtschaftsprüfungsgesellschaft.
(f) Consent of the Federal Republic of Germany.

Exhibit (d)
This description of KfW and the Federal Republic of Germany is dated May 17, 2010 and appears as Exhibit (d) to the Annual Report on Form 18-K of KfW for the fiscal year ended December 31, 2009.
TABLE OF CONTENTS Page
PRESENTATION OF FINANCIAL AND OTHER INFORMATION 3EXCHANGE RATE INFORMATION 3RECENT DEVELOPMENTS 5
KfW 5KfW’s Results for the Three Months Ended March 31, 2010 5Other Recent Developments 8
The Federal Republic of Germany 9Gross Domestic Product (GDP) 9Inflation Rate 10Unemployment Rate 11Current Account and Foreign Trade 12
KFW 13General 13
Overview 13Ownership 13Legal Status 13Relationship with the Federal Republic 14Corporate Background 16
Business 17Introduction 17Domestic Promotional Business 19KfW Mittelstandsbank (KfW SME Bank) 21KfW Privatkundenbank (KfW Private Client Bank) 22KfW Kommunalbank (KfW Municipal Bank) 23Export and Project Finance (KfW IPEX-Bank) 24Promotion of Developing and Transition Countries 27Financial Markets 30Others 37
Capitalization 38Management and Employees 39Financial Section 42
Financial Statements and Auditors 42Financial Review 43Risk Report 53Financial Statements of KfW Bankengruppe 71Notes to Financial Statements 80Reprint of the Auditor’s Report 157
THE FEDERAL REPUBLIC OF GERMANY G-1General G-1
Area, Location and Population G-1Government G-1Political Parties G-1International Organizations G-2The European Union and European Integration G-2Statistical Disclosure Standards of the International Monetary Fund G-6
The Economy G-7Overview G-7Key Economic Figures G-7Economic Policy G-9Gross Domestic Product G-10Sectors of the Economy G-12Employment and Labor G-13Social Security Legislation and Social Policy G-15

2
Page
International Economic Relations G-16Monetary and Financial System G-20
Background of the European System of Central Banks G-20Monetary Policy Instruments of the ESCB G-20Monetary Policy Strategy and Prices G-20Official Foreign Exchange Reserves G-21External Positions of Banks G-21Foreign Exchange Rates and Controls G-22Financial System G-22Securities Market G-24Policy Response to the Crisis in the Global Financial Markets G-24
Public Finance G-27Receipts and Expenditures G-27Germany’s General Government Deficit/Surplus, the Stability Program and the Excessive Deficit Procedure G-28Tax Structure G-30Government Participations G-32Debt of the Federal Government G-33
Tables and Supplementary Information G-34I. Direct Debt of the Federal Government G-34II. Guarantees by the Federal Government G-38III. Liabilities to International Financial Organizations G-39

THIS DOCUMENT (OTHERWISE THAN AS PART OF A PROSPECTUS CONTAINED IN A REGISTRATION STATEMENT FILED UNDER THE U.S. SECURITIES ACT OF 1933) DOES NOT CONSTITUTE AN OFFER TO SELL OR THE SOLICITATION OF AN OFFER TO BUY ANY SECURITIES OF KFW. THE DELIVERY OF THIS DOCUMENT AT ANY TIME DOES NOT IMPLY THAT THE INFORMATION HEREIN IS CORRECT AS OF ANY TIME SUBSEQUENT TO ITS DATE.
PRESENTATION OF FINANCIAL AND OTHER INFORMATION
In this description, references to “€€ ”, “euro” or “EUR” are to the single European currency of the Member States of the European Union participating in the euro and references to “U.S. dollars”, “$” or “USD” are to United States dollars. See “Exchange Rate Information” below for information regarding the rates of conversion of the euro into United States dollars and “The Federal Republic of Germany—General—The European Union and European Integration” for a discussion of the introduction of the euro.
Unless explicitly stated otherwise, financial information relating to KfW Bankengruppe presented herein has been prepared in accordance with International Financial Reporting Standards as adopted by the European Union (“IFRS”).
Amounts in tables may not add up due to rounding differences.
On May 14, 2010, the euro foreign exchange reference rate as published by the European Central Bank was EUR 1.00 = U.S. dollar 1.2492 (EUR 0.8005 per U.S. dollar).
In this document, references to the “Federal Republic” and “Germany” are to the Federal Republic of Germany and references to the “Federal Government” are to the government of the Federal Republic of Germany. The terms “KfW Bankengruppe” and “group” refer to KfW and its consolidated subsidiaries.
EXCHANGE RATE INFORMATION
We file reports with the Securities and Exchange Commission giving financial and economic data expressed in euro.
The following table shows noon buying rates for euro, expressed as U.S. dollars per EUR 1.00, for the periods and dates indicated, as reported by the Federal Reserve Bank of New York. On January 1, 2009, the Federal Reserve Bank of New York discontinued daily publication of noon buying rates. As of this date, noon buying rates are as published on a weekly basis by the Federal Reserve Bank of New York.
The following table shows the high and low noon buying rates for euro, expressed as U.S. dollars per EUR 1.00, for each month from November 2009 through May 2010 (through May 7, 2010), as reported by the Federal Reserve Bank of New York.
3
Year ended December 31, Period End Average (1) High Low2005 1.1842 1.2400 1.3476 1.16672006 1.3197 1.2661 1.3327 1.18602007 1.4603 1.3797 1.4862 1.29042008 1.3919 1.4673 1.6010 1.24462009 1.4332 1.3955 1.5100 1.2547 Period End Average (1) High LowQuarter ended March 31, 2010 1.3526 1.3685 1.4536 1.3344
(1) The average of the noon buying rates on the last business day of each month during the relevant period.
High Low
2009 November 1.5085 1.4658December 1.5100 1.4243

No representation is made that the euro or U.S. dollar amounts referred to herein or referred to in the documents which incorporate this information by reference could have been or could be converted into U.S. dollars or euro, as the case may be, at any particular rate.
There are, except in limited embargo circumstances, no legal restrictions in the Federal Republic of Germany on international capital movements and foreign exchange transactions. However, for statistical purposes only, every individual or corporation residing in the Federal Republic of Germany must report to the Deutsche Bundesbank, the German Central Bank, subject to a number of exceptions, any payment received from or made to an individual or a corporation resident outside of the Federal Republic of Germany if such payment exceeds EUR 12,500 (or the equivalent in a foreign currency).
4
High Low
2010 January 1.4536 1.3870February 1.3955 1.3476March 1.3758 1.3344April 1.3666 1.3130May (through May 7, 2010) 1.3183 1.2689

RECENT DEVELOPMENTS
KFW
KfW’s Results for the Three Months Ended March 31, 2010
KfW is not required by law to prepare and publish interim financial statements in conformity with International Financial Reporting Standards as adopted by the EU (“IFRS”) applicable to interim financial reporting. Accordingly, KfW only prepares selected interim financial information rather than a full set of interim financial statements. The following information is based on this selected unaudited interim financial information prepared by KfW in accordance with IFRS applicable to interim financial reporting. This information is not necessarily indicative of the figures of KfW Bankengruppe for the full year ending December 31, 2010.
The group’s total assets increased by 4.4%, or EUR 17.6 billion, from EUR 400.1 billion as of December 31, 2009 to EUR 417.7 billion as of March 31, 2010.
The group’s operating result before valuation amounted to EUR 567 million for the three months ended March 31, 2010, compared with EUR 636 million for the same period in 2009(1). The main driver for the group’s operating result before valuation during the first three months in 2010 was high net interest income reflecting favorable funding conditions for KfW. The group’s operating result before valuation is before (1) risk provisions for lending business, (2) net gains/losses from securities and investments, and (3) net gains/losses from hedge accounting and other financial instruments at fair value through profit or loss. These valuation effects amounted to:
The group’s consolidated result for the three months ended March 31, 2010, amounted to EUR 575 million compared to EUR 57 million(1) for the same period in 2009. KfW’s consolidated result for the first quarter of 2009 was characterized by considerable negative valuation effects as a result of the global financial and economic crisis.
5
• Risk provisioning of EUR 123 million;
• Positive effects in an amount of EUR 125 million as market values of securities and equity investments rose further in 2010, thus contributing to profits; and
• Charges in an amount of EUR 53 million due to fair value changes of derivatives used exclusively for hedging purposes in closed risk positions. Economic hedging relationships are recognized through hedge accounting and by using the “fair value option”. However, as not all derivatives are subject to hedge accounting or the “fair value option”, some economic hedging derivatives are reflected in the accounts, although their risk mitigating impact is not reflected in the accounts because the hedged risk associated with the underlying transactions is not recognized in profit or loss under IFRS.
(1) In the first quarter of 2009, the promotional subsidies specified in the ERP-Wirtschaftsplangesetz granted to KfW for the purpose of executing ERP funding were recognized through profit or loss as interest income. In the second quarter of 2009, the accounting policies changed and since then these commitments have been reported as deferred income under other liabilities and only shown as interest income when the underlying promotional expenses from the promotional loans granted are incurred. Due to this methodical change, the figures for the first quarter of 2009 have been adjusted correspondingly.

Promotional Business Volume
The following table sets forth a breakdown of commitments by business areas for the first three months of 2010 as compared with the first three months of 2009.
PROMOTIONAL BUSINESS VOLUME BY BUSINESS AREA
During the first quarter of 2010, KfW’s total promotional business volume increased to EUR 17.8 billion from EUR 11.0 billion during the first quarter of 2009. This significant increase was principally driven by an increase in commitments of KfW Mittelstandsbank, KfW Privatkundenbank and KfW Kommunalbank, which are KfW’s mainly domestic finance operations, as well as in commitments of KfW IPEX-Bank.
Commitments of KfW Mittelstandsbank more than doubled to EUR 7.3 billion in the first quarter of 2010 from EUR 3.4 billion in the same period of 2009. This significant increase was mainly driven by commitments under the KfW Sonderprogramm amounting to EUR 2.7 billion in the first quarter of 2010 compared with EUR 0.3 billion in the same period in 2009. Also contributing to this increase was strong demand for financing under KfW Mittelstandsbank’s environmental investment programs.
Commitments of KfW Privatkundenbank increased to EUR 4.6 billion during the first three months in 2010 compared with EUR 2.6 billion in the same period in 2009. This increase was principally attributable to an increase in loans under KfW’s Privatkundenbank’s housing investment programs.
KfW Kommunalbank’s commitments increased to EUR 3.7 billion in the first quarter of 2010 from EUR 3.2 billion in the same period of 2009. This development resulted primarily from an increase in loan commitments under KfW Kommunalbank’s municipal infrastructure programs.
Commitments in KfW’s export and project finance business made by KfW IPEX-Bank during the three months ended March 31, 2010 amounted to EUR 1.3 billion compared with EUR 1.0 billion for the same period
6
Three months ended March 31, 2010 2009 (EUR in millions)
KfW Mittelstandsbank (1) 7,311 3,438
KfW Privatkundenbank 4,608 2,595
KfW Kommunalbank 3,692 3,229
Export and project finance (KfW IPEX-Bank) 1,326 970
Promotion of developing and transition countries 697 833of which KfW Entwicklungsbank 593 733 of which DEG — Deutsche Investitions- und Entwicklungsgesellschaft mbH 104 100
Financial markets (2) 117 —
of which securitization program commitments — —Others 30 18
Total promotional business volume (3)(4) 17,751 11,000
(1) Commitment figures include EUR 27 million in the first quarter of 2010 under the KfW Sonderprogramm that will not be disbursed due to cancellations and withdrawals which occurred after the contractual loan commitments but on or before March 31, 2010.
(2) Commitments in the first quarter of 2010 include EUR 43 million within the program for the refinancing of export loans and EUR 74 million relating to the ABS portfolio.
(3) Total promotional business volume has been adjusted for commitments of EUR 30 million in the first quarter of 2010 (first quarter 2009: EUR 83 million) made by KfW IPEX-Bank relating to export and project finance and refinanced under certain of KfW Mittelstandsbank’s promotional programs.
(4) Commitments represent the volume of funds committed for loans and other business transactions (with the exception of program-based global loans to Landesförderinstitute) in the relevant year, including amounts to be disbursed in future years, and do not include amounts disbursed in the relevant year pursuant to commitments made in prior years. In the case of program-based global loans to the Landesförderinstitute, commitments represent the actual volume of funds disbursed in the relevant year. Previously, commitments represented the volume of funds committed for loans and other business transactions (with the exception of global loans and global funding facilities) in the relevant year, including amounts to be disbursed in future years, and did not include amounts disbursed in the relevant year pursuant to commitments made in prior years. As a result of the adjustment, commitments for the first quarter of 2009 set forth in the table above differ from the amounts which KfW disclosed previously for the same period.

of 2009. The main drivers were increasing commitments in (1) the energy and environment and (2) the airports and harbors, construction industries sectors.
Commitments made by KfW Entwicklungsbank amounted to EUR 593 million in the first quarter of 2010 compared to EUR 733 million in the first quarter of 2009. This decrease was mainly due to relatively high commitments in the first quarter of 2009.
Commitments of DEG amounted to EUR 104 million in the first quarter of 2010 compared to EUR 100 million in the same period of 2009.
Commitments under KfW’s financial markets business amounted to EUR 117 million in the first quarter of 2010 while there were no commitments in the same period of 2009.
Sources of Funds
The volume of funding raised in the capital markets for the first three months of 2010 was EUR 25.4 billion, of which 38% was raised in euro, 36% in U.S. dollar and the remainder in 15 other currencies.
Capitalization and Indebtedness of KfW Bankengruppe as of March 31, 2010
The capitalization of KfW Bankengruppe as of March 31, 2010 is not necessarily indicative of its capitalization to be recorded as of December 31, 2010.
The increase of EUR 624 million in total equity, which totaled EUR 13,745 million as of March 31, 2010 compared to EUR 13,121 million as of December 31, 2009, reflected (1) an increase of EUR 48 million of revaluation reserves due to valuation profits recognized directly in equity relating to available-for-sale financial assets, and (2) KfW Bankengruppe’s consolidated result of EUR 575 million for the three months ended March 31, 2010.
KfW is not subject to the German Banking Act (Kreditwesengesetz) and the German Solvency Regulation (Solvabilitätsverordnung), which require banks to have adequate own funds (Eigenmittel) for the conduct of their business. However, KfW calculates capital ratios prescribed by these rules on a voluntary basis for internal purposes. KfW applies all material rules in calculating these ratios, with slight modifications for KfW’s promotional core business. According to the calculations based on the results for the three months ended March 31, 2010, KfW’s total capital ratio according to section 2(6) of the German Solvency Regulation amounted to 12.7% and its tier 1 ratio amounted to 10.3% as of March 31, 2010.
7
(EUR in millions)
Borrowings Short-term funds 27,745Bonds and other fixed-income securities 312,587 Other borrowings 29,913Subordinated liabilities (1) 3,247
Total borrowings 373,491
Equity Paid-in subscribed capital (2) 3,300Capital reserve (3) 5,947Reserve from the ERP Special Fund 909Retained earnings 5,330Fund for general banking risks 0Revaluation reserve -242 Balance sheet loss -1,499
Total equity 13,745
Total capitalization 387,236
(1) Includes assets transferred from the ERP Special Fund in form of a subordinated loan of EUR 3,247 million.
(2) KfW’s equity capital, 80% of which is held by the Federal Government and the remaining 20% by the Länder, amounted to EUR 3,750 million as of March 31, 2010, of which EUR 3,300 million has been paid in pro rata by the Federal Government and the Länder.
(3) Includes equity capital in form of a promotional reserve (Förderrücklage) from the ERP Special Fund of EUR 4,650 million.
Other Recent Developments
Involvement of KfW Bankengruppe in Financial Support Measures for Greece
Following a request by the Hellenic Republic, or Greece, on April 23, 2010, the other Euro Area Member States agreed on May 2, 2010 to provide Greece with stability support. The support aims to safeguard financial stability in the euro area as a whole and will be provided in the form of pooled bilateral loans of up to EUR 80 billion. See “The Federal Republic of Germany—General—The European Union and European Integration—Monetary Integration” for more information on the stability support measures for Greece.
On May 8, 2010, the Federal Government mandated KfW in the form of a special mandate pursuant to §2 paragraph 4 of the KfW Law (Zuweisungsgeschäft) to participate on behalf of the Federal Republic in a loan facility to be granted to the Hellenic Republic under the stabilitysupport measures for Greece agreed upon by the Euro Area Member States. Accordingly, KfW committed to participate in a loan facility to the Hellenic Republic in an amount of up to EUR 22.3 billion, representing approximately 27.9% of the total loan facility amount of EUR 80 billion. Disbursements to be made by KfW until May 2011 are currently limited to a total of EUR 8.4 billion. Greece may draw down the full amount during the period ending May 2013. Risks arising for KfW from loans extended under this loan facility are covered by a guarantee of the Federal Republic.
8

THE FEDERAL REPUBLIC OF GERMANY
The following economic information regarding the Federal Republic is derived from the public official documents cited below. Certain of the information is preliminary.
Gross Domestic Product (GDP)
GROSS DOMESTIC PRODUCT
(adjusted for price, seasonal and calendar effects)
The German economy expanded slightly in the first quarter of 2010 compared to the preceding quarter. Thus, the slight upward trend observed since the second quarter of 2009 continued. Economic growth in the first quarter of 2010 was supported by capital formation in machinery and equipment and by exports. Furthermore, the building of inventories and the increase in government final consumption expenditure had a positive impact. Capital formation in construction, final consumption expenditures of households and imports negatively affected growth.
Compared with the first quarter of 2009, GDP in the first quarter of 2010 increased by 1.6% in calendar-adjusted terms (unadjusted figure: +1.7%).
Source: Statistisches Bundesamt, Gross domestic product slightly up in 1st quarter of 2010, press release of May 12, 2010 (http://www.destatis.de/jetspeed/portal/cms/Sites/destatis/Internet/EN/press/pr/2010/05/PE10__170__811,templateId=renderPrint.psml).
9
Percentage change on Percentage change on the same quarter inReference period previous quarter previous year
1st quarter 2009 -3.5 -6.72nd quarter 2009 0.4 -5.8 3rd quarter 2009 0.7 -4.84th quarter 2009 0.2 -2.21st quarter 2010 0.2 1.6

Inflation Rate
INFLATION RATE
(based on overall consumer price index)
The consumer price index for Germany rose by 1.0% in April 2010 compared to April 2009. This increase was slightly lower than the price increase in March 2010 compared with March 2009 (+1.1%). As in the previous months, the increase in April 2010 was mainly due to an increase in prices of energy (+5.2%).
The increase in prices of mineral oil products (+19.5% - of which heating oil: +32.9% and motor fuels: +16.4%) had a particularly strong impact on the increase in April 2010. Excluding the prices of mineral oil products, the inflation rate in April 2010 compared to April 2009 would have been 0.3%. While prices of electricity also increased (+2.5%), prices of gas (-9.8%) and central and remote heating (-13.0%) decreased.
Food prices increased by 1.5% in April 2010 compared to April 2009, which was mainly due to an increase in prices of vegetables (+8.9%), fruits (+6.3%) and oils and fats (+5.7%). Price decreases were recorded for dairy products (-2.7%).
The slight decrease of 0.1% in the consumer price index from April 2010 to March 2010 was mainly due to seasonal price decreases which more than offset price increases for energy (+1.3%) and food (+0.8%).
Source: Statistisches Bundesamt, Consumer prices in April 2010: +1.0% on April 2009, press release of May 11, 2010 (http://www.destatis.de/jetspeed/portal/cms/Sites/destatis/Internet/EN/press/pr/2010/05/PE10__166__611,templateId=renderPrint.psml).
10
Percentage change on previous Percentage change on the same Reference period month month in previous year
April 2009 0.0 0.7May 2009 -0.1 0.0June 2009 0.4 0.1July 2009 0.0 -0.5August 2009 0.2 0.0 September 2009 -0.4 -0.3October 2009 0.1 0.0November 2009 -0.1 0.4December 2009 0.8 0.9January 2010 -0.6 0.8February 2010 0.4 0.6March 2010 0.5 1.1 April 2010 -0.1 1.0

Unemployment Rate
UNEMPLOYMENT RATE
(percent of unemployed persons in the total labor force according to the International Labour Organization (ILO) definition) (1)
The number of employed persons decreased by approximately 138,000, or 0.3%, in March 2010 compared to March 2009. Compared to February 2010, the number of employed persons in March 2010 increased by approximately 12,000 after elimination of seasonal variations.
The seasonally adjusted number of unemployed persons in March 2010 decreased by approximately 50,000, or 1.7%, compared to March 2009. Compared to February 2010, the seasonally adjusted number of unemployed persons in March 2010 decreased by approximately 30,000, or 1.0%. Sources: Statistisches Bundesamt, Employment in March 2010: Decline in employment slowing down (http://www.destatis.de/jetspeed/portal/cms/Sites/destatis/Internet/EN/Content/Statistics/Arbeitsmarkt/ILOArbeitsmarktstatistik/Aktuell,templateId=renderPrint.psml); Statistisches Bundesamt, ILO labour market statistics, Unemployment rates (http://www.destatis.de/jetspeed/portal/cms/Sites/destatis/Internet/EN/Content/Statistics/TimeSeries/EconomicIndicators/LabourMarket/Content100/arb430a,templateId=renderPrint.psml); Statistisches Bundesamt, Notes on the ILO labour market statistics from reference month September 2007 (http://www.destatis.de/jetspeed/portal/cms/Sites/destatis/Internet/EN/Content/Statistics/Arbeitsmarkt/ILOArbeitsmarktstatistik/Hinweise__ILO,templateId=renderPrint.psml); Statistisches Bundesamt, ILO labour market statistics, Unemployment, Unemployment rate, Seasonally and calendar adjusted figures (estimation) (http://www.destatis.de/jetspeed/portal/cms/Sites/destatis/Internet/EN/Content/Statistics/TimeSeries/EconomicIndicators/LabourMarket/Content75/arb422a,templateId=renderPrint).
11
Reference period Original percentages Seasonally adjusted percentages (2)
March 2009 7.8 7.4April 2009 7.7 7.6May 2009 7.4 7.6 June 2009 7.5 7.6July 2009 7.6 7.6August 2009 7.7 7.6September 2009 7.3 7.5October 2009 7.0 7.5November 2009 7.1 7.5December 2009 7.2 7.4 January 2010 7.9 7.4February 2010 7.9 7.4March 2010 7.5 7.3
(1) Starting with the press release of the Federal Statistical Office dated October 30, 2007, the Federal Statistical Office’s telephone survey “Labour market in Germany”, which had been in use since January 2005 and was discontinued in April 2007, was replaced by the EU-wide harmonized labour force survey as the source of information for, among other things, the monthly ILO unemployment data. While the overall unemployment level according to the new method is higher, the methodological change has not resulted in significant differences in terms of trends.
(2) As the time series available following the methodological change described in footnote (1) is not long enough to permit for seasonal adjustments, the seasonally adjusted results will for some time be estimated using data of the Federal Employment Agency (Bundesagentur für Arbeit) on the seasonally adjusted monthly number of registered unemployed. A time series of sufficient length for direct seasonal adjustment is expected to be available in 2011 at the earliest, because stable monthly data are available only from January 2007 and the time series should span at least four years.

Current Account and Foreign Trade
CURRENT ACCOUNT AND FOREIGN TRADE
Source: Statistisches Bundesamt, German exports in March 2010: +23.3% on March 2009, press release of May 10, 2010 (http://www.destatis.de/jetspeed/portal/cms/Sites/destatis/Internet/EN/press/pr/2010/05/PE10__164__51,templateId=renderPrint.psml).
12
(balance in EUR billion)Item January to March 2010 January to March 2009
Foreign trade 37.8 27.5Services -1.5 -1.3Factor income (net) 11.2 11.9Current transfers -13.4 -12.9Supplementary trade items -2.4 -2.7
Current account 31.7 22.6

KFW
GENERAL
Overview
KfW is a public law institution (Anstalt des öffentlichen Rechts) serving domestic and international public policy objectives of the Federal Government (“Federal Government”) of the Federal Republic of Germany (“Federal Republic”). KfW promotes its financing activities under the umbrella brand name KfW Bankengruppe. It conducts its business in the following business areas:
As of December 31, 2009, KfW held total assets of EUR 400.1 billion, including loans and advances of EUR 317.7 billion. KfW’s promotional business volume amounted to EUR 63.9 billion in 2009, of which EUR 62.3 billion, or 98%, represented financing commitments and EUR 1.5 billion, or 2%, represented securitization commitments.
KfW’s offices are located at Palmengartenstraße 5-9, 60325 Frankfurt am Main, Federal Republic of Germany. KfW’s telephone number is 011-49-69-74310. KfW also maintains branch offices in Berlin and Bonn, Germany, as well as a liaison office to the European Union in Brussels, Belgium.
Ownership
The Federal Republic holds 80% of KfW’s capital, and the German federal states (each, a “Land” and together, the “Länder”) hold the remaining 20%. Shares in KfW’s capital may not be pledged or transferred to entities other than the Federal Republic or the Länder. Capital contributions have been, and are expected to continue to be, made to KfW in such proportions as to maintain the relative shares of capital held by the Federal Republic and the Länder.
Legal Status
KfW is organized under the Law Concerning KfW (Gesetz über die Kreditanstalt für Wiederaufbau, or the “KfW Law”) as a public law institution with unlimited duration. As a public law institution serving public policy objectives of the Federal Government, KfW itself is not subject to corporate taxes (although certain of its subsidiaries are) and as a promotional bank does not seek to maximize profits. KfW does, however, seek to maintain an overall level of profitability that allows it to strengthen its equity base in order to support its promotional activities and to grow the volume of its business. KfW is prohibited from distributing profits, which are instead allocated to statutory
13
• KfW Mittelstandsbank (KfW SME Bank) promotes small and medium-sized enterprises (“SMEs”), business founders, start-ups and self-employed professionals;
• KfW Privatkundenbank (KfW Private Client Bank) provides housing-related loans and grants as well as financing for education to private individuals;
• KfW Kommunalbank (KfW Municipal Bank) offers financing for infrastructure projects, primarily for municipalities, and grants global funding instruments to promotional institutions of the German federal states (Landesförderinstitute);
• Export and project finance: KfW IPEX-Bank offers customized financing for exports and project and corporate financing worldwide. KfW IPEX-Bank has been, since January 1, 2008, a legally independent entity wholly owned by KfW;
• Promotion of developing and transition countries: KfW Entwicklungsbank (KfW Development Bank) is responsible for KfW’s public sector development cooperation activities, and DEG-Deutsche Investitions- und Entwicklungsgesellschaft (German Investment and Development Company) finances private-sector investments in developing countries. DEG is a legally independent entity wholly owned by KfW; and
• Financial markets, which comprises KfW’s treasury, funding, securitization and other capital markets-related activities.

and special reserves. KfW is also prohibited from taking deposits, conducting current account business or dealing in securities for the account of others.
Relationship with the Federal Republic
Guarantee of the Federal Republic
The KfW Law expressly provides that the Federal Republic guarantees all existing and future obligations of KfW in respect of money borrowed, bonds and notes issued and derivative transactions entered into by KfW, as well as obligations of third parties that are expressly guaranteed by KfW (KfW Law, Article 1a). Under this statutory guarantee (the “Guarantee of the Federal Republic”), if KfW fails to make any payment of principal or interest or any other amount required to be paid with respect to securities issued by KfW, or if KfW fails to make any payment required to be made under KfW’s guarantee when that payment is due and payable, the Federal Republic will be liable at all times for that payment as and when it becomes due and payable. The Federal Republic’s obligation under the Guarantee of the Federal Republic ranks equally, without any preference, with all of its other present and future unsecured and unsubordinated indebtedness. Holders of securities issued by KfW or issued under KfW’s guarantee may enforce this obligation directly against the Federal Republic without first having to take legal action against KfW. The Guarantee of the Federal Republic is strictly a matter of statutory law and is not evidenced by any contract or instrument. It may be subject to defenses available to KfW with respect to the obligations covered.
Institutional Liability (Anstaltslast)
KfW is a public law institution (Anstalt des öffentlichen Rechts). Accordingly, under the German administrative law principle of Anstaltslast, the Federal Republic, as the constituting body of KfW, has an obligation to safeguard KfW’s economic basis. Under Anstaltslast, the Federal Republic must keep KfW in a position to pursue its operations and enable it, in the event of financial difficulties, through the allocation of funds or in some other appropriate manner, to meet its obligations when due. Anstaltslast is not a formal guarantee of KfW’s obligations by the Federal Republic, and creditors of KfW do not have a direct claim against the Federal Republic. Nevertheless, the effect of this legal principle is that KfW’s obligations, including the obligations to the holders of securities issued by it or issued under KfW’s guarantee, are fully backed by the credit of the Federal Republic. The obligation of the Federal Republic under Anstaltslast would constitute a charge on public funds that, as a legally established obligation, would be payable without the need for any appropriation or any other action by the German Parliament.
Understanding with the European Commission
In order to clarify that the Federal Republic’s responsibility for KfW’s obligations was and is compatible with European Community (“EC”) law prohibitions against state aid, the German Federal Ministry of Finance and the European Commissioner for Competition held discussions which were formalized in an understanding reached on March 1, 2002. In the understanding with the European Commission, it was agreed that, in respect of the promotional activities for which KfW is responsible, KfW will continue to benefit from Anstaltslast and the Guarantee of the Federal Republic. The understanding acknowledged that KfW’s role in providing financing for, in particular, small and medium-sized enterprises, risk capital, environmental protection, technology/innovation, infrastructure and housing, as well as its cooperation with developing countries, is promotional and thus compatible with EC rules.
In the area of export and project finance, the understanding with the European Commission required KfW to transfer to a legally independent subsidiary that portion of its export finance and domestic and international project finance activities which the European Commission deemed to fall outside the scope of the promotional activities of KfW. The transfer of such activities was to be effected by December 31, 2007, and as from that date KfW has not been permitted to fund the subsidiary at other than market rates of interest or to extend to the subsidiary any benefits of Anstaltslast or the Guarantee of the Federal Republic.
KfW continues to be permitted, however, to engage directly in the following promotional export and project finance activities:
14
• implementation of international promotional programs, such as the interest-rate subsidized CIRR (Commercial Interest Reference Rate) and LASU (Large Aircraft Sector Understanding) schemes, which are recognized as promotional activities in accordance with the OECD consensus;

The European Commission transformed the understanding into a decision, which the Federal Republic formally accepted. A part of the Promotional Bank Restructuring Act (Förderbankenneustrukturierungsgesetz) implemented the understanding with the European Commission and amended the KfW Law and KfW’s by-laws accordingly.
On January 1, 2008, KfW IPEX-Bank GmbH, a limited liability corporation (Gesellschaft mit beschränkter Haftung) formed as a wholly owned subsidiary of KfW, commenced operations as a legally independent entity, thus satisfying the requirements set forth in the understanding with the European Commission. KfW IPEX-Bank GmbH conducts those export and project finance activities which the European Commission deemed to fall outside the scope of KfW’s promotional activities directly and on its own behalf. KfW provides funding for KfW IPEX Bank GmbH at market rates based on the ratings assigned to KfW IPEX-Bank GmbH by international rating agencies. The permitted promotional export and project finance activities are conducted by KfW IPEX-Bank GmbH in its own name on behalf of KfW on a trust basis. In accordance with the understanding with the European Commission, KfW IPEX-Bank GmbH obtained a banking license and is subject to the German Banking Act (Kreditwesengesetz) and the corporate tax regime. For more information on KfW’s formation of KfW IPEX-Bank GmbH as a legally independent entity, see “Business—Export and Project Finance (KfW IPEX-Bank)—Corporate Background.”
Supervision
KfW is generally exempt from the requirements of the German Banking Act. Under the KfW Law, the Federal Ministry of Finance, in consultation with the Federal Ministry of Economics and Technology, supervises KfW and has the power to adopt all measures necessary to safeguard the compliance of KfW’s business operations with applicable laws, KfW’s by-laws and other regulations. Subject to the foregoing, the Federal Ministry of Finance does not have the right to influence business decisions made by KfW’s Managing Board or Board of Supervisory Directors. KfW’s overall activities are supervised by its Board of Supervisory Directors, which consists of seven Federal Ministers, seven appointees of each of the two houses of Parliament, the Bundesrat and the Bundestag, and representatives of various sectors and institutions of the German economy. For more information on the Managing Board and the Board of Supervisory Directors, see “Management and Employees.”
There are plans to streamline KfW’s corporate governance structures and to subject KfW to certain provisions of the German Banking Act to the extent appropriate. These plans may lead to amendments of the KfW Law and KfW’s by-laws. Any decision as to whether and how to proceed with respect to such amendments will be made by the Federal Government. KfW is currently unable to predict whether, when or in what form such plans are realized or such amendments may occur.
In addition to the annual audit of its financial statements, KfW, as a government-owned entity, is subject to an audit that meets the requirements of the Budgeting and Accounting Act (Haushaltsgrundsätzegesetz). The Budgeting and Accounting Act requires that this audit and the resulting reporting be designed so as to enable the Board of Supervisory Directors, the responsible Federal Ministries, and the Federal Court of Auditors (Bundesrechnungshof) to form their own opinions and to take action as and when required. One of the specific aspects to be covered by this audit and the related reporting is the proper conduct of KfW’s business by its management.
Under the terms of various agreements concluded between KfW and the government authorities sponsoring KfW’s programs, KfW is also required to have an auditor to report on the proper discharge of KfW’s duties and the efficiency and effectiveness of its administration.
15
• participation in syndicated financing activities outside the European Union (“EU”), the European Economic Area and countries holding the status of official candidate for EU membership, subject to certain conditions, and sole financing activities in countries in which sufficient sources of financing do not exist; and
• participation in projects in the interest of the EC that are co-financed by the European Investment Bank or similar European financing institutions.

Corporate Background
KfW was established in 1948 by the Administration of the Combined Economic Area, the immediate predecessor of the Federal Republic. Originally, KfW’s purpose was to distribute and lend funds of the European Recovery Program (the “ERP” or “Marshall Plan”). Even today, several of KfW’s programs to promote the German and European economies are supported using funds for subsidizing interest rates from the so-called “ERP Special Fund.” KfW has expanded and internationalized its operations over the past decades. In 1994, following the reunification of the Federal Republic and the former German Democratic Republic (“GDR”), KfW assumed the operations of the former central bank of the GDR (Staatsbank), which was located in Berlin.
In September 2001, KfW acquired DEG-Deutsche Investitions- und Entwicklungsgesellschaft mbH (“DEG”) from the Federal Republic. DEG is a limited liability company that acts as the German development finance institution for the promotion of private enterprises in developing countries and countries in transition.
In 2003, Deutsche Ausgleichsbank (“DtA”), which was based in Bonn, merged into KfW. DtA was formed in 1950 as a public law institution and promotional bank particularly active in the area of lending to SMEs and start-up businesses. The merger was accomplished through the Promotional Bank Restructuring Act and was designed to restructure and simplify promotional banking in the Federal Republic and harmonize it with the understanding reached with the European Commission. The Promotional Bank Restructuring Act became effective on August 22, 2003 and implemented the merger of DtA into KfW with retroactive effect as of January 1, 2003. The merger was effected by a transfer of the Federal Republic’s shares in DtA into a special capital reserve of KfW. In connection with the combination of KfW’s and DtA’s SME-related businesses, KfW Mittelstandsbank was created as a new, separately branded platform for all SME-related financing instruments. In addition, a Mittelstandsrat (SME advisory council) was established within KfW which consults and decides on proposals concerning KfW’s SME-related business, taking into consideration KfW’s overall business plan. The Mittelstandsrat is chaired by the Federal Minister of Economics and Technology and includes other members of the Federal Government.
16

BUSINESS
Introduction
In early 2009, KfW reorganized its business areas in order to better reflect the nature of its ultimate clients and to facilitate the assignment of responsibility for the business areas to the members of KfW’s Managing Board. KfW currently conducts its business in the following business areas:
In terms of reporting methodology, the former KfW Förderbank segment is no longer used and two new segments, KfW Privatkundenbank and KfW Kommunalbank, have been introduced. In addition, securitization commitments, which are part of KfW’s promotional activities and were reported in the former KfW Mittelstandsbank and KfW Förderbank business areas, are now included in the new financial markets business area. The ABS SME Portfolio, which was included in financing commitments of the former KfW Mittelstandsbank business area in 2008, has been merged into the ABS Portfolio and also allocated to the financial markets business area. Advisory services (grants), which were reported in the former KfW Mittelstandsbank and KfW Förderbank business areas, are now presented under the item “Others,” which also comprises KfW’s strategic shareholdings. The scope of the export and project finance and the promotion of developing and transition countries business areas has remained unchanged. For comparative purposes, financial data for 2008 such as commitments have been adjusted to reflect the new organizational structure.
The following table sets forth the total assets, loans and advances and securitization commitments outstanding of KfW Bankengruppe in each year.
KEY FIGURES OF KFW BANKENGRUPPE
The following table sets forth the relative size of each of the business areas in terms of commitments for each of the years indicated. As described above, KfW reorganized its business areas in early 2009. For comparative purposes, the commitments for 2008 have been adjusted to reflect the changed organizational structure.
17
• KfW Mittelstandsbank (KfW SME Bank), which focuses on small and medium-sized enterprises (“SMEs”) and other commercial clients;
• KfW Privatkundenbank (KfW Private Client Bank), which focuses on private clients;
• KfW Kommunalbank (KfW Municipal Bank), which is responsible for public clients, such as municipalities and Landesförderinstitute;
• Export and project finance (KfW IPEX-Bank);
• Promotion of developing and transition countries (KfW Entwicklungsbank and DEG); and
• Financial markets, which comprises KfW’s treasury, funding, securitization, and other capital markets-related activities.
As of December 31, 2009 2008 (EUR in millions)Total assets 400,084 394,826 Loans and advances 317,696 313,725 Securitization commitments outstanding (1) 28,123 45,003
(1) Aggregate principal amount of outstanding securitization commitments as of December 31, 2009 and 2008, respectively, consisting of commitments in connection with credit-default swaps under KfW’s PROMISE and PROVIDE securitization programs and its variations in the amount of EUR 27,540 million in 2009 and EUR 44,388 million in 2008, as well as irrevocable loan commitments in the amount of EUR 583 million in 2009 and EUR 615 million in 2008.

PROMOTIONAL BUSINESS VOLUME BY BUSINESS AREA
The following table sets forth the total economic capital required of KfW Bankengruppe as well as the relative size of each of the operative business areas in terms of the percentage of economic capital required for each of the years indicated. For more information on the term economic capital see “Financial Section—Risk Report—Risk Management Approach of the KfW Group—Economic Risk Bearing Capacity.” For more information on the economic capital required by KfW Bankengruppe, see Note 37 to the financial statements.
ECONOMIC CAPITAL REQUIRED
18
Year ended December 31, 2009 2008 (EUR in millions)
KfW Mittelstandsbank (1) 23,766 17,027
KfW Privatkundenbank 16,094 14,856
KfW Kommunalbank 9,358 11,561
Export and project finance (KfW IPEX-Bank) 8,910 17,552
Promotion of developing and transition countries 4,497 4,873of which KfW Entwicklungsbank 3,482 3,648of which DEG — Deutsche Investitions- und Entwicklungsgesellschaft mbH 1,015 1,225
Financial markets (2) 1,537 1,938
of which securitization program commitments 1,537 1,578Others 98 37
Total promotional business volume (3)(4) 63,867 67,791
(1) Commitment figures for 2009 include commitments under the KfW Sonderprogramm, which were first made in the beginning of 2009. These commitments include EUR 577 million that will not be disbursed due to cancellations and withdrawals which occurred after the contractual loan commitments but on or before December 31, 2009.
(2) Commitments in 2009 include EUR 3.4 million for the refinancing of export loans covered by the Federal Republic through Euler Hermes Kreditversicherungs-AG (“HERMES”), the official German export credit insurer. See also “—Financial Markets”.
(3) Total promotional business volume has been adjusted for commitments of EUR 394 million in 2009 (2008: EUR 52 million) made by KfW IPEX-Bank relating to export and project finance and refinanced under certain of KfW Mittelstandsbank’s promotional programs.
(4) Commitments represent the volume of funds committed for loans and other business transactions (with the exception of program-based global loans to Landesförderinstitute) in the relevant year, including amounts to be disbursed in future years, and do not include amounts disbursed in the relevant year pursuant to commitments made in prior years. In the case of program-based global loans to the Landesförderinstitute, commitments represent the actual volume of funds disbursed in the relevant year.
Previously, commitments represented the volume of funds committed for loans and other business transactions (with the exception of global loans and global funding facilities) in the relevant year, including amounts to be disbursed in future years, and did not include amounts disbursed in the relevant year pursuant to commitments made in prior years. In order to facilitate comparisons, commitments for 2008 have been adjusted; they are now presented on the same basis as commitments shown for 2009. As a result of the adjustment, commitments for 2008 set forth in the table above differ from the amounts KfW previously disclosed for the same period.
As of December 31, 2009 2008
Total economic capital required (in EUR millions) 9,842 8,556of which KfW Mittelstandsbank 20 % 19 %of which KfW Privatkundenbank 11 % 11 %of which KfW Kommunalbank 4 % 6 %of which export and project finance (KfW IPEX-Bank) 19 % 18 %of which promotion of developing and transition countries (KfW Entwicklungsbank and DEG) 9 % 8 %of which financial markets 18 % 19 %
Domestic Promotional Business
General
To support the economic and policy objectives of the Federal Government, KfW offers a broad range of financing programs in Germany and to a limited extent elsewhere in Europe, as well as grants funded from the federal budget for domestic promotional purposes. KfW’s predominantly domestic finance activities are conducted by the KfW Mittelstandsbank, KfW Privatkundenbank, and KfW Kommunalbank business areas. Further promotional activities targeting the domestic market are KfW’s securitization activities, which are reported under the financial markets business area, and advisory services, which are reported under “Others.”
Under the KfW Law, KfW must generally involve banks or other financing institutions when granting financings. Therefore, KfW involves commercial banks in the handling of its loans by extending loans to commercial banks, which, in turn, on-lend the funds to the ultimate borrowers. To a limited extent, however, KfW is allowed to grant financings directly to the ultimate borrower, e.g., for financings of municipalities in the KfW Kommunalbank business area.
By lending to commercial banks, KfW, in principle, insulates itself from credit exposure to the ultimate borrower and gains the benefit of the commercial banks’ knowledge of their customers as well as their administrative and servicing expertise. KfW monitors its exposures to, and the credit standing of, each banking institution to which it lends. In its KfW Mittelstandsbank, KfW Privatkundenbank, and KfW Kommunalbank business areas, KfW currently lends to approximately 240 banks.
KfW’s German commercial banking on-lending customers include the nine German Landesbanken. The Landesbanken are German public law financial institutions that have traditionally focused on the banking business for and in the Land in which they operate. Originally, obligations of the Landesbanken benefited from government credit support (Gewährträgerhaftung). According to a settlement reached with the European Commission in July 2001 relating to state aid to the Landesbanken, however, borrowings by the Landesbanken incurred after the settlement date and maturing after December 31, 2015 and all borrowings incurred after July 19, 2005 no longer benefit from government credit support. KfW’s long-term receivables from on-lending operations involving Landesbanken amounted to EUR 56.3 billion as of December 31, 2009. Of this amount, EUR 15.0 billion, or 27%, continues to benefit from government credit support. Since the settlement, KfW’s credit line management has increased its focus on the individual financial strength of each institution. In addition, most of the loans to the Landesbanken have been, and will continue to be, secured by collateral. Over time, the risk profile of the loans to the Landesbanken has been shifting from government risk to a profile more comparable to KfW’s other loans to the banking sector.
KfW offers two different models for processing KfW loans to commercial banks. KfW’s traditional and most important model for handling its lending business is based on individual loan applications for each borrower within the framework of specified loan, mezzanine capital or equity participation instruments. Under the other model, KfW extends global loans or global funding facilities to commercial banks or financing institutions.
Individual Loans. KfW explicitly defines detailed formal requirements for each loan that it extends to a commercial bank as well as for each loan the commercial bank on-lends to the ultimate borrower under each of its lending programs. Borrowers do not apply directly to KfW, however, and may only apply for a KfW loan through a bank of their choice. The intermediate bank appraises the financial and business situation of the applicant, takes collateral for the loan and assumes liability for repayment to KfW. Loans made by commercial banks are normally collateralized by real property or other assets, or are guaranteed by the Federal Republic or by one of the Länder. The processing of individual loans within KfW’s lending programs is characterized by two formally separate loan approvals — first by the intermediate bank and then by KfW — for each borrower. KfW’s loan approval, however, is in most cases based solely on a review of the loan application with respect to compliance with the formal requirements defined for the particular lending program.
Under the traditional pricing model, the commercial banks to which KfW lends are permitted to on-lend the funds at fixed spreads over the applicable interest rate payable to KfW. In 2005, KfW replaced the fixed-spread pricing model with a risk-adjusted pricing model for new commitments in many of its loan programs targeted at SMEs and other commercial enterprises. The fixed-spread pricing model, however, continues to apply in KfW Privatkundenbank’s lending programs, KfW Mittelstandsbank’s lending programs for start-up financing, as well as certain programs of KfW Kommunalbank.
19

Under the risk-adjusted pricing model, KfW establishes pricing categories based on a combination of the borrower’s creditworthiness and the collateral securing the loan. Under each lending program, KfW sets maximum interest rates for each pricing category. The on-lending banks assess the risk profile of the borrower and the collateral securing the loan to determine the applicable pricing category for each loan and the applicable maximum interest rate for the pricing category. KfW’s role in the pricing process is limited to verifying that banks derive the appropriate maximum interest rate from the ultimate borrower’s creditworthiness and the collateral provided.
In the traditional SME lending programs offered by KfW, the on-lending banks are liable to KfW and bear the risk of customer default as described above. In recent years, KfW Mittelstandsbank has been reworking and renewing its SME financing programs to increase its support for SMEs. The recent focus has been on enhancing the support under various SME lending programs in order to encourage on-lending banks to extend loans, especially to SMEs with a higher risk profile, and on complementing its products by offering mezzanine capital and equity participations. Under lending programs, to which the risk-adjusted pricing model applies, KfW offers the option of a partial exemption from liability to on-lending banks. If the on-lending bank applies for an exemption from liability, KfW bears the risk not retained by the bank and the risk margin is shared pro rata between KfW and the bank. The risk-adjusted pricing model applies to KfW Mittelstandsbank’s two largest and most important lending programs, the Unternehmerkredit, or entrepreneurial loan, program and the KfW Sonderprogramm, or special loan program, launched in the beginning of 2009 in connection with the Federal Republic’s economic stimulus packages (see “—Participation in Government Stimulus Packages” below). In addition, mezzanine capital and equity participations offered by KfW Mittelstandsbank and its special programs for investments by micro-enterprises are designed so that KfW assumes direct exposure to the credit risk of the ultimate borrower, which is covered or compensated in different ways: by means of a risk pool funded by risk premiums included in the interest rate charged to the ultimate borrower; or by means of guarantees from the Federal Government or the European Investment Fund.
Global Loans and Global Funding Facilities. Global loans and global funding facilities are extended in the form of lump sums to commercial banks or promotional institutions of the federal states (Landesförderinstitute) in order to facilitate the processing of KfW loans. Global loans and global funding facilities differ from KfW’s individual loans primarily in terms of simplified processing, the lack of a requirement for formal loan approval by KfW with respect to each individual ultimate borrower, and, in general, a higher degree of flexibility for the on-lending financial institution. As a result, global loans and global funding facilities entail lower administrative costs for both KfW and the on-lending bank or financial institution compared with KfW’s traditional lending programs. KfW offers three different kinds of global loans or global funding facilities, two of which are targeted at Landesförderinstitute.
KfW extends global loans to selected commercial banks in Germany and to a limited extent elsewhere in Europe, in the form of a lump sum which the banks break down and grant as individual loans to fund their own financing needs for SMEs, housing projects and municipal infrastructure projects. KfW expects the receiving banks to on-lend these funds within a reasonable period of time. In contrast to KfW’s individual loans, these global loans offer greater loan structure flexibility, as the mode of repayment may be agreed individually between the bank and its customer and the interest rate may be variable or fixed. The interest rate for the ultimate borrower is composed of KfW’s funding rate to the bank plus an individual risk-adjusted margin. The margin is determined by the ultimate borrower’s creditworthiness, which is evaluated on the basis of the bank’s rating system. The bank and KfW agree on the methodology used to calculate the margin.
In the framework of its traditional lending programs, KfW also extends global loans to some Landesförderinstitute. Most of the Landesförderinstitute are independent public law institutions and benefit from explicit guarantees by the respective German federal state (Land). In total, KfW extends global loans to 19 Landesförderinstitute, each of which is responsible for promotional issues within its Land or Länder, as the case may be. Landesförderinstitute use KfW’s global loans to finance specified investments relating to SMEs, housing projects and municipal infrastructure projects in their respective Land within the framework of cooperative loan programs of the Landesförderinstitut and KfW. The conditions of each cooperative loan program must comply with the conditions of the relevant KfW program.
Finally, KfW extends global funding facilities exclusively to Landesförderinstitute for their own promotional funding purposes, thus offering Landesförderinstitute broad flexibility with respect to the use of funds extended in their promotional business without a direct link to any of KfW’s lending programs.
20

Participation in Government Stimulus Packages
In order to stabilize and strengthen the German economy, which has been negatively affected by the global economic and financial crisis, the Federal Government implemented packages of stimulus measures, which provide for the participation of KfW, in late 2008. These measures were amended in 2009. Against the backdrop of a lack of funding from financial institutions, KfW Mittelstandsbank initiated a special loan program (KfW Sonderprogramm) under the Federal Republic’s packages of measures to promote investments. This program was designed to safeguard enterprises, primarily small and medium-sized, but also larger enterprises, against a lack of funding from financial institutions and at providing project financing. The KfW Sonderprogramm offers financings primarily according to KfW’s ordinary individual loan scheme, but also global loans to banks according to KfW’s global loan scheme and direct loans to large enterprises and for project financing. KfW expects to extend commitments under the KfW Sonderprogramm of up to EUR 40 billion through 2011. In addition to the KfW Sonderprogramm, the measures under the stimulus packages comprise financings of housing-related investments of individuals (KfW Privatkundenbank), financings of investments relating to innovation and energy efficiency by SMEs (KfW Mittelstandsbank), and financings of municipal infrastructure projects (KfW Kommunalbank).
In total, KfW expects to extend commitments of up to EUR 52.5 billion through 2011 in connection with the stimulus packages, of which EUR 19.1 billion have already been committed by the year ended December 31, 2009. Additional risks to KfW from commitments made under the stimulus packages are covered by the Federal Government.
KfW Mittelstandsbank (KfW SME Bank)
KfW Mittelstandsbank promotes SMEs, business founders, start-ups and self-employed professionals; it offers financings for many and varied purposes to companies in different stages of development. According to the KfW-Mittelstandspanel 2009 survey of SMEs in Germany, there were nearly 3.7 million SMEs (including enterprises with an annual group turnover of up to EUR 500 million) in 2008. SMEs accounted for 55% of the gross investment by the German corporate sector, employed two-thirds of the workforce and trained more than 80% of apprentices in 2008.
KfW Mittelstandsbank provides financings in the sectors start-up financing and general investments, innovation and environmental protection primarily by means of loans (2009: EUR 21.9 billion, 2008: EUR 15.5 billion; including global loans to Landesförderinstitute as well as commercial banks), mezzanine capital (2009: EUR 1.6 billion, 2008: EUR 1.3 billion) and equity participations (2009: EUR 0.1 billion, 2008: 0.2 billion).
The following table shows KfW Mittelstandsbank’s commitments by sector for each of the years indicated.
KFW MITTELSTANDSBANK COMMITMENTS
21
Year ended December 31, 2009 2008 (EUR in millions)
Start-up financing and general investment 15,480 10,408 of which: KfW Sonderprogramm (1) 7,162 —
Innovation 1,291 951Environmental investment 6,997 5,667
Total commitments (2) 23,766 17,027
(1) Commitments were first made in the beginning of 2009 and include an amount of EUR 577 million that will not be disbursed due to cancellations and withdrawals which occurred after the contractual loan commitments but on or before December 31, 2009.
(2) Commitments represent the volume of funds committed for loans and other business transactions (with the exception of program-based global loans to Landesförderinstitute) in the relevant year, including amounts to be disbursed in future years, and do not include amounts disbursed in the relevant year pursuant to commitments made in prior years. In the case of program-based global loans to the Landesförderinstitute, commitments represent the actual volume of funds disbursed in the relevant year.
Previously, commitments represented the volume of funds committed for loans and other business transactions (with the exception of global loans and global funding facilities) in the relevant year, including amounts to be disbursed in future years, and did not include amounts disbursed in the relevant year pursuant to commitments made in prior years. In order to facilitate comparisons, commitments for 2008 have been adjusted; they are now presented on the same basis as commitments shown for 2009. As a result of the adjustment, commitments for 2008 set forth in the table above differ from the amounts KfW previously disclosed for the same period.

To support the German economy, KfW Mittelstandsbank committed financings in the amount of EUR 23.8 billion in 2009, compared to EUR 17.0 billion in 2008. This significant increase of 40% was mainly driven by commitments under the KfW Sonderprogramm, which were first made in 2009. Commitments in 2009 include EUR 3.6 billion extended as global loans to Landesförderinstitute and global loans to commercial banks of EUR 1.5 billion, compared to global loans to Landesförderinstitute of EUR 5.0 billion and no global loans to commercial banks in 2008.
KfW Mittelstandsbank applies the risk-adjusted pricing model to most of its loans. In some cases, KfW Mittelstandsbank offers the on-lending banks a partial exemption from liability as described above. This is the case for KfW Unternehmerkredite (KfW entrepreneurial loans), which are the most important SME loans and offer financing for a broad range of investments, such as construction and purchases of machinery, in the start-up financing and general investment sector.
KfW Mittelstandsbank extends mezzanine capital in the form of unsecured subordinated loans, which contain equity-like elements combining characteristics of debt and equity capital. The on-lending bank is not liable to KfW Mittelstandsbank for the subordinated loan. In its mezzanine financing, KfW Mittelstandsbank seeks to tailor the terms and conditions of its lending to each borrower’s risk profile in order to provide a better correlation between yield and risk weighting. As a result, the interest rate of the subordinated loan takes account of both the prevailing rates in the capital markets and the borrower’s credit standing. The borrower’s creditworthiness is first assessed by the on-lending bank. However, as KfW Mittelstandsbank fully assumes the risk of the subordinated loan, it reserves the right to review and, if necessary, to revise the bank’s assessment by applying KfW Mittelstandsbank’s own rating standards.
Finally, KfW Mittelstandsbank provides loans to equity investors, typically private equity companies and venture capital companies. These investors, in turn, make equity investments in SMEs. In addition, KfW Mittelstandsbank provides new equity for innovative SMEs by direct investment, provided that a private investor provides at least the same amount in equity.
Start-up Financing and General Investment Programs
KfW Mittelstandsbank provides start-up financing and financial support for general investments for a wide range of purposes such as investments in property and buildings, in plant and machinery, equipment or in takeovers. In 2009, commitments in this sector amounted to EUR 15.5 billion compared with EUR 10.4 billion in 2008. This significant increase was driven by commitments under the KfW Sonderprogramm amounting to EUR 7.2 billion in 2009, which were first made in 2009. Commitments in form of KfW entrepreneurial loans (KfW Unternehmerkredite) amounted to EUR 6.4 billion in 2009, compared to EUR 9.0 billion in 2008. The decline was mainly due to a lower demand from Landesförderinstitute.
Innovation Programs
KfW Mittelstandsbank provides financing for innovations by extending funds for research and development activities either by means of mezzanine capital or direct equity investments. In 2009, commitments amounted to EUR 1.3 billion compared to EUR 1.0 billion in 2008.
Environmental Investment Programs
KfW Mittelstandsbank finances environmental protection projects, in particular, for measures aiming at increasing energy efficiency, reducing greenhouse gas emissions and promoting the use of sources of renewable energy. In 2009, commitments increased to EUR 7.0 billion from EUR 5.7 billion in 2008, mainly driven by increased financings for the use of renewable energy.
KfW Privatkundenbank (KfW Private Client Bank)
KfW Privatkundenbank provides housing-related loans and grants as well as financing for education to private individuals. The following table shows KfW Privatkundenbank’s commitments by sector for each of the years indicated.
22
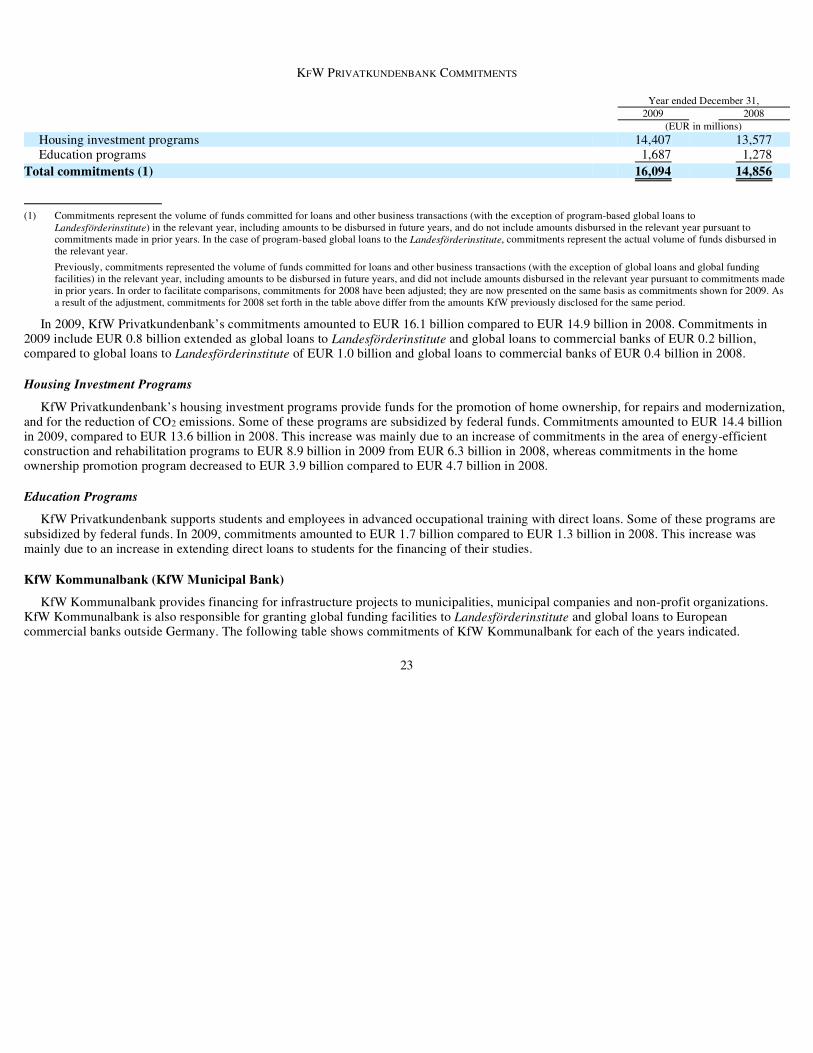
KFW PRIVATKUNDENBANK COMMITMENTS
In 2009, KfW Privatkundenbank’s commitments amounted to EUR 16.1 billion compared to EUR 14.9 billion in 2008. Commitments in 2009 include EUR 0.8 billion extended as global loans to Landesförderinstitute and global loans to commercial banks of EUR 0.2 billion, compared to global loans to Landesförderinstitute of EUR 1.0 billion and global loans to commercial banks of EUR 0.4 billion in 2008.
Housing Investment Programs
KfW Privatkundenbank’s housing investment programs provide funds for the promotion of home ownership, for repairs and modernization, and for the reduction of CO2 emissions. Some of these programs are subsidized by federal funds. Commitments amounted to EUR 14.4 billion in 2009, compared to EUR 13.6 billion in 2008. This increase was mainly due to an increase of commitments in the area of energy-efficient construction and rehabilitation programs to EUR 8.9 billion in 2009 from EUR 6.3 billion in 2008, whereas commitments in the home ownership promotion program decreased to EUR 3.9 billion compared to EUR 4.7 billion in 2008.
Education Programs
KfW Privatkundenbank supports students and employees in advanced occupational training with direct loans. Some of these programs are subsidized by federal funds. In 2009, commitments amounted to EUR 1.7 billion compared to EUR 1.3 billion in 2008. This increase was mainly due to an increase in extending direct loans to students for the financing of their studies.
KfW Kommunalbank (KfW Municipal Bank)
KfW Kommunalbank provides financing for infrastructure projects to municipalities, municipal companies and non-profit organizations. KfW Kommunalbank is also responsible for granting global funding facilities to Landesförderinstitute and global loans to European commercial banks outside Germany. The following table shows commitments of KfW Kommunalbank for each of the years indicated.
23
Year ended December 31, 2009 2008 (EUR in millions)
Housing investment programs 14,407 13,577Education programs 1,687 1,278
Total commitments (1) 16,094 14,856
(1) Commitments represent the volume of funds committed for loans and other business transactions (with the exception of program-based global loans to Landesförderinstitute) in the relevant year, including amounts to be disbursed in future years, and do not include amounts disbursed in the relevant year pursuant to commitments made in prior years. In the case of program-based global loans to the Landesförderinstitute, commitments represent the actual volume of funds disbursed in the relevant year.
Previously, commitments represented the volume of funds committed for loans and other business transactions (with the exception of global loans and global funding facilities) in the relevant year, including amounts to be disbursed in future years, and did not include amounts disbursed in the relevant year pursuant to commitments made in prior years. In order to facilitate comparisons, commitments for 2008 have been adjusted; they are now presented on the same basis as commitments shown for 2009. As a result of the adjustment, commitments for 2008 set forth in the table above differ from the amounts KfW previously disclosed for the same period.

KFW KOMMUNALBANK COMMITMENTS
In 2009, financing commitments under KfW Kommunalbank’s programs amounted to EUR 9.4 billion compared to EUR 11.6 billion in 2008. This decrease was mainly due to the decline of commitments in global funding facilities to Landesförderinstitute.
Municipal Infrastructure Programs
KfW Kommunalbank provides financing for investments in municipal and social infrastructure, predominantly as direct loans to municipalities (i.e., local and municipal authorities and municipal special-purpose associations). Infrastructure investments by private companies that are majority-owned by municipal authorities and social investments made by non-profit organizations are financed according to KfW’s ordinary on-lending scheme involving commercial banks. Some of these programs are subsidized by federal funds. Commitments amounted to EUR 2.0 billion in 2009 compared with EUR 2.1 billion in 2008.
Global Funding Facilities to Landesförderinstitute
In 2009, KfW extended global funding facilities in the amount of EUR 7.3 billion to Landesförderinstitute compared to EUR 9.1 billion in 2008. The decline was mainly due to a lower demand from the Landesförderinstitute.
Global Loans to European Commercial Banks
Due to the financial crisis, lending was limited, totaling EUR 0.1 billion in 2009 compared with EUR 0.3 billion in 2008.
Export and Project Finance (KfW IPEX-Bank)
Business
KfW IPEX-Bank operates on a worldwide basis, with a particular focus on promoting financings in the interest of the German and European economy, offering project, export and trade financing, as well as corporate financing. It offers a full range of financing products with a focus on long-term financing, including structured financing, investment financing, project financing and acquisition financing. In addition, in recent years KfW IPEX-Bank has increasingly offered short-term instruments, such as performance and payment bonds and non-recourse purchase of receivables discounted at market rates, mezzanine products, participations in lease finance and derivatives as hedging instruments for its clients. As a strategic shareholding in the area of lease operations, KfW IPEX-Bank holds a 50% stake in Railpool Holding GmbH & Co KG, an asset manager in rail transportation established in 2008. The other 50% in this joint venture is held by HSH Nordbank.
KfW IPEX-Bank’s principal customers are large corporations with international operations and larger medium-sized companies in basic and manufacturing industries, as well as in the commerce, health, power and energy, environmental protection, telecommunications, shipping, aviation, rail and road, airport and harbors and
24
Year ended December 31, 2009 2008 (EUR in millions)
Municipal infrastructure programs 1,982 2,135Global funding facilities to Landesförderinstitute 7,269 9,135Global loans to European commercial banks outside Germany 108 291
Total commitments (1) 9,358 11,561
(1) Commitments represent the volume of funds committed for loans and other business transactions (with the exception of program-based global loans to Landesförderinstitute) in the relevant year, including amounts to be disbursed in future years, and do not include amounts disbursed in the relevant year pursuant to commitments made in prior years. In the case of program-based global loans to the Landesförderinstitute, commitments represent the actual volume of funds disbursed in the relevant year.
Previously, commitments represented the volume of funds committed for loans and other business transactions (with the exception of global loans and global funding facilities) in the relevant year, including amounts to be disbursed in future years, and did not include amounts disbursed in the relevant year pursuant to commitments made in prior years. In order to facilitate comparisons, commitments for 2008 have been adjusted; they are now presented on the same basis as commitments shown for 2009. As a result of the adjustment, commitments for 2008 set forth in the table above differ from the amounts KfW previously disclosed for the same period.

other industry sectors. Traditionally, the bulk of the loans extended by KfW IPEX-Bank has been used for export and project financings. In recent years, KfW IPEX-Bank has increasingly extended loans to finance direct investments by German enterprises and other corporate purposes linked to the internationalization of German companies. KfW IPEX-Bank’s loans are also used to secure sources of raw materials for the German industry and are conditioned upon the delivery of raw materials into the Federal Republic for the term of the loan. In addition, loans serve to co-finance large-scale infrastructure projects in the European transport sector.
KfW IPEX-Bank’s loans are generally extended directly to the ultimate borrower, and KfW IPEX-Bank makes a significant portion of these loans at its own risk. KfW IPEX-Bank regularly cooperates with other financial institutions by way of consortia and syndications and intends to expand its syndication activities. In some cases, KfW IPEX-Bank may arrange for commercial banks to assume the risk on portions of loans made by KfW IPEX-Bank through “risk-participations,” for which KfW IPEX-Bank pays a fee to the bank assuming the risk.
From time to time, KfW IPEX-Bank also enters into framework loan agreements with foreign banks, which enable such banks to extend loans to their customers for the purpose of importing equipment from German or other European exporters. Because the amounts of individual loans are usually small, the related transaction costs are relatively high. The framework agreements help to reduce these transaction costs.
Loans extended by KfW IPEX-Bank are generally secured by collateral and often benefit from a payment guarantee or other security arrangement. Loans extended to finance direct investments may benefit from an investment guarantee against political risk by the Federal Republic if the host country risk is assessed to be substantial.
A portion of export finance loans extended by KfW IPEX-Bank is guaranteed by the Federal Republic through Euler Hermes Kreditversicherungs-AG, the official German export credit insurer (“HERMES”). HERMES insurance covers up to 95% of KfW IPEX-Bank’s risk, so that the portion covered becomes the equivalent of German government risk. HERMES also provides coverage for related deliveries from other, mainly European, countries provided that it does not exceed a certain portion of the total delivery for which an export finance loan was extended. In addition to HERMES insurance, KfW IPEX-Bank frequently obtains a guarantee from a foreign export credit agency or a government instrumentality in the buyer’s country.
For borrowers in other European and Organization for Economic Cooperation and Development (“OECD”) countries where the country risk is not considered high, KfW IPEX-Bank has been increasingly extending loans on the basis of ordinary banking collateral (e.g., mortgages on aircraft or ships) without seeking the benefit of HERMES or similar coverage. In addition, even when HERMES coverage is sought, KfW IPEX-Bank often extends loans on which the insured portion is less than 95%. As of December 31, 2009, KfW IPEX-Bank’s outstanding loans and guarantees outside Germany amounted to EUR 34.2 billion, of which EUR 6.2 billion, or 18%, were export finance loans guaranteed by HERMES.
Corporate Background
In accordance with the understanding between the European Commission and the German Federal Government reached in March 2002, KfW was required to transfer to a legally independent subsidiary that portion of its export and domestic and international project finance activities which the European Commission deemed to fall outside the scope of the promotional activities of KfW by no later than December 31, 2007. See “General—Relationship with the Federal Republic—Understanding with the European Commission.”
In 2003, KfW started to implement this understanding and set up a separate business unit under the KfW IPEX-Bank brand. Until December 31, 2007 KfW IPEX-Bank was organized as a bank-within-the-bank within KfW and was responsible for all lending activities at purely commercial terms and conditions in competition with other financial institutions. In 2007, KfW finalized the institutional structuring of KfW IPEX-Bank’s activities, completing its preparation for independent compliance with applicable banking law and regulation and the organizational and functional separation of various activities, including treasury, controlling, internal accounting and risk management. In April 2007, KfW IPEX-Bank was registered as a limited liability corporation under German law and a banking license was granted to allow for the preparation of the transfer of a part of the current loan portfolio in export and project finance from KfW to KfW IPEX-Bank GmbH.
As of January 1, 2008, KfW IPEX-Bank GmbH commenced operations as a legally independent entity wholly owned by KfW. KfW IPEX-Bank GmbH conducts the portion of export and project finance activities
25

which the European Commission deemed to fall outside the scope of KfW’s promotional activities directly and on its own behalf, while it conducts the promotional export and project finance activities in its own name on behalf of KfW on a trust basis. As of December 31, 2009, KfW IPEX-Bank GmbH’s total outstanding loans and guarantees amounted to EUR 48.4 billion compared with EUR 52.7 billion as of December 31, 2008. KfW IPEX-Bank GmbH is located in Frankfurt am Main/Germany and maintains a branch office in London/United Kingdom. As of December 31, 2009, KfW IPEX Bank GmbH employed 521 persons (excluding managing directors, but including temporary personnel).
KfW IPEX-Bank GmbH is approved as an IRB (internal rating based-advanced) bank under the Basel II rules by the relevant German supervisory authorities — the Bundesanstalt für Finanzdienstleistungsaufsicht (Federal Financial Supervisory Authority) and Deutsche Bundesbank (German Central Bank).
Commitments
In 2009, total commitments of export and project finance amounted to EUR 8.9 billion compared with EUR 17.6 billion in 2008. This significant decrease was principally due to investment plans being postponed by companies in Germany and abroad, which resulted in reduced demand for loans. In addition, due to the generally increased market risks resulting from the global economic and financial crisis, KfW IPEX Bank’s lending policy became more selective. Both developments had an almost equal effect on the changes to the sectoral and regional distribution of KfW IPEX-Bank’s new business in 2009. The following table shows commitments in KfW’s business area export and project finance in 2009 and 2008.
EXPORT AND PROJECT FINANCE COMMITMENTS (KFW IPEX-BANK)
Commitments by Sectors. The following table shows KfW IPEX-Bank’s commitments by economic sector in 2009 and 2008.
Commitments by Geographic Area. In 2009, KfW IPEX-Bank’s commitments for project and corporate financings within Germany decreased to EUR 3.0 billion from EUR 4.2 billion in 2008. KfW IPEX-Bank’s commitments to other countries decreased to EUR 5.9 billion in 2009 from EUR 13.3 billion in 2008. The decrease of new commitments in Germany was less pronounced than the decrease of new commitments to
26
Year ended December 31, 2009 2008 (EUR in (in % of (EUR in (in % of millions) total) millions) total)Commercial business 4,613 52 12,574 72Promotional business (conducted on behalf of KfW) 4,296 48 4,978 28
Total commitments (1) 8,910 100 17,552 100
(1) Commitments represent the volume of funds committed for loans and other business transactions (including grants and guarantees) in the relevant year, including amounts to be disbursed in future years, and do not include amounts disbursed in the relevant year pursuant to commitments made in prior years.
Year ended December 31, 2009 2008 (EUR in millions)Shipping 1,625 4,179Rail and road 821 2,660Manufacturing industries, retail and health 1,282 2,636 Energy and environment 1,489 2,364Basic industries 1,226 2,099Aviation 488 955Telecommunications, media 332 909Financial institutions/ Trade and commodity finance 718 676Airports and harbors, construction industries 757 640Leveraged finance, mezzanine, equity 172 433
Total commitments 8,910 17,552

other countries, which is attributable, in part, to KfW IPEX-Bank’s involvement as an on-lending bank under the KfW Sonderprogramm. KfW IPEX-Bank’s export and project finance business to countries outside Germany includes loans that finance corporate investments in Germany and abroad, loans that finance direct investments by German and other European companies in countries abroad, and loans that finance projects by foreign borrowers which nevertheless serve German or European interests, such as projects relating to natural resources. In 2009, commitments in the amount of EUR 3.6 billion were made in Europe (excluding Germany, but including Russia and Turkey). Demand for financing from countries outside Europe was relatively low. KfW IPEX-Bank expects its business to focus increasingly on domestic and European promotional activities going forward.
Commitments by Products. The following table shows KfW IPEX-Bank’s commitments by product in 2009 and 2008.
Funding
The funds for KfW IPEX-Bank’s commitments are mainly provided by KfW through borrowings in the capital markets. Since KfW IPEX-Bank commenced operations as a legally independent subsidiary on January 1, 2008, KfW has been providing funding to KfW IPEX-Bank’s international project and export finance business at market rates based on the ratings assigned to KfW IPEX-Bank by international rating agencies. For those areas of export finance which the European Commissioner has deemed to fall within the scope of the promotional activities of KfW, funds from the ERP Special Fund may also be used for subsidizing interest rates. In 2009, EUR 58 million of loan disbursements was supported by the ERP Special Fund. In connection with the sale of ships, KfW IPEX-Bank extends loans under the CIRR (Commercial Interest Reference Rate) scheme for the shipping industry supported by the federal budget.
The terms of export and project finance loans funded in the capital markets are based on the cost of funds to KfW, plus a margin intended to cover the administrative cost of the loan, the credit risk and a return on the bank’s capital. Because the Federal Republic is a member of the OECD, loans financed with ERP Special Fund funds or under the CIRR scheme for the shipping industry must comply with OECD regulations, which provide for minimum interest rates and maximum credit periods. Margins on these loans are also generally intended to cover all the risks of such loans as well as administrative costs and a return on capital. In addition, KfW IPEX-Bank charges customary banking fees for reserving and providing financing and for handling. Foreign-currency denominated loans are hedged through matched funding or other mechanisms.
Promotion of Developing and Transition Countries
In its promotion of developing and transition countries business, KfW, on behalf of the Federal Republic, provides financial assistance to developing countries and countries in transition, either through KfW Entwicklungsbank (KfW Development Bank), which promotes mainly public-sector development cooperation activities, or through DEG, which promotes private-sector investments in developing countries.
The following table sets forth KfW’s commitments for its promotion of developing and transition countries business in 2009 and 2008.
27
Year ended December 31, 2009 2008 (EUR in millions)Direct loans 2,253 6,080Export finance 1,851 2,480Structured finance 720 1,942Project finance 1,335 1,718Guarantees 1,067 1,664Credit lines 715 1,526 Lease finance 245 948Acquisition finance 150 659Mezzanine and other products 574 535
Total commitments 8,910 17,552

PROMOTION OF DEVELOPING AND TRANSITION COUNTRIES COMMITMENTS
KfW Entwicklungsbank (KfW Development Bank)
KfW acts as the Federal Republic’s international development bank, extending loans and disbursing grants mainly to foreign public-sector borrowers and recipients. Approximately 42% of these loans and grants are refinanced from federal budget funds provided to KfW and made according to instructions from the Federal Government. Mandates and both loan commitments for the account of the Federal Republic and grants are funded by federal budget funds and, by their nature, do not appear on KfW’s balance sheet.
KfW extends financial cooperation loans in three ways:
Generally, interested foreign governments submit applications for financial cooperation to the Federal Government, which then asks KfW to appraise the proposed projects. In the case of Financial Cooperation Promotional Loans, project sponsors may submit their proposals directly to KfW. KfW maintains a staff of economists, engineers and other specialists to assist in the appraisal and development of projects. KfW receives fees from the Federal Republic for loans and grants extended for the account of the Federal Government and Development Loans, calculated as a percentage of outstanding loans and grants, as far as they are financed out of the federal budget. Based on KfW’s appraisal and its recommendation, the Federal Republic decides whether or not to fund a particular project. Upon a favorable decision and upon determination of the terms and conditions of financing, KfW enters into a loan or grant agreement with the recipient country or, if applicable, the individual agency responsible for the project, in which case the obligations under that agreement would then usually be fully guaranteed by the respective recipient country.
Financial cooperation loans and grants are disbursed according to the progress of the relevant project, and KfW monitors the utilization of funds in order to verify compliance with the provisions of the loan or grant agreement.
The following table shows KfW Entwicklungsbank commitments in 2009 and 2008.
28
Year ended December 31, 2009 2008 (EUR in millions)KfW Entwicklungsbank (1) 3,482 3,648DEG – Deutsche Investitions- und Entwicklungsgesellschaft mbH 1,015 1,225
Total commitments 4,497 4,873
(1) Commitments for 2008 have been adjusted on the basis of revisions to the reporting methodology which were introduced in 2009. As a result, commitments for 2008 set forth in the table above differ from the amounts which KfW disclosed previously for the same period.
• Traditional Financial Cooperation Loans that are extended for the account of the Federal Republic;
• Financial Cooperation Development Loans (FZ-Entwicklungskredite), in which KfW offers its own funds as an additional source of financing. For these loans, federal budget funds at low interest rates or grant funds are combined with funds from KfW that are refinanced in the capital markets. Roughly half of the portion refinanced with KfW funds is guaranteed either by a special guarantee facility of the Federal Republic or by export credit agencies. Interest rates and related terms of Financial Cooperation Development Loans are significantly more favorable to the borrower than market terms and, therefore, meet the requirements for recognition as official development assistance; and
• Financial Cooperation Promotional Loans (FZ-Förderkredite), which are funded solely through funds raised by KfW in the capital markets and do not include interest reduction elements from the federal budget.

KFW ENTWICKLUNGSBANK COMMITMENTS
Total commitments of KfW Entwicklungsbank decreased by 5% to EUR 3,482 million in 2009 from EUR 3,648 million in 2008. The relative share of loan commitments that were refinanced in the capital markets increased to 85% in 2009 from 79% in 2008.
In 2009, Europe/Caucasus accounted for 24% of KfW Entwicklungsbank’s commitments; Asia, for 36%; sub-Saharan Africa, for 19%; Latin America, for 11%; and Middle East/North Africa, for 10%.
The following table shows KfW Entwicklungsbank’s commitments by sector in 2009.
Cooperation Between KfW Entwicklungsbank and GTZ. The Federal Government currently provides aid to developing countries mainly through two organizations: financial cooperation with developing countries through KfW Entwicklungsbank; and technical cooperation through Deutsche Gesellschaft für Technische Zusammenarbeit GmbH (“GTZ”), a private company owned by the Federal Government. GTZ provides solutions for political, economic, ecological and social development worldwide – frequently in cooperation with KfW. The former Federal Government was considering coordinating its financial and technical cooperation more closely, including, among other options, by potentially combining KfW Entwicklungsbank and GTZ into a single institution. While the current Federal Government continues to pursue the goal of coordinating financial and technical cooperation more closely, as a first step, it is planning to combine the organizations active in the area of technical cooperation, which include GTZ and certain other smaller organizations.
DEG – Deutsche Investitions- und Entwicklungsgesellschaft mbH
DEG, a limited liability corporation, is a legally independent entity founded in 1962 which KfW acquired from the Federal Republic in 2001. DEG is located in Cologne/Germany and in 2009 maintained 11 representative offices in developing or transition countries. In 2009, DEG employed an average of 401 persons compared to 385 in 2008. DEG is fully consolidated in KfW’s consolidated financial statements.
DEG’s activities extend to various countries in Africa, Asia, Latin America, and Central and Eastern Europe. DEG aims to establish and expand private enterprise structures in these countries as a contribution to sustainable growth and lasting improvement in the living conditions of the local population. To this end, DEG provides long-term capital for private enterprises investing in developing countries. In addition, DEG provides both finance and consultancy services in customized packages on a project basis.
29
Year ended December 31, 2009 2008 (EUR in millions)
Loan commitments 2,259 2,698of which federal funds 336 563of which KfW’s funds refinanced in the capital markets 1,923 2,135
Grant commitments 1,112 882Mandates (1) 111 68
Total commitments 3,482 3,648
(1) Mandates are grants funded by governmental or supranational entities and distributed using KfW’s expertise and channels.
2009 (EUR in millions) (in % of total)
Financial sector 1,089 31Social infrastructure 1,003 29Economic infrastructure 889 26 Production sector 148 4Others (1) 352 10
Total commitments 3,482 100
(1) Consists of commitments made for different multisectoral programs.

DEG pursues four key economic aims in its private sector development policy:
DEG conducts its activities in cooperation with commercial banks rather than in competition with them. In its activities, DEG acts in accordance with commercial principles. Accordingly, it does not provide subsidized financing, but instead offers financing solely on commercial terms and conditions. DEG also seeks to mobilize other partners to provide additional capital for investment in its projects.
As an instrumentality serving public policy objectives of the Federal Government, DEG has been granted a favorable tax status under which only part of DEG’s activities are subject to corporate income tax. Like KfW, DEG does not distribute profits but instead re-channels them into new investments.
DEG’s obligations do not benefit from the Guarantee of the Federal Republic or from Anstaltslast, and while DEG’s indebtedness is reflected in KfW’s consolidated balance sheet, its debt represents obligations of DEG and not of KfW. In June 2001, KfW and DEG entered into a refinancing agreement, pursuant to which KfW acts as sole issuer in the capital markets and provides DEG with mid- and long-term capital market funds according to DEG’s capital needs. In addition, internal agreements have been reached concerning the respective fields of business activities, the mutual use of offices abroad, joint public relations activities and joint information technology management.
The following table shows DEG’s commitments in 2009 and 2008. These commitments include risk participations by third parties of EUR 1 million in 2009, compared with EUR 134 million in 2008. This decrease was due to the global economic and financial crisis.
DEG COMMITMENTS
Financial Markets
KfW’s financial markets business area comprises KfW’s securitization activities, which are part of KfW’s promotional activities, the group’s treasury activities, including its funding activities and its financial asset management, as well as other capital markets-related activities currently consisting of privatization initiatives relating to Deutsche Telekom AG and Deutsche Post AG on behalf of the Federal Government. The following table shows financial markets’ commitments and the amount of new funds raised in the capital markets for each of the years indicated.
30
• promoting direct investment, including with DEG’s own venture capital;
• providing long-term debt finance to investment projects;
• supporting pioneer investors in new countries and regions; and
• strengthening local capital markets through financial sector development.
Year ended December 31, 2009 2008 (EUR in millions)Loans 613 776Equity participations 149 163Mezzanine financing 230 253 Guarantees 23 33
Total commitments 1,015 1,225

FINANCIAL MARKETS KEY FIGURES
Securitization Activities
Synthetic Securitization Programs. For a number of years, KfW has been running a synthetic securitization program known as PROMISE (Program for “Mittelstand” Loan Securitization) to foster the promotion of SMEs through the support of on-lending German commercial banks by easing the transfer of credit risk on their SME loans to the capital markets. In addition, KfW established PROVIDE, a synthetic securitization program for residential mortgage loans. In 2009, due to the ongoing weak market conditions for securitization transactions as a result of the global economic and financial crisis, only one transaction was concluded amounting to EUR 1.5 billion compared to a volume of EUR 1.6 billion securitized in 2008. At year-end 2009, KfW’s securitization commitments outstanding amounted to EUR 27.5 billion compared to EUR 44.4 billion at year-end 2008.
All securitization transactions to date have followed a standardized basic structure whereby KfW acts as intermediary credit-default swap or intermediary bank guarantee provider between lending commercial banks and mortgage banks and the capital markets. In the case of credit-default swaps, KfW generally enters into a credit-default swap with the originating bank to provide cover for specified credit risks of the assets being securitized. In general, KfW then contractually shifts the risks assumed under the credit-default swap with third parties by (1) entering into further credit-default swaps with highly-rated credit institutions (or, upon provision of highly-rated collateral, other financial institutions) and, in most cases, (2) issuing credit-linked certificates of indebtedness to a special-purpose vehicle (“SPV”) as collateral against the SPV’s obligations under mirroring credit-linked notes (“CLNs”), issued by the SPV to investors.
The proceeds from the sale of CLNs are used by the SPV to purchase the certificates of indebtedness from KfW on the issue date of the CLN. KfW uses the cash proceeds to fulfill its payment obligations under its certificates of indebtedness to the SPV, and, to the extent obligations arise in respect of KfW’s credit-default swap with the originating bank (i.e., any realized losses occurred in the reference portfolio), to pay compensation to the originating bank. In this case, the payment obligations of KfW under the certificates of indebtedness are reduced simultaneously in an amount matching the compensation payments under the credit-default swap with the originating bank.
KfW selectively retained parts of AAA-rated super senior swap tranches in transactions under the securitization programs, which amounted to EUR 1.1 billion as of December 31, 2009, compared to EUR 1.6 billion as of December 31, 2008. In February 2010, one retained part of two super senior swap tranches in the outstanding amount of EUR 0.5 billion was downgraded by one out of two international rating agencies, Fitch Ratings, from AAA to A. KfW does not expect any drawings under the senior bank guarantees that KfW has provided in relation to the securitization programs.
There was no material change with respect to the level of risk that KfW incurred as a result of changes in the ratings of transactions concluded under the securitization programs.
ABS Portfolio. KfW may invest in tranches of securitized assets (e.g., SME and mortgage loan-portfolios) in order to foster the access of KfW’s promotional target groups to funding from financial institutions. Due to the ongoing global economic and financial crisis, there was no investment in 2009.
Program for the Refinancing of Export Loans. In September 2009, KfW launched a new program in the context of the stimulus packages of the German government. Under this program, KfW offers commercial banks long-term refinancing of export loans covered by HERMES, the official German export credit insurer. As
31
Year ended December 31, 2009 2008
Securitization commitments (EUR in millions) 1,537 1,938of which securitization program commitments (1) 1,537 1,578of which ABS Portfolio — 360
New funds raised in the capital markets (EUR in billions) 74.7 75.3
(1) Including EUR 3.4 million for the refinancing of export loans covered by the Federal Republic through HERMES.

these loans are guaranteed by the Federal Republic through HERMES, KfW’s exposure is fully covered by the Federal Republic. In 2009, KfW committed EUR 3.4 million.
Funding
KfW Bankengruppe’s principal sources of funds are the international financial markets and public funds, with the majority of lending in its business areas being financed from funds raised by KfW in the international financial markets. KfW Bankengruppe’s consolidated balance sheet total as of December 31, 2009 was EUR 400.1 billion. EUR 355.6 billion, or 89% of this amount, was financed through borrowings (i.e., from financial market funds or public funds). In addition, as of December 31, 2009, KfW had EUR 16.9 billion in liabilities held in trust (i.e., for which the Federal Government provides the funding and assumes all risks), which do not appear on KfW’s consolidated balance sheet. In line with the focus on mid-term and long-term loans within its loan portfolio resulting from its promotional business, approximately 80% of KfW Bankengruppe’s total borrowings outstanding at the end of 2009 had remaining maturities of one year or more.
Financial-Market Funds. KfW raises short-term and long-term funds in the international financial markets through the issuance of bonds and notes (including commercial paper) and by incurring loans against debt certificates (Schuldscheindarlehen). Long-term funding with initial maturities of more than one year (referred to as “capital-market funding” below) represents the most important source of funding. Short-term borrowings with initial maturities of less than one year in the form of commercial paper (referred to as “money-market funding” below) are primarily used for purposes of KfW’s liquidity management. The percentage of capital-market funding outstanding of total financial-market funds outstanding was 91% at the end of 2009.
KfW’s wholly owned finance subsidiary in the United States, KfW International Finance Inc., a Delaware corporation, concluded its refinancing activities for KfW in 2008. The subsidiary has since ceased further operations and KfW is planning to initiate the dissolution of its subsidiary in the course of 2010.
All amounts stated in connection with KfW’s capital- and money-market funding transactions or funding volume are, unless stated otherwise, based on net proceeds to KfW, which are calculated as principal amount less price discount and underwriting commissions, if any.
Capital-Market Funding. KfW’s capital-market funding policy pursues a dual aim: to achieve the most favorable terms possible for funds raised in the capital markets; and to minimize, to the extent practicable, the effects of changes in interest rates and foreign exchange rates mainly through interest rate and currency risk hedging instruments and, to a more limited extent, by matching funding liabilities with loan assets. In order to achieve favorable terms for funds raised, KfW maintains an active presence in all major capital markets and utilizes a broad range of funding instruments in various currencies, covering a range of maturities.
KfW’s capital-market funding is based on three pillars: its “benchmark” bond programs (in euro and U.S. dollar); publicly placed bonds outside the benchmark programs; and “private placements,” which is a term KfW uses in the commercial sense to refer to sales to a specific investor or a limited number of investors. In 2009, benchmark bonds accounted for a funding volume of EUR 34.4 billion, or 46% of KfW’s total capital-market funding. The two other funding sources accounted for EUR 27.7 billion, or 37%, and EUR 11.0 billion, or 15%, respectively, with the remaining 2% being funded by issuance of credit-linked certificates of indebtedness in connection with securitization transactions and Schuldscheindarlehen. Total capital-market funding in 2009 amounted to EUR 74.7 billion, almost unchanged compared to EUR 75.3 billion in 2008.
KfW’s core currencies are the euro, the U.S. dollar, the pound sterling and the Japanese yen, which together accounted for 90% of KfW’s total new capital-market funding in 2009. While the percentage of new funds raised in euro and U.S. dollar have remained almost unchanged compared to 2008, the relative importance of pound sterling decreased from 12% to 7%, while that of Japanese yen increased from 2% to 4%. In 2009, KfW’s total new capital-market funding was raised in 19 different currencies and 420 separate capital market transactions.
32

KFW’S TOTAL NEW CAPITAL-MARKET FUNDING VOLUME 2009 BY CURRENCIES
KfW expects the volume of funding to be raised in the capital markets in 2010 to be in a range of approximately EUR 70 billion to EUR 75 billion.
The most important source of capital-market funding for KfW Bankengruppe are bond and note issues. As of December 31, 2009, the amount of outstanding bonds and notes issued by KfW totaled EUR 289.0 billion, representing a EUR 17.4 billion increase from EUR 271.6 billion outstanding as of December 31, 2008. The amount of new bonds raised in the capital markets was EUR 73.0 billion in 2009 compared with EUR 74.1 billion in 2008.
In 2009, KfW issued four bonds in a total principal amount of EUR 19 billion under its euro benchmark program and six new notes in a total principal amount of USD 21 billion under its U.S. dollar program. The first euro benchmark bond in 2009 with a total principal amount of EUR 6 billion had a maturity of 10 years and was KfW’s largest bond issue ever. Besides the benchmark issues, two additional global bonds (one denominated in Canadian dollars and one denominated in Egyptian pounds) were issued by KfW in 2009.
KFW’S BENCHMARK BOND ISSUES IN 2009
Of outstanding borrowings, Schuldscheindarlehen continue to be KfW’s second most important capital-market funding instrument, with EUR 14.4 billion outstanding as of December 31, 2009, of which EUR 3.1 billion was included on KfW’s consolidated balance sheet in liabilities to banks and EUR 11.3 billion in liabilities to customers. Schuldscheindarlehen are a special instrument of the German capital market, whereby the lending entity, generally a bank, insurance company or public pension fund, receives a certificate evidencing its loan to the borrower and the terms of such loan. Maturities on Schuldscheindarlehen range from one to 30 years, thereby providing a high degree of flexibility to both the borrower and the lender. Transferable only by way of assignment, Schuldscheindarlehen have only limited liquidity in the interbank secondary market.
The following table sets forth summary information concerning KfW’s outstanding bonds and notes as well as Schuldscheindarlehen with an initial maturity of more than one year and issued in the capital markets.
33
EUR in billions In % of total
Euro (EUR) 32.8 44U.S. dollar (USD) 25.7 34Pound sterling (GBP) 5.6 7Japanese yen (JPY) 2.8 4Other currencies (e.g., AUD, NOK and CHF) 7.8 11
Total 74.7 100
Principal amount Interest rate in billions Initial maturity (in years) in % per annum
U.S. $-Benchmark I/2009 USD 5.0 3 2.000U.S. $-Benchmark II/2009 USD 2.0 2 1.875 U.S. $-Benchmark III/2009 USD 5.0 5 3.500U.S. $-Benchmark IV/2009 USD 3.0 3 2.250U.S. $-Benchmark V/2009 USD 3.0 10 4.875U.S. $-Benchmark VI/2009 USD 3.0 5 2.750Euro-Benchmark I/2009 EUR 6.0 10 3.875Euro-Benchmark II/2009 EUR 5.0 5 3.125Euro-Benchmark III/2009 EUR 5.0 3 2.250 Euro-Benchmark IV/2009 EUR 3.0 7 3.125

INFORMATION ON ISSUES OF FUNDED DEBT OF KFW BANKENGRUPPE (AS OF DECEMBER 31, 2009)
34
Average interest Average rate in % Year time to Principal amount Principal amount Number of Interest per annum of Year of maturity outstanding outstanding
Currency transactions type (1) (2) issue maturity in years (2) in currency in EUR (3) AUD 21 FIXED 5.78 2003 - 2009 2010 - 2028 4.0 12,874,820,000 8,042,741,129 AUD 2 FLOATING 1.07 2008 - 2009 2012 - 2015 4.9 167,370,000 104,553,973 BGN 1 FLOATING NA 2007 2012 2.9 10,000,000 5,112,997 BRL 1 FIXED NA 2006 2017 7.7 350,000,000 139,575,690 BRL 11 FLOATING NA 2005 - 2009 2010 - 2014 1.4 1,790,000,000 713,829,957 CAD 12 FIXED 4.37 2004 - 2009 2010 - 2037 9.1 4,397,000,000 2,906,530,936 CAD 1 FLOATING 0.54 2009 2012 3.0 350,000,000 231,359,069 CHF 13 FIXED 2.96 2000 - 2009 2011 - 2037 7.8 5,505,000,000 3,710,568,887 CHF 3 FLOATING 0.20 2007 - 2009 2010 - 2011 1.1 320,000,000 215,691,561 DEM 1 FIXED NA 1993 2023 13.3 105,985,000 54,189,270EGP 2 FLOATING NA 2007 - 2009 2010 - 2012 0.9 1,325,000,000 167,693,287 EUR 271 FIXED 3.77 1980 - 2009 2010 - 2044 4.5 126,510,496,325 126,510,496,325 EUR 310 FLOATING 2.00 1997 - 2009 2010 - 2057 14.2 15,645,589,191 15,645,589,191 GBP 29 FIXED 5.02 1999 - 2009 2010 - 2037 6.5 30,500,156,000 34,343,155,050 GBP 39 FLOATING 0.93 1999 - 2009 2010 - 2061 13.8 1,382,301,376 1,556,470,416 GHS 1 FLOATING NA 2008 2010 0.3 20,000,000 9,664,170 HKD 10 FIXED 1.77 2003 - 2009 2010 - 2017 3.0 1,631,000,000 146,004,351 HKD 2 FLOATING 0.26 2008 - 2009 2010 - 2012 2.0 2,180,000,000 195,149,898 HUF 3 FIXED 6.50 2005 - 2008 2010 - 2012 0.9 50,500,000,000 186,746,542 IDR 5 FLOATING NA 2007 - 2009 2011 - 2012 2.4 1,460,500,000,000 107,985,213 ISK 5 FIXED 9.76 2006 - 2008 2010 - 2017 0.7 18,500,000,000 63,793,103JPY 47 FIXED 1.81 1995 - 2009 2010 - 2038 6.4 739,229,000,000 5,551,434,365 JPY 909 FLOATING 0.43 1996 - 2009 2010 - 2039 16.9 1,575,234,000,000 11,829,633,523
MXN 2 FIXED 9.22 2005 - 2006 2010 - 2011 0.7 2,050,000,000 108,739,413 MYR 2 FIXED 4.29 2006 - 2007 2013 - 2017 5.2 805,000,000 163,199,604 NGN 2 FLOATING NA 2007 - 2008 2010 - 2011 0.9 33,523,000,000 155,910,053 NOK 30 FIXED 5.03 2002 - 2009 2010 - 2036 5.4 41,810,000,000 5,037,349,398 NOK 3 FLOATING 1.83 2007 - 2009 2010 - 2011 0.6 2,550,000,000 307,228,916 NZD 13 FIXED 6.40 2005 - 2009 2010 - 2015 2.5 3,593,000,000 1,814,371,560 NZD 1 FLOATING 3.32 2009 2010 - 2012 2.4 150,000,000 75,746,099 PLN 1 FIXED 4.50 2006 2025 15.1 57,058,306 13,901,402 RON 3 FIXED 10.14 2007 - 2009 2010 - 2014 1.3 285,000,000 67,275,689 RUB 3 FIXED 6.21 2007 - 2008 2010 - 2012 2.1 9,000,000,000 208,555,406SEK 6 FIXED 4.39 2006 - 2009 2012 - 2017 6.8 4,450,000,000 434,061,647 SEK 2 FLOATING 0.31 2008 2010 - 2015 3.3 2,200,000,000 214,592,275 SGD 2 FIXED 1.87 2009 2011 - 2012 2.4 850,000,000 420,917,104 THB 1 FIXED 3.87 2007 2010 0.6 3,000,000,000 62,561,910 TRY 14 FIXED 13.65 2005 - 2009 2010 - 2017 2.0 2,210,000,000 1,025,664,826 USD 242 FIXED 3.46 1993 - 2009 2010 - 2047 5.9 100,578,924,441 69,817,384,729 USD 57 FLOATING 0.49 2004 - 2009 2010 - 2035 2.5 10,885,227,116 7,556,037,148 ZAR 11 FIXED 8.23 2005 - 2008 2010 - 2015 1.6 7,777,120,000 729,150,572
Total 2,094 6.1 300,650,616,654

As a result of various governmental rescue and stimulus packages implemented worldwide in response to the global economic and financial crisis, the supply of bond issuances by sovereigns and issuers benefiting from state guarantees remained high. These market conditions have overall led to increased refinancing costs for KfW compared to pre-crisis levels, especially in the first half of 2009. Market conditions normalized in the second half of 2009.
Money-Market Funding. Commercial paper is issued under two commercial paper programs: the multicurrency commercial paper program; and the U.S. dollar commercial paper program. The multicurrency commercial paper-program represents the most important source of short term liquidity for KfW. As of December 31, 2009, KfW Bankengruppe’s commercial paper outstanding totaled EUR 32.5 billion compared with EUR 30.9 billion at the end of 2008.
Public Funds. The proportion of public funds in the group’s borrowings was 3% at the end of 2009. The most important source of public funds for KfW is the budget of the Federal Republic. Total long-term and short-term borrowings from funds provided by the federal budget (excluding loans on a trust basis) amounted to EUR 11.5 billion as of December 31, 2009, including EUR 9.5 billion in borrowings which were transferred from the ERP Special Fund due to its reorganization with effect as of July 1, 2007. The group’s long-term and short-term borrowings from the ERP Special Fund amounted to EUR 168 million as of December 31, 2009. Public funds are made available to the group for use in special categories of KfW’s domestic activities and certain export and project finance transactions with developing countries. Public funds are particularly important in the area of financial cooperation, where KfW Entwicklungsbank extends loans and disburses grants to foreign public sector borrowers and recipients in developing and transition countries. Public funds constituted approximately 42% of the sources of funding for KfW Entwicklungsbank’s commitments in 2009.
Asset Management
As of December 31, 2009, KfW Bankengruppe held financial assets in an amount of EUR 36.7 billion compared with EUR 44.2 billion in 2008. See “Financial Section—Financial Review—Development of KfW Group—Development of Assets” for more information concerning financial assets. EUR 22.0 billion, or 60%, of all financial assets were held in the form of negotiable securities for liquidity purposes. The remaining financial assets were securities held as surrogate for loans or as equity investments in the context of KfW’s promotional business (e.g., ABS Portfolio or DEG’s direct investments), as well as liquidation portfolios. Finally, equity participations held, directly or indirectly, by KfW made up only a very limited amount of the group’s financial assets. The following table presents the amounts of financial assets held at the end of 2009 for the group’s most important securities portfolios.
KfW BANKENGRUPPE’S MOST IMPORTANT ASSET MANAGEMENT PORTFOLIOS
Liquidity Portfolios. KfW pursues a conservative liquidity management strategy. For this purpose, KfW and its subsidiaries hold financial assets in various securities portfolios. The bulk of securities held in these portfolios are denominated in euro, with the remainder denominated in U.S. dollar. The portfolios are managed by KfW’s Treasury Department. For its liquidity portfolios, which KfW holds as liquidity reserve, KfW purchases money-market assets and short- and medium-term securities of public sector issuers as well as bonds issued by banks and other borrowers of high credit quality. The bulk of euro-denominated bonds included in
35
(1) Interest rate of floating rate note means the applicable interest rate as of December 31, 2009. Floating rate notes for which the interest rate is fixed in arrears are not included in the calculation of the weighted average of the interest rate.
(2) Averages have been calculated on a capital-weighted basis taking into account the principal amount outstanding in euro.
(3) Conversion into euro at the spot rate using the European Central Bank reference rates on December 31, 2009.
EUR in billions as of December 31, 2009
Liquidity portfolios 22.0Liquidation portfolios 3.5
of which managed by external portfolio managers 3.3
Total 25.5

KfW’s liquidity portfolio is eligible as collateral with the European Central Bank and enables KfW to enter into repurchase agreements in refinancing operations within the European System of Central Banks via the Deutsche Bundesbank. At the end of 2009, KfW held securities in the aggregate amount of EUR 22.0 billion in its liquidity portfolios. For financial reporting purposes, securities denominated in U.S. dollar were converted into euro at the currency exchange rate as of December 31, 2009. In addition to these securities, as of December 31, 2009, KfW held money-market assets (overnight and term loans as well as reserve repurchase transactions) for liquidity management purposes in the amount of EUR 22.1 billion.
Liquidation Portfolios. Due to changes in its asset management strategy, KfW reduced the investment of a portion of its own funds in securities, or income portfolios. As a result, in 2009 income portfolios have been restructured into liquidation portfolios, while some assets have been transferred from externally managed income portfolios to KfW’s internal asset management. In addition, the number of external portfolio managers has been reduced. The remaining amount invested in liquidation portfolios denominated in euro and U.S. dollars amounted to EUR 3.5 billion as of December 31, 2009 and is managed by external managers and, to a lesser extent, by KfW. The liquidation portfolios include securities held by KfW in connection with the rescue measures implemented in 2008 for Hypo Real Estate Group, a private banking group headquartered in Munich, Germany, as well as securities formerly owned by IKB Deutsche Industriebank (“IKB”), Germany, which were transferred to KfW in the course of the IKB rescue. As previously reported, IKB had seriously been affected by the crisis in the U.S. subprime mortgage market, which resulted in KfW, which at the time held a stake in IKB, together with several of the German banking associations providing substantial support and risk protection to IKB in 2007 and 2008. Some of the support measures are still in place. As previously disclosed, KfW agreed to assume specified portfolio and legal risks in connection with the sale of its stake in IKB in October 2008. For more information on the risk protection, support measures and sale of KfW’s interest in IKB, see Note 11 to the financial statements.
Privatization Initiatives
In furtherance of the privatization initiatives of the Federal Government, KfW has acquired and sold shares of both Deutsche Telekom AG and Deutsche Post AG in various transactions since 1997. KfW sold those shares through, among other transactions, German and international public offerings, private placements, block trades, exchangeable bonds and other transactions. Pursuant to an arms-length agreement with the Federal Government, KfW is protected against the market risk of these transactions. The agreement provides that KfW will receive a percentage of any market value increase in the shares acquired and sold, plus a fee for its services.
In the case of Deutsche Telekom AG, the number of shares held by KfW remained unchanged in 2009. As of December 31, 2009, KfW held 735.7 million shares of Deutsche Telekom AG, which represented a stake of approximately 16.9%. To KfW’s knowledge, the Federal Republic continued to hold a direct stake of approximately 14.8% in Deutsche Telekom AG as of December 31, 2009.
In the case of Deutsche Post AG, the number of shares held by KfW remained unchanged in 2009. As of December 31, 2009, KfW held 368.3 million ordinary registered shares of Deutsche Post AG, which represented a stake of approximately 30.5%. To KfW’s knowledge, the Federal Republic does not hold any shares in Deutsche Post AG. In July 2009, KfW issued exchangeable bonds due in July 2014 in an aggregate principal amount of EUR 750 million, which are exchangeable into ordinary registered shares of Deutsche Post AG. Upon exchange in full of these bonds, KfW’s ownership interest in Deutsche Post AG would be reduced by approximately 54.1 million ordinary registered shares.
Given the aforementioned agreement with the Federal Government, KfW’s holdings in shares of Deutsche Post AG and Deutsche Telekom AG are not included in financial assets, but are presented on KfW’s consolidated balance sheet as loans and advances to customers.
The Federal Government may sell further stakes in Deutsche Telekom AG to KfW in 2010. KfW expects its holdings in Deutsche Telekom AG and Deutsche Post AG shares to be reduced in the medium term.
36

Others
Following the reorganization of KfW’s business areas in 2009, “Others” primarily comprises strategic shareholdings and advisory services as well as certain other services provided by KfW for or on behalf of the Federal Government in connection with activities associated with Germany’s reunification. For purposes of KfW’s segment reporting, these activities are reported under the item “Group centre.” See Note 37 to the financial statements.
Strategic Shareholdings
KfW generally holds its subsidiaries and equity participations that are subject to German taxation through its two investment holding companies: KfW Beteiligungsholding GmbH; and KfW IPEX-Beteiligungsholding GmbH.
KfW Beteiligungsholding. As of December 31, 2009, the assets of KfW Beteiligungsholding GmbH consisted of a 100% stake each in Finanzierungs- und Beratungsgesellschaft mbH, ASTRA-Grundstücksgesellschaft mbH and tbg Technologie-Beteiligungs-Gesellschaft mbH. In addition, KfW Beteiligungsholding GmbH holds a 13.0% stake in Dedalus GmbH & Co. KGaA (“Dedalus”), which, in turn, indirectly holds a 7.5% economic stake (the “EADS stake”) in European Aeronautic Defence Space Company EADS N.V (“EADS”), a European aerospace and defense company, which holds, among other participations, a majority interest in Airbus S.A.S., the European aircraft manufacturer. In 2007, KfW, together with 14 other investors, had agreed to acquire jointly from DaimlerChrysler group the EADS stake; the economic interest in the EADS stake is held through Dedalus. As a result, KfW is exposed to the economic risk equivalent to holding an equity stake of approximately 0.975% in EADS. The interests of KfW and the 14 other investors in the partnership and the EADS stake are subject to various resale restrictions. KfW and the 14 other investors benefit from a special dividend distribution. Voting rights in the EADS stake remain with the Daimler group, and neither KfW nor any of the other investors are entitled — either directly or indirectly — to exercise any voting rights attached to the EADS stake. The investment of KfW Bankengruppe in EADS, which was recorded on KfW’s balance sheet in an amount of EUR 80 million as of December 31, 2009, was made under a special mandate of the Federal Government in accordance with section 2 paragraph 4 of the KfW Law, which authorizes the Federal Government to direct KfW to take measures in connection with matters in which the Federal Republic has an interest (Zuweisungsgeschäft).
KfW IPEX-Beteiligungsholding. KfW IPEX-Beteiligungsholding GmbH was established in 2005 to become the holding company for KfW IPEX-Bank GmbH’s participations. KfW IPEX-Beteiligungsholding GmbH holds KfW IPEX-Bank GmbH itself, which commenced operations as a legally independent subsidiary of KfW as of January 1, 2008. In addition, KfW IPEX-Beteiligungsholding GmbH holds a 5.1% share in Movesta Lease and Finance GmbH (“Movesta”), after having sold a 44.9% stake in Movesta to Timaso Verwaltung GmbH, a subsidiary of LHI Leasing GmbH, in 2009. In connection with this transaction, KfW IPEX-Beteiligungsholding GmbH, via its subsidiary KfW IPEX-Bank GmbH, acquired a 50% stake in MD Capital Beteiligungsgesellschaft mbH from Movesta.
Advisory Services
KfW offers advisory support to individuals and enterprises to facilitate better understanding of the German Federal Government’s various business-related promotional programs. In addition, a regional advisory service (Beratungssprechtage) provides entrepreneurs and SMEs with assistance in conducting in-depth analyses of their investment and business plans. This service is offered in cooperation with other institutions engaged in economic promotion (regional promotional banks, chambers of commerce, chambers of crafts, etc.). By partially funding coaching and advisory services, KfW supports individual entrepreneurs in the early start-up phase of their business ventures, as well as SMEs in determining the necessary steps to effect a turnaround in case of temporary crisis.
In 2009, KfW extended EUR 98 million in grants for advisory services, compared with EUR 37 million in 2008.
Other Services
KfW provides services for and on behalf of the Federal Government in connection with activities associated with Germany’s reunification. KfW administers certain claims transferred to the Federal Government under the 1990 Unification Treaty between the Federal Republic and the former GDR and performs other services in connection with the assets and obligations taken over from the former GDR. In 2009, KfW continued to make progress in resolving the remaining open cases, claims and accounts.
37

CAPITALIZATION
CAPITALIZATION OF KFW BANKENGRUPPE AS OF DECEMBER 31, 2009
38
(EUR in millions)
Borrowings Short-term funds 33,121Bonds and other fixed-income securities 288,950Other borrowings 30,273Subordinated liabilities (1) 3,247
Total borrowings 355,591
Equity Paid-in subscribed capital (2) 3,300 Capital reserve (3) 5,947Reserve from the ERP Special Fund 893Retained earnings 4,725Fund for general banking risks 46Revaluation reserve -290Balance sheet profit/loss -1,499
Total equity 13,121
Total capitalization 368,712
(1) Includes assets transferred from the ERP Special Fund in form of a subordinated loan of EUR 3,247 million.
(2) KfW’s equity capital, 80% of which is held by the Federal Government and the remaining 20% by the Länder, amounted to EUR 3,750 million in 2009, of which EUR 3,300 million has been paid in pro rata by the Federal Government and the Länder.
(3) Includes equity capital in form of a promotional reserve (Förderrücklage) from the ERP Special Fund of EUR 4,650 million.

MANAGEMENT AND EMPLOYEES
The bodies of KfW are the Managing Board (Vorstand) and the Board of Supervisory Directors (Verwaltungsrat).
Managing Board
The Managing Board is responsible for the day-to-day conduct of KfW’s business and the administration of its assets. Members of the Managing Board are full-time employees of KfW and are generally appointed for five-year terms of office by the Board of Supervisory Directors. Reappointment is permitted. Each Managing Director is responsible for certain aspects of KfW’s activities but shares the responsibility for all actions taken by the Board.
The names of the current members of the Managing Board and the dates of their initial appointments to the Board are set forth below:
In 2009, KfW’s Board of Supervisory Directors appointed two new members of KfW’s Managing Board: Mr. Dr. Axel Nawrath, previously State Secretary in the Federal Ministry of Finance, took office on April 1, 2009; and Mr. Bernd Loewen, who previously served as member of the management board and head of investment banking of BRE Bank SA, Warsaw/Poland, a subsidiary of Commerzbank AG, took office on July 1, 2009.
On September 30, 2009, Mr. Wolfgang Kroh retired from his functions. Mr. Kroh had been member of the Managing Board since December 1, 2000 and acted as provisional official Spokesman of the Managing Board from April 7, 2008 to August 31, 2008. Mr. Kroh was not replaced; instead, his responsibilities were allocated to the remaining members of the Managing Board.
On October 22, 2008, the Office of the Public Prosecutor in Frankfurt am Main announced that it had initiated criminal investigations against members of KfW’s Managing Board for alleged breach of trust (Untreue) in connection with a currency swap payment to an affiliate of Lehman Brothers made by KfW on September 15, 2008 (the date of Lehman Brothers’ filing of a petition under Chapter 11 of the U.S. Bankruptcy Code). KfW is cooperating fully with the Office of the Public Prosecutor.
For information on the remuneration of the Managing Board, see Note 75 to the financial statements.
Board of Supervisory Directors
The Board of Supervisory Directors generally has 37 members and consists of the Federal Minister of Finance; the Federal Minister of Economics and Technology; the Federal Minister of Foreign Affairs; the Federal Minister of Food, Agriculture and Consumer Protection; the Federal Minister of Transport, Building and Urban Affairs; the Federal Minister for Economic Cooperation and Development; the Federal Minister for the Environment, Nature Conservation and Nuclear Safety; seven members appointed by the Bundesrat; seven members appointed by the Bundestag; five representatives of commercial banks; two representatives of industry; one representative each of the local municipalities, agriculture, crafts, trade and the housing industry; and four representatives of the trade unions. The representatives of the commercial banks, industry, the local municipalities, agriculture, crafts, trade, the housing industry and the trade unions are appointed by the Federal Government after consultation with their constituencies.
Following the German general elections held on September 27, 2009, the composition of KfW’s Board of Supervisory Directors changed —most notably as to its chairmanship. The Federal Minister of Finance and the Federal Minister of Economics and Technology are appointed on a year-by-year rotating basis as Chairman and Deputy Chairman of the Board of Supervisory Directors, with the latter serving as Chairman for the year
39
Name Date of Initial Appointment
Dr. Ulrich Schröder (Chief executive officer) September 1, 2008Dr. Günther Bräunig October 1, 2006Dr. Norbert Kloppenburg January 1, 2007Bernd Loewen July 1, 2009Dr. Axel Nawrath April 1, 2009

2010. The term of office of all Federal Ministers in KfW’s Board of Supervisory Directors directly depends on their term of office as a Federal Minister, while the other members of the Board of Supervisory Directors are appointed for three years.
The Board of Supervisory Directors supervises the overall conduct of KfW’s business and the administration of its assets. It may give the Managing Board general or special directives. In particular, the Board of Supervisory Directors approves all loan commitments to a single borrower exceeding EUR 100 million and may reserve the right to approve other transactions or types of transactions. It is not, however, authorized to represent KfW or to commit funds on KfW’s behalf.
The Board of Supervisory Directors has a Credit Committee (Kreditbewilligungsausschuss), an Executive Committee (Präsidialausschuss), and an Audit Committee (Prüfungsausschuss). The Credit Committee approves all loan commitments to a single borrower in an amount of between EUR 50 million and EUR 100 million. The Executive Committee is responsible for the handling of legal and administrative matters as well as for business and corporate policy matters of general importance. It may take decisions on the Board of Supervisory Directors’ behalf in urgent matters (Eilentscheidung). The Audit Committee prepares matters relating to financial reporting and risk management but does not have any decision-making power. While the Chairman of the Board of Supervisory Directors simultaneously acts as Chairman of the Executive Committee and the Credit Committee, the Audit Committee is chaired by a representative of the banking sector.
The current members of the Board of Supervisory Directors are:
40
Name PositionIlse Aigner Federal Minister of Food, Agriculture and Consumer ProtectionAnton F. Börner
President of the Bundesverband Großhandel, Außenhandel, Dienstleistungen (BGA) e.V.; representative of the wholesale and foreign trade sector
Christian Brand
Chairman of the Board of Managing Directors of L-Bank, Landeskreditbank Baden-Württemberg; representative of the mortgage banks
Rainer Brüderle Federal Minister of Economics and Technology; Chairman in 2010Frank Bsirske Chairman of ver.di – Vereinigte Dienstleistungsgewerkschaft; representative of the trade unionsProf. Dr. Hans Heinrich
Driftmann President of the Deutscher Industrie- und Handelskammertag (DIHK) e.V.; representative of the industry
Prof. Dr. Kurt Faltlhauser Former Minister of Finance of the Free State of Bavaria, appointed by the BundesratAxel Gedaschko Senator for economics and labour in the city state of Hamburg; appointed by the BundesratHeinrich Haasis President of the Deutscher Sparkassen- und Giroverband; representative of the savings banksHubertus Heil Member of Parliament; appointed by the BundestagGerhard P. Hofman
Member of the Board of Managing Directors of Bundesverband der Deutschen Volksbanken und Raiffeisenbanken e.V. (BVR); representative of the cooperative banks
Bartholomäus Kalb Member of Parliament, appointed by the BundestagRoland Koch Minister President of the State of Hesse, appointed by the BundesratDr. h.c. Jürgen Koppelin Member of Parliament, appointed by the BundestagMonika Kuban
Permanent Representative of the Executive Director of the Deutscher Städtetag; representative of the local municipalities
Karoline Linnert Senator for finance in the city state of Bremen; appointed by the BundesratDr. Helmut Linssen Minister of Finance of the State of Northrhine-Westphalia, appointed by the BundesratDr. Gesine Lötzsch Member of Parliament, appointed by the BundestagClaus Matecki
Member of the Federal Executive Committee of Deutscher Gewerkschaftsbund; representative of the trade unions
Dr. Michael Meister Member of Parliament, appointed by the BundestagFranz-Josef Möllenberg Chairman of the Gewerkschaft Nahrung-Genuss-Gaststätten; representative of the trade unionsHartmut Möllring Minister of Finance of the State of Lower Saxony, appointed by the BundesratDirk Niebel Federal Minister for Economic Cooperation and DevelopmentDr. Peter Ramsauer Federal Minister of Transport, Building and Urban Development

See Note 75 to the financial statements for information concerning the remuneration of the Board of Supervisory Directors.
Employees
In 2009, KfW Bankengruppe employed an average of 4,265 persons (excluding Managing Directors and trainees, but including temporary personnel), compared to 4,228 persons in 2008. Approximately 29% of KfW’s staff is covered by collective bargaining agreements. KfW provides employee benefits such as pensions to its employees.
Of KfW Bankengruppe’s staff, approximately 21% is engaged in KfW’s domestic business activities, 21% in promotion of developing and transition countries, 12% in export and project finance, and the balance in KfW’s accounting, disbursements, collateral, funding and lending support departments and in general administrative and staff functions.
See Note 74 to the financial statements for more information concerning KfW Bankengruppe’s employees.
41
Name PositionDr. Norbert Röttgen Federal Minister for the Enviroment, Nature Conservation and Nuclear SafetyAlexander Rychter
Chairman of the Verband der Wohnungs- und Immobilienwirtschaft Rheinland-Westfalen e.V.; representative of the housing sector
Dr. Wolfgang Schäuble Federal Minister of Finance, Deputy Chairman in 2010Christine Scheel Member of Parliament, appointed by the BundestagHanns-Eberhard Schleyer Representative of the craftsAndreas Schmitz President of the Bundesverband Deutscher Banken e.V.; representative of the commercial banksDr. Werner Schnappauf Director General of Bundesverband der Deutschen Industrie e.V.; representative of the industryCarsten Schneider Member of Parliament; appointed by the BundestagMichael Sommer Chairman of the Deutscher Gewerkschaftsbund; representative of the trade unionsGerhard Sonnleitner President of the Deutscher Bauernverband e.V.; representative of the agricultural sectorMarion Walsmann Minister of Finance of the Free State of Thuringia; appointed by the BundesratDr. Guido Westerwelle Federal Minister of Foreign Affairs

FINANCIAL SECTION
Financial Statements and Auditors
The consolidated financial statements of KfW included in this annual report have been prepared in accordance with International Financial Reporting Standards as adopted by the EU (“IFRS”) and the additional requirements of German commercial law pursuant to § 315a (1) of the German Commercial Code (Handelsgesetzbuch, or HGB) and supplementary provisions of the KfW Law and the by-laws of KfW. IFRS differs in certain significant respects from accounting principles generally accepted and financial reporting practices followed in the United States (“U.S. GAAP”), and, as a result, KfW’s consolidated financial statements included in this annual report may differ substantially from financial statements prepared in accordance with U.S. GAAP.
Pursuant to the KfW Law, the annual financial statements of KfW are examined by a Wirtschaftsprüfer (Certified Public Accountant) who is appointed by the Federal Minister of Finance in consultation with the Board of Supervisory Directors and the Federal Court of Auditors (Bundesrechnungshof). KfW’s external auditors for the fiscal year 2009 are KPMG AG Wirtschaftsprüfungsgesellschaft (“KPMG”), a member firm of KPMG International.
The annual audit is conducted in accordance with German Generally Accepted Auditing Standards (“German GAAS”).
The auditor’s report of KPMG for the year ended December 31, 2009, dated March 12, 2010, refers to a group management report (Konzernlagebericht). The examination of, and the auditor’s report upon, this group management report are required under German GAAS. This examination was not made in accordance with U.S. generally accepted auditing standards (“U.S. GAAS”) or U.S. attestation standards. Therefore, KPMG does not provide any opinion on the aforementioned examination, on the group management report or on the financial statements included in this annual report in accordance with U.S. GAAS or U.S. attestation standards.
42

Financial Review
Overview of the KfW Group
The KfW Group consists of KfW and six consolidated subsidiaries. In addition to KfW, the Group’s main subsidiaries involved in operating business are KfW IPEX-Bank and DEG. KfW Finance concluded its refinancing activities for KfW in financial year 2008 and thus is no longer included in the Group.
With the realignment of the Group’s investment strategy in 2009, the number of special funds responsible for strategic asset management that are included in the consolidated financial statements in accordance with the requirements of SIC-12 was reduced from five to three. The special fund established in connection with the IKB sale in order to acquire portfolio investments in 2008 continues to be included in the Group.
The development of the Group’s operating result is largely dependent on the financial performance of KfW.
COMPOSITION OF THE KFW GROUP
Development of the KfW Group
Despite the ongoing global economic and financial crisis in 2009, the KfW Group returned to profitability with a consolidated profit of EUR 1.1 billion following two years of losses due to the IKB rescue. Business performance in 2009 was largely characterized by the following developments:
43
As of December 31, 2009 2008 (EUR in millions)Total assets (before consolidation) KfW 400,305 395,486Subsidiaries:
KfW IPEX-Bank GmbH, Frankfurt am Main/Germany (KfW IPEX-Bank) 25,787 28,338DEG — Deutsche Investitions- und Entwicklungsgesellschaft mbH, Cologne/Germany (DEG) 3,710 3,825KfW IPEX-Beteiligungsholding GmbH, Frankfurt am Main/Germany 1,873 1,887KfW Beteiligungsholding GmbH, Bonn/Germany 1,043 747tbg Technologie-Beteiligungs-Gesellschaft mbH, Bonn/Germany (tbg) 397 431Finanzierungs- und Beratungsgesellschaft mbH, Berlin/Germany (FuB) 44 49KfW International Finance Inc., Delaware/USA (KfW Finance) — 0
Special purpose entities required to be consolidated: Special funds 3,323 5,912
Investments accounted for using the equity method: Movesta Lease and Finance GmbH, Düsseldorf/Germany (50%) — 141Railpool Holding GmbH & Co KG, Munich/Germany (50%) 283 106Railpool GmbH, Munich/Germany (50%) 3 —Microfinance Enhancement Facility S.A., Luxembourg (16.7%) 86 —
A. The continuation of a significant volume of promotional business with a record volume of domestic financing, including the use of the KfW Sonderprogramm as part of the Federal Government’s extensive support of the German economy to combat the consequences of the recession;
B. A strong operating result in 2009, which benefited throughout the year from KfW’s favorable refinancing situation, particularly in the short-term segment;
C. A considerable increase in risk provisions for lending business, particularly in the business areas of the KfW Group that were most affected by the global economic and financial crisis;
D. The recovery of the securities portfolio, as market values of securities rose with the return of liquidity to the financial markets in 2009, thus contributing to profits.

A. Significant Promotional Business Volume. The Group expanded its domestic promotion of the German economy, the environment, housing and education by EUR 5.5 billion in 2009 to a record volume of EUR 50.9 billion, thus making a significant contribution to alleviating the effects of the economic crisis in Germany. By contrast, total financing volume decreased due to the crisis but nevertheless remained relatively high at EUR 63.9 billion. Due to the difficult market environment with significantly lower borrowing demand, the new business volume of EUR 8.9 billion in the area of export and project finance was, as expected, far below the exceptional level seen in 2008 (EUR 17.6 billion).
Domestic financing volume includes KfW commitments under special economic stimulus programs in the amount of EUR 7.2 billion, which were granted primarily to SMEs and thus made an important contribution to the stabilization of economic conditions and the safeguarding of jobs. These lending programs are part of the economic stimulus packages initiated by the Federal Government and are guaranteed by the Federal Republic of Germany.
For more information on the promotional business volume by each business area see “Business—Introduction.”
B. Strong Operating Result. The operating result before valuation developed positively growing by EUR 706 million, or 47%, to EUR 2,198 million.
The main factor contributing to this growth was the Group’s net interest income, which rose considerably despite continued significant interest rate reductions of EUR 571 million. The Group benefited, in particular, from the highly favorable refinancing conditions in the short-term segment that arose following the monetary policy stabilization measures taken by central banks as well as from KfW’s strong credit ratings.
The Group’s cost/income ratio before interest rate reductions improved from 23.5% to 21.1%.
C. Increasing Risk Provisions for Lending Business. The Group’s credit risks accelerated during the course of 2009, reflecting the gradual spread of the financial crisis to the real economy. In view of the state of the market, risk provisions for the lending business were markedly increased by EUR 972 million in 2009 and were thus maintained at a level in line with the Group’s conservative risk policy. For further details and risk provisions in 2008 relating to IKB see Note 28 to the financial statements.
Individual impairments were recognized to account for immediate lending risks, particularly in the export and project finance business area. However, support for domestic SMEs and promotion for developing and transition countries also led to higher risk provisions. Collective impairments for latent risks in the loan portfolio were substantially increased in view of the current economic situation and take into account those sectors and countries that were particularly hard-hit by the recession.
D. Stabilization of the Financial Markets. Conditions in the financial markets improved considerably over the course of 2009 as a result of the stabilization measures taken by governments and central banks. Whereas markets for nearly all classes of securities had largely dried up in 2008, with high risk and liquidity premiums, even for good counterparties, being the norm, prices gradually recovered during the course of 2009 as investor confidence returned. Accordingly, by mid-year, the Group no longer had to calculate the fair value of its securities portfolios on the basis of models rather than using market prices.
The Group’s investment strategy was re-examined in light of the knowledge gained from the global financial crisis and was realigned in 2009. The priority became ensuring clear internal responsibility for individual asset classes, as well as the investment goal of securing liquidity. This entails a reduction of the securities portfolio.
In addition, at the beginning of 2009, the securities that serve to maintain liquidity – through their use in repurchase or open market transactions with the European Central Bank – were reclassified from the available-for-sale financial assets category to the loans and receivables category with a fair value of EUR 18.2 billion.
Overall in 2009, the Group’s securities portfolio, which was reduced by EUR 7.6 billion to EUR 35.4 billion, yielded positive effects totaling EUR 296 million on the income statement. Moreover, reversals of impairment losses totaling EUR 285 million were directly recognized in equity, considerably improving revaluation reserves.
44

Despite the normalization of the financial markets, IFRS-related effects in the valuation of derivatives burdened results during the year in the amount of EUR 305 million. As a non-trading book institution, KfW uses derivatives exclusively to hedge risks that arise, in particular, in connection with refinancings. Accordingly, the resulting effects on earnings were not economically meaningful, as such effects will offset each other again in future periods.
The following key financial data provide an overview of the developments in 2009 and are explained in more detail below:
KEY FINANCIAL DATA FOR THE KFW GROUP
The consolidated total assets of the KfW Group increased by EUR 5.3 billion to EUR 400.1 billion in 2009. Loans and advances (EUR 317.7 billion) increased by EUR 4.0 billion. Short-term funds increased while securities and investments decreased. The growth in total assets resulted mainly from increased funding activities. The volume of certificated liabilities of EUR 321.4 billion was EUR 18.9 billion higher in 2009 than in the previous year.
45
As of December 31, 2009 2008 (1) (EUR in billions, except %)Balance sheet
Total assets 400 395Volume of lending 384 365Contingent liabilities 8 6Irrevocable loan commitments 50 35Assets held in trust 17 18Volume of business 475 454Equity 13 12 Equity ratio (%) 3.3% 3.0%
Year ended December 31, 2009 2008 (1) (EUR in millions, except %)Income statement
Operating result before valuation 2,198 1,492Operating result after valuation (2) 1,161 -2,838Consolidated profit/loss 1,127 -2,743Cost/income ratio before interest rate reductions (%) (3) 21.1% 23.5%
Economic key figures Consolidated profit/loss before IFRS effects from hedging 1,432 -2,179Change in revaluation reserves recognized directly in equity 261 -460
(1) Adjustment of previous year’s figures due to change in accounting policies (see corresponding information in the consolidated financial statements).
(2) After giving effect to the participation of the Federal Republic and the German banking sector in the IKB measures.
(3) Administrative expense in relation to adjusted income. Adjusted income is calculated by adding net interest income, net commission income and interest rate reductions.

The operating result before valuation developed very positively, increasing by EUR 706 million, or 47%, to EUR 2,198 million primarily due to the large increase in net interest income.
Despite high risk provisions for lending business totaling nearly EUR 1 billion, the Group recorded a consolidated profit of EUR 1,127 million, following two years of significant losses attributable to the IKB rescue. The consolidated profit was retained, thus improving the Group’s risk-bearing capacity as well as its future funding opportunities.
The consolidated comprehensive income amounted to EUR 1,388 million, including transactions recognized directly in group equity totaling EUR 261 million, which were mainly the result of securities valuations.
The consolidated profit includes IFRS charges not deemed economically meaningful in an amount of EUR 305 million (previous year: EUR 565 million). The consolidated profit adjusted for these effects amounted to EUR 1,432 million.
Development of Assets
The Group’s core business remains lending to banks and customers. 78% of the Group’s assets in 2009 were attributable to its lending business.
46

The volume of lending increased by EUR 18.5 billion, or 5%, to EUR 383.5 billion.
VOLUME OF LENDING
Loans and advances increased by EUR 4.0 billion to EUR 317.7 billion in 2009. Risk provisions for lending business decreased mainly as a result of defaults on liquidity lines related to the IKB rescue measures, which were already impaired in 2008. Net loans and advances totaled EUR 310.8 billion at year-end 2009, representing 81% of the volume of lending.
Contingent liabilities from financial guarantees stood at EUR 5.6 billion, slightly below the previous year’s level. Irrevocable loan commitments increased by EUR 15.0 billion to EUR 50.4 billion in 2009, particularly due to a high level of new commitments in the domestic promotional business. Within assets held in trust, the volume of loans and advances held in trust, which primarily comprise loans to support developing countries that are financed by federal budget funds provided by the Federal Republic of Germany, declined by 4% in 2009 over the previous year to EUR 16.8 billion.
At EUR 23.2 billion, other loans and advances to banks and customers were EUR 9.0 billion more than the 2008 value of EUR 14.2 billion. The increase particularly affected short-term funds, which were extended due to significantly higher loan commitments that had already been refinanced as well as for overall liquidity maintenance.
The total amount of securities and investments at year-end 2009 was EUR 36.7 billion, 17% below the level at the end of the previous year.
SECURITIES AND INVESTMENTS
The Group’s current investment strategy, which focuses on maintaining liquidity, has led to a reduction of the securities portfolio by EUR 7.6 billion to EUR 35.4 billion at year-end 2009. Bonds and other fixed-income securities, excluding money market securities, decreased by EUR 5.0 billion to EUR 35.1 billion in 2009. The value of money market securities decreased by EUR 2.3 billion to EUR 0.2 billion in 2009. The value of securities, a substantial portion of which are bonds and other fixed-income securities, held in the special funds that invest a portion of KfW’s own funds was also significantly reduced. At year-end 2009, the portfolio of such securities totaled EUR 3.0 billion. The value of structured securities directly held by KfW decreased by EUR 0.9 billion to EUR 4.5 billion. For more information on KfW’s asset management see “Business—Financial Markets—Asset Management.”
47
As of December 31, 2009 2008 Change (EUR in millions)Loans and advances 317,696 313,725 3,971Risk provisions for lending business -6,904 -7,604 700
Net loans and advances 310,793 306,122 4,671 Contingent liabilities from financial guarantees 5,637 5,996 -359Irrevocable loan commitments 50,360 35,390 14,970Loans and advances held in trust 16,757 17,533 -776
Total 383,546 365,040 18,506
As of December 31, 2009 2008 Change (EUR in millions) Bonds and other fixed-income securities 35,292 42,555 -7,263Shares and other non-fixed income securities 67 433 -366Equity investments 1,333 1,230 103 Shares in affiliated entities not included in the consolidated financial statements 2 2 0Investments accounted for using the equity method 15 8 7Shares in held-for-sale affiliated entities 0 0 0
Total 36,709 44,228 -7,519

The value of derivatives with positive fair values decreased by EUR 2.1 billion to EUR 19.6 billion. Value adjustments from macro hedging for underlying asset portfolios increased by EUR 1.3 billion to EUR 6.8 billion.
There were only minor changes to the other asset items on the statement of financial position.
Development of Liabilities and Shareholders’ Equity
The Group finances its operations in the international capital markets, particularly by means of benchmark bonds in euros and U.S. dollars, other public bonds and private placements. Funds raised in the form of certificated liabilities continued to play a key role, accounting for an increased share of 80% of total assets in 2009.
Borrowings increased by EUR 8.1 billion, or 2%, to EUR 355.6 billion at year-end 2009 and were the main source of funding for the expansion of the volume of business.
BORROWINGS
The Group’s principal sources of funding were medium- and long-term bonds and other fixed-income securities. In 2009, funds from these sources amounted to EUR 289.0 billion, representing an increase of EUR 17.3 billion and accounting for 81% of borrowings at year-end 2009. Short-term issues of commercial paper increased by EUR 1.5 billion to EUR 32.5 billion. Total short-term funds thus amounted to EUR 33.1 billion while time deposits and overnight money were reduced. Besides Schuldscheindarlehen, which declined by EUR 3.7 billion to EUR 14.4 billion compared with the previous year, other borrowings by KfW consisted mainly of liabilities to the Federal Republic of Germany. For more information on Schuldscheindarlehen see “Business—Financial Markets—Funding—Financial-Market Funds—Capital-Market Funding.”
Subordinated liabilities continue to include a subordinated loan totaling EUR 3.2 billion granted by the ERP Special Fund as part of the restructuring of the ERP economic promotion program in 2007.
The volume of derivatives with negative fair values decreased by EUR 3.8 billion, amounting to EUR 26.3 billion at year-end.
48
As of December 31, 2009 2008 Change (EUR in millions)Short-term funds 33,121 38,206 -5,084Bonds and other fixed-income securities 288,950 271,612 17,338 Other borrowings 30,273 34,386 -4,112Subordinated liabilities 3,247 3,247 0
Total 355,591 347,451 8,141

There were only minor changes to the other liability items on the balance sheet.
Equity increased by EUR 1.4 billion to EUR 13.1 billion at year-end 2009 compared with the end of the previous year. The equity ratio amounted to 3.3% compared with 3.0% at the end of the previous year.
EQUITY
Reversals of impairment losses to be directly recognized in equity relating to securities and investments in the available-for-sale financial assets category resulted in an increase in the revaluation reserves of EUR 0.3 billion.
The decrease of the balance sheet loss resulted from KfW’s unconsolidated net income for 2009 (EUR 1.7 billion) and from an offset out of the capital reserve in an amount of EUR 0.3 billion. The remaining EUR -0.6 billion resulting from the difference between KfW’s unconsolidated net income and the Group’s consolidated profit in 2009 (EUR 1.1 billion) reduced retained earnings.
Development of Earnings Position
The earnings position was characterized by the positive development in net interest income from the Group’s operating business. This was offset by the high level of risk provisions for lending business, while an overall positive earnings contribution resulted from the securities portfolio after charges in the previous year. Overall, no significant effects on earnings resulted in 2009 from the IKB rescue measures as compared with 2008 in which such measures burdened earnings by EUR 1.3 billion.
EARNINGS POSITION
49
As of December 31, 2009 2008 Change (EUR in millions)Paid-in subscribed capital 3,300 3,300 0Capital reserve 5,947 6,254 -307
of which promotional reserves from the ERP Special Fund 4,650 4,650 0 Reserve from the ERP Special Fund 893 848 45Retained earnings 4,725 5,269 -544Fund for general banking risks 46 50 -4Revaluation reserves -290 -551 261Balance sheet loss -1,499 -3,436 1,937
Total 13,121 11,733 1,388
As of December 31, 2009 2008 Change (EUR in millions) Net interest income 2,654 1,919 735
Including interest rate reductions -571 -606 35Net commission income 286 218 68 Administrative expense 742 646 97
Operating result before valuation 2,198 1,492 706Risk provisions for lending business -972 -2,139 1,167Net gains/losses from hedge accounting and other financial instruments at fair value through
profit or loss 55 -1,747 1,802 Net gains/losses from securities and investments -120 -1,974 1,854
Operating result after valuation 1,161 -4,368 5,529Net other operating income 23 1,536 -1,513
Profit/loss from operating activities 1,184 -2,832 4,016Taxes on income 57 -89 146
Consolidated profit/loss 1,127 -2,743 3,870Consolidated profit/loss before IFRS effects from hedging 1,432 -2,179 3,611
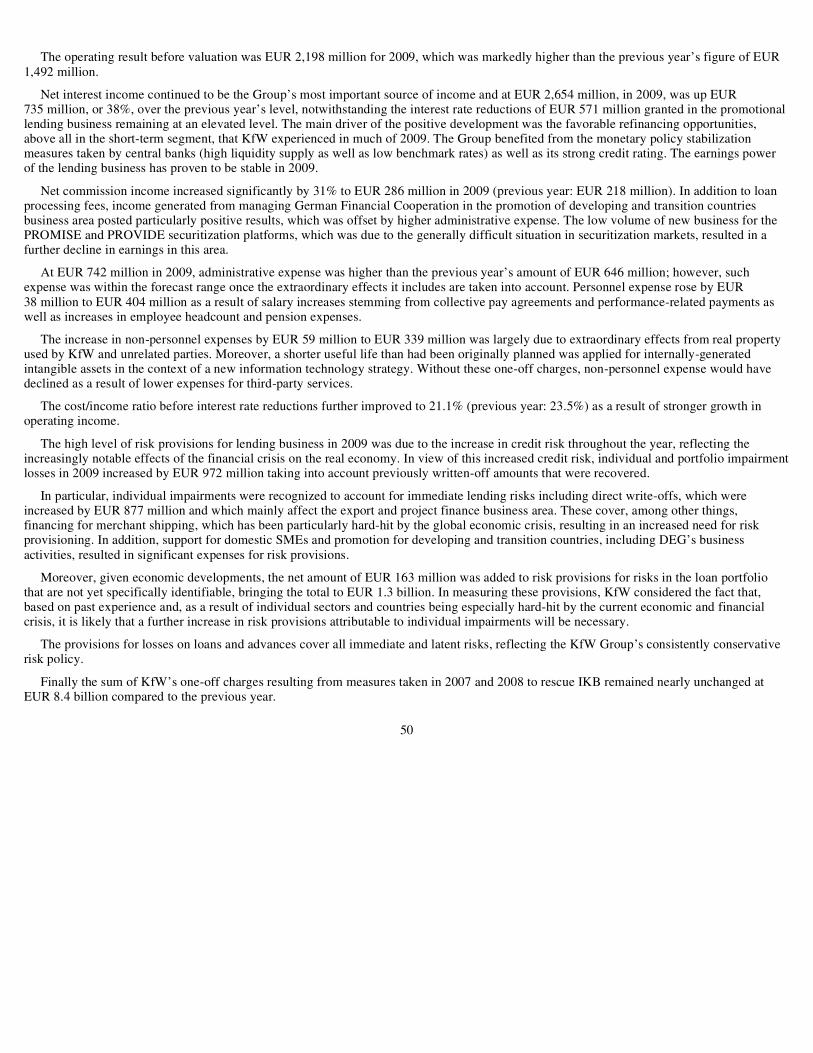
The operating result before valuation was EUR 2,198 million for 2009, which was markedly higher than the previous year’s figure of EUR 1,492 million.
Net interest income continued to be the Group’s most important source of income and at EUR 2,654 million, in 2009, was up EUR 735 million, or 38%, over the previous year’s level, notwithstanding the interest rate reductions of EUR 571 million granted in the promotional lending business remaining at an elevated level. The main driver of the positive development was the favorable refinancing opportunities, above all in the short-term segment, that KfW experienced in much of 2009. The Group benefited from the monetary policy stabilization measures taken by central banks (high liquidity supply as well as low benchmark rates) as well as its strong credit rating. The earnings power of the lending business has proven to be stable in 2009.
Net commission income increased significantly by 31% to EUR 286 million in 2009 (previous year: EUR 218 million). In addition to loan processing fees, income generated from managing German Financial Cooperation in the promotion of developing and transition countries business area posted particularly positive results, which was offset by higher administrative expense. The low volume of new business for the PROMISE and PROVIDE securitization platforms, which was due to the generally difficult situation in securitization markets, resulted in a further decline in earnings in this area.
At EUR 742 million in 2009, administrative expense was higher than the previous year’s amount of EUR 646 million; however, such expense was within the forecast range once the extraordinary effects it includes are taken into account. Personnel expense rose by EUR 38 million to EUR 404 million as a result of salary increases stemming from collective pay agreements and performance-related payments as well as increases in employee headcount and pension expenses.
The increase in non-personnel expenses by EUR 59 million to EUR 339 million was largely due to extraordinary effects from real property used by KfW and unrelated parties. Moreover, a shorter useful life than had been originally planned was applied for internally-generated intangible assets in the context of a new information technology strategy. Without these one-off charges, non-personnel expense would have declined as a result of lower expenses for third-party services.
The cost/income ratio before interest rate reductions further improved to 21.1% (previous year: 23.5%) as a result of stronger growth in operating income.
The high level of risk provisions for lending business in 2009 was due to the increase in credit risk throughout the year, reflecting the increasingly notable effects of the financial crisis on the real economy. In view of this increased credit risk, individual and portfolio impairment losses in 2009 increased by EUR 972 million taking into account previously written-off amounts that were recovered.
In particular, individual impairments were recognized to account for immediate lending risks including direct write-offs, which were increased by EUR 877 million and which mainly affect the export and project finance business area. These cover, among other things, financing for merchant shipping, which has been particularly hard-hit by the global economic crisis, resulting in an increased need for risk provisioning. In addition, support for domestic SMEs and promotion for developing and transition countries, including DEG’s business activities, resulted in significant expenses for risk provisions.
Moreover, given economic developments, the net amount of EUR 163 million was added to risk provisions for risks in the loan portfolio that are not yet specifically identifiable, bringing the total to EUR 1.3 billion. In measuring these provisions, KfW considered the fact that, based on past experience and, as a result of individual sectors and countries being especially hard-hit by the current economic and financial crisis, it is likely that a further increase in risk provisions attributable to individual impairments will be necessary.
The provisions for losses on loans and advances cover all immediate and latent risks, reflecting the KfW Group’s consistently conservative risk policy.
Finally the sum of KfW’s one-off charges resulting from measures taken in 2007 and 2008 to rescue IKB remained nearly unchanged at EUR 8.4 billion compared to the previous year.
50

In 2009, net gains/losses from hedge accounting and other financial instruments at fair value through profit or loss was characterized by the stabilization of the financial markets, which had positive effects on the securities portfolio, as well as continuing to have an effect on earnings as a result of reporting economic hedges under IFRS.
Securities recorded at fair value through profit or loss, which include fair value accounting of gains and losses on special funds used for strategic asset management, resulted in income totaling EUR 368 million, after very high charges, which were, in part, forecast to be temporary, were reported in 2008.
The net negative earnings effects resulting from hedge accounting and borrowing recorded at fair value, including IFRS-induced hedging derivatives, totaled EUR 305 million in 2009. The marked-to-market derivatives are each components of economically hedged positions. However, situations in which the other part of the relevant hedged positions cannot be carried at market value or in which different methods must be used in the valuation inevitably result in temporary fluctuations in earnings that are fully offset by the maturity of the transaction. Although additional measures were implemented in 2009 to improve the reporting of the effects of economic hedges, these effects continue to have a strong impact due to considerable changes to the relevant valuation factors.
While satisfactory performance was still achieved from the equity finance business recorded at fair value through profit or loss in the previous year, the income statement was negatively affected during 2009 by EUR 42 million. The reason for this was the poor development of the global economic situation, which affected the Group’s loan portfolio as well as its equity portfolio.
Net gains/losses from securities and investments totaling EUR -120 million were largely shaped by write-offs on securities. In 2008, this item was materially and adversely affected by the IKB rescue measures.
Compared to the previous year, lower net expenses of EUR 74 million were generated in 2009 by valuations and disposals of structured securities not accounted for at fair value through the income statement. A net charge of EUR 31 million resulted from the equity portfolio.
The reversal of impairments from securities and investments not recognized through profit or loss in the amount of EUR 285 million was directly recognized in equity under revaluation reserves.
Accounting for both net other operating income and taxes on income, a consolidated profit of EUR 1,127 million resulted in 2009 as compared with a consolidated loss of EUR 2,743 million in 2008.
The consolidated profit before IFRS effects from hedging is a further key financial figure based on the consolidated profit in accordance with IFRS. Derivative financial instruments are entered into for hedging purposes. Under IFRS, the requirements for recognition and valuation of derivatives and hedges nevertheless give rise to temporary net gains or losses. In KfW’s opinion, such net gains or losses do not sufficiently reflect economically effective hedges.
As a result, the following reconciliations were performed by eliminating temporary contributions to income of EUR 305 million for 2009 as follows:
The reconciled earnings position stood at a net gain of EUR 1,432 million in 2009.
51
• Valuation results from micro and macro hedge accounting; all of the Group’s hedges are economically effective and do not give rise to any net gain or loss over the entire period to maturity.
• Valuation results from the use of the fair value option to avoid an accounting mismatch in the case of borrowings including related hedging derivatives. The economically effective hedges do not give rise to any net gain or loss over the entire period to maturity.
• Valuation results from the market value accounting of highly economically effective hedges that do not qualify for hedge accounting; these hedges do not give rise to any net gain or loss over the entire period to maturity.

Overall, with its return to profitability, the KfW Group recorded very positive results for 2009. These results were based on a strong operating result, which benefited from KfW’s refinancing opportunities, particularly in the short-term segment, positive effects from the securities portfolio and the elimination of the one-off charges from the IKB rescue. These factors more than offset the increased risk provisions for lending business and the continued high level of purely IFRS-related charges.
Supplementary Report (as of March 12, 2010)
No matters of particular importance have occurred since the end of 2009.
52

Risk Report
Current Developments
The financial year 2009 was marked by the ongoing global economic and financial crisis, although there were some signs of economic recovery, particularly at the end of the year. As expected, the financial crisis in 2008 also had a delayed impact on the real economy. Developments caused by the crisis in trade and container shipping and in the automotive sector were of particular note, being accompanied by heightened risks in other cyclical sectors and certain countries and regions. Compared with 2008, broad sections of the financial sector stabilized in 2009, due, in large measure, to substantial government support. Nonetheless, considerably higher risks remain observable in some areas.
The KfW Group has been affected by these developments, partly due to the international aspect of its promotional mandate, and it is continuing to monitor and manage its risks closely. All recognizable risks are measured using conservative standards. Assessments of the KfW Group’s risk-bearing capacity are regularly carried out and show that the Group can bear the risks taken in the context of its mandate.
KfW is systematically further developing its risk management and control processes, focusing on group-wide control processes (e.g., for securities and operational risks), the expansion and further integration of its various scenario analyses and stress testing within risk management, and the expansion of the real-time decision-oriented reporting system. Early risk detection with regard to the Group’s controlling equity investments is also to be further developed based on stable and efficient processes and instruments. Focal points in 2010 will be reducing complexity and increasing the stability of the instruments, as well as standardizing processes for validation and further development. In addition, the valuation methods used for corporate and bank ratings and for collateral acceptance in the on-lending business will be reviewed and enhanced.
Basic Principles and Objectives of Risk Management
The Group has a statutory promotional mandate, which provides the foundations for its special position and its institutional structure. Sustainable promotion is the Group’s overarching purpose. Measuring and controlling risks is key to the efficient use of available resources to carry out this promotional mandate. As part of its risk management, the Group aims to incur risks only to the extent that they appear manageable in the context of the Group’s current and anticipated earnings and the probable outcome of the risks. Group risk/return management takes into account the special characteristics of a promotional bank. Banking supervisory law requirements, such as the German Minimum Standards for Risk Management — MaRisk, constitute important secondary requirements for KfW’s risk management structures and procedures.
In order to establish risk management and control competence within its organization, KfW offers training courses that include a modular program on risk topics. This training program enables management and employees from the whole of the KfW Group to acquire introductory knowledge or to deepen their specialized knowledge.
Organization of Risk Management and Monitoring
Risk Management Bodies and Functional Aspects of Risk Management. As part of its overall responsibility, KfW’s Managing Board determines the bank’s risk principles and guidelines. KfW’s supervisory bodies – the Board of Supervisory Directors and the Federal Ministries of Finance and of Economics and Technology, each of which provides the chairman and deputy chairman of the Board of Supervisory Directors in alternation – are informed at least once per quarter of the Group’s risk profile. The Executive Committee of the Board of Supervisory Directors is responsible for decisions in urgent matters (Eilentscheidungen). The Chairman of the Board of Supervisory Directors decides whether an issue is urgent.
Risk management within the KfW Group is exercised by closely intertwined decision-making bodies. The bank’s system of executive bodies was restructured in 2009 to improve the organizational structure. The Managing Board is at the helm of the new system; it makes the key decisions on risk policy. There is also a quarterly Managing Board meeting which includes the directors and focuses on risk management and accounting issues. These meetings discuss, in particular, the reports prepared at the end of each quarter as well as major changes to the Group’s risk manual. Three risk committees were established below the level of the
53

Managing Board to prepare decisions for the Managing Board (the Credit Risk Committee, the Market Price Risk Committee and the Operational Risk Committee), each committee also having the capacity to make decisions within certain defined ranges of competency. Further working groups support these committees. The back-office departments (Risk Management and Controlling, Transaction Management, and Accounting) generally have the right of veto in the committees. If no unanimous decision can be reached, an issue may be escalated to Managing Board level.
Credit Risk Committee. The Credit Risk Committee is chaired by the chief risk officer and meets once a week. Its other members are the director of Risk Management and Controlling and two members of the Managing Board with front-office responsibilities. The Credit Risk Committee is supported by the Country Risks, Collateral, and Rating Systems Working Groups. The weekly meetings involve decisions on loans and limits. Further meetings, held on a quarterly basis, are also attended by representatives of the business areas, some central staff departments and subsidiaries of the KfW Group. Internal Auditing has observer status. Major changes to existing risk principles and credit risk methods, as well as drafts of new principles and methods are adopted at these quarterly meetings. The committee also monitors the Group’s loan portfolio.
Market Price Risk Committee. The Market Price Risk Committee is chaired by the chief risk officer and meets once a month. Other members include the Managing Board member responsible for capital market activities, and, among others, the directors of Treasury and Capital Markets, Asset Securitization, Risk Management and Controlling, and Accounting. The Market Price Risk Committee makes decisions regarding entering into market price risks, the valuation of securities, changes in market price risk methods, liquidity management issues and risk principles on market price and liquidity risk management. It also prepares resolutions on interest risk positions, transfer pricing and the funding strategy for the Managing Board. The Market Price Risk Committee is supported by the Surveillance Committee, which deals with the valuation of securities, and the Hedge Committee, which deals primarily with the earnings effects of IFRS hedge accounting and the optimization thereof.
54

Operational Risk Committee. The Operational Risk Committee comprises all directors and meets once a quarter. It is chaired by the director of Risk Management and Controlling. The central staff departments and subsidiaries of KfW are also represented on this committee. It is responsible for dealing with issues relating to operational risks. These issues include, in particular, measuring and evaluating operational risks, including legal risks, and the relevant provisions in the risk manual in addition to business continuity management. The committee informs the Managing Board of operational risk events on a monthly, or, if necessary, ad hoc basis.
There are five working groups or committees below the level of these main risk committees, which report to the Credit Risk Committee or Market Price Risk Committee and prepare decisions. These are:
Country Risks Working Group. The Country Risks Working Group is the central unit for assessing country risks. It is composed of economists from the regional departments of KfW Entwicklungsbank and representatives of KfW IPEX-Bank, DEG and KfW’s Transaction Management. It is chaired by Risk Management. This Working Group meets quarterly or more often as required. The role of the Country Risks Working Group is to identify, analyze and assess political and economic risks (and rewards) in the global economy and particularly in the countries in which the KfW Group does or plans to do business. Proposals for risk ratings to be assigned to developing, transition and emerging countries are made by the economists, while proposals for ratings to be assigned to industrial countries are submitted by Risk Management. Countries are ultimately assigned to risk categories on the basis of discussions conducted within the Country Risks Working Group. If no consensus is reached, the vote of Risk Management is decisive. Risk Management reports on the conclusions of meetings to the Credit Risk Committee.
Collateral Working Group. The Collateral Working Group is a central body serving KfW and its subsidiaries to help ensure that procedures are sufficiently understood throughout the Group for all essential aspects of collateral acceptance and valuation, as well as collateral management processes for lending and trading activities and structured products. In addition, the Working Group helps to ensure that such procedures are uniform and produces recommendations for development and enhancement measures on which management must decide and, when the matter falls within its defined range of competency, takes these decisions itself. The Collateral Working Group is composed of representatives from various business areas and departments. Its central functions include the development, enhancement and review of collateral valuation procedures, the review and expansion of accepted and acceptable collateral and the related acceptance criteria, the establishment and review of minimum requirements for collateral management processes and collateral acceptance and the establishment of guidelines for meeting regulatory standards regarding risk mitigation techniques.
Rating Systems Working Group. The Rating Systems Working Group is a central body serving KfW and its subsidiaries, which helps to ensure sufficient understanding of all essential aspects of credit risk measurement instruments. These include, in particular, rating systems, loan portfolio models, risk indicators and limit management systems. The working group’s tasks include evaluating and approving reports on validation and further development as well as deriving recommendations for measures to develop and enhance credit risk measurement instruments.
Surveillance Committee. The Surveillance Committee is an integral component of the surveillance and impairment process for securities and structured credit products, and reports to the Market Price Risk Committee. One of the Surveillance Committee’s central functions is to recommend valuation figures for the securities and structured products that are not to be recognized at fair value through profit or loss (i.e. for the categories loans and receivables and available for sale (under IFRS), and for fixed assets under the German Commercial Code (Handelsgesetzbuch — HGB)). These recommendations are presented to the Market Price Risk Committee for decision-making.
Members of the Surveillance Committee include representatives of the back-office departments (Risk Management and Controlling, Transaction Management, and Accounting) and of the responsible front-office departments.
Hedge Committee. The economic management of market price risks at KfW is the responsibility of the Market Price Risk Committee. Measures relating to the management of these risks can lead to fluctuations in valuation/results in purely accounting terms, if instruments that must be recognized at fair value under IFRS are used. At KfW, this applies particularly to the use of derivatives. The purpose of the Hedge Committee is to ensure that the treatment of instruments recognized at fair value under IFRS is in line with the economic objective of the use of derivatives at KfW.
55

The subsidiaries of the KfW Group and the organizational units exercise their own control functions within the group-wide risk management system. In addition, group-wide projects and working groups ensure a coordinated approach, for example in the rollout of rating instruments to subsidiaries or the management and valuation of collateral.
Responsibility for developing and assuring the quality of risk management and control lies outside the front-office departments, with Risk Management and Controlling. A comprehensive risk manual has been prepared for this purpose and is continually updated. The rules and regulations laid out in the risk manual apply to the entire Group and are accessible to all employees. Risk principles (i.e., normative rules for lending processes and risk management procedures) and portfolio guidelines (e.g., business restrictions and collateral requirements) make up the core of the risk manual. The requirements for the Group’s controlling equity investments were comprehensively revised in 2009, as were the Group’s internal hedging mechanisms for payment transactions. Substantial changes were also made to the requirements for the management of banking risks. The risk principles and portfolio guidelines serve as the framework for the operating activities of all business areas. The risk manual ensures that uniform procedures are applied throughout the Group to identify, measure, control and monitor risks. In addition, group-wide regulations are supplemented in individual business areas by specific rules. Risk Management and Controlling reviews these for conformity with group-wide regulations.
Risk Management. The primary task of the Risk Management Department is to ensure that the Group is able to bear the risks falling within its defined risk tolerance. For this purpose, it formulates and regularly reviews the Group’s risk strategy, including the risk management of the major subsidiaries. The risk strategy builds on the basic business policy and establishes general risk principles and concrete risk policy measures in line with business strategy. A variety of instruments to control credit, market price and operational risks are used to implement the risk strategy. In addition, risk management instruments, such as risk guidelines for potential risk, capital allocation, second vote for loan approvals, a limit management system, portfolio guidelines and early warning systems are used for individual counterparties and for portfolios. Concentration limits apply at various sub-portfolio levels (including borrower units, countries and sectors) to prevent major individual losses and to restrict risk concentration in the loan portfolio. If necessary, a risk transfer can also be made to the capital markets (e.g., through credit derivatives), depending on the market situation.
At KfW, Group Risk Management has the right to veto (“second vote”) risk management decisions with regard to single transactions. KfW-IPEX-Bank and DEG have their own second vote independent of their front office. The relevant business decision-making processes are structured with a view to risk. The need for a second vote is determined by the type, scope (material risk content and effect on the overall risk position) and complexity of a transaction. Risk Management was reorganized in 2009 and received additional staff. In order to better focus specific expertise, Risk Management was divided into two parallel departments corresponding to the client groups “financial institutions” and “corporates and equity investments.”
Risk Management Loan Support. With effect from April 1, 2009, Risk Management Loan Support became a separate department within Risk Management.
The department is responsible for non-performing loans and for providing intensive support (such as increased monitoring and measures to reduce the risk of non-performance) for banks and large corporates in the KfW portfolio whose loans may still be performing but are regarded as higher risk. It becomes involved, assuming full responsibility with various competencies in case of downgradings below certain internal rating thresholds. The objective is to achieve recovery of a loan through restructuring, reorganization and workout arrangements. If the business partner is deemed incapable or undeserving of restructuring, the priority becomes realizing as much value as possible from the loan and the related collateral. Internal regulations are in place within the relevant business areas to ensure clear allocation of expertise and responsibility between the front-office departments and Risk Management Loan Support; Risk Management Loan Support also cooperates closely with the credit departments and legal department.
In the event of a crisis in the banking sector, the department has to be able to act immediately both in-house and externally; the financial institution crisis plan has been further developed for this purpose. It primarily provides for the establishment of a working group headed by Risk Management, immediate loss analysis and implementation of the next steps necessary.
Risk Controlling. Risk Controlling is responsible for measuring and reporting all risks and risk groups of the KfW Group and analyzing the Group’s risk-bearing capacity. In this regard, uniform methods and models
56

are implemented throughout the Group at the operating level. Stress tests and scenario calculations are also used with the goal of quantifying the capital requirements needed to ensure the Group’s risk-bearing capacity, including in situations characterized by considerably worsening economic conditions.
The department is involved in the quality management process for the risk indicators used in risk management and control and also provides professional support for the information systems used in reporting. In operational risk and business continuity management, the department is responsible for the group frameworks and guidelines and supports the business areas in implementing these standards.
Risk reporting is in line with regulatory standards (MaRisk). The Managing Board is informed on a monthly basis about the Group’s risk situation. A risk report is issued quarterly to the Group’s supervisory bodies.
Risk Methods, Instruments and Process Management. The Risk Methods, Instruments and Process Management Department is responsible for providing suitable methods and instruments for group-wide risk analysis and management.
The development of a long-term, sustainable and consistent method and instrument strategy for risk management and risk control is rounded off with regular validations, developments and enhancements of models and methods. The focus is on models to measure, control and price credit risks. In addition, the department is responsible for the coordination and project management of the implementation of instruments and IT systems used in risk management and control to ensure that the requirements placed on them are properly handled. In addition, it coordinatesthe formulation and development of group-wide risk principles as well as the procedure manual for risk management and control.
Internal Auditing. The Internal Auditing Department supports the Managing Board, is not bound by directives and works independently of group procedures. It generally audits all of KfW’s processes and activities to identify the risks involved and reports directly to the Managing Board.
The audit cycles for individual audit areas are determined by Internal Auditing based on an annual risk assessment of the audit areas. In so doing, the department takes into account the economic capital requirements of the operations to be audited.
In addition to promotional business (including the KfW Sonderprogramm), auditing activities focused on risk management procedures and methods in 2009. The risk management audits focused on the further development of risk management processes and the validation of internal rating systems.
While maintaining its independence, Internal Auditing monitored important projects, particularly the IT development projects. In 2009, Internal Auditing monitored, as in previous years, the further development of risk measurement procedures by participating (with observer status) in meetings of decision-making bodies.
KfW’s Internal Auditing is also the group auditing department for the KfW Group. It incorporates the internal auditing departments of the subsidiaries in group-wide audit reporting.
Internal Control System. Various internal control processes are used to ensure that the risk of error in the unconsolidated and consolidated financial statements is minimized. The statements made in the annual financial statements regarding the existence, completeness, accuracy, measurement and recognition of financial information are supported by internal control procedures. The preparation and structuring of each control process in the front-office, settlement and accounting functions are governed by strictly defined criteria that provide a complete chain of accounting-related steps from the recording of transactions to external reporting. The entire control process is automated, from carrying out the control through issuing confirmations to daily tracking. During preparation of the annual financial statements, reporting is made in a prompt and decision-oriented manner. The established processes provide enough scope to accommodate both accounting changes and new technical procedures, thereby ensuring the annual financial statements’ consistent high quality level. The Audit Committee was informed of the effectiveness of the internal control system and compliance with statutory provisions.
57

Risk Management Approach of the KfW Group
The above chart shows the KfW Group’s risk management process. Risk management within the KfW Group serves one central purpose: ensuring the Group’s risk-bearing capacity. Risk management was improved during the reporting year by creating stronger links between regulatory and economic risk-bearing capacity. This integration is to be further developed in 2010.
Regulatory Risk-Bearing Capacity.
INDICATORS UNDER SUPERVISORY LAW
KfW is not subject to the requirements of Sections 10 or 10a of the German Banking Act (Kreditwesengesetz — KWG). For internal purposes, the key legal requirements are used to voluntarily calculate the regulatory capital ratios. In-house rating methods are used for large sections of the loan portfolio to calculate the risk exposure (advanced IRB approach).
The KfW Group’s regulatory total capital ratio as of December 31, 2009 was 11.7% taking the consolidated comprehensive income into account (previous year: 10.1%). The Group’s tier 1 ratio totaled 9.4% at year-end 2009 (previous year: 7.8%). The significant rise in the regulatory indicators is due to both the increase in capital resources and the decline in risk exposure. While the healthy annual result was reflected in the capital resources, the first-time recognition of the federal guarantee for holding arrangements eased the risk burden considerably.
Economic Risk-Bearing Capacity. An analysis of risk-bearing capacity as part of internal procedures must measure risks and match them against the economic resources available for risk coverage. Potential financial losses are measured with the aid of two central risk-measuring tools: “expected loss” and “economic capital,” which is a measure to cover unexpected loss.
58
As of December 31, 2009 2008 (EUR in millions, except %)Risk position (1) 129,386 139,712Tier 1 capital 12,223 10,860Total regulatory capital 15,195 14,141Tier 1 ratio 9.4% 7.8%Total capital ratio 11.7% 10.1%
(1) The “Risk position” indicator is the product of the total amounts of capital charges for counterparty risks, market risks and operational risks multiplied by 12.5.

Expected loss refers to loss that is expected to arise on a statistical average over a number of years. Expected losses, along with other parameters, are important when credit is priced. Expected losses are defined as the product of:
The probability of default is estimated for each borrower with the aid of rating methods. The result of the rating measures is an estimate of the probability that a counterparty will be unable to fulfill its obligations within the next 12 months. In particular, collateral must be evaluated to estimate the magnitude of the likely loss. Expected losses are not backed by capital as they are offset by risk margins (insurance principle).
The risk potential to be backed by capital is quantified by Risk Controlling with the aid of statistical models. For credit risks, the loss potential is computed using a loan portfolio model and using the risk measure “credit value-at-risk.” The difference between credit value-at-risk and expected loss is referred to as the economic capital requirement.
The Group takes a similar approach with regard to market price risks. Value-at-risk is also calculated using statistical models. For market price risks, the value-at-risk is also the economic capital requirement.
The forecast period for both risk categories is one year. The capital requirement for credit and market price risks is aggregated, taking diversification effects into account. The capital requirement for operational risks is calculated using the regulatory standard approach according to the German Solvency Regulation (Solvabilitätsverordnung — SolvV).
To assess the risk-bearing capacity, the necessary capital requirement(1) (economic capital requirements) are matched against the economic resources available for risk coverage (available financial resources). The definition of available financial resources differs from the definition of equity or regulatory capital, as available financial resources do not include some parts of the reserves. In contrast to equity as per the balance sheet, portfolio impairments are not included either.
On this basis, as at December 31, 2009, KfW’s economic risk-bearing capacity stood at a solvency level of 99.96%. This means that the available financial resources cover the overall capital requirements. The available financial resources exceeding the overall capital requirements (December 31, 2009: EUR 461 million) improved over the previous year (EUR 286 million).
When assessing risk-bearing capacity, the Group takes into account potential additional capital requirements for stress scenarios calculated in accordance with conservative standards. It also uses several alternative sensitivity and scenario analyses for this purpose. A standard stress test in line with supervisory requirements is performed for credit risks, simulating a further gradual deterioration of the economic situation affecting all portfolios.
In addition, the potential consequences of the global economic and financial crisis for the Group’s risk-bearing capacity and earnings position were analyzed using a scenario stress test which was attuned to the current environment. For this purpose, sectors and regions were identified where borrowers have been particularly affected by the recession. The stress test assumed a further substantial deterioration in credit quality and a considerable increase in the number of credit defaults for these sectors or regions, and simulated the additional economic capital requirement and additional impairment losses.
The effect of stress on market price risks was also examined in various scenarios. The primary effect of these risks, such as the scenario of a steep interest rate increase, is reduced earnings.
On the basis of the analyses conducted and assumed stress scenarios, KfW expects additional capital requirements of EUR 3.1 billion. These requirements will be covered by the unrestricted portion of available
59
• the probability of a borrower’s default (probability of default),
• the expected amount of the loan outstanding at the time of the potential default (exposure at default) and
• the (anticipated) loss rate upon default (loss given default).
(1) KfW does not cover liquidity risk with risk capital, as it is not a loss risk to be covered on the liabilities side of the balance sheet, but rather a payment risk to be covered on the assets side.

financial resources and through further equity components and subordinated liabilities. Considering these funds, risk-bearing capacity at a solvency level of 99.99% is attained even under unfavorable macroeconomic conditions.
KfW addresses liquidity and other risks by monitoring appropriate key figures and by regularly testing the processes of its banking operations.
KfW’s risk measurement is based on state-of-the-art models used in banking practice. However, each model represents a simplification of a complex reality and builds on the assumption that risk parameters observed in the past can be considered representative of the future. Not all possible influential factors and their complex interactions can be identified and modeled for the risk development of a portfolio. This is one reason why KfW carries out stress tests both in the credit risk models and in the market risk models. The Group works continually to refine its risk models and processes.
Types of Risks
Counterparty Default Risk. The KfW Group assumes counterparty risks(2) in the context of its promotional mandate. The main risks in the domestic promotional lending business are in the areas of start-up finance for small- and medium-sized enterprises and equity investments. In addition, KfW assumes risks in the context of export and project finance as well as in the context of promotion for developing and transition countries.
60
(2) Counterparty default risk is defined as the risk of financial loss that can occur if the borrower or counterparty fails to meet contractual payment obligations. Counterparty default risk also includes country risk, comprising transfer, conversion and political risks.

Counterparty default risk is measured by estimating the probability of default, the exposure at default and the (anticipated) loss given default.
In identifying the probability of default, the Group uses internal rating procedures for banks, large corporates, small- and medium-sized enterprises, private equity investors, private equity investees, start-up businesses, and countries. These procedures are based on scorecards and follow a uniform and consistent model architecture. For project finance, KfW applies a cash flow-based rating method. The rating procedures aim at forecasting one-year default probability. As a rule, the transaction management departments are responsible for preparing ratings for risk-bearing business. Ratings are updated at least once annually, with the exception of ratings for business partners with whom only retail business is conducted.
Mapping the default probability to a master scale which is uniform for the entire KfW Group ensures comparability of ratings issued using different rating procedures and for various business areas. The master scale consists of 20 different classes that can be divided into four groups: investment grade, non-investment grade, watch list and default. The range of default probabilities and the average default probability are defined for each master scale class.
Specific regulations, which mainly specify the responsibilities, competencies and control mechanisms associated with a particular rating, apply to each rating procedure. External ratings are mapped to the KfW master scale to ensure the comparability of internal ratings within the KfW Group with ratings of external rating agencies. Periodic validation and further development of the rating procedures ensure that KfW is able to rapidly respond to changes in overall conditions. The aim is to continuously improve the accuracy of all rating procedures. Rating instruments and procedures largely meet the minimum requirements of the prevailing regulatory standards (MaRisk/Basel II).
Exposure at default and valuation of collateral are heavily weighted when determining the severity of loss. Collateral has a risk-mitigating effect in calculating loss given default. When valuing acceptable collateral, the expected net revenue from realizing the collateral is estimated over the entire loan term. This estimate is reduced, in the case of personal guarantees, to take into account the probability of default and the magnitude of loss incurred by the collateral provider. For tangible collateral, the reductions are chiefly attributable to fluctuations in market prices and depreciation. The determined value is an important element in estimating loss given default within the KfW Group. Depending on the availability of data, the various valuation procedures for individual types of collateral are based on internal and external historical data and expert estimates. The valuation parameters are reviewed on a regular basis. This guarantees the reliable valuation of individual collateral. The uniform management, valuation and recognition of collateral across the Group are regulated by a risk principle.
The KfW Group has various portfolio guidelines to limit risks from new business. These guidelines form the basis for the second vote on lending transactions and serve as an orientation guide for loan approvals. They are also designed to ensure KfW’s portfolio is of adequate quality and possesses an appropriate risk structure.(3) These guidelines distinguish between types of counterparties and product variants and define the conditions under which business transactions may generally be conducted.
Existing higher-risk exposures are divided into a watch list and a list of non-performing loans. The watch list serves to identify potential problem loans early and, if necessary, to allow preparations for the handling of these loans to be made. KfW closely monitors the economic and financial environment of the respective borrower in the case of a potential problem loan. It regularly reviews and documents the economic situation and the collateral provided and formulates proposals for remedial action. In the case of non-performing loans, the units in charge of restructuring are responsible for this process. This guarantees that specialists are involved at an early stage to ensure the appropriate management of problem loans.
Risk Provisioning. The KfW Group takes appropriate measures to address all identifiable default risks in its lending business by making risk provisions for loans. These risks also include political risks resulting from financing transactions outside Germany. For loans with an immediate risk of default (i.e., non-performing loans), KfW sets up individual impairments or provisions for undisbursed portions. These events are identified on the basis of criteria that meet both Basel II and IFRS requirements. Criteria include the identification of
61
(3) These guidelines take into account the special nature of KfW’s promotional business.

considerable financial difficulties on the part of the debtor, payment arrears, concessions made to the debtor owing to its financial situation (for example, in the context of restructuring measures), conspicuous measures undertaken by the debtor to increase its liquidity, and a substantial deterioration in the value of collateral received. These criteria are further specified in KfW’s risk manual. Individual impairments are determined by means of an impairment procedure. The calculation of individual impairments is also based on an individual assessment of the borrower’s ability to make payments in the future. The calculation takes into account the scope and value of the collateral as well as the political risk. A simplified impairment procedure is performed for small and standardized loans on the basis of homogeneous sub-portfolios.
Risk provisions for latent risks (i.e., portfolio impairment) are derived from the valuation of loan receivables that occurs in the context of annual rating procedures and collateral valuations. Portfolio impairment is recorded for both economic and political risks. The basis for this is the expected loss model described above, which is adjusted for IFRS purposes. Risk provisions for irrevocable loan commitments and financial guarantees are set up using the same method of calculation.
In light of the ongoing economic and financial crisis, KfW has identified particularly critical sectors and countries and analyzed the effects on the loan portfolio. These risks were addressed in the form of further portfolio impairments.
Maximum Risk of Default. According to IFRS 7.36, the maximum exposure to credit risk for the KfW Group arising from financial instruments is the total loss of the respective risk positions. Contingent liabilities and irrevocable loan commitments are also taken into account. Carrying amounts have been reduced by the risk provisions made.
Payment arrears on the balance sheet date were reported only in loans and advances to banks and customers, and securities and investments. Individual impairments were also reported under contingent liabilities and irrevocable loan commitments.
MAXIMUM EXPOSURE
FINANCIAL INSTRUMENTS PAST DUE AND NOT INDIVIDUALLY IMPAIRED
62
Value adjustments Derivatives used Contingent from macro fair for hedge liabilities, Loans and advances Loans and advances to value hedge accounting; Other Securities and irrevocable loan to banks customers accounting derivatives investments commitments 2009 2008 2009 2008 2009 2008 2009 2008 2009 2008 2009 2008 (EUR in million)
Carrying amount as equivalent for maximum risk of default 241,139 222,935 92,892 97,366 6,751 5,451 19,645 21,737 36,709 44,228 57,889 41,673
Risk provisions 420 526 6,484 7,077 0 0 0 0 4 2 355 255 of which neither past
due nor impaired 240,832 222,454 90,551 94,797 6,751 5,451 19,645 21,737 36,469 43,826 57,848 41,612 of which with
conditions renegotiated (in the reporting year)(1) 0 0 2,165 0 0 0 0 0 2 0 0 0
(1) Includes financial instruments that would be past due or impaired without renegotiation of conditions
Loans and advances to Loans and advances to banks customers Securities and investments 2009 2008 2009 2008 2009 2008 (EUR in million)
Less than 90 days past due 115 274 439 810 1 090 days and more past due 21 25 318 261 0 0

INDIVIDUALLY IMPAIRED FINANCIAL INSTRUMENTS
At year-end 2009, EUR 2.0 billion (previous year: EUR 2.1 billion), net after deductions of risk provisions, was classified as individually impaired out of a total of EUR 455 billion (previous year: EUR 433 billion) in financial instruments outstanding. Potential losses are conservatively estimated, and individual impairments have been recorded in the amount of EUR 6.0 billion (previous year: EUR 6.7 billion). This includes provision for risks from the various IKB rescue measures in the amount of EUR 4.2 billion (previous year: EUR 5.2 billion).
In addition to provisions for immediate risks of default, the KfW Group makes provisions for latent risks of default (economic and political risks). At year-end 2009, risk provisions for transactions not individually impaired totaled EUR 1.3 billion (previous year: EUR 1.1 billion). On average, 47.5% of the loans in the group portfolio are collateralized (previous year: 46.9%)(4). By far the largest portion of collateral (32% based on the total position) is attributable to assigned end-borrower receivables from on-lending business. Approximately 8% of outstanding financial instruments are secured by guarantees from the Federal Republic of Germany or from individual Federal States (previous year: 6%).
The high exposure as regards derivatives with positive fair values must be put into the context of the netting agreements with counterparties. These also include derivatives with negative fair values and collateral agreements and considerably reduce the counterparty risk.
The marked decline in financial assets resulted from the new securities strategy implemented at KfW. The main focus of this strategy is to secure liquidity. In this context, the existing securities in the portfolio which were not suitable for this purpose were removed while the number of reverse repos entered into was increased.
There was an increase in irrevocable loan commitments of around EUR 15 billion in the reporting year resulting primarily from the strong domestic promotional business.
Portfolio Structure. The contribution of individual items to the risk associated with the KfW Group’s loan portfolio is assessed based on an internal portfolio model. Concentrations of individual borrowers or groups of borrowers give rise to the risk of major losses that could jeopardize KfW’s existence. On the basis of the economic capital concept, the Risk Controlling Department measures the risk concentrations by individual borrower, sector and country. Concentrations are measured primarily by the extent to which they require economic capital. This ensures that not only high risk volumes but also unfavorable probabilities of default and undesirable risk correlations are taken into account. The results form the basis for the management of the loan portfolio and are included in the limit management system to contain concentration risks. On the basis of the limit management system, the KfW Group defines concentration limits to prevent losses that would put the continuity of the KfW Group at risk. The limits for the relevant areas are derived from the KfW Group’s risk-bearing capacity. The concentration limits provide a framework for managing counterparty risks.
Regions. At year-end 2009, 72% of the Group’s loan portfolio(5) in terms of economic capital requirements was attributable to the Euro area (previous year: 74%). The slight decline within the Euro area was largely due to the lower capital requirements in the German financial sector.
63
Contingent liabilities; Loans and advances to Irrevocable loan Loans and advances to banks customers Securities and investments commitments 2009 2008 2009 2008 2009 2008 2009 2008 (EUR in million)
Carrying amount 172 183 1,584 1,497 239 402 41 60Individual impairments,
provisions 282 393 5,421 6,151 0 0 278 180
(4) The collateral is presented as recognised for internal steering purposes. This means that further reductions and participation effects are taken into account as regards the fair value of each individual item of collateral, to avoid reporting double collateralisation.
(5) The loan portfolio includes loans and financial assets.

Sectors. The significant share of overall capital required for credit risks attributable to the financial sector is due to the KfW Group’s promotional mandate. By far the greatest portion of the Group’s domestic promotional lending business consists of loans that are on-lent through banks. Capital requirements for the financial sector fell considerably during the reporting year. At year-end 2009, required capital accounted for just 49% of the entire capital for the loan portfolio (previous year: 63%). This decline was primarily a result of the reduced money market portfolio. The breakdown by sector was updated in the reporting year. The data for the previous year has been adjusted for comparability.
Credit Quality. Credit quality is a major factor influencing the economic capital requirement, such that it is appropriate in analyzing the credit quality structure to examine the distribution of net exposures by credit quality category. Measured by net exposure, at year-end 2009, 68% (previous year: 70%) of the Group’s portfolio was composed of investment-grade debt (according to internal assessments). This slight decline was largely due to a reduction in the securities portfolio. 3% of the net exposure was categorized as default/probable loss (previous year: 2%). This increase was primarily due to the developments in the shipping industry. Despite the negative changes in ratings, the Group’s loan portfolio continued to have a good credit quality structure.
64

Structured Products in the Group’s Portfolio. According to the recommendations of the Financial Stability Board (FSB), the Group presents its portfolio of structured products separately in this section, broken down into asset-backed securities (ABS) and its PROMISE and PROVIDE securitization platforms.
Asset-Backed Securities. In addition to its own holdings of ABS, the Group’s ABS portfolio includes ABS investments in special funds; however, these are being gradually reduced. The securities had a nominal value of EUR 5.9 billion at year-end 2009. Accounting for the mark-to-market valuation of the securities reported at fair value, the portfolio had a total value of EUR 5.2 billion at year-end 2009. The following tables show the composition of the ABS portfolio by asset class, rating and geographic distribution of the underlying assets in the securitization portfolios.
EXPOSURE BASED ON NOMINAL VALUE AS OF DECEMBER 31, 2009
The portfolio volume at year-end 2009 was considerably lower than at year-end 2008 due to a large number of sales and repayments (nominal value EUR -2.3 billion). The rating structure of the portfolio improved following the sales. The reduction in holdings on the watch-list was a result of the sales and of rating changes. The proportion of securities with default status fell due to sales and transaction settlements. The regional focus of the ABS portfolio remains Europe.
65
CLO RMBS CDO CMBS ABS & other Total in 2009 Total in 2008 (EUR in millions)Investment Grade 2,016 1,463 81 486 469 4,515 5,528Non-Investment Grade 419 23 114 2 2 560 379Watch List 66 58 259 55 439 1,552Default 96 28 242 16 382 746
2,597 1,571 697 544 487 5,896 8,205
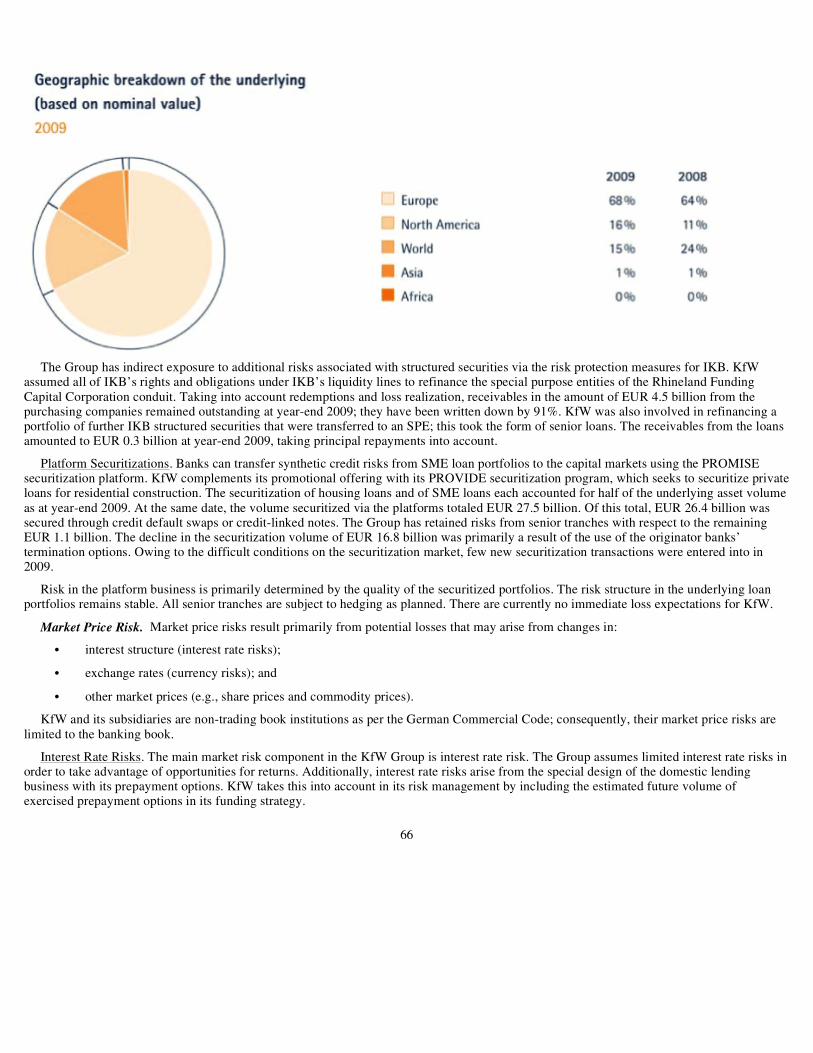
The Group has indirect exposure to additional risks associated with structured securities via the risk protection measures for IKB. KfW assumed all of IKB’s rights and obligations under IKB’s liquidity lines to refinance the special purpose entities of the Rhineland Funding Capital Corporation conduit. Taking into account redemptions and loss realization, receivables in the amount of EUR 4.5 billion from the purchasing companies remained outstanding at year-end 2009; they have been written down by 91%. KfW was also involved in refinancing a portfolio of further IKB structured securities that were transferred to an SPE; this took the form of senior loans. The receivables from the loans amounted to EUR 0.3 billion at year-end 2009, taking principal repayments into account.
Platform Securitizations. Banks can transfer synthetic credit risks from SME loan portfolios to the capital markets using the PROMISE securitization platform. KfW complements its promotional offering with its PROVIDE securitization program, which seeks to securitize private loans for residential construction. The securitization of housing loans and of SME loans each accounted for half of the underlying asset volume as at year-end 2009. At the same date, the volume securitized via the platforms totaled EUR 27.5 billion. Of this total, EUR 26.4 billion was secured through credit default swaps or credit-linked notes. The Group has retained risks from senior tranches with respect to the remaining EUR 1.1 billion. The decline in the securitization volume of EUR 16.8 billion was primarily a result of the use of the originator banks’ termination options. Owing to the difficult conditions on the securitization market, few new securitization transactions were entered into in 2009.
Risk in the platform business is primarily determined by the quality of the securitized portfolios. The risk structure in the underlying loan portfolios remains stable. All senior tranches are subject to hedging as planned. There are currently no immediate loss expectations for KfW.
Market Price Risk. Market price risks result primarily from potential losses that may arise from changes in:
KfW and its subsidiaries are non-trading book institutions as per the German Commercial Code; consequently, their market price risks are limited to the banking book.
Interest Rate Risks. The main market risk component in the KfW Group is interest rate risk. The Group assumes limited interest rate risks in order to take advantage of opportunities for returns. Additionally, interest rate risks arise from the special design of the domestic lending business with its prepayment options. KfW takes this into account in its risk management by including the estimated future volume of exercised prepayment options in its funding strategy.
66
• interest structure (interest rate risks);
• exchange rates (currency risks); and
• other market prices (e.g., share prices and commodity prices).

To record interest rate risks in its banking book, the KfW Group uses standard software that integrates all data relevant for risk assessment. The current balances of interest rate maturities (Euro, U.S. dollar and British pound) are determined with the aid of this standard software. On this basis, the KfW Group regularly performs value-at-risk calculations to assess its interest risk position. The applied simulation-based method, which was subject to major revision at December 31, 2009, is based on a two-factor Cox-Ingersoll-Ross model, which is used to estimate the distribution of risk positions in the Group given possible changes in market interest rates and based on an assumed holding period of three months. The factors applied in the model – neither of which is directly observable – are the two main factors influencing interest rate fluctuations. The model parameters determine the form of the simulated yield curve depending on the values of these two factors, their volatility and their mean reversion. The estimate of the parameters is based on historical time series of daily yield curves since 1990. The risk calculation is performed using a Monte Carlo simulation. Key optional components of business (e.g., terminable loans) are accounted for in the Group’s cash flow. The economic capital requirements are identified – as are credit risks – for a period of one year. Periodic stress tests supplement this calculation to estimate possible losses under extreme, standardized market conditions. In addition to the parallel shift in the yield curve prescribed by supervisory law, these tests include scenarios such as an inversion of the yield curve and an extension of the holding period.
Currency Risks. Foreign currency loans are generally refinanced in the same currency or secured by appropriate foreign currency hedging instruments. This also applies to individual impairments for which the corresponding replacement assets are provided. Open currency positions resulting from accrued margins or impairment losses are generally closed as soon as possible.
Risks from open currency positions remaining at the balance sheet date are measured by a variance/covariance approach in the form of a value-at-risk with a holding period of three months. The required parameters are estimated from historical data.
Other Market Price Risks. Other market price risks include share price risks from equity investments. They also include commodity price risks from CO2 certificates which the Group keeps on its own books. Risks from CO2 certificates arise as a result of the Group’s decision to act as an intermediary between the buyers and sellers of CO2 certificates. As a result, KfW also keeps certificates on its own books.
Other market price risks are measured using variance/covariance approaches. The assumed holding period when measuring risk is three months, as is the case for all other types of market price risk, with a one-year capitalization period. All of the necessary parameters are calculated using historical data.
The Market Price Risk Committee manages market price risks based on the valuation and analysis of interest and currency positions, other market price risks and stress tests for interest rate risks. The objective of this is long-term management of a reasonable market risk position for the bank. The strategy pursued is defined annually as part of the Group’s business area planning. This strategy is monitored using a limit system for all market price risks.
In accordance with MaRisk, framework conditions imposed by the Managing Board, which are in line with market standards, apply for the transaction, processing and settlement of trades.
In total, market price risks within the Group required a total of EUR 1,678 million in economic capital at year-end 2009. This position is composed of the following individual risks:
TOTAL ECONOMIC CAPITAL FOR MARKET PRICE RISKS
67
As of December 31, 2009 2008 (EUR in millions)Interest rate risks 1,048 919Currency risks 44 26Other market price risks 142 141 Volatility of present value of assets funded by equity 444 316
Market price risk 1,678 1,402

Interest rate risks increased at year-end 2009, brought about mainly by the methodical changes made to the interest structure model. In certain cases these led to more conservative risk assessments.
There was one open currency position in the balance sheet at year-end 2009, which was, however, closed shortly after the reporting date. As in previous years, the most important currency remained the U.S. dollar. The economic capital for currency risks was EUR 44 million at year-end 2009.
With respect to the remaining market price risks, required economic capital was virtually unchanged as against the previous year, at EUR 142 million at year-end 2009.
Liquidity Risk. Liquidity risk is the risk of a lack of liquidity. KfW differentiates between institutional liquidity risk (the risk of not being able to meet payment obligations) and market liquidity risk (the risk that the required funds are only available at costs higher than the risk-commensurate interest rate).
The primary objective of liquidity management is to ensure that the KfW Group is at all times capable of meeting its payment obligations. Although KfW’s subsidiaries are principally responsible for ensuring and managing their own liquidity and complying with the existing regulatory requirements, KfW is available as a contractual partner for all of its subsidiaries’ commercial transactions, particularly for their funding. For this reason, the liquidity requirements of the subsidiaries are included both in KfW’s funding schedule and in the liquidity maintenance strategy.
Liquidity risk is measured on the basis of the liquidity risk indicator under regulatory law, the utilization threshold in accordance with the KfW Law and economic scenario analyses.
Liquidity risk management is based on scenario calculations. This approach first analyses the expected inflow and outflow of funds for the next twelve months based on business already concluded. This basis cash flow is then supplemented by uncertain payments (e.g., borrowings from the capital market, expected loan defaults or planned new business) for three scenarios (normal, stress and worst case). The result provides an overview of the liquidity required by KfW in the next twelve months. The required liquidity is calculated for the three scenarios of normal case, stress case and worst case, the main difference being variation among the uncertain payments.
Available liquidity is calculated on a parallel basis. It largely consists of KfW’s ECB collateral account, repo assets, liquidity portfolios and the volume of commercial paper that is regularly placeable on the market. Available liquidity is subjected to stress analysis in the same way as the other cash flow components in the stress case and worst case scenario tests.
The ratio of cumulative required liquidity to cumulative available liquidity is calculated for each scenario. This figure may not exceed the value of 1 in any scenario for any period. The prescribed horizon in the normal case scenario is 12 months, in the stress case six months, and in the worst case, three months.
The key figures are calculated and reported to the Market Price Risk Committee on a monthly basis. The following table shows the key risk indicators for the scenarios at year-end 2009:
LIQUIDITY RISK INDICATORS AS OF DECEMBER 31, 2009
Since the indicators for all three scenarios (including the extremely conservative “worst case”) are significantly below 1, KfW believes that it had a comfortable liquidity position at year-end 2009.
The table below shows the contractual payment obligations (principal and interest) of the KfW Group arising from financial instruments by maturity range.
68
Normal Case 0.20Stress Case 0.43Worst Case 0.55

CONTRACTUAL PAYMENT OBLIGATIONS ARISING FROM FINANCIAL INSTRUMENTS BY MATURITY RANGE
Given the ongoing economic and financial crisis, the overall conditions for KfW’s funding activities were challenging in 2009. Even major issuers with a strong credit rating such as KfW were unable to avoid market developments that were, at times, turbulent. KfW therefore had to accept less favorable refinancing conditions for long-term funding during the highly volatile phase of the first half of 2009. As 2009 progressed, the market situation improved, from which KfW benefited; at the end of 2009, KfW was able to achieve long-term refinancing conditions much closer to their historical average. KfW issued some 420 bonds under these difficult market conditions in 2009, thus raising long-term funds equivalent to almost EUR 75 billion as planned. This figure is comparable to that of the prior year. In terms of short-term refinancing, (i.e., in the money markets), KfW profited from the low risk tolerance of many investors. This kept the demand for safe
69
As of December 31, 2009 (1) 1 to 3 3 months to 1 1 to 5 5 years and Up to 1 month months year years more Total (EUR in millions)Liabilities to banks and customers 7,893 2,924 2,006 15,672 21,026 49,521Certificated liabilities 8,559 7,605 40,138 178,190 132,984 367,476Net liabilities under derivative financial instruments -225 -519 942 -9 -12,051 -11,863Liabilities under derivative financial instruments 25,409 26,881 69,370 347,303 282,940 751,903Subordinated liabilities 0 0 146 494 3,415 4,055
Liabilities under on-balance sheet financial instruments 16,227 10,009 43,231 194,347 145,374 409,190 Contingent liabilities 7,529 0 0 0 0 7,529Irrevocable loan commitments 50,360 0 0 0 0 50,360
Liabilities under off-balance sheet financial instruments 57,889 0 0 0 0 57,889
Liabilities under financial instruments 74,116 10,009 43,231 194,347 145,374 467,079
As of December 31, 2008 (1) 1 to 3 3 months to 1 1 to 5 5 years and Up to 1 month months year years more Total (EUR in millions)Liabilities to banks and customers 6,505 4,126 4,230 19,097 22,764 56,723Certificated liabilities 9,006 5,187 39,136 159,613 128,218 341,160Net liabilities under derivative financial instruments -390 969 3,140 4,273 -20,313 -12,321Liabilities under derivative financial instruments 25,598 26,688 82,662 310,885 274,133 719,967 Subordinated liabilities 0 0 146 539 3,516 4,201
Liabilities under on-balance sheet financial instruments 15,120 10,283 46,652 183,522 134,185 389,763Contingent liabilities 6,283 0 0 0 0 6,283Irrevocable loan commitments 35,390 0 0 0 0 35,390
Liabilities under off-balance sheet financial instruments 41,673 0 0 0 0 41,673
Liabilities under financial instruments 56,794 10,283 46,652 183,522 134,185 431,436
(1) The net liabilities under derivative financial instruments comprise payment obligations which are offset against the corresponding payment claims from derivative contracts; the gross liabilities are reported as liabilities under derivative financial instruments. Irrevocable loan commitments and contingent liabilities are generally allocated to the first maturity range.

investments at a high level. KfW was thus able to generate attractive funding conditions via the money markets in 2009, and to stabilize the volume in its commercial paper programs slightly below the record level of the previous year. KfW expects the demand for long-term refinancing to remain the same at between EUR 70-75 billion in 2010.
Operational and Other Risks. The KfW Group defines operational risk as the risk of loss resulting from inadequate or failed internal processes, people and systems or from external events. This definition includes legal risks, but does not include strategic risks.
Control of operational risks and business continuity management are performed centrally by the Risk Management and Controlling Department and supports risk management. Operational risks are managed in a decentralized manner by the individual operational departments and subsidiaries.
In accordance with the definition laid out in the German Solvency Regulation, operational risks in the KfW Group are integrated into its economic management as part of a comprehensive management approach. Risk management is based on loss data collection, OpRisk assessments and the surveying and monitoring of measures already undertaken.
Operational risks are quantified and capital requirements are determined using the regulatory standard approach according to the Solvency Regulation. The qualitative supervisory requirements of the Solvency Regulation and MaRisk are met through the methods implemented in the risk management process. The definitions of loss events were expanded and clarified as part of loss data collection. OpRisk assessments were conducted along process chains on a test basis, and will be quantitative in nature in 2010. The measures resulting from these OpRisk instruments are recorded and monitored. Preliminary indicators are collected and analyzed to support risk assessment.
The core of management reporting consists of up-to-date monthly reporting to KfW’s Managing Board. At the operational level, operational risks within the KfW Group are limited by an internal control system. The IT system is under continual development and business processes are constantly analyzed and improved. For risks that may arise from unforeseeable events, the bank has put appropriate contingency plans in place (e.g., for IT system disruptions, inability to use buildings or absence of staff) and has sufficient insurance coverage (e.g., for fire and water damage).
The Group addresses legal risks by involving its in-house legal department early in the process and by cooperating closely with external legal advisers in Germany and abroad. Contracts may be entered into only on the basis of unambiguous and correctly-documented arrangements. Moreover, current operations use standard contracts (e.g., ISDA agreements for swap and similar transactions).
KfW has implemented a central and a decentralized emergency organization as part of business continuity management, including an emergency team and a crisis team. There are emergency plans for all of the Group’s critical workflows, which are tested appropriately. In addition, emergency workstations have been created for high priority processes at a sufficiently removed location. Crisis, emergency and early warning procedures have also been determined. A technical solution has already been implemented for the early warning procedures.
70

Financial Statements of KfW Bankengruppe
INCOME STATEMENT
71
Note(s) 2009 2008 1) Change EUR in EUR in EUR in millions millions millionsInterest income (27) 18,017 28,590 -10,573Interest expense (27) 15,363 26,671 -11,308
Net interest income 2,654 1,919 735 Risk provisions for lending business (11), (14), (28) -972 -2,139 1,167
Net interest income after risk provisions 1,682 -220 1,902Commission income (29) 430 406 24Commission expense (29) 144 188 -44
Net commission income 286 218 68Net gains/losses from hedge accounting (8), (30) -313 -309 -4Net gains/losses from other financial instruments at fair value through
profit or loss (11), (31) 368 -1,438 1,806Net gains/losses from securities and investments (15), (32) -120 -1,974 1,854 Administrative expense (33) 742 646 97 Net other operating income (11), (34) 23 1,536 -1,513
Profit/loss from operating activities 1,184 -2,832 4,016 Taxes on income (35) 57 -89 146
Consolidated profit/loss 1,127 -2,743 3,870
1) Adjustment in the figures for 2008 due to the change in accounting policies is explained in Note 2.

STATEMENT OF COMPREHENSIVE INCOME
Other comprehensive income comprises income and expenses recorded under Revaluation reserves.
PRESENTATION OF RECLASSIFICATION AMOUNTS INCLUDED IN THE INCOME STATEMENT
The reclassification amounts are the result of income and expenses which were accounted for through profit or loss during the reporting periodand which were previously recognised directly in equity in the revaluation reserves. They also include amortisation of revaluation reservesfrom the reclassification of securities and investments from the “available-for-sale financial assets” valuation category to the “loans and advances” category. Income recognised in the income statement is reported with a negative sign preceding the amount and expenses with apositive sign.
72
Note(s) 2009 2008 1) Change EUR in EUR in EUR in millions millions millionsConsolidated profit/loss 1,127 -2,743 3,870Other comprehensive income from financial instruments (15), (36) 285 -463 748Other comprehensive income from deferred taxes on financial
instruments (19), (36) -17 4 -20Other comprehensive income from investments accounted for using the
equity method (4), (15), (36) -7 0 -7Other comprehensive income, total 261 -460 721
Consolidated comprehensive income 1,388 -3,203 4,591
1) Adjustment in the figures for 2008 due to the change in accounting policies is explained in Note 2.
2009 2008 Change EUR in EUR in EUR in millions millions millionsReclassification amounts relating to financial instruments 135 327 -191Reclassification amounts relating to deferred taxes on financial instruments -1 0 -1
Total 134 327 -193

STATEMENT OF FINANCIAL POSITION
73
31 Dec. 31 Dec. Note(s) 2009 2008 1) Change EUR in EUR in EUR in millions millions millionsASSETS Cash reserves (39) 337 99 238Loans and advances to banks (10), (13), (40) 241,559 223,462 18,097Loans and advances to customers (10), (11), (13), (41) 99,376 104,444 -5,068Risk provisions for lending business (11), (14), (42) -6,904 -7,604 700Value adjustments from macro fair value hedge accounting (8), (43) 6,751 5,451 1,300Derivatives used for hedge accounting (8), (44) 14,622 13,028 1,594Other derivatives (9), (10), (45) 5,023 8,709 -3,685 Securities and investments (15), (16), (46) 36,709 44,228 -7,519Property, plant and equipment (17), (47) 876 871 4Intangible assets (18), (48) 44 62 -17Other assets (19), (49) 1,691 2,077 -386
Total 400,084 394,826 5,258
LIABILITIES AND EQUITY Liabilities to banks (10), (20), (50) 8,095 11,788 -3,693Liabilities to customers (10), (20), (51) 23,734 31,306 -7,572Certificated liabilities (20), (52) 321,429 302,559 18,870Value adjustments from macro fair value hedge accounting (8), (53) 27 13 14Derivatives used for hedge accounting (8), (54) 19,476 10,997 8,479Other derivatives (9), (10), (55) 6,838 19,104 -12,266Provisions (14), (21), (56) 2,065 1,728 336 Other liabilities (19), (57) 2,052 2,351 -299Subordinated liabilities (22), (58) 3,247 3,247 0Equity (23), (59) 13,121 11,733 1,388
Paid-in subscribed capital 3,300 3,300 0Capital reserve 5,947 6,254 -307Reserve from the ERP Special Fund 893 848 45Retained earnings 4,725 5,269 -544 Fund for general banking risks 46 50 -4Revaluation reserves (15) -290 -551 261Balance sheet loss -1,499 -3,436 1,937
Total 400,084 394,826 5,258
1) Adjustment in the figures for 2008 due to the change in accounting policies is explained in Note 2.

STATEMENT OF CHANGES IN EQUITY
Statement of changes in equity in financial year 2009
KfW’s reserves from the ERP Special Fund are increased on the basis of contractual agreements. KfW’s net income for the period in the amount of EUR 1,664 million reduces the balance sheet profit/loss carried forward from financial year 2008; moreover, the fund for generalbanking risks was reduced by EUR 4 million in this context. In addition, KfW’s capital reserve in the amount of EUR 307 million was offsetagainst the balance sheet loss or special reserve under Section 10 (3) of the KfW Law.
The difference from the comprehensive income is allocated to Other retained earnings or if recognised directly in equity, to Revaluationreserves.
74
As at 1 Owner-related Appropriation of As at 31 Jan. changes comprehensive Dec.EUR in millions 2009 in equity income 2009 2009
Subscribed capital 3,750 0 0 3,750less uncalled outstanding contributions -450 0 0 -450Capital reserve 6,254 -307 0 5,947
Promotional reserves from the ERP Special Fund 4,650 0 0 4,650Reserve from the ERP Special Fund 848 0 45 893Retained earnings 5,269 34 -578 4,725
Statutory reserve under Section 10 (2) KfW Law 1,574 0 0 1,574Special reserve under Section 10 (3) KfW Law 1,893 34 0 1,928Special reserve less the special loss account from provisioning pursuant to Section 17 (4) of the D-Mark Balance Sheet Law 21 0 0 21Other retained earnings 1,780 0 -578 1,202
Fund for general banking risks 50 0 -4 46 Revaluation reserves -551 261 -290Balance sheet loss -3,436 272 1,664 -1,499
EQUITY 11,733 0 1,388 13,121

Statement of changes in revaluation reserves in financial year 2009
75
Shares and Effects Investments other non-fixed of accounted for Bonds and other fixed- income deferred using the EUR in millions income securities securities taxes equity method Total
As at 1 Jan. 2009 -557 2 4 0 -551 A. Changes recognised in the income statement Decrease due to disposals 0 0 0 0 0Increase due to disposals 10 0 -1 0 9Decrease due to impairments 0 0 0 0 0Amortisation after reclassification 125 0 0 0 125
Total changes recognised in the income statement 136 0 -1 0 134B. Changes recognised directly in equity Changes in revaluation reserves due to impairment reversal only
for equity instruments 0 20 0 0 20Changes in revaluation reserves due to fair value changes 129 0 -15 -7 107
Total changes recognised directly in equity 129 19 -15 -7 126Effects of exchange rate changes 1 0 0 1
As at 31 Dec. 2009 -291 21 -13 -7 -290

Statement of changes in equity in financial year 2008 (1)
76
Appropriation As at 1 of consolidated As at 31 Jan. Owner-related changes comprehensive Dec.EUR in millions 2008 in equity income 2008 2008
Subscribed capital 3,750 0 0 3,750 less uncalled outstanding contributions -450 0 0 -450Capital reserve 6,254 0 0 6,254
Promotional reserves from the ERP Special Fund 4,650 0 0 4,650
Reserve from the ERP Special Fund 804 0 43 848Retained earnings 5,862 0 -594 5,269
Statutory reserve under Section 10 (2) KfW Law 1,574 0 0 1,574Special reserve under Section 10 (3) KfW Law 1,893 0 0 1,893Special reserve less the special loss account from provisioning pursuant to Section 17 (4) of the D-Mark Balance Sheet Law 21 0 0 21Other retained earnings 2,374 0 -594 1,780
Fund for general banking risks 200 0 -150 50Revaluation reserves -92 -460 -551Balance sheet loss -1,393 0 -2,043 -3,436
EQUITY 14,936 0 -3,203 11,733
(1) Adjustment in the figures for 2008 due to the change in accounting policies is explained in Note 2.

Statement of changes in revaluation reserves in financial year 2008
77
Shares and Effects other non-fixed of Bonds and other fixed- income Equity deferredEUR in millions income securities securities investments taxes Total
As at 1 Jan. 2008 -125 34 -1 0 -92 A. Changes recognised in the income statement Decrease due to disposals 0 -2 0 0 -3Increase due to disposals 33 0 0 0 33Decrease due to impairments 244 29 1 0 274Amortisation after reclassification 23 0 0 0 23
Total changes recognised in the income statement 299 27 1 0 327B. changes recognised directly in equity Changes in revaluation reserves due to fair value
changes -731 -62 0 4 -789
Total changes recognised directly in equity -731 -62 0 4 -789Effects of exchange rate changes 1 2 0 0 2
As at 31 Dec. 2008 -557 2 0 4 -551

STATEMENT OF CASH FLOWS
EUR in millions
The IAS 7 Cash and cash equivalents item reported in the statement of cash flows is identical to the Cash reserves balance sheet item and thuscomprises cash on hand and balances with central banks.
The statement of cash flows shows the changes in cash and cash equivalents in the financial year through the cash flows from operatingactivities, investing activities and financing activities.
78
2009 2008 1)
Consolidated profit/loss 1,127 -2,743 Non-cash items included in consolidated profit/loss and reconciliation to cash flow from operating
activities: Depreciation, amortisation, impairment and reversal of impairment losses (receivables, property, plant and
equipment, securities and investments) and changes in risk provisions for lending business 1,169 2,730Changes in other provisions 305 534Profit/loss from the disposal of securities and investments and property, plant and equipment -3 -17Other adjustments -3,374 623
Subtotal -775 1,127 Changes in assets and liabilities from operating activities after adjustment for non-cash items: Loans and advances to banks -18,098 -17,722Loans and advances to customers 3,654 -6,984 Securities and investments (securities) 7,854 863Other assets relating to operating activities 1,775 -22,384Liabilities to banks -3,693 4,331Liabilities to customers -7,572 -11,725Certificated liabilities 18,870 42,244Other liabilities relating to operating activities -4,152 9,377Interest and dividends received 18,017 28,590 Interest paid -15,363 -26,671Income tax paid -10 -58
Cash flow from operating activities 507 988Cash proceeds from the disposal of: Property, plant and equipment 24 9 Cash payments for investment in: Securities and investments (equity investments) -197 -307Property, plant and equipment -96 -117
Cash flow from investing activities -269 -416 Changes from other financing activities 0 -500
Cash flow from financing activities 0 -500 Cash and cash equivalents as at the end of the previous period 99 26 Cash flow from operating activities 507 988Cash flow from investing activities -269 -416Cash flow from financing activities 0 -500
Cash and cash equivalents as at the end of the period 337 99
1) Adjustment in the figures for 2008 due to the change in accounting policies is explained in Note 2.

The Other adjustments item mainly comprises the adjustment of net interest income in the amount of EUR -2,654 million as well as the net gains/losses from other financial instruments at fair value through profit or loss in the amount of EUR -582 million. It also comprises exchange rate changes in the amount of EUR -144 million.
Please refer to the comments on liquidity risk in “—Risk Report—Types of Risk—Liquidity Risk” for information on the KfW Group’s liquidity risk management.
79

Notes to Financial Statements
Accounting Policies
KfW is the promotional bank of the Federal Republic of Germany and was founded in 1948 as a public law institution based in Frankfurt amMain.
As at 31 December 2009, the KfW Group includes six subsidiaries and four special funds (securities funds — Wertpapiersondervermögen) that are fully consolidated. Two jointly controlled entities and one associated company are accounted for at equity.
The consolidated financial statements as at 31 December 2009 have been prepared, pursuant to Section 315a (1) of the German CommercialCode (Handelsgesetzbuch — HGB), in accordance with the International Financial Reporting Standards (IFRS), as applicable in the European Union (EU), and with the interpretations set out by the International Financial Reporting Interpretations Committee (IFRIC), asmandatory consolidated accounts in accordance with Article 4 of Regulation (EC) No 1606/2002 (IAS Regulation) of the EuropeanParliament and of the Council of 19 July 2002, as well as further regulations on the adoption of certain international accounting standards.The standards and interpretations that apply are those that had been published and endorsed by the EU by 31 December 2009.
The supplementary provisions of the German Commercial Code that also apply to IFRS consolidated financial statements have been takeninto account. The group management report prepared in accordance with Section 315 of the German Commercial Code includes the riskreport with the risk-oriented information on financial instruments as set out in IFRS 7, material events after the balance sheet date according to IAS 10 as well as information on capital and capital management as set out in IAS 1.124.
The consolidated financial statements were prepared in accordance with accounting policies that are uniform across the KfW Group and arebased on the going concern principle. All companies accounted for at equity prepared their annual financial statements as at 31December 2009.
The accounting policies were used consistently with the exception of the material changes described below:
The reporting currency and the functional currency of all consolidated entities is the euro. Unless otherwise specified, all amounts are statedin millions of euros (EUR in millions).
As a general rule, assets are carried at (amortised) cost, with the exception of the following financial instruments:
The consolidated financial statements include values which are determined on the basis of judgements and/or estimates and assumptionswhich are determined to the best possible knowledge and in accordance with the applicable standard. The amounts actually realised in thefuture can deviate from these estimates. Estimates and assumptions are required, in particular, for calculating risk provisions, recognisingand measuring provisions (including pension liabilities), performing the fair value accounting for financial instruments based on valuationmodels, assessing and measuring impairment of assets, and assessing the utilisation of deferred tax assets. The estimates and assumptionsunderlying these estimates are reviewed on
80
(1) Basis of presentation
• Use of options for prospective reclassification of financial assets in accordance with IAS 39 as amended on 13 October 2008pursuant to the resolution of 17 February 2009 for part of the Group’s securities that serve to maintain group liquidity.
• The deferral of the promotional subsidies as stated in the German law to define the economic plan of the ERP Special Fund (ERP-Wirtschaftsplangesetz) — which are granted to KfW for the purpose of executing ERP funding — is not recognised through profit or loss until the promotional expenses are incurred over the maturity of the loans granted; once a claim to a promotional subsidyexists the subsidy is initially reported as deferred income.
• derivative financial instruments carried at fair value through profit or loss;
• designated financial instruments carried at fair value through profit or loss; and
• available-for-sale financial assets carried at fair value recognised directly in equity.

an ongoing basis and are based, among other things, on experience, including expectations concerning future events that appear likely giventhe particular circumstances. Insofar as estimates and their underlying assumptions were required, the assumptions made are explained in thenotes to the relevant items.
KfW does not expect any deviations from its assumptions or any uncertainties with respect to estimates that could result in a substantialadjustment to the related assets and liabilities within the next financial year. Given the general uncertainties on the financial markets as wellas the current difficult global economic situation, however, this cannot be fully excluded. Yet because valuation models for measuring thefair value of financial instruments are used to a considerably lower extent than in the previous year, these risks are lower than in the previousyear. Given the increasing market liquidity, the KfW Group no longer valuates securities it issues using valuation models
In the financial year 2008 the promotional subsidies specified in the ERP-Wirtschaftsplangesetz that were granted to KfW for the first time for the purpose of executing ERP funding were recognised through profit or loss as interest income. They are now initially reported asdeferred income under Other liabilities and only shown as interest income when the underlying promotional expenses from the promotionalloans granted are incurred. Due to this methodical change, the figures for 2008 have been adjusted correspondingly in accordance with IAS8.15.
81
(2) Adjustments to corresponding figures for the previous year due to changes in accounting policies in accordance with IAS 8.14 et seq.

The effects of the changed method are shown in the following tables:
NET INTEREST INCOME IN ACCORDANCE WITH THE INCOME STATEMENT FOR THE FINANCIAL YEAR 2008
The new rules of the amended IAS 1 “Presentation of Financial Statements” in the version dated 6 September 2007 and of IFRS 8 “Operating Segments” to be applied for the first time in the financial year 2009 result in no material impacts on the bank’s net assets, financial position and results of operations.
The standards and interpretations newly adopted by the EU in 2009 and already applicable for the financial year 2009 have no materialimpacts on the Group’s net assets, financial position and results of operations and are not relevant for the Group.
The amendments to the standards IFRS 1 “First-time Adoption of International Financial Reporting Standards” (November 2008), IFRS 3 “Business Combinations” (January 2008), IAS 27 “Consolidated and Separate Financial Statements” (January 2008) and IAS 39 “Financial Instruments: Recognition and Measurement” (July 2008), which the EU has already adopted and the application of which is mandatory with effect from the financial year 2010, were not voluntarily applied early. These amendments are not expected to have any material impacts onthe Group’s net assets, financial position and results of operations nor are they of relevance to the Group.
The amendments of IAS 32 “Financial Instruments: Presentation” (October 2009), which the EU has already adopted and the application ofwhich is mandatory with effect from the financial year 2011, were not voluntarily applied early. These amendments are of no relevance tothe Group.
IFRIC 17 “Distributions of Non-cash Assets to Owners” and IFRIC 18 “Transfers of Assets from Customers”, which have already been adopted by the EU and the application of which is mandatory with effect from the financial year 2010, are of no relevance to the Group.
82
Before adjustment Adjustment After adjustment
EUR in millions
EUR in millions
EUR in millions
Interest income 28,677 -87 28,590Interest expense 26,671 0 26,671
Net interest income 2,006 -87 1,919
OTHER LIABILITIES AND EQUITY IN ACCORDANCE WITH THE BALANCE SHEET FOR THE FINANCIAL YEAR 2008 Before adjustment Adjustment After adjustment
EUR in millions
EUR in millions
EUR in millions
Other liabilities 2,264 87 2,351Equity 11,820 -87 11,733
Paid-in subscribed capital 3,300 — 3,300 Capital reserve 6,254 — 6,254Reserve from the ERP Special Fund 848 — 848Retained earnings 5,356 -87 5,269Fund for general banking risks 50 — 50Revaluation reserves -551 — -551Balance sheet loss -3,436 — -3,436
(3) Assessment of the impact of IFRS/IFRIC standards to be applied in the future

All significant subsidiaries, jointly controlled entities and associated companies have been included in the consolidated financial statements.
Affiliated entities are fully consolidated in accordance with IAS 27 if KfW can exercise control over the company directly or indirectly.Initial consolidation occurs as soon as control can be exercised. Affiliated entities are deconsolidated when control can no longer beexercised.
Associated and jointly controlled entities are included in accordance with IAS 28/IAS 31 insofar as significant influence or joint control isexercised.
Special purpose entities (SPEs) are companies formed to accomplish a narrow, well-defined objective. In accordance with IAS 27/SIC-12, a special purpose entity is consolidated when the substance of the relationship between the reporting enterprise and the SPE indicates that theSPE is controlled by that enterprise.
The structure of the consolidated group is set out in the Notes under “Disclosures on shareholdings”.
Consolidation involves revaluing the total assets and liabilities of the subsidiaries at the acquisition date, irrespective of the percentage ofequity instruments, and incorporating them into the consolidated balance sheet. The resulting adjustments from hidden reserves andobligations are treated in accordance with the applicable standards. If the revaluation procedure results in an excess of acquisition cost overassets, this amount is recognised as goodwill. At present, no goodwill is recognised.
Any intragroup assets and liabilities as well as expenses and revenues from transactions between companies included in the consolidatedfinancial statements are eliminated in the process of the intragroup consolidation of debt, expenses and earnings. Intragroup profits andlosses between consolidated companies are also eliminated.
Associated and jointly controlled entities are accounted for using the equity method.
KfW holds no minority interests.
A financial instrument is any contract that gives rise to a financial asset of one entity and a financial liability or equity instrument of anotherentity. The following explanations provide an overview of how the requirements of IAS 39 are implemented.
Initial recognition is as at the settlement date for non-derivative financial instruments and as at the trade date for derivatives.
Upon initial recognition, financial instruments must be assigned to one of the following categories. The subsequent valuation depends onthis categorisation:
The category “loans and receivables” includes non-derivative financial assets with fixed or determinable payments that are not quoted in anactive market. These are measured at amortised cost using the effective interest method. For the KfW Group, this primarily relates to thelending business reported under Loans and advances to banks and Loans and advances to customers. In its lending business the KfW Groupuses the Basel definition for its selection of default criteria and applies a uniform definition of default group-
83
(4) Consolidated group
(5) Basis of consolidation
(6) Financial instruments — recognition and measurement
a. Loans and receivables,
b. Held-to-maturity investments,
c. Financial assets and liabilities at fair value through profit or loss,
a. Financial assets and liabilities designated at fair value through profit or loss, fair value option,
b. Financial assets and liabilities held for trading,
d. Available-for-sale financial assets, or
e. Other liabilities.

wide. Default criteria are, in particular, payments overdue for more than 90 days (taking a marginality limit into account) and anticipatednon-fulfilment of payment obligations in the face of indicators such as filing for bankruptcy, material adverse change, distressed loan indication, cases of conversion and transfer, debt to equity swaps, deferment/restructuring and disposal of loans or advances at significantloss.
“Held-to-maturity investments” are non-derivative financial assets with fixed or determinable payments and fixed maturity that an entity has the intention and ability to hold to maturity. This valuation category is used for acquisitions in the Group’s securities portfolio on a case-by-case basis. These are carried under Securities and investments, any impairments and reversals of impairment losses are to be recognised inNet gains/losses from securities and investments. Premiums and discounts amortised according to the effective interest method areaccounted for through profit or loss under Interest income.
For financial assets and liabilities, the “fair value option” can be used irrevocably if
“Designated financial assets and liabilities” are measured at fair value through profit or loss. The KfW Group uses the “fair value option”for hedging relationships, structured products, securitisation transactions, equity finance business, and for financial instruments of specialfunds. These financial instruments are reported under Securities and investments, Liabilities to banks and customers and Certificatedliabilities. Changes to the fair value are stated under Net gains/losses from other financial instruments at fair value through profit or loss,while interest income/expense is reported under Net interest income.
Financial instruments that belong to the “financial assets and liabilities held for trading” category are measured at fair value through profit or loss. This category includes both derivative and non-derivative financial instruments purchased with the intention of generating a short-term profit. The KfW Group does not enter into any transactions with the intention of generating a short-term profit. Derivative transactionsconcluded exclusively for hedging purposes are allocated to this category if they are not used in hedge accounting according to IAS 39.They are reported under Other derivatives. Changes to the fair value are reported under Net gains/losses from other financial instruments atfair value through profit or loss. Derivatives used for hedge accounting are carried under the item of the same name. Changes to the fairvalue are reported under Net gains/losses from hedge accounting. Interest income/expense from derivatives is reported under Net interestincome.
All other financial assets fall under the “available-for-sale financial assets” category. The difference between the fair value and the (amortised) cost is recognised directly in a separate equity item until the asset is sold or an impairment loss has to be recognised in profit orloss. This is the case for debt instruments if there is objective evidence (“trigger”) of impairment with an impact on the expected future cash flows. Specific trigger events are defined depending on the type of financial instrument. For example, incidents such as payments overduefor 30 days or more, a deterioration in the internal rating to the non- performing loans category, and a decline in the market price can beconsidered objective evidence of a possible impairment. Furthermore, an impairment has to be recognised in profit or loss in the case of asignificant or prolonged decline below the acquisition cost of equity instruments. The impairment of a debt instrument assigned to thiscategory is reversed through profit or loss if there is no longer any objective evidence for an impairment. Impairments of equity instrumentsassigned to this category may only be reversed directly in equity. Equity instruments that cannot be reliably measured at fair value areaccounted for at cost. Impairments are recognised through profit or loss, while reversals of impairment losses are not considered. Within theKfW Group, the available-for-sale financial assets are reported under Securities and investments. Gains and losses from disposals,impairments to be recognised through profit or loss and the reversal of impairments from debt instruments are reported under Netgains/losses from securities and investments. Premiums and discounts are amortised through profit or loss using the effective interestmethod and recognised under Interest income.
84
• the categorisation can resolve or substantially reduce an accounting mismatch resulting from the valuation of financial assets orfinancial liabilities or the recognition of a loss or a gain as a result of differing accounting policies;
• a group of financial assets and/or financial liabilities is managed in accordance with the documented risk management or investmentstrategy and its performance is assessed on the basis of the fair value and the information is passed on to key personnel; or
• a contract contains one or several embedded derivatives which significantly modify the cash flows required by the contract or ananalysis is required to determine that the embedded derivative(s) may not be separated.

All non-derivative financial liabilities for which the “fair value option” is not applied are categorised as “other liabilities”. These are measured at amortised cost using the effective interest method. For the KfW Group, this category covers borrowings that are reported underLiabilities to banks and customers, Certificated liabilities and Subordinated liabilities.
Financial assets are derecognised as at the settlement date, with the exception of derivatives. Derecognition is performed when thecontractual rights relating to the asset have expired, the power of disposal/control has been transferred, or a substantial portion of the risksand rewards has been transferred to a third party unrelated to the KfW Group.
Financial liabilities are derecognised if the obligations set out in the agreement have been discharged or cancelled or have expired.
The amendment to IAS 39 dated 13 October 2008 expanded the possibilities to reclassify financial assets. Accordingly, until 31October 2008, it was possible to reclassify assets carried as “available-for-sale financial assets” as “loans and receivables” with retroactive effect as at 1 July 2008 and afterwards prospectively as at the date of the resolution if there was the intention and ability to hold therespective financial instruments for the foreseeable future or until maturity and if the general categorisation criteria for “loans and receivables” were fulfilled on the date of reclassification.
The KfW Group resolved to use this approach on 31 October 2008 with retroactive effect as of 1 July 2008 for its asset-backed securities for which, as part of the general crisis of confidence in the financial markets, there was no longer an active market when the decision waspassed (i.e., no current, regularly occurring market transactions on an arm’s length basis could be observed) and which were to be held untilto maturity.
Some of the securities that serve to maintain group liquidity – through the use in repo transactions or open market transactions of the European Central Bank — were reclassified with prospective effect taking advantage of the expanded possibilities to reclassify financialassets introduced on 17 February 2009. An active market for these securities that are to be held for the foreseeable future no longer existedat the date of the resolution, as a result of the general crisis of confidence in the financial markets.
The fair value on the date of reclassification is the new acquisition cost of the reclassified financial assets. Amortisation is accounted forthrough profit or loss under Interest income according to the effective interest method. The difference between the fair value and(amortised) cost, which had been recognised directly in equity until the reclassification, continues to be carried under equity as a separateitem. Amortisation using the effective interest method is accounted for through profit or loss under Interest income.
Classification for the Notes was performed in agreement with the Group’s business model focussed primarily on the lending business —valued at (amortised) cost — based on products or the balance sheet items which encompass them.
At the KfW Group, initial recognition of financial instruments is at fair value.
Subsequent valuation at amortised cost is based, within the KfW Group, on the fair value upon initial recognition, taking into account anyprincipal repayments and any impairments. The amortisation of premiums and discounts, transaction costs and fees is performed inaccordance with the effective interest method on the basis of the contractual cash flows. In its promotional business, only discounts areamortised; this is carried out until the end of the first fixed interest rate period (generally five or ten years).
At the KfW Group, subsequent valuation at fair value is based on the following hierarchy:
1. Active market
The best objective evidence of fair value is provided by published price quotations in an active market. A financial instrument is regarded asquoted in an active market if quoted prices are readily and regularly available and those prices represent current — i.e., traded on the date of conclusion or shortly before — and regularly occurring market transactions on an arm’s length basis. Apart from the traded nominal volumes, the contract sizes and the number of contracts, this assessment takes into account in particular the bid-ask spreads observed, which in the event of a significant expansion point towards an inactive market.
85
(7) Financial instruments — valuation techniques

2. No active market — valuation techniques
If the financial instrument is not quoted in an active market, valuation techniques are used. The valuation techniques used include, inparticular, the discounted cash flow (DCF) method and option pricing models, as well as a comparison with the fair value of a financialinstrument with almost identical characteristics (e.g., multiplier-based models). The valuation techniques take account of all of the parameters that the market participants would include in the pricing process, e.g., market rates, risk-free interest rates, credit spreads or swap curves. As these data can generally be observed on the market and are usually the only relevant parameters for measuring financialinstruments through valuation techniques, disclosures on valuation methods used for financial instruments carried at fair value normallystate “Valuation method based on observable market data (model)”.
3. No active market — equity instruments
If in exceptional cases it is not possible to reliably determine the fair value of equity instruments that are not quoted in an active marketusing valuation models, they are measured at cost. The fair value cannot be calculated reliably if the range of reasonable fair value estimatesfor this instrument is significant and the probabilities of the various estimates cannot be reasonably assessed.
For its securities, the Group examines whether a financial instrument is quoted on an active market based on homogeneous portfolios. Inexamining the criteria of an active market, particular account also need to be taken of whether the market transactions and pricing arecharacterised by very high illiquidity discounts, as the criteria for regularly occurring market transactions on an arm’s length basis can thus no longer be regarded as fulfilled.
As a result, in these cases, according to the valuation hierarchy of IAS 39, valuation methods to determine the fair value are used, which takeinto account the parameters which can be observed on the market. The valuation methods used thus include, in particular, changes increditworthiness and risk-free interest rates, however they also take into account the general and the financial instrument-specific tightening of the market due to lower liquidity.
This was no longer the case as at the reporting date — in contrast to the previous year characterised by the culmination of the general crisisof confidence in the financial markets — particularly for financial, insurance and corporate bonds, as well as for covered bonds (Pfandbriefe), so that the prices of liquid markets could again be used to determine fair value.
Fair values are determined on the basis of the valuation category for recognition on the balance sheet and for information on financialinstruments in the Notes. Fair values from active markets are applied, in particular, for bonds and other fixed-income securities — unless there are inactive markets and thus valuation techniques are used — as well as shares and other non-fixed income securities. However,valuation techniques for non-derivative financial instruments are applied in particular to the products reported under Loans and advances tobanks and customers, Liabilities to banks and customers, and Certificated liabilities. Valuation techniques are also applied to OTCderivatives. Equity investments and shares which cannot be reliably measured at fair value are measured at cost.
The fair value for loans to banks and customers is calculated using the discounted cash flow (DCF) method based on the discounting of therisk-adjusted cash flows with the swap curve. The expected loss calculated for the respective reporting date is used to correct the contractual cash flows. The fair value at initial recognition is equivalent to the cost upon acquisition. The customer fee includes operating expenses, themargin, the equity and debt risk premium, and any subsidies. The customer fee remains unchanged for subsequent valuation (constantspread).
The fair value of financial instruments due on demand, such as cash reserves or receivables and liabilities due on demand, is the carryingamount.
In cases in which no prices from liquid markets are available, recognised valuation models and methods are applied. The DCF method isused for securities, swaps, and currency and money market transactions with no embedded options and no complex coupons. Independentoptions, as well as derivatives with embedded options, triggers, guaranteed interest rates and/or complex coupon agreements, are measuredusing recognised models (e.g. Hull & White) unless they are listed on a stock exchange. The same applies for credit default swaps.
The aforementioned models are calibrated, if possible, on the basis of observable market data for instruments that are similar in terms of thetype of transaction, maturity, and credit quality.
86

Derivatives are used within the KfW Group for the hedging of interest rate and currency risks. Economic hedging relationships arerecognised through hedge accounting and by using the “fair value option”. Economic hedging relationships also impact the accounts in the form of embedded derivatives requiring separation which are spun off and accounted for through profit or loss. However, as not allderivatives are subject to hedge accounting or the “fair value option”, some economic hedging derivatives are reflected in the accounts,although their risk-mitigating impact is not reflected in the accounts because the hedged risk associated with the underlying transactions is not recognised in profit or loss under IFRSs.
Hedge accounting, i.e. the accounting for hedging instruments (derivatives) and hedged transactions in accordance with special rules, issubject to strict requirements.
Within the KfW Group, hedge accounting is used solely in the form of fair value hedges to recognise hedging relationships betweenderivatives and the respective assets/liabilities. The hedging relationship is reported at the individual transaction level in the form of microfair value hedge accounting, and at portfolio level in the form of macro fair value hedge accounting. The effectiveness of the hedgingrelationships is verified using the dollar offset method and a regression analysis.
In micro fair value hedge accounting, interest rate and currency risks from bonds allocated to securities and investments (“loans and receivables” and “available-for-sale financial assets” categories) and borrowings (“other liabilities” category) are hedged. The fair values attributable to the hedged risks are reported as an adjustment of the carrying amount of the hedged items with the corresponding gain or lossreported under Net gains/losses from hedge accounting. The hedging instruments are recognised at fair value under Derivatives used forhedge accounting. Changes in the value of these instruments are also reported under Net gains/losses from hedge accounting, leading to asubstantial compensation of the earnings effects resulting from the valuation of the hedged items. The fair value of the hedged risks fromhedging relationships which no longer fulfil the strict hedge accounting requirements is amortised over the residual term of the originalhedging relationship under Net gains/losses from hedge accounting.
In macro fair value hedge accounting, interest rate risks from loan receivables (“loans and receivables” category) and borrowings (“other liabilities” category) are hedged. The fair values attributable to the hedged risks in the hedged portfolios in the “loans and receivables”category are reported under Value adjustments from macro fair value hedge accounting on the assets side. The fair values attributable to thehedged risks in the hedged portfolios in the “other liabilities” category are reported under Value adjustments from macro fair value hedge accounting on the liabilities side. Changes in the fair values of the hedged risks from the hedged portfolios are reported under Netgains/losses from hedge accounting. The hedging instruments are reported at fair value under Derivatives used for hedge accounting.Changes in the value of these instruments are also reported under Net gains/losses from hedge accounting, with the consequence that theyalmost fully offset the earnings effects from the valuation of the hedged portfolios. The portfolio of underlying transactions is determinedeach month in the context of a dynamic hedge designation and reversal process. The resultant value adjustment items are amortised over theresidual term of the maturity period in Net gains/losses from hedge accounting. Disposals from the hedged portfolios result in a partialreversal of the related value adjustments in Net gains/losses from hedge accounting.
If the strict hedge accounting requirements for the designation of hedging relationships between derivatives and financial assets/liabilitiesare not fulfilled within the KfW Group, the “fair value option” is used for the non-derivative financial instruments in certain circumstances, in particular for structured products. Based on the product, in the case of some structured financial liabilities the embedded derivativesrequiring separation are accounted for independently instead of using the “fair value option”.
Further derivative financial instruments are also used to hedge risks, but their resultant hedge effect is not reflected in the accounts.
The fair values of all derivatives not subject to hedge accounting are reported under Other derivatives. Changes in the fair values arerecognised in the income statement under Net gains/losses from other financial instruments at fair value through profit or loss.
Derivative financial instruments can be part of a hybrid (combined) financial instrument as embedded derivatives. Under certain conditions,they are reported separately from the host contract, similar to stand-alone derivatives. They must be reported separately if the economic characteristics and risks of the
87
(8) Hedging relationships
(9) Treatment of embedded derivatives

embedded derivative are not closely related to the economic characteristics and risks of the host contract. The host contract will beaccounted for depending on its categorisation.
The KfW Group enters into contracts with embedded derivatives requiring separation particularly with respect to borrowings. As it makesuse of the “fair value option”, KfW reports these hybrid (combined) financial instruments at fair value. In the case of certain products, theembedded derivatives requiring separation are spun off and accounted for separately. Changes in fair value are recorded in Net gains/lossesfrom other financial instruments at fair value through profit or loss under the item Derivatives not qualifying for hedge accounting, wherethey have a compensatory effect on the valuation of the hedging derivatives.
Supplementary agreements made in the KfW Group’s equity finance business are treated as separate embedded derivatives which are measured at fair value through profit or loss and reported under Other derivatives. The loan receivables are reported under Loans andadvances to customers. Changes in fair value are recorded in Net gains/losses from other financial instruments at fair value through profit orloss under the item Derivatives not qualifying for hedge accounting.
Unscheduled termination rights that are granted regularly in promotional loan transactions are not recorded as embedded derivativesrequiring separation since the economic characteristics and risks associated with the termination rights are closely related to the economiccharacteristics and risks of the loans and a premature repayment is made approximately at amortised cost.
The KfW Group enters into credit derivatives as guarantor and secured party.
As part of active portfolio management, single name credit default swaps (“CDSs”) are used to hedge the risks of individual counterparties. These are recognised at fair value under Other derivatives. The changes in value are reported in the income statement under Net gains/lossesfrom other financial instruments at fair value through profit or loss. The current risk premiums are reported under Commission expense.
As part of risk diversification, single name CDSs are also used to acquire the risks of individual counterparties. These are recognised at fairvalue under Other derivatives. The changes in value are reported in the income statement under Net gains/losses from other financialinstruments at fair value through profit or loss. The current risk premiums are reported under Commission income.
As part of its promotional loan business, the KfW Group gives commercial banks the opportunity to place their credit risks in the capitalmarket as part of a synthetic securitisation via the two standardised platforms PROMISE (programme for the securitisation of SME loans)and PROVIDE (programme for the securitisation of housing loans). In a first step, the KfW Group assumes the default risks of the referenceportfolio via portfolio CDSs, while the risks are simultaneously passed on to third parties via portfolio CDSs/credit-linked notes. These transactions are reported using the “fair value option”. The fair values are reported as receivables or liabilities. Changes to the fair values arerecognised under Net gains/losses from other financial instruments at fair value through profit or loss. The current risk premiums arereported under Net commission income.
With respect to transactions for which, in line with individual contractual regulations, the “fair value option” is not used in order to avoid an accounting mismatch, portfolio CDSs are recognised in the balance sheet as financial guarantees issued or received in accordance with thegenerally applicable procedure for these financial instruments. Credit-linked notes with embedded financial guarantees not requiring separation are classified as “other liabilities” and recognised in accordance with the principles for reporting borrowings.
Until its sale in the financial year 2008, IKB was an affiliated entity of KfW, supported in 2007 and 2008 by the German banking sector andthe Federal Republic of Germany with measures protecting it against risks related to the US subprime mortgage crisis, various capitalmeasures and additional agreements made as part of its sale.
As part of the risk protection measures agreed in 2007, KfW assumed all of IKB’s rights and obligations under IKB’s liquidity lines to refinance the special purpose entities of the “Rhineland Funding Capital
88
(10) Credit derivatives
(11) Risk protection, capital measures and sale of IKB

Corporation, New York, USA” conduit. The other financial instruments used for risk protection were settled during 2008.
The “Rhineland Funding Capital Corporation, New York, USA” conduit was not consolidated by the KfW Group during the reporting year.The provision of the liquidity lines did not trigger an obligation for KfW to consolidate the special purpose entities because KfW did not“control” the SPEs within the meaning of SIC-12. KfW did not obtain any power of disposal over the SPEs or over their assets by providingthe liquidity lines. KfW served solely as provider of debt capital for the conduit and did not possess any decision-making powers over the assets of the SPEs or over the SPEs themselves. The fully drawn liquidity lines are reported under Loans and advances to customers.Individual impairments were recorded to account for the default risks.
The valuation of receivables resulting from the assumption of the liquidity lines was based on an analysis of the underlying assets. Thevaluation techniques took into account the hierarchy set out in IAS 39.48A. To the extent available, market values were used for theinstruments covered by the risk protection. In all other cases valuation was carried out on the basis of models that took into considerationdirectly or indirectly observed market prices for similar or substantially identical financial instruments. Valuation was carried out usingmodels only insofar as no prices or market parameters were available for the instruments covered by the risk protection or for similar orsubstantially identical financial instruments. In such cases the capital losses resulting from the protected financial instruments werecalculated using a cash flow-based loss estimate. The financial instruments were differentiated by asset category, rating and, in some cases,year of issue. The values were verified through comparison with quotations by arrangers and/or independent estimates by specialists.
Using this as a basis, KfW recorded individual impairments for the receivables resulting from the assumption of the liquidity lines.
In addition to various capital measures carried out to benefit IKB in the financial year 2008, KfW granted IKB liquidity facilities on marketterms, which are accounted for and measured according to the uniform group methods that apply to these products (loans and advances). Asat the date on which these financial statements were prepared, the commitments outstanding amounted to EUR 2.75 billion (originally EUR3.0 billion).
In connection with the sale in the financial year 2008, KfW also acquired financial instruments carrying risks from IKB in the form ofstructured securities and credit derivatives at a purchase price of EUR 1 billion. These financial instruments are accounted for according touniform group accounting policies for these instruments. KfW’s risk is initially limited to a first loss of EUR 150 million, with the FederalRepublic of Germany bearing further risks in an amount of up to EUR 600 million. The guarantee agreement concluded for this purpose isrecorded as a credit derivative with a positive market value under Other derivatives in line with the nature of the hedged risks. The changesin value are reported in the income statement under Net gains/losses from other financial instruments at fair value through profit or loss.
In addition, involvement by KfW in refinancing a portfolio of further IKB structured securities which were transferred to an SPE was agreedin the form of loans originally totalling EUR 0.6 billion on market terms with senior redemption. The KfW Group’s accounting is in line with the applicable accounting policies for these products (loans and advances). The provision of refinancing did not trigger a consolidationrequirement for the SPE for KfW, because KfW did not have any control over the SPE within the meaning of SIC-12. KfW did not acquire control of the SPE or the assets held by the SPE by providing refinancing. KfW served solely as provider of debt capital for the SPE and did not possess any decision-making powers over the assets of the SPE or over the SPE itself.
In addition, KfW agreed to indemnify IKB for certain legal risks up to a certain amount. As at the end of the reporting period, severalproceedings against IKB which are relevant in this context were pending. There were no major claims made against KfW under theindemnification agreement as a result of the legal action in 2009.
The functional currency of KfW and its consolidated subsidiaries and special funds is the euro. Monetary assets and liabilities denominatedin foreign currency are converted at the spot rate. Translation
89
(12) Foreign currency translation

is made as at the balance sheet date using the European Central Bank reference rates. Income and expenses are translated strictly at theaverage monthly rate.
The results from foreign currency translation are recognised in profit or loss under Net gains/losses from other financial instruments at fairvalue through profit or loss.
The KfW Group’s lending business carried at amortised cost is reported under Loans and advances to banks and customers. This itemconsists primarily of the promotional loan business, in which loans are typically granted to the final borrowers through accreditedcommercial banks. These assets are reported under Loans and advances to banks insofar as the commercial banks underwrite part of theliability. Promotional on-lending without underwriting of liability by commercial banks is reported under Loans and advances to customers.
Current interest and similar income are recorded under Interest income. Premiums, discounts, processing fees and charges are amortised inInterest income using the effective interest method. Processing fees that do not need to be amortised using the effective interest method arerecognised under Commission income.
Loans and advances to banks and customers comprise loans with a subsidy element (interest rate reduction) granted by KfW as part of theERP economic promotion programme. The promotional subsidies granted annually to KfW through the ERP Special Fund based on theERP-Wirtschaftsplangesetz for the purpose of executing ERP funding are reported as deferred income under Other liabilities; their deferralis not recognised in profit or loss under Interest income until the underlying promotional expenses are incurred during the loan maturity.
The overall risk provisions for lending business include the provisions for losses on loans and advances and receivables from reverse reposas a separate asset item, as well as the provisions for contingent liabilities and irrevocable loan commitments reported under Provisions.
The risks resulting from on balance sheet lending business are accounted for by individual and portfolio impairments recognised in profit orloss.
Individual impairments are recorded for counterparty risks identified in an impairment test of individual loans. The amount of theimpairment loss corresponds to the difference between the carrying amount of the loan and the discounted expected future cash flows frominterest and redemption payments and from collateral-based cash flows. The recognition of interest income in accordance with the originalcontractual terms is terminated as at the date on which the first individual impairment is set up. In the subsequent valuation, the effect ofcompounding the present value of anticipated cash flows is determined by using the original effective interest rate and carried as interestincome (unwinding). The risk provisions are reduced by this amount. Any reversals of individual impairment losses are accounted forthrough profit or loss.
Smaller and standardised loans are grouped into homogeneous subportfolios and specific valuation allowances are made as a lump sumbased on the assessed default risks. Any reversals of portfolio impairment losses are accounted for through profit or loss.
For performing loans not subject to individual impairment, the risk of impairment losses that have already occurred but have not yet beenindividually identified is addressed by portfolio impairment. Economic risk and transfer risk are taken into account for the calculation. Thekey parameters are the outstanding loan volume (based on the carrying amount) as at the reporting date, the expected loss given default andone-year probabilities of default (given a LIP [loss identification period] factor of 1). The probabilities of default are provided by credit riskcontrol, as is the loss given default, whereby the latter is adjusted for imputed cost. The underlying assumptions of expected losses arebacktested on a regular basis against the actual loss experience.
Moreover, portfolio impairments are formed for impairments on the loan portfolio that have already arisen but not yet been individuallyidentified, particularly in times of steep economic decline. Their identification is based on past experience gathered in similar economicscenarios at sector level (also regions).
90
(13) Loans and advances to banks and customers
(14) Risk provisions for lending business

For contingent liabilities and irrevocable loan commitments the individual risks detected are addressed in the form of provisions, with acorresponding effect on the income statement. For irrevocable loan commitments, impairments not yet identified individually are addressedby forming provisions, which are determined based on portfolio models.
Non-recoverable loans, for which no individual impairments were recorded, are written off directly. Recoveries on loans already written offare recognised as income from risk provisions.
Securities and investments include, in particular, securities portfolios. These mainly serve to support KfW’s liquidity status or are used tooptimise and stabilise the ability of the KfW Group to fulfil its promotional mandate in the long term.
The Securities and investments item on the balance sheet comprises bonds and other fixed-income securities, shares and other non-fixed income securities, equity investments, and shares in affiliated entities not included in the consolidated financial statements which are held byKfW, its subsidiaries and consolidated special funds.
To ensure uniform accounting treatment for equity investments with and without significant influence, individual group business divisionsthat provide equity financing as part of their promotional mandate are categorised as venture capital organisations for accounting purposesprovided they meet the respective requirements. These equity investments, like all other equity investments, are reported under Securitiesand investments.
Securities and investments are initially recognised at fair value and subsequently measured depending on their classification either as“financial assets at fair value through profit or loss” or as “available-for-sale financial assets”. Financial instruments with fixed or determinable payments which are not quoted in an active market are categorised as “loans and receivables”. Classification as “held-to-maturity investments” occurs on a case-by-case basis provided that the relevant criteria were fulfilled at the time of acquisition.
When non-listed equity investments are measured at fair value, appropriate allowances are made for illiquidity. For example, when discounted cash flow (DCF) models are used, a discount rate adjusted for a fungibility factor is applied. In cases where the fair value of non-listed equity investments cannot be reliably measured, such assets are carried at cost allowing for impairment losses.
Any changes in the value of “financial assets at fair value through profit or loss” are reported under Net gains/losses from other financial instruments at fair value through profit or loss. Realised gains and losses and impairments relating to the “available-for-sale financial assets”, “loans and receivables” and “held-to-maturity investments” categories are recognised under Net gains/losses from securities andinvestments; amounts reported for “loans and receivables” and “held-to-maturity investments” include allowances for impairment losses that have already occurred but have not yet been individually identified, based on the expected loss for one year. Unrealised gains from“available-for-sale financial assets” are recognised directly in equity as revaluation reserves. Current interest payments and dividends arereported under Interest income.
Associated and jointly controlled entities that are included in the KfW Group are also recognised under Securities and investments. Theirinclusion is based on the equity method insofar as there is significant influence or joint control. Any value adjustments are reported underNet gains/losses from securities and investments.
The KfW Group enters into repurchase agreements (“repos”) as standardised repos or reverse repos. These are combinations of simultaneous spot and forward transactions on securities with the same counterparty. The terms and modalities of collateralisation and for the use ofcollateral follow common market practice. Credit claims are also an eligible type of collateral for open-market transactions.
The securities sold under repo transactions (spot sale) continue to be recognised and measured as securities. The repayment obligation iscarried as a liability to banks or customers in the amount of the cash inflow.
91
(15) Securities and investments
(16) Repurchase agreements

Interest is recorded under Interest expense in accordance with the respective conditions of the repurchase agreements.
A repayment claim is recognised and measured as a loan or advance to banks or customers in the amount of the cash outflow generated byreverse repos. The securities received (spot purchase) are not recognised or measured. Interest is recorded in Interest income in accordancewith the respective conditions of the reverse repurchase agreements.
The land and buildings and the plant and equipment reported by the KfW Group are carried at cost less depreciation on a straight-line basis and impairment, both recognised under Administrative expense. An impairment is recognised if the carrying amount of the asset exceeds therecoverable amount, which is the higher of the fair value less the disposal cost or the value in use. The useful life is determined based onexpected wear and tear. The KfW Group assumes an estimated useful life of 40 to 50 years for premises, four years for workstationcomputer equipment and five years for other property, plant and equipment. Gains and losses from the sale of property, plant and equipmentare reported under Net other operating income.
The KfW Group’s land and buildings are primarily owner-occupied. There is a small volume of rental activity to third parties. Theseproperties are reported as investment property under Property, plant and equipment and measured as such. Every five years an expertopinion determines the fair value of these properties by applying the discounted earnings method unless a significant change in the realestate market becomes detectable beforehand.
Payments in advance and assets under construction are reported under Other property, plant and equipment; no scheduled impairment wasrecognised.
Under Intangible assets, the KfW Group reports purchased and internally generated software at cost less scheduled, straight-line depreciation and impairments, both recognised under Administrative expense. The useful life is determined based on expected wear andtear. The KfW Group assumes a useful life of five years.
Assets are impaired when the carrying amount of an asset exceeds the recoverable amount.
An impairment is recorded when no future economic benefits can be identified.
In-house software under development is reported under Other intangible assets.
KfW is a non-taxable entity. Taxes on income for non-exempt subsidiaries and their taxed permanent establishments are determined using tax laws in the country of residence. Current taxes on income as well as expenses and income from the change in deferred taxes arerecognised in profit or loss as Taxes on income or directly in equity under Revaluation reserves depending on the underlying transaction.Current and deferred tax assets and liabilities are reported under the items Other assets and Other liabilities. Deferred income tax assets andliabilities are offset insofar as the requirements are met.
Current taxes on income are calculated using currently applicable tax rates.
Deferred tax assets and liabilities arise as a result of differences between carrying values according to IFRSs of an asset or a liability and therespective tax bases if these are likely to result in taxable or tax deductible amounts in the future (temporary differences). Deferred tax assetsrelating to loss carryforwards not yet used are recognised only if there is a sufficient degree of certainty that the respective taxable entity willearn sufficient taxable income in subsequent periods to use the loss carryforward. Deferred tax assets and liabilities are recognised andmeasured either through profit or loss as Taxes on income or directly in equity under Revaluation reserves, depending on the underlyingtransaction.
92
(17) Property, plant and equipment and investment property
(18) Intangible assets
(19) Taxes on income

The item Liabilities to banks and customers primarily includes non-current borrowings carried at amortised cost and the KfW Group’s money-market transactions. The item Certificated liabilities contains bonds, notes and money-market instruments issued. Own issuesrepurchased for market-making purposes are deducted from the liabilities as at the repurchase date.
The “fair value option” is used for structured liabilities. There are no changes in the fair value due to changes in credit risk as KfW is classified in the highest rating classes with stable outlook by the leading international rating agencies. The valuation effects from market-related changes in purchase prices (including liquidity spreads) generated by the development of demand for the different KfW refinancinginstruments are recognised under Net gains/losses from other financial instruments at fair value through profit or loss. In the case of certainproducts, the embedded derivatives requiring separation are spun off and accounted for separately. Presentation of the different types ofborrowed funds is not based on their categorisation or their designation as hedged items. Valuation of the items is based on their respectivecategorisation.
Current interest is recorded in Interest expense; premiums and discounts are amortised using the effective interest method over the expectedlife in Interest expense. Changes in the value of liabilities designated at fair value are recorded in profit or loss under Net gains/losses fromother financial instruments at fair value through profit or loss. Results from the repurchase of own issues categorised as “other liabilities”are recognised as at the repurchase date under Net other operating income.
Provisions includes provisions for pensions and similar commitments, credit risks as well as other obligations of uncertain amount andtiming involving a probable outflow of funds.
The employees of the KfW Group participate in a company pension plan that pays retirement, long-term disability and survivor benefits. The KfW Group has solely defined-benefit pension plans. The benefits depend on the length of service and salary. Apart from employer-financed pension plans there are also plans in place involving contributions by employees.
The pension commitments are calculated by an independent qualified expert in accordance with the projected unit credit method on the basisof group-wide uniform parameters such as age, length of service and salary. The commitments are recognised at present value of the defined-benefit obligations as at the reporting date, taking into consideration actuarial gains and losses to be amortised. The discount factoris based on current market conditions for corporate bonds with a maturity matching that of the obligations. Additional demographic factors(including the Heubeck actuarial tables for 2005 G) and actuarial assumptions (rate of salary increases, rate of pension increases, rate of staffturnover, etc.) are accounted for. No plan assets were defined for the pension obligations of the KfW Group, so the related specialregulations do not apply.
The KfW Group recognises net cumulative actuarial gains and losses that exceed 10% of the present value of the defined-benefit obligations (corridor approach). Amounts in excess of the 10% mark are amortised on a straight-line basis over the expected average remaining working life and reported through profit and loss in Administrative expense and recognised under Provisions for pensions and similar commitments.
All pension obligations are financed from the recognised pension provisions; there are no fund-financed pension obligations. Allocations to pension provisions distinguish between current service cost, interest expense and other allocations (including past service cost). The interestexpense for pension obligations is reported under Other interest expense and other allocations are included in the item Administrativeexpense.
Pension-like obligations include commitments for deferred compensation, early retirement and partial retirement. Actuarial reports areprepared and a provision is set up accordingly for these types of commitments as well. There are no actuarial gains and losses, so that therecognised provision matches the present value of the obligations.
Other provisions are set up primarily for obligations to employees and for audit and consultancy services at the estimated expenditure.
93
(20) Liabilities to banks and customers and certificated liabilities
(21) Provisions

Subordinated liabilities consist of subordinated liabilities to the ERP Special Fund.
Subordinated liabilities are classified as “other liabilities” and carried at amortised cost.
Deferred interest as well as value adjustments from micro fair value hedge accounting are recognised under Other liabilities.
Current interest expenses are recorded under Interest expense.
The equity structure is determined by the KfW Law and IFRSs.
Pursuant to Section 10 (2) and (3) of the KfW Law, KfW’s net income for the period determined in accordance with the German Commercial Code is transferred to reserves and is included in equity under IFRSs. In accordance with IFRSs, the KfW Group must reportthe contractually agreed “strengthening” of the reserve from the ERP Special Fund under equity as Appropriation of consolidated profit/loss.
The KfW Group created a fund for general banking risks. Additions to or reductions of the fund are shown under IFRSs as appropriation ofconsolidated profit/loss.
Under IFRSs any remaining consolidated net income is allocated to Other retained earnings in the same period.
The revaluation reserves include the valuation results from the “available-for-sale financial assets” category and also deferred taxes recognised directly in equity, depending on the underlying transaction.
94
(22) Subordinated liabilities
(23) Equity

The KfW Group’s contingent liabilities result mainly from guarantees (financial guarantee contracts). All contingent liabilities are listed inthe Notes at their nominal amounts less provisions.
Irrevocable loan commitments are firm commitments by the KfW Group to grant a loan under contractually agreed terms. These are listed inthe Notes at their nominal amounts less provisions.
Assets and liabilities held by the KfW Group in its own name but for third-party accounts are not recognised. This applies in particular toloans granted under German Financial Cooperation to support developing countries; the federal budget both grants the funds andunderwrites these loans. The remuneration associated with these transactions is recognised under Commission income.
Leases are classified as operating leases or as finance leases depending on the risks and rewards relating to ownership of an asset. Thisclassification determines their accounting treatment.
The KfW Group enters into both types of leases as a lessee only. Real estate leases are classified as operating leases; the correspondingrental payments are included under Administrative expense.
Finance leases are entered into only to a limited extent. The leased assets are capitalised and depreciated over the useful life or lease term,whichever is shorter, in Administrative expense. Liabilities arising from future leasing payments are reported under Other liabilities.
95
(24) Contingent liabilities and irrevocable loan commitments
(25) Trust activities
(26) Leasing transactions
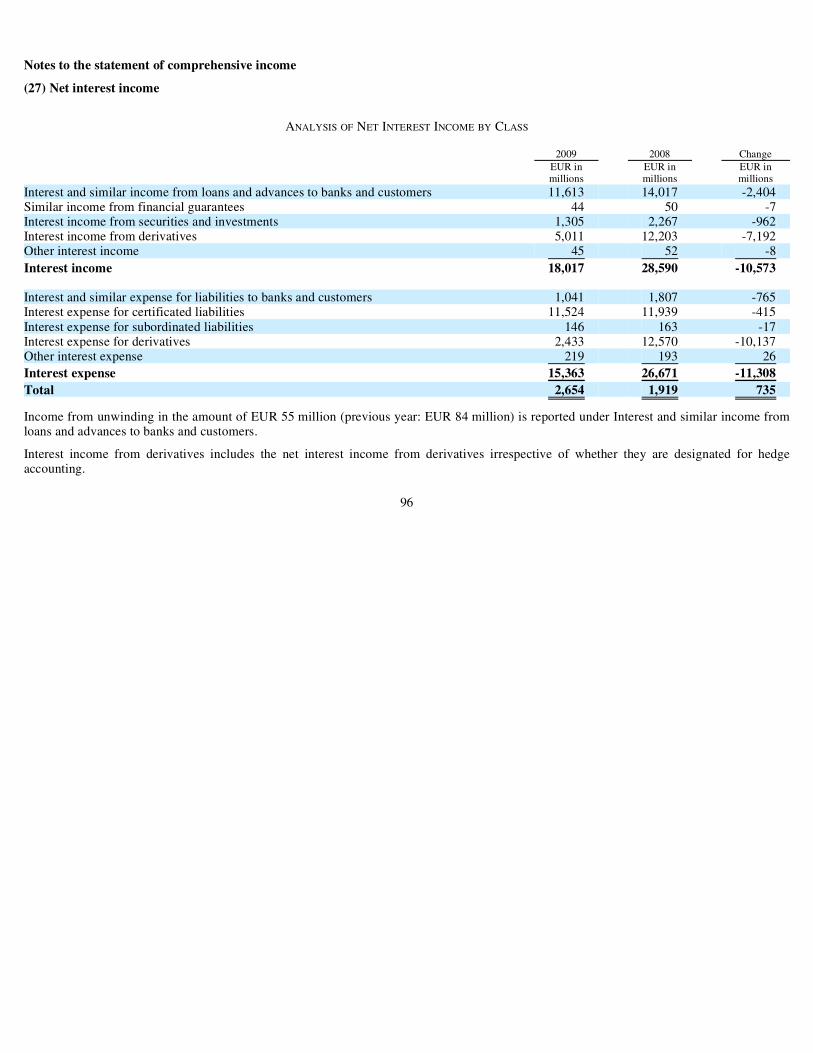
Notes to the statement of comprehensive income
ANALYSIS OF NET INTEREST INCOME BY CLASS
Income from unwinding in the amount of EUR 55 million (previous year: EUR 84 million) is reported under Interest and similar income fromloans and advances to banks and customers.
Interest income from derivatives includes the net interest income from derivatives irrespective of whether they are designated for hedgeaccounting.
96
(27) Net interest income
2009 2008 Change EUR in EUR in EUR in millions millions millionsInterest and similar income from loans and advances to banks and customers 11,613 14,017 -2,404Similar income from financial guarantees 44 50 -7Interest income from securities and investments 1,305 2,267 -962Interest income from derivatives 5,011 12,203 -7,192Other interest income 45 52 -8
Interest income 18,017 28,590 -10,573 Interest and similar expense for liabilities to banks and customers 1,041 1,807 -765Interest expense for certificated liabilities 11,524 11,939 -415 Interest expense for subordinated liabilities 146 163 -17Interest expense for derivatives 2,433 12,570 -10,137Other interest expense 219 193 26
Interest expense 15,363 26,671 -11,308
Total 2,654 1,919 735

ANALYSIS OF INTEREST INCOME FROM SECURITIES AND INVESTMENTS
ANALYSIS OF RISK PROVISIONS BY TRANSACTION
The direct write-offs in 2008 resulted almost entirely from the IKB risk protection measures (EUR 1.0 billion), which also necessitatedimpairment charges in the amount of EUR 0.3 billion.
97
2009 2008 Change EUR in EUR in EUR in millions millions millionsInterest income from bonds and other fixed-income securities 1,271 2,204 -933Income from shares and other non-fixed income securities 3 32 -29Income from equity investments 31 26 5Income from shares in affiliated entities not included in the consolidated financial
statements 0 5 -5
Total 1,305 2,267 -962
(28) Risk provisions for lending business
2009 2008 Change EUR in EUR in EUR in millions millions millionsImpairment charges 1,352 1,303 49Direct write-offs 123 1,087 -964
Expense for risk provisions 1,475 2,391 -916 Income from the reversal of impairment losses 443 184 259Income from recoveries of amounts previously written off 60 68 -8
Income from risk provisions 503 252 251
Total -972 -2,139 1,167

ANALYSIS OF NET COMMISSION INCOME BY CLASS
Commission income from lending business also includes current premiums and fees from the PROMISE and PROVIDE securitisationplatforms.
Other commission income includes fees for handling German Financial Cooperation with developing countries in the amount of EUR107 million (previous year: EUR 84 million).
ANALYSIS OF NET GAINS/LOSSES FROM HEDGE ACCOUNTING BY TYPE OF HEDGING RELATIONSHIP
Net gains/losses from macro fair value hedge accounting comprise the valuation of hedging instruments in the amount of EUR -1,746 million (previous year: EUR -6,079 million) and the valuation of hedged risks from the hedged portfolios. It also includes the amortisation of the value adjustments from the dynamic hedge designation and reversal process and the pro-rata reversal of value adjustments in the event of disposals from the underlying portfolios as well as the residual term effect of the hedging derivatives.
98
(29) Net commission income
2009 2008 Change EUR in EUR in EUR in millions millions millionsCommission income from lending business 286 274 12Commission income from credit derivatives 6 12 -6Other commission income 136 118 18Income from trust activities 1 1 0
Commission income 430 406 24 Commission expense for lending business 129 166 -37Commission expense for credit derivatives 3 4 -1Other commission expense 12 18 -6
Commission expense 144 188 -44
Total 286 218 68
(30) Net gains/losses from hedge accounting
2009 2008 Change EUR in EUR in EUR in millions millions millionsMicro fair value hedge accounting 389 -450 839Macro fair value hedge accounting -702 141 -843
Total -313 -309 -4

ANALYSIS OF NET RESULTS FROM MICRO FAIR VALUE HEDGE ACCOUNTING BY HEDGED ITEM
99
2009 2008 Change EUR in EUR in EUR in millions millions millionsHedging of securities and investments -17 51 -68Hedging of liabilities to banks and customers 7 -8 15Hedging of certificated liabilities 314 -434 748Hedging of subordinated liabilities 4 -5 9
Subtotal: Effectiveness of hedges 308 -396 704Amortisation of value adjustments 81 -54 135
Total 389 -450 839
Gross analysis of valuation results from micro fair value hedge accounting:
COMPARISON OF HEDGED ITEMS AND HEDGING INSTRUMENTS IN FINANCIAL YEAR 2009 Hedging Hedged items instruments Effectiveness of hedges EUR in EUR in EUR in millions millions millionsHedging of securities and investments -1 -16 -17Hedging of liabilities to banks and customers 27 -20 7 Hedging of certificated liabilities 2,864 -2,550 314Hedging of subordinated liabilities -49 53 4
Total 2,841 -2,533 308

Gross analysis of valuation results from micro fair value hedge accounting:
COMPARISON OF HEDGED ITEMS AND HEDGING INSTRUMENTS IN FINANCIAL YEAR 2008
100
Hedged Hedging items instruments Effectiveness of hedges EUR in EUR in EUR in millions millions millionsHedging of securities and investments 731 -680 51Hedging of liabilities to banks and customers -73 65 -8 Hedging of certificated liabilities -11,294 10,860 -434Hedging of subordinated liabilities -224 219 -5
Total -10,859 10,464 -396
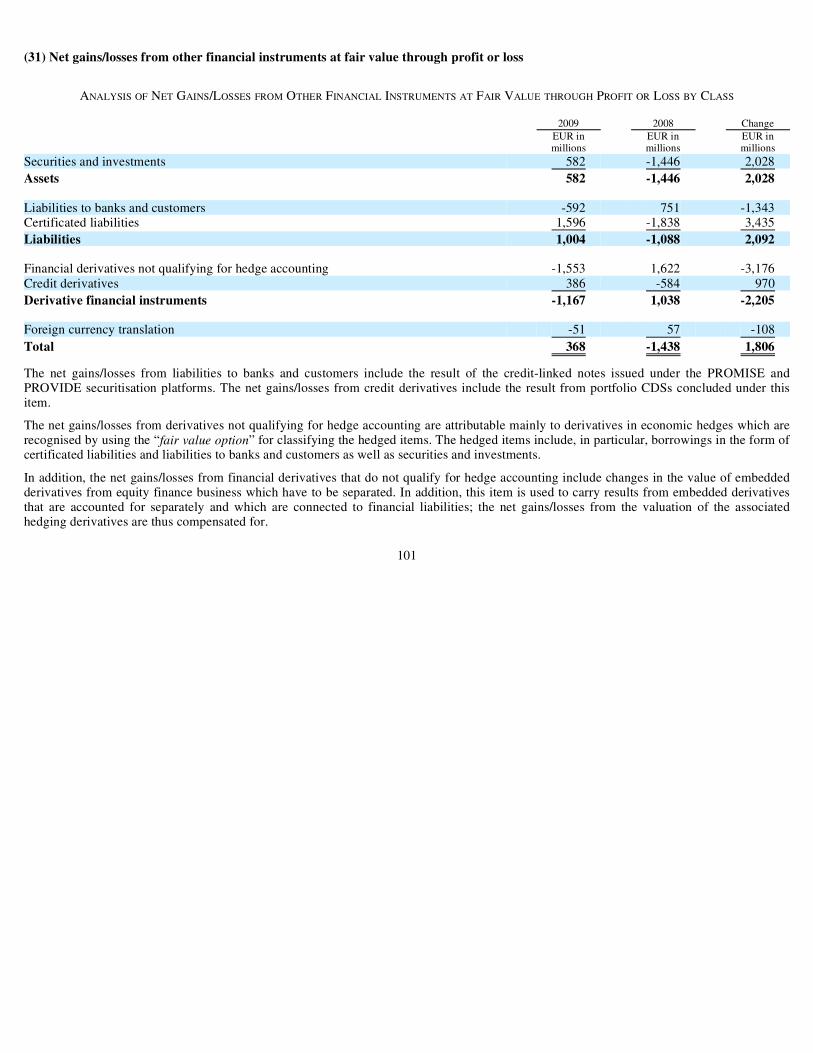
(31) Net gains/losses from other financial instruments at fair value through profit or loss
ANALYSIS OF NET GAINS/LOSSES FROM OTHER FINANCIAL INSTRUMENTS AT FAIR VALUE THROUGH PROFIT OR LOSS BY CLASS
The net gains/losses from liabilities to banks and customers include the result of the credit-linked notes issued under the PROMISE and PROVIDE securitisation platforms. The net gains/losses from credit derivatives include the result from portfolio CDSs concluded under thisitem.
The net gains/losses from derivatives not qualifying for hedge accounting are attributable mainly to derivatives in economic hedges which arerecognised by using the “fair value option” for classifying the hedged items. The hedged items include, in particular, borrowings in the form of certificated liabilities and liabilities to banks and customers as well as securities and investments.
In addition, the net gains/losses from financial derivatives that do not qualify for hedge accounting include changes in the value of embeddedderivatives from equity finance business which have to be separated. In addition, this item is used to carry results from embedded derivativesthat are accounted for separately and which are connected to financial liabilities; the net gains/losses from the valuation of the associatedhedging derivatives are thus compensated for.
101
2009 2008 Change EUR in EUR in EUR in millions millions millionsSecurities and investments 582 -1,446 2,028
Assets 582 -1,446 2,028 Liabilities to banks and customers -592 751 -1,343Certificated liabilities 1,596 -1,838 3,435
Liabilities 1,004 -1,088 2,092 Financial derivatives not qualifying for hedge accounting -1,553 1,622 -3,176 Credit derivatives 386 -584 970
Derivative financial instruments -1,167 1,038 -2,205 Foreign currency translation -51 57 -108
Total 368 -1,438 1,806

ANALYSIS OF NET GAINS/LOSSES FROM SECURITIES AND INVESTMENTS AT FAIR VALUE THROUGH PROFIT OR LOSS BY PRODUCT TYPE
ANALYSIS OF NET GAINS/LOSSES FROM CREDIT DERIVATIVES AND CREDIT-LINKED NOTES FROM THE SECURITISATION PLATFORMS PROMISE AND PROVIDE AT FAIR VALUE THROUGH PROFIT OR LOSS
GROSS ANALYSIS OF RESULTS FROM ECONOMICALLY HEDGED BORROWING: COMPARISON OF HEDGED ITEMS AND HEDGING INSTRUMENTS
102
2009 2008 Change EUR in EUR in EUR in millions millions millionsBonds and other fixed-income securities 601 -1,121 1,721Shares and other non-fixed income securities 1 -323 325Equity investments -20 -2 -18
Total 582 -1,446 2,028
2009 2008 Change EUR in EUR in EUR in millions millions millionsSingle Name CDSs 98 -64 162Portfolio CDSs -286 286 -572PROMISE / PROVIDE -27 -3 -25
CDSs 574 -806 1,380Issued credit-linked notes -601 804 -1,405
Total -215 219 -435
2009 2008 Change EUR in EUR in EUR in millions millions millionsBorrowings 1,605 -1,891 3,496Hedging instruments -1,686 2,313 -3,999
Total (Effectiveness of economic hedges) -81 422 -503

(32) Net gains/losses from securities and investments
ANALYSIS OF NET GAINS/LOSSES FROM SECURITIES AND INVESTMENTS BY CLASS
The net gains/losses from financial instruments include gains and losses realised from the sale and impairment of securities and investmentsclassified as “available-for-sale financial assets”, “loans and receivables” or “held-to-maturity investments”. Both the net gains/losses fromshares and other non-fixed income securities and the net gains/losses from equity investments include income from the disposal of financialassets that were recognised at cost.
In financial year 2008, net gains/losses from held-for-sale affiliated entities contained expenses resulting from the sale of IKB only.
103
2009 2008 Change EUR in EUR in EUR in millions millions millionsBonds and other fixed-income securities -83 -436 353Shares and other non-fixed income securities 1 -25 26Equity investments -35 -95 59
Financial instruments -117 -555 438Investments accounted for using the equity method -3 3 -6Held-for-sale affiliated entities 0 -1,421 1,421
Total -120 -1,974 1,854

DISCLOSURES ON IMPAIRMENT OF SECURITIES AND INVESTMENTS
DISCLOSURES ON THE REVERSAL OF IMPAIRMENT LOSSES FROM SECURITIES AND INVESTMENTS
104
2009 2008 Change EUR in EUR in EUR in millions millions millionsSecurities and investments 142 562 -420
Bonds and other fixed-income securities 100 405 -304Shares and other non-fixed income securities 0 32 -32Equity investments 41 125 -84
Total 142 562 -420
2009 2008 Change EUR in EUR in EUR in millions millions millionsSecurities and investments 34 1 33
Bonds and other fixed-income securities 34 1 33
Total 34 1 33

(33) Administrative expense
ANALYSIS OF ADMINISTRATIVE EXPENSE
Non-personnel expense includes EUR 5 million for depreciation, amortisation and impairment relating to finance leases (previous year: EUR6 million).
Other administrative expense includes rental expense arising from operating leases in the amount of EUR 16 million (previous year: EUR14 million).
(34) Net other operating income
ANALYSIS OF NET OTHER OPERATING INCOME
Other operating income contains income from repurchasing own issues, rental income including investment property income of EUR 3 million(previous year: EUR 4 million) and income from the reversal of other provisions.
In 2008, net other operating income included in particular the contributions by the Federal Government and the German banking sector to theIKB capital measures and the risk protection for IKB.
105
2009 2008 Change EUR in EUR in EUR in millions millions millionsWages and salaries 333 305 28Social security contributions 44 41 3Expense for pension provision and other employee benefits 27 20 7
Personnel expense 404 366 38 Other administrative expense 256 233 22Depreciation, amortisation and impairment of property, plant and equipment and intangible
assets 83 46 37
Non-personnel expense 339 280 59
Total 742 646 97
2009 2008 Change EUR in EUR in EUR in millions millions millionsOther operating income 51 1,592 -1,540 Other operating expense 29 56 -28
Total 23 1,536 -1,513

(35) Taxes on income
ANALYSIS OF TAXES ON INCOME BY COMPONENT
In 2009 deferred tax assets resulted in expenses of EUR 22 million (previous year: income of EUR 100 million – in particular from the first-time inclusion of KfW IPEX-Bank). These deferred tax assets were largely a result of the change in recognition of temporary differences.
The reconciliation presents the relationship between the calculated income tax expense for the financial year and the taxes on income.
TAX RECONCILIATION
106
2009 2008 Change EUR in EUR in EUR in millions millions millionsCurrent taxes on income 35 12 24Deferred taxes 22 -100 122
Total 57 -89 146
2009 2008 Change EUR in EUR in EUR in millions millions millionsProfit/loss from operating activities (before taxes) 1,184 -2,832 4,016Group income tax rate (%) 0 0 0
Calculated income tax expense for 2009 0 0 0 Effects of tax rate differentials within the Group -116 -180 64Effect of tax rate changes 0 -62 62Effects of previous year taxes recorded in the reporting year 9 -7 16Effects of non-deductible taxes on income 14 3 11Effects of non-deductible business expenses 6 2 4Effects of tax-free income -2 -1 -1Trade tax add-ons 2 4 -2 Permanent accounting differences 0 -1 1Effects of changes in recognised deferred tax assets 144 152 -8Other effects 0 -2 2
Reported taxes on income 57 -89 146

The KfW Group’s applicable income tax rate of zero per cent, on which the reconciliation is based, takes into account the tax status of KfW as a non-taxable public-law institution and the major effect of this status on profit/loss from operating activities.
The effects of tax rate differentials result from individual group companies being taxable and the related different tax rates. The tax rates wereunchanged from the previous year at between 0% and 32%.
The effects of changes in recognised deferred tax assets include, in particular, the non-consideration of tax losses recorded during the reporting year and of the surplus assets for deductible temporary differences. This reflects KfW’s conservative approach to the valuation of deferred tax assets.
(36) Notes to other comprehensive income
ANALYSIS OF OTHER COMPREHENSIVE INCOME BY CLASS
Other comprehensive income comprises income and expenses recognised directly in equity under Revaluation reserves.
107
2009 2008 Change EUR in EUR in EUR in millions millions millionsFinancial instruments 285 -463 748
Bonds and other fixed-income securities 266 -431 697Shares and other non-fixed income securities 19 -33 52Equity investments 0 1 -1
Deferred taxes on financial instruments -17 4 -20Investments accounted for using the equity method -7 0 -7
Other comprehensive income, total 261 -460 721

ANALYSIS OF RECLASSIFICATION AMOUNTS INCLUDED IN THE INCOME STATEMENT BY CLASS
The reclassification amounts are the result of income and expenses which were accounted for through profit or loss during the reporting periodand which were previously recognised directly in equity in the revaluation reserves. They also include amortisation of revaluation reservesfrom the reclassification of securities and investments from the valuation category “available-for-sale financial assets” to the “loans and advances” category. Income recognised in the income statement is reported with a negative sign preceding the amount and expenses with apositive sign.
108
2009 2008 Change EUR in EUR in EUR in millions millions millionsReclassification amounts relating to financial instruments 135 327 -191
Bonds and other fixed-income securities 136 299 -163Shares and other non-fixed income securities 0 27 -27Equity investments 0 1 -1
Reclassification amounts relating to deferred taxes on financial instruments -1 0 -1
Total 134 327 -193

Segment reporting
(37) Segment reporting by business area
In accordance with the provisions of IFRS 8, segment reporting follows the internal management reporting system, which is used by theGroup’s main decision makers to assess each segment’s performance and to allocate resources to segments.
In accordance with the internal business area structure in place since 1 January 2009, the segments and their products and services are brokendown as follows:
As part of the reorientation of the business area structure as at 1 January 2009, the previous business area of Investment finance Germany andEurope was divided into the three new business areas KfW Mittelstandsbank, KfW Privatkundenbank and KfW Kommunalbank. Apart fromsecurities and money market investments, refinancing and holding arrangements (all of which were previously allocated to the sincediscontinued business area Shareholdings, treasury and services), the newly created Financial markets business area also comprises loansecuritisation, which was previously allocated to Investment finance Germany and Europe. The group centre now includes advisory support(previously in Investment finance Germany and Europe) and strategic equity investments (previously in Shareholdings, treasury and services)from the discontinued business areas.
The new business area structure was used as the basis for conforming comparative figures for financial year 2008.
The business areas are measured on the basis of their contribution to consolidated profit. The individual line items are based on the followingmethods:
109
KfW Mittelstandsbank - Financing of corporate investments and industrial pollution control
- Equity financing (including tbg Technologie-Beteiligungs-Gesellschaft mbH) KfW Privatkundenbank - Financing for housing construction and modernisation
- Education finance KfW Kommunalbank - Infrastructure and social finance
- Global loans
- Transactions on behalf of the Federal Government Export and project finance - Financing for German and European export activities
- Financing for projects and investments in the German and European interest Promotion for developing and transition countries
-
Promotion of developing and transition countries on behalf of the Federal Government (budget funds) with complementary funds raised by KfW in the market
-
Financing provided by DEG – Deutsche Investitions- und Entwicklungsgesellschaft mbH (private enterprise financing)
Financial markets - Securities and money market investments
- Loan securitisation
- Holding arrangements for the Federal Republic of Germany
- Refinancing Group centre - Central interest rate and currency management
- Strategic equity investments
- Advisory services
110
• Net interest income (before interest rate reductions) comprises interest margins from asset operations calculated on the basis of the marketinterest rate method1. The item also includes the imputed return on equity with an analysis based on economic capital usage. Group centre also includes the treasury result, which largely comprises the income/loss from interest rate management and profit contributions from KfWrefinancing2.
• The interest rate reductions included in Net interest income in the income statement are reported separately in the internal managementreport due to their special relevance as a management variable. Interest rate reductions are components of promotional business of the KfWMittelstandsbank, KfW Privatkundenbank and KfW Kommunalbank business areas. Promotional loans with a KfW interest receivablewhich is below the KfW refinancing rate are deemed reduced-interest loans.
• The allocation of administrative expense is based on the results from activity-based accounting by cost centre3. Administrative expense includes depreciation on property, plant and equipment.
• Deviating from previous reporting, risk provisions for lending business are no longer allocated to the segments on the basis of the concept ofexpected losses (standard risk costs). In line with the changes in internal reporting, net impairment charges, direct write-offs and recoveries on loans written off are now distributed among the business areas according to the attributable risk provision amounts.
• The valuation result comprises the net gains/losses from hedge accounting, the net gains/losses from other financial instruments at fair value,the net gains/losses from securities and investments, and net other operating income.
• When taxes on income are allocated to the business areas (excluding the group centre), only the current taxes on income are taken intoaccount. Deferred taxes are allocated to the group centre.
• The reported economic capital requirement to cover potential credit, market price and operating risks is quantified for a solvency level of99.96%4.
• Segment assets are not reported since, as per the internal management reporting system, they are used neither to assess the performance ofthe business areas nor to allocate resources to business areas.
• In line with the changed internal reporting, the limited number of transfers between profit contribution items as part of internal managementreporting which did not impact the bottom line are no longer carried out. The comparative figures from the previous year were adjustedaccordingly.
• The portrayal of segment income and expense is based on consolidated figures. Internal administrative and commission expenses resultingwithin the Group as well as commission income and other operating income resulting from service relationships between the business areasare adjusted in the segment reporting. Any minimal consolidation effects that remain are reported under Reconciliation/consolidation.
1 Refinancing at matching maturities using KfW’s internal refinancing curve is assumed for the calculation of interest margins in this method.
2 The difference between the realised refinancing rates and the maturity structure, and the refinancing rates calculated in-house. This profit contribution can currently only be calculated indicatively. Therefore, it is not allocated to the Financial markets business area.
3 The costs incurred in the organisational units are allocated to the products by means of core services.
4 The statistical models and methods used are explained in the risk report section of the group management report.
SEGMENT REPORTING BY BUSINESS AREA FOR FINANCIAL YEAR 2009
1 In the Export and project finance business area, the valuation result includes the result attributable to investments accounted for using the equity method totalling EUR
-3 million.
SEGMENT REPORTING BY BUSINESS AREA FOR FINANCIAL YEAR 2008
Promotion for Export developing KfW and and Mittel- KfW KfW project transition Financial Group Reconciliation/ KfWEUR in millions standsbank Privatkundenbank Kommunalbank finance1 countries markets centre consolidation Group
Volume of new commitments 23,766 16,094 9,358 8,910 4,497 1,537 98 -394 63,867
Net interest income
before interest rate reductions 264 155 55 627 201 287 1,633 2 3,224
Net commission income 25 8 5 84 131 37 -4 0 286
Administrative expense 115 99 27 136 191 64 110 0 742
Operating result before valuation (before interest rate reductions) 174 64 34 575 141 261 1,519 2 2,769
Risk provisions for lending business -248 -2 14 -499 -232 -27 21 0 -972
Valuation result -43 0 2 -53 -10 363 -300 -2 -42
Profit/loss from operating activities (before interest rate reductions) -117 62 50 23 -101 597 1,241 0 1,755
Interest rate reductions -262 -234 -75 — — — — — -571Taxes on income -1 — 0 22 3 0 33 — 57Consolidated profit -379 -172 -25 1 -104 597 1,208 0 1,127
Economic capital
requirement 2,013 1,116 415 1,844 888 1,805 1,761 9,842
Promotion for Export developing KfW and and Mittel- KfW KfW project transition Financial Group Reconciliation/ KfWEUR in millions standsbank Privatkundenbank Kommunalbank finance1 countries markets centre consolidation Group
Volume of new commitments 17,027 14,856 11,561 17,552 4,873 1,938 37 -52 67,791
Net interest income
before interest rate reductions 237 140 56 548 130 239 983 192 2,525
Net commission income 15 4 13 28 101 54 -6 9 218
Administrative expense 112 85 25 129 173 59 55 7 646
Operating result before valuation (before interest rate reductions) 139 59 44 446 59 234 922 195 2,098
Risk provisions for lending business -190 -26 -162 -203 -55 -13 -264 -1,226 -2,139
Valuation result 34 0 1 -74 -10 -1,599 -789 251 -2,185
Profit/loss from operating activities

1 In the Export and project finance business area, the valuation result includes the result attributable to investments accounted for using the equity method totalling
EUR 3 million.
111
(before interest rate reductions) -17 33 -117 169 -6 -1,377 -131 -781 -2,226
Interest rate reductions -248 -244 -114 — — — 0 — -606Taxes on income — — 0 5 6 1 -101 — -89Consolidated profit -265 -211 -231 165 -12 -1,378 -30 -781 -2,743
Economic capital
requirement 1,588 900 499 1,567 664 1,609 1,493 236 8,556

The reconciliation/consolidation column includes all adjustments that were necessary to reconcile segment information with the aggregatedinformation for the KfW Group. The consolidation effects reported for “Volume of new commitments” relate to commitments for programme loans made by KfW Mittelstandsbank for which KfW IPEX-Bank acts as on-lending bank. The other amounts in this column in the segmentreport for 2009 result from minimal consolidation effects. The comparative figures for 2008 comprise a limited amount of consolidation effectsalong with the impact on earnings of the risk protection for IKB and of the sale of KfW’s interest in IKB.
(38) Segment reporting by region
Net interest and commission income are allocated on the basis of the clients’ geographical location. The imputed return on equity included innet interest income and the treasury result are allocated to Germany. The Group receives commission income from the Federal Government forsupporting developing countries using budget funds of the Federal Government. This is allocated according to the region of the countryreceiving the investment. The commission expense paid to special purpose entities resulting from the loan securitisation platform is distributedaccording to the geographical location of the originator bank.
Property, plant and equipment and intangible assets are not reported according to region because – apart from immaterial amounts – these assets relate to Germany.
SEGMENT REPORTING BY REGION FOR FINANCIAL YEAR 2009
The reconciliation/consolidation column includes all adjustments that were necessary to reconcile segment information with the aggregatedinformation for the KfW Group. The amounts in this column in the segment report for financial year 2009 result solely from minimalconsolidation effects. The comparative figures for financial year 2008 comprise a limited amount of consolidation effects along with the impactof the risk protection for IKB and of the sale of KfW’s interest in IKB on earnings.
112
Europe Rest of the Reconciliation/EUR in millions Germany (excl. Germany) world consolidation KfW GroupNet interest income 1,829 402 422 2 2,654 Net commission income 105 40 142 0 286
Segment income 1,934 441 564 2 2,940
SEGMENT REPORTING BY REGION FOR FINANCIAL YEAR 2008 Europe Rest of the Reconciliation/EUR in millions Germany (excl. Germany) world consolidation KfW Group
Net interest income 1,110 327 290 192 1,919Net commission income 89 20 99 9 218
Segment income 1,200 347 390 201 2,137
Notes to the balance sheet
(39) Cash reserves
ANALYSIS OF CASH RESERVES BY CLASS
(40) Loans and advances to banks
ANALYSIS OF LOANS AND ADVANCES TO BANKS BY CLASS
The receivables from reverse repos and the PROMISE and PROVIDE securitisation platforms are included in Other receivables.
ANALYSIS OF LOANS AND ADVANCES TO BANKS BY LIABILITY TYPE
113
31 Dec. 2009 31 Dec. 2008 Change EUR in EUR in EUR in millions millions millionsBalances with central banks 337 99 238
31 Dec. 2009 31 Dec. 2008 Change EUR in EUR in EUR in millions millions millionsMoney-market transactions 4,004 5,065 -1,060Loans and advances 218,870 210,357 8,513Promissory note loans 0 0 0Other receivables 18,685 8,040 10,644
Total 241,559 223,462 18,097
31 Dec. 2009 31 Dec. 2008 Change EUR in EUR in EUR in millions millions millionsDirect loans to banks 82,084 78,002 4,082On-lent customer loans with full underwriting borne by the on-lending bank 132,422 129,627 2,795On-lent customer loans with partial underwriting borne by the on-lending bank 4,011 2,406 1,605Direct and on-lent subordinated loans 353 321 31
Total 218,870 210,357 8,513

(41) Loans and advances to customers
ANALYSIS OF LOANS AND ADVANCES TO CUSTOMERS BY CLASS
The receivables from reverse repos and the PROMISE and PROVIDE securitisation platforms are included in Other receivables.
ANALYSIS OF LOANS AND ADVANCES TO CUSTOMERS BY LIABILITY TYPE
114
31 Dec. 2009 31 Dec. 2008 Change EUR in EUR in EUR in millions millions millionsMoney-market transactions 0 100 -100Loans and advances 98,826 103,368 -4,542Promissory note loans 3 19 -15Other receivables 546 957 -410
Total 99,376 104,444 -5,068
31 Dec. 2009 31 Dec. 2008 Change EUR in EUR in EUR in millions millions millionsDirect loans to customers 91,507 95,673 -4,166On-lent customer loans without underwriting borne by the on-lending bank 679 690 -11Direct and on-lent subordinated loans 6,641 7,006 -365
Total 98,826 103,368 -4,542

(42) Risk provisions for lending business
ANALYSIS OF RISK PROVISIONS FOR LENDING BUSINESS BY CLASS
Provisions for losses on loans and advances also includes reverse repos.
DEVELOPMENT OF RISK PROVISIONS FOR LENDING BUSINESS IN FINANCIAL YEAR 2009 BY RISK ASSESSMENT TYPE
Provisions for risks assessed on a portfolio basis comprise both provisions for credit rating risks and provisions for country risks.
In 2009, EUR 175 million (previous year: EUR 183 million) in interest income was not collected for impaired loans.
115
31 Dec. 2009 31 Dec. 2008 Change EUR in EUR in EUR in millions millions millionsLoans and advances to banks 420 526 -106Loans and advances to customers 6,484 7,077 -594
Provisions for losses on loans and advances 6,904 7,604 -700 Provisions for contingent liabilities and irrevocable loan commitments 355 255 99
Total 7,258 7,859 -601
Individually Risks assessed
on Provisions for Provisions Provisions assessed a portfolio losses on loans (individual (portfolio EUR in millions risks basis and advances risks) risks) Total
As at 1 Jan. 2009 6,544 1,059 7,604 180 75 7,859Additions 865 322 1,187 260 29 1,475Write-offs -1,410 0 -1,410 0 0 -1,410Reversals -107 -160 -267 -149 -28 -443 Unwinding -55 0 -55 0 0 -55Exchange rate changes -146 -7 -153 -11 1 -163Transfers 11 -13 -2 -2 0 -4
As at 31 Dec. 2009 5,702 1,201 6,904 278 76 7,258

DEVELOPMENT OF RISK PROVISIONS FOR LENDING BUSINESS IN FINANCIAL YEAR 2008 BY RISK ASSESSMENT TYPE
(43) Value adjustments from macro fair value hedge accounting
The fair values attributable to the hedged risks in the hedged portfolios under the “loans and receivables” category are included in this item.
(44) Derivatives used for hedge accounting
ANALYSIS OF DERIVATIVES WITH POSITIVE FAIR VALUES DESIGNATED FOR HEDGE ACCOUNTING BY TYPE OF HEDGING RELATIONSHIP
116
Risks
Individually assessed
on Provisions for Provisions Provisions assessed a portfolio losses on loans (individual (portfolio EUR in millions risks basis and advances risks) risks) Total
As at 1 Jan. 2008 6,929 742 7,671 530 0 8,201 Additions 1,953 276 2,230 128 33 2,391Write-offs -2,407 0 -2,407 -400 0 -2,807Reversals -76 -73 -149 -32 -3 -184Unwinding -84 0 -84 0 0 -84Exchange rate changes 347 -3 343 -1 0 342Transfers -118 118 0 -46 46 0
As at 31 Dec. 2008 6,544 1,059 7,604 180 75 7,859
31 Dec. 2009 31 Dec. 2008 Change EUR in EUR in EUR in millions millions millionsValue adjustments to assets designated for macro fair value hedge accounting 6,751 5,451 1,300
31 Dec. 2009 31 Dec. 2008 Change EUR in EUR in EUR in millions millions millionsMicro fair value hedge accounting 13,979 12,391 1,587Macro fair value hedge accounting 643 637 6
Total 14,622 13,028 1,594

ANALYSIS OF DERIVATIVES WITH POSITIVE FAIR VALUES DESIGNATED FOR HEDGE ACCOUNTING BY CLASS
Only interest-related derivatives are designated for macro fair value hedge accounting.
Cross-currency swaps are presented under Currency-related derivatives.
(45) Other derivatives
ANALYSIS OF OTHER DERIVATIVES WITH POSITIVE FAIR VALUES BY CLASS
Cross-currency swaps are presented under Currency-related derivatives.
117
31 Dec. 2009 31 Dec. 2008 Change EUR in EUR in EUR in millions millions millionsInterest-related derivatives 10,747 11,132 -385Currency-related derivatives 3,875 1,896 1,979
Total 14,622 13,028 1,594
31 Dec. 2009 31 Dec. 2008 Change EUR in EUR in EUR in millions millions millionsInterest-related derivatives 2,636 4,265 -1,629Currency-related derivatives 2,320 4,034 -1,715Equity/index-related derivatives 27 5 21Credit derivatives 10 342 -331Other derivatives 31 62 -31
Total 5,023 8,709 -3,685

(46) Securities and investments
ANALYSIS OF SECURITIES AND INVESTMENTS BY CLASS
Bonds and other fixed-income securities are recognised less impairments for the risk of decreases in value that have already occurred but have not yet been individually identified.
(47) Property, plant and equipment
ANALYSIS OF PROPERTY, PLANT AND EQUIPMENT BY CLASS
Plant and equipment includes leased assets from finance leases that are required to be capitalised.
Payments in advance and assets under construction are presented under Other property, plant and equipment.
The fair value of the investment property is its carrying amount.
DEVELOPMENT IN PROPERTY, PLANT AND EQUIPMENT IN FINANCIAL YEAR 2009
118
31 Dec. 2009 31 Dec. 2008 Change EUR in EUR in EUR in millions millions millionsBonds and other fixed-income securities 35,292 42,555 -7,263Shares and other non-fixed income securities 67 433 -366Equity investments 1,333 1,230 103Shares in affiliated entities not included in the consolidated financial statements 2 2 0
Financial instruments, total 36,694 44,220 -7,526Investments accounted for using the equity method 15 8 7
Total 36,709 44,228 -7,519
31 Dec. 2009 31 Dec. 2008 Change EUR in EUR in EUR in millions millions millionsLand and buildings 585 605 -20Plant and equipment 42 48 -7Other property, plant and equipment 231 189 42
Property, plant and equipment for own use 857 842 16Investment property 18 29 -11
Total 876 871 4
Accumulated depreciation,
impairment and Purchase/ reversal of production impairment Net carryingEUR in millions cost losses amount
Carrying amount as at 1 Jan. 2009 1,098 -226 871Additions/reversals of impairment losses 80 0 80 Disposals -92 68 -24Depreciation — -30 -30Non-scheduled impairment losses — -23 -23
Carrying amount as at 31 Dec. 2009 1,086 -210 876
DEVELOPMENT IN PROPERTY, PLANT AND EQUIPMENT IN FINANCIAL YEAR 2008
119
Accumulated depreciation,
impairment and Purchase/ reversal of production impairment Net carryingEUR in millions cost losses amount
Carrying amount as at 1 Jan. 2008 1,007 -206 801Additions/reversals of impairment losses 105 0 105 Disposals -14 9 -5Depreciation — -29 -29Non-scheduled impairment losses — -1 -1
Carrying amount as at 31 Dec. 2008 1,098 -226 871

(48) Intangible assets
ANALYSIS OF INTANGIBLE ASSETS BY CLASS
Other intangible assets include, in particular, software under development.
DEVELOPMENT IN INTANGIBLE ASSETS IN FINANCIAL YEAR 2009
DEVELOPMENT IN INTANGIBLE ASSETS IN FINANCIAL YEAR 2008
120
31 Dec. 2009 31 Dec. 2008 Change EUR in EUR in EUR in millions millions millionsSoftware 36 55 -20
Acquired software 12 7 5Internally generated software 23 48 -25
Other intangible assets 9 6 2
Total 44 62 -17
Accumulated amortisation,
impairment and Purchase/ reversal of production impairment Net carryingEUR in millions cost losses amount
Carrying amount as at 1 Jan. 2009 126 -64 62 Additions/reversals of impairment losses 16 0 16Disposals -39 38 0Amortisation — -18 -18Non-scheduled impairment losses — -15 -15
Carrying amount as at 31 Dec. 2009 103 -59 44
Accumulated amortisation,
impairment and Purchase/ reversal of production impairment Net carryingEUR in millions cost losses amount
Carrying amount as at 1 Jan. 2008 119 -50 69Additions/reversals of impairment losses 13 0 13 Disposals -6 2 -4Amortisation — -16 -16
Carrying amount as at 31 Dec. 2008 126 -64 62

(49) Other assets
ANALYSIS OF OTHER ASSETS BY CLASS
ANALYSIS OF INCOME TAX ASSETS BY TYPE
The current income tax assets derive from deductible taxes (investment income tax/solidarity surcharge) and tax receivables from advance tax payments during the reporting year.
Deferred income tax assets mostly result from valuation differences relating to the balance sheet items listed below.
ANALYSIS OF DEFERRED TAX ASSETS BY BALANCE SHEET ITEM
The use of existing tax loss carryforwards for the taxable group companies is not sufficiently probable, with the result that it was only possible to carry deferred tax assets to a limited extent.
(50) Liabilities to banks
ANALYSIS OF LIABILITIES TO BANKS BY CLASS
Liabilities from repos, from cash collateral received and from the PROMISE and PROVIDE securitisation platforms are included in Other liabilities.
31 Dec. 2009 31 Dec. 2008 Change EUR in EUR in EUR in millions millions millionsOther assets and receivables 826 704 122Prepaid expenses and deferred charges 676 1,125 -450Income tax assets 189 247 -58
Total 1,691 2,077 -386
31 Dec. 2009 31 Dec. 2008 Change EUR in EUR in EUR in millions millions millionsCurrent income tax assets 33 59 -26 Deferred income tax assets 156 188 -32
Total 189 247 -58
31 Dec. 2009 31 Dec. 2008 Change EUR in EUR in EUR in millions millions millionsLoans and advances to banks and customers (incl. impairments) 58 75 -17 Other derivatives (assets) 0 11 -11Securities and investments 4 11 -7Property, plant and equipment 0 2 -2Intangible assets 23 23 0Liabilities to banks and customers 5 5 0Other derivatives (liabilities) 27 37 -10Provisions 13 18 -5 Other balance sheet items 16 4 12Tax loss carryforwards 10 2 8
Subtotal 156 188 -32Offset against deferred tax liabilities 0 0 0
Total 156 188 -32
31 Dec. 2009 31 Dec. 2008 Change EUR in EUR in EUR in millions millions millionsMoney-market transactions 5 1,885 -1,880Promissory note loans 3,144 5,968 -2,824 Other liabilities 4,947 3,936 1,012
Total 8,095 11,788 -3,693

121
(51) Liabilities to customers
ANALYSIS OF LIABILITIES TO CUSTOMERS BY CLASS
Liabilities from repos, cash collateral received and the PROMISE and PROVIDE securitisation platforms are included in Other liabilities.Credit-linked notes issued on the securitisation platforms are included under Promissory note loans.
(52) Certificated liabilities
ANALYSIS OF CERTIFICATED LIABILITIES BY CLASS
(53) Value adjustments from macro fair value hedge accounting
The fair values attributable to hedged risks in the hedged portfolios in the category “other liabilities” are included in this item.
122
31 Dec. 2009 31 Dec. 2008 Change EUR in EUR in EUR in millions millions millionsMoney-market transactions 638 5,374 -4,736Promissory note loans 11,259 12,092 -833Other liabilities 11,837 13,839 -2,002
Total 23,734 31,306 -7,572
31 Dec. 2009 31 Dec. 2008 Change EUR in EUR in EUR in millions millions millionsMoney-market issues 32,479 30,947 1,532Bonds and notes 288,950 271,612 17,338
Total 321,429 302,559 18,870
31 Dec. 2009 31 Dec. 2008 Change EUR in EUR in EUR in millions millions millionsValue adjustments to liabilities under macro fair value hedge accounting 27 13 14

(54) Derivatives used for hedge accounting
ANALYSIS OF DERIVATIVES WITH NEGATIVE FAIR VALUES DESIGNATED FOR HEDGE ACCOUNTING BY TYPE OF HEDGING RELATIONSHIP
ANALYSIS OF DERIVATIVES WITH NEGATIVE FAIR VALUES DESIGNATED FOR HEDGE ACCOUNTING BY CLASS
Only interest-related derivatives are designated for macro fair value hedge accounting. Cross-currency swaps are presented under Currency-related derivatives.
(55) Other derivatives
ANALYSIS OF OTHER DERIVATIVES WITH NEGATIVE FAIR VALUES BY CLASS
Cross-currency swaps are presented under Currency-related derivatives.
123
31 Dec. 2009 31 Dec. 2008 Change EUR in EUR in EUR in millions millions millionsMicro fair value hedge accounting 9,016 3,745 5,270Macro fair value hedge accounting 10,461 7,251 3,209
Total 19,476 10,997 8,479
31 Dec. 2009 31 Dec. 2008 Change EUR in EUR in EUR in millions millions millionsInterest-related derivatives 11,664 8,402 3,263Currency-related derivatives 7,812 2,595 5,217
Total 19,476 10,997 8,479
31 Dec. 2009 31 Dec. 2008 Change EUR in EUR in EUR in millions millions millionsInterest-related derivatives 1,203 1,522 -319Currency-related derivatives 5,584 17,410 -11,827 Credit derivatives 17 158 -141Other derivatives 35 14 21
Total 6,838 19,104 -12,266
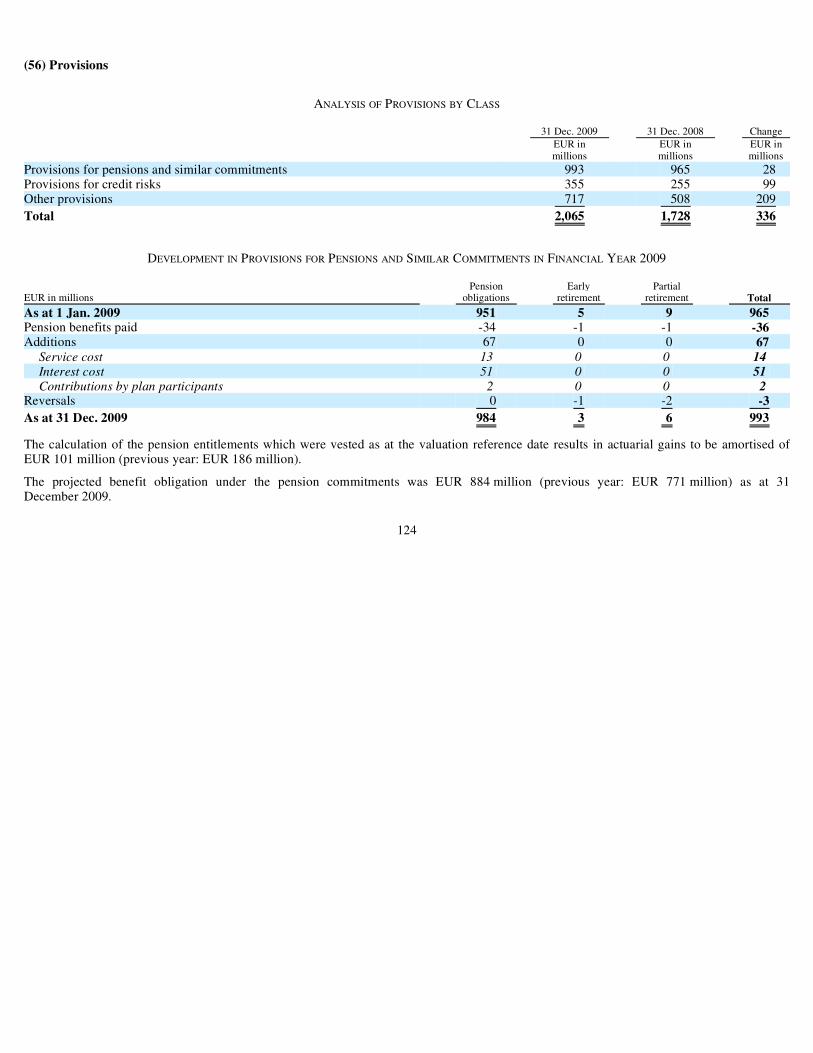
(56) Provisions
ANALYSIS OF PROVISIONS BY CLASS
DEVELOPMENT IN PROVISIONS FOR PENSIONS AND SIMILAR COMMITMENTS IN FINANCIAL YEAR 2009
The calculation of the pension entitlements which were vested as at the valuation reference date results in actuarial gains to be amortised ofEUR 101 million (previous year: EUR 186 million).
The projected benefit obligation under the pension commitments was EUR 884 million (previous year: EUR 771 million) as at 31December 2009.
124
31 Dec. 2009 31 Dec. 2008 Change EUR in EUR in EUR in millions millions millionsProvisions for pensions and similar commitments 993 965 28Provisions for credit risks 355 255 99Other provisions 717 508 209
Total 2,065 1,728 336
Pension Early PartialEUR in millions obligations retirement retirement Total
As at 1 Jan. 2009 951 5 9 965Pension benefits paid -34 -1 -1 -36Additions 67 0 0 67
Service cost 13 0 0 14Interest cost 51 0 0 51Contributions by plan participants 2 0 0 2
Reversals 0 -1 -2 -3
As at 31 Dec. 2009 984 3 6 993

DEVELOPMENT IN PROVISIONS FOR PENSIONS AND SIMILAR COMMITMENTS IN FINANCIAL YEAR 2008
The provisions for pensions and similar commitments are calculated on the basis of the 2005 G Heubeck actuarial tables and based on the following actuarial assumptions:
ACTUARIAL ASSUMPTIONS IN % P.A.
DEVELOPMENT IN OTHER PROVISIONS IN FINANCIAL YEAR 2009
The obligations to employees show other long-term employee benefits including provisions for service anniversaries. Corresponding actuarial reports have been prepared for these obligations.
DEVELOPMENT IN OTHER PROVISIONS IN FINANCIAL YEAR 2008
125
Pension Early Partial EUR in millions obligations retirement retirement Total
As at 1 Jan. 2008 919 4 10 933Pension benefits paid -32 -1 -2 -35Additions 64 3 1 67
Service cost 15 3 1 18Interest cost 44 0 0 44Contributions by plan participants 5 0 0 5
Reversals 0 0 0 0
As at 31 Dec. 2008 951 5 9 965
31 Dec. 2009 31 Dec. 2008
Technical discount rate 4.90 5.70 Rate of salary increases 2.90 2.90Rate of pension increases 2.30 2.30Rate of staff turnover1 2.00 2.00
1 The rate of staff turnover is taken into account in the calculations in accordance with an age table.
Obligations to Other TaxEUR in millions employees provisions Total provisions
As at 1 Jan. 2009 24 484 508 3Additions 10 231 241 6Used amounts -4 -28 -33 0Reversals -1 0 -1 0Transfers 0 2 2 0
As at 31 Dec. 2009 28 689 717 9
Obligations to Other TaxEUR in millions employees provisions Total provisions
As at 1 Jan. 2008 25 57 82 5Additions 8 460 468 3 Used amounts -10 -32 -41 0Reversals 0 -1 -1 -5
As at 31 Dec. 2008 24 484 508 3

(57) Other liabilities
ANALYSIS OF OTHER LIABILITIES BY CLASS
The promotional subsidies granted to KfW through the ERP Special Fund based on the German Law to define the economic plan of the ERPSpecial Fund (ERP-Wirtschaftsplangesetz) in the amount of EUR 178 million (previous year: EUR 87 million) were reported as deferred income.
ANALYSIS OF INCOME TAX LIABILITIES BY TYPE
The current income tax liabilities in the reporting year are the result of additions to tax provisions at the level of taxable companies included inthe consolidated financial statements.
Deferred income tax liabilities mostly result from valuation differences relating to the balance sheet items listed below.
ANALYSIS OF DEFERRED TAX LIABILITIES BY BALANCE SHEET ITEM
126
31 Dec. 2009 31 Dec. 2008 Change EUR in EUR in EUR in millions millions millionsOther liabilities 1,668 2,161 -493Deferred income 316 135 181Income tax liabilities 68 55 13
Total 2,052 2,351 -299
31 Dec. 2009 31 Dec. 2008 Change EUR in EUR in EUR in millions millions millionsCurrent income tax liabilities 9 3 6Deferred income tax liabilities 59 53 6
Total 68 55 13
31 Dec. 2009 31 Dec. 2008 Change EUR in EUR in EUR in millions millions millionsOther derivatives (assets) 27 37 -10Securities and investments 15 15 0Other balance sheet items 17 1 16
Subtotal 59 53 6Offset against deferred tax assets 0 0 0
Total 59 53 6

(58) Subordinated liabilities
ANALYSIS OF SUBORDINATED LIABILITIES BY CLASS
As part of the new legislation governing ERP economic promotion as at 1 July 2007, the ERP Special Fund provided a subordinated loan toKfW in the amount of EUR 3,247 million. The loan consists of three tranches with different fixed-interest periods. The period during which capital is tied up ends for all tranches as at 31 December 2017. Interest is charged on the tranches at an initial rate of 4.5% per annum.
127
31 Dec. 2009 31 Dec. 2008 Change EUR in EUR in EUR in millions millions millionsSubordinated liabilities 3,247 3,247 0

(59) Equity
ANALYSIS OF EQUITY
Equity forms the basis for the economic resources available for risk coverage which are matched against the economic capital requirementsderived from internal steering. For details, please see “—Risk Report”.
128
31 Dec. 2009 31 Dec. 2008 Change EUR in EUR in EUR in millions millions millionsSubscribed capital 3,750 3,750 0less uncalled outstanding contributions -450 -450 0
Paid-in subscribed capital 3,300 3,300 0 Capital reserve 5,947 6,254 -307
Promotional reserves from the ERP Special Fund 4,650 4,650 0Reserve from the ERP Special Fund 893 848 45Retained earnings 4,725 5,269 -544
Statutory reserve under Section 10 (2) KfW Law 1,574 1,574 0Special reserve under Section 10 (3) KfW Law 1,928 1,893 34Special reserve less the special loss account from provisioning pursuant to Section 17
(4) of the D-Mark Balance Sheet Law 21 21 0Other retained earnings 1,202 1,780 -578
Fund for general banking risks 46 50 -4Revaluation reserves -290 -551 261Balance sheet loss -1,499 -3,436 1,937
Total 13,121 11,733 1,388

Notes on financial instruments
(60) Gains and losses from financial instruments by valuation category
The following tables show an analysis of the results from financial instruments included in the various income statement items organised byvaluation category. In addition to interest and similar income and expenses reported in Net interest and commission income and loanprocessing fees included in Net commission income, contributions to income included in particular the risk provisions for lending business.Depending on measurement and designation for hedge accounting, the effects of fair value measurement, impairment losses and reversals ofimpairment losses and gains and losses from disposals are also included. The result from foreign currency translation is not included.
129

GAINS AND LOSSES FROM FINANCIAL INSTRUMENTS BY VALUATION CATEGORY IN FINANCIAL YEAR 2009
130
Net gains/ losses Net from other gains/losses Risk Net financial from provisions for Net gains/losses instruments at fair securities Net other Net interest lending commission from hedge value through and operating income business income accounting profit or loss investments income Total EUR in EUR in EUR in EUR in EUR in EUR in EUR in EUR in millions millions millions millions millions millions millions millionsLoans and receivables 12,347 -972 134 1,243 -96 12,657Held-to-maturity
investments 21 -1 20Other liabilities -11,447 -10 2,916 13 -8,527 Available-for-sale
financial assets 335 0 43 -21 357Financial assets at fair
value through profit or loss 303 151 1,156 1,610
Financial liabilities at fair value through profit or loss -1,432 -119 1,004 -547
Derivatives used for hedge accounting 2,322 -4,515 -2,193
Other derivatives 256 4 -1,741 -1,481
Total 2,705 -972 160 -313 419 -117 13 1,896

GAINS AND LOSSES FROM FINANCIAL INSTRUMENTS BY VALUATION CATEGORY IN FINANCIAL YEAR 2008
131
Net gains/ losses Net from other gains/losses Risk Net financial from provisions for Net gains/losses instruments at fair securities Net other Net interest lending commission from hedge value through and operating income business income accounting profit or loss investments income Total EUR in EUR in EUR in EUR in EUR in EUR in EUR in EUR in millions millions millions millions millions millions millions millionsLoans and receivables 14,308 -2,139 54 6,751 -160 1,530 20,344Held-to-maturity
investments 21 0 21Other liabilities -12,125 0 -12,085 21 -24,189 Available-for-sale
financial assets 1,607 0 730 -395 1,942Financial assets at fair
value through profit or loss 451 219 -1,446 -776
Financial liabilities at fair value through profit or loss -1,930 -166 -1,894 -3,990
Derivatives used for hedge accounting 914 4,295 5,209
Other derivatives -1,281 9 1,845 573
Total 1,964 -2,139 116 -309 -1,495 -555 1,551 -867

(61) Balance sheet for financial instruments by valuation category
The following tables show the assets and liabilities from financial instruments included in the different balance sheet items organised byvaluation category.
FINANCIAL ASSETS BY VALUATION CATEGORY AS AT 31 DECEMBER 2009
132
Value adjustments Loans and Loans and Risk provisions from macro Derivatives used advances to advances to for lending fair value hedge for hedge Other Securities and Assets (financial banks customers business accounting accounting derivatives investments instruments) EUR in EUR in EUR in EUR in EUR in EUR in EUR in EUR in millions millions millions millions millions millions millions millions (in %)Loans and receivables 241,017 99,362 -6,904 6,751 22,821 363,046 91.4 Held-to-maturity investments 996 996 0.3 Available-for-sale financial
assets 0 0 7,295 7,295 1.8 Financial assets at fair value
through profit or loss 542 15 5,582 6,139 1.5 Derivatives used for hedge
accounting 14,622 14,622 3.7 Other derivatives 5,023 5,023 1.3
Total 241,559 99,376 -6,904 6,751 14,622 5,023 36,694 397,121 100.0

FINANCIAL LIABILITIES BY VALUATION CATEGORY AS AT 31 DECEMBER 2009
133
Value adjustments from macro Derivatives used Liabilities to Liabilities to Certificated fair value hedge for hedge Other Other Subordinated Liabilities (financial banks customers liabilities accounting accounting derivatives liabilities liabilities instruments) EUR in EUR in EUR in EUR in EUR in EUR in EUR in EUR in EUR in millions millions millions millions millions millions millions millions millions (in %)Other financial liabilities 7,005 17,738 295,955 27 263 3,247 324,234 84.6 Financial liabilities at
fair value through profit or loss 1,090 5,997 25,473 0 32,560 8.5
Derivatives used for hedge accounting 19,476 19,476 5.1
Other derivatives 6,838 6,838 1.8
Total 8,095 23,734 321,429 27 19,476 6,838 263 3,247 383,109 100.0

FINANCIAL ASSETS BY VALUATION CATEGORY AS AT 31 DECEMBER 2008
134
Value adjustments Loans and Loans and Risk provisions from macro Derivatives used advances to advances to for lending fair value hedge for hedge Other Securities and Assets (financial banks customers business accounting accounting derivatives investments instruments) EUR in EUR in EUR in EUR in EUR in EUR in EUR in EUR in millions millions millions millions millions millions millions millions (in %)Loans and receivables 222,878 104,380 -7,604 5,451 5,290 330,396 84.3 Held-to-maturity investments 937 937 0.2 Available-for-sale financial
assets 0 0 30,962 30,962 7.9 Financial assets at fair value
through profit or loss 583 64 7,031 7,678 2.0 Derivatives used for hedge
accounting 13,028 13,028 3.3 Other derivatives 8,709 8,709 2.2
Total 223,462 104,444 -7,604 5,451 13,028 8,709 44,220 391,710 100.0

FINANCIAL LIABILITIES BY VALUATION CATEGORY AS AT 31 DECEMBER 2008
135
Value adjustments from macro Derivatives used Liabilities to Liabilities to Certificated fair value hedge for hedge Other Other Subordinated Liabilities (financial banks customers liabilities accounting accounting derivatives liabilities liabilities instruments) EUR in EUR in EUR in EUR in EUR in EUR in EUR in EUR in EUR in millions millions millions millions millions millions millions millions millions (in %)Other financial
liabilities 10,052 24,758 271,220 13 214 3,247 309,503 81.6 Financial liabilities at
fair value through profit or loss 1,736 6,548 31,339 0 39,623 10.4
Derivatives used for hedge accounting 10,997 10,997 2.9
Other derivatives 19,104 19,104 5.0
Total 11,788 31,306 302,559 13 10,997 19,104 214 3,247 379,228 100.0

(62) Disclosures on the reclassification of financial assets
In financial year 2008 EUR 2,750 million in bonds and other fixed-income securities (collateralised variable-interest securities) reported under Securities and investments were reclassified with retroactive effect as from 1 July 2008 (fair value as at the date of reclassification) from the“available-for-sale financial assets” valuation category to the “loans and receivables” valuation category.
The following table shows the carrying amounts of these reclassified financial assets and their fair values:
For the reclassified financial assets a change of EUR 107 million (previous year: EUR -194 million) in fair value would have been recorded directly in equity under Revaluation reserves, and net gains/losses from securities and investments of EUR 11 million (previous year: EUR -60 million) would have been recorded as well.
Net gains/losses from securities and investments include reversals of impairment losses and impairments on reclassified financial assetstotalling EUR 11 million (previous year: EUR -60 million); as in the previous year, no realised gains and losses were recorded. Interest income from the reclassified securities is still received unchanged.
In financial year 2009, in accordance with a resolution with prospective effect dated 17 February 2009 bonds and other fixed-income securities reported under Securities and investments (which serve to maintain liquidity through the use of repo transactions (“repos”) or open market transactions of the European Central Bank) with a volume of EUR 18,170 million (fair value as at the date of reclassification) with anticipatedinterest and principal payments totalling EUR 20,834 million and a nominal capital-weighted effective interest rate of 3.54% were reclassified from the “available-for-sale financial assets” valuation category to the “loans and receivables” valuation category.
The changes in the fair value of these reclassified financial assets in the reporting period through to the date of the reclassification in theamount of EUR -42 million were recorded directly in equity in the Revaluation reserves, which totalled EUR -362 million on the date of reclassification. The changes in fair value in the previous year that were recorded directly in equity in the Revaluation reserves totalled EUR -274 million.
The following table shows the carrying amounts of these reclassified financial assets and their fair values:
For the reclassified financial assets a change of EUR 43 million in fair value would have been recorded directly in equity under Revaluationreserves, and net gains/losses from securities and investments of EUR -7 million would have been recorded as well.
Net gains/losses from securities and investments include realised gains and losses totalling EUR -6 million as well as reversals of impairment losses and impairments on reclassified financial assets totalling EUR -1 million. Interest income from the reclassified securities is still received unchanged.
136
EUR in millions 2009 2008
Carrying amount (balance sheet) 2,135 2,450Fair value 2,028 2,256
EUR in millions 2009
Carrying amount (balance sheet) 18,270Fair value 18,208

(63) Disclosures on the valuation methods used for financial instruments carried at fair value
The following tables show the financial instruments carried at fair value according to the valuation methods used.
The portfolio of securities and investments carried at fair value significantly declined due to the reclassifications undertaken in financial year2009 from the “available-for-sale financial assets” valuation category to the “loans and receivables” valuation category. In the case of bonds and other fixed-income securities, for which no prices were available from active markets at the end of 2008 as a result of the general crisis ofconfidence in the financial markets, and which were thus valuated using valuation models (DCF methods, for which risk-free interest rates and counterparty default risks are determined on the basis of observable market data and market liquidity is estimated on the basis of observablemarket data for reference bonds) and allocated to the category “Valuation method based on observable market data (model)”, prices in liquid markets could now be used again for determination of the fair value.
Equity instruments included in Securities and investments and for which the fair value could not be reliably determined are reported in thecategory “Valuation method based on data that were, in part, not observable on the market”.
FINANCIAL ASSETS CARRIED AT FAIR VALUE AS AT 31 DECEMBER 2009
137
Valuation Valuation method method based on based on data that observable were, in part, not Quoted market market data observable on the EUR in millions price (model) market TotalLoans and advances to banks – recorded at fair value through profit or
loss 43 175 324 542Loans and advances to customers – recorded at fair value through
profit or loss 0 11 3 15 Derivatives used for hedge accounting 0 14,622 0 14,622Other derivatives 7 4,990 26 5,023Securities and investments – available for sale 6,606 45 645 7,295Securities and investments – recorded at fair value through profit or
loss 4,919 349 314 5,582
FINANCIAL LIABILITIES CARRIED AT FAIR VALUE AS AT 31 DECEMBER 2009 Valuation Valuation method method based on based on data that observable were, in part, not Quoted market market data observable on the EUR in millions price (model) market TotalLiabilities to banks – recorded at fair value through profit or loss 1 732 357 1,090Liabilities to customers – recorded at fair value through profit or loss 0 5,995 2 5,997Certificated liabilities – recorded at fair value through profit or loss 249 25,224 0 25,473 Derivatives used for hedge accounting 0 19,362 114 19,476Other derivatives 13 6,826 0 6,838

FINANCIAL ASSETS CARRIED AT FAIR VALUE AS AT 31 DECEMBER 2008
138
Valuation Valuation method method based on based on data that observable were, in part, not Quoted market market data observable on the EUR in millions price (model) market TotalLoans and advances to banks – recorded at fair value through profit or
loss 172 262 150 583Loans and advances to customers – recorded at fair value through
profit or loss 0 18 46 64Derivatives used for hedge accounting 0 13,028 0 13,028Other derivatives 245 8,321 142 8,709Securities and investments – available for sale 1,458 29,007 497 30,962Securities and investments – recorded at fair value through profit or
loss 3,085 3,626 320 7,031

FINANCIAL LIABILITIES CARRIED AT FAIR VALUE AS AT 31 DECEMBER 2008
139
Valuation Valuation method method based on based on data that observable were, in part, not Quoted market market data observable on the EUR in millions price (model) market TotalLiabilities to banks – recorded at fair value through profit or loss 75 1,510 152 1,736 Liabilities to customers – recorded at fair value through profit or loss 0 6,545 2 6,548Certificated liabilities – recorded at fair value through profit or loss 516 30,823 0 31,339Derivatives used for hedge accounting 0 10,997 0 10,997Other derivatives 168 18,916 20 19,104

DEVELOPMENT OF FINANCIAL ASSETS CARRIED AT FAIR VALUE IN FINANCIAL YEAR 2009, USING VALUATION METHODS BASED ON DATA THAT WERE, IN PART, NOT OBSERVABLE ON THE MARKET
140
Loans and Loans and advances Securities and advances to banks - to customers - investments - recorded at fair recorded at fair Securities and recorded at fair value through value through profit investments - value through profit or loss or loss Other derivatives available for sale profit or loss Total EUR in EUR in EUR in EUR in EUR in EUR in millions millions millions millions millions millionsAs at 1 Jan. 2009 150 46 142 497 320 1,155A. Changes recognised in the
income statement Net interest and commission
income 1 0 0 0 0 0Contracts still valid at year-end 1 0 0 0 0 1
Net gains/losses from other financial instruments at fair value through profit or loss 155 -42 -28 0 -19 67 Contracts still valid at year-end 155 -42 -28 0 -18 67
Net gains/losses from securities and investments 0 0 0 -11 0 -11Contracts still valid at year-end 0 0 0 -31 0 -31
Total changes recognised in the income statement 156 -42 -28 -12 -18 55
B. Changes recognised directly in equity
Change of valuation method used 19 0 -85 98 5 37Additions 0 0 0 114 27 141

141
Loans and Loans and advances Securities and advances to banks - to customers - investments - recorded at fair recorded at fair Securities and recorded at fair value through value through profit investments - value through profit or loss or loss Other derivatives available for sale profit or loss Total EUR in EUR in EUR in EUR in EUR in EUR in millions millions millions millions millions millions Disposals 0 0 -3 -50 -9 -61
Total changes recognised directly in equity 19 0 -88 162 23 116
Changes in the consolidated group 0 0 0 1 0 1 Exchange rate changes 0 0 0 -3 -11 -14As at 31 Dec. 2009 324 3 26 645 314 1,313

DEVELOPMENT OF FINANCIAL LIABILITIES CARRIED AT FAIR VALUE IN FINANCIAL YEAR 2009, USING VALUATION METHODS BASED ON DATA THAT WERE, IN PART, NOT OBSERVABLE ON THE MARKET
142
Liabilities to Liabilities to banks customers - recorded - recorded at fair at fair value Derivatives used value through through for hedge profit or loss profit or loss accounting Other derivatives Total EUR in EUR in EUR in EUR in EUR in millions millions millions millions millionsAs at 1 Jan. 2009 152 2 0 20 174A. Changes recognised in the income statement Net interest and commission income 1 0 0 0 1
Contracts still valid at year-end 1 0 0 0 1Net gains/losses from other financial instruments at
fair value through profit or loss 205 0 0 0 205Contracts still valid at year-end 162 0 0 0 162
Total changes recognised in the income statement 205 0 0 0 205
B. Changes recognised directly in equity Change of valuation method used 0 0 114 -20 94Additions 0 0 0 0 0Disposals 0 0 0 0 0
Total changes recognised directly in equity 0 0 114 -20 94
As at 31 Dec. 2009 357 2 114 0 473

(64) Fair values of financial instruments
In the following tables, the fair values of financial instruments are compared to their carrying amounts. Existing provisions for losses on loansand advances are deducted from the carrying amounts of loans and advances to banks and customers. The carrying amount of the subordinatedliabilities comprises pro-rata interest and value adjustments from micro fair value hedge accounting reported in the item Other liabilities.
FAIR VALUES OF FINANCIAL INSTRUMENTS AS AT 31 DECEMBER 2009
Interest-related changes in value are also included in calculating the fair value of the financial instruments. Accordingly, when the comparisonis made with the carrying amount, it is necessary to take account of the (interest-related) changes in value resulting from the recognition of loans and advances and borrowings in macro fair value hedge accounting.
Equity instruments included in Securities and investments, for which the fair value could not be reliably determined, are carried at costallowing for impairment losses in the amount of EUR 548 million (previous year: EUR 475 million).
143
Carrying amount EUR in millions Fair value (balance sheet) Difference
Loans and advances to banks 245,877 241,139 4,739Loans and advances to customers 95,860 92,892 2,967Value adjustments from macro fair value hedge accounting — 6,751 -6,751 Derivatives used for hedge accounting 14,622 14,622 0Other derivatives 5,023 5,023 0Securities and investments 36,252 36,694 -442
Assets 397,635 397,121 513
Liabilities to banks 8,168 8,095 73Liabilities to customers 24,784 23,734 1,050 Certificated liabilities 323,873 321,429 2,445Value adjustments from macro fair value hedge accounting — 27 -27Derivatives used for hedge accounting 19,476 19,476 0Other derivatives 6,838 6,838 0Subordinated liabilities 3,486 3,509 -24
Liabilities 386,625 383,109 3,516

FAIR VALUES OF FINANCIAL INSTRUMENTS AS AT 31 DECEMBER 2008
144
Carrying amount EUR in millions Fair value (balance sheet) Difference
Loans and advances to banks 226,709 222,935 3,773Loans and advances to customers 100,894 97,366 3,527Value adjustments from macro fair value hedge accounting — 5,451 -5,451Derivatives used for hedge accounting 13,028 13,028 0Other derivatives 8,709 8,709 0Securities and investments 43,603 44,220 -617
Assets 392,942 391,710 1,232
Liabilities to banks 11,771 11,788 -17Liabilities to customers 32,103 31,306 797Certificated liabilities 298,533 302,559 -4,026Value adjustments from macro fair value hedge accounting — 13 -13Derivatives used for hedge accounting 10,997 10,997 0Other derivatives 19,104 19,104 0 Subordinated liabilities 3,414 3,461 -47
Liabilities 375,921 379,228 -3,307

(65) Additional disclosures on liabilities to banks
DISCLOSURES ON LIABILITIES TO BANKS DESIGNATED AT FAIR VALUE THROUGH PROFIT OR LOSS (FAIR VALUE OPTION)
Of the difference between the repayment amount at maturity and the carrying amount, EUR 45 million (previous year: EUR 1,025 million) isattributable to borrowings for which the repayment amount builds up as a result of the capitalisation over time of interest due.
(66) Additional disclosures on liabilities to customers
DISCLOSURES ON LIABILITIES TO CUSTOMERS DESIGNATED AT FAIR VALUE THROUGH PROFIT OR LOSS (FAIR VALUE OPTION)
Of the difference between the repayment amount at maturity and the carrying amount, EUR 3,172 million (previous year: EUR 2,736 million)is attributable to borrowings for which the repayment amount builds up as a result of the capitalisation over time of interest due.
145
31 Dec. 2009 31 Dec. 2008 Change EUR in EUR in EUR in millions millions millionsCarrying amount 182 269 -87Repayment at maturity 360 1,424 -1,064
Difference 178 1,155 -977
31 Dec. 2009 31 Dec. 2008 Change EUR in EUR in EUR in millions millions millionsCarrying amount 5,992 6,542 -550Repayment at maturity 9,509 10,212 -703
Difference 3,517 3,670 -153

(67) Additional disclosures on certificated liabilities
DISCLOSURES ON CERTIFICATED LIABILITIES DESIGNATED AT FAIR VALUE THROUGH PROFIT OR LOSS (FAIR VALUE OPTION)
Of the difference between the repayment amount at maturity and the carrying amount, EUR 14,171 million (previous year: EUR17,793 million) is attributable to borrowings for which the repayment amount builds up as a result of the capitalisation over time of interestdue.
(68) Additional disclosures on derivatives
ANALYSIS OF DERIVATIVES BY COUNTERPARTY
The analysis includes stand-alone financial and credit derivatives which are presented in the items Derivatives used for hedge accounting andOther derivatives.
The economic hedge effect of financial derivatives with a nominal volume of EUR 503 billion (2008: EUR 380 billion) is presented inaccordance with IAS 39; the risk-mitigating impact of the remaining financial derivatives is not reflected in the accounts.
The KfW Group received collateral (in the form of securities) under derivative transactions, which can be resold or repledged at any time, evenif the party furnishing collateral has not defaulted. The fair value of this collateral totals EUR 166 million (previous year: EUR 220 million).The collateral has been neither resold nor repledged.
Moreover, liquid collateral totalling EUR 1,523 million (previous year: EUR 993 million) was accepted, which was reported under Liabilitiesto banks and customers.
146
31 Dec. 2009 31 Dec. 2008 Change EUR in EUR in EUR in millions millions millionsCarrying amount 25,473 31,339 -5,866Repayment at maturity 42,514 49,558 -7,044
Difference 17,041 18,219 -1,178
Fair value Fair value
Nominal value 31 Dec. 2009 31 Dec. 2008EUR in millions 31 Dec. 2009 31 Dec. 2008 positive negative positive negative
OECD banks 564,383 504,224 18,068 24,910 19,070 27,436Non-OECD banks 39 62 0 3 0 9Other counterparties 30,053 54,639 1,480 1,394 2,318 2,655Public sector 531 582 27 0 291 1
Total 595,006 559,507 19,575 26,308 21,679 30,101

(69) Additional disclosures on the PROMISE/PROVIDE securitisation platforms
The KfW Group received collateral (in the form of securities) under the PROMISE and PROVIDE platform transactions, which can be resoldor repledged at any time, without the party furnishing collateral having defaulted. The fair value of this collateral totals EUR 97 million. Thecollateral has been neither resold nor repledged. No collateral was accepted in 2008.
Moreover, provision of liquid collateral totalling EUR 225 million (previous year: EUR 414 million) was accepted, which was reported underLiabilities to banks and customers.
(70) Disclosures on repurchase agreements
DISCLOSURES ON REPO TRANSACTIONS
The KfW Group has pledged collateral (in the form of securities) under repo transactions which can be resold or repledged at any time, withoutthe party furnishing collateral having defaulted. The carrying amount of this collateral totals EUR 1 million. No collateral was pledged in 2008.
As in 2008, the KfW Group did not receive any collateral under repo transactions, which can be resold or repledged at any time, without theparty furnishing collateral having defaulted.
As in 2008, no liquid collateral has been provided.
DISCLOSURES ON REVERSE REPO TRANSACTIONS
Securities purchased under reverse repos are not recognised.
As in 2008, the KfW Group has not pledged any collateral under reverse repo transactions which can be resold or repledged at any time,without the party furnishing collateral having defaulted.
As in the previous year, the KfW Group did not receive any collateral under reverse repo transactions, which can be resold or repledged at anytime, without the party furnishing collateral having defaulted.
The Group has no liquid collateral. Liquid collateral totalling EUR 349 million was received in 2008, which was reported under Liabilities tobanks and customers.
147
31 Dec. 2009 31 Dec. 2008 Change EUR in EUR in EUR in millions millions millionsCarrying amount of securities sold under repo transactions that continue to be recognised
in securities and investments 620 316 304Liabilities to banks (countervalue) 624 319 305
31 Dec. 2009 31 Dec. 2008 Change EUR in EUR in EUR in millions millions millionsLoans and advances to banks (countervalue) 18,116 7,052 11,064

Other notes
(71) Contingent liabilities and irrevocable loan commitments
ANALYSIS OF CONTINGENT LIABILITIES BY CLASS
Other contingent liabilities include payment obligations attributable to investments which are not fully paid up and do not have to beconsolidated.
VOLUME OF IRREVOCABLE LOAN COMMITMENTS
The irrevocable loan commitments are mainly attributable to domestic promotional lending business.
148
31 Dec. 2009 31 Dec. 2008 Change EUR in EUR in EUR in millions millions millionsContingent liabilities from financial guarantees 5,637 5,996 -359Contingent liabilities from PROMISE/PROVIDE securitisation platforms 1,369 0 1,369Performance guarantees 43 55 -13Other contingent liabilities 480 232 248
Total 7,529 6,283 1,246
31 Dec. 2009 31 Dec. 2008 Change EUR in EUR in EUR in millions millions millionsIrrevocable loan commitments 50,360 35,390 14,970

(72) Trust activities and administered loans
ANALYSIS OF TRUST ACTIVITIES BY CLASS (TRANSACTIONS IN THE BANK’S OWN NAME BUT FOR THIRD PARTY ACCOUNTS)
EUR 14,988 million (previous year: EUR 15,232 million) of the assets held in trust are attributable to the business area Promotion fordeveloping and transition countries.
VOLUME OF ADMINISTERED LOANS GRANTED (LOANS IN THE NAME AND FOR THE ACCOUNT OF THIRD PARTIES)
149
31 Dec. 2009 31 Dec. 2008 Change EUR in EUR in EUR in millions millions millionsLoans and advances to banks 2,038 2,054 -17Loans and advances to customers 14,719 15,478 -759Securities and investments 108 48 60
Assets held in trust 16,864 17,580 -716Liabilities to banks 78 98 -20Liabilities to customers 16,786 17,483 -696
Liabilities held in trust 16,864 17,580 -716
31 Dec. 2009 31 Dec. 2008 Change EUR in EUR in EUR in millions millions millionsAdministered loans 5,643 5,142 501

(73) Leasing transactions as lessee
DISCLOSURES ON LESSEE AGREEMENTS AS AT 31 DECEMBER 2009
DISCLOSURES ON LESSEE AGREEMENTS AS AT 31 DECEMBER 2008
150
Due within Due in between one Due in more than EUR in millions one year and five years five years Total
Finance leases Future minimum leasing payments 5 4 0 9Unearned finance income after remaining maturities 0 0 0 1Present value of future minimum leasing payments 5 4 0 9Operating leases Future minimum leasing payments 11 5 0 16
Due within Due in between one Due in more than EUR in millions one year and five years five years Total
Finance leases Future minimum leasing payments 6 14 0 20Unearned finance income after remaining maturities 0 1 0 1Present value of future minimum leasing payments 6 14 0 20Operating leases Future minimum leasing payments 13 16 0 29

The average number of employees including temporary staff but without trainees is calculated based on the levels at the end of each quarter.
(75) Compensation and loans to members of the Managing Board and Board of Supervisory Directors of KfW
COMPENSATION TO MEMBERS OF THE MANAGING BOARD AND BOARD OF SUPERVISORY DIRECTORS
The following table provides details on the compensation paid to the Managing Board in financial year 2009:
151
(74) Average number of employees during the financial year 2009 2008 Change
Employees (female) 2,086 2,076 10Employees (male) 2,179 2,152 27
Total 4,265 4,228 37
Staff not covered by collective agreements 3,017 2,858 159Staff covered by collective agreements 1,248 1,370 -122
2009 2008 Change EUR in EUR in EUR in thousands thousands thousandsMembers of the Managing Board 2,658 2,653 6Members of the Board of Supervisory Directors 160 218 -58Former members of the Managing Board and their surviving dependents 3,619 3,617 2
Total 6,437 6,487 -50
Monetary Other Annual compensation 2009 compensation compensation1) Total
EUR in EUR in EUR in thousands thousands thousandsDr Ulrich Schröder (Chairman) 660.0 110.3 770.3Dr Günther Bräunig 349.2 41.6 390.8Dr Norbert Kloppenburg 466.6 60.2 526.8Wolfgang Kroh (until 30 Sept. 2009) 385.2 34.0 419.2 Bernd Loewen (since 1 July 2009) 240.0 15.4 255.4Dr Axel Nawrath (since 1 April 2009) 243.8 51.7 295.5
Total 2,344.8 313.2 2,658.0
1) Other compensation mostly comprises the use of company cars and insurance premiums and the taxes and social security payments on these amounts. It also comprisescompensation for serving on the Boards of Supervisory Directors of subsidiaries.

The compensation to the members of the Board of Supervisory Directors is determined by the Supervisory Authority in accordance withSection 4 (5) of the KfW By-Laws and is composed as follows:
Members who join during the year receive their compensation on a pro-rata basis.
Members of the Federal Government who serve on the KfW Board of Supervisory Directors in accordance with Section 7 (1) No 2 of the KfWLaw waive their compensation pursuant to Section 4 (5) of the KfW By-Laws. With their self-imposed commitment these members of the Board of Supervisory Directors want to support the Government’s Public Corporate Governance Codex as well as the guidelines on corporategovernance and, by waiving their compensation, even exceed the requirements therein.
Per diems (EUR 0.2 thousand per meeting day) and travel expenses are also paid on request.
The following table contains details on the compensation for members of the Board of Supervisory Directors in financial year 2009:
152
Compensation for the Chairman of the Board of Supervisory Directors: EUR 13 thousand p.a. (previous year: EUR 13 thousand)
Compensation for the Deputy Chairman: EUR 10 thousand p.a. (previous year: EUR 10 thousand)
Compensation for the members of the Board of Supervisory Directors: EUR 5 thousand p.a. (previous year: EUR 5 thousand)
Compensation for membership of the Loan Approval, Executive and Audit Committees: EUR 0.6 thousand p.a. (previous year: EUR 0.6thousand)
Dates of Compensation membership in (EUR inName 2009 thousands)
Former Federal Minister Peer Steinbrück1) 1 Jan.-27 Oct. 0 Federal Minister Dr Wolfgang Schäuble1) 28 Oct.-31 Dec. 0Former Federal Minister Michael Glos1) 1 Jan.-10 Feb. 0Federal Minister Dr Karl-Theodor Freiherr zu Guttenberg1) 12 Feb.-27 Oct. 0Federal Minister Rainer Brüderle1) 28 Oct.-31 Dec. 0Federal Minister Ilse Aigner1) 1 Jan.-31 Dec. 0Dr Günter Baumann 1 Jan.-1 April 1.7Anton F. Börner 1 Jan.-31 Dec. 5.7 Christian Brand 5 Aug.-31 Dec. 2.2Dr Uwe Brandl 1 Jan.-31 Dec. 5.1Frank Bsirske 1 Jan.-31 Dec. 5.1Former Minister Prof. Dr Ingolf Deubel2) 1 Jan.-31 Dec. 6.3Prof. Dr Hans Heinrich Driftmann 27 May-31 Dec. 3.4Former State Minister Prof. Dr Kurt Faltlhauser2) 1 Jan.-31 Dec 5.7Former Federal Minister Sigmar Gabriel1) 1 Jan.-27 Oct. 0

Provisions in the amount of EUR 47,515 thousand had been set up at the end of the financial year for pension obligations for former membersof the Managing Board and their surviving dependents (previous year: EUR 41,052 thousand). The regular compensation totalled EUR 3,619thousand (previous year: EUR 3,617 thousand).
The total amount of loans granted to members of the Managing Board was EUR 87 thousand as at year-end (previous year: EUR 104thousand). Interest rates were between 3% p.a. and 4% p.a.
153
Dates of Compensation membership in (EUR inName 2009 thousands)
Heinrich Haasis 1 Jan.-31 Dec. 7.0 Gerhard P. Hofmann 1 Jan.-31 Dec. 6.3Minister Peter Jacoby2) 1 Jan.-31 Dec. 5.1Dr Siegfried Jaschinski 1 Jan.-19 May 2.6Bartholomäus Kalb 1 Jan.-31 Dec. 6.3Prof. Dr-Ing. Hans-Peter Keitel 1 Jan.-22 May 2.3Minister President Roland Koch2) 1 Jan.-31 Dec. 5.7Dr h.c. Jürgen Koppelin 1 Jan.-31 Dec. 5.7 Waltraud Lehn 1 Jan.-31 Dec. 5.7Minister Dr Helmut Linssen2) 1 Jan.-31 Dec. 5.7Dr Gesine Lötzsch3) 1 Jan.-31 Dec. 5.1Claus Matecki 1 Jan.-31 Dec. 5.1Dr Michael Meister 1 Jan.-31 Dec. 5.7Franz-Josef Möllenberg 1 Jan.-31 Dec. 6.3Minister Hartmut Möllring2) 1 Jan.-31 Dec. 5.1 Klaus-Peter Müller 1 Jan.-23 Mar. 1.4Federal Minister Dirk Niebel1) 28 Oct.-31 Dec. 0Minister President Matthias Platzeck1) 1 Jan.-31 Dec. 0Federal Minister Dr Peter Ramsauer1) 28 Oct.-31 Dec. 0Federal Minister Dr Norbert Röttgen1) 28 Oct.-31 Dec. 0Alexander Rychter3) 1 Jan.-31 Dec. 5.6Christine Scheel3) 1 Jan.-31 Dec. 5.7 Hanns-Eberhard Schleyer 1 Jan.-31 Dec. 6.3Andreas Schmitz 25 Mar.-31 Dec. 5.5Dr Werner Schnappauf 5 Aug.-31 Dec. 2.2Michael Sommer 1 Jan.-31 Dec. 5.7Gerd Sonnleitner 1 Jan.-31 Dec. 5.7Former Federal Minister Dr Frank-Walter Steinmeier1) 1 Jan.-27 Oct. 0Ludwig Stiegler 1 Jan.-31 Dec. 6.3 Former Federal Minister Wolfang Tiefensee1) 1 Jan.-27 Oct. 0Federal Minister Dr Guido Westerwelle1) 28 Oct.-31 Dec. 0Former Federal Minister Heidemarie Wieczorek-Zeul1) 1 Jan.-27 Oct. 0
Total4) 160.0
1) Compensation waived
2) Amount determined by state law.
3) Amount not yet called
4) Total compensation including amounts not yet called

(76) Related party disclosures
The KfW Group’s related parties, in accordance with IAS 24, include as legal persons the consolidated subsidiaries, the non-consolidated affiliated entities, jointly controlled entities and associated entities.
Natural persons considered related parties in accordance with IAS 24 include the members of the Managing Board and the Directors of KfW(and their close family members), the members of the Board of Supervisory Directors of KfW, and the executive bodies of its consolidatedsubsidiaries.
KfW is a public law institution in which the Federal Republic of Germany (Federal Government) holds an 80% and the Federal States a 20%stake. Any transactions with the Federal Government and the Federal States in the reporting year are covered by the rules and regulations setforth in the KfW Law.
The business relationships between KfW and its affiliates and other related parties are primarily determined by the rules set out in the KfWLaw. The conditions and prices are in line with standard market conditions and are concluded in accordance with KfW’s general conditions for its loan programmes open to the general public.
154

(77) Auditor’s fees
Due to the change of auditor in financial year 2009 comparability with the previous years’ figures is possible to only a limited extent. For this reason these figures are not stated.
(78) Disclosures on shareholdings
SUBSIDIARIES INCLUDED IN THE CONSOLIDATED FINANCIAL STATEMENTS
KfW International Finance Inc., Delaware, USA, has completed its refinancing activities for KfW in financial year 2008 and is therefore nolonger included in the consolidated financial statements.
155
2009 EUR in thousandsAudit 1,834Other audit-related and valuation services 40Tax advisory services 329Other services 278
Total 2,481
Equity (IFRS, EUR in Capital share millions)Name/registered office (%) as at 31 Dec. 2009
KfW IPEX-Bank GmbH, Frankfurt (www.kfw-ipex-bank.de) 100 2,389KfW IPEX-Beteiligungsholding GmbH, Frankfurt 100 1,856DEG — Deutsche Investitions- und Entwicklungsgesellschaft mbH, Cologne (www.deginvest.de) 100 1,491tbg Technologie-Beteiligungs-Gesellschaft mbH, Bonn 100 374KfW Beteiligungsholding GmbH, Bonn 100 190 Finanzierungs- und Beratungsgesellschaft mbH, Berlin 100 33
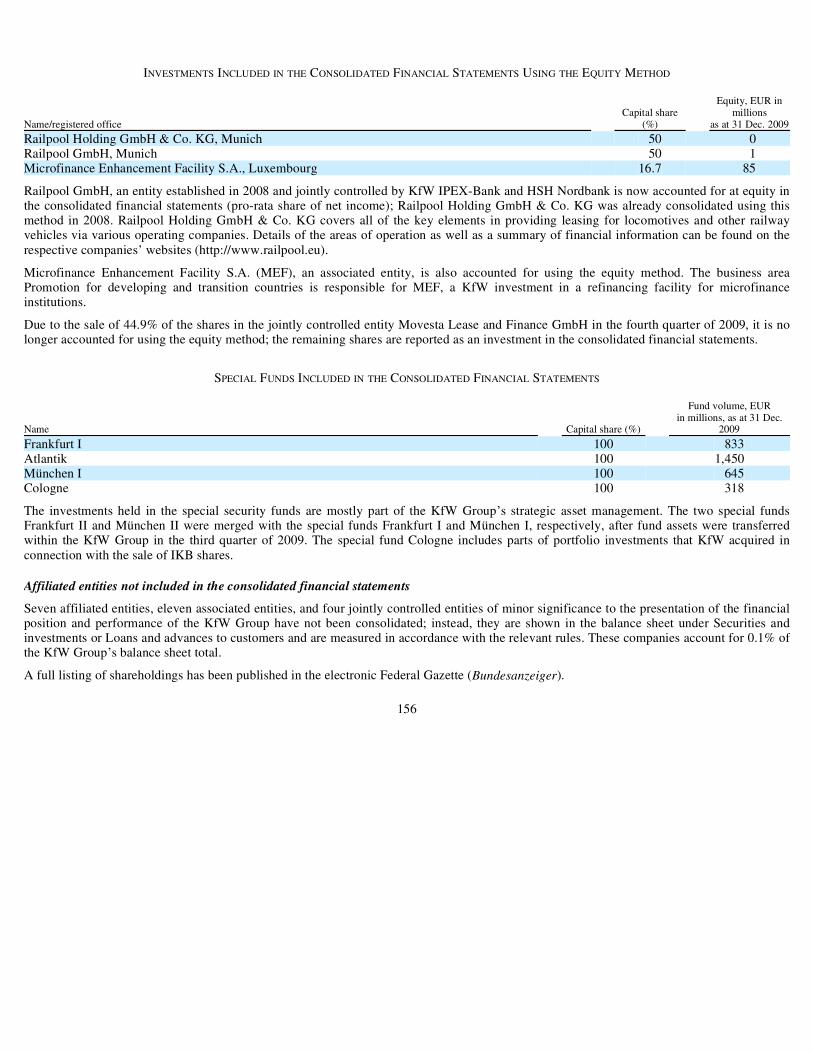
INVESTMENTS INCLUDED IN THE CONSOLIDATED FINANCIAL STATEMENTS USING THE EQUITY METHOD
Railpool GmbH, an entity established in 2008 and jointly controlled by KfW IPEX-Bank and HSH Nordbank is now accounted for at equity in the consolidated financial statements (pro-rata share of net income); Railpool Holding GmbH & Co. KG was already consolidated using this method in 2008. Railpool Holding GmbH & Co. KG covers all of the key elements in providing leasing for locomotives and other railwayvehicles via various operating companies. Details of the areas of operation as well as a summary of financial information can be found on therespective companies’ websites (http://www.railpool.eu).
Microfinance Enhancement Facility S.A. (MEF), an associated entity, is also accounted for using the equity method. The business areaPromotion for developing and transition countries is responsible for MEF, a KfW investment in a refinancing facility for microfinanceinstitutions.
Due to the sale of 44.9% of the shares in the jointly controlled entity Movesta Lease and Finance GmbH in the fourth quarter of 2009, it is nolonger accounted for using the equity method; the remaining shares are reported as an investment in the consolidated financial statements.
SPECIAL FUNDS INCLUDED IN THE CONSOLIDATED FINANCIAL STATEMENTS
The investments held in the special security funds are mostly part of the KfW Group’s strategic asset management. The two special funds Frankfurt II and München II were merged with the special funds Frankfurt I and München I, respectively, after fund assets were transferred within the KfW Group in the third quarter of 2009. The special fund Cologne includes parts of portfolio investments that KfW acquired inconnection with the sale of IKB shares.
Affiliated entities not included in the consolidated financial statements
Seven affiliated entities, eleven associated entities, and four jointly controlled entities of minor significance to the presentation of the financialposition and performance of the KfW Group have not been consolidated; instead, they are shown in the balance sheet under Securities andinvestments or Loans and advances to customers and are measured in accordance with the relevant rules. These companies account for 0.1% ofthe KfW Group’s balance sheet total.
A full listing of shareholdings has been published in the electronic Federal Gazette (Bundesanzeiger).
156
Equity, EUR in Capital share millionsName/registered office (%) as at 31 Dec. 2009
Railpool Holding GmbH & Co. KG, Munich 50 0Railpool GmbH, Munich 50 1Microfinance Enhancement Facility S.A., Luxembourg 16.7 85
Fund volume, EUR in millions, as at 31 Dec.Name Capital share (%) 2009
Frankfurt I 100 833Atlantik 100 1,450München I 100 645Cologne 100 318

Reprint of the Auditor’s Report
Based on the final results of our audit we issued the following unqualified auditor’s report dated March 12, 2010:
“Auditor’s Report
We have audited the consolidated financial statements prepared by KfW, Frankfurt am Main, comprising the statement of comprehensive income, statement of financial position, statement of changes in equity, statement of cash flows and the notes to the consolidated financial statements, together with the group management report for the business year from 1 January to 31 December 2009. The preparation of the consolidated financial statements and the group management report in accordance with IFRSs, as adopted by the EU, and the additional requirements of German commercial law pursuant to § (Article) 315a Abs. (paragraph) 1 HGB (Handelsgesetzbuch “German Commercial Code”) and supplementary provisions of the Law concerning KfW (KfW Law) and By-Laws of KfW are the responsibility of KfW’s Managing Board. Our responsibility is to express an opinion on the consolidated financial statements and on the group management report based on our audit.
We conducted our audit of the consolidated financial statements in accordance with § 317 HGB (Handelsgesetzbuch “German Commercial Code”) and German generally accepted standards for the audit of financial statements promulgated by the Institut der Wirtschaftsprüfer (Institute of Public Auditors in Germany) (IDW). Those standards require that we plan and perform the audit such that misstatements materially affecting the presentation of the net assets, financial position and results of operations in the consolidated financial statements in accordance with the applicable financial reporting framework and in the group management report are detected with reasonable assurance. Knowledge of the business activities and the economic and legal environment of the Group and expectations as to possible misstatements are taken into account in the determination of audit procedures. The effectiveness of the accounting-related internal control system and the evidence supporting the disclosures in the consolidated financial statements and the group management report are examined primarily on a test basis within the framework of the audit. The audit includes assessing the annual financial statements of those entities included in consolidation, the determination of entities to be included in consolidation, the accounting and consolidation principles used and significant estimates made by the Managing Board, as well as evaluating the overall presentation of the consolidated financial statements and the group management report. We believe that our audit provides a reasonable basis for our opinion.
Our audit has not led to any reservations.
In our opinion, based on the findings of our audit, the consolidated financial statements comply with IFRSs, as adopted by the EU and the additional requirements of German commercial law pursuant to § 315a Abs. 1 HGB and supplementary provisions of the KfW Law and By-Laws of KfW and give a true and fair view of the net assets, financial position and results of operations of the KfW Group in accordance with these requirements. The group management report is consistent with the consolidated financial statements and as a whole provides a suitable view of the Group’s position and suitably presents the opportunities and risks of future development.”
Frankfurt am Main, 12 March 2010 KPMG AG
Wirtschaftsprüfungsgesellschaft
157
Mock SchweitzerWirtschaftsprüfer Wirtschaftsprüfer (German Public Auditor) (German Public Auditor)

THE FEDERAL REPUBLIC OF GERMANY
GENERAL
Area, Location and Population
The Federal Republic is situated in central Europe and comprises an area of 357,104 km2 (about 138,000 square miles). Its total population was in the range of 82.0 million in 2008. Approximately 16% of the total population is concentrated in metropolitan areas with more than 500,000 inhabitants; the largest of these areas are (in descending order) Berlin, Hamburg, Munich, Cologne, Frankfurt am Main, Stuttgart, Dortmund, Essen, Dusseldorf and Bremen.
Source: Statistisches Bundesamt, Statistisches Jahrbuch 2009, Tables 2.1.1, 2.4, 2.5, and 2.6.
Government
The Federal Republic is a federated republic whose constitution is codified in the Grundgesetz of 1949. The capital of the Federal Republic is Berlin. The Federal Republic consists of 16 federal states (Länder). The Länder have legislative sovereignty over matters not expressly reserved to the legislative, executive and judicial bodies of the Federal Republic.
The Grundgesetz provides for a Federal President (Bundespräsident), two Houses of Parliament (the Bundestag and the Bundesrat, which consists of representatives of the 16 Länder governments), a Chancellor (Bundeskanzler) and a Federal Constitutional Court (Bundesverfassungsgericht). The Chancellor heads the Federal Government (Bundesregierung), consisting of the Chancellor and the Federal Ministers. The Bundespräsident acts as head of state.
General elections for the Bundestag are generally held every four years on the basis of an electoral system of proportional representation. The last general election was held on September 27, 2009.
A political party is not entitled to party representation in the Bundestag unless it receives at least 5% of the votes cast or three direct mandates in a general election. The Chancellor is elected by and is responsible to the Bundestag.
Political Parties
The political parties currently represented in the Bundestag are the Christian Democratic Union (CDU) and its Bavarian sister party, the Christian Social Union (CSU), the Social Democratic Party (SPD), the Free Democratic Party (FDP), the Left-Wing Party (Die Linke., founded in 2007 by the merger of the Left-Wing Party of Democratic Socialism (Linkspartei.PDS) and the party Labor and Social Justice – The Election Alternative (WASG)), and the Greens (Bündnis 90/Die Grünen).
Since 1949, the Federal Republic has been governed by eight Chancellors over 17 electoral periods. The most recent general election, held in September 2009, resulted in a coalition between the Christian Democrats (CDU/CSU) and the Free Democratic Party (FDP), led by Chancellor Ms. Angela Merkel (CDU).
Sources: The Federal Returning Officer, Official final result of the 2009 Bundestag election, press release of October 14, 2009 (http://www.bundeswahlleiter.de/en/bundestagswahlen/BTW_BUND_09/presse/75_EndgueltigesErgebnis.html); Growth. Education. Unity. Coalition Agreement between CDU, CSU and FDP (http://www.cdu.de/doc/pdfc/091215-koalitionsvertrag-2009-2013-englisch.pdf).
G-1

The following table shows the results of the five most recent general elections for the Bundestag.
ELECTION RESULTS TO THE GERMAN BUNDESTAG
Sources: Statistisches Bundesamt, Statistisches Jahrbuch 2009, Tables 4.3 and 4.6; The Federal Returning Officer, Official final result of the 2009 Bundestag election, press release of October 14, 2009 (http://www.bundeswahlleiter.de/en/bundestagswahlen/BTW_BUND_09/presse/75_EndgueltigesErgebnis.html).
International Organizations
In addition to the European Union (“EU”), the Federal Republic is a member of various major multilateral institutions, including the United Nations, the International Monetary Fund (“IMF”), the International Bank for Reconstruction and Development and the International Development Association (“World Bank”), the Council of Europe, the Organization for Economic Cooperation and Development (“OECD”), the West European Union (“WEU”), and the North Atlantic Treaty Organization (“NATO”). In addition, the Federal Republic is a signatory to the General Agreement on Tariffs and Trade (“GATT”) and a member of the World Trade Organization (“WTO”). It is also a shareholder of, among others, the European Investment Bank, the European Bank for Reconstruction and Development, and the European Atomic Energy Community.
The European Union and European Integration
The Federal Republic was a founding member of the European Coal and Steel Community (“ECSC”) in 1951, which later developed into the European Union. Today, the Federal Republic is one of 27 member states of the EU (the “Member States”). On May 1, 2004, ten new countries – Cyprus, the Czech Republic, Estonia, Hungary, Latvia, Lithuania, Malta, Poland, Slovakia and Slovenia – became part of the EU, joining its previous members Austria, Belgium, Denmark, Finland, France, Germany, Greece, Ireland, Italy, Luxembourg, the Netherlands, Portugal, Spain, Sweden and the United Kingdom. On January 1, 2007, two additional countries – Bulgaria and Romania – joined the EU. The aggregate population of the Member States is now approximately 501 million. Accession negotiations with Turkey and Croatia started in October 2005. Furthermore, in December 2005, the European Council decided to grant candidate status to the Former Yugoslav Republic of Macedonia. On July 23, 2009 and December 22, 2009, Iceland and Serbia submitted their respective applications for EU membership.
Sources: Europa.eu, The history of the European Union (http://europa.eu/abc/history/index_en.htm); Europa.eu, 2000-today: A decade of further expansion, The history of the European Union (http://europa.eu/abc/history/2000_today/index_en.htm); Statistical Office of the European Communities, Total population (http://epp.eurostat.ec.europa.eu/tgm/table.do?tab=table&language=en&pcode=tps00001&tableSelection=1&footnotes=yes&labeling=labels&plugin=1); Europa.eu, Enlargement strategy 2007-2008: Summary (http://europa.eu/legislation_summaries/enlargement/ongoing_enlargement/index_en.htm); Enlargement process: Consolidation, Conditions, Communication. Roadmap for the Western Balkans (2005) (http://europa.eu/legislation_summaries/enlargement/ongoing_enlargement/e50021_en.htm).
Economic Integration
From its inception, the EU has had the fundamental objective, like its predecessors, of economic integration of its Member States. Culminating a long process, a single market that provides for the free
G-2
2009 2005 2002 1998 1994 Elections Elections Elections Elections Elections % of % of % of % of % of Votes Seats Votes Seats Votes Seats Votes Seats Votes Seats
CDU/CSU 33.8 239 35.2 226 38.5 248 35.1 245 41.4 294SPD 23.0 146 34.2 222 38.5 251 40.9 298 36.4 252FDP 14.6 93 9.8 61 7.4 47 6.2 43 6.9 47Die Linke. (1) 11.9 76 8.7 54 4.0 2 5.1 36 4.4 30Bündnis 90/Die Grünen 10.7 68 8.1 51 8.6 55 6.7 47 7.3 49Others 6.0 — 3.9 — 3.0 — 5.9 — 3.6 —
Total 622 614 603 669 672
(1) Results for the Party of Democratic Socialism (PDS) for all elections prior to 2005.

movement of goods and services, persons and capital among the Member States was established as of January 1, 1993. The integration of the Member States’ economies and the completion of a single market are also promoted by a European competition policy, which aims at creating a level playing field for Member States’ companies, and promoting economic efficiency, and a European consumer policy. In addition, various liberalization and harmonization measures are being implemented, for example in the telecommunications and energy sectors. In the financial sector, the single market has been fostered by providing for the free movement of capital and the freedom to perform banking services throughout the EU under the “European passport”, which enables financial institutions to provide financial services throughout the common market based on a single license obtained in one Member State. Another important policy area for the EU has been agriculture. Subsidies to this sector make up more than 40% of the EU’s budget. The EU also promotes economic integration with regional aid, which is designed to focus development efforts on certain disadvantaged regions and sections of population of the EU.
The financial framework for the enlarged EU for the period from 2007 until 2013 was formally adopted on May 17, 2006, with an Interinstitutional Agreement (“IIA”) signed by the European Parliament (the “Parliament”), the Council of the European Union (the “Council”) and the European Commission. Among other things, the IIA defines maximum amounts for commitment appropriations, which cover commitments made to spend funds over one or more years in certain expenditure categories. Additionally, the IIA defines an annual maximum amount for payment appropriations, which cover payments made to honor the legal commitments entered into during the current financial year and/or earlier financial years. The 2010 EU budget, which was adopted by the Parliament on December 17, 2009, amounts to EUR 141.4 billion in commitment appropriations and EUR 122.9 billion in payment appropriations. The amount of commitment appropriations corresponds to 1.20% of the EU gross national income, while the amount of payment appropriations corresponds to 1.04% of the EU gross national income.
Sources: Europa.eu, What does the EU do? (http://europa.eu/abc/12lessons/lesson_5/index_en.htm); Europe.eu, The single market (http://europa.eu/abc/12lessons/lesson_6/index_en.htm); European Commission, Banking (http://ec.europa.eu/internal_market/bank/index_en.htm); European Commission, A Financial Framework for the enlarged Union (2007-2013), Financial Programming and Budget (http://ec.europa.eu/budget/prior_future/fin_framework_en.htm); Official Journal of the European Union, Interinstitutional Agreement between the European Parliament, the Council and the Commission on budgetary discipline and sound financial management (2006/C 139/01) (http://eur-lex.europa.eu/LexUriServ/site/en/oj/2006/c_139/c_13920060614en00010017.pdf); European Commission, The current year, Financial Programming and Budget (http://ec.europa.eu/budget/budget_detail/current_year_en.htm).
Monetary Integration
The Federal Republic is a signatory to and has ratified the Treaty on European Union of February 1992 (also known as the “Maastricht Treaty”). The Maastricht Treaty was the basis for the establishment of the European Economic and Monetary Union (“EMU”). The EMU led, in turn, to the adoption of irrevocable conversion rates between the euro and the national currencies of the initial participating Member States on December 31, 1998 and the introduction of the euro as the single European currency in the “euro area” on January 1, 1999. On January 1, 2002, banknotes and coins denominated in euro were introduced as legal tender to replace the national currencies in the 12 Member States forming the euro area at that time (Austria, Belgium, Finland, France, Germany, Greece, Ireland, Italy, Luxembourg, the Netherlands, Portugal and Spain). Slovenia joined the euro area as the thirteenth Member State on January 1, 2007; and Malta and Cyprus followed on January 1, 2008. On January 1, 2009, Slovakia adopted the euro as legal tender. The EMU thus currently comprises 16 Member States.
The European Central Bank (“ECB”) was established on June 1, 1998, as part of the European System of Central Banks (“ESCB”). According to the Maastricht Treaty, the primary objective of the ESCB is to maintain price stability. Without prejudice to the objective of price stability, the ESCB supports the general economic policies of the EU. See “Monetary and Financial System” for more information on the ECB and ESCB. The Eurosystem, consisting of the ECB and the national central banks of those Member States whose currency is the euro, assumed sole responsibility for the monetary policy in the euro area on January 1, 1999.
Sources: The European Union, Treaty on European Union (http://eur-lex.europa.eu/en/treaties/dat/11992M/htm/11992M.html); The European Central Bank, Economic and Monetary Union (EMU) (http://www.ecb.int/ecb/history/emu/html/index.en.html); The European Central Bank, The first ten years (http://www.ecb.int/ecb/10ann/html/index.en.html); The European Central Bank, The euro cash changeover is progressing smoothly in all euro area countries, press release of January 2, 2002 (http://www.ecb.int/press/pr/date/2002/html/pr020102.en.html)
To ensure continuous budgetary discipline in the EMU, the Member States agreed on the main elements of a Stability and Growth Pact (the “Pact”) in 1996. According to the Pact, which was slightly
G-3

modified in 2005, Member States must pursue a medium-term objective of ensuring the long-term sustainability of public finances and minimizing the risk of any Member State’s government deficit exceeding the reference value of 3% of its gross domestic product (“GDP”) under the Maastricht Treaty.
Under the Maastricht Treaty, implementing regulations and the Pact, a Member State whose general government deficit exceeds the reference value of 3% of its GDP becomes subject to the Excessive Deficit Procedure (“EDP”). The EDP provides that the Economic and Finance Affairs Council (the “Ecofin Council”) decides whether an excessive deficit has been incurred. The Ecofin Council is a meeting of the Council composed of Economics and Finance Ministers of the Member States. If it concludes that there is an excessive deficit, the Ecofin Council, based on recommendations by the European Commission, suggests corrective measures aimed at a deficit reduction and then reviews the corrective measures taken by the Member State. If it determines that such corrective measures are not adequate, the Maastricht Treaty and the Pact provide for a wide range of remedies. For those Member States whose currency is the euro, this process could ultimately lead to the imposition of annual financial penalties of as much as 0.5% of a Member State’s GDP. Financial penalties may not be imposed, however, until the end of a further review period. Furthermore, the Pact provides that the 3% limit may be exceeded without triggering an EDP provided that the deficit is considered to be exceptional and temporary, for example, in the event of a severe economic downturn (i.e., a recession), a longer period of weak growth or an unusual event outside the control of the Member State concerned (e.g., a significant natural disaster or a war having an impact on that Member State) and the deficit ratio remains close to the 3% threshold.
Moreover, in judging whether a deficit is excessive and whether a Member State must implement corrective measures, the Ecofin Council relies on an indicative list of relevant factors that has been agreed upon by the Member States. This list includes, among other factors, the costs of implementing policies according to the EU Strategy for Growth and Jobs (Lisbon Strategy); high financial contributions aimed at fostering international solidarity and achieving European policy goals, notably European unification; and costs of pension reform.
As a consequence of the global economic and financial crisis, nearly all Member States breached the 3% of GDP deficit reference value in 2009. With the exception of Bulgaria, Finland, Denmark, Luxembourg, Cyprus, Sweden and Estonia, all EU Member States, including Germany, are currently subject to the EDP. According to the European Commission’s regular spring forecast published in May 2010, as well as its assessments of stability and convergence programs published in early 2010, the general government deficits of most Member States are also expected to exceed the deficit reference value in 2010.
After Greece had experienced serious difficulties in accessing the financial markets to obtain new borrowings, the Member States that form the euro area (the “Euro Area Member States”) concluded that the stability of the euro area as a whole was threatened and agreed to help Greece meet its financing needs. In April 2010, the Euro Area Member States agreed upon the terms of financial support that was to be given to Greece, when needed. On April 23, 2010, the Greek government requested the activation of the financial support mechanism. Following the request by the Greek government and an agreement reached on May 2, 2010, the other Euro Area Member States agreed to provide Greece with stability support in the form of pooled bilateral loans in the amount of up to EUR 80 billion over a period of three years parallel to a loan facility provided by the IMF in the amount of up to EUR 30 billion. The German share amounts to up to approximately EUR 22.3 billion.
Furthermore, on May 10, 2010, the Council of the European Union and the Member States decided on a comprehensive package of measures to address the risk of contagion in an environment of fragile financial markets and to preserve financial stability in Europe. This package includes a new community instrument (European financial stabilization mechanism) of up to EUR 60 billion. This mechanism is modelled after the EU-balance of payments assistance and is designed to stay in place for as long as is needed. In addition, the Euro Area Member States stand ready to complement such resources with up to EUR 440 billion through a special purpose vehicle that is guaranteed on a pro rata basis by participating Member States in a coordinated manner and that will expire after three years, respecting their national constitutional requirements. The activation of the European financial stabilization mechanism is subject to strong conditionality with the funding being provided on terms and conditions similar to those required by the IMF. The IMF will participate in financing arrangements and is expected to provide at least half as much as the EU contribution through its usual facilities in line with recent European programs. At the same time, the Council of the European Union and the Member States pledged to work urgently on reforms to complement the existing framework to ensure financial sustainability and underlined the need to make rapid progress on financial market regulation and supervision.
G-4

Germany recorded a deficit of 3.3% in 2009. According to the January 2010 update of the German stability program, Germany’s general government deficit will increase to 51/2% of GDP in 2010, but will decline to 41/2% of GDP in 2011 (for further information see “Public Finance—Germany’s General Government Deficit/Surplus, the Stability Program and the Excessive Deficit Procedure”).
Sources: European Council, Dublin European Council 13 and 14 December 1996 Presidency Conclusions (http://europa.eu/rapid/pressReleasesAction.do?reference=DOC/96/8&format=HTML&aged=1&language=EN&guiLanguage=en); Treaty of Maastricht on European Union (http://europa.eu/legislation_summaries/economic_and_monetary_affairs/institutional_and_economic_framework/treaties_maastricht_en.htm); European Commission, Economic and Financial Affairs, Stability and Growth Pact (http://ec.europa.eu/economy_finance/sgp/index_en.htm); European Commission, The corrective arm: the excessive deficit procedure (http://europa.eu/legislation_summaries/economic_and_monetary_affairs/stability_and_growth_pact/l25020_en.htm); European Commission, European Economic Forecast, Spring 2010 (http://ec.europa.eu/economy_finance/publications/european_economy/2010/pdf/ee-2010-2_en.pdf); European Commission, Commission assesses Stability and Convergence Programmes of fourteen Member States, press release of March 17, 2010 (http://europa.eu/rapid/pressReleasesAction.do?reference=IP/10/288); European Commission, Commission assesses stability and convergence programmes of ten EU Member States, press release of March 24, 2010 (http://europa.eu/rapid/pressReleasesAction.do?reference=IP/10/346&format=HTML&aged=0&language=EN&guiLanguage=en); European Commission, Commission assesses Stability Programme of Greece, press release of February 3, 2010 (http://europa.eu/rapid/pressReleasesAction.do?reference=IP/10/116); European Commission, Economic and Financial Affairs, Overview of ongoing excessive deficit procedures (http://ec.europa.eu/economy_finance/sgp/deficit/countries/index_en.htm); Statement on the support to Greece by Euro area Members States, press release of April 11, 2010 (http://europa.eu/rapid/pressReleasesAction.do?reference=MEMO/10/123&format=HTML&aged=0&language=EN&guiLanguage=en); Statement of the heads of state or government of the euro area of May 7, 2010 (http://ec.europa.eu/commission_2010-2014/president/news/speeches-statements/pdf/114295.pdf); Bundesregierung, Griechenland-Hilfe beschlossen, May 7, 2010 (http://www.bundesregierung.de/nn_1264/Content/DE/Artikel/2010/05/2010-05-07-griechenland.html); IMF, IMF Approves €€ 30 Bln Loan for Greece on Fast Track, May 9, 2010 (http://www.imf.org/external/pubs/ft/survey/so/2010/NEW050910A.htm); Council of the European Union, Extraordinary Council meeting, Economic and Financial Affairs, Brussels 9/10 May 2010, press release (http://www.consilium.europa.eu/uedocs/cms_data/docs/pressdata/en/ecofin/114324.pdf); Statistisches Bundesamt, Government deficit ratio for 2009 amounting to 3.3%, press release of February 24, 2010 (http://www.destatis.de/jetspeed/portal/cms/Sites/destatis/Internet/EN/press/pr/2010/02/PE10__062__813.psml); Bundesministerium der Finanzen, Germany Stability Programme January 2010 Update (http://ec.europa.eu/economy_finance/sgp/pdf/20_scps/2009-10/01_programme/de_2010-02-09_sp_en.pdf).
Political Integration
The EU’s three main institutions are the Council (representing the governments of the Member States), the Parliament (elected by and representing the citizens of the Member States) and the European Commission (the executive body of the EU). In order to ensure that the decision-making process within the EU’s institutions continues to work effectively, the European Convention was formed in 2001. Its goal was to draft a European constitution that would set out the powers and responsibilities of the institutions and the decision-making process, thus enabling the EU to cope with its main challenges in the mid-term future, the enlargement of the EU and the increased involvement of EU citizens, by introducing more direct democratic processes and transparency into the governance of the EU. The European constitution was signed by the heads of state and government and the foreign ministers in October 2004; it was required to be ratified by all Member States as a precondition to its entry into force. After the failure of referendums on ratification held in France and the Netherlands, the European Council in June 2005 decided to enter a period of reflection on the process of reforming the EU institutions. In June 2007, the European Council decided to convene an Intergovernmental Conference to draft a new EU treaty. The treaty, which was signed by the heads of state and government and the foreign ministers in Lisbon on December 13, 2007 (the “Treaty of Lisbon”), largely reflects the institutional reforms embodied in the Constitution, while modifying or leaving out certain controversial topics. It entered into force on December 1, 2009.
Sources: Europa.eu, How does the EU work?, Europe in 12 lessons (http://europa.eu/abc/12lessons/lesson_4/index_en.htm); Europa.eu, Institutional Reform of the European Union: Main dates (http://europa.eu/institutional_reform/chronology/index_en.htm); Official Journal of the European Union, 2004/C 310/01 (http://eur-lex.europa.eu/JOHtml.do?uri=OJ:C:2004:310:SOM:EN:HTML); European Council, Declaration by the Heads of State or Government of the Members States of the European Union, June 18, 2005 (http://europa.eu/rapid/pressReleasesAction.do?reference=DOC/05/3&format=HTML&aged=0&language=EN&guiLanguage=en); European Council, The Brussels European Council – June 21 and 22, 2007 (http://europa.eu/legislation_summaries/other/constitution_european_council_2007_en.htm); Europa.eu, Treaty of Lisbon: The treaty at a glance (http://europa.eu/lisbon_treaty/glance/index_en.htm); Europa.eu, Treaty of Lisbon: News (http://europa.eu/lisbon_treaty/index_en.htm).
G-5

Statistical Disclosure Standards of the International Monetary Fund
The Federal Republic currently meets the Special Data Dissemination Standard (“SDDS”) of the IMF relating to coverage, periodicity and timeliness of economic data. Although subscription by member countries to the SDDS is voluntary, it carries a commitment requiring members to observe the standard and to provide certain information to the IMF about their practices in disseminating economic and financial data.
G-6

THE ECONOMY
Overview
Since 1945, the Federal Republic’s economic system has developed into a social market economy, combining the free initiative of the individual with progressive social principles. The Grundgesetz guarantees freedom of private enterprise and private property, provided that these basic rights are not exercised against the public good. The state mainly has a regulatory function in the market economy, setting the general framework of conditions within which market processes take place. State intervention in price setting is limited to a very small number of industries.
Key Economic Figures
The German economy is one of the world’s largest economies. In 2009, its GDP expressed at current prices was EUR 2,407.2 billion, compared to EUR 2,495.8 billion in 2008, which represents a decrease of 3.5%. Real GDP decreased by 5.0% compared to 2008 but exceeded the 1991 level by 22.7%. 1991 represents the first full year after German reunification on October 3, 1990. The growth in GDP since 1991 has been largely driven by gains in productivity, as real GDP per employee has risen by 17.7% since 1991. In calculating real GDP, the Federal Statistical Office uses a chain index based on the previous year’s prices. In 2009, GDP per capita at current prices was EUR 29,410, while GDP per employee at current prices was EUR 59,784.
Source: Statistisches Bundesamt, Fachserie 18, Reihe 1.4 — 2009 (March 2010), Tables 2.1.1 and 2.1.4.
As in many advanced economies, the services sector of the Federal Republic has become the largest contributor to GDP (in terms of gross value added). In 2009, financial, renting and business activities accounted for 31.0% (1991: 23.3%), and other public and private service activities accounted for 24.0% (1991: 20.8%) of gross value added, measured at current prices, while the share of trade and transport services, including hotel and restaurant services as well as communication services, amounted to 17.6% (1991: 17.9%). The production sector (excluding construction) generated 22.0% of gross value added compared to 30.6% in 1991. Construction contributed 4.6% (1991: 6.0%) to gross value added, and agriculture, forestry and fishing accounted for 0.8% of gross value added (1991: 1.4%).
Source: Statistisches Bundesamt, Fachserie 18, Reihe 1.4 — 2009 (March 2010), Table 2.2.1.
In 2009, private consumption totaled 58.8% of nominal GDP, gross capital formation amounted to 17.0%, and government consumption equaled 19.7%. Exports and imports of goods and services accounted for 40.8% and 36.2% of GDP at current prices, respectively. The trade balance (according to national accounts) thus showed a surplus equal to 4.6% of GDP in 2009.
Source: Statistisches Bundesamt, Fachserie 18, Reihe 1.4 — 2009 (March 2010), Table 2.3.1.
In 2009, real GDP decreased by 5.0% compared to 2008. This decrease represented the most severe economic downturn since the Second World War. Net exports reduced economic growth in 2009 by 3.0 percentage points. The negative growth contribution of foreign trade was due to the sharp decrease in exports by 14.2% (compared to a 2.9% increase in 2008), while imports declined by 8.9% on a price-adjusted basis (2008: +4.3%). Nevertheless, exports measured at current prices still reached EUR 982.3 billion and imports stood at EUR 872.3 billion. Gross fixed capital formation in machinery and equipment also decreased significantly in 2009 (in real terms: -20.5% compared to +3.3% in 2008), and gross fixed capital formation in construction fell by 0.8%. Final consumption expenditure of general government rose by 3.0% in 2009 upon price adjustment, and final consumption expenditure of households rose by 0.2% on a price-adjusted basis compared to 2008.
Sources: Statistisches Bundesamt, Fachserie 18, Reihe 1.4 — 2009 (March 2010), Tables 2.3.1, 2.3.2 and 2.3.10.; Statistisches Bundesamt, Statistisches Jahrbuch 2009, Table 24.2.
The rate of registered unemployment (as computed under the “national definition” of the Federal Employment Agency) increased from 7.8% in 2008 to 8.2% in 2009. Based on the internationally comparable method of calculation promulgated by the International Labour Organization (“ILO”), which is referred to as the “ILO definition”, the unemployment rate increased from 7.2% in 2008 to 7.6% in 2009. For an explanation of the differences between the national definition and the ILO definition, see “—Employment and Labor”. Inflation as measured by the percentage increase in the national consumer price index (“CPI”) decelerated from 2.6% in 2008 to 0.4% in 2009. This was mainly due to the decline in prices for energy (-5.4%), food (-1.3%)
G-7

and education (-4.1%). General government debt increased by EUR 116.0 billion in 2009 and stood at EUR 1,762.2 billion at year-end 2009.
Sources: Bundesagentur für Arbeit, Monatsbericht März 2010, Table 5.1; Statistisches Bundesamt, Fachserie 18, Reihe 1.4 — 2009 (March 2010), Table 2.1.11; Statistisches Bundesamt, Fachserie 17, Reihe 7 — Februar 2010 (March 2010), Table 1.1 and 1.2; Statistisches Bundesamt, Consumer prices in 2009: +0.4% on 2008, press release of January 14, 2010 (http://www.destatis.de/jetspeed/portal/cms/Sites/destatis/Internet/EN/Content/Statistics/Preise/CPI,templateId=renderPrint.psm); Eurostat, Euro area and EU27 government deficit at 6.3% and 6.8% of GDP respectively, press release of April 22, 2010 (http://epp.eurostat.ec.europa.eu/cache/ITY_PUBLIC/2-22042010-BP/EN/2-22042010-BP-EN.PDF).
The growth prospects for Germany’s export-oriented economy have improved due to a recovery of global demand as well as the stimulus measures taken by the German government. In its spring forecast published in April 2010, the Federal Government projected that real GDP in Germany will grow by 1.4% in 2010. About two thirds of the forecasted rise in real GDP for 2010 is expected to be attributable to the positive growth contribution of net exports. Real exports and imports are expected to increase by 6.8% and 4.9%, respectively, compared to 2009. With the continued impetus from foreign trade, investment activity is likely to gather pace as the year goes on. Accordingly, gross fixed capital formation is projected to grow by 2.1% in 2010. German enterprises are expected to increase real gross fixed capital formation in machinery and equipment by 3.1%, and real gross fixed capital formation in construction is projected to rise by 1.0%. Government consumption, which was a stabilizing factor in 2009, is expected to further increase by 1.6% in 2010, while private consumption is expected to decline by 0.6% (both in real terms). However, private consumption expenditures should benefit from the Federal Government’s stimulus measures and are expected to slightly recover in the course of the year. The Federal Government expects that unemployment (according to the national definition) will equal approximately 3.4 million persons on average in 2010, which would constitute a rise of 10,000 registered unemployed persons compared to 2009.
Sources: Bundesministerium für Wirtschaft und Technologie, Frühjahrsprojektion 2010, press release of April 21, 2010 (http://www.bmwi.de/BMWi/Navigation/Presse/pressemitteilungen,did=339206.html); Bundesministerium für Wirtschaft und Technologie, Eckwerte-Tabelle zur Frühjahrsprojektion 2010 der Bundesregierung (http://www.bmwi.de/BMWi/Redaktion/PDF/F/fruehjahrsprojektion-eckwerte-tabelle-2010,property=pdf,bereich=bmwi,sprache=de,rwb=true.pdf).
The following table shows selected key economic figures for the Federal Republic for the past five years.
KEY ECONOMIC FIGURES
Sources: Deutsche Bundesbank, Monatsbericht April 2010, Tables IX.1 and XI.2; Statistisches Bundesamt, Fachserie 18, Reihe 1.2 - 4. Vierteljahr 2009 (February 2010), Tables 1.1 and 1.10; Statistisches Bundesamt, Consumer Prices, Consumer price index for Germany (2005=100) - % change on the previous year, last updated on April 13, 2010 (http://www.destatis.de/jetspeed/portal/cms/Sites/destatis/Internet/EN/Content/Statistics/TimeSeries/EconomicIndicators/BasicData/Content100/vpi101j,templateId=renderPrint.psml); Eurostat, Euro area and EU27 government deficit at 6.3% and 6.8% of GDP respectively, press release of April 22, 2010 (http://epp.eurostat.ec.europa.eu/cache/ITY_PUBLIC/2-22042010-BP/EN/2-22042010-BP-EN.PDF).
G-8
2009 2008 2007 2006 2005 (EUR in billions)GDP - at current prices 2,407.2 2,495.8 2,428.2 2,325.1 2,242.2
(change from previous year in %) -3.5 2.8 4.4 3.7 1.4GDP - price-adjusted, chain-linked index (2000=100),
not adjusted for calendar effects 104.8 110.3 108.9 106.3 103.0(change from previous year in %) -5.0 1.3 2.5 3.2 0.8
GDP - price-adjusted, chain-linked index (2000=100), adjusted for calendar effects 104.7 110.1 109.1 106.3 102.8(change from previous year in %) -4.9 1.0 2.6 3.4 0.9
Unemployment rate (ILO definition) (in %) (1) 7.6 7.2 8.3 9.8 10.6Rate of inflation (year-to-year change in consumer
price index (CPI) in %) 0.4 2.6 2.3 1.6 1.5Balance of payments - current account 119.2 167.0 185.1 150.1 114.6 General government debt (2) 1,762.2 1,646.2 1,578.8 1,571.7 1,524.4
(1) Unemployed persons, available and seeking work.
(2) Definition according to Maastricht Treaty.

Economic Policy
General
The Federal Government’s foremost economic policy objectives are to promote economic growth and employment. In addition, the Federal Government seeks to modernize the German economy and German society on every level in order to face successfully the challenges resulting from European integration, globalization and the emergence of a knowledge-based economy. The Federal Government believes that achieving these objectives is also necessary to further improve the Federal Republic’s position as a business location that is able to compete globally for capital, ideas and innovation.
In recent years, the Federal Government carried out major structural reforms in order to enhance the flexibility and adaptivity of the German economy and to increase the attractiveness of Germany as a business location. With effect from January 1, 2008, the reform of corporate and other general business taxation reduced the average overall tax burden on companies in Germany to just below 30%. The same law introduced a flat rate tax of 25%, effective as of January 1, 2009, on all capital gains and proceeds from the sale of private capital assets. In addition, with effect from January 1, 2010, the basic income tax allowance was increased (for further information see “Public Finance—Tax Structure—Recent and Pending Tax Reform Measures”).
Sources: Growth. Education. Unity. Coalition Agreement between CDU, CSU and FDP (http://www.cdu.de/doc/pdfc/091215-koalitionsvertrag-2009-2013-englisch.pdf); Bundesministerium für Wirtschaft und Technologie, Jahreswirtschaftsbericht 2010 (http://www.bmwi.de/BMWi/Redaktion/PDF/Publikationen/jahreswirtschaftsbericht-2010,property=pdf,bereich=bmwi,sprache=de,rwb=true.pdf).
Stimulus Packages
Since fall 2008, the significant deterioration of global economic conditions has been determining the agenda of the Federal Government’s economic policy. The Federal Government has generally decided to accept the negative impact of the adverse economic trend on the public budget and to permit automatic stabilizers, such as cyclical tax shortfalls and rising unemployment compensation, to take full effect. It has, however, also decided to introduce measures aimed at stimulating demand, while simultaneously enhancing long-term growth potential. In total, the Federal Government’s measures to support and stimulate the economy in 2009 and 2010 amount to approximately EUR 100 billion, including approximately EUR 8 billion in tax shortfalls in connection with the retroactive reinstatement of the commuter tax allowance (Pendlerpauschale) as a result of a decision of the Federal Constitutional Court. This corresponds to 2% of GDP in each of 2009 and 2010.
The first series of measures, which provides a total stimulus of EUR 32 billion in 2009 and 2010, was adopted between October and December 2008 and includes the “Package of measures to reduce tax burdens, stabilize social insurance contributions and invest in families” and the 15-point program “Securing jobs by strengthening growth.” These measures seek to stimulate private and public investments by reducing the tax burdens on private citizens and businesses. To support the labor market, the maximum drawing period for short-time work benefit was extended from 12 to 18 months. Moreover, in order to prevent a large-scale disruption in credit supply, KfW’s lending programs for small- and medium-sized enterprises have been supplemented by an additional special loan program (KfW Sonderprogramm).
In light of the continuing negative global economic and financial conditions, characterized by a significant decline in demand and production, the implementation of further measures became necessary with a view to stabilizing growth. In February 2009, the legislature adopted an additional package of measures entitled “Pact for employment and stability in Germany” which, in the aggregate, provides for additional expenditures respectively revenue shortfalls of approximately EUR 51 billion for the general government budgets for 2009 and 2010. Key measures include: public investments in educational infrastructure and other infrastructure; supplying credit to businesses (including by means of extending the KfW Sonderprogramm established under the first series of measures for larger companies); fostering innovation and targeting specific sectors (including the motor vehicle sector, by introducing an environmental bonus for scrapping older vehicles (Abwrackprämie)
G-9

and purchasing new low-emission replacement vehicles in 2009); securing employment and promoting skills; reducing taxes and social contributions; and a commitment to sustainable fiscal policy called the “debt brake” (Schuldenbremse). The debt brake imposes a constitutional limit on net borrowing: under normal economic conditions, the structural deficit of the Federal Government may not exceed 0.35% of nominal GDP from 2016 onwards and the budgets of the Länder are to be balanced structurally from 2020 onwards. The constitutional amendment necessary for the implementation of this measure came into effect in August 2009.
In December 2009, the newly elected Federal Government introduced the Growth Acceleration Act (Wachstumsbeschleunigungsgesetz), which contains an additional package of measures aimed at strengthening the economic recovery. These measures became effective at the beginning of 2010 and further reduce the tax burden on companies and private households to encourage consumption and investment. The tax relief in 2010 adds up to more than EUR 6 billion.
For information on government measures to stabilize Germany’s financial system, see “Monetary and Financial System—Policy Response to the Global Economic and Financial Crisis—Financial Market Stabilization Fund”. For information on the federal budget, see “Public Finance”. Sources: Bundesministerium für Wirtschaft und Technologie, Jahreswirtschaftsbericht 2010 (http://www.bmwi.de/BMWi/Redaktion/PDF/Publikationen/jahreswirtschaftsbericht-2010,property=pdf,bereich=bmwi,sprache=de,rwb=true.pdf); Bundesministerium für Wirtschaft und Technologie, Jahreswirtschaftsbericht 2009 (http://www.bmwi.de/BMWi/Redaktion/PDF/Publikationen/jahreswirtschaftsbericht-2009); Bundesministerium der Finanzen, Addendum to the Update of the German Stability Programme (http://ec.europa.eu/economy_finance/publications/publication13915_en.pdf); Bundesministerium der Finanzen, German Stability Programme January 2010 Update (http://ec.europa.eu/economy_finance/sgp/pdf/20_scps/2009-10/01_programme/de_2010-02-09_sp_en.pdf); Bundesamt für Wirtschaft und Ausfuhrkontrolle, Umweltprämie (http://www.bafa.de/bafa/de/wirtschaftsfoerderung/umweltpraemie/index.html); Bundesministerium der Finanzen, Gesetz zur Beschleunigung des Wirtschaftswachstums (http://www.bundesfinanzministerium.de/nn_82/DE/BMF__Startseite/Aktuelles/Aktuelle__Gesetze/Gesetze__Verordnungen/044__a,templateId=raw,property=publicationFile.pdf); Bundesministerium der Finanzen, Gesetz zur Sicherung von Beschäftigung und Stabilität in Deutschland (http://www.bundesfinanzministerium.de/nn_82/DE/BMF__Startseite/Aktuelles/Aktuelle__Gesetze/Gesetze__Verordnungen/031__Konjunkturpaket__2__anl,templateId=raw,property=publicationFile.pdf).
Gross Domestic Product
The following tables show the structure of the Federal Republic’s GDP at current prices by use and origin for each of the years indicated along with changes over the respective preceding period.
G-10

STRUCTURE OF GDP — USE
Source: Statistisches Bundesamt, Fachserie 18, Reihe 1.2 — 4. Vierteljahr 2009 (February 2010), Tables 3.1 and 3.9.
G-11
2009 2008 2007 2006 2005 2009 2008 2007 2006 (EUR in billions) (change in %)Domestic uses 2,297.3 2,340.1 2,256.5 2,192.6 2,123.3 -1.8 3.7 2.9 3.3
Final private consumption 1,414.7 1,409.7 1,375.4 1,356.3 1,325.4 0.4 2.5 1.4 2.3Final government
consumption 473.1 451.8 435.6 426.3 419.6 4.7 3.7 2.2 1.6Gross fixed capital
formation 430.6 474.7 455.5 422.8 390.1 -9.3 4.2 7.7 8.4Machinery and
equipment 158.2 201.8 196.5 178.4 161.3 -21.6 2.7 10.2 10.6Construction 245.2 245.0 231.5 217.9 203.4 0.1 5.8 6.3 7.1Other products 27.3 27.9 27.5 26.6 25.4 -2.2 1.6 3.4 4.7
Changes in inventories (1) -21.2 3.9 -10.0 -12.7 -11.8 — — — —Net exports (1) 109.9 155.7 171.7 132.5 118.9 — — — —
Exports 982.3 1,179.4 1,139.5 1,054.9 921.8 -16.7 3.5 8.0 14.4Imports 872.3 1,023.7 967.8 922.5 802.9 -14.8 5.8 4.9 14.9
Gross domestic product 2,407.2 2,495.8 2,428.2 2,325.1 2,242.2 -3.5 2.8 4.4 3.7
(1) Percentage changes are not presented due to the potentially changing signs of these net positions.

STRUCTURE OF GDP — ORIGIN
Source: Statistisches Bundesamt, Fachserie 18, Reihe 1.2 — 4. Vierteljahr 2009 (February 2010), Tables 1.13 and 2.1.
Sectors of the Economy
Production Sector
The production sector of the Federal Republic grew rapidly after 1945. The main cause for this development was the transition from a state-controlled economy to a social market economy, in which state intervention is limited to furthering social welfare and creating favorable economic conditions. Following German reunification in 1990, industry in the eastern Länder, i.e., the former German Democratic Republic (“GDR”), has undergone a restructuring process. Today, the German production sector is characterized by a balanced mix of small, medium and large enterprises and is almost entirely privately owned. It is geographically concentrated in the western Länder of North-Rhine Westphalia, Bavaria and Baden-Württemberg. The main segments of the production sector relate to the manufacturing of motor vehicles, machinery and equipment, electrical and optical equipment, basic metals and fabricated metal products, as well as chemicals and chemical products. In 2009, the production sector’s aggregate contribution to gross value added at current prices was 22.0% (excluding construction) and 26.6% (including construction). The production sector (excluding construction) was particularly adversely affected by the global economic and financial crisis: In 2009, real gross value added shrank by 17.2% year-on-year.
Sources: Volkswirtschaftliche Gesamtrechnungen der Länder, Reihe 1, Länderergebnisse Band 1 (March 2010), Table 2.3; Statistisches Bundesamt, Fachserie 18, Reihe 1.4 — 2009 (March 2010), Tables 2.2.1, 2.2.2 and 3.2.1.
G-12
2009 2008 2007 2006 2005 2009 2008 2007 2006 (EUR in billions) (change in %)Gross value added of all
economic sectors 2,150.7 2,239.2 2,176.6 2,097.2 2,023.9 -4.0 2.9 3.8 3.6Agriculture, forestry
and fishing 18.1 20.3 20.7 17.9 17.5 -10.9 -2.0 15.5 2.2Production sector
(excluding construction) 473.8 572.7 568.4 545.8 509.8 -17.3 0.8 4.1 7.1
Construction 98.2 95.2 88.3 82.1 80.1 3.1 7.9 7.6 2.4Trade and transport (1) 378.2 397.4 379.6 368.1 357.5 -4.8 4.7 3.1 3.0Financial, renting and
business activities 666.5 659.2 639.4 613.3 593.7 1.1 3.1 4.3 3.3Other public and private
service activities 516.0 494.5 480.3 470.0 465.3 4.4 2.9 2.2 1.0Taxes on products offset
against subsidies on products 256.5 256.6 251.6 227.9 218.3 -0.0 2.0 10.4 4.4
Gross domestic product 2,407.2 2,495.8 2,428.2 2,325.1 2,242.2 -3.5 2.8 4.4 3.7
(1) Including hotel and restaurant services as well as communication services.

The following table shows the output of the production sector in index form using 2005 as the base year for each of the years indicated.
OUTPUT IN THE PRODUCTION SECTOR (1) (2005 = 100)
Source: Deutsche Bundesbank, Monatsbericht April 2010, Table X.2.
Services Sector
As in most other industrialized countries, the services sector, which comprises trade and transport services (including hotel and restaurant services as well as communications services), financial, renting and business activities as well as other public and private service activities, has expanded rapidly in recent years and is currently the largest contributor to gross value added. In 2009, the sector’s aggregate contribution to gross value added at current prices rose significantly to 72.6% (after 62.0% in 1991). Within the services sector, the segment of financial, renting and business activities represents the largest segment in terms of contribution to total gross value added at current prices, contributing 31.0% in 2009.
Source: Statistisches Bundesamt, Fachserie 18, Reihe 1.4 — 2009 (March 2010), Table 2.2.1.
Employment and Labor
In 2009, the average unemployment rate according to the national definition was 8.2%, compared to 7.8% in 2008. Under the ILO definition, the average unemployment rate was 7.6% in 2009 compared to 7.2% in 2008. Under both definitions, the average unemployment rate in 2009 increased only moderately, despite the deep recession, from the rate in 2008, which was the lowest level of unemployment since 1992.
The relatively strong labor market in 2009 was, to a large extent, attributable to favorable rules regarding the use of short-time work that the Federal Government adopted as a part of the stimulus packages: In 2009, among other things, the maximum period of short-time work has been extended from 6 to 24 months. For applications that are filed in 2010, the maximum period has been reduced to 18 months.
The number of persons resident in Germany who were either employed or self-employed in 2009 was approximately 40.2 million, which represents a decrease of 0.1% compared to 2008.
Sources: Bundesagentur für Arbeit, Der Arbeits- und Ausbildungsmarkt in Deutschland: Dezember und das Jahr 2009, Table 9.1 (http://www.pub.arbeitsagentur.de/hst/services/statistik/000100/html/monat/200912.pdf); Statistisches Bundesamt, Fachserie 18, Reihe 1.4 — 2009 (March 2010), Table 2.1.11.; Bundesministerium für Wirtschaft und Technologie, Jahreswirtschaftsbericht 2010 (http://www.bmwi.de/BMWi/Redaktion/PDF/Publikationen/jahreswirtschaftsbericht-2010).
G-13
2009 (2) 2008 2007 2006 2005
Production sector, total 93.8 111.5 111.6 105.4 99.7Industry (3) 93.2 113.4 113.1 105.8 99.6of which:
Intermediate goods (4) 93.2 114.2 114.6 107.1 99.7 Capital goods (5) 90.8 116.8 114.9 106.0 99.6Durable goods (6) 87.6 104.0 108.4 107.3 99.7Nondurable goods (7) 100.7 104.4 105.8 101.7 99.6
Energy (8) 90.1 95.6 98.2 101.0 100.1Construction (9) 108.2 108.3 108.9 105.8 99.5
(1) Adjusted for working-day variations.
(2) Provisional figures.
(3) Manufacturing sector, unless assigned to the main grouping energy, plus mining and quarrying.
(4) Including mining and quarrying except energy-producing goods.
(5) Including manufacture of motor vehicles and components.
(6) Consumption goods that have a long-term use, such as furniture.
(7) Consumption goods that have a short-term use, such as food. Including printing and service activities related to printing.
(8) Electricity, gas, steam and hot water supply, mining and quarrying of energy-producing materials, and especially manufacture of refined petroleum products.
(9) Comprises the economic classifications “Site preparation” and “Building of complete constructions or parts thereof; civil engineering.”

The following table shows data with respect to employment and unemployment for each of the years indicated. Persons who are participating in programs such as vocational training, job creation plans or early retirement, which are designed to reduce unemployment, particularly in the eastern Länder, are not included in the unemployment rates shown below, as they are not treated as unemployed.
EMPLOYMENT AND UNEMPLOYMENT
Sources: Bundesagentur für Arbeit, Der Arbeits- und Ausbildungsmarkt in Deutschland: Dezember und das Jahr 2009, Table 9.1 (http://www.pub.arbeitsagentur.de/hst/services/statistik/000100/html/monat/200912.pdf); Statistisches Bundesamt, Fachserie 18, Reihe 1.2 — 4. Vierteljahr 2009 (February 2010), Table 1.10.
Beginning in 1989, the increase in the number of immigrants of German descent from Eastern Europe and of Germans from the former GDR resulted in an accelerated growth of the workforce and contributed, in part, to a subsequent increase in the number of registered unemployed persons. As a result of the fundamental restructuring of the eastern German economy following reunification, a significant number of employees in the eastern Länder lost their jobs. In 2009, under the national definition, the unemployment rate in the eastern Länder was 13.0%, compared to an unemployment rate of 6.9% in the western Länder.
Source: Bundesagentur für Arbeit, Der Arbeits- und Ausbildungsmarkt in Deutschland: Dezember und das Jahr 2009, Tables 9.2 and 9.3 (http://www.pub.arbeitsagentur.de/hst/services/statistik/000100/html/monat/200912.pdf).
In 2009, gross wages and salaries per employee in Germany fell by 0.4%. This decrease is the first decline in gross wages and salaries in the history of the Federal Republic. The decrease was caused mainly by the extensive use of short-time work as well as the reduction of overtime in response to the economic crisis. Unit labor costs, which take into account changes in labor productivity, grew in 2009 by 5.6% as the decline of production did not induce an equivalent reduction of employment. As a consequence, labor productivity declined substantially. The following table shows changes in the wage level per employee and unit labor costs per hour worked for each of the years indicated by reference to 2000 figures as reflected in various economic indices.
WAGE TRENDS AND LABOR COSTS
Source: Statistisches Bundesamt, Fachserie 18, Reihe 1.2 — 4. Vierteljahr 2009 (February 2010), Tables 2.17 and 2.20.
Approximately one-fifth of the German work force is organized in unions. The German Trade Union Federation (Deutscher Gewerkschaftsbund) serves as an umbrella organization for eight such unions. Each
G-14
2009 2008 2007 2006 2005
Employed (in thousands)-ILO definition 40,171 40,220 39,656 38,996 38,741Unemployed (in thousands)-ILO definition (1) 3,295 3,141 3,602 4,250 4,573Unemployment rate (in %)-ILO definition 7.6 7.2 8.3 9.8 10.6 Unemployed (in thousands)-national definition (2) 3,423 3,268 3,777 4,487 4,861Unemployment rate (in %)-national definition (3) 8.2 7.8 9.0 10.8 11.7
(1) Unemployed persons, available and seeking work.
(2) Registered unemployed persons, available and seeking work (but including persons working up to 15 hours per week). From 2005, unemployed persons include former recipients of social assistance who are able to work.
(3) As a percentage of the total work force (excluding armed forces).
2009 2008 2007 2006 2005
Gross wages and salaries per employee EUR 27,648 27,751 27,128 26,706 26,470Change from previous year in % -0.4 2.3 1.6 0.9 0.3
Unit labor costs per hour worked Index (2000=100) 107.1 101.4 99.2 99.1 100.7Change from previous year in % 5.6 2.2 0.1 -1.6 -0.8

member union typically covers employees of an entire industry, regardless of the precise type of work done by those employees (the “one union, one industry” principle). As a result, employers usually deal with only one negotiating partner on the labor side in each specific industry.
The unions and employers of each specific industry enter into collective labor agreements (Tarifverträge) without government intervention. As a practical matter, the Tarifverträge apply to all employees of a given industry, regardless of whether or not a particular employee is a member of a union, so long as the employer is a member of the relevant association of employers, which is often the case. Despite their binding character, however, there is a wide range of possibilities to deviate from these agreements. Over the past years, the number of employees in companies that are subject to labor agreements has continuously declined. Many employers in the eastern Länder are no longer members of employers’ associations, in which case wages are individually negotiated, which often results in wage levels that are lower than those provided for by the Tarifverträge.
In February 2009, amendments to the Law on Posting Workers (Arbeitnehmer-Entsendegesetz) and the Law on Minimum Working Conditions (Mindestarbeitsbedingungengesetz) were adopted by the legislature. These amendments increase the possibilities of using minimum wage rules at the industry level, whereas initiatives to introduce a national statutory minimum wage were abandoned.
Source: Bundesministerium für Arbeit und Soziales, Mindestlohn-Gesetze erhalten Zustimmung, press release of February 13, 2009 (http://www.bmas.de/coremedia/generator/31204/2009_02_13_mindestlohngesetze.html).
Social Security Legislation and Social Policy
The comprehensive system of social security legislation and services in effect in the Federal Republic includes health insurance, long-term care insurance, retirement and disability pensions, unemployment benefits, child welfare programs, care for physically and mentally handicapped persons, allowances to orphans and to single persons with dependents, and the provision of general public assistance to needy persons. The majority of the German population is covered by mandatory statutory retirement pensions and health insurance. Most of the hospitals and institutions caring for children and handicapped persons are operated by municipalities, churches and charitable institutions.
These social security programs are mainly funded through social security contributions from employers and employees, and a smaller part is funded through direct contributions by the Federal Republic, the Länder, municipalities and other public institutions. The most important part of the social security system – retirement pensions, health insurance and unemployment insurance – is funded primarily through equal contributions by employers and employees.
The Federal Republic’s statutory retirement insurance system operates on a pay-as-you-go basis, with the contributions from current employers and employees funding payments to current retired persons. Certain persons, including members of certain professions, and civil servants, may either apply for exemption or are automatically exempted from mandatory participation in the statutory retirement pension insurance system. They may instead contribute to private pension schemes or, in the case of civil servants, benefit from special pension schemes for civil servants. The Retirement Funds Act (Altersvermögensgesetz) aims to ensure the long-term viability of the statutory retirement pension insurance system by encouraging insurees to also sign up for designated privately funded or corporate pension schemes, for which certain bonus payments and tax incentives are provided, with a view to offsetting the expected decline of payments from the statutory retirement pension insurance.
Statutory health insurance coverage must be made available to all persons fulfilling the applicable eligibility criteria. Within the statutory health insurance system, insurees may choose among a large number of statutory health insurance providers that have developed historically. Persons whose gross income exceeds certain thresholds as well as civil servants, self-employed persons and members of certain professions may opt out of the statutory system and choose private health insurance coverage. Contributions to the statutory health insurance system are based solely on the insuree’s income situation and are independent of the insuree’s gender, age and medical risk. By contrast, to date, contributions towards private health insurance coverage are mainly calculated based on the insuree’s gender, age, medical risk and the desired level of coverage.
In 2009, social security revenue, as shown in the national accounts, amounted to EUR 495.5 billion, and expenditure was EUR 507.6 billion. The social security budget thus incurred a deficit of EUR 12.1 billion in 2009, the first deficit after three years (2006 to 2008) of surpluses.
Source: Statistisches Bundesamt, Fachserie 18, Reihe 1.4 – 2009 (March 2010), Table 3.4.3.7.
G-15

In light of a changing population structure, the Federal Government has already implemented structural reforms of the statutory pension system in order to safeguard the sustainability of the social security system in the long term. Among the important reforms of the previous government were the reforms of the health insurance and the statutory pension insurance.
The health insurance reform became effective on January 1, 2009. This reform aims at increasing competition within the statutory health insurance system as well as among private health insurance providers. At the heart of the reform is the “health fund” (Gesundheitsfonds). Within the statutory health insurance system, a uniform contribution rate was introduced. The health fund collects the health care contributions and distributes them – adjusted for differences in the risk structures of the insuree pools – in equal amounts per capita among the statutory health insurance providers. An insurance provider may collect additional contributions from the insurees, if necessary, or partially refund the contributions, if possible. Additionally, health insurance was made compulsory.
The reform to the statutory retirement pension insurance system consisted of legislation adopted at the end of April 2007 to raise gradually the regular retirement age by two years to the age of 67 between 2012 and 2029. This reform constitutes an important step in meeting the growing financing needs of the statutory retirement pension insurance system required by an aging German population. With this measure, the Federal Government hopes to be able to keep the rate of contribution to the system at below 20% of gross salaries in the long run. In addition, the Federal Government continues to promote private and corporate pension schemes.
Sources: Growth. Education. Unity. Coalition Agreement between CDU, CSU and FDP, page 121 (http://www.cdu.de/doc/pdfc/091215-koalitionsvertrag-2009-2013-englisch.pdf); Bundesministerium der Gesundheit, Gesundheitsfonds (http://www.bmg.bund.de/cln_110/sid_5E52F310238A1F6A6983B1911F3502FF/DE/Gesundheit/Gesundheitsfonds/gesundheitsfonds_node.html?_nnn=true); Bundesministerium für Arbeit und Soziales, Rente mit 67 (http://www.bmas.de/portal/41130/2009__12__15__rente__mit__67.html); Bundesministerium für Arbeit und Soziales, Fragen und Antworten zur Rente mit 67 (http://www.bmas.de/portal/41128/property=pdf/faqrentemit67.pdf).
International Economic Relations
International economic relations are of major importance to the German economy. In 2009, exports and imports of goods and services amounted to 40.8% and 36.2% of GDP at current prices, respectively. The Federal Republic pursues a liberal foreign trade policy aimed at dismantling tariffs and other barriers to trade.
Source: Statistisches Bundesamt, Fachserie 18, Reihe 1.4 – 2009 (March 2010), Table 2.3.13.
Because the Federal Republic’s economy depends on exports, it is particularly vulnerable to trade barriers, such as protective tariffs. The Federal Government thus supports efforts to reduce trade barriers, such as the current negotiations within the framework of the World Trade Organization under the Doha Development Agenda.
Source: Bundesministerium für Wirtschaft und Technologie, Handelspolitik EU / WTO (http://www.bmwi.de/BMWi/Navigation/Aussenwirtschaft/handelspolitik-eu-wto.html).
Balance of Payments
The Federal Republic typically achieves a surplus in the trading of goods. Traditionally, this surplus has been partially offset by deficits in other fields, such as in services, as well as by remittances by foreign employees to their home countries, the Federal Republic’s net payments to the EU and various other payments. In 2009, the current account surplus totaled EUR 119.1 billion, compared to EUR 167.0 billion in 2008. The significant decline was caused predominantly by the sharp contraction of exports resulting from the global economic and financial crisis.
Source: Deutsche Bundesbank, Monatsbericht März 2010, Table XI.2.
According to calculations by the Deutsche Bundesbank, applying a broad indicator of Germany’s price competitiveness compared to 56 trading partners based on consumer price indices, Germany’s price competitiveness has been relatively stable since 2003, fluctuating within a range of 6.3% around the average indicator value. A major part of German exports is not directly affected by the variations of the euro/U.S. dollar exchange rate as other EMU countries account for a considerable portion of German exports (43% in 2009).
G-16

However, since the introduction of the euro, the exchange rate against the U.S. dollar has shown high volatility. After appreciating by approximately 85% against the U.S. dollar between June 2001 and July 2008, the euro depreciated considerably relative to the U.S. dollar by approximately 13% between July 2008 and February 2010, breaking a long-term trend of appreciation.
Sources: Deutsche Bundesbank, Monatsbericht März 2002, Table X.11; Deutsche Bundesbank, Monatsbericht März 2010, Tables XI.3 and XI.11; Deutsche Bundesbank, Statistics, Exchange rates, gold prices, Time series YUDM10: Indicator of the German economy’s price competitiveness against 56 trading partners / based on consumer price indices (http://www.bundesbank.de/statistik/statistik_zeitreihen.en.php?func=row&open=devisen&tr=YUDM10).
The following table shows the Federal Republic’s balance of payments for each of the years indicated.
BALANCE OF PAYMENTS (BALANCES) (1)
Source: Deutsche Bundesbank, Statistisches Beiheft 3 zum Monatsbericht März 2010, Zahlungsbilanzstatistik, Tables I.1 and I.9.a.
Balance of Trade
The following tables show information relating to foreign trade of the Federal Republic for each of the years indicated.
FOREIGN TRADE OF GOODS
Source: Deutsche Bundesbank, Statistisches Beiheft 3 zum Monatsbericht März 2010, Zahlungsbilanzstatistik, Table I.1.
G-17
2009 2008 2007 2006 2005 (EUR in millions)Current account (2)
Foreign trade (3) 135,925 178,297 195,348 159,048 158,179Supplementary trade items -9,226 -12,618 -9,907 -12,888 -14,057Services (4) -9,437 -7,031 -11,603 -13,740 -25,677Factor income 33,797 42,617 43,506 44,893 24,896 Current transfers -31,991 -34,303 -32,206 -27,206 -28,712
Total current account 119,069 166,963 185,137 150,106 114,630Capital transfers and purchases/sales of intangible
non-produced assets -186 -209 110 -258 -1,369 Capital account
Total net German investment abroad (increase/capital exports—negative figure) 4,951 -233,154 -687,629 -470,072 -399,493
Total net foreign investment in Germany (increase/capital imports—positive figure) -142,728 34,423 468,128 295,939 269,858
Total net capital export (5) -137,777 -198,730 -219,502 -174,133 -129,635Balance of unclassifiable transactions 18,895 31,976 34,254 24,285 16,374
(1) Figures are subject to considerable uncertainty owing to changes in the method of data collection in foreign trade.
(2) Foreign trade and services are recorded on the basis of exports (f.o.b.)/imports (c.i.f.)(i.e., including the freight and insurance costs of imports).
(3) Special trade according to the official foreign trade statistics. Special trade consists principally of goods that are imported into the Federal Republic for use, consumption, adaptation or processing, as well as goods that are produced, manufactured, adapted or processed in the Federal Republic and are exported. (Source: Statistisches Bundesamt, Statistisches Jahrbuch 2008, page 469).
(4) Excluding the freight and insurance costs included in the c.i.f. import value.
(5) Including change of currency reserves.
2009 2008 2007 2006 2005 (EUR in millions)Exports of goods (f.o.b.) 802,731 984,140 965,236 893,042 786,266Imports of goods (c.i.f.) 666,806 805,842 769,887 733,994 628,087
Trade surplus 135,925 178,297 195,348 159,048 158,179
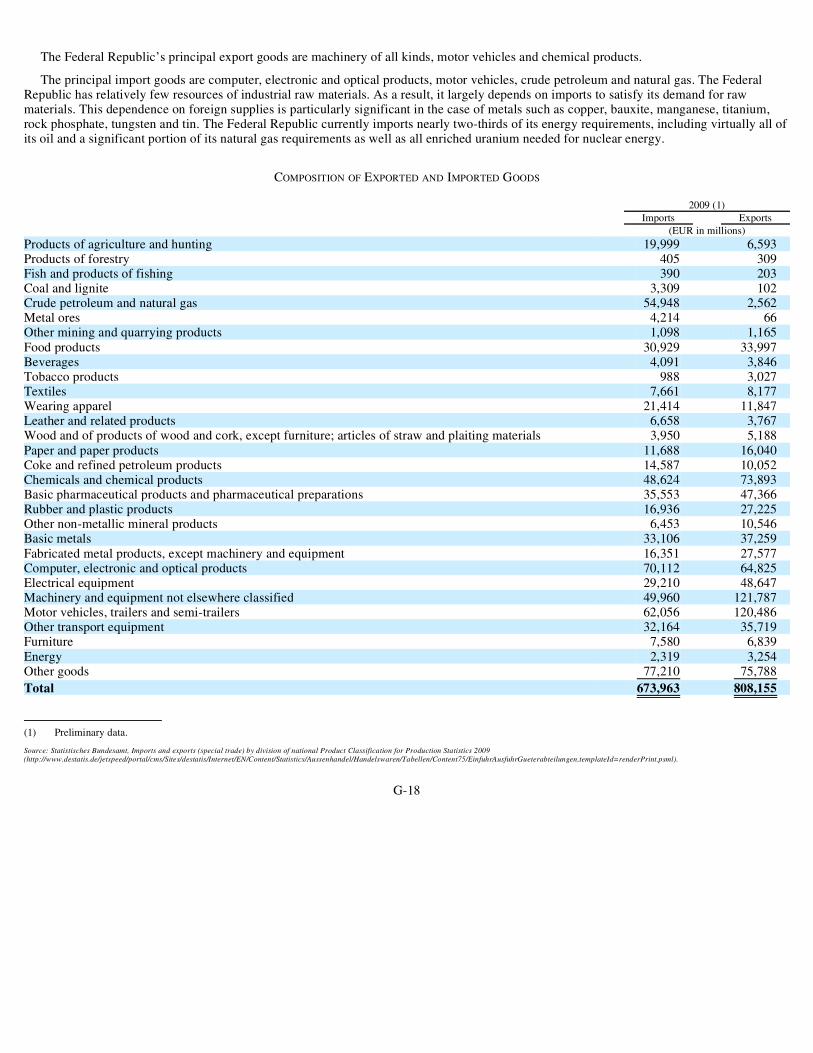
The Federal Republic’s principal export goods are machinery of all kinds, motor vehicles and chemical products.
The principal import goods are computer, electronic and optical products, motor vehicles, crude petroleum and natural gas. The Federal Republic has relatively few resources of industrial raw materials. As a result, it largely depends on imports to satisfy its demand for raw materials. This dependence on foreign supplies is particularly significant in the case of metals such as copper, bauxite, manganese, titanium, rock phosphate, tungsten and tin. The Federal Republic currently imports nearly two-thirds of its energy requirements, including virtually all of its oil and a significant portion of its natural gas requirements as well as all enriched uranium needed for nuclear energy.
COMPOSITION OF EXPORTED AND IMPORTED GOODS
Source: Statistisches Bundesamt, Imports and exports (special trade) by division of national Product Classification for Production Statistics 2009 (http://www.destatis.de/jetspeed/portal/cms/Sites/destatis/Internet/EN/Content/Statistics/Aussenhandel/Handelswaren/Tabellen/Content75/EinfuhrAusfuhrGueterabteilungen,templateId=renderPrint.psml).
G-18
2009 (1) Imports Exports (EUR in millions)Products of agriculture and hunting 19,999 6,593Products of forestry 405 309Fish and products of fishing 390 203Coal and lignite 3,309 102Crude petroleum and natural gas 54,948 2,562Metal ores 4,214 66Other mining and quarrying products 1,098 1,165 Food products 30,929 33,997Beverages 4,091 3,846Tobacco products 988 3,027Textiles 7,661 8,177Wearing apparel 21,414 11,847Leather and related products 6,658 3,767Wood and of products of wood and cork, except furniture; articles of straw and plaiting materials 3,950 5,188 Paper and paper products 11,688 16,040Coke and refined petroleum products 14,587 10,052Chemicals and chemical products 48,624 73,893Basic pharmaceutical products and pharmaceutical preparations 35,553 47,366Rubber and plastic products 16,936 27,225Other non-metallic mineral products 6,453 10,546Basic metals 33,106 37,259 Fabricated metal products, except machinery and equipment 16,351 27,577Computer, electronic and optical products 70,112 64,825Electrical equipment 29,210 48,647Machinery and equipment not elsewhere classified 49,960 121,787Motor vehicles, trailers and semi-trailers 62,056 120,486Other transport equipment 32,164 35,719Furniture 7,580 6,839 Energy 2,319 3,254Other goods 77,210 75,788
Total 673,963 808,155
(1) Preliminary data.

FOREIGN TRADE (SPECIAL TRADE) BY GROUPS OF COUNTRIES AND COUNTRIES (1)
Source: Deutsche Bundesbank, Monatsbericht März 2010, Table XI.3.
G-19
2009 2008 2007 (EUR in millions)Exports to: Total 802,731 984,140 965,236
of which: France 81,941 93,718 91,665The Netherlands 54,142 65,799 62,948United States 53,835 71,428 73,327United Kingdom 53,156 64,175 69,760 Italy 51,050 62,015 64,499Austria 48,235 54,689 52,813Belgium/Luxembourg 46,808 55,230 55,397China (3) 36,460 34,065 29,902Switzerland 35,324 39,027 36,373Spain 31,296 42,676 47,631Southeast Asia (2) 28,309 32,572 32,284 Japan 10,787 12,732 13,022
Imports from: Total 666,806 805,842 769,887
of which: The Netherlands 58,044 67,971 61,951China (3) 55,447 60,825 56,417 France 54,559 63,369 62,873United States 39,915 46,464 45,993Italy 39,684 46,842 44,694United Kingdom 33,174 41,646 41,966Belgium/Luxembourg 32,092 39,959 39,455Austria 29,084 33,180 32,091Switzerland 28,071 31,299 29,822 Southeast Asia (2) 27,756 33,152 35,357Spain 19,257 20,701 20,687Japan 18,116 23,130 24,381
(1) Exports (f.o.b.) by country of destination, imports (c.i.f.) by country of origin. Special trade consists mainly of goods that are imported into the Federal Republic for use, consumption, adaptation or processing, as well as goods that are produced, manufactured, adapted or processed in the Federal Republic and subsequently exported. (Source: Statistisches Bundesamt, Statistisches Jahrbuch 2009, page 469).
(2) Includes Brunei Darussalam, Hong Kong, Indonesia, Malaysia, Philippines, Singapore, South Korea, Taiwan and Thailand.
(3) Excludes Hong Kong.

MONETARY AND FINANCIAL SYSTEM
Background of the European System of Central Banks
The ESCB comprises the ECB and the national central banks of the 27 Member States of the EU, while the Eurosystem consists of the ECB and the national central banks of the 16 Member States that have adopted the euro as their legal currency.
The Eurosystem is responsible for the single monetary policy for the euro area. Its decision-making bodies are the Governing Council and the Executive Board of the ECB. The national central banks of the Member States that are not part of the Eurosystem are represented in the General Council of the ECB, but have no voting right in the decision-making process, particularly with respect to monetary policy. The Eurosystem’s primary objective is to maintain price stability. Without prejudice to the objective of price stability the ESCB supports the general economic policies of the EU.
The Deutsche Bundesbank – Germany’s national central bank within the ESCB – has the responsibility of implementing the single monetary policy in Germany and continues to perform various other tasks, including acting as the Federal Government’s fiscal agent and playing an important role in banking and financial market supervision, as further described below under the caption “—Financial System.”
Sources: European Central Bank, Annual Report 2004, pages 162-168; European Central Bank, Slovakia joins the Euro area, press release of January 1, 2009 (http://www.ecb.int/press/pr/date/2009/html/pr090101.en.html); Deutsche Bundesbank, Tasks and organisation (http://www.bundesbank.de/aufgaben/aufgaben.en.php).
Monetary Policy Instruments of the ESCB
To achieve its operational goals, the ESCB conducts open market operations, offers standing facilities and requires credit institutions to maintain minimum reserves in accounts with the ESCB. Open market operations play an important role in the ESCB’s monetary policy for the purposes of steering interest rates and managing the liquidity situation in the market. Available open market operations are reverse transactions, outright transactions, the issuance of debt certificates or foreign exchange swaps, and the collection of fixed-term deposits. Standing facilities are designed to provide or absorb overnight liquidity and the imposition of minimum reserve requirements allows the ESCB to stabilize money market interest rates, create (or enlarge) a structural liquidity shortage and possibly contribute to the control of monetary expansion. While its overall monetary policy instruments remained unchanged, the ESCB changed its liquidity framework quite substantially in response to the global economic and financial crisis. For further information on these changes, see “—Policy Response to the Global Economic and Financial Crisis.”
Source: European Central Bank, Implementation of Monetary Policy in the Euro Area, September 2006, pages 7-9 (http://www.ecb.int/pub/pdf/other/gendoc2006en.pdf).
Monetary Policy Strategy and Prices
The ECB’s primary goal is to maintain medium-term price stability, which is defined as a year-on-year increase in the Harmonized Index of Consumer Prices for the euro area of less than 2%. However, the ECB has clarified that, within this definition, it aims at an inflation rate close to 2%. This goal indicates the commitment to provide an adequate margin to avoid the risk of deflation. The stability-oriented monetary policy strategy of the Eurosystem used by the ECB to achieve this goal is based on two pillars: (1) analysis and assessment of short- to medium-term risks to price stability (economic analysis); and (2) assessment of medium- to long-term monetary developments (monetary analysis).
Sources: European Central Bank, Monthly Bulletin, January 1999, pages 45-50; European Central Bank, The Monetary Policy of the ECB, 2004, page 50ff. (http://www.ecb.int/pub/pdf/other/monetarypolicy2004en.pdf).
The following table shows price trends in Germany for the periods indicated.
G-20

PRICE TRENDS
Sources: Statistisches Bundesamt, Consumer Prices, Harmonized consumer price index (2005=100) – % change on the previous year, last update January 14, 2010 (http://www.destatis.de/jetspeed/portal/cms/Sites/destatis/Internet/EN/Content/Statistics/TimeSeries/EconomicIndicators/BasicData/Content50/vpi120j.psml); Statistisches Bundesamt, Consumer Prices, Consumer price index for Germany (2005=100) – % change on the previous year, last update March 10, 2009 (http://www.destatis.de/jetspeed/portal/cms/Sites/destatis/Internet/EN/Content/Statistics/TimeSeries/EconomicIndicators/BasicData/Content100/vpi101j,templateId=renderPrint.psml); Deutsche Bundesbank, Monatsbericht Februar 2010, Table X.7.
Official Foreign Exchange Reserves
The following table shows the breakdown of the Federal Republic’s official foreign exchange reserves as of the end of the years indicated.
OFFICIAL FOREIGN EXCHANGE RESERVES OF THE FEDERAL REPUBLIC (1)
Source: Deutsche Bundesbank, Monatsbericht Februar 2010, Table XI.9.
The Federal Republic’s foreign reserve assets are managed by the Deutsche Bundesbank. The 16 Member States participating in the EMU have transferred foreign reserve assets in an aggregate amount equivalent to approximately EUR 40.2 billion to the ECB, consisting of foreign currency reserves and gold. The ECB manages the foreign reserve assets transferred to it. The foreign reserve assets not transferred to the ECB continue to be held and managed by the national central banks of the 16 participating Member States. In order to ensure consistency within the single monetary and foreign exchange policies of the EMU, the ECB monitors and coordinates market transactions conducted with those assets.
Sources: European Central Bank, Annual Report 1998, page 74 (http://www.ecb.int/pub/pdf/annrep/ar1998en.pdf); European Central Bank, Annual Report 2009, page 215 (http://www.ecb.de/pub/pdf/annrep/ar2009en.pdf).
External Positions of Banks
The following table shows the external assets and liabilities of the Deutsche Bundesbank and the banks (monetary financial institutions) of the Federal Republic as of the end of each of the years indicated.
G-21
2009 2008 2007 2006 2005 (change from previous year in %)Harmonized Index of Consumer Prices (HICP) 0.2 2.8 2.3 1.8 1.9Consumer price index (CPI) 0.4 2.6 2.3 1.6 1.5Index of producer prices of industrial products sold on
the domestic market (1) -4.2 5.5 1.3 5.4 4.4
(1) Excluding value-added tax.
As of December 31 2009 2008 2007 2006 2005 (EUR in millions)Gold 83,939 68,194 62,433 53,114 47,924Foreign currency balances 25,977 27,705 27,694 28,640 33,708IMF
Reserve position and special drawing rights 15,626 3,285 2,418 3,011 4,549
Total 125,541 99,185 92,545 84,765 86,181
(1) External position of the Deutsche Bundesbank in the EMU. Assets and liabilities vis-à-vis all EMU member countries and non-EMU member countries.

EXTERNAL FINANCIAL ASSETS AND LIABILITIES BY SECTOR
Source: Deutsche Bundesbank, Monatsbericht Februar 2010, Tables IV.4 and XI.9.
Foreign Exchange Rates and Controls
The euro is a freely convertible currency. Since its introduction, the euro has become the second most widely used currency internationally. Currency transactions do not require licenses or other permissions. Capital market transactions are not subject to any license or similar requirements. Gold may be imported and exported freely, subject only to the levy of VAT on some transactions.
The following table shows the annual average exchange rates for selected currencies in relation to the euro for the past five years.
ANNUAL AVERAGE EXCHANGE RATES OF THE EURO (1)
Source: Deutsche Bundesbank, Monthly Report February 2010, Table XI.11.
Financial System
As of January 31, 2010, 1,938 monetary financial institutions in Germany reported an aggregate balance sheet total of EUR 7,525.5 billion to the Deutsche Bundesbank. According to the Deutsche Bundesbank’s classification, these institutions included 277 commercial banks (with an aggregate balance sheet total of EUR 2,223.9 billion), 431 savings banks (with an aggregate balance sheet total of EUR 1,064.9 billion) and their ten regional institutions (including nine Landesbanken and Deka-Bank Deutsche Girozentrale, the central asset managing institution of the German savings banks and Landesbanken, with an aggregate balance sheet total of EUR 1,449.8 billion), 18 special-purpose credit institutions (including KfW, KfW IPEX-Bank and promotional banks of the federal states with an aggregate balance sheet total of EUR 886.3 billion), 1,157 credit cooperatives (with an aggregate balance sheet total of EUR 688.9 billion) and their two central institutions (with an aggregate balance sheet total of EUR 253.5 billion), 18 mortgage banks (with an aggregate balance sheet total of EUR 763.3 billion) and 25 building and loan associations (with an aggregate balance sheet total of EUR 194.8 billion). Also included in this classification are the 147 subsidiaries and branches of foreign banks located in the Federal Republic, with an aggregate balance sheet total of EUR 812.4 billion.
The Deutsche Bundesbank also publishes separate data for the four German “big banks” (Großbanken) as a subcategory of commercial banks that operate nationwide. As of January 31, 2010, these four big banks reported an aggregate balance sheet total of EUR 1,308.9 billion. In early 2009, two major transactions within the German financial sector were finalized, in which four of the formerly five big banks participated. On January 12, 2009, Commerzbank AG (“Commerzbank”), Germany’s second largest bank in terms of total assets, announced that it had completed a 100% takeover of Dresdner Bank AG. On February 25, 2009, Deutsche Bank AG, Germany’s largest bank in terms of total assets, announced that it had acquired a stake of
G-22
2009 2008 2007 2006 2005 (EUR in billions)Deutsche Bundesbank
Assets 323.3 230.8 179.5 104.4 130.3Liabilities 9.1 30.2 16.0 4.8 6.3
Net position 314.2 200.6 163.5 99.6 124.0 Banks
Loans to foreign banks 1,277.4 1,446.6 1,433.5 1,266.9 1,038.8Loans to foreign non-banks 815.7 908.4 908.3 777.0 712.0Loans from foreign banks 652.6 703.3 738.9 689.7 651.7Loans from foreign non-banks 216.3 286.1 303.1 310.1 316.4
2009 2008 2007 2006 2005
U.S. dollars per euro 1.3948 1.4708 1.3705 1.2556 1.2441Pound sterling per euro 0.89094 0.79628 0.68434 0.68173 0.68380 Japanese yen per euro 130.34 152.45 161.25 146.02 136.85Swiss franc per euro 1.5100 1.5874 1.6427 1.5729 1.5483
(1) Calculated from daily values.

25% plus one share in Deutsche Postbank AG, which provides it with a blocking minority for certain material corporate decisions.
Sources: Deutsche Bundesbank, Monatsbericht März 2010, Table IV.2; Deutsche Bundesbank, Statistik der Banken und sonstigen Finanzinstitute, Richtlinien und Kundensystematik, Januar 2010, Statistische Sonderveröffentlichung 1, pages 641, 643 and 644 (http://www.bundesbank.de/download/statistik/stat_sonder/statso1_12verzeich.pdf); Deutsche Bank AG, Deutsche Bank and Deutsche Post close Postbank transaction, press release of February 25, 2009 (http://www.deutsche-bank.de/ir/de/content/ir_informationen_2009_7277.htm); Commerzbank AG, Commerzbank: Dresdner Bank takeover closed, press release of January 12, 2009 (https://www.commerzbank.de/en/hauptnavigation/presse/archiv_/presse_mitteilungen/2009/quartal_09_01/presse_archiv_detail_09_01_5068.html).
The German Banking Act regulates all banks except for the Deutsche Bundesbank and KfW (although it may regulate subsidiaries of KfW). German commercial banking institutions operate as “universal” banks and are not restricted by law or otherwise from offering a complete range of diverse financial services.
The Financial Supervisory Authority (Bundesanstalt für Finanzdienstleistungsaufsicht, or “BaFin”) is responsible for the integrated supervision of financial services. Its primary objective is to guarantee the proper functioning, stability and integrity of the German financial system. The BaFin operates exclusively in the public interest. It seeks to ensure the ability of banks, financial services institutions and insurance companies to meet their payment obligations (solvency supervision), and it also enforces standards of professional conduct aimed at preserving investors’ trust in the financial markets (market supervision). In addition, the BaFin has an investor protection role in that it seeks to prevent unauthorized financial business from being carried out. The Deutsche Bundesbank is closely involved in the ongoing supervision of the banking sector by the BaFin. A new supervisory guideline, which clarifies the assignment of tasks between the two authorities, entered into force in February 2008. According to these guidelines, the BaFin is responsible for all supervisory measures, while most of the ongoing operational tasks in banking supervision are assigned to the Deutsche Bundesbank.
Sources: Bundesministerium der Justiz, Gesetz über das Kreditwesen (http://www.gesetze-im-internet.de/kredwg/index.html); Bundesanstalt für Finanzdienstleistungsaufsicht, BaFin, Functions (http://www.bafin.de/nn_721302/EN/BaFin/Functions/functions__node.html?__nnn=true); Deutsche Bundesbank and Bundesanstalt für Finanzdienstleistungsaufsicht, Joint press release of November 4, 2002 (http://www.bundesbank.de/download/presse/pressenotizen/2002/20021104bbk1_en.pdf); Bundesanstalt für Finanzdienstleistungsaufsicht, Aufsichtsrichtlinie – Richtlinie zur Durchführung und Qualitätssicherung der laufenden Überwachung der Kredit- und Finanzdienstleistungsinstitute durch die Deutsche Bundesbank (AufsichtsRL), February 21, 2008 (http://www.bafin.de/cln_171/nn_723146/SharedDocs/Aufsichtsrecht/DE/Richtlinien/rl__080221__aufsichtsrichtlinie.html).
In light of the recent experience gained from the global economic and financial crisis, political leaders, together with regulatory and supervisory authorities, have started a process of revising and adapting the regulatory framework of banks and other financial market participants. Proposals were made and initiatives started by the Group of Twenty (G-20), the Financial Stability Board, the Basel Committee on Banking Supervision, the European Commission and the responsible national authorities.
At the level of the European Union, these measures include, among other things, further amendments to the Capital Requirements Directive, a Regulation on Credit Rating Agencies, a proposed Directive on Alternative Investment Fund Managers, and a proposal for the installation of a new financial services supervisory infrastructure in the European Union, including the creation of a new “European Systemic Risk Council” for macro-prudential supervision and a new “European System of Financial Supervisors” for micro-prudential supervision.
At the national level, recent measures include, among other things, an amendment to the Deposit Guarantee and Investor Compensation Act (Gesetz zur Änderung des Einlagensicherungs- und Anlegerentschädigungsgesetzes und anderer Gesetze), the Strengthening of the Financial Markets and Insurance Oversight Act (Gesetz zur Stärkung der Finanzmarkt- und der Versicherungsaufsicht) that grants the BaFin a more extensive right to intervene in times of crisis and provides it with better preventative authority, a further refinement and extension of the minimum requirements for risk management by the BaFin, further requirements for sound compensation practices and a new transparency system for net short-selling positions. In addition, the government proposed a new law on compensation practices for financial institutions (Gesetz über die aufsichtsrechtlichen Anforderungen an die Vergütungssysteme von Finanzinstituten) in February 2010. Furthermore, according to the coalition agreement, the Federal Government plans to move responsibility for banking supervision in Germany from the BaFin to the Deutsche Bundesbank.
G-23

In light of the variety of initiatives and the preliminary nature of some of the proposals, the overall impact that these initiatives and proposals will have on the German financial system is still unclear. From today’s perspective, it appears as if banks in Germany and abroad will be faced with higher regulatory capital requirements, a tighter definition of regulatory capital, higher capital requirements for selected risk positions, higher liquidity standards, and higher standards for risk management and corporate governance. Furthermore, in the case of Germany, the national regulator will be vested with more regulatory competence and the financial services supervisory structure in Germany and in the European Union will be altered: in Germany in the direction of more competence for the Deutsche Bundesbank, and in the EU in the direction of more cross-border cooperation among national regulators.
Sources: European Commission, Regulatory Capital (http://ec.europa.eu/internal_market/bank/regcapital/index_en.htm); European Commission, Rating Agencies (http://ec.europa.eu/internal_market/securities/agencies/index_en.htm); European Commission, Alternative Investments (http://ec.europa.eu/internal_market/investment/alternative_investments_en.htm); European Commission, Financial Services Supervision and Committee Architecture (http://ec.europa.eu/internal_market/finances/committees/index_en.htm); Bundesregierung, Gesetzliche Neuregelungen zum 1. Juli, June 29, 2009 (http://www.bundesregierung.de/Content/DE/Artikel/ArtikelNeuregelungen/2009/2009-06-29-gesetzliche-neuregelungen-juli-2009.html#doc828918bodyText4); Bundesregierung, Aufsicht über die Finanzmärkte verbessern, July 10, 2009 (http://www.bundesregierung.de/Content/DE/Artikel/2009/03/2009-03-25-finanzmarktaufsicht.html); Bundesministerium der Finanzen, Neue Regeln für Vergütung im Finanzbereich, February 9, 2010 (http://www.bundesfinanzministerium.de/nn_67366/DE/Wirtschaft__und__Verwaltung/Geld__und__Kredit/100209-gesetzesentwurf-angemessene-nachhaltige-verguetung.html); BaFin, Neue MaRisk: BaFin setzt internationale Risikomanagement-Standards um, press release of August 14, 2009 (http://www.bafin.de/cln_188/nn_722802/SharedDocs/Mitteilungen/DE/Service/PM__2009/pm__090814__marisk__neu.html); BaFin, Neue Vergütungsregelungen: BaFin veröffentlicht Rundschreiben, press release of December 21, 2009 (http://www.bafin.de/cln_188/nn_722802/SharedDocs/Mitteilungen/DE/Service/PM__2009/pm__091221__verguetung__rs.html); BaFin, BaFin führt Transparenzsystem für Netto-Leerverkaufspositionen ein, press release of March 4, 2010 (http://www.bafin.de/cln_188/nn_722802/SharedDocs/Mitteilungen/DE/Service/PM__2010/pm__100304__leerverk__transparenz.html); Growth. Education. Unity. Coalition Agreement between CDU, CSU and FDP, page 74 (http://www.cdu.de/doc/pdfc/091215-koalitionsvertrag-2009-2013-englisch.pdf).
Securities Market
The Federal Republic’s securities market is among Europe’s largest. Trading in listed securities is not legally or otherwise confined to the stock exchanges. It is estimated, however, that most transactions in equity securities are executed through stock exchanges. By contrast, debt securities, although typically listed, are predominantly traded over-the-counter.
Highly developed secondary markets, combined with the distribution capabilities of an extensive network of financial institutions, provide the basis for the Federal Republic’s position in the world’s capital markets. Equity and debt issues are generally underwritten and distributed through banking syndicates, which typically include commercial banks as well as certain regional and specialized institutions. The official securities markets of Berlin, Dusseldorf, Frankfurt am Main, Hamburg, Hanover, Munich and Stuttgart, the futures and options exchange Eurex Deutschland and the European Energy Exchange are recognized as regulated markets of the EU according to Article 47 of Directive 2004/39/EC on Markets in Financial Instruments and comply with globally accepted regulatory standards.
The most important stock exchange in the Federal Republic is the Frankfurt Stock Exchange, operated by Deutsche Börse AG. The Frankfurt Stock Exchange had a total turnover of EUR 2,778.7 billion in 2009, accounting for 81.4% of the total turnover on German securities exchanges.
Source: Deutsche Börse, Cash Market: Monthly Statistics – February 2010, page 3 (http://deutsche-boerse.com/INTERNET/IP/ip_stats.nsf/(KIR+Monatsstatistik+Kassamarkt+E)/DEAA97BEFED13148C12576DC004D66CF/$FILE/fwb_monthly.pdf?OpenElement).
Policy Response to the Global Economic and Financial Crisis
Financial Market Stabilization Fund
In October 2008, the legislature adopted the Financial Market Stabilization Act (Finanzmarktstabilisierungsgesetz) (the “Stabilization Act”) and the Federal Government established the Financial Market Stabilization Fund (Sonderfonds Finanzmarktstabilisierung) (the “SoFFin”) provided for by the Stabilization Act. The stabilization measures extended by the SoFFin include Government guarantees of up to a total amount of EUR 400 billion as well as recapitalization measures and risk assumption for troubled assets
G-24
of up to a total amount of EUR 80 billion to stimulate bank refinancing and to ensure the availability of loans for the economy. In April 2009, the legislature adopted an amendment to the Stabilization Act (Finanzmarktstabilisierungsergänzungsgesetz). The amendment provided, among other things, for the temporary authorization of the Federal Government to nationalize financial institutions through expropriation of shareholders in return for appropriate compensation as a last resort to prevent the failure of systemically relevant financial institutions.
As of late April 2010, a number of support measures have been implemented under the Stabilization Act and its amendment, including recapitalization measures for four German financial institutions (Aareal Bank AG, Commerzbank AG, Hypo Real Estate Holding AG (“HRE”) and WestLB AG), the extension of refinancing guarantees by the SoFFin for nine German financial institutions, and the takeover of HRE, a troubled German financial institutions by the SoFFin.
In July 2009, the Further Stabilization of the Financial Market Act (Gesetz zur Fortentwicklung der Finanzmarktstabilisierung) came into effect. This law provides the legal basis for a new asset relief scheme for banks in Germany, aimed at addressing the uncertainty regarding the quality of banks’ assets, and supplements the previously adopted stabilization measures by providing for three different types of bad bank models. The first model was not used by banks and the application period to take advantage of the first model ended in January 2010. The other two models may be implemented either under German federal law or the laws of the Länder. These models allow banks to spin-off the economically sound core bank; other risk positions and non-strategic business operations are to be liquidated in separate, bank-specific liquidation sub-agencies (Abwicklungsanstalten).
In December 2009, within the framework set out by the Further Stabilization of the Financial Market Act, the first liquidation sub-agency (Abwicklungsanstalt) was established for WestLB AG, comprising a portfolio of structured securities, other risk positions and non-strategic business operations in a total amount of up to EUR 85 billion. In addition, according to a press release issued by HRE in January 2010, HRE has also applied for the establishment of a liquidation sub-agency, to which it plans to transfer a portfolio of assets in an amount of up to EUR 210 billion.
In addition to these stabilization measures of the Federal Government, some Länder undertook further stabilization measures for their Landesbanken.
Sources: Gesetz zur Umsetzung eines Maßnahmenpakets zur Stabilisierung des Finanzmarktes (Finanzmarktstabilisierungsgesetz – FMStG), October 17, 2008 (http://www.bundesfinanzministerium.de/nn_67366/DE/BMF__Startseite/Aktuelles/Aktuelle__Gesetze/Gesetze__Verordnungen/Finanzmarktstabi.html); Gesetz zur weiteren Stabilisierung des Finanzmarktes, April 7, 2009 (http://www.soffin.de/export/sites/standard/downloads/rechtsgrundlagen/FMStErgG_BGBl_8.4.2009.pdf); SoFFin Bundesanstalt für Finanzmarktstabilisierung, Stabilisierungsmaßnahmen des SoFFin, April 30, 2010 (http://www.soffin.de/de/soffin/leistungen/massnahmen-aktuell/index.html); SoFFin Bundesanstalt für Finanzmarktstabilisierung, HRE – Übertragung der Aktien der Minderheitsaktionäre nach erfolgtem Squeeze-Out, press release of October 14, 2009 (http://www.soffin.de/de/presse/pressemitteilungen/2009/20091014_pressenotiz_soffin.html); SoFFin Bundesanstalt für Finanzmarktstabilisierung, Gesetz zur Fortentwicklung der Finanzmarktstabilisierung – Kernpunkte und Einschätzung der FMSA; SoFFin Bundesanstalt für Finanzmarktstabilisierung, Inkrafttreten des Gesetzes zur Fortentwicklung der Finanzmarktstabilisierung, press release of July 22, 2009 (http://www.soffin.de/de/presse/pressemitteilungen/2009/20090722_pressenotiz_soffin.html); SoFFin Bundesanstalt für Finanzmarktstabilisierung, Bundesanstalt für Finanzmarktstabilisierung errichtet Abwicklungsanstalt der WestLB, press release of December 14, 2009 (http://www.soffin.de/de/presse/pressemitteilungen/2009/20091214_pressenotiz_soffin.html); Hypo Real Estate Holding AG, HRE submits application for a transfer of assets, press release of January 21, 2010 (http://www.hyporealestate.com/eng/pdf/1001AidA_Antrag_FINAL_e.pdf).
Policy Response by the European Central Bank
In response to the global economic and financial crisis, the ECB has provided substantial amounts of liquidity to the European financial sector. The liquidity measures have been accompanied by extensive changes in the liquidity framework of the ECB, including an expansion of assets eligible as collateral in the Eurosystem, enhanced open market operations, the provision of U.S. dollar liquidity to Eurosystem counterparties, the provision of euro liquidity to central banks outside the Eurosystem and changes in the ECB standing facility rates corridor. In addition to these liquidity measures, the ECB lowered its key interest rate from 4.25% in July 2008 to 1.00% in early May 2009 – the lowest interest rate level since the introduction of the euro in 1999. Also in early May 2009, the ECB decided to implement further measures, including the conduct of additional liquidity-providing longer-term refinancing operations, the acceptance of the European Investment Bank as an
G-25
eligible counterparty in the Eurosystem’s monetary policy operations, and the purchase of euro-denominated covered bonds issued in the euro area in a total volume of EUR 60 billion, starting in July 2010. In line with its enhanced liquidity operations, the balance sheet of the ECB grew strongly during 2008 and reached EUR 383.9 billion as of December 31, 2008. The reduction of uncertainty in financial markets during 2009 led to a lower demand for liquidity and ECB’s balance sheet shrank to EUR 138.0 billion as of December 31, 2009.
To address severe tensions that are hampering the monetary policy transmission mechanism in the euro area, the ECB decided in early May 2010 to conduct interventions in the euro area public and private debt securities markets to ensure depth and liquidity in those market segments that are dysfunctional. In order to sterilise the impact of the above interventions, the ECB will conduct specific operations to re-absorb the liquidity. The measures will not affect the monetary policy stance of the euro area.
Sources: European Central Bank, key interest rates (http://www.ecb.int/stats/monetary/rates/html/index.en.html); European Central Bank, Annual Report 2009, page 202 (http://www.ecb.de/pub/pdf/annrep/ar2009en.pdf); European Central Bank, Specific measures to address liquidity pressures in funding markets, press release of March 11, 2008 (http://www.ecb.int/press/pr/date/2008/html/pr080311.en.html); European Central Bank, Changes in tender procedure and in the standing facility corridor, press release of October 8, 2008 (http://www.ecb.int/press/pr/date/2008/html/pr081008_2.en.html); European Central Bank, Measures to further expand the collateral framework and enhance the provision of liquidity, press release of October 15, 2008 (http://www.ecb.europa.eu/press/pr/date/2008/html/pr081015.en.html); European Central Bank, Magyar Nemzeti Bank and European Central Bank cooperation to support the MNB’s Euro Liquidity Providing Instruments, press release of October 16, 2008 (http://www.ecb.int/press/pr/date/2008/html/pr081016.en.html); European Central Bank, longer-term refinancing operations, press release of May 7, 2009 (http://www.ecb.int/press/pr/date/2009/html/pr090507_2.en.html); European Central Bank, EIB becomes an eligible counterparty in the Eurosystem’s monetary policy operations, press release of May 7, 2009 (http://www.ecb.int/press/pr/date/2009/html/pr090507_1.en.html); European Central Bank, Purchase programme for covered bonds, press release of June 4, 2009 (http://www.ecb.int/press/pr/date/2009/html/pr090604_1.en.html); European Central Bank, ECB decides on measures to address severe tensions in financial markets, press release of May 10, 2010 (http://www.ecb.int/press/pr/date/2010/html/pr100510.en.html).
G-26

PUBLIC FINANCE
Receipts and Expenditures
The Federal Government, each of the Länder governments and each of the municipalities (Gemeinden) have separate budgets. The federal budget is the largest single public budget.
The fiscal year of the Federal Republic is the calendar year. The annual federal budget is passed by an act of Parliament. On the basis of a proposal prepared by the Ministry of Finance, the Federal Government introduces the Federal Budget Bill to the Parliament, generally in the fall of each year. The proposal has to pass through three Bundestag sessions, the budget committee of the Bundestag, and the Bundesrat, which deliberates the proposal twice. The final vote on the proposal is taken by the Bundestag in its third session.
In addition to the federal, Länder and municipal budgets, there are separate budgets for the social security funds and various special funds (Sondervermögen) of the federal administration that are created for specific public purposes. General government, as defined in the national accounts, comprises all these different levels of government activity.
In 2009, total consolidated general government revenue as presented in the national accounts amounted to EUR 1,066.0 billion, with tax revenue of EUR 562.9 billion and social contributions of EUR 411.1 billion.
Source: Statistisches Bundesamt, Fachserie 18, Reihe 1.4 – 2009 (March 2010), Table 3.4.3.2.
In 2009, the value added tax and the taxes on income and wealth as presented in the national accounts amounted to EUR 176.0 billion and EUR 259.6 billion, respectively. In addition to these taxes, the Federal Government, the Länder governments and the municipal authorities each levied special taxes, for example on tobacco and beer. The joint taxes are distributed among the Federal Government, the Länder governments and municipal authorities, according to a predetermined formula.
Source: Statistisches Bundesamt, Fachserie 18, Reihe 1.4 – 2009 (March 2010), Table 3.4.3.20.
Consolidated general government expenditure in 2009, as presented in the national accounts, amounted to a total of EUR 1,145.3 billion. The most significant consolidated general government expenditures were monetary social benefits (EUR 444.0 billion), social benefits in kind (EUR 196.8 billion) and employee compensation (EUR 177.0 billion). Other significant consolidated general government expenditure included intermediate consumption (EUR 113.9 billion), interest on public debt (EUR 63.5 billion), and gross capital formation (EUR 40.1 billion).
Source: Statistisches Bundesamt, Fachserie 18, Reihe 1.4 – 2009 (March 2010), Table 3.4.3.2.
GENERAL GOVERNMENT ACCOUNTS (1)
Source: Statistisches Bundesamt, Fachserie 18, Reihe 1.4 – 2009 (March 2010), Tables 3.4.3.2, 3.4.3.3 and 3.4.3.7.
G-27
2009 2008 2007 2006 2005 (EUR in billions)Federal Government, Länder governments and
municipalities Revenue 679.5 708.1 686.6 638.9 603.8of which: Taxes (2) 562.9 592.6 576.3 530.6 493.2Expenditure 746.8 715.2 692.8 681.9 674.1
Balance -67.2 -7.2 -6.2 -43.1 -70.3 Social security funds
Revenue 495.5 487.0 477.5 471.9 466.9Expenditure 507.6 478.8 466.6 466.9 470.8
Balance -12.1 8.2 10.9 5.0 -3.9 General Government
Revenue 1,066.0 1,091.8 1,065.3 1,016.4 976.1Expenditure 1,145.3 1,090.8 1,060.7 1,054.5 1,050.3
Balance -79.3 1.0 4.7 -38.1 -74.2
(1) Definition according to the national accounts.
(2) Excluding capital taxes and taxes of domestic sectors to EU.
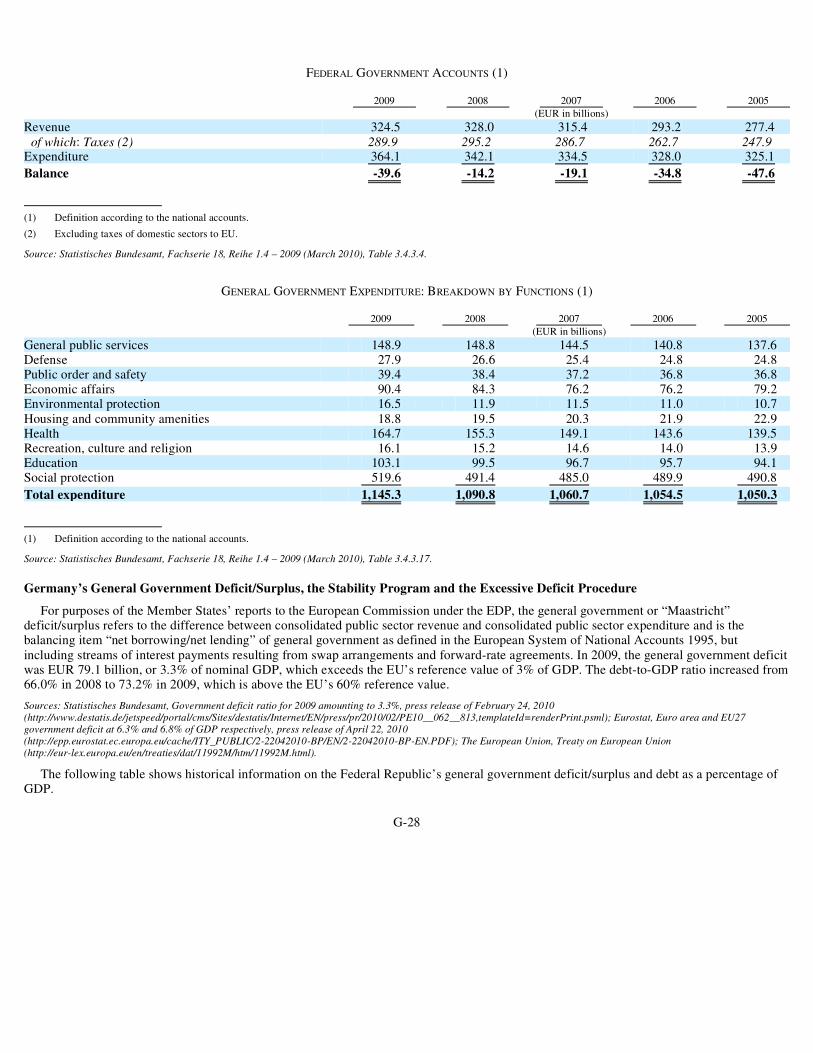
FEDERAL GOVERNMENT ACCOUNTS (1)
Source: Statistisches Bundesamt, Fachserie 18, Reihe 1.4 – 2009 (March 2010), Table 3.4.3.4.
GENERAL GOVERNMENT EXPENDITURE: BREAKDOWN BY FUNCTIONS (1)
Source: Statistisches Bundesamt, Fachserie 18, Reihe 1.4 – 2009 (March 2010), Table 3.4.3.17.
Germany’s General Government Deficit/Surplus, the Stability Program and the Excessive Deficit Procedure
For purposes of the Member States’ reports to the European Commission under the EDP, the general government or “Maastricht” deficit/surplus refers to the difference between consolidated public sector revenue and consolidated public sector expenditure and is the balancing item “net borrowing/net lending” of general government as defined in the European System of National Accounts 1995, but including streams of interest payments resulting from swap arrangements and forward-rate agreements. In 2009, the general government deficit was EUR 79.1 billion, or 3.3% of nominal GDP, which exceeds the EU’s reference value of 3% of GDP. The debt-to-GDP ratio increased from 66.0% in 2008 to 73.2% in 2009, which is above the EU’s 60% reference value.
Sources: Statistisches Bundesamt, Government deficit ratio for 2009 amounting to 3.3%, press release of February 24, 2010 (http://www.destatis.de/jetspeed/portal/cms/Sites/destatis/Internet/EN/press/pr/2010/02/PE10__062__813,templateId=renderPrint.psml); Eurostat, Euro area and EU27 government deficit at 6.3% and 6.8% of GDP respectively, press release of April 22, 2010 (http://epp.eurostat.ec.europa.eu/cache/ITY_PUBLIC/2-22042010-BP/EN/2-22042010-BP-EN.PDF); The European Union, Treaty on European Union (http://eur-lex.europa.eu/en/treaties/dat/11992M/htm/11992M.html).
The following table shows historical information on the Federal Republic’s general government deficit/surplus and debt as a percentage of GDP.
G-28
2009 2008 2007 2006 2005 (EUR in billions)Revenue 324.5 328.0 315.4 293.2 277.4
of which: Taxes (2) 289.9 295.2 286.7 262.7 247.9Expenditure 364.1 342.1 334.5 328.0 325.1
Balance -39.6 -14.2 -19.1 -34.8 -47.6
(1) Definition according to the national accounts.
(2) Excluding taxes of domestic sectors to EU.
2009 2008 2007 2006 2005 (EUR in billions)General public services 148.9 148.8 144.5 140.8 137.6Defense 27.9 26.6 25.4 24.8 24.8Public order and safety 39.4 38.4 37.2 36.8 36.8Economic affairs 90.4 84.3 76.2 76.2 79.2Environmental protection 16.5 11.9 11.5 11.0 10.7 Housing and community amenities 18.8 19.5 20.3 21.9 22.9Health 164.7 155.3 149.1 143.6 139.5Recreation, culture and religion 16.1 15.2 14.6 14.0 13.9Education 103.1 99.5 96.7 95.7 94.1Social protection 519.6 491.4 485.0 489.9 490.8
Total expenditure 1,145.3 1,090.8 1,060.7 1,054.5 1,050.3
(1) Definition according to the national accounts.

THE FEDERAL REPUBLIC’S FISCAL MAASTRICHT CRITERIA
Sources: Deutsche Bundesbank, Monatsbericht April 2010, Table IX.1; Eurostat, Euro area and EU27 government deficit at 6.3% and 6.8% of GDP respectively, press release of April 22, 2010 (http://epp.eurostat.ec.europa.eu/cache/ITY_PUBLIC/2-22042010-BP/EN/2-22042010-BP-EN.PDF).
In 2009, economic development of the Federal Republic was characterized by the stabilization of the global financial markets accompanied by a moderate economic upswing since the second quarter. Nevertheless, the severe economic slump in the last quarter of 2008 and the first quarter of 2009 caused economic performance in Germany to be about 5% lower in 2009 than it was in 2008. A series of legislative measures was adopted in order to stimulate macroeconomic demand and further stabilize the financial markets. Both the financial market stabilization efforts and the stimulus measures affected the general government deficit in 2009. For more information on these measures, see “The Economy—Economic Policy—Stimulus Packages” and “Monetary and Financial System—Policy Response to the Global Economic and Financial Crisis—Financial Market Stabilization Fund”. Based on a provisional general government budget deficit of 3.7% of GDP for 2009 that was reported to the European Commission in September 2009 and on the Commission’s own November deficit forecast for Germany in 2009 of 3.4% of GDP, the Ecofin Council initiated an EDP against Germany on December 2, 2009. Having found that special circumstances caused by the global economic and financial crisis allowed for correction of the deficit in the medium term (rather than the short term), the Ecofin Council called on Germany to reduce its deficit to below the reference value of 3% of GDP by 2013.
According to the January 2010 update of the German stability program, the deficit is expected to further rise to approximately 51/2% of GDP in 2010. This deficit forecast was calculated based on a forecasted increase in real GDP of 1.4% in 2010. The continued worsening of the deficit ratio in 2010 is primarily the result of the fiscal measures aimed at stimulating the economy and boosting growth, which carry on into 2010. The Ecofin Council recommendations set 2011 as the year in which Germany should begin consolidation of the public finances. According to the January 2010 update of the German stability program, the 2011 deficit is expected to fall by about one percentage point compared to 2010 to approximately 41/2%. In 2013, the 3% reference value is expected to be achieved. On March 17, 2010, the European Commission stated in its recommendation for the opinion of the Ecofin Council that, taking into account the risks, the budgetary strategy may not be sufficient for Germany to adhere to the Maastricht Treaty reference value of 3% of GDP in 2013. Therefore, the European Commission has recommended that the Ecofin Council invites Germany, among other things, to specify the measures underlying the budgetary strategy to correct the excessive deficit.
Also according to the January 2010 update of the German stability program, the Federal Republic’s debt-to-GDP ratio is projected to increase to 761/2% of nominal GDP in 2010, to 791/2% in 2011 and to 82% in 2013. These figures would continue to exceed the EU’s reference value of 60% of nominal GDP.
Sources: Bundesministerium der Finanzen, German Stability Programme January 2010 Update (http://ec.europa.eu/economy_finance/sgp/pdf/20_scps/2009-10/01_programme/de_2010-02-09_sp_en.pdf); Council of the European Union, press release of December 2, 2009 (http://www.consilium.europa.eu/uedocs/cms_data/docs/pressdata/en/ecofin/111706.pdf); European Commission, Recommendation for a council opinion on the updated stability programme of Germany, 2009-2013, March 17, 2010 (http://ec.europa.eu/economy_finance/sgp/pdf/20_scps/2009-10/03_commission/2010-03-17_de_recommendation_for_co_en.pdf).
G-29
2009 (1) 2008 2007 2006 2005 as % of GDPGeneral government deficit (-) / surplus (+) (2) -3.3 0.0 0.2 -1.6 -3.3General government gross debt 73.2 66.0 65.0 67.6 68.0
(1) Provisional figures, partly estimated.
(2) Definition according to the reporting under the EDP: For purposes of the Member States’ reports to the European Commission under the EDP, “general government deficit/surplus” is the balancing item “net borrowing/net lending” of general government as defined in the national accounts, but including streams of interest payments resulting from swap arrangements and forward-rate agreements.

GENERAL GOVERNMENT BUDGETARY PROSPECTS (1)
Source: Bundesministerium der Finanzen, German Stability Programme January 2010 Update, Tables 9 and 10 (http://ec.europa.eu/economy_finance/sgp/pdf/20_scps/2009-10/01_programme/de_2010-02-09_sp_en.pdf).
Tax Structure
Income Tax
Significant sources of revenue for the Federal Government are the various types of income taxes. Income taxation for employees and self-employed persons is based on a progressive tax scale ranging from 14% to 45% subject to the amount of taxable income. Employees pay taxes on their income from employment in the form of wage taxes. Self-employed persons typically pay estimated taxes during the year before filing their annual income tax return. Income generated by partnerships is not subject to tax at the partnership level, but at the level of the partners. The partners pay tax on this income according to their individual income tax brackets.
Income generated by corporations is subject to corporate income tax (Körperschaftsteuer) at a flat rate of 15%.
Capital income received by domestic taxpayers (all types of income from capital as well as private shareholders’ net gains from sales of shares in corporations) is subject to a final uniform tax rate of 25% (Abgeltungssteuer), taking into consideration an allowance (Sparerfreibetrag) of EUR 801 (EUR 1,602 for married couples).
In addition to the various types of income tax, a solidarity surcharge of 5.5% is imposed on the applicable income tax liability.
Sources: Bundesministerium der Justiz, Einkommensteuergesetz (http://bundesrecht.juris.de/estg/index.html); Bundesministerium der Justiz, Section 39b, Einkommensteuergesetz (http://bundesrecht.juris.de/estg/__39b.html) Bundesministerium der Justiz, Section 43a, Einkommensteuergesetz (http://bundesrecht.juris.de/estg/__43a.html); Bundesministerium der Justiz, Section 20, Einkommensteuergesetz (http://bundesrecht.juris.de/estg/__20.html); Bundesministerium der Justiz, Section 32a, Einkommensteuergesetz (http://bundesrecht.juris.de/estg/__32a.html); Bundesministerium der Justiz, Section 4, Solidaritätszuschlaggesetz (http://bundesrecht.juris.de/solzg_1995/__4.html); Bundesministerium der Justiz, Körperschaftsteuergesetz (http://bundesrecht.juris.de/kstg_1977/index.html); Bundesministerium der Justiz, Section 23, Körperschaftsteuergesetz (http://bundesrecht.juris.de/kstg_1977/__23.html).
G-30
2013 2012 2011 2010 2009 (% of GDP)Revenue 42 42 42 421/2 44.4
Taxes 221/2 22 22 221/2 23.5Social contributions 161/2 161/2 161/2 17 17.1Other 3 31/2 31/2 31/2 3.8
Expenditure 45 46 47 48 47.6Intermediate consumption, social transfers in kind,
compensation of employees, other taxes on production 191/2 20 20 201/2 20.2 Social transfers other than in kind 17 171/2 18 181/2 18.5Interest expenditure 3 3 21/2 21/2 2.7Subsidies 11/2 11/2 11/2 11/2 1.4Gross fixed capital formation 11/2 11/2 11/2 2 1.7Other 21/2 3 3 3 3.2
General government deficit (-) / surplus (+) -3 -31/2 -41/2 -51/2 -3.2Federal government -11/2 -2 -21/2 -31/2 -1.7Länder governments and municipalities -11/2 -11/2 -2 -2 -1.0Social security funds -0 -0 -0 -0 -0.5
General government gross debt 82 81 791/2 761/2 721/2
(1) Definition according to the reporting under the EDP: for purposes of the Member States’ reports to the European Commission under the EDP, “general government deficit/surplus” is the balancing item “net borrowing/net lending” of general government as defined in the national accounts, but including streams of interest payments resulting from swap arrangements and forward-rate agreements. Accordingly, interest included in the figures set forth in the table above reflects these streams.

Value-Added Tax and Consumption Taxes
Value-added tax (“VAT”) serves also as a significant source of revenue. VAT is a general consumption tax that is imposed on the value of most goods and services. The standard rate applicable to most goods and services is 19%. Certain items that are classified as basic necessities, such as food (except beverages and all turnovers in restaurants) and books, are subject to a reduced rate of 7%.
In addition to the VAT, there are some specific consumption taxes. The most significant specific consumption taxes relate to energy and tobacco.
Sources: Bundesministerium der Justiz, Umsatzsteuergesetz (http://bundesrecht.juris.de/ustg_1980/index.html); Bundesministerium der Justiz, Umsatzsteuergesetz, Section 12 (http://bundesrecht.juris.de/ustg_1980/__12.html); Bundesministerium der Justiz, Energiesteuergesetz (http://bundesrecht.juris.de/energiestg/); Bundesministerium der Finanzen, Glossar, Tabaksteuer (http://www.bundesfinanzministerium.de/nn_53848/DE/BMF__Startseite/Service/Glossar/T/001__Tabaksteuer.html?__nnn=true?__nnn=true).
Environmental Tax
The environmental tax regime aims to encourage energy conservation and to lower employers’ and employees’ contributions to the public pension system at the same time, thereby allocating the burden of taxes and contributions more equally among labor, capital and natural resources. Key points of the environmental tax regime are an electricity tax imposed on the consumption of electricity and an energy tax on mineral oil and coal. The electricity tax rate is EUR 20.50 per megawatt-hour. The rates of the energy tax are assessed in accordance with certain environmental criteria.
Sources: Bundesministerium der Justiz, Stromsteuergesetz (http://bundesrecht.juris.de/stromstg/index.html); Bundesministerium der Justiz, Stromsteuergesetz, Section 3 (http://bundesrecht.juris.de/stromstg/__3.html); Bundesministerium der Finanzen, Ökosteuer / Ökologische Steuerreform, Glossary (http://www.bundesfinanzministerium.de/nn_39840/DE/BMF__Startseite/Service/Glossar/O/001__Oekosteuer-Oekologische_20Steuerreform.html).
Trade Tax
Trade tax (Gewerbesteuer) is levied at the municipal level and is imposed on businesses and their objective earning power. The trade tax rate varies and depends on the municipality that levies the tax. Basis of assessment are the profits of a business enterprise as determined under income tax law or corporation tax law, increased or decreased by certain adjustments. The result is multiplied by the basic federal rate (Gewerbesteuermesszahl) to achieve the base amount for the trade tax (Steuermessbetrag), which is then multiplied by the municipal multiplier (Hebesatz). Beyond a required minimum level of 200% municipalities have discretion to fix the municipal tax collection rate.
Source: Bundesministerium der Justiz, Gewerbesteuergesetz (http://bundesrecht.juris.de/gewstg/index.html).
Recent and Pending Tax Reform Measures
The Citizen Relief Act Regarding Health Insurance (Bürgerentlastungsgesetz Krankenversicherung) entered into force with effect from January 1, 2010. The aim of the act is to improve the tax deductibility of contributions to health insurance and to long-term care insurance. The Growth Acceleration Act (Wachstumsbeschleunigungsgesetz), which contains a collection of measures, including an increase of the child benefit and of the tax-free child allowance, the implementation of the reduced VAT rate for accommodation services and certain changes related to the corporate income tax and the death duty, also entered into force with effect from January 1, 2010.
Furthermore, also with effect from January 1, 2010, the basic income tax allowance was further increased from EUR 7,834 to EUR 8,004 as part of the stimulus package measures to boost economic growth.
With effect from January 1, 2011, the declining balance depreciation method for movable economic assets that has been effective since January 1, 2009 will be abolished. Sources: Bundesministerium der Finanzen, Gesetz ,,Beschäftigungssicherung durch Wachstumsstärkung” (http://www.bundesfinanzministerium.de/nn_53848/DE/BMF__Startseite/Aktuelles/Aktuelle__Gesetze/Gesetze__Verordnungen/027__St__Ma_C3_9Fnahmenpaket__anl,property=publicationFile.pdf); Bundesministerium der Finanzen, Bürgerentlastungsgesetz Krankenversicherung (http://www.bundesfinanzministerium.de/nn_53848/DE/BMF__Startseite/Aktuelles/Aktuelle__Gesetze/Gesetze__Verordnungen/038__B_C3_BCrgerentlastungsG__anl,property=publicationFile.pdf); Bundesministerium der Finanzen, Gesetz zur Sicherung von Beschäftigung und Stabilität (http://www.bundesfinanzministerium.de/nn_82/DE/BMF__Startseite/Aktuelles/Aktuelle__Gesetze/Gesetze__Verordnungen/031__Konjunkturpaket__2__anl,templateId=raw,property=publicationFile.pdf); Bundesministerium der Justiz, Einkommensteuergesetz, Section 32a (http://www.gesetze-im-internet.de/estg/__32a.html); Bundesministerium der Justiz, Einkommensteuergesetz, Section 52 (http://www.gesetze-im-internet.de/estg/__52.html); Bundesministerium der Finanzen, Dauerhafte steuerliche Entlastung für alle Kranken- und Pflegeversicherte, press release of February 18, 2009 (http://www.bundesfinanzministerium.de/nn_53848/DE/Presse/Pressemitteilungen/Finanzpolitik/2009/02/20091802__PM8.html?__nnn=true); Bundesministerium der Finanzen, Wachstumsbeschleunigungsgesetz (http://www.bundesfinanzministerium.de/nn_53848/DE/BMF__Startseite/Aktuelles/Aktuelle__Gesetze/Gesetze__Verordnungen/044__a,property=publicationFile.pdf); Bundesministerium der Finanzen, Bürgerinnen und Bürger werden 2010 deutlich entlastet, press release of December 18, 2009 (http://www.bundesfinanzministerium.de/nn_53848/sid_A1163A06A9C02DF9A96F047352BE8627/DE/Presse/Pressemitteilungen/Finanzpolitik/2009/12/20091812__PM59.html?__nnn=true).
G-31

The following table provides an overview of the annual tax revenues of the general government divided by categories for each of the years indicated as presented in the national accounts.
TAXES (1)
Source: Statistisches Bundesamt, Fachserie 18, Reihe 1.4 – 2009 (March 2010), Table 3.4.3.20.
Government Participations
As of October 2009, the Federal Republic held direct participations in 90 public and private enterprises, and various special funds held participations in 19 (18 without double counting) enterprises. The aggregate nominal capital of the enterprises in which the Federal Republic or the special funds held direct participations of more than 50% amounted to EUR 18.1 billion as of December 31, 2008 compared to EUR 18.8 billions as of December 31, 2007.
Sources: Bundesministerium der Finanzen, Beteiligungsbericht 2008, page 2; Bundesministerium der Finanzen, Beteiligungsbericht 2009, pages 3 and 4.
The following table shows information on the Federal Republic’s significant direct participations (including those held through its “special funds”) as of December 31, 2008.
PARTICIPATIONS OF THE FEDERAL REPUBLIC
Source: Bundesministerium der Finanzen, Beteiligungsbericht 2009, Chapters B and E.
G-32
2009 2008 2007 2006 2005 (EUR in billions)Current taxes 562.9 592.6 576.3 530.6 493.2
Taxes on production and imports 303.2 311.4 305.5 280.5 265.6of which: Value-added tax 176.0 172.5 166.5 143.8 136.9
Current taxes on income and wealth 259.6 281.2 270.8 250.1 227.6of which: Wage tax 182.3 186.4 176.2 167.1 161.9
Assessed income tax 37.5 37.1 34.8 28.6 21.6Non-assessed taxes on earnings 24.0 32.4 27.3 21.9 17.8Corporate tax 8.8 17.8 25.0 25.0 18.9
Capital taxes 4.5 4.8 4.2 3.8 4.1
Tax revenue of general government 567.4 597.4 580.5 534.4 497.3Taxes of domestic sectors to EU 5.8 8.1 7.8 7.5 6.7
Taxes 573.2 605.5 588.3 541.9 504.0
(1) Definition according to the national accounts.
Participation of the FederalEnterprises Nominal capital of enterprise Republic (EUR in millions) (%)Significant majority participations:
Deutsche Bahn AG 2,150 100.0KfW 3,750 80.0
Significant minority participations exceeding 25%:
Flughafen München GmbH 307 26.0
Debt of the Federal Government
As of December 31, 2009, the Federal Government’s total debt, not including the debt of the Länder governments and the municipalities, amounted to EUR 1,017.7 billion, compared to EUR 941.3 billion as of December 31, 2008.
Source: Bundesministerium der Finanzen, Übersicht über den Stand der Schuld der Bundesrepublik Deutschland zum 31. Dezember 2009, Bundesanzeiger Nr. 55 of April 13, 2010, page 1316; Bundesministerium der Finanzen, Übersicht über den Stand der Schuld der Bundesrepublik Deutschland zum 31. Dezember 2008, Bundesanzeiger Nr. 26 of February 18, 2009, page 583.
The Federal Government raises funds primarily through the issuance of bonds and notes. Euro-denominated bonds and notes issued by the Federal Republic are evidenced by book entry and no certificates are issued.
In addition to its own direct debt obligations, the Federal Government had outstanding guarantees in an aggregate amount of EUR 260.0 billion as of December 31, 2008. Of this amount, EUR 101.3 billion was outstanding in the form of export credit insurance, which is handled by Euler Hermes Kreditversichtungs-AG on behalf of and for the account of the Federal Government.
Source: Bundesministerium der Finanzen, Finanzbericht 2010, Overview 4, page 359.
For more detailed information regarding the Federal Government’s debt and guarantees, see “Tables and Supplementary Information”.
For information on the Federal Government’s liability as of December 31, 2009 for capital subscriptions to various international financial organizations, see the table entitled “Tables and Supplementary Information—III. Liabilities to International Financial Organizations” below.
G-33

TABLES AND SUPPLEMENTARY INFORMATION
I. DIRECT DEBT OF THE FEDERAL GOVERNMENT
SUMMARY
Source: Bundesministerium der Finanzen, Übersicht über den Stand der Schuld der Bundesrepublik Deutschland zum 31. Dezember 2009, Bundesanzeiger Nr. 55 of April 13, 2010, page 1316.
G-34
Principal amount outstanding as of December 31, 2009 (EUR in millions)Federal Bonds 610,454Inflation-linked Securities 27,000Five-year Federal Notes 171,000Federal Treasury Notes 116,000Federal Savings Notes 9,470Treasury Discount Paper 103,542 Federal Treasury Financing Paper 867German Government Day-Bonds 2,494Further short-term debt (≤ 1 year) 1,392Borrowers’ note loans 12,807
Of which: From residents 12,590From non-residents 217
Old debt (1) 4,477Of which:
Equalization claims 4,128Other 40Repurchased debt 41,869Medium-term notes of Treuhandanstalt 51
Total 1,017,727
(1) Mainly equalization and covering claims of the Deutsche Bundesbank, other banks and insurance companies in connection with the currency reform of 1948.

DEBT TABLES
1. Federal Bonds (1)
G-35
Principal amount outstanding as of Interest Year of December 31,Title rate issue Maturity 2009 (% per annum) (EUR in millions)6% Bonds of the Federal Republic of 1986 (II) 6 1986 2016 3,750 5.625% Bonds of the Federal Republic of 1986 5.625 1986 2016 7506.25% Bonds of the Federal Republic of 1994 6.25 1994 2024 10,2506.5% Bonds of the Federal Republic of 1997 6.5 1997 2027 11,2505.625% Bonds of the Federal Republic of 1998 5.625 1998 2028 14,5004.75% Bonds of the Federal Republic of 1998 (II) 4.75 1998 2028 11,2505.375% Bonds of the Federal Republic of 1999 5.375 1999 2010 20,2506.25% Bonds of the Federal Republic of 2000 6.25 2000 2030 9,250 5.5% Bonds of the Federal Republic of 2000 5.5 2000 2031 17,0005.25% Bonds of the Federal Republic of 2000 (I) 5.25 2000 2010 20,2505.25% Bonds of the Federal Republic of 2000 (II) 5.25 2000 2011 23,2505% Bonds of the Federal Republic of 2001 5 2001 2011 24,0005% Bonds of the Federal Republic of 2002 (I) 5 2002 2012 25,0005% Bonds of the Federal Republic of 2002 (II) 5 2002 2012 27,0004.5% Bonds of the Federal Republic of 2003 4.5 2003 2013 24,000 3.75% Bonds of the Federal Republic of 2003 3.75 2003 2013 22,0004.25% Bonds of the Federal Republic of 2003 4.25 2003 2014 24,0004.75% Bonds of the Federal Republic of 2003 4.75 2003 2034 20,0004.25% Bonds of the Federal Republic of 2004 4.25 2004 2014 25,0003.75% Bonds of the Federal Republic of 2004 3.75 2004 2015 23,0004% Bonds of the Federal Republic of 2005 4 2005 2037 23,0003.25% Bonds of the Federal Republic of 2005 3.25 2005 2015 21,000 3.5% Bonds of the Federal Republic of 2005 3.5 2005 2016 23,0003.875% USD-Bonds of the Federal Republic of 2005 3.875 2005 2010 3,9684% Bonds of the Federal Republic of 2006 4 2006 2016 23,0003.75% Bonds of the Federal Republic of 2006 3.75 2006 2017 20,0004.25% Bonds of the Federal Republic of 2007 4.25 2007 2039 14,0004.25% Bonds of the Federal Republic of 2007 4.25 2007 2017 19,0004% Bonds of the Federal Republic of 2007 4 2007 2018 20,000 4.25% Bonds of the Federal Republic of 2008 4.25 2008 2018 21,0003.75% Bonds of the Federal Republic of 2008 3.75 2008 2019 24,0004.75% Bonds of the Federal Republic of 2008 4.75 2008 2040 10,0003.5% Bonds of the Federal Republic of 2009 3.5 2009 2019 24,0003.25% Bonds of the Federal Republic of 2009 3.25 2009 2020 6,0001.5% USD-Bonds of the Federal Republic of 2009 1.5 2009 2012 2,736
Total Federal Bonds 610,454
(1) Federal Bonds are evidenced by book entry, and no certificates are issued. Maturities are 10 to 30 years. No redemption prior to maturity; including principal strips.

2. Inflation-linked Securities (1)
3. Five-Year Federal Notes (1)
4. Federal Treasury Notes (1)
G-36
Principal amount outstanding as of Interest Year of December 31,Title rate issue Maturity 2009 (% per annum) (EUR in millions)1.5% Inflation-linked Bonds of the Federal Republic of 2006 1.5 2006 2016 13,0002.25% Inflation-linked Notes of the Federal Republic of 2007 2.25 2007 2013 9,000 1.75% Inflation-linked Bonds of the Federal Republic of 2009 1.75 2009 2020 5,000
Total Inflation-linked Securities 27,000
(1) Inflation-linked Securities are evidenced by book entry, and no certificates are issued. Maturities are five to ten years. No redemption prior to maturity.
Principal amount outstanding as of Interest Year of December 31,Title rate issue Maturity 2009 (% per annum) (EUR in millions)3.25% Bonds of 2005-Series 146 3.25 2005 2010 17,000 2.5% Bonds of 2005-Series 147 2.5 2005 2010 17,0003.5% Bonds of 2006-Series 148 3.5 2006 2011 19,0003.5% Bonds of 2006-Series 149 3.5 2006 2011 17,0004% Bonds of 2007 Series 150 4 2007 2012 16,0004.25% Bonds of 2007 Series 151 4.25 2007 2012 16,0003.5% Bonds of 2008 Series 152 3.5 2008 2013 17,0004% Bonds of 2008 Series 153 4 2008 2013 16,000 2.25% Bonds of 2009 Series 154 2.25 2009 2014 19,0002.5% Bonds of 2009 Series 155 2.5 2009 2014 17,000
Total Five-Year Federal Notes 171,000
(1) Five-Year Federal Notes are evidenced by book entry, and no certificates are issued. Maturities are approximately five years. No redemption prior to maturity.
Principal Amount Outstanding as of Interest Year of December 31,Title Rate Issue Maturity 2009 (% per annum) (EUR in millions)3% Notes of 2008 3 2008 2010 15,0004.75% Notes of 2008 4.75 2008 2010 15,0004% Notes of 2008 4 2008 2010 15,0002.25% Notes of 2008 2.25 2008 2010 14,0001.25% Notes of 2009 1.25 2009 2011 15,0001.5% Notes of 2009 1.5 2009 2011 15,0001.25% Notes of 2009 1.25 2009 2011 16,000 1.25% Notes of 2009 1.25 2009 2011 11,000
Total Federal Treasury Notes 116,000
(1) Federal Treasury Notes are evidenced by book-entry, and no certificates are issued. Maturities are two years. No redemption prior to maturity.

5. Federal Savings Notes (1)
G-37
Principal amount outstanding as of Interest rate Year of issue Maturity December 31, 2009 (EUR in millions)Federal Savings Notes 0.5% to 5.5% 2003 to 2009 2010 to 2016 9,470
6. Treasury Discount Paper (2) Principal amount outstanding as of Interest rate (3) Year of issue Maturity December 31, 2009 (EUR in millions)Treasury Discount Paper 0.44% to 1.39% 2009 2009 to 2011 103,542
7. Federal Treasury Financing Paper (4) Principal amount outstanding as of Interest rate (3) Year of issue Maturity December 31, 2009 (EUR in millions)Federal Treasury Financing Paper 0.5% to 4.5% 2008 to 2009 2010 to 2011 867
8. German Government Day-Bonds Principal amount outstanding as of Interest rate Year of issue Maturity December 31, 2009 (EUR in millions)
German Government Day-Bonds variable, tied
to EONIA 2008/continuous
tap none 2,494
9. Further short-term debt (≤ 1 year) Principal amount outstanding as of Interest rate Year of issue Maturity December 31, 2009 (EUR in millions) money market Further short-term debt (≤ 1 year) rates 2009 2010 1,392
10. Borrowers’ note loans (5) Principal amount outstanding as of Interest rate Year of incurrence Maturity December 31, 2009 (EUR in millions)Borrowers’ note loans (Schuldscheindarlehen) 0.67% to 7.75% 1954 to 2009 2010 to 2037 12,807
(1) Federal Savings Notes are evidenced by book entry and no certificates are issued. Maturities are six or seven years. The bonds are redeemable after one year from the issue date at the option of the holders in installments of EUR 5,113 per holder and month. The terms of the Federal Savings Notes provide for interest rates that increase during the term of the bonds. In addition, the seven-year Federal Savings Notes provide for payment of compounded interest at maturity or upon redemption prior to maturity.
(2) Treasury Discount Papers are issued at a discount and repaid at par value on the maturity date. No interest payments are made during the term of the paper. It is issued in the form of one global bearer security. Maturities range from one year to two years. No redemption is permitted prior to maturity.
(3) Reflects annual interest rate paid to the holder by way of the initial issue discount.
(4) Federal Treasury Financing Papers are issued at a discount and repaid at par value on the maturity date. No interest payments are made during the term of the paper. It is issued in the form of one global bearer security. Maturities range from one year to two years. No redemption is permitted prior to maturity.

No redemption is permitted prior to maturity.
11. Other Liabilities
Source: Bundesministerium der Finanzen, Übersicht über den Stand der Schuld der Bundesrepublik Deutschland zum 31. Dezember 2009, Bundesanzeiger Nr. 55 of April 13, 2010, page 1316.
II. GUARANTEES BY THE FEDERAL GOVERNMENT (1)
Sources: Bundesministerium der Finanzen, Finanzbericht 2009, Overview 4, page 336; Finanzbericht 2010, Overview 4, page 359.
G-38
(5) Borrowers’ note loans (Schuldscheindarlehen) are an instrument of the German capital market where the lending entity, generally an institutional investor, receives a certificate evidencing its loan to the borrower and the term of such loans. The certificate generally authorizes at least three assignments.
Principal amount outstanding as ofTitle Interest rate Year of incurrence Maturity December 31, 2009 (EUR in millions)Old debt (1) 0% to 3% Various Various 4,128Other debt (2) Various Various Various 40
(1) Includes mainly equalization and covering claims of the Deutsche Bundesbank, other banks and insurance companies in connection with the currency reform of 1948.
(2) Includes liabilities of the Federal Government to repay amounts received from the Investitionshilfeabgabe, a special duty levied on income, the proceeds of which were to be used to promote investments.
Principal amount outstanding as of December 31,Purpose of Guarantees 2007 2008 (EUR in millions)Export finance loans (including rescheduled loans)(2) 96,667 101,278Untied loans; direct foreign investments by German companies;
Loans of the European Investment Bank to non-EU borrowers 26,114 25,144 Loans in connection with EU agricultural policy measures 7,500 7,500Loans to domestic corporations and for projects in areas of Agriculture, fishing and housing
construction 44,663 79,644Contributions to international financing institutions 40,256 40,256Co-financing of bilateral projects of German financial co-operation 1,052 1,159Successor agencies to Treuhandanstalt 1,239 1,009Interest compensation guarantees 0 4,000
Total guarantees 217,491 259,990
(1) Does not include guarantees under the KfW Law with respect to money borrowed, bonds issued and derivative transactions entered into by KfW. For information relating to KfW’s borrowings, see “KfW—Business—Financial Markets—Funding.”
(2) Includes export finance loans extended by KfW IPEX-Bank guaranteed by the Federal Republic through Euler Hermes Kreditversicherungs-AG (“HERMES”), the official German export credit insurer. For information relating to loans extended by KfW IPEX-Bank benefiting from HERMES coverage, see “KfW—Business—Export and Project Finance (KfW IPEX-Bank)—Business.”

III. LIABILITIES TO INTERNATIONAL FINANCIAL ORGANIZATIONS
The Federal Republic is obligated to contribute to the capital subscriptions and, in some cases, to the additional financing requirements of certain international organizations in which it participates. Such contributions are in many cases stated initially in 1944 U.S. dollars. One 1944 U.S. dollar is equivalent to one Special Drawing Right (“SDR”), a unit of value established by an amendment in July 1969 to the Articles of Agreement of the IMF. From July 1, 1974 to December 31, 1980, the exchange rate between world currencies and the SDR was determined on the basis of a basket of 16 currencies, including the U.S. dollar, which accounted for approximately one-third of the value of the basket. From 1981 to 2000, the exchange rate between world currencies and the SDR was determined on the basis of a basket of five currencies, including the U.S. dollar. The currencies that determine the value of the SDR, the proportion of each of these currencies in the basket, and the financial instruments used in determining the interest rate on the SDR, are reviewed every five years. The adoption of the euro as the common currency for the initial 11 Member States of the European Union called for a change in the composition of the SDR basket. With effect from January 1, 2001, the SDR basket consists of four currencies: U.S. dollar, euro, Japanese yen and pound sterling. The currency weight of the U.S. dollar in the SDR basket initially was 45%, changing on a daily basis as a result of exchange rate fluctuations. On December 31, 2009, SDR 1 equaled EUR 1.08822.
SUBSCRIPTIONS OR COMMITMENTS BY THE FEDERAL REPUBLIC TO INTERNATIONAL FINANCIAL ORGANIZATIONS
AS OF DECEMBER 31, 2009
G-39
Subscription or commitment by the Name of organization Federal Republic (1) Amount paid in (U.S.$ in millions)IMF (2) 20,392.8 20,392.8International Bank for Reconstruction and Development (IBRD) (3)(4) 8,733.9 542.9International Development Association (IDA)(3)(4) 22,015.2 22,015.2International Finance Corporation (IFC)(3)(4) 128.9 128.9European Investment Bank (EIB) (5) 54,134.9 2,706.7African Development Bank (3) 1,405.1 140,7African Development Fund (3) 2,964.7 2,755.7 Asian Development Bank (3) 2,390.9 167.4Asian Development Fund (3) 2,275.3 2,033.0Inter-American Development Bank (3) 1,913.7 82.3Inter-American Investment Corporation (3) 13.3 13.3Fund for Special Operations (3) 230.0 230.0International Fund for Agricultural Development (IFAD)(3) 404.7 365.5Caribbean Development Bank (3) 50.2 11.1 Special Development Fund of the Caribbean Development Bank (3) 85.7 71.6European Bank for Reconstruction and Development (EBRD)(3)(5) 2,454.8 643.9Council of Europe Development Bank (CEB)(3)(5) 791.9 87.4
(1) Subscriptions are in part committed in U.S. $, SDR or EUR. SDR or EUR commitments are converted to U.S. $ at year-end exchange rates, except that certain SDR commitments are converted at the fixed conversion rate of SDR 1 = U.S. $1.56769.
(2) Source: computation provided by the Ministry of Finance based on data provided by the IMF.
(3) Source: computation provided by the Ministry of Finance and the Ministry for Economic Cooperation and Development.
(4) Source: IBRD and IDA: Worldbank Annual Report 2009 (June 30, 2009); IFC: Consolidated Financial Statements 2009 (June 30, 2009). The amount does not differentiate between amount subscribed and paid-in.
(5) Source: computation provided by the Ministry of Finance based on euro exchange rate of the European Central Bank at year-end 2009 of EUR 1 per U.S. $1.44060. EIB: As of April 1, 2009 the EIB’s subscribed capital has increased from U.S. $237.4 billion to U.S. $334.8 billion.

Exhibit (e)
AUDITOR’S CONSENT
We consent to the incorporation by reference in the registration statement (No. 333-158277) on Form S-B of KfW of our report dated March 12, 2010, with respect to the consolidated financial statements of KfW as of December 31, 2009 and 2008, comprising the statements of comprehensive income, statements of financial position, statements of changes in equity, statements of cash flows and the notes to the consolidated financial statements for the years then ended, and the group management report for the year from January 1, 2009 to December 31, 2009, which appears in Exhibit (d) to the December 31, 2009 annual report on Form 18-K of KfW. /s/ KPMG AG Wirtschaftsprüfungsgesellschaft Frankfurt May 17, 2010

Exhibit (f)
CONSENT OF THE FEDERAL REPUBLIC OF GERMANY
On behalf of the Federal Republic of Germany, I hereby consent to the making of the statements with respect to the Federal Republic of Germany included in the Annual Report on Form 18-K of KfW for the year ended December 31, 2009 and to the incorporation by reference of such information in the Registration Statement under Schedule B of KfW filed with the Securities and Exchange Commission of the United States of America.
May 17, 2010 By: /s/ Elke Kallenbach
Elke Kallenbach Ministerialrätin (Head of Division)