Forging - DBS Bank
211
DBS. Living, Breathing Asia DBS GROUP HOLDINGS LTD ANNUAL REPORT 2013 in Dynamic Asia Forging
Transcript of Forging - DBS Bank

DBS. Living, Breathing Asia
DBS GROUP HOLDINGS LTDANNUAL REPORT 2013
in Dynamic Asia
Forging

DBS – previously known as the Development Bank of Singapore – has over the years played a key role in Singapore’s meteoric rise from third world to first.
Today, as a leading Asian bank with a network across 17 markets, DBS is committed to helping Asia transform. We help individuals prosper, enable business growth and expansion, and develop Asia’s capital markets.
We will continue to break new ground as we embrace the digital frontier and shape the future of banking. Our understanding of Asia, and our ability to move swiftly to seize opportunities, have enabled us to forge ahead in a dynamic Asia.
Forging
AHEADin Dynamic Asia

ANNEXURE
188 Further Information on Board of Directors
193 Further Information on Group Management Committee
195 International Banking Offices
197 Main Subsidiaries and Associated Companies
198 Awards and Accolades
Shareholders’ Information
202 Share Price
203 Financial Calendar
204 Shareholding Statistics
206 Notice of Annual General Meeting
Proxy Form
Corporate Information (Inside back cover)
CoNtENtS
GRoUp ovERvIEw
2 Highlights
4 Embracing Digital
8 How We Create Value
12 Board of Directors
14 Group Management Committee
16 Letter from the Chairman and CEO
20 Interview with CEO
22 Management Discussion
REpoRtS
49 Corporate Governance Report
75 Risk Management
105 Capital Management and Planning
109 Financial Statements
181 Directors’ Report
185 Statement by the Directors
186 Independent Auditor’s Report
187 Five-year Summary
1

HigHligHts
Total income rose 11% to a record
SGD 8.93 billion from higher
loan volumes and broad-based
non-interest income growth
Expense growth was contained
at 8%, resulting in a positive
income-expense jaws of 3% points.
The cost-income ratio improved
to 44% from 45% in 2012
■ Cost/income (%)■ Income-expense jaws (YoY % pt)
total income
sgD 8,927 m2012: SGD 8,064 m
+11%
Net profit
+4%Net profit before one-time items
rose 4% to a record SGD 3.50 billion
income-expense jaws
2012: -3% pt
+3% pt
sHareHolDers
Customers regulators
employees soCiety
One of first two foreign banks to be given a licence to set up sub-branch in Shanghai Free Trade Zone
sgD 3,501 m2012: SGD 3,359 m
2010 2011 2012 2013
8,927
Total income (SGD million)
2010 2011 2012 2013
Net profit (SGD million)
2,650 3,035 3,359
3,501
2013201220112010
41
43
4544
-5% -5%
-3%
3%
7,066 7,631 8,064
employee engagement
Ranked among top 10% of all companies surveyed by Gallup globally Awarded 2013 Gallup Great Workplace Award
CommitteD
sgD
50m to DBs FouNDatioNto streNgtHeN Csr eFForts
internet banking users:
2.4m 200,000
mobile banking users:
839,000 240,000
32 DBS AnnuAl RepoRt 2013 HiGHliGHTS

DriviNg greater use oF DigitisatioN to eNHaNCe eFFiCieNCy
Developments across Asia-Pacific in recent years have seen the adoption of technology to enhance
the customer experience. At DBS, our emphasis has always been on driving innovation to deliver
greater productivity and customer efficiencies. This will continue to be a strategic focus as
we entrench our position as a leading Asian bank.
In 2013, DBS pioneered the launch of a fully automated online account opening service for
companies in Singapore. With this service, the time taken to open a corporate account
has been significantly reduced.
With DBS Remit, we are the only bank in Singapore to offer same-day online transfers to banks in
India and Indonesia. DBS IDEAL™ 3.0, our enhanced regional corporate Internet banking platform,
makes online banking for our corporate customers faster and simpler.
ForgiNg aHeaD iN DyNamiC asia
The pace of change that is upon us is extremely daunting. The world
which we live, work and bank in today is continuously changing.
Consumers today are far more demanding, our ability to access
information and make choices have changed dramatically, and new
technologies are revolutionising our way of life. In a highly-wired Asia,
we have made innovation a large part of our agenda, and we
have sought to be at the forefront of the digital revolution.

makiNg tHe Customer experieNCe more iNteraCtive
At DBS, we are committed to putting the customer at the heart of the banking experience.
That includes making banking interactive and intuitive. DBS’ flagship branch at our headquarters
in Marina Bay Financial Centre was designed with the customer in mind. In the past year, we also
continued to enhance our mobile apps and wealth website so that customers can bank easily
with us while they are on the move, or in the comfort of their own homes.
Excerpt from “For the Service Edge, Think Like A Designer” published in TODAY newspaper on 19 February 2014: “ From entering its pod-like lobby at the Marina Bay Financial Centre, which looked like a cross between a five-star-hotel reception and a spaceship, I was mesmerised. Could this really be a bank?”
“ How often, particularly in a business-to-business context, and in a bank for that matter, do you walk away thinking and feeling that you have had a beyond-great customer experience? That’s service innovation – across every conceivable touchpoint and customer interaction, down to the smallest detail.”
– Natalie Turner, Founder and CEO of The Entheo Network, a leadership innovation consultancy
leveragiNg aNalytiCs aND tHe use oF Big Data
Technology has transformed the way we think about banking. As customer interaction shifts from
physical branches to the online and mobile space, banks need to develop new ways of engaging
customers. The engagement goes beyond products and services to relationships and insights.
Harnessing analytics and big data is key to building this engagement. DBS has been using voice
analytics at our customer call centre to improve customer satisfaction. Customer touchpoints such
as ATMs, which were merely output channels previously, are now a customer sensor point for us,
delivering real-time information that we can use to form a better picture of our customers and their
needs. We are tapping on IBM Watson to assist our wealth relationship managers to analyse large
volumes of data, so as to provide better quality insights to our customers.
We are also helping customers benefit from useful analysis and insights. For example, the DBS Home
Connect mobile app offers them property information and other useful data on the go.

What We DoOur aim is to become “The Asian Bank of Choice for a new Asia”. We are an Asia-centric commercial bank focused on harnessing the region’s long-term potential as the centre of economic gravity shifts eastwards to Asia. To differentiate ourselves, we have developed a unique brand of banking, Banking the Asian Way. We seek to provide a kind of banking that is joyful and trustworthy as we help to transform this region that we live in.
We are distinct from local lenders or global players. As an Asian specialist, we have the reach and sophistication to outcompete local lenders, and deep Asian insights that distinguish us from global competitors.
We seek to intermediate trade and investment flows between Asia’s three key axes of growth – Greater China, South Asia and Southeast Asia – as well as participate in Asia’s growing affluence. Our key franchises are in Singapore, Hong Kong, China, Taiwan, India and Indonesia.
In Singapore, our home market, we are a universal bank serving all customer segments, including the mass market through the DBS and POSB “People’s Bank” franchise. In other markets, we focus on three lines of business:
� Corporate/Investment banking (covering large corporations and institutional investors) � SME banking� Wealth management
We see an opportunity to leverage digital technology as a means to reach customers across Asia.
HoW We CreAte VAlue
AsiA’s three key Axes of growth
Why We Do It
Banking benefits the community when it creates long-term economic value and generates profits in a responsible way. We have the ability to improve lives with our products and services. A housing loan can empower individuals to build homes for their families; a business loan can create job opportunities for thousands. We recognise we have obligations to multiple stakeholders – shareholders, customers, employees, regulators and society – and strive to consistently deliver value to all of them.
Given our roots as the Development Bank of Singapore and unique position as the custodian of Singapore’s oldest and much-loved Post Office Savings Bank (now known as POSB), we believe that banking is more than just being a commercially-centred enterprise. We are committed to the philosophy of doing the right thing for our stakeholders and have embedded it in our business. Apart from creating long-term economic value, we also seek to positively benefit the communities we are present in, and deliver social value. To further our corporate social responsibility efforts, we recently established a SGD 50 million foundation to further our commitment to be a force for good.
DeliveringvAlue to multiple
stAkeholDers
Greater China
Southeast Asia
South Asia
8 DBS AnnuAl RepoRt 2013

Where We Do It
lArgest BAnk In sIngApore
� Extensive network of more than 2,300 DBS/POSB branches and self-service banking machines
� Leading market share across corporate and consumer banking, serving over 4.6 million retail customers
greAter CHInA
� Hong Kong: Anchor of our Greater China franchise with 50 branches� China: Locally incorporated in 2007, first Singapore bank to do so;
29 branches in 10 major cities today� Taiwan: Locally incorporated in 2012, first Singapore bank to do so;
43 branches today
soutH AnD soutHeAst AsIA
� India: 12 branches in 12 major cities, largest network for a Singapore bank� Indonesia: 39 branches across 11 major cities
� Japan 1 branch
�
taiwan 43 branches
� philippines 1 representative office
� Hong kong 50 branches
China 29 branches, 1 representative office � korea 1 branch �
India 12 branches �
Macau 1 branch �
Myanmar 1 representative office �
thailand 1 representative office �
Malaysia 1 branch, 1 representative office �
Indonesia 39 branches �
singapore 89 branches �
Vietnam 1 branch, 1 representative office �
As of 31 December 2013Branches include sub-branches and centres. DBS also has branches and
outlets in London, Los Angeles and Dubai. In addition, DBS Vickers has offices in
Singapore, Hong Kong, Indonesia, Thailand, UK and US.
over 250 brAnches Across AsiA
9how we creAte vAlue

How We Bank
Banking the Asian Way is how we intend to become the bank of choice for customers. It comprises:
Asian relationshipsFor us, customer centricity is not just a buzzword. We strive to embody elements of what relationships are about in Asia: a) being there for the long haul, through good times and bad, and b) recognising that relationships have swings and roundabouts, and that every transaction does not have to be profitable in its own right. At DBS, we also value relationships with staff and the community.
Asian serviceWe aim for every customer to walk away from any interaction feeling that we have been Respectful, Easy to deal with and Dependable. Our service ethos is characterised by the “humility to serve and the confidence to lead”.
Asian InsightsWe know Asia better and use our knowledge of how to do business in this region to provide unique Asian insights to support our customers’ growth. We leverage our knowledge of local markets to create Asian-specific products to address our customers’ bespoke needs.
Asian ConnectivityWe work in a collaborative manner across geographies, supporting our customers as they expand. Our one-bank approach lets us rise above individual country and business line priorities.
Asian InnovationWe understand that some global solutions do not necessarily apply to Asia. We leverage our insights to constantly innovate new ways of banking as we strive to make banking more intuitive and interactive for our customers.
10 DBS AnnuAl RepoRt 2013

How We Measure ourselves
We understand the importance of delivering sustained performance to our stakeholders and executing to our strategy. Our progress is tracked against a balanced scorecard that maps our key performance indicators and measures the value we create for various stakeholder groups, including shareholders, customers, employees, regulators and society. This allows us to monitor the progress made in execution of our strategy and accountability to each stakeholder group. Our balanced scorecard is cascaded down the organisation. It is aligned for all business units, markets and support functions and used to measure their individual performance and remuneration.
How We Bank
Banking the Asian Way is how we intend to become the bank of choice for customers. It comprises:
WHAt guIDes us InternAlly
We are committed to the highest standards of integrity, ethics and professionalism. We believe that sound and effective corporate governance is fundamental to the Group’s long-term success and sustainability. It forms the basis for responsible management, ensures rigour in the decision-making process, and guides our commitment to safeguarding stakeholders’ interests and maximising shareholder value. Our governance is in accordance with relevant provisions in the Singapore Code of Corporate Governance and related guidelines, and banking regulations issued by the Monetary Authority of Singapore. We also align ourselves with international corporate governance best practices.
To achieve effective corporate governance, we have put in place a framework that combines competent leadership, effective risk management and a values-led culture. The Group is directed by an independent Board comprising individuals with diverse skill-sets and experience. Two-thirds of the Board are former bankers and the rest are industry experts in domains ranging from consumer goods to accounting. The Board seeks to ensure that the Group is well-positioned for growth and risk, and provides direction for management by setting, reviewing and overseeing the implementation of the Group’s strategy. Effective risk management is central to all parts of our organisation. Our risk management frameworks – approved by the Board (please refer to page 78 for Section 3 of Risk Management) – sets the boundaries in which our business groups can operate and achieve their objectives in accordance with our scorecard (please refer to page 23 of Management Discussion). Our performance against these objectives determines individual benefits including remuneration and helps drive appropriate behaviours.
We also consider the impact our decisions will have on all our stakeholders and strive to strike a balance between long-term priorities and short-term objectives. Our organisational values shape the way we do business and work within the Group. We believe that what we do goes beyond banking. We value relationships and teamwork. We embrace change and innovation to challenge the status quo to provide better banking solutions. We have the courage to take responsibility for decisions and are empowered to make things happen. Finally, we aim to build an organisation where people feel good and energised about being part of an exciting workplace.
competent leadership
effective risk management
values-led culture
+
+
effective corporAte
governAnce
11how we creAte vAlue

Board of directors 1 andre sekulic 2 Piyush Gupta 3 Ho tian Yee 4 Peter seah Lim Huat5 danny teoh Leong Kay 6 ow foong Pheng 7 Nihal Vijaya devadas Kaviratne cBe 8 euleen Goh Yiu Kiang 9 Bart Joseph Broadman
For more information on directors, please refer to pages 188 to 192.
1
2
3
4
5
6
7
8
9
1312 DBS AnnuAl RepoRt 2013 Board of directors

GrouP MaNaGeMeNt coMMittee
The Group Management Committee comprises
a total of 19 members, including members
of the Group Executive Committee.
1 Piyush Gupta*, Chief Executive Officer 2 eric ang, Capital Markets 3 sanjiv Bhasin, DBS India 4 Jerry chen, DBS Taiwan 5 chng sok Hui*, Chief Financial Officer 6 domenic fuda, Consumer Banking and Wealth Management Group 7 Neil Ge, DBS China 8 david Gledhill*, Group Technology & Operations 9 sue Lynn Koo, Group Legal, Compliance & Secretariat 10 Lee Yan Hong, Group Human Resources 11 andrew Ng*, Treasury and Markets 12 Jimmy Ng, Group Audit 13 Karen Ngui, Group Strategic Marketing & Communications 14 sebastian Paredes*, DBS Hong Kong 15 elbert Pattijn*, Chief Risk Officer 16 sim s Lim*, DBS Singapore 17 tan su shan*, Consumer Banking and Wealth Management Group 18 Melvin teo, DBS Indonesia 19 Jeanette Wong*, Institutional Banking Group
Those marked by * are also in the Group Executive Committee.
For more information on the Group Management Committee members, please refer to pages 193 to 194.
1
2 3
10
11 12
4
5 6 7
8 9
13
14 15 16
17 18 19
1514 DBS AnnuAl RepoRt 2013 Group ManaGeMent coMMittee

Letter From the Chairman and Ceo
2013 was a challenging year for the global economy. Growth in the developing world slowed. The US economy continued to grind along at a tepid growth rate of 1.9%. Europe continued to be a drag, with GDP falling by 0.4%.
In China, the world’s second-largest economy, growth held steady at 7.7%, but its leadership has signalled plans to
pursue a more sustainable growth target of 7.5% per year.
Despite these external headwinds, Singapore, our home market, made a solid recovery, with growth of 4.1% compared to 1.9% the previous year. Hong Kong, our second-largest market, also fared better, with resilient private consumption more than offsetting the impact of weaker external demand
“ Our record performance in a climate of continuing
low interest rates is testament to the soundness
of our strategy.”– Chairman Peter Seah and CEO Piyush Gupta
16 DBS AnnuAl RepoRt 2013

arising from the slowdown in China. In 2013, Hong Kong’s GDP growth rose to 2.8%, from 1.5% in 2012.
Growth in India and Indonesia, two of our other key markets, slowed down with GDP growth of 4.8% and 5.8% in 2013.
Financial market activities were also hit by volatility that arose from expectations that the US would roll back its accommodative monetary policy of recent years.
earninGS and inCome at reCord hiGhS
For DBS too, the year was not without its challenges. While we started 2013 on a very solid note with strong business momentum and broad-based growth, as the year progressed, we had to grapple with periodic bouts of market volatility.
Notwithstanding this, we saw our top-line grow by 11% to SGD 8.93 billion, an all-time high. Our growth was high-quality, propelled by multiple engines, and fuelled by key businesses we have been emphasising in recent years. We also continued to move the agenda on areas such as innovation and customer experience, which will be key drivers of our future success.
During the year, we saw credit costs rise from 10 basis points to 18 basis points of loans, due principally to pressures in some portions of our India book.
Full-year earnings hit a record SGD 3.50 billion. Including one-time items, net profit was SGD 3.67 billion. Our balance sheet is healthy, with capital, liquidity and asset quality remaining strong. To reward shareholders, we have proposed raising our full-year dividends. reShaPinG oUr FranChiSe
Our record performance in a climate of continuing low interest rates is testament to the soundness of our strategy.
Since 2010, we have progressively entrenched our leadership in Singapore, repositioned Hong Kong and diversified our earnings base. We have also built leading regional customer franchises in wealth management, SME banking, transaction banking and treasury activities, all of which showed record income.
In 2013, we strengthened our wealth proposition further by being the first Singapore bank to create a “one-stop shop”, offering banking and brokerage products under one roof. We believe the holistic bank brokerage model is integral to the future of banking. With this initiative, our customers can now trade shares without the need to maintain separate relationships with us and a broking firm.
We also continued to carve a niche for ourselves as a leading player in the Asian fixed income and offshore RMB space.
Despite the property cooling measures and other business pressures, including the low interest rate environment, our Singapore franchise saw income rise to an all-time high of SGD 5.42 billion. This is significant given the maturity of the market. Excluding our regional trading book, our core Singapore franchise recorded double-digit growth in its top and bottom lines. We are deeply honoured that for the first time, DBS was ranked by Brand Finance, a leading brand consultancy, as the most valuable brand in Singapore. Our overall brand value has more than doubled in the past four years, rising from USD 1.36 billion in 2009 to USD 3.47 billion in 2013.
Hong Kong, which anchors our Greater China presence, is also a much stronger entity; our focus on the affluent segment and our ability to leverage the China connectivity continue to pay off. This helped drive 2013 income to a record SGD 1.86 billion, up 22%, outpacing the market. Full-year earnings reached SGD 851 million, an all-time high.
We also continued to strengthen our franchise in our other key markets, China, Taiwan, India and Indonesia.
For example, in China, we were one of the first two foreign banks to be given a licence to set up a sub-branch in the newly established Shanghai Free Trade Zone. This is an important milestone as we employ our insights to help clients capture new growth opportunities.
In Taiwan, we continued to strengthen our wealth management proposition, as well as our position as a leading SME partner. In 2013, we became the second-largest SME lender among foreign banks in Taiwan.
In India, we are the fourth-largest foreign bank, and will continue to build on our solid platform while being watchful of the economic cycle. We are cautiously optimistic about the prospects for expansion under the wholly-owned subsidiary framework, and are studying the conditions carefully.
In Indonesia, the agreement to acquire a majority stake in Bank Danamon lapsed 16 months following the announcement of the transaction. We remain positive about Indonesia’s prospects and are committed to the market. DBS is already widely known as one of the top three wealth management banks, and we intend to accelerate our organic growth plans in the country.
DBS’ presence in the Shanghai Free Trade Zone
17Letter From the Chairman and Ceo
In line with our focus on our core markets, we divested our remaining 9.9% stake in the Bank of the Philippine Islands for a total consideration of SGD 850 million.
Hwang-DBS (Malaysia) (HDBS), in which we hold a 27.7% stake, is in the process of selling several of its key operating businesses. We are supportive of this decision by HDBS’ Board.
As we continue to execute on strategy, the fundamental construct of the bank has changed.
Income contribution from our key growth markets of China, Taiwan, India and Indonesia has increased, accounting for 14% of Group income, up from 11% in 2009.
We have also shifted the composition of our business, and income from higher-return annuity businesses has grown substantially. For example, wealth management, transaction banking and treasury customer business today account for 58% of the Group’s non-interest income, compared to 44% in 2009.
Our achievements are being recognised. In 2013, DBS was recognised as the “Best Managed Bank in Asia-Pacific” by The Asian Banker magazine. We also continue to be named the “Safest Bank in Asia” by Global Finance magazine for the fifth straight year.
PUttinG the CUStomer at the heart oF the BanKinG eXPerienCe
At DBS, we are committed to putting the customer at the heart of the banking experience. Over the past four years, our efforts have been primarily centred on improving our service delivery by enhancing our processes. Through these efforts, more than 240 million hours of customer waiting time have been eliminated. While we continue to work on improving our processes, a key focus in 2013 was on customer journey projects. We introduced the concept of Human-Centred Design (HCD) thinking in
DBS to enhance the management, design and delivery of customer journeys.
The idea is to put ourselves in the shoes of our customers, and think through the way they would prefer to interact with us from start to finish so as to enhance the customer experience.
To this end, we also established our first Customer Journey Design Lab in DBS to foster HCD thinking and innovation. The lab is a facility where staff can spend time with coaches, who will help them design, prototype and test their customer-centred concepts before roll-out.
ShaPinG the FUtUre oF BanKinG
Recognising that new technologies have revolutionised the way people bank, we continued to innovate new ways of banking. Much progress has been made on this front.
In Singapore, we launched DBS Home Connect, an app designed to make the home-buying process easier for our customers by providing them with all the essential information they require 24 x 7 via their mobile devices. In the corporate banking
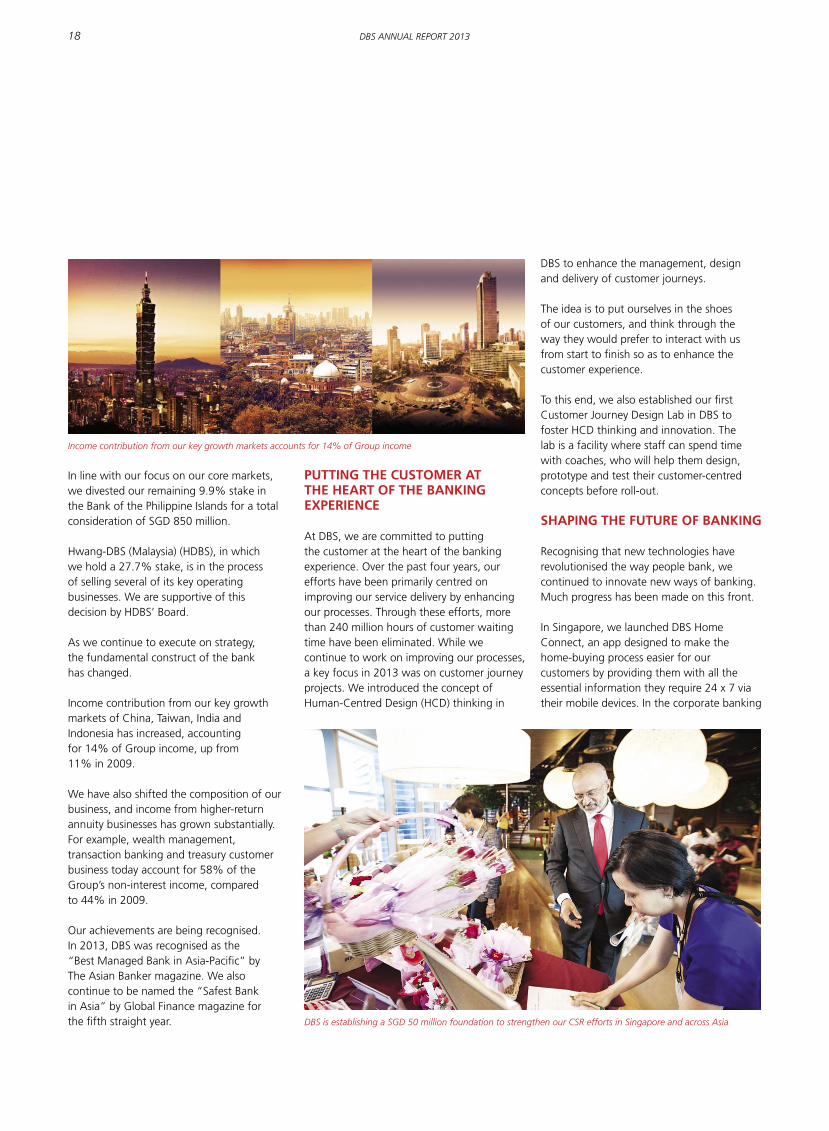
Income contribution from our key growth markets accounts for 14% of Group income
DBS is establishing a SGD 50 million foundation to strengthen our CSR efforts in Singapore and across Asia
18 DBS AnnuAl RepoRt 2013

space, we pioneered the launch of a fully automated online account opening service for companies. In 2014, we announced an agreement with IBM in which we will deploy its Watson cognitive computing innovation to deliver a next-generation customer experience. We are also collaborating with research agency A*STAR to set up a joint lab to research emerging technologies for the benefit of customers.
Our efforts to be at the forefront of banking innovation have been recognised. In 2013, our mobile banking apps strategy was ranked #1 in the world by Swiss research firm MyPrivateBanking. We were named “Most Innovative Transaction Bank in Asia-Pacific” by The Banker magazine, and “Trailblazer of the Year in Asia-Pacific” by Banking & Payments Asia.
To step up our game in the innovation space, we recently announced plans to invest SGD 200 million over the next three years to better harness digital technologies. This will enable us to access large retail banking markets and better integrate banking into our customers’ lifestyle. A new digital banking organisation has been created to spearhead this transformation.
enGaGinG emPLoYeeS and GivinG BaCK to SoCietY
DBS is committed to our employees. Over the past four years, we have invested in our people, creating a sense of purpose and pride, and a high degree of engagement. Our people are among the most engaged globally, ranking among the top 10% of all companies surveyed by Gallup, a leading management consultant. In 2013, DBS was one of just three Asian firms to win the Gallup Great Workplace Award.
We also recognise that the future of business is to be a force for good. Underlining our commitment to giving back to society in a sustained manner, in February 2014, we announced the establishment of a SGD 50 million
foundation. This initiative will strengthen our corporate social responsibility (CSR) efforts in Singapore and across Asia.
In our home market Singapore, we are privileged to play a significant role in banking the heartlands and serving every level of society. At POSB, we are “Neighbours first and Bankers second” and will continue to recognise and uphold the responsibility we have as custodian of the nation’s oldest and most loved bank. To bring value to customers, we launched the POSB HDB Loan, a first-of-its-kind Housing & Development Board (HDB) loan. This was the first floating rate programme in Singapore to provide HDB homebuyers with the security of having their interest capped below HDB concessionary rates for 10 years while benefiting from the present low interest rates.
In 2012, DBS was the first Singapore member of a pilot programme set up by the International Integrated Reporting Council (IIRC), which is focused on enhancing the way companies communicate their strategies and values to stakeholders. Our belief that we need to deliver value to all our stakeholders underlines our continued commitment to using the integrated reporting format for our annual reports. Following IIRC’s newly issued framework, we have made further enhancements to our 2013 annual report, which we believe will help our stakeholders better understand the bank’s integrated approach to doing business.
dividendS
The Board has proposed a final dividend of 30 cents per share for approval at the forthcoming annual general meeting. This compares to a final dividend of 28 cents per share in 2012, and raises the full-year payout from 56 cents per share to 58 cents per share. The increase is in line with DBS’ dividend policy of paying sustainable dividends commensurate with our capital management objectives and long-term growth prospects.
ForGinG ahead in dYnamiC aSia
Despite the slowing growth in some Asian markets, we believe that in the medium term, Asia’s structural growth prospects are intact and the region is powering its own growth.
As an Asian bank, DBS is well-placed to capture the opportunities before us. We have invested in our franchise – in our people, platform and products – and continue to be well-positioned to intermediate the growing capital and trade flows in Asia and beyond.
At the same time, as the banking landscape continues to change and customer behaviours rapidly evolve, we are well aware of the need to remain nimble and agile. We thank our customers and shareholders for their continued support. With the passion and commitment of our 19,000 colleagues around the region, we will continue to forge ahead in a dynamic Asia.
Peter Seah Lim huatChairman, DBS Group Holdings
Piyush GuptaChief Executive Officer, DBS Group Holdings
19Letter From the Chairman and Ceo

interview with Ceo
Q there are rising concerns about the macroeconomic stability of asia. what is your view on that?
a Due to the turbulence seen across Asian markets in 2013, I have increasingly heard concerns that a repeat of the 1997 Asian financial crisis is imminent. I don’t believe this is likely. Asia as a region is in a much stronger position than it was in 1997. Current accounts are mostly in surplus. Banking systems are more robust today, with better regulatory systems and buffers. There are no huge mismatches between assets and liabilities, and governments and companies hold more of their debt in local rather than foreign currency, so currency fluctuations would not cause spikes in debt-servicing costs. The region also has much higher foreign exchange reserves and established multi-lateral swap agreements to buffer outflows.
The more vulnerable countries in Asia are Indonesia and India, both of which face the challenge of dual deficits. Consequently, both countries came under some pressure in the middle of last year, with significant depreciation in their currencies. However, the markets appear to have already priced in their weaknesses. In addition, both countries took some measures that have been helpful, including tighter monetary policy.
So while the Fed is likely to continue its tapering plans in 2014, I do not see a massive sell-off in these countries this year. However, I do expect to see continued volatility as financial markets in Asia remain
relatively underdeveloped. Shallow and illiquid markets will remain vulnerable to capital outflows, leading to bouts of turbulence during the year.
At DBS, we are well-prepared for further Fed tapering. We have adequate USD liquidity buffers and have kept our securities portfolio duration short since end-2012. We are thus well-positioned to benefit from a rising interest rate environment.
Q what is your outlook on asia’s growth prospects in 2014 and beyond? Could you share your perspective, especially on China, india and indonesia? a Asia’s economies have built up strong foundations over the past decade, positioning them well to weather short-term economic volatility as they realise their long-term potential. Young populations, a ready pool of savings, improvements in education and health care, rising consumption as well as growing regional trade and investment flows have enabled Asia to grow under its own steam. In light of Asia’s growth prospects, I believe that this part of the world will remain one of the best places to operate in.
However, the region is likely to face headwinds in 2014. China has been powering growth in the region for the past decade but expansion has cooled as the leadership strives to implement market-oriented economic reforms and nurture domestic demand. This will have a dampening effect on growth in the
region in 2014. However, if conditions continue to improve in the United States and Europe, this could bolster exports from the region and mitigate the impact of slowing growth in China.
In China, we will see further bouts of volatility in liquidity as the authorities attempt to rein in the shadow banking sector. This attempt to correct financial imbalances in the system is positive over the long term, but the complexity of the shadow banking system means that there will be a need to proceed cautiously.
2014 will be an important election year for India and Indonesia. Reforms are key to unlocking the long-term potential of these two markets, and the outcome of elections this year will determine if they adopt pro-growth agendas, especially in India where the likelihood of a coalition government remains high.
At DBS, we believe in the growth potential of these economies and the importance they play in our expansion strategy. While we may calibrate our plans for short-term cycles, we are invested for the long-term in these geographies.
Q across industries, companies that are not innovating fast enough are falling by the wayside. is the digital revolution a concern for banks? a Yes, definitely. Rapidly changing technology and customer behaviours are causing a digital disruption to our industry. Increasingly, customers do not need banks but they want to do their banking on the fly, while they are going about their daily activities. We are also facing increased competition from non-banks such as Alibaba, PayPal and Square, which are
DBS CEO Piyush Gupta shares his views on the global economy
and Asia’s prospects, as well as opportunities and challenges
facing the banking industry
“ Increasingly, customers do not need banks but
they want to do their banking on the fly, while
they are going about their daily activities.”
20 DBS AnnuAl RepoRt 2013

seeing tremendous momentum in areas such as payments, investments and loans, enabled by their online and mobile platforms.
While these are threats, they also present opportunities for us. By leveraging the power of technology, we can change the rules of the game in countries where we are constrained by our brick and mortar network. As part of our ambition to build out a pan-Asian commercial bank, we are embarking on a digital initiative of our own. We recently announced plans to invest SGD 200 million over three years in digital banking. We have formed a new digital banking organisation to spearhead a transformation of DBS across the front and back end. New frontiers including advanced usage of data analytics will also be explored through strategic collaborations with partners such as IBM and A*STAR.
At the same time, we need to be mindful of cybersecurity, which has become an issue of global importance. Criminal activity today is increasingly sophisticated and prevalent, and attacks range from “phishing” for personal information, viruses and malware targeting online and mobile devices, to attacks on servers and databases. To give customers peace of mind, we need to remain ever vigilant in ensuring their protection. Achieving the balance between servicing our customers seamlessly, while keeping their information safe, will be our utmost priority.
Q what is your take on the wide swathe of regulatory changes facing the banking sector? a Five years after the global financial crisis, banks are facing a more complex regulatory environment. New rules such as Basel III and the entire regulatory edifice around central clearing of derivatives, as well as extra-territorial regulations such as Dodd Frank and FATCA, are re-shaping the global banking
industry, altering existing business models and transforming risk-return dynamics.
Financial stability is a prerequisite for effective financial intermediation, but we must remain mindful of side effects associated with remedial regulatory measures. The industry has always cautioned against the unintended consequences of regulatory reform; this tension remains with us today. In particular, it is here in Asia where we need to ensure that the right balance is struck between economic growth and regulatory change.
The banking system remains a primary source of finance in Asia, due to relatively under-developed capital markets. The capital needs of Asian banks as they seek to meet credit demand under a Basel III regime will not be trivial, and at risk are credit extensions to the life-blood of Asian economies: SMEs, trade and infrastructure. In stark contrast to the Western world, Asia needs to incentivise development of deeper bond markets and related exposure management tools. A one-size-fits-all regulatory agenda may therefore not be appropriate to serve the economic needs of Asian nations. To better preserve the growth trajectory and continued access to credit, the scope for a reasoned exercise of national discretion and a more moderate calibration in supervisory add-ons to Basel III minimum standards should be considered.
Separately, the implementation of derivatives-related reforms could be better coordinated. A unilateral, jurisdiction-specific approach introduces frictional inefficiencies, increasing transaction costs as liquidity becomes fragmented and collateral management more complex. I would also add that the heightened tendency for national regulators to ringfence capital and liquidity creates inefficiencies in the system of global finance, and needs closer scrutiny.
Q what do you think about the role of banks and where do you see it going? a Companies across all industries are increasingly expected to go beyond maximising shareholder value and deliver value to multiple stakeholders (shareholders, customers, employees, regulators and society). This requires a perceptible shift from expediency to values and from short-term profit maximisation to long-term profit sustainability. The banking industry, which plays a fundamental role in society, is increasingly under pressure to fulfil its responsibilities to the stakeholders that it serves.
At DBS, we believe that banks serve a higher purpose beyond simply being stewards of capital. We believe we should not only create shareholder value but also shared value for our customers, staff and the communities we operate in.
As the former Development Bank of Singapore, helping in the industrialisation of Singapore, we believe one of the ways in which we can be a force for good is by supporting the growth of social enterprises. We are passionate about this cause because while Asia has emerged as the global engine of growth, not everyone has had the opportunity to participate in its wealth. In Asia, as in other parts of the world, there is an ever-widening income divide. We believe social enterprises can play a role in addressing some of these ails; moreover, they resolve social issues through financially viable solutions, enabling them to sustain their efforts over the long term.
“ We believe we should not only create shareholder
value but also shared value for our customers,
staff and the communities we operate in.”
Scan here to watch a video interview with CEO Piyush Gupta
21interview with Ceo

how we measure Long-term Performance
enGaGinG mULtiPLe StaKehoLderS
Our actions are guided by a long-term perspective and the interests of our stakeholders – shareholders, customers, employees, regulators and society. To this end, we have a balanced scorecard that measures our performance against our strategy. The Group’s balanced scorecard is cascaded throughout the organisation; the performance goals of every business, market and support function are aligned to those of the Group.
manaGement diSCUSSion
reGULatorS We believe we can contribute to
the stability of the financial system
by engaging regulators and industry
bodies to shape the development
of policies. We actively participate
in forums to do so.
SoCietY Our role in society goes beyond
corporate citizenship and philanthropy.
We believe we have a much broader
social purpose – to create long-term
economic value through responsible
banking to enhance the communities
we serve.
SharehoLderS Our shareholders expect
superior and sustainable returns
commensurate with their risk
appetite, with profits earned
in a responsible manner.
emPLoYeeS People are at the heart of banking
and we are committed to being
an employer of choice.
CUStomerS To differentiate ourselves in an
industry as commoditised as
banking, we must put our customers
at the centre of all that we do. This
means anticipating our customers’
needs as well as offering better
products, a superior experience
and greater convenience.
22 DBS AnnuAl RepoRt 2013

dBS’ BaLanCed SCoreCard
The scorecard is divided into two parts of equal weighting. Specific objectives for each part are updated every year and approved by the Board. Specific key performance indicators (KPIs) are in place to track the progress made in serving the interests of shareholders, customers and employees. KPIs relating to regulators and society are embedded in our scorecard and cut across all aspects of our operations. As we operate in a regulated industry, upholding regulatory requirements is paramount and underlies all our decisions and actions.
We recognise the importance of serving society at large and are committed to giving back to the community.
The top part of the scorecard comprises KPIs set for the current year. Shareholder metrics measure the financial results achieved and include income growth, expense-related ratios and return on equity. We measure risk-related KPIs to ensure that the Group’s income growth is balanced against the level of risk taken. Control and compliance KPIs are also a focus in this section. Customer metrics measure the Group’s achievement in increasing customer wallet share and
satisfaction. Employee KPIs, such as employee engagement, training, mobility and turnover, seek to measure the progress we have made in being an employer of choice.
The bottom part of the scorecard sets out the initiatives we intend to complete in the current year as part of our longer-term journey towards achieving our strategic objectives. Specific KPIs and targets are set for our nine priorities and other areas of focus. Our ability to meet the current-year targets in the first part is dependent on successfully executing the second part in preceding years.
BaLanCed SCoreCard aPProaCh
Shareholder Customer employee
trad
itio
nal
KPi
s 50
%
achieve sustainable growth
� Income growth� Manage expenses� Returns� Portfolio risk� Controls and compliance
Position dBS as Bank of Choice
� Increase wallet share� Customer satisfaction
Position dBS as employer of Choice
� Employee engagement� People development
Geographies
regional businesses
enablers
Stra
teg
ic p
rio
riti
es 5
0%
Entrench leadership in Singapore
Reposition Hong Kong
Rebalance geographic mix of our business
Build a leading Small and Medium Enterprise (SME) Banking business
Strengthen wealth proposition
Build out transaction banking and treasury customer businesses
Place customers at the heart of the banking experience
Focus on management processes, people and culture
Strengthen technology and infrastructure platform
other areas of focus
Scale up institutional investor and western MNC businesses
Build a leading Asian fixed income business
Leverage innovation to extend customer reach and offer differentiated client experience
Champion social entrepreneurship in Singapore and across Asia
23management disCussion

SeLeCted KPis in oUr SCoreCard
traditionaL KPis (50% weiGhtinG)
SharehoLder KPis
1. Grow income
target: Deliver consistent income growth outcome: Double-digit percentage income growth to record of SGD 8.93 billion. Non-interest income and net interest income at new highs
4. improve returns
target: Return on equity of 12% or better in a normalised interest rate environment outcome: Double-digit return on equity in a historically low interest rate environment
return on equity (%)
2009 2010 2011 2012 2013
8.410.2
11.0 11.2 10.8
2. manage expenses
target: Be cost efficient while investing for growth; cost-income ratio target of 45% or better outcome: Cost-income ratio better than target of 45%. Investments paying off: positive 3% pt income-expense jaws after three years of franchise investments
Cost/income (%)
2009 2010 2011 2012 2013
39 41 43 45 44
3. manage portfolio risk
target: Grow exposures prudently, aligned to risk appetite. Expect specific allowances (SP) to average 25 basis points of loans through the economic cycle outcome: SP as a percentage of loans moved towards normalisation after exceptionally low levels in 2011 and 2012
SP/average loans (bp)
2009 2010 2011 2012 2013
85
43
11 1018
income (SGd m)
2009 2010 2011 2012 2013
6,603 7,066 7,631 8,0648,927
+11%
24 DBS AnnuAl RepoRt 2013

CUStomer KPis
5. increase wallet share
target: Deepen wallet share of individual and corporate customers outcome: Institutional Banking (IBG) non-loan to total income ratio was maintained and Consumer Banking (CBG) non-interest income ratio rose
CBG non-interest income ratio (%)iBG non-loan income ratio (%)
2009 2010 2011 2012 20132009 2010 2011 2012 2013
30 32 3438 41
39 4148 50 50
6. increase customer satisfaction
target: Increase customer satisfaction outcome: Improved customer satisfaction in Institutional Banking and Consumer Banking based on customer surveys
Customer satisfaction scores* 2012 2013
Wealth Management customer engagement score 3.81 4.02
Consumer Bank customer engagement score 3.71 3.86
Large corporate bank ‘core bank’ score 59% 65%
SME bank customer engagement score 4.03 4.05
* Customer engagement scores (1 = worst; 5 = best) based on survey to measure customers’ satisfaction with DBS across markets. ‘Core bank’ score is the percentage of surveyed customers across the region who view DBS as a top 3 bank
7. maintain high employee engagement
target: Build a highly engaged organisation outcome: The Gallup Q12 grand mean score was maintained at 4.31 out of a possible 5. We were awarded the Gallup Great Workplace Award 2013 for the high level of engagement
8. People development
target: Provide our people with development opportunities for professional and personal growth outcome: Enabled our people to broaden their exposure across businesses and markets. More than one-quarter of positions filled internally in 2013
emPLoYee KPis
2009 2010 2011 2012 2013
Positions filled internally
dBS Q12 grand mean score
mobility
■ Target
■ Actual
3.92
20%
4.00
28%
4.11 4.31 4.31
25management disCussion

1. entrench leadership in Singapore
target: Be the dominant universal bank in our home market outcome: Record income and earnings despite low interest rate environment. Excluding regional trading income booked in Singapore, the core domestic franchise posted double-digit percentage growth in income and earnings
3. rebalance the geographic mix of our business
target: Build out our franchises in growth markets of China, Taiwan, Indonesia and India to achieve a more balanced geographic mix outcome: Made headway in growth markets with China’s and Indonesia’s income at new highs; tempered by the macroeconomic environment in India
2. reposition hong Kong
target: Anchor of our Greater China franchise to capture China-related flows outcome: Income and earnings at new highs as we repositioned our franchise to capture the benefits of Hong Kong-China connectivity and the growing affluent customer segment
GeoGraPhiC KPis
income (SGd m)
China, taiwan, indonesia and india income (SGd m)
income (SGd m)
2009 2010 2011 2012 2013
1,366 1,465 1,453 1,532
1,863
2009 2010 2011 2012 2013
3,9914,426 4,719 4,966
5,415
% of Group income
11% 14%
StrateGiC PrioritieS (50% weiGhtinG)
+9%
+22%
2009 2010 2011 2012 2013
759 767
1,0561,161
1,249
26 DBS AnnuAl RepoRt 2013

4. Build a leading Sme Banking business
target: Serve SMEs by leveraging our local franchises and insights outcome: Record income through asset growth and stronger non-interest income activities
6. Build out transaction banking and treasury customer businesses
target: Leverage on our trade, cash and treasury expertise to offer customers differentiated financial solutions outcome: Transaction banking income and treasury customer income at new highs
5. Strengthen wealth proposition
target: Serve Asia’s growing affluent by leveraging our expertise to offer a strong Asian wealth management proposition outcome: Income at record, underpinned by customer acquisition and deepening relationships
reGionaL BUSineSS KPis
Sme Banking income (SGd m)
wealth income (SGd m)
2009 2010 2011 2012 2013
1,024 1,041 1,0921,229
1,370
2009 2010 2011 2012 2013
481 506620
787
924
2009 2010 2011 2012 2013
464
687
822 868
1,037
treasury customer income (SGd m)
trade and cash* income (SGd m)
2009 2010 2011 2012 2013
673 706
1,046
1,371 1,430
+11%
+18%
+19%+4%
* Trade and cash are part of the transaction banking business
27management disCussion
GroUP ProFit and LoSS SUmmarY
2013 2012 % chg
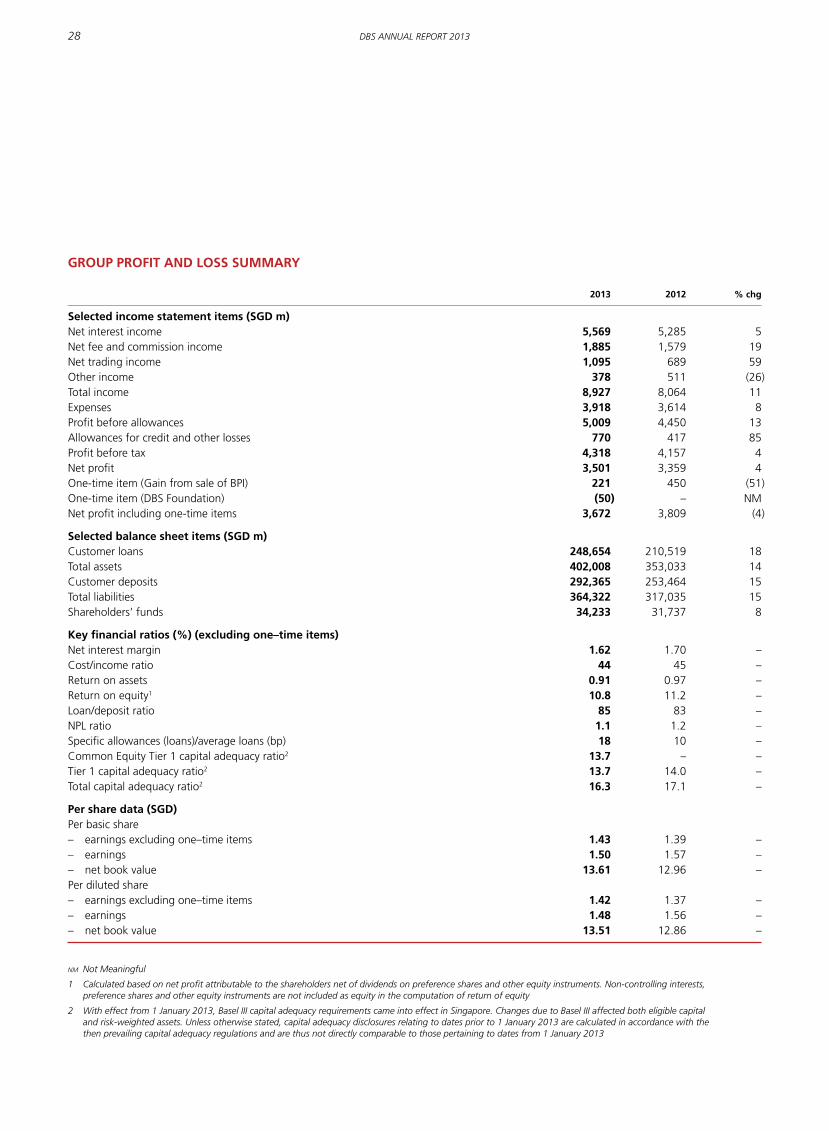
Selected income statement items (SGd m) Net interest income 5,569 5,285 5Net fee and commission income 1,885 1,579 19Net trading income 1,095 689 59Other income 378 511 (26)Total income 8,927 8,064 11Expenses 3,918 3,614 8Profit before allowances 5,009 4,450 13Allowances for credit and other losses 770 417 85Profit before tax 4,318 4,157 4Net profit 3,501 3,359 4One-time item (Gain from sale of BPI) 221 450 (51)One-time item (DBS Foundation) (50) – NMNet profit including one-time items 3,672 3,809 (4)
Selected balance sheet items (SGd m) Customer loans 248,654 210,519 18Total assets 402,008 353,033 14Customer deposits 292,365 253,464 15Total liabilities 364,322 317,035 15Shareholders’ funds 34,233 31,737 8
Key financial ratios (%) (excluding one–time items) Net interest margin 1.62 1.70 –Cost/income ratio 44 45 –Return on assets 0.91 0.97 –Return on equity1 10.8 11.2 –Loan/deposit ratio 85 83 –NPL ratio 1.1 1.2 –Specific allowances (loans)/average loans (bp) 18 10 –Common Equity Tier 1 capital adequacy ratio2 13.7 – –Tier 1 capital adequacy ratio2 13.7 14.0 –Total capital adequacy ratio2 16.3 17.1 –
Per share data (SGd) Per basic share – earnings excluding one–time items 1.43 1.39 –– earnings 1.50 1.57 –– net book value 13.61 12.96 –Per diluted share – earnings excluding one–time items 1.42 1.37 –– earnings 1.48 1.56 –– net book value 13.51 12.86 –
NM Not Meaningful
1 Calculated based on net profit attributable to the shareholders net of dividends on preference shares and other equity instruments. Non-controlling interests, preference shares and other equity instruments are not included as equity in the computation of return of equity
2 With effect from 1 January 2013, Basel III capital adequacy requirements came into effect in Singapore. Changes due to Basel III affected both eligible capital and risk-weighted assets. Unless otherwise stated, capital adequacy disclosures relating to dates prior to 1 January 2013 are calculated in accordance with the then prevailing capital adequacy regulations and are thus not directly comparable to those pertaining to dates from 1 January 2013
28 DBS AnnuAl RepoRt 2013

FinanCiaL PerFormanCe overview
Net profit rose to a record SGD 3.50 billion for 2013. Including one-time items, net profit was SGD 3.67 billion.
record operating performanceTotal income increased 11% to a new high of SGD 8.93 billion, propelled by higher loan volumes and broad-based non-interest income growth. The double-digit top-line growth reflected the depth and resilience of our regional franchise in a year marked by market volatility.
Net interest income rose 5% to a record SGD 5.57 billion. Loans increased 18% or SGD 38 billion to SGD 249 billion, led by regional trade loans, Singapore corporate borrowing and secured consumer loans. While the net interest margin of 1.62% was eight basis points below the previous year due to lower average loan spreads and yields on securities, it was stable during the course of the year with little quarterly fluctuations.
Non-interest income increased 21% to a record SGD 3.36 billion. Fee income rose 19% to SGD 1.89 billion. All fee segments grew by double-digit percentage terms, with contributions from wealth management and transaction banking services reaching new highs. Stockbroking commissions and investment banking income benefited from stronger capital market activity, particularly in the first half. Other non-interest income increased 23% to SGD 1.47 billion as higher
treasury customer income and trading gains were partially offset by lower income from investment securities.
By customer segments, Wealth Management income increased 18% to SGD 924 million and SME Banking income grew 11% to SGD 1.37 billion. By product lines, income from treasury customer activities rose 19% to SGD 1.04 billion, accounting for a record 50% of total Treasury income from 44% in the previous year. Income from Global Transaction Services increased 5% to SGD 1.48 billion as double-digit percentage increases in trade loans and cash management deposits were offset by lower rates.
Institutional Banking and Consumer Banking / Wealth Management, the two customer-facing business units, respectively accounted for 52% and 28% of the group’s total income. The remaining 20% was attributable to other activities, including balance sheet management, market making, and investment and trading gains.
Expense growth was contained at 8% to SGD 3.92 billion, giving a positive jaw of three percentage points. The cost-income ratio improved to 44% from 45% a year ago.
Profit before allowances increased 13% to cross SGD 5 billion for the first time. The stronger operating performance was partially offset by higher general and specific allowances. Total allowances rose 85% to SGD 770 million. General allowances increased in line with stronger loan growth
while specific allowances rose to 18 basis points of loans from exceptionally low levels a year ago.
One-time items amounted to SGD 171 million, comprising a gain of SGD 221 million for the partial divestment of a stake in the Bank of the Philippine Islands less a sum of SGD 50 million set aside to establish the DBS Foundation to further our commitment to social and community development.
Balance sheet remains strongAsset quality remained healthy. The non-performing loan rate was little changed from recent quarters at 1.1%. Allowance coverage was at 135% and at 204% if collateral was considered.
Liquidity continued to be ample. Deposits grew 15% or SGD 39 billion during the year to SGD 292 billion, in line with loan growth, and the loan-deposit ratio was maintained around recent quarters’ levels at 85%. Three-fifths of the deposit growth during the year was in US dollars from western multinational corporations, institutional investors and other customers.
The Group was also well capitalised, with a total capital adequacy ratio of 16.3% and a Common Equity Tier-1 ratio of 13.7%.
“ Total income increased 11% to a new high
of SGD 8.93 billion, reflecting the depth and
resilience of our regional franchise in a year
marked by market volatility.”
29management disCussion

Shareholders
review BY BUSineSS UnitS
ConSUmer BanKinG / weaLth manaGement
hiGhLiGhtS
total income (SGd m) Loans (SGd bn)
2,008
44
2,06550
2,20455
2,300 62
2,538 71
2009 20092010 20102011 20112012 20122013 2013
wealth total earnings assets* (SGd bn) non-interest income ratio (%)
8630
9132103
3411638
134 41
2009 20092010 20102011 20112012 20122013 2013
# mBanking Users
839,000# iBanking Users
2,440,000# wealth Customers
283,000
* DBS Treasures, DBS Treasures Private Client and DBS Private Bank
30 DBS AnnuAl RepoRt 2013

introdUCtion
Consumer Banking / Wealth Management (CBG) provides individual customers with a diverse range of banking and related financial services. Our customers can take comfort that we have been consistently named “Safest Bank in Asia” by Global Finance magazine since 2009. We have deep roots in Singapore, where we serve all parts of the community through our extensive network of more than 2,300 DBS and POSB branches, ATMs and self-service banking machines.
Our Wealth Management franchise offers a full suite of products and services. Affluent individuals are served in the DBS Treasures customer segment while high net worth individuals with assets of more than SGD 1.5 million are served in the DBS Treasures Private Client and DBS Private Bank segments. In addition to offering customers the safety that comes from being well-capitalised and having one of the highest credit ratings, we are differentiated by our insights on Asia and access to investments that tap into Asia’s growth.
FinanCiaL PerFormanCe
CBG’s total income rose 10% to SGD 2.54 billion. Net profit increased at a faster rate of 17% to SGD 603 million, as a result of productivity gains and stable credit costs. The pace of growth in both income and earnings was higher than the previous year.
The stronger performance was led by a 19% increase in non-interest income to SGD 1.04 billion as contributions from investment and bancassurance product sales grew 27%,
demonstrating the strength of our wealth management franchise.
Net interest income rose 5% to SGD 1.50 billion driven by loan and deposit volume growth, partially offset by lower interest margin.
In Singapore, loans grew 10% from housing and other secured consumer loans. Drawdowns of housing loans approved in previous years contributed to 32% of the growth in our Singapore housing loan portfolio. However, applications for new Singapore housing loans declined 20% compared to 2012 following a series of government measures to cool the market. On the other hand, housing loan yields have been firming. The proportion of applications for fixed-rate loans increased as more borrowers became amenable to paying a premium to lock in rates for mostly up to three years while interest rates are low. The proportion of applications for public housing loans also increased from 2012 as we introduced a product to attract buyers who would otherwise have borrowed directly from the public housing authority.
Deposits grew 6% mainly from SGD current and savings accounts, in which we maintained our leading market share. SGD deposits costs were stable during the year.
We continued to manage operating costs tightly while investing in technology to enhance our digital capabilities. Expenses rose 9% to SGD 1.74 billion. Allowances continued to be low as asset quality remained stable in a benign credit environment. Around 90% of our Singapore housing loans, which
account for the majority of our housing loan exposure, are to borrowers with only one housing loan. The average outstanding Singapore housing loan in our portfolio is only 56% of the property’s market value. We also adopted debt servicing standards long before they became regulatory requirements to ensure that borrowers did not overstretch themselves.
StrateGiC initiativeS
We achieved the franchise development goals we set for ourselves in 2013. They were to improve our online platforms, cement our leading position in wealth management and make further strides in customer service.
digital initiativesWith consumer transactions rapidly shifting online, we continue to enhance our Internet and mobile platforms to make them seamless extensions of our physical branch footprint. The revamp incorporates an improved engine to pull together customer and product information, a refreshed and consistent look and feel for all our online and mobile channels, and the introduction of innovative applications. Once the full revamp is completed, our Internet and mobile platforms will be simpler and more intuitive to use, offer a higher degree of customisation to individual needs, and enable customers to interact in real time with relationship managers or branch staff. Customers will be able to make everyday transactions such as payments, receive assistance for making investment decisions, call up information on lifestyle activities such as dining and shopping, and check on their bank accounts – all at their convenience, 24 x 7.
Among the specific enhancements we introduced during the year was a mobile app, DBS Home Connect, enabling Singapore home buyers to find out the valuation of a residential property as well as recent transaction prices in the vicinity by pointing their mobile device at the property. In addition, applicants for credit cards and unsecured loans can download our Optical Character Reader to reduce the time for completing their online applications.
Focus areas
� Build out regional wealth business � Bank mass market in Singapore; consider consumer finance
opportunistically in other countries
Priorities in 2014
� Increase focus on digitisation to enhance efficiency� Make the customer experience more interactive and intuitive� Leverage analytics and the use of big data
31management disCussion

Customers can also use our online platform to remit funds; transfers to India and Indonesia can be completed in a matter of minutes.
We also partnered Alibaba’s e-commerce payments site Alipay to allow our Singapore, Hong Kong and China customers to purchase items on Taobao, a popular online market. We tapped social media to enhance brand awareness and launch products, including a crowd-sourcing deposit-gathering programme called uGoiGo™ that was launched in Hong Kong with great success and subsequently replicated in other markets.
We have been meticulous in our efforts to build a secure foundation around our electronic platforms. During the year, we completed the roll-out of additional security features, including a new-generation log-in token for customers and a system to alert customers when transaction sizes cross a threshold or when they are not routine. These changes have contributed to a safer and easier experience. As a result, channel usage increased over 40%, driven primarily by mobile. We now have more than 2.4 million online and 800,000 mobile users across the region. On an average day there are more than 300,000 logins, with mobile accounting for close to 40% of the total. To reduce paper usage and go green, we have enabled our customers to receive statements in electronic form. In Singapore, over 50% of our customers now do so.
wealth managementIn Wealth management, we continued to make changes to improve the effectiveness of our client interaction. We increased the number of relationship managers across the region by 13% and equipped them with customised tools that make them more effective in helping clients to make investment decisions. We up-tiered qualifying clients in order to serve them better. In Hong Kong, we completed the integration of our middle and back offices to improve the quality of support for front-line staff.
Our wealth management online platforms were re-designed based on clients’ feedback. They asked for products and services that were relevant to their investment needs and risk appetite, information and execution that are delivered at speed, and simple processes. The revamped platform empowers clients with quick and intuitive access to services, product information and research. Insights and analysis can be customised according to clients’ preferences. Equities and funds trading have been incorporated into the platform, enhancing the range of asset classes that are available online.
These efforts, coming on top of those in recent years, enabled us to continue achieving strong growth in our wealth management business. Total earning assets rose 15% during the year to SGD 134 billion, bringing growth since 2010 to 47%. Wealth management
income grew 18% during the year to SGD 924 million; since 2010, it has grown 83%. The number of wealth management clients grew 5% during the year.
Customer experienceMaking continuous improvements to deliver a superior experience for all our customers remained a key strategic objective. In previous years, we successfully cut queue times at our branches, improved the speed at which calls to our customer hotline were answered, and increased the availability of our ATMs. In 2013, our distribution channels were expanded by a partnership with 7-Eleven, a convenience store chain, to enable our customers to withdraw cash from its 500 outlets across Singapore. This built on the partnership with SingPost that was launched in 2012, which enabled our customers to carry out basic banking transactions at 56 post offices in Singapore.
We used data analytics to strengthen our ability to respond to and pre-empt customers’ needs. A voice analytics programme has improved the efficiency of our call centre operations. The technology has enabled us, for example, to identify calls requiring longer handling times as well as the underlying causes for repeat calls from a customer. Propensity models were developed using advanced statistical techniques to improve customer targeting. This has reduced frictional costs for the customer and improved our operating efficiency. We also launched real-time marketing and service offers using our new complex event processing technology. For example, when a customer makes an airline purchase online, he will receive personalised complementary hotel and travel insurance offers within seconds. This new capability has improved both customer satisfaction and conversion rates.
We also continued to improve customer experience. For example, the new on-boarding process for upgraded DBS Treasures customers in Singapore now takes one day instead of seven days previously. We are now working on similar initiatives across other markets to similarly differentiate the customer journey.
Partnered 7-Eleven to enable customers to withdraw cash from its 500 outlets in Singapore
32 DBS AnnuAl RepoRt 2013

Our efforts are being noticed and appreciated by our customers and the industry. We received the following accolades: “Best Local Private Bank in Singapore” by Euromoney magazine, “Best Wealth Manager in Indonesia” by The Asset magazine, “Best Consumer Bank (Foreign) in China” by Global Finance and “Best Wealth Management in Hong Kong” by Global Banking & Finance. We were also given numerous awards in Singapore, including “Best Use of Social Media/Mobile” for the DBS Traveller Shield campaign by Marketing Magazine. Customer engagement results for Singapore’s DBS Private Bank and DBS Treasures Private Client registered significant progress with both segments achieving 75th percentile scores in an industry survey carried out by Gallup,
a management consultant. DBS Treasures customer engagement satisfaction scores increased in all our markets, with Hong Kong and Indonesia achieving significant improvements. DBS and POSB customer engagement satisfaction scores also increased significantly.
oUtLooK
We remain optimistic about our operating environment, barring any unforeseen shock. While recent regulations are likely to affect the short-term growth of housing and car loans in some markets, we are fortunate to be operating in a region with promising demographics and a rapidly growing middle class that will provide continued
opportunities for growth. We will grow sensibly while managing asset quality.
We will continue to fundamentally reshape the customer experience and our value proposition by leveraging technology and our wealth management capabilities. We will focus on reinforcing our leadership position in wealth management with differentiated offerings, driving digital innovation with specific emphasis on mobility, payments and e-wealth, using big data analytics to provide customers with timely offers, and enhancing the customer experience across all segments and touchpoints.
inStitUtionaL BanKinG GroUP
hiGhLiGhtS
Cash management deposits (SGd bn)
nPL ratio (%) Cost-income ratio (%)
5565
8195
119
2009 2010 2011 2012 2013
3.8
2.5
1.7 1.6 1.4
2009 2010 2011 2012 2013
30 32 33 31 29
2009 2010 2011 2012 2013
total income (SGd m) non-loan income ratio (%) trade assets (SGd bn)
2009 2010 2011 2012 2013
3,1723,513
4,010 4,1524,676
2009 2010 2011 2012 2013
39 4148 50 50
2009 2010 2011 2012 2013
1420
4552
63
33management disCussion

introdUCtion
Institutional Banking (IBG) provides financial services and products to over 200,000 institutional clients, including bank and non-bank financial institutions, government-linked companies, large corporates and small and medium-sized enterprises (SMEs). We offer the complete range of credit facilities from short-term working capital financing to specialised lending. We also provide transaction banking services such as cash management and trade finance, treasury and market products, corporate finance, advisory banking and capital market solutions. Building leading transaction banking and SME businesses are two of the Group’s strategic objectives.
FinanCiaL PerFormanCe
IBG posted another strong year. Total income grew 13% to SGD 4.68 billion from strong asset growth and non-loan activities across most markets, underpinned by robust demand in Asia. Improved non-loan activities contributed to an 18% increase in non-interest income to SGD 1.65 billion as we continued to deliver holistic solutions to customers. Non-loan activities accounted for 50% of IBG’s total income. Net interest income rose 10% to SGD 3.02 billion. Customer loans grew 20% to SGD 179 billion from strong broad-based demand across the region, but the impact was partially offset by a lower net interest margin. We also grew deposits from both existing clients as well as our growing customer base of western multinational corporations and institutional investors.
While investing for the future, we remained disciplined on costs and improved the cost-income ratio to 29% from 31% in 2012. Profit before allowances grew 14% to SGD 3.30 billion. Total allowances amounted to SGD 544 million as general allowances increased in line with loan growth and specific allowances rose from exceptionally low levels. The non-performing loan ratio remained low at 1.4% despite uncertainties in some growth markets, such as India. We continued to be vigilant and actively managed risks during the year.
Net profit grew 5% to SGD 2.32 billion.
StrateGiC initiativeS
global transaction services (gts)GTS achieved another strong year as fee activities propelled total income to a record SGD 1.48 billion, up 5%. While earnings were affected by industry-wide margin pressure on trade finance loans, our investment in higher-value working capital solutions enabled us to continue making gains in several product segments. Since 2010, GTS has added over SGD 700 million of annuity income streams with high return on capital, contributing to improving the Group’s profitability and earnings quality.
Over the past three years, we launched high value-added products ranging from sophisticated liquidity management solutions and supply chain structures, to new payment technologies that provide ease of use and the
ability to handle massive volumes. We also expanded our capabilities to serve established multinationals as well as SMEs building out their Asia franchise. We have become a key relationship bank for large Asian companies establishing regional treasury centres in Singapore and Hong Kong.
The sophistication of the products we offer is as good as any in the world. Combined with our strong balance sheet, it has resulted in new mandates from the world’s leading companies. We offer solutions to assist clients to generate free cash flow, a critical and highly valued activity. In the past 24 months, we have won 190 deals in excess of SGD 1 million of income.
The technology we invested in has allowed us to acquire clients, provide state-of-the-art customer service, and deepen wallet share without a corresponding increase in staff cost.
The combination of new products, expanded client servicing capabilities and more efficient technology has led to record levels of GTS assets and deposits. In 2013, deposits grew SGD 24 billion to SGD 119 billion while trade assets grew SGD 11 billion to SGD 63 billion. Growth in deposits outpaced growth in assets for the third straight year, strengthening DBS’ liquidity further.
With interest rates at historical lows, margins for both trade and cash products have been compressed. As such, we believe there is significant intrinsic value embedded in our recent deposit and asset growth.
As the driver of the global economy in the next decade, Asia will continue to lead the world in the rate of growth of both manufacturing and domestic consumption. As companies invest in Asia to capitalise on these opportunities, we are well-positioned with our extensive range of products and services to support them.
sme Banking With the building of the SME regional platform architecture completed in 2012,
Focus areas
� Grow large corporate banking business regionally � Build out regional SME business
Priorities in 2014
� Scale up the western MNC and institutional investor businesses � Grow SME franchise by customer acquisition and offering customised solutions � Scale up cash business by leveraging online platform and drive
trade business by offering/working capital solutions � Maintain leadership in fixed income, capital markets and syndications � Leverage e-channels and innovation to extend reach and differentiate client experience
34 DBS AnnuAl RepoRt 2013

our efforts in 2013 were focused on acquiring new clients and on increasing wallet share across the markets we operate in. Total income rose 11% to SGD 1.37 billion, exceeding the target we set for the year, from broad-based growth. Loans grew 14% to SGD 40 billion while deposits increased 11% to SGD 35 billion. Non-loan income accounted for 63% of total income from 60% in 2012, helped by strong treasury product sales, particularly in Hong Kong, and debt and equity issuances.
The performance was the result of upgrades we made to our operations. We enhanced our credit process by building local programmes in each country to approve mid-sized exposures with a clear set of rules and parameters. The programmes have reduced the time taken to assess and approve credit applications across all our markets. We incorporated technology into our efforts to improve customer experience. Our online account opening was extensively automated with a new engine that pulls together customer data from public sources. This has reduced the time taken for clients to open an account to 15 minutes, compared to the industry average of one to two hours. We also revamped our website to give a simplified and consistent look and feel for easy navigation. Our relationship managers now use iPads to receive updated client and product information, enabling them to evaluate customer requirements and propose solutions on the go.
While Singapore and Hong Kong currently account for a significant proportion of our SME business, we are able to provide high-value services in treasury, cash management, trade facilities and advisory services to SMEs in China, Taiwan, India and Indonesia to support their regional expansion.
Treasury and capital market products in particular led our non-loan activities with SMEs during the year. While large corporates dominated debt raising in 2012, it was SMEs that were active in embracing the debt capital market in 2013 as an alternative source of funding for expansion. In Singapore, we
were the market leader in advising SMEs on bond issuance and had a market share of 45% in 2013. In a securitisation deal that won two awards from International Financing Review magazine, we helped TG Master, a property developer, raise SGD 200 million of unencumbered capital secured against future payments from committed bookings of a property project it had launched. The transaction improved its cash flow by enabling it to finance other ongoing projects. We also supported Soilbuild Business Space REIT in its initial public offering and provided advisory services to Frencken Group for its acquisition of Juken Technology.
Our success has been reflected in the awards we won during the year. The Asset magazine named us “Best Bank for Emerging Corporates in Asia”, we were recognised as “Best SME bank in Hong Kong” by Global Banking & Finance Review, and we were named “Best Small Business Lending Bank” at Global Finance’s Stars of China Awards.
Customer experienceDuring the year, we continued to strengthen our operating systems and streamline our processes, which are instrumental to our ability to introduce innovative customer solutions. We launched a one-stop customer service call centre called DBS Business Care to provide a prompt response to customer needs. For a start, we rolled out Business Care in Singapore and Hong Kong.
We improved the customer on-boarding experience with a simplified documentation process. Our account opening documents were awarded the Crystal Mark for being written in plain English. We launched an online appointment system so that waiting time can be reduced when customers visit a branch to complete their account opening.
We improved client engagement by using a disciplined approach to account planning. Clients have cited their appreciation for the regular strategic dialogues we conducted with them and noticed the increasingly advisory approach we have been taking
to address their business needs. We also organised Asian Insights industry forums for industry participants to exchange insights, outlook and trends, and the forums have been well received. The improvement in customer satisfaction is evident from the increased number of clients across all countries who cited DBS as their core bank in the latest annual customer surveys.
oUtLooK
The investments we made in recent years to improve regional connectivity, product expertise and customer engagement are reaping strong results. We are winning new mandates across multiple customer segments and business lines.
Our strategy remains unchanged. We will work with clients across the region, leveraging on our regional network, product capabilities and technological innovation. We will develop our western multinational and institutional investor client base, grow our SME franchise regionally by driving customer acquisition and offering innovative holistic solutions, use our cash and trade product capabilities to help customers manage their working capital needs, and maintain leadership in capital markets and syndication.
35management disCussion

We are an Asian leader in treasury and offer a broad range of products and services to individuals, companies and financial institutions. We offer cash and derivative products in foreign exchange, interest rates, equities, commodities and fixed income securities. We carry out activities related to market-making, risk warehousing and investment activities. We also help customers raise funds through debt issuances. Our nimbleness in structuring products for customers in response to changing market conditions sets us apart
from competitors. Our sales and structuring teams work with relationship managers and other product specialists across the Group to offer total risk management solutions to customers.
We are the acknowledged leader in Singapore, with dominance in SGD across various asset classes. We are the leading market-maker for SGD foreign exchange and cross-currency options. With one of the biggest foreign exchange and derivatives teams in Singapore, we have been able to
offer superior pricing capabilities to customers. In Hong Kong, we are a major market-maker with an estimated market share of about 10% for the RMB spot and forward markets. We offer a full suite of RMB and HKD derivative products to customers. We are committed to extending our leadership in market-making, structuring and distribution capabilities, and strengthening our fixed income origination capabilities in Asian currencies.
We are the leader in SGD rates. As a dominant participant in the interbank swap market, we are a significant provider of liquidity in the interbank SGD swap market. We are a primary dealer of Singapore Government Securities and are one of the largest and most active participants in the market.
Our expertise enables us to offer structured products to individual customers seeking yield or manage sizeable transactions for corporates and institutions. We provide innovative solutions on long-dated or large-sized interest rate swaps and cross currency derivative transactions, benefiting both foreign and domestic customers seeking to match liabilities. We can also develop alternative funding solutions for corporate customers to optimise their capital structure and balance sheet.
FinanCiaL PerFormanCe
Treasury segment income fell 8% to SGD 1.03 billion. The decline was due mainly to lower gains from interest rate and credit activities. Income from customer activities rose 19% to SGD 1.04 billion from higher sales to institutional and individual customers. This brought total Treasury income to SGD 2.07 billion, a 4% increase over 2012.
Over the past four years, income from customer activities has grown while treasury segment income has generally remained flat. As a result, the proportion of total Treasury income from customer activities has doubled from 27% in 2009 to 50% in 2013. The shift reflects our ability to respond to market opportunities arising from our extensive product expertise and understanding
Focus areas
� Grow treasury customer income� Strengthen product and electronic distribution capabilities across all asset classes
Priorities in 2014
� Grow customer income further� Deliver offshore RMB and cross-border solutions for customers� Continue efforts to build a leading Asian fixed income house� Build a customer-centric commodity business� Build up institutional investor business with a focus on treasury products� Keep pace with evolving regulatory over-the-counter derivatives reforms globally
treaSUrY
hiGhLiGhtS
total treasury income (SGd million)
2009
27%
2010
36%
2011
42%
2012
44%
2013
50%
1,713
464
1,249
1,920
687
1,233
1,974
822
1,152
1,987
868
1,119
2,071
1,037
1,034
The Treasury segment reflects only income related to market-making, risk warehousing and investment activities. Income from treasury customer activities is reflected in IBG and CBG since such income derives from our relationship with the customers in those business segments. Total Treasury income encompasses Treasury segment income and customer income
Customer income
Treasury segment income
% of total Treasury income
36 DBS AnnuAl RepoRt 2013

of customer needs. We also invested in regional expansion, particularly in Greater China where we built an extensive RMB business spanning foreign exchange, bonds, structured products and hedging solutions. Taiwan, China and Hong Kong posted the highest compounded annual income growth during the period.
StrateGiC initiativeS
CommoditiesDuring the year, we expanded our product range with option pricing capabilities for over-the-counter energy products. Since 2011, when we started with copper, we have expanded our product range to aluminium, copper, lead, nickel, iron ore, crude oil and refined oil products, cotton, soybean and bean oil. Customer income from commodity products has grown five-fold since 2011.
Fixed incomeOur fixed income capability has been expanded beyond SGD, our traditional stronghold, to regional and G3 currencies.
While SGD debt issuances slowed during the year, we maintained our long-standing leadership with 55 transactions worth SGD 6.1 billion.
We also powered ahead with foreign-currency bond transactions. We completed 23 USD bond transactions as a book-runner, a new benchmark for us, compared to 16 in 2012. Some of the biggest USD deals we were involved in were inaugural issues. They included San Miguel Corp’s landmark USD 800 million issue, which was the largest corporate bond out of the Philippines; Dutch-based Trafigura Beheer BV’s debut USD 500 million perpetual bond, for which we were the only Asian book-runner; and a debut USD 450 million seven-year transaction for Mersin International Port, a joint venture between PSA, Singapore’s port operator, and Akfen, a Turkish infrastructure company. The deal was the first Turkish bond arranged by a Singapore bank. We were also book-runner for the first corporate USD high-yield bond from India, a USD 200 million five-year bond for Rolta LLC. We will continue to grow our USD franchise to serve the global funding needs of our clients.
During the year, we were ranked fifth in underwriting league tables for CNH bonds (excluding financial institutions issues), a marked improvement from 2012. We executed our first CNH bond transaction for a Taiwanese issuer and successfully priced our inaugural CNH bond of RMB 500 million settled in Singapore.
digital initiativesWe enhanced our online infrastructure as part of efforts to make continuous improvements to customer experience and reach.
DealOnline, our full-fledged online treasury platform, offers auto price streaming and auto-dealing in spot foreign exchange, swap, forward and non-deliverable forward contracts. The platform offers corporate and financial institution customers flexibility to conduct a range of banking activities and services with a secure login. In Singapore, 2,000 SMEs have also signed up.
Corporate customers are able to enquire, book their foreign exchange and manage their cash and trade transactions over a highly customisable dashboard, receive real-time updates via email and SMS on all banking activities and always stay informed. With the same platform, corporate customers can utilise their foreign currencies for either remittance or trade financing purposes. DealOnline also offers individual customers in Hong Kong a 24-hour foreign exchange pricing engine.
oUtLooK
Regulatory developments could have an impact on our business. They include reforms for the over-the-counter derivatives market, which would involve regulations on central counterparty clearing, trade repository reporting, the US Dodd-Frank Wall Street Reform and Consumer Protection Act, and the European Market Infrastructure Market Regulation.
We will stay the course with our strategy. Our initiatives for 2014 include maintaining the momentum for customer activity with institutional, corporate and individual clients, and strengthening our electronic platform.
We enhanced our online offerings to improve the customer experience
37management disCussion
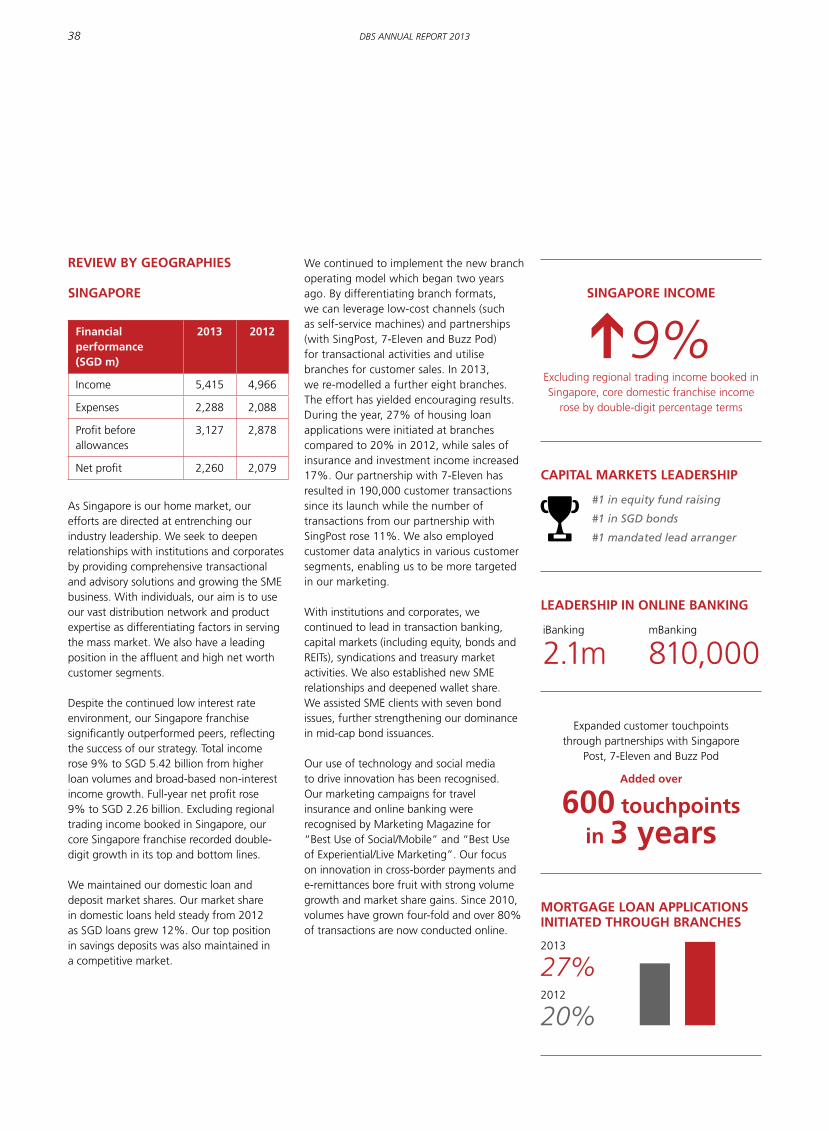
review BY GeoGraPhieS
SinGaPore
Financial performance (SGd m)
2013 2012
Income 5,415 4,966
Expenses 2,288 2,088
Profit before allowances
3,127 2,878
Net profit 2,260 2,079
As Singapore is our home market, our efforts are directed at entrenching our industry leadership. We seek to deepen relationships with institutions and corporates by providing comprehensive transactional and advisory solutions and growing the SME business. With individuals, our aim is to use our vast distribution network and product expertise as differentiating factors in serving the mass market. We also have a leading position in the affluent and high net worth customer segments.
Despite the continued low interest rate environment, our Singapore franchise significantly outperformed peers, reflecting the success of our strategy. Total income rose 9% to SGD 5.42 billion from higher loan volumes and broad-based non-interest income growth. Full-year net profit rose 9% to SGD 2.26 billion. Excluding regional trading income booked in Singapore, our core Singapore franchise recorded double-digit growth in its top and bottom lines.
We maintained our domestic loan and deposit market shares. Our market share in domestic loans held steady from 2012 as SGD loans grew 12%. Our top position in savings deposits was also maintained in a competitive market.
We continued to implement the new branch operating model which began two years ago. By differentiating branch formats, we can leverage low-cost channels (such as self-service machines) and partnerships (with SingPost, 7-Eleven and Buzz Pod) for transactional activities and utilise branches for customer sales. In 2013, we re-modelled a further eight branches. The effort has yielded encouraging results. During the year, 27% of housing loan applications were initiated at branches compared to 20% in 2012, while sales of insurance and investment income increased 17%. Our partnership with 7-Eleven has resulted in 190,000 customer transactions since its launch while the number of transactions from our partnership with SingPost rose 11%. We also employed customer data analytics in various customer segments, enabling us to be more targeted in our marketing.
With institutions and corporates, we continued to lead in transaction banking, capital markets (including equity, bonds and REITs), syndications and treasury market activities. We also established new SME relationships and deepened wallet share. We assisted SME clients with seven bond issues, further strengthening our dominance in mid-cap bond issuances.
Our use of technology and social media to drive innovation has been recognised. Our marketing campaigns for travel insurance and online banking were recognised by Marketing Magazine for “Best Use of Social/Mobile” and “Best Use of Experiential/Live Marketing”. Our focus on innovation in cross-border payments and e-remittances bore fruit with strong volume growth and market share gains. Since 2010, volumes have grown four-fold and over 80% of transactions are now conducted online.
SinGaPore inCome
Excluding regional trading income booked in Singapore, core domestic franchise income
rose by double-digit percentage terms
9%
mortGaGe Loan aPPLiCationS initiated throUGh BranCheS
2013
27%2012
20%
CaPitaL marKetS LeaderShiP
#1 in equity fund raising
#1 in SGD bonds
#1 mandated lead arranger
iBanking
2.1m
LeaderShiP in onLine BanKinG
mBanking
810,000
Expanded customer touchpoints through partnerships with Singapore
Post, 7-Eleven and Buzz Pod
added over
600 touchpoints in 3 years
38 DBS AnnuAl RepoRt 2013

honG KonG
Financial performance (SGd m)
2013 2012
Income 1,863 1,532
Expenses 717 678
Profit before allowances
1,146 854
Net profit 851 716
As the anchor of our Greater China franchise, Hong Kong plays an instrumental role in our efforts to deepen relationships with leading China enterprises, as well as bring customers from elsewhere into China. It is the base for employing our expertise in transaction banking, treasury and wealth management to connect China with the rest of our network. Our established domestic franchise also serves the full range of corporate and SME clients and affluent individuals in Hong Kong.
Hong Kong achieved another record year as total income, profit before allowances and net profit all reached new highs. Total income rose 22% to SGD 1.86 billion from loan growth, improved net interest margin and broad-based non-interest income growth. Profit before allowances surpassed SGD 1 billion for the first time to SGD 1.15 billion, a 34% increase. Net profit rose 19% to SGD 851 million, contributing to 24% of the Group’s total. Our top and bottom line growth outperformed competitors in the market.
Hong Kong's record performance was the result of strong growth across all customer segments.
Our regional network, product expertise and reputation for consistent customer support through business cycles contributed to a deepening of our relationship with Chinese enterprises with overseas operations during the year. Our relationship has progressively extended beyond credit facilities to strategic advisory as well as capital market and treasury activities. During the year, we were the lead arranger for several transactions
related to acquisition financing and debt and equity issuances of Chinese enterprises, and we completed our inaugural Qianhai cross-border bilateral RMB loan agreement. As such, we grew income from Chinese large corporates by 34%.
We maintained our status as a leading bank in offshore RMB transactions. Offshore RMB activity accounted for more than 20% of total Hong Kong income as a result of strong treasury, cash and trade activities. The growth in treasury customer income during the year was led by Hong Kong SMEs, which took advantage of the favourable environment to hedge their RMB requirements.
We devised a composite index called DRIVE (for “DBS RMB Index for VVinning Enterprises”), which uses company surveys to measure the level of adoption of the RMB in Hong Kong for local and global transactions. The index is intended to assist policy makers, businesses and investors to track the usage and acceptance of RMB among Hong Kong companies.
We further expanded our SME franchise by focusing on customer acquisition and offering holistic solutions. We increased the size of our sales team and added two dedicated customer centres to serve this segment. The improved capabilities enabled us to improve the breadth of our relationship with products other than loans.
We continue to be among the largest SME banks in Hong Kong. We were named the “SME Bank of the Year” by Asian Banking and Finance and the “Best SME’s Partner” by the Hong Kong General Chamber of Small and Medium Businesses for the fifth year in a row.
Our efforts to reposition consumer banking continue to pay off as income from investment and insurance products rose 18%. We opened our first DBS Treasures Private Client centre in the city to serve the high net worth segment.
We actively used social media and product differentiation to build brand presence and deepen customer engagement. We launched an online crowd-sourcing campaign called
uGoiGo™, which was entirely devised in-house, to acquire DBS Treasures customers. The campaign used a group-buying concept to offer a progressively higher tier of interest rate for time deposits once a specific group size was achieved. With an online marketing and social media strategy, the target size was achieved within two days of launch. Overall, the uGoiGo™ campaign garnered more than 64,000 page views. It also increased the number of DBS Treasures customers acquired by online channels five-fold from 2012. The campaign was awarded the “Best Idea in Viral Marketing” at Marketing Magazine’s MARKies Award 2013, with DBS being the only financial institution to win the award.
StronG oFFShore rmB CaPaBiLitieS
RMB-related income exceeds 20% of total income in Hong Kong
taPPinG on China’S ConneCtivitY
inCome From China Large Corporates grew 34%
indUStrY-wide reCoGnition
Best sme’s partnersme Bank of the Year
39management disCussion

Growth marKetS
Our operations in growth markets are integral to our strategy of intermediating trade and investment flows in the region. In these markets, our customers are principally large and medium-sized corporates and affluent individuals.
reSt oF Greater China
Financial performance (SGd m)
2013 2012
Income 743 663
Expenses 548 498
Profit before allowances
195 165
Net profit 92 110
Total income in the Rest of Greater China rose 12% to SGD 743 million as a decline in net interest income from lower net interest margin was more than offset by increased fee income and treasury income from customer activities. Net profit fell 16% to SGD 92 million as expenses rose and allowances doubled to SGD 76 million mainly due to higher specific allowances.
China China’s economic growth was maintained at 7.7%. With further interest rate liberalisation during the year, net interest margin came under pressure, especially in the first half of the year. Against this backdrop, we took steps to improve the loan-deposit ratio and our deposit mix. These efforts helped the financial performance of our China operations in the second half.
Our wealth proposition was enhanced with an expanded product range and improved servicing capabilities. We introduced the Morning Star asset allocation tool to help in clients’ asset allocation. We were the first foreign bank to offer financial needs analysis and enable customers to make purchases of structured investment products online. These improvements
resulted in a 44% increase in consumer banking income.
We grew treasury customer income by focusing on the foreign exchange and commodity hedging needs of corporate clients and the investment needs of affluent customers. We were the first to introduce equity-linked notes tailored to an individual customer’s requirements. Moreover, we are able to structure and deliver the customised product within a day of receiving the request.
We fully leveraged our regional connectivity strength to win loan syndication deals. We were the sole arranger for the largest USD syndicated loan in Chongqing for the Chongqing Grain Group, a leading China agricultural corporate.
Clients have positive feedback on our enhanced products and services, as well as our stepped-up engagement with them. We are heartened by the results of externally-conducted customer surveys. In SME banking, we realigned our sales team structure to enable relationship managers to better focus on client servicing. This effort helped us to be named “Best Foreign Bank for Small Business Lending in China” by Global Finance and “Best Foreign Bank” by China Association for Small and Medium Enterprises (CASME)in 2013.
New licences granted to us during the year provide us with new areas of growth. We were appointed by the State Administration of Foreign Exchange as an official market-maker in USD/CNY and SGD/RMB foreign exchange spot and forward contracts. In June, we were among the first batch of foreign banks to win approval to sell domestic unit trusts, which enhanced our wealth proposition. In the fourth quarter, we were one of the first two foreign banks to receive approval to open a sub-branch in the Shanghai Free Trade Zone. We believe that this zone provides a test ground for interest rate liberalisation, RMB internationalisation and the opening up of capital markets. We intend to take full advantage of these opportunities in the coming years.
“Best Consumer Bank, Foreign” by
global Finance
“Best Foreign Bank for small
Business Lending in China” by
global Finance
“Best Foreign Bank” by Casme
maKinG headwaY in retaiL BanKinG
maKinG headwaY in Sme BanKinG
40 DBS AnnuAl RepoRt 2013

taiwanTaiwan’s economic growth slowed to 2.1% from sluggish external demand and domestic factors. Despite reduced corporate loan demand and increased credit quality concerns, we managed to grow our Taiwan franchise while renewing our focus on credit quality.
In consumer banking, we enhanced our foreign exchange product range. With the launch of an RMB business, our Treasures customer base increased by one-quarter as 5,000 customers signed up, with deposits in excess of RMB 1 billion.
We cemented our position as a leading banking partner to SMEs. We became the second-largest SME lender among foreign banks with a 37% share of loans by foreign banks. Our strong treasury and cash management capabilities, together with our extensive electronic and mobile channels for customers, helped us achieve 25% income growth in the SME segment. We were named “Best Overall Domestic / Cross-border Cash Management Services Provider in Taiwan” for small corporates by Asiamoney magazine.
Treasury sales had a strong performance as more financial institutions as well as corporate and individual clients came to us for structured and currency hedging products. With the Group’s success in offshore RMB products, we were able to capitalise on the deregulation of the offshore RMB market in Taiwan, which enabled customers to make RMB deposits and investments. Income from RMB derivatives grew more than three times as derivative volumes increased five-fold. Our RMB one-year structured investment product garnered RMB 80 million within a few months of its launch.
Our success is predicated on the ability to offer customers connectivity to other Asian markets. We serve more than 200 Taiwanese companies with operations in China, Hong Kong, Singapore, India and Indonesia. In addition to credit facilities, we provide cross-border financial services such as capital market issuance, foreign exchange hedging and trade transactions to these clients.
SoUth and SoUtheaSt aSia
Financial performance (SGd m)
2013 2012
Income 600 591
Expenses 283 275
Profit before allowances
317 316
Net profit 198 293
Total income grew 2% to SGD 600 million as the underlying franchise remained resilient despite a challenging macroeconomic environment. Net profit fell 32% as allowances rose from SGD 38 million to SGD 126 million mainly due to higher specific allowances.
indiaIndia’s economy and currency were affected by volatile financial markets during the year, which dented business confidence and consumer demand. The challenging environment resulted in muted balance sheet growth and an increase in non-performing loans in parts of our mid-sized corporate portfolio. We are the fourth-largest foreign bank by assets and strongly believe in India’s long-term growth potential. While slowing down during the year, we took steps to strengthen our franchise to prepare ourselves for the time when growth opportunities return.
We strengthened our credit processes, from the origination of new loans to the monitoring of existing ones. We also took steps to increase overall returns and improve
wallet share by conducting in-depth account planning for key corporate clients. We set up an India desk in Singapore to drive offshore business opportunities arising from Indian corporates’ growing regional operations.
Non-interest income was boosted by a range of treasury, cash management and trade activities. We concluded seven debt capital market transactions, including a successful USD 200 million five-year high-yield issue for Rolta, a leading information technology corporation, as well as a SGD 250 million bond, followed by a retap of 150 million, for Tata Communication.
We launched a mobile banking platform for corporate clients to perform transaction banking services on the go. We enhanced our proposition for non-resident Indians with the launch of a remittance service for Singapore-based clients to transfer funds to any bank in India. Since the launch, almost SGD 200 million has been remitted through the online platform, with an average daily transaction count of 900 in December. We launched two foreign currency non-resident (FCNR) products, garnering USD 500 million of FCNR deposits that were subsequently swapped with the Indian central bank during a limited window, enabling clients to capitalise on a short-term opportunity.
We continued to grow our customer franchises as we added close to 1,000 corporate and 5,000 individual customers.
StronG CaPaBiLitieS to SUPPort CorPorateS in taiwan
“Best Overall Domestic / Cross-border Cash Management Services Provider in Taiwan” for small corporates by Asiamoney
StronG CaPaBiLitieS to SUPPort CorPorateS in india
“Best FX solutions provider in india” by global Finance
“Best Foreign Cash management Bank for medium corporates” by asiamoney
41management disCussion

indonesiaIndonesia’s economic growth slowed to 5.8% from accelerating inflation, falling export prices and slower foreign investment. In the middle of the year, Indonesian financial markets were also affected as capital outflows led to IDR depreciation and volatility in financial asset prices.
Despite the challenging environment, we recorded strong growth in corporate banking and wealth management. To drive higher returns, we managed net interest margin by ensuring price discipline and focusing on target customer segments. In the large corporate segment, we utilised our knowledge in sectors such as commodities and our regional connectivity to support clients’ cross-border financing needs. Among SMEs, our cash management, trade and treasury capabilities helped us to be recognised as “Best Foreign Cash Management Bank for Small Corporate” by Asiamoney magazine.
Our reputation as Asia’s safest bank as well as our extensive product capabilities helped us gain customers among affluent individuals. Widely recognised as one of the top three wealth management banks in Indonesia with competitive investment product suites, we also leveraged our treasury capabilities to structure products with higher returns for customers.
Customers
imProvinG CUStomer aCCeSS
Our network spans key Asian markets, enabling us to connect customers with opportunities across the region. Many of our competitors either focus on a particular sub-region, or do not have the Asian roots, insights and connectivity that we do. Our distribution and product capabilities enable us to offer “one-bank” solutions to serve both the personal and business needs of customers.
In Singapore, we have more than 2,300 distribution points – including branches, ATMs and self-service banking machines – that enable our individual customers to perform a variety of transactions such as paying bills and buying movie tickets besides making cash withdrawals. The usage of our ATM channel is among the highest in the world. Every hour, we also have 39,000 online and mobile transactions as well as enquiries, one of the highest in Singapore.
Our branch network in Singapore is in the process of being transformed to make customer transactions faster, easier and more convenient. Our state-of-the-art flagship branch at Marina Bay Financial Centre offers customers touch-pads to shorten the time needed to complete forms. These innovations have reduced queue times, while sales volumes and customer satisfaction have improved. On the back of this success, we have been extending the new branch design to other branches.
Besides re-modelling, we have been increasing the number of touchpoints over the years. To complement our network of full branches, we added mini-branches at high traffic locations and community centres. In April 2013, we began to progressively install ATMs at 83 Buzz Pod convenience stores located at bus interchanges, MRT stations, shopping malls, and residential estates. These additional outlets will complement our partnerships with 7-Eleven and the post office.
In India, our 12 branches, including our headquarters in Mumbai, are located in cities that account for more than 75% of the total trade transacted by companies in India. While our reach enables us to support corporate clients, a larger distribution network will let us serve affluent individuals better and improve our positioning for garnering additional cash management mandates. We have therefore applied for four more branches and are studying the guidelines for foreign bank subsidiarisation, which would allow us to rapidly fast-track our growth in the country.
ProvidinG innovative SoLUtionS
Innovation is a key item on our agenda, because we believe companies that do not embrace the digital age are likely to become extinct. Customers want banking services but not necessarily banks. They want to be able to bank on the fly as they go about their daily activities. One of our aims is to maintain leadership in electronic payments and mobile banking.
During the year, we revamped our online wealth platform to incorporate a number of industry firsts. Our mobile banking app strategy was ranked #1 in the world by Swiss research firm MyPrivateBanking in 2013.
For corporates and SMEs, we launched a fully automated online account opening service in Singapore.
In 2014, we announced a partnership with IBM to deploy its Watson cognitive computing innovation to our wealth management business. IBM Watson will help DBS’ relationship managers analyse large volumes of complex unstructured and structured data, including research reports, product information and customer profiles; and weigh various financial options available to customers. By harnessing big data, we hope to deliver a better customer experience by providing insights that are more precise, customised and actionable.
StronG CaPaBiLitieS to SUPPort CorPorateS in indoneSia
“Best treasury and working Capital Bank for mnC/Large Corporate” by asiamoney
“Best Cash management solution Bank” by asiamoney
“Best FX Bank” by global Finance
42 DBS AnnuAl RepoRt 2013
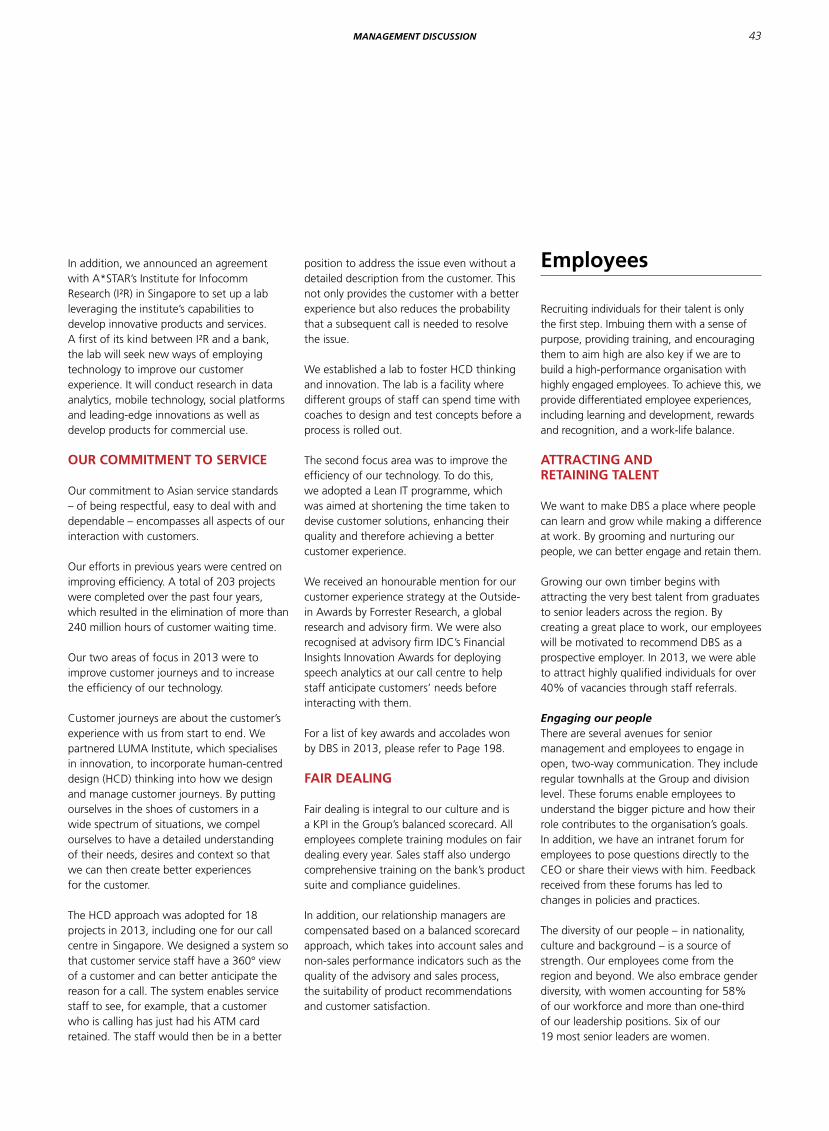
In addition, we announced an agreement with A*STAR’s Institute for Infocomm Research (I²R) in Singapore to set up a lab leveraging the institute’s capabilities to develop innovative products and services. A first of its kind between I²R and a bank, the lab will seek new ways of employing technology to improve our customer experience. It will conduct research in data analytics, mobile technology, social platforms and leading-edge innovations as well as develop products for commercial use.
oUr Commitment to ServiCe
Our commitment to Asian service standards – of being respectful, easy to deal with and dependable – encompasses all aspects of our interaction with customers.
Our efforts in previous years were centred on improving efficiency. A total of 203 projects were completed over the past four years, which resulted in the elimination of more than 240 million hours of customer waiting time.
Our two areas of focus in 2013 were to improve customer journeys and to increase the efficiency of our technology.
Customer journeys are about the customer’s experience with us from start to end. We partnered LUMA Institute, which specialises in innovation, to incorporate human-centred design (HCD) thinking into how we design and manage customer journeys. By putting ourselves in the shoes of customers in a wide spectrum of situations, we compel ourselves to have a detailed understanding of their needs, desires and context so that we can then create better experiences for the customer.
The HCD approach was adopted for 18 projects in 2013, including one for our call centre in Singapore. We designed a system so that customer service staff have a 360° view of a customer and can better anticipate the reason for a call. The system enables service staff to see, for example, that a customer who is calling has just had his ATM card retained. The staff would then be in a better
position to address the issue even without a detailed description from the customer. This not only provides the customer with a better experience but also reduces the probability that a subsequent call is needed to resolve the issue.
We established a lab to foster HCD thinking and innovation. The lab is a facility where different groups of staff can spend time with coaches to design and test concepts before a process is rolled out.
The second focus area was to improve the efficiency of our technology. To do this, we adopted a Lean IT programme, which was aimed at shortening the time taken to devise customer solutions, enhancing their quality and therefore achieving a better customer experience.
We received an honourable mention for our customer experience strategy at the Outside-in Awards by Forrester Research, a global research and advisory firm. We were also recognised at advisory firm IDC’s Financial Insights Innovation Awards for deploying speech analytics at our call centre to help staff anticipate customers’ needs before interacting with them.
For a list of key awards and accolades won by DBS in 2013, please refer to Page 198.
Fair deaLinG
Fair dealing is integral to our culture and is a KPI in the Group’s balanced scorecard. All employees complete training modules on fair dealing every year. Sales staff also undergo comprehensive training on the bank’s product suite and compliance guidelines.
In addition, our relationship managers are compensated based on a balanced scorecard approach, which takes into account sales and non-sales performance indicators such as the quality of the advisory and sales process, the suitability of product recommendations and customer satisfaction.
employees
Recruiting individuals for their talent is only the first step. Imbuing them with a sense of purpose, providing training, and encouraging them to aim high are also key if we are to build a high-performance organisation with highly engaged employees. To achieve this, we provide differentiated employee experiences, including learning and development, rewards and recognition, and a work-life balance.
attraCtinG and retaininG taLent
We want to make DBS a place where people can learn and grow while making a difference at work. By grooming and nurturing our people, we can better engage and retain them.
Growing our own timber begins with attracting the very best talent from graduates to senior leaders across the region. By creating a great place to work, our employees will be motivated to recommend DBS as a prospective employer. In 2013, we were able to attract highly qualified individuals for over 40% of vacancies through staff referrals.
engaging our peopleThere are several avenues for senior management and employees to engage in open, two-way communication. They include regular townhalls at the Group and division level. These forums enable employees to understand the bigger picture and how their role contributes to the organisation’s goals. In addition, we have an intranet forum for employees to pose questions directly to the CEO or share their views with him. Feedback received from these forums has led to changes in policies and practices.
The diversity of our people – in nationality, culture and background – is a source of strength. Our employees come from the region and beyond. We also embrace gender diversity, with women accounting for 58% of our workforce and more than one-third of our leadership positions. Six of our 19 most senior leaders are women.
43management disCussion

To support our employees in their various life stages, we have flexible work initiatives in place. In recognition of our family-friendly work environment, we were the only bank to win the “Best Company for Mums” award from the Singapore National Trades Union Congress and the Tripartite Alliance for Fair Employment Practices.
We also seek to create a work environment that is fun. We organise year-round events including sports and games, workshops and talks, bazaars and performances to promote interaction and a sense of excitement. In Singapore, we have a tradition of holding a DBS Family Day together with the DBS Marina Regatta, Singapore’s biggest water sports festival. The annual Family Day in Taiwan was integrated into a fair in support of social enterprises.
Our efforts have been recognised. In recent years, we have steadily improved our employee engagement scores in annual surveys conducted by Gallup. We now
rank among the top 10% of all financial institutions and companies surveyed by Gallup. We were one of only three Asian companies to be awarded the 2013 Gallup Great Workplace Award. We were also recognised by The Asian Banker for our employee engagement in Asia.
giving rewards and recognitionWe recognise employees who go the extra mile for customers. The annual Banking the Asian Way Awards recognise teams and individuals who exemplify our unique brand of banking through the following: Asian Relationships, Asian Insights, Asian Service, Asian Innovation and Asian Connectivity.
We enhanced our package of employee benefits. At the same time, employees can determine for themselves which basket of benefits suits them best.
supporting learning and developmentEvery year, we engage employees with three performance conversations which also focus
on their career aspirations and development opportunities. Our performance management system not only measures the “what” but also considers the “how” to ensure sustainability in performance and alignment to DBS values.
Learning and development programmes are carried out by the DBS Academy, an in-house school with centres in Singapore, Hong Kong and Shanghai. The academy devises programmes in collaboration with business and support units to help our people deliver a differentiated customer experience.
BUiLdinG the neXt Generation oF LeaderS
We have a rigorous talent and leadership management process to identify and develop the next generation of leaders at all levels. The structured development programme comprises training, experiential learning, mentoring and internal mobility.
More than one in three leaders at DBS are women
44 DBS AnnuAl RepoRt 2013

talent programmesOur senior leaders are committed to building a strong leadership culture at DBS and take an active role in nurturing talent and the development of future leaders.
We introduced four new programmes in 2013 to groom recent diploma and degree holders who aspire to excel in retail banking, SME banking and customer service.
We identify the talent pool for more senior employees by using an all-round approach that includes the individual’s performance, reviews by peers and subordinates, and external talent identification and management tools. For this pool, we designed and built new leadership programmes in 2013 to supplement existing ones.
internal mobilityAs part of the process to nurture talent from within, we have in place an internal mobility programme since 2010. Staff are strongly encouraged to leverage opportunities provided by the programme to work across departments, businesses and countries. Employees holding corporate ranks up to Assistant Vice-President who have worked two years in their current role can seek to be placed in a new role with two months’ notice. For more senior employees, the corresponding periods are three years and three months. In 2013, more than one-quarter of our positions were filled by internal transfers.
We have a programme in place for senior employees with high potential to be rotated to different parts of the organisation. The rotations include assignments to lead major projects or stints with various businesses or countries. In 2013, one-third of such employees were given new job assignments or expanded roles.
regulators
Containing systemic risk in the financial sector continues to be a significant concern among regulators globally. We are committed to maintaining financial system stability.
Our policies and processes aim to ensure compliance with both letter and spirit of laws and regulations in the countries we operate in. We inculcate a strong compliance culture, and our employees are required to attend regular training sessions to refresh and update their knowledge of compliance requirements. The principles of our compliance framework are outlined in the Corporate Governance report. We believe this approach supports our application for licences in markets, and for products and services. During the year, we were among the first two foreign banks to be given a licence to set up a sub-branch in the Shanghai Free Trade Zone. We will continue to adhere closely to various regulatory requirements as they develop.
We work closely with regulators and industry associations to ensure safety for our customers and their personal data. In 2013, we embarked on a campaign to encourage customers to upgrade their magnetic stripe credit cards to chip cards for enhanced security and at the same time enjoy improved customer benefits. The upgrade is an example of how implementing improved security measures can be combined with an enhanced client experience.
We also work with regulators and the industry to combat the growing threat of cybercrime. In 2013, we demonstrated our monitoring capabilities to regulators and government bodies as we worked with them to address this threat.
We aim to be consistent with the principles and standards set out by the Financial Stability Board (FSB) in relevant areas, including our remuneration policy and risk disclosures. We have adopted standards for our risk disclosures in this annual report to be in line
with the recommendations of the Enhanced Disclosure Task Force set up by the FSB.
Members of senior management continue to be active in regulatory and industry forums. We believe our insights from operating in the region can contribute to the formulation of financial standards and regulations, which can often have a global impact.
Society
PoSB
POSB has served generations of Singaporeans since 1877 and is regarded as the “People’s Bank”. Over the years, the bank has evolved its products and services to meet the changing needs and lifestyle of customers. At the same time, POSB remains actively involved in grassroots activities, and engages the young to the seniors through community initiatives. In 2013, POSB supported more than 40 community events led by grassroots organisations.
POSB partners local community associations to organise programmes that inculcate the habit of regular savings among young people. In 2013, over 7,200 children from lower-income families benefited from them. We also collaborated with the Women’s Initiative for Ageing Successfully, a non- profit group, to help seniors adapt to electronic banking as well as gain financial knowledge relevant for an active lifestyle. In 2013, 26% of our senior customers started using self-service banking machines and Internet banking, compared to 19% in 2011.
We also worked with special needs schools to educate students on basic life skills such as banking. We supported the National Library Board to promote a vibrant reading environment at four of its branches.
Since 2009, POSB has been strengthening community bonds through the POSB PAssion Run for Kids, which has raised more than
45management disCussion

SGD 3 million and benefited over 68,000 children in Singapore to date. In 2013, more than 8,500 people took part in the charity run.
CorPorate SoCiaL reSPonSiBiLitY – dBS FoUndation
Underlining our commitment to be a force for good in the communities we operate in, we announced the establishment of a SGD 50 million foundation in February 2014 to strengthen our corporate social responsibility efforts across Asia.
Since our inception as the Development Bank of Singapore, we have progressed over more than four decades alongside Singapore’s development. The foundation will channel our efforts to contribute to the future development of Singapore and play a bigger role in the future of Asia.
Through the foundation, we will scale up our support for communities and social enterprises in Asia, and make a greater
impact in addressing the region’s evolving social needs. The foundation will also provide relief and support to communities in times of need, for example, during natural disasters or crises.
promoting social enterprisesBesides the DBS Foundation, we have ongoing corporate social responsibility efforts to champion social entrepreneurship. We seek to empower social enterprises to become commercially viable while pursuing their social objectives.
Our support for social enterprises is anchored around a three pronged framework: promoting the development of the social enterprise sector, supporting selected enterprises through funding and mentorship, and integrating social enterprises into our culture and operations.
We work closely with other organisations to promote the development of social enterprises. We partnered the National University of Singapore Enterprise to launch
the inaugural DBS-NUS Social Venture Challenge Asia to identify and support new social ventures across the region that have the potential to make a sustained and meaningful social impact. The response was overwhelming as we received more than 400 submissions from aspiring and existing social entrepreneurs from 20 countries. We also launched a similar programme in China in partnership with YouChange Foundation.
During the year, we supported more than 50 initiatives, including conferences, workshops and training programmes involving close to 20,000 participants from 200 social enterprises across Asia. For example, we worked with HUB Singapore – a group dedicated to bringing people, ideas and funding together to create a better future – to organise a series of boot camps for aspiring social entrepreneurs. Other partners we worked with in Singapore and the region included the Social Enterprise Association, Enactus, Social Innovation Park and Shujog.
DBS employees creating a more conducive environment for hearing impaired students
46 DBS AnnuAl RepoRt 2013

We also leverage internal and external DBS events to showcase social enterprises. In Taiwan, we held the first Social Enterprises Fair at the National Dr. Sun Yat Sen Memorial Hall to promote social enterprises to the public, with DBS employees and their families as volunteers. In Singapore, we jointly organised the first-ever Social Enterprise Carnival at Marina Bay with the Ministry of Social and Family Development.
We also support selected enterprises with funding. Since 2012, we have provided close to SGD 2 million in grants to 59 social enterprises in Asia. The funds have enabled them to set up businesses or expand existing ones to provide employment opportunities to the disadvantaged. We also demonstrate our commitment to social enterprises by procuring their products and services.
We offer dedicated banking packages to social enterprises. First launched in Singapore in 2008, the DBS Social Enterprise Package is now available in Hong Kong, India, Indonesia, China and Taiwan. DBS is the only bank in Asia to offer a banking package for social enterprises that comes with transactional services that are virtually free. In Singapore, we also offer – as part of the DBS Social Enterprise Package –
unsecured business loans at a preferential annual interest rate that is half of regular commercial rates.
voLUnteeriSm
DBS’ support of social enterprises is extended to our employee volunteer programme. In Singapore, DBS staff and Thinkscape, an education provider, took a group of underprivileged children on heritage trails to learn about the rich and diverse culture of Singapore. In another initiative, Social Creatives, a visual arts group, and DBS staff created a more conducive learning environment for hearing impaired students through the painting of colourful murals at the Canossian School.
We partnered the Hong Kong House of Stories to conduct a series of activities that introduce the cultural heritage and history of Hong Kong to underprivileged children. In recognition of their community service, 89 volunteers from DBS Hong Kong received awards from the city’s social welfare department.
other CommUnitY initiativeS
We are investing SGD 10 million over three years to make Marina Bay a vibrant locale
and a ‘People’s Bay’ that everyone can enjoy. DBS Marina Regatta, Singapore’s biggest water sports festival, brought 15,000 people to the bay over two weekends in 2013. It was bigger and better than the year before, and had a wide range of activities that included dragon boat races, a drum challenge, a cosplay festival and a music concert. More than 2,400 paddlers from close to 140 dragon boat teams participated, a 50% increase over the previous year.
In addition to DBS Marina Regatta, we organise popular events at the bay, including a monthly sailing programme and movie screenings.
CriSiS reLieF eFFortS
In response to the earthquake that hit Ya’an City, Sichuan in April 2013, DBS donated SGD 100,000 towards the relief effort through the Shanghai Charity Foundation. When typhoon Haiyan tore through the Philippines in November 2013, DBS responded swiftly and supported the crisis relief efforts by the Singapore Red Cross. We made available our self-service banking channels, including ATMs, Internet and mobile banking, for donations by our customers. In addition, we also rallied employees to support the victims of typhoon Haiyan by pledging a dollar-for-dollar match for their donations. Collectively, DBS, our customers and employees raised more than SGD 1.2 million.
DBS’ support of social enterprises extends to our employee volunteer programme
47management disCussion

environment
As we move into new premises across the region, we are committed to adopting environmentally-sustainable practices and using eco-friendly materials in the planning, design and construction of the new buildings. Our efforts are well recognised and validated by the certifications awarded to us.
In Singapore, our headquarters and flagship branch at Marina Bay, and our premises in Changi, have been awarded Greenmark Gold certification by Singapore’s Building and Construction Authority. Our newest premises in Jurong also received Greenmark certification in 2013.
Under a scheme initiated by Hong Kong’s Environmental Protection Department to minimise the creation of waste, our offices at One Island East and Millennium City 6 were both awarded the Class of Excellence, and our office at Miramar Tower the Class of Good. In Taiwan, our headquarters meets the standards set by the Leadership in Energy and Environmental Design rating system.
We implemented several measures to reduce the consumption of electricity and water at our premises. They included introducing LED light bulbs, which are more energy-efficient than other lamps, motion-sensor lighting in restrooms, as well as reduced water flow in taps. Recycling bins are provided on every floor and social hub.
waste recycled (tonnes) 2013
Paper 329
Aluminium 8.5
Plastics 4
In a concerted drive to go paperless, we have encouraged our customers to adopt electronic statements.
Given our sizable shareholder base, we distribute our annual reports on compact discs and have developed an online version that can be downloaded from our website or QR codes. Printed copies are available on request.
BUiLdinG a SUStainaBLe BUSineSS
As a provider of financial capital, DBS plays a central role in creating long-term value in the markets we operate in. We recognise the importance of engaging all stakeholders, and being a force for good.
As an organisation, we are committed to environmental, social and governmental (ESG) standards. Our efforts have been recognised in an ESG index created by Bloomberg that was based on data for 2,700 banks worldwide. Our representation of women in our workforce puts us in the 83rd percentile of the index, while the broad-based composition of our Board places us in the 98th percentile for independent directors and the 95th percentile for women on the Board.
In a complex marketplace, we seek to focus on addressing sustainability issues that are material to us. We completed a materiality assessment of our ESG efforts in 2013. The assessment reviewed our practices and processes against external benchmarks such as the AA1000 Stakeholder Engagement Standard and the Global Reporting Initiative framework. The review is intended to help us channel our ESG efforts and improve the process.
diStriBUtinG the vaLUe we Created to oUr StaKehoLderS
We define the value we create for stakeholders as pre-tax profit before discretionary bonuses. In 2013, the value we created amounted to SGD 5.37 billion. The chart shows how we distributed value to our stakeholders in 2013.
Shareholders received 26% of the value created directly in the form of dividends. Variable compensation distributed to employees accounted for 9%. The 12% attributable to society is based on the income and indirect taxes we paid and does not include other contributions such as the DBS Foundation and other corporate social responsibility efforts.
The remaining 53% of the value we generated was kept as retained earnings, which will be used to generate value for stakeholders in the future.
■ Employees – Variable Compensation■ Society – Income Tax Expense■ Shareholders – Dividends■ Retained Earnings – reinvested in
DBS Group
2,83453%
5079%
65312%
1,37626%
value distribution (SGd m)
48 DBS AnnuAl RepoRt 2013

Corporate GovernanCe report
oUr CoMMItMent to GovernanCe
DBS Group Holdings Ltd (DBSH) is fully committed to effective governance to protect the interests of all our stakeholders and to promote the long-term sustainability of the Group. The Group’s efforts in improving corporate governance were recognised and it was named the winner of the Singapore Corporate Governance Award 2013 in the Big Cap Category.
For the financial year ended 2013 (“FY2013”), DBSH has complied with the Banking (Corporate Governance) Regulations 2005 (“Banking Regulations”), and complied in all material aspects with the principles laid down by the Guidelines on Corporate Governance for Banks, Financial Holding Companies and Direct Insurers issued on 3 April 2013, which comprises the Code of Corporate Governance 2012 (“2012 Code” or “Code”) and supplementary guidelines and policies added by the Monetary Authority of Singapore (MAS) (“Guidelines”) to cater to the diverse and complex risks undertaken by financial institutions.
This report is arranged according to the principles listed in the Code. Principles 1 to 6 deal with Board matters, principles 7 to 9 with remuneration, principles 10 to 13 with accountability and audit and principles 14 to 16 with shareholder rights and responsibilities.
BoarD MatterS
tHe BoarD’S ConDUCt oF aFFaIrS (prInCIpLe 1)
Our DirectorsThe Board comprises nine directors, namely Mr Peter Seah Lim Huat (Chairman), Mr Piyush Gupta (Chief Executive Officer or “CEO”), Dr Bart Joseph Broadman, Ms Euleen Goh Yiu Kiang, Mr Ho Tian Yee, Mr Nihal Vijaya Devadas Kaviratne CBE, Mr Andre Sekulic, Mr Danny Teoh Leong Kay and Mrs Ow Foong Pheng.
Please refer to pages 188 to 192 of this Annual Report for key information of each director. Biodata of each director can also be found @ www.dbs.com
Board ResponsibilityThe Board directs the Group in the conduct of its affairs and ensures that corporate responsibility and ethical standards underline the conduct of the Group’s business. It bears ultimate responsibility for the Group’s governance, strategy, risk management and financial performance.
The Board believes that it is important to have a corporate culture imbued with the principles of corporate governance and to this end, seeks to ensure that a robust corporate governance framework is in place to promote transparency, fairness and accountability throughout the organisation.
Board Balance and Diversity
� 1 Executive Director� 8 Non-Executive Directors, out of which 7 are Independent Directors (including the Chairman)� 78% Male, 22% Female
Key responsibilities of the Board
� Setting the strategic vision, direction and long-term goals of the Group and ensuring that adequate resources are available to meet these objectives
� Approving and monitoring capital and financial plans, the annual budget, the annual and interim financial statements, capital expenditures and strategic acquisitions and divestments
� Establishing a framework for risks to be assessed and managed� Reviewing management performance� Determining the Group’s values and standards (including ethical standards) and ensuring that obligations to its stakeholders
are understood and met� Developing succession plans for the Board and CEO � Considering sustainability issues (including environmental and social factors) as part of the Group’s strategy
49

Delegation by the BoardTo enable the Board to discharge its stewardship and fiduciary responsibilities effectively, it delegates authority to Board committees to oversee specific responsibilities based on clearly defined terms of reference.
The terms of reference for each Board committee stipulate the responsibilities of the committee, quorum and voting requirements, as well as qualifications for Board committee membership. Each Board committee has direct access to management and the power to hire independent advisers as it deems necessary. Changes to the terms of reference for any Board committee require Board approval.
An integral part of the Group’s corporate governance framework is the Group Approving Authority (GAA) established by the Board. The GAA sets out the delegation of authority at various levels and is consistently applied throughout the Group. Changes to the GAA require Board approval.
Material transactions requiring Board approval
The material transactions that require Board approval under the GAA include:
� Group’s strategic and business plans� Group’s annual budget � Capital expenditures and expenses exceeding certain material limits� Strategic investments and divestments� Capital-related matters including capital adequacy objectives, capital structure, capital issuance and redemption� Dividend policy� Risk strategy and risk appetite
BoarD oF DIreCtorS
audit Committee
executive Committee
nominating Committee
Board risk Management Committee
Compensation & Management Development
Committee
50 DBS AnnuAl RepoRt 2013

Board Committees The Board committees have been constituted in compliance with the Banking Regulations. A brief description of the composition and responsibilities delegated to each Board committee is set out in the table below.
Board Committee Main areas of oversight Composition Further Information
Executive Committee (Exco)
� Review and provide recommendations on matters that would require Board approval
� Approve non-strategic investments and divestments
Comprises 3 members, of which 2 members (including the Exco chairman) are independent directors.
See page 54 of this report for further information on the composition, responsibilities and activities of the Exco.
Nominating Committee (NC)
� Membership and performance of Board and Board committees
� Independence of directors� Fit and proper qualification of directors � Training of directors� Review key staff appointments
(including CEO, chief financial officer (CFO) and chief risk officer (CRO))
Comprises 5 members, of which 4 members (including the NC chairman) are independent directors. All members are non-executive directors.
See page 55 of this report for further information on the composition, responsibilities and activities of the NC.
Audit Committee (AC) � Financial reporting� Internal controls� Internal audit function� External audit
Comprises 5 members, of which 4 members (including the AC chairman) are independent directors. All members are non-executive directors.
See pages 70 to 71 of this report for further information on the composition, responsibilities and activities of the AC.
Board Risk Management Committee (BRMC)
� Risk appetite� Risk governance� Risk frameworks� Risk management practices
and policies
Comprises 6 members, all of whom are independent and non-executive directors.
See page 68 of this report for further information on the composition, responsibilities and activities of the BRMC.
Compensation and Management Development Committee (CMDC)
� Compensation policies� Remuneration framework of directors
and employees� Management development and
succession planning
Comprises 4 members, all of whom are independent and non-executive directors.
See page 58 of this report for further information on the composition, responsibilities and activities of the CMDC.
Board Meetings and Attendance The Board meets on a regular basis, and ad-hoc meetings are held where warranted. During the scheduled Board meetings, the Board is updated by management on the Group‘s business activities and performance to enable the Board to have a deeper insight into the Group’s businesses. The Chairman of each Board committee will also update the Board on the matters discussed during the respective Board committee meetings.
When exigencies prevent a director from attending a Board meeting in person, he or she can participate by telephone or video-conference. Board approvals for routine matters in the ordinary course of business can also be obtained through written resolutions approved by circulation as permitted under the Articles of Association of DBSH.
51CORpORAte GOveRnAnCe RepORt
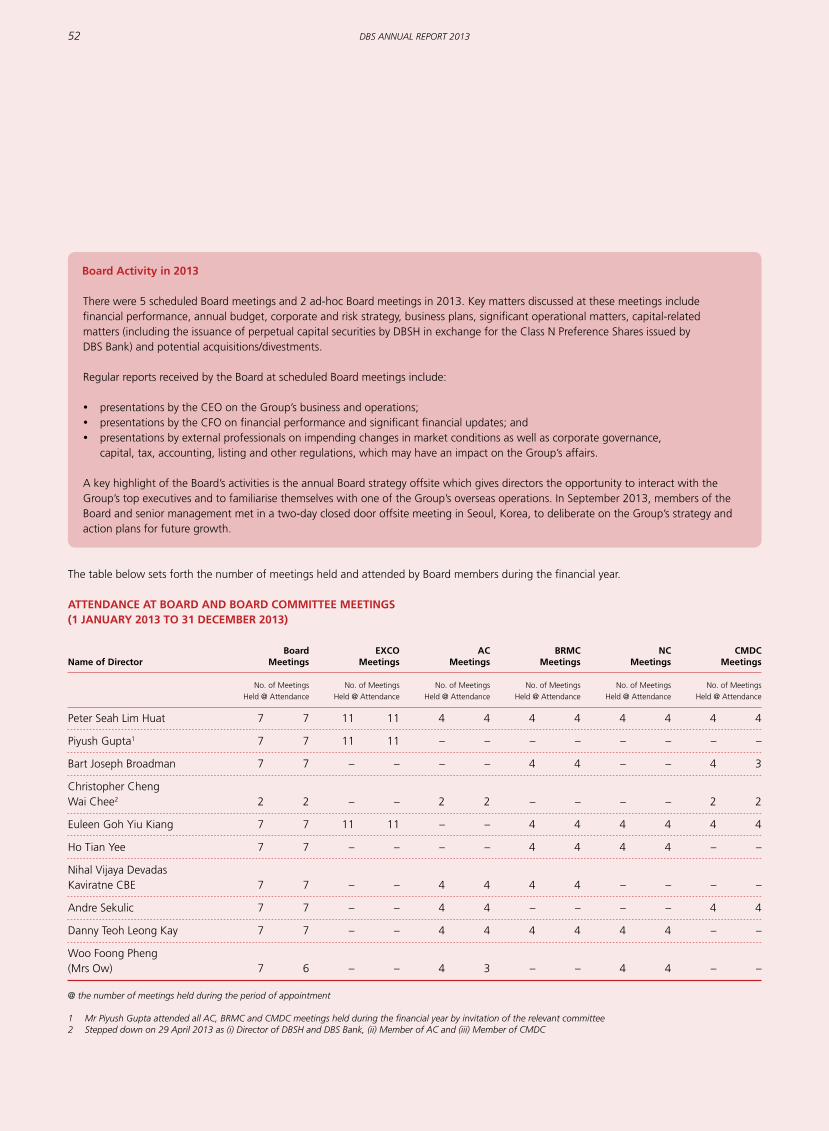
The table below sets forth the number of meetings held and attended by Board members during the financial year.
attenDanCe at BoarD anD BoarD CoMMIttee MeetInGS (1 JanUarY 2013 to 31 DeCeMBer 2013)
Board eXCo aC BrMC nC CMDCname of Director Meetings Meetings Meetings Meetings Meetings Meetings
No. of Meetings No. of Meetings No. of Meetings No. of Meetings No. of Meetings No. of Meetings
Held @ Attendance Held @ Attendance Held @ Attendance Held @ Attendance Held @ Attendance Held @ Attendance
Peter Seah Lim Huat 7 7 11 11 4 4 4 4 4 4 4 4
Piyush Gupta1 7 7 11 11 – – – – – – – –
Bart Joseph Broadman 7 7 – – – – 4 4 – – 4 3
Christopher Cheng Wai Chee2 2 2 – – 2 2 – – – – 2 2
Euleen Goh Yiu Kiang 7 7 11 11 – – 4 4 4 4 4 4
Ho Tian Yee 7 7 – – – – 4 4 4 4 – –
Nihal Vijaya Devadas Kaviratne CBE 7 7 – – 4 4 4 4 – – – –
Andre Sekulic 7 7 – – 4 4 – – – – 4 4
Danny Teoh Leong Kay 7 7 – – 4 4 4 4 4 4 – –
Woo Foong Pheng (Mrs Ow) 7 6 – – 4 3 – – 4 4 – –
@ the number of meetings held during the period of appointment
1 Mr Piyush Gupta attended all AC, BRMC and CMDC meetings held during the financial year by invitation of the relevant committee2 Stepped down on 29 April 2013 as (i) Director of DBSH and DBS Bank, (ii) Member of AC and (iii) Member of CMDC
Board activity in 2013
There were 5 scheduled Board meetings and 2 ad-hoc Board meetings in 2013. Key matters discussed at these meetings include financial performance, annual budget, corporate and risk strategy, business plans, significant operational matters, capital-related matters (including the issuance of perpetual capital securities by DBSH in exchange for the Class N Preference Shares issued by DBS Bank) and potential acquisitions/divestments.
Regular reports received by the Board at scheduled Board meetings include:
� presentations by the CEO on the Group’s business and operations;� presentations by the CFO on financial performance and significant financial updates; and� presentations by external professionals on impending changes in market conditions as well as corporate governance,
capital, tax, accounting, listing and other regulations, which may have an impact on the Group’s affairs.
A key highlight of the Board’s activities is the annual Board strategy offsite which gives directors the opportunity to interact with the Group’s top executives and to familiarise themselves with one of the Group’s overseas operations. In September 2013, members of the Board and senior management met in a two-day closed door offsite meeting in Seoul, Korea, to deliberate on the Group’s strategy and action plans for future growth.
52 DBS AnnuAl RepoRt 2013
Board Induction and trainingA comprehensive and tailored induction is arranged as part of the on-boarding programme for every new director to familiarise him or her with the discharge of his or her duties and to introduce the Group’s business and governance practice and arrangements, amongst others. The Group also encourages and make arrangements for first-time directors to attend the Singapore Institute of Directors’ ‘Listed Companies Directorships’ programme.
Please refer to page 56 of this report for details on the selection criteria and nomination process as well as the induction programme for new directors.
A continuous development programme was introduced in 2010 to enhance Board effectiveness. The objective of this programme is to provide directors with training by external professionals and management to keep them abreast of legal, regulatory, corporate governance and economic developments which are relevant to the business and operations of the Group. To ensure that the topics covered under this programme are relevant and appropriate, the NC regularly reviews the schedule and proposes topics that would meet the objective of the programme. In 2013, the programme covered topics such as key developments in China, US and the region, overview of the Singapore Personal Data Protection Act, update on European banking developments, and update on directors’ duties under recent legislative and corporate governance initiatives.
BoarD CoMpoSItIon anD GUIDanCe (prInCIpLe 2)
Independence of JudgementThere is a strong independent element on the Board, with the independent directors making up more than two-thirds of the Board. The number of independent directors exceeds the requirements set out in the Code, Guidelines and Banking Regulations. This ensures that the Board is able to exercise objective judgment on corporate affairs independently.
Annual Review of Director’s IndependenceThe NC conducts a review and determines annually whether each director is independent. In making its determination, the NC considers whether a director is: (i) independent of management and business relationships (for example, an independent director should not be a former employee or significant customer or supplier of the Group, a close relative of an executive director, or related to any of the Group’s external auditors, lawyers, consultants or service providers); (ii) independent from substantial shareholders; and (iii) independent based on length of service. Independence is assessed in compliance with the stringent standards required of financial institutions prescribed under the Banking Regulations.
The seven directors considered independent by the NC are Dr Bart Broadman, Ms Euleen Goh, Mr Ho Tian Yee, Mr Nihal Kaviratne, Mr Peter Seah, Mr Andre Sekulic and Mr Danny Teoh. The independent directors provide the Board with objectivity and a balance of perspectives. They also ensure that the performance of management is objectively measured against the key performance indicators established annually to measure and guide management performance.
Ms Euleen Goh, Mr Ho Tian Yee, Mr Nihal Kaviratne, Mr Peter Seah and Mr Danny Teoh are on the boards of companies that have a banking relationship with DBS, and are also directors of companies linked to Temasek Holdings (Private) Limited (“Temasek-linked Companies”), DBSH’s substantial shareholder. However, the NC considers the above-named directors (i) independent of business relationships as the revenues arising from such relationships are not material; and (ii) independent of the substantial shareholder as their appointments on the boards of Temasek-linked Companies are non-executive in nature and they are not involved in the day-to-day conduct of these companies’ businesses. Mrs Ow Foong Pheng, who is a Permanent Secretary for the Ministry of Trade and Industry, Singapore, is considered not independent of the substantial shareholder as the Singapore government is the ultimate owner of Temasek Holdings (Private) Limited. However, Mrs Ow Foong Pheng is considered independent of management and business relationships with DBSH.
Robust procedures have been instituted to manage potential conflicts of interest between a director and the Group. Such conflicts could arise, for instance, when the Group extends credit facilities or provides products or services to a director’s company. An appropriate account tagging mechanism has been put in place to monitor and control the occurrences of conflicts, which are then escalated for aggregation purposes under the SGX-ST Listing Manual (“SGX Listing Rules”). Exposures of DBS Bank Ltd (“DBS Bank” or the “Bank”) to the individual directors and their respective related concerns are tabled at the quarterly Board meetings.
53CORpORAte GOveRnAnCe RepORt

Board CompositionThe Board is of the view that the size of the Board is appropriate, given the current size and geographic footprint of the Group’s operations. The NC reviews the size and composition of the Board at least annually, taking into account the requirements of the business and the resourcing level required at Board committees. The Board members collectively bring range and depth of experience and industry expertise to the table, representing diversity of gender, nationality, skills and knowledge.
executive CommitteeThe Exco is chaired by Mr Peter Seah and comprises Ms Euleen Goh and Mr Piyush Gupta. In accordance with the requirements of the Code, Guidelines and Banking Regulations, the majority of Exco members (including the Chairman) are independent directors.
CHaIrMan anD CHIeF eXeCUtIve oFFICer (prInCIpLe 3)
Separation of the Role of Chairman and the CeOThe Group’s leadership model espouses a clear division of responsibilities between the Chairman and the CEO, which ensures an appropriate balance of power, increased accountability and enhanced independence in decision-making. The Chairman and the CEO are not related.
The Chairman provides clear and distinct leadership to the Board with respect to the Group’s strategic growth. The Chairman maintains open lines of communication with senior management, and acts as a sounding board on strategic and operational matters.
The CEO heads the Group Executive Committee and the Group Management Committee, which are the highest management bodies. He oversees the execution of the Group’s strategy and is responsible for managing its day-to-day operations.
The Board is of the view that it is not necessary to appoint a lead independent director, given that the present Chairman is independent, non-executive and unrelated to the CEO.
Key responsibilities of the exco
Review and provide recommendations on matters that would require Board approval, including:
� strategic matters such as country and business strategies� business plans, annual budget, capital structure and dividend policy� strategic investments or divestments� delegation of authority stipulated by the GAA� weak credit cases
The Board has also delegated to the Exco the authority to approve certain matters such as non-strategic investments and divestments, credit transactions, investments, capital expenditure and expenses that exceed the limits that can be authorised by the CEO.
activities of the exco in 2013
There were 11 Exco meetings held in 2013. In the course of 2013, the Exco reviewed the potential impact on the Group’s operations arising from changes in global market conditions to ensure that the Group’s strategy remains relevant and responsive to changes in business conditions, proposed divestments and investments (such as the proposed sale of the underlying businesses of Hwang-DBS Malaysia Bhd and the proposed sale of DBS’ remaining stake in the Bank of the Philippine Islands), corporate actions (such as the Group’s existing and future debt issuance programmes) and capital expenditure. Weak credit cases were reviewed on a quarterly basis.
54 DBS AnnuAl RepoRt 2013
Role of the ChairmanThe Chairman is responsible for leading the Board to enable the Board to discharge its duties effectively, and for maintaining and enhancing the Group’s standards of corporate governance. He oversees the setting of the agenda of Board meetings in consultation with the CEO to ensure that there is sufficient information and time to address all agenda items, and promotes open and frank debates by all directors at Board meetings. As the Chairman also sits on all the Board committees, he plays an important role in managing the business of the Board and supervising the activities of each Board committee.
The Chairman oversees, guides and advises the CEO and senior management. He also encourages constructive relations within the Board, and between the Board and senior management. Directors and members of the Group Management Committee have the opportunity to interact through regular dinners which are held around the time of each scheduled Board meeting, and at the annual Board strategy offsite.
Finally, the Chairman encourages and facilitates constructive dialogue between shareholders, Board members and management at shareholders meetings.
BoarD MeMBerSHIp (prInCIpLe 4)
nominating CommitteeThe NC is chaired by Mr Peter Seah and comprises Ms Euleen Goh, Mr Ho Tian Yee, Mrs Ow Foong Pheng and Mr Danny Teoh, all of whom are non-executive directors. In accordance with the requirements of the Code, Guidelines and Banking Regulations, a majority (four out of five members of the NC), including the NC Chairman, are independent directors. Mrs Ow Foong Pheng, who is a non-independent director, is considered independent from business relationships and management.
NC members are subject to an annual assessment of their independence as prescribed by the Code, the Guidelines and the Banking Regulations. This independence assessment takes into account the NC members’ business relationships with the Group, relationships with members of management, relationships with the substantial shareholder of DBSH as well as length of service.
Key responsibilities of the nC
� Reviewing regularly the composition of the Board and Board committees� Reviewing the Board’s succession plans for directors, in particular, the Chairman and the CEO � Identifying, reviewing and recommending Board appointments for approval by the Board, taking into account the experience,
expertise, knowledge and skills of the candidate and the needs of the Board � Determining independence of proposed and existing directors, and assessing if each proposed and/or existing director is a fit and
proper person and is qualified for the office of director� Reviewing and recommending to the Board the re-appointment of any non-executive director having regard to their performance,
commitment and ability to contribute to the Board as well as his or her skillset� Conducting on an annual basis an evaluation of the performance of the Board, the Board committees and the directors� Making an annual assessment of whether each director has sufficient time to discharge his or her responsibilities, taking into
consideration multiple board representations and other principal commitments� Exercising oversight of the training of Board members� Reviewing key staff appointments (including CEO, CFO and CRO)
55CORpORAte GOveRnAnCe RepORt

Selection Criteria, nomination process and Induction training for new DirectorsThe NC leads and has put in place a formal and transparent process for the appointment and re-appointment of directors to the Board.
The NC recognizes the importance of an appropriate balance and diversity of industry knowledge, skills, backgrounds, experience, professional qualifications, gender and nationalities in building an effective Board. To achieve this, the NC reviews the Board’s collective skills matrix regularly to ensure that the Board has the appropriate diversity to perform effectively. The matrix takes into account whether a director has the specific knowledge, skills or experience in various areas such as banking/financial services, financial management, economics, specialised audit/accounting, Financial Stability Board principles, remuneration practices, technical sophistication in risk disciplines, strategic planning, country expertise in other markets and strong business network.
As part of the formal process for the appointment of new directors, the NC reviews the composition of the Board and Board committees and identifies the skillsets which will enhance the effectiveness of the Board and the relevant Board committees. Thereafter, suitable candidates are identified from various sources and, in compliance with the Banking Regulations, the NC conducts an initial assessment to:
(i) review a candidate’s qualifications, attributes, capabilities, skills, age, past experience and such other relevant factors as may be determined by the NC to determine whether the candidate is a fit and proper person for the office in accordance with the MAS’ fit and proper guidelines (which require the candidate to be competent, honest, to have integrity and be of sound financial standing); and
(ii) ascertain whether the candidate is independent from any substantial shareholder of the Group and/or from management and business
relationships with the Group.
The NC then proceeds to interview short-listed candidates to determine if he or she possesses the qualifications and skills required and makes its recommendations to the Board accordingly.
Upon appointment, a new director receives his or her letter of appointment, and is issued with a Directors’ Handbook setting out a director’s duties, responsibilities and disclosure obligations as a director of a financial institution. He or she is also briefed on key disclosure duties and statutory obligations. The new director also gains an understanding of the Group’s management, business and governance practices through a series of detailed induction briefings by members of senior management on the Group’s various businesses and support functions.
terms of AppointmentThe Group has a standing policy that a non-executive director may serve up to a maximum of 3 three-year terms. The Group considers this tenure to be appropriate for members to gain an understanding of the Group and to make an effective contribution. None of the incumbent directors have served more than 6 years.
Prior to the end of each three-year term, there is a formal process in place for the NC to consider whether to extend the tenure of the non-executive director. If a non-executive director is a member of the NC, he or she will recuse himself or herself from deliberations on his or her own re-appointment.
Rotation and Re-election of DirectorsOne-third of directors who are longest-serving are required to retire from office every year at the Annual General Meeting (AGM). Based on such a rotation process, each director is required to submit himself or herself for re-election by shareholders at least once every three years.
Where an existing director is required to retire from office, the NC reviews the composition of the Board and takes into account factors such as that existing director’s attendance, participation, contribution and competing time commitments when deciding whether to recommend that director for re-election.
56 DBS AnnuAl RepoRt 2013

Dr Bart Broadman, Mr Piyush Gupta and Mr Ho Tian Yee shall be retiring by rotation at the AGM to be held on 28 April 2014 (“2014 AGM”). At the recommendation of the NC, they will be seeking re-election at the 2014 AGM.
In addition, as Mr Nihal Kaviratne will be turning 70 years of age before the 2014 AGM, he is required under Section 153 of the Companies Act to step down at the 2014 AGM. At the recommendation of the NC, Mr Nihal Kaviratne will be seeking shareholders’ approval for re-appointment as a director at the 2014 AGM.
Directors’ time CommitmentAs a director’s ability to commit time to the Group’s affairs is essential for performance, the NC has formulated guidelines to assess each director’s ability to make such a commitment. The guidelines consider the number of other board and committee memberships a director holds, as well as size and complexity of the companies in which he or she is a board member. All directors are aware of his or her time commitment obligations and have met the requirements under the guidelines. In addition, each director completed a self-assessment of his or her time commitment obligations in 2013. The NC conducts a review of the time commitment of each director on an ongoing basis. The Board believes that each director has to personally determine the demands of his or her competing directorships and obligations and assess how much time is available to serve on the Board effectively. Accordingly, the Board has not made a determination of the maximum number of listed company board representations a director may hold.
BoarD perForManCe (prInCIpLe 5)
The NC makes an assessment at least once a year to determine whether the Board and Board committees are performing effectively and identifies steps for improvement. The evaluation covers a range of issues including Board composition as well as the timeliness and quality of information provided to the Board. As part of the Board effectiveness evaluation for 2013, each director completed a Board evaluation questionnaire and returned it to the Chairman. The evaluation results were discussed with the NC and the Board, and key action steps were mapped with the goal of enhancing the effectiveness of the Board and the Board committees.
aCCeSS to InForMatIon (prInCIpLe 6)
Prior to each Board and Board committee meeting, directors are provided with complete and relevant information concerning agenda items in a timely manner. All such information is uploaded onto a board portal which can be readily accessed on tablet devices provided to the directors by DBSH.
Directors have direct access to senior management and may request from management such additional information as needed in order to make informed and timely decisions. Directors have the discretion to engage external advisers at the expense of the Group.
Directors have separate and independent access to the Group Secretary at all times. The Group Secretary attends all Board meetings and ensures that applicable rules and regulations are complied with. The Group Secretary facilitates communication between the Board, its committees and management, and the induction of new directors, and generally assists directors in the discharge of their duties. The appointment and removal of the Group Secretary require the approval of the Board.
57CORpORAte GOveRnAnCe RepORt

reMUneratIon MatterS
proCeDUreS For DeveLopInG reMUneratIon poLICIeS (prInCIpLe 7)LeveL anD MIX oF reMUneratIon (prInCIpLe 8)
Remuneration StrategyThe quality and commitment of our human capital is fundamental to our success. The overall objective of the Group’s remuneration policy is to establish a framework for attracting, retaining and motivating employees, and creating incentives for delivering long-term performance within established risk limits. The policy reinforces a culture that rewards for performance. The Group’s remuneration policy aims to be consistent with the principles and standards set out by the Financial Stability Board (FSB) and the relevant local regulators where it operates.
Our reward strategy aims to drive pay for performance culture and is aligned to our risk framework. It also balances the need for us to win the war for talent in the banking industry while protecting the long-term interests of our shareholders. Performance is judged, not only on what is achieved, but also on how it is achieved as well as alignment to the Group’s values.
GovernanceThe governance of the Group’s remuneration policy (including design, implementation and ongoing review) falls under the remit of the CMDC. The CMDC ensures that the balance between shareholder returns and remuneration is appropriate.
Compensation and Management Development CommitteeThe CMDC is chaired by Mr Peter Seah and comprises Dr Bart Broadman, Ms Euleen Goh and Mr Andre Sekulic, all of whom are non-executive and independent directors. The number of independent directors exceeds the requirements of the Code, Guidelines and Banking Regulations.
In fulfilling its responsibilities, the CMDC ensures that the Group complies with the corporate governance practices as stipulated under the Code, Guidelines and the Banking Regulations. Details are outlined under Principles 7, 8 and 9 of this report.
The CMDC reviews and approves the Group’s remuneration policy and the annual variable pay pool which are also endorsed at the Board level. It provides oversight of the remuneration of executive directors, senior executives and control functions in line with FSB guidelines. The CMDC also reviews cases where total remuneration exceeds a pre-defined threshold, or where a deferral mechanism is implemented as a risk control process.
The CMDC has direct access to senior management and works closely with the BRMC and the AC when performing its role. In addition, Dr Bart Broadman, Ms Euleen Goh and Mr Peter Seah are also members of the BRMC while Mr Peter Seah and Mr Andre Sekulic are members of the AC. Their membership in other Board committees enable them to make remuneration decisions in a more informed, holistic and independent manner.
Key responsibilities of the CMDC
� Overseeing the Group’s principles and framework of compensation to ensure their alignment with prudent risk-taking to build a sustainable business in the long term
� Overseeing the remuneration of senior executives, including reviewing and approving the remuneration of the executive director� Approving employee incentive schemes and reviewing their effectiveness in employee retention and the creation of long-term
value for the Group � Overseeing management development and succession planning to ensure that management bench strength is robust and able to
cope with attrition and the Group’s expansion plans
58 DBS AnnuAl RepoRt 2013

In 2013, an external management consulting firm, Oliver Wyman, was engaged to provide an independent review of the Group’s compensation system and processes to ensure compliance with the FSB Principles for Sound Compensation Practices. Oliver Wyman and its consultants are independent and not related to DBSH or any of its directors.
As part of the Group’s Talent Management process, an annual review of people plans for the Group’s business and support units was undertaken by DBS Bank and endorsed by CMDC. The review focused on (i) succession and the depth of the talent pipeline; (ii) people development initiatives and readiness of the people plans to support business operations and growth plans; and (iii) quality of the Group talent development programs in each business and support units /countries as well as the state of talent development activities within the Group.
Remuneration approachThe 2 main thrusts of the Group’s remuneration approach are designed to:
� Focus on total compensation DBS manages remuneration from a total compensation perspective. An employee’s total compensation is determined by the Group,
business and individual performances.
DBS participates in remuneration surveys to ensure that its total compensation is competitive against banks of similar size and standing which we compete with for talent.
� alignment with appropriate risk taking behaviour The Group aims to differentiate the ratio between variable and fixed pay according to performance, rank and function. The proportion of
variable pay increases significantly with increase in responsibility and rank. This is in line with the FSB principle to ensure that employee incentives remain focused on prudent risk taking and effective control, depending on the employee’s role.
The payout structure is designed to incentivise employees whose decisions can have a material impact on the Group to adopt appropriate risk behaviour. These employees include senior management, key personnel at business units and senior control staff. The Group defines this group of staff based on their roles as well as the quantum of their variable remuneration and the ratio of their variable to fixed pay, where such employees may have an impact on the risk profile of the Group.
elements of total CompensationAn employee’s total compensation is made up of the following elements:
(1) Fixed pay - Salary
purpose & Link to Strategy operation Measures
� To ensure fixed pay is competitive with other comparable institutions to attract and retain talent
� Cash� Paid monthly� Typically reviewed annually
� Rate set at an appropriate level taking into account market dynamics, the skills, experience, responsibilities and competencies of the employee
total Compensation = + +Salary Bonus Long term Incentive
Fixed pay variable pay variable pay
59CORpORAte GOveRnAnCe RepORt

(2) variable pay – Bonus (Cash) and Long term Incentive (Shares)
purpose & Link to Strategy operation Measures
� To provide a portion of total compensation that is performance rated
� To focus employees on the achievement of objectives which are aligned to value creation for our shareholders
� Awards are delivered in cash and restricted shares (deferred remuneration)
� Awards in excess of a certain threshold are subject to a tiered deferral rate that ranges from 20% – 60%. All deferred remuneration is paid in restricted shares and comprises two elements: the main award and the retention award. The shares given in the retention award constitute 20% of the shares given in the main award. The retention award is designed to retain talent and compensate the staff for the time value of deferral
� Deferred awards vest over 4 years
� Deferred share awards that are unvested are subject to clawback. The clawback will be triggered by events such as a material violation of risk limits, material losses due to negligent risk taking or inappropriate individual behaviour, a material restatement of the Group’s financials due to inaccurate performance measures, and misconduct or fraud
� Annual performance awards are based on the overall Group performance, the business unit or support unit (“Units”) in which the employee works for and the individual performance
� All Units are measured against a balanced scorecard which is agreed at the start of the year. This scorecard is cascaded to all employees in the Unit
� Our performance management system not only measures the “what”, it also considers the “how” to ensure sustainability in performance and alignment to DBS values
Sizing and allocation of variable pay pool The final variable pay pool therefore takes into consideration the need to remain competitive in the markets that the Group operates in while being consistent with our risk appetite.
The Group uses a comprehensive performance management methodology based on the Group Balanced Scorecard (the “Group Scorecard”) approach to determine the size and allocation of the variable pay pool. The Group Scorecard can be found on page 23 of this Annual Report.
Inputs to the Group Scorecard need to be agreed with the Board at the beginning of each year. The Group Scorecard comprises financial and non-financial metrics encompassing employees, customers, shareholders, risks and compliance objectives. The Group Scorecard is cascaded throughout the Group to drive synergies across all Units and strengthen the alignment between pay and performance.
60 DBS AnnuAl RepoRt 2013

A summary of the Performance Management Process is as follows:
objective Setting Interim review performance review
� Individual objectives agreed with manager
� Objectives cover both quantitative and qualitative measures
� Mid-year discussions against objectives, providing opportunities for feedback and to ensure alignment between manager and employee
� Self appraisal followed by performance discussion with manager
� Feedback from control function (Audit, Risk and Finance) taken into consideration where appropriate before final rating issued
The variable pay pool is derived from a combination of bottoms-up and top-down approach. This process of establishing the variable pay pool is as follows:
establish variable pay pool based on quality of execution of Group Balanced Scorecard
This is a function of net profit before tax for the year and appropriate market benchmarks which are approved by the CMDC.
risk adjustments
Further adjusted for risks through review of Returns on Risk-Adjusted Capital (RoRAC).
Further adjustments
Review against other prisms (eg distribution of earnings between employees and shareholders).
allocation of variable pay pool
Variable pay pool allocated to each Unit driven by the evaluation of each Unit’s achievement against the Balanced Scorecard and moderated by inputs
from the control functions.
61CORpORAte GOveRnAnCe RepORt
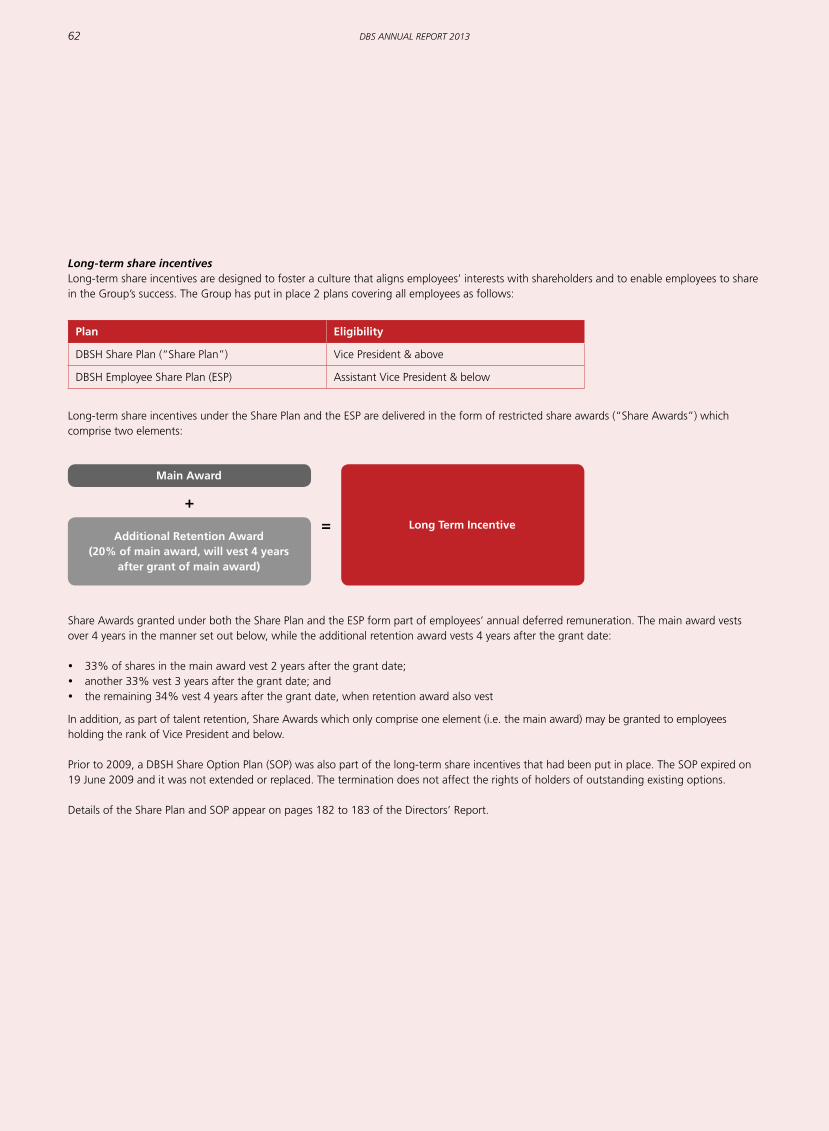
Long-term share incentives Long-term share incentives are designed to foster a culture that aligns employees’ interests with shareholders and to enable employees to share in the Group’s success. The Group has put in place 2 plans covering all employees as follows:
plan eligibility
DBSH Share Plan (“Share Plan”) Vice President & above
DBSH Employee Share Plan (ESP) Assistant Vice President & below
Long-term share incentives under the Share Plan and the ESP are delivered in the form of restricted share awards (“Share Awards”) which comprise two elements:
Share Awards granted under both the Share Plan and the ESP form part of employees’ annual deferred remuneration. The main award vests over 4 years in the manner set out below, while the additional retention award vests 4 years after the grant date:
� 33% of shares in the main award vest 2 years after the grant date;� another 33% vest 3 years after the grant date; and� the remaining 34% vest 4 years after the grant date, when retention award also vest
In addition, as part of talent retention, Share Awards which only comprise one element (i.e. the main award) may be granted to employees holding the rank of Vice President and below.
Prior to 2009, a DBSH Share Option Plan (SOP) was also part of the long-term share incentives that had been put in place. The SOP expired on 19 June 2009 and it was not extended or replaced. The termination does not affect the rights of holders of outstanding existing options.
Details of the Share Plan and SOP appear on pages 182 to 183 of the Directors’ Report.
Main award
additional retention award (20% of main award, will vest 4 years
after grant of main award)
Long term Incentive
+=
62 DBS AnnuAl RepoRt 2013

Determining Individual total CompensationIndividual awards are linked to the achievement of quantitative as well as qualitative objectives set out in the individual’s key performance indicators (KPIs). In addition, in determining the variable pay of senior management and the respective Units’ bonus pools, inputs from control functions such as Audit, Compliance and Risk are sought (as a check for adherence to established operational risks, concentration risk, tenure risk and country risk frameworks). An individual award is not formula driven but considered holistically taking into account both the “what” and “how” the KPIs are achieved to ensure sustainable performance as well as alignment to DBS values.
Sales employees are incentivised to promote development of mutually beneficial long-term relationships with their customers, rather than focus on short term gains. Non-financial metrics such as customer satisfaction and compliance with fair dealing principles are incorporated into their KPIs.
Control functions (Risk, Finance, Legal, Compliance and Audit) are measured independently from the business units they support to prevent any conflicts in interests. The remuneration of the CRO and Group Head of Audit are endorsed by the Board Risk Management Committee and the Audit Committee respectively.
Other provisionsThe Group does not allow accelerated payment of deferred remuneration except in cases such as death in service. There are no provisions for:� special executive retirement plans;� golden parachutes or special executive severance packages; and/or � guaranteed bonuses beyond one year
Remuneration of non-executive DirectorsThe remuneration for non-executive directors, including the Chairman, has been benchmarked to reflect trends in global, regional and local banking markets. Non-executive directors will receive 70% of their fees in cash and the remaining 30% in share awards. The share awards are not subject to a vesting period, but are subject to a selling moratorium whereby each non-executive director is required to hold the equivalent of one year’s basic retainer for his or her tenure as a director and for one year after the date he or she steps down. The fair value of share grants to the non-executive directors shall be based on the volume-weighted average price of DBSH ordinary shares over the 10 trading days immediately following the AGM. The actual number of DBSH ordinary shares to be awarded will be rounded down to the nearest share, and any residual balance will be paid in cash. Shareholders are entitled to vote on non-executive directors’ remuneration at the forthcoming 2014 AGM.
Remuneration of executive DirectorMr Piyush Gupta has led the Group since November 2009. During his tenure, the Group has made significant progress against its objective of being the Bank of Choice in Asia. The Group’s performance against the Group Scorecard was especially strong in the areas of:
� Executing our strategic initiatives resulting in record full-year net profit of SGD 3.50 billion for 2013 in an environment of significant market volatility
� Strengthening our regional capabilities across our key markets of Greater China, Southeast Asia and South Asia � Leveraging on our solid capital base, strong liquidity and high credit ratings to position the Group for long-term sustainable growth
The CMDC decides on the remuneration for the executive director based on the Group’s achievement against the Group Scorecard and market rates for this role in the marketplace. The CMDC’s recommendation for the executive director’s remuneration is endorsed by the Board.
63CORpORAte GOveRnAnCe RepORt

DISCLoSUre on reMUneratIon (prInCIpLe 9)
Annual fee structure for BoardThe proposed annual fee structure for the Board for 2013 is set out below. This fee structure is subject to shareholders’ approval at the forthcoming 2014 AGM.
Fees for 2012SGD
Fees for 2013SGD
Basic annual retainer Fees
Board 80,000 80,000
additional Chairman fees for:
Board 500,000 1,350,000
Audit Committee 75,000 75,000
Board Risk Management Committee 75,000 75,000
Compensation and Management Development Committee 65,000 65,000
Executive Committee 75,000 75,000
Nominating Committee 35,000 35,000
additional Committee member fees for:
Audit Committee 45,000 45,000
Board Risk Management Committee 45,000 45,000
Compensation and Management Development Committee 35,000 35,000
Executive Committee 45,000 45,000
Nominating Committee 20,000 20,000
As part of the annual review of non-executive directors’ fees, the CMDC and the Board (other than Mr Peter Seah who recused himself from all CMDC and Board discussions relating to the Board Chairman’s annual retainer fee) considered whether the Board Chairman’s annual retainer fee should be revised, taking into account the role and contribution of the Board Chairman and the performance of the Group under his leadership. In view of (i) the amount of time the Board Chairman spends on DBS matters; (ii) the significant and strategic value of his input and guidance to management; and (iii) the strong performance of the Group under his leadership in the last three years, and considering the board chairman’s fee of comparable financial institutions, the CMDC and the Board recommend increasing the Board Chairman’s annual retainer fee to SGD 1,350,000 for 2013.
Apart from the proposed increase in the Board Chairman’s annual retainer fee, no other changes are proposed to be made to the annual fee structure for the Board for 2013.
64 DBS AnnuAl RepoRt 2013

Breakdown of Directors’ RemunerationThe following table shows the composition of directors’ remuneration for 2013. Directors who were appointed or who resigned or retired during the year are included in the table.
BreaKDoWn oF DBS DIreCtorS’ reMUneratIon For perForManCe Year 2013 (1 JanUarY 2013 – 31 DeCeMBer 2013)
Salary Cash Share Directors’ Share-based remuneration Bonus1 plan Fees2 remuneration3 others4 totalname of Director SGD SGD SGD SGD SGD SGD SGD
Peter Seah Lim Huat – – – 1,261,050 540,450 41,168 1,842,668
Piyush Gupta 1,200,000 3,425,000 4,525,0005 – – 54,974 9,204,9746
Bart Joseph Broadman – – – 150,150 64,350 – 214,500
Christopher Cheng Wai Chee7 – – – 73,564 – – 73,564
Euleen Goh Yiu Kiang – – – 240,800 103,200 – 344,000
Ho Tian Yee – – – 140,700 60,300 – 201,000
Nihal Vijaya Devadas Kaviratne CBE – – – 177,800 76,200 – 254,000
Andre Sekulic – – – 187,250 80,250 – 267,500
Danny Teoh Leong Kay – – – 201,250 86,250 – 287,500
Woo Foong Pheng (Mrs Ow)8 – – – 202,500 – – 202,500
1 The amount has been accrued in 2013 financial statements2 Fees payable in cash, in 2014, for being a director in 2013. This is subject to shareholder approval at the 2014 AGM3 This is to be granted in the form of DBSH ordinary shares, for being a director in 2013. The actual number of DBSH ordinary shares to be awarded will be rounded down
to the nearest share, and any residual balance will be paid in cash. This is subject to shareholder approval at the 2014 AGM4 Represents non-cash component and comprises club, car and driver 5 For better comparability with other listed companies, these figures exclude the estimated value of retention shares amounting to SGD 905,000 which will only vest in the
4th year if the incumbent is still in the employment of the Group6 Refers to 2013 performance remuneration – includes fixed pay in 2013, cash bonus received in 2014 and DBSH ordinary shares granted in 20147 Dr Cheng, who stepped down on 29 April 2013, will receive all of his director’s remuneration in cash8 Director’s remuneration payable to Mrs Ow Foong Pheng will be paid fully in cash to a government agency, the Directorship & Consultancy Appointments Council Notes:� Directors are also paid attendance fees for Board and Board Committee meetings, as well as for attending the AGM and the annual Board offsite � Fees have been pro-rated according to the date of appointment or resignation. There were 365 days in calendar year 2013
65CORpORAte GOveRnAnCe RepORt

In 2013, none of the Group’s employees were immediate family members of a director. Senior Management and Material Risk takers’ Remuneration The following tables show the breakdown of remuneration and long-term remuneration awards for senior management and key risk takers. Senior management (SM) is defined as the executive director and members of the Group Management Committee, who have authority and responsibility for planning the activities and the overall direction of the Group.
Material risk takers (MRTs) are defined as individual employees whose duties require them to take on material risk on behalf of the Group in the course of their work. These could be either individual employees or a group of employees who may not pose a risk to the financial soundness of an institution on an individual basis, but may present a material risk on a collective basis.
table 1: Guaranteed Bonuses, Sign-on Bonuses and Severance payments
Category SM Mrts
Number of guaranteed bonuses 0 0
Number of sign-on bonuses 0 7
Number of severance payments 0 0
Total amounts of above payments made during the Financial Year (SGD ’000)
0 2,108
table 2: Breakdown of remuneration awarded in Current Financial Year
Category SM Mrts
Unrestricted %
Deferred %
Unrestricted %
Deferred %
Fixed remuneration Cash-based 20 – 38 –
Shares and share-linked instruments
– – – –
Other forms of remuneration
– – – –
Variable remuneration
Cash-based 36 – 41 –
Shares and share-linked instruments
– 44 – 21
Other forms of remuneration
– – – –
total 100 100
66 DBS AnnuAl RepoRt 2013
table 3: Breakdown of Long-term remuneration awards
Category SM%
Mrts%
Change in deferred remuneration awarded in current financial year1 8 (8)4 13 (8)4
Change in amount of outstanding deferred remuneration from previous financial year2
493 (49)4 423 (41)4
outstanding deferred remuneration (breakdown): Cash Shares & share-linked instruments Other forms of remuneration total
0100
0100
0100
0100
outstanding deferred remuneration (performance adjustments): Of which exposed to ex-post adjustments Reductions in current year due to ex-post adjustments (explicit) Reductions in current year due to ex-post adjustments (implicit)2
100––
100––
outstanding retained remuneration (performance adjustments): Of which exposed to ex-post adjustments Reductions in current year due to ex-post adjustments (explicit) Reductions in current year due-to ex-post adjustments (implicit)
–––
–––
Headcount 20 252
1 Value of DBSH ordinary shares (including retention shares) granted in respect of performance year 2013 vs. value of DBSH ordinary shares (including retention shares) granted in respect of performance year 2012. Share price taken at date of grant
2 [No. of unvested DBSH ordinary shares as at 31 Dec 13 x share price as at 31 Dec 13] / [No. of unvested DBSH ordinary shares as at 31 Dec 12 x share price as at 31 Dec 12]3 The increase is due to the difference in share price between 31 Dec 2012 and 31 Dec 2013 as well as the larger number of DBSH ordinary shares granted in 20134. The figure in the parenthesis showed the change in deferred remuneration awarded if the same population of staff that fulfils the definition of SM and MRTs for both
performance year 2012 and 2013 is used
Examples of explicit ex-post adjustments include malus, clawbacks or similar reversal or downward revaluations of awards.
Examples of implicit ex-post adjustments include fluctuations in the value of DBSH ordinary shares or performance units.
Key executives’ remunerationAlthough the Code and the Guidelines recommend that at least the top five key executives’ remuneration be disclosed within bands of SGD 250,000 and in aggregate, the Board believes that such disclosure would be disadvantageous to the Group’s business interests, given the highly competitive conditions in the banking industry where poaching of executives is commonplace.
aCCoUntaBILItY anD aUDIt
aCCoUntaBILItY (prInCIpLe 10)
The Board is regularly updated on the performance, position and prospects of the Group. Management provides the Board with detailed financial performance reports on a monthly basis. Prior to each quarterly Board meeting, management provides Board members with detailed reports on the Group’s financial performance and related matters and will present such reports at the Board meeting. As members of the Group Executive Committee are present at all Board meetings, Board members have the opportunity to discuss with senior management on the business and operations of the Group during each Board meeting.
The CEO and CFO provide the AC and the external auditors with a letter of representation attesting to the integrity of the financial statements each quarter.
67CORpORAte GOveRnAnCe RepORt

The Board provides shareholders with quarterly and annual financial reports. In presenting these statements, the Board aims to give shareholders a balanced assessment of the Group’s financial performance and position. The Board also ensures timely and full disclosure of material corporate developments to shareholders.
rISK ManaGeMent anD InternaL ControLS (prInCIpLe 11)
Board Risk Management CommitteeThe BRMC is chaired by Ms Euleen Goh and comprises Dr Bart Broadman, Mr Ho Tian Yee, Mr Nihal Kaviratne, Mr Peter Seah and Mr Danny Teoh, all of whom are non-executive independent directors. The BRMC members are appropriately qualified to discharge their responsibilities, and five out of six BRMC members have the relevant technical financial sophistication in risk disciplines.
Internal ControlsThe Group has instituted an internal controls framework covering financial, operational, compliance and technology controls, as well as risk management policies and systems. DBS’ risk governance structure includes three lines of defence with clear roles and responsibilities. The business management, in partnership with support functions, is the first line of defence and is primarily responsible for identification, assessment and management of risk within approved risk appetite and policies. They are required to develop and maintain appropriate risk management controls including self-assurance processes. As the second line of defence, corporate oversight functions (such as Risk Management Group and Group Legal & Compliance) are responsible for establishment and maintenance of risk management frameworks
Key responsibilities of the BrMC
� Setting of risk appetite for the various types of risk and cascading this into risk appetite limits and the monitoring of exposures against these risk appetite limits
� Monitoring all other types of large risk exposures against risk limits and risk strategy in accordance with approved guidelines� Monitoring of large risk events and subsequent remedial action plans� Monitoring market developments, such as macro-economic, credit, industry, country and commodity risks and stress tests related to
these developments� Approving the Group’s overall and specific risk governance frameworks � Reviewing (jointly with the AC) the adequacy and effectiveness of the Group’s internal control framework� Approving Basel compliant risk models and monitoring the performance of previously approved models� Overseeing an independent Group-wide risk management system and ensuring there are sufficient resources to monitor risks� Exercising oversight of the Internal Capital Adequacy Assessment Process including approval of stress scenarios and commensurate
results for capital, risk-weighted assets, profit and loss and liquidity� Approving the Group-wide Recovery Plan
activities of the BrMC in 2013
In 2013, the BRMC steered the enhancements to the Risk Appetite Framework which included portfolio performance and early warning signals dashboards, target market and risk acceptance criteria frameworks as well as the development of an economic capital limit monitoring tool. The Risk Appetite Framework is approved by the BRMC on an annual basis. During discussions of the risk dashboard (introduced since 2011) that informs the Bank of all major risk positions and risk developments, the BRMC closely monitored the US Federal Reserve’s intention to slow down cash infusion into the US economy (also known as Quantitative Easing tapering) and the macro-economic outlook for the key Asian countries where DBS operates. In particular, the BRMC considered the vulnerabilities, such as liquidity tightening, risk of rising interest rates and currency risk, which could impact the Bank’s strategy in these countries and the portfolios. During the year, the BRMC approved and monitored the performance of various risk models. The BRMC was apprised of various stress testing results and regulatory updates such as Basel III and Financial Stability Board Thematic Peer Review on Risk Governance. In addition to the annual approval of the Group’s Recovery Plan, the BRMC also approved the Bank’s Resolution Plan which was required by the Federal Reserve Board and Federal Deposit Insurance Corporation under the Dodd Frank Wall Street Reform Act as the Bank has operations in the United States.
68 DBS AnnuAl RepoRt 2013
as well as monitoring and reporting of key risk issues. Group Audit, as the third line of defence, provides assurance on the reliability, adequacy and effectiveness of the Group’s system of internal controls, risk management procedures, governance framework and processes, and the quality of performance in carrying out assigned responsibilities.
Please refer to the section on ‘Risk Management’ in this Annual Report which sets out the overall risk governance and various risk management frameworks covering credit, market, liquidity and operational risks.
The Group has in place a risk management process that requires all units to perform a half-yearly Control Self Assessment (CSA) to assess the effectiveness of their internal controls. In addition, all units of the Group are required to submit quarterly attestations on their controls relating to the financial reporting process, and annual attestations on their compliance with the overall internal controls framework. Leveraging on the results of the CSA and the quarterly and annual attestations, the CEO and CFO would in turn provide an annual attestation to the AC relating to adequacy and effectiveness of the Group’s risk management and internal control systems. Group Audit performs regular independent reviews to provide assurance on the adequacy and effectiveness of the Group’s risk management, control and governance processes. The AC and BRMC review the overall adequacy and effectiveness of the Group’s internal controls framework.
DBS Code of ConductThe DBS Code of Conduct (“Code of Conduct”) sets out the principles and standards of behaviour that are expected of all employees of the Group (including part-time and temporary employees) when dealing with customers, business associates, regulators and colleagues. The principles covered in the Code of Conduct include professional integrity, confidentiality, conflicts of interests, fair dealings with customers and whistle blowing. All employees are required to read and acknowledge the Code of Conduct on an annual basis. Members of the public may access the Code of Conduct on the Group’s website, as well as write in via the portal available. Significant Incident protocol and Code of ConductThe Group has in place a significant incident protocol that highlights processes and procedures for incidents according to the level of severity. In this way, appropriate levels of management are made aware of these incidents and can take action accordingly. In addition, there are procedures on the escalation, investigation and follow up of any reported wrong-doing by a DBS employee, customer, vendor or third party. The procedure for escalation is in various Group policies but most predominantly in the Code of Conduct. The Code of Conduct define processes for DBS staff to report incidents and provides protection for those staff for these disclosures. The Code of Conduct also encourages employees to report their concerns to the Group’s dedicated, independent investigation team within Group Legal, Compliance and Secretariat which handles whistle-blowing cases according to a well defined protocol. Alternatively, in case of actual or potential conflict of interest or fear of retribution, employees may write in confidence to Human Resources, Group Audit, or even the CEO or Chairman.
Board’s commentary on adequacy and effectiveness of internal controls The Board has received assurance from the CEO and CFO that, as at 31 December 2013: (a) the Group’s financial records have been properly maintained, and the financial statements give a true and fair view of the
Group’s operations and finances; and (b) the Group’s risk management and internal control systems were adequate and effective to address financial, operational,
compliance and information technology risks which the Group considers relevant and material to its operations. Based on the internal controls established and maintained by the Group, work performed by the internal and external auditors, reviews performed by management and various Board committees and assurances received from the CEO and CFO, the Board, with the concurrence of the aC, is of the opinion that the Group’s internal controls and risk management systems were adequate and effective as at 31 December 2013 to address financial, operational, compliance and information technology risks which the Group considers relevant and material to its operations. The Board notes that the internal controls and risk management systems provide reasonable, but not absolute, assurance that the Group will not be affected by any event that could be reasonably foreseen as it strives to achieve its business objectives. In this regard, the Board also notes that no system can provide absolute assurance against the occurrence of material errors, poor judgement in decision-making, human error, fraud or other irregularities.
69CORpORAte GOveRnAnCe RepORt

Related party transactionsThe Group has embedded procedures to comply with all regulations governing related party transactions, including those in the Banking Act, Chapter 19 (“Banking Act”), MAS directives and the SGX Listing Rules. The Banking Act and MAS directives impose limits on credit exposures by the Group to certain related entities and persons, while the SGX Listing Rules cover interested party transactions in general.
All new directors are briefed on all relevant provisions that affect them. If necessary, existing credit facilities to related parties are adjusted prior to a director’s appointment, and all credit facilities to related parties are continually monitored. Checks are conducted before the Group enters into credit or other transactions with related parties to ensure compliance with regulations.
As required under the SGX Listing Rules, the following are details of interested person transactions in 2013:
aggregate value of all Interested person transactions during 2013 name of Interested person (excluding transactions less than SGD 100,000)
CapitaLand Limited Group 6,865,374Certis CISCO Security Pte Ltd Group 14,676,979Mapletree Investments Pte Ltd Group 464,400MediaCorp Pte Ltd Group 2,963,551Singapore Airlines Limited Group 390,000Singapore Telecommunications Limited Group 37,745,810SMRT Corporation Ltd Group 6,969,864StarHub Ltd Group 5,054,284Temasek Capital (Private) Limited Group 177,792
total Interested person transactions (SGD) 75,308,054
Material ContractsSince the end of the previous financial year, no material contracts involving the interest of any director or controlling shareholder of the Group has been entered into by the Group or any of its subsidiary companies, and no such contract subsisted as at 31 December 2013, save as disclosed via SGXNET.
Dealings in securities In conformance with the “black-out” policies prescribed under SGX Listing Rules, DBSH directors and employees are prohibited from trading in DBSH securities one month before the release of the full-year results and two weeks before the release of the first, second and third quarter results. In addition, business units and subsidiaries engaging in proprietary trading are restricted from trading in DBSH securities during the black-out period. Prior to the commencement of each black-out period, Group Secretariat will send an email to all directors and employees to inform them of the duration of such period.
Directors and officers are prohibited at all times from trading in DBSH securities if they are in possession of material non-public information. The Group has put in place a personal investment policy which prohibits employees with access to price-sensitive information in the course of their duties from trading in securities in which they possess such price-sensitive information. Such employees are also required to seek pre-clearance before making any personal trades in securities, and may only trade through the Group’s stock broking subsidiaries for securities listed in Singapore and Hong Kong. The personal investment policy discourages employees from engaging in short-term speculative trading, and states that investment decisions should be geared towards long-term investment.
aUDIt CoMMIttee (prInCIpLe 12)
The AC is chaired by Mr Danny Teoh and comprises Mr Nihal Kaviratne, Mr Peter Seah, Mrs Ow Foong Pheng and Mr Andre Sekulic, all of whom are non-executive directors. Mr Danny Teoh possesses an accounting qualification and was the managing partner of KPMG, Singapore. All members of the AC have recent and relevant accounting or related financial management expertise or experience. In accordance with the requirements of the Code, Guidelines and Banking Regulations, a majority (four out of five members of the AC) including the AC Chairman are independent directors. Mrs Ow Foong Pheng, who is a non-independent director, is considered independent from business relationships and management.
70 DBS AnnuAl RepoRt 2013

The AC has full discretion to invite any director and executive to attend its meetings. Separate sessions with the external auditors are held without the presence of management at each AC meeting to discuss matters that might have to be raised privately. In addition, there is at least one scheduled private session annually for the head of Group Audit to meet with the AC. The AC Chairman meets the internal auditors regularly to discuss the internal audit plan, current work, key findings and other significant matters. The AC has explicit authority to investigate any matter within its terms of reference, and has full access to and cooperation by management.
The AC has reviewed the Group’s audited financial statements with management and the external auditors and is of the view that the Group’s financial statements for 2013 are fairly presented in conformity with relevant Singapore Financial Reporting Standards in all material aspects.
During the financial year, the AC carried out an annual assessment of the effectiveness of the Group Audit function. The review showed that Group Audit continues to perform to a very high standard; adopts effective communication to stakeholders; places high importance to its people, continuously investing to enhance its bench-strength; stays relevant and competent to changes in the Bank’s risk and regulatory environment.
Key responsibilities of the aC
� Monitoring the financial reporting process and ensuring the integrity of the Group’s financial statements� Reviewing the adequacy and effectiveness of internal controls, such as financial, operational, compliance and information technology
controls, as well as accounting policies and systems � Reviewing all material related party transactions � Reviewing the policy and arrangements by which staff of the Group may, in confidence, raise concerns about possible improprieties
in matters of financial reporting or other matters and to ensure that arrangements are also in place for such concerns to be raised and independently investigated and for appropriate follow-up action to be taken
� Reviewing the internal auditor’s plans, the scope and results of audits, and effectiveness of the internal audit function� Approving the hiring, removal, resignation, evaluation and compensation of Head of Group Audit � Reviewing the scope and results of the external audit and the independence and objectivity of the external auditors, and ensuring
that the external auditors promptly informs the AC if there are any weaknesses in the Group’s internal controls and ensuring that such weaknesses are promptly rectified
� Making recommendations to the Board on the proposals to shareholders on the appointment, re-appointment and renewal of the external auditors and approving the remuneration and terms of engagement of the external auditors
� Overseeing the implementation of the Group Disclosure Policy by the Group Disclosure Committee and approve proposed changes of a substantive nature
activities of the aC in 2013
During the course of 2013, the AC’s activities included:
� Performing quarterly reviews of financial statements (audited and unaudited), and making recommendations to the Board for approval� Performing quarterly reviews of reports from Group Audit and Group Legal and Compliance� Reviewing the Group’s progress on the implementation of the Fair Dealing Outcomes across the Group, in line with the
principles issued by MAS� Reviewing the annual audit plan and the legal and compliance plans, approving any changes as necessary� Reviewing the annual re-appointment of the external auditors and determining their remuneration, and making a
recommendation for Board approval � Reviewing the observations from the independent external assessor appointed to conduct an assessment of Group Audit’s
conformance with the Institute of Internal Auditors (IIA) International Standards for the Professional Practice of Internal Auditing
AC members are regularly kept updated on changes to accounting standards and issues related to financial reporting through quarterly meetings with Group Audit, and via internal audit bulletins, among others.
71CORpORAte GOveRnAnCe RepORt

external AuditorsThe AC makes recommendations to the Board for the appointment, re-appointment and dismissal of the external auditors including the remuneration and terms of engagement. The Group has complied with Rule 712 and Rule 715 of the SGX Listing Rules in relation to its external auditors.
The total fees paid to our external auditors, PricewaterhouseCoopers LLP (PwC), for the financial year ended 31 December 2013, and the breakdown of the fees paid for audit and non-audit services respectively are set out below:
Fees paid to pwC for FY 2013 SGD ’000
For Audit and Audit-Related Services 6,740For Non-Audit Services 1,868
Total Fees paid 8,608
InternaL aUDIt (prInCIpLe 13)
Group Audit is a function that is independent of the activities it audits. The objective, scope of authority and responsibilities of Group Audit are defined in the Group Audit charter, which is approved by the AC. In DBSH, Group Audit reports functionally to the Chairman of the AC and administratively to the CEO.
Group Audit’s responsibilities include:
(i) Evaluating the adequacy and effectiveness of the Group’s risk management and internal control systems, including whether there is prompt and accurate recording of transactions and proper safeguarding of assets;
(ii) Providing an independent assessment of the Group’s credit management processes, portfolio strategies and portfolio quality;(iii) Reviewing whether the Group complies with laws and regulations and adheres to established policies; and(iv) Reviewing whether management is taking appropriate steps to address control deficiencies.
Group Audit adopts a risk-based approach in its auditing activities. An annual audit plan is developed using a structured risk and control assessment framework, where Group Audit assesses the inherent risk and control effectiveness of each auditable entity in the Group. The assessment also covers risks arising from new lines of business or product. Audit projects are planned based on the results of the assessment, with priority given to auditing higher risk areas. Consideration is also given to conducting audit projects required by regulators. Appropriate resources are deployed to complete the plan, which is reviewed and approved by the AC.
Group Audit has unfettered access to the AC, the Board and senior management, as well as the right to seek information and explanation. Group Audit staff is required to adhere to the Code of Conduct as well as the Code of Ethics established by the IIA, from which the principles of objectivity, competence, confidentiality and integrity are based.
Audit reports containing identified issues and corrective action plans are reported to the AC and senior management. The progress of the corrective action plans is monitored through a centralised issue management system. Information on outstanding issues is included in regular reports to the AC, the Chairman, senior management and business and support unit heads.
Group Audit apprises the regulators and external auditors of all relevant audit matters. It works closely with the external auditors to coordinate audit efforts.
In line with leading practices, Group Audit has established a quality assurance and improvement programme that covers all aspects of its audit activity and conforms to the International Standards for the Professional Practice of Internal Auditing. The programme includes periodic internal quality assurance reviews, self-assessments based on standards established by the IIA and internal audit methodologies, stakeholder surveys and industry benchmarking surveys. External quality assessments are also carried out at least once every five years by qualified professionals from an external organisation. The most recent assessment was conducted in 2013 by KPMG.
72 DBS AnnuAl RepoRt 2013

Based on KPMG’s Strategic Performance Review of Internal Audit (“K’SPRint”) methodology, the following assessment was made, which include areas considered as leading practices:
� Management buy-in and adoption of Group Audit’s annually refreshed Top 10 Key Audit Focus Areas (based on its annual risk and control assessment results, perspectives of senior management and business plans) reflects strong recognition of Group Audit’s contribution in helping to shape the control culture and awareness within the organisation;
� Strong positive feedback from management on stakeholder engagement; � Organisational structure within Group Audit ensures proper functional and geographical engagement and coverage;� Having an internal bulletin, complimented by members of the Group Management Committee as a useful communication tool, alerts
stakeholders to control weaknesses in respective areas;� A successful Guest Auditor Programme, which invites internal applicants from other departments to participate in audit reviews
alongside experienced auditors, brings value to both Group Audit (leverage on product knowledge) and stakeholders (understanding of audit requirements); and
� Comprehensive Annual Audit Planning Process.
KPMG concluded that Group Audit conforms to the International Standards for the Professional Practice of Internal Auditing.
Group Audit achieved another significant milestone during its participation in the 2013 Securities Investors Association of Singapore (SIAS) Investors’ Choice Awards, jointly organised by the SIAS, IIA Singapore and Singapore Management University. Group Audit emerged as the runner-up for the Internal Audit Excellence Award, and top among banks for the third year running. These wins are significant for the Group as the SIAS Investors’ Choice Awards is one of only few awards in the market that recognises public-listed companies for their exemplary corporate governance and transparency practices.
Group Audit continues to improve on its approach towards the internal audit function. One of its initiatives is the extensive use of computer-assisted audit techniques (CAATs) as well as more complex data analytics, for greater efficiency and effectiveness, as well as to enhance productivity. Technology will continue to play a central role in driving innovation and process automation to improve quality and efficiency in performing audits and managing internal department processes. The future of audit lies in the ability to identify emerging risks. As such, Group Audit is continuously looking into ways to connect the dots by sharing insights on issues, and how one issue is connected to another, with all stakeholders. This boundary-spanning sharing also crosses business segments and geographical locations.
Last but not least, Group Audit continues to invest in its people, ensuring that it is adequately staffed to meet the demands of internal audit. Proper training roadmaps and up-skilling programmes are instituted to constantly enhance the knowledge, skills and competencies of its internal auditors.
SHareHoLDer rIGHtS anD reSponSIBILItIeS
SHareHoLDer rIGHtS (prInCIpLe 14)
The Group’s robust corporate governance culture and awareness promote fair and equitable treatment of all shareholders. All shareholders enjoy specific rights under the Singapore Companies’ Act and Articles of Association. All shareholders are treated fairly and equitably.
These rights include, amongst others, the right to participate in profit distributions and the right to attend and vote at general meetings. Ordinary shareholders are entitled to attend and vote at the AGM by person or proxy. A shareholder may appoint up to the maximum of two proxies, who need not be shareholders of DBSH. Notwithstanding the two-proxy rule, investors who hold DBSH ordinary shares through CPF or custodian banks, but have not been appointed as proxies, are also allowed to attend the AGM as observers.
The Group respects the equal information rights of all shareholders and is committed to the practice of fair, transparent and timely disclosure. All price-sensitive information is publicly released prior to any sessions with individual investors or analysts.
73CORpORAte GOveRnAnCe RepORt

CoMMUnICatIon WItH SHareHoLDerS (prInCIpLe 15)
The Group’s investor relations activities promote regular, effective and fair communication with shareholders. Briefing sessions for the media and analysts are conducted when quarterly results are released. All press statements and quarterly financial statements are published on the DBSH and SGX websites. A dedicated investor relations team supports the CEO and the CFO in maintaining a close and active dialogue with institutional investors. The Group’s website provides contact details for investors to submit their feedback and raise any questions.
During the year, management met with more than 370 investors at more than 280 investor meetings. It participated in nine local and foreign investor conferences and non-deal road shows. These meetings provide a forum for management to explain the Group’s strategy and financial performance. Management also uses meetings with investors and analysts to solicit their perceptions of the Group. At the IR Magazine Awards and Conference South East Asia 2013, the Group was named the Best Investor Relations in the banks and financial services sector. The Group was also conferred the Best Investor Relations (bronze) award in the category for companies with a market capitalisation of SGD 1 billion and above at the Singapore Corporate Awards 2013. The Group has a formal disclosure policy to ensure that all disclosures of material information are timely, complete and accurate. The policy also spells out how material information should be managed to prevent selective disclosure. In 2012, the Group Disclosure Committee (GDC) was formed to assist the CEO and CFO in implementing the Group’s disclosure policy. The GDC comprises the CFO, members of the Group Executive Committee as well as various department heads. The GDC’s objectives are to periodically review the Group’s disclosure policy and update it as needed; ensure that all material disclosures are appropriate, complete and accurate; and ensure the avoidance of selective or inadvertent disclosure of material information. The Group’s efforts to improve disclosure were recognised at the 14th Investors’ Choice Awards organised by the SIAS, where it won the Most Transparent Company Award in the finance category.
ConDUCt oF SHareHoLDer MeetInGS (prInCIpLe 16)
The AGM provides shareholders with the opportunity to share their views and to meet the Board of Directors, including the chairpersons of the Board committees and certain members of senior management. The Group’s external auditor is available to answer shareholders’ queries. At the AGM, the Group’s financial performance for the preceding year is presented to shareholders.
At general meetings, the Chairman plays a pivotal role in fostering constructive dialogue between shareholders and the Board members. The Group encourages and values shareholder participation at its general meetings. To enhance shareholder participation, the Group puts all resolutions at general meetings to vote by electronic poll and announces the results by showing the number of votes cast for and against each resolution and the respective percentage.
In accordance with the recommendations contained in the Code and the Guidelines, resolutions requiring shareholder approval are tabled separately for adoption at the DBSH’s general meetings unless they are closely related and are more appropriately tabled together.
74 DBS AnnuAl RepoRt 2013

rISK ManaGeMent
The table below gives an overview of the locations of our risk disclosures.
In 2013, we have implemented the majority of the Enhanced Disclosure Task Force (EDTF) recommendations for improved bank risk disclosures1. For an overview of the recommendations and where we have incorporated the relevant disclosures, please refer to Appendix on page 101.
Section page
1. risk taking and our Business Model 76
2. risk overview 76
3. DBS risk appetite 3.1. Risk-limiting Thresholds 3.2. Stress Testing 3.3. Internal Capital Adequacy Assessment Process 3.4. Use of Economic Capital for Concentration Risk Management
7879808080
4. risk Governance 4.1. Risk and Control 4.2. Governance Structure
818182
5. Credit risk 5.1. Credit Risk in DBS 5.2. Credit Risk Management at DBS 5.3. Credit Risk Mitigants 5.4. Credit Risk in 2013 5.5. Internal Credit Risk Models
838384878889
6. Market risk 6.1. Market Risk in DBS 6.2. Market Risk Management at DBS 6.3. Market Risk in 2013
93939394
7. Liquidity risk 7.1. Liquidity Risk in DBS 7.2. Liquidity Risk Management at DBS 7.3. Liquidity Risk in 2013 7.4. Liquid Assets 7.5. Regulatory Requirements
959595979798
8. operational risk 8.1. Operational Risk in DBS 8.2. Operational Risk Management at DBS 8.3. Operational Risk in 2013
989899100
1 See ‘Enhancing the Risk Disclosure of Banks’ published by the Financial Stability Board in October 2012
75

tHe SeCtIonS MarKeD BY a GreY LIne In tHe LeFt MarGIn ForM part oF tHe GroUp’S aUDIteD FInanCIaL StateMentS.
1. rISK taKInG anD oUr BUSIneSS MoDeL
DBS’ focus on Asia has enabled us to grow our franchise successfully by allowing us to leverage on our key strengths in a region we know best. This Asian connectivity naturally exposes us to some degree of concentration risk to the region. However, through spreading our franchise across the expansive Asian region, our risk is diversified across many markets with differing macroeconomic fundamentals and growth drivers. Our strategic spread across many different industries and portfolios, as well as individual name concentration management, enables us to mitigate risk and withstand situations of economic stress. Whilst this diversification strategy has worked well over the years, it is really our specialist knowledge of the regional markets, clients and a keen understanding of their businesses that enable us to manage our risk.
We believe that focusing on the markets and customer segments we know well enables us to achieve a superior return by taking on sound credit risk. A strong focus on our private and corporate customers and on corporate lending – especially to small and medium-sized enterprises (SMEs) and in trade finance - in selected markets where we have built expertise has served us well.
2. rISK overvIeW
In carrying out our strategy and our nine strategic priorities we are faced with economic, financial and other types of risk. These risks are interdependent and require a holistic approach to risk management. Very broadly these risks can be aligned around the following risk categories.
Business and Strategic risk is an over-arching risk that arises out of changes in the business environment and from adverse decisions that can materially impact the Group’s long term objectives. This risk is managed separately under other governance processes.
reputational risk is the current or prospective risk to our shareholder value (including earnings and capital) arising from adverse perception of DBS’ image on the part of its stakeholders. It affects the Group’s ability to establish new relationships or services, or continue servicing existing relationships, and have continued access to sources of funding. Reputational risk is typically an outcome of failure to manage the other risk types.
Credit risk is the risk of loss resulting from the failure of borrowers or counterparties to meet their debt or contractual obligations.
Market risk affects the economic value of financial instruments held by the Group, arising from changes in interest rates, foreign exchange rates, equity prices, commodity prices, credit spreads and also changes in the correlations and volatilities of these risk factors.
Liquidity risk is the risk arising from the inability of the Group to meet obligations when they become due.
operational risk is the risk of loss resulting from inadequate or failed internal processes, people or systems, or from external events, including legal risk, but does not include strategic or reputational risk.
top anD eMerGInG rISKS
Amongst those risks discussed above, some are more salient and critical to our strategy whilst others are emerging as more critical risk due to changes in regulation, stakeholders’ concerns or the nature of our businesses. We consider the following areas of uncertainties and risks as top and emerging in achieving our strategic priorities going forward, and have in place the appropriate risk mitigating initiatives to manage these. All these risks have the potential of impacting the Group’s image negatively and hence have reputational risk implications.
Business and Strategic
reputational Credit Market Liquidity operational
76 DBS AnnuAl RepoRt 2013

CreDIt
Credit Risk and Concentration Credit risk remains the Group’s most material risk and usage of capital. Depending on severity, a prolonged weak economic environment, brought about by factors such as economic uncertainty in Asia and normalization of monetary policy in the United States, may impact our credit portfolios. We continue to monitor our risk appetite position closely. Risk acceptance criteria and policies are modified as necessary to pro-actively mitigate potential portfolio threats.
Country Risk DBS has a stated strategy to be a regional bank in Asia. Consequently, the Group has large concentrations in a limited number of countries and the risks in those countries are correlated as well. Instability in and across our target markets, such as economic uncertainty in China and political-economic flux in India and Indonesia, may give rise to country risk events. This risk is mitigated by setting limits for the maximum exposure in each country. In addition the potential loss given transfer event is monitored on the basis of how the exposure is divided among short term and long term, trade and non-trade as well as wrong way risk in our derivatives portfolio. Based on the macro economic outlook, the country risk limits and exposures will be adjusted in order to stay within the Group’s Risk Appetite.
LIQUIDItY
Liquidity RiskFrom time to time, the Group may need to supplement its holdings of fungible currencies through the use of swaps (please refer to Section 7.2 on page 95 for details on our liquidity management and funding strategy). Consequently, the Group actively participates in the swap markets to convert its surplus SGD funds to USD for on-lending across locations. As the swaps are typically shorter in contractual maturity than the USD loans, the Group is exposed to potential cashflow mismatches arising from the risk that counterparties may not roll over maturing swaps with the Group to support the continual funding of USD loans.
This risk, i.e. the cashflow mismatch arising from the potential inability to roll over maturing swaps with counterparties, is mitigated by the setting of a trigger on the amount of SGD:USD swaps transacted with the market and conservative assumptions on the cashflow treatment of swaps under the behavioural profiling of the Group’s cashflow maturity gap analysis. In addition, the Group continues to make inroads in growing, deepening and diversifying its USD deposit base across locations, through the expansion of its product suites and investments made in cash management capabilities, amongst other initiatives. The Group also maintains access to various wholesale funding instruments as supplementary funding sources (e.g. issuance of Euro Commercial Papers and Medium Term Notes).
operatIonaL
Regulatory DevelopmentsThe global regulatory landscape is evolving continuously. We continue to observe various regulatory bodies, both globally and regionally, issuing guidance with additional requirements related to a wide variety of topics. These range from risk appetite, internal models approaches as well as liquidity and capital requirements. The volume and depth of increasingly demanding regulatory requirements have the effect of pro-longing implementation timelines and increasing costs especially where regulatory approval is more uncertain.
As discussed in the ‘Regulators’ section of our Management Discussion on page 45, the Group remains vigilant in tracking international and domestic regulatory developments to ensure that it stays on top of changes applicable to its businesses. New requirements are promptly analysed and disseminated to the respective action parties and, where applicable, embedded into the Group’s processes and systems. Standards of compliance behaviour expected of all staff are reinforced through training sessions, briefings and other means of communication and dissemination. In addition, individuals who perform certain activities may be required to fulfill specific training and examination standards.
The Group also recognises the importance of proactive engagement with regulators and we continue to steer industry and regulatory forums where possible. Towards this end, the Group strives to build and maintain positive relationships with regulators that have oversight responsibilities in the locations where we operate.
77RISK MAnAGeMent

Financial Crime and Information SecurityFraud continues to be a risk for financial institutions particularly as criminals embrace the use of technology. The Group takes this threat seriously and has implemented a broad range of controls to identify and mitigate risk to customers and businesses. Traditional fraud such as card skimming and online fraud continue to present a risk for financial institutions globally. These risks are being mitigated mainly through the implementation of Europay, MasterCard and Visa (EMV) technology for card payments and multi factor authentication for online payments along with increased level of transaction monitoring. Physical security enhancements at point-of-sale terminals and self-service banking facilities are also acting as a deterrent to skimming attacks.
Regulators globally continue to focus on anti-money laundering and counter-terrorism financing to safeguard the financial system. Singapore recently designated tax evasion as a predicate offence to money laundering placing greater onus on financial institutions to understand the source of customer monies.
The Group takes the issue of financial system integrity most seriously and has robust policies and procedures in place to ensure use of the Group’s infrastructure only for legitimate purposes. Systems are in place to detect suspicious transactions and report such transactions to the appropriate authorities.
3. DBS rISK appetIte
As mentioned above, the pursuit of the Group’s strategic priorities and business opportunities inherently carries risk. The Board has established an overall Risk Appetite which is supervised by the Board Risk Management Committee (BRMC). Our risk strategy is to link our Risk Appetite with the Group’s strategic and operational needs across material risk types. The embedding of Risk Appetite in DBS starts with a formally defined Risk Appetite Statement set by the Group Board.
To this end, we have established the Risk Appetite Framework which covers the risk management measures put in place to ensure adherence with the Risk Appetite Statement. The Framework brings together various risk processes across Risk Management Group (RMG) and Finance onto a structured platform for effective enterprise risk management. The Framework serves to reinforce the risk culture, defined by the ‘tone from the top’, by providing a coherent understanding of risk across the Group. In addition, to embed Risk Appetite into our culture, the Group’s remuneration policy (please refer to Corporate Governance section on page 58) is structured to align compensation to appropriate risk taking behaviour.
Underlying risk management frameworks are in turn developed for each risk type to ensure adherence with Risk Appetite.
Credit Stress testing
Market Stress testing
Liquidity Stress testing
Business Continuity Management
Group Credit risk Management Framework*
Group Market risk Management Framework
Group Liquidity risk Management Framework
Group operational risk Management Framework
Group reputational risk Management Framework
risk appetite Framework
* Includes Country Risk
78 DBS AnnuAl RepoRt 2013

The key instruments that the Group uses to ensure proper risk identification and quantification include:
� A strategic planning process and continuous monitoring process against approved risk targets� Regular risk reporting to management and the use of the risk reports for capital management purposes� An Economic Capital (EC) and stress testing framework
3.1. rISK-LIMItInG tHreSHoLDS
The Risk Appetite considers the various risk types and is operationalised via limits, policies, processes and controls. The inclusion of threshold structures into the risk frameworks is integral in driving Risk Appetite into our businesses. Effective thresholds are essential in managing aggregate risks within acceptable levels. Portfolio risk limits for the quantifiable risk types are cascaded from Risk Appetite through a top down approach and operationalised through formal frameworks. Other significant risk aspects are guided by qualitative expression of principles.
obligor economic Capital trigger– Corporate– Banks
Industry eC trigger– Financial Institutions– Non-Financial Institutions
Country (transfer & Convertibility) Limit– Strategic– Non-strategic
risk appetite
regulatory Capital ConstraintCapital attribution
Credit risk
obligor
Internal capital demand (economic Capital basis)
Internal capital demand (economic Capital basis)
Internal capital demand (regulatory Capital basis)
trading Book(product desk)
Banking Book(Business segment)
Concentration Risk Management
Value-at-Risk Appetite Limit Manage through frameworks, policies and standards
Maintain Counterbalancing Capacity to meet the Liquidity Risk Exposure
Industry
Country (transfer & Convertibility )
Market risk operational risk Liquidity risk
total tail value at risk Limit
trading book tail value at risk Limit
79RISK MAnAGeMent
Specific risk-limiting thresholds for the respective risk types are as follows.
� Credit Risk – EC triggers and country Transfer and Convertibility (T&C) limits are used to manage credit risk. Sector concentration triggers and Target Market Risk Acceptance Criteria are used to manage sector concentration risk. Obligor concentration triggers and Relationship Caps are used to limit concentrated borrower exposures. T&C limits are used to manage geographic exposures.
� Market Risk – Value-at-Risk (VaR) limits and EC limits are used to manage downside risk. Management stress triggers are used to manage combined exposures arising from combined positions in both trading and banking books.
� Liquidity Risk – Cashflow maturity mismatch analysis is the primary measure. This is complemented by other risk control measures such as liquidity-related ratios and balance sheet analysis.
� Operational and Reputational Risks – Operational and reputational risks are managed through frameworks, policies and standards.
3.2. StreSS teStInG
Stress testing is an integral part of the Group’s risk management process. It alerts senior management to the Group’s potential vulnerability to exceptional but plausible adverse events. It enables the Group to assess capital adequacy, identify potential risky portfolio segments, inherent systematic risks and provides an opportunity to define mitigating actions before the onset of an adverse event.
We have a rigorous stress testing regime which is conducted throughout the year, including the Internal Capital Adequacy Assessment Process (ICAAP), industry-wide stress test and Pillar 1 credit stress test. In addition, we also perform various sensitivity analyses under stress scenarios.
Appropriate stress testing is conducted at least annually or at suitable intervals given the reading of micro and macro economic conditions. All stress tests are documented, including contingency plans, exit strategies and mitigating actions appropriate to different scenarios. The results of the stress tests are also used to calibrate the thresholds and boundaries of the Risk Appetite.
3.3. InternaL CapItaL aDeQUaCY aSSeSSMent proCeSS
Through ICAAP, the capital planning process takes into account the demand for capital under a range of stress scenarios and compares them against the available supply of capital. Capital demand is in turn a function of growth plans and the target credit rating specified in the Risk Appetite Statement. Based on the assessment of capital needs, the corresponding risk capital for credit risk and market risk are defined. The planning process under ICAAP therefore ensures that the Group’s overall risk and rewards are aligned with Risk Appetite.
3.4. USe oF eConoMIC CapItaL For ConCentratIon rISK ManaGeMent
While the Group firmly complies to regulatory capital requirements at all times, we recognise the need to have more robust methodologies to measure capital usage. Effective concentration management requires a robust metric that can accurately capture the portfolio risk characteristics including granular portfolio segment profile, risk concentrations and correlation of risks in the portfolio. The metric has to be sensitive to changes made to adjust the portfolio shape and direction of growth.
We have therefore adopted the EC metric as our primary concentration risk management tool and have integrated it into our risk processes. EC is deployed as a core component in our ICAAP and it also serves as a key metric in cascading Risk Appetite and limits setting.
80 DBS AnnuAl RepoRt 2013

4. rISK GovernanCe
4.1. rISK anD ControL
The Group has three lines of defence when it comes to risk taking where each line of defence has a clear responsibility.
Working closely with the support functions, the first line of defence is the front office that has a clear responsibility for risk in terms of identifying risks and reporting on any changes in the risk profile of the clients or positions.
As a second line of defence, RMG and other control functions such as Group Compliance have their own responsibilities for developing, overseeing and reporting on risk frameworks. In addition, RMG is responsible for identifying individual and portfolio risk, approve transactions and trades and ensure that they are within approved limits and monitor and report on the portfolio, taking into account current and future potential developments through stress testing.
Finally, Group Audit forms the third line of defence as a completely independent check to ensure adherence to approved policies and procedures.
FIrSt LIne oF DeFenCe SeConD LIne oF DeFenCe
BoarDCeo
SenIor ManaGeMentprovides oversight of the 3 Lines of Defence
tHIrD LIne oF DeFenCe
Strategy, performance and risk Management
policy and Monitoring Independent assurance
Business Units, Countries Corporate oversight Functions Group audit
Identification and Management of risk in the businesses
Framework, risk oversight and reporting
Independent Challenge and review of adequacy and effectiveness of
processes and Controls
81RISK MAnAGeMent

4.2. GovernanCe StrUCtUre
As discussed in Section 3.1, under the Group’s risk management frameworks, the Board of Directors, through the BRMC, sets risk appetite, oversees the establishment of robust enterprise-wide risk management policies and processes, and sets risk limits to guide risk-taking within the Group.
The Chief Risk Officer (CRO) has been appointed to oversee the risk management function. The CRO is a member of the Group Executive Committee and has a dual reporting line to the CEO and to the Board which is also responsible for the appointment, remuneration, resignation or dismissal of the CRO. The CRO is independent of business lines and is actively involved in key decision making processes. The CRO also engages the Group’s regulator(s) on a regular basis to discuss risk matters.
Working closely with the established risk and business committees, the CRO is responsible for the following:
� Management of the risks in the Group including developing and maintaining systems and processes to identify, approve, measure, monitor, control and report risks
� Engagement of senior management on material matters relating to the various types of risks and development of risk controls and mitigation processes
�Ensuring the effectiveness of risk management and adherence to the Risk Appetite established by the Board
DBS 3 Levels of risk & Control Governance Structure
GroUp BoarD Group Management Location Board & Management
BoarD oF DIreCtorS
BoarD eXeCUtIve CoMMIttee
BoarD rISK ManaGeMent CoMMIttee (BrMC)
Location Management Committee
Location Risk Committee
Business Control Committee
Group Management Committee
Group executive Committee
risk executive Committee
Group Credit risk Committee
Group Market & Liquidity risk Committee
Group operational risk Committee
product approval Committee
BoarD aUDIt CoMMIttee (BaC)
Location Board/Board Committee
82 DBS AnnuAl RepoRt 2013

To facilitate BRMC’s risk oversight, risk management committees have been established as follows.
risk Management Committees
Risk Executive Committee (Risk ExCo) The Risk ExCo provides comprehensive group-wide oversight and direction relating to the management of all risk types and is the overall executive body mandated by the BRMC on risk matters.
Product Approval Committee (PAC) The PAC provides comprehensive group-wide oversight and direction relating to the new product approval - an important risk mitigation element within the Group.
Group Credit Risk Committee
Group Market and Liquidity Risk Committee
Group Operational Risk Committee
Each of these committees reporting to the Risk ExCo are broadly mandated – within the specific risk areas – to serve as an executive forum for discussion and decisions on all aspects of risk and its management.
This includes:� Assessing risk taking� Maintaining oversight on effectiveness of the Group’s risk management infrastructure,
including framework, decision criteria, authorities, policies, people, processes, information, systems and methodologies
� Approving risk model governance standards as well as stress testing scenarios� Assessing the risk-return trade-offs across the Group� Identifying specific concentrations of risk
The members in these committees comprise representatives from RMG as well as key business and support units.
The above committees are supported in all major locations by local risk committees. The local risk committees provide oversight over local risk positions across all businesses and support units and ensure compliance with limits set by the group risk committees. They also approve country specific risk policies and ensure compliance with local regulatory risk limits and requirements.
5. CreDIt rISK
5.1. CreDIt rISK In DBS
Credit risk arises out of our daily activities in various areas of business – lending to retail, corporate and institutional customers; trading activities such as foreign exchange, derivatives and debt securities; and settlement of transactions. Credit risk is one of the most significant measurable risks faced by the Group.
Lending exposures are typically represented by the notional value or principal amount of on-balance sheet financial instruments. Financial guarantees and standby letters of credit, which represent undertakings that the Group will make payments in the event that a customer cannot meet its obligations to third parties, carry the same credit risk as loans even though they are contingent in nature. Pre-settlement Credit Exposures (PCE) for trading and securities transactions is measured taking into account collateral and netting arrangements. Settlement risk is the risk of loss due to the counterparty’s failure to perform its obligation after the Group has performed its obligation under an exchange of cash or securities.
Please refer to Note 41.1 to the Financial Statements on page 162 for details on the Group’s maximum exposure to credit risk.
83RISK MAnAGeMent

5.2. CreDIt rISK ManaGeMent at DBS
The Group’s approach to credit risk management is formulated on the following building blocks:
FraMeWorK
The Credit Risk Management Framework, approved by the BRMC, defines credit risk and the scope of its application; establishes the dimensions of credit risk; and provides a consistent Group-wide framework for managing credit risk across the Group.
poLICIeS
Senior management sets the overall direction and policy for managing credit risk at the enterprise level. A Core Credit Risk Policy sets forth the principles by which the Group conducts its credit risk management activities. This policy, supported by a number of operational policies, ensure consistency in credit risk underwriting across the Group and provide guidance in the formulation of business-specific and/or location-specific credit policies. The Core Credit Risk Policy is considered and approved by the Risk ExCo based on recommendations from the Group Credit Policy Committee. The business-specific and/or location-specific credit policies are established to provide greater details on the implementation of the credit principles within the Core Credit Risk Policy and are adapted to reflect different credit environments and portfolio risk profiles.
rISK MetHoDoLoGIeS
Managing credit risk is performed through our deep understanding of our customers, the businesses they are in and the economies in which they operate. This is facilitated through the use of credit ratings and lending limits. The Group uses an array of rating models in both the corporate and retail space. Most are built internally using the Group’s own loss data. Limits and “rules for the business” are driven from the Group’s Risk Appetite Statement and Target Market Risk Acceptance Criteria respectively.
Retail exposures are typically managed on a portfolio basis and assessed based on credit scoring models, credit bureau record, internal and available external customers’ behaviour records and supplemented by risk acceptance criteria.
Wholesale exposures are assessed using approved credit models, reviewed and analysed by experienced credit risk managers taking into consideration the relevant credit risk factors. Credit extensions are proposed by the business unit and are approved by the credit risk function based on independent credit assessment, while also taking into account the business strategies determined by senior management.
Please refer to section 5.5 on page 89 for further discussion on our internal credit risk models.
Counterparty risk that may arise from traded products and securities is measured on a loan equivalent basis and included under the Group’s overall credit limits to counterparties. Issuer Default Risk that may arise from traded products and securities are generally measured based on jump-to-default computations.
Framework policies risk Methodologiesprocesses, Systems
and reports
84 DBS AnnuAl RepoRt 2013

The Group actively monitors and manages its exposure to counterparties in over-the-counter (OTC) derivative trades to protect its balance sheet in the event of a counterparty default. Counterparty risk exposures which may be materially and adversely affected by market risk events are identified, reviewed and acted upon by management and highlighted to the appropriate risk committees. In addition, the Group’s risk measurement methodology takes into account the higher risks associated with transactions that exhibit a strong relationship between the creditworthiness of a counterparty and the expected future replacement value of a relevant transaction (so called wrong-way risk) as identified during the trade booking process. The current exposure method is used for calculating the Group’s net credit exposure and regulatory capital for counterparty exposures, using the mark-to-market exposures with an appropriate add-on factor for potential future exposures.
Concentration Risk ManagementThe Group’s risk management processes aim to ensure that an acceptable level of risk diversification is maintained across the Group on an ongoing basis. Limits are established and regularly monitored in respect of country exposures and major industry groups, as well as for single counterparty exposures. Control structures exist to ensure that appropriate limits are in place, exposures are monitored against these limits, and appropriate actions are taken if limits are breached.
Country RiskCountry risk is the risk of loss which is specifically attributed to events in a specific country (or a group of countries). It includes political risk, exchange rate risk, economic risk, sovereign risk and transfer & convertibility (T&C) risk. In DBS, Country Risk is managed as part of concentration risk management under the Risk Appetite Framework.
T&C risk is the risk that capital and foreign exchange controls may be imposed by government authorities that would prevent or materially impede the conversion of local currency into foreign currency and/or transfer funds to non-residents. A T&C risk event could therefore lead to a default of an otherwise solvent borrower. The principles and approach in the management of transfer risk are set out in the Group’s Country Risk Management Framework. The framework includes an internal T&C risk and sovereign risk rating system where the assessments are made independent of business decisions. T&C risk limits are set in accordance to the Group’s Risk Appetite Framework. Limits for non-strategic countries are set using a model-based approach. Limits for strategic countries are set based on country-specific strategic business considerations and the extent of potential loss versus the Risk Appetite. There are active discussions amongst the senior management and credit management in right-sizing transfer risk exposures to take into account not only risks and rewards, but also whether such exposures are in line with the strategic intent of the Group. All country limits are subject to Board approval.
Stress testingThe Group performs various types of credit stress tests which are directed by the regulators or driven by internal requirements and management. Credit stress tests are performed at a portfolio or sub-portfolio level and are generally meant to assess the impact of changing economic conditions on asset quality, earnings performance, and capital adequacy and liquidity.
A credit stress test working group is responsible for developing and maintaining a robust stress testing program to include the execution of the stress testing process and effective analysis of program results. Stress test results are reported and discussed in Group Credit Risk Committee, Risk ExCo and the BRMC.
The stress testing program is comprehensive in nature spanning all major functions and areas of business. It brings together an expert view of the macro-economics, market, and portfolio information with the specific purpose of driving model and expert oriented stress testing results.
The Group generally performs the following types of credit stress testing at a minimum and others as necessary:
85RISK MAnAGeMent

Pillar 1 Credit Stress Testing DBS conducts Pillar 1 credit stress test regularly as required by regulators. Under the Pillar 1 credit stress test, DBS assesses the impact of a mild stress scenario (at least 2 consecutive quarters of zero GDP growth) on internal rating based (IRB) estimates (i.e. Probability of Default, Loss Given Default and Exposure at Default) and the impact on regulatory capital. The purpose of the Pillar 1 credit stress test is to assess the robustness of internal credit risk models and the cushion above minimum regulatory capital.
Pillar 2 Credit Stress Testing DBS conducts Pillar 2 credit stress test once a year as part of the ICAAP. Under the Pillar 2 credit stress test, DBS assesses the impact of stress scenarios, with different severity, on asset quality, earnings performance, internal and regulatory capital. The results of the credit stress tests will also form the input to the capital planning process under ICAAP. The purpose of the Pillar 2 credit stress testing is to examine, in a rigorous and forward-looking manner, the possible events or changes in market conditions that could adversely impact the Group.
Industry-Wide Stress Testing DBS participates in the industry-wide stress test (IWST) undertaken annually. This is a supervisory driven stress test conducted as part of the supervisory process and ongoing assessment of financial stability by regulator. Under the IWST, the Group is to assess the impact of adverse scenarios, provided by the regulator, on asset quality, earnings performance, and capital adequacy.
Other Stress Testing DBS also conducts multiple independent credit stress tests and sensitivity analyses on its portfolio or a sub-portfolio to evaluate the impact of the economic environment or specific risk factors to identify vulnerabilities for the purpose of developing and executing mitigating actions.
proCeSSeS, SYSteMS anD reportS
The Group continues to invest in systems to support risk monitoring and reporting for both the wholesale and consumer businesses. The end-to-end credit process is constantly subject to review and improvement through various front-to-back initiatives involving the Business, Risk Management, Operations and other key stakeholders.
Day-to-day monitoring of credit exposures, portfolio performance and the external environment that may have an impact on credit risk profiles is key to the Group’s philosophy of effective credit risk management. Risk reporting on credit trends, which may include industry analysis, early warning alerts and key weak credits, is provided to the various credit committees, and key strategies and action plans are formulated and tracked.
Credit control functions ensure that credit risks are being taken and maintained in compliance with Group-wide credit policies and guidelines. These functions ensure proper activation of approved limits, ensure appropriate endorsement of excesses and policy exceptions, and monitor compliance with credit standards and credit covenants established by management and regulators.
An independent credit risk review team conducts regular reviews of credit exposures and judgmental credit risk management processes. It also conducts independent validation of internal credit risk rating processes on an annual basis. These reviews provide senior management with objective and timely assessments of the effectiveness of credit risk management practices and ensure Group-wide policies, internal rating models and guidelines are being adopted consistently across different business units including relevant subsidiaries.
non-performing AssetsThe Group classifies its credit facilities as ‘Performing Assets’ or ‘Non-Performing Assets’ (NPA) in accordance with the MAS’ Notice to Banks No. 612 “Credit Files, Grading and Provisioning” (Notice 612). These guidelines require the Group to categorise its credit portfolios according to its assessment of a borrower’s ability to repay a credit facility from the borrower’s normal sources of income. There are five categories of assets as follows:
86 DBS AnnuAl RepoRt 2013

Classification Description
performing assets
pass grade Indicates that the timely repayment of the outstanding credit facilities is not in doubt.
Special mention grade Indicates that the credit facilities exhibit potential weaknesses that, if not corrected in a timely manner, may adversely affect future repayments and warrant close attention by the Group.
Classified or npa
Substandard grade Indicates that the credit facilities exhibit definable weaknesses either in respect of business, cash flow or financial position of the borrower that may jeopardise repayment on existing terms.
Doubtful grade Indicates that the credit facilities exhibit severe weaknesses such that the prospect of full recovery of the outstanding credit facilities is questionable and the prospect of a loss is high, but the exact amount remains undeterminable.
Loss grade Indicates the amount of recovery is assessed to be insignificant.
The linkage between the above MAS categories and the Group’s internal ratings is shown in Section 5.5.
Credit facilities are classified as restructured assets when the Group grants concessions to a borrower because of deterioration in the financial position of the borrower or the inability of the borrower to meet the original repayment schedule. A restructured credit facility is classified into the appropriate non-performing grade depending on the assessment of the financial condition of the borrower and the ability of the borrower to repay based on the restructured terms. Such credit facilities are not returned to the performing status until there are reasonable grounds to conclude that the borrower will be able to service all future principal and interest payments on the credit facility in accordance with the restructured terms.
Please refer to Note 2.11 to the Financial Statements on page 119 for the Group’s accounting policies on the assessment of specific and general allowances for credit losses. In general, specific allowances are recognised for defaulting credit exposures rated sub-standard and below. The breakdown of NPA for the Group according to Notice 612 requirements by loan grading and industry and the related amounts of specific allowances recognised can be found in Note 41.2 to the Financial Statements on page 165. A breakdown of Group’s past due loans can also be found in the same note.
When required, the Group will take possession of collateral it holds as securities and will dispose of them as soon as practicable, with the proceeds used to reduce the outstanding indebtedness. A breakdown of collateral held for NPA is shown in Note 41.2 to the Financial Statements on page 166. Repossessed collateral is classified in the balance sheet as other assets. The amounts of such other assets for 2013 and 2012 were not material.
5.3. CreDIt rISK MItIGantS
Collateral Where possible, the Group takes collateral as a secondary recourse to the borrower. Collateral includes cash, marketable securities, properties, trade receivables, inventory and equipment and other physical and financial collateral. The Group may also take fixed and floating charges on the assets of borrowers. It has put in place policies to determine the eligibility of collateral for credit risk mitigation, which include requiring specific collaterals to meet minimum operational requirements in order to be considered as effective risk mitigants.
When a collateral arrangement is in place for financial market counterparties covered under market standard documentation (such as Master Repurchase Agreements and International Swaps and Derivatives Association (ISDA) agreements), collateral received is marked to market on a frequency mutually agreed with the counterparties.
The Group is required to post additional collateral in the event of a rating downgrade. As at 31 December 2013, for a one notch downgrade of its Standard & Poor’s Ratings Services and Moody’s Investors Services ratings, the Group would have to post additional collateral amounting to SGD 363 million and SGD 63 million respectively.
87RISK MAnAGeMent

Collateral taken for commercial banking is revalued periodically, depending on the type of collateral. While real estate properties constitute the largest percentage of collateral assets, the Group generally considers the collateral assets to be diversified.
Helping our customers to restructure repayment liabilities, in times of difficulty, is our preferred approach. However, should the need arise, expeditious disposal and recovery processes are in place for disposal of collaterals held by the Group. The Group also maintains a panel of agents and solicitors for the expeditious disposal of non-liquid assets and specialized equipment.
Other Risk MitigantsThe Group manages its credit exposure from derivatives, repo and other repo-style transactions by entering into netting and collateral arrangements with counterparties where it is appropriate and feasible to do so. The credit risk associated with outstanding contracts with positive mark to market is reduced by master netting arrangements to the extent that if an event of default occurs, all amounts with a single counterparty in a netting-eligible jurisdiction are settled on a net basis.
The Group may also enter into agreements which govern the posting of collateral with derivative counterparties for credit risk mitigation (e.g. Credit Support Annexes under ISDA master agreements). These are governed by internal guidelines with respect to the eligibility of collateral types and the frequency of collateral calls.
In addition, the Group also uses guarantees as credit risk mitigants. While the Group may accept guarantees from any counterparty, it sets internal thresholds for considering guarantors to be eligible for credit risk mitigation.
5.4. CreDIt rISK In 2013
Concentration RiskGeographically, our exposure remains predominantly in our home market of Singapore accounting for 41% of the portfolio. Our exposure to customers in Greater China ex-Hong Kong has grown steadily over the years as we continue to rebalance the geographic mix of our business and accounts for 20% of the overall portfolio by the end of 2013. We continue to look for opportunities to diversify out of the home market.
Our overall exposure is well distributed across various industries with General Commerce and Financial Institutions as the largest contributors in the wholesale portfolio.
Please refer to Note 41.4 to the Financial Statements on page 167 for the Group’s breakdown of concentration of credit risk.
Industry Concentration
Manufacturing Building and construction Housing loans General commerce Transportation, storage
& communications Financial Institutions, Investment
and holding companies Government Professionals and private individuals
(excluding housing loans) Others
9%
13%
12%
15%
21%
7%
8%
5%10%
Geographical Concentration
Singapore Hong Kong Rest of Greater China South and South-East Asia Rest of the world
41%
17%
13%
20%
9%
88 DBS AnnuAl RepoRt 2013
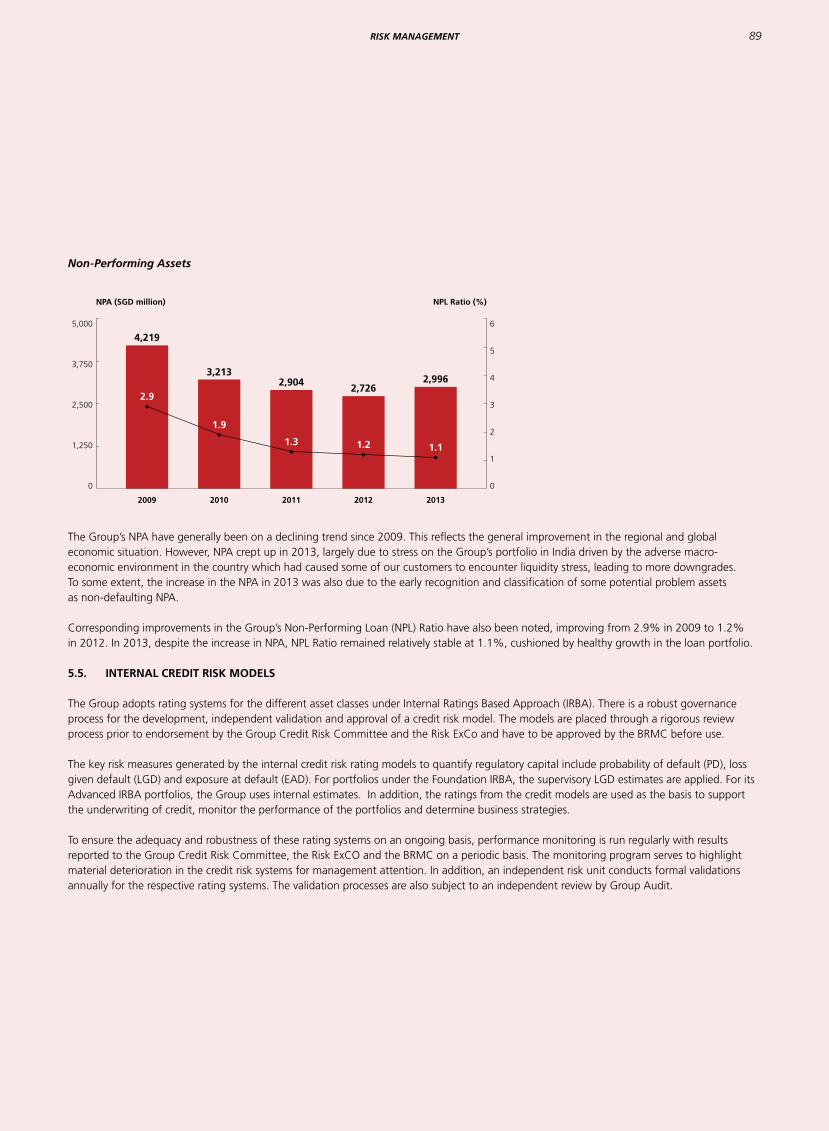
non-performing Assets
The Group’s NPA have generally been on a declining trend since 2009. This reflects the general improvement in the regional and global economic situation. However, NPA crept up in 2013, largely due to stress on the Group’s portfolio in India driven by the adverse macro-economic environment in the country which had caused some of our customers to encounter liquidity stress, leading to more downgrades. To some extent, the increase in the NPA in 2013 was also due to the early recognition and classification of some potential problem assets as non-defaulting NPA.
Corresponding improvements in the Group’s Non-Performing Loan (NPL) Ratio have also been noted, improving from 2.9% in 2009 to 1.2% in 2012. In 2013, despite the increase in NPA, NPL Ratio remained relatively stable at 1.1%, cushioned by healthy growth in the loan portfolio.
5.5. InternaL CreDIt rISK MoDeLS
The Group adopts rating systems for the different asset classes under Internal Ratings Based Approach (IRBA). There is a robust governance process for the development, independent validation and approval of a credit risk model. The models are placed through a rigorous review process prior to endorsement by the Group Credit Risk Committee and the Risk ExCo and have to be approved by the BRMC before use.
The key risk measures generated by the internal credit risk rating models to quantify regulatory capital include probability of default (PD), loss given default (LGD) and exposure at default (EAD). For portfolios under the Foundation IRBA, the supervisory LGD estimates are applied. For its Advanced IRBA portfolios, the Group uses internal estimates. In addition, the ratings from the credit models are used as the basis to support the underwriting of credit, monitor the performance of the portfolios and determine business strategies.
To ensure the adequacy and robustness of these rating systems on an ongoing basis, performance monitoring is run regularly with results reported to the Group Credit Risk Committee, the Risk ExCO and the BRMC on a periodic basis. The monitoring program serves to highlight material deterioration in the credit risk systems for management attention. In addition, an independent risk unit conducts formal validations annually for the respective rating systems. The validation processes are also subject to an independent review by Group Audit.
5,000
3,750
2,500
1,250
0
npa (SGD million)
2009
4,219
3,2132,904
2,7262,996
2010 2011 2012 2013
npL ratio (%)
6
5
4
3
2
1
0
2.9
1.9
1.3 1.2 1.1
89RISK MAnAGeMent

5.5.1. retail exposure Models
Retail portfolios are categorised into asset classes under the Advanced IRBA, namely residential mortgages, qualifying revolving retail exposures and other retail exposures, including vehicle loans extended to individuals.
Within each asset class, exposures are managed on a portfolio basis. Each account is assigned to a risk pool, taking into consideration factors such as borrower characteristics and collateral type. Loss estimates are based on historical default and realised losses within a defined period. The definition of default is applied at the level of a particular facility, rather than at the level of the obligor.
Business-specific credit risk policies and procedures including underwriting criteria, scoring models, approving authorities, frequency of asset quality and business strategy reviews, as well as systems, processes and techniques to monitor portfolio performance against benchmarks are in place. Credit risk models for secured and unsecured portfolios are used to update the risk level of each loan on a monthly basis, reflecting the broad usage of risk models in portfolio quality reviews.
5.5.2. Wholesale exposure Models
Wholesale exposures are assessed under the Foundation IRBA. The risk ratings for the wholesale exposures (other than securitisation exposures) have been mapped to likely corresponding external rating equivalents. A description of the rating grades is provided in the table to give a qualitative explanation of the risk benchmarks.
Sovereign exposures are risk rated using internal risk rating models and guidelines in line with IRBA portfolios. Country-specific macroeconomic risk factors, political risk factors, social risk factors and liquidity risk factors are reviewed objectively in the sovereign rating models to assess the sovereign credit risk in a disciplined and systematic approach.
Bank exposures are assessed using a bank rating model covering various credit risk factors such as capital levels and liquidity, asset quality, earnings, management and market sensitivity. The risk ratings derived are benchmarked against external credit risk ratings to ensure that the internal rating systems are well aligned and appropriately calibrated.
Large corporate credits are assessed using approved models and reviewed by designated credit approvers. Credit factors considered in the risk assessment process include the counterparty’s financial standing and specific non-quantitative factors such as industry risk, access to funding, market standing and management strength.
The counterparty risk rating assigned to smaller business borrowers is primarily based on the counterparty’s financial position and strength.
Credit ratings under the IRBA portfolios are, at a minimum, reviewed on an annual basis unless credit conditions require more frequent assessment. The counterparty risk rating process is reinforced by the facility risk rating system, which considers other exposure risk mitigants, such as collateral and third party guarantees.
A default is considered to have occurred with regard to a particular obligor when either or both of the two following events have taken place:
� Subjective default: Obligor is unlikely to pay its credit obligations in full, without recourse by the Group to actions such as realising security (if held)
� Technical default: Obligor is past due more than 90 days on any credit obligation to the Group
This is consistent with the guidance provided under the MAS’ Notice to Banks No.637 “Notice on Risk Based Capital Adequacy Requirements for Banks incorporated in Singapore” (Notice 637).
90 DBS AnnuAl RepoRt 2013

A description of the internal ratings used and corresponding external ratings and MAS classification for the various portfolios is as follows:
Grade (aCrr) Description of rating Grade Classification equivalent external rating
MaS Classification
PD Grade 1 Taking into account the impact of relevant economic, social or geopolitical conditions, capacity to meet its financial commitment is exceptional.
Exceptional AAA Passed Performing Assets
PD Grade 2 Taking into account the impact of the relevant economic, social or geopolitical conditions, capacity to meet its financial commitment is excellent.
Excellent AA+, AA, AA- Passed
PD Grade 3 More susceptible to adverse economic, social, geopolitical conditions and other circumstances. Capacity to meet its financial commitment is strong.
Strong A+, A, A- Passed
PD Grade 4A/4B
Adequate protection against adverse economic, social or geopolitical conditions or changing circumstances. More likely to lead to a weakened capacity of the obligor to meet its financial commitment.
Good BBB+/BBB Passed
PD Grade 5 Relatively worse off than an obligor rated “4B” but exhibits adequate protection parameters.
Satisfactory BBB- Passed
PD Grade 6A/6B
Satisfactory capacity to meet its financial commitment but capacity may become inadequate due to adverse business, financial, economic, social or geopolitical conditions and changing circumstances.
Acceptable BB+/BB Passed
PD Grade 7A/7B
Marginal capacity to meet its financial commitment but capacity may become inadequate or uncertain due to adverse business, financial, economic, social or geopolitical conditions and changing circumstances.
Marginal BB- Passed
PD Grade 8A Sub-marginal capacity to meet its financial commitment. Adverse business, financial, or economic conditions will likely impair the obligor’s capacity or willingness to meet its financial commitment.
Sub-Marginal B+ Passed
PD Grade 8B/8C
Low capacity to meet its financial commitment. Adverse business, financial, or economic conditions will likely impair the obligor’s capacity or willingness to meet its financial commitment.
Special Caution B/B- Special Mention
PD Grade 9 Vulnerable to non-payment and is dependent upon favourable business, financial, and economic conditions for the obligor to meet its financial commitment. Likely to have little capacity to meet its financial commitment under adverse conditions.
Sub- Performing
CCC-C Sub-Standard(Non-Defaulting)
Classified or NPA
PD Grade 10 and Above
An obligor rated ’10’ and above is in default (as defined under Notice 637).
Default D Sub-Standard and Below (Defaulting)
91RISK MAnAGeMent

5.5.3. Specialised Lending exposures
Specialised lending IRBA portfolios, consisting of income-producing real estate, project finance, object finance, hotel finance and commodities finance, adopt the supervisory slotting criteria specified under Annex 7v of Notice 637. The supervisory slotting criteria guidelines under the supervisory rating categories are used to determine the risk weights to calculate the credit risk-weighted exposures.
5.5.4. Securitisation exposures
The Group is not active in securitisation activities that are motivated by credit risk transfer or other strategic considerations. As a result, the Group does not securitise its own assets, nor does it acquire assets with a view to securitising them.
The Group arranges securitisations for clients and earns fees for arranging such transactions and placing the securities issued into the market. These transactions do not involve special purpose entities that are controlled by the Group. For transactions that are not underwritten, no securitisation exposures are assumed as a direct consequence of arranging the transactions. Any decision to invest in any such arranged transaction is subject to independent risk assessment. Where the Group provides an underwriting commitment, any securitisation exposure arising will be held in the trading book to be traded or sold down in accordance with internal policy and risk limits. In addition, the Group does not provide implicit support for any transactions it structures or in which it has invested.
The Group has processes in place to monitor the credit risk of the Group’s securitisation exposures.
� exposures to client asset-backed securitisations The Group invests in clients’ securitisation transactions from time to time, and this may include securitisation transactions arranged by either
the Group or by other parties. The Group may also act as liquidity facility provider, working capital facility provider or swap counterparty. Such exposures require the approval of the independent risk function prior to being assumed and are subject to regular risk review thereafter, taking into account the underlying risk characteristics of the assets.
� Investment in collateralised debt obligations and asset-backed securitisations The Group continues to hold certain investments in collateralised debt obligations (CDOs) and asset-backed securitisations that were
made before 2008. Allowances for credit losses have been made for the total exposures arising from investments in CDOs. The remaining exposures are reviewed regularly by the independent risk function. Other than these legacy exposures, the Group has invested in asset-backed securitisations in order to meet policy lending requirements in a certain jurisdiction. They require the approval of the independent risk function prior to being assumed and are subject to regular risk review thereafter, taking into account the underlying risk characteristics of the assets.
5.5.5. Credit exposures Falling outside of Internal Credit risk Models
The Group applies the Standardised Approach (SA) for portfolios which are individually immaterial in terms of both size and risk profile and for transitioning portfolios. These portfolios include:
� IRBA-transitioning retail and wholesale exposures� IRBA-exempt retail exposures� IRBA-exempt wholesale exposures
The transitioning retail and wholesale exposures are expected to transit to the Advanced IRBA and Foundation IRBA respectively over the next few years, subject to certification by MAS. In the meantime, the SA has been applied.
The portfolios under the SA are subject to the Group’s overall governance framework and credit risk management practices. Under this framework, the Group continues to monitor the size and risk profile of these portfolios and will look to enhance risk measurement processes should these risk exposures become material.
The Group uses external ratings for credit exposures under the SA, where relevant, and the Group only accepts ratings from Standard & Poor’s, Moody’s and Fitch in such cases. The Group follows the process prescribed in Notice 637 to map the ratings to the relevant risk weights.
92 DBS AnnuAl RepoRt 2013
6. MarKet rISK
6.1. MarKet rISK In DBS
The Group’s exposure to market risk is categorised into:
• trading portfolios: Arising from positions taken for (i) market-making, (ii) client-facilitation and (iii) benefiting from market opportunities. • non-trading portfolios: Arising from (i) positions taken to manage the interest rate risk of the Group’s retail and commercial banking
assets and liabilities, (ii) equity investments comprising of investments held for yield and/or long-term capital gains, (iii) strategic stakes in entities and (iv) structural foreign exchange risk arising mainly from the Group’s strategic investments which are denominated in currencies other than the Singapore dollar.
6.2. MarKet rISK ManaGeMent at DBS
The Group’s approach to market risk management is formulated on the following building blocks:
FraMeWorK
The Market Risk Framework, approved by the BRMC, sets out the Group’s overall approach towards market risk management.
poLICIeS
The Core Market Risk Policy (CMRP) establishes the base standards for market risk management within the Group. The Policy Implementation Guidance and Requirements (PIGR) complements the CMRP and sets out guidance and requirements with more details for specific subject matters. Both CMRP and PIGR facilitate the identification, measurement, control, monitoring and reporting of market risk in a consistent manner within the Group.
rISK MetHoDoLoGIeS
The Group’s market risk appetite framework links market risk EC by a multiplier to Tail Value-at-Risk (TVaR) metric as a tool to monitor and limit market risk exposures. TVaR, or more commonly referenced as Expected Shortfall, is calculated using the historical simulation VaR approach and averaging the losses beyond the 95% confidence interval, over a one-day holding period. TVaR is supplemented by risk control metrics such as sensitivities to risk factors and loss triggers for management action.
The Group conducts backtesting to verify the predictiveness of the VaR model. Backtesting compares VaR calculated for positions at the close of each business day with the revenues which actually arise on those positions on the following business day. The backtesting revenues exclude fees and commissions, and revenues from intra-day trading. For backtesting, VaR at the 99% confidence interval and over a one-day holding period is derived from the same TVaR potential loss distribution. VaR models such as historical simulation VaR permit the estimation of the aggregate portfolio market risk potential loss due to a range of market risk factors and instruments. VaR models have limitations which include but are not limited to: (i) past changes in market risk factors may not provide accurate predictions of the future market movements and (ii) may understate the risk arising from severe market risk related events.
To monitor the Group’s vulnerability to unexpected but plausible extreme market risk related events, the Group has implemented an extensive stress testing policy for market risk where regular and multiple stress tests were run covering trading and non-trading portfolios through a combination of historical and hypothetical scenarios depicting risk factors movement.
Framework policies risk Methodologiesprocesses, Systems
and reports
93RISK MAnAGeMent

TVaR is the key risk metric used to manage the Group’s assets and liabilities’ except for credit spread risk under Loans and Receivables where it is under the credit framework. The Group manages banking book interest rate risk arising from mismatches in the interest rate profile of assets, liabilities and capital instruments (and associated hedges), including basis risk arising from different interest rate benchmarks, interest rate re-pricing risk, yield curve risks and embedded optionality. Behavioural assumptions are applied in managing the interest rate risk of banking book deposits with indeterminate maturities.
Credit derivatives are used in the trading book with single name or index underlyings to support business strategy in building a regional Fixed Income franchise. The Group actively monitors its counterparty credit risk in credit derivative contracts. More than 90% of the gross notional value of the Group’s credit derivative positions as at 31 December 2013 is to 13 large, established names with which the Group maintains collateral agreements.
proCeSSeS, SYSteMS anD reportS
Robust internal control processes and systems are designed and implemented to support the Group’s approach for market risk management. Additionally, regular reviews of these control processes and systems are conducted. These reviews provide senior management with objective and timely assessments of the control processes and systems’ appropriateness and effectiveness.
The day-to-day market risk monitoring, control and analysis is managed by the RMG Market and Liquidity Risk unit – an independent market risk management function that reports to the CRO. This group comprises risk control, risk analytics, production and reporting teams.
6.3. MarKet rISK In 2013
The Group level TVaR considers both trading and non-trading portfolios. The Group level TVaR is tabulated below, showing the period-end, average, high and low TVaR.
1 Jan 2013 to 31 Dec 2013
In SGD million as at 31 Dec 2013 average High Low
Total 87 66 89 31
1 Jan 2012 to 31 Dec 2012
In SGD million as at 31 Dec 2012 average High Low
Total 40 52 62 38
The Group level TVaR as at 31 December 2013 was significantly higher than at 31 December 2012, due to (i) exceptional volatility of June-August 2013 coming into the one-year time series data used in the TVaR calculation and (ii) growth in the Group’s commercial loan book.
The following table shows for Treasury’s trading portfolios, the period-end, average, high and low diversified TVaR and TVaR by risk class:
1 Jan 2013 to 31 Dec 2013
In SGD million as at 31 Dec 2013 average High Low
Diversified 11 10 14 8Interest Rates 9 9 11 7Foreign Exchange 4 6 9 3Equity 1 1 1 0Credit Spread 4 4 5 3Commodity 1 1 1 0
94 DBS AnnuAl RepoRt 2013

1 Jan 2012 to 31 Dec 2012
In SGD million as at 31 Dec 2012 average High Low
Diversified 8 15 24 8Interest Rates 6 10 15 6Foreign Exchange 3 4 5 3Equity 1 2 3 1Credit Spread 5 11 19 5Commodity 0 1 2 0
With effect from fourth quarter 2013, the table excludes structural foreign exchange positions. The definitions in this table have been realigned to follow the demarcation of the banking and trading books based on intent and in-use risk management measures based on TVaR. The structural foreign exchange positions are captured in non-trading book TVaR. If the structural foreign exchange positions were to be included in the above two tables, the diversified TVaR as of 31 Dec 2013 would be SGD 24 million (2012: SGD 14 million). The average, highest and lowest TVaR would be SGD 20 million, SGD 26 million, SGD 13 million respectively (2012: SGD 20 million, SGD 30 million and SGD 13 million).
In the Group, the main risk factors driving Treasury’s trading portfolios in 2013 were interest rates, foreign exchange and credit spreads. Treasury’s trading portfolios’ average TVaR decreased by SGD 5 million (33%), contributed largely by credit spreads falling by SGD 6 million (60%). Increased G7 exposures by the foreign exchange trading desk led to an increase in foreign exchange average TVaR by SGD 2 million (50%). The diversification effect observed for 2013 (average of SGD 11 million) is similar to that observed for 2012 (average of SGD 13 million).
Treasury’s trading portfolio experienced five back-testing exceptions in 2013 compared with none in 2012. The exceptions occurred in June and July, when there was pronounced market volatility.
The key market risk drivers of the Group’s non-trading portfolios are SGD and USD interest rate positions. The economic value impact of changes in interest rates is simulated under various assumptions for the non-trading risk portfolio. The simulated economic value changes are negative SGD 288 million and SGD 532 million (2012: negative SGD 449 million and SGD 848 million) based on parallel shocks to all yield curves of 100 basis points and 200 basis points respectively. The reported figures are based on the worst case of an upward and downward parallel shift in the yield curves.
LIQUIDItY rISK
7.1. LIQUIDItY rISK In DBS
The Group’s liquidity risk arises from its obligations to honour withdrawals of deposits, repayments of borrowed funds at maturity, and commitments to extend credit and support working capital needs.
The Group seeks to manage its liquidity in a manner that ensures that its liquidity obligations would continue to be honoured under normal as well as adverse circumstances.
7.2. LIQUIDItY rISK ManaGeMent at DBS
Liquidity Management and Funding StrategyThe Group strives to develop a diversified funding base with access to funding sources across retail and wholesale channels. In particular, the Group has continuously made inroads in growing, deepening and diversifying its deposit base, spanning retail, wealth management, corporate and institutional customers across markets that it operates in. Supplementing the deposit base, the Group continues to maintain access to wholesale channels, to support the growth of its investor base, as well as to increase flexibility and reduce funding cost in capitalising on business opportunities.
95RISK MAnAGeMent

In deploying the funds, the Group aims to predominantly fund its lending activities via customer deposits and wholesale borrowings. In the event where market conditions lead to insufficient or prohibitively expensive customer funding, flexibility is maintained to fund lending growth with duration matched wholesale funding. With increasing diversification of funding sources, optimising the mismatch in fund deployments against sources with respect to pricing, size, currency and tenor remains challenging. To this end, where practicable and transferable without loss, the Group actively makes use of the swap markets in the conversion of funds across currencies to deploy surplus funds across locations in value.
The Group Assets and Liabilities Committee regularly reviews the growth in loans and deposits, momentum in business activities, market competition, economic outlooks, market conditions and other factors that may affect liquidity in the continual refinement of the Group’s funding strategy.
Approach to Liquidity Risk ManagementThe Group’s approach to liquidity risk management is formulated on the following building blocks:
FraMeWorK
The Liquidity Risk Framework, approved by the BRMC, sets out the Group’s overall approach towards liquidity risk management. The Framework describes the range of strategies employed by the Group to manage its liquidity. These include maintaining an adequate counterbalancing capacity (comprising liquid assets, the capacity to borrow from the money markets as well as forms of managerial interventions that improve liquidity) to address potential cashflow shortfalls and maintaining diversified sources of liquidity. In the event of a potential or actual crisis, the Group has in place a set of liquidity contingency and recovery plans to ensure that decisive actions are taken to ensure the Group maintains adequate liquidity.
poLICIeS
The Core Liquidity Risk Policy establishes the baseline standards for liquidity risk management within the Group. Policies and guidance documents communicate the base standards and detailed requirements throughout the Group and enhance the ability of the Group to manage its liquidity risk.
rISK MetHoDoLoGIeS
The primary measure used to manage liquidity within the tolerance defined by the Board is the cashflow maturity mismatch analysis. The analysis is performed on a regular basis under normal and adverse scenarios, and assesses the adequacy of the counterbalancing capacity to fund or mitigate any cashflow shortfalls that may occur as forecasted in the cashflow movements across successive time bands. To ensure that liquidity is managed in line with the risk appetite, core parameters underpinning the performance of the analysis, such as the types of scenarios, the survival period and the minimum level of liquid assets, are pre-specified for monitoring and control at the Group. Any occurrences of forecasted shortfalls that cannot be covered by the counterbalancing capacity would be escalated to the relevant committees for deliberation and actions.
Stress testing is performed mainly under the cashflow maturity mismatch analysis, and covers adverse scenarios involving shocks that are general market and/or Group-specific in nature to assess the Group’s vulnerability when run-offs in liabilities increase, rollovers of assets and/or liquidity assets buffer reduce. In addition, ad-hoc stress tests are performed as part of the Group’s recovery plan and ICAAP.
Liquidity risk control measures, such as liquidity-related ratios and balance sheet analysis, are complementary tools to the cashflow maturity mismatch analysis and are performed regularly to obtain deeper insights and finer control over the liquidity profile across the Group.
Framework policies risk Methodologiesprocesses, Systems
and reports
96 DBS AnnuAl RepoRt 2013

proCeSSeS, SYSteMS anD reportS
Robust internal control processes and systems underlie the overall approach to identifying, measuring, aggregating, controlling and monitoring liquidity risk across the Group.
The day-to-day liquidity risk monitoring, control reporting and analysis are managed by the RMG Market and Liquidity Risk unit – an independent liquidity risk management function that reports to the CRO. This group comprises risk control, risk analytics, production and reporting teams.
7.3. LIQUIDItY rISK In 2013
For the purpose of risk management, the Group actively monitors and manages its liquidity profile based on the cashflow maturity mismatch analysis.
In forecasting the cashflows under the analysis, behavioural profiling is necessary in cases where a product has indeterminate maturity or the contractual maturity does not realistically reflect the expected cashflows. An example would be maturity-indeterminate savings and current account deposits which are generally viewed as a source of stable funding for commercial banks and consistently exhibited stability even under historical periods of stress.
A conservative view is therefore adopted in the Group’s behavioural profiling of assets, liabilities and off-balance sheet commitments that have exhibited cashflow patterns that differ significantly from the contractual maturity profile shown under Note 42.1 of our Financial Statements on page 169.
The table below shows the Group’s behavioural net and cumulative maturity mismatch between assets and liabilities over a 1-year period under a normal scenario without incorporating growth projections:
In SGD million(a) Less than 7 days 1 week to 1 month 1 to 3 months 3 to 6 months 6 months to 1 year
2013 net liquidity mismatch 18,638 (2,642) 7,052 10,539 11,800Cumulative mismatch 18,638 15,995 23,048 33,587 45,387
2012(b) net liquidity mismatch 18,190 (6,941) 2,199 8,134 2,321Cumulative mismatch 18,190 11,249 13,448 21,582 23,903
(a) Positive indicates a position of liquidity surplus. Negative indicates a liquidity shortfall that has to be funded(b) As the behavioural assumptions used to determine the maturity mismatch between assets and liabilities are updated from time to time, the liquidity mismatches may not
be directly comparable across past balance sheet dates
Net liquidity of the Group is observed to have improved from end 2012, which is consistent with the Group’s efforts in increasing its stable sources of funds from deposit gathering and medium term notes issuances to support overall growth in customer loans.
7.4. LIQUID aSSetS
In DBS, liquid assets are assets that are readily available and can be easily monetised to meet liquidity shortfalls under times of stress. Such assets are internally defined under the governance of the relevant oversight committees, taking into account asset class, issuer type and credit rating, amongst other criteria, before they are reflected as available funds under the cashflow maturity mismatch analysis used to manage liquidity risk within the risk tolerance.
In addition to the characteristics of the liquid assets, the treasury function within the Group should be able to operationally monetise the pool of liquid assets to meet liquidity shortfalls under times of stress. A key operational requirement is that the Group should only view as available funds the liquid assets that are unencumbered. “Unencumbered” means free of legal, regulatory, contractual or other restrictions that may impede the Group’s ability to monetise the asset under times of stress.
97RISK MAnAGeMent

In practice, liquid assets are maintained in key locations and to different significant currency levels to ensure that operating entities in such locations possess a degree of self-sufficiency to support business needs as well as protect against contingencies. The main portion of the Group’s liquid assets is centrally maintained under DBS Bank to support liquidity needs in smaller overseas subsidiaries and branches. Internally, the Group sets on itself a requirement to maintain its pool of liquid assets above a minimum level as a source of contingent funds, taking into account projected stress shortfalls under its cashflow maturity mismatch analysis and other factors.
The table below shows the Group’s encumbered and unencumbered liquid assets by instrument and counterparty against other assets in the same category under the balance sheet. Figures are based on the carrying value as at the balance sheet date.
Liquid assets others(d) total
In SGD million encumbered Unencumbered
2013Cash and balances with central banks(a) 7,777 5,878 5,071 18,726placements with and loans to banks(b) – 8,576 31,241 39,817Financial Investments(c) 2,076 42,810 16,157 61,043
total 9,853 57,264 52,469 119,586
(a) Unencumbered balances with central banks comprise holdings that are unrestricted and available overnight. The encumbered portion represents the mandatory balances held with central banks
(b) Liquid assets comprise nostro accounts and eligible certificates of deposits(c) Financial investments comprise government securities and treasury bills, and bank and corporate securities. Liquid assets comprise securities issued or guaranteed by
sovereigns and central banks, and other corporate securities that are internally assessed to be liquid under times of stress(d) ‘Others’ refer to assets that are not recognised as part of the available pool of liquid assets for liquidity management under stress
In addition to the above table, collateral received in reverse repo transactions amounting to SGD 3,055 million are recognised for liquidity management under stress.
As can be observed from the table, the Group’s funding strategy in the normal course of its business does not rely on collaterised wholesale funding. Instead, liquid assets are maintained as a source of contingent funds to meet potential shortfalls that may arise under times of stress, as assessed under regulatory standards and the Group’s internal measures.
7.5. reGULatorY reQUIreMentS
Based on its internal assessment and participation in the Quantitative Impact Studies by the Basel Committee on Banking Supervision, the Group is well-positioned to meet the minimum standards of the Basel III liquidity-related requirements.
8. operatIonaL rISK
8.1. operatIonaL rISK In DBS
Operational risk include processing errors, fraudulent acts, inappropriate behaviour of staff, vendors’ misperformance, system failure and natural disasters. Operational risk is inherent in most of the Group’s businesses and activities.
Our objective is to keep operational risk at appropriate levels, taking into account the markets the Group operates in, the characteristics of the businesses as well as the competitive and regulatory environment the Group is subject to.
98 DBS AnnuAl RepoRt 2013

8.2. operatIonaL rISK ManaGeMent at DBS
The Group’s approach to operational risk management is formulated on the following building blocks:
FraMeWorK
The Operational Risk Management Framework (the “Framework”), approved by the BRMC, has been developed with the objective to ensure that operational risks within the Group are identified, monitored, managed and reported in a structured, systematic and consistent manner.
poLICIeS
A key component of the Framework is a set of Core Operational Risk Standards which provides guidance on the baseline controls to ensure a controlled and sound operating environment. Each new product or service introduced or outsourcing initiative is subject to a risk review and sign-off process where relevant risks are identified and assessed by departments independent of the risk-taking unit proposing the product or service. Variations of existing products or services and outsourcing initiatives are also subject to a similar process.
Information Technology (IT) risk is managed in accordance to a Technology Risk Management Framework (which covers risk governance, communication, monitoring, assessment, mitigation and acceptance), supported by a set of IT policies and standards, control processes and risk mitigation programs.
Compliance risk is the risk of impairment to the Group’s ability to successfully conduct its business as a result of any failure to comply with applicable regulatory requirement, industry code or standard of professional conduct. The Group Compliance Policy is a key tool to help management, employees and stakeholders understand the Group’s approach to compliance risk, which includes the responsibility, guiding principles and processes involved in managing compliance risk. To address compliance risk, the Group strongly believes in the need to inculcate a strong compliance culture in its employees, mindset and DNA, and in its processes and systems. The Group seeks to establish a strong compliance culture through the leadership of its Board and senior management and aims to comply with the letter and spirit of the laws and regulatory standards in the environment in which it operates.
The Group has a Fraud Management Policy which establishes minimum standards for its businesses and functional units to prevent, detect, investigate and remediate against fraud and related events. This Policy also establishes the components, key roles and the framework of the Fraud Management Programme through which the standards are to be implemented on a unit and geographical level. These standards aim to provide end-to-end management of fraud and related issues for the Group.
The Group Anti Money Laundering, Countering the Financing of Terrorism and Sanctions Policy establishes minimum standards for the business and functional units to mitigate and manage actual and/or potential exposure of the Group to money laundering, terrorist financing, sanctions, corruption, or other illicit financial activity. The Policy also establishes accountabilities for the protection of the assets and reputation of the Group and the interests of customers and shareholders.
Framework policies risk Methodologiesprocesses, Systems
and reports
99RISK MAnAGeMent

rISK MetHoDoLoGIeS
To manage and control operational risk, the Framework encompasses various tools including control self-assessment, operational risk event management and key risk indicators monitoring. Control self-assessment is used by each business or support unit to identify key operational risk and assess the degree of effectiveness of the internal controls. For those control issues identified, the units are responsible to develop action plans and track the timely resolution of these issues. Operational risk events are classified in accordance with Basel standards. Such events, including any significant incidents that may impact the Group’s reputation, are required to be reported based on certain established thresholds. Key risk indicators with pre-defined escalation triggers are employed to facilitate risk monitoring in a forward looking manner.
Major operational risk mitigation programmes include Business Continuity Management and Global Insurance Programme. A robust crisis management and business continuity management program is in place within the Group to oversee the continuity of essential business services during unforeseen events. Types of incidents being managed include technology incidents having enterprise-wide impact on essential banking services, natural disasters with wide geographical area impact, safety-at-risk incidents e.g. terrorism and other events leading to significant business disruption. Senior management provides an attestation to the BRMC on an annual basis including the state of business continuity readiness, extent of alignment to regulatory guidelines and disclosure of residual risks.
To mitigate losses from specific unexpected and significant event risks, the Group purchases group-wide insurance policies, under the Global Insurance Programme, from third-party insurers. These policies cover fraud and civil liability, property damage and general liability and directors’ and officers’ liability.
proCeSSeS, SYSteMS anD reportS
The Group has implemented a web-based system that supports multiple operational risk management processes and tools including operational risk event reporting, control self-assessment, key risk indicators, tracking of issues or action plans and operational risk reporting.
Units are responsible for the day-to-day management of operational risk in their products, processes, systems and activities in accordance with the Framework and policies. RMG Operational Risk provides oversight and monitors the effectiveness of operational risk management, assesses key operational risk issues with units to determine the impact across the Group, and reports and/or escalates key operational risks to relevant senior management and Board-level committees with recommendations on appropriate risk mitigation strategies.
8.3. operatIonaL rISK In 2013
Loss resulting from Operational Risk may result in reduced revenue or in settlement claims and or fines. Claims and fines are recorded as “Other Expenses”. For the Financial Year 2013 we have not recorded any such losses that in themselves were material to the Group.
100 DBS AnnuAl RepoRt 2013

appenDIX
General recommendations Where have we disclosed this?(in risk Section unless otherwise stated)
1 Present all related risk information together in any particular report. Please refer to the table on page 75
2 Define the bank’s risk terminology and risk measures and present key parameter values used.
Sections 2, 5.2, 6.2, 7.2, 8.2
3 Describe and discuss top and emerging risks, incorporating relevant information in the bank’s external reports on a timely basis.
Section 2
4 Once the applicable rules are finalized, outline plans to meet each new key regulatory ratio, e.g. the net stable funding ratio, liquidity coverage ratio and leverage ratio and, once the applicable rules are in force, provide such key ratios.
Not applicableThe rules are not yet adopted in Singapore
risk governance and risk management strategies/business model
5 Summarise prominently the bank’s risk management organisation, processes and key functions.
Section 4
6 Provide a description of the bank’s risk culture, and how procedures and strategies are applied to support the culture.
Section 3
7 Describe the key risks that arise from the bank’s business models and activities, the bank’s risk appetite in the context of its business models and how the bank manages such risks.
Sections 1, 2 and 3
8 Describe the use of stress testing within the bank’s risk governance and capital frameworks. Stress testing disclosures should provide a narrative overview of the bank’s internal stress testing process and governance.
Sections 3.2, 5.2, 6.2, 7.2
Capital adequacy and risk-weighted assets
9 Provide minimum Pillar 1 capital requirements, including capital surcharges for G-SIBs and the application of counter-cyclical and capital conservation buffers or the minimum internal ratio established by management.
Refer to Pillar 3 disclosures published on DBS website
10 Summarise information contained in the composition of capital templates adopted by the Basel Committee to provide an overview of the main components of capital, including capital instruments and regulatory adjustments. A reconciliation of the accounting balance sheet to the regulatory balance sheet should be disclosed.
Refer to Pillar 3 disclosures published on DBS website
11 Present a flow statement of movements since the prior reporting date in regulatory capital, including changes in common equity tier 1, tier 1 and tier 2 capital.
Refer to Pillar 3 disclosures published on DBS website
101RISK MAnAGeMent

General recommendations Where have we disclosed this?(in risk Section unless otherwise stated)
12 Qualitatively and quantitatively discuss capital planning within a more general discussion of management’s strategic planning, including a description of management’s view of the required or targeted level of capital and how this will be established.
Refer to Capital Management and Planning section
13 Provide granular information to explain how risk-weighted assets (RWAs) relate to business activities and related risks.
Not Implemented
14 Present a table showing the capital requirements for each method used for calculating RWAs for credit risk, including counterparty credit risk, for each Basel asset class as well as for major portfolios within those classes. For market risk and operational risk, present a table showing the capital requirements for each method used for calculating them.
Refer to Pillar 3 disclosures published on DBS website
15 Tabulate credit risk in the banking book showing average probability of default (PD) and LGD as well as exposure at default (EAD), total RWAs and RWA density for Basel asset classes and major portfolios within the Basel asset classes at a suitable level of granularity based on internal ratings grades.
Refer to Pillar 3 disclosures published on DBS website
16 Present a flow statement that reconciles movements in RWAs for the period for each RWA risk type.
Not implemented
17 Provide a narrative putting Basel Pillar 3 back-testing requirements into context, including how the bank has assessed model performance and validated its models against default and loss.
Refer to Pillar 3 disclosures published on DBS website
Liquidity
18 Describe how the bank manages its potential liquidity needs and provide a quantitative analysis of the components of the liquidity reserve held to meet these needs, ideally by providing averages as well as period-end balances.
Sections 7.2, 7.4
Funding
19 Summarise encumbered and unencumbered assets in a tabular format by balance sheet categories, including collateral received that can be rehypothecated or otherwise redeployed. This is to facilitate an understanding of available and unrestricted assets to support potential funding and collateral needs.
Section 7.4
20 Tabulate consolidated total assets, liabilities and off-balance sheet commitments by remaining contractual maturity at the balance sheet date. Present separately (i) senior unsecured borrowing (ii) senior secured borrowing (separately for covered bonds and repos) and (iii) subordinated borrowing. Banks should provide a narrative discussion of management’s approach to determining the behavioural characteristics of financial assets and liabilities.
Section 7.4Financial Statements Note 42.1
102 DBS AnnuAl RepoRt 2013

General recommendations Where have we disclosed this?(in risk Section unless otherwise stated)
21 Discuss the bank’s funding strategy, including key sources and any funding concentrations, to enable effective insight into available funding sources, reliance on wholesale funding, any geographical or currency risks and changes in those sources over time.
Section 7.2
Market risk
22 Provide information that facilitates users’ understanding of the linkages between line items in the balance sheet and the income statement with positions included in the traded market risk disclosures (using the bank’s primary risk management measures such as Value at Risk (VaR)) and non-traded market risk disclosures such as risk factor sensitivities, economic value and earnings scenarios and/or sensitivities.
Section 6.2
23 Provide further qualitative and quantitative breakdowns of significant trading and non-trading market risk factors that may be relevant to the bank’s portfolios beyond interest rates, foreign exchange, commodity and equity measures.
Sections 6.2, 6.3
24 Provide qualitative and quantitative disclosures that describe significant market risk measurement model limitations, assumptions, validation procedures, use of proxies, changes in risk measures and models through time and descriptions of the reasons for back-testing exceptions, and how these results are used to enhance the parameters of the model.
Sections 6.2, 6.3
25 Provide a description of the primary risk management techniques employed by the bank to measure and assess the risk of loss beyond reported risk measures and parameters, such as VaR, earnings or economic value scenario results, through methods such as stress tests, expected shortfall, economic capital, scenario analysis, stressed VaR or other alternative approaches. The disclosure should discuss how market liquidity horizons are considered and applied within such measures.
Sections 6.2 , 6.3
Credit risk
26 Provide information that facilitates users’ understanding of the bank’s credit risk profile, including any significant credit risk concentrations.
Section 5.4Financial Statements Note 41.4
27 Describe the policies for identifying impaired or non-performing loans, including how the bank defines impaired or non-performing, restructured and returned-to-performing (cured) loans as well as explanations of loan forbearance policies.
Section 5.2
28 Provide a reconciliation of the opening and closing balances of non-performing or impaired loans in the period and the allowance for loan losses. Disclosures should include an explanation of the effects of loan acquisitions on ratio trends, and qualitative and quantitative information about restructured loans.
Sections 5.2, 5.4Financial Statements Note 41.2
103RISK MAnAGeMent

General recommendations Where have we disclosed this?(in risk Section unless otherwise stated)
29 Provide a quantitative and qualitative analysis of the bank’s counterparty credit risk that arises from its derivatives transactions.
Section 5.2Financial Statements Note 37
30 Provide qualitative information on credit risk mitigation, including collateral held for all sources of credit risk and quantitative information where meaningful.
Section 5.3
other risks
31 Describe ‘other risk’ types based on management’s classifications and discuss how each one is identified, governed, measured and managed. In addition to risks such as operational risk, reputational risk, fraud risk and legal risk, it may be relevant to include topical risks such as business continuity, regulatory compliance, technology, and outsourcing.
Section 2
32 Discuss publicly known risk events related to other risks, including operational, regulatory compliance and legal risks, where material or potentially material loss events have occurred. Such disclosures should concentrate on the effect on the business, the lessons learned and the resulting changes to risk processes already implemented or in progress.
Not applicable
104 DBS AnnuAl RepoRt 2013

CapItaL ManaGeMent anD pLannInG
oBJeCtIve
The capital management and planning process is overseen by the Capital Committee which is chaired by the Chief Financial Officer. Quarterly updates on the Group’s capital position are provided to the Board of Directors which is responsible for the Group’s capital management objective and capital structure. The Group’s capital management objective is to maintain a strong capital position consistent with regulatory requirements under the MAS’ Notice to Banks No. 637 “Notice on Risk Based Capital Adequacy Requirements for Banks Incorporated in Singapore” (Notice 637) and the expectations of various stakeholders, i.e., customers, investors and rating agencies. This objective is pursued while delivering returns to shareholders and ensuring that adequate capital resources are available for business growth and investment opportunities as well as adverse situations. The Group seeks to pay sustainable dividends over time, in line with its capital management objective and long-term growth prospects. For the year ended 31 December 2013, the Board has recommended a final dividend of SGD 0.30 per ordinary share, to which the Scrip Dividend Scheme is being applied, bringing the total ordinary dividend for the year to SGD 0.58.
proCeSS
The Group’s capital management objective is articulated concretely as capital targets that are consistent with the need to support organic and inorganic business growth in line with its strategic plans and risk appetite. A key tool for capital planning is the annual Internal Capital Adequacy Assessment Process (ICAAP). Through the ICAAP, the Group assesses its forecast capital supply and demand relative to its regulatory and internal capital targets, under various scenarios, including stress scenarios of differing scope and severity, over a three-year horizon.
The Group allocates capital capacity on two dimensions: by business line and by entity. Capital allocations by business line are set as part of the budget process and monitored during the year. Return on regulatory capital is one of several metrics used to measure business performance. Capital allocations by entity seek to optimise the distribution of capital resources across the Group’s various entities, taking into account the capital adequacy requirements imposed on each subsidiary in its respective jurisdiction. Capital is allocated to ensure that each subsidiary is able to comply with regulatory requirements as it executes its business strategies in line with the Group strategy. During the course of the year, these subsidiaries did not experience any impediments to the distribution of dividends.
CapItaL StrUCtUre
The Group manages its capital structure within regulatory norms in order to optimise the cost and flexibility offered by various capital resources. In order to achieve this, the Group assesses the need and the opportunity to raise capital from the financial markets.
During the year, approximately six million ordinary shares were issued pursuant to the Scrip Dividend Scheme. This added SGD 103 million to share capital. Refer to Note 32 to the Financial Statements for details on the movement of the Group’s share capital and treasury shares during the year ended 31 December 2013.
The Group enhanced its capital position through an issue of perpetual capital securities in December 2013. These were issued as consideration to holders of non-Basel III-compliant preference shares issued in October 2010 by DBS Bank who successfully tendered their preference shares. Through this capital management initiative, the Group has effectively retired, on a consolidated basis, SGD 805 million of capital instruments ineligible under Basel III rules. Refer to Notes 31, 33 and 35 to the Financial Statements as well as the Pillar 3 Main Features of Capital Instruments disclosure (http://www.dbs.com/investor/preferenceshares/default.aspx) for the terms of the capital instruments that are included in Eligible Total Capital.
105

The table below analyses the movement in Common Equity Tier 1, Additional Tier 1 and Tier 2 Capital during the period.
In SGD million Common equity tier 1 (Cet1) CapitalOpening amount1/ 30,598
Dividends paid (1,376) Issue of shares pursuant to Scrip Dividend Scheme 103 Issue of shares upon exercise of share options 18 Purchase of treasury shares (28) Cost of share-based payments 76 Profit for the year (attributable to shareholders) 3,672 Movements in other comprehensive income, including available-for-sale revaluation reserves (772) Other, including regulatory adjustments and transitional arrangements 357 Closing amount 32,648
Common Equity Tier 1 32,648
additional tier 1 (at1) CapitalOpening amount1/ –
Issuance of perpetual capital securities 803 Movement in AT1 capital instruments issued by fully-consolidated subsidiaries that meet criteria for inclusion (405) Other, including regulatory adjustments and transitional arrangements (398)
Closing amount –
Tier 1 Capital 32,648
tier 2 CapitalOpening amount1/ 6,151
Other, including regulatory adjustments and transitional arrangements 20
Closing amount 6,171
Total Capital 38,819
1/ Pro forma as at 31 December 2012, applying MAS Notice 637 effective 1 January 2013
106 DBS AnnuAl RepoRt 2013

CapItaL aDeQUaCY ratIoS
The Group’s Common Equity Tier 1 Capital Adequacy Ratio (CAR), Tier 1 CAR and Total CAR as at 31 December 2013 were well above the MAS’ minimum requirements of 4.5%, 6.0% and 10.0% respectively. The table below sets out the capital resources and capital adequacy ratios of the Group as at 31 December 2013. The Group’s Tier 1 and Total capital adequacy ratios declined year-on-year due to the reduced eligibility of the Group’s preference shares and subordinated term debts, higher risk-weights under Basel III rules for exposures to financial institutions and exposures to central counterparties, as well as new capital charges for over-the-counter derivatives. Refer to ‘Five-Year Summary’ for the historical trend of Tier 1 and Total CAR. Refer to http://www.dbs.com/investor/quarterlyresults/default.aspx for the Group’s Pillar 3 Quantitative Disclosures which set out details on the Group’s risk‐weighted assets (RWA).
In SGD million 31 Dec 2013 1/ 31 Dec 2012 1/
Share capital 9,607 Disclosed reserves and others 23,917 Regulatory adjustments due to insufficient Additional Tier 1 capital (876)
Common Equity Tier 1 32,648 Additional Tier 1 capital instruments 4,144 Total regulatory adjustments to Additional Tier 1 capital (4,144)
Tier 1 capital 32,648 30,196 Provisions eligible as Tier 2 capital 1,217 Tier 2 capital instruments 4,955 Total regulatory adjustments to Tier 2 capital (1)
Total capital 38,819 36,831 Credit RWA 188,124 173,969Market RWA 35,092 27,827Operational RWA 14,865 13,795
Total RWA 238,081 215,591
Capital adequacy ratio (Car) (%) Common Equity Tier 1 13.7 13.5 2/
Tier 1 13.7 14.0Total 16.3 17.1
Pro forma Common Equity Tier 1 under final rules effective 1 Jan 2018 11.9 11.8 3/
Minimum Car (%) Common Equity Tier 1 4.5 NATier 1 6.0 6.0Total 10.0 10.0
Note:1/ With effect from 1 January 2013, Basel III capital adequacy requirements came into effect in Singapore. Changes due to Basel III affected both eligible capital
and risk-weighted assets. Unless otherwise stated, capital adequacy disclosures relating to dates prior to 1 January 2013 are calculated in accordance with the then prevailing capital adequacy regulations and are thus not directly comparable to those pertaining to dates from 1 January 2013
2/ Definition of Common Equity Tier 1 as at 1 January 2013. Risk-weighted assets include Basel III changes introduced 1 January 20133/ Risk-weighted assets include Basel III changes introduced 1 January 2013NA Not Applicable
107CApItAL MAnAGeMent AnD pLAnnInG

reGULatorY CHanGe
The Group has been required to comply with the Basel Committee for Banking Supervision’s Basel III capital adequacy framework since 1 January 2013, as implemented by MAS under Notice 637.
Notice 637 sets out a minimum Common Equity Tier 1 (CET1) CAR of 4.5% and a minimum Tier 1 CAR of 6.0% with effect from 1 January 2013. These will increase progressively to 6.5% and 8.0% respectively by 1 January 2015. The requirement for Total CAR remains unchanged at 10.0%. By 2015, the minimum capital requirements under Notice 637 are two percentage points higher than the Basel III minima specified by the Basel Committee of 4.5%, 6.0% and 8.0% for CET1, Tier 1 and Total CAR respectively. In line with Basel III, Notice 637 also includes a capital conservation buffer (CCB) and a countercyclical buffer. The capital conservation buffer of 2.5% will be phased in from 1 January 2016 to 1 January 2019. The countercyclical buffer will be phased in from 1 January 2016 to 1 January 2019. The countercyclical buffer is not an ongoing requirement but only applied as and when specified by the relevant banking supervisors. These two buffers are to be maintained in the form of CET1 capital.
The table below summarises the minimum capital requirements under Notice 637.
From 1 January 2013 2014 2015 2016 2017 2018 2019
Minimum Car % CET1 (a) 4.5 5.5 6.5 6.5 6.5 6.5 6.5CCB (b) – – – 0.625 1.25 1.875 2.5CET1 including CCB (a) + (b) 4.5 5.5 6.5 7.125 7.75 8.375 9.0Tier 1 6.0 7.0 8.0 8.625 9.25 9.875 10.5Total 10.0 10.0 10.0 10.625 11.25 11.875 12.5 Countercyclical Buffer – – – 0.625 1.25 1.875 2.5
In addition to changes in minimum capital requirements, Basel III also mandates various adjustments in the calculation of capital resources. These adjustments are being phased in from 1 January 2013 and are for items such as goodwill and investments exceeding certain thresholds. Basel III has also revised the criteria for the eligibility of capital instruments. The Group’s existing preference shares and subordinated term debts are ineligible in the first instance as capital instruments under Basel III rules as they lack provisions for conversion to ordinary shares or write-down at the point of non-viability as determined by the MAS, but are accorded partial recognition under the Basel III transitional arrangements.
The Group’s CET1 CAR as at 31 December 2013 was 13.7%. On a pro forma “look-through” basis, i.e., after all adjustments that will eventually be taken against CET1 by 1 January 2018, the Group’s CET1 CAR was 11.9%. This comfortably exceeded the eventual minimum CET1 CAR requirement under Notice 637 of 9.0% effective on 1 January 2019. The Group is also well-positioned to comply with forthcoming leverage ratio requirements. As at 31 December 2013, the Group’s leverage ratio stood at 7.2%, based on the Basel Committee’s final rules issued in January 2014. This was well above the minimum 3% level being tested during the Basel Committee’s 2013-2017 leverage ratio parallel run.
The Basel Committee has developed an indicator-based methodology for identifying global systemically important banks (G-SIBs) on which higher loss absorbency requirements will be imposed. While the Group is not a G-SIB, it is required to disclose the 12 indicators which are published on the Group website (http://www.dbs.com/investor/quarterlyresults/default.aspx).
108 DBS AnnuAl RepoRt 2013
FINANCIAL STATEMENTS
DBS Group HoLDINGS LTD AND ITS SuBSIDIArIES
110 CoNSoLIDATED INCoME STATEMENT111 CoNSoLIDATED STATEMENT oF
CoMprEHENSIvE INCoME112 BALANCE SHEETS113 CoNSoLIDATED STATEMENT oF CHANGES
IN EquITy114 CoNSoLIDATED CASH FLow STATEMENT
NoTES To THE FINANCIAL STATEMENTS115 Domicile and Activities Summary of Significant Accounting Policies123 Critical Accounting Estimates124 Effects on Financial Statements on Adoption
of New or Revised FRS
Income Statement124 Net Interest Income Net Fee and Commission Income Net Trading Income125 Net Income from Investment Securities Other Income Employee Benefits Other Expenses Allowances for Credit and Other Losses127 Income Tax Expense Earnings Per Ordinary Share
Balance Sheet: Assets128 Classification of Financial Instruments131 Cash and Balances with Central Banks132 Government Securities and Treasury Bills Bank and Corporate Securities133 Loans and Advances to Customers135 Financial Assets Transferred136 Other Assets Deferred Tax Assets/Liabilities137 Subsidiaries and Other Controlled Entities138 Joint Ventures Associates140 Properties and Other Fixed Assets142 Goodwill
Balance Sheet: Liabilities143 Deposits and Balances from Customers Other Liabilities144 Other Debt Securities146 Subordinated Term Debts
Balance Sheet: Share Capital and reserves147 Share Capital148 Other Equity Instruments Other Reserves and Revenue Reserves150 Non-controlling Interests
off-balance Sheet Information151 Contingent Liabilities and Commitments Financial Derivatives
Additional Information155 Share-based Compensation Plans157 Related Party Transactions Fair Value of Financial Instruments162 Credit Risk169 Liquidity Risk172 Capital Management Segment Reporting175 Comparatives
DBS BANk LTD
176 INCoME STATEMENT177 STATEMENT oF CoMprEHENSIvE INCoME178 BALANCE SHEET179 NoTES To THE SuppLEMENTAry
FINANCIAL STATEMENTS
181 DIrECTorS’ rEporT185 STATEMENT By THE DIrECTorS186 INDEpENDENT AuDITor’S rEporT
109

for the year ended 31 December 2013
In $ millions Note 2013 2012
IncomeInterest income 7,986 7,621Interest expense 2,417 2,336
Net interest income 5 5,569 5,285Net fee and commission income 6 1,885 1,579Net trading income 7 1,095 689Net income from investment securities 8 276 419Other income 9 273 542
Total income 9,098 8,514
ExpensesEmployee benefits 10 2,065 1,888Other expenses 11 1,853 1,726Allowances for credit and other losses 12 770 417
Total expenses 4,688 4,031
Share of profits of associates 79 124
profit before tax 4,489 4,607Income tax expense 13 615 588
Net profit 3,874 4,019
Attributable to:Shareholders 3,672 3,809Non-controlling interests 202 210
3,874 4,019
Basic earnings per ordinary share ($) 14 1.50 1.57Diluted earnings per ordinary share ($) 14 1.48 1.56
(The notes on pages 115 to 175 as well as the Risk Management section on pages 75 to 104 form part of these financial statements)
CoNSoLIDATED INCoME STATEMENT
110 DBS AnnuAl RepoRt 2013
DBS Group Holdings ltd and its Subsidiaries
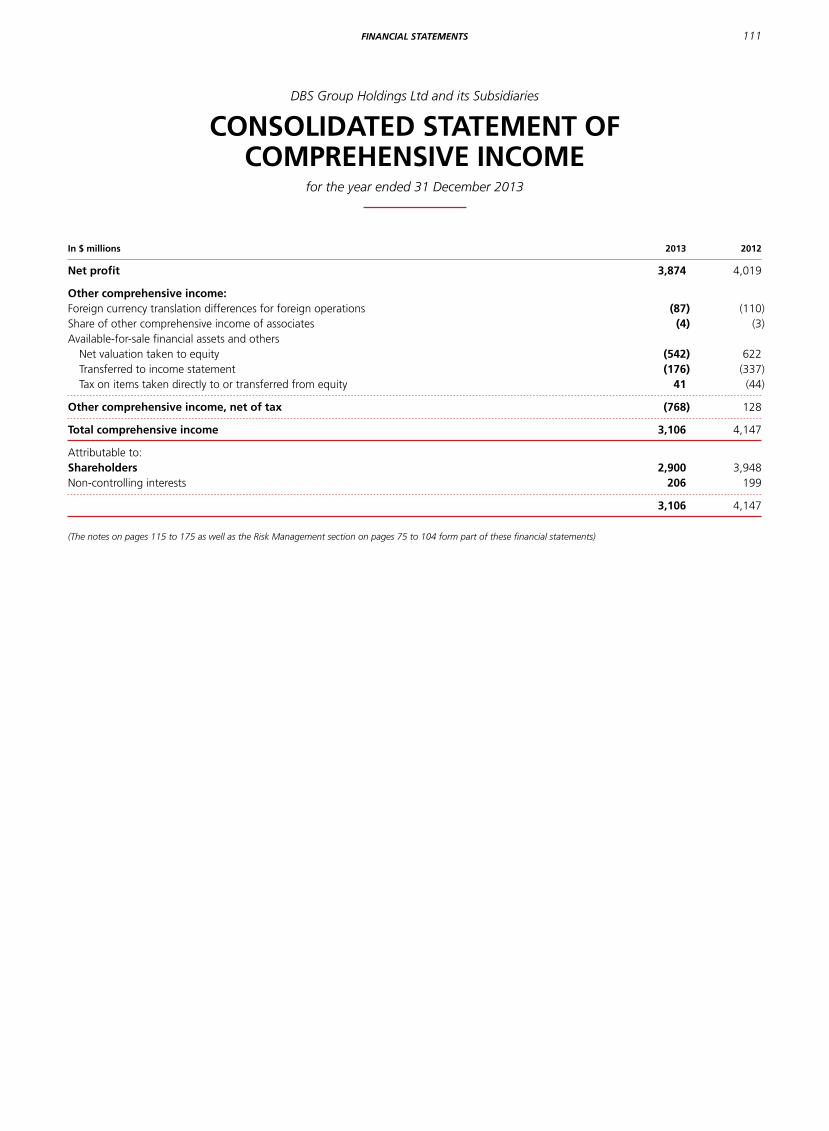
In $ millions 2013 2012
Net profit 3,874 4,019
other comprehensive income:Foreign currency translation differences for foreign operations (87) (110)Share of other comprehensive income of associates (4) (3)Available-for-sale financial assets and others
Net valuation taken to equity (542) 622Transferred to income statement (176) (337)Tax on items taken directly to or transferred from equity 41 (44)
other comprehensive income, net of tax (768) 128
Total comprehensive income 3,106 4,147
Attributable to:Shareholders 2,900 3,948Non-controlling interests 206 199
3,106 4,147
(The notes on pages 115 to 175 as well as the Risk Management section on pages 75 to 104 form part of these financial statements)
for the year ended 31 December 2013
CoNSoLIDATED STATEMENT oF CoMprEHENSIvE INCoME
111Financial StatementS
DBS Group Holdings Ltd and its Subsidiaries

at 31 December 2013
BALANCE SHEETS
Group Company
In $ millions Note 2013 2012 2013 2012
AssetsCash and balances with central banks 16 18,726 17,772Government securities and treasury bills 17 27,497 36,426Due from banks 39,817 29,406Derivatives 37 17,426 17,280Bank and corporate securities 18 33,546 25,448Loans and advances to customers 19 248,654 210,519Other assets 21 8,925 8,702Associates 25 1,166 1,236Subsidiaries 23 – – 12,547 11,159Properties and other fixed assets 26 1,449 1,442Goodwill 27 4,802 4,802
Total assets 402,008 353,033 12,547 11,159
LiabilitiesDue to banks 13,572 15,351Deposits and balances from customers 28 292,365 253,464Derivatives 37 18,132 17,532Other liabilities 29 11,594 11,429 11 8Other debt securities 30 23,115 13,754Subordinated term debts 31 5,544 5,505
Total liabilities 364,322 317,035 11 8
Net assets 37,686 35,998 12,536 11,151
EquityShare capital 32 9,676 9,542 9,704 9,574Other equity instruments 33 803 – 803 –Other reserves 34 6,492 7,229 136 101Revenue reserves 34 17,262 14,966 1,893 1,476
Shareholders’ funds 34,233 31,737 12,536 11,151
Non-controlling interests 35 3,453 4,261
Total equity 37,686 35,998 12,536 11,151
(The notes on pages 115 to 175 as well as the Risk Management section on pages 75 to 104 form part of these financial statements)
112 DBS AnnuAl RepoRt 2013
DBS Group Holdings ltd and its Subsidiaries

for the year ended 31 December 2013
CoNSoLIDATED STATEMENT oF CHANGES IN EquITy
other Non- Share equity other revenue controlling TotalIn $ millions capital instruments reserves reserves Total interests equity
2013Balance at 1 January 9,542 – 7,229 14,966 31,737 4,261 35,998Issue of shares upon exercise of share options 18 18 18Cost of share-based payments 76 76 76Reclassification of reserves upon exercise of share options 4 (4) – –Draw down of reserves upon vesting of performance shares 37 (37) – –Issue of shares pursuant to Scrip Dividend Scheme 103 103 103Purchase of treasury shares (28) (28) (28)Issue of perpetual capital securities 803 803 803Purchase of preference shares of a subsidiary – (805) (805)Final dividends paid for previous year (684) (684) (684)Interim dividends paid for current year (692) (692) (692)Dividends paid to non-controlling interests – (209) (209)Total comprehensive income (772) 3,672 2,900 206 3,106
Balance at 31 December 9,676 803 6,492 17,262 34,233 3,453 37,686
2012Balance at 1 January 9,196 – 7,075 12,523 28,794 4,275 33,069Issue of shares upon exercise of share options 25 25 25Cost of share-based payments 68 68 68Reclassification of reserves upon exercise of share options 2 (2) – –Draw down of reserves upon vesting of performance shares 51 (51) – –Issue of shares pursuant to Scrip Dividend Scheme 268 268 268Final dividends paid for previous year (677) (677) (677)Interim dividends paid for current year (689) (689) (689)Dividends paid to non-controlling interests – (213) (213)Total comprehensive income 139 3,809 3,948 199 4,147
Balance at 31 December 9,542 – 7,229 14,966 31,737 4,261 35,998
(The notes on pages 115 to 175 as well as the Risk Management section on pages 75 to 104 form part of these financial statements)
113Financial StatementS
DBS Group Holdings Ltd and its Subsidiaries

for the year ended 31 December 2013
In $ millions 2013 2012
Cash flows from operating activitiesNet profit 3,874 4,019
Adjustments for non-cash items:Allowances for credit and other losses 770 417Depreciation of properties and other fixed assets 214 179Share of profits of associates (79) (124)Net gain on disposal (net of write-off) of properties and other fixed assets (44) (42)Net income from investment securities (276) (419)Net gain on disposal of associate (221) (450)Income tax expense 615 588
Profit before changes in operating assets and liabilities 4,853 4,168
Increase/(Decrease) in:Due to banks (1,779) (2,907)Deposits and balances from customers 38,901 18,288Other liabilities 716 (6,614)Other debt securities and borrowings 9,323 160
(Increase)/Decrease in:Restricted balances with central banks (998) (366)Government securities and treasury bills 8,540 (5,720)Due from banks (10,427) (2,237)Loans and advances to customers (38,845) (16,208)Bank and corporate securities (8,117) (253)Other assets (312) 5,368Tax paid (562) (587)
Net cash generated from/(used in) operating activities (1) 1,293 (6,908)
Cash flows from investing activitiesDividends from associates 52 82Purchase of properties and other fixed assets (227) (338)Proceeds from disposal of properties and other fixed assets 63 90Acquisition of interest in associates (65) (566)Proceeds from disposal of interest in associate 425 757
Net cash generated from investing activities (2) 248 25
Cash flows from financing activitiesIncrease in share capital 121 295Payment upon maturity of subordinated term debts – (2,575)Issue of subordinated term debts – 2,943Purchase of treasury shares (28) –Dividends paid to shareholders of the Company (1,376) (1,366)Dividends paid to non-controlling interests (209) (213)Issue of perpetual capital securities 803 –Purchase of preference shares of a subsidiary (805) –
Net cash used in financing activities (3) (1,494) (916)
Exchange translation adjustments (4) (91) (99)
Net change in cash and cash equivalents (1)+(2)+(3)+(4) (44) (7,898)Cash and cash equivalents at 1 January 10,993 18,891
Cash and cash equivalents at 31 December (Note 16) 10,949 10,993
(The notes on pages 115 to 175 as well as the Risk Management section on pages 75 to 104 form part of these financial statements)
CoNSoLIDATED CASH FLow STATEMENT
114 DBS AnnuAl RepoRt 2013
DBS Group Holdings ltd and its Subsidiaries

for the year ended 31 December 2013
NoTES To THE FINANCIAL STATEMENTS
These Notes are integral to the financial statements.
The consolidated financial statements for the year ended 31 December 2013 were authorised for issue by the directors on 13 February 2014.
1 DoMICILE AND ACTIvITIES
The Company, DBS Group Holdings Ltd, is incorporated and domiciled in the Republic of Singapore and has its registered office at 12 Marina Boulevard, Marina Bay Financial Centre Tower Three, Singapore 018982.
The Company is listed on the Singapore Exchange.
The Company is principally an investment holding company. Its main wholly-owned subsidiary is DBS Bank Ltd (the Bank), which is engaged in a range of commercial banking and financial services, principally in Asia.
The financial statements relate to the Company and its subsidiaries (the Group) and the Group’s interests in associates and joint ventures.
2 SuMMAry oF SIGNIFICANT ACCouNTING poLICIES
2.1 BASIS oF prEpArATIoN
compliance with Singapore Financial Reporting Standards (FRS)The financial statements of the Company and the consolidated financial statements of the Group are prepared in accordance with Singapore Financial Reporting Standards (FRS) and related Interpretations promulgated by the Accounting Standards Council (ASC). In accordance with Section 201(19) of the Companies Act (the Act), the requirements of FRS 39 Financial Instruments: Recognition and Measurement in respect of loan loss provisioning are modified by the requirements of Notice to Banks No. 612 “Credit Files, Grading and Provisioning” issued by the Monetary Authority of Singapore. As permitted by Section 201(4B) of the Act, the Company’s income statement has not been included in these financial statements.
The financial statements are presented in Singapore dollars and rounded to the nearest million, unless otherwise stated.
Differences between international Financial Reporting Standards (iFRS) and FRSBeyond the above modification to FRS related to Notice to Banks No. 612, there are no significant differences between IFRS and FRS in terms of their application to the Group for periods covered by these financial statements and consequently there would otherwise be no significant differences had the financial statements been prepared in accordance with IFRS. The consolidated financial statements together with the notes thereon as set out on pages 115 to 175 as well as the Risk Management section on pages 75 to 104 include the aggregate of all disclosures necessary to satisfy IFRS and FRS.
2.2 SIGNIFICANT ESTIMATES AND JuDGEMENT
The preparation of financial statements requires management to exercise judgement, use estimates and make assumptions that affect the application of policies and reported amounts of assets, liabilities, income and expenses. Although these estimates are based on management’s best knowledge of current events and actions, actual results may differ from these estimates. Critical accounting estimates and assumptions used that are significant to the financial statements, and areas involving a higher degree of judgement and complexity, are disclosed in Note 3.
2.3 CHANGE IN BALANCE SHEET prESENTATIoN
The presentation of the Group’s balance sheet has been streamlined to focus on the most material assets and liabilities. “Loans and advances to customers” and “Deposits and balances from customers” on the balance sheet are now consistent with the amounts shown as “Customer loans” and “Customer deposits” in the Group’s investor communications. The current presentation also reflects the guidance under IFRS to arrange balance sheet items broadly by their nature and liquidity.
In addition, “Due to Banks” now differentiates interbank money market activities from cash deposits related to fund management activities of institutional investors. The latter are now classified as “Deposits and balances from customers” to better reflect the nature of such deposits. Prior period comparatives have been aligned to the current presentation.
2.4 ADopTIoN oF NEw AND rEvISED ACCouNTING STANDArDS
On 1 January 2013, the Group adopted the following new or revised FRS that are issued by the ASC and relevant for the Group:
� FRS 113 Fair Value Measurement� Amendments to FRS 107 Disclosures – Offsetting Financial
Assets and Financial Liabilities� Amendments to FRS 1 – Presentation of Other
Comprehensive Income� Improvements to FRS (issued in August 2012).
FrS 113 unifies the definition for fair value and establishes a single framework for measuring fair value. It replaces and expands the disclosure requirements for fair value measurements in other FRSs, including FRS 107. Please refer to Note 40 for additional disclosures in this regard.
Amendments to FrS 107 introduce more extensive disclosures that focus on quantitative information on recognised financial instruments that are offset on the balance sheet as well as those that are subject to master netting or similar arrangements irrespective of whether they are offset on the balance sheet. Please refer to Note 15 for additional disclosures.
115Financial StatementS
DBS Group Holdings Ltd and its Subsidiaries
Except for the above additional disclosures, there is no significant impact on the Group’s financial statements from the adoption of the new or revised FRS.
New or revised FRS to be adopted in future reporting periods are outlined in Note 4.
A summary of the most significant group accounting policies is described further below starting with those relating to the entire financial statements followed by those relating to the income statement, the balance sheet and other specific topics. This does not reflect the relative importance of these policies to the Group.
A) General Accounting policies
2.5 Group ACCouNTING
SubsidiariesSubsidiaries are entities over which the Group has the power to govern the financial and operating policies so as to obtain benefits from their activities.
The acquisition method is used to account for business combinations. Subsidiaries are consolidated from the date control is transferred to the Group to the date control ceases. Refer to Note 2.13 for the Group’s accounting policy on goodwill.
All intra-group transactions, balances, income and expenses are eliminated on consolidation.
Special purpose entitiesIn the course of business, the Group is involved in a number of entities with limited and predetermined activities (special purpose entities or SPEs) in different capacities such as structuring securities issuances for clients via SPEs, entering into derivative transactions with SPEs, or investing in certain assets issued by SPEs. While the Group may hold little or no equity in the SPEs, it may consolidate such entities in certain circumstances where there is evidence to suggest it has control over them.
The main SPEs that the Group controls and consolidates are outlined in Note 23. These entities are used for issuance of structured products on behalf of the Group.
Joint venturesJoint ventures are entities that are jointly controlled by the Group together with one or more parties through contractual arrangements. The Group recognises its interests in joint ventures using the proportionate consolidation method.
associatesAssociates are entities over which the Group has significant influence, but no control, and generally holds a shareholding of between and including 20% and 50% of the voting rights. The
Group recognises its investments in associates using the equity method of accounting.
2.6 ForEIGN CurrENCy TrEATMENT
Functional and presentation currencyItems in the financial statements are measured using the functional currency of each entity in the Group, being the currency of the primary economic environment in which the entity operates. The Group’s financial statements are presented in Singapore dollars, which is its functional currency of the Company.
Foreign currency transactions and balancesTransactions in foreign currencies are measured using the exchange rate at the date of the transaction.
Monetary assets and liabilities denominated in foreign currencies are translated into the functional currency of the entity undertaking the transaction at the exchange rate as at the balance sheet date. Foreign exchange differences arising from this translation are recognised in the income statement.
Non-monetary assets and liabilities measured at cost in a foreign currency are translated using the exchange rate at the date of the transaction.
Non-monetary assets and liabilities measured at fair values in foreign currencies are translated using the exchange rates at the date when the fair values are determined, which is generally the balance sheet date.
Unrealised foreign exchange differences arising from non-monetary financial assets and liabilities classified as fair value through profit or loss are recognised in the income statement as trading income. For non-monetary financial assets such as equity investments classified as available-for-sale, unrealised foreign exchange differences are recorded in other comprehensive income and accumulated in equity until the assets are disposed of or become impaired, in which case they are reclassified to the income statement.
Subsidiaries and branchesThe results and financial position of subsidiaries and branches whose functional currency is not Singapore dollars (“foreign operations”) are translated into Singapore dollars in the following manner:
� Assets and liabilities are translated at the exchange rates as at the balance sheet date;
� Income and expenses in the income statement are translated at exchange rates prevailing at each month-end, approximating the exchange rates at the dates of the transactions; and
� All resulting exchange differences are recognised in other comprehensive income.
116 DBS AnnuAl RepoRt 2013

For acquisitions prior to 1 January 2005, the foreign exchange rates at the respective dates of acquisition were used. Please refer to Note 27 for an overview of goodwill recorded. Goodwill and fair value adjustments arising on the acquisition of a foreign operation on or after 1 January 2005 are treated as assets and liabilities of the foreign operation and translated at the closing rate.
On consolidation, foreign exchange differences arising from the translation of net investments in foreign entities, as well as any borrowings and instruments designated as foreign currency hedges of such investments, are recognised in other comprehensive income and accumulated under capital reserves in equity. When a foreign operation is disposed of, such currency translation differences are recognised in the income statement as part of the gain or loss on disposal.
2.7 SEGMENT rEporTING
Operating segments are reported in a manner consistent with the internal reporting provided to management responsible for allocating resources and assessing performance of the operating segments.Please refer to Note 44 for further details on business and geographical segment reporting.
B) Income Statement
2.8 INCoME rECoGNITIoN
interest income and interest expenseInterest income and interest expense as presented in Note 5 represent the income on all assets and liabilities regardless of the classification and measurement of the assets and liabilities on amortised cost or at fair value, with the exception of the Group’s structured investment deposits which are carried at fair value through profit or loss. Interest expense on such structured investment deposits are presented together with other fair value changes in trading income.
Interest income and interest expense are recognised on a time-proportionate basis using the effective interest method as prescribed by FRS. The calculation includes significant fees and transaction costs that are integral to the effective interest rate, as well as premiums or discounts.
Fee and commission incomeThe Group earns fee and commission income from a diverse range of products and services provided to its customers.
Fee and commission income is generally recognised on the completion of a transaction. Such fees include underwriting fees, brokerage fees and fees related to completion of corporate finance transactions. For a service that is provided over a period of time, fee and commission income is recognised over the period during which the related service is provided or credit risk is undertaken. Such fees include the income from issuance of financial guarantees.
Fee and commission income is recorded net of expenses that are required for, directly related to and incremental to generating it. These expenses typically include brokerage fees paid, card-related expenses and sales commissions, but do not include expenses for services delivered over a period (such as service contracts) and other expenses that are not specifically related to fee and commission income transactions.
Dividend incomeDividend income is recognised when the right to receive payment is established. This is generally the ex-dividend date for listed equity securities, and usually the date when shareholders approve the dividend for unlisted equity securities. Dividend income arising from held-for-trading financial assets is recognised in “Net trading income”, and dividend arising from available-for-sale financial assets is recognised in “Net income from investment securities”.
allowances for credit and other lossesPlease refer to Note 2.11 for the accounting policy on impairment of financial assets.
C) Balance Sheet
2.9 FINANCIAL ASSETS
initial recognitionPurchases and sales of all financial assets, even if their classification and measurement are subsequently changed, are recognised on the date that the Group enters into the contractual arrangements with counterparties. When the Group acts as trustee or in a fiduciary capacity without controlling directly or benefiting directly from the assets, these assets and the corresponding income belonging to a customer are excluded from the financial statements.
Financial assets are initially recognised at fair value, which is generally the transaction price.
classification and subsequent measurementThe Group classifies and measures financial assets based on their nature and the purpose for which they are acquired. This generally corresponds to the business models in which they are applied and how management monitors performance, as follows:
� Financial assets (other than derivatives) that are managed mainly for longer-term holding and collection of payments are classified as loans and receivables. These assets have fixed or determinable payments, are not quoted in an active market and are mainly in the segments “Consumer Banking/Wealth Management” and “Institutional Banking”. Loans and receivables are carried at amortised cost using the effective interest method.
� Financial assets that are managed on a fair value basis, which are mainly in the “Treasury” segment, are classified as financial
117Financial StatementS

assets at fair value through profit or loss. Such assets include instruments held for the purpose of short term selling and market making (“Held for trading”), or designated under the fair value option if doing so eliminates or significantly reduces measurement or recognition inconsistencies that would otherwise arise, or if the financial asset contains an embedded derivative that would otherwise need to be separately recorded (“Designated at fair value through profit or loss”).
Realised or unrealised gains or losses on such financial assets, except interest income, are taken to “Net trading income” in the income statement in the period they arise.
Derivatives (including derivatives embedded in other contracts but separated for accounting purposes) are also categorised as “held for trading” unless they are designated as hedges in accordance with Note 2.19. Derivatives are classified as assets when the fair value is positive and as liabilities when the fair value is negative. Changes in the fair value of derivatives other than those designated as hedges are included in “Net trading income”.
� Financial assets that the Group intends to hold to maturity are classified as “held to maturity”. These are Singapore Government securities that the Group holds for satisfying regulatory liquidity requirements and are held within the “Others” segment.
� The Group also holds other financial assets for the purpose of investment or satisfying regulatory liquidity requirements. Such assets are held for an indefinite period and may be sold in response to needs for liquidity or changes in interest rates, credit spreads, exchange rates or equity prices. Financial assets in this category are held in all business segments as well as the liquidity management unit in the “Others” segment. These assets are classified as available-for-sale and initially and subsequently measured at fair value.
Unrealised gains or losses arising from changes in fair value are recognised in other comprehensive income and accumulated in available-for-sale revaluation reserves. When sold or impaired, the accumulated fair value adjustments in the available-for-sale revaluation reserves are reclassified to the income statement. Unquoted equity investments classified as available-for-sale for which fair values cannot be reliably determined are carried at cost, less impairment.
Where the classification and measurement of financial assets do not reflect the management of the financial assets (or financial liabilities), the Group may apply hedge accounting where permissible and relevant to better reflect the management of the financial assets. Please refer to Note 2.19 for details on hedging and hedge accounting.
Please refer to Note 15 for further details on the types of financial assets classified and measured as above.
Reclassification of financial assetsWhen the purpose for holding a financial asset changes, or when FRS otherwise requires it, non-derivative financial assets are reclassified accordingly. Financial assets may be classified out of the fair value through profit or loss or available-for-sale categories only in particular circumstances as prescribed by FRS 39. In 2008 and 2009, the Group reclassified certain financial assets between categories as a result of a change in its holding intention. The reclassifications have had no material impact on the income statement and statement of comprehensive income for the current period.
Determination of fair valueThe fair value of financial assets is the price that would be received if the asset is sold in an orderly transaction between market participants at the measurement date. Fair value is generally estimated by discounting the future contractual cash flows at the current market interest rate that is available to the Group for similar financial instruments. Where applicable, a valuation reserve or pricing adjustment is applied to arrive at the fair value. The determination of fair value is considered a significant accounting policy for the Group and further details are disclosed in Note 40 on fair value measurements.
OffsettingFinancial assets and liabilities are presented net when there is a legally enforceable right to set off the recognised amounts and there is an intention to settle them on a net basis, or realise the asset and settle the liability simultaneously.
DerecognitionFinancial assets are derecognised when the rights to receive cash flows from the financial assets have expired or when they have been transferred together with substantially all the risks and rewards of ownership.
The Group enters into certain transactions where it transfers financial assets recognised on its balance sheet but retains either all or a portion of the risks and rewards of the transferred financial assets. In such cases, the transferred financial assets are not derecognised from the balance sheet. Such transactions include repurchase transactions described in Note 2.12. They also include transactions where control over the financial asset is retained, for example, by a simultaneous transaction (such as options) with the same counterparty to which the asset is transferred. These are mainly transacted in the “Treasury” segment. In such cases the Group continues to recognise the asset to the extent of its continuing involvement and by the extent to which it is exposed to changes in the value of the transferred asset.
Please refer to Note 20 for disclosures on transferred financial assets.
118 DBS AnnuAl RepoRt 2013

2.10 CASH AND CASH EquIvALENTS
For the purposes of the cash flow statement, cash and cash equivalents comprise cash on hand and non-restricted balances with central banks which are readily convertible into cash.
2.11 IMpAIrMENT oF FINANCIAL ASSETS
The Group assesses at each balance sheet date whether there is evidence that a financial asset or a group of financial assets is impaired.
(a) Financial assets classified as loans and receivables and held to maturity
The Group carries out regular and systematic reviews of all credit facilities extended to customers.
The criteria that the Group uses to determine whether there is evidence of an impairment loss include:
� Significant financial difficulty of the issuer or obligor, including breach of covenants and/or financial conditions.
� A breach of contract, such as a default or delinquency in interest or principal payments.
� Granting of a concession to the borrower, for economic or legal reasons relating to the borrower’s financial difficulty, that the Group would not otherwise consider.
� High probability of bankruptcy or other financial reorganisation of the borrower.
Specific allowances for credit lossesA specific allowance for credit losses is established if there is evidence that the Group will be unable to collect all amounts due under a claim according to the original contractual terms or the equivalent value. A “claim” means a loan, debt security or a commitment such as financial guarantees and letters of credit.
A specific allowance for credit losses is recorded as a reduction in the carrying value of a claim on the balance sheet. For an off-balance sheet item such as a commitment, a specific allowance for credit loss is recorded as ”provision for loss in respect of off-balance sheet credit exposures” within “Other liabilities”.
Specific allowances for credit losses are evaluated either individually or collectively for a portfolio.
Specific allowance for an individual credit exposure is made when existing facts, conditions or valuations indicate that the Group is not likely to collect the principal and interest due contractually on the claim. An allowance is reversed only when there has been an identifiable event that has led to an improvement in the collectability of the claim. The amount of specific allowance also takes into account the collateral value, which may be discounted to reflect the impact of a forced sale or untimely liquidation.
Overdue unsecured consumer loans which are homogenous in nature, such as credit card receivables, are pooled according to their delinquency behaviour and evaluated for impairment collectively as a group, taking into account the historical loss experience of such loans.
When a loan is uncollectible, it is written off against the related allowance for loan impairment. Such loans are written off after all the recovery procedures have been exhausted and the amount of the loss has been determined. Recoveries in full or in part of amounts previously written off are credited to the income statement in “Allowances for credit and other losses”.
General allowances for credit lossesApart from specific allowances, the Group also recognises general allowances for credit losses. The Group maintains a level of allowances that is deemed sufficient to absorb the estimated credit losses inherent in its loan portfolio (including off-balance sheet credit exposures). The Group maintains general allowances of at least 1% of credit exposures arising from both on and off-balance sheet items (against which specific allowances have not been made), adjusted for collateral held. This is in accordance with the transitional arrangements under Notice to Banks No. 612 “Credit Files, Grading and Provisioning” issued by the Monetary Authority of Singapore.
(b) Financial assets classified as available-for-saleThe Group assesses at each balance sheet date whether there is evidence that an available-for-sale financial asset is impaired.
In the case of an equity investment, a significant or prolonged decline in the fair value of the security below its cost is a factor in determining whether the asset is impaired.
When there is evidence of an impairment of an available-for-sale financial asset, the cumulative loss – measured as the difference between the acquisition cost and the current fair value, less any impairment loss on that financial asset previously recognised in the income statement – is reclassified from the revaluation reserve within equity to the income statement.
For equity investments, impairment losses are not reversed until they are disposed of. For impaired debt instruments that subsequently recover in value, the impairment losses are reversed through the income statement if there has been an identifiable event that led to the recovery.
2.12 rEpurCHASE AGrEEMENTS
repurchase agreements (repos) are treated as collateralised borrowings. The amount borrowed is reflected as a liability either as “Due to banks” or “Deposits and balances from customers”. The securities sold under repos are treated as pledged assets and remain on the balance sheet at amortised cost or fair value depending on their classification.
119Financial StatementS
reverse repurchase agreements (reverse repos) are treated as collateralised lending. The amount lent is reflected as an asset as “Cash and balances with central banks”, “Due from banks” or “Loans and advances to customers”.
Amounts paid and received in excess of the amounts borrowed and lent on the repos and reverse repos are amortised as interest expense and interest income respectively using the effective interest method.
2.13 GooDwILL
Goodwill arising from business combinations generally represents the excess of the acquisition cost over the fair value of identifiable assets acquired and liabilities and contingent liabilities assumed on the acquisition date. Goodwill is stated at cost less impairment losses and is tested at least annually for impairment.
At the acquisition date, any goodwill acquired is allocated to each of the cash-generating units (CGU) or group of CGUs expected to benefit from the combination’s synergies.
An impairment loss is recognised when the carrying amount of a CGU, or a group of CGUs, including the goodwill, exceeds the applicable recoverable amount. The recoverable amount of a CGU or CGU group is the higher of the CGU’s or CGU group’s fair value less cost to sell and its value-in-use. An impairment loss on goodwill is recognised in the income statement and cannot be reversed in subsequent periods.
2.14 propErTIES AND oTHEr FIxED ASSETS
Properties (including investment properties) and other fixed assets are stated at cost less accumulated depreciation and impairment losses.
Depreciation is calculated using the straight-line method over the estimated useful lives of the assets. Generally, the useful lives are as follows:
Buildings 50 years or over the remaining lease period, whichever is shorter.
Leasehold land 100 years or over the remaining lease period, whichever is shorter. Leasehold land where the unexpired lease period is more than 100 years is not depreciated.
Intangible/Computer software 3 - 5 years
Office equipment, 5 - 10 yearsfurniture and fittings
Please refer to Note 26 for the details of properties and other fixed assets and their movements during the year.
2.15 FINANCIAL LIABILITIES
initial recognition, classification and subsequent measurementFinancial liabilities are initially recognised at fair value. The Group generally classifies and measures its financial liabilities in accordance with the purpose for which the financial liabilities are incurred and managed. Accordingly:
� Financial liabilities are classified as financial liabilities at fair value through profit or loss if they are incurred for the purpose of repurchasing in the near term (“held for trading”), and this usually pertains to short positions in securities for the purpose of ongoing market-making, hedging or trading. Financial liabilities at fair value through profit or loss can also be designated by management on initial recognition (designated under the fair value option). Financial liabilities in this classification are usually within the “Treasury” segment.
In addition, some financial liabilities used to fund specific financial assets measured at fair value through profit or loss are designated under the fair value option when doing so eliminates or significantly reduces measurement or recognition inconsistencies that would otherwise arise.
Realised or unrealised gains or losses on financial liabilities held for trading and financial liabilities designated under the fair value option, except interest expense, are taken to “Net trading income” in the income statement in the period they arise. Interest expense on structured investment deposits at fair value through profit or loss are also presented together with other fair value changes in “Net trading income”.
� Derivative liabilities are treated consistently with derivative assets. Please refer to Note 2.9 for the accounting policy on derivatives.
� Other financial liabilities are carried at amortised cost using the effective interest method. These comprise predominantly the Group’s deposit portfolio under “Deposits and balances from customers” and “Due to banks”, and those under “Other liabilities”.
Please refer to Note 15 for further details on the types of financial liabilities classified and measured as above.
Determination of fair valueThe fair value of financial liabilities is the price that would be paid to transfer the liability in an orderly transaction between market participants at the measurement date.
Please refer also to Note 40 for further fair value measurement disclosures.
120 DBS AnnuAl RepoRt 2013

DerecognitionA financial liability is derecognised from the balance sheet when the obligation specified in the contract is discharged, cancelled or expired.
2.16 LoAN CoMMITMENTS, LETTErS oF CrEDIT AND FINANCIAL GuArANTEES
loan commitmentsLoan commitments are typically not financial instruments and are not recognised on balance sheet but are disclosed off-balance sheet in accordance with FRS 37. They form part of the disclosures in Note 36. Upon a loan draw down, the amount of the loan is accounted for under “loans and receivables” as described in Note 2.9.
letters of creditLetters of credit are recorded off-balance sheet as contingent liabilities upon issuance, and the corresponding payables to the beneficiaries and receivables from the applicants are recognised on-balance sheet upon acceptance of the underlying documents.
Financial guaranteesA financial guarantee is initially recognised in the financial statements at fair value on the date the guarantee is given. This is generally the amount (fee) paid by the counterparty. Subsequently, the fee is recognised over time as income in accordance with the principles in Note 2.8.
Off-balance sheet credit exposures are managed for credit risk in the same manner as financial assets. Please refer to Note 2.11 on the Group’s accounting policies on specific allowances for credit losses.
2.17 provISIoNS AND oTHEr LIABILITIES
Provisions for other liabilities of uncertain timing and amounts are recognised when:
� the Group has a present legal or constructive obligation as a result of past events;
� it is probable that an outflow of resources embodying economic benefits will be required to settle the obligation; and
� a reliable estimate of the amount of the obligation can be made.
The amount recognised as a provision is the best estimate of the expenditure required to settle the present obligation at the balance sheet date.
2.18 SHArE CApITAL AND oTHEr INSTruMENTS CLASSIFIED AS EquITy
Ordinary shares, preference shares and other instruments which do not result in the Group having a contractual obligation to deliver cash or another financial asset, or to exchange financial assets or financial liabilities with the holder under conditions that are potentially
unfavourable to the Group, are classified as equity. Distributions arising from such instruments are recognised in equity as there is no contractual obligation to pay distributions on these instruments. Incremental external costs directly attributable to the issuance of such instruments are accounted for as a deduction from equity.
When any entity within the Group purchases the Company’s ordinary shares (“treasury shares”), the consideration paid including any directly attributable incremental cost is presented as a component within equity, until they are cancelled, sold or reissued.
When treasury shares are subsequently cancelled, the cost of the treasury shares is deducted against either the share capital account or retained earnings. When treasury shares are subsequently sold or reissued, any realised gain or loss on sale or reissue, net of any directly attributable incremental transaction costs and related income tax, is recognised in capital reserves.
For ordinary and preference shares, interim dividends are recorded during the financial year in which they are declared payable. Final dividends are recorded during the financial year in which the dividends are approved by the shareholders at the Annual General Meeting.
D) other Specific Topics
2.19 HEDGING AND HEDGE ACCouNTING
The Group uses derivative contracts mainly as part of its risk management strategies for hedging interest rate risk arising from maturity mismatches or for hedging currency risk arising from currency mismatches and cash flows in foreign currencies.
In some cases, where the strict criteria in FRS 39 are met, hedge accounting is applied as set out in subsequent paragraphs. At the inception of each hedging relationship, the Group documents the relationship between the hedging instrument and hedged item; the risk management objective for undertaking the hedge transaction; and the methods used to assess the effectiveness of the hedge. At inception and on an on-going basis, the Group also documents its assessment of whether the hedging instrument is highly effective in offsetting changes in the fair value or cash flows of the hedged item.
Fair value hedgeThe Group’s fair value hedges consist principally of interest rate swaps used for managing the interest rate gaps that naturally arise from its purchases or issues of debt securities, and where a mismatch in the measurement between the hedging derivative (measured at fair value through profit or loss) and the hedged item (measured at amortised cost) exists. Such hedges are mainly used in the “Treasury” and “Others” segments.
121Financial StatementS

For a qualifying fair value hedge, the changes in the fair value of the hedging derivatives are recorded in the income statement, together with any changes in the fair value of the hedged item attributable to the hedged risk.
If the hedge no longer meets the criteria for hedge accounting, the adjustment to the carrying amount of a hedged item is amortised to the income statement over its remaining maturity, using the effective interest method.
cash flow hedgeFor transactions with highly probable cash flows, derivatives are used to hedge against cash flow variability due to exchange rate movements in certain situations. Cash flow hedge accounting is principally applied in such cases.
The effective portion of changes in the fair value of a derivative designated and qualifying as a cash flow hedge is recognised in other comprehensive income and accumulated under the cash flow hedge reserve in equity. This amount is reclassified to the income statement in the periods when the hedged forecast cash flows affect the income statement. The ineffective portion of the gain or loss is recognised immediately in the income statement under “Net trading income”.
When a hedging instrument expires or is sold, or when a hedge no longer meets the criteria for hedge accounting, any cumulative gain or loss existing in the cash flow hedge reserve remains until the forecast transaction is recognised in the income statement. When a forecast transaction is no longer expected to occur, the cumulative gain or loss in the cash flow hedge reserve is reclassified from equity to the income statement.
net investment hedgeNet investment hedging is applied to hedge investments which comprise certain subsidiaries, branches, associates and joint ventures with a functional currency different from that of the Company. Under the Group’s hedging strategy, the carrying amount of these investments could be fully hedged, partially hedged or not hedged at all.
Hedges of net investments in the Group’s foreign operations are accounted for in a manner similar to cash flow hedges. On disposal of the foreign operations, the cumulative gain or loss in the capital reserves is reclassified to the income statement as part of the gain or loss on disposal.
economic hedges which do not qualify for hedge accountingSome derivatives may be transacted as economic hedges as part of the Group’s risk management but do not qualify for hedge accounting under FRS 39. These include swaps and other derivatives (e.g. futures and options) that the Group transacts to manage interest rate, foreign exchange or other risks. Such derivatives are treated in the same way as derivatives held for trading purposes,
i.e. realised and unrealised gains and losses are recognised in “Net trading income”. In some cases, the hedged exposures are designated at fair value through profit or loss, thereby achieving some measure of offset in the income statement.
Please refer to Note 37.2 for disclosures on hedging derivatives.
2.20 EMpLoyEE BENEFITS
Employee benefits, which include base pay, cash bonuses, share-based compensation, contribution to defined contribution plans such as the Central Provident Fund and other staff-related allowances, are recognised in the income statement when incurred. For defined contribution plans, contributions are made to publicly or privately administered funds on a mandatory, contractual or voluntary basis. Once the contributions have been paid, the Group has no further payment obligations.
Employee entitlement to annual leave is recognised when they accrue to employees. A provision is made for the estimated liability for annual untaken leave as a result of services rendered by employees up to the balance sheet date.
2.21 SHArE-BASED CoMpENSATIoN
Employee benefits also include share-based compensation, namely the DBSH Share Ownership Scheme (the Scheme), the DBSH Share Option Plan, the DBSH Share Plan and the DBSH Employee Share Plan (the Plans). The details of the Scheme and Plans are described in Note 38.
Equity instruments granted and ultimately vested under the Plans are recognised in the income statement based on the fair value of the equity instrument at the date of grant. The expense is amortised over the vesting period of each award, with a corresponding adjustment to the share option/plan reserves. Monthly contributions to the Scheme are expensed off when incurred.
For the DBSH Share Plan and the DBSH Employee Share Plan, a trust has been set up for each share plan. The employee trust funds are consolidated and the DBSH shares held by the trust funds are accounted for as “treasury shares”, which is presented as a deduction within equity.
2.22 CurrENT AND DEFErrED TAxES
Current income tax for current and prior periods is recognised as the amount expected to be paid or recovered from the tax authorities, using the tax rates and tax laws that have been enacted or substantively enacted by the balance sheet date. The Group considers uncertain tax positions generally at the level of the total tax liability to each tax authority for each period. The liability is determined based on the total amount of current tax expected to be paid, taking into account all tax uncertainties, using either an
122 DBS AnnuAl RepoRt 2013

expected value approach or a single best estimate of the most likely outcome.
Tax assets and liabilities of the same type (current or deferred) are offset when a legal right of offset exist and settlement in this fashion is intended. This applies generally when they arise from the same tax reporting group and relate to the same tax authority.
Deferred income tax is provided on temporary differences arising between the tax bases of assets and liabilities and their carrying amounts in the financial statements. The amount of deferred tax provided is based on the expected manner of realisation or settlement of the carrying amount of assets and liabilities, using tax rates enacted or substantively enacted by the balance sheet date.
The amount of deferred tax assets recognised takes into account the likelihood the amount that can be used to offset payable taxes for future profits.
Deferred tax related to fair value re-measurement of available-for-sale investments, which are recognised outside profit or loss, is also recognised outside profit or loss, i.e. in other comprehensive income and accumulated in the available-for-sale revaluation reserves.
3 CrITICAL ACCouNTING ESTIMATES
The Group’s accounting policies and use of estimates are integral to the reported results. Certain accounting estimates require management’s judgement in determining the appropriate methodology for valuation of assets and liabilities. Procedures are in place to ensure that methodologies are reviewed and revised as appropriate. The Group believes its estimates for determining the valuation of its assets and liabilities are appropriate.
The following is a brief description of the Group’s critical accounting estimates that involve management’s valuation judgement.
3.1 IMpAIrMENT ALLowANCES
It is the Group’s policy to establish, through charges against profit, specific and general allowances in respect of estimated and inherent credit losses in its portfolio as described in Note 2.11.
In estimating specific allowances, the Group assesses the gap between borrowers’ obligations to the Group and their repayment ability. The assessment takes into account various factors, including the economic or business outlook, the future profitability of the borrowers and the liquidation value of collateral. Such assessment requires considerable judgement.
Another area requiring judgement is the calculation of general allowances, which are established after taking into account historical data and management’s assessment of the current economic and credit environment, country and portfolio risks, as well as industry
practices. Please refer to the Risk Management section for a further description of the Group’s credit risk management.
3.2 FAIr vALuE oF FINANCIAL INSTruMENTS
The majority of the Group’s financial instruments reported at fair value are based on quoted and observable market prices or on internally developed models that are based on independently sourced market parameters.
The fair value of financial instruments without an observable market price in a liquid market may be determined using valuation models. The choice of model requires significant judgement for complex products especially those in the “Treasury” segment.
Policies and procedures have been established to facilitate the exercise of judgement in determining the risk characteristics of various financial instruments, discount rates, estimates of future cash flows and other factors used in the valuation process.
Please refer to Note 40 for details on fair valuation and fair value hierarchy of the Group’s financial instruments measured at fair value.
3.3 GooDwILL
The Group performs an impairment review to ensure that the carrying amount of a CGU to which goodwill is allocated does not exceed the recoverable amount of the CGU. Note 27 provides details of goodwill as of the reporting date.
The recoverable amount represents the present value of the estimated future cash flows expected to arise from continuing operations. Therefore, in arriving at the recoverable amount, management exercises judgement in estimating the future cash flows, growth rate and discount rate.
3.4 INCoME TAxES
The Group has exposure to income taxes in numerous jurisdictions. Significant judgement is involved in determining the Group-wide provision for income taxes. The Group recognises liabilities for expected tax issues based on reasonable estimates of whether additional taxes will be due. Where uncertainty exists around the Group’s tax position including resolution of any related appeals or litigation processes, appropriate provisions are provided based on technical merits of the positions with the same tax authority. Note 22 provides details of the Group’s deferred tax assets/liabilities. In general, determination of the value of assets/liabilities relating to carry forward tax losses requires judgement.
123Financial StatementS

4 EFFECTS oN FINANCIAL STATEMENTS oN ADopTIoN oF NEw or rEvISED FrS
The Group has not applied the following FRS that have been issued and are most relevant to the Group but are not yet effective. These new/revised standards will be adopted by the Group for annual periods commencing on their effective date of 1 January 2014, and are not expected to have significant impact to the Group’s financial statements.
�FRS 110 Consolidated Financial Statements� FRS 111 Joint Arrangements�FRS 112 Disclosure of Interests in Other Entities�Amendments to FRS 32 Offsetting Financial Assets and
Financial Liabilities
5 NET INTErEST INCoME
The Group
In $ millions 2013 2012
Cash and balances with central banks and Due from banks 460 496Customer non-trade loans 4,710 4,341Trade assets 1,458 1,303Debt securities 1,358 1,481
Total interest income 7,986 7,621
Deposits and balances from customers 1,926 1,782Other borrowings 491 554
Total interest expense 2,417 2,336
Net interest income 5,569 5,285
Comprising:Interest income for financial assets at fair value through profit or loss 329 353Interest income for financial assets not at fair value through profit or loss 7,657 7,268Interest expense for financial liabilities at fair value through profit or loss (107) (92)Interest expense for financial liabilities not at fair value through profit or loss (2,310) (2,244)
Total 5,569 5,285
6 NET FEE AND CoMMISSIoN INCoME
The Group
In $ millions 2013 2012
Stockbroking 214 179Investment banking 191 148Trade and transaction services(b) 531 473Loan-related 367 333Cards(c) 337 299Wealth management 412 300Others 69 43
Fee and commission income 2,121 1,775Less: fee and commission expense 236 196
Net fee and commission income(a) 1,885 1,579
(a) Includes net fee and commission income of $28 million (2012: $29 million), which is derived from the provision of trust and other fiduciary services during the year. Net fee and commission income earned from financial assets or liabilities not at fair value through profit or loss is $671 million (2012: $603 million) during the year
(b) Includes trade & remittances, guarantees and deposit-related fees(c) Cards fees are net of interchange fees paid
7 NET TrADING INCoME
The Group
In $ millions 2013 2012
Net trading income– Foreign exchange 981 705– Interest rates, credit, equities and others(a) 138 32Net loss from financial assets designated at fair value (24) (3)Net loss from financial liabilities designated at fair value # (45)
Total 1,095 689
# Amount under $500,000(a) Includes dividend income of $14 million (2012: $11 million)
124 DBS AnnuAl RepoRt 2013

8 NET INCoME FroM INvESTMENT SECurITIES
The Group
In $ millions 2013 2012
Debt securities– Available-for-sale 89 294– Loans and receivables 5 7Equity securities(a) 182 118
Total(b) 276 419
Comprising net gains transferred from:Available-for-sale revaluation reserves 197 345
(a) Includes dividend income of $69 million (2012: $38 million)(b) Includes fair value impact of hedges for the investment securities
9 oTHEr INCoME
The Group
In $ millions 2013 2012
Rental income 29 23Net gain on disposal of properties and other fixed assets 44 49Others(a) 200 470
Total 273 542
(a) 2013 includes an amount of $171 million, comprising a gain of $221 million (2012: $450 million) for the partial divestment of a stake in the Bank of the Philippine Islands less a sum of $50 million set aside to establish the DBS Foundation to further the Group’s commitment to social and community development. Refer to Note 25
10 EMpLoyEE BENEFITS
The Group
In $ millions 2013 2012
Salaries and bonus 1,689 1,544Contributions to defined contribution plans 98 95Share-based expenses 76 68Others 202 181
Total 2,065 1,888
11 oTHEr ExpENSES
The Group
In $ millions 2013 2012
Computerisation expenses(a) 678 622Occupancy expenses(b) 365 330Revenue-related expenses 231 222Others(c) 579 552
Total 1,853 1,726
(a) Includes hire and maintenance of computer hardware and software(b) Includes rental expenses of office and branch premises of $216 million
(2012: $178 million) and amounts incurred in the maintenance and service of buildings
(c) Includes office administration expenses (e.g. printing, stationery, telecommunications, etc), and legal and professional fees
The Group
In $ millions 2013 2012
Depreciation expenses 214 179Hire and maintenance of fixed assets, including building-related expenses 355 319Expenses on investment properties 7 7Audit fees payable to external auditors(a):– Auditors of the Company 3 3– Associated firms of Auditors of the Company 4 3Non audit fees payable to external auditors(a):– Auditors of the Company 1 #– Associated firms of Auditors of the Company 1 1
# Amount under $500,000(a) PricewaterhouseCoopers network firms
12 ALLowANCES For CrEDIT AND oTHEr LoSSES
The Group
In $ millions 2013 2012
Loans and advances to customers (Note 19) 726 379Investment securities– Available-for-sale 8 16– Loans and receivables 8 1Properties and other fixed assets (1) 1Off-balance sheet credit exposures 23 5Others (bank loans and sundry debtors) 6 15
Total 770 417
125Financial StatementS

The table below shows the movements in specific and general allowances during the year for the Group:
The Group
Charge/ Net (write-back) write-off Exchange Balance at to income during and other Balance at 31In $ millions 1 January statement the year movements December
2013Specific allowancesLoans and advances to customers (Note 19) 1,217 416 (552) 48 1,129Investment securities 71 7 (11) 2 69Properties and other fixed assets 50 (1) (1) – 48Off-balance sheet credit exposures 2 1 – (2) 1Others (bank loans and sundry debtors) 39 7 (2) 9 53
Total specific allowances 1,379 430 (566) 57 1,300
Total general allowances for credit exposures 2,511 340 – 14 2,865
Total allowances 3,890 770 (566) 71 4,165
2012Specific allowancesLoans and advances to customers (Note 19) 1,188 198 (149) (20) 1,217Investment securities 66 17 (10) (2) 71Properties and other fixed assets 62 1 (12) (1) 50Off-balance sheet credit exposures 40 (8) – (30) 2Others (bank loans and sundry debtors) 45 (2) (3) (1) 39
Total specific allowances 1,401 206 (174) (54) 1,379
Total general allowances for credit exposures 2,339 211 – (39) 2,511
Total allowances 3,740 417 (174) (93) 3,890
126 DBS AnnuAl RepoRt 2013

13 INCoME TAx ExpENSE
Income tax expense in respect of profit for the financial year is analysed as follows:
The Group
In $ millions 2013 2012
Current tax expense– Current year 704 637– Prior years’ provision (28) (63)Deferred tax expense– Prior years’ provision (3) (2)– Origination of temporary differences (58) 16
Total 615 588
The deferred charge/(credit) in the income statement comprises the following temporary differences:
The Group
In $ millions 2013 2012
Accelerated tax depreciation 3 7 Allowances for loan losses (51) 6 Other temporary differences (13) 1
Deferred tax (credit)/charge to income statement (61) 14
The tax on the Group’s profit (before share of profits of associates) differs from the theoretical amount that would arise using the Singapore basic tax rate as follows:
The Group
In $ millions 2013 2012
Profit 4,410 4,483
Prima facie tax calculated at a tax rate of 17% (2012: 17%) 750 762Effect of different tax rates in other countries 23 88Net income not subject to tax (97) (96)Net income taxed at concessionary rate (74) (69)Others 13 (97)
Income tax expense charged to income statement 615 588
Refer to Note 22 for further information on deferred tax assets/liabilities.
14 EArNINGS pEr orDINAry SHArE
The Group
Number of shares (millions) 2013 2012
Weighted average number of ordinary shares in issue (a) 2,441 2,413Dilutive effect of share options # 1Full conversion of non-voting redeemable CPS 30 30
Weighted average number of ordinary shares in issue (diluted) (aa) 2,472 2,444
# Amount under $500,000
The Group
In $ millions 2013 2012
Net profit attributable to shareholders (Net profit less dividends on other equity instruments) (b) 3,669 3,809Net profit (less preference dividends and dividends on other equity instruments) (c) 3,660 3,800
Earnings per ordinary share ($)Basic (c)/(a) 1.50 1.57Diluted (b)/(aa) 1.48 1.56
For the purpose of calculating the diluted earnings per ordinary share, the weighted average number of ordinary shares in issue is adjusted to take into account the effect of a full conversion of non-voting redeemable convertible preference shares and the exercise of all outstanding share options granted to employees when such shares would be issued at a price lower than the average share price during the financial year.
127Financial StatementS

15 CLASSIFICATIoN oF FINANCIAL INSTruMENTS
The Group
2013
Designated at fair value Loans and through receivables/ Held profit amortised Available- Held to HedgingIn $ millions for trading or loss cost for-sale maturity derivatives Total
AssetsCash and balances with central banks – – 14,789 3,937 – – 18,726Government securities and treasury bills 6,220 – 39 20,689 549 – 27,497Due from banks 2,375 – 35,745 1,697 – – 39,817Derivatives 17,174 – – – – 252 17,426Bank and corporate securities 8,713 75 11,907 12,851 – – 33,546Loans and advances to customers – 883 247,771 – – – 248,654Other financial assets – – 8,720 – – – 8,720
Total financial assets 34,482 958 318,971 39,174 549 252 394,386
Non-financial assets(a) 7,622
Total assets 402,008
LiabilitiesDue to banks 82 – 13,490 – – – 13,572Deposits and balances from customers 569 1,374 290,422 – – – 292,365Derivatives 17,914 – – – – 218 18,132Other financial liabilities 1,353 – 9,012 – – – 10,365Other debt securities 2,651 965 19,499 – – – 23,115Subordinated term debts – – 5,544 – – – 5,544
Total financial liabilities 22,569 2,339 337,967 – – 218 363,093
Non-financial liabilities(b) 1,229
Total liabilities 364,322
(a) Includes associates, goodwill, properties and other fixed assets and deferred tax assets(b) Includes current tax liabilities, deferred tax liabilities and provision for loss in respect of off-balance sheet credit exposures
128 DBS AnnuAl RepoRt 2013

The Group
2012
Designated at fair value Loans and through receivables/ Held profit amortised Available- Held to HedgingIn $ millions for trading or loss cost for-sale maturity derivatives Total
AssetsCash and balances with central banks – – 14,841 2,931 – – 17,772Government securities and treasury bills 8,845 – 25 27,556 – – 36,426Due from banks 598 – 27,514 1,294 – – 29,406Derivatives 17,044 – – – – 236 17,280Bank and corporate securities 4,844 65 9,581 10,958 – – 25,448Loans and advances to customers – 1,124 209,395 – – – 210,519Other financial assets – – 8,611 – – – 8,611
Total financial assets 31,331 1,189 269,967 42,739 – 236 345,462
Non-financial assets(a) 7,571
Total assets 353,033
LiabilitiesDue to banks 746 – 14,605 – – – 15,351Deposits and balances from customers 792 950 251,722 – – – 253,464Derivatives 17,243 – – – – 289 17,532Other financial liabilities 1,843 – 8,506 – – – 10,349Other debt securities 2,373 1,145 10,236 – – – 13,754Subordinated term debts – – 5,505 – – – 5,505
Total financial liabilities 22,997 2,095 290,574 – – 289 315,955
Non-financial liabilities(b) 1,080
Total liabilities 317,035
(a) Includes associates, goodwill, properties and other fixed assets and deferred tax assets(b) Includes current tax liabilities, deferred tax liabilities and provision for loss in respect of off-balance sheet credit exposures
129Financial StatementS

The disclosures set out in the tables below pertain to financial assets and liabilities that are not offset in the Group’s balance sheet but are subject to enforceable master netting arrangement or similar agreement that covers similar financial instruments. The disclosures enable the understanding of both the gross and net amounts (for IFRS and US GAAP readers respectively), as well as provide additional information on how such credit risk is mitigated.
related amounts not set off on balance sheet
Financial instruments Gross recognised Carrying not in scope of financialIn $ millions amounts on offsetting instruments Financial Cash collateral Net amountsTypes of financial balance sheet disclosures in scope instruments received/pledged in scopeassets/liabilities (A) (B) (A – B = C + D + E) (C) (D) (E)
2013Financial AssetsDerivatives 17,426(a) 7,205(b) 10,221 9,802(b) 309 110Reverse repurchase agreements 4,780(c) 597 4,183 4,171 – 12Securities borrowings 35(d) – 35 34 – 1
Total 22,241 7,802 14,439 14,007 309 123
Financial LiabilitiesDerivatives 18,132(a) 6,028(b) 12,104 9,845(b) 1,637 622Repurchase agreements 2,010(e) 39 1,971 1,970 – 1Securities lendings –(f) – – – – –
Total 20,142 6,067 14,075 11,815 1,637 623
Financial assets and liabilities are presented net when there is a legally enforceable right to set off the recognised amounts, and there is intention to settle them on a net basis or to realise the asset and settle the liability simultaneously.
Financial assets and liabilities offset on the balance sheetAs at 31 December 2013, “Loans and advances to customers” of $2,452 million (2012: $3,710 million) were set off against “Deposits and balances from customers” of $2,600 million (2012: $3,734 million) because contractually the Group has a legally enforceable right to set off these amounts, and intends to settle the loans and the deposits simultaneously at maturity or termination dates. This resulted in a net amount of $148 million being reported under “Deposits and balances from customers” as at 31 December 2013 (2012: $24 million).
Financial assets and liabilities subject to netting agreement but not offset on the balance sheetThe Group enters into master netting arrangements with counterparties where it is appropriate and feasible to do so to mitigate counterparty risk. The credit risk associated with favourable contracts is reduced by a master netting arrangement to the extent
that if an event of default occurs, all amounts with the counterparty are settled on a net basis. Master netting arrangements do not result in an offset of financial assets and liabilities on the balance sheet, as the legal right to set off the transactions is conditional upon default.
These agreements include derivative master agreements (including the International Swaps and Derivatives Association (ISDA) Master Agreement), global master repurchase agreements and global securities lending agreements. The collateral received and posted under these agreements are generally conducted under terms that are in accordance with normal market practice. In these agreements, the counterparty is typically allowed to sell or re-pledge those non-cash collateral (i.e. securities) lent or transferred, but has an obligation to return the securities at maturity. If the securities decrease in value, the Group may, in certain circumstances, be required to pay additional cash collateral, and typically the counterparty has recourse only to the securities.
In addition, the Group receives cash and other collateral such as marketable securities to reduce its credit exposure. The Group also engages in a variety of counterparty credit mitigation strategies in addition to netting and collateral arrangements.
130 DBS AnnuAl RepoRt 2013

related amounts not set off on balance sheet
Financial instruments Gross recognised Carrying not in scope of financialIn $ millions amounts on offsetting instruments Financial Cash collateral Net amountsTypes of financial balance sheet disclosures in scope instruments received/pledged in scopeassets/liabilities (A) (B) (A – B = C + D + E) (C) (D) (E)
2012Financial AssetsDerivatives 17,280(a) 7,139(b) 10,141 9,624(b) 447 70Reverse repurchase agreements 2,429(c) – 2,429 2,429 – –Securities borrowings 76(d) – 76 71 – 5
Total 19,785 7,139 12,646 12,124 447 75
Financial LiabilitiesDerivatives 17,532(a) 5,521(b) 12,011 9,662(b) 1,936 413Repurchase agreements 3,335(e) 420 2,915 2,914 – 1Securities lendings 1(f) – 1 – – 1
Total 20,868 5,941 14,927 12,576 1,936 415
(a) Derivatives are measured at fair value through profit or loss(b) Related amounts under “Financial Instruments” are prepared on the same basis as netting arrangements recognised for computation of Capital Adequacy Ratio (CAR) as
set out under MAS Notice 637 (unaudited), which incorporates a conservative stance on enforceable netting. Accordingly, the amounts shown under “Financial assets/liabilities not in scope of offsetting disclosures” are those where either no netting agreement exists or where the netting agreement has not been recognised for computation of CAR
(c) Reverse repurchase agreements shown above are the aggregate of transactions recorded in separate line items on the balance sheet, namely “Cash and balances with central banks”, “Due from banks”, and “Loans and advances to customers”. These transactions are measured at either fair value through profit or loss or amortised cost
(d) Cash collateral placed under securities borrowings are presented under “Other assets” on the balance sheet, and are measured at amortised cost(e) Repurchase agreements shown above is the aggregate of transactions recorded in separate line items on the balance sheet, namely “Due to banks”, and “Deposits and
balances from customers”. These transactions are measured at either fair value through profit or loss or amortised cost(f) Cash collateral placed under securities lendings are presented under “Other liabilities” on the balance sheet, and are measured at amortised cost
16 CASH AND BALANCES wITH CENTrAL BANkS
The Group
In $ millions 2013 2012
Cash on hand 1,803 1,656Non-restricted balances with central banks 9,146 9,337
Cash and cash equivalents 10,949 10,993
Restricted balances with central banks(a) 7,777 6,779
Total 18,726 17,772
(a) Mandatory balances with central banks
131Financial StatementS

17 GovErNMENT SECurITIES AND TrEASury BILLS
The Group
Held for Available- Loans and Held toIn $ millions trading for-sale receivables(c) maturity(d) Total
2013Singapore Government securities and treasury bills(a) 2,013 7,332 – 549 9,894Other government securities and treasury bills(b) 4,207 13,357 39 – 17,603
Total 6,220 20,689 39 549 27,497
2012Singapore Government securities and treasury bills(a) 2,639 10,294 – – 12,933Other government securities and treasury bills(b) 6,206 17,262 25 – 23,493
Total 8,845 27,556 25 – 36,426
(a) Includes financial assets transferred of $564 million (2012: $841 million) (See Note 20)(b) Includes financial assets transferred of $1,450 million (2012: $2,207 million) (See Note 20)(c) The fair value of securities classified as loans and receivables amounted to $39 million (2012: $25 million)(d) The fair value of securities classified as held to maturity amounted to $537 million (2012: Nil)
18 BANk AND CorporATE SECurITIES
The Group
Designated at fair value through Held for profit Available- Loans andIn $ millions trading or loss for-sale receivables(a) Total
2013Bank and corporate debt securities(b) 8,129 75 11,551 12,036 31,791Less: Impairment allowances – – – (129) (129)Equity securities 584 – 1,300 – 1,884
Total 8,713 75 12,851 11,907 33,546
2012Bank and corporate debt securities(b) 4,609 65 9,859 9,702 24,235Less: Impairment allowances – – – (121) (121)Equity securities 235 – 1,099 – 1,334
Total 4,844 65 10,958 9,581 25,448
(a) The fair value of securities classified as loans and receivables amounted to $11,992 million (2012: $9,862 million)(b) Includes financial assets transferred of $902 million (2012: $1,349 million) (See Note 20)
132 DBS AnnuAl RepoRt 2013

19 LoANS AND ADvANCES To CuSToMErS
The Group
In $ millions 2013 2012
Gross 252,181 213,828Less: Specific allowances 1,129 1,217 General allowances 2,398 2,092
248,654 210,519
Analysed by productLong-term loans 100,950 92,917Short-term facilities 51,896 36,048Housing loans 49,147 45,570Trade loans 50,188 39,293
Gross total 252,181 213,828
Analysed by currencySingapore dollar 101,456 90,503Hong Kong dollar 29,463 29,443US dollar 84,998 67,156Others 36,264 26,726
Gross total 252,181 213,828
Refer to Note 41.4 for breakdown of loans and advances to customers by country of incorporation of borrower and industry.
133Financial StatementS

The table below shows the movements in specific and general allowances for loans and advances to customers during the year for the Group:
Charge/ (write-back) Net write-off Exchange Balance at to income during and other Balance at 31In $ millions 1 January statement the year movements December
2013Specific allowances(a)
Manufacturing 222 108 (100) 10 240Building and construction 34 30 (23) 1 42Housing loans 10 (2) – 1 9General commerce 149 139 (154) 8 142Transportation, storage and communications 501 (54) (3) 21 465Financial institutions, investment and holding companies 232 13 (105) 6 146Professionals and private individuals (excluding housing loans) 45 166 (166) 3 48Others 24 16 (1) (2) 37
Total specific allowances 1,217 416 (552) 48 1,129
Total general allowances 2,092 310 – (4) 2,398
Total allowances 3,309 726 (552) 44 3,527
2012Specific allowances(a)
Manufacturing 223 26 (19) (8) 222Building and construction 37 (3) 1 (1) 34Housing loans 11 (1) – – 10General commerce 125 46 (17) (5) 149Transportation, storage and communications 282 227 (9) 1 501Financial institutions, investment and holding companies 392 (152) (5) (3) 232Professionals and private individuals (excluding housing loans) 63 76 (90) (4) 45Others 55 (21) (10) – 24
Total specific allowances 1,188 198 (149) (20) 1,217
Total general allowances 1,919 181 – (8) 2,092
Total allowances 3,107 379 (149) (28) 3,309
(a) Certain loans to investment holding companies have been reclassified to better reflect the underlying principal activity of the companies owned by the holding company. The amounts for prior period have also been reclassified to conform to the current presentation
134 DBS AnnuAl RepoRt 2013

Included in loans and advances to customers are loans designated at fair value, as follows:
The Group
In $ millions 2013 2012
Fair value designated loans and advances and related credit derivatives/enhancementsMaximum credit exposure 883 1,124Credit derivatives/enhancements – protection bought (883) (1,124)Cumulative change in fair value arising from changes in credit risk (138) (61)Cumulative change in fair value of related credit derivatives/enhancements 138 61
Changes in fair value arising from changes in credit risk are determined as the amount of change in their fair value that is not attributable to changes in market conditions that give rise to market risk. Changes in market conditions that give rise to market risk include changes in a benchmark interest rate, foreign exchange rate or index of prices or rates.
During the year, the amount of change in the fair value of the loans and advances attributable to credit risk was a loss of $77 million (2012: gain of $16 million). During the year, the amount of change in the fair value of the related credit derivatives/enhancements was a gain of $77 million (2012: loss of $16 million).
20 FINANCIAL ASSETS TrANSFErrEDThe Group transfers financial assets to third parties or special purpose entities in the course of business, for example when it pledges securities as collateral for repurchase agreements or when it undertakes securities lending arrangements.
Transferred assets are derecognised in the Group’s financial statements when substantially all of their risks and rewards are also transferred. Among them is pledged collateral (mainly cash) for derivative transactions under credit support annexes agreements. Derecognised assets that were subject to the Group’s partial continuing involvement were not material in 2013 and 2012.
Where the Group retains substantially all the risks and rewards of the transferred assets, they continue to be recognised in the Group’s financial statements. These assets are described below.
SecuritiesSecurities transferred under repurchase agreements and securities lending arrangements are generally conducted under terms in line with normal market practice. The counterparty is typically allowed to sell or re-pledge the securities but has an obligation to return them at maturity. If the securities decrease in value, the Group may, in certain circumstances, be required to pay additional cash collateral. The counterparty typically has no further recourse to the Group’s other assets beyond the transferred securities.
For repurchase agreements, the securities transferred are either classified as “fair value through profit or loss” or “available-for-sale”. The Group receives cash in exchange and records a financial
liability for the cash received. The fair value of the associated liabilities approximates the carrying amount of $2,010 million (2012: $3,335 million), which are recorded under “Due to banks” and “Deposits and balances from customers” on the balance sheet.
For securities lending transactions, the securities lent are classified as “available-for-sale” or “loans and receivables” on the balance sheet, and the carrying amount approximates the fair value. As the Group mainly receives other financial assets in exchange, the associated liabilities recorded are not material.
The Group
In $ millions 2013 2012
Securities pledged and transferredSingapore Government securities and treasury bills 564 841Other government securities and treasury bills 1,450 2,207Bank and corporate debt securities 902 1,349
Total securities pledged and transferred 2,916 4,397
loansThe Group also enters into structured funding transactions where it retains the contractual rights to receive cash flows of loans extended to third parties, but assumes a contractual obligation to pay these cash flows under the issued notes. The carrying amounts and fair values of these financial assets and liabilities both amount to $883 million (2012: $1,124 million).
135Financial StatementS

21 oTHEr ASSETS
The Group
In $ millions 2013 2012
Accrued interest receivable 941 844Deposits and prepayments 290 297Clients’ monies receivable from securities business 633 778Sundry debtors and others 6,856 6,692Deferred tax assets (Note 22) 205 91
Total 8,925 8,702
22 DEFErrED TAx ASSETS/LIABILITIES
Deferred tax assets and liabilities are offset when there is a legally enforceable right to set off current tax assets against current tax liabilities and when the deferred income taxes relate to the same tax authority. The deferred tax assets and liabilities are to be recovered and settled after one year and the following amounts, determined after appropriate offsetting, are shown in “Other assets” (Note 21) and “Other liabilities” (Note 29) respectively.
The Group
In $ millions 2013 2012
Deferred tax assets 205 91Deferred tax liabilities (42) (30)
Total 163 61
The movement in deferred tax (prior to offsetting of balances within the same tax jurisdiction) is as follows:
The Group
In $ millions 2013
other Allowances for temporaryDeferred income tax assets losses differences Total
Balance at 1 January 136 73 209Credit to income statement 51 12 63
Balance at 31 December 187 85 272
Available- for-sale financial other Accelerated tax assets temporaryDeferred income tax liabilities depreciation and others differences Total
Balance at 1 January (89) (47) (12) (148)(Charge)/Credit to income statement (3) – 1 (2)Credit to equity – 41 – 41
Balance at 31 December (92) (6) (11) (109)
136 DBS AnnuAl RepoRt 2013

The Group
In $ millions 2012
other Allowances for temporaryDeferred income tax assets losses differences Total
Balance at 1 January 142 84 226Charge to income statement (6) (11) (17)
Balance at 31 December 136 73 209
Available- for-sale financial other Accelerated tax assets temporaryDeferred income tax liabilities depreciation and others differences Total
Balance at 1 January (82) (3) (22) (107)Credit/(Charge) to income statement (7) – 10 3Charge to equity – (44) – (44)
Balance at 31 December (89) (47) (12) (148)
23 SuBSIDIArIES AND oTHEr CoNTroLLED ENTITIES
The Company
In $ millions 2013 2012
Unquoted equity shares, at cost 10,326 10,326Preference shares, at cost (Note 35) 805 –Due from subsidiaries 1,416 833
12,547 11,159
23.1 MAIN opErATING SuBSIDIArIES
The main operating subsidiaries of the Group are listed below:
Effective shareholding %
Name of subsidiary Country of incorporation 2013 2012
Commercial BankingDBS Bank Ltd Singapore 100 100DBS Bank (China) Limited* China 100 100PT Bank DBS Indonesia* Indonesia 99 99DBS Bank (Taiwan) Limited* Taiwan 100 100DBS Bank (Hong Kong) Limited* Hong Kong 100 100
Merchant BankingThe Islamic Bank of Asia Limited Singapore 50 50
StockbrokingDBS Vickers Securities (Singapore) Pte Ltd Singapore 100 100
* Audited by PricewaterhouseCoopers network firms outside Singapore
137Financial StatementS

23.2 SpECIAL purpoSE ENTITIES
The main special purpose entities controlled and consolidated by the Group are listed below:
Name of entity purpose of special purpose entity Country of incorporation
Zenesis SPC Issuance of structured notes Cayman IslandsConstellation Investment Ltd Issuance of structured notes Cayman Islands
24 JoINT vENTurES
The Group’s share of income and expenses, and assets and liabilities of joint venture at 31 December are as follows:
The Group
In $ millions 2013 2012
Income statementShare of income 25 25Share of expenses (19) (19)
Balance sheetShare of total assets 232 205Share of total liabilities 173 153
The main joint venture of the Group is listed below:
Effective shareholding %
Name of joint venture Country of incorporation 2013 2012
Hutchinson DBS Card Limited* British Virgin Islands 50 50
* Audited by PricewaterhouseCoopers network firms outside Singapore
25 ASSoCIATES
The Group
In $ millions 2013 2012
unquotedCost 783 718Share of post acquisition reserves 134 130
Sub-total 917 848
quotedCost 153 246Net exchange translation adjustments (5) (14)Share of post acquisition reserves 101 156
Sub-total(a) 249 388
Total 1,166 1,236
(a) The market value of quoted associates amounted to $525 million (2012: $1,063 million)
138 DBS AnnuAl RepoRt 2013

The Group’s share of income and expenses, assets and liabilities and off-balance sheet items of associates at 31 December are as follows:
The Group
In $ millions 2013 2012
Income statementShare of income 342 472Share of expenses (263) (348)
Balance sheetShare of total assets 3,705 4,779Share of total liabilities 2,539 3,543
off-balance sheetShare of contingent liabilities and commitments 46 57
25.1 MAIN ASSoCIATES
The main associates of the Group are listed below:
Effective shareholding %
Name of associate Country of incorporation 2013 2012
quotedBank of the Philippine Islands(a) ** The Philippines 5.0 9.9Hwang - DBS (Malaysia) Bhd(b)* Malaysia 27.7 27.7
unquotedNetwork for Electronic Transfers (Singapore) Pte Ltd Singapore 33.3 33.3Changsheng Fund Management Company** China 33.0 33.0Central Boulevard Development Pte Ltd Singapore 33.3 30.0
* Audited by PricewaterhouseCoopers network firms outside Singapore** Audited by other auditors(a) The Group’s effective interest in Bank of the Philippine Islands (BPI) is held via Ayala DBS Holdings Inc. (ADHI). BPI is an associate of ADHI(b) Shareholding includes 4.15% held through the Bank
139Financial StatementS

25.2 ACquISITIoN AND DISpoSAL oF INTErESTS IN ASSoCIATES
acquisition of 33% equity stake in central Boulevard Development Pte ltd (cBDPl)On 31 December 2012, the Group acquired a 30% stake in Marina Bay Financial Centre Tower 3 by buying a 30% interest in CBDPL. The purchase was done via Heedum Pte Ltd (Heedum), a wholly-owned subsidiary, from Choicewide Group Limited (CGL), a joint venture of Cheung Kong (Holdings) Ltd and Hutchison Whampoa Limited. The acquisition was structured as a purchase from CGL of the 30% equity interest it holds in, and its associated shareholder’s loan it had advanced to, CBDPL for an aggregate purchase consideration of $1.04 billion.
Both parties also entered into a conditional put option agreement for the Group to take up CGL’s remaining 3.33% equity stake in CBDPL and its associated loan, for an estimated aggregate price of $115 million (Put Option). Following the exercise of the Put Option by CGL on 15 July 2013, the Group owns a one-third equity stake in CBDPL.
The Group does not equity account for the results of Marina Bay Suites Pte Ltd (MBSPL), a wholly-owned subsidiary of CBDPL as the acquisition of the 33% interest in CBDPL is structured to effectively exclude any significant interest in MBSPL. The Group, through Heedum, has entered into a deed of undertaking with CGL whereby the Group agrees not to participate in the financial and operating policy decisions in MBSPL and that the Group would exercise all voting rights and other rights and powers that it directly or indirectly has or controls in CBDPL and MBSPL in accordance with the written instructions of CGL on all matters arising from, relating to, or otherwise connected with MBSPL and/or CGL’s ownership of MBSPL.
Divestment of Bank of the Philippine islands (BPi)On 11 October 2012, the Group divested 10.4% of its total effective interest of 20.3% of its investment in BPI to Ayala Corporation for a total cash consideration of $757 million (PHP 25.6 billion). A $450 million gain was recognised from the transaction (Note 9). After the divestment, the Group held an effective interest of 9.9% through a joint venture company, Ayala DBS Holdings Inc. (ADHI), in which the Group owned 34.1%.
On 11 November 2013, the Group entered into an agreement to divest its shares in ADHI for a total consideration of $850 million (PHP 29.6 billion). The transaction was to be completed in two equal tranches, the first by the end of 2013 and the second in January 2014. The first tranche was completed at end-November 2013 and a gain of $171 million was recorded (Note 9). $171 million comprised a gain of $221 million for the partial divestment of a stake in the BPI less a sum of $50 million set aside to establish the DBS Foundation to further the Group’s commitment to social and community development.
As at end December 2013, the Group retained significant influence over ADHI and had representation on the ADHI board. The Group continued to equity account for its effective remaining shareholding of 5.0% in BPI until the completion of the second tranche on 8 January 2014.
Divestment of HwangDBS investment BankOn 22 January 2014, Hwang-DBS (Malaysia) Berhad (HDBS), in which the Group owned an effective shareholding of 27.7%, entered into a conditional share sale and purchase agreement with Affin Holdings Berhad (Affin) to sell to Affin 100% equity interest in HwangDBS Investment Bank Berhad, 100% equity interest in HDM Futures Sdn Bhd, 53% equity interest in Hwang Investment Management Berhad and 49% equity interest in Asian Islamic Investment Management Sdn Bhd.
As at 31 December 2013, HDBS was accounted for as investment in an associated company.
26 propErTIES AND oTHEr FIxED ASSETS
The Group leases out investment properties under operating leases. The leases typically run for an initial period of one to five years, and may contain an option to renew the lease after that date at which time all terms will be renegotiated.
The minimum lease receivables as at the balance sheet date are as follows:
The Group
In $ millions 2013 2012
Minimum lease receivableNot later than 1 year 30 22Later than 1 year but not later than 5 years 66 64Later than 5 years – 3
Total 96 89
140 DBS AnnuAl RepoRt 2013

The Group
Non-investment properties
owner- Subtotal of Investment occupied other non-investment In $ millions properties properties fixed assets(a) properties Total
(1) (2) (3) (4) = (2 + 3) (5) = (1 + 4)
2013CostBalance at 1 January 654 514 1,234 1,748 2,402Additions – 10 217 227 227Disposals – (18) (77) (95) (95)Transfers 7 (7) – (7) –Exchange differences 2 14 8 22 24
Balance at 31 December 663 513 1,382 1,895 2,558
Less: Accumulated depreciationBalance at 1 January 157 89 664 753 910Depreciation charge 8 13 193 206 214Disposals – (9) (67) (76) (76)Transfers 3 (3) – (3) –Exchange differences 1 6 6 12 13
Balance at 31 December 169 96 796 892 1,061
Less: Allowances for impairment – 48 – 48 48
Net book value at 31 December 494 369 586 955 1,449
Market value at 31 December 793 756
2012CostBalance at 1 January 491 760 1,027 1,787 2,278Additions(b) 2 3 333 336 338Disposals (1) (71) (78) (149) (150)Transfers 172 (155) (17) (172) –Exchange differences (10) (23) (31) (54) (64)
Balance at 31 December 654 514 1,234 1,748 2,402
Less: Accumulated depreciationBalance at 1 January 119 124 625 749 868Depreciation charge 8 16 155 171 179Disposals – (19) (77) (96) (96)Transfers 31 (17) (14) (31) –Exchange differences (1) (15) (25) (40) (41)
Balance at 31 December 157 89 664 753 910
Less: Allowances for impairment – 50 – 50 50
Net book value at 31 December 497 375 570 945 1,442
Market value at 31 December 772 704
(a) Refers to computer hardware, software, office equipment, furniture and fittings and other fixed assets(b) 2012 includes additions relating to the Group’s move to Marina Bay Financial Centre
141Financial StatementS

26.1 PWC Building is held as an investment property following the Group’s move to Marina Bay Financial Centre in 2012. Its net book value was $398 million as at 31 December 2013 (2012: $404 million), and its fair value was independently appraised at $599 million (2012: $583 million).
26.2 The market values of investment properties are determined using investment method, or using a combination of comparable sales and investment methods. The properties are classified under Level 3 of the fair value hierarchy and the significant unobservable input used for valuation is market yields. As of 31 December 2013, there were no transfers into or out of Level 3.
27 GooDwILL
The carrying value of the Group’s goodwill arising from acquisition of subsidiaries is allocated to the Group’s cash-generating units (CGUs) or groups of CGUs as follows:
The Group
In $ millions 2013 2012
DBS Bank (Hong Kong) Limited 4,631 4,631DBS Vickers Securities Holdings Pte Ltd 154 154Primefield Company Pte Ltd 17 17
Total 4,802 4,802
Key assumptions used for value-in-use calculations:
DBS Bank (Hong kong) Limited DBS vickers Securities Holdings pte Ltd
2013 2012 2013 2012
Growth rate 4.5% 4.5% 4.0% 4.0% Discount rate 9.0% 9.5% 9.0% 9.0%
The carrying values of the CGUs are reviewed at least once a year to determine if the goodwill associated with them should be impaired. If a CGU’s carrying value exceeds its recoverable value, a goodwill impairment charge is recognised in the income statement.
The recoverable value is determined based on a value-in-use calculation. The CGU’s five-year projected cash flows, taking into account projected regulatory capital requirements, are discounted by its cost of capital to derive their present value. To derive the value beyond the fifth year, a long-term growth rate is imputed to the fifth-year cash flow and then discounted by the cost of capital to derive the terminal value. The long- term growth rate used does not exceed the historical long-term growth rate of the market the CGU operates in. The recoverable value is the sum of the present value of the five-year cash flows and the terminal value.
The process of evaluating goodwill impairment involves management judgement and prudent estimates of various factors including future cash flows as well as the cost of capital and long-term growth rates. The results can be highly sensitive to the assumptions used. Management believes that any reasonably possible change in the key assumptions would not cause the carrying amount of the operating unit to exceed its recoverable amount at 31 December 2013. However, if conditions in Hong Kong and the banking industry deteriorate and turn out to be significantly worse than anticipated in the Group’s performance forecast, the goodwill may be further impaired in future periods.
142 DBS AnnuAl RepoRt 2013

28 DEpoSITS AND BALANCES FroM CuSToMErS(a)
The Group
In $ millions 2013 2012
Analysed by currencySingapore dollar 134,758 131,000US dollar 75,023 52,607Hong Kong dollar 29,840 27,339Others 52,744 42,518
Total 292,365 253,464
Analysed by productSavings accounts 112,429 103,512Current accounts 48,809 42,841Fixed deposits 122,500 102,516Other deposits 8,627 4,595
Total 292,365 253,464
(a) Refer to Note 2.3 on change in balance sheet presentation
29 oTHEr LIABILITIES
The Group
In $ millions 2013 2012
Cash collateral received in respect of derivative portfolios 695 745Accrued interest payable 623 624Provision for loss in respect of off-balance sheet credit exposures 249 226Clients’ monies payable in respect of securities business 564 679Sundry creditors and others 6,864 6,142Bills payable 266 316Current tax liabilities 938 824Payable in respect of short sale of securities 1,353 1,843Deferred tax liabilities (Note 22) 42 30
Total 11,594 11,429
143Financial StatementS

30 oTHEr DEBT SECurITIES
The Group
In $ millions 2013 2012
Negotiable certificates of deposit (Note 30.1) 1,235 1,149Senior medium term notes (Note 30.2) 5,635 3,168Commercial papers (Note 30.3) 12,142 5,820Other debt securities (Note 30.4) 4,103 3,617
Total 23,115 13,754
Due within 1 year 17,108 8,498Due after 1 year 6,007 5,256
Total 23,115 13,754
30.1 Details of negotiable certificates of deposit issued and outstanding at 31 December 2013 are as follows:
In $ millions The Group
Currency Interest rate and repayment terms 2013 2012
Issued by other subsidiariesCNH 1.6% to 2.99%, payable semi-annually – 48CNH 2.8%, payable yearly – 88HKD 2.25% to 4.22%, payable quarterly 452 462HKD 3M HIBOR + 0.9%, payable quarterly 220 244HKD 1.2% to 4.2%, payable yearly 313 307HKD 0% to 0.9%, payable on maturity 250 –
Total 1,235 1,149
The negotiable certificates of deposit were issued by DBS Bank (Hong Kong) Limited under its HKD 28 billion Certificate of Deposit Programme. The outstanding negotiable certificates of deposit as at 31 December 2013 were issued between 22 August 2008 and 31 December 2013 (2012: 21 August 2008 and 31 January 2012) and mature between 9 January 2014 and 16 March 2021 (2012: 16 January 2013 and 16 March 2021).
144 DBS AnnuAl RepoRt 2013

30.2 Details of senior medium term notes issued and outstanding at 31 December 2013 are as follows:
In $ millions The Group
Currency Interest rate and repayment terms 2013 2012
Issued by the BankUSD 2.375%, payable half yearly 1,298 1,281USD 2.35%, payable half yearly 1,265 1,221USD Floating rate note, payable quarterly 569 37GBP Floating rate note, payable quarterly 2,398 494HKD 2.24%, payable quarterly 82 79IDR 7.25%, payable yearly 23 28IDR 6.89%, payable yearly – 28
Total 5,635 3,168
The senior medium term notes were issued by the Bank under its USD 10 billion Euro Medium Term Note Programme which was first established in June 2010 and updated to a USD 15 billion Global Medium Term Note Programme in October 2011. The outstanding senior medium term notes as at 31 December 2013 were issued between 14 September 2010 and 16 October 2013 (2012: 8 September 2010 and 12 September 2012) and mature between 4 March 2014 and 30 March 2017 (2012: 4 April 2013 and 30 March 2017).
30.3 The zero-coupon commercial papers which are payable on maturity were issued by the Bank under its USD 5 billion Euro Commercial Paper Programme established in August 2011 and US Commercial Paper Programme originally established in December 2011 with a programme size of USD 5 billion. The US Commercial Paper Programme was upsized from USD 5 billion to USD 15 billion in June 2012. The outstanding notes as at 31 December 2013 were issued between 21 March 2013 and 6 December 2013 (2012: 31 January 2012 and 31 December 2012) and mature between 3 January 2014 and 11 December 2014 (2012: 3 January 2013 and 18 September 2013).
30.4 Details of other debt securities issued and outstanding at 31 December 2013 are as follows:
In $ millions The Group
Type 2013 2012
Issued by the Bank and other subsidiariesEquity linked notes 708 459Credit linked notes 1,525 1,696Interest linked notes 800 766Foreign exchange linked notes 585 597Fixed rate bonds 485 99
Total 4,103 3,617
The outstanding securities as at 31 December 2013 were issued between 31 March 2006 and 30 December 2013 (2012: 31 March 2006 and 31 December 2012) and mature between 2 January 2014 and 6 November 2043 (2012: 2 January 2013 and 31 October 2042).
145Financial StatementS

31 SuBorDINATED TErM DEBTS
Subordinated term debts issued by a subsidiary of the Group are classified as liabilities in accordance with FRS 32. These are long term debt instruments that have a junior or lower priority claim on the issuing entity’s assets in the event of a default or liquidation. These instruments are in the first instance ineligible as capital instruments under Basel III rules as they lack provisions for conversion to ordinary shares or write-down at the point of non-viability as determined by the Monetary Authority of Singapore, but are accorded partial eligibility as Tier 2 capital for calculating capital adequacy ratios under the Basel III transitional arrangements for capital instruments issued prior to 1 January 2013.
The GroupIn $ million Maturity InterestInstrument Note Issue date date payment 2013 2012
Issued by the BankUS$750m 5.00% Subordinated Notes Callable with Step-up in 2014Interest rate resets to 6-month LIBOR plus 1.61% if not called 31.1 1 Oct 2004 15 Nov 2019 May/Nov 966 951
US$900m Floating Rate Subordinated Notes Callable with Step-up in 2016Interest rate equal to 3-month LIBOR plus 0.61% until call dateInterest rate resets to 3-month LIBOR plus 1.61% thereafter if not called 16 Jun 2006 15 Jul 2021 Jan/Apr/Jul/Oct 1,139 1,100
S$500m 4.47% Subordinated Notes Callable with Step-up in 2016 Interest rate resets to 6-month Singapore Dollar Swap Offer Rate plus 1.58% if not called 11 Jul 2006 15 Jul 2021 Jan/Jul 500 500
S$1,000m 3.30% Subordinated Notes Callable in 2017Interest rate resets to 5-year Singapore Dollar Swap Offer Rate plus 2.147% if not called 31.2 21 Feb 2012 21 Feb 2022 Feb/Aug 1,004 1,013
US$750m 3.625% Subordinated Notes Callable in 2017Interest rate resets to 5-year US Dollar Swap Offer Rate plus 2.229% if not called 31.3 21 Mar 2012 21 Sep 2022 Mar/Sep 953 939
S$1,000m 3.10% Subordinated Notes Callable in 2018Interest rate resets to 5-year Singapore Dollar Swap Offer Rate plus 2.085% if not called 31.4 14 Aug 2012 14 Feb 2023 Feb/Aug 982 1,002
Total 5,544 5,505
Due within 1 year – –Due after 1 year 5,544 5,505
Total 5,544 5,505
31.1 Part of the fixed rate funding has been converted to floating rate at three-month LIBOR + 0.61% via interest rate swaps.
31.2 The fixed rate funding has been converted to floating rate at six-month Singapore Dollar Swap Offer Rate + 2.22% via interest rate swaps.
31.3 The fixed rate funding has been converted to floating rate at three-month LIBOR + 2.21% via interest rate swaps.
31.4 The fixed rate funding has been converted to floating rate at six-month Singapore Dollar Swap Offer Rate + 2.16% via interest rate swaps.
For more information on each instrument, please refer to “Capital Instruments” section at the Group’s website (http://www.dbs.com/investor/preferenceshares/default.aspx) (unaudited).
146 DBS AnnuAl RepoRt 2013

32 SHArE CApITAL
During the financial year, pursuant to the DBSH Share Option Plan, the Company issued 1,699,266 (2012: 2,104,176) ordinary shares, fully paid in cash upon the exercise of the options granted. The Company also issued 5,996,350 (2012: 19,579,969) ordinary shares to eligible shareholders who elected to participate in the scrip dividend scheme.
On 28 February 2012, the Company issued 70,026,649 ordinary shares upon the conversion of 180,915 non-voting convertible preference shares (CPS) and 69,845,734 non-voting redeemable CPS. The newly issued shares rank pari passu in all respects with the previously issued shares.
The non-voting CPS and non-voting redeemable CPS enjoy the same dividend rate paid on ordinary shares except that the dividend payable is subject to maximum of $0.30 per annum (non-cumulative). All non-voting CPS have been converted to ordinary shares on 28 February 2012. The CPS do not carry voting rights, except in certain instances e.g. where any relevant dividend due is not paid up in full or where a resolution is proposed varying the rights of the preference shares. Subject to the terms set out in the Company’s Articles of Association, each CPS may be converted into one fully paid ordinary share at the option of the holder. The Company may also redeem the non-voting redeemable CPS in accordance with the Articles of Association.
As at 31 December 2013, the number of treasury shares held by the Group is 6,727,074 (2012: 7,648,152), which is 0.27% (2012: 0.31%) of the total number of issued shares excluding treasury shares.
Movements in the number and carrying amount of share capital are as follows:
The Group The Company Shares (’000) In $ millions Shares (’000) In $ millions 2013 2012 2013 2012 2013 2012 2013 2012
ordinary sharesBalance at 1 January 2,442,028 2,350,317 9,482 9,101 2,442,028 2,350,317 9,482 9,101Issue of shares pursuant to Scrip Dividend Scheme 5,997 19,580 103 268 5,997 19,580 103 268Issue of shares upon exercise of share options 1,699 2,104 18 25 1,699 2,104 18 25Reclassification of reserves upon exercise of share options – – 4 2 – – 4 2Conversion of non-voting CPS & non-voting redeemable CPS to ordinary shares – 70,027 – 86 – 70,027 – 86
Balance at 31 December 2,449,724 2,442,028 9,607 9,482 2,449,724 2,442,028 9,607 9,482
Treasury sharesBalance at 1 January 7,648 11,321 (103) (154) 5,344 8,644 (71) (115)Purchase of treasury shares 1,800 – (28) – 1,800 – (28) –Draw down of reserves upon vesting of performance shares (2,721) (3,673) 37 51 – – – –Transfer of treasury shares – – – – (2,500) (3,300) 33 44
Balance at 31 December 6,727 7,648 (94) (103) 4,644 5,344 (66) (71)
Convertible preference sharesBalance at 1 January 30,011 100,038 163 249 30,011 100,038 163 249Conversion of non-voting CPS & non-voting redeemable CPS to ordinary shares – (70,027) – (86) – (70,027) – (86)
Balance at 31 December 30,011 30,011 163 163 30,011 30,011 163 163
Issued share capital, as at 31 December 9,676 9,542 9,704 9,574
147Financial StatementS
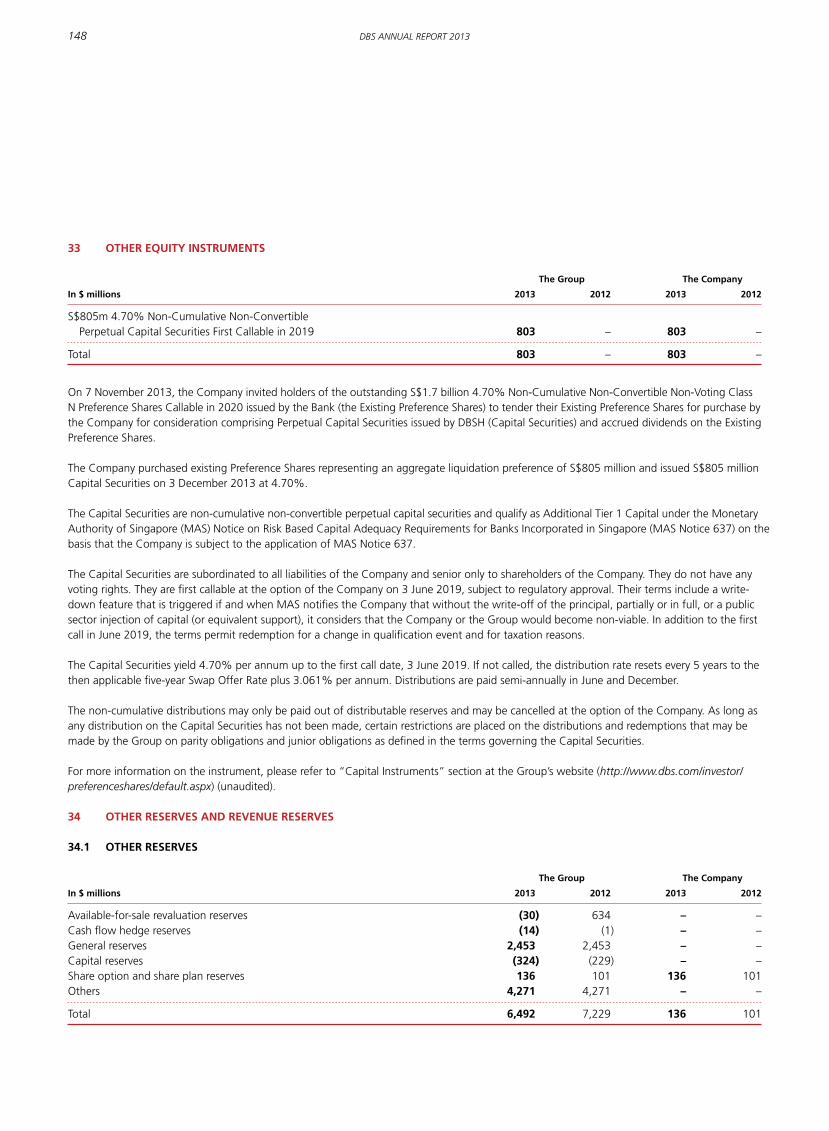
33 oTHEr EquITy INSTruMENTS
The Group The Company
In $ millions 2013 2012 2013 2012
S$805m 4.70% Non-Cumulative Non-Convertible Perpetual Capital Securities First Callable in 2019 803 – 803 –
Total 803 – 803 –
On 7 November 2013, the Company invited holders of the outstanding S$1.7 billion 4.70% Non-Cumulative Non-Convertible Non-Voting Class N Preference Shares Callable in 2020 issued by the Bank (the Existing Preference Shares) to tender their Existing Preference Shares for purchase by the Company for consideration comprising Perpetual Capital Securities issued by DBSH (Capital Securities) and accrued dividends on the Existing Preference Shares.
The Company purchased existing Preference Shares representing an aggregate liquidation preference of S$805 million and issued S$805 million Capital Securities on 3 December 2013 at 4.70%.
The Capital Securities are non-cumulative non-convertible perpetual capital securities and qualify as Additional Tier 1 Capital under the Monetary Authority of Singapore (MAS) Notice on Risk Based Capital Adequacy Requirements for Banks Incorporated in Singapore (MAS Notice 637) on the basis that the Company is subject to the application of MAS Notice 637.
The Capital Securities are subordinated to all liabilities of the Company and senior only to shareholders of the Company. They do not have any voting rights. They are first callable at the option of the Company on 3 June 2019, subject to regulatory approval. Their terms include a write-down feature that is triggered if and when MAS notifies the Company that without the write-off of the principal, partially or in full, or a public sector injection of capital (or equivalent support), it considers that the Company or the Group would become non-viable. In addition to the first call in June 2019, the terms permit redemption for a change in qualification event and for taxation reasons.
The Capital Securities yield 4.70% per annum up to the first call date, 3 June 2019. If not called, the distribution rate resets every 5 years to the then applicable five-year Swap Offer Rate plus 3.061% per annum. Distributions are paid semi-annually in June and December.
The non-cumulative distributions may only be paid out of distributable reserves and may be cancelled at the option of the Company. As long as any distribution on the Capital Securities has not been made, certain restrictions are placed on the distributions and redemptions that may be made by the Group on parity obligations and junior obligations as defined in the terms governing the Capital Securities.
For more information on the instrument, please refer to “Capital Instruments” section at the Group’s website (http://www.dbs.com/investor/preferenceshares/default.aspx) (unaudited).
34 oTHEr rESErvES AND rEvENuE rESErvES
34.1 oTHEr rESErvES
The Group The Company
In $ millions 2013 2012 2013 2012
Available-for-sale revaluation reserves (30) 634 – –Cash flow hedge reserves (14) (1) – –General reserves 2,453 2,453 – –Capital reserves (324) (229) – –Share option and share plan reserves 136 101 136 101Others 4,271 4,271 – –
Total 6,492 7,229 136 101
148 DBS AnnuAl RepoRt 2013
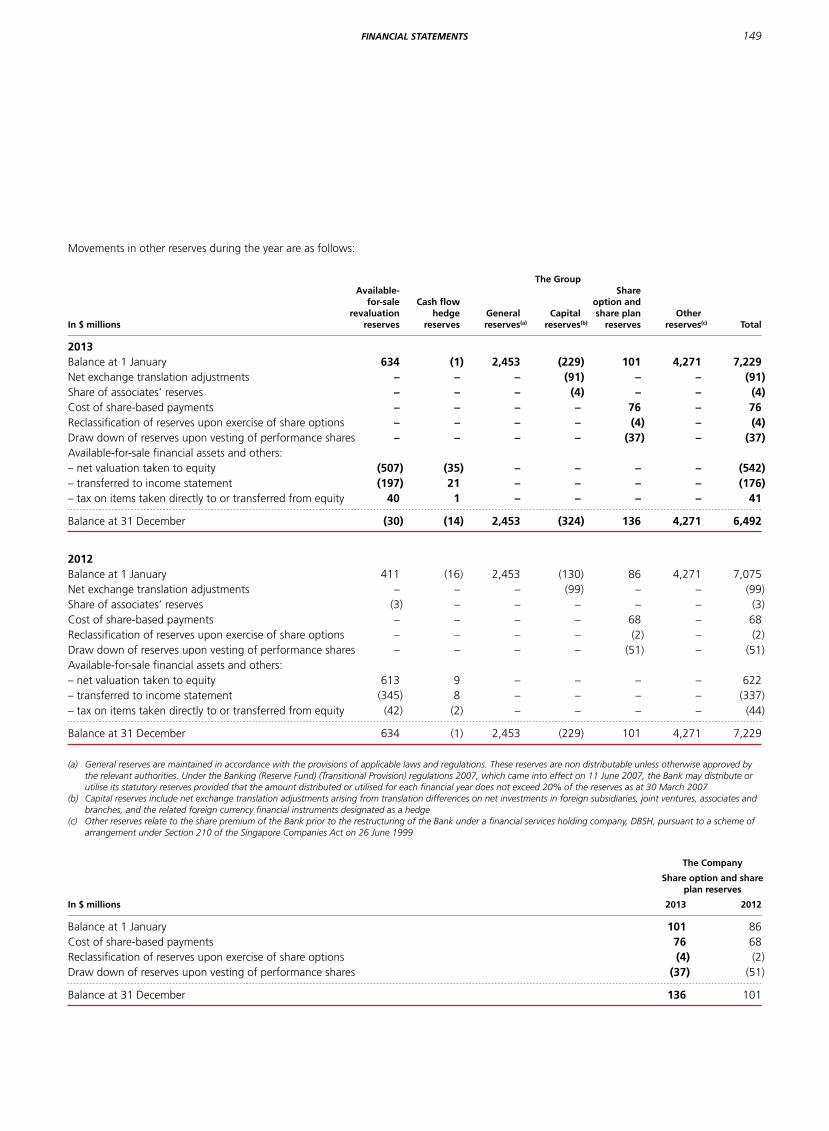
Movements in other reserves during the year are as follows:
The Group Available- Share for-sale Cash flow option and revaluation hedge General Capital share plan otherIn $ millions reserves reserves reserves(a) reserves(b) reserves reserves(c) Total
2013Balance at 1 January 634 (1) 2,453 (229) 101 4,271 7,229Net exchange translation adjustments – – – (91) – – (91)Share of associates’ reserves – – – (4) – – (4)Cost of share-based payments – – – – 76 – 76Reclassification of reserves upon exercise of share options – – – – (4) – (4)Draw down of reserves upon vesting of performance shares – – – – (37) – (37)Available-for-sale financial assets and others:– net valuation taken to equity (507) (35) – – – – (542)– transferred to income statement (197) 21 – – – – (176)– tax on items taken directly to or transferred from equity 40 1 – – – – 41
Balance at 31 December (30) (14) 2,453 (324) 136 4,271 6,492
2012Balance at 1 January 411 (16) 2,453 (130) 86 4,271 7,075Net exchange translation adjustments – – – (99) – – (99)Share of associates’ reserves (3) – – – – – (3)Cost of share-based payments – – – – 68 – 68Reclassification of reserves upon exercise of share options – – – – (2) – (2)Draw down of reserves upon vesting of performance shares – – – – (51) – (51)Available-for-sale financial assets and others:– net valuation taken to equity 613 9 – – – – 622– transferred to income statement (345) 8 – – – – (337)– tax on items taken directly to or transferred from equity (42) (2) – – – – (44)
Balance at 31 December 634 (1) 2,453 (229) 101 4,271 7,229
(a) General reserves are maintained in accordance with the provisions of applicable laws and regulations. These reserves are non distributable unless otherwise approved by the relevant authorities. Under the Banking (Reserve Fund) (Transitional Provision) regulations 2007, which came into effect on 11 June 2007, the Bank may distribute or utilise its statutory reserves provided that the amount distributed or utilised for each financial year does not exceed 20% of the reserves as at 30 March 2007
(b) Capital reserves include net exchange translation adjustments arising from translation differences on net investments in foreign subsidiaries, joint ventures, associates and branches, and the related foreign currency financial instruments designated as a hedge
(c) Other reserves relate to the share premium of the Bank prior to the restructuring of the Bank under a financial services holding company, DBSH, pursuant to a scheme of arrangement under Section 210 of the Singapore Companies Act on 26 June 1999
The Company
Share option and share plan reserves
In $ millions 2013 2012
Balance at 1 January 101 86Cost of share-based payments 76 68Reclassification of reserves upon exercise of share options (4) (2)Draw down of reserves upon vesting of performance shares (37) (51)
Balance at 31 December 136 101
149Financial StatementS

34.2 rEvENuE rESErvES The Group
In $ millions 2013 2012
Balance at 1 January 14,966 12,523Net profit attributable to shareholders 3,672 3,809
Amount available for distribution 18,638 16,332Less: Final dividend on ordinary shares of $0.28 (one-tier tax-exempt) paid for the previous financial year (2012: $0.28 one-tier tax-exempt) 684 677 Final dividends on non-voting CPS and non-voting redeemable CPS of $0.02 (one-tier tax-exempt) paid for the previous financial year (2012: $0.02 one-tier tax-exempt) # # Interim dividends on ordinary shares of $0.28 (one-tier tax-exempt) paid for the current financial year (2012: $0.28 one-tier tax-exempt) 684 681 Interim dividends on non-voting redeemable CPS of $0.28 (one-tier tax-exempt) paid for the current financial year (2012: $0.28 one-tier tax-exempt) 8 8
Balance at 31 December 17,262 14,966
# Amount under $500,000
34.3 propoSED DIvIDEND
Proposed final one-tier tax-exempt dividends on ordinary shares of $0.30 per share and DBSH non-voting redeemable CPS of $0.02 per share has not been accounted for in the financial statements for the year ended 31 December 2013. They are to be approved at the Annual General Meeting on 28 April 2014.
35 NoN-CoNTroLLING INTErESTS
The following preference shares issued by subsidiaries of the Group are classified as non-controlling interests. These instruments have a deeply subordinated claim on the issuing entity’s assets in the event of a default or liquidation. These instruments are in the first instance ineligible as capital instruments under Basel III rules as they lack provisions for conversion to ordinary shares or write-down at the point of non-viability as determined by the Monetary Authority of Singapore, but are accorded partial eligibility as Tier 1 capital for calculating capital adequacy ratios under the Basel III transitional arrangements for capital instruments issued prior to 1 January 2013.
The GroupIn $ millions Issuance Liquidation DividendInstrument Note date preference payment 2013 2012
Issued by the BankS$1,700m 4.70% Non-Cumulative, Non-Convertible, Non-Voting Preference Shares Callable in 2020 35.1 22 Oct 2010 $250,000 Apr/Oct 895 1,700
S$800m 4.70% Non-Cumulative, Non-Convertible, Non-Voting Preference Shares Callable in 2020 35.2 22 Nov 2010 $100 May/Nov 800 800
Issued by DBS Capital Funding II CorporationS$1,500m 5.75% Non-Cumulative, Non-Convertible, Non-Voting, Guaranteed Preference Shares Callable with Step-up in 2018 35.3 27 May 2008 $250,000 Jun/Dec 1,500 1,500
Non-controlling interests in subsidiaries 258 261
Total 3,453 4,261
35.1 Dividends are payable if declared by the Board of Directors of the Bank. DBSH purchased S$805 million of the Bank’s preference shares tendered at 4.70% on 3 December 2013 (refer to Note 33).
35.2 Dividends are payable if declared by the Board of Directors of the Bank.
150 DBS AnnuAl RepoRt 2013

35.3 Dividends are payable if declared by the Board of Directors of DBS Capital Funding II Corporation. They are payable semi-annually on 15 June, and 15 December at a fixed rate of 5.75% per annum up to 15 June 2018. If these are not redeemed at the tenth year, dividends will be payable quarterly in arrears on 15 March, 15 June, 15 September and 15 December at a floating rate of the three- month Singapore Dollar Swap Offer Rate plus a stepped-up spread of 3.415% per annum.
For more information on each instrument, please refer to “Capital Instruments” section at the Group’s website (http://www.dbs.com/investor/preferenceshares/default.aspx) (unaudited).
36 CoNTINGENT LIABILITIES AND CoMMITMENTS
The Group issues guarantees, performance bonds and indemnities in the ordinary course of business. The majority of these facilities are offset by corresponding obligations of third parties.
Guarantees and performance bonds are generally written by the Group to support the performance of a customer to third parties. As the Group will only be required to meet these obligations in the event of the customer’s default, the cash requirements of these instruments are expected to be considerably below their nominal amount.
Endorsements are residual liabilities of the Group in respect of bills of exchange, which have been paid and subsequently rediscounted.
The Group
In $ millions 2013 2012
Guarantees on account of customers 14,921 12,578Endorsements and other obligations on account of customers 5,998 8,481Undrawn loan commitments(a) 158,027 135,513Undisbursed commitments in securities 22 291
Sub-total 178,968 156,863Operating lease commitments (Note 36.2) 772 875Capital commitments 18 19
Total 179,758 157,757
Analysed by industry (excludingoperating lease and capital commitments)Manufacturing 28,994 25,680Building and construction 12,940 10,973Housing loans 11,547 9,783General commerce 38,337 29,185Transportation, storage and communications 10,018 10,767Government 1 319 Financial institutions, investment and holding companies 15,965 16,317Professionals and private individuals (excluding housing loans) 43,020 39,069Others 18,146 14,770
Total 178,968 156,863
The Group
In $ millions 2013 2012
Analysed by geography (excludingoperating lease and capital commitments)(b)
Singapore 79,779 71,403Hong Kong 37,644 32,231Rest of Greater China 10,834 11,354South and Southeast Asia 18,366 14,849Rest of the World 32,345 27,026
Total 178,968 156,863
(a) Undrawn loan commitments are recognised at activation stage and include commitments which are unconditionally cancellable by the Group (2013: $124,031 million, 2012: $103,666 million)
(b) Based on the country of incorporation of the counterparty or borrower
36.1 The Group has existing outsourcing agreements for the provision of information technology and related support to the Group’s operations. There are various termination clauses in the agreements that could require the Group to pay termination fees on early termination of the contract or part thereof. The termination fees are stipulated in the agreements and are determined based on the year when the agreements or part thereof are terminated.
36.2 The Group has existing significant operating lease commitments including the leasing of office premises in Changi Business Park and Marina Bay Financial Centre in Singapore; and One Island East in Hong Kong. These include lease commitments for which the payments will be determined in the future based on the prevailing market rates in accordance with the lease agreements, of which the related amounts have not been included. The leases have varying terms, escalation clauses and renewal rights.
37 FINANCIAL DErIvATIvES
Financial derivatives are financial instruments whose characteristics are derived from the underlying assets, or from interest and exchange rates or indices. These include forwards, swaps, futures and options. The following sections outline the nature and terms of the most common types of derivatives used by the Group.
interest rate derivativesForward rate agreements give the buyer the ability to determine the underlying rate of interest for a specified period commencing on a specified future date (the settlement date). There is no exchange of principal and settlement is effected on the settlement date. The settlement amount is the difference between the contracted rate and the market rate prevailing on the settlement date.
Interest rate swaps involve the exchange of interest obligations with a counterparty for a specified period without exchanging the underlying (or notional) principal.
151Financial StatementS

Interest rate futures are exchange-traded agreements to buy or sell a standard amount of a specified fixed income security or time deposit at an agreed interest rate on a standard future date.
Interest rate options give the buyer on payment of a premium the right, but not the obligation, to fix the rate of interest on a future deposit or loan, for a specified period and commencing on a specified future date.
Interest rate caps and floors give the buyer the ability to fix the maximum or minimum rate of interest. There is no facility to deposit or draw down funds, instead the writer pays to the buyer the amount by which the market rate exceeds or is less than the cap rate or the floor rate respectively. This category includes combinations of interest rate caps and floors, which are known as interest rate collars.
Foreign exchange derivativesForward foreign exchange contracts are agreements to buy or sell fixed amounts of currency at agreed rates of exchange on a specified future date.
Cross currency swaps are agreements to exchange, and on termination of the swap, re-exchange principal amounts denominated in different currencies. Cross currency swaps may involve the exchange of interest payments in one specified currency for interest payments in another specified currency for a specified period.
Currency options give the buyer, on payment of a premium, the right but not the obligation, to buy or sell specified amounts of currency at agreed rates of exchange on or before a specified future date.
equity derivativesEquity options provide the buyer, on payment of a premium, the right but not the obligation, either to purchase or sell a specified stock or stock index at a specified price or level on or before a specified date.
Equity swaps involve the exchange of a set of payments whereby one of these payments is based on an equity-linked return while the other is typically based on an interest reference rate.
credit derivativesCredit default swaps involve the transfer of credit risk of a reference asset from the protection buyer to the protection seller. The protection buyer makes one or more payments to the seller in exchange for an undertaking by the seller to make a payment to the buyer upon the occurrence of a predefined credit event.
commodity derivativesCommodity contracts are agreements between two parties to exchange cash flows which are dependent on the price of the underlying physical assets.
Commodity futures are exchange-traded agreements to buy or sell a standard amount of a commodity at an agreed price on a standard future date.
Commodity options give the buyer the right, but not the obligation, to buy or sell a specific amount of commodity at an agreed contract price on or before a specified date.
37.1 TrADING DErIvATIvES
Most of the Group’s derivatives relate to sales and trading activities. Sales activities include the structuring and marketing of derivatives to customers to enable them to take, transfer, modify or reduce current or expected risks. Trading activities are entered into principally for dealer’s margin or for the purpose of generating a profit from short-term fluctuations in price.
Trading includes mainly market making and warehousing to facilitate customer orders. Market making involves quoting bid and offer prices to other market participants with the intention of generating revenues based on spread and volume. Warehousing involves holding on to positions in order to liquidate in an orderly fashion with timing of unwinding determined by market conditions and traders’ views of markets as they evolve.
37.2 HEDGING DErIvATIvES
The accounting treatment of the hedge derivative transactions varies according to the nature of the hedge and whether the hedge meets the specified criteria to qualify for hedge accounting. Derivatives transacted as economic hedges but do not qualify for hedge accounting are treated in the same way as derivative instruments used for trading purposes.
Fair value hedgesThe Group’s fair value hedges consist principally of interest rate swaps used for managing interest rate gaps. For the year ended 31 December 2013, the gain on hedging instruments was $59 million (2012: $144 million). The total loss on hedged items attributable to the hedged risk amounted to $59 million (2012: $143 million).
cash flow hedgesThe Group’s cash flow hedges consist principally of currency forwards and currency swaps transacted to hedge highly probable forecast transactions expected to occur at various future dates against variability in exchange rates. The currency forwards and currency swaps have maturity dates that coincide within the expected occurrence of these transactions. The hedged cash flows are expected to occur over next 3 years following the balance sheet date, and are expected to affect profit or loss in the same period these cash flows occur. The ineffectiveness arising from these hedges was insignificant.
152 DBS AnnuAl RepoRt 2013

net investment hedgesThe Group hedges part of the currency translation risk of investments through financial derivatives and borrowings. The ineffectiveness arising from hedging of investments was insignificant. The Group regularly reviews its hedging strategy and rebalance based on long term outlook of the currency fundamentals.
Financial Net instruments remaining investments which hedge unhedged in foreign the net currencyIn $ millions operations(a) investments(b) exposures
2013Hong Kong dollar 6,236 6,156 80US dollar 885 880 5Others 5,414 1,639 3,775
Total 12,535 8,675 3,860
2012Hong Kong dollar 5,417 5,394 23US dollar 801 797 4Others 4,957 1,997 2,960
Total 11,175 8,188 2,987
(a) Refer to net tangible assets of subsidiaries, joint ventures and associates, and capital funds/retained earnings of overseas operations(b) Includes forwards, non-deliverable forwards and borrowings used to hedge the investments
The table on the following page summarises the contractual or underlying principal amounts of derivative financial instruments held or issued for trading and hedging purposes. The notional or contractual amounts of these instruments reflect the volume of transactions outstanding at balance sheet date, and do not represent amounts at risk.
In the financial statements, trading derivative financial instruments are revalued on a gross position basis and the unrealised gains or losses are reflected as derivative assets or derivative liabilities. Derivative assets and liabilities arising from different transactions are only offset if the transactions are done with the same counterparty, a legal right of offset exists, and the parties intend to settle the cash flows on a net basis. There was no offset of derivative assets and liabilities in 2013 and 2012.
153Financial StatementS

2013 2012 underlying underlyingIn $ millions notional Assets Liabilities notional Assets Liabilities
Derivatives held for tradingInterest rate derivativesInterest rate swaps 604,785 6,445 6,626 545,166 8,013 7,987Financial futures 8,057 7 3 4,801 1 1Interest rate options 7,621 74 98 7,788 87 110Interest rate caps/floors 22,544 309 448 23,249 356 534
Sub-total 643,007 6,835 7,175 581,004 8,457 8,632
Foreign exchange (Fx) derivativesFX contracts 555,055 5,341 5,925 511,736 3,794 3,779Currency swaps 134,668 3,319 3,151 107,227 3,452 3,511Currency options 146,913 1,048 986 146,528 610 490
Sub-total 836,636 9,708 10,062 765,491 7,856 7,780
Equity derivativesEquity options 1,861 42 56 1,933 207 245Equity swaps 286 4 6 409 6 8
Sub-total 2,147 46 62 2,342 213 253
Credit derivativesCredit default swaps and others 53,890 481 520 60,665 457 520
Sub-total 53,890 481 520 60,665 457 520
Commodity derivativesCommodity contracts 2,376 41 45 1,255 31 36Commodity futures 3,081 48 39 2,006 28 17Commodity options 1,178 15 11 500 2 5
Sub-total 6,635 104 95 3,761 61 58
Total derivatives held for trading 1,542,315 17,174 17,914 1,413,263 17,044 17,243
Derivatives held for hedgingInterest rate swaps held for fair value hedge 8,824 129 163 8,554 228 231FX contracts held for fair value hedge – – – 20 – #FX contracts held for cash flow hedge 853 – 8 586 # 1FX contracts held for hedge of net investment 1,578 6 4 1,930 8 26Currency swaps held for fair value hedge 1,322 – 43 61 – 2Currency swaps held for cash flow hedge 2,690 116 – 160 – 2Currency swaps held for hedge of net investment 1,075 1 – 1,635 – 27
Total derivatives held for hedging 16,342 252 218 12,946 236 289
Total derivatives 1,558,657 17,426 18,132 1,426,209 17,280 17,532
Impact of netting arrangements recognised for computation of Capital Adequacy ratio (CAr) (unaudited) (9,746) (9,746) (9,616) (9,616)
7,680 8,386 7,664 7,916
# Amounts less than $500,000
154 DBS AnnuAl RepoRt 2013

The contractual or underlying principal amounts of derivative financial instruments of bank and non-bank counterparties amounted to $1,122 billion (2012: $1,025 billion) and $437 billion (2012: $401 billion) respectively. These positions were mainly booked in Singapore. For purpose of managing its credit exposures, the Group maintains collateral agreements and enters into master netting agreements with most of these counterparties. For those arrangements that comply with the regulatory requirements as set out in MAS Notice 637, the Group recognises the netting arrangements in the computation of its Capital Adequacy Ratios.
As at 31 December 2012, the conditional put option agreement for the Bank through Heedum Pte Ltd to take up Choicewide Group Limited’s remaining 3.33% equity stake in Central Boulevard Development Pte Ltd and its associated loan for an aggregate of $115 million was carried at cost (Refer to Note 25.2). The fair value cannot be reliably estimated because of the lack of comparable market data points and the associated uncertain parameters in the option valuation model. The put option was exercised on 15 July 2013 at $115 million.
38 SHArE-BASED CoMpENSATIoN pLANS
As part of the Group’s remuneration policy, the Group provides various share-based compensation plans to reward good performers, support retention of key employees and enable employees to share in the success of the Group.
Main Scheme/plan Note
DBSH Share plan (Share plan)�Share Plan is granted to Group executives as determined by the Committee appointed to
administer the Share Plan from time to time.�Participants are awarded shares of the Company, their equivalent cash value or a combination.�Awards consist of main award and retention award (20% of main awards).�The vesting of main award is staggered between 2 – 4 years after grant i.e. 33% will vest 2 years
after grant. Another 33% will vest on the third year and the remainder 34% plus the retention award will vest 4 years after grant.
�The fair value of the shares awarded is computed based on the market price of the ordinary shares at the time of the award.
38.1
DBSH Employee Share plan (ESp)�ESP caters to employees not eligible to participate in the above listed Share Plan. Eligible employees
are awarded ordinary shares of the Company, their equivalent cash value or a combination of both (at the discretion of the Committee), when time-based conditions are met.
�The awards structure and vesting conditions are similar to Share Plan.�There are no additional retention awards for shares granted to top performers and key employees.�However, in specific cases where the award forms part of an employee’s annual performance
remuneration, the retention award which constitutes 20% of the shares given in the main award will be granted. The shares in the retention award will vest 4 years after the date of grant.
38.1
DBSH Share ownership Scheme�All Singapore based employees with at least one year of service who hold the rank of Assistant
Vice President and below are eligible.�Participants contribute up to 10% of monthly salary and the Group will match up to 5% of
monthly base salary to buy units of the Company’s ordinary shares.
38.2
DBSH Share option plan (option plan)�The Option Plan expired on 19 June 2009. Its termination does not affect the rights of holders of
outstanding existing options.�Option Plan is granted to eligible Group executives who hold the rank of Vice President (or
equivalent) and above and selected employees below the rank of Vice President (or equivalent).�The exercise price is equal to the average of the last dealt prices for the Company’s share as
determined by reference to the daily official list published by the Singapore Exchange Securities Trading Ltd, for the three consecutive trading days immediately preceding the date of the grant.
�The options vest over a period in accordance to vesting schedule and are exercisable after the first anniversary of the date of the grant up to the date of expiration of the options.
�The fair value of options granted is determined using the Binomial model.
38.3
155Financial StatementS
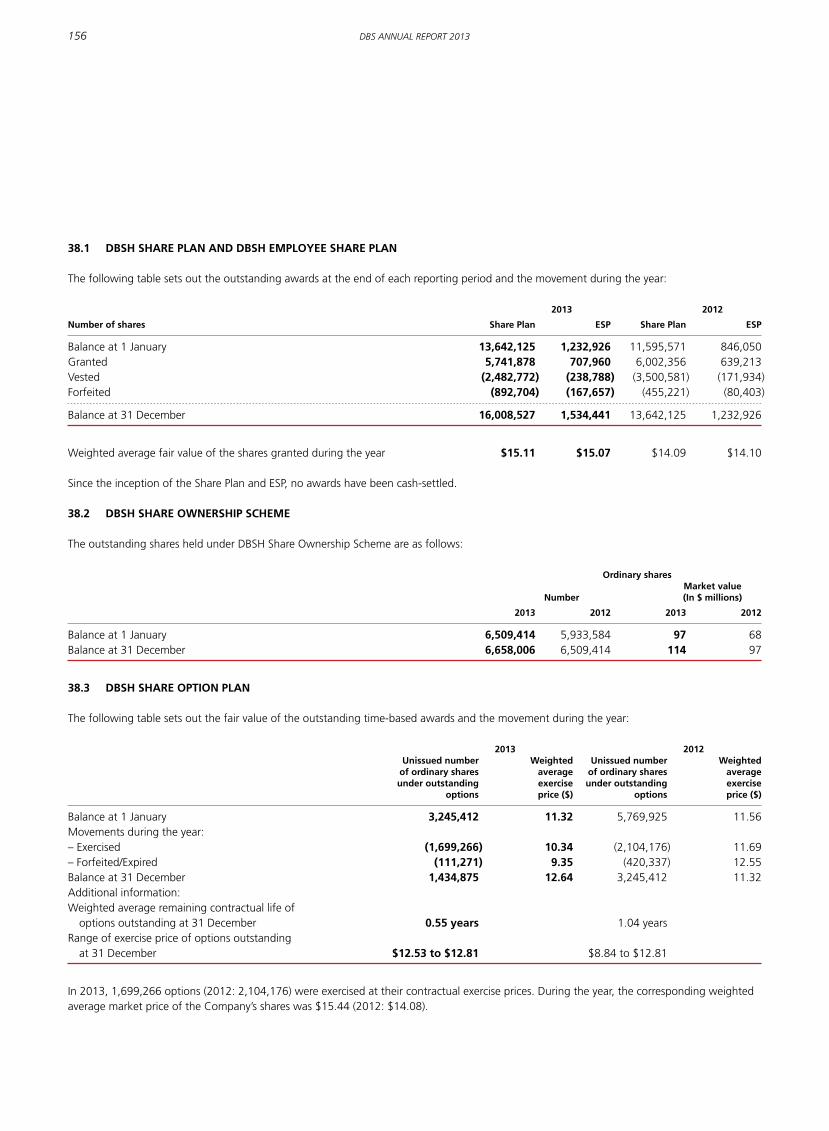
38.1 DBSH SHArE pLAN AND DBSH EMpLoyEE SHArE pLAN
The following table sets out the outstanding awards at the end of each reporting period and the movement during the year:
2013 2012
Number of shares Share plan ESp Share plan ESp
Balance at 1 January 13,642,125 1,232,926 11,595,571 846,050Granted 5,741,878 707,960 6,002,356 639,213Vested (2,482,772) (238,788) (3,500,581) (171,934)Forfeited (892,704) (167,657) (455,221) (80,403)
Balance at 31 December 16,008,527 1,534,441 13,642,125 1,232,926
Weighted average fair value of the shares granted during the year $15.11 $15.07 $14.09 $14.10
Since the inception of the Share Plan and ESP, no awards have been cash-settled.
38.2 DBSH SHArE owNErSHIp SCHEME
The outstanding shares held under DBSH Share Ownership Scheme are as follows:
ordinary shares Market value Number (In $ millions)
2013 2012 2013 2012
Balance at 1 January 6,509,414 5,933,584 97 68Balance at 31 December 6,658,006 6,509,414 114 97
38.3 DBSH SHArE opTIoN pLAN
The following table sets out the fair value of the outstanding time-based awards and the movement during the year:
2013 2012 unissued number weighted unissued number weighted of ordinary shares average of ordinary shares average under outstanding exercise under outstanding exercise options price ($) options price ($)
Balance at 1 January 3,245,412 11.32 5,769,925 11.56Movements during the year:– Exercised (1,699,266) 10.34 (2,104,176) 11.69– Forfeited/Expired (111,271) 9.35 (420,337) 12.55Balance at 31 December 1,434,875 12.64 3,245,412 11.32Additional information:Weighted average remaining contractual life of options outstanding at 31 December 0.55 years 1.04 yearsRange of exercise price of options outstanding at 31 December $12.53 to $12.81 $8.84 to $12.81
In 2013, 1,699,266 options (2012: 2,104,176) were exercised at their contractual exercise prices. During the year, the corresponding weighted average market price of the Company’s shares was $15.44 (2012: $14.08).
156 DBS AnnuAl RepoRt 2013

39 rELATED pArTy TrANSACTIoNS
39.1 Transactions between the Company and its subsidiaries, including consolidated special purpose entities, which are related parties of the Company, have been eliminated on consolidation and are not disclosed in this Note.
39.2 During the financial year, the Group had banking transactions with related parties, consisting of associates, joint ventures and key management personnel of the Group. These included the taking of deposits and extension of credit card and other loan facilities. These transactions were made in the ordinary course of business and carried out at arms-length commercial terms, and were not material. In addition, key management personnel received remuneration for services rendered during the financial year. Non-cash benefits including performance shares were also granted.
39.3 Total compensation and fees to key management personnel(a) are as follows:
The Group
In $ millions 2013 2012
Short-term benefits(b) 42 41Share-based payments(c) 20 16
Total 62 57
Of which: Company Directors’ remuneration and fees 12 10
(a) Includes Company Directors and members of the Management Committee who have authority and responsibility in planning the activities and direction of the Group. The composition and number of Directors and Management Committee members may differ from year to year
(b) Includes cash bonus based on amount accrued during the year, to be paid in the following year
(c) Share-based payments are expensed over the vesting period in accordance with FRS102
40 FAIr vALuE oF FINANCIAL INSTruMENTS
40.1 vALuATIoN proCESS
The valuation processes used by the Group are governed by the Valuation, the Rates and the Reserves frameworks. These frameworks apply to financial assets and liabilities where mark-to-market or model valuation is required.
The Rates framework governs the daily revaluation of all financial assets and liabilities that are fair value measured, covering both market prices as well as model inputs. Financial assets and liabilities are marked directly using reliable and independent market prices or by using reliable and independent market parameters (as model inputs) in conjunction with a valuation model. Products with a liquid market or those traded via an exchange will fall under the former while most over-the-counter (OTC) exotic products will form the latter. Market parameters include interest rate yield curves, credit spreads, exchange prices, dividend yields, option volatilities and foreign exchange rates.
Valuation models go through an assurance process carried out by the Risk Management Group (RMG), independent of the model developers. This assurance process would review the underlying methodology including its logic and conceptual soundness together with the model inputs and outputs. Model assurances are conducted prior to implementation and subject to regular review or when there are significant changes arising from market or portfolio changes. Where necessary, the Group also imposes model reserves and other adjustments in determining fair value. Models are approved by the Group Market and Liquidity Risk Committee.
The majority of OTC derivatives are traded in active markets. Valuations are determined using generally accepted models (discounted cash flows, Black-Scholes model, interpolation techniques) based on quoted market prices for similar instruments or underlyings.
A process of independent price verification (IPV) is in place to establish the accuracy of the market parameters used when the marking is performed by the Front Office. The IPV process entails independent checks to compare traders’ marks to independent sources such as broker/dealer sources or market consensus providers. The results of the IPV are reviewed by independent control functions on a monthly basis.
For illiquid complex financial instruments where mark-to-market is not possible, the Group will value these products using an approved valuation model. Prices and parameters used as inputs to the model or to any intermediate technique involving a transformation process must be derived from approved market reliable sources. Where possible, the inputs must be checked against multiple sources for reliability and accuracy. Reliance will be placed on the model assurance framework established by RMG for assurance of valuation models as fit for purpose.
The Group uses various market accepted benchmark interest rates such as LIBOR and Swap Offer Rates to determine the fair value of the financial instruments.
Where unobservable inputs are used in these models resulting in Level 3 classification, valuation adjustments or reserves will be taken for the purpose of adjusting for uncertainty in valuations. Valuation adjustment or reserve methodologies are used to substantiate the unobservable inputs and attempt to quantify the level of uncertainty in valuations. Such methodologies are governed by the Reserve Framework and require approval by the Group Market and Liquidity Risk Committee.
The main valuation adjustments and reserves are described below:
model and parameter uncertainty adjustmentsValuation uncertainties may occur during fair value measurement either due to uncertainties in the required input parameters or uncertainties in the modelling methods used in valuation process. In such situations, adjustments may be necessary to take these factors into account.
157Financial StatementS

For example, where market data such as prices or rates for an instrument are no longer observable after an extended period of time, these inputs used to value the financial instruments may no longer be relevant in the current market conditions. In such situations, adjustments may be necessary to address the pricing uncertainty arising from the use of stale market data inputs.
credit risk adjustmentCredit risk adjustment is incorporated into derivative valuations to reflect the impact on fair value of counterparty credit risk. Credit risk adjustment is based upon the creditworthiness of the counterparties, magnitude of the current or potential exposure on the underlying transactions, netting arrangements, collateral arrangements, and the maturity of the underlying transactions.
Day 1 profit or loss (P&l) reserveIn situations where the market for an instrument is not active and its fair value is established using a valuation model based on significant unobservable market parameters, Day 1 P&L reserve is utilised to defer the P&L arising from the difference between the transaction price and the model value. A market parameter is defined as being significant when its impact on the Day 1 P&L is greater than an internally determined threshold. The Day 1 P&L reserve is released to income statement as the parameters become observable or the transaction closed out or amortised over the duration of the transaction. At year end, the unamortised Day 1 P&L was not material.
Bid offer adjustmentThe Group often holds, at varying points in time, both long or short positions in financial instruments which are valued using mid market levels. Bid offer adjustments are then made to adjust net open position valuations to the respective bid or offer levels as appropriate.
40.2 FAIr vALuE HIErArCHy
The fair value hierarchy accords the highest level to observable inputs such as unadjusted quoted prices in active markets for identical assets or liabilities and the lowest level to unobservable inputs. The fair value measurement of each financial instrument is categorised in accordance to the same level of the fair value hierarchy as the input with the lowest level that is significant to the entire measurement. If unobservable inputs are deemed as significant, the financial instrument will be categorised as Level 3.
Financial instruments that are valued using quoted prices in active markets are classified as Level 1 within the fair value hierarchy. These would include government and sovereign securities, listed equities and corporate debt securities which are actively traded. Derivatives contracts which are traded in an active exchange market are also classified as Level 1 of the valuation hierarchy.
Where fair value is determined using quoted market prices in less active markets or quoted prices for similar assets and liabilities, such instruments are generally classified as Level 2. In cases where quoted prices are generally not available, the Group will determine the fair value based on valuation techniques that use market parameters as inputs including but not limited to yield curves, volatilities and foreign exchange rates. The majority of valuation techniques employ only observable market data and so reliability of the fair value measurement is high. These would include corporate debt securities, repurchase, reverse repurchase agreements and most of the Group’s over-the-counter derivatives.
The Group classifies financial instruments as Level 3 when there is reliance on unobservable inputs to the valuation model attributing to a significant contribution to the instrument value. These would include all input parameters which are derived from historical data such as correlation or volatilities as well as unquoted equity securities. The fair value of unquoted equity securities is measured in comparison with recent transactions in the equity of the company in question or comparable companies in similar industries. Level 3 inputs also include all quoted security prices that have not been updated for more than 3 months, quoted proxies in active markets for non-similar asset classes (e.g. bonds marked over credit default swap spreads), as well as prices/valuations that are obtained from counterparties. Valuation reserves or pricing adjustments where applicable will be used to converge to fair value.
158 DBS AnnuAl RepoRt 2013

The following table presents assets and liabilities measured at fair value, classified by level within the fair value hierarchy:
The Group
In $ millions Level 1 Level 2 Level 3 Total
2013AssetsFinancial assets at fair value through profit or loss– Singapore Government securities and treasury bills 2,013 – – 2,013– Other government securities and treasury bills 4,207 – – 4,207– Bank and corporate debt securities 6,808 857 539 8,204– Equity securities 437 147 – 584– Other financial assets – 3,258 – 3,258Available-for-sale financial assets– Singapore Government securities and treasury bills 7,332 – – 7,332– Other government securities and treasury bills 13,297 60 – 13,357– Bank and corporate debt securities 8,982 2,543 26 11,551– Equity securities(a) 889 2 131 1,022– Other financial assets 253 5,381 – 5,634Derivatives 50 17,355 21 17,426
LiabilitiesFinancial liabilities at fair value through profit or loss– Other debt securities – 3,595 21 3,616– Other financial liabilities 1,353 2,025 – 3,378Derivatives 40 18,041 51 18,132
2012AssetsFinancial assets at fair value through profit or loss– Singapore Government securities and treasury bills 2,639 – – 2,639– Other government securities and treasury bills 6,206 – – 6,206– Bank and corporate debt securities 3,470 1,107 97 4,674– Equity securities 235 – – 235– Other financial assets – 1,722 – 1,722Available-for-sale financial assets– Singapore Government securities and treasury bills 10,294 – – 10,294– Other government securities and treasury bills 17,262 – – 17,262– Bank and corporate debt securities 7,204 2,619 36 9,859– Equity securities(a) 702 43 126 871– Other financial assets – 4,225 – 4,225Derivatives 29 17,229 22 17,280
LiabilitiesFinancial liabilities at fair value through profit or loss– Other debt securities – 3,493 25 3,518– Other financial liabilities 1,861 2,469 1 4,331Derivatives 19 17,502 11 17,532
(a) Excludes unquoted equities stated at cost of $278 million (2012: $228 million)
159Financial StatementS

The following table presents the changes in Level 3 instruments for the financial year ended:
Balance at Transfers Transfers Balance at 1 January Fair value gains or losses purchases Issues Settlements in out 31 December
other profit comprehensiveIn $ millions or loss income
2013AssetsFinancial assets at fair value through profit or loss– Bank and corporate debt securities 97 (23) – 477 – (12) – – 539Available-for-sale financial assets– Bank and corporate debt securities 36 – 1 – – (11) – – 26– Equity securities 126 8 16 3 – (22) – – 131Derivatives 22 2 – – – – 6 (9) 21
LiabilitiesFinancial liabilities at fair value through profit or loss– Other debt securities 25 – – – – (4) – – 21– Other financial liabilities 1 – – – – – – (1) –Derivatives 11 (4) – 51 – – – (7) 51
2012AssetsFinancial assets at fair value through profit or loss– Bank and corporate debt securities 210 (38) – 6 – (97)(a) 25 (9) 97Available-for-sale financial assets– Bank and corporate debt securities 286 – (15) – – (216)(a) – (19) 36– Equity securities 278 15 (12) 18 – (27) – (146) 126Derivatives 18 (21) – – – (5) 34 (4) 22
LiabilitiesFinancial liabilities at fair value through profit or loss– Other debt securities 28 (3) – – – (24) 25 (1) 25– Other financial liabilities – – – – 1 – – – 1Derivatives 18 – – – 3 (6) 7 (11) 11
(a) Principally reflects settlement of Level 3 debt securities which were called back/matured during the year
160 DBS AnnuAl RepoRt 2013

Economic hedges entered into for Level 2 exposures may be classified within a different category (i.e. Level 1) and similarly, hedges entered for Level 3 exposures may also be classified within a different category (i.e. Level 1 and/or Level 2). The effects are presented gross in the table.
During the year, the Group transferred financial assets and liabilities consisting primarily corporate bonds of $264 million (2012: $112 million) from Level 1 to Level 2 due to reduced market activity for these financial instruments.
Gains and losses on level 3 financial assets and liabilities measured at fair value
Category reported in the Income Statement
In $ millions Net income from2013 Net trading Income investment securities Total
Total gain/(loss) for the period included in income statement (17) 8 (9)Of which: Change in unrealised gain/(loss) for the period included in income statement for assets held at the end of the reporting period (17) – (17)
Fair value gains or losses taken to Other Comprehensive Income are reported in the Statement of Comprehensive Income as “Net valuation taken to equity”.
effect of changes in significant unobservable inputs to reflect reasonably possible alternativesAs at 31 December 2013, financial instruments measured with valuation techniques using significant unobservable inputs (Level 3) included unquoted equity investments, bank and corporate debt securities, interest rate and credit derivatives and financial liabilities from structured product issuances.
There are limited inter-relationships between unobservable inputs as the financial instruments are usually categorised into Level 3 because of a single unobservable input.
In estimating significance, the Group performed sensitivity analysis based on methodologies applied for fair value adjustments. These adjustments reflect the values which the Group estimates to be appropriate to reflect uncertainties in the inputs used (e.g. based on stress testing methodologies on the unobservable input). The methodologies used can be statistical or based on other relevant approved techniques.
The movement in fair value arising from reasonably possible changes to the significant unobservable inputs is assessed as not significant.
In $ millions2013 Fair value Classification valuation technique unobservable Input
AssetsBank and corporate debt securities 539 FVPL(a) Discounted Cash Flows Credit spreads
Bank and corporate debt securities 26 AFS(b) Discounted Cash Flows Credit spreads
Equity securities (Unquoted) 131 AFS(b) Net Asset Value Net asset value of securities
Derivatives 21 FVPL(a) CDS models/Option & Credit spreads/ interest rate pricing model Correlations/Basis Volatility
Total 717
LiabilitiesOther debt securities 21 FVPL(a) Discounted Cash Flows Credit spreads
Derivatives 51 FVPL(a) CDS models/Option & Credit spreads/Correlations interest rate pricing model
Total 72
(a) FVPL denotes financial instruments classified as fair value through profit or loss(b) AFS denotes financial instruments classified as available-for-sale
161Financial StatementS
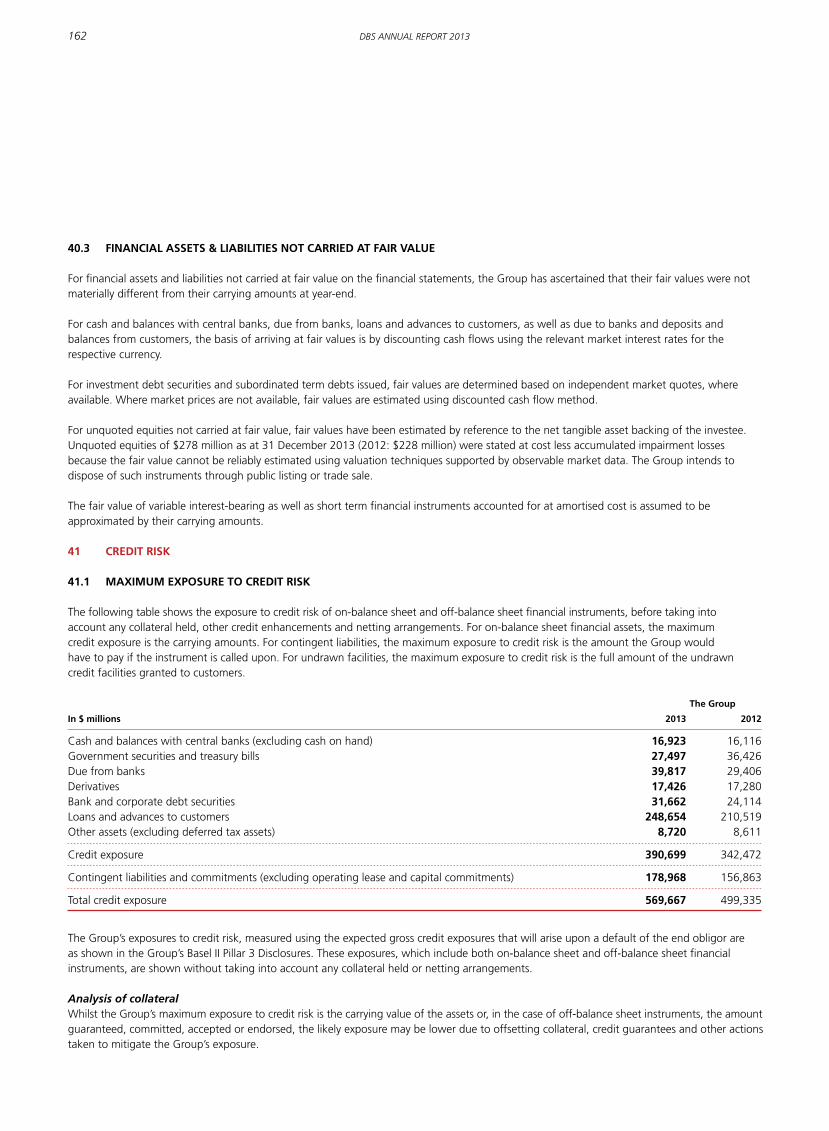
40.3 FINANCIAL ASSETS & LIABILITIES NoT CArrIED AT FAIr vALuE
For financial assets and liabilities not carried at fair value on the financial statements, the Group has ascertained that their fair values were not materially different from their carrying amounts at year-end.
For cash and balances with central banks, due from banks, loans and advances to customers, as well as due to banks and deposits and balances from customers, the basis of arriving at fair values is by discounting cash flows using the relevant market interest rates for the respective currency.
For investment debt securities and subordinated term debts issued, fair values are determined based on independent market quotes, where available. Where market prices are not available, fair values are estimated using discounted cash flow method.
For unquoted equities not carried at fair value, fair values have been estimated by reference to the net tangible asset backing of the investee. Unquoted equities of $278 million as at 31 December 2013 (2012: $228 million) were stated at cost less accumulated impairment losses because the fair value cannot be reliably estimated using valuation techniques supported by observable market data. The Group intends to dispose of such instruments through public listing or trade sale.
The fair value of variable interest-bearing as well as short term financial instruments accounted for at amortised cost is assumed to be approximated by their carrying amounts.
41 CrEDIT rISk
41.1 MAxIMuM ExpoSurE To CrEDIT rISk
The following table shows the exposure to credit risk of on-balance sheet and off-balance sheet financial instruments, before taking into account any collateral held, other credit enhancements and netting arrangements. For on-balance sheet financial assets, the maximum credit exposure is the carrying amounts. For contingent liabilities, the maximum exposure to credit risk is the amount the Group would have to pay if the instrument is called upon. For undrawn facilities, the maximum exposure to credit risk is the full amount of the undrawn credit facilities granted to customers.
The Group
In $ millions 2013 2012
Cash and balances with central banks (excluding cash on hand) 16,923 16,116Government securities and treasury bills 27,497 36,426Due from banks 39,817 29,406Derivatives 17,426 17,280Bank and corporate debt securities 31,662 24,114Loans and advances to customers 248,654 210,519Other assets (excluding deferred tax assets) 8,720 8,611
Credit exposure 390,699 342,472
Contingent liabilities and commitments (excluding operating lease and capital commitments) 178,968 156,863
Total credit exposure 569,667 499,335
The Group’s exposures to credit risk, measured using the expected gross credit exposures that will arise upon a default of the end obligor are as shown in the Group’s Basel II Pillar 3 Disclosures. These exposures, which include both on-balance sheet and off-balance sheet financial instruments, are shown without taking into account any collateral held or netting arrangements.
analysis of collateralWhilst the Group’s maximum exposure to credit risk is the carrying value of the assets or, in the case of off-balance sheet instruments, the amount guaranteed, committed, accepted or endorsed, the likely exposure may be lower due to offsetting collateral, credit guarantees and other actions taken to mitigate the Group’s exposure.
162 DBS AnnuAl RepoRt 2013

The description of collateral for each class of financial asset is set out below:
Balances with central banks, government securities and treasury bills, due from banks and bank and corporate debt securitiesCollateral is generally not sought for these assets.
DerivativesThe Group maintains collateral agreements and enters into master netting agreements with most of the counterparties for derivative transactions. Please refer to Note 37 for the impact of netting arrangements recognised for the computation of Capital Adequacy Ratio (CAR).
Loans and advances to customers, contingent liabilities and commitmentsCertain loans and advances to customers, contingent liabilities and commitments are typically collateralised to a substantial extent. In particular, residential mortgage exposures are generally fully secured by residential properties. Income-producing real estate, which is a sub-set of the Specialised Lending exposure, are fully secured by the underlying assets financed.
The extent to which credit exposures are covered by Basel II-eligible collateral, besides real estate, after the application of the requisite regulatory hair-cuts, is shown in the Group’s Basel II Pillar 3 Disclosures. The amounts are a sub-set of the actual collateral arrangements entered by the Group as Basel II imposes strict legal and operational standards before collateral can be admitted as credit risk mitigants. As a result, certain collateral arrangements which do not meet its criteria will not be included. Certain collateral types which are not permitted as credit risk mitigants for credit exposures under the Standardised Approach are also excluded.
41.2 LoANS AND ADvANCES To CuSToMErS
Loans and advances to customers are summarised as follows:
The Group
In $ millions 2013 2012
Loans and advances to customers Performing Loans – Neither past due nor impaired (i) 247,811 210,541 – Past due but not impaired (ii) 1,488 745 Non-Performing Loans – Impaired (iii) 2,882 2,542
Total gross loans (Note 19) 252,181 213,828
(i) Loans and advances neither past due nor impaired, analysed by loan grading and industry
The credit quality of the portfolio of loans and advances that are neither past due nor impaired can be assessed by reference to the loan gradings in MAS Notice to Banks No. 612, “Credit Files, Grading and Provisioning” are as follows:
The Group
In $ millions pass Special mention Total
2013Manufacturing 28,664 771 29,435Building and construction 42,206 341 42,547Housing loans 48,611 – 48,611General commerce 50,304 1,023 51,327Transportation, storage and communications 19,744 350 20,094Financial institutions, investments and holding companies 10,585 90 10,675Professionals and private individuals (excluding housing loans) 18,544 22 18,566Others 26,205 351 26,556
Total 244,863 2,948 247,811
163Financial StatementS

The Group
In $ millions pass Special mention Total
2012Manufacturing 25,785 804 26,589Building and construction 35,829 183 36,012Housing loans 45,119 150 45,269General commerce 36,711 1,105 37,816Transportation, storage and communications 16,100 447 16,547Financial institutions, investments and holding companies 10,745 50 10,795Professionals and private individuals (excluding housing loans) 14,684 23 14,707Others 22,365 441 22,806
Total 207,338 3,203 210,541
(ii) Loans and advances past due but not impaired, analysed by past due period and industry
The Group
Less than 30 30-59 days 60-90 daysIn $ millions days past due past due past due Total
2013Manufacturing 79 29 3 111Building and construction 133 87 23 243Housing loans 354 43 27 424General commerce 65 10 4 79Transportation, storage and communications 20 4 2 26Financial institutions, investment and holding companies 73 – – 73Professionals and private individuals (excluding housing loans) 373 71 15 459Others 63 7 3 73
Total 1,160 251 77 1,488
2012Manufacturing 93 17 4 114Building and construction 82 1 6 89Housing loans 180 14 3 197General commerce 122 18 3 143Transportation, storage and communications 5 – – 5Financial institutions, investment and holding companies – – – –Professionals and private individuals (excluding housing loans) 88 10 2 100Others 84 12 1 97
Total 654 72 19 745
(iii) Non-performing assets (NpAs)
The table below shows the movements in non-performing assets during the year for the Group: The Group
In $ millions 2013 2012
Balance at 1 January 2,726 2,904New NPAs 1,085 364Upgrades, recoveries and translations (123) (364)Write-offs (692) (178)
Balance at 31 December 2,996 2,726
164 DBS AnnuAl RepoRt 2013

non-performing assets by loan grading and industry The Group
NpAs Specific allowances Sub- Sub-In $ millions standard Doubtful Loss Total standard Doubtful Loss Total
2013Customer loansManufacturing 295 139 54 488 56 130 54 240Building and construction 184 41 1 226 11 30 1 42Housing loans 100 3 9 112 – – 9 9General commerce 250 98 49 397 21 72 49 142Transportation, storage and communications 832 295 18 1,145 164 283 18 465Financial institutions, investment and holding companies 48 143 74 265 – 72 74 146Professional and private individuals (excluding housing loans) 130 14 11 155 24 13 11 48Others 76 3 15 94 19 3 15 37
Total customer loans 1,915 736 231 2,882 295 603 231 1,129
Debt securities 5 1 3 9 – – 3 3Contingent items and others 61 16 28 105 11 11 28 50
Total 1,981 753 262 2,996 306 614 262 1,182
Of which: restructured loans 878 343 56 1,277 168 326 56 550
The Group
NpAs(b) Specific allowances(b)
Sub- Sub-In $ millions standard Doubtful Loss Total standard Doubtful Loss Total
2012Customer loans(a)
Manufacturing 108 152 92 352 9 139 92 240Building and construction 47 32 4 83 8 26 4 38Housing loans 92 4 10 106 1 1 10 12General commerce 140 63 74 277 23 58 74 155Transportation, storage and communications 708 207 286 1,201 152 82 286 520Financial institutions, investment and holding companies 105 258 41 404 43 181 41 265Professional and private individuals (excluding housing loans) 138 12 12 162 23 11 12 46Others 18 7 17 42 4 5 17 26
Total customer loans 1,356 735 536 2,627 263 503 536 1,302
Debt securities 7 2 4 13 – – 4 4Contingent items and others 42 15 29 86 5 15 29 49
Total 1,405 752 569 2,726 268 518 569 1,355
Of which: restructured loans 888 223 276 1,387 200 114 276 590
(a) Certain loans to investment holding companies have been reclassified to better reflect the underlying principal activity of the companies owned by the holding company. The amounts for prior period have also been reclassified to conform to the current presentation
(b) 2012 NPAs and specific allowances for customer loans each includes $85 million in interest receivables
165Financial StatementS

Non-performing assets by region(a)
The Group
Specific GeneralIn $ millions NpAs allowances allowances
2013Singapore 440 113 1,066Hong Kong 235 117 461Rest of Greater China 284 146 602South and Southeast Asia 638 227 342Rest of the World 1,399 579 394
Total 2,996 1,182 2,865
2012Singapore 411 133 1,056Hong Kong 245 127 431Rest of Greater China 237 132 354South and Southeast Asia 257 159 330Rest of the World 1,576 804 340
Total 2,726 1,355 2,511
(a) Based on the country of incorporation of the borrower
Non-performing assets by past due period
The Group
In $ millions 2013 2012
Not overdue 1,281 1,245
< 90 days past due 275 29791-180 days past due 272 193> 180 days past due 1,168 991
Total past due assets 1,715 1,481
Total 2,996 2,726
Collateral value for non-performing assets
The Group
In $ millions 2013 2012
Properties 351 269Shares and debentures 323 58Fixed deposits 33 32Others 303 252
Total 1,010 611
past due non-performing assets by industry
The Group
In $ millions 2013 2012
Manufacturing 468 341Building and construction 123 73Housing loans 93 105General commerce 368 231Transportation, storage and communications 189 193Financial institutions, investment and holding companies 197 312Professional and private individuals (excluding housing loans) 111 118Others 83 39
Sub-total 1,632 1,412
Debt securities, contingent items and others 83 69
Total 1,715 1,481
past due non-performing assets by region(a)
The Group
In $ millions 2013 2012
Singapore 409 346Hong Kong 191 198Rest of Greater China 261 215South and Southeast Asia 471 194Rest of the World 300 459
Sub-total 1,632 1,412
Debt securities, contingent items and others 83 69
Total 1,715 1,481
(a) Based on the country of incorporation of the borrower
166 DBS AnnuAl RepoRt 2013

41.3 CrEDIT quALITy oF GovErNMENT SECurITIES AND TrEASury BILLS AND BANk AND CorporATE DEBT SECurITIES
The table below presents an analysis of Government securities and treasury bills and Bank and corporate debt securities for the Group by rating agency designation as at 31 December:
Singapore other Bank and Government government corporateIn $ millions securities and securities and debtExternal rating treasury bills treasury bills securities
2013AAA 9,894 560 8,108AA- to AA+ – 13,376 2,064A- to A+ – 430 6,419Lower than A- – 3,237 3,589Unrated – – 11,482
Total 9,894 17,603 31,662
2012AAA 12,933 1,642 3,271AA- to AA+ – 16,174 1,733A- to A+ – 861 5,675Lower than A- – 4,816 2,753Unrated – – 10,682
Total 12,933 23,493 24,114
41.4 CrEDIT rISk By GEoGrApHy AND INDuSTry
The exposures are determined based on the country of incorporation of borrower, issuer or counterparty.
Bank and Loans and Government corporate advances toIn $ millions securities and Due from debt customersAnalysed by geography treasury bills banks Derivatives securities (Gross) Total
2013Singapore 9,894 856 2,095 14,214 119,463 146,522Hong Kong 2,452 3,027 1,565 1,122 41,418 49,584Rest of Greater China 2,594 20,337 1,248 1,971 47,910 74,060South and Southeast Asia 2,780 4,217 1,136 3,008 23,004 34,145Rest of the World 9,777 11,380 11,382 11,347 20,386 64,272
Total 27,497 39,817 17,426 31,662 252,181 368,583
2012Singapore 12,933 625 2,609 9,273 101,485 126,925Hong Kong 2,693 1,004 1,358 1,137 38,119 44,311Rest of Greater China 2,466 15,912 927 1,524 30,678 51,507South and Southeast Asia 4,314 4,017 661 2,115 23,045 34,152Rest of the World 14,020 7,848 11,725 10,065 20,501 64,159
Total 36,426 29,406 17,280 24,114 213,828 321,054
167Financial StatementS

Bank and Loans and Government corporate advances toIn $ millions securities and Due from debt customersAnalysed by industry(a) treasury bills banks Derivatives securities (Gross) Total
2013Manufacturing – – 454 1,770 30,034 32,258Building and construction – – 137 2,641 43,016 45,794Housing loans – – – – 49,147 49,147General commerce – – 568 1,115 51,803 53,486Transportation, storage and communications – – 545 2,524 21,265 24,334Financial institutions, investment and holding companies – 39,817 14,699 13,542 11,013 79,071Government 27,497 – – – – 27,497Professionals and private individuals (excluding housing loans) – – 145 – 19,180 19,325Others – – 878 10,070 26,723 37,671
Total 27,497 39,817 17,426 31,662 252,181 368,583
2012Manufacturing – – 319 1,065 27,037 28,421Building and construction – – 238 1,590 36,179 38,007Housing loans – – – – 45,570 45,570General commerce – – 289 1,012 38,230 39,531Transportation, storage and communications – – 498 2,359 17,745 20,602Financial institutions, investment and holding companies – 29,406 14,700 10,997 11,155 66,258Government 36,426 – – – – 36,426Professionals and private individuals (excluding housing loans) – – 68 – 14,969 15,037Others – – 1,168 7,091 22,943 31,202
Total 36,426 29,406 17,280 24,114 213,828 321,054
(a) Certain loans to investment holding companies have been reclassified to better reflect the underlying principal activity of the companies owned by the holding company. The amounts for prior period have also been reclassified to conform to the current presentation
168 DBS AnnuAl RepoRt 2013

42 LIquIDITy rISk
42.1 CoNTrACTuAL MATurITy proFILE oF ASSETS AND LIABILITIES
The table below analyses assets and liabilities of the Group as at 31 December based on the remaining period as at balance sheet date to the contractual maturity date.
Less than 1 week to 1 to 3 3 to 12 1 to 3 More than No specificIn $ millions 7 days 1 month months months years 3 years maturity Total
2013Cash and balances with central banks 15,240 586 671 2,007 222 – – 18,726Government securities and treasury bills 94 1,803 4,284 9,739 4,453 7,124 – 27,497Due from banks 14,134 5,124 9,143 11,013 403 – – 39,817Derivatives(a) 17,426 – – – – – – 17,426Bank and corporate securities 83 1,548 4,267 3,800 6,956 15,008 1,884 33,546Loans and advances to customers 16,115 29,755 27,852 47,190 48,153 79,589 – 248,654Other assets 1,898 468 583 2,807 390 2,168 611 8,925Associates – – – – – – 1,166 1,166Properties and other fixed assets – – – – – – 1,449 1,449Goodwill – – – – – – 4,802 4,802
Total assets 64,990 39,284 46,800 76,556 60,577 103,889 9,912 402,008
Due to banks 6,414 2,268 2,566 1,285 1,039 – – 13,572Deposits and balances from customers 187,914 40,730 34,087 26,196 2,992 446 – 292,365Derivatives(a) 18,132 – – – – – – 18,132Other liabilities 2,215 1,083 141 3,711 555 2,558 1,331 11,594Other debt securities 682 2,512 5,939 7,975 2,779 3,228 – 23,115Subordinated term debts – – – – – 5,544 – 5,544
Total liabilities 215,357 46,593 42,733 39,167 7,365 11,776 1,331 364,322
Non-controlling interests – – – – – – 3,453 3,453Shareholders’ funds – – – – – – 34,233 34,233
Total equity – – – – – – 37,686 37,686
(a) Derivatives financial assets and liabilities are included in the “Less than 7 days” bucket as they are mainly held for trading. Refer to the table in Note 42.2 on cash flows associated with these derivatives
169Financial StatementS

Less than 1 week to 1 to 3 3 to 12 1 to 3 More than No specificIn $ millions 7 days 1 month months months years 3 years maturity Total
2012Cash and balances with central banks 10,257 1,974 4,160 1,381 – – – 17,772Government securities and treasury bills 172 1,616 5,166 10,747 11,486 7,239 – 36,426Due from banks 7,588 4,307 5,664 10,509 1,245 93 – 29,406Derivatives(a) 17,280 – – – – – – 17,280Bank and corporate securities 17 758 855 3,921 7,731 10,832 1,334 25,448Loans and advances to customers 14,566 23,445 21,014 34,295 44,614 72,585 – 210,519Other assets 3,313 159 505 1,454 2,947 233 91 8,702Associates – – – – – – 1,236 1,236Properties and other fixed assets – – – – – – 1,442 1,442Goodwill – – – – – – 4,802 4,802
Total assets 53,193 32,259 37,364 62,307 68,023 90,982 8,905 353,033
Due to banks 9,619 2,221 1,827 126 1,192 366 – 15,351Deposits and balances from customers 159,738 34,136 28,735 26,609 3,575 671 – 253,464Derivatives(a) 17,532 – – – – – – 17,532Other liabilities 6,434 1,169 381 2,152 587 676 30 11,429Other debt securities 1,222 2,729 2,488 2,059 2,124 3,132 – 13,754Subordinated term debts – – – – – 5,505 – 5,505
Total liabilities 194,545 40,255 33,431 30,946 7,478 10,350 30 317,035
Non-controlling interests – – – – – – 4,261 4,261Shareholders’ funds – – – – – – 31,737 31,737
Total equity – – – – – – 35,998 35,998
(a) Derivatives financial assets and liabilities are included in the “Less than 7 days” bucket as they are mainly held for trading. Refer to the table in Note 42.2 on cash flows associated with these derivatives
The above table includes disclosure of the contractual maturity of financial liabilities, which approximates the same analysis on an undiscounted basis as total future interest payments are not material relative to the principal amounts. Assets and liabilities (including non-maturing savings/current deposits) are represented on a contractual basis or in a period when it can legally be withdrawn. On a behavioural basis for liquidity risk analysis, the assets and liabilities cash flows may differ from contractual basis.
170 DBS AnnuAl RepoRt 2013
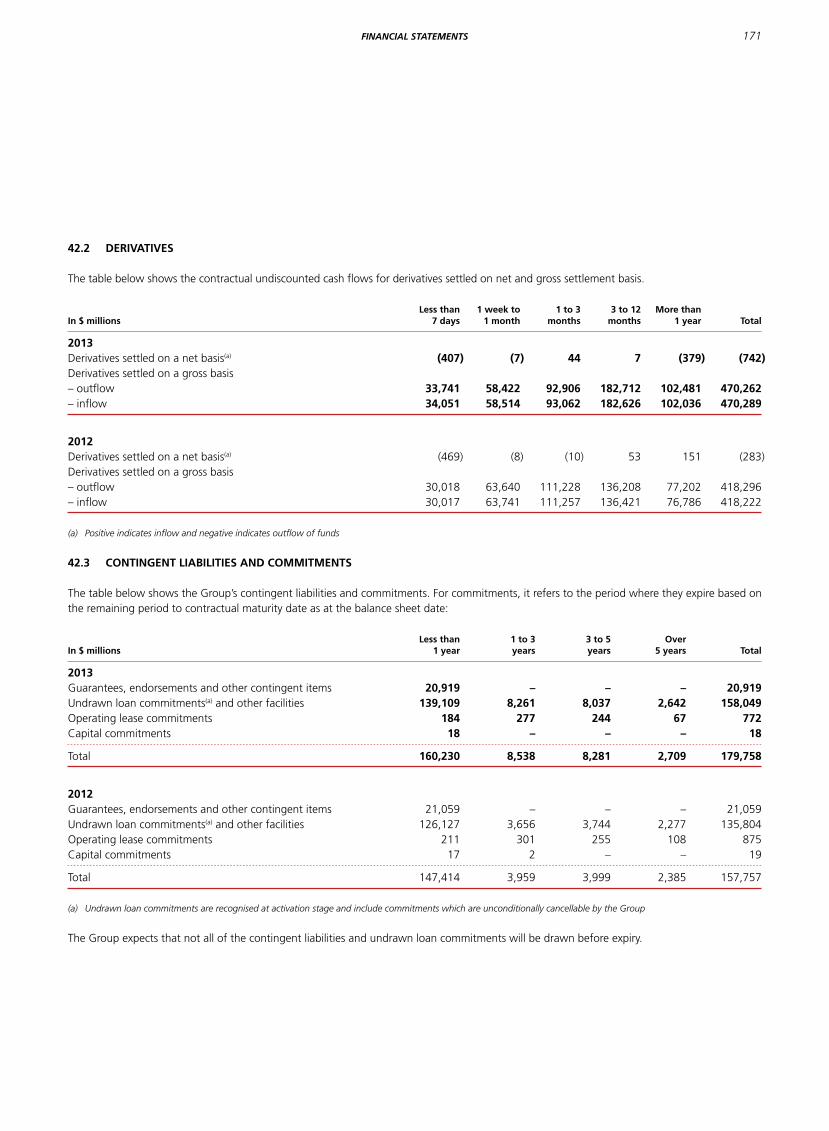
42.2 DErIvATIvES
The table below shows the contractual undiscounted cash flows for derivatives settled on net and gross settlement basis.
Less than 1 week to 1 to 3 3 to 12 More thanIn $ millions 7 days 1 month months months 1 year Total
2013Derivatives settled on a net basis(a) (407) (7) 44 7 (379) (742)Derivatives settled on a gross basis– outflow 33,741 58,422 92,906 182,712 102,481 470,262– inflow 34,051 58,514 93,062 182,626 102,036 470,289
2012Derivatives settled on a net basis(a) (469) (8) (10) 53 151 (283)Derivatives settled on a gross basis– outflow 30,018 63,640 111,228 136,208 77,202 418,296– inflow 30,017 63,741 111,257 136,421 76,786 418,222
(a) Positive indicates inflow and negative indicates outflow of funds
42.3 CoNTINGENT LIABILITIES AND CoMMITMENTS
The table below shows the Group’s contingent liabilities and commitments. For commitments, it refers to the period where they expire based on the remaining period to contractual maturity date as at the balance sheet date:
Less than 1 to 3 3 to 5 overIn $ millions 1 year years years 5 years Total
2013Guarantees, endorsements and other contingent items 20,919 – – – 20,919Undrawn loan commitments(a) and other facilities 139,109 8,261 8,037 2,642 158,049Operating lease commitments 184 277 244 67 772Capital commitments 18 – – – 18
Total 160,230 8,538 8,281 2,709 179,758
2012Guarantees, endorsements and other contingent items 21,059 – – – 21,059Undrawn loan commitments(a) and other facilities 126,127 3,656 3,744 2,277 135,804Operating lease commitments 211 301 255 108 875Capital commitments 17 2 – – 19
Total 147,414 3,959 3,999 2,385 157,757
(a) Undrawn loan commitments are recognised at activation stage and include commitments which are unconditionally cancellable by the Group
The Group expects that not all of the contingent liabilities and undrawn loan commitments will be drawn before expiry.
171Financial StatementS

43 CApITAL MANAGEMENT
The Group’s capital management objectives are to diversify its sources of capital, to allocate capital efficiently, guided by the need to maintain a prudent relationship between available capital and the risks of its underlying businesses, and to meet the expectations of key constituencies, including investors, regulators and rating agencies. The Group has complied with all externally imposed capital requirements (whether prescribed by regulation or by contract) throughout the financial year.
The capital management process, which is under the oversight of the Capital Committee, includes periodic reviews of both the demand for and supply of capital across the Group. Overseas subsidiaries and non-banking subsidiaries of the Group may be required to comply with country-specific and industry-specific capital requirements depending on the jurisdiction and industry in which they operate, and are allocated capital accordingly to ensure regulatory compliance. Quarterly updates on the Group’s capital position are provided to the Board of Directors.
The Group is subject to the capital adequacy requirements set out in the Monetary Authority of Singapore’s Notice to Banks No. 637 (Notice on Risk Based Capital Adequacy Requirements for Banks incorporated in Singapore), which effects the Basel Committee on Banking Supervision’s capital adequacy framework in Singapore.
44 SEGMENT rEporTING
44.1 BuSINESS SEGMENT rEporTING
The business segment results are prepared based on the Group’s internal management reporting which reflects the organisation management structure. As the activities of the Group are highly integrated, internal allocation has been made in preparing the segment information. Amounts for each business segment are shown after the allocation of certain centralised costs, funding income and the application of transfer pricing, where appropriate. Transactions between segments are recorded within the segment as if they are third party transactions and are eliminated on consolidation.
The various business segments are described below:
consumer Banking/Wealth managementConsumer Banking/Wealth Management provides individual customers with a diverse range of banking and related financial services. The products and services available to customers include current and savings accounts, fixed deposits, loans and home finance, cards, payments, investment and insurance products.
institutional BankingInstitutional Banking provides financial services and products to institutional clients including bank and non-bank financial institutions, government-linked companies, large corporates and small and medium-sized businesses. The business focuses on broadening and deepening customer relationships. Products and services comprise the full range of credit facilities from short term working capital financing to specialised lending. It also provides global transactional services such as cash management, trade finance and securities and fiduciary services; treasury and markets products; corporate finance and advisory banking as well as capital markets solutions. In addition, Institutional Banking also includes Islamic Bank of Asia. From 1 January 2013, DBS Vickers Securities, which provides equities and derivatives brokerage services, has been classified under the “Others” segment. Historical figures have been reclassified accordingly.
treasuryTreasury provides treasury services to corporations, institutional and private investors, financial institutions and other market participants. It is primarily involved in sales, structuring, market making and trading across a broad range of financial products including foreign exchange, interest rate, debt, credit, equity and other structured derivatives. Income from these financial products and services offered to the customer of other business segments, such as Consumer Banking/Wealth Management and Institutional Banking, is reflected in the respective segments. Treasury is also responsible for managing surplus funds.
OthersOthers encompasses a range of activities from corporate decisions and income and expenses not attributed to the business segments, including capital and balance sheet management, funding and liquidity. DBS Vickers Securities has also been included in this segment.
During the year, no one group of related customers as defined under banking regulations accounted for more than 10% of the Group’s revenues.
172 DBS AnnuAl RepoRt 2013

The following table analyses the results, total assets and total liabilities of the Group by business segments:
Consumer Banking/wealth InstitutionalIn $ millions Management Banking Treasury others Total
2013Net interest income 1,500 3,024 694 351 5,569Non-interest income 1,038 1,652 340 499 3,529Total income 2,538 4,676 1,034 850 9,098Expenses 1,740 1,377 478 323 3,918Allowances for credit and other losses 88 544 (3) 141 770Share of profits of associates – – – 79 79Profit before tax 710 2,755 559 465 4,489Income tax expense 615Net profit attributable to shareholders 3,672
Total assets before goodwill 72,887 207,264 83,049 34,006 397,206Goodwill 4,802Total assets 402,008Total liabilities 143,325 132,206 75,349 13,442 364,322
Capital expenditure 63 30 15 119 227Depreciation(a) 32 9 8 165 214
2012Net interest income 1,427 2,747 692 419 5,285Non-interest income 873 1,405 427 524 3,229Total income 2,300 4,152 1,119 943 8,514Expenses 1,602 1,269 462 281 3,614Allowances for credit and other losses 93 215 (3) 112 417Share of profits of associates – – – 124 124Profit before tax 605 2,668 660 674 4,607Income tax expense 588Net profit attributable to shareholders 3,809
Total assets before goodwill 63,232 175,329 75,434 34,236 348,231Goodwill 4,802Total assets 353,033Total liabilities 136,639 101,700 75,697 2,999 317,035
Capital expenditure 57 12 13 256 338Depreciation(a) 32 13 7 127 179
(a) Amounts for each business segment are shown before allocation of centralised cost
173Financial StatementS

44.2 GEoGrApHICAL SEGMENT rEporTING
Income and net profit attributable to shareholders (Net profit) are based on the country in which the transactions are booked. Total assets are shown by geographical area in which the assets are booked. It would not be materially different if total assets shown are based on the country in which the counterparty or assets are located. The total assets, income and net profit are stated after elimination of inter-group assets and revenues.
The Group
rest of South and Greater Southeast rest ofIn $ millions Singapore Hong kong China(a) Asia(b) the world(c) Total
2013Net interest income 3,487 1,016 456 405 205 5,569Non-interest income 2,099 847 287 195 101 3,529Total income 5,586 1,863 743 600 306 9,098Expenses 2,288 717 548 283 82 3,918Allowances for credit and other losses 335 142 76 126 91 770Share of profits of associates 13 – 8 58 – 79Profit before tax 2,976 1,004 127 249 133 4,489Income tax expense 344 153 35 50 33 615Net profit attributable to shareholders 2,431 851 92 198 100 3,672
Total assets before goodwill 258,580 65,783 43,132 16,466 13,245 397,206Goodwill 4,802 – – – – 4,802Total assets 263,382 65,783 43,132 16,466 13,245 402,008Non-current assets(d) 2,124 355 103 31 2 2,615
2012Net interest income 3,209 886 510 451 229 5,285Non-interest income 2,207 646 153 140 83 3,229Total income 5,416 1,532 663 591 312 8,514Expenses 2,088 678 498 275 75 3,614Allowances for credit and other losses 318 11 34 38 16 417Share of profits of associates 19 – 6 99 – 124Profit before tax 3,029 843 137 377 221 4,607Income tax expense 290 127 27 84 60 588Net profit attributable to shareholders 2,529 716 110 293 161 3,809
Total assets before goodwill 225,678 56,577 35,317 16,860 13,799 348,231Goodwill 4,802 – – – – 4,802Total assets 230,480 56,577 35,317 16,860 13,799 353,033Non-current assets(d) 2,189 355 111 21 2 2,678
(a) Rest of Greater China includes branch, subsidiary and associate operations in Mainland China and Taiwan(b) South and Southeast Asia includes branch, subsidiary and associate operations in India, Indonesia, Malaysia, Vietnam and the Philippines(c) Rest of the World includes branch operations in South Korea, Japan, Dubai, United States of America and United Kingdom(d) Includes investment in associates, properties and other fixed assets
174 DBS AnnuAl RepoRt 2013

45 CoMpArATIvES
Prior period comparatives have been aligned to the current presentation (refer to Note 2.3). The table below provides a reconciliation of the current Balance Sheet presentation to the old Balance Sheet presentation for 2012 balances.
In $ millions Current prior2013 Line item 2012 Line item presentation presentation
Government securities and treasury bills 36,426 Singapore Government securities and treasury bills 12,092 Financial assets at fair value through profit or loss 5,334 Financial investments 15,952 Securities pledged and transferred 3,048
Due from banks 29,406 Due from banks 28,808 Financial assets at fair value through profit or loss 598
Bank and corporate securities 25,448 Financial assets at fair value through profit or loss 4,484 Financial investments 19,615 Securities pledged and transferred 1,349
Loans and advances to customers 210,519 Financial assets at fair value through profit or loss 1,124 Loans and advances to customers 209,395
Other assets 8,702 Other assets 8,611 Deferred tax assets 91
Properties and other fixed assets 1,442 Properties and other fixed assets 945 Investment properties 497
Due to banks 15,351 Due to banks 25,162 Financial liabilities at fair value through profit or loss 746 Reclassification to deposits and balances from customers (10,557)
Deposits and balances from customers 253,464 Due to non-bank customers 241,165 Financial liabilities at fair value through profit or loss 1,742 Reclassification from due to banks 10,557
Other liabilities 11,429 Financial liabilities at fair value through profit or loss 1,843 Bills payable 316 Current tax liabilities 824 Deferred tax liabilities 30 Other liabilities 8,416
Other debt securities 13,754 Financial liabilities at fair value through profit or loss 3,518 Other debt securities in issue 10,236
175Financial StatementS

for the year ended 31 December 2013
INCoME STATEMENT
In $ millions Note 2013 2012
IncomeInterest income 5,614 5,396Interest expense 1,502 1,571
Net interest income 4,112 3,825Net fee and commission income 1,276 1,085Net trading income 491 690Net income from investment securities 248 366Other income 2 372 380
Total income 6,499 6,346
ExpensesEmployee benefits 1,298 1,140Other expenses 1,177 1,116Allowances for credit and other losses 556 342
Total expenses 3,031 2,598
profit before tax 3,468 3,748Income tax expense 463 450
Net profit 3,005 3,298
(see notes on pages 179 to 180, which form part of these financial statements)
176 DBS AnnuAl RepoRt 2013
DBS Bank ltd

for the year ended 31 December 2013
STATEMENT oF CoMprEHENSIvE INCoME
In $ millions 2013 2012
Net profit 3,005 3,298
other comprehensive income:Foreign currency translation differences for foreign operations (52) 2Available-for-sale financial assets and others: Net valuation taken to equity (530) 599 Transferred to income statement (163) (327) Tax on items taken directly to or transferred from equity 40 (43)
other comprehensive income, net of tax (705) 231
Total comprehensive income 2,300 3,529
(see notes on pages 179 to 180, which form part of these financial statements)
177Financial StatementS
DBS Bank Ltd

BALANCE SHEET
In $ millions Note 2013 2012
AssetsCash and balances with central banks 11,652 11,652Government securities and treasury bills 23,640 31,520Due from banks 31,686 22,661Derivatives 16,764 16,982Bank and corporate securities 30,481 22,694Loans and advances to customers 191,887 160,567Other assets 4,997 5,083Associates 431 649Subsidiaries 3 18,222 15,690Properties and other fixed assets 567 552
Total assets 330,327 288,050
LiabilitiesDue to banks 12,276 13,613Deposits and balances from customers 224,649 193,577Derivatives 17,535 17,283Other liabilities 6,031 5,999Other debt securities 21,476 12,486Due to holding company 1,406 822Due to subsidiaries 4 9,391 7,129Subordinated term debts 5,544 5,505
Total liabilities 298,308 256,414
Net assets 32,019 31,636
EquityShare capital 5 17,096 17,096Other reserves 6 2,274 2,979Revenue reserves 6 12,649 11,561
Shareholders’ funds 32,019 31,636
Total equity 32,019 31,636
(see notes on pages 179 to 180, which form part of these financial statements)
as at 31 December 2013
178 DBS AnnuAl RepoRt 2013
DBS Bank ltd

The supplementary financial statements of DBS Bank Ltd (the Bank) are extracted from the Audited Statutory Financial Statements of DBS Bank Ltd and its subsidiaries (the Bank Group) for the financial year ended 31 December 2013. The statutory financial statements of the Bank and the Bank Group which contained an unqualified audit report, will be delivered to the Accounting & Corporate Regulatory Authority in accordance with the Singapore Companies Act.
1 SuMMAry oF SIGNIFICANT ACCouNTING poLICIES
The accounting policies applied by the Bank and the Bank Group are consistent with those applied by the Group as disclosed in Note 2 of the “Notes to the Financial Statements” (Notes) in the Group’s Consolidated Financial Statements.
2 oTHEr INCoME
Other income includes the following:
In $ millions 2013 2012
Dividends from subsidiaries 193 7Dividends from associates 41 82
Total 234 89
3 SuBSIDIArIES
In $ millions 2013 2012
Unquoted equity shares(a) 12,578 12,434Less: impairment allowances 741 736
Sub-total 11,837 11,698Due from subsidiaries 6,382 3,990
Total 18,219 15,688
(a) The carrying amounts of certain investments which are designated as hedged items in a fair value hedge are adjusted for fair value changes attributable to the hedged risks
Movements in impairment allowances during the year are as follows:
In $ millions 2013 2012
Balance at 1 January 736 813Charge/(Write-back) to income statement 5 (7)Write-off against investment cost – (70)
Balance at 31 December 741 736
4 DuE To SuBSIDIArIES
In $ millions 2013 2012
Subordinated term debts issued to DBS Capital Funding Corporation II (Note 4.1) 1,500 1,500Due to subsidiaries 7,891 5,629
Total 9,391 7,129
4.1 The $1,500 million 5.75% subordinated note was issued on 27 May 2008 by the Bank to DBS Capital Funding II Corporation, both wholly-owned subsidiaries of DBSH. Interest is payable semi-annually on 15 June and 15 December at a fixed rate of 5.75% per annum up to 15 June 2018. If these are not redeemed at the tenth year, interest will be payable quarterly on 15 March, 15 June, 15 September and 15 December at a floating rate of three-month Singapore Dollar Swap Offer Rate plus a stepped-up spread of 3.415% per annum.
5 SHArE CApITAL
Issued and fully paid up 2013 2012
2,233,102,635 (2012: 2,233,102,635) ordinary shares 2,233 2,2336,800 (2012: 6,800) 4.7% Non-Cumulative, Non-Convertible, Non-Voting Preference Shares Callable in 2020 # #8,000,000 (2012: 8,000,000) 4.7% Non-Cumulative, Non-Convertible, Non-Voting Preference Shares Callable in 2020 8 8
Total number of shares (millions) 2,241 2,241
Total Share Capital (in $ millions) 17,096 17,096
# Amount under 500,000
6 oTHEr rESErvES
6.1 oTHEr rESErvES
In $ millions 2013 2012
Available-for-sale revaluation reserves (10) 630Cash flow hedge reserves (14) (1)General reserves 2,360 2,360Capital reserves (62) (10)
Total 2,274 2,979
for the year ended 31 December 2013
NoTES To THE SuppLEMENTAry FINANCIAL STATEMENTS
179Financial StatementS
DBS Bank Ltd
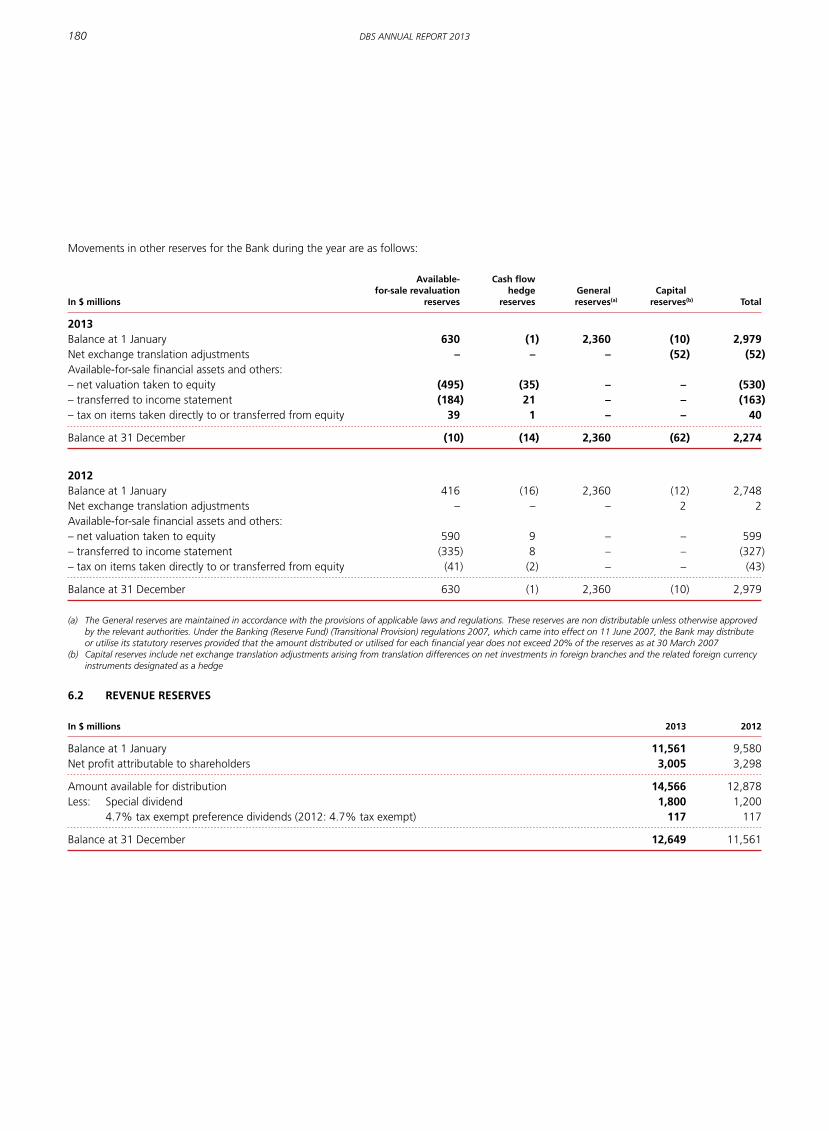
Movements in other reserves for the Bank during the year are as follows:
Available- Cash flow for-sale revaluation hedge General CapitalIn $ millions reserves reserves reserves(a) reserves(b) Total
2013Balance at 1 January 630 (1) 2,360 (10) 2,979Net exchange translation adjustments – – – (52) (52)Available-for-sale financial assets and others:– net valuation taken to equity (495) (35) – – (530)– transferred to income statement (184) 21 – – (163)– tax on items taken directly to or transferred from equity 39 1 – – 40
Balance at 31 December (10) (14) 2,360 (62) 2,274
2012Balance at 1 January 416 (16) 2,360 (12) 2,748Net exchange translation adjustments – – – 2 2Available-for-sale financial assets and others:– net valuation taken to equity 590 9 – – 599– transferred to income statement (335) 8 – – (327)– tax on items taken directly to or transferred from equity (41) (2) – – (43)
Balance at 31 December 630 (1) 2,360 (10) 2,979
(a) The General reserves are maintained in accordance with the provisions of applicable laws and regulations. These reserves are non distributable unless otherwise approved by the relevant authorities. Under the Banking (Reserve Fund) (Transitional Provision) regulations 2007, which came into effect on 11 June 2007, the Bank may distribute or utilise its statutory reserves provided that the amount distributed or utilised for each financial year does not exceed 20% of the reserves as at 30 March 2007
(b) Capital reserves include net exchange translation adjustments arising from translation differences on net investments in foreign branches and the related foreign currency instruments designated as a hedge
6.2 rEvENuE rESErvES
In $ millions 2013 2012
Balance at 1 January 11,561 9,580Net profit attributable to shareholders 3,005 3,298
Amount available for distribution 14,566 12,878Less: Special dividend 1,800 1,200 4.7% tax exempt preference dividends (2012: 4.7% tax exempt) 117 117
Balance at 31 December 12,649 11,561
180 DBS AnnuAl RepoRt 2013

DIrECTorS’ rEporT
The Directors are pleased to submit their report to the Members together with the audited consolidated financial statements of DBS Group Holdings Ltd (the Company or DBSH) and its subsidiaries (the Group) and the balance sheet of the Company for the financial year ended 31 December 2013, which have been prepared in accordance with the provisions of the Companies Act, Chapter 50 (the Companies Act) and Singapore Financial Reporting Standards, as modified by the requirements of Notice to Banks No. 612 “Credit Files, Grading and Provisioning” issued by the Monetary Authority of Singapore.
BoArD oF DIrECTorS
The Directors in office at the date of this report are:Peter Seah Lim Huat – ChairmanPiyush Gupta – Chief Executive OfficerBart Joseph BroadmanEuleen Goh Yiu KiangHo Tian YeeNihal Vijaya Devadas Kaviratne CBEAndre SekulicDanny Teoh Leong KayWoo Foong Pheng (Mrs Ow Foong Pheng)
Mr Piyush Gupta, Dr Bart Joseph Broadman and Mr Ho Tian Yee will retire in accordance with Article 95 of the Company’s Articles of Association at the forthcoming annual general meeting (AGM) and will offer themselves for re-election at the AGM.
Mr Nihal Vijaya Devadas Kaviratne CBE, who will be attaining the age of 70 years before the forthcoming AGM, is required to retire pursuant to Section 153 of the Companies Act. As such, Mr Nihal Kaviratne CBE has to be re-appointed by the Members at the forthcoming AGM to continue in office as a director until the next AGM.
ArrANGEMENTS To ENABLE DIrECTorS To ACquIrE SHArES or DEBENTurES
Neither at the end of nor at any time during the financial year, was the Company a party to any arrangement, the object of which is to enable the directors to acquire benefits through the acquisition of shares in or debentures of the Company or any other body corporate, save as disclosed in this report.
DIrECTorS’ INTErEST IN SHArES or DEBENTurES
The following directors, who held office at the end of the financial year, had, according to the register of directors’ shareholdings required to be kept under Section 164 of the Companies Act, an interest in shares of the Company and related corporations as stated below:
Holdings in which Holdings in which Directors are deemed Directors have a direct interest to have an interest
As at As at As at As at 31 Dec 2013 1 Jan 2013 31 Dec 2013 1 Jan 2013
DBS Group Holdings Ltd (DBSH) ordinary sharesPeter Seah 38,532 16,306 – –Piyush Gupta 200,140 100,576 118,000 118,000Bart Broadman 15,449 10,000 – –Euleen Goh 12,545 4,185 – –Ho Tian Yee 3,444 – – –Nihal Kaviratne CBE 4,767 300 – –Andre Sekulic 2,693 – – –Danny Teoh 11,540 6,000 18,723 18,427Ow Foong Pheng 4,257 4,120 – –
181Financial StatementS
DBS Group Holdings Ltd and its Subsidiaries
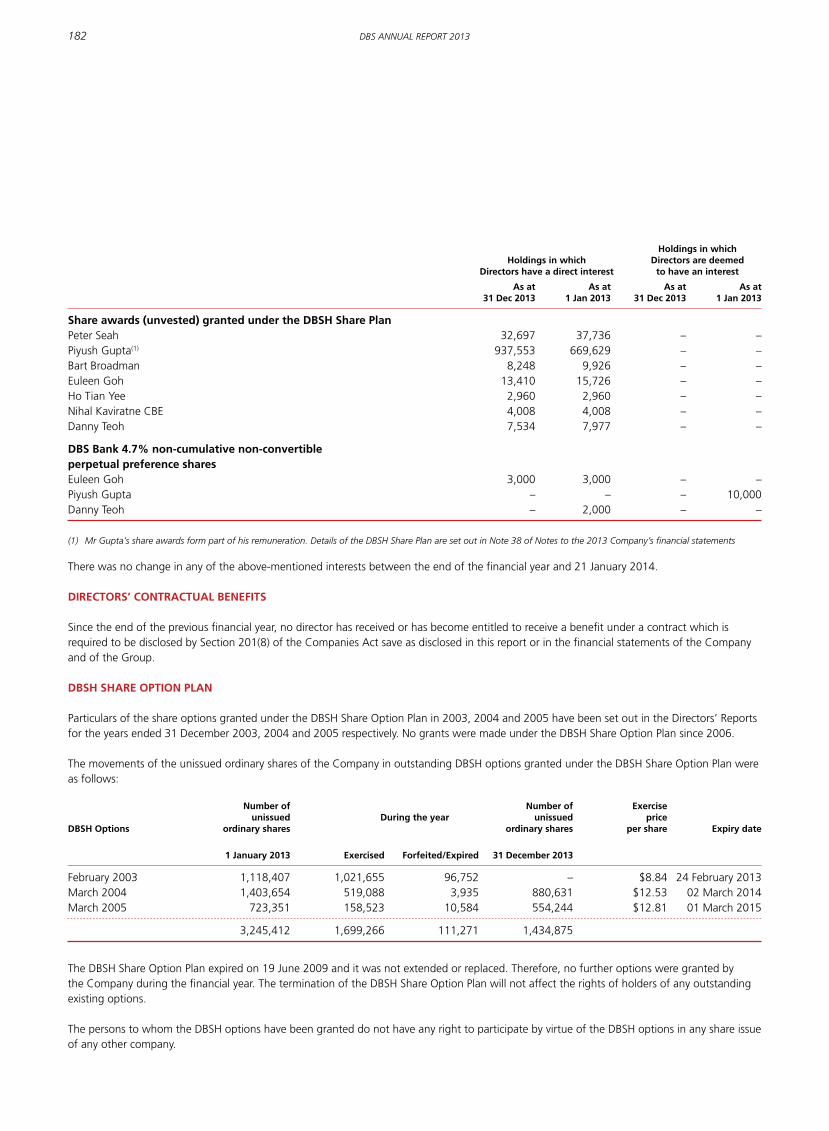
Holdings in which Holdings in which Directors are deemed Directors have a direct interest to have an interest
As at As at As at As at 31 Dec 2013 1 Jan 2013 31 Dec 2013 1 Jan 2013
Share awards (unvested) granted under the DBSH Share planPeter Seah 32,697 37,736 – –Piyush Gupta(1) 937,553 669,629 – –Bart Broadman 8,248 9,926 – –Euleen Goh 13,410 15,726 – –Ho Tian Yee 2,960 2,960 – –Nihal Kaviratne CBE 4,008 4,008 – –Danny Teoh 7,534 7,977 – –
DBS Bank 4.7% non-cumulative non-convertibleperpetual preference sharesEuleen Goh 3,000 3,000 – –Piyush Gupta – – – 10,000Danny Teoh – 2,000 – –
(1) Mr Gupta’s share awards form part of his remuneration. Details of the DBSH Share Plan are set out in Note 38 of Notes to the 2013 Company’s financial statements
There was no change in any of the above-mentioned interests between the end of the financial year and 21 January 2014.
DIrECTorS’ CoNTrACTuAL BENEFITS
Since the end of the previous financial year, no director has received or has become entitled to receive a benefit under a contract which is required to be disclosed by Section 201(8) of the Companies Act save as disclosed in this report or in the financial statements of the Company and of the Group.
DBSH SHArE opTIoN pLAN
Particulars of the share options granted under the DBSH Share Option Plan in 2003, 2004 and 2005 have been set out in the Directors’ Reports for the years ended 31 December 2003, 2004 and 2005 respectively. No grants were made under the DBSH Share Option Plan since 2006.
The movements of the unissued ordinary shares of the Company in outstanding DBSH options granted under the DBSH Share Option Plan were as follows:
Number of Number of Exercise unissued During the year unissued priceDBSH options ordinary shares ordinary shares per share Expiry date
1 January 2013 Exercised Forfeited/Expired 31 December 2013
February 2003 1,118,407 1,021,655 96,752 – $8.84 24 February 2013March 2004 1,403,654 519,088 3,935 880,631 $12.53 02 March 2014March 2005 723,351 158,523 10,584 554,244 $12.81 01 March 2015
3,245,412 1,699,266 111,271 1,434,875
The DBSH Share Option Plan expired on 19 June 2009 and it was not extended or replaced. Therefore, no further options were granted by the Company during the financial year. The termination of the DBSH Share Option Plan will not affect the rights of holders of any outstanding existing options.
The persons to whom the DBSH options have been granted do not have any right to participate by virtue of the DBSH options in any share issue of any other company.
182 DBS AnnuAl RepoRt 2013

DBSH SHArE pLAN
During the financial year, time-based awards in respect of an aggregate of 5,741,878 ordinary shares were granted pursuant to the DBSH Share Plan, to selected employees of the Group. This included 367,488 ordinary shares comprised in awards granted to executive director Mr Piyush Gupta, which formed part of his remuneration. During the financial year, certain non-executive directors received an aggregate of 41,815 ordinary shares comprised in time-based awards, which formed part of their directors’ fees. Details are set out below.
Share awards granted during Share awards vested duringDirectors of the Company the financial year ended 31 December 2013 the financial year ended 31 December 2013
Peter Seah(2) 16,299 21,338Piyush Gupta 367,488(1) 99,564Bart Broadman(2) 3,771 5,449Euleen Goh(2) 6,044 8,360Ho Tian Yee(2) 3,444 3,444Nihal Kaviratne CBE(2) 4,467 4,467Andre Sekulic(2) 2,693 2,693Danny Teoh(2) 5,097 5,540
(1) Mr Gupta’s awards formed part of his remuneration for 2012(2) The awards of these non-executive directors formed part of their directors’ fees for 2012, which had been approved by the shareholders at DBSH’s Annual General
Meeting held on 29 April 2013
Information on the DBSH Share Plan is as follows:
(i) Awards over DBSH’s ordinary shares may be granted to DBSH Group executives who hold such rank as may be determined by the Compensation and Management Development Committee of DBSH from time to time. Awards may also be granted to (amongst others) executives of associated companies of DBSH who hold such rank as may be determined by the Compensation and Management Development Committee from time to time, and non-executive directors of DBSH.
The participants of the DBSH Share Plan shall not be eligible to participate in the DBSH Employee Share Plan or other equivalent plans.
(ii) Where time-based awards are granted, participants are awarded ordinary shares of DBSH, their equivalent cash value or a combination of both as part of their deferred bonus, at the end of the prescribed vesting periods. Awards are granted under the DBSH Share Plan at the absolute discretion of the Compensation and Management Development Committee.
(iii) The DBSH Share Plan shall continue to be in force at the discretion of the Compensation and Management Development Committee, subject to a maximum period of ten years. At an Extraordinary General Meeting held on 8 April 2009, the DBSH Share Plan was extended for another ten years, from 18 September 2009 to 17 September 2019, provided always that the DBSH Share Plan may continue beyond the above stipulated period with the approval of the shareholders of DBSH by ordinary resolution in general meeting and of any relevant authorities which may then be required.
(iv) Awards under the DBSH Share Plan may be granted at any time in the course of a financial year, and may lapse by reason of cessation of service of the participant, or the retirement, redundancy, ill health, injury, disability, death, bankruptcy or misconduct of the participant, or by reason of the participant, being a non-executive director, ceasing to be a director, or in the event of a take-over, winding up or reconstruction of DBSH.
(v) Subject to the prevailing legislation and the rules of the Singapore Exchange Securities Trading Limited, DBSH will have the flexibility to deliver ordinary shares of DBSH to participants upon vesting of their awards by way of an issue of new ordinary shares and/or the transfer of existing ordinary shares (which may include ordinary shares held by the Company in treasury).
(vi) The class and/or number of ordinary shares of DBSH comprised in an award to the extent not yet vested, and/or which may be granted to participants, are subject to adjustment by reason of any variation in the ordinary share capital of DBSH (whether by way of a capitalisation of profits or reserves or rights issue, reduction, subdivision, consolidation, or distribution) or if DBSH makes a capital distribution or a declaration of a special dividend (whether in cash or in specie), upon the written confirmation of the auditor of DBSH that such adjustment (other than in the case of a capitalisation issue) is fair and reasonable.
183Financial StatementS

AuDIT CoMMITTEE
The Audit Committee comprised non-executive directors Mr Danny Teoh (Chairman), Mr Nihal Kaviratne CBE, Mr Peter Seah, Mr Andre Sekulic and Mrs Ow Foong Pheng.
The Audit Committee performed its functions in accordance with the Companies Act, the SGX-ST Listing Manual, the Banking (Corporate Governance) Regulations 2005, the MAS Guidelines for Corporate Governance and the Code of Corporate Governance, which include, inter alia, the following:
(i) reviewing the Group’s consolidated financial statements and financial announcements prior to submission to the Board;
(ii) reviewing the adequacy and effectiveness of the Group’s internal controls;
(iii) reviewing with the external auditor, its audit plan, its audit report, its evaluation of the internal accounting controls of DBS and assistance given by the management to the external auditor;
(iv) reviewing the internal auditor’s plans and the scope and results of audits; and
(v) overseeing the adequacy and effectiveness of the internal audit function, and the effectiveness, independence and objectivity of the external auditor.
In its review of the audited financial statements for the financial year ended 31 December 2013, the Audit Committee has discussed with management and the external auditor the accounting principles that were applied and their judgement on the items that might affect the financials. Based on the review and discussions with management and the external auditor, the Audit Committee is of the view that the financial statements are fairly presented in conformity with generally accepted accounting principles in all material aspects.
The Audit Committee has received the requisite information from PricewaterhouseCoopers LLP (PwC) and has considered the financial, business and professional relationship between PwC and the Group. It is of the view that such relationship is compatible with maintaining PwC’s independence.
The Audit Committee recommends to the Board of Directors the re-appointment of PwC as independent external auditor at the forthcoming Annual General Meeting of the Company on 28 April 2014.
INDEpENDENT AuDITor
PricewaterhouseCoopers LLP has expressed its willingness to accept re-appointment as independent external auditor.
On behalf of the Directors
peter Seah Lim Huat
piyush Gupta
13 February 2014Singapore
184 DBS AnnuAl RepoRt 2013

STATEMENT By THE DIrECTorS
We, Peter Seah Lim Huat and Piyush Gupta, being two of the Directors of DBS Group Holdings Ltd (the Company), state that, in the opinion of the Directors, the consolidated financial statements of the Group, consisting of the Company and its subsidiaries and the balance sheet of the Company, together with the notes thereon, as set out on pages 110 to 175, are drawn up so as to give a true and fair view of the state of affairs of the Company and the Group as at 31 December 2013, and the results, changes in equity and cash flows of the Group for the financial year ended on that date and there are reasonable grounds to believe that the Company and the Group will be able to pay their debts as and when they fall due.
On behalf of the Directors
peter Seah Lim Huat
piyush Gupta
13 February 2014Singapore
185Financial StatementS
DBS Group Holdings Ltd and its Subsidiaries

INDEpENDENT AuDITor’S rEporT
To THE MEMBErS oF DBS Group HoLDINGS LTD (INCorporATED IN SINGAporE)
rEporT oN THE FINANCIAL STATEMENTS
We have audited the accompanying financial statements of DBS Group Holdings Ltd (the “Company”) and its subsidiaries (the “Group”) set out on pages 110 to 175, which comprise the consolidated balance sheet of the Group and balance sheet of the Company as at 31 December 2013, the consolidated income statement, statement of comprehensive income, statement of changes in equity and statement of cash flows of the Group for the financial year then ended, and a summary of significant accounting policies and other explanatory information.
management’s responsibility for the financial statementsManagement is responsible for the preparation of financial statements that give a true and fair view in accordance with the provisions of the Singapore Companies Act (the “Act”) and Singapore Financial Reporting Standards, and for devising and maintaining a system of internal accounting controls sufficient to provide a reasonable assurance that assets are safeguarded against loss from unauthorised use or disposition; and transactions are properly authorised and that they are recorded as necessary to permit the preparation of true and fair profit and loss accounts and balance sheets and to maintain accountability of assets.
auditor’s responsibilityOur responsibility is to express an opinion on these financial statements based on our audit. We conducted our audit in accordance with Singapore Standards on Auditing. Those standards require that we comply with ethical requirements and plan and perform the audit to obtain reasonable assurance about whether the financial statements are free from material misstatement.
An audit involves performing procedures to obtain audit evidence about the amounts and disclosures in the financial statements. The procedures selected depend on the auditor’s judgement, including the assessment of the risks of material misstatement of the financial statements, whether due to fraud or error. In making those risk assessments, the auditor considers internal control relevant to the entity’s preparation of financial statements that give a true and fair view in order to design audit procedures that are appropriate in the circumstances, but not for the purpose of expressing an opinion on the effectiveness of the entity’s internal control. An audit also includes evaluating the appropriateness of accounting policies used and the reasonableness of accounting estimates made by management, as well as evaluating the overall presentation of the financial statements.
We believe that the audit evidence we have obtained is sufficient and appropriate to provide a basis for our audit opinion.
OpinionIn our opinion, the consolidated financial statements of the Group and the balance sheet of the Company are properly drawn up in accordance with the provisions of the Act and Singapore Financial Reporting Standards, including the modification of the requirements of FRS 39 Financial Instruments: Recognition and Measurement in respect of loan loss provisioning by Notice to Banks No. 612 “Credit Files, Grading and Provisioning” issued by Monetary Authority of Singapore, so as to give a true and fair view of the state of affairs of the Group and of the Company as at 31 December 2013, and the results, changes in equity and cash flows of the Group for the financial year ended on that date.
rEporT oN oTHEr LEGAL AND rEGuLATory rEquIrEMENTS
In our opinion, the accounting and other records required by the Act to be kept by the Company and by those subsidiaries incorporated in Singapore of which we are the auditors, have been properly kept in accordance with the provisions of the Act.
pricewaterhouseCoopers LLpPublic Accountants and Chartered Accountants
13 February 2014Singapore
186 DBS AnnuAl RepoRt 2013
DBS Group Holdings ltd and its Subsidiaries

FIVE-YEAR SUMMARY
Group 2013 2012 2011 2010 2009
Selected income statement items ($ millions)
Total income 8,927 8,064 7,631 7,066 6,603 Profit before allowances 5,009 4,450 4,328 4,141 3,999 Allowances 770 417 722 911 1,529 Profit before tax 4,318 4,157 3,733 3,332 2,536 Net profit excluding one-time items and goodwill charges 3,501 3,359 3,035 2,650 2,064 One-time items (1) 171 450 – – (23)Goodwill charges – – – 1,018 – Net profit 3,672 3,809 3,035 1,632 2,041
Selected balance sheet items ($ millions)Total assets 402,008 353,033 340,847 283,710 258,644 Customer loans 248,654 210,519 194,720 152,094 130,583 Total liabilities 364,322 317,035 307,778 250,608 229,145 Customer deposits(2) 292,365 253,464 225,346 193,692 183,432 Total shareholders’ funds 34,233 31,737 28,794 26,599 25,373
Per ordinary share ($) Earnings excluding one-time items and goodwill charges 1.43 1.39 1.30 1.15 0.91 Earnings 1.50 1.57 1.30 0.70 0.90 Net asset value 13.61 12.96 11.99 11.25 10.85 Dividends 0.58 0.56 0.56 0.56 0.56
Selected financial ratios (%)Dividend cover for ordinary shares (number of times) 2.58 2.79 2.28 1.25 1.57 Net interest margin 1.62 1.70 1.77 1.84 2.02Cost-to-income 43.9 44.8 43.3 41.4 39.4 Return on assets(3) 0.91 0.97 0.97 0.98 0.80 Return on shareholders’ funds(3)(4) 10.8 11.2 11.0 10.2 8.4 Loan/deposit ratio 85.0 83.1 86.4 78.5 71.2Non-performing loan rate 1.1 1.2 1.3 1.9 2.9 Loss allowance coverage 135 142 126 100 83 Capital adequacy(5)
Common Equity Tier 1 – Transitional 13.7 – – – – Common Equity Tier 1 – Final 11.9 – – – – Tier I 13.7 14.0 12.9 15.1 13.1 Total 16.3 17.1 15.8 18.4 16.7
(1) One-time items include gains on sale of investments, impairment charges for investments, and an amount set aside to establish the DBS Foundation (2) Includes deposits related to fund management activities of institutional investors from 2012 onwards. Prior to 2012, these deposits were classified as ”Due to Banks”(3) Excluding one-time items and goodwill charges(4) Calculated based on net profit attributable to the shareholders net of dividends on preference shares and other equity instruments. Non-controlling interests, preference
shares and other equity instruments are not included as equity in the computation of return of equity(5) With effect from 1 January 2013, Basel III capital adequacy requirements came into effect in Singapore. Changes due to Basel III affected both eligible capital and risk-
weighted assets. Unless otherwise stated, capital adequacy disclosures relating to dates prior to 1 January 2013 are calculated in accordance with the then prevailing capital adequacy regulations and are thus not directly comparable to those pertaining to dates from 1 January 2013
187
BoARd oF dIREctoRSas at 28 February 2014
Piyush Gupta, 54Chief Executive OfficerExecutive and Non-Independent Director
Post Graduate Diploma in ManagementIndian Institute of Management, Ahmedabad, India
Bachelor of Arts, EconomicsUniversity of Delhi, India
• Date of first appointment as a director: 9 November 2009• Date of last re-election as a director: 25 April 2012• Length of service as a director: 4 years 3 months
Board committee(s) served on: Executive Committee (Member)
Present directorships:Other Listed Companies
Nil
Other Principal Commitments
• DBS Bank Ltd Chief Executive Officer & Director• DBS Bank (Hong Kong) Limited Vice Chairman• The Islamic Bank of Asia Limited Director• Human Capital Leadership Institute Board Member• Institute of International Finance, Washington Board Member• Dr Goh Keng Swee Scholarship Fund Director• MasterCard Asia/Pacific, Middle East and Africa - Regional Advisory Board Director• Asian Bureau of Finance and Economic Research Council Member• Singapore Business Federation Council Member• The Association of Banks in Singapore Council Member• The Institute of Banking & Finance Council Member• Sim Kee Boon Institute for Financial Economics Member, Advisory Board• Indian Business-leaders Roundtable under Singapore Indian Development Association (SINDA) Member, Managing Council
Past directorships in listed companies heldover the preceding 3 years:
Nil
Peter Seah Lim Huat, 67ChairmanNon-Executive and Independent Director
Bachelor of Business Administration (Honours)National University of Singapore
• Date of first appointment as a director: 16 November 2009
• Date of appointment as Chairman: 1 May 2010
• Date of last re-election as a director: 25 April 2012
• Length of service as a director: 4 years 3 months
Board committee(s) served on: Compensation and Management Development Committee (Chairman)Executive Committee (Chairman)Nominating Committee (Chairman)Audit Committee (Member)Board Risk Management Committee (Member)
Present directorships:Other Listed Companies
• CapitaLand Limited Deputy Chairman• Level 3 Communications Inc Director• StarHub Ltd Director• STATS ChipPAC Ltd Director
Other Principal Commitments
• DBS Bank Ltd Chairman• DBS Bank (Hong Kong) Limited Chairman• GIC Private Limited Director• Asia Mobile Holdings Pte Ltd Director• Fullerton Financial Holdings Pte Ltd Director• LaSalle College of the Arts Limited Chairman• Singapore Health Services Pte Ltd Chairman• STT Communications Ltd Deputy Chairman
Past directorships in listed companies heldover the preceding 3 years:
• Singapore Technologies Engineering Ltd Chairman
188 DBS AnnuAl RepoRt 2013

Bart Joseph Broadman, 52Non-Executiveand Independent Director
Bachelor of Science in Agricultural Science and ManagementUniversity of California at Davis
MBA in Financial EconomicsUniversity of Southern California, Graduate School of Business
Ph.D in Financial EconomicsUniversity of Southern California, Graduate School of Business
• Date of first appointment as a director: 17 December 2008• Date of last re-election as a director: 28 April 2011• Length of service as a director: 5 years 3 months
Board committee(s) served on: Board Risk Management Committee (Member)Compensation and Management Development Committee (Member)
Present directorships:Other Listed Companies
Nil
Other Principal Commitments
• DBS Bank Ltd Director• Alphadyne Asset Management Pte Ltd Director• Alphadyne (UK) Holdings Limited Director• Alphadyne Asset Management, LLC Managing Member• Monetary Authority of Singapore Member, Financial Research Council• Nanyang Technological University Member, Investment Committee
Past directorships in listed companies heldover the preceding 3 years:
Nil
Euleen Goh Yiu Kiang, 58Non-Executiveand Independent Director
Member of the following institutions:Institute of Chartered Accountants in England and WalesChartered Institute of Taxation, UKInstitute of Certified Public Accountants of SingaporeInstitute of Financial Services, UK
• Date of first appointment as a director: 1 December 2008• Date of last re-election as a director: 29 April 2013• Length of service as a director: 5 years 3 months
Board committee(s) served on: Board Risk Management Committee (Chairman)Compensation and Management Development Committee (Member)Executive Committee (Member)Nominating Committee (Member)
Present directorships:Other Listed Companies
• CapitaLand Limited Director• SATS Ltd Director
Other Principal Commitments
• DBS Bank Ltd Director• DBS Foundation Ltd Chairman• NorthLight School Chairman,
Board of Governors• Singapore Chinese Girls’ School Chairman• Singapore International Foundation Chairman,
Board of Governors• NUS Business School Member, Management
Advisory Board• Singapore Institute of
International Affairs Trustee, Endowment Fund
Past directorships in listed companies heldover the preceding 3 years:
• Aviva PLC Director• Singapore Airlines Limited Director• Singapore Exchange Limited Director
189BOard Of direCtOrs
Nihal Vijaya devadas Kaviratne cBE, 69Non-Executiveand Independent Director
Bachelor of Arts, Economics (Honours)Bombay University, India
• Date of first appointment as a director: 29 April 2011• Date of last re-election as a director: 25 April 2012• Length of service as a director: 2 years 10 months
Board committee(s) served on: Audit Committee (Member)Board Risk Management Committee (Member)
Present directorships:Other Listed Companies
• Akzo Nobel India Limited Chairman• GlaxoSmithKline Pharmaceuticals Ltd Director• SATS Ltd Director• StarHub Ltd Director
Other Principal Commitments
• DBS Bank Ltd Director• DBS Foundation Ltd Director• TVS Motor (Singapore) Pte. Limited Director• Wildlife Reserves Singapore Pte Ltd Director• PT TVS Motor Company President Commissioner• Bain & Company SE Asia, Inc Member, Advisory
Board for South East Asia/Indonesia
Past directorships in listed companies heldover the preceding 3 years:
• Titan Industries Ltd (now known as Titan Company Limited) Director
Ho tian Yee, 61Non-Executiveand Independent Director
Bachelor of Arts (Honours), Economics (CNAA)Portsmouth University, UK
• Date of first appointment as a director: 29 April 2011• Date of last re-election as a director: 25 April 2012• Length of service as a director: 2 years 10 months
Board committee(s) served on: Board Risk Management Committee (Member)Nominating Committee (Member)
Present directorships:Other Listed Companies
• SP AusNet(1) Director
Other Principal Commitments
• DBS Bank Ltd Director• Pacific Asset Management (S) Pte Ltd Managing Director• Fullerton Fund Management Co. Ltd Director• Hexa-Team Planners Pte Ltd Director• Singapore Power Ltd Director• Blue Edge Advisors Pte. Ltd. Investment Advisor
Past directorships in listed companies heldover the preceding 3 years:
• Fraser and Neave Limited Director• Singapore Exchange Limited Director
(1) SP AusNet, a stapled security, comprises SP Australia Networks (Distribution) Ltd, SP Australia Networks (RE) Ltd and SP Australia Networks (Transmission) Ltd.
190 DBS AnnuAl RepoRt 2013

danny teoh Leong Kay, 58Non-Executiveand Independent Director
Institute of Chartered Accountants in England and WalesAssociate Member
Newcastle-upon-Tyne Polytechnic, EnglandDiploma in Accounting
• Date of first appointment as a director: 1 October 2010• Date of last re-election as a director: 29 April 2013• Length of service as a director: 3 years 5 months
Board committee(s) served on: Audit Committee (Chairman)Board Risk Management Committee (Member)Nominating Committee (Member)
Present directorships:Other Listed Companies
• Keppel Corporation Limited Director• CapitaMall Trust Management Limited
(the Manager of CapitaMall Trust) Director
Other Principal Commitments
• DBS Bank Ltd Director• DBS Bank (China) Limited Director• DBS Foundation Ltd Director• Changi Airport Group (Singapore) Pte Ltd Director• JTC Corporation Director• Singapore Olympic Foundation Director
Past directorships in listed companies heldover the preceding 3 years:
Nil
Andre Sekulic, 63Non-Executiveand Independent Director
University of Sydney
• Date of first appointment as a director: 26 April 2012• Date of last re-election as a director: 29 April 2013• Length of service as a director: 1 year 10 months
Board committee(s) served on: Audit Committee (Member)Compensation and Management Development Committee (Member)
Present directorships:Other Listed Companies
Nil
Other Principal Commitments
• DBS Bank Ltd Director• comGateway (S) Pte Ltd Chairman• PSP International (Europe) Limited Chairman• Hussar Pty Ltd Director• Insourcing International Pty Ltd Director• PSP IP Pty Ltd Director• Queenstar Pty Ltd Director
Past directorships in listed companies heldover the preceding 3 years:
Nil
191BOard Of direCtOrs

Woo Foong Pheng (Mrs ow Foong Pheng), 50Non-Executiveand Non-Independent Director
Master of Science in Management Stanford University, USA
Bachelor of Arts, Politics, Philosophy and EconomicsSt John’s College, Oxford University
• Date of first appointment as a director: 26 April 2012• Date of last re-election as a director: 29 April 2013• Length of service as a director: 1 year 10 months
Board committee(s) served on: Audit Committee (Member)Nominating Committee (Member)
Present directorships:Other Listed Companies
• Mapletree Greater China Commercial Trust Management Ltd (the Manager of Mapletree Greater China Commercial Trust) Director
Other Principal Commitments
• DBS Bank Ltd Director• Ministry of Trade and Industry Permanent Secretary
Past directorships in listed companies heldover the preceding 3 years:
Nil
192 DBS AnnuAl RepoRt 2013

GRoUP MANAGEMENt coMMIttEE
1 Piyush Gupta*Chief Executive OfficerPiyush is Chief Executive Officer and Director of DBS Group, as well as Director of DBS Bank (Hong Kong) and The Islamic Bank of Asia. Prior to joining DBS, he was Citigroup’s Chief Executive Officer for South East Asia, Australia and New Zealand. His external appointments include serving on the boards of the Institute of International Finance, Washington, The Institute of Banking and Finance, Dr Goh Keng Swee Scholarship Fund, the MasterCard Asia/Pacific, Middle East and Africa Regional Advisory Board and Human Capital Leadership Institute.
2 Eric Ang Capital MarketsEric started his career with DBS in 1978 and is currently responsible for Capital Markets. Within the DBS Group, he serves on a number of boards including DBS Asia Capital, Hwang-DBS (Malaysia) Berhad and The Islamic Bank of Asia.
3 Sanjiv Bhasin DBS IndiaSanjiv is the country head of DBS Bank Ltd, India, a role he has held since 2008. A seasoned banker, Sanjiv started his career with HSBC India in 1979 where he was previously Chief Operating Officer. Sanjiv has worked in various capacities spanning corporate, investment banking, credit and risk management in India, London and Mauritius. Before joining DBS, he was the CEO and Managing Director of Rabo India Finance.
4 Jerry chen DBS TaiwanJerry is the country head of DBS Bank Ltd, Taiwan. Prior to joining DBS in 2008, he was the President of Ta Chong Bank for four years, during which he significantly increased the bank’s asset quality to attract foreign investments. Jerry has extensive experience in Corporate Banking, Consumer Banking and Treasury businesses and spent over 25 years in Citibank, Taiwan.
5 chng Sok Hui*Chief Financial OfficerSok Hui was awarded the DBS scholarship and joined DBS in 1983. She was appointed Group CFO in 2008, and prior to this appointment, she was Group Head of Risk Management for six years. She is the Supervisor of DBS Bank (China) Board and a board member of the Housing & Development Board, and the Inland Revenue Authority of Singapore. She has served on the Accounting Standards Council in Singapore since 2009. Sok Hui received the Best CFO award at the Singapore Corporate Awards 2013. Her professional qualifications include CFA / FRM / FICP / CA (Singapore).
6 domenic Fuda Consumer Banking and Wealth Management GroupDomenic is the Deputy Group Head for the Consumer & Wealth Management business. Domenic joined DBS in 2010 as CFO for the Consumer Banking Group. Prior to joining DBS, he spent over 16 years with Citigroup in a variety of senior management roles across business, risk management and finance. Domenic is a director of AXS Pte Ltd, Hutchison DBS Card Limited and Network for Electronic Transfers (Singapore) Pte Ltd (NETS).
7 Neil Ge DBS ChinaNeil is the country head of DBS Bank (China) Ltd. A seasoned banker, he has over 20 years of international experience spanning Beijing, Shanghai, Hong Kong, Tokyo and New York. Formerly Managing Director at Credit Suisse’s Shanghai office, Neil played an instrumental role in building up the joint venture between Credit Suisse and Founder Securities.
8 david Gledhill*Group Technology & OperationsDavid brings with him over 25 years of experience in the financial services industry and has spent over 20 years in Asia. Prior to joining DBS in 2008, he held progressively senior positions with regional responsibilities in JP Morgan where he was involved with several mergers, offshoring as well as the regionalisation of the bank’s operations. David is a Director of Singapore Clearing House Pte Ltd and a member of IBM Advisory Board.
9 Sue Lynn Koo Group Legal, Compliance & SecretariatSue Lynn oversees the legal, compliance and board support functions for DBS Group. Prior to joining DBS, she served as Managing Director and General Counsel of Korea Exchange Bank, and previously worked for Prudential Financial, Inc. and Morrison & Foerster LLP.
10 Lee Yan Hong Group Human ResourcesWith more than 25 years of Human Resources experience in a diverse range of industries, Yan Hong is responsible for driving the strategic people agenda of DBS Group. Prior to joining DBS in 2011, Yan Hong was Citigroup’s Managing Director of Human Resources, Singapore. She has also worked at General Motors and Hewlett Packard previously.
The Group Management Committee comprises a total of 19 members, including members of the Group Executive Committee.
193

11 Andrew Ng*Treasury and MarketsAndrew joined DBS in 2000 and has over 28 years of experience in the treasury business. Prior to joining DBS, he was Executive Director at Canadian Imperial Bank of Commerce (CIBC) from 1995 to 1999. He set up CIBC’s trading platform and derivative capabilities on Asian currencies. Between 1986 and 1995, Andrew was Head of North Asia Trading and Treasurer of Chase Manhattan Bank in Taipei.
12 Jimmy Ng Group AuditJimmy Ng is the Head of Group Audit at DBS Bank. In this role, he is responsible for strengthening the bank’s control environment, risk management and governance process. He has over 20 years of banking experience across a broad range of functions including T&O, Risk Management, Product Control and Audit. His international career has spanned multiple geographies including Singapore, London and Amsterdam, focusing on setting up of new functions and migration of cross border operations. Prior to DBS, he held progressively senior positions in Morgan Guaranty Trust Company of New York, ABN AMRO Bank and Royal Bank of Scotland.
13 Karen Ngui Group Strategic Marketing & CommunicationsKaren is responsible for corporate communications, brand management, strategic marketing and corporate social responsibility. She has over 25 years of experience in the financial sector and prior to joining DBS in 2005, was the Global Head of Brand Management and Strategic Marketing at Standard Chartered Bank. She sits on the Board of Governors of the Singapore International Foundation.
14 Sebastian Paredes*DBS Hong KongSebastian is the CEO of DBS Bank (Hong Kong) Ltd and DBS Hong Kong Branch. He is a non-executive Director of DBS China and a member of DBS Group Executive Committee. A banker of over 28 years, Sebastian has a strong track record in building franchises across multiple markets. Prior to joining DBS, Sebastian was President Director of PT Bank Danamon Indonesia where he solidified the bank’s position in retail, SME and micro finance. Prior to that, he spent 20 years at Citi in South America, Middle East, Europe and Africa.
15 Elbert Pattijn*Chief Risk OfficerElbert has been Chief Risk Officer for DBS since October 2008. Prior to that, he was Head of Specialised Corporate and Investment Banking at the bank. Before DBS, he was Head of Debt Products Origination, Asia for ING Bank. He has previously held the position of Head of Counterparty Risk, Country Risk, Risk Research and Modelling for ING Group in Amsterdam. Elbert has also worked for Barclays and ABN AMRO.
16 Sim S Lim*DBS SingaporeSim is the first DBS country head with dedicated oversight for Singapore. He is responsible for helping the bank to derive greater synergy and value across the Singapore franchise. He spent the bulk of his 31-year banking career in Asia, where he assumed a wide variety of roles. Prior to joining DBS, Sim was the President and CEO of Citigroup Global Markets Japan Inc.
17 tan Su Shan*Consumer Banking and Wealth Management GroupSu Shan is responsible for growing DBS’ regional wealth management and consumer banking business which encompasses DBS Private Bank, DBS Treasures Private Client, DBS Treasures and our regional consumer banking business. Prior to joining the bank, Su Shan was Morgan Stanley’s Head of Private Wealth Management for Southeast Asia. She has also worked at Citi Private Bank as the Region Head for Singapore, Malaysia and Brunei. Su Shan is the co-chairman of the Monetary Authority of Singapore Private Banking Advisory Group.
18 Melvin teo DBS IndonesiaPresident Director of PT Bank DBS Indonesia, Melvin is responsible for leading the team and driving business growth in Indonesia. Prior to this, he was the country head of DBS Bank (China) Limited. During his three-year stint as country head of China, Melvin successfully grew and strengthened the China franchise.
19 Jeanette Wong*Institutional Banking GroupJeanette oversees DBS’ corporate banking and global transaction services businesses. She was the CFO of DBS for five years before taking on her current responsibilities in 2008. Prior to joining DBS in 2003, Jeanette spent 16 years at JP Morgan. Jeanette chairs the board of DBS Bank (Taiwan) and is also on the boards of DBS Bank (China), Neptune Orient Lines and Singapore International Arbitration Centre. She also chairs the Advisory Board of SMU Lee Kong Chian School of Business.
Those marked by * are also in the Group Executive Committee.
194 DBS AnnuAl RepoRt 2013

INtERNAtIoNAL BANKING oFFIcES
cHINA
dBS Bank (china) Limited18th Floor dBS Bank tower 1318 Lu Jia Zui Ring Road Pudong Shanghai 200120 People’s Republic of china tel: (8621) 3896 8888 Fax: (8621) 3896 8989
HoNG KoNG
dBS Bank (Hong Kong) Limited11th Floor, the center 99 Queen’s Road central Hong Kong tel: (852) 3668 0808 Fax: (852) 2167 8222
dBS Bank Hong Kong Branch18th Floor, the center 99 Queen’s Road central Hong Kong tel: (852) 3668 1900 Fax: (852) 2596 0577
INdIA
dBS Bank IndiaFort House, 3rd Floor 221, dr. d.N. Road, Fort Mumbai 400001, India tel: (9122) 6638 8888 Fax: (9122) 6638 8899
INdoNESIA
Pt Bank dBS IndonesiadBS Bank tower, Lobby, 33rd – 37th floorciputra World 1Jalan Prof. dr. Satrio Kav 3-5Jakarta 12940, Indonesiatel: (6221) 2988 5000Fax: (6221) 2988 5005
JAPAN
dBS Bank tokyo Branch508 Yurakucho denki Building 7-1 Yurakucho 1-chome chiyoda-ku tokyo 1000006, Japan tel: (813) 3213 4411 Fax: (813) 3213 4415
KoREA
dBS Bank Seoul Branch18th Floor, Seoul Finance center 136 Sejong-daero Jung-Gu Seoul Republic of Korea tel: (822) 6322 2660 Fax: (822) 6322 2670
MAcAU
dBS Bank (Hong Kong) Macau BranchNos 5 a 7E da Rua de Santa clara, Edif. RibeiroLoja c e d., Macau tel: (853) 2832 9338Fax: (853) 2832 3711
MALAYSIA
dBS Bank Kuala Lumpur Representative office#08-01, Menara Keck Seng 203 Jalan Bukit Bintang 55100 Kuala Lumpur, Malaysia tel: (603) 2148 8338 Fax: (603) 2148 7338
dBS Bank Labuan BranchLevel 10 (A) Main office tower Financial Park Labuan Jalan Merdeka 87000 W.P. Labuan, Malaysia tel: (6087) 595 500 Fax: (6087) 423 376
195

MYANMAR
dBS Bank Myanmar Representative officeUnit 1002 Sakura tower, Level 10339 Bogyoke Aung San Road, Kyauktada townshipYangon Myanmartel: (951) 255 299 Fax: (951) 255 239
PHILIPPINES
dBS Bank Manila Representative office18th Floor, BPI Building Ayala Avenue corner Paseo de Roxas Makati city, the Philippines tel: (632) 845 5112 Fax: (632) 750 2144
tAIWAN
dBS Bank (taiwan) Limited17F, No. 36 Songren Road Xinyi district taipei city 110 R.o.c. tel: (8862) 6612 9889 Fax: (8862) 6612 9285
tHAILANd
dBS Bank Bangkok Representative office989 Siam tower 15th Floor Rama 1 Road, Pathumwan Bangkok 10330, thailand tel: (662) 658 1400-1 Fax: (662) 658 1402
UNItEd ARAB EMIRAtES
dBS Bank dIFc BranchSuite 5, 3rd Floor, Building 3 Gate Precinct, dIFc P.o. Box 506538 dubai, UAE tel: (971) 4364 1800 Fax: (971) 4364 1801
UNItEd KINGdoM
dBS Bank London Branch4th Floor, Paternoster House 65 St Paul’s churchyard London Ec4M 8AB, UK tel: (44 207) 489 6550 Fax: (44 207) 489 5850
UNItEd StAtES oF AMERIcA
dBS Bank Los Angeles Agency725 South Figueroa Street Suite 2000, Los Angeles cA 90017, USA tel: (1 213) 627 0222 Fax: (1 213) 627 0228
VIEtNAM
dBS Bank Hanoi Representative officeRoom 1404 14th Floor, Pacific Place 83B Ly thuong Kiet Street Hanoi, Vietnam tel: (844) 3946 1688 Fax: (844) 3946 1689
dBS Bank Ho chi Minh city Branch11th floor, Saigon centre 65 Le Loi Boulevard, district 1 Ho chi Minh city, Vietnam tel: (84 8) 3914 7888 Fax: (84 8) 3914 4488
196 DBS AnnuAl RepoRt 2013

dBS BANK Ltd (“dBS BANK”)12 Marina BoulevardMarina Bay Financial centre tower 3Singapore 018982tel: (65) 6878 8888100% owned by DBS Group Holdings Ltd
AXS PtE Ltd61 Mohamed Sultan Road#01-11 Sultan LinkSingapore 239001tel: (65) 6560 2727Fax: (65) 6636 455026.41% owned by DBS Bank and 59.77% owned by Primefield Company Pte Ltd, a wholly-owned subsidiary of DBS Bank
cENtRAL BoULEVARd dEVELoPMENt PtE. Ltd.8 Marina Boulevard #04-01 Marina Bay Financial centre tower 1Singapore 01898133% owned by Heedum Pte. Ltd., a wholly-owned subsidiary of DBS Bank
cHANGSHENG FUNd MANAGEMENt coMPANY LIMItEd21F Building A, chengjian Plaza18 Beitaipingzhuang RoadHaidian district, Beijing 100088People’s Republic of chinatel: (86 10) 8201 9988Fax: (86 10) 8225 598833% owned by DBS Bank
dBS ASIA cAPItAL LIMItEd 17th Floor, the center99 Queen’s Road centralHong Kongtel: (852) 3668 1148Fax: (852) 2868 0250100% owned by DBS Bank
dBS BANK (cHINA) LIMItEd18th Floor dBS Bank tower1318 Lu Jia Zui Ring RoadPudong, Shanghai 200120People’s Republic of chinatel: (86 21) 3896 8888Fax: (86 21) 3896 8989100% owned by DBS Bank
dBS BANK (HoNG KoNG) LIMItEd 11th Floor, the center99 Queen’s Road centralHong Kongtel: (852) 3668 0808 Fax: (852) 2167 8222100% owned by DBS Diamond Holdings Ltd, a wholly-owned subsidiary of DBS Bank
dBS BANK (tAIWAN) Ltd15th, 16th, 17th Floor, No. 32 & 36 Songren RoadXinyi district, 110 taipei citytaiwan, R.o.c.tel: (886 2) 6612 9889Fax: (886 2) 6612 9285100% owned by DBS Bank
dBS NoMINEES (PRIVAtE) LIMItEd12 Marina BoulevardMarina Bay Financial centre tower 3Singapore 018982tel: (65) 6878 8888Fax: (65) 6338 8936100% owned by DBS Bank
dBS tRUStEE LIMItEd 12 Marina BoulevardMarina Bay Financial centre tower 3Singapore 018982tel: (65) 6878 8888Fax: (65) 6878 3977100% owned by DBS Bank
dBS VIcKERS SEcURItIES (SINGAPoRE) PtE Ltd 12 Marina Boulevard Level 3Marina Bay Financial centre tower 3Singapore 018982tel: (65) 6327 2288100% owned by DBS Vickers Securities Holdings Pte Ltd, a wholly-owned subsidiary of DBS Bank DBS Vickers Securities (Singapore) Pte Ltd is the main operating entity in Singapore of the DBS Vickers Group, which has operations of varying scope and complexity in other jurisdictions including Hong Kong, Indonesia, Thailand, Malaysia and the US.
dBSN SERVIcES PtE. Ltd. 12 Marina BoulevardMarina Bay Financial centre tower 3Singapore 018982tel: (65) 6878 8888Fax: (65) 6338 8936100% owned by DBS Bank
HUtcHISoN dBS cARd LIMItEd22nd Floor, Hutchison House10 Harcourt RoadHong Kongtel: (852) 2128 1188Fax: (852) 2128 170550% owned by DBS Bank (Hong Kong) Limited
HWANG-dBS (MALAYSIA) BHdLevel 8, Wisma Sri Pinang60 Green Hall, 10200 PenangMalaysiatel: (604) 263 6996Fax: (604) 263 95974.15% owned by DBS Bank and 23.51% owned by DBS Vickers Securities (Malaysia) Pte Ltd, an indirect wholly-owned subsidiary of DBS Bank
NEtWoRK FoR ELEctRoNIc tRANSFERS (SINGAPoRE) PtE Ltd298 tiong Bahru Road, #04-01/06central PlazaSingapore 168730tel: (65) 6272 0533Fax: (65) 6272 233433.33% owned by DBS Bank Pt BANK dBS INdoNESIAdBS Bank tower, Lobby 33rd to 37th Floor, ciputra World 1Jalan Prof. dr. Satrio Kav 3-5Jakarta 12940Indonesiatel: (62 21) 2988 5000Fax: (62 21) 2988 500599% owned by DBS Bank
tHE ISLAMIc BANK oF ASIA LIMItEd12 Marina Boulevard #15-03Marina Bay Financial centre tower 3 Singapore 018982tel: (65) 6878 5522Fax: (65) 6878 550050% owned by DBS Bank
MAIN SUBSIdIARIES & ASSocIAtEd coMPANIES
197

AWARdS ANd AccoLAdES
dBS GRoUP� Best Managed Bank, Asia-Pacific
– The Asian Banker
� Best CEO (Piyush Gupta), Asia-Pacific – The Asian Banker
� Lifetime Leadership Achievement Award (Peter Seah), Asia-Pacific – The Asian Banker
� Safest Bank in Asia – Global Finance
� Asia’s Best Brand – CMO Asia
� Asia’s Most Promising Brand in Banking – World Research & Consulting Corporation
� Best Investor Relations by CEO, Southeast Asia – Investor Relations Magazine
� Best Investor Relations in Finance, Southeast Asia – Investor Relations Magazine
� Best Brand in Singapore – Brand Finance � Best Domestic Bank, Singapore
– Alpha Southeast Asia
� Best Domestic Bank, Singapore – Asiamoney
� Best Domestic Bank, Singapore – Euromoney
� Best Domestic Bank, Singapore – FinanceAsia
� Best Managed Bank, Singapore – The Asian Banker
� Best Managed Company, Singapore – Asiamoney
� Best CEO, Singapore (Piyush Gupta) – The Asian Banker
� Best CEO, Singapore (Piyush Gupta) – The Business Times
� Best CEO, Singapore (Piyush Gupta) – FinanceAsia
� Best CFO, Singapore (Chng Sok Hui) – The Business Times
� Best Executive, Singapore (Piyush Gupta) – Asiamoney
� Asian Corporate Director Recognition Award, Singapore (Piyush Gupta) – Corporate Governance Asia
� Asia’s Icon in Corporate Governance, Singapore – Corporate Governance Asia
� Singapore Corporate Governance Award –
Securities Investors Association (Singapore)
� Internal Audit Excellence Award, Singapore – Securities Investors
Association (Singapore)
� Most Transparent Company for Finance, Singapore –
Securities Investors Association (Singapore)
� Top Gun CEO Designation Award, Singapore (Piyush Gupta) – Securities Investors Association (Singapore)
� Platinum Award, Most Engaging Annual Report Worldwide – LACP Awards
� Most Innovative Banking, Hong Kong – Global Banking & Finance Review
� Best CEO (Neil Ge), China – Global Finance
� Best Foreign Banker (Sanjiv Bhasin), India – The Sunday Standard
� Best Bank (with assets above Rp. 25-100 trillion), Indonesia – Investor Magazine
� Banking Efficiency Award, Indonesia – Bisnis Indonesia
INStItUtIoNAL BANKING � Loan of the Year, Asia-Pacific
(Focus Media) – IFR/IFR Asia
� Best LBO, Asia (Focus Media) – The Asset
� Best Leveraged Loan, Asia (Focus Media) – FinanceAsia
� Best Leveraged Financing, Asia (Focus Media) – Asiamoney
� Best Loan, Asia (Alibaba) – FinanceAsia
� Best Syndicated Loan, Asia (Alibaba) – Asiamoney
� Best Syndicated Loan, Asia (Alibaba) – The Asset
� Loan Deal of the Year, Asia (Alibaba) – The Banker
� Best Cross Border M&A, Asia (Shuanghui International Holdings) – The Asset
� M&A Deal of the Year, Asia (F&N) – The Banker
� Best Project Finance, Asia-Pacific (Nghi Son) – The Asset
� Best Deal of the Year, Asia-Pacific (Reliance) – Global Trade Review
� Healthcare Deal of the Year, Asia-Pacific (Bendigo Hospital) – Project Finance Magazine
� Petrochemical Deal of the Year, Asia-Pacific (Nghi Son) – Project Finance International
� Petrochemicals Deal of the Year, Asia-Pacific (Nghi Son) – Project Finance Magazine
� Ports Deal of the Year, Asia-Pacific (Botany & Kembla) – Project Finance Magazine
� PPP Deal of the Year, Asia-Pacific (Sydney Convention Centre) – Project Finance International
� PPP Deal of the Year, Asia-Pacific (Sydney Convention Centre) – Project Finance Magazine
� Refinancing Deal of the Year, Asia-Pacific (Senoko) – Project Finance Magazine
� Social Infrastructure Deal of the Year, Asia-Pacific (Bendigo Hospital) – Project Finance International
� Transport Deal of the Year, Asia-Pacific (NSW Ports) – Project Finance International
� Port Deal of the Year, Middle East & Africa (Mersin) – Project Finance International
� Best Deal for Minority Shareholders, Southeast Asia (F&N) – Alpha Southeast Asia
� Best Cross Border M&A Deal, Southeast Asia (F&N) – Alpha Southeast Asia
� Best Deal, Singapore (F&N) – FinanceAsia
� Best Domestic Investment Bank, Singapore – The Asset
� Best Investment Bank, Singapore – Alpha Southeast Asia
� Best Investment Bank, Singapore – FinanceAsia
� Best Investment Bank, Singapore – Global Finance
� Loan House of the Year, Singapore – IFR Asia
� Best M&A Advisory, Singapore – Euromoney
� Project Finance Bank of the Year, Singapore – Asian Banking & Finance
� SME Bank of the Year, Hong Kong – Asian Banking & Finance
� Best SME Bank, Hong Kong – Global Banking & Finance Review
� Best SME Partner, Hong Kong – HK General Chamber of Small & Medium Business
Firing On All Engines Across Businesses And Geographies
198 DBS AnnuAl RepoRt 2013

� Best Growth Syndication Institution, China – Shanghai Banking Association
� Best Deal, China (Alibaba) – Asiamoney
� Best Deal, China (Chongqing Grain) – Shanghai Banking Association
� Best Deal, China (Shuanghui International Holdings) – The Asset
� Best Foreign Bank, China – China Association of Small & Medium Enterprises
� Best Small Business Lending, China – Global Finance
� SME Banking Competitive Excellence Award, China – China Business Journal
� Loan House of the Year, Indonesia – IFR Asia
GLoBAL tRANSActIoN SERVIcES� Best Global Cash Management Bank,
Asia-Pacific – Asiamoney
� Best Bank for Emerging Corporates, Asia Pacific – The Asset
� Best in Receivables Financing, Asia-Pacific – East & Partners
� Most Innovative Transaction Bank, Asia-Pacific – The Banker
� Best Asian International Transaction Bank – The Asian Banker
� Best Online Cash Management in Asia – Global Finance
� Best Trade Finance Services in Asia – Global Finance
� Editor’s Triple Star: IDEAL 3.0 – The Asset
� Best Risk Management Solution, Middle East (Oman Trading International) – The Asset
� Best Transaction Bank, ASEAN – Alpha Southeast Asia
� Best in Working Capital and Trade Finance, Southeast Asia – The Asset
� Best Transaction Bank, Singapore – The Asset
� Best Cash Management Bank, Singapore – The Asian Banker
� Best Cash Management Bank, Singapore – The Asset
� Best Local Cash Management Bank, Singapore – Asiamoney
� Cash Management Bank of the Year, Singapore – Asian Banking & Finance
� Best Structured Trade Finance Bank, Singapore – The Asset
� Best Trade Finance Bank, Singapore – The Asset
� Best Trade Finance Bank, Singapore – The Corporate Treasurer
� Best Custodian Bank, Singapore – The Asset
� Best Sub-custodian Bank, Singapore – Global Finance
� Leading Counterparty Bank, Singapore – The Asian Banker
� Best Corporate/Institutional Internet Bank, Singapore – Global Finance
� Best Foreign Cash Management Bank, Hong Kong – Asiamoney
� Best Overall Domestic Cash Management Service, Hong Kong – Asiamoney
� Best Overall Cross-Border Cash Management Service, Hong Kong – Asiamoney
� Best E-Banking Implementation, Hong Kong (Aviva) – The Asset
� Best Foreign Cash Management Bank, China – Asiamoney
� Best Overall Domestic Cash Management Service, China – Asiamoney
� Best Overall Cross-Border Cash Management Service, China – Asiamoney
� Best Cash Management, China (Shanghai Huisheng Motors Corporation) – Eurofinance
� Best Working Capital Management, China (GA Holdings) – Eurofinance
� Most Innovative Treasury Solutions, China (Shanghai Huisheng Motors Corporation) – Eurofinance
� Top Funding Solutions, China (CNOOC) – Eurofinance
� Best E-Banking Implementation, China (China Automation Motor Group) – The Asset
� Best Cash Management Solution, China (Sumitomo Mitsui Finance and Leasing) – The Asset
� Best Liquidity Management Solution, China (Fortune Motor) – The Asset
� Best Trade Finance Solution, China (RMB Trade Settlement for Heilongjiang Oil) – The Asset
� Rising Star Transaction Bank, India – The Asset
� Best Foreign Cash Management Bank, India – Asiamoney
� Best Trade Finance Bank, India – The Asset
� Best Structured Trade Finance Solution, India (Sterling & Wilson Co-Gen Solutions) – The Asset
� Best Trade Finance Solution, India (Tecpro Systems) – The Asset
� Best Transaction Bank, Indonesia – The Asset
� Best MNC Bank for Treasury Working Capital Management, Indonesia – The Asset
� Best Foreign Cash Management Bank, Indonesia – Asiamoney
� Best Overall Cross-Border Cash Management Bank, Indonesia – Asiamoney
� Best Cash Management Solution, Indonesia (Multi Bintang) – The Asset
� Best Risk Management Solution, Indonesia (Kasih Industri) – The Asset
� Best Overall Domestic Cash Management Service, Taiwan – Asiamoney
� Best Overall Cross-Border Cash Management Service, Taiwan – Asiamoney
tREASURY & MARKEtS� Structured Finance Issue of the Year,
Asia-Pacific (TG Master) – IFR/IFR Asia
� Best Cross Border Securitisation, Asia (BMW Financial Services Korea) – The Asset
� Best Dim Sum Bond, Asia (21Vianet) – The Asset
� Best Foreign Exchange Bank, Southeast Asia – Global Finance
� Best Local Currency Bond Deal, Southeast Asia (Swiber Capital) – Alpha Southeast Asia
� House of the Year, Singapore – Asia Risk
� Derivatives House of the Year, Singapore – The Asset
� Best Foreign Exchange Bank, Singapore – Alpha Southeast Asia
• Best Foreign Exchange Bank, Singapore – FinanceAsia
199aWards aNd aCCOLades
� Best Foreign Exchange Bank, Singapore – Global Finance
� Foreign Exchange Bank of the Year, Singapore – Asian Banking & Finance
� Top Currency Products, Singapore – Asia Risk
� Top Interest Rate Products, Singapore – Asia Risk
� Best Bond House, Singapore – Alpha Southeast Asia
� Best Bond House, Singapore – FinanceAsia
� Best Domestic Bond House, Singapore – The Asset
� Bond House of the Year, Singapore – IFR Asia
� Best Domestic Debt House, Singapore – Asiamoney
� Best Debt Capital Markets, Singapore – Euromoney
� Best Compliant Trading Member in China – China Foreign Exchange Trade System
� Best Foreign Exchange Member in China – China Foreign Exchange Trade System
� Best Potential Market Maker in China – China Foreign Exchange Trade System
� Excellent Derivative Trading Member in China – China Foreign Exchange Trade System
� Excellent SPOT Trading Member in China – China Foreign Exchange Trade System
� Top 100 Banks in Interbank CNY Market – China Foreign Exchange Trade System
� House of the Year, India – Asia Risk
� Best Foreign Exchange Bank, Indonesia – Global Finance
� Best Deal, Taiwan (Advanced Semiconductor Engineering) – FinanceAsia
� Best Deal, Taiwan (Advanced Semiconductor Engineering) – The Asset
cAPItAL MARKEtS � Best REIT House, Asia – The Asset
� Best Islamic Equity, Asia (IHH Healthcare USD 2.2B IPO) – The Asset
� Best REIT, Asia (Mapletree) – The Asset
� Best Equity Deal, Southeast Asia (Mapletree) – Alpha Southeast Asia
� Best REIT Deal, Southeast Asia (Mapletree) – Alpha Southeast Asia
� Best Equity House, Singapore – Alpha Southeast Asia
� Best Equity House, Singapore – Asiamoney
� Best Equity House, Singapore – FinanceAsia
� Best Equity Finance, Singapore – Euromoney
� Equity House of the Year, Singapore – IFR Asia
� Distinguished Financial Industry Competent Professional: Corporate Finance, Singapore (Kan Shik Lum) – Institute of Banking and Finance Singapore
BRoKERAGE (dBS VIcKERS)� Top Telecommunications Stock Picker,
Asia (Sachin Mittal) – Wall Street Journal
� Best Broker, Southeast Asia – Alpha Southeast Asia
� Best Equity Broker, Singapore – International Finance Magazine
� Best Institutional Broker, Singapore – Alpha Southeast Asia
� Best Local Brokerage, Singapore – Asiamoney
� Best Overall Country Research, Singapore – Asiamoney
� Best Overall Sales Services, Singapore – Asiamoney
� Best Execution, Singapore – Asiamoney
� Best in Sales Trading, Singapore – Asiamoney
� Best Research Coverage for Strategy, Singapore – Asiamoney
� Best Research Coverage for Food, Beverage & Tobacco, Singapore – Asiamoney
� Best for Events and Conferences, Singapore – Asiamoney
� Best for Roadshows and Company Visits, Singapore – Asiamoney
� Top Earnings Estimator for Retail & Consumer Products, Singapore (Alfie Yeo) – Thomson Reuters/Starmine
� Best Research Coverage for Small Caps, Hong Kong – Asiamoney
� Top Stock Picker, Hong Kong (Carol Wu) – Wall Street Journal
� Best Research Coverage for Small Caps & Telecommunications Services, China – Asiamoney
coNSUMER BANKING GRoUP� Best Mobile Apps Strategy, Global
– MyPrivateBanking
� Asian Retail Bank of the Year – Retail Banker International
� Best PR/Guerilla Marketing Stunt, Asia (Driveshield) – Marketing Magazine
� Best Bank (POSB/DBS), Singapore – AsiaOne
� Domestic Retail Bank of the Year, Singapore – Asian Banking & Finance
� Top Bank Brand for e-Commerce Payments, Singapore – Brand Alliance
� Branch Innovation of the Year, Singapore (MBFC Branch) – Asian Banking & Finance
� Best Card-Based Loyalty Programme, Singapore – Marketing Magazine
� Best Credit/Debit Card, Singapore (POSB Everyday Card) – AsiaOne
� Best Integration of Mobile Apps, Singapore – Marketing Magazine
� Best Location-based Marketing, Singapore – Marketing Magazine
� Best Use of Experiential & Live Marketing, Singapore (Great DBS Touchdown) – Marketing Magazine
� Best Use of Multiple Mobile Channels, Singapore – Marketing Magazine
� Best Use of Social & Mobile, Singapore (DBS TravellerShield) – Marketing Magazine
� Excellence in Experiential & Event Marketing (DBS Driveshield) – Marketing Magazine
� SPRING Innovation Class Award, Singapore – SPRING Singapore
� Domestic Retail Bank of the Year, Hong Kong – Asian Banking & Finance
� Best Creative Design for Apps, Hong Kong – Marketing Magazine
� Best CRM & Loyalty Program, Hong Kong – Marketing Magazine
� Best mCommerce Solution, Hong Kong – Marketing Magazine
� Best Online Banking Initiative, Hong Kong – Asian Banking & Finance
� Best Use of Search Solution, Hong Kong (Loans Always On) – Yahoo!
200 DBS AnnuAl RepoRt 2013

� Best Viral Idea, Hong Kong (uGOiGOTM) – Marketing Magazine
� Best Viral Marketing, Hong Kong – Marketing Magazine
� Customer Service Excellence Silver Award, Hong Kong – HK Association for Customer Service Excellence
� Best Foreign Consumer Bank, China – Global Finance
� Best Brand Building, China – 21st Century Business Herald
� Operation Excellence Awards (Value-added Services), India – National Payments Corporation of India
� Indonesia Young Consumer Banker Award (Pauline Sulistianingsih) – Indonesia Business Magazine
� Indonesia Young Consumer Banker Award (Asri Natanegeri) – Indonesia Business Magazine
WEALtH MANAGEMENt & PRIVAtE BANKING� Outstanding Private Banker of the Year,
(Tan Su Shan) – Private Banker International
� Outstanding Individual Contribution to Asian Wealth Management (Tan Su Shan) – WealthBriefing Asia
� Best Local Private Bank, Singapore – Euromoney
� Best Private Bank, Singapore – The Asset
� Best Private Bank, Singapore – PWM/The Banker
� Best Wealth Manager, Singapore – The Asset
� Dominant Local Private Bank (Highest AUM), Singapore – Private Banker International
� Best Wealth Management, Hong Kong – Global Banking & Finance Review
� China’s Best Priority Banking (DBS Treasures) – The Securities Times
� Best Wealth Manager, Indonesia – The Asset
tEcHNoLoGY ANd oPERAtIoNS� Best Core Banking Technology, Global
– The Banker
� Best International Retail Banking Concept – Redaktion Geldinstitute
� Bank Technology Leadership Achievement Award, Asia-Pacific (Dave Gledhill) – The Asian Banker
� Best Branch Automation Project, Asia-Pacific – The Asian Banker
� Best Core Banking Implementation, Asia-Pacific – The Asian Banker
� Best Security & Risk Management Project, Asia-Pacific – The Asian Banker
� Speech Analytics Technology Award, Asia-Pacific – IDC Financial Insights
� Trailblazer of the Year, Asia-Pacific – Banking & Payments Asia
� Channel Excellence Award (Branch), Asia-Pacific – Banking & Payments Asia
� Service Excellence Award (Mobile Services), Asia-Pacific – Banking & Payments Asia
� Service Excellence Award (Customer Experience), Asia-Pacific – Banking & Payments Asia
� Product Excellence Award (NFC; Contactless Payments), Asia-Pacific – Banking & Payments Asia
� ASEAN Business Award for Innovation – ASEAN Business Advisory Council
� Technology and Operations Bank of the Year, Singapore – Asian Banking & Finance
� Best In-House Contact Centre, Singapore – Contact Centre Association of Singapore
� Best Contact Centre Employee Recruitment/Retention Program, Singapore – Contact Centre Association of Singapore
� Best Customer Experience, Singapore – Contact Centre Association of Singapore
� Best Customer Experience Strategy, Singapore – Forrester Research
� Best CRM Strategy, Singapore (SSB Load Optimisation) – Marketing Magazine
� Branch Innovation of the Year, Singapore (DBS Remix) – Asian Banking & Finance
� Business Continuity Team of the Year, Singapore – BCI Asia
� Most Innovative Productivity Solution, Singapore – Contact Centre Association of Singapore
� Outstanding Customer Service Program, Hong Kong (DBS Red) – HK Association for Customer Service Excellence
� Operations Management Award, Hong Kong – Best Practice Management Group
� Banking IT Excellence Award, Indonesia – Warta Ekonomi Magazine
HUMAN RESoURcES� Great Workplace Award, Global – Gallup
� Best Employee Engagement, Asia – The Asian Banker
� ASEAN Business Award for Employment – ASEAN Business Advisory Council
� Outstanding SHARE Award, Singapore – Community Chest
� Best Companies for Mums, Singapore – National Trades Union Congress
� Labour Day Gold Award, Singapore – National Trades Union Congress
� Best Practice Award for Employee Engagement, Hong Kong – Best Practice Management Group
� Excellent Employee Engagement, Hong Kong – Institute of HR Management
� Best Employer, East China (China) – China Human Resources
� Best Companies to work for, India – Economic Times
� Future HR Leaders in Indonesia Award – Indonesia Business Magazine
coRPoRAtE SocIAL RESPoNSIBILItY � Best Corporate Social Responsibility
Practices, Asia – CMO Asia
� Corporate Social Responsibility Award, Hong Kong – Capital Weekly
� Caring Company Award, Hong Kong – Hong Kong Council of Social Service
� Best Supporter for Social Enterprise Products, Taiwan – Taipei City Government
201aWards aNd aCCOLades

SHARE PRIcE
20102009 2011 2012 2013 2014
0
5
10
15
20
25
2009 2010 2011 2012 2013
Share Price ($) High 15.46 15.80 15.73 14.99 17.90Low 6.42 13.24 10.81 11.59 14.30Close 15.40 14.32 11.52 14.84 17.10Average 11.48 14.30 13.77 13.98 16.19
Per ordinary Share ($) Gross dividend yield 4.9 3.9 4.1 4.0 3.6Price-to-earning ratio (number of times) (1) 12.6 12.4 10.6 10.1 11.3Price-to-book ratio (number of times) 1.1 1.3 1.1 1.1 1.2
(1) Earnings exclude one-time items and goodwill charges
202 DBS AnnuAl RepoRt 2013

FINANcIAL cALENdAR
2013
02 MayAnnouncement of first quarter results 2013
27 JunePayment date of Final Dividends on Ordinary Shares
and Non-Voting Redeemable Convertible Preference
Shares for the financial year ended 31 December 2012
01 AugustAnnouncement of second quarter results 2013
30 SeptemberPayment date of Interim Dividends on Ordinary Shares
and Non-Voting Redeemable Convertible Preference
Shares for the six months ended 30 June 2013
01 NovemberAnnouncement of third quarter results 2013
31 DecemberFinancial Year End
2014
14 FebruaryAnnouncement of full year results 2013
28 AprilAnnual General Meeting
AprilAnnouncement of first quarter results 2014
JulyProposed payment of Final Dividends on Ordinary
Shares and Non-Voting Redeemable Convertible
Preference Shares for the financial year ended
31 December 2013
AugustAnnouncement of second quarter results 2014
OctoberAnnouncement of third quarter results 2014
2015
FebruaryAnnouncement of full year results 2014
203

I. Class of Shares – Ordinary shares Voting Rights – One vote per share Total number of issued ordinary shares – 2,450,453,676 (excluding treasury shares) Treasury Shares – 182,000 (representing 0.007% of the total number of issued ordinary shares, excluding treasury shares)
No. of No. ofSize of Shareholdings Shareholders % Shares %*
1 – 999 7,898 17.96 1,818,406 0.081,000 – 10,000 31,774 72.24 88,285,644 3.6010,001 – 1,000,000 4,282 9.73 147,352,258 6.011,000,001 & above 30 0.07 2,212,997,368 90.31
Total 43,984 100.00 2,450,453,676 100.00
Location of Shareholders
Singapore 41,333 93.97 2,428,374,910 99.10Malaysia 1,531 3.48 12,156,071 0.50Overseas 1,120 2.55 9,922,695 0.40
Total 43,984 100.00 2,450,453,676 100.00
tWENtY LARGESt SHAREHoLdERS (as shown in the Register of Members and depository Register)
Name of Shareholder No. of Shares %*
1 Citibank Nominees Singapore Pte Ltd 438,051,235 17.882 Maju Holdings Pte. Ltd. 428,888,448 17.503 DBS Nominees Pte Ltd 415,017,761 16.94 4 Temasek Holdings (Private) Ltd 284,145,301 11.60 5 DBSN Services Pte Ltd 252,772,355 10.32 6 HSBC (Singapore) Nominees Pte Ltd 151,172,510 6.177 United Overseas Bank Nominees Pte Ltd 89,173,361 3.64 8 BNP Paribas Securities Services Singapore Branch 33,165,537 1.35 9 Raffles Nominees (Pte) Ltd 32,131,589 1.31 10 Lee Pineapple Company Pte Ltd 14,250,000 0.58 11 Lee Foundation 10,217,475 0.42 12 DB Nominees (S) Pte Ltd 10,080,198 0.41 13 Bank of Singapore Nominees Pte Ltd 9,025,949 0.37 14 BNP Paribas Nominees Singapore Pte Ltd 7,633,797 0.31 15 DBS Vickers Securities (S) Pte Ltd 7,048,996 0.29 16 OCBC Securities Private Ltd 5,826,228 0.24 17 KEP Holdings Limited 4,033,947 0.16 18 UOB Kay Hian Pte Ltd 2,512,004 0.10 19 OCBC Nominees Singapore Pte Ltd 2,388,172 0.10 20 Kwee Siu Min @ Sudjasmin Kusmin or Dianawati Tjendera 2,181,203 0.09
total 2,199,716,066 89.78
* Percentage is calculated based on the total number of issued ordinary shares, excluding treasury shares
II. Class of Shares – Non-Voting Redeemable Convertible Preference Shares ("NVRCPS") Voting Rights – Please see Article 6A of the Articles of Association Sole Shareholder of 30,011,421 NVRCPS: Maju Holdings Pte. Ltd.
SHAREHoLdING StAtIStIcSas at 3 March 2014
204 DBS AnnuAl RepoRt 2013

SUBStANtIAL oRdINARY SHAREHoLdERS (as shown in the Register of Substantial Shareholders as at 3 March 2014) direct Interest deemed Interest No. of Shares %* No. of Shares %*
Maju Holdings Pte. Ltd. 428,888,448 17.50 0 0.00Temasek Holdings (Private) Limited 284,145,301 11.60 433,338,229 17.68
* Percentage is calculated based on the total number of issued ordinary shares, excluding treasury shares
1. Maju Holdings Pte. Ltd. ("Maju") is a wholly-owned subsidiary of Temasek Holdings (Private) Limited ("Temasek"). 2. Temasek, a company wholly-owned by the Minister for Finance, is deemed to be interested in all the ordinary shares held by Maju.3. In addition, Temasek is deemed to be interested in 4,449,781 ordinary shares in which its other subsidiaries and associated companies
have or are deemed to have an interest pursuant to Section 4 of the Securities and Futures Act, Chapter 289.
As at 3 March 2014, approximately 70.39% of issued ordinary shares of DBS Group Holdings Ltd are held by the public and, therefore, Rule 723 of the SGX Listing Manual is complied with.
205sHareHOLdiNg statistiCs

NotIcE oF ANNUAL GENERAL MEEtING
dBS GRoUP HoLdINGS Ltd (Incorporated in the Republic of Singapore)Company Registration No.: 199901152M
To: All Shareholders
NOTICE IS HEREBY GIVEN that the Fifteenth Annual General Meeting of the shareholders of DBS Group Holdings Ltd (the “Company”) will be held at NtUc Auditorium, one Marina Boulevard, Level 7, Singapore 018989 on Monday, 28 April 2014 at 10.00 am to transact the following business:
oRdINARY BUSINESS oRdINARY RESoLUtIoN No.
To receive and consider the Directors’ Report and Audited Financial Statements for the year ended 31 December 2013 and the Auditors’ Report thereon.
Resolution 1
To declare a one-tier tax exempt Final Dividend of 30 cents per ordinary share, for the year ended 31 December 2013. [2012: Final Dividend of 28 cents per ordinary share, one-tier tax exempt]
Resolution 2
To declare a one-tier tax exempt Final Dividend of 2 cents per Non-Voting Redeemable Convertible Preference Share, for the year ended 31 December 2013. [2012: 2 cents per Non-Voting Redeemable Convertible Preference Share, one-tier tax exempt]
Resolution 3
To approve the amount of $3,687,232 proposed as Directors’ remuneration for the year ended 31 December 2013. [2012: $2,923,438]
Resolution 4
To re-appoint Messrs PricewaterhouseCoopers LLP as Auditors of the Company and to authorise the Directors to fix their remuneration.
Resolution 5
To re-elect the following Directors, who are retiring under Article 95 of the Company’s Articles of Association and who, being eligible, offer themselves for re-election:
(a) Mr Piyush Gupta (b) Dr Bart Joseph Broadman (c) Mr Ho Tian Yee
Key information on Mr Gupta, Dr Broadman and Mr Ho can be found on pages 188, 189 and 190 respectively of the 2013 Annual Report.
Resolution 6Resolution 7Resolution 8
To re-appoint Mr Nihal Vijaya Devadas Kaviratne CBE as a Director pursuant to Section 153(6) of the Companies Act, Chapter 50.
Key information on Mr Kaviratne can be found on page 190 of the 2013 Annual Report.
Resolution 9
206 DBS AnnuAl RepoRt 2013

SPEcIAL BUSINESS oRdINARY RESoLUtIoN No.
To consider and, if thought fit, to pass the following Resolutions as ORDINARY RESOLUTIONS:
That authority be and is hereby given to the Directors of the Company to:
(a) allot and issue from time to time such number of ordinary shares in the capital of the Company (“DBSH Ordinary Shares”) as may be required to be issued pursuant to the exercise of options under the DBSH Share Option Plan; and
(b) offer and grant awards in accordance with the provisions of the DBSH Share Plan and to allot and issue from time to time such number of DBSH Ordinary Shares as may be required to be issued pursuant to the vesting of awards under the DBSH Share Plan,
PROVIDED ALWAYS THAT:
(1) the aggregate number of new DBSH Ordinary Shares to be issued pursuant to the exercise of options granted under the DBSH Share Option Plan and the vesting of awards granted or to be granted under the DBSH Share Plan shall not exceed 5 per cent of the total number of issued shares (excluding treasury shares) in the capital of the Company from time to time; and
(2) the aggregate number of new DBSH Ordinary Shares under awards to be granted pursuant to the DBSH Share Plan during the period commencing from the date of this Annual General Meeting of the Company and ending on the date of the next Annual General Meeting of the Company or the date by which the next Annual General Meeting of the Company is required by law to be held, whichever is the earlier, shall not exceed 2 per cent of the total number of issued shares (excluding treasury shares) in the capital of the Company from time to time.
Resolution 10
That authority be and is hereby given to the Directors of the Company to:
(a) (i) issue shares in the capital of the Company (“shares”) whether by way of rights, bonus or otherwise; and/or
(ii) make or grant offers, agreements or options (collectively, “Instruments”) that might or would require shares to be issued, including but not limited to the creation and issue of (as well as adjustments to) warrants, debentures or other instruments convertible into shares,
at any time and upon such terms and conditions and for such purposes and to such persons as the Directors may in their absolute discretion deem fit; and
(b) (notwithstanding the authority conferred by this Resolution may have ceased to be in force) issue shares in pursuance of any Instrument made or granted by the Directors while this Resolution was in force,
Resolution 11
207NOtiCe Of aNNUaL geNeraL MeetiNg

SPEcIAL BUSINESS oRdINARY RESoLUtIoN No.
provided that:
(1) the aggregate number of shares to be issued pursuant to this Resolution (including shares to be issued in pursuance of Instruments made or granted pursuant to this Resolution) does not exceed 50 per cent of the total number of issued shares (excluding treasury shares) in the capital of the Company (as calculated in accordance with paragraph (2) below), of which the aggregate number of shares to be issued other than on a pro rata basis to shareholders of the Company (including shares to be issued in pursuance of Instruments made or granted pursuant to this Resolution) shall be less than 10 per cent of the total number of issued shares (excluding treasury shares) in the capital of the Company (as calculated in accordance with paragraph (2) below);
(2) (subject to such manner of calculation and adjustments as may be prescribed by the Singapore Exchange Securities Trading Limited (“SGX-ST”)), for the purpose of determining the aggregate number of shares that may be issued under paragraph (1) above, the percentage of issued shares shall be based on the total number of issued shares (excluding treasury shares) in the capital of the Company at the time this Resolution is passed, after adjusting for:
(i) new shares arising from the conversion or exercise of any convertible securities or share options or vesting of share awards which are outstanding or subsisting at the time this Resolution is passed; and
(ii) any subsequent bonus issue, consolidation or subdivision of shares;
(3) in exercising the authority conferred by this Resolution, the Company shall comply with the provisions of the Listing Manual of the SGX-ST for the time being in force (unless such compliance has been waived by the SGX-ST) and the Articles of Association for the time being of the Company; and
(4) (unless revoked or varied by the Company in general meeting) the authority conferred by this Resolution shall continue in force until the conclusion of the next Annual General Meeting of the Company or the date by which the next Annual General Meeting of the Company is required by law to be held, whichever is the earlier.
That authority be and is hereby given to the Directors of the Company to allot and issue such number of new ordinary shares and new Non-Voting Redeemable Convertible Preference Shares in the capital of the Company as may be required to be allotted and issued pursuant to the application of the DBSH Scrip Dividend Scheme to the final dividends of 30 cents per ordinary share and 2 cents per Non-Voting Redeemable Convertible Preference Share, for the year ended 31 December 2013.
Resolution 12
208 DBS AnnuAl RepoRt 2013

SPEcIAL BUSINESS oRdINARY RESoLUtIoN No.
That authority be and is hereby given to the Directors of the Company to apply the DBSH Scrip Dividend Scheme to any dividend(s) which may be declared for the year ending 31 December 2014 and to allot and issue such number of new ordinary shares and new Non-Voting Redeemable Convertible Preference Shares in the capital of the Company as may be required to be allotted and issued pursuant thereto.
Resolution 13
By Order of The Board
Goh Peng Fong (Mr)Group Secretary DBS Group Holdings Ltd
31 March 2014Singapore
NOTES: A member of the Company entitled to attend and vote at the Meeting is entitled to appoint a proxy or proxies to attend and to vote in his stead. A member of the Company which is a corporation is entitled to appoint its authorised representative or proxy to vote on its behalf.
A proxy need not be a member of the Company.
The instrument appointing a proxy must be deposited at the Company’s office at 12 Marina Boulevard, Marina Bay financial Centre tower 3, Level 12, singapore 018982 (attention to: group secretariat) at least 48 hours before the time for holding the Meeting.
EXPLANAtoRY NotES
oRdINARY BUSINESS
Ordinary resolution 4: directors’ remuneration for 2013 Resolution 4 is to approve the payment of an aggregate amount of $3,687,232 as Directors’ remuneration for the non-executive Directors of the Company for the year ended 31 December 2013. If approved, each of the non-executive Directors (with the exception of those named below) will receive 70% of his or her Directors’ fees in cash and 30% of his or her Directors’ fees in the form of share awards granted pursuant to the DBSH Share Plan. The share awards will not be subject to a vesting period, but will be subject to a selling moratorium whereby each non-executive director will be required to hold the equivalent of one year’s basic retainer for the duration of his or her tenure as a director, and for one year after the date he or she steps down as a director. The actual number of shares to be awarded will be determined by reference to the volume-weighted average price of a share on the SGX-ST over the 10 trading days immediately following the date of the forthcoming 2014 Annual General Meeting, rounded down to the nearest share, and any residual balance will be paid in cash. The Director’s fees for Mrs Ow Foong Pheng will be paid in cash to a government agency, the Directorship & Consultancy Appointments Council. In addition, Dr Christopher Cheng, who stepped down as a Director of the Company on 29 April 2013, will receive all of his Director’s fees (calculated on a pro-rated basis) in cash. Please refer to pages 64 and 65 of the Corporate Governance Report for more details on the annual fee structure for the Board and Board committees for 2013.
Ordinary resolutions 6, 7 and 8: re-election of directors retiring under article 95 (a) Mr Piyush Gupta, upon re-election as a Director of the Company, will remain as a member of the Executive Committee. Mr Gupta is a
non-independent Director.
(b) Dr Bart Joseph Broadman, upon re-election as a Director of the Company, will remain as a member of each of the Board Risk Management Committee and Compensation and Management Development Committee, and will be considered independent.
(c) Mr Ho Tian Yee, upon re-election as a Director of the Company, will remain as a member of each of the Board Risk Management Committee and Nominating Committee, and will be considered independent.
209NOtiCe Of aNNUaL geNeraL MeetiNg
Ordinary resolution 9: re-appointment of director pursuant to section 153(6) of the Companies act, Chapter 50 As Mr Nihal Vijaya Devadas Kaviratne CBE is over 70 years of age, his office will be vacated at the forthcoming Annual General Meeting, and he will be standing for re-appointment thereat. Upon re-appointment as a Director of the Company, Mr Kaviratne will remain as a member of each of the Audit Committee and Board Risk Management Committee, and will be considered independent.
SPEcIAL BUSINESS
Ordinary resolution 10: dBsH share Option Plan and dBsH share Plan Resolution 10 is to empower the Directors to issue ordinary shares in the capital of the Company pursuant to the exercise of options under the DBSH Share Option Plan and to offer and grant awards and to issue ordinary shares in the capital of the Company pursuant to the DBSH Share Plan, provided that: (a) the maximum number of ordinary shares which may be issued under the DBSH Share Option Plan and the DBSH Share Plan is limited to 5 per cent of the total number of issued shares in the capital of the Company (excluding treasury shares) from time to time and (b) the aggregate number of new ordinary shares under awards which may be granted pursuant to the DBSH Share Plan from this Annual General Meeting to the next Annual General Meeting shall not exceed 2 per cent of the total number of issued shares in the capital of the Company (excluding treasury shares) from time to time.
Ordinary resolution 11: share issue Mandate Resolution 11 is to empower the Directors to issue shares in the capital of the Company and to make or grant instruments (such as warrants or debentures) convertible into shares, and to issue shares in pursuance of such instruments, up to a number not exceeding in total 50 per cent of the total number of issued shares (excluding treasury shares) in the capital of the Company, of which the number of shares that may be issued other than on a pro rata basis to shareholders must be less than 10 per cent of the total number of issued shares (excluding treasury shares). For the purpose of determining the aggregate number of shares that may be issued, the percentage of issued shares shall be based on the total number of issued shares (excluding treasury shares) in the capital of the Company at the time that Resolution 11 is passed, after adjusting for (a) new shares arising from the conversion or exercise of any convertible securities or share options or vesting of share awards which are outstanding or subsisting at the time that Resolution 11 is passed, and (b) any subsequent bonus issue, consolidation or subdivision of shares.
Ordinary resolution 12: dBsH scrip dividend scheme Resolution 12 is to empower the Directors to issue such number of new ordinary shares and new Non-Voting Redeemable Convertible Preference Shares in the capital of the Company as may be required to be issued pursuant to the application of the DBSH Scrip Dividend Scheme (the “Scheme”) to the final dividends of 30 cents per ordinary share and 2 cents per Non-Voting Redeemable Convertible Preference Share, for the year ended 31 December 2013 (“FY2013”).
In the announcement dated 14 February 2014, the Company proposed that the Scheme would be applied to the final dividends for FY2013, subject to shareholder approval being obtained for the said final dividends for FY2013.
Ordinary resolution 13: dBsH scrip dividend scheme Resolution 13 is to authorise the Directors to apply the Scheme to any dividend(s) which may be declared for the year ending 31 December 2014 (“FY2014”), and to empower the Directors to issue such number of new ordinary shares and new Non-Voting Redeemable Convertible Preference Shares in the capital of the Company as may be required to be issued pursuant thereto. The authority conferred by this Resolution will lapse at the conclusion of the next Annual General Meeting of the Company or the date by which the next Annual General Meeting of the Company is required by law to be held, whichever is the earlier.
If Resolution 13 is passed at the Annual General Meeting, and if the Directors should decide to apply the Scheme to a dividend declared in respect of FY2014, the current intention is that no discount will be given for the scrip shares. If the Directors decide not to apply the Scheme to a dividend for FY2014, such dividend will be paid in cash to shareholders in the usual way.
210 DBS AnnuAl RepoRt 2013

PRoXY FoRMdBS GRoUP HoLdINGS Ltd(Incorporated in the Republic of Singapore)Company Registration Number: 199901152M
Annual General Meeting
*I/We ........................................................................................................................................... (NRIC/Passport No. .............................................................. )
of ................................................................................................................................................. being an Ordinary Shareholder of DBS Group Holdings Ltd
(the “Company”) hereby appoint
NAME AddRESS NRIc/PASSPoRt NUMBER PRoPoRtIoN oF SHAREHoLdINGS (%)
*and/or
or failing *him/her, the Chairman of the Meeting or such person(s) as he may nominate, as *my/our proxy/proxies, to vote for *me/us and on *my/our behalf and, if necessary, to demand a poll, at the Fifteenth Annual General Meeting of the Company, to be held at NtUc Auditorium, one Marina Boulevard, Level 7, Singapore 018989 on Monday, 28 April 2014 at 10.00 am and at any adjournment thereof in the following manner:
No. RESoLUtIoNS FoR AGAINSt
ordinary Business
1 Adoption of audited Financial Statements and Directors’ and Auditors’ Report
2 Declaration of Final Dividend on Ordinary Shares
3 Declaration of Final Dividend on Non-Voting Redeemable Convertible Preference Shares
4 Approval of proposed Directors’ remuneration of SGD 3,687,232 for FY2013
5 Re-appointment of PricewaterhouseCoopers LLP as Auditors
6 Re-election of Mr Piyush Gupta as a Director retiring under Article 95
7 Re-election of Dr Bart Joseph Broadman as a Director retiring under Article 95
8 Re-election of Mr Ho Tian Yee as a Director retiring under Article 95
9 Re-appointment of Mr Nihal Vijaya Devadas Kaviratne CBE as a Director pursuant to Section 153(6) of the Companies Act, Chapter 50
Special Business
10 Authority to issue shares under the DBSH Share Option Plan, and to grant awards and issue shares under the DBSH Share Plan
11 General authority to issue shares subject to limits
12 Authority to issue shares pursuant to the DBSH Scrip Dividend Scheme for the FY2013 Final Dividends
13 Authority to apply the DBSH Scrip Dividend Scheme to dividends for FY2014, and to issue shares pursuant thereto
If you wish to exercise all your votes For or Against, please tick with “P”. Alternatively, please indicate the number of votes For or Against each resolution.
The proxy may vote or abstain as the proxy deems fit on any of the above resolutions if no voting instruction is specified, and on any other matter arising at the Annual General Meeting.
As witness *my/our hand(s) this .........................................day of ..........................................2014.
Signature or Common Seal of Shareholder
IMPoRtANt:
1. For investors who have used their CPF monies to buy DBS Group Holdings Ltd shares, the annual report is forwarded to them at the request of their CPF Approved Nominees and is sent solely FOR INFORMATION ONLY.
2. For holders of Non-Voting Redeemable Convertible Preference Shares (NVRCPS), the annual report is forwarded to them solely FOR INFORMATION ONLY.
3. This Proxy form is not valid for use by CPF Investors and NVRCPS holders and shall be ineffective for all intents and purposes if used or purported to be used by them.
No. of ordinary Shares held
IMPoRtANt PLEASE REAd NotES oVERLEAF.* delete as appropriate

NOtes:
1 Please insert the total number of Ordinary Shares held by you. If you have Ordinary Shares entered against your name in the Depository Register (as defined in Section 130A of the Companies Act, Chapter 50 of Singapore), you should insert that number of Ordinary Shares. If you have Ordinary Shares registered in your name in the Register of Members, you should insert that number of Ordinary Shares. If you have Ordinary Shares entered against your name in the Depository Register and Ordinary Shares registered in your name in the Register of Members, you should insert the aggregate number of Ordinary Shares entered against your name in the Depository Register and registered in your name in the Register of Members.
2 A Member entitled to attend and vote at a Meeting of the Company is entitled to appoint a proxy or two proxies to attend and vote instead of him.
3 Where a Member appoints two proxies, the appointments shall be invalid unless he specifies the proportion of his shareholding (expressed as a percentage of the whole) to be represented by each proxy.
4 The Instrument appointing a proxy must be deposited at the Company’s office at 12 Marina Boulevard, Marina Bay financial Centre tower 3, Level 12, singapore 018982 (attention to: group secretariat) at least 48 hours before the time for holding the Meeting.
5 The Instrument appointing the proxy or proxies must be under the hand of the appointer or of his attorney duly authorised in writing. Where the Instrument appointing a proxy or proxies is executed by a corporation, it must be executed either under its seal or under the hand of an officer or attorney duly authorised.
6 A corporation which is a Member may, in accordance with Section 179 of the Companies Act, Chapter 50 of Singapore, authorise by resolution of its directors or other governing body such person as it thinks fit to act as its representative at the Annual General Meeting.
7 The Company shall be entitled to reject the Instrument appointing a proxy or proxies if it is incomplete, improperly completed or illegible or where the true intentions of the appointer are not ascertainable from the instructions of the appointer specified in the Instrument appointing a proxy or proxies. In addition, in the case of members whose Ordinary Shares are entered against their names in the Depository Register, the Company may reject any Instrument appointing a proxy or proxies lodged if such Members are not shown to have Ordinary Shares entered against their names in the Depository Register 48 hours before the time appointed for holding the Annual General Meeting as certified by The Central Depository (Pte) Limited to the Company.

BOARD OF DIRECTORSPeter Seah ChairmanPiyush Gupta Chief Executive OfficerBart BroadmanEuleen Goh Ho Tian YeeNihal Kaviratne CBEAndre SekulicDanny TeohOw Foong Pheng
AUDIT COMMITTEEDanny Teoh ChairmanNihal Kaviratne CBEPeter SeahAndre SekulicOw Foong Pheng
NOMINATING COMMITTEEPeter Seah ChairmanEuleen Goh Ho Tian YeeDanny TeohOw Foong Pheng
BOARD RISK MANAGEMENT COMMITTEEEuleen Goh ChairmanBart BroadmanHo Tian YeeNihal Kaviratne CBEPeter Seah Danny Teoh
BOARD EXECUTIVE COMMITTEEPeter Seah ChairmanEuleen GohPiyush Gupta
COMPENSATION AND MANAGEMENT DEVELOPMENT COMMITTEEPeter Seah ChairmanBart BroadmanEuleen Goh Andre Sekulic
GROUP SECRETARYGoh Peng Fong
GROUP EXECUTIVE COMMITTEEPiyush GuptaChief Executive OfficerChng Sok HuiChief Financial OfficerDavid GledhillGroup Technology & OperationsAndrew NgTreasury and MarketsSebastian ParedesDBS Hong KongElbert PattijnChief Risk OfficerSim S LimDBS SingaporeTan Su ShanConsumer Banking and Wealth Management GroupJeanette WongInstitutional Banking Group
GROUP MANAGEMENT COMMITTEEIncludes the Group Executive Committee and the following: Eric AngCapital MarketsSanjiv BhasinDBS IndiaJerry ChenDBS TaiwanNeil GeDBS ChinaSue Lynn KooGroup Legal, Compliance & SecretariatLee Yan HongGroup Human ResourcesJimmy NgGroup AuditKaren NguiGroup Strategic Marketing & CommunicationsMelvin TeoDBS IndonesiaDomenic FudaConsumer Banking and Wealth Management Group
REGISTRARTricor Barbinder Share Registration Services(a division of Tricor Singapore Pte. Ltd.)80 Robinson Road, #02-00Singapore 068898Tel: (65) 6236 3333Fax: (65) 6236 4399
AUDITORSPricewaterhouseCoopers LLPChartered Accountants8 Cross Street #17-00PwC BuildingSingapore 048424
PARTNER IN CHARGE OF THE AUDIT Karen LoonAppointed on 29 April 2013 (DBS Group Holdings Ltd) and 29 April 2013 (DBS Bank Ltd.)
REGISTERED OFFICE12 Marina BoulevardMarina Bay Financial Centre Tower 3 Singapore 018982Tel: (65) 6878 8888Website: www.dbs.com
INVESTOR RELATIONSEmail: [email protected]
CORPORATE INFORMATION

12 Marina BoulevardMarina Bay Financial Centre Tower 3
Singapore 018982Tel: (65) 6878 8888
www.dbs.com
Co. Reg. No. 199901152M
Scan this to read the Annual Report
DBS. Living, Breathing Asia
www.facebook.com/dbs
Asia’s Safest,Asia’s Best
Best Managed Bank, Asia-Pacific 2013The Asian Banker
Safest Bank, Asia 2009 – 2013Global Finance