Forestry Reportfwforestry.net/wp-content/uploads/2015/01/FW... · Unfortunately, taxes on forestry...
8
INSIDE // 3 AL Lumber Facility To Reopen // 4 Environmental Groups Take On Wood Pellet Exports // 7 Lumber Exports Roar Back By Marshall Thomas, president of F&W Forestry Services, Inc. FALL 2013 // NO. 118 Prices, Creeks, And Criticism On The Rise (And Maybe Taxes Too) Forestry Report A PUBLICATION OF F&W FORESTRY SERVICES, INC. // ALBANY, GEORGIA It’s been a long time since we had enough wet weather to affect creek levels and timber prices, and it took record wet weather to do it this time. We are finally seeing some of the old weather related stumpage price patterns. Pine pulpwood and hardwood pulpwood and sawtimber prices are up substantially from the same quarter last year, but pine chip-n- saw and sawtimber seem to be slower in responding. It’s not surprising that sawtimber is slower to respond, given the low demand since 2006 and the inventory we have accumulated on the stump. However our managers indicate that demand is growing for sawtimber and we are seeing higher prices in pockets, perhaps a sign that we will see regional increases soon. All in all, timber markets look positive as we move into the typical fall dry season with more ground water than we have had in years. The creeks and associated wetlands held water during the summer. While they are drying out some now, most foresters believe that even normal rainfall this winter will create some real issues with logging and make all-weather logging sites very valuable—something we have already seen in the rain-soaked eastern U.S. this summer. And don’t forget, we’re still in hurricane season, which lasts until the end of October. Pellet mills and their possible effect on the sustainability of the Southern forest are also getting attention from environmental groups (see page 4). In an unfortunate sense, this may also be a good sign for Southern timber growers. Other than the forest roads issue (see article page 3), which really started in the Northwest, we haven’t seen a lot of environmental attention on the Southern forest since the last boom markets of the late 1990’s. Since then, we have been somewhat “ignored” and prices have been flat to declining. Maybe it’s time that we recognize environmental attention as an indicator (or maybe a companion) of good markets and increasing demand! Unfortunately, taxes on forestry may be rising too. House and Senate committees, in an effort to rewrite the Federal Tax Code, are looking at capital gains and the expensing provisions for reforestation and management—along with the rest of the code (see article page 3). Across the pine belt, pulpwood prices on F&W sales in the third quarter averaged $10.53 per ton, up 14 percent over the same period a year ago and 7 percent above the second quarter. Small sawtimber (chip-n-saw) averaged $16.31 across PINE PULPWOOD PINE SMALL SAWTIMBER PINE LARGE SAWTIMBER HARDWOOD PULPWOOD HARDWOOD SAWTIMBER SOUTHEAST LAFAYETTE, AL $8–15 $13–19 $22–32 $6–14 $20–34 GAINESVILLE, FL $15–23 $18–26 $28–34 $9–14 $15–30 MARIANNA, FL $12–20 $20–24 $25–30 $5–8 $15–25 ALBANY, GA $10–14 $15–22 $24–35 $8–14 $25–45 MACON, GA $11–15 $15–22 $24–36 $10–16 $25–40 STATESBORO, GA $15–22 $18–25 $27–35 $10–18 $23–40 GREENWOOD, SC $7–10 $16–20 $25–32 $7–9 $18–25 CENTRAL REGION CHILLICOTHE, OH $5–6 NA NA $2–3 $31–49 CLINTON, TN $3–7 NA $6–13 $3–5 $20–40 PARIS, TN $8–12 $12–15 NA $6–11 $28–35 WEST GULF DEQUEEN, AR $6–13 $13–13 $20–24 $10–15 $22–38 EL DORADO, AR $5–8 $8–12 $19–34 $7–14 $22–57 CORINTH, MS $4–13 $10–15 $21–21 $8–11 $43–46 JACKSON, MS $5–9 $11–18 $18–35 $5–14 $25–40 HUNTSVILLE, TX $6–8 $11–14 $23–28 $7–9 $24–36 MID-ATLANTIC CHARLOTTESVILLE, VA** $10–14 $13–19 $17–28 $4–6 $14–42 NORTHEAST GLENS FALLS, NY*** $3–5 $7–14 $15–29 $6–8 $50–120 HERKIMER, NY*** $2–3 $7–12 $10–29 $4–7 $60–170 2013 THIRD QUARTER PINE & HARDWOOD STUMPAGE PRICE RANGE* *All Prices in tons, based on sales handled by F&W offices. If no sales occurred, prior quarter’s sales and other data are used to compile price range. Price ranges are due to different locations, timber quality, logging conditions, type of harvest, and local market conditions. To convert $/ton to $/cord multiply $/ton price by 2.7. The actual range for our sales, depending on region, is from 2.6 to 2.8. **Virginia Pine Sawtimber is $90-100 MBF (I). (S) = Scribner, (I) = International, (D) = Doyle. *** Northeast Pine Pulpwood prices also include Hemlock and Spruce. (Continued on page 2)
Transcript of Forestry Reportfwforestry.net/wp-content/uploads/2015/01/FW... · Unfortunately, taxes on forestry...

INSIDE // 3 AL Lumber Facility To Reopen // 4 Environmental Groups Take On Wood Pellet Exports // 7 Lumber Exports Roar Back
By Marshall Thomas,president of F&W Forestry Services, Inc.
FALL 2013 // NO. 118
Prices, Creeks, And Criticism On The Rise (And Maybe Taxes Too)
Forestry ReportA PUBLICATION OF F&W FORESTRY SERVICES, INC. // ALBANY, GEORGIA
It’s been a long time since we had enough wet weather to affect creek levels and timber prices,
and it took record wet weather to do it this time. We are finally seeing some of the old weather related stumpage price patterns. Pine pulpwood and hardwood pulpwood and sawtimber prices are up substantially from the same quarter last year, but pine chip-n-saw and sawtimber seem to be slower in responding. It’s not surprising that sawtimber is slower to respond, given the low demand
since 2006 and the inventory we have accumulated on the stump. However our managers indicate that demand is growing for sawtimber and we are seeing higher prices in pockets, perhaps a sign that we will see regional increases soon.
All in all, timber markets look positive as we move into the typical fall dry season with more ground water than we have had in years. The creeks and associated wetlands held water during the summer. While they are drying out some now, most foresters believe that even normal rainfall this winter will create some real issues with logging and make all-weather logging sites very valuable—something we have already seen in the rain-soaked eastern U.S. this summer. And don’t forget, we’re still in hurricane season, which lasts until the end of October.
Pellet mills and their possible effect on the sustainability of the Southern forest are also getting attention from environmental groups (see page 4). In an unfortunate sense, this may also be a good sign for Southern timber growers. Other than the forest roads issue (see article page 3), which really started in the Northwest, we haven’t seen a lot of environmental attention on the Southern forest since the last boom markets of the late 1990’s. Since then, we have been somewhat “ignored” and prices have been flat to declining. Maybe it’s time that we recognize environmental attention as an indicator (or maybe a companion) of good markets and increasing demand!
Unfortunately, taxes on forestry may be rising too. House and Senate committees, in an effort to rewrite the Federal Tax Code, are looking at capital gains and the expensing provisions for reforestation and management—along with the rest of the code (see article page 3).
Across the pine belt, pulpwood prices on F&W sales in the third quarter averaged $10.53 per ton, up 14 percent over the same period a year ago and 7 percent above the second quarter.
Small sawtimber (chip-n-saw) averaged $16.31 across
PIN
E
PU
LPW
OO
D
PIN
E S
MA
LL
SA
WT
IMB
ER
PIN
E L
AR
GE
S
AW
TIM
BE
R
HA
RD
WO
OD
P
UL
PW
OO
D
HA
RD
WO
OD
S
AW
TIM
BE
R
SOUTHEAST LAFAYETTE, AL $8–15 $13–19 $22–32 $6–14 $20–34 GAINESVILLE, FL $15–23 $18–26 $28–34 $9–14 $15–30 MARIANNA, FL $12–20 $20–24 $25–30 $5–8 $15–25 ALBANY, GA $10–14 $15–22 $24–35 $8–14 $25–45 MACON, GA $11–15 $15–22 $24–36 $10–16 $25–40 STATESBORO, GA $15–22 $18–25 $27–35 $10–18 $23–40 GREENWOOD, SC $7–10 $16–20 $25–32 $7–9 $18–25
CENTRAL REGION
CHILLICOTHE, OH $5–6 NA NA $2–3 $31–49 CLINTON, TN $3–7 NA $6–13 $3–5 $20–40 PARIS, TN $8–12 $12–15 NA $6–11 $28–35
WEST GULF
DEQUEEN, AR $6–13 $13–13 $20–24 $10–15 $22–38 EL DORADO, AR $5–8 $8–12 $19–34 $7–14 $22–57 CORINTH, MS $4–13 $10–15 $21–21 $8–11 $43–46 JACKSON, MS $5–9 $11–18 $18–35 $5–14 $25–40 HUNTSVILLE, TX $6–8 $11–14 $23–28 $7–9 $24–36
MID-ATLANTIC
CHARLOTTESVILLE, VA** $10–14 $13–19 $17–28 $4–6 $14–42
NORTHEAST
GLENS FALLS, NY*** $3–5 $7–14 $15–29 $6–8 $50–120 HERKIMER, NY*** $2–3 $7–12 $10–29 $4–7 $60–170
2013 THIRD QUARTER PINE & HARDWOOD STUMPAGE PRICE RANGE*
*�All�Prices� in� tons,�based�on�sales�handled�by�F&W�offices.� If�no�sales�occurred,�prior�quarter’s�sales�and�other�data�are�used�to�compile�price�range.�Price�ranges�are�due�to�different�locations,�timber� quality,� logging� conditions,� type� of� harvest,� and� local� market� conditions.� To� convert� $/ton�to�$/cord�multiply�$/ton�price�by�2.7.�The�actual�range�for�our�sales,�depending�on�region,�is�from�2.6�to�2.8.�**Virginia�Pine�Sawtimber�is�$90-100�MBF�(I).�(S)�=�Scribner,�(I)�=�International,�(D)�=�Doyle.� ***�Northeast�Pine�Pulpwood�prices�also�include�Hemlock�and�Spruce.� (Continued on page 2)
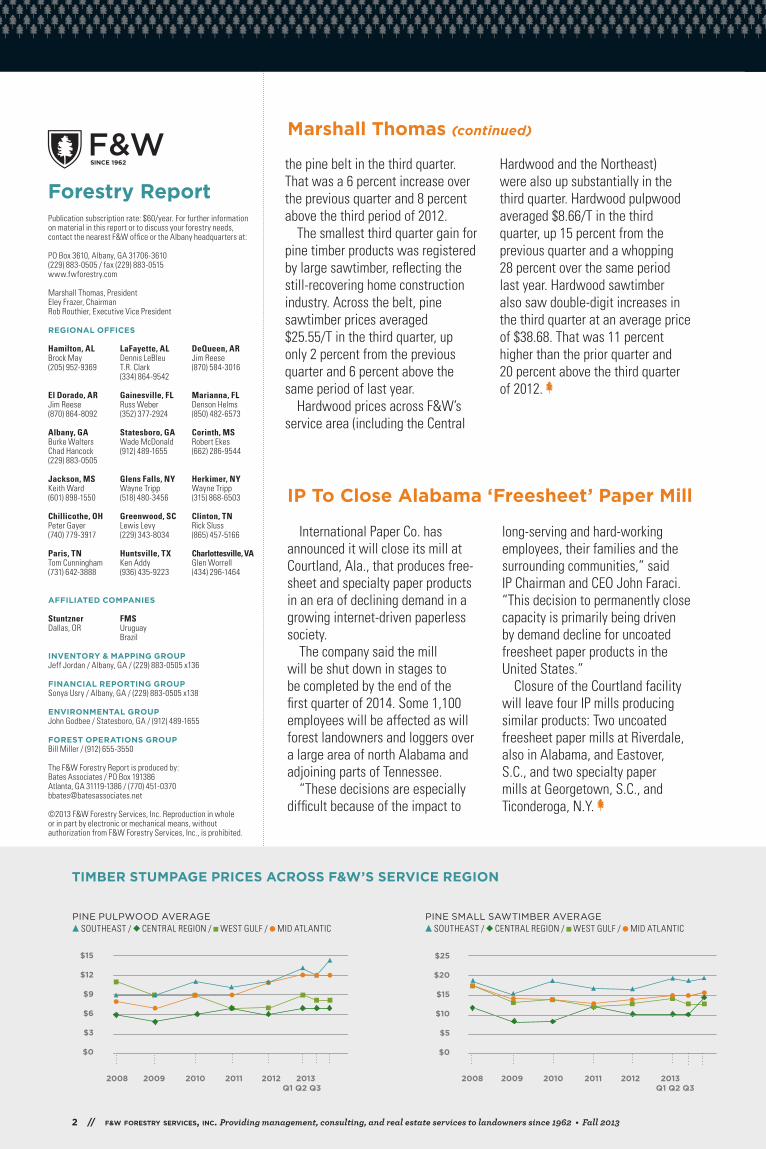
the pine belt in the third quarter. That was a 6 percent increase over the previous quarter and 8 percent above the third period of 2012.
The smallest third quarter gain for pine timber products was registered by large sawtimber, reflecting the still-recovering home construction industry. Across the belt, pine sawtimber prices averaged $25.55/T in the third quarter, up only 2 percent from the previous quarter and 6 percent above the same period of last year.
Hardwood prices across F&W’s service area (including the Central
Hardwood and the Northeast) were also up substantially in the third quarter. Hardwood pulpwood averaged $8.66/T in the third quarter, up 15 percent from the previous quarter and a whopping 28 percent over the same period last year. Hardwood sawtimber also saw double-digit increases in the third quarter at an average price of $38.68. That was 11 percent higher than the prior quarter and 20 percent above the third quarter of 2012.
PINE PULPWOOD AVERAGE SOUTHEAST / CENTRAL REGION / WEST GULF / MID ATLANTIC
PINE SMALL SAWTIMBER AVERAGE SOUTHEAST / CENTRAL REGION / WEST GULF / MID ATLANTIC
Marshall Thomas (continued)
TIMBER STUMPAGE PRICES ACROSS F&W’S SERVICE REGION
Forestry ReportPublication subscription rate: $60/year. For further information on material in this report or to discuss your forestry needs, contact the nearest F&W office or the Albany headquarters at:
PO Box 3610, Albany, GA 31706-3610(229) 883-0505 / fax (229) 883-0515www.fwforestry.com
Marshall Thomas, PresidentEley Frazer, ChairmanRob Routhier, Executive Vice President
REGIONAL OFFICES
Hamilton, AL LaFayette, AL DeQueen, AR Brock May Dennis LeBleu Jim Reese (205) 952-9369 T.R. Clark (870) 584-3016 (334) 864-9542
El Dorado, AR Gainesville, FL Marianna, FLJim Reese Russ Weber Denson Helms (870) 864-8092 (352) 377-2924 (850) 482-6573
Albany, GA Statesboro, GA Corinth, MS Burke Walters Wade McDonald Robert Ekes Chad Hancock (912) 489-1655 (662) 286-9544(229) 883-0505
Jackson, MS Glens Falls, NY Herkimer, NY Keith Ward Wayne Tripp Wayne Tripp (601) 898-1550 (518) 480-3456 (315) 868-6503
Chillicothe, OH Greenwood, SC Clinton, TN Peter Gayer Lewis Levy Rick Sluss (740) 779-3917 (229) 343-8034 (865) 457-5166
Paris, TN Huntsville, TX Charlottesville, VATom Cunningham Ken Addy Glen Worrell(731) 642-3888 (936) 435-9223 (434) 296-1464
AFFILIATED COMPANIES
Stuntzner FMS Dallas, OR Uruguay Brazil
INVENTORY & MAPPING GROUPJeff Jordan / Albany, GA / (229) 883-0505 x136
FINANCIAL REPORTING GROUPSonya Usry / Albany, GA / (229) 883-0505 x138
ENVIRONMENTAL GROUPJohn Godbee / Statesboro, GA / (912) 489-1655
FOREST OPERATIONS GROUPBill Miller / (912) 655-3550
The F&W Forestry Report is produced by: Bates Associates / PO Box 191386Atlanta, GA 31119-1386 / (770) [email protected]
©2013 F&W Forestry Services, Inc. Reproduction in whole or in part by electronic or mechanical means, without authorization from F&W Forestry Services, Inc., is prohibited.
$15
$12
$9
$6
$3
$0
2008 2009 2010 2011 2012 2013 Q1 Q2 Q3
$0
$5
$10
$15
$20
$25
$30
MidAtlantic
West Gulf
Central Hardwood
Southeast
$0
$5
$10
$15
$20
$25
$0
$3
$6
$9
$12
$15
$0
$5
$10
$15
$20
$25
$30
MidAtlantic
West Gulf
Central Hardwood
Southeast
$25
$20
$15
$10
$5
$0
2008 2009 2010 2011 2012 2013 Q1 Q2 Q3
International Paper Co. has announced it will close its mill at Courtland, Ala., that produces free-sheet and specialty paper products in an era of declining demand in a growing internet-driven paperless society.
The company said the mill will be shut down in stages to be completed by the end of the first quarter of 2014. Some 1,100 employees will be affected as will forest landowners and loggers over a large area of north Alabama and adjoining parts of Tennessee.
“These decisions are especially difficult because of the impact to
long-serving and hard-working employees, their families and the surrounding communities,” said IP Chairman and CEO John Faraci. “This decision to permanently close capacity is primarily being driven by demand decline for uncoated freesheet paper products in the United States.”
Closure of the Courtland facility will leave four IP mills producing similar products: Two uncoated freesheet paper mills at Riverdale, also in Alabama, and Eastover, S.C., and two specialty paper mills at Georgetown, S.C., and Ticonderoga, N.Y.
IP To Close Alabama ‘Freesheet’ Paper Mill
2 // f&w forestry services, inc. Providing management, consulting, and real estate services to landowners since 1962 • Fall 2013

PINE LARGE SAWTIMBER AVERAGE SOUTHEAST / CENTRAL REGION / WEST GULF / MID ATLANTIC
SOUTHEAST HARDWOOD PRICES HARDWOOD PULPWOOD / HARDWOOD SAWTIMBER
for more information and data, visit www.fwforestry.com
$50
$40
$30
$20
$10
$0
$0
$10
$20
$30
$40
$50
MidAtlantic
West Gulf
Central Hardwood
Southeast
Notes to designer:• You will need to manually draw connector lines because many of the data �elds are blank.• If you change any of the data, the ellipses will revert to squares. To change them back to ellipses, select your white arrow, option-click one of the squares, option-click again, and again until all squares are selected. Then go to E�ect > Convert to shape > Ellipses. Select absolute @ 0.05” • Only the graph area of this Illustrator �le will show in the InDesign frame. You will need to manually place the legend and x/y axises in InDesign. This is because working with Illustrator graph axises can get tricky if you have to change the data frequently and the Illustrator legends take up too much real estate.
$0
$10
$20
$30
$40
$50
$0
$5
$10
$15
$20
$25
$30
Hardwood Timber
Hardwood Pulpwood
Notes to designer:• You will need to manually draw connector lines because many of the data �elds are blank.• If you change any of the data, the ellipses will revert to squares. To change them back to ellipses, select your white arrow, option-click one of the squares, option-click again, and again until all squares are selected. Then go to E�ect > Convert to shape > Ellipses. Select absolute @ 0.05” • Only the graph area of this Illustrator �le will show in the InDesign frame. You will need to manually place the legend and x/y axises in InDesign. This is because working with Illustrator graph axises can get tricky if you have to change the data frequently and the Illustrator legends take up too much real estate.
$0
$5
$10
$15
$20
$25$25
$20
$15
$10
$5
$0
2008 2009 2010 2011 2012 2013 Q1 Q2 Q3
2008 2009 2010 2011 2012 2013 Q1 Q2 Q3
Weyerhaeuser To Reopen Alabama Lumber Plant;Wood Products High On ISM Industry Growth List
In a positive development for home construction activity, Weyerhaeuser Company has announced it will re-start production at its engineered lumber facility in south Alabama after a four-year shutdown.
A separate upbeat note: the Institute for Supply Management’s (ISM) manufacturing survey for August ranked wood products second among 15 U.S. industrial groups reporting overall growth after lingering for a prolonged period in the contraction or no-growth categories. The ISM counts wood products separately from pulp and paper in its 18-industry survey.
In ISM’s August manufacturing
survey, the wood products industry ranked second in new orders, first in employment growth, first in industries reporting decreases in customer inventories, and first in increases in export orders. The paper industry in August continued it’s long-run in the ISM growth category but, for a change, ranked below wood products in several categories.
Weyerhaeuser said it will begin plans “effective immediately” to re-start operations at its Evergreen, Ala., facility that produces wood joists—a fundamental building block for wooden structures—through its patented engineering process.
“Customer demand for engineered wood products has improved over
the last year and our Evergreen facility is the ideal location to add production capacity,” said Jan Marrs, manufacturing manager for Weyerhaeuser Engineered Lumber Products.
Weyerhaeuser’s announcement said it would hire 100 new employees for the Evergreen facility by the end of 2014.
Based in Washington state, Weyerhaeuser’s Alabama operations include a lumber manufacturing facility at Millport, a nursery facility at Camden, and ownership of more than half million acres of timberland in 23 counties.
U.S. Congress Back In Session; Vital Forestry Issues Pending
Congress is back in session after its summer vacation break facing a multitude of earth-moving issues from Syria to keeping the government running past Sept. 30. Throw in the approaching federal debt ceiling for good measure.
Caught in the legislative deep squeeze are two issues of vital importance to forest landowners and the broader forest industry:
• Legislation pending in the House and Senate intended to block further
litigation still alive in the 9th Circuit U.S. Court of Appeals by writing existing EPA rules into law that forest roads do not require federal permits but are regulated under state Best Management Practices. This bill was added as an amendment to the pending House version of the Farm Bill that is awaiting a Conference Committee with the Senate to work out a final version.
• An on-going effort by House and Senate committees to rewrite
the federal tax code that puts at risk three existing tax provisions vital to forestland owners: capital gains treatment of timber sales, reforestation costs, and forest management expenses. Although the committee chairmen are seeking a budget-neutral revision, President Obama and Senate Democratic Leader Harry Reid of Nevada say increased revenues must be a part of tax reform.
Fall 2013 • www.fwforestry.com // 3

Some 75 environmental and allied groups led by the Natural Resources Defense Council (NRDC) and the Dogwood Alliance have declared war on wood pellet production in the U.S. South, much of which is exported to Europe to reduce pollution from coal-fired power plants.
The environmentalist battle cry is that mass conversion of trees into pellets is destroying Southern forests. As the Dogwood Alliance—not known for moderation in causes it espouses—put it: “European utility companies are driving the destruction of Southern forests in the name of ‘renewable energy’.”
The specific target of the environmental groups is the cutting and conversion of whole trees into pellets. Woody biomass such as timber harvest residues, including tops and branches are acceptable, but not whole trees. “Real biomass solutions must not be established at the expense of natural forests,” says an NRDC fact sheet that does not mention planted forests.
There also appears to be concern among some segments of the forest industry that the explosive growth of pellet production and exports may threaten wood supplies to other domestic users, notably the pulp and paper industry. Others see this concern as overblown.
The environmental groups have been fired up by the dramatic growth over the past five years of wood pellet production in this country, which
is heavily concentrated in the U.S. South. New pellet plants are springing up all over the region, especially in locales within trucking distance of East Coast and Gulf ports for shipment to European Union countries that are under a mandate to cut carbon emissions by 20 percent by 2020 by reducing coal energy.
According to Forisk Consulting of Athens, Ga., 68 pellet plants are in operation or have been announced for Southern states.
These plants are creating a vast new market for Southern wood and forest landowners. Also, to some degree, the pellet plants are competing with U.S. pulp and paper mills, which are also concentrated in the South, for smaller-sized timber—more often than not plantation pine thinnings—as raw material.
According to the North American Wood Fiber Review, pellet exports from the U.S. South to Europe rose to more than 1.7 million tons in 2012, shattering past records and showing no signs of slowing. Indeed, shipments showed double-digit growth in the first quarter, the publication reported.
The U.S. South has replaced British Columbia as the major supplier of wood pellets to Europe. The United Kingdom currently is the major importer of pellets from both the U.S. and Canada.
What seems most to irk the environmentalist organizations that are fighting the wood pellet industry is the use of whole trees to produce the product which they see as a
great threat to Southern forests. That ignores the fact that in normal times about three-fourths of the wood fiber used by the pulp and paper industry in the South comes from whole trees, which clearly has not destroyed the region’s forests after a half century of operation.
“If big power plants turn increasingly to whole trees for their fuel, it will intensify pressure to overharvest our forests, threatening our climate, wildlife, land, and water,”
a NRDC fact sheet says. “For the biomass industry to grow in a way that helps reduce pollution and protects our forests, large power companies and pellet manufacturers must commit to a wood-sourcing policy that excludes whole trees.”
The dramatic increase in Southern pellet production that has fired up the environmental community also may be causing some degree of concern to other commercial wood users, notably the pulp and paper industry with its large Southern manufacturing base. Indeed, such concern apparently was communicated to the U.S. Trade Representative (USTR) by the American Forest & Paper Association (AFPA) in a letter last May, which was not disclosed publicly by AFPA.
However, the pulp and paper association on its website takes note of the “surge” of pellet exports to Europe and warns it could “impact availability of wood for energy and manufactured products in the U.S.”
Responding to the USTR in their own letter, which was made public,
Environmental Groups Declare War On Wood Pellet Exports;See ‘Destruction’ Of Southern Forests; Some Industry Supply Concerns
© C ZIHE - Fotolia.com
ACCORDING TO THE NORTH AMERICAN WOOD FIBER
REVIEW, PELLET EXPORTS FROM THE U.S. SOUTH TO
EUROPE ROSE TO MORE THAN 1.7 MILLION TONS IN 2012,
SHATTERING PAST RECORDS AND SHOWING NO SIGNS
OF SLOWING
(Continued on page 5)
4 // f&w forestry services, inc. Providing management, consulting, and real estate services to landowners since 1962 • Fall 2013

Southern pulp mills are using more logs and less wood residues to produce paper and packaging products—and it’s not entirely due to the slump in new home construction.
According to the U.S. Forest Service’s latest report on Southern pulpwood production, the industry’s 81 mills in the region consumed almost 167 million tons of whole trees and residues in 2011 (latest year reported). Of that total, some 136.6 million tons, about 82 percent, was in the form of “round wood”—virtually all of it whole trees—and 30.4 million, or 18 percent, was in the form of wood residues from lumber mills and other wood-using facilities (see table).
While some of the greater use of whole trees for paper making is due to reduced lumber and wood product production—thus less residues—is a result of the housing slump, the trend to greater use of whole trees began a few years earlier.
According to the Forest Service report, in 2002 the pulp industry in the South used a total of 167.6 million tons of wood fiber, of which 31.4 percent was in the form of residues and the remainder in whole tree form. In 2003, well before the housing bust, the percent of residues used by the mills dropped to the 25 percent range before sliding to the 20 percent and below as the housing bust took hold.
The increased use of whole
trees as a fiber source has been an unintended benefit of the housing bust to forestland owners by providing some support for pulpwood prices while sawtimber prices tanked.
The number of pulp and paper mills in the Southern region has stabilized at 81 in operation in 2011, according to the Forest Service report. It noted the closure of International Paper Co.’s huge mill at Franklin, Va., in 2010. The company subsequently established a
new, smaller “fluff” pulp mill at the Franklin site that began production in 2012.
Georgia continued to be the leading pulpwood producing state in the Southern region, followed by Alabama. Those states, plus Mississippi, South Carolina, Louisiana, and North Carolina, accounted for 70 percent of Southern pulpwood production in 2011.
Southern Pulp Mills Increase Use Of Whole TreesAs Fiber Source; Trend Began Before Housing Slump
PULPWOOD PRODUCTION IN THE SOUTH 2007-2011SOURCE OF WOOD & STATE 2007 2008 2009 2010 2011 2010/2011
% CHANGE
ROUNDWOOD
ALABAMA 21,540 21,140 19,296 21,738 21,352 -2%
ARKANSAS 8,406 8,370 7,899 8,956 8,874 -1%
FLORIDA 8,933 8,102 9,931 9,468 9,912 5%
GEORGIA 22,353 25,110 21,733 25,244 24,764 -2%
KENTUCKY 901 940 1,025 1,072 1,232 15%
LOUISIANA 13,048 12,866 12,216 12,869 12,649 -2%
MISSISSIPPI 14,806 14,260 14,573 17,225 15,663 -9%
NORTH CAROLINA 10,177 9,924 9,344 9,500 8,948 -6%
OKLAHOMA 1,262 1,602 1,382 1,581 1,213 -23%
SOUTH CAROLINA 11,834 12,677 12,995 12,840 14,035 9%
TENNESSEE 4,314 4,200 4,249 4,678 4,634 -1%
TEXAS 6,473 7,614 6,432 6,572 5,668 -14%
VIRGINIA 5,849 6,271 5,750 8,446 7,608 -10%
ALL STATES 129,897 133,075 126,825 140,189 136,553 -3%
RESIDUES 43,936 44,075 35,407 35,212 30,390 -14%
TOTAL 173,833 177,151 162,231 175,401 166,943 -5%
NUMBER OF MILLS 87 86 83 82 81 -1%
the heads of the National Alliance of Forest Owners (NAFO) and the U.S. Industrial Pellet Association (USIPA) state that “a significant body of information establishes that there is enough privately-owned sustainable fiber to meet the demands of both European energy markets and the markets served by domestic
manufacturing.”Specifically, the NAFO/USIPA
letter cited U.S. Census Bureau data showing that wood fiber consumption by the pulp and paper industry has declined from 400 to 290 million metric tons over the past 15 years, a decrease of 28 percent.
“This strongly supports the premise
that private forests in the U.S. can sustainably produce sufficient fiber to meet the demands of new markets, including the European industrial wood pellet market,” said the USTR letter signed jointly by David P. Tenny of NAFO and M. Seth Ginther of USIPA.
Source: USDA Forest Service http://www.srs.fs.fed.us/pubs/rb/rb_srs194.pdf
(Continued on page 5)
Wood Pellet Exports (continued)
(thousand green tons)
Fall 2013 • www.fwforestry.com // 5

Just eight years after its founding, Kapstone Paper and Packaging Corporation has jumped its manufacturing operations cross-country from its Southern base to the Pacific Northwest with the acquisition of Longview Fibre Paper and Packaging, Inc., in Washington state for slightly over a billion dollars.
It was the fourth pulp and paper facility to be acquired by Chicago-headquartered Kapstone since the company was founded from scratch in 2005 by Roger W. Stone, whose family has been involved in the U.S. pulp and paper industry for some half century.
Separately, Weyerhaeuser Co. announced it had acquired Longview’s 645,000 acres of Douglas fir timberland in Washington and
Oregon for $2.65 billion, increasing its forestland holdings in the Pacific Northwest to 2.6 million acres and its total U.S. land holdings—owned or controlled—to 6.6 million acres.
“This acquisition will increase our exposure to the highly desirable containerboard segment,” said Stone, the Kapstone chairman and CEO. “It also broadens our Kraft paper line and makes Kapstone a global producer of high performance extensible multi-wall paper, a grade which is growing at about 4 percent per year,” he said.
The acquisition includes a huge pulp and paper manufacturing complex with five paper machines at Longview, Wash., capable of producing some 1.15 million tons of containerboard and Kraft paper
annually. The Washington state pulp and
paper complex is the fourth mill to be acquired by Kapstone since its founding. The others are located at Roanoke Rapids, N.C., acquired from International Paper Company in 2006; North Charleston, S.C., acquired from MeadWestvaco Corporation in 2008; and at Cowpens, S.C., which came with Kapstone’s acquisition of U.S. Corrugated, Inc., in 2011.
Kapstone also has lumber and chip mill operations in South Carolina that came with the purchase of the North Charleston mill. However, the company does not own any timberlands, buying all its pulpwood and fiber needs.
Kapstone Expands From South To Pacific Northwest;Weyerhaeuser Grows Its Forestland Holdings
A Texas company seeking to produce oil from pine wood chips says it is now shipping both gasoline and diesel fuel in limited quantities from its start-up plant in Columbus, Miss., utilizing a proprietary process.
KiOR, Inc., a publicly-held company based in Pasadena, Texas, said it has begun shipping “cellulosic gasoline” from the Columbus facility. It previously announced that shipments of diesel from Columbus had commenced.
Building on those two developments, KiOR President Fred Cannon said in the company’s 2013 second quarter financial report that “we more than doubled the run time of our core technology, the Biomass Fluid Catalytic Cracking Unit (BFCC), to 43 percent in the quarter, up from 20 percent in the first quarter.”
“In total, we shipped over 75,000 gallons of cellulosic fuel from Columbus,” Cannon said. “The BFCC unit is running now and producing high quality oil that we are preparing to upgrade into fuel and ship to our customers. Over the next few months we will focus on further building that progress and we look to push the facility closer to it its nameplate capacity.” (An outside source said the “nameplate capacity” of the Columbus facility is 13 million gallons per year.)
But while production at the Columbus plant showed progress, its quarterly losses continued to mount, not surprising for a high-tech start-up. Its second quarter financial report showed a net loss of $38.5 million compared to $31.3 million for the first quarter of this year. In the
second quarter of 2012, it reported a loss of $23 million.
Despite the quarterly operating losses, KiOR is pushing ahead with plans for a second and much larger plant at Natchez, Miss. The company reported spending $5.1 million in the second quarter on “front end engineering and design” for the proposed facility.
Among KiOR’s big-name financial backers are Vinod Khosia and his venture capital company, Khosia Ventures. Khosia has backed other bio-fuel ventures, including the attempt by Range Fuels to covert pine chips to ethanol at a Georgia facility that ended in failure and bankruptcy. The state of Mississippi also has provided substantial financing assistance to KiOR.
Production Grows, Losses Mount At Mississippi PlantConverting Pine Chips Into Gasoline And Diesel Fuel
6 // f&w forestry services, inc. Providing management, consulting, and real estate services to landowners since 1962 • Fall 2013
U.S. Log & Lumber Exports To China Roar BackAfter Surprising Lag In Year’s First Quarter
After pausing in the first part of the year, log and lumber exports from the U.S. to China from West Coast ports rebounded robustly in the second quarter, according to the U.S. Forest Service. The export surge was confirmed by a private, non-government reporting service that said the Chinese wood import market “came back roaring.”
The Forest Service’s Research Station in Portland, Ore., said total log exports through U.S. Pacific Coast ports jumped 28 percent over the first quarter, totaling 540 million board feet. Shipments of sawn lumber from the West Coast also increased but by a more modest five
percent to 230 million board feet.Resurgent Chinese demand was
the driving force behind the surge in log and lumber exports from the West Coast.
“In the second quarter of 2013, China imported 349 million board feet of West Coast logs, compared to 243 million board feet earlier in the year,” according to a Forest Service news release. “At West Coast ports, 65 percent of outgoing logs and 35 percent of outgoing lumber were destined for China.”
Wood Resources International LLC, a Seattle-based firm that tracks and publishes timber data world- wide, confirmed the sharp increase
in lumber and log shipments to China from the U.S. and other timber-exporting countries such as Canada, Russia, and New Zealand.
“The higher demand for wood products comes as house-building activities (in China) have increased in the first half of 2013 as compared to the same period in 2012,” Wood Resources International reported. “Year-over-year, investments were up 13 percent in residential buildings, and 23 percent in commercial buildings, according to recently published official Chinese statistics.”
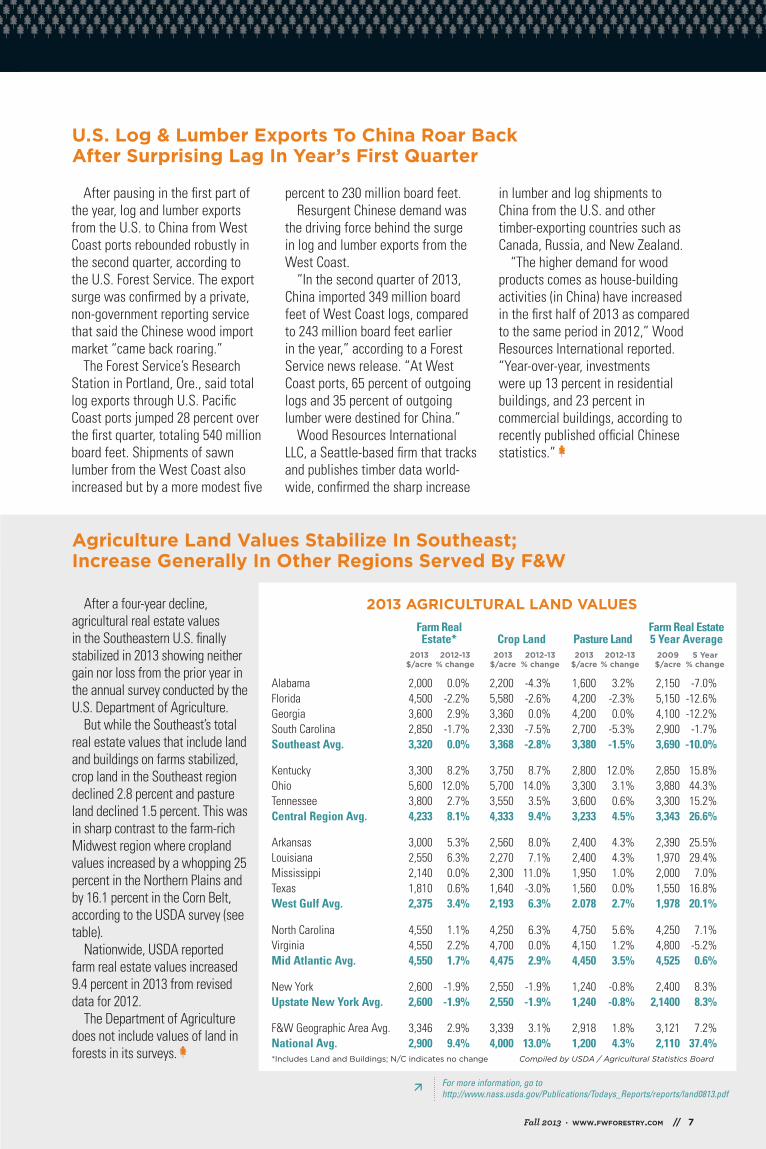
After a four-year decline, agricultural real estate values in the Southeastern U.S. finally stabilized in 2013 showing neither gain nor loss from the prior year in the annual survey conducted by the U.S. Department of Agriculture.
But while the Southeast’s total real estate values that include land and buildings on farms stabilized, crop land in the Southeast region declined 2.8 percent and pasture land declined 1.5 percent. This was in sharp contrast to the farm-rich Midwest region where cropland values increased by a whopping 25 percent in the Northern Plains and by 16.1 percent in the Corn Belt, according to the USDA survey (see table).
Nationwide, USDA reported farm real estate values increased 9.4 percent in 2013 from revised data for 2012.
The Department of Agriculture does not include values of land in forests in its surveys.
Agriculture Land Values Stabilize In Southeast;Increase Generally In Other Regions Served By F&W
2013 AGRICULTURAL LAND VALUES Farm Real Farm Real Estate Estate* Crop Land Pasture Land 5 Year Average 2013 2012-13 2013 2012-13 2013 2012-13 2009 5 Year $/acre % change $/acre % change $/acre % change $/acre % change
Alabama 2,000 0.0% 2,200 -4.3% 1,600 3.2% 2,150 -7.0%Florida 4,500 -2.2% 5,580 -2.6% 4,200 -2.3% 5,150 -12.6%Georgia 3,600 2.9% 3,360 0.0% 4,200 0.0% 4,100 -12.2%South Carolina 2,850 -1.7% 2,330 -7.5% 2,700 -5.3% 2,900 -1.7%Southeast Avg. 3,320 0.0% 3,368 -2.8% 3,380 -1.5% 3,690 -10.0%
Kentucky 3,300 8.2% 3,750 8.7% 2,800 12.0% 2,850 15.8%Ohio 5,600 12.0% 5,700 14.0% 3,300 3.1% 3,880 44.3%Tennessee 3,800 2.7% 3,550 3.5% 3,600 0.6% 3,300 15.2%Central Region Avg. 4,233 8.1% 4,333 9.4% 3,233 4.5% 3,343 26.6%
Arkansas 3,000 5.3% 2,560 8.0% 2,400 4.3% 2,390 25.5%Louisiana 2,550 6.3% 2,270 7.1% 2,400 4.3% 1,970 29.4%Mississippi 2,140 0.0% 2,300 11.0% 1,950 1.0% 2,000 7.0%Texas 1,810 0.6% 1,640 -3.0% 1,560 0.0% 1,550 16.8%West Gulf Avg. 2,375 3.4% 2,193 6.3% 2.078 2.7% 1,978 20.1%
North Carolina 4,550 1.1% 4,250 6.3% 4,750 5.6% 4,250 7.1%Virginia 4,550 2.2% 4,700 0.0% 4,150 1.2% 4,800 -5.2%Mid Atlantic Avg. 4,550 1.7% 4,475 2.9% 4,450 3.5% 4,525 0.6%
New York 2,600 -1.9% 2,550 -1.9% 1,240 -0.8% 2,400 8.3%Upstate New York Avg. 2,600 -1.9% 2,550 -1.9% 1,240 -0.8% 2,1400 8.3%
F&W Geographic Area Avg. 3,346 2.9% 3,339 3.1% 2,918 1.8% 3,121 7.2%National Avg. 2,900 9.4% 4,000 13.0% 1,200 4.3% 2,110 37.4%*Includes Land and Buildings; N/C indicates no change Compiled by USDA / Agricultural Statistics Board
For more information, go to http://www.nass.usda.gov/Publications/Todays_Reports/reports/land0813.pdf
Fall 2013 • www.fwforestry.com // 7

100
210
320
430
540
650
Notes to designer:• Only the graph area of this Illustrator �le will show in the InDesign frame. You will need to manually place the legend and x/y axises in InDesign. This is because working with Illustrator graph axises can get tricky if you have to change the data frequently and the Illustrator legends take up too much real estate.
2008 2009 2010 2011 2012 2013 Q3
RESIDENTIAL CONSTRUCTION LUMBER PRICES
650
540
430
320
210
100
30-YEAR FIXED RATESource: Freddie Mac
SOUTHERN PINE–S/MBFSource: Random Lengths Southern Pine Composite Index
US DOLLAR VALUE AGAINST 26 MAJOR TRADING PARTNERSSource: Federal Reserve
266
350
246 239
TIMBER MARKET INDICATORS
244
0.4
0.6
0.8
1.0
1.2
1.4
1.6
1.8
Notes to designer:• If you change any of the data, the ellipses will revert to squares. To change them back to ellipses, select your white arrow, option-click one of the squares, option-click again, and again until all squares are selected. Then go to Effect > Convert to shape > Ellipses. Select absolute @ 0.05” • Only the graph area of this Illustrator �le will show in the InDesign frame. You will need to manually place the legend and x/y axises in InDesign. This is because working with Illustrator graph axises can get tricky if you have to change the data frequently and the Illustrator legends take up too much real estate.
HOUSING PERMITS
2008 2009 2010 2011 2012 2013 Q3
1.8
1.6
1.4
1.2
1.0
0.8
0.6
0.4
1.8
1.6
1.4
1.2
1.0
0.8
0.6
0.4
IN MILLIONS OF UNITS (ANNUALIZED) THROUGH AUGUST Source: US Department of Commerce
IN MILLIONS OF UNITS (ANNUALIZED) THROUGH AUGUSTSource: US Department of Commerce
HOUSING STARTS
.781.905 .906
.572 .554.605 .624 .587 .609
2008 2009 2010 2011 2012 2013 Q3
200
250
300
350
400
Notes to designer:• Only the graph area of this Illustrator �le will show in the InDesign frame. You will need to manually place the legend and x/y axises in InDesign. This is because working with Illustrator graph axises can get tricky if you have to change the data frequently and the Illustrator legends take up too much real estate.
2008 2009 2010 2011 2012 2013
400
350
300
250
200
284261
Q1 Q2 Q3
3
4
5
6
7
Notes to designer:• This is a column graph with a manual area �ll. The area fill is on a separate layer. • Only the graph area of this Illustrator �le will show in the InDesign frame. You will need to manually place the legend and x/y axises in InDesign. This is because working with Illustrator graph axises can get tricky if you have to change the data frequently and the Illustrator legends take up too much real estate.
MORTGAGE RATES
2008 2009 2010 2011 2012 2013
7
6
5
4
3
6.03%
5.04%
4.69%
Q1 Q2 Q3
90
100
110
120
130
Notes to designer:• This is a column graph with a manual area �ll. The area fill is on a separate layer. • Only the graph area of this Illustrator �le will show in the InDesign frame. You will need to manually place the legend and x/y axises in InDesign. This is because working with Illustrator graph axises can get tricky if you have to change the data frequently and the Illustrator legends take up too much real estate.
US DOLLAR
130
120
110
100
90
100106
97
2008 2009 2010 2011 2012 2013 Q1 Q2 Q3
IN MILLIONS OF UNITS (ANNUALIZED) THROUGH JULYSource: US Department of Commerce
102
.830
4.45%
3.66%
100
3.50%
294
241
312
.942.907
325
423
100 1013.69%
395
4.44%102
363
PRESORTED1ST CLASS
US POSTAGEPAID
PERMIT #4009ATLANTA, GA.
PO Box 3610 Albany, Georgia 31706