Forestry Privatization in South Africa by Aditya Agarwal Siddharth Bafna Alok Gupta Ioannis Maniatis...
25
Forestry Privatization in South Africa by Aditya Agarwal Siddharth Bafna Alok Gupta Ioannis Maniatis Ozlem Tanik
-
Upload
jamison-tiley -
Category
Documents
-
view
215 -
download
0
Transcript of Forestry Privatization in South Africa by Aditya Agarwal Siddharth Bafna Alok Gupta Ioannis Maniatis...

Forestry Privatization in South Africa
byAditya AgarwalSiddharth Bafna
Alok GuptaIoannis Maniatis
Ozlem Tanik

Agenda
• Background • Key Parties• Industry – Global & Local• Analysis of Parameters & Risks• Opportunities & Plans• Class Discussion• Valuation• Results

Background
• South African Government offers 75% shareholding in SAT Pty, a timber plantation
• 10% of South Africa’s forestry assets• Land to be leased and not sold• 187 K hectares land out of which 126 K hectares
plantations• Equity to be held by a consortium with min 10%
stake for Black Empowerment partner

Key Parties- CTI
• One of 3 bidders• The largest cooling tower manufacturer in
India • One of the largest traders of timber in India• $46.87 million revenues in 2001• Importer of logs from RSA and New Zealand• Seeks to acquire overseas forestry assets

Key Parties-SAT
• Fully owned by South African Government
• Revenues (2000) - Rand 265m (US$ 35m)
• 1.8m m3 of timber produced per year
• 80% sold under long-term contracts
• Export handling capacity of 200k m3 at Richards Bay port

Key Parties-SAT
Strengths• High product quality• Commanding local market
share• Fragmented local
competition• Imports are
uncompetitive• Debt free balance sheet• Experienced forestry
management staff
Weaknesses• High overhead
costs• Below average
productivity standards
• Inability to retrench redundant labor

Industry characteristics
• Global supply of rainforest timber decreasing due to environmental concerns
• Environmentally certified (plantation) wood has more acceptability in global markets
• Demand for saw logs expected to increase faster than supply both globally and locally
• Export price realizations are higher than domestic prices

Global market outlook
2010 2020
Hardwood 142 m m3 200 m m3
Softwood 410 m m3 475 m m3
• Forecasted global demand supply gap
• International prices expected to grow at 1.1% in the long term

Local Market outlook
• Demand supply gap in the medium term: 32%
• Demand supply gap in the long term: 40%– Based on customer surveys
• Domestic prices are expected to grow at 1.8% over the long term to achieve export price parity in 30 years
• Lower price volatility due to long term contracts

Sociopolitical Parameters
• Political Stability• Government Committed to Privatization• Highly Unionized Labor – Unions oppose
privatization• Black empowerment movement• Regional instability – Crisis in Zimbabwe• AIDS Pandemic Threat• Moderate Corruption • High Crime Rate

Economic Parameters
• Emerging markets crisis – Depreciating Rand
• Responsible Economic Policies– Growing Trade Surplus– Falling Inflation– Decreasing Budget Deficit
• High Unemployment

Key Economic Parameters
South Africa
Population 44.4m (2001)a
Currency RandR8.61:US$1 (average, 2001)
GDP US$113bn (2001)US$350bn (2001, at PPP)
GDP growth 2.2% (average, 1997-2001)2.2% (2001)
GDP per capita US$2,549 (2001)US$7,882 (2001, at PPP)
Inflation 6.3% (average, 1997-2001)5.6% (average, 2001)

SA Rand vs. US Dollar 1991-2001
0
1
2
3
4
5
6
7
8
9
10
1/1
/1991
7/1
/1991
1/1
/1992
7/1
/1992
1/1
/1993
7/1
/1993
1/1
/1994
7/1
/1994
1/1
/1995
7/1
/1995
1/1
/1996
7/1
/1996
1/1
/1997
7/1
/1997
1/1
/1998
7/1
/1998
1/1
/1999
7/1
/1999
1/1
/2000
7/1
/2000
1/1
/2001
7/1
/2001
Ran
d/$
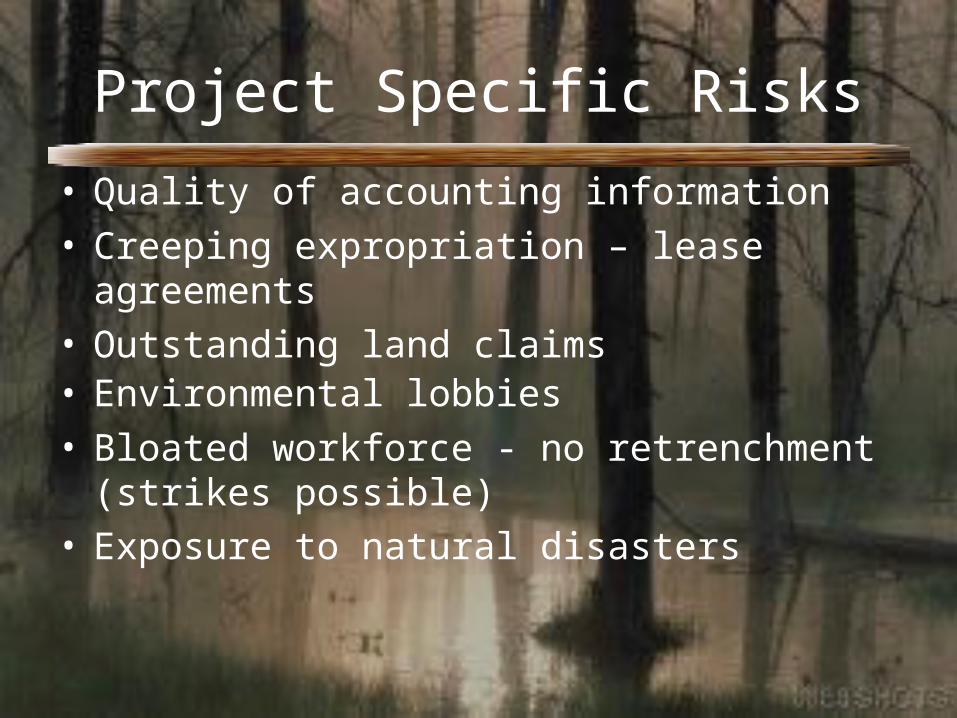
Project Specific Risks
• Quality of accounting information
• Creeping expropriation – lease agreements• Outstanding land claims• Environmental lobbies
• Bloated workforce - no retrenchment (strikes possible)
• Exposure to natural disasters

Mitigation of Risks
• Currency risk hedging through exports• Strong due diligence and use of benchmarks for
valuation• Creeping expropriation - lease rent to be
escalated in line with inflation (PPI)• Land claims - compensation from Government
for upheld claims • Environmental opposition – FSC certification for
sustainable forest utilization• Insurance against natural disasters

Future Opportunities / Plans
• Increase in output by around 200,000 m3 through genetic improvements (already underway)
• Improvement in productivity through training and capital investments
• Build export handling facility at Maputo port (closer to the plantations) at the cost of R 55m
• Improve portfolio of customers by increasing exports and domestic spot sales

Case Discussion

Valuation methodology
• APV method
• Cash flow projections for 28 years
• Incorporated domestic and export price growths and volatilities
• Ran Monte Carlo for base case scenario
• Valued the option for investing in the export handling facility at Maputo using MC simulation

Key Valuation Assumptions
• Improved productivity incorporated as reduction in COGS
• Increased yields included in production forecasts
• Tax setoff to the extent of value of the plantations in total enterprise value

Proforma Profit & Loss statementsYear 1 Year 2 Year 3 Year 4 Year 5 Year 6
Domestic Sales Volume 1580 1523 1501 1698 1733 1799Export Sales Volume - Richards Bay 200 200 200 200 200 200Export Sales Volume - Maputo 0 0 0 0 0Total Sales Volume 1780 1723 1701 1898 1933 1999Domestic Sales Price 149 152 154 157 160 163Domestic Sales Price Growth 1.8% 1.8% 1.8% 1.8% 1.8%Export Sales Price - FOB 440 445 450 455 460 465Export Sales Price Growth 1.1% 1.1% 1.1% 1.1% 1.1%Freight & Handling cost - Richards bay 290 290 290 290 290 290Freight & Handling cost - Maputo 260 260 260 260 260 260Export realization - Richards bay 150 155 160 165 170 175Export realization - Maputo 180 185 190 195 200 205
Sales 265 308 261 870 263 636 299 766 311 253 327 982Plantation costs 41% 108 776 104 748 102 818 113 911 118 276 124 633Overheads / Other costs 92 915 93 646 94 384 95 130 95 130 95 130Additional depreciation on Maputo investment 0 0 0 0 0 0Net Operating Income-forestry 63 617 63 476 66 434 90 725 97 847 108 219Losses from Sawmills 5 000Net Operating Income-Komatiland 58 617 63 476 66 434 90 725 97 847 108 219Finance Costs 30 966 61 816 61 117 52 332 40 329 30 800Income Before Taxation 27 650 1 660 5 317 38 393 57 518 77 419Taxation 0 0 0 0 0 0Net Income 27 650 1 660 5 317 38 393 57 518 77 419Dividend 0 0 0 0 0 0Retained Income 27 650 1 660 5 317 38 393 57 518 77 419

Cost of Capital – Base CaseRisk Premium Calculation
Inputs Output Category5.42 U.S. risk free in %3.50 U.S. risk premium in %
93.10 Current U.S. Credit Rating37.50 Institutional Investor country credit rating (0-100)
25.02 Anchored Cost of Equity Capital for project of average risk in country (ICCRC)
16.10 Country Risk Premium
Industry Adjustment1.05 Beta (Industry)
0.18 Sector adjustment
Project Risk Mitigation (-10 to 10; where 10=risk completely eliminated, 0=average for country)
Weights Score
Impact on Country Premium
Sovereign0.40 2.00 -1.29 Currency (convertibility)0.15 0.00 0.00 Expropriation (direct, diversion, creeping)0.05 -5.00 0.40 Commercial International partners0.05 -10.00 0.80 Involvement of Multilateral Agencies0.05 -2.00 0.16 Sensitivity of Project to wars, strikes, terrorism0.05 0.00 0.00 Sensitivity of Project to natural disasters
Project Cost of Capital 24.92
US inflation outlook 2.80
Real cost of Capital 21.52

Cost of Capital – with Maputo Option
Risk Premium CalculationInputs Output Category
5.42 U.S. risk free in %3.50 U.S. risk premium in %
93.10 Current U.S. Credit Rating37.50 Institutional Investor country credit rating (0-100)
25.02 Anchored Cost of Equity Capital for project of average risk in country (ICCRC)
16.10 Country Risk Premium
Industry Adjustment1.05 Beta (Industry)
0.18 Sector adjustment
Project Risk Mitigation (-10 to 10; where 10=risk completely eliminated, 0=average for country)
Weights Score
Impact on Country Premium
Sovereign0.40 5.00 -3.22 Currency (convertibility)0.15 0.00 0.00 Expropriation (direct, diversion, creeping)0.05 -5.00 0.40 Commercial International partners0.05 -10.00 0.80 Involvement of Multilateral Agencies0.05 -2.00 0.16 Sensitivity of Project to wars, strikes, terrorism0.05 0.00 0.00 Sensitivity of Project to natural disasters
Project Cost of Capital 22.99
US inflation outlook 2.80
Real cost of Capital 19.64

Valuation results
Base case• Currency risk hedged
for 12 years• Cost of capital:
21.52%• Enterprise value:
R484 million
With Maputo option• Currency risk hedged
for 21 years• Cost of capital:
19.64%• Enterprise value:
R598 million
Value of the Maputo option: R114 million

Enterprise value
Final Amount
0
0.01
0.02
0.03
0.04
0.05
0.06
0.07
402333.3333 542333.3333 682333.3333 822333.3333 962333.3333
Pro
bab
ility
Enterprise Value WM
Enterprise Value

Q & A