
Forest treatment residues for thermal energy compared with disposal by onsite burning: Emissions and...
10
Forest treatment residues for thermal energy compared with disposal by onsite burning: Emissions and energy return Greg Jones a, *, Dan Loeffler b , David Calkin a , Woodam Chung c a Human Dimensions Science Program, Rocky Mountain Research Station, USDA Forest Service, PO Box 7669, 200 East Broadway Street, Missoula, MT 59807, USA b The University of Montana, College of Forestry and Conservation, PO Box 7669, 200 East Broadway Street, Missoula, MT 59807, USA c The University of Montana, College of Forestry and Conservation, Missoula, MT 59812, USA article info Article history: Received 28 January 2009 Received in revised form 26 August 2009 Accepted 6 January 2010 Available online 29 January 2010 Keywords: Biomass energy Bioenergy Emissions Carbon emissions Greenhouse gases GHG Logging residues Woody biomass Forestry abstract Mill residues from forest industries are the source for most of the current wood-based energy in the US, approximately 2.1% of the nation’s energy use in 2007. Forest residues from silvicultural treatments, which include limbs, tops, and small non-commercial trees removed for various forest management objectives, represent an additional source of woody biomass for energy. We spatially analyzed collecting, grinding, and hauling forest residue biomass on a 515,900 ha area in western Montana, US, to compare the total emissions of burning forest residues in a boiler for thermal energy with the alternatives of onsite disposal by pile-burning and using either natural gas or #2 distillate oil to produce the equivalent amount of useable energy. When compared to the pile-burn/fossil fuel alternatives, carbon dioxide emissions from the bioenergy alternative were approximately 60%, methane emissions were approximately 3%, and particulate emissions less than 10 mm were 11% and 41%, respectively, for emission control and no-control boilers. Emis- sions from diesel consumption for collecting, grinding, and hauling biomass represented less than 5% of the total bioenergy emissions at an average haul distance of 136 km. Across the study area, an average 21 units of bioenergy were produced for each unit of diesel energy used to collect, grind, and haul biomass. Fossil fuel energy saved by the bioenergy alternative relative to the pile-burn/fossil fuel alternatives averaged 14.7–15.2 GJ t 1 of biomass. Published by Elsevier Ltd. 1. Introduction Wood provided 2.3 EJ of energy in the US in 2007, or approxi- mately 2.1% of the nation’s energy use [1]. Mill residues from forest industries are the source for most of this current wood- based energy in the US [2] and Zerbe [3] estimates that up to 10% of the US energy requirement could eventually be produced from wood. Forest residues from silvicultural treatments, which include limbs, tops, and small non- commercial trees removed for various forest management objectives, represent a potential source for producing signifi- cant additional quantities of woody biomass for energy production [4–8]. For example, in the western US alone there are approximately 3.7 Mha of accessible forestland that could benefit from mechanical fuel treatments to reduce hazardous fuels and effects of severe wildfires [7]. The majority of * Corresponding author. Tel.: þ1 406 329 3396; fax: þ1 406 329 3487. E-mail addresses: [email protected] (G. Jones), drloeffl[email protected] (D. Loeffler), [email protected] (D. Calkin), woodam.chung@ umontana.edu (W. Chung). Available at www.sciencedirect.com http://www.elsevier.com/locate/biombioe biomass and bioenergy 34 (2010) 737–746 0961-9534/$ – see front matter Published by Elsevier Ltd. doi:10.1016/j.biombioe.2010.01.016
-
Upload
greg-jones -
Category
Documents
-
view
213 -
download
0
Transcript of Forest treatment residues for thermal energy compared with disposal by onsite burning: Emissions and...

b i o m a s s a n d b i o e n e r g y 3 4 ( 2 0 1 0 ) 7 3 7 – 7 4 6
Avai lab le a t www.sc iencedi rec t .com
ht tp : / /www.e lsev i er . com/ loca te /b iombioe
Forest treatment residues for thermal energy compared withdisposal by onsite burning: Emissions and energy return
Greg Jones a,*, Dan Loeffler b, David Calkin a, Woodam Chung c
a Human Dimensions Science Program, Rocky Mountain Research Station, USDA Forest Service, PO Box 7669,
200 East Broadway Street, Missoula, MT 59807, USAb The University of Montana, College of Forestry and Conservation, PO Box 7669, 200 East Broadway Street,
Missoula, MT 59807, USAc The University of Montana, College of Forestry and Conservation, Missoula, MT 59812, USA
a r t i c l e i n f o
Article history:
Received 28 January 2009
Received in revised form
26 August 2009
Accepted 6 January 2010
Available online 29 January 2010
Keywords:
Biomass energy
Bioenergy
Emissions
Carbon emissions
Greenhouse gases
GHG
Logging residues
Woody biomass
Forestry
* Corresponding author. Tel.: þ1 406 329 339E-mail addresses: [email protected] (G.
umontana.edu (W. Chung).0961-9534/$ – see front matter Published bydoi:10.1016/j.biombioe.2010.01.016
a b s t r a c t
Mill residues from forest industries are the source for most of the current wood-based
energy in the US, approximately 2.1% of the nation’s energy use in 2007. Forest residues
from silvicultural treatments, which include limbs, tops, and small non-commercial trees
removed for various forest management objectives, represent an additional source of
woody biomass for energy. We spatially analyzed collecting, grinding, and hauling forest
residue biomass on a 515,900 ha area in western Montana, US, to compare the total
emissions of burning forest residues in a boiler for thermal energy with the alternatives of
onsite disposal by pile-burning and using either natural gas or #2 distillate oil to produce
the equivalent amount of useable energy. When compared to the pile-burn/fossil fuel
alternatives, carbon dioxide emissions from the bioenergy alternative were approximately
60%, methane emissions were approximately 3%, and particulate emissions less than
10 mm were 11% and 41%, respectively, for emission control and no-control boilers. Emis-
sions from diesel consumption for collecting, grinding, and hauling biomass represented
less than 5% of the total bioenergy emissions at an average haul distance of 136 km. Across
the study area, an average 21 units of bioenergy were produced for each unit of diesel
energy used to collect, grind, and haul biomass. Fossil fuel energy saved by the bioenergy
alternative relative to the pile-burn/fossil fuel alternatives averaged 14.7–15.2 GJ t�1 of
biomass.
Published by Elsevier Ltd.
1. Introduction treatments, which include limbs, tops, and small non-
Wood provided 2.3 EJ of energy in the US in 2007, or approxi-
mately 2.1% of the nation’s energy use [1]. Mill residues from
forest industries are the source for most of this current wood-
based energy in the US [2] and Zerbe [3] estimates that up to
10% of the US energy requirement could eventually be
produced from wood. Forest residues from silvicultural
6; fax: þ1 406 329 3487.Jones), [email protected]
Elsevier Ltd.
commercial trees removed for various forest management
objectives, represent a potential source for producing signifi-
cant additional quantities of woody biomass for energy
production [4–8]. For example, in the western US alone there
are approximately 3.7 Mha of accessible forestland that could
benefit from mechanical fuel treatments to reduce hazardous
fuels and effects of severe wildfires [7]. The majority of
s (D. Loeffler), [email protected] (D. Calkin), woodam.chung@

gninnihT tseroF
eerT-elohW htiw
gnitsevraH
nruB
saG larutaN
rof relioB ni
ygrenE eht
tnelaviuqE
eht fo
ygreneoiB
evitanretlA
dnirG
seudiseR
luaH
seudiseR
nruB
ni seudiseR
rof relioB
ygrenE
tcelloC
seudiseR tnemtaerT
gnidnaL ta
,sbmil ,spoT(
)seert llams dna
ygreneoiB
evitanretlA
nruB-eliP
sevitanretlA
nruB
etallitsiD 2#
relioB ni liO
eht rof
ygrenE
tnelaviuqE
eht fo
ygreneoiB
evitanretlA
nruB-eliP
seudiseR
gnidnaL ta
Fig. 1 – Emissions from collecting, grinding, and hauling
forest residues in the bioenergy alternative were compared
with pile-burn alternatives that include use of fossil fuels
to collect residues for onsite burning and provide thermal
energy in a boiler to produce the equivalent usable energy
as the bioenergy alternative.
b i o m a s s a n d b i o e n e r g y 3 4 ( 2 0 1 0 ) 7 3 7 – 7 4 6738
residues from forest treatments, including mechanical fuel
treatments, historically have been disposed of by burning
onsite, releasing a significant quantity of energy that poten-
tially could be used to offset fossil fuel consumption.
Increasing the use of woody biomass for energy produc-
tion is one of the ways that forest management may
contribute to carbon management objectives [9]. Based on
USDA Forest Service inventories, forest ecosystem carbon
stocks in the US have increased since 1953 providing an
important offset to fossil fuel emissions, but in recent years
the rate of increase has slowed because of increasing harvest
in some areas and declining growth with maturing forests in
other areas [10]. Various forestry activities may enable the
sequestration of additional carbon by either increasing the
sequestration rate or reducing emissions, although more
information is needed about best management practices for
carbon [11].
Studies have addressed various aspects of utilizing forest
residue biomass for energy production and the associated
carbon emissions and sequestration. For example, several
studies have looked at the financial aspects of utilizing forest
residues from silvicultural treatments and the potential
quantities of biomass available over time [5,12,13]. Skog [14]
estimates carbon sequestered in harvested wood products.
Markewitz [15] highlights a framework for carbon accounting
during silvicultural activities within the forest, and addition-
ally notes that overall, little effort has been applied to carbon
accounting during forestry operations. The Consortium for
Research on Renewable Industrial Materials produced esti-
mates of fuel consumption per cubic meter harvested for
stump-to-truck and stump-to-mill [16], and a much earlier
estimate was produced by Watson et al. [17].
There is inadequate information about the trade-offs and
benefits of using forest residues to produce thermal energy as
compared to standard slash burning practices. In order to
compare the trade-offs all fossil fuels used in collecting,
grinding, and hauling must be considered, as well as the
amount of fossil fuel energy offset through use of this biofuel.
Forest residues are often dispersed over extensive landscapes,
sometimes requiring long haul distances to deliver the resi-
dues for energy utilization. How much fossil fuel is required to
harvest, grind, and haul this woody biomass from various
landscape locations, and how does it compare with the bio-
energy produced? What are the net emissions of key green-
house gases and particulate matter of utilizing forest residues
for energy production from various landscape locations? How
do these emissions compare with the common practice of
burning these forest residues onsite? Answers to questions
such as these are needed to inform policy as well as potential
investments in infrastructure.
We conducted a spatial analysis on a 515,900 ha area in
western Montana to compare the total emissions from
utilizing forest residues for thermal energy production with
the alternative of disposing of these residues by onsite
burning and using fossil fuels for the energy that the biomass
would have produced. Specifically, this paper compares the
carbon dioxide, methane, and particulate matter emissions as
well as fossil fuel consumption among biomass disposal
alternatives that dispose of the forest residues and produce
the equivalent thermal energy in a boiler (Fig. 1):
� Bioenergy alternative: Collecting, grinding, and hauling forest
residues to a facility to be burned in a boiler to produce
thermal energy.
� Pile-burn alternatives: Collecting and disposing of the forest
residues by burning onsite and using either natural gas or #2
distillate oil to produce the equivalent energy of the forest
biomass.
2. Study area
The study area included the Bitterroot National Forest and
adjacent forested lands in the Bitterroot Valley of western
Montana, comprising a total of 515,900 ha (Fig. 2). The low to
mid elevations in this area historically experienced frequent
low severity wildfires that removed shade-tolerant trees from
the forest understory. Fire suppression over many years and
other factors have resulted in a build-up of shade-tolerant
trees which create ladder fuels that increase the risk of severe
wildfire as well as reduce the vigor of the larger trees making
them more susceptible to insects and disease. We were
specifically interested in examining alternatives for disposing
of forest residues produced by mechanical fuel treatments
where they are needed on the landscape to reduce the threat
of severe wildfire and improve forest health. Disposal of these
forest residues is important to accomplish the treatment
objectives of reducing fuel loading to reduce the risk of wild-
fire. Reducing forest fuels and improving forest health are
predominate reasons for forest vegetation treatments in the
area, especially on the National Forest.
We analyzed transporting the treatment residues to a wood
residue boiler located 27.4 km from the study area boundary.
Forest residues provide a possible additional source of biomass
for such plants that traditionally used residues from sawmills
and other primary wood product manufactures, which have
declined in numbers in many areas of the US in recent years

Fig. 2 – Study area showing treatment polygons and mill
location for consuming bioenergy.
b i o m a s s a n d b i o e n e r g y 3 4 ( 2 0 1 0 ) 7 3 7 – 7 4 6 739
due to greater forest management emphasis on non-
commodity use and amenity values. Transportation to the mill
is from forest roads and secondary roads that feed into a main
highway.
3. Methods
3.1. Modeling forest vegetation treatments
A wide variety of silvicultural treatments are available to land
managers to achieve differing fuel treatment and/or forest
health restoration objectives. In this analysis we focused on
a mechanical treatment designed to reduce ladder and crown
fuels to mitigate the potential for wildfire effects and restore
forests to sustainable and historical conditions [18]. In these
stands prescribed burning is not feasible without first con-
ducting mechanical treatments. This mechanical treatment,
called comprehensive restoration, removes all trees below
17.8 cm diameter at breast height plus some larger diameter
trees with a target residual stand having a basal area in the
range 9.2–13.8 m2 ha�1 comprised of fire resistant tree species
such as ponderosa pine (Pinus ponderosa) and western larch
(Larix occidentalis). This treatment provides an open stand of
trees that reduces the potential for crown fire and promotes
health of the residual trees by removing competition for
moisture and nutrients.
We assume whole-tree harvesting is used to cut and skid
trees to a landing accessible by road. In this system, which is
commonly used in the western US, whole trees, including the
main stem, limbs, and tops are delivered to a landing. We
assume the tree boles suitable for higher valued commercial
products are removed and the portion that remains is what is
available for bioenergy and consists of the tops and limbs of
the commercial trees, and all of the smaller, non-commercial
trees that were skidded to the landing to accommodate
treatment objectives. This green biomass typically has
a moisture content around 50% and is allowed to air dry to 30%
moisture content prior to grinding and hauling offsite [19].
The approach to modeling forest vegetation treatments is
based on the method described in Loeffler et al. [5]. The
Northern Idaho/Inland Empire variant of the Forest Vegeta-
tion Simulator (FVS, www.fs.fed.us/fmsc/fvs) was used to
model the outcome of applying the comprehensive treatment
prescription to Forest Inventory and Analysis (FIA, http://
www.fs.fed.us/rm/ogden) plot data. To ensure adequate
data, we supplemented the FIA plots from the study area with
plots from similar sampled forests outside the study
boundary. Analyzing these plots provided estimates of per
hectare merchantable timber volumes and non-merchantable
biomass volumes that are in the tops, and branch wood of
merchantable trees and in non-merchantable trees that are
skidded to meet prescription objectives. Stokes [20] reported
that about 90% of biomass residues are recoverable with
whole-tree harvesting, while the default for the Fuel Reduc-
tion Cost Simulator [21] is 80% recovery of residues for whole-
tree harvesting. Baral and Guha [22] assumed 20% of biomass
is lost during harvesting and hauling. We assume 80%
recovery for the base case and present sensitivity analysis
results for both 60% and 100% recovery.
Weights for all merchantable logs that would be removed
were computed through a combination of the FVS Database
Extension, tree component ratio equations from published
biomass estimators [23], and dry volume weights obtained
from the Fire and Fuels Extension of FVS [24]. Quadratic mean
diameter (QMD) and trees cut per FIA plot were tallied for both
the merchantable and non-merchantable categories. The Fire
and Fuels Extension of FVS was also utilized to estimate the
weight of the total biomass removed. Subtracting the removed
merchantable log weight from the weight of the total biomass
removed yielded the weight of the non-merchantable biomass.
Summary statistics of cut materials are displayed in Table 1.
3.2. Modeling spatial distribution of forestlands andtreatment
The locations on the study area landscape where the
comprehensive treatment is applicable were identified using
a GIS-based forest vegetation classification system, R1-VMP,
produced by the Northern Region of the USDA Forest Service
[25]. R1-VMP categorizes forested polygons based on domi-
nant and co-dominant tree species, stand size class, and stand
density as measured by percent canopy cover. R1-VMP poly-
gons selected as candidates for treatment contained species
associated with low-elevation, frequent low-intensity fire

Table 1 – Summary statistics from modeling application of the comprehensive restoration treatment on 0.405 ha (1 acre)plots (n [ 458).
Biomassremoved
(dry t)
QMDa oftrees removed�17.8 cm (cm)
QMD of treesremoved
<17.8 cm (cm)
Number oftrees removed�17.8 cm
Number oftrees removed<17.8 cm
Volumeremoved from
trees �17.8cm (m3)
Volume removedfrom trees
<17.8 cm (m3)
Mean 10.51 26.75 9.75 95.97 294.98 38.83 11.28
Median 9.37 26.16 10.18 82.46 187.25 30.91 8.17
Standard
deviation
6.61 5.58 4.57 64.03 328.35 32.92 11.93
Minimum 0.49 17.78 0.00 1.85 0.00 0.68 0.00
Maximum 43.14 61.98 17.53 363.95 1 962.14 185.65 80.49
a Quadratic mean diameter.
b i o m a s s a n d b i o e n e r g y 3 4 ( 2 0 1 0 ) 7 3 7 – 7 4 6740
regimes (Pinus ponderosa and mixtures of Pinus ponderosa, Larix
occidentalis, and Pseudotsuga menziessi and miscellaneous
shade-tolerant species) that fell into fire regime condition
classes 2 and 3. These fire regime condition classes have the
greatest deviation from natural fire regimes and are most in
need of treatment [26,27]. Candidate polygons were further
restricted to average slopes less than 35%, are within 457 m
from the polygon centers to existing roads, and are Forest
Service non-reserved or non-industrial privately owned land.
This resulted in 15,800 polygons comprising 30,920 ha (Fig. 2).
The spatial R1-VMP forest vegetation classification does
not contain forest inventory data, nor did any other spatial
vegetation classification system at the time of this study.
Therefore, the FIA plots were classified into the R1-VMP
vegetation categories based upon dominant species, tree size
class, and stand canopy cover. The results from analyzing
the plots were averaged within the R1-VMP categories such
that each R1-VMP category contained the average tree attri-
butes calculated from the FIA plots in the corresponding
category.
3.3. Modeling biomass haul
A GIS roads coverage obtained from the Bitterroot National
Forest (www.fs.fed.us/r1/bitterroot) provided the road network
for modeling haul of biomass from the candidate treatment
polygons to the bioenergy facility northwest of the study area.
This GIS coverage contains road segments separated by nodes,
which were placed at every road intersection and in the vicinity
of candidate treatment polygons. The location where biomass
volume from each polygon enters the road system was
approximated by choosing the nearest down-slope node.
Many of the treatment polygons are on roads inaccessible
by large chip vans, which are generally considered the most
cost-effective way of trucking biomass on paved surfaces.
Therefore we assumed the biomass is hauled from the poly-
gons to the bioenergy facility by hook-lift trucks hauling roll-
on/off containers resembling extremely large trash bins [19].
These trucks are suitable for low-standard mountain roads
and have essentially the same access capabilities as a logging
truck. These hook-lift trucks haul one roll-on/off container
and pull a pup trailer with a second container, providing
a total payload of approximately 22.7 t [28]. This compares
with 24.5–27.2 t payloads for a chip van. We assume that the
biomass is ground and conveyed by the grinder’s outfeed into
these roll-on/off containers at the landings. The hook-lift
trucks then pick up the loaded containers, one on the truck,
one on the pup trailer, and haul them to the biomass utiliza-
tion facility. Empty containers are returned to the landing on
the return trip.
3.4. Fossil fuel consumption
Fossil fuels are consumed in the bioenergy alternative to
collect, grind, and haul the forest treatment residue to
a biomass utilization facility (Fig. 1). The pile-burn alternatives
use fossil fuels to collect the forest residue and provide the
same amount of useable thermal energy in a boiler that the
bioenergy alternative provides. Incidental consumption of
fossil fuels in these alternatives, such as the fuel used to
transport workers to the field, was not included in this analysis.
Diesel consumption for collecting biomass in whole-tree
harvesting (cutting, skidding, and processing) was estimated
at 2.85 L m�3 of harvested timber (15). We assumed the diesel
consumption attributable to biomass collection was propor-
tional to the biomass percentage of the total weight of mate-
rial delivered to the landing, which based on FVS analysis
averaged 25% of total weight.
Diesel consumption for grinding biomass was estimated
using the Forest Residue Trucking Simulator (FoRTS, http://
www.srs.fs.usda.gov/forestops/biomass) at 1.7 L t�1 of
biomass which had been allowed to dry in piles to an average
30% moisture content. In addition, we used FoRTS to estimate
the diesel consumed during a 20 min idle time for each hook-
lift truck and pup trailer to be loaded at 0.8 L. This factor is the
difference between estimated fuel consumption using
‘standing time’ model inputs of 0 and 20 min. The diesel
consumption for trucks hauling biomass was estimated at
0.6 L km�1 [28]. This consumption was applied to the loaded
haul distance as well as the return trips with empty containers.
The quantities of #2 distillate oil and natural gas required
to produce the same useable thermal energy in a boiler were
computed using published heat values and efficiency rates
[29]. The energy contents used in this calculation were
14.005 GJ t�1 for wood, 0.039 GJ L�1 for #2 distillate oil, and
0.038 GJ m�3 for natural gas. The efficiency rates used were
74% for wood, 83% for #2 distillate oil, and 80% for
natural gas.
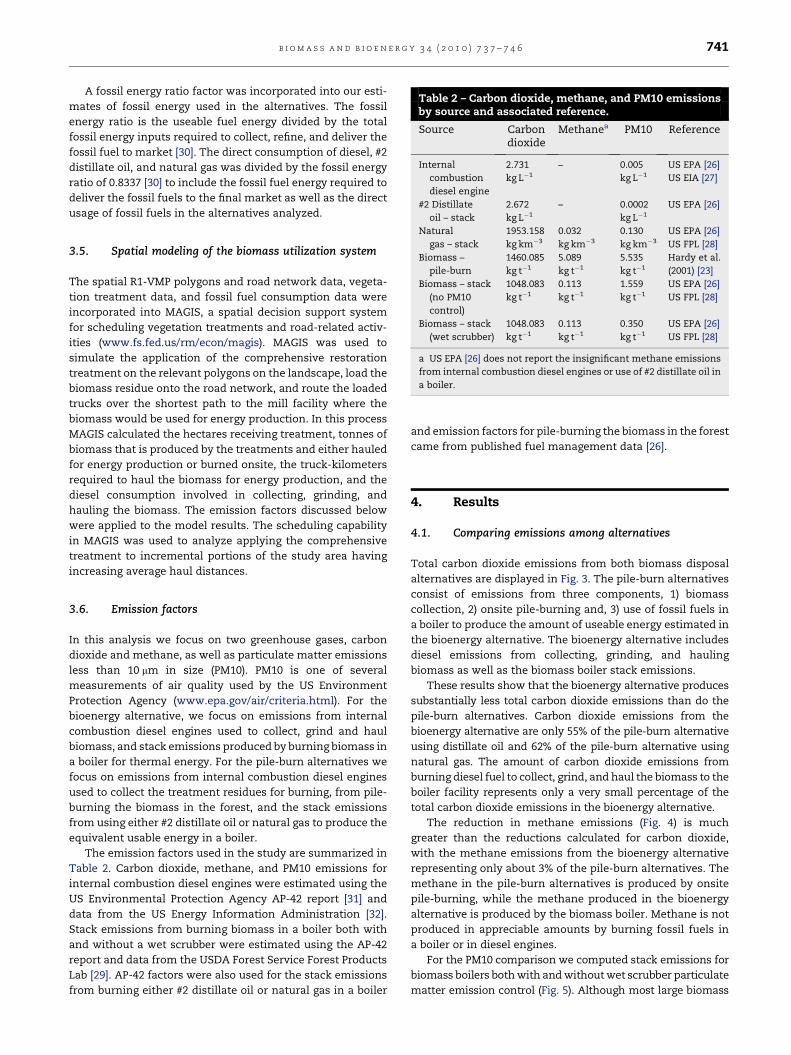
Table 2 – Carbon dioxide, methane, and PM10 emissionsby source and associated reference.
Source Carbondioxide
Methanea PM10 Reference
Internal
combustion
diesel engine
2.731
kg L�1
– 0.005
kg L�1
US EPA [26]
US EIA [27]
#2 Distillate
oil – stack
2.672
kg L�1
– 0.0002
kg L�1
US EPA [26]
b i o m a s s a n d b i o e n e r g y 3 4 ( 2 0 1 0 ) 7 3 7 – 7 4 6 741
A fossil energy ratio factor was incorporated into our esti-
mates of fossil energy used in the alternatives. The fossil
energy ratio is the useable fuel energy divided by the total
fossil energy inputs required to collect, refine, and deliver the
fossil fuel to market [30]. The direct consumption of diesel, #2
distillate oil, and natural gas was divided by the fossil energy
ratio of 0.8337 [30] to include the fossil fuel energy required to
deliver the fossil fuels to the final market as well as the direct
usage of fossil fuels in the alternatives analyzed.
Natural
gas – stack
1953.158
kg km�3
0.032
kg km�3
0.130
kg km�3
US EPA [26]
US FPL [28]
Biomass –
pile-burn
1460.085
kg t�1
5.089
kg t�1
5.535
kg t�1
Hardy et al.
(2001) [23]
Biomass – stack
(no PM10
control)
1048.083
kg t�1
0.113
kg t�1
1.559
kg t�1
US EPA [26]
US FPL [28]
Biomass – stack
(wet scrubber)
1048.083
kg t�1
0.113
kg t�1
0.350
kg t�1
US EPA [26]
US FPL [28]
a US EPA [26] does not report the insignificant methane emissions
from internal combustion diesel engines or use of #2 distillate oil in
a boiler.
3.5. Spatial modeling of the biomass utilization system
The spatial R1-VMP polygons and road network data, vegeta-
tion treatment data, and fossil fuel consumption data were
incorporated into MAGIS, a spatial decision support system
for scheduling vegetation treatments and road-related activ-
ities (www.fs.fed.us/rm/econ/magis). MAGIS was used to
simulate the application of the comprehensive restoration
treatment on the relevant polygons on the landscape, load the
biomass residue onto the road network, and route the loaded
trucks over the shortest path to the mill facility where the
biomass would be used for energy production. In this process
MAGIS calculated the hectares receiving treatment, tonnes of
biomass that is produced by the treatments and either hauled
for energy production or burned onsite, the truck-kilometers
required to haul the biomass for energy production, and the
diesel consumption involved in collecting, grinding, and
hauling the biomass. The emission factors discussed below
were applied to the model results. The scheduling capability
in MAGIS was used to analyze applying the comprehensive
treatment to incremental portions of the study area having
increasing average haul distances.
3.6. Emission factors
In this analysis we focus on two greenhouse gases, carbon
dioxide and methane, as well as particulate matter emissions
less than 10 mm in size (PM10). PM10 is one of several
measurements of air quality used by the US Environment
Protection Agency (www.epa.gov/air/criteria.html). For the
bioenergy alternative, we focus on emissions from internal
combustion diesel engines used to collect, grind and haul
biomass, and stack emissions produced by burning biomass in
a boiler for thermal energy. For the pile-burn alternatives we
focus on emissions from internal combustion diesel engines
used to collect the treatment residues for burning, from pile-
burning the biomass in the forest, and the stack emissions
from using either #2 distillate oil or natural gas to produce the
equivalent usable energy in a boiler.
The emission factors used in the study are summarized in
Table 2. Carbon dioxide, methane, and PM10 emissions for
internal combustion diesel engines were estimated using the
US Environmental Protection Agency AP-42 report [31] and
data from the US Energy Information Administration [32].
Stack emissions from burning biomass in a boiler both with
and without a wet scrubber were estimated using the AP-42
report and data from the USDA Forest Service Forest Products
Lab [29]. AP-42 factors were also used for the stack emissions
from burning either #2 distillate oil or natural gas in a boiler
and emission factors for pile-burning the biomass in the forest
came from published fuel management data [26].
4. Results
4.1. Comparing emissions among alternatives
Total carbon dioxide emissions from both biomass disposal
alternatives are displayed in Fig. 3. The pile-burn alternatives
consist of emissions from three components, 1) biomass
collection, 2) onsite pile-burning and, 3) use of fossil fuels in
a boiler to produce the amount of useable energy estimated in
the bioenergy alternative. The bioenergy alternative includes
diesel emissions from collecting, grinding, and hauling
biomass as well as the biomass boiler stack emissions.
These results show that the bioenergy alternative produces
substantially less total carbon dioxide emissions than do the
pile-burn alternatives. Carbon dioxide emissions from the
bioenergy alternative are only 55% of the pile-burn alternative
using distillate oil and 62% of the pile-burn alternative using
natural gas. The amount of carbon dioxide emissions from
burning diesel fuel to collect, grind, and haul the biomass to the
boiler facility represents only a very small percentage of the
total carbon dioxide emissions in the bioenergy alternative.
The reduction in methane emissions (Fig. 4) is much
greater than the reductions calculated for carbon dioxide,
with the methane emissions from the bioenergy alternative
representing only about 3% of the pile-burn alternatives. The
methane in the pile-burn alternatives is produced by onsite
pile-burning, while the methane produced in the bioenergy
alternative is produced by the biomass boiler. Methane is not
produced in appreciable amounts by burning fossil fuels in
a boiler or in diesel engines.
For the PM10 comparison we computed stack emissions for
biomass boilers both with and without wet scrubber particulate
matter emission control (Fig. 5). Although most large biomass

0
10
20
30
40
50
60
Pile-burn alternative with distillate oil heat
Pile-burn alternative with natural gas heat
Bioenergy alternative - Wet
Scrubber
Bioenergy alternative - No
Control
ah
g
k(
0
1M
P-1)
Biomass collectOnsite pile burnFossil fuel boiler
Biomass collectBiomass grind and haulBioenergy boiler
Pile-burn Bioenergy
Fig. 5 – PM10 emissions haL1 treated compared across the
forest residue disposal alternatives.
0
5000
10000
15000
20000
25000
30000
Pile-burn alternative with distillate oil heat
Pile-burn alternative with natural gas heat
Bioenergy alternative
Ca
rb
on
D
io
xid
e (k
g h
a-1)
Biomass collectOnsite pile burnFossil fuel boiler
Biomass collectBiomass grind and haulBioenergy boiler
Pile-burn Bioenergy
Fig. 3 – Carbon dioxide emissions haL1 treated compared
across the forest residue disposal alternatives.
b i o m a s s a n d b i o e n e r g y 3 4 ( 2 0 1 0 ) 7 3 7 – 7 4 6742
boilers would be expected to have particulate matter emission
controls, we were also interested in comparing emissions from
small boilers without these controls. PM10 emissions from the
bioenergy alternative with wet scrubber emission control were
11% of the pile-burn alternatives and without the emission
control were 41% of the pile-burn alternatives. For the pile-burn
alternatives PM10 emissions are almost entirely produced by
the pile-burning, very little is produced by burning either
distillate oil or natural gas in a boiler.
0.0
5.0
10.0
15.0
20.0
25.0
30.0
35.0
40.0
45.0
50.0
Pile-burn alternative with distillate oil heat
Pile-burn alternative with natural gas heat
Bioenergy alternative
ah
gk
(
en
ah
te
M-1)
Fossil fuel boilerOnsite pile burnBioenergy boiler
0.1 kg ha-1 (Fossil fuel boiler)
Fig. 4 – Methane emissions haL1 treated compared across
the forest residue disposal alternatives.
4.2. Effect of haul distance on total bioenergy emissions
Next we looked at the effect of biomass haul distance on the
amount of emissions originating from diesel fuel consumption
as a percentage of the total emissions in the bioenergy alter-
native. For this analysis the MAGIS model was used to schedule
treatments for 10% increments in available biomass volume
from the comprehensive restoration treatment. The first
increment represents the area providing 10% of the total
biomass volume available with the least haul cost, the second
represents the area providing 20% of the volume with the least
haul cost, and so on through the tenth increment which
included all the treatable area. The average haul distance for
the ten increments ranged from 75 to 136 km.
Carbon dioxide emissions from the entire biomass delivery
process of collecting, grinding, and hauling biomass
comprised only 3.2% of the total carbon dioxide emissions for
the bioenergy alternative at the 75 km average haul distance,
increasing to 3.9% at the 136 km distance (Fig. 6). This increase
was entirely due to the increasing haul distance, as emissions
from collecting and grinding were a constant percentage of
the total over this range. Although the carbon dioxide emis-
sions from diesel are increasing with increasing average haul
distances, it still represents a small percentage of total emis-
sions even at the relatively long average distance of 136 km.
Similar results were obtained for PM10 from diesel emis-
sions as a percentage of total PM10 emissions in the bioenergy
alternative in which no particulate matter emission control is
used. PM10 emissions from diesel consumption from harvest-
ing, grinding, and hauling increased from 3.7% at the 75 km
distance to 4.6% at the 136 km distance. When wet scrubber
particulate matter emission control is used, PM10 emissions
from diesel consumption range from 14.8% to 17.7% of total
emission PM10 emissions for the bioenergy alternative.

0%
2%
4%
6%
8%
10%
12%
14%
16%
18%
20%
70 80 90 100 110 120 130 140
sn
ois
sim
E la
to
T f
o %
Average Haul Distance (km)
Carbon DioxidePM10 with Emission Control
PM10 without Emission Control
Fig. 6 – Carbon dioxide and PM10 emissions (with and
without web scrubber control) from harvesting, grinding,
and hauling as a percentage of the total bioenergy
emissions, respectively, across increasing average haul
distances.
b i o m a s s a n d b i o e n e r g y 3 4 ( 2 0 1 0 ) 7 3 7 – 7 4 6 743
4.3. Effect of haul distance on bioenergy return
Fig. 7 shows the units of bioenergy obtained for each unit of
diesel energy expended to collect, grind, and haul the biomass
over increasing average haul distances. As in the boiler
emission calculations, the fossil energy ratio of 0.8337 was
applied to our estimate of the amount of diesel consumed by
these activities to account for the total amount of energy
required for a liter of fuel. At the 75 km average haul distance,
26 units of energy are obtained for each unit of diesel fuel
energy required to deliver the ground biomass to the energy
facility. This ratio drops to 21 units of energy per unit of diesel
fuel energy consumed at the 136 km average haul distance,
a 19% decrease.
0
5
10
15
20
25
30
70 80 90 100 110 120 130 140
Bio
ma
ss
E
ne
rg
y R
etu
rn
Average Haul Distance (km)
Fig. 7 – Biomass energy return per unit of fossil fuel energy
used to collect, grind, and haul biomass across increasing
average haul distances.
4.4. Fossil energy use among alternatives
Fig. 8 compares average fossil fuel energy consumed to collect,
grind, and haul 1 t of biomass in the bioenergy alternative
with the fossil fuel energy consumed in the pile-burn alter-
natives to collect biomass in piles for burning at the landing
and provide the equivalent amount of thermal energy in
a fossil fuel boiler. The difference in fossil fuel energy between
the pile-burn alternative using distillate oil and the bioenergy
alternative averages 14.7 GJ t�1 of biomass available from the
study area, assuming 83% efficiency for the distillate oil boiler.
The difference for the pile-burn alternative using natural gas
averages 15.2 GJ t�1 of biomass, assuming 80% efficiency for
the natural gas boiler. The energy used to collect biomass is
a minor component in all alternatives. The reason for the large
difference in fossil fuel consumption between the pile-burn
alternatives and the bioenergy alternative is that the quantity
of #2 distillate oil or natural gas required to provide the
equivalent usable thermal energy is many times greater than
the diesel energy required to grind and haul the biomass in the
bioenergy alternative.
4.5. Sensitivity analysis
The sensitivity of results to residue recovery rates around the
base case of 80% recovery was analyzed using recovery rates
of 60% and 100%. The change in carbon dioxide emissions
across recovery rates is displayed in Fig. 9. Total carbon
dioxide emissions change proportionally across the residue
recovery rates for each residue disposal alternative. Thus, as
the recovery rate increases, the absolute difference in carbon
dioxide emissions increases between the pile-burn alterna-
tives and the bioenergy alternative.
Changes in methane and PM10 across recovery rates are
displayed in Figs. 10 and 11, respectively. The values for the
pile-burn alternative with distillate oil heat are almost iden-
tical to the displayed pile-burn alternative with natural gas
heat. The changes in methane and PM10 are also proportional
to the recovery rate and the absolute difference in emissions
0.00
2.00
4.00
6.00
8.00
10.00
12.00
14.00
16.00
18.00
Pile-burn alternative with distillate oil heat
Pile-burn alternative with natural gas heat
Bioenergy alternative
Fo
ssil E
nerg
y (G
J)
Fig. 8 – Fossil fuel energy consumed to collect, grind, and
haul 1 t of biomass in the bioenergy alternative compared
to the fossil fuel energy consumed in the pile-burn
alternatives to collect biomass for burning and provide the
equivalent thermal energy in a boiler.

0.0
5000.0
10000.0
15000.0
20000.0
25000.0
30000.0
35000.0
60% 80% 100%
ah
gk
( e
dix
oiD
no
br
aC
-1)
Residue Recovery Rates
Pile-burn alternative with distillate oil heatPile-burn alternative with natural gas heat
Bioenergy alternative
Fig. 9 – Carbon dioxide emissions haL1 treated across three
residue recovery rates for the forest residue disposal
alternatives.
0.0
10.0
20.0
30.0
40.0
50.0
60.0
70.0
60% 80% 100%
ah
g
k(
0
1M
P-1)
Pile-burn alternative with natural gas heatBioenergy alternative - Wet Scrubber
Bioenergy alternative - No Control
Residue Recovery Rates
Fig. 11 – PM10 emissions haL1 treated across three residue
recovery rates for two forest residue disposal alternatives.
b i o m a s s a n d b i o e n e r g y 3 4 ( 2 0 1 0 ) 7 3 7 – 7 4 6744
between the pile-burn alternatives and the bioenergy alter-
native increase with the residue recovery rate.
We also computed the biomass energy return ratio for the
bioenergy alternative and found that the ratio was not
0.0
10.0
20.0
30.0
40.0
50.0
60.0
60% 80% 100%
ah
gk
( e
na
ht
eM
-1)
Residue Recovery Rates
Pile-burn alternative with natural gas heat
Bioenergy alternative
Fig. 10 – Methane emissions haL1 treated across three
residue recovery rates for two forest residue disposal
alternatives.
affected by the residue recovery rate. Likewise the fossil fuel
consumption to dispose of one dry tonne of biomass via each
alternative was unaffected by the residue recovery rate. The
fossil fuel consumption for each residue disposal alternative is
a linear function of the quantity of residues that are skidded to
the landing for disposal.
5. Discussion and conclusions
These results show that when a bioenergy alternative to
onsite pile-burning is available, far fewer carbon dioxide,
methane, and particulate matter emissions are generated,
and useable energy produced offsets the use of fossil fuels for
thermal energy production. At the haul distances we
analyzed, the fossil fuel energy required for the bioenergy
alternative is small compared to the energy produced in the
bioenergy alternative. Fossil fuel energy saved by the bio-
energy alternative compared to the pile-burn alternatives
using fossil fuel for thermal energy averaged 14.7–15.2 GJ t�1 of
biomass used.
The analysis presented in this paper is based on collecting
biomass residues in the whole-tree harvesting process,
grinding biomass residue, and hauling loaded roll-on/off
containers to the location where the biomass is burned for
thermal energy. We expect that other ground-based harvest-
ing systems or biomass comminution systems would produce
somewhat different emission trade-offs and energy
consumption ratios. However, the changes in magnitude of
these results that would be required to make bioenergy the
less attractive method of residue disposal from an emissions
standpoint are very unlikely.
In this paper we analyzed disposal alternatives for piled
forest residues which are generally burned onsite. There are,

b i o m a s s a n d b i o e n e r g y 3 4 ( 2 0 1 0 ) 7 3 7 – 7 4 6 745
however, many ways to conduct treatments and handle resi-
dues, some of which could be designed to leave a greater
portion of the residues dispersed over a treatment area for
nutrient cycling, wildlife habitat, or other forest management
objectives. Although our sensitivity analysis showed reducing
recovery rates have no effect on the fossil fuel energy required
per tonne for collecting biomass, other methods for inten-
tionally leaving biomass onsite could have an effect. However,
the fossil energy consumed per tonne for grinding and hauling
would not be expected to change significantly by leaving more
biomass onsite.
Our results indicate that utilizing woody residues for
thermal energy can contribute to solving energy needs while
at the same time reducing greenhouse gas and particulate
matter emissions compared to alternative methods of residue
disposal. The reduction in particulate matter emissions may
also provide an advantage in areas where open burning is
restricted by air quality standards. Finally, with the emer-
gence of carbon trading markets, assessments such as those
carried out in this paper may help to quantify the appropriate
carbon offset credits that should become available to biomass
utilization facilities. These credits may help to offset the high
material collection costs, enhancing the economic feasibility
of future bioenergy development.
6. Role of the funding source
Financial support for this research came from the USDA
Forest Service National Fire Plan Research and Development
Program as well as the Bitterroot Ecosystem Management
Research Project of the USDA Forest Service, Rocky Mountain
Research Station. These study sponsors did not contribute in
the study design; the collection, analysis, and interpretation of
data; in the writing of the report; or in the decision to submit
the paper for publication.
Acknowledgments
We thank Janet Sullivan and Kurt Krueger of the Rocky
Mountain Research Station and Edward Butler from the
University of Montana for their help in applying the MAGIS
model in this study. We also thank Mark Nechodom of the
USDA Forest Service Pacific Southwest Research Station for
advice on methodology.
r e f e r e n c e s
[1] Energy Information Administration. Renewable energyconsumption and electricity preliminary 2007 statistics.Available from: http://www.eia.doe.gov/cneaf/alternate/page/renew_energy_consump/rea_prereport.html; 2006[accessed 23 October 2008].
[2] Malmsheimer RW, Heffernan P, Brink S, Crandall D,Deneke F, Galik C, et al. Forest management solutions formitigating climate change in the United States. Journal ofForestry 2008;106(3):115–71.
[3] Zerbe JI. Thermal energy, electricity, and transportation fuelsfrom wood. Forest Products Journal 2006;56(1):6–14.
[4] Barbour RJ, Fight RD, Christensen GA, Pinjuv GL,Nagubadi RV. Thinning and prescribed fire and projectedtrends in wood product potential, financial return, and firehazard in Montana. PNW-GTR-606. U.S. Department ofAgriculture, Forest Service, Pacific Northwest ResearchStation; 2004.
[5] Loeffler D, Calkin DE, Silverstein RP. Estimating volumes andcosts of forest biomass in western Montana using forestinventory and geospatial data. Forest Products Journal 2006;56(6):31–7.
[6] Perlack RD, Wright LL, Turhollow A, Graham RL, Stokes B,Erbach DC. Biomass as feedstock for a bioenergy andbioproducts industry: the technical feasibility of a billion-ton annual supply. Washington, DC: U.S. Department ofEnergy and U.S. Department of Agriculture, Forest Service;2005. 73p.
[7] USFS. A strategic assessment of forest biomass and fuelreduction treatments in western states. Washington, D.C.: U.S. Dept. of Agriculture, Forest Service, Research andDevelopment; 2003. 18p.
[8] Skog KE, Barbour RJ. Estimating woody biomass supply fromthinning treatments to reduce fire hazard in the U.S. West.Proceedings RMRS-P-41. In: Andrews PL, Butler BW, editors.Fuels management-how to measure success: conferenceproceedings. 28–30 March 2006; Portland, OR. Fort Collins,CO: U.S. Department of Agriculture, Forest Service, RockyMountain Research Station; 2006. p. 657–72.
[9] Birdsey R, Pregitzer J, Lucier A. Forest carbon management inthe United States: 1600–2100. Journal of EnvironmentalQuality 2006;35:1461–9.
[10] Pacala S, Birdsey RA, Bridgham SD, Conant RT, Davis K,Hales B, et al. The North American carbon budget past andpresent. In: King AW, Dilling L, Zimmerman GP, Fairman DM,Houghton RA, Marland G, et al., editors. The first state of thecarbon cycle report (SOCCR): the North American carbonbudget and implications for the global carbon cycle. Asheville,NC: National Oceanic and Atmospheric Administration,National Climatic Data Center; 2007. p. 29–36.
[11] Birdsey R, Alig R, Adams D. Mitigation activities in the forestsector to reduce emissions and enhance sinks of greenhousegases. Gen. Tech. Rep. RMRS-GTR-59. In: Joyce LA, Birdsey R,editors. The impact of climate change on America’s forests:a technical document supporting the 2000 USDA forestservice RPA assessment. Fort Collins, CO: U.S. Department ofAgriculture, Forest Service, Rocky Mountain ResearchStation; 2000. p. 112–31.
[12] Fried J, Christensen G. FIA BioSum: a tool to evaluatefinancial costs, opportunities and effectiveness of fueltreatments. Western Forester; September/October, 2004.
[13] Silverstein RP, Loeffler D, Jones JG, Calkin DE, Zuuring HR,Twer M. Biomass utilization modeling on the BitterrootNational Forest. Proceedings RMRS-P-41. In: Andrews PL,Butler BW, comps, editors. Fuels management – how tomeasure success: conference proceedings. Fort Collins, CO:U.S. Department of Agriculture, Forest Service, RockyMountain Research Station; 2006. p. 673–88.
[14] Skog KE. Sequestration of carbon in harvested woodproducts for the United States. Forest Products Journal 2008;58(6):56–72.
[15] Markewitz D. The carbon costs of silvicultural activities:impacts on carbon sequestration in forests. Forest Ecologyand Management 2006;236(2–3):153–61.
[16] CORRIM. The consortium for research on renewableindustrial materials: phase I final report, forest resourcespacific northwest and southeast. Available from: http://www.corrim.org; 2004 [accessed: 15 October, 2008].

b i o m a s s a n d b i o e n e r g y 3 4 ( 2 0 1 0 ) 7 3 7 – 7 4 6746
[17] Watson WF, Miller DE, Stokes BJ, Broussard ML. Energybudget for an energywood harvesting system. In:Proceedings of the 1986 southern forest biomass workshop;1986 June 16–19; Knoxville, TN. Norris, TN: Tennessee ValleyAuthority; 1986. p. 103–5.
[18] Fiedler CE, Keegan III CE, Wichman DP, Arno SF. Product andeconomic implications of ecological restoration. ForestProducts Journal 1999;42(2):19–23.
[19] Han HS, Halbrook J, Pan F, Salazar L. Economic evaluation ofa roll-off trucking system removing forest biomass resultingfrom shaded fuelbreak treatments. Final report submitted toUSDA Forest Service, Six Rivers National Forest, Eureka,California, 2008. 31p.
[20] Stokes BJ. Harvesting small trees and forest residues.Biomass and Bioenergy 1992;2:131–47.
[21] Fight RD, Hartsough BR, Noordijk P. Users guide for FRCS:fuel reduction cost simulator software. Gen. Tech. Rep. PNW-GTR-668. Portland, OR: U.S. Department of Agriculture,Forest Service, Pacific Northwest Research Station; 2006. 23p.
[22] Baral A, Guha GS. Trees for carbon sequestration or fossilfuel substitution: the issue of cost vs. carbon benefit.Biomass and Bioenergy 2004;27:41–55.
[23] Jenkins JC, Chojnacky DC, Heath LS, Birdsey RA. Nationalscale biomass estimators for United States tree species.Forest Science 2003;49:12–35.
[24] Reinhardt E, Crookston NL. The fire and fuels extension tothe forest vegetation simulator. Gen. Tech. Rep. RMRS-GTR-116. Ogden, UT: U.S. Department of Agriculture, ForestService, Rocky Mountain Research Station; 2003. 209p.
[25] Brewer CK, Berglund D, Barber JA, Bush R. Northern regionvegetative mapping project summary report and spatialdatasets. Northern Region, Missoula, MT: USDA ForestService; 2004.
[26] Hardy CC, Schmidt KM, Menakis JP, Sampson RN. Spatialdata for national fire planning and fuel management.International Journal of Wildland Fire 2001;10:353–72.
[27] Schmidt KM, Menakis JP, Hardy CC, Hann WJ, Bunnell DL.Development of coarse-scale spatial data for wildland fireand fuel management. Gen. Tech. Rep. RMRS-GTR-87. FortCollins, CO: U.S. Department of Agriculture, Forest Service,Rocky Mountain Research Station; 2002. 41p.
[28] Thomas C. Logging contractor, Personal communication, 6August, 2008.
[29] USDA Forest Service Forest Products Laboratory. Fuel valuecalculator. Techline. Madison, WI: U.S. Department ofAgriculture, Forest Service; 2004. 3p.
[30] National Renewable Energy Laboratory. Life cycleinventory of biodiesel and petroleum diesel for use in anurban bus: final report. NREL/SR-580–24089; 1998. Golden,Colorado.
[31] US Environmental Protection Agency. Stationary point andarea sources. Report AP-42. In: Compilation of air pollutantsemission factors, vol. I. Research Triangle Park, NC: Office ofAir and Radiation, US Environmental Protection Agency;1995.
[32] US EIA. US Energy Information Administration, http://www.eia.doe.gov/basics/conversion_basics.html; 2008. Availablefrom: [accessed 23 October, 2008].


