Forest Statistics Ireland 2020 - Teagasc
89
Prepared by the Department of Agriculture, Food and the Marine agriculture.gov.ie Forest Statistics Ireland 2020 Prepared by the Department of Agriculture, Food and the Marine agriculture.gov.ie
Transcript of Forest Statistics Ireland 2020 - Teagasc

Prepared by the Department of
Agriculture, Food and the Marine
agriculture.gov.ie
Forest Statistics
Ireland 2020
Prepared by the Department of
Agriculture, Food and the Marine
agriculture.gov.ie

The Department of Agriculture, Food and the Marine is responsible for ensuring the development of forestry within Ireland in a manner and to a scale that maximises its contribution to national socio-economic well-being on a sustainable basis that is compatible with the protection of the environment. Its strategic objectives are:
Published by:
Department of Agriculture, Food & the Marine,
Johnstown Castle Estate
Co. Wexford
Tel. 053 91 63400 / Lo-Call 0761 064 415
E-mail [email protected]
Web www.agriculture.gov.ie/forestservice
© Department of Agriculture, Food & the Marine, Ireland
July 2020

Department of Agriculture, Food & the Marine
Table of contents
1. Introduction ......................................................................................................................... 3
2. Forest Area ........................................................................................................................... 4
2.1 Introduction ................................................................................................................................ 4
2.2 Forest definition .......................................................................................................................... 5
2.3 Forest area .................................................................................................................................. 5
2.4 Forest Ownership ........................................................................................................................ 9
2.5 Species composition ................................................................................................................... 9
2.6 Forest age .................................................................................................................................. 10
2.7 Hedgerows and Trees outside the Forest ................................................................................. 11
2.7.1 Extent ............................................................................................................................ 11
2.7.2 Agri-Environmental Schemes ........................................................................................ 12
2.7.3 Biomass and Carbon...................................................................................................... 12
3. Afforestation ...................................................................................................................... 13
3.1 Introduction .............................................................................................................................. 13
3.2 Afforestation ............................................................................................................................. 14
3.3 Private lands afforested, forest size and number ..................................................................... 17
3.4 Grant Premium Category .......................................................................................................... 20
3.5 Private afforestation ownership ............................................................................................... 20
3.5.1 Farmer/non-farmer ....................................................................................................... 20
3.5.2 Number of grant aided forests planted by individuals ................................................. 22
3.5.3 Annual grant applications by individual owner ............................................................ 23
3.5.4 Age and gender profile of forest owners ...................................................................... 24
3.5.5 Private (non grant-aided) ownership details ................................................................ 26
3.6 Grant-aided forest removal ...................................................................................................... 27
3.7 Change of applicant .................................................................................................................. 27
3.8 County level statistics ............................................................................................................... 27
4. Forest Management Operations .......................................................................................... 33
4.1 Introduction .............................................................................................................................. 33
4.2 Forest Roads .............................................................................................................................. 34
4.2.1 Public forest roading ..................................................................................................... 34
4.2.2 Private forest grant-aided roading ................................................................................ 34
4.3 Felling Licences Issued .............................................................................................................. 36
4.4 Public forest thinning and clearfelling ...................................................................................... 37
4.5 Public forest reforestation ........................................................................................................ 38
4.6 Broadleaf Thinning and Tending ............................................................................................... 39
4.7 Certification ............................................................................................................................... 40
5. Forest Production and Carbon ............................................................................................. 41
5.1 Introduction .............................................................................................................................. 41
5.2 Roundwood ............................................................................................................................... 42
5.2.1 Roundwood Harvest 1955-2018 ................................................................................... 42
5.2.2 Roundwood available for processing in Ireland ............................................................ 42
5.2.3 Roundwood Forecast .................................................................................................... 43
5.2.4 Actual Harvest Vs. Forecasted ...................................................................................... 45
5.2.5 Roundwood prices - Coillte ........................................................................................... 45
Ireland’s Forests – Statistics 2020
5.2.6 Roundwood Prices - Private Sector ............................................................................... 47
5.2.7 Forest-based biomass ................................................................................................... 48
5.3 Firewood production ................................................................................................................ 49
5.4 Timber and paper products trade ............................................................................................. 51
5.5 Carbon stocks ............................................................................................................................ 52
5.5.1 National Carbon Stocks ................................................................................................. 52
5.5.2 Current net greenhouse emissions and removals from forests ................................... 53
6. The-Economic Contribution of the Forest Sector .................................................................. 54
6.1 Introduction .............................................................................................................................. 54
6.2 Value of the forest Sector ......................................................................................................... 55
6.3 Employment in the forest sector .............................................................................................. 56
6.3.1 Categorisation of employment statistics ...................................................................... 56
6.3.2 Labour Force Survey/Quarterly National Household Survey ........................................ 56
6.3.3 Census of Ireland 2006, 2011 and 2016 ........................................................................ 58
6.4 Forests & Recreation ................................................................................................................. 59
6.5 State Expenditure on Forestry .................................................................................................. 60
7. Forest Protection and Health .............................................................................................. 62
7.1 Introduction .............................................................................................................................. 62
7.2 Biotic – Pests and Diseases ....................................................................................................... 63
7.2.1 Protected Zone Organisms ............................................................................................ 63
7.2.2 Other Regulated Organisms .......................................................................................... 64
7.2.3 Surveys .......................................................................................................................... 64
7.2.4 Ash Dieback (Hymenoscyphus fraxineus) ...................................................................... 66
7.2.5 Phytophthora ramorum ................................................................................................ 68
7.3 EU Plant Health Directive & Protected Zone Monitoring ......................................................... 70
7.4 ISPM No. 15 (IPPC International Standard for Wood Packaging Material)............................... 72
7.5 Abiotic ....................................................................................................................................... 73
7.5.1 Forest fires .................................................................................................................... 73
8. Forest Reproductive Material .............................................................................................. 74
8.1 Seed Collection permits and master certificates of provenance .............................................. 75
8.2 National Register of Approved Basic Material .......................................................................... 75
8.3 Utilisation of Forest Reproductive Material in Afforestation and Reforestation ..................... 77
9. International comparators .................................................................................................. 79
9.1 Introduction .............................................................................................................................. 79
9.2 Global & EU 28 Forest Cover ..................................................................................................... 80
9.3 Forest comparison: EU 28 ......................................................................................................... 81
9.4 European Forest Expansion Rate .............................................................................................. 83
Department of Agriculture, Food & the Marine
3
1. Introduction
The Department of Agriculture, Food and the Marine is responsible for the collection and
publication of forest statistics.
Forest stakeholders and policy makers require reliable statistics upon which to plan and make
decisions. Ireland also has a series of international reporting requirements relating to forests and
forestry. These include the:
• United Nations Framework Convention on Climate Change (UNFCCC) for carbon stocks
and stock changes; “Regulation (EU) 2018/841 of the European Parliament and of the
Council of 30 May 2018 on the inclusion of greenhouse gas emissions and removals from
land use, land use change and forestry in the 2030 climate and energy framework, and
amending Regulation (EU) No 525/2013 and Decision No 529/2013/EU”, commonly
referred to as the LULUCF Regulation”
• Food and Agriculture Organisation (FAO) for series of forest related data including the
Global Forest Resource Assessment;
• Statistical office of the European Union (EUROSTAT);
• United Nations Economic Commission for Europe (UNECE) for wood harvest and trade
data (the Joint Forest Sector Questionnaire);
• Joint Wood Energy Enquiry of the UNECE, IEA and FAO;
• FOREST EUROPE (The brand name of the Ministerial Conference on the Protection of
Forests in Europe);
• European Commission in respect of forest health.
Forest Statistics is an annual compilation of statistics on the forest estate and the forest industry
in Ireland.
Data revision and correction policy
While every effort is made to ensure the accuracy of data provided, amendments can occur as
new data become available or errors are detected and corrected. The data in each report relate to
the year prior to the year of publication e.g. the data range in the 2020 edition includes
information up to the end of 2019. However, as there is a certain time-lag before statistics are
finalised for a given year, the relevant sections will be revised to include the new data when it
becomes available.

Ireland’s Forests – Statistics 2020
4
2. Forest Area
2.1 Introduction
This chapter contains statistics on:
• Irish forest area and area changes over time;
• Forest ownership;
• Tree species composition;
• Age structure of the forest estate.
Key Facts
• Forest trees began recolonising Ireland following the end of the last glacial stage 10,000
years ago. Analysis of pollen from peat bogs illustrates the establishment of forests that
once covered 80% of the land surface;
• The area of forest is estimated to be 770,020 ha or 11% of the total land area of Ireland
(National Forest Inventory 2017);
• Forest cover is estimated to be at its highest level in over 350 years;
• Of the total forest area, 391,357 ha or 50.8% is in public ownership, mainly Coillte1;
• The forest estate is comprised of 71.2% conifers and 28.7% broadleaves;
• Nearly three quarters of the stocked forest area is less than 30 years of age.
1Coillte is a State-owned company operating in forestry, land-based businesses and added-value processing operations. The company was established as a private limited company under the Forestry Act 1988 which set out its objectives and duties. The company’s shareholders are the Minister for Finance and the Minister for Agriculture, Food and the Marine.
Department of Agriculture, Food & the Marine
5
2.2 Forest definition
The National Forest Inventory defines forests as land with a minimum area of 0.1 ha under stands
of trees 5 m or higher, having a minimum width of 20 m and a canopy cover of 20% or more
within the forest boundary; or trees able to reach these thresholds in situ. The forest definition
relates to land use rather than land cover, with the result that open space within a forest boundary
either permanently or temporarily unstocked with trees, along with felled areas that are awaiting
regeneration, are included as forest.
2.3 Forest area
In 2017, the 3rd National Forest Inventory (NFI) estimated the area of forest to be 770,020
hectares or 11% of the land area, excluding inland water bodies (Table 1 and Figure 1). Of the
total forest area, 687,525 ha or 89.3% comprises areas occupied by trees or potentially occupied
by trees, while permanently unstocked open area within the forest (roads, ridelines, powerlines,
etc.) comprises 82,496 ha or 10.7%. Leitrim is the county with the highest percentage of forest
cover (18.9%), while Cork has the largest forest area (90,020 ha) (Table 1). Nearly two-thirds
(65.5%) the stocked forest area is conifer forest, while 20.5% is broadleaved forest and 14% is
mixed forest. Information on the composition of tree species planted annually as part of
afforestation scheme is presented in Chapter 3.
Table 1. Forest Area by County (NFI, 2017).
County Forest Area
(ha) Percent Forest Cover
within County (%) Carlow 8,403 9.4 Cavan 18,032 9.3 Clare 55,106 17.2 Cork 90,020 12.1 Donegal 55,534 11.4 Dublin 6,011 6.5 Galway 60,605 9.9 Kerry 57,540 12.1 Kildare 10,396 6.1 Kilkenny 19,825 9.6 Laois 26,462 15.4 Leitrim 30,061 18.9 Limerick 27,933 10.4 Longford 9,160 8.4 Louth 2,428 2.9 Mayo 51,325 9.2 Meath 13,326 5.7 Monaghan 5,997 4.6 Offaly 29,332 14.7 Roscommon 28,311 11.1 Sligo 20,980 11.4 Tipperary 50,241 11.8 Waterford 26,949 14.7 Westmeath 15,163 8.2 Wexford 14,620 6.2 Wicklow 36,262 17.9 Total 770,020
Ireland’s Forests – Statistics 2020
6
Forest trees began recolonising Ireland following the end of the last glacial stage 10,000 years
ago. Analysis of pollen from peat bogs illustrates the establishment of forests that once covered
80% of the land surface2. In the sixteenth and early seventeenth centuries significant forest
exploitation occurred as a result of the cutting of wood for use in: ship construction, barrel staves,
and for charcoal for iron and glass work. By the early 1700’s all but the least accessible forests
had been cleared.3
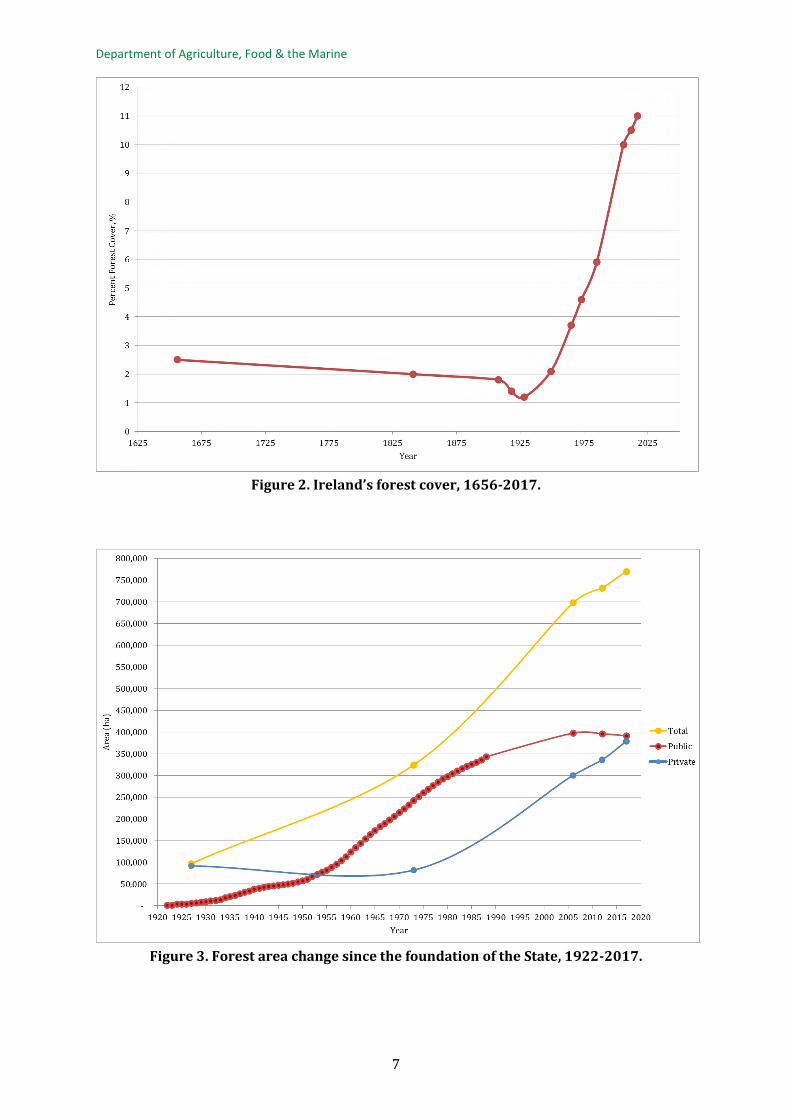
The changes in forest cover in Ireland since 1656 are indicated in Table 2 and Figure 1. All
estimates prior to 1918 relate to the whole of the island of Ireland, thereafter estimates are for
the Republic of Ireland only. A 1905 forest cover estimate for the province of Ulster was 15,000
ha, but overall forest cover on the island of Ireland was still declining up to 1928.
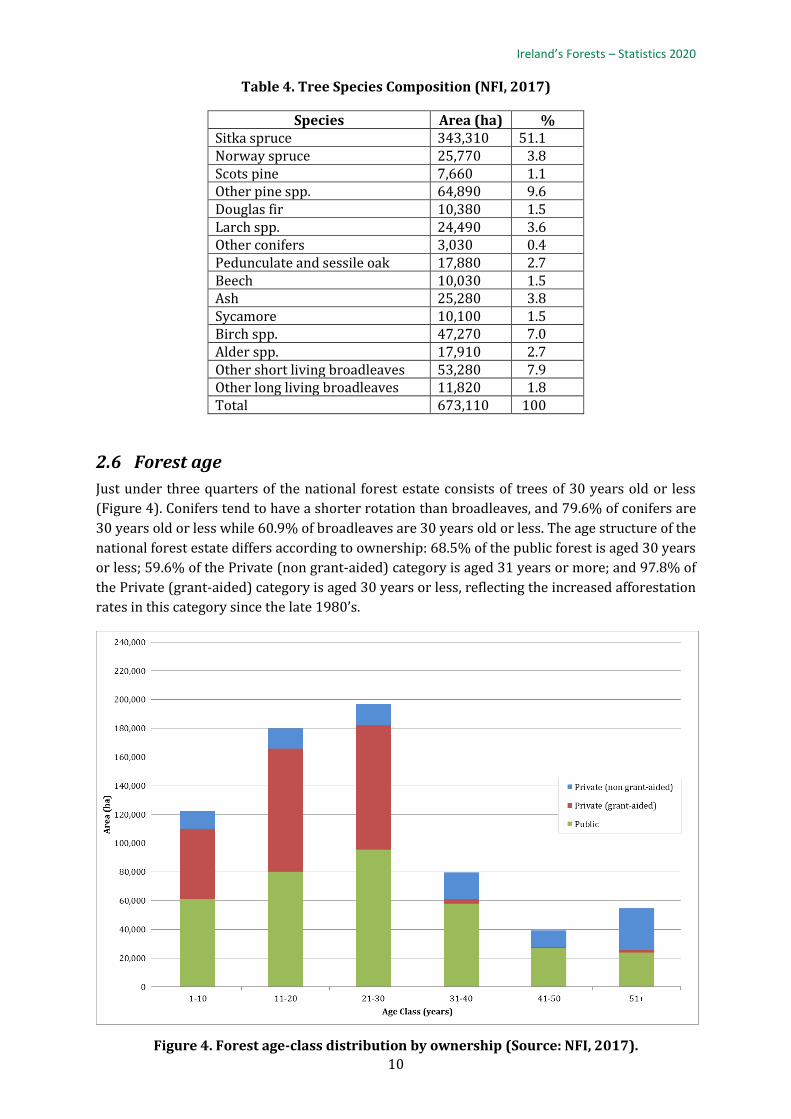
Since the foundation of the State, forest cover in Ireland has grown from 1.4% of the land area, to
the current 11%. Figure 2 shows the growth in area of both public and private forests over this
period. Four inventories of the private forest estate have taken place: 1973, 2006, 2012 and 2017.
The area of privately-owned forests has increased from 81,958 ha in 1973 to 378,663 ha in 2017,
over a four-fold increase. Over the same period, the State owned forest area has also significantly
increased from 242,056 ha to 391,357 ha. The 770,020 ha of forest in Ireland in 2017 represents
11% of the total land area (Figure 3).
Table 2. Development of forest area in Ireland.
Year Area (ha) % of Total Land Area 16564 170,000 2.5 18415 140,000 2.0 19086 125,200 1.8 19187 100,717 1.4 19288 89,000 1.2 19499 144,000 2.1 196510 254,350 3.7 197311 323,654 4.6 198512 411,529 5.9 200613 697,730 10.1 201214 731,650 10.5 201715 770,020 11.0
2 Mitchell, J. G. 1995. The Dynamics of Irish Post-Glacial Forests. In: Wood, trees and forests. Royal Irish Academy. Proceedings of a Seminar Held on 22 and 23 February 1994. Dublin 3Anon. 1979. Irish Forestry Policy. National Economic and Social Council. Government Publication Office 4 Rackham, O., 1986. The History of the Countryside. Dent & Sons Ltd., London. 5 Aalen, F. H. A., Whelan K. and Stout M. (Eds). 1997. Atlas of the Irish Rural Landscape. Cork University Press 6 Dept. Of Agriculture & Technical Instruction. 1908. Report of the Departmental Committee on Irish Forestry. A. Thom & Co., 1908. 7 Dept. of Agriculture, 1926. Forest Lands and Timber Supply in the Irish Free State. Proceedings of the First International Congress on Sylviculture, Rome, 1926. 8 Minister for Lands & Agriculture. Dail Eireann, Volume 23, 3rd May 1928. 9 Estimate generated from Annual Report of the Department of Agriculture, 1943/49. 10 Estimate generated from Annual Report of the Department of Agriculture, 1964/65. 11 Estimate generated from Purcell, T.J, 1973. Inventory of Private Forests -1973. Department of Fisheries and Forestry and Annual Report of the Department of Agriculture 1972/73. 12 Estimate generated from Annual Report of the Department of Agriculture, 1985. 13 National Forest Inventory Republic of Ireland Results. 2007. Dept. of Agriculture, Fisheries and Food. 14 National Forest Inventory Republic of Ireland Results. 2013. Dept. of Agriculture, Food and the Marine. 15 National Forest Inventory Republic of Ireland Results. 2017. Dept. of Agriculture, Food and the Marine.
Department of Agriculture, Food & the Marine
7
Figure 2. Ireland’s forest cover, 1656-2017.
Figure 3. Forest area change since the foundation of the State, 1922-2017.

Ireland’s Forests – Statistics 2020
8
Figure 1. Forest cover in Ireland.

Department of Agriculture, Food & the Marine
9
2.4 Forest Ownership
Within the national forest estate there are three main forest ownership categories:
1. Public: all State owned forests, mainly Coillte;
2. Private (grant-aided): private afforested land which was in receipt of either grant
and/or premium since 1980;
3. Private (non grant-aided): private forests not in receipt of grant-aid post 1980. Includes
areas semi-natural forests that have regenerated naturally and other long-standing
plantations on private estate holdings.
In 2017, 50.8% of forests were in State ownership, a reduction from 57% in 2006 (primarily due
to private sector afforestation in the intervening period). The public forest area (Table 3), consists
of 391,357 ha; comprises 357,290 ha of stocked forest land and 34,060 ha of forest open area.
Coillte owns 380,156 ha of the public forest area.
Table 3. Forest ownership in Ireland (NFI, 2017)
Ownership Area (ha) % Public 391,357 50.8 Private (grant-aided) 268,100 34.8 Private (non grant-aided) 110,563 14.4 Total 770,020 100
2.5 Species composition
Sitka spruce is the most common species, occupying 51.1% of the forest area (Table 4). Over one
quarter of the forest contains broadleaves. Nearly one-third (33.6%) of the broadleaves are ‘Other
broadleaf species’ (both long living and short living), of which over half are willow16. The next
largest broadleaf species group was birch (24.4%), followed by ash (13.1%) and oak (9.2%).
Conifers occupy 479,530 ha while broadleaved species cover 193,580 ha.
The interpretation of stocked areas of individual species presented in Table 4 needs to be
carefully considered since many forests contain an intimate mixture of species. Methods are used
to apportion the constituent individual species from these intimate mixtures into the total area
covered by the forest. The total stocked area of a given species therefore does not represent
distinct areas of land covered by pure stands of the species, but represent the areas of mixed
forest apportioned to them.
16 For most NFI statistical outputs, it was more convenient to work with the species groups than with individual species. The data would not have been sufficiently representative if processed by species. The species group composition of long living broadleaves are as follows: field maple, maple, horse chestnut, strawberry tree, hornbeam, sweet chestnut, holly, nothofagus spp., white poplar, black poplar, Turkey oak, red oak, whitebeam, small-leaved lime, large-leaved lime, wych elm. The species group composition of short living broadleaves are as follows: crab apple, aspen, cherry, blackthorn, goat willow, other willows, mountain ash, and hazel.
Ireland’s Forests – Statistics 2020
10
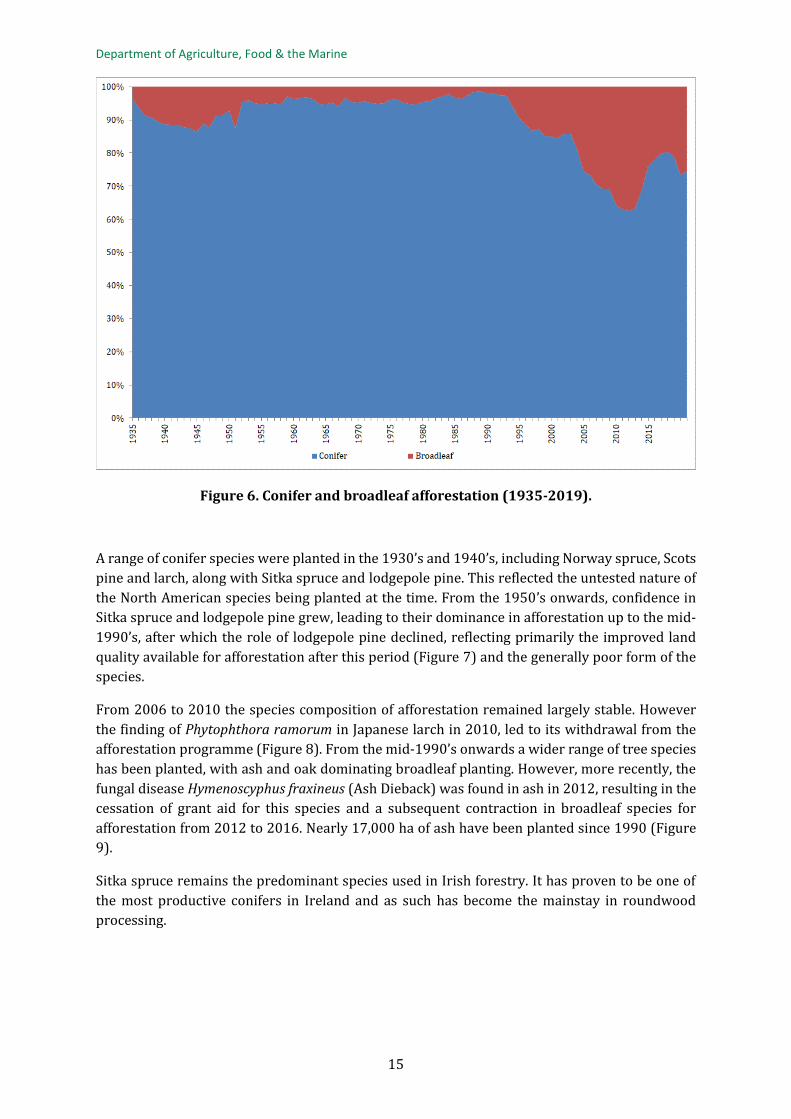
Table 4. Tree Species Composition (NFI, 2017)
Species Area (ha) % Sitka spruce 343,310 51.1 Norway spruce 25,770 3.8 Scots pine 7,660 1.1 Other pine spp. 64,890 9.6 Douglas fir 10,380 1.5 Larch spp. 24,490 3.6 Other conifers 3,030 0.4 Pedunculate and sessile oak 17,880 2.7 Beech 10,030 1.5 Ash 25,280 3.8 Sycamore 10,100 1.5 Birch spp. 47,270 7.0 Alder spp. 17,910 2.7 Other short living broadleaves 53,280 7.9 Other long living broadleaves 11,820 1.8 Total 673,110 100
2.6 Forest age
Just under three quarters of the national forest estate consists of trees of 30 years old or less
(Figure 4). Conifers tend to have a shorter rotation than broadleaves, and 79.6% of conifers are
30 years old or less while 60.9% of broadleaves are 30 years old or less. The age structure of the
national forest estate differs according to ownership: 68.5% of the public forest is aged 30 years
or less; 59.6% of the Private (non grant-aided) category is aged 31 years or more; and 97.8% of
the Private (grant-aided) category is aged 30 years or less, reflecting the increased afforestation
rates in this category since the late 1980’s.
Figure 4. Forest age-class distribution by ownership (Source: NFI, 2017).

Department of Agriculture, Food & the Marine
11
2.7 Hedgerows and Trees outside the Forest
2.7.1 Extent
In 2011 Teagasc produced a hedgerow map of Ireland, based upon 2005 orthophotography16. All
areas of mature hedgerows, individual trees and non-forest woodland and scrub were digitally
mapped to a 1 metre resolution. National cover of hedgerows, individual trees and non-forest
woodland and scrub was estimated at approximately 482,000 ha, or 6.4%, with an 80% accuracy.
Table 4 displays the results on a county level.
The third National Forest Inventory (2017) estimates national hedgerow and non-forest other
wooded land at 347,690 ha, or 4.9% cover. This estimate differs from the Teagasc Irish Hedge
Map estimate from 2011, which is most likely due to differing methodologies. In addition, the
Teagasc Irish Hedge Map includes areas of non-forest woodland and scrub that under the NFI
were classified as Forest.
Table 4. County level estimates of non-forest hedgerow, scrub and woodland (HSW) cover
(The Irish Hedge Map, Teagasc, 2011).
County Area of HSW (ha) % of National HWS Stock % of County under HWS Galway 30,000 6.7 4.9 Leitrim 11,000 2.4 6.9 Mayo 23,000 5.1 4.1 Roscommon 19,000 4.2 7.5 Sligo 11,000 2.4 6 Carlow 8,000 1.8 8.9 Dublin 5,000 1.1 5.4 Kildare 14,000 3.1 8.3 Kilkenny 19,000 4.2 9.2 Laois 12,000 2.7 7 Longford 8,000 1.8 7.3 Louth 8,000 1.8 9.8 Meath 24,000 5.3 10.2 Offaly 13,000 2.9 6.5 Westmeath 17,000 3.8 9.2 Wexford 20,000 4.4 8.5 Wicklow 10,000 2.2 4.9 Clare 22,000 4.9 7 Cork 57,000 12.7 7.6 Kerry 23,000 5.1 4.8 Limerick 25,000 5.6 9.3 Tipperary 35,000 7.8 8.1 Waterford 12,000 2.7 6.5 Cavan 20,000 4.4 10.4 Donegal 20,000 4.4 4.1 Monaghan 16,000 3.6 12.4 Total 482,000 6.4
16 The Irish Hedge Map – Version 1.0. Teagasc, 2011.

Ireland’s Forests – Statistics 2020
12
2.7.2 Agri-Environmental Schemes
Since the introduction of agri-environmental schemes in 1994 6,605 kilometres of new
hedgerows and more than 3.7 million trees have been established on non-forest land as outlined
in Table 5.
Table 5. The total estimate of newly established hedgerows and trees under agri-
environmental schemes (Department of Agriculture, Food and the Marine, 2018).
Scheme Newly
established hedgerows (km)
Newly planted
trees
Newly planted
orchard trees Rural Environment Protection Scheme (REPS) 1994 - 2010
4,100 1,702,972 N/A
Agri-Environment Options Scheme (AEOS) 2010 - 2014
1,322 464,910 N/A
Green Low Carbon Agri-Environment (GLAS) 2014 - 2018
1,183 1,617,516 11,182
Total 6,605 3,785,398 11,182
2.7.3 Biomass and Carbon
A 2014 report from the Environmental Protection Agency (EPA) examining the feasibility of a
national hedgerow inventory estimated that hedgerow and non-forest woodland and scrub could
potentially be sequestering 0.66 - 3.3 tonnes of CO2/ha/year17. Based on existing national
estimates for hedgerow and non-forest woodland and scrub cover, it states that this could result
in a net removal of 0.27-1.4 Mt CO2/year. The value of hedgerows and trees outside of forests is
reflected in recently introduced agri-environmental measures which have resulted in the
establishment of new hedgerows and trees outside of the forest.
A second EPA project titled, Biomass Retrieval in Ireland using Active Remote sensing (BRIAR)18,
examined the use of radar to estimate biomass stocks in hedgerows. The Ordnance Survey Prime2
spatial data storage model was applied in conjunction with developed maps showing the
probability of a field boundary being a stone wall or a hedgerow, to give a new national estimate
for hedgerow length in Ireland of 689,000 km. This estimate is double the frequently quoted
figure of 300,000 km because of a much wider definition of “hedgerow” used in the BRIAR report.
Net change in hedgerow length was examined using the aerial photographic records from 1995,
2005 and 2015, along with county-level survey records, showing that there has been a net
removal of hedgerows between 1995 and 2015 of between 0.16% and 0.3% per annum, although
the rate is much slower in the latter half of that period.
17 Carbon Sequestration by Hedgerows in the Irish Landscape. Climate Change Research Programme (CCRP) 2007–2013 Report Series No. 32. Environmental Protection Agency, 2014. 18BRIAR: Biomass Retrieval in Ireland using Active Remote sensing. EPA Research Programme 2014–2020 Report Series No. 2014-CCRP-MS.17. Environmental Protection Agency, 2019.

Department of Agriculture, Food & the Marine
13
3. Afforestation This section provides information on afforestation levels since the foundation of the State, with
a particular emphasis on private afforestation since 1980.
3.1 Introduction
This chapter provides information on:
• Species composition of afforestation;
• Forest size and number of private (grant-aided) afforestation since 1980;
• Ownership and forest size patterns of private (grant-aided) afforestation since 1980;
• Ownership patterns of private forests established prior to 1980.
Key statistics
• State afforestation was relatively low up until the 1950’s, but thereafter increased up to
the year 2000;
• Private afforestation came to the fore in the mid-1980’s: nearly 300,000 ha of private
forests were established between 1980 and 2019;
• The proportion of broadleaf afforestation significantly increased after 1993, and up to the
present, averaging 23% of all afforestation since that year. Broadleaf afforestation
accounted for 25% of the area afforested in 2019;
• Tree diseases such as Phytophthora ramorum (mainly affecting larch) and Ash Dieback
(Hymenoscyphus fraxineus) may influence species diversity into the future;
• 81% of the forests afforested since 1980 have been planted by farmers;
• The average size of private grant-aided parcels of land afforestated between 1980 and
2019 was 8.6 ha;
• Since 1980, 23,256 individual private forest owners have received grant aid to establish
their forests;
• Nearly half (46.2%) of all individual owners have received afforestation grant aid at least
twice since 1980, which should contribute to management efficiencies, due to the
increased size of the individuals forest holding.

Ireland’s Forests – Statistics 2020
14
3.2 Afforestation
As shown in Table 2, forest cover on the island of Ireland continued to decline up to 1928. With
the introduction of the first Forestry Act in 1928 the decline of forest area was largely halted,
however afforestation levels remained relatively low right up until the 1950’s. The level of State
afforestation dramatically increased from the 1950’s up to 2000, after which State planting
declined to a negligible level.
Private afforestation came to the fore in the mid-1980’s following the introduction of a grant and
particularly an annual premium scheme for afforestation. Long-run afforestation trends,
including the change from State-led to private-led grant-aided afforestation in the 1980’s and
1990’s are shown in Figure 5.
Figure 5. Annual State and private afforestation (1922-2019).
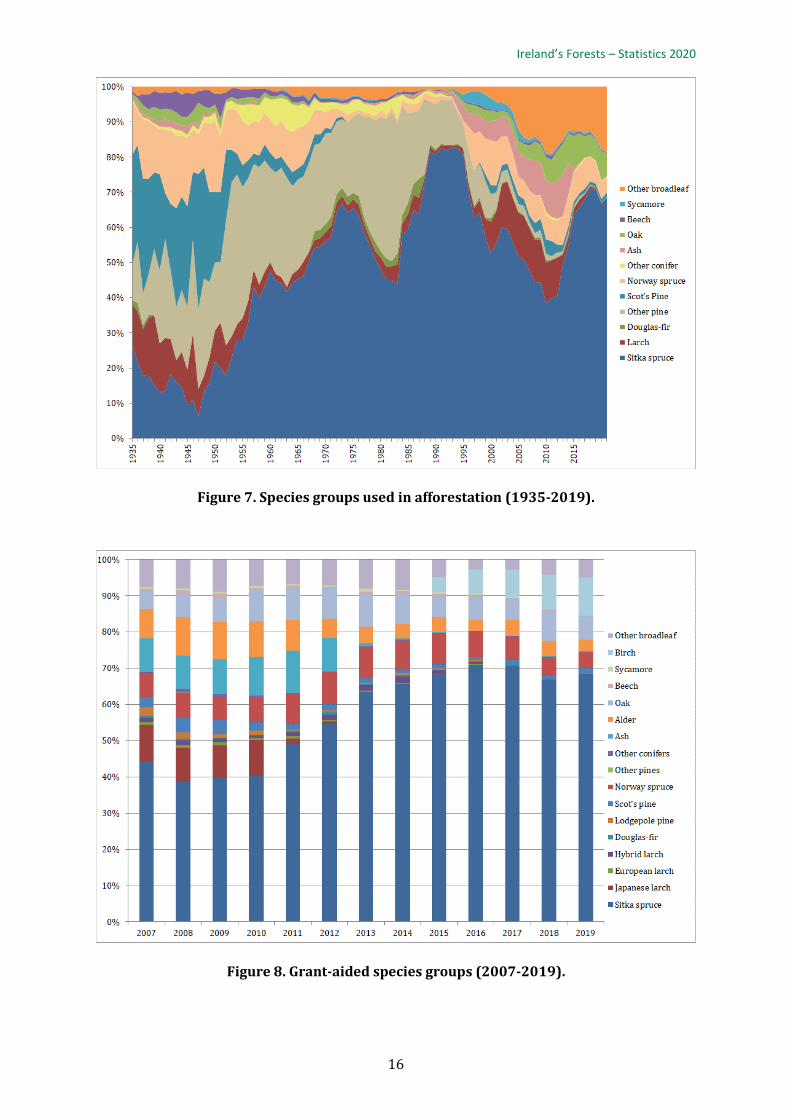
Figure 6 displays the ratio of broadleaf and conifer afforestation from 1935 to the present. During
the 1930’s and 1940’s, afforestation consisted of approximately 90% conifer species and 10%
broadleaf species, and from the late 1940’s to the early 1990’s, broadleaves comprised
approximately 4% of all afforestation. As a result of the positive differential in favour of broadleaf
species in both the afforestation grant and premium schemes, the proportion of broadleaves
planted increased significantly from 1993 up to the present, reaching a high of 37% from 2008 to
2011. Broadleaf afforestation subsequently declined to 20% in 2015 and 2016, primarily due to
restrictions on planting ash (due to Hymenoscyphus fraxineus), but in 2019 had increased to 25%
of all afforestation. From 1993 to the present broadleaf afforestation has averaged 23% and
conifers 77%.
Department of Agriculture, Food & the Marine
15
Figure 6. Conifer and broadleaf afforestation (1935-2019).
A range of conifer species were planted in the 1930’s and 1940’s, including Norway spruce, Scots
pine and larch, along with Sitka spruce and lodgepole pine. This reflected the untested nature of
the North American species being planted at the time. From the 1950’s onwards, confidence in
Sitka spruce and lodgepole pine grew, leading to their dominance in afforestation up to the mid-
1990’s, after which the role of lodgepole pine declined, reflecting primarily the improved land
quality available for afforestation after this period (Figure 7) and the generally poor form of the
species.
From 2006 to 2010 the species composition of afforestation remained largely stable. However
the finding of Phytophthora ramorum in Japanese larch in 2010, led to its withdrawal from the
afforestation programme (Figure 8). From the mid-1990’s onwards a wider range of tree species
has been planted, with ash and oak dominating broadleaf planting. However, more recently, the
fungal disease Hymenoscyphus fraxineus (Ash Dieback) was found in ash in 2012, resulting in the
cessation of grant aid for this species and a subsequent contraction in broadleaf species for
afforestation from 2012 to 2016. Nearly 17,000 ha of ash have been planted since 1990 (Figure
9).
Sitka spruce remains the predominant species used in Irish forestry. It has proven to be one of
the most productive conifers in Ireland and as such has become the mainstay in roundwood
processing.
Ireland’s Forests – Statistics 2020
16
Figure 7. Species groups used in afforestation (1935-2019).
Figure 8. Grant-aided species groups (2007-2019).

Department of Agriculture, Food & the Marine
17
Figure 9. Extent of ash afforestation (1990-2019).
3.3 Private lands afforested, forest size and number
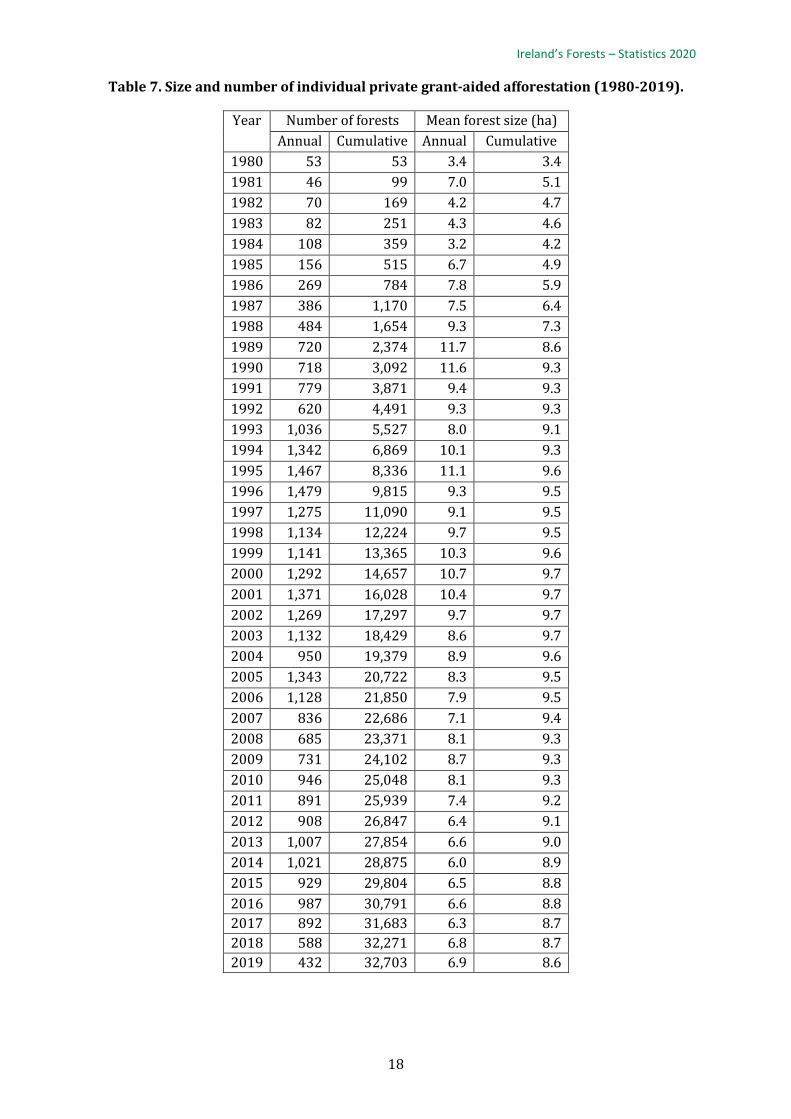
This section provides statistics of private lands afforested over the period 1980 to 2018. The
average size of private grant-aided afforestation between 1980 and 2019 was 8.6 ha (Table 7).
From 1980 up to the mid-1980’s the average afforestation parcel was relatively small at 5.9 ha,
but with the introduction of the grant and premium scheme average afforestation increased to
9.6 ha by the mid-1990s. By 2019 the average area afforested has decreased to 6.9 ha as a result
of planting consisting of a portion of individual agricultural holdings and a movement away from
unenclosed land.
In terms of the size class contribution to overall afforestation since 1980, the distribution is
slightly skewed towards parcels of 10-30 ha; over a wide range from 0.1 ha to over 100+ ha
(Figure 10). Figure 11 shows that large sized individual plantings were a feature of mid 1980’s-
late 1990’s planting. The threshold for a mandatory Environmental Impact Assessment (EIA) was
reduced from 200 to 70 ha in 1996. The size of afforestation parcels decreased between 1997 and
2002, with area afforested in parcels greater than 20 ha decreasing from 46% to 35%. In 2001
the EIA threshold was further reduced from 70 to 50 ha along with sub threshold EIAs in the case
of afforestation likely to have a significant effect on the environment. Since 2002, 20% of
afforestation parcels have been greater than 20 ha; in the last 10 years no individual forestry
application greater than 50 ha has been established. Since 2010 all afforestation applications are
screened to determine whether they require an EIA, and all developments over 50 ha are subject
to a mandatory Environmental Impact Statement. Presently, 32% of the total afforested area
(1980-2019) consists of plantations greater than 20 ha, 63% are greater than 10 ha and 75% are
greater than 7.5 ha in size.
Ireland’s Forests – Statistics 2020
18
Table 7. Size and number of individual private grant-aided afforestation (1980-2019).
Year Number of forests Mean forest size (ha)
Annual Cumulative Annual Cumulative
1980 53 53 3.4 3.4
1981 46 99 7.0 5.1
1982 70 169 4.2 4.7
1983 82 251 4.3 4.6
1984 108 359 3.2 4.2
1985 156 515 6.7 4.9
1986 269 784 7.8 5.9
1987 386 1,170 7.5 6.4
1988 484 1,654 9.3 7.3
1989 720 2,374 11.7 8.6
1990 718 3,092 11.6 9.3
1991 779 3,871 9.4 9.3
1992 620 4,491 9.3 9.3
1993 1,036 5,527 8.0 9.1
1994 1,342 6,869 10.1 9.3
1995 1,467 8,336 11.1 9.6
1996 1,479 9,815 9.3 9.5
1997 1,275 11,090 9.1 9.5
1998 1,134 12,224 9.7 9.5
1999 1,141 13,365 10.3 9.6
2000 1,292 14,657 10.7 9.7
2001 1,371 16,028 10.4 9.7
2002 1,269 17,297 9.7 9.7
2003 1,132 18,429 8.6 9.7
2004 950 19,379 8.9 9.6
2005 1,343 20,722 8.3 9.5
2006 1,128 21,850 7.9 9.5
2007 836 22,686 7.1 9.4
2008 685 23,371 8.1 9.3
2009 731 24,102 8.7 9.3
2010 946 25,048 8.1 9.3
2011 891 25,939 7.4 9.2
2012 908 26,847 6.4 9.1
2013 1,007 27,854 6.6 9.0
2014 1,021 28,875 6.0 8.9
2015 929 29,804 6.5 8.8
2016 987 30,791 6.6 8.8
2017 892 31,683 6.3 8.7
2018 588 32,271 6.8 8.7
2019 432 32,703 6.9 8.6

Department of Agriculture, Food & the Marine
19
Figure 11. Size class distribution of private grant-aided afforestation (1980-2019).
Figure 12. Proportion of annual private grant-aided afforestation area by size class
(1980-2019).

Ireland’s Forests – Statistics 2020
20
3.4 Grant Premium Category
Figure 10 outlines the total area of grant-aided afforestation by Grant Premium Category (GPC).
Grant and premium categories are used in the afforestation scheme to label different species and
species groupings. The GPC categories are described in figure 10.
GPC 3 (Sitka spruce, plus other species) has been the most popular category, and has increased
from 48% in 2004 to 77% in 2019. The increase in the area of GPC 3 is in part due to the removal
of ash and larch from the afforestation programme due to Chalara and Phytophthora ramorum
but also due to the reduction in the area of GPC 4 been afforested. GPC 5 (mainly broadleaves)
has historically been the second most popular category, at approximately 20% during 2004 to
2011.
Figure 10. Proportion of annual grant-aided afforestation area by Grant Premium
Categories (2004 to 2019).
3.5 Private afforestation ownership
This section provides information on the nature of private forest owners who afforested between 1980 and 2019. The data refers to the calendar year when the forest was planted.
3.5.1 Farmer/non-farmer
Farmers accounted for 81% of private lands afforested between 1980 and 2019. In the
Afforestation Grant and Premium Scheme (2014-2020) changes were implemented to the
differentiation of Farmers and Non-farmers in terms of premium payments. Prior to 2014 it was
necessary for land owners to qualify as farmers to be eligible for an additional five premium
payments. Farmers and Non-farmers are now eligible for the same duration of premium
payments. The category ‘Non-farmer’ includes landowners who in general are not actively
farming. However, it is important to note that the non-farmer category includes; retired farmers,
family members of farmers who might have inherited land but who work outside of farming and
other landowners who may have recently bought the land.
Department of Agriculture, Food & the Marine
21
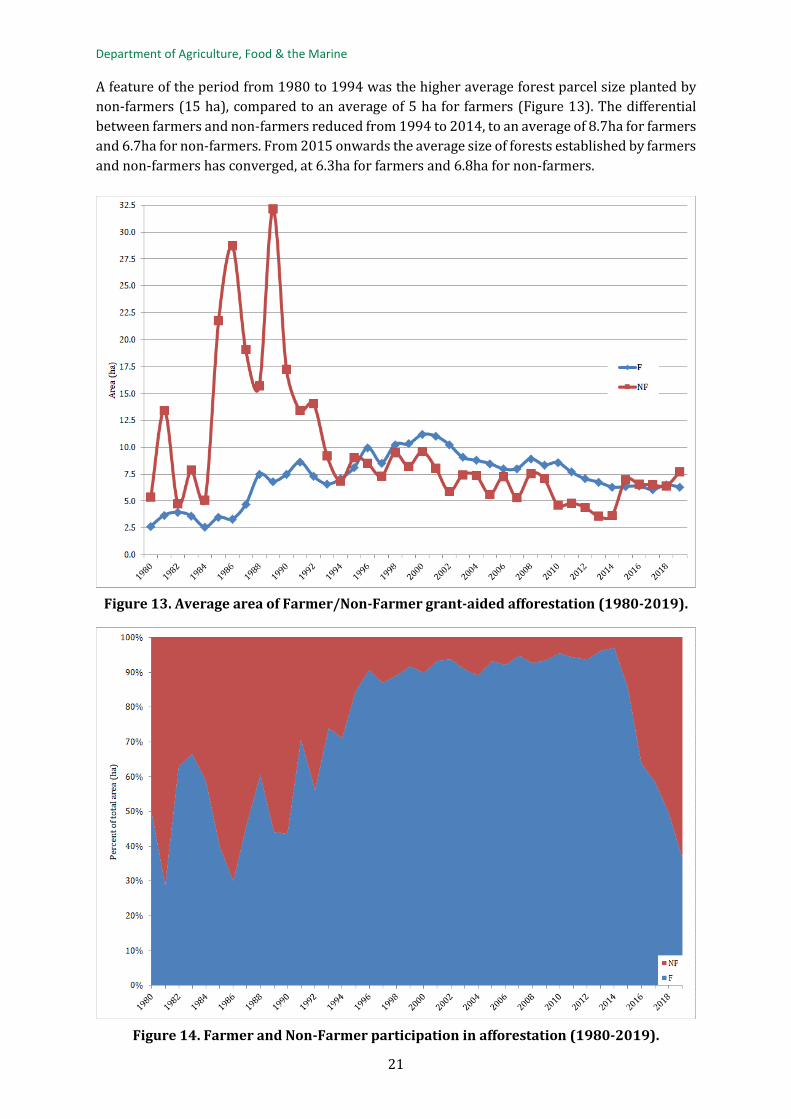
A feature of the period from 1980 to 1994 was the higher average forest parcel size planted by
non-farmers (15 ha), compared to an average of 5 ha for farmers (Figure 13). The differential
between farmers and non-farmers reduced from 1994 to 2014, to an average of 8.7ha for farmers
and 6.7ha for non-farmers. From 2015 onwards the average size of forests established by farmers
and non-farmers has converged, at 6.3ha for farmers and 6.8ha for non-farmers.
Figure 13. Average area of Farmer/Non-Farmer grant-aided afforestation (1980-2019).
Figure 14. Farmer and Non-Farmer participation in afforestation (1980-2019).
Ireland’s Forests – Statistics 2020
22
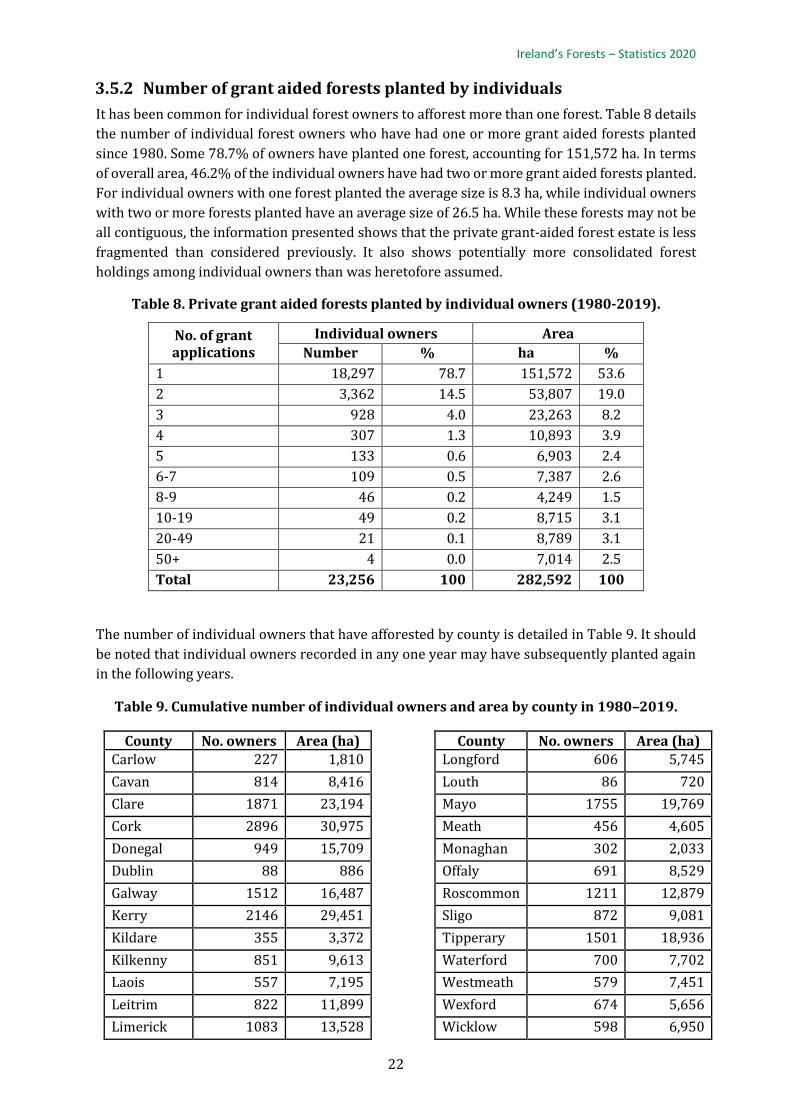
3.5.2 Number of grant aided forests planted by individuals
It has been common for individual forest owners to afforest more than one forest. Table 8 details
the number of individual forest owners who have had one or more grant aided forests planted
since 1980. Some 78.7% of owners have planted one forest, accounting for 151,572 ha. In terms
of overall area, 46.2% of the individual owners have had two or more grant aided forests planted.
For individual owners with one forest planted the average size is 8.3 ha, while individual owners
with two or more forests planted have an average size of 26.5 ha. While these forests may not be
all contiguous, the information presented shows that the private grant-aided forest estate is less
fragmented than considered previously. It also shows potentially more consolidated forest
holdings among individual owners than was heretofore assumed.
Table 8. Private grant aided forests planted by individual owners (1980-2019).
No. of grant applications
Individual owners Area
Number % ha %
1 18,297 78.7 151,572 53.6
2 3,362 14.5 53,807 19.0
3 928 4.0 23,263 8.2
4 307 1.3 10,893 3.9
5 133 0.6 6,903 2.4
6-7 109 0.5 7,387 2.6
8-9 46 0.2 4,249 1.5
10-19 49 0.2 8,715 3.1
20-49 21 0.1 8,789 3.1
50+ 4 0.0 7,014 2.5
Total 23,256 100 282,592 100
The number of individual owners that have afforested by county is detailed in Table 9. It should
be noted that individual owners recorded in any one year may have subsequently planted again
in the following years.
Table 9. Cumulative number of individual owners and area by county in 1980–2019.
County No. owners Area (ha) County No. owners Area (ha) Carlow 227 1,810 Longford 606 5,745
Cavan 814 8,416 Louth 86 720
Clare 1871 23,194 Mayo 1755 19,769
Cork 2896 30,975 Meath 456 4,605
Donegal 949 15,709 Monaghan 302 2,033
Dublin 88 886 Offaly 691 8,529
Galway 1512 16,487 Roscommon 1211 12,879
Kerry 2146 29,451 Sligo 872 9,081
Kildare 355 3,372 Tipperary 1501 18,936
Kilkenny 851 9,613 Waterford 700 7,702
Laois 557 7,195 Westmeath 579 7,451
Leitrim 822 11,899 Wexford 674 5,656
Limerick 1083 13,528 Wicklow 598 6,950

Department of Agriculture, Food & the Marine
23
3.5.3 Annual grant applications by individual owner
As stated, when assessing the average size of the total forest holdings of individual owners a
profile of a less fragmented private forest estate emerges, compared to using a simple average of
afforestation areas. By 2019, the average cumulative area afforested by individual owners was
12.2 ha (Table 10), compared to the average afforestation area of 8.6 ha (Table 7). Looking only
at the average size of individual afforestation areas ignores the fact that some owners have
afforested multiple forest holdings over time (Figure 15).
Table 10. Annual grant applications by individual owners (1980-2019).
Year No. of individual owners Mean forest size (ha) Annual Cumulative Annual Cumulative
1980 46 46 3.9 3.9
1981 41 74 7.8 6.8
1982 70 133 4.2 6.0
1983 78 193 4.5 6.0
1984 104 272 3.3 5.5
1985 142 382 7.4 6.7
1986 229 573 9.1 8.1
1987 353 860 8.2 8.7
1988 464 1,239 9.7 9.7
1989 658 1,789 12.8 11.4
1990 646 2,331 12.9 12.3
1991 764 3,058 9.5 11.8
1992 594 3,581 9.7 11.7
1993 938 4,410 8.8 11.3
1994 1,250 5,505 10.8 11.6
1995 1,355 6,627 12.0 12.0
1996 1,365 7,714 10.1 12.1
1997 1,163 8,602 10.0 12.2
1998 1,042 9,392 10.6 12.4
1999 1,037 10,187 11.4 12.6
2000 1,161 11,021 11.9 12.9
2001 1,248 11,967 11.4 13.0
2002 1,134 12,787 10.9 13.2
2003 1,005 13,467 9.6 13.2
2004 830 14,065 10.2 13.3
2005 1,186 14,910 9.4 13.3
2006 1,026 15,640 8.7 13.2
2007 759 16,173 7.8 13.1
2008 629 16,628 8.8 13.1
2009 695 17,156 9.2 13.1
2010 898 17,843 8.5 13.0
2011 858 18,529 7.7 12.9
2012 845 19,196 6.9 12.7
2013 938 19,911 7.1 12.6
2014 950 20,622 6.5 12.5
2015 863 21,264 7.0 12.4
2016 926 21,983 7.0 12.3
2017 815 22,594 6.9 12.2
2018 539 22,985 7.4 12.2
2019 377 23,256 8.0 12.2

Ireland’s Forests – Statistics 2020
24
Figure 15. Average area of individual afforestation grant application vs. the average area
of the combined multiple afforestation grant applications owned by the same person
(1980-2019).
3.5.4 Age and gender profile of forest owners
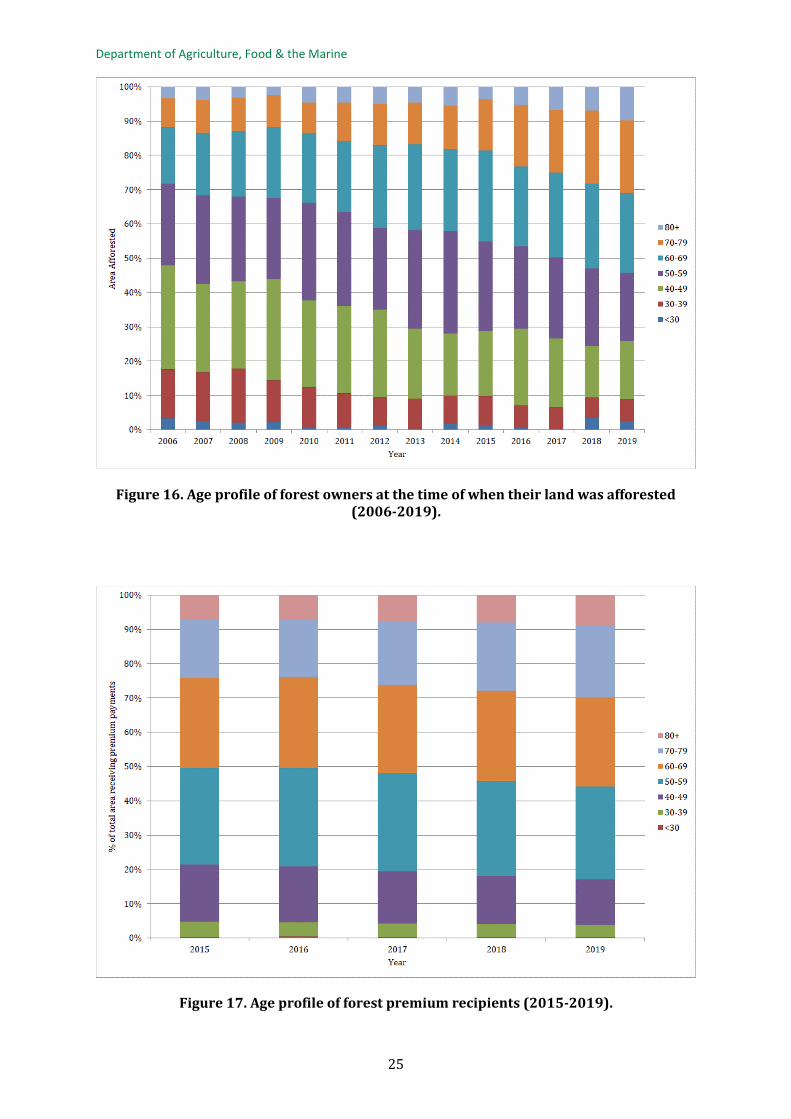
In this section information is presented on the age and gender of forest owners. It is clear from
Figure 16 that between 2006 and 2019, the age of entrants to the afforestation scheme has been
increasing. In 2006, 28% of the area afforested was by people aged 60 years or more, and in 2019
this had increased to 57%. Figure 17 details the age profile of the forest owners in receipt of
premium.
In 2019, 56% of the total area that received premium payments was owned by people aged 60
years or more. Over the 14-year period (2006-2019) 83% of entrants to the afforestation scheme
were male (Figure 18), which is in line with participation in other agricultural schemes in Ireland
(e.g. Basic Payment Scheme).
Department of Agriculture, Food & the Marine
25
Figure 16. Age profile of forest owners at the time of when their land was afforested (2006-2019).
Figure 17. Age profile of forest premium recipients (2015-2019).

Ireland’s Forests – Statistics 2020
26
Figure 18. Gender of forest owners at the time of when land was afforested (2006-2019).
3.5.5 Private (non grant-aided) ownership details
Previous sub-sections in this chapter have outlined ownership profiles of the private grant-aided
estate. Detailed information on the Private (non grant-aided) component of the forest estate is
not available which comprised 110,563 ha in 2017 (NFI, 2017). The 1973 Inventory of Private
Woodlands18 provided inventory information for forest areas of 40 ha or more (17,481 ha) or
21% of the total of 81,958 ha of private forests estimated at the time. At the time, areas 40 ha or
more and under single ownership represented the more commercially viable forest stands in
private ownership. The remaining Private (non grant-aided) forest is comprised of primarily
juvenile, short-living, naturally regenerated broadleaf species such as birch. These forest areas
are commonly quite small and frequently of limited use for agriculture due to slope and other
restrictions. The number of owners in this category is in the region of 20,000-30,000 individuals.
In 1973 over 40% of the 81,958 ha was comprised of “scrub” category. The size category of the
151 estates with detailed historical inventory information is shown in Table 11.
Table 11. Inventory of Private Woodlands, 1973 - Forest-size categories.
Estate Forest Area (ha) Number of estates Area (%) 40-50 25 7 51-100 67 24 101-500 56 59 501-1,000 3 11
18 Purcell, T. 1979. Inventory of Private Woodlands, 1973, Department of Fisheries and Forestry, Forest and Wildlife Service.

Department of Agriculture, Food & the Marine
27
3.6 Grant-aided forest removal
The area of private grant-aided forest removed from the afforestation scheme is shown in Table
12. The majority of these removals are for the following reasons: Public utilities (e.g. power lines)
and Commercial Developments (e.g. windfarms).
Table 12. Lands taken out of afforestation (2007-2019).
Year Number Area (ha) Mean Area (ha) 2007 47 67 1.4
2008 101 209 2.1
2009 110 147 1.3
2010 74 99 1.3
2011 68 87 1.3
2012 75 91 1.2
2013 63 70 1.1
2014 52 64 1.2
2015 13 36 2.7
2016 47 156 3.3
2017 40 101 2.5
2018 34 83 2.4
2019 19 39 2.0
3.7 Change of applicant A substantial area of private grant-aided forests change ownership each year (Table 13). Most
ownership change is within families from one generation to the next.
Table 13. Change of ownership by area of forest (2007-2019).
Year Number Area Mean Area (ha) 2007 345 3,385 9.8 2008 348 3,309 9.5 2009 374 3,850 10.3 2010 393 3,612 9.2 2011 335 2,970 8.9 2012 402 3,999 9.9 2013 379 3,440 9.1 2014 366 3,911 10.7 2015 362 3,503 9.7 2016 543 5,453 10.0 2017 395 3,350 8.5 2018 335 2,915 8.7
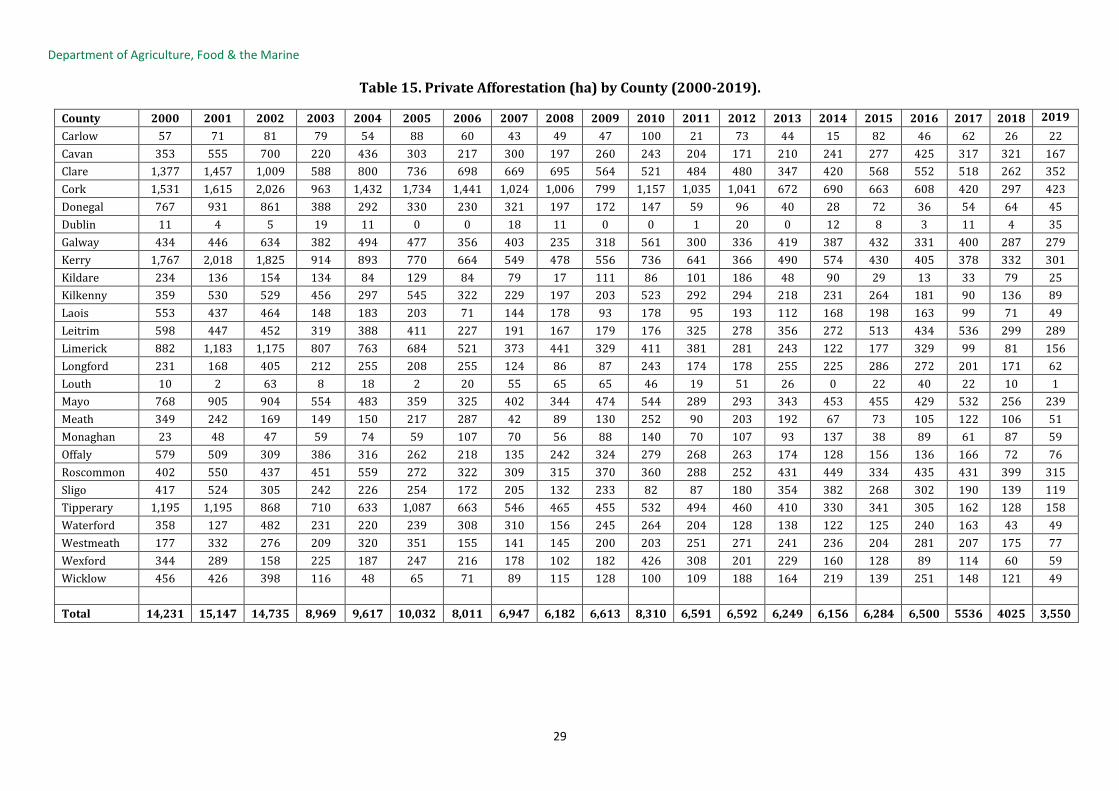
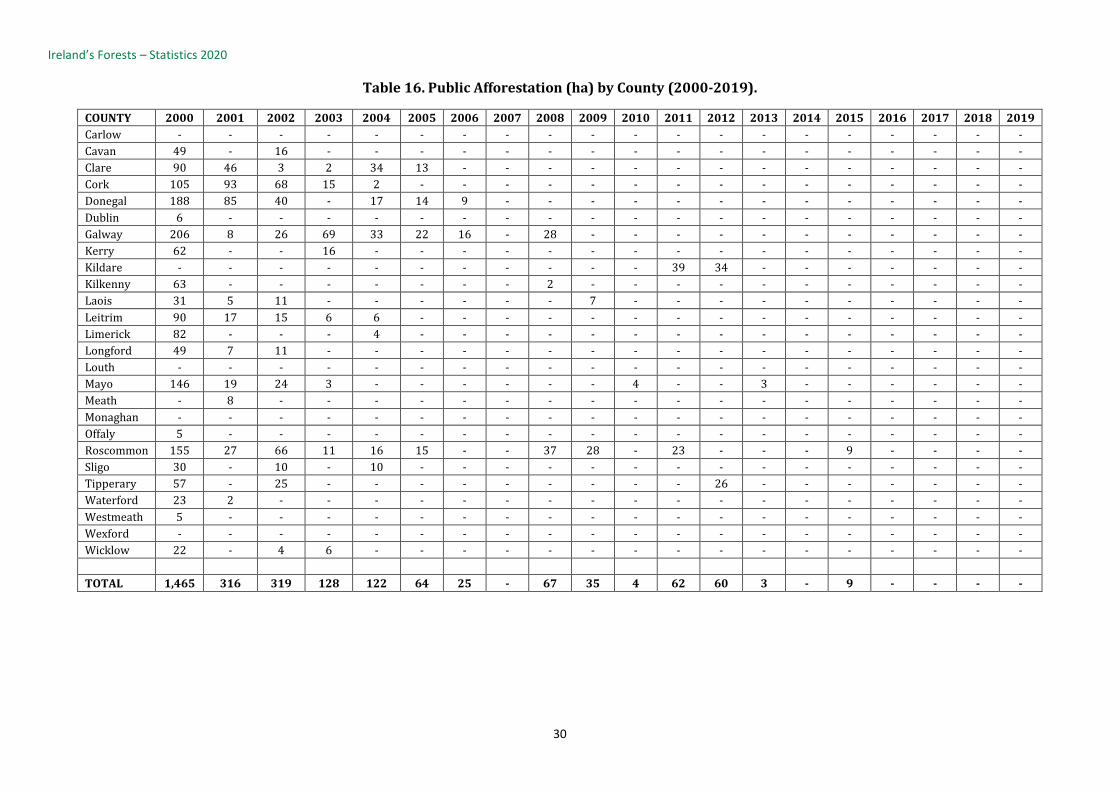
3.8 County level statistics
The total afforestation by county for the last 20 years is detailed in Table 14. In 2019, Cork had
the highest afforestation area at 423ha followed by Clare at 352ha. County level statistics
detailing private and public afforestation are detailed in Tables 15 and 16, respectively. In Table
17, information is presented on the area afforested in each county by Farmers and Non-farmers.
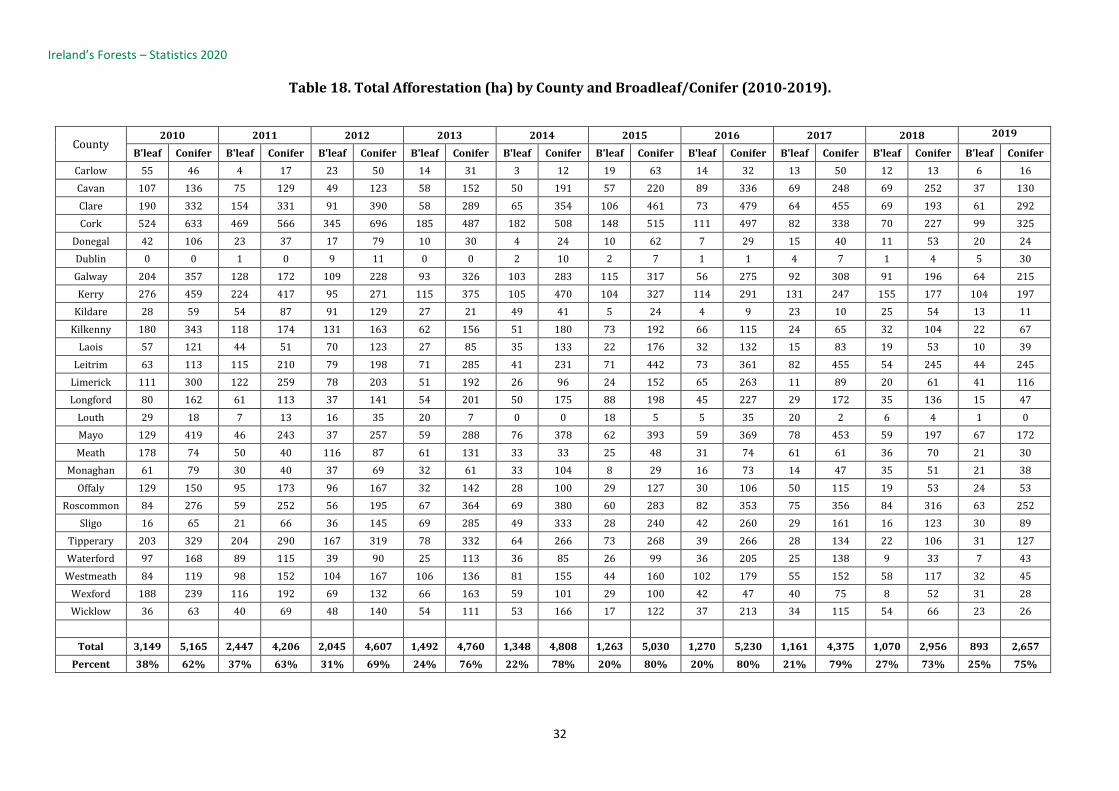
County level species composition details (i.e. broadleaf/conifer) is presented in Table 18.

Ireland’s Forests – Statistics 2020
28
Table 14. Total Afforestation (ha) by County (2000-2019).
County 2000 2001 2002 2003 2004 2005 2006 2007 2008 2009 2010 2011 2012 2013 2014 2015 2016 2017 2018 2019
Carlow 57 71 81 79 54 88 60 43 49 47 100 21 73 44 15 82 46 62 26 22
Cavan 402 555 716 220 436 303 217 300 197 260 243 204 171 210 241 277 425 317 321 167
Clare 1,467 1,504 1,012 590 833 749 698 669 695 564 521 484 480 347 420 568 552 518 262 352
Cork 1,636 1,709 2,094 978 1,434 1,734 1,441 1,024 1,006 799 1,157 1,035 1,041 672 690 663 608 420 297 423
Donegal 955 1,016 900 388 309 345 239 321 197 172 147 59 96 40 28 72 36 54 64 45
Dublin 17 4 5 19 11 - - 18 11 - - 1 20 - 12 8 3 11 4 35
Galway 640 454 660 452 527 499 372 403 263 318 561 300 336 419 387 432 331 400 287 279
Kerry 1,828 2,018 1,825 930 893 770 664 549 478 556 736 641 366 490 574 430 405 378 332 301
Kildare 234 136 154 134 84 129 84 79 17 111 86 141 220 48 90 29 13 33 79 25
Kilkenny 422 530 529 456 297 545 322 229 199 203 523 292 294 218 231 264 181 90 136 89
Laois 584 441 476 148 183 203 71 144 178 100 178 95 193 112 168 198 163 99 71 49
Leitrim 688 464 467 325 394 411 227 191 167 179 176 325 278 356 272 513 434 536 299 289
Limerick 964 1,183 1,175 807 767 684 521 373 441 329 411 381 281 243 122 177 329 99 81 156
Longford 280 175 416 212 255 208 255 124 86 87 243 174 178 255 225 286 272 201 171 62
Louth 10 2 63 8 18 2 20 55 65 65 46 19 51 26 - 22 40 22 10 1
Mayo 914 924 929 556 483 359 325 402 344 474 548 289 293 346 453 455 429 532 256 239
Meath 349 250 169 149 150 217 287 42 89 130 252 90 203 192 67 73 105 122 106 51
Monaghan 23 48 47 59 74 59 107 70 56 88 140 70 107 93 137 38 89 61 87 59
Offaly 585 509 309 386 316 262 218 135 242 324 279 268 263 174 128 156 136 166 72 76
Roscommon 557 577 503 462 575 287 322 309 352 398 360 311 252 431 449 343 435 431 399 315
Sligo 446 524 315 242 237 254 172 205 132 233 82 87 180 354 382 268 302 190 139 119
Tipperary 1,252 1,195 893 710 633 1,087 663 546 465 455 532 494 486 410 330 341 305 162 128 158
Waterford 381 129 482 231 220 239 308 310 156 245 264 204 128 138 122 125 240 163 43 49
Westmeath 182 332 276 209 320 351 155 141 145 200 203 251 271 241 236 204 281 207 175 77
Wexford 344 289 158 225 187 247 216 178 102 182 426 308 201 229 160 128 89 114 60 59
Wicklow 478 426 402 122 48 65 71 89 115 128 100 109 188 164 219 139 251 148 121 49
Total 15,696 15,464 15,054 9,098 9,739 10,096 8,037 6,947 6,249 6,648 8,314 6,653 6,652 6,252 6,156 6,293 6,500 5,536 4,025 3,550
Department of Agriculture, Food & the Marine
29
Table 15. Private Afforestation (ha) by County (2000-2019).
County 2000 2001 2002 2003 2004 2005 2006 2007 2008 2009 2010 2011 2012 2013 2014 2015 2016 2017 2018 2019
Carlow 57 71 81 79 54 88 60 43 49 47 100 21 73 44 15 82 46 62 26 22
Cavan 353 555 700 220 436 303 217 300 197 260 243 204 171 210 241 277 425 317 321 167
Clare 1,377 1,457 1,009 588 800 736 698 669 695 564 521 484 480 347 420 568 552 518 262 352
Cork 1,531 1,615 2,026 963 1,432 1,734 1,441 1,024 1,006 799 1,157 1,035 1,041 672 690 663 608 420 297 423
Donegal 767 931 861 388 292 330 230 321 197 172 147 59 96 40 28 72 36 54 64 45
Dublin 11 4 5 19 11 0 0 18 11 0 0 1 20 0 12 8 3 11 4 35
Galway 434 446 634 382 494 477 356 403 235 318 561 300 336 419 387 432 331 400 287 279
Kerry 1,767 2,018 1,825 914 893 770 664 549 478 556 736 641 366 490 574 430 405 378 332 301
Kildare 234 136 154 134 84 129 84 79 17 111 86 101 186 48 90 29 13 33 79 25
Kilkenny 359 530 529 456 297 545 322 229 197 203 523 292 294 218 231 264 181 90 136 89
Laois 553 437 464 148 183 203 71 144 178 93 178 95 193 112 168 198 163 99 71 49
Leitrim 598 447 452 319 388 411 227 191 167 179 176 325 278 356 272 513 434 536 299 289
Limerick 882 1,183 1,175 807 763 684 521 373 441 329 411 381 281 243 122 177 329 99 81 156
Longford 231 168 405 212 255 208 255 124 86 87 243 174 178 255 225 286 272 201 171 62
Louth 10 2 63 8 18 2 20 55 65 65 46 19 51 26 0 22 40 22 10 1
Mayo 768 905 904 554 483 359 325 402 344 474 544 289 293 343 453 455 429 532 256 239
Meath 349 242 169 149 150 217 287 42 89 130 252 90 203 192 67 73 105 122 106 51
Monaghan 23 48 47 59 74 59 107 70 56 88 140 70 107 93 137 38 89 61 87 59
Offaly 579 509 309 386 316 262 218 135 242 324 279 268 263 174 128 156 136 166 72 76
Roscommon 402 550 437 451 559 272 322 309 315 370 360 288 252 431 449 334 435 431 399 315
Sligo 417 524 305 242 226 254 172 205 132 233 82 87 180 354 382 268 302 190 139 119
Tipperary 1,195 1,195 868 710 633 1,087 663 546 465 455 532 494 460 410 330 341 305 162 128 158
Waterford 358 127 482 231 220 239 308 310 156 245 264 204 128 138 122 125 240 163 43 49
Westmeath 177 332 276 209 320 351 155 141 145 200 203 251 271 241 236 204 281 207 175 77
Wexford 344 289 158 225 187 247 216 178 102 182 426 308 201 229 160 128 89 114 60 59
Wicklow 456 426 398 116 48 65 71 89 115 128 100 109 188 164 219 139 251 148 121 49
Total 14,231 15,147 14,735 8,969 9,617 10,032 8,011 6,947 6,182 6,613 8,310 6,591 6,592 6,249 6,156 6,284 6,500 5536 4025 3,550
Ireland’s Forests – Statistics 2020
30
Table 16. Public Afforestation (ha) by County (2000-2019).
COUNTY 2000 2001 2002 2003 2004 2005 2006 2007 2008 2009 2010 2011 2012 2013 2014 2015 2016 2017 2018 2019
Carlow - - - - - - - - - - - - - - - - - - - -
Cavan 49 - 16 - - - - - - - - - - - - - - - - -
Clare 90 46 3 2 34 13 - - - - - - - - - - - - - -
Cork 105 93 68 15 2 - - - - - - - - - - - - - - -
Donegal 188 85 40 - 17 14 9 - - - - - - - - - - - - -
Dublin 6 - - - - - - - - - - - - - - - - - - -
Galway 206 8 26 69 33 22 16 - 28 - - - - - - - - - - -
Kerry 62 - - 16 - - - - - - - - - - - - - - - -
Kildare - - - - - - - - - - - 39 34 - - - - - - -
Kilkenny 63 - - - - - - - 2 - - - - - - - - - - -
Laois 31 5 11 - - - - - - 7 - - - - - - - - - -
Leitrim 90 17 15 6 6 - - - - - - - - - - - - - - -
Limerick 82 - - - 4 - - - - - - - - - - - - - - -
Longford 49 7 11 - - - - - - - - - - - - - - - - -
Louth - - - - - - - - - - - - - - - - - - - -
Mayo 146 19 24 3 - - - - - - 4 - - 3 - - - - - -
Meath - 8 - - - - - - - - - - - - - - - - - -
Monaghan - - - - - - - - - - - - - - - - - - - -
Offaly 5 - - - - - - - - - - - - - - - - - - -
Roscommon 155 27 66 11 16 15 - - 37 28 - 23 - - - 9 - - - -
Sligo 30 - 10 - 10 - - - - - - - - - - - - - - -
Tipperary 57 - 25 - - - - - - - - - 26 - - - - - - -
Waterford 23 2 - - - - - - - - - - - - - - - - - -
Westmeath 5 - - - - - - - - - - - - - - - - - - -
Wexford - - - - - - - - - - - - - - - - - - - -
Wicklow 22 - 4 6 - - - - - - - - - - - - - - - -
TOTAL 1,465 316 319 128 122 64 25 - 67 35 4 62 60 3 - 9 - - - -

Department of Agriculture, Food & the Marine
31
Table 17. Total Afforestation (ha) by County and Farmer/Non-farmer (2014-2019).
County
2014 2015 2016 2017 2018 2019
Farmer Non Farmer Farmer Non Farmer Farmer Non Farmer Farmer Non Farmer Farmer Non Farmer Farmer Non Farmer
No. ha No. ha No. ha No. ha No. ha No. ha No. ha No. ha No. Ha No. ha No. Ha No. ha
Carlow 5 15 - - 9 82 - - 5 17 4 28 8 46 2 16 5 22 1 4 2 21 1 1
Cavan 39 239 2 1 42 218 11 59 33 213 26 212 27 188 21 129 18 108 24 213 12 88 17 80
Clare 62 394 3 25 85 498 8 70 60 314 33 238 38 259 40 259 21 101 28 161 11 61 35 291
Cork 97 679 5 11 95 589 11 74 49 354 34 254 38 206 28 214 16 144 19 153 13 88 29 335
Donegal 5 24 1 4 10 47 5 25 6 28 2 8 4 28 4 26 4 15 5 49 2 4 6 40
Dublin 1 6 2 6 1 5 1 3 1 3 - - 1 3 2 7 1 4 0 0 2 35 0 0
Galway 57 384 1 3 62 387 7 45 49 242 17 89 35 235 24 165 25 185 24 101 16 113 17 166
Kerry 82 571 2 3 48 359 10 72 51 285 20 120 29 164 31 214 20 175 22 158 18 132 30 169
Kildare 18 85 2 5 3 20 2 9 2 8 3 6 5 22 3 11 6 59 4 20 3 10 4 14
Kilkenny 42 229 1 2 38 208 4 56 19 132 7 49 16 89 1 1 16 121 3 15 12 69 6 20
Laois 26 168 - - 11 173 2 26 15 111 11 52 7 62 7 36 7 46 4 25 3 14 3 35
Leitrim 32 260 4 12 58 416 10 97 34 239 28 195 37 271 33 266 14 117 27 182 7 42 25 248
Limerick 24 119 3 3 26 163 4 14 35 219 14 110 14 64 7 36 4 29 9 52 5 31 13 125
Longford 39 216 4 9 37 215 6 71 26 144 15 128 30 150 10 50 20 81 12 90 5 26 6 36
Louth - - - - 2 4 2 19 2 12 4 28 4 22 0 0 2 9 1 1 1 1 0 0
Mayo 84 422 6 31 72 424 8 31 53 316 22 113 51 252 33 280 24 98 33 158 10 70 28 169
Meath 10 67 - - 12 60 2 13 11 64 9 41 9 60 12 62 9 62 5 44 5 36 4 16
Monaghan 13 121 1 16 8 24 2 14 9 46 6 43 4 39 5 23 7 37 7 50 4 37 2 23
Offaly 25 128 - - 18 130 5 26 14 106 9 30 18 130 10 36 9 57 4 15 9 51 5 25
Roscommon 68 427 4 22 49 285 7 58 50 305 29 130 52 293 20 138 33 180 30 219 28 137 24 179
Sligo 58 367 4 15 31 233 6 35 43 200 15 102 23 116 13 74 12 67 13 72 7 38 13 81
Tipperary 55 328 1 2 49 301 8 40 19 186 13 120 10 67 17 94 8 94 6 34 11 76 8 82
Waterford 21 118 1 3 23 119 2 7 17 221 4 19 18 132 5 32 4 18 4 24 2 15 2 35
Westmeath 30 236 - - 27 204 - - 21 173 18 108 23 146 10 61 13 87 11 88 6 35 7 42
Wexford 31 157 1 3 23 109 4 20 14 67 5 22 20 90 8 24 4 32 5 29 5 36 5 23
Wicklow 26 216 1 3 13 118 3 21 14 151 9 99 15 108 7 40 7 60 14 61 7 27 3 22
Total 950 5,978 49 178 852 5,389 130 904 652 4,156 357 2,344 536 3242 353 2,294 309 2,009 315 2,016 206 1,292 293 2,258
Ireland’s Forests – Statistics 2020
32
Table 18. Total Afforestation (ha) by County and Broadleaf/Conifer (2010-2019).
County 2010 2011 2012 2013 2014 2015 2016 2017 2018 2019
B'leaf Conifer B'leaf Conifer B'leaf Conifer B'leaf Conifer B'leaf Conifer B'leaf Conifer B'leaf Conifer B'leaf Conifer B'leaf Conifer B'leaf Conifer
Carlow 55 46 4 17 23 50 14 31 3 12 19 63 14 32 13 50 12 13 6 16
Cavan 107 136 75 129 49 123 58 152 50 191 57 220 89 336 69 248 69 252 37 130
Clare 190 332 154 331 91 390 58 289 65 354 106 461 73 479 64 455 69 193 61 292
Cork 524 633 469 566 345 696 185 487 182 508 148 515 111 497 82 338 70 227 99 325
Donegal 42 106 23 37 17 79 10 30 4 24 10 62 7 29 15 40 11 53 20 24
Dublin 0 0 1 0 9 11 0 0 2 10 2 7 1 1 4 7 1 4 5 30
Galway 204 357 128 172 109 228 93 326 103 283 115 317 56 275 92 308 91 196 64 215
Kerry 276 459 224 417 95 271 115 375 105 470 104 327 114 291 131 247 155 177 104 197
Kildare 28 59 54 87 91 129 27 21 49 41 5 24 4 9 23 10 25 54 13 11
Kilkenny 180 343 118 174 131 163 62 156 51 180 73 192 66 115 24 65 32 104 22 67
Laois 57 121 44 51 70 123 27 85 35 133 22 176 32 132 15 83 19 53 10 39
Leitrim 63 113 115 210 79 198 71 285 41 231 71 442 73 361 82 455 54 245 44 245
Limerick 111 300 122 259 78 203 51 192 26 96 24 152 65 263 11 89 20 61 41 116
Longford 80 162 61 113 37 141 54 201 50 175 88 198 45 227 29 172 35 136 15 47
Louth 29 18 7 13 16 35 20 7 0 0 18 5 5 35 20 2 6 4 1 0
Mayo 129 419 46 243 37 257 59 288 76 378 62 393 59 369 78 453 59 197 67 172
Meath 178 74 50 40 116 87 61 131 33 33 25 48 31 74 61 61 36 70 21 30
Monaghan 61 79 30 40 37 69 32 61 33 104 8 29 16 73 14 47 35 51 21 38
Offaly 129 150 95 173 96 167 32 142 28 100 29 127 30 106 50 115 19 53 24 53
Roscommon 84 276 59 252 56 195 67 364 69 380 60 283 82 353 75 356 84 316 63 252
Sligo 16 65 21 66 36 145 69 285 49 333 28 240 42 260 29 161 16 123 30 89
Tipperary 203 329 204 290 167 319 78 332 64 266 73 268 39 266 28 134 22 106 31 127
Waterford 97 168 89 115 39 90 25 113 36 85 26 99 36 205 25 138 9 33 7 43
Westmeath 84 119 98 152 104 167 106 136 81 155 44 160 102 179 55 152 58 117 32 45
Wexford 188 239 116 192 69 132 66 163 59 101 29 100 42 47 40 75 8 52 31 28
Wicklow 36 63 40 69 48 140 54 111 53 166 17 122 37 213 34 115 54 66 23 26
Total 3,149 5,165 2,447 4,206 2,045 4,607 1,492 4,760 1,348 4,808 1,263 5,030 1,270 5,230 1,161 4,375 1,070 2,956 893 2,657
Percent 38% 62% 37% 63% 31% 69% 24% 76% 22% 78% 20% 80% 20% 80% 21% 79% 27% 73% 25% 75%

Department of Agriculture, Food & the Marine
33
4. Forest Management Operations
4.1 Introduction
This chapter provides information on forest roads, felling activity, reforestation and forest
certification as follows:
• Public forest road construction from 1944 to 2019;
• Private forest road construction from 2007 to 2019;
• Felling licenses issued annually between 2010 and 2019;
• Clearfell levels in State forests between 1933 and 2019;
• Private sector broadleaf tending and thinning between 2009 and 2019;
• The level of annual State reforestation between 1933 and 2019;
• The certified forest area.
Key findings
• Since 1944 an average of 129 km of forest roads have been built annually in public forests;
• Between 2006 and 2019 an average of 89 km of private grant-aided forest roads were
built annually;
• Over 9,000 ha were reforested on public lands in 2019;
• Public forest clearfelling amounted to 7,442 ha in 2019, while 12,998 ha of forest were
thinned;

Ireland’s Forests – Statistics 2020
34
4.2 Forest Roads
Forest roads enhance the economic viability of forests primarily by improving access for
harvesting and mobilising timber. In addition, forest roads also provide areas for the stacking of
timber and for drying and chipping. Apart from economic enhancement, forest roads also
improve the environmental and biodiversity value of forests by increasing edge effects, improve
access to deal with fire and allow for better health and safety by providing access for emergency
vehicles.
4.2.1 Public forest roading
Between 1944 and 2019, 9,769 km of forest roads have been built in the public forest estate or
on average 129 km annually (Figure 19).
Figure 19. Forest road construction in public forests 1944–2019.
4.2.2 Private forest grant-aided roading
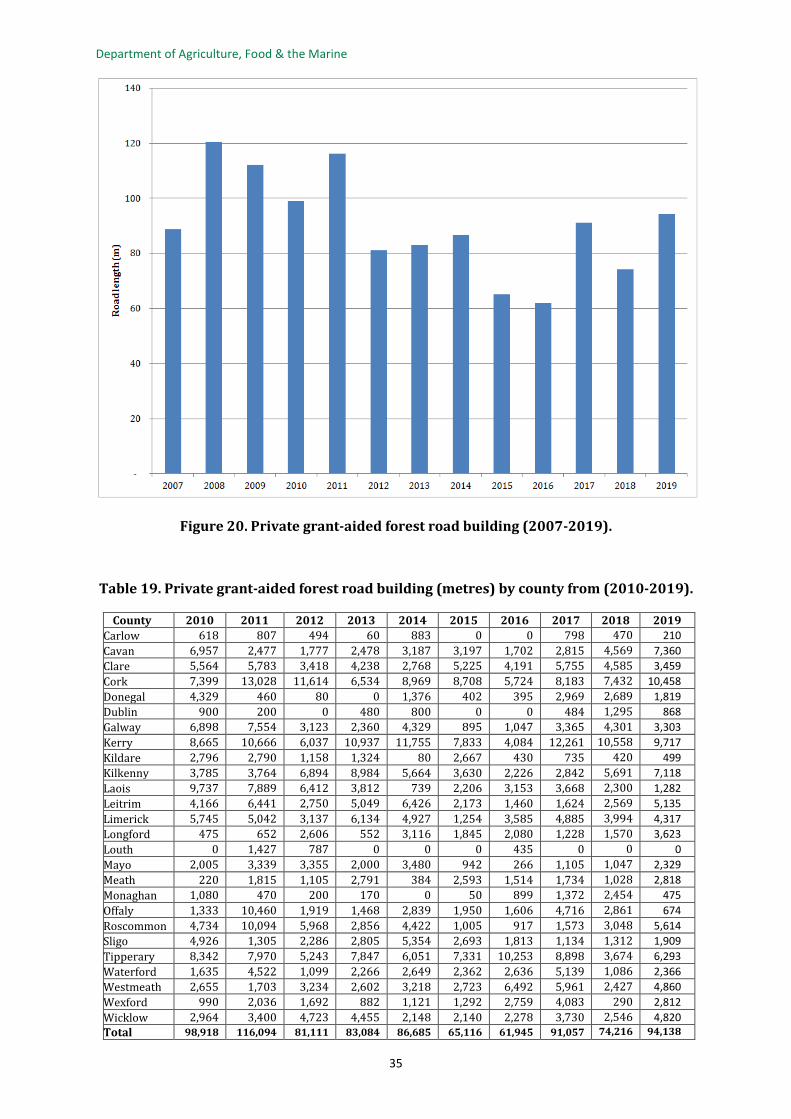
Due to the age profile of forests, forest roads were built primarily in public forests. However with the maturation of private sector forests, roads are increasingly required in private forests (Figure 20). Since 2006, IFORIS19 has been used to record the number and length of forest roads grant aided.
As the private estate reaches harvesting stage there has been an increase in the length of forest
road built. Between 2006 and 2019, an average of 89 km of private grant-aided forest roads were
built annually. Table 19 shows the private grant-aided forest road construction from 2010 to
2019 on a county level.
19 IFORIS is an Integrated Forest Information System which was developed for the processing of forestry pre-approval, grant and premium applications.
Department of Agriculture, Food & the Marine
35
Figure 20. Private grant-aided forest road building (2007-2019).
Table 19. Private grant-aided forest road building (metres) by county from (2010-2019).
County 2010 2011 2012 2013 2014 2015 2016 2017 2018 2019
Carlow 618 807 494 60 883 0 0 798 470 210
Cavan 6,957 2,477 1,777 2,478 3,187 3,197 1,702 2,815 4,569 7,360
Clare 5,564 5,783 3,418 4,238 2,768 5,225 4,191 5,755 4,585 3,459
Cork 7,399 13,028 11,614 6,534 8,969 8,708 5,724 8,183 7,432 10,458
Donegal 4,329 460 80 0 1,376 402 395 2,969 2,689 1,819
Dublin 900 200 0 480 800 0 0 484 1,295 868
Galway 6,898 7,554 3,123 2,360 4,329 895 1,047 3,365 4,301 3,303
Kerry 8,665 10,666 6,037 10,937 11,755 7,833 4,084 12,261 10,558 9,717
Kildare 2,796 2,790 1,158 1,324 80 2,667 430 735 420 499
Kilkenny 3,785 3,764 6,894 8,984 5,664 3,630 2,226 2,842 5,691 7,118
Laois 9,737 7,889 6,412 3,812 739 2,206 3,153 3,668 2,300 1,282
Leitrim 4,166 6,441 2,750 5,049 6,426 2,173 1,460 1,624 2,569 5,135
Limerick 5,745 5,042 3,137 6,134 4,927 1,254 3,585 4,885 3,994 4,317
Longford 475 652 2,606 552 3,116 1,845 2,080 1,228 1,570 3,623
Louth 0 1,427 787 0 0 0 435 0 0 0
Mayo 2,005 3,339 3,355 2,000 3,480 942 266 1,105 1,047 2,329
Meath 220 1,815 1,105 2,791 384 2,593 1,514 1,734 1,028 2,818
Monaghan 1,080 470 200 170 0 50 899 1,372 2,454 475
Offaly 1,333 10,460 1,919 1,468 2,839 1,950 1,606 4,716 2,861 674
Roscommon 4,734 10,094 5,968 2,856 4,422 1,005 917 1,573 3,048 5,614
Sligo 4,926 1,305 2,286 2,805 5,354 2,693 1,813 1,134 1,312 1,909
Tipperary 8,342 7,970 5,243 7,847 6,051 7,331 10,253 8,898 3,674 6,293
Waterford 1,635 4,522 1,099 2,266 2,649 2,362 2,636 5,139 1,086 2,366
Westmeath 2,655 1,703 3,234 2,602 3,218 2,723 6,492 5,961 2,427 4,860
Wexford 990 2,036 1,692 882 1,121 1,292 2,759 4,083 290 2,812
Wicklow 2,964 3,400 4,723 4,455 2,148 2,140 2,278 3,730 2,546 4,820
Total 98,918 116,094 81,111 83,084 86,685 65,116 61,945 91,057 74,216 94,138

Ireland’s Forests – Statistics 2020
36
4.3 Felling Licences Issued
A felling licence granted by the Minister for Agriculture, Food & the Marine provides authority
under the Forestry Act 2014 to fell or otherwise remove a tree or trees and to thin a forest for
silvicultural reasons. Table 20 shows the area of lands granted felling licences for both thinning
and clearfelling.
The area issued with felling licences for thinning was on an upward trend between 2010 and
2014, and declined by approximately 4,544 ha in 2015. This figure has subsequently increased,
with 14,504 ha licensed? for thinning in 2018. A large increase in the area licensed for clearfell
was evident in 2014 due to Storm Darwin. The clearfell area licensed in 2016 declined to 1,384
ha, which is still high when compared to pre-Storm Darwin clearfell areas. In 2018, 4,421 ha were
licensed for clearfell, reflecting plantations that were established during the late 1980’s and early
1990’s reaching maturity.
Information is also from provided for the public estate in Table 20 on felling licences. In 2011 and
2016, large areas were licensed for thinning which represent a multi-annual thinning
programme.
It should be noted that the areas licensed for thinning and clearfell are indicative and may not be
fully utilised on the ground due to a variety of reasons e.g. markets, access.
Table 20. Area (ha) of felling licences issued (2010-2019)
Year Public Private Total
Thinning Clearfell Thinning Clearfell Thinning Clearfell
2010 3,634 10,558 10,382 439 14,016 10,996
2011 109,789 15,134 12,275 590 122,064 15,725
2012 353 3,026 13,037 467 13,390 3,493
2013 301 6,170 15,150 394 15,450 6,564
2014 272 8,566 15,742 3,447 16,014 12,012
2015 5,717 9,571 11,198 2,012 16,916 11,583
2016 137,848 8,395 16,549 1,384 154,397 9,780
2017 10,281 7,980 16,697 2,133 26,977 10,113
2018 11,184 9,736 14,504 4,421 25,688 14,157
2019 38,242 5,936 9,328 3,690 47,571 9,626

Department of Agriculture, Food & the Marine
37
4.4 Public forest thinning and clearfelling
The area of public forest clearfelled peaked in 2003, coinciding with a peak in domestic
construction activity (Figure 20). Clearfell areas from 1986-2000 were estimated by averaging
the reforestation areas for the two years following clearfell. Thinning activity in the public estate
is shown in Figure 21. Thinning data for 1986-1996 are not available, but to create a complete
time series an estimate of 10,065 ha has been assumed (i.e. average of a 10 year period 1981-
1985 and 1997-2001).
Figure 21. Public estate clearfelling 1933-2019.
Figure 22. Public estate thinning 1933-2019.

Ireland’s Forests – Statistics 2020
38
4.5 Public forest reforestation
Reforestation is the regeneration of existing areas of forests that have been felled, and it is a
condition of most felling licences that the felled forest is reforested. Annual reforestation rates
are mainly driven by harvesting levels (with a time lag, usually of around 2 years, between
harvesting and reforestation).
Public forest reforestation rates from 1933 to 2019 are shown in Figure 23. Up until the early
1980’s reforestation rates were low due to relatively low afforestation up to 1950. In the 1950’s
and 1960’s afforestation greatly expanded, which in turn was reflected in the increasing
reforestation of the 1980’s and 1990’s. By 2008 and 2009, the area of public reforestation had
fallen by about a third, since a peak of 10,000 ha in 2003. In recent years the level of reforestation
has significantly increased.
Figure 23. Public sector reforestation 1933-2019.

Department of Agriculture, Food & the Marine
39
4.6 Broadleaf Thinning and Tending
As part of the Woodland Improvement Scheme (WIS), grants have been available for the tending
and thinning of broadleaves. The objectives of the scheme are:
• Improvement felling of malformed or over-mature trees
• Felling of additional trees to release potential final crop trees
• Pruning to improve stem quality
• Thinning or re-spacing to promote growth
• Management and re-spacing of natural regeneration.
Grant aid for the treated area is available for either tending or thinning operations, depending on
which are the most appropriate to the site (i.e. it is not necessary to carry out both sets of
operations for grant aid). The tending and thinning element of the WIS was introduced in 2009.
In total 6,347 ha have received payment to be tended or thinned between 2011 and 2019 (Figure
23). Ash has been the main species grant aided. Figure 24 shows the species areas grant aided.
The year presented in both charts refers to the year when works were completed.
Figure 24. Total area tended and thinned under the Woodland Improvement Scheme 2011-2019.

Ireland’s Forests – Statistics 2020
40
Figure 25. Species tended and thinned under the Woodland Improvement Scheme 2011-2019.
4.7 Certification
Voluntary forest certification schemes are run by international non-governmental organisations
to promote good forest practice. In Ireland, there are currently two certifying schemes: the
Programme for the Endorsement of Forest Certification (PEFC) and the Forest Stewardship
Council (FSC). Voluntary forest certification links the demand for forest products to
environmental and social standards to producers who to show that wood or wood products come
from certified forests. All major Irish sawmills are certified.
The management of the Coillte estate, which comprises 54% of the national forest estate, is
certified by both the FSC and PEFC. Coillte first obtained certification in 2001 from FSC and
became certified in 2014 when the company received PEFC certification.
As harvesting in the private sector increases, certification is likely to be an issue for private forest
owners in the near future. Currently 11,181ha of private forest is certified; of which 4,590ha is
certified by PEFC and 6,771ha by FSC. There are 180ha certified by both schemes.

Department of Agriculture, Food & the Marine
41
5. Forest Production and Carbon
5.1 Introduction
This chapter provides information on:
• The annual roundwood harvest between 1955 and 2018;
• The roundwood available for processing between 2006 and 2018;
• The roundwood forecast for 2016 to 2035;
• Roundwood timber prices for both Coillte and the private sector;
• Timber and paper products trade;
• Firewood production;
• Forest based biomass usage;
• The role of forests in climate change mitigation;
• Ireland’s Kyoto obligation and its fulfilment;
• Irish forest carbon stocks.
Key statistics
• The total roundwood harvest in 2018 (including firewood) was 3.69 million m3, the
highest level since records began;
• Softwood available for processing in 2018 was 3.24 million mᶾ;
• 80% of the roundwood available for processing came from Coillte in 2018, with the
balance coming from the private sector;
• The share of private sector roundwood available for processing has increased from 7.6%
in 2006 to 26.4% in 2018, reflecting the maturing private forest estate;
• The total forecast of net realisable volume production for the Republic of Ireland over the
forecast period 2016-2035 is estimated as being 107.8 million m3 overbark with an
additional 4.5 million m3 potentially available in the tip - 7cm category;
• The average Coillte contracted standing sales price in 2018 was €72, up 33% from 2017;
• In 2018, exports of forest products from the Republic of Ireland were valued at €450
million, an 8.7% increase on 2017;
• In 2018, 40% of the wood fibre available for use in the Republic of Ireland was used for
energy generation, mainly within the forest products sector;
• The national forest estate is an important carbon reservoir, amounting to 311.7 million
tonnes of carbon in 2017;
Ireland’s Forests – Statistics 2020
42
5.2 Roundwood
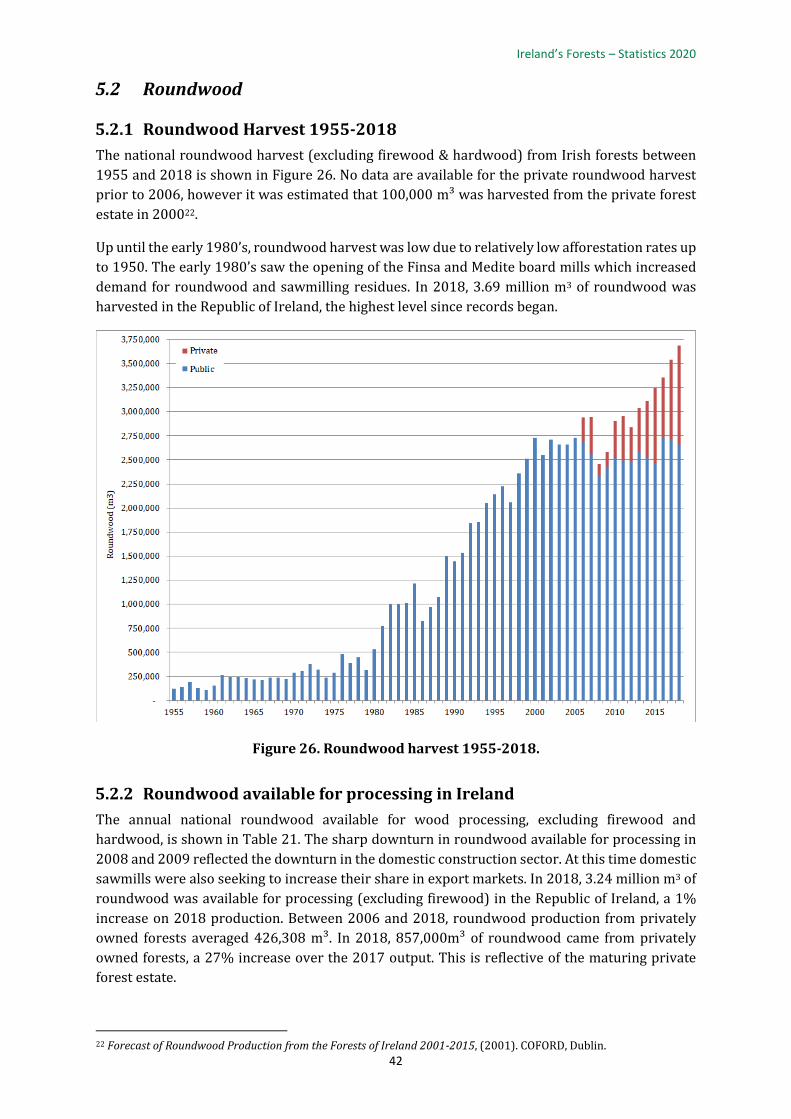
5.2.1 Roundwood Harvest 1955-2018
The national roundwood harvest (excluding firewood & hardwood) from Irish forests between
1955 and 2018 is shown in Figure 26. No data are available for the private roundwood harvest
prior to 2006, however it was estimated that 100,000 m³ was harvested from the private forest
estate in 200022.
Up until the early 1980’s, roundwood harvest was low due to relatively low afforestation rates up
to 1950. The early 1980’s saw the opening of the Finsa and Medite board mills which increased
demand for roundwood and sawmilling residues. In 2018, 3.69 million m3 of roundwood was
harvested in the Republic of Ireland, the highest level since records began.
Figure 26. Roundwood harvest 1955-2018.
5.2.2 Roundwood available for processing in Ireland
The annual national roundwood available for wood processing, excluding firewood and
hardwood, is shown in Table 21. The sharp downturn in roundwood available for processing in
2008 and 2009 reflected the downturn in the domestic construction sector. At this time domestic
sawmills were also seeking to increase their share in export markets. In 2018, 3.24 million m3 of
roundwood was available for processing (excluding firewood) in the Republic of Ireland, a 1%
increase on 2018 production. Between 2006 and 2018, roundwood production from privately
owned forests averaged 426,308 m³. In 2018, 857,000m³ of roundwood came from privately
owned forests, a 27% increase over the 2017 output. This is reflective of the maturing private
forest estate.
22 Forecast of Roundwood Production from the Forests of Ireland 2001-2015, (2001). COFORD, Dublin.

Department of Agriculture, Food & the Marine
43
Table 21. Roundwood available (commercial softwood) for processing (2006-2018).
Year
Log imports
less exports
Coillte Output
Private output
Total Roundwood
Sawlog Pulp Stake
2006 214,000 2,700,000 240,000 3,154,000 2,176,000 820,000 158,000 2007 57,000 2,556,000 390,000 3,003,000 1,934,000 889,000 180,000 2008 106,000 2,279,000 118,000 2,503,000 1,619,000 804,000 80,000 2009 -63,000 2,354,000 130,000 2,421,000 1,602,000 731,000 88,000 2010 28,000 2,217,000 463,000 2,708,000 1,603,000 987,000 118,000 2011 55,000 2,299,000 386,000 2,740,000 1,580,000 1,044,000 116,000 2012 -18,000 2,269,000 343,000 2,594,000 1,622,000 841,000 131,000 2013 49,000 2,474,000 328,000 2,851,000 1,710,000 1,024,000 117,000 2014 68,000 2,434,000 447,000 2,949,000 1,815,000 987,000 147,000 2015 40,000 2,377,000 646,000 3,063,000 1,867,000 1,027,000 169,000 2016 -16,000 2,600,000 518,000 3,102,000 1,977,000 961,000 164,000 2017 -65,000 2,613,000 676,000 3,224,000 2,178,000 898,000 148,000 2018 -205,000 2,591,000 857,000 3,243,000 2,084,000 994,000 165,000
In recent years the private sector has begun to make a substantial contribution to the annual
harvest. This reflects the greater area of private forests reaching first thinning stage, and the
increased export market share gained by sawmills.
In 2018, 40% of the roundwood fibre available for use in the Republic of Ireland was used for
energy generation, mainly within the forest products sector. Intake of sawmill roundwood was
2.08 million m3 in 2018, which was converted to 1.01 million m3 of sawn timber 23
Commercial hardwoods are still a minor element of the annual roundwood available for
processing, the figure has decreased substantially between 2017 and 2018, from 18,000 m3 to
5,000 m3 (Table 22).
Table 22. Roundwood available (commercial hardwood 000 m3 overbark) for processing in the Republic of Ireland 2011-2018.
2011 2012 2013 2014 2015 2016 2017 2018 Imports less exports 0 0 -1 0 0 0 0 0 Coillte 1 1 2 6 3 5 7 0 Private Sector 1 1 1 0 0 1 11 5
5.2.3 Roundwood Forecast
The total forecast of net realisable volume production for the Republic of Ireland over the forecast
period 2016-2035 is estimated as being 107.8 million m3 overbark which includes 4.5 million m3
potentially available in the tip–7 cm category.
The annual forecast of net realisable volume will increase from 3.6 million m3 in 2016 to
7.6 million m3 by 2035. Table 23 displays the future sustainable harvest levels between 2016 and
2035 by assortment and ownership type. Privately owned forests will steadily increase their
share of the total harvest of roundwood from 27% in 2016 to 63% in 203524.
23 Woodflow and forest-based biomass energy use on the island of Ireland, 2018. COFORD, Department of Agriculture,
Food and the Marine, Dublin.
24 All Ireland Roundwood Production Forecast 2016-2035, 2016. COFORD, Department of Agriculture, Food and the Marine, Dublin.

Ireland’s Forests – Statistics 2020
44
Table 23. Forecast of potential conifer net realisable volume production by assortment
category and ownership type 2016-2035 (000 m³ overbark).
Year Private Coillte
Overall Total
Tip - 7cm
7-13cm
14- 19cm
20+cm Total Tip - 7cm
7 - 13cm
14-19cm
20+ cm
Total
2016 60 368 219 328 976 150 548 695 1,262 2,655 3,630 2017 55 356 174 329 914 126 499 669 1,399 2,694 3,608 2018 59 375 212 281 926 149 493 757 1,362 2,762 3,688 2019 76 451 334 298 1,158 150 510 783 1,401 2,844 4,003 2020 78 473 372 401 1,324 148 481 754 1,438 2,821 4,145 2021 80 501 446 412 1,439 145 538 924 1,294 2,902 4,341 2022 91 547 560 564 1,762 145 538 924 1,294 2,902 4,663 2023 106 595 766 842 2,309 145 538 924 1,294 2,902 5,211 2024 103 595 782 1,194 2,674 145 538 924 1,294 2,902 5,576 2025 109 632 969 1,260 2,970 145 538 924 1,294 2,902 5,872 2026 117 656 1,048 1,508 3,329 124 449 764 1,347 2,684 6,013 2027 120 683 1,049 1,523 3,375 124 449 764 1,347 2,684 6,059 2028 99 560 863 1,461 2,982 124 449 764 1,347 2,684 5,667 2029 99 609 905 1,455 3,068 124 449 764 1,347 2,684 5,752 2030 110 650 1,084 1,479 3,323 124 449 764 1,347 2,684 6,007 2031 94 528 890 1,837 3,350 110 390 724 1,603 2,828 6,177 2032 99 578 1,062 1,853 3,592 110 390 724 1,603 2,828 6,419 2033 95 563 1,018 2,033 3,709 110 390 724 1,603 2,828 6,536 2034 103 609 1,104 2,151 3,967 110 390 724 1,603 2,828 6,794 2035 123 753 1,376 2,595 4,847 110 390 724 1,603 2,828 7,674 Total 1,876 11,083 15,232 23,803 51,994 2,621 9,418 15,721 28,082 55,842 107,837
Figure 27. Forecast of total net realisable volume (2016 - 2035).

Department of Agriculture, Food & the Marine
45
5.2.4 Actual Harvest Vs. Forecasted
Actual and forecast harvest (net realisable volume (NRV)) for the Republic of Ireland has been
compared for the period 2011 to 2018. NRV forecast data is taken from the All-Ireland Roundwood
Production Forecast (2016 - 2035). Actual harvest is from the COFORD Connects Woodflow Series.
Over the period 2011 to 2018, private sector harvest was 109% of NRV forecast, while Coillte
harvest was 94% of NRV forecast. Over the same period, the combined harvest (i.e. Coillte and
private) was 97% of NRV forecast (Table 24).
Table 24. Actual and forecast roundwood harvest (000 m3 overbark) in the Republic of
Ireland (2011-2018).
Year 2011 2012 2013 2014 Harvest type1 A F % A F % A F % A F % Private 460 371 124 354 384 92 448 369 121 597 425 140 Coillte 2,492 2,979 84 2,485 2,737 91 2,588 2,798 92 2,517 2,906 87 Total 2,952 3,350 88 2,839 3,121 91 3,036 3,167 96 3,114 3,331 93
Year 2015 2016 2017 2018
Harvest type A F % A F % A F % A F % Private 780 504 155 622 916 68 828 859 96 1,027 868 118
Coillte 2,470 2,844 87 2,733 2,505 109 2,714 2,568 106 2,658 2,613 102
Total 3,250 3,348 97 3,355 2,421 98 3,542 3,427 103 3,685 3,481 106
Year Total (2011-2018)
Harvest type A F %
Private 5,116 4,706 109
Coillte 20,657 21,950 94
Total 25,773 26,656 97
1 A: Actual harvest: F: Forecast harvest. D: Difference % = actual harvest expressed as a % of NRV forecast
5.2.5 Roundwood prices - Coillte
Coillte is currently the dominant supplier of logs to the processing sector in Ireland. The standing
timber price is the price paid per cubic metre of timber by the purchaser, where the purchaser is
responsible for harvesting. The figures quoted in Table 25 below are for sales to the sawmill
sector only and include all species and harvest types. As the mix of species and harvest types can
vary from quarter to quarter, this can impact on contracted prices in addition to the impact of
other market factors. The majority of prices quoted are for standing sales with retained
pulpwood, i.e. there is no value for pulp included in these prices. Coillte retain the pulpwood to
supply their boardmills, i.e. Smartply and Medite.

Ireland’s Forests – Statistics 2020
46
Table 25. Coillte Average Standing Timber Prices (€/m3) by tree size category26. Category (m3)
2006 2007 2008 2009 2010 2011 2012 2013 2014 2015 2016 2017 2018 2019*
0.001 - 0.074
- 10.0 - - - - 10.5 - - - - 39.4 - -
0.075 - 0.124
6.7 8.2 - 3.96 - - - - - 41.2 - - - -
0.125 - 0.174
12.2 8.6 19.4 4.0 - 8.5 9.5 - - - - 40.1 - -
0.175 - 0.224
17.2 19.4 24.1 15.0 38.6 32.8 - - - - - 56.6 - -
0.225 - 0.274
18.1 33.1 21.4 19.0 47.6 39.5 40.9 43.7 49.2 50.0 43.5 44.2 66.4 51.8
0.275 - 0.324
26.4 35.4 28.9 19.9 43.8 42.3 43.2 47.1 52.4 49.9 45.8 46.0 62.4 55.6
0.325 - 0.374
22.1 43.1 30.4 23.2 44.1 43.7 44.5 51.3 54.5 53.9 44.7 51.8 70.5 54.3
0.375 - 0.424
24.6 37.8 33.8 24.5 58.2 44.4 46.8 48.6 57.3 56.5 48.1 51.1 67.8 53.4
0.425 - 0.474
34.4 41.9 31.5 24.0 55.5 47.2 45.6 52.0 58.6 58.4 50.5 50.6 75.0 58.2
0.475 - 0.499
34.3 50.0 35.7 25.1 55.1 46.0 48.5 54.5 62.1 62.9 54.4 52.1 73.9 63.9
0.500-0.599
32.5 47.8 37.8 26.8 59.9 48.3 50.5 51.6 62.2 63.3 54.5 55.2 70.0 61.7
0.600-0.699
36.3 51.0 38.4 27.1 63.7 49.0 52.9 55.4 67.2 66.0 57.2 57.1 76.8 58.9
0.700-0.799
39.4 51.4 39.0 27.0 58.8 49.9 54.1 55.6 65.7 59.6 57.0 57.6 81.9 65.3
0.800-0.899
41.2 49.5 42.1 27.3 57.1 50.7 52.8 57.4 71.8 67.9 58.7 56.8 76.5 64.3
0.900-0.999
37.9 51.1 41.4 28.9 56.0 51.3 54.0 60.7 66.4 67.0 58.4 57.4 80.7 67.6
> 1.000 45.1 54.6 39.6 29.4 59.6 51.3 53.8 54.0 74.3 71.1 60.8 60.3 76.7 71.3
*Prices from January to September 2019
26 Forestry & Timber Yearbook 2019. Irish Timber Growers Association, Dublin.

Department of Agriculture, Food & the Marine
47
5.2.6 Roundwood Prices - Private Sector
The UCD Forestry Section and the Irish Timber Growers Association (ITGA) collate timber price
information from private sources, publishing it in the Forestry and Timber Yearbook annually. The
prices are averages derived from small sales data received from a range of growers and therefore
prices presented in Table 26 below are for guidance purposes only. The prices presented in Table
26 include pulpwood prices from the private sector.
Table 27. Annual private standing roundwood prices (€/m3) 2009-201927.
Category (m3) 2009 2010 2011 2012 2013 2014 2015 2016 2017 2018 2019
0.001 - 0.074 8.28 10.5 10.6 10.2 9.44 14.04 13.2 7.7 9.39 12.5 14.7
0.075 - 0.124 7.15 14.4 14.3 14.3 12.8 13.53 16.3 11.4 12.15 15.05 16.82
0.125 - 0.174 7.26 17.4 13.5 19.2 18.96 18.4 19.6 14.9 12.26 18.88 24.96
0.175 - 0.224 11.59 22.9 15.8 17.8 20.44 28.72 20.8 17.9 20.67 24.37 26.6
0.225 - 0.274 11.29 35.3 23.1 25.1 18.62 33.14 30.8 17.1 19.64 34.75 42.28
0.275 - 0.324 11.64 47.1 36.9 32.9 21.84 34.06 33.6 28 27.51 38.71 33.18
0.325 - 0.374 14.5 64.1 57.5 38.6 47.42* 39.64 34.3 26.7 43.36 36.15 -
0.375 - 0.424 16 56.7 52.3 28.4 44.48 49.03 43.3 39.3 41.87 49.07 27.1
0.425 - 0.474 50 54.2 53.3 48.3 32.00* 65.93 39.2 49.4 - 58.61 62
0.475 - 0.499 - 53 35 - 48 53.1 54.07
0.500 - 0.599 - 57.1 50.3 49.2 45.05 61.85 47.6 44 51.31 58.52 57.17
0.600 - 0.699 - 54.3 51.7 51.8 45.99 56.82 59 58.8 49.4 58.3 61.28
0.700 - 0.799 - 54.3 52.6 54.7 53.79 64.21 59.5 49.4 52.74 52.34 47.98
0.800 - 0.899 - 53.7 50.4 54.9 53.35 67.72 59.5 49.8 50.71 59.57 62
0.900 - 0.999 - 52.9 53.4 54.8 51.26 65.16 64.7 57.5 53.75 57.97 58.74
1.000 and over - 56.9 45 54.2 52.97 60.38 61.5 60.9 54.04 58.61 60.62
An additional source of information on the range of prices paid for privately owned timber during
2018 is the IFA Timber Price Survey (Table 27). The prices paid for timber varied significantly,
for example the pulp prices quoted ranged from €20 to €34/tonne, depending on distance to
market, access to the site and the size of the sale. The prices for sawlog varied from €68 to
€90/tonne throughout the year, which represents an increase compared to the 2017 survey.
Table 27. IFA Timber Price Survey 2018 (Price € /tonne roadside excl. vat)28.
Product Type Length (m) Diameter (cm) Jan-Feb Mar-Apr July-Sep Pulp 3 m < 7cm 20 -32 25 - 30 25 – 34 Stakewood 1.6 m > 8cm < 15 cm 34 – 42 40 – 46 40 – 46
Palletwood
2.5 m
> 14 cm
34 - 48 40 – 46 40 – 52 3.1 m 43 – 48 42 – 50 48 – 60 3.4 m 45 – 50 50 – 55 56 – 60 3.7 m 48 – 57 48 – 66 56 – 64
Sawlog 4.9m
> 20cm 68 – 80 68 – 84 72 – 86
5.5 m 80 - 86 86 80 - 90
27 Forestry & Timber Yearbook 2019. Irish Timber Growers Association, Dublin. 28 Available from: https://www.ifa.ie/market-reports/market-reports-4/

Ireland’s Forests – Statistics 2020
48
5.2.7 Forest-based biomass
Forests also provide a source of renewable raw materials and replace materials and energy
produced from fossil fuels which help mitigate rises in greenhouse gases. Usage of wood fuels is
increasing due to renewable energy policies and as young plantations enter the production stage.
In 2018, 40% of wood fibre available for use in the Republic of Ireland was used for energy
generation, mainly within the forest products sector (Table 28). The usage of forest based
biomass for the energy sector abated 0.88 million tonnes of CO2 emissions in 2018.
Table 28. Use of forest-based biomass and as a proportion of total roundwood harvest
(2010-2018) (000 m3 overbark)29.
2010 2011 2012 2013 2014 2015 2016 2017 2018
Wood-biomass use by the energy30
and forest products industry 554 572 611 660 760 796 1,049 1,296 1,080
Roundwood chipped for primary
energy use 39 41 30 100 100 114 117 49 67
Domestic firewood use 199 214 225 230 235 237 237 239 243
Short rotation coppice 1 5 5 5 5 5 20 20 18
Wood pellets and briquettes 121 129 144 161 150 154 160 175 172
Charcoal 2 5 2 1 1 1 1 1 2
Total 916 966 1,017 1,157 1,251 1,307 1,584 1,780 1,582
Roundwood harvest
Roundwood available for
processing 2,708 2,740 2,594 2,852 2,975 3,016 3,108 3,242 3,248
Firewood harvest 199 214 225 230 235 237 237 235 243
Total 2,907 2,954 2,819 3,082 3,210 3,253 3,345 3,477 3,491
Forest-based biomass as a % of
total roundwood harvest 31.5 32.6 36.0 33.5 36.3 34.8 34.1 42.1 40.0
29 Woodflow and forest-based biomass energy use on the island of Ireland, 2018. COFORD, Department of Agriculture, Food and the Marine. 30 This includes co-firing of wood-biomass at Edenderry Power Station, Co. Offaly.

Department of Agriculture, Food & the Marine
49
5.3 Firewood production
Statistics on the sale of firewood from public forests between 1937 and 1987 are shown in Figure
28. Firewood consumption peaked during the Second World War due to restricted coal imports.
There was also increasing firewood demand during the 1980’s, reflected in increased sales during
this period. Official estimates of firewood use are unavailable between the years 1988 and 2005.
Figure 28. Firewood production volume from public forests 1937-1987. Residential energy use grew by 18.3% (0.4% per annum) over the period 1990–2015. Corrected
for weather, the growth was 10%. During this time the number of households in the State
increased by 74%, from approximately 1.0 million to 1.75 million. Since 1990, there has also been
a decrease in the use of firewood in open fires, in line with the general decline of solid-fuel open
fires, with a concurrent rise in the use of oil, gas and electricity for residential energy
consumption. As a result, the share of firewood used for domestic heating has decreased since
199031.
Despite this, due to the significant increase in the number of households and energy usage per
household there has been a concurrent increase in firewood sales since the 1980’s. Between 2006
and 2018 the firewood market in Ireland has grown by 63%, from 147,000 m3 in 2006 to 243,000
m3 in 2019, and the market is now estimated to be worth €35 million32. Figure 29 shows firewood
use in Ireland between 2006 and 2018 from State and private forests, including wood sourced
from non-forest areas. The introduction of grant aid in 2009 for first thinning of broadleaf forests
has resulted in substantial mobilisation of firewood from first thinnings, principally for domestic
use. In addition, firewood is also harvested by forest owners for their own use and this is not
accounted for in current figures.
31 Energy in Ireland 1990–2015, 2016 Report, 2016. Sustainable Energy Authority of Ireland. 32 Woodflow and forest-based biomass energy use on the island of Ireland, 2018. COFORD, Department of Agriculture, Food and the Marine.

Ireland’s Forests – Statistics 2020
50
Initiatives such as The Wood Fuel Quality Assurance (WFQA) scheme for Ireland administered by
the Irish Bioenergy Association (Irbea) increases consumer confidence in wood fuel products sold
in Ireland. The WFQA independently certifies and verifies suppliers of firewood, wood pellets,
woodchip and wood briquettes. All certification is carried out against EN ISO 17225 standards for
biomass fuels. By 1st January 2022, all wood burning stoves must comply with the Ecodesign
European directive in a bid to tackle air pollution and particulate emissions. By 1st January 2020
the directive applies to all biomass boilers. Firewood at 20% moisture content produces less than
33% of the emissions of wood fuel at 30% moisture content when burned in older stoves.
However if firewood is burned in modern Eco-Design stoves the emission levels are reduced by
almost 90%. Firewood will continue to provide an important market for forest owners in the
thinning of forests.
Figure 29. The domestic firewood market 2006-2018.

Department of Agriculture, Food & the Marine
51
5.4 Timber and paper products trade
In 2018, exports of forest products from the Republic of Ireland were valued at €450 million, an 8.7% increase on 2017. Wood-based panels accounted for nearly
54% of the value of forest products exports, the balance compromising paper and sawn timber exports (Table 29). In value terms Ireland became a net exporter
of sawn timber in 2010, the first time since 1961, when forest products statistics began to be compiled by the FAO. This came about due to the closing of the gap
between the value of exports and imports from 2008 onwards due to the collapse of the domestic construction market and greatly increased exports of sawn
timber. In value terms Ireland exported €146 million of sawn timber in 2018, mainly to the UK.
Table 29. Timber and paper products trade, volume and value (2010-2018)33
Imports 2010 2011 2012 2013 2014 2015 2016 2017 2018 2010 2011 2012 2013 2014 2015 2016 2017 2018
000 m3 € million
Sawn timber 242 201 145 134 205 227 250 266 339 74 64 54 51 74 88 92 99 126 Wood-based panels 166 195 204 194 235 240 242 273 275 65 68 75 78 98 112 112 129 126
000 tonnes € million
Pulp products 41 54 47 50 46 51 46 45 41 31 45 45 41 42 53 45 45 37 Paper & particle-board products
370 383 415 428 404 427 417 407 388 313 333 339 340 340 359 337 335 353
TOTAL 483 510 513 510 554 612 586 608 642
Exports
2010 2011 2012 2013 2014 2015 2016 2017 2018 2010 2011 2012 2013 2014 2015 2016 2017 2018
000 m3 € million
Sawn timber 658 619 534 601 718 701 806 875 832 85 83 73 81 122 121 122 129 146 Wood-based panels 660 616 630 665 610 610 628 660 691 179 173 179 199 198 190 206 224 243
000 tonnes € million
Pulp products 1 3 18 1 1 1 Paper and particle-
board products 33 59 68 81 67 86 137 40 37 44 52 51 59 50 44 51 69 60
TOTAL 308 308 303 339 370 355 380 423 450
33 Roundwood, sawmill residues and secondary processed timber products are not included. Data sourced from COFORD Connects Woodflow Series, available from: http://www.coford.ie/publications/cofordconnects/
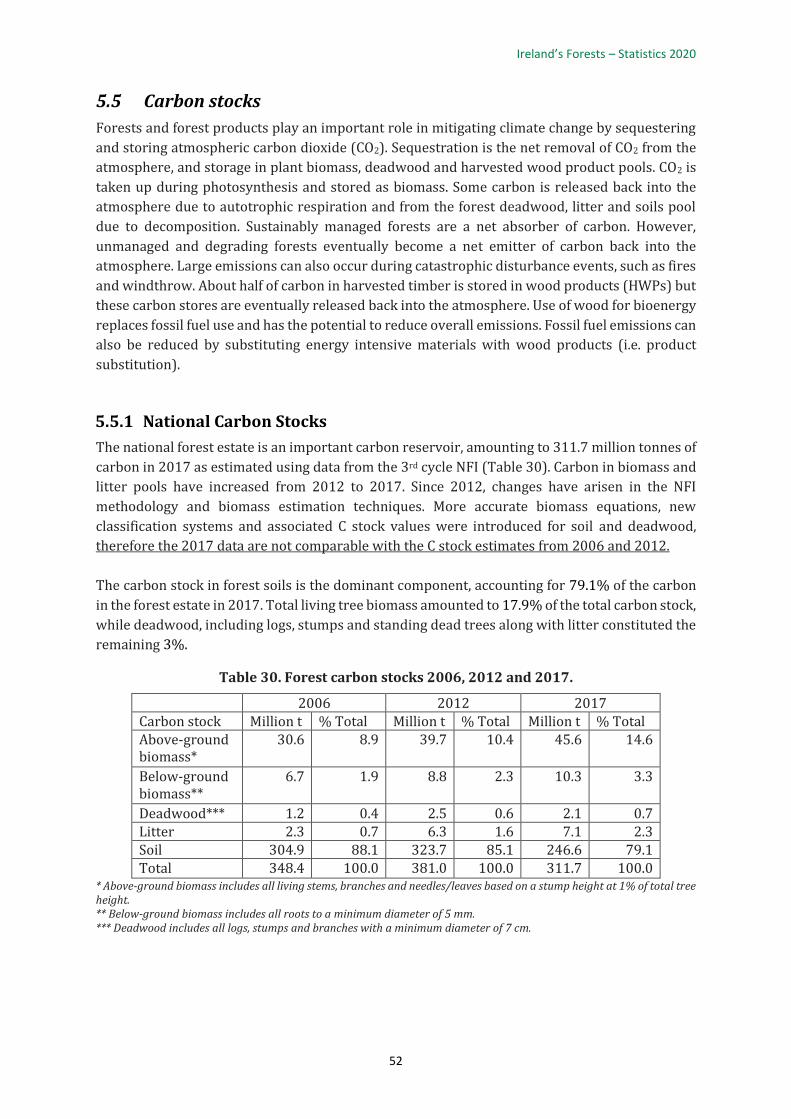
Ireland’s Forests – Statistics 2020
52
5.5 Carbon stocks
Forests and forest products play an important role in mitigating climate change by sequestering
and storing atmospheric carbon dioxide (CO2). Sequestration is the net removal of CO2 from the
atmosphere, and storage in plant biomass, deadwood and harvested wood product pools. CO2 is
taken up during photosynthesis and stored as biomass. Some carbon is released back into the
atmosphere due to autotrophic respiration and from the forest deadwood, litter and soils pool
due to decomposition. Sustainably managed forests are a net absorber of carbon. However,
unmanaged and degrading forests eventually become a net emitter of carbon back into the
atmosphere. Large emissions can also occur during catastrophic disturbance events, such as fires
and windthrow. About half of carbon in harvested timber is stored in wood products (HWPs) but
these carbon stores are eventually released back into the atmosphere. Use of wood for bioenergy
replaces fossil fuel use and has the potential to reduce overall emissions. Fossil fuel emissions can
also be reduced by substituting energy intensive materials with wood products (i.e. product
substitution).
5.5.1 National Carbon Stocks
The national forest estate is an important carbon reservoir, amounting to 311.7 million tonnes of
carbon in 2017 as estimated using data from the 3rd cycle NFI (Table 30). Carbon in biomass and
litter pools have increased from 2012 to 2017. Since 2012, changes have arisen in the NFI
methodology and biomass estimation techniques. More accurate biomass equations, new
classification systems and associated C stock values were introduced for soil and deadwood,
therefore the 2017 data are not comparable with the C stock estimates from 2006 and 2012.
The carbon stock in forest soils is the dominant component, accounting for 79.1% of the carbon
in the forest estate in 2017. Total living tree biomass amounted to 17.9% of the total carbon stock,
while deadwood, including logs, stumps and standing dead trees along with litter constituted the
remaining 3%.
Table 30. Forest carbon stocks 2006, 2012 and 2017.
2006 2012 2017 Carbon stock Million t % Total Million t % Total Million t % Total Above-ground biomass*
30.6 8.9 39.7 10.4 45.6 14.6
Below-ground biomass**
6.7 1.9 8.8 2.3 10.3 3.3
Deadwood*** 1.2 0.4 2.5 0.6 2.1 0.7 Litter 2.3 0.7 6.3 1.6 7.1 2.3 Soil 304.9 88.1 323.7 85.1 246.6 79.1 Total 348.4 100.0 381.0 100.0 311.7 100.0
* Above-ground biomass includes all living stems, branches and needles/leaves based on a stump height at 1% of total tree height. ** Below-ground biomass includes all roots to a minimum diameter of 5 mm. *** Deadwood includes all logs, stumps and branches with a minimum diameter of 7 cm.

Department of Agriculture, Food & the Marine
53
5.5.2 Current net greenhouse emissions and removals from forests
Since 2006, data from the NFI, such as individual tree information, soils, deadwood, harvest
removals and area deforested, is used to produce annual estimates of UNFCCC greenhouse gas
(GHG) emissions/removals. Reporting also uses emission factors and activity data derived from
national and international research, in accordance with IPCC good practice and UNFCCC rules,
such as: CO2 and non-CO2 emissions from fires, drained organic soils, application of fertilisers and
harvested wood products19.
Ireland’s forests have removed (sequestered) an average of 4.3 Mt of Carbon dioxide equivalents
(CO2 eq.) per year from the atmosphere over the period 2007 to 2017 (Table 31). These estimates
include HWP removals and emissions from fires and deforestation. The trends in forest GHG
removals are related to the level of annual harvest, tree mortality, extent of historical
afforestation and changes in the age class structure of the national forests over time20. Negative
CO2 values represent a net removal of CO2, but negative C values represent a net emission of C.
Mineral soils are currently assumed to result in a zero C stock change.
Table 31. Changes in C fluxes for biomass, litter and deadwood and soil C pools and net CO2 emissions from 2007-201721.
Year
Carbon Stock Changes (Gg C) (removal is a positive value & an emission a negative value)
Overall Balance (Gg CO2 eq.) (removal is a negative value & an
emission a positive value) Living biomass
Litter & Deadwood
Mineral soils
Organic soils
Fire HWP Total CO2 non-CO2
Total
2007 934.39 60.71 -7.32 -250.79 -15.98 326.84 1047.84 -3842.07 335.14 -3506.92
2008 1333.85 -23.94 -7.40 -251.07 -16.51 174.15 1209.07 -4433.26 367.98 -4065.28
2009 1221.78 113.17 -4.93 -254.21 -9.30 193.87 1260.37 -4621.35 386.91 -4234.44
2010 1176.37 166.68 -4.24 -254.88 -60.82 213.11 1236.22 -4532.81 450.38 -4082.42
2011 1238.24 130.92 -2.54 -256.03 -22.57 202.69 1290.70 -4732.58 435.74 -4296.84
2012 1250.22 187.26 -0.66 -257.31 -5.71 180.32 1354.11 -4965.07 432.62 -4532.46
2013 1180.07 147.56 0.92 -256.60 -24.30 187.17 1234.82 -4527.66 459.23 -4068.43
2014 1224.35 252.36 2.16 -256.92 -19.41 208.91 1411.45 -5175.31 459.43 -4715.89
2015 1191.71 126.84 2.05 -256.14 -10.85 199.49 1253.09 -4594.68 456.68 -4138.00
2016 1272.87 255.41 2.17 -258.43 -2.20 219.92 1489.74 -5462.39 453.38 -5009.01
2017 1062.12 357.74 4.47 -261.99 -87.92 237.70 1312.11 -4811.05 492.28 -4318.78
19 Duffy, B. Hyde, E. Hanley, P. O’Brien and K. Black 2017. National inventory report Greenhouse gas emissions 1990 –
2015 Reported to the united nations Framework convention On climate change, EPA, Dublin.
20 Black, K., Hendrick, E., Gallagher., G., Farrington, P. 2012. Establishment of Irelands projected reference level for
Forest Management for the period 2013-2020 under Article 3.4 of the Kyoto Protocol. Irish Forestry 69: 7-32.
21 Duffy, B. Hyde, E. Hanley, P. O’Brien and K. Black 2019. National inventory report Greenhouse gas emissions 1990 –
2017 Reported to the united nations Framework convention On climate change, EPA, Dublin.

Ireland’s Forests – Statistics 2020
54
6. The-Economic Contribution of the Forest Sector
6.1 Introduction
This Chapter provides information on the socio-economic contribution of forestry in Ireland in
the following areas:
• The value of direct economic activity in the growing and harvesting subsectors (excluding
wood processing and related activities) and employment for the years 2003 and 2012;
• The value of total (Direct, Indirect and Induced) economic activity in the growing and
harvesting subsector and employment for the years 2003 and 2012.
Key statistics
• An approximation of the full economic value of the forest sector in 2012 was €2.3 billion,
when both indirect and induced effects were taken into account;
• The total GVA of the forest sector was €1,096.5 million in 2012;
• The total value of economic activity in the growing and harvesting sector in 2012 was
€387 million;
• For every €1 of economic activity generated in the growing and harvesting subsector a
further €0.78 was generated in the wider economy in 2012;
• The total value of economic activity in the wood processing sector in 2012 was €1389.1
million;
• For every €1 of economic activity in wood processing an extra €0.66 was generated in the
wider economy in 2012;
• The number of people employed directly in the forestry and logging sector averaged 2,800
between 1998 and 2017;
• In 2012 total employment generated by activities in the forest and wood products sector
was 12,000 full time equivalents;
• Between 2003 and 2012 the overall value of both the growing and harvesting subsector
and wood processing subsector grew by 46% and 39% respectively;
• The number of people employed directly in the wood processing subsector has decreased
since the economic downturn in 2008;
• Visits to Irish forests are estimated to be over 29 million visits per annum;
• In 2019, total expenditure was €89.9 million which includes afforestation grants, annual
premium payments and grant aid for forest roads.

Department of Agriculture, Food & the Marine
55
6.2 Value of the forest Sector
The total value of economic activity in the forest sector, both directly of itself and to the wider
Irish economy, is shown in Table 32. The total direct value of economic activity in the growing
and harvesting subsector in 2012 was €387 million. Value to overall Gross Domestic Product or
Gross Value Added (GVA) was €136.6 million. In terms of the multiplier effect of this economic
activity, for every €1 generated in the growing and harvesting subsector a further €0.78 was
generated in the wider economy in 2012. This resulted in the growing and harvesting subsector
contributing an overall value of €688.7 million to the wider Irish economy, an increase of €216
million since 2003.
The total value of economic activity in the wood processing subsector in 2012 was €1389.1
million, adding €391.6 million in terms of GVA to the economy. For every €1 of economic activity
in wood processing an extra €0.66 was generated in the wider economy, an increase of €79.3m
over the 2003 figure. Total extra activity in the wider economy in 2012 was €910.3 million
(€2,299.4 – €1,389.1 million), an increase of €235 million since 2003.
The total GVA of the forest sector was €1,096.5 million in 2012, and an approximation of the full
economic value of the forest sector in 2012 was €2.3 billion, when both indirect and induced
effects were taken into account.34
Table 32. Value of economic activity in the forest sector.
Growing and harvesting subsector
200335 201236
million, €
Direct Economic Activity Value 255.4 386.9
Gross Value Added 134.5 136.6
Overall Value to Wider Irish Economy 472.4 688.7
Type 2 Multiplier 1.9 1.78
Wood processing subsector
Direct Economic Activity Value 975.0 1389.1
Gross Value Added 312.3 391.6
Overall Value to Wider Irish Economy 1650.0 2299.4
Type 2 Multiplier 1.66
34 Annual Review and Outlook for Agriculture, Food and the Marine 2013/14, 2014. Department of Agriculture, Food
and the Marine. 35 The Socioeconomic Contribution of Forestry in Ireland – an Interdisciplinary Approach, 2006. COFORD, Department of Agriculture, Food and the Marine, Dublin. 36 Personal Communication. Dr. Richard Moloney, 2014.

Ireland’s Forests – Statistics 2020
56
6.3 Employment in the forest sector
In 2010 direct and induced employment supported by the forest sector was estimated to be 5,531,
while in the wood processing sector direct and induced employment was estimated to be 6,40837.
In 2012 COFORD estimated that the total employment generated by activities in the forest and
wood products sector was 12,000 full time equivalents38.
6.3.1 Categorisation of employment statistics
There is an EU wide nomenclature for the classification of economic activity, which is referred to
as NACE39. The class Forestry and Logging is most relevant for the purpose of this publication and
includes the following four components:
• Silviculture and other forestry activities;
• Logging;
• Gathering of wild growing non-wood products;
• Support services to forestry.
It is important to note that the Forestry and Logging class is concerned only with what occurs
within the forest. Activities outside of the forest, such as the transport of logs to sawmills are not
included.
There is one other class which is relevant for this publication: Manufacture of wood and of
products of wood and cork, except furniture; manufacture of articles of straw and plaiting materials.
This class can be broken into the following sub-categories:
• Sawmilling and planing of wood;
• Manufacture of products of wood, cork, straw and plaiting materials:
o Manufacture of veneer sheets and wood-based panels;
o Manufacture of assembled parquet floors;
o Manufacture of other builders' carpentry and joinery;
o Manufacture of wooden containers;
o Manufacture of other products of wood; manufacture of articles of cork, straw and
plaiting materials.
6.3.2 Labour Force Survey/Quarterly National Household Survey
The Labour Force Survey (formerly the Quarterly National Household Survey) is a large-scale,
nationwide survey of households in Ireland, which began in September 1997. It is designed to
produce quarterly labour force estimates that include the official measure of employment and
unemployment in the State. Each quarter, field interviewers visit 39,000 households. In figure 28
below, average annual estimates are displayed.
The number of people employed directly in the forestry and logging sector has averaged 2,800
between 1998 and 2017 while the average number employed directly in sawmilling and planing
of wood has averaged 7,200 for the same period. A downward trend in employment in the wood
processing sector has been a feature since 1998, particularly since the economic recession in
2008 (Figure 30). Estimates were not produced for 2015, 2018 and 2019 as the sample size was
37 An Economic Evaluation of the Market and Non-Market Functions of Forestry, 2013. COFORD, Department of
Agriculture, Food and the Marine. 38 Irish Forestry and the Economy, 2014. COFORD. Department of Agriculture, Food and the Marine. 39 Description of NACE codes available at http://www.cso.ie/px/u/NACECoder/NACEItems/searchnace.asp
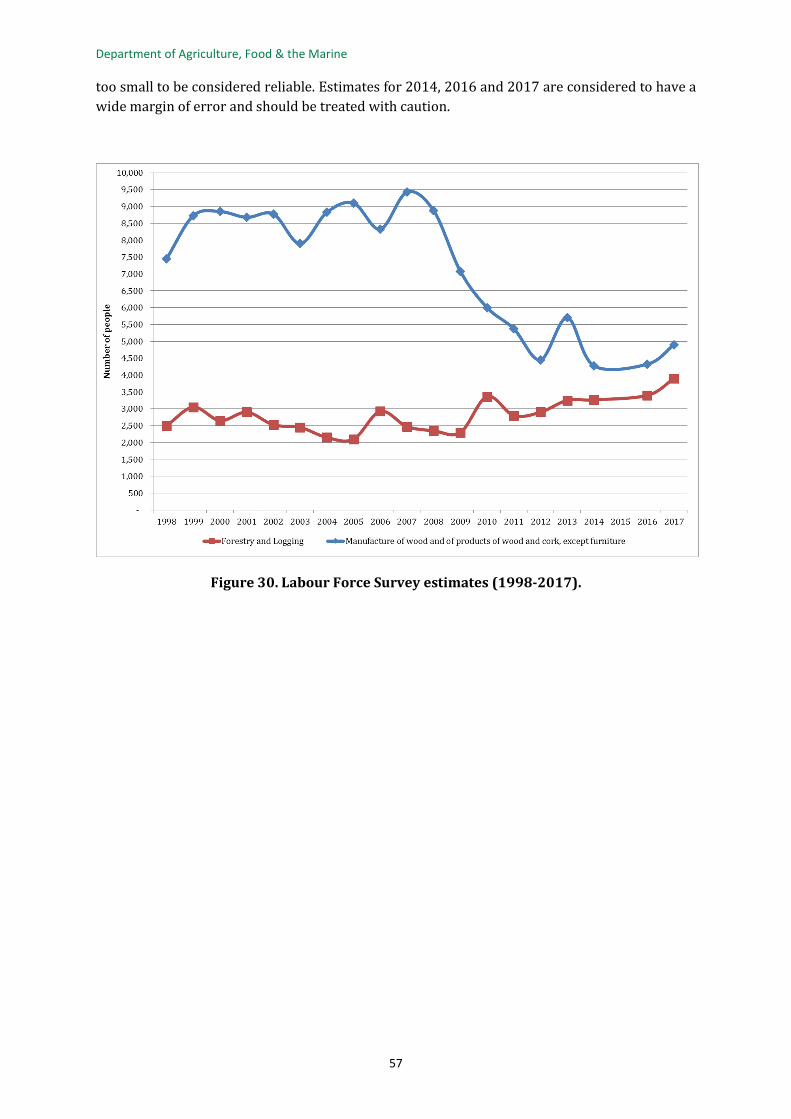
Department of Agriculture, Food & the Marine
57
too small to be considered reliable. Estimates for 2014, 2016 and 2017 are considered to have a
wide margin of error and should be treated with caution.
Figure 30. Labour Force Survey estimates (1998-2017).

Ireland’s Forests – Statistics 2020
58
6.3.3 Census of Ireland 2006, 2011 and 2016
Table 33 outlines persons aged 15 and over, classified by principal economic status and detailed
industrial group involved in forestry, logging and related activities40. The unemployment rate in
the sector has fallen to 5.5% in 2016 in both Forestry and Logging and Manufacture of wood and
wood products. The total in the labour force for wood and wood products has also decreased
significantly from 5,530 in 2011 to 4,000 in 2016 (Table 33).
The statistical classification of economic activities in the European Community, abbreviated as
NACE, is used to categorise the census data. The NACE Rev.1 classification was used in 2006,
whereas the NACE Rev.2 classification data is used for the 2011 and 2016 census.
Table 33. Persons 15 years and over involved in forestry by principal economic status.
NACE 02 - Forestry and Logging
Census Year
Total in labour force
At Work Unemployed (incl. looking for first regular job
Unemployment rate (%) Male Female Total
2006 2,548 2,142 282 2,424 124 4.9
2011 2,169 1,676 237 1,913 256 9.5
2016 2,468 1,978 290 2,268 200 5.5
NACE 16 - Manufacture of wood and of products of wood and cork, except furniture
Census Year
Total in labour force
At Work Unemployed (incl. looking for first regular job
Unemployment rate (%) Male Female Total
2006 6,188 5,168 752 5,920 268 4.3
2011 5,530 3,767 647 4,414 1116 20.6
2016 4,000 3,182 429 3,611 389 5.5
40 Available from : https://www.cso.ie/en/csolatestnews/presspages/2017/census2016profile11employmentoccupationsandindustry

Department of Agriculture, Food & the Marine
59
6.4 Forests & Recreation
There has been a long-standing policy in place of encouraging the use of forests for outdoor
recreation. Table 34 shows an upward trend in visitor number to Irish publicly owned forests
between 1999 and 2015.
Table 34. Estimate of number of visits to Irish forests 1999 - 2015.
Year Number of forest visits
199941 8,500,000
200442 11,000,000
200543 18,000,000
201545 29,105,759
Since the early 1970’s there has been an active programme of providing recreational facilities in
State forests. At the present time there are nearly 300 recreational sites, 12 forest parks and over
3000 km of hiking trails in forests throughout the country44. In addition to providing recreational
sites such as picnic areas and trails, Coillte has an open forest policy that allows free public access
to its 440,000 ha estate. The National Parks and Wildlife Service (NPWS) provide access to
national parks and nature reserves, and arboreta managed by the Office of Public Works are open
to the public. Also urban forests (public forests established and managed for recreation) owned
by County Councils or local communities are quite intensively used being close to population
centres. The most recent figures estimate 29,105,759 visits to Irish forests per annum, and values
forest recreation at €179 million per annum45.
For the private forest estate the decision to allow public access rests with the forest owner, and
is provided on a goodwill basis46. Private forest owners who have availed of a roading grant in
recent years allow public access to the forest road which may be subject to certain conditions.
Public access does not establish any legal right of access by the public to a grant aided forest road.
41 Clinch, P. (1999), The Economics of Irish Forestry, COFORD, Department of Agriculture, Food and the Marine. 42 Bacon, P. and Associates (2004). A Review and Appraisal of Ireland’s Forestry Development Strategy, Final Report. Stationery Office, Dublin 43 Fitzpatrick and Associates (2005). Economic Value of Trails and Forest Recreation in the Republic of Ireland. Coillte and the National Trails Strategy Working Group of the Irish Sports Council. Final Report, Dublin 44 http://www.coillte.ie 45 ECOVALUE: Valuing the Ecosystem Services of Irish Forests, 2015. Teagasc. 46 Forest Recreation in Ireland A Guide For Owners & Managers, 2006. Forest Service, Department of Agriculture, Food and the Marine.

Ireland’s Forests – Statistics 2020
60
6.5 State Expenditure on Forestry
Since 1993, nearly €3 billion has been expended by the State and European Union on
afforestation, including existing premium liabilities and other support measures for the forest
sector. In 2019, €89.9 million was spent on forest activities including afforestation, maintenance
grants, annual premium payments and grants for forest road infrastructure (Figure 31).
Expenditure in 2019 decreased by €4.7 million on the previous year due in part to reduced
afforestation levels and the payment of forest premium. A detailed breakdown of expenditure by
activity since 2008 is provided in Table 35.
Figure 31. Total state expenditure on forestry (1993-2019).

Department of Agriculture, Food & the Marine
61
Table 35. Annual state expenditure on forestry (2008-2019).
Expenditure (1000's Euro) 2008 2009 2010 2011 2012 2013 2014 2015 2016 2017 2018 2019 Main Afforestation Programme
Grant - 1st Instalment 19,852 22,080 27,557 20,482 19,215 17,033 16,759 17,480 18,420 15,819 12,270 10,769 Grant - 2nd Instalment 9,470 8,675 7,441 7,697 6,334 7,291 7,630 7,357 6,881 6,192 5,916 5,243 Premium 74,264 70,496 72,285 75,005 75,685 76,013 77,501 73,609 72,418 71,511 68,089 64,063 Sundry (e.g. Debt Recovery) 1,192 1,075 505 647 379 523 620 259 79 108 106 77
Afforestation Total 104,778 102,326 107,789 103,831 101,614 100,860 102,511 98,705 97,798 93,630 86,381 80,151 Forest Roads-Harvesting 7,129 5,400 3,694 4,204 3,077 2,709 2,794 2,381 2,561 3,889 3,038 3,796 Reconstitution of Woodlands 2,108 790 966 827 567 257 253 222 248 130 109 19 Chalara (RCW) 0 0 0 0 0 693 1,274 688 446 811 1,822 1,311 Storm Darwin (RCW) 0 0 0 0 0 0 0 0 0 0 437 195 Woodland Improvement Scheme 233 374 248 164 70 65 76 28 22 29 17 6 Thinning & Tending - WIS 0.0 0.0 610 750 971 864 666 470 593 603 441 636 Shaping of Broadleaves 57 83 10 0.0 0.0 0.5 0.0 0.0 0.0 0.0 0.0 0.0 Pruning of Conifers 189 454 56 0.0 233 94 0.0 0.0 0.0 0.0 0.0 0.0 NeighbourWood 578 670 180 351 435 146 6 0.0 167 130 116 0 Native Woodland Conservation 1,724 851 819 829 1,221 845 514 211 194 289 365 648 NDP Other Measures 170 52 3 11 -2 0 0 0 0 0 0 0 Other 0 0 0 0 0 0 0 0 0 31 21 3 Support Schemes Total 12,187 8,674 6,587 7,136 6,573 5,673 5,582 3,999 4,356 5,912 6,366 6,614 Reforestation 8 4 13 11 0 5 0.0 0.0 11 0.4 0 1 Forest Inventory 69 15 7 69 41 30 18 68 34 42 45 11 Other Capital Total 76 19 20 81 41 35 18 68 45 43 45 11
Total Capital 117,041 111,018 114,395 111,048 108,227 106,568 108,111 102,772 102,199 99,585 92,793 86,777
Promotion 1,738 487 289 864 799 828 684 693 840 1,060 1,123 2,189 Training 820 1,122 954 226 105 80 103 0 0 0 0 0 Technical Support 379 752 393 92 85 232 268 278 234 180 112 111 Fees International Organisations 31 37 39 189 8 16 8 10 10 10 0 0 Forest Sector Development (Coford) 4,258 4,289 401 408 380 425 304 350 424 606 475 670 Miscellaneous (e.g. legal, printing) -123 -195 94 4 41 20 144 -65 119 100 52 142
Total Current 7,103 6,491 2,171 1,782 1,418 1,601 1,511 1,265 1,627 1,956 1,762 3,112 Overall Total 124,145 117,510 116,566 112,830 109,646 108,169 109,622 104,037 103,826 101,541 94,555 89,889

Ireland’s Forests – Statistics 2020
62
7. Forest Protection and Health
7.1 Introduction
One of the key objectives of the Forestry Inspectorate of DAFM is to implement the forestry
aspects of the EU Plant Health Directive 2000/29/EC which includes monitoring and control
programmes for harmful forestry pests and diseases. In this regard with increased levels and new
emerging patterns in trade and greater mobility of larger numbers of people, the risk from the
introduction of exotic pests and diseases is ever present. Damage may also be caused to forests
by abiotic factors, with fire and wind the most common cause.
The majority of forests in Ireland are established using planting stock and ensuring the
traceability, suitability and quality of forest seed and plants used is vitally important. The Forestry
Inspectorate has responsibility for the implementation of the Council Directive 1999/105/EC on
the marketing of forest reproductive material and the associated implementing regulations as
well as the being the designated authority in Ireland for the OECD Scheme for the Certification of
Forest Reproductive Material Moving in International Trade.
The Forestry Inspectorate also oversees the national implementation of the FAO, IPPC
International Standard for Phytosanitary Measures (ISPM) No. 15, Guidelines for Regulating
Wood Packaging Material in International Trade. Not only is this important in terms of imports
and protecting Ireland’s forests but also for companies exporting who require compliant wood
packaging, thereby facilitating Irish exports of goods of all kinds.
Key statistics
• In 2019 Brexit preparedness work dominated the work of the Forest Health Section
particularly in relation to contingency planning for a no-deal exit from the EU in March and
October 2019 and the impacts of such an event on imports and exports of forestry products
(including wood packaging material) to and from the UK.
• In December 2019 the new EU Plant Health Regulation 2016/2031 replaced the existing
Plant Health Directive 2000/29/EC.
• There were no findings of any EU priority pests or pests for which Ireland has current EU
Protected Zone status in Irish forests during annual surveys in 2019;
• The first detection of Hymenoscyphus fraxineus (previously referred to as Chalara fraxinea)
in Ireland was in October 2012. The surveys conducted in 2019 included a targeted survey
of forestry plantations and a systematic survey of National Forest Inventory points across
the country. By the end of 2019 there had been findings in ash in over 650 locations in various
settings – forests, nurseries and garden centres, on farm planting, roadside planting,
hedgerows and private gardens in all 26 counties.
• Phytophthora ramorum was first detected in Japanese larch in 2010 and at the end of 2019
has been confirmed present at a total of 56 locations in this tree species;
• 54 Irish companies are currently registered in Ireland to produce wood packaging material
to the FAO IPPC International Standard for the Regulation of Wood Packaging Material in
International Trade (ISPM No. 15) thus facilitating the export of goods worldwide from
Ireland on compliant pallets and crates.

Department of Agriculture, Food & the Marine
63
7.2 Biotic – Pests and Diseases
The Forestry Inspectorate is responsible for implementing the forestry aspects of the EU Plant
Health Directive, Council Directive 2000/29/EC on protective measures against the introduction
into the Community of organisms harmful to plants or plant products and against their spread
within the Community. Under the EU Plant Health regime, for logistical plant health reasons the
island of Ireland is considered as a whole. As a result there is close co-operation with Northern
Ireland’s Department of Agriculture, Environment and Rural Affairs (DAERA) involving regular
meetings of the North South Ministerial Council and the Plant Health Sub-Group.
The Forestry Inspectorate implements the provisions of the Directive relating to timber, wood
packaging material (pallets, crates, etc.), forest plants, Christmas trees and other forest products
and surveys the national forest estate for quarantine forest pests and diseases.
Council Directive 2000/29/EC was repealed and replaced by Regulation (EU) 2016/2031
effective from 14th December 2019. The related Official Controls Regulation 2017/625 also came
into effect on that date and impacts inter alia on how official import controls and diagnostics are
carried out. DAFM is actively organising policy and operational requirements to meet the articles
of Regulation 2016/2031 and 2017/625. Increased stakeholder engagement is an important
element of the incoming Plant Health regime and in 2019 the Forestry Inspectorate contributed
to the roll out of the first DAFM Plant Health Strategy which was launched in November 2019 and
the continued roll out of the Don’t Risk It campaign in relation to imports. The DAFM Don’t Risk
It campaign was very well received again at events such as Bloom and the National Ploughing
Championships 2018. All of this work in 2019 serves as an excellent platform for the International
Year of Plant Health 2020.
7.2.1 Protected Zone Organisms Ireland has Protected Zone status for 13 harmful organisms present in other EU Member States
but not present here (Table 36). In accordance with Commission Regulation EC No 690/2008 to
justify Ireland’s Protected Zone status, the Forestry Inspectorate conducts annual national forest
surveys and submits reports annually to European Commission. No detection of the
aforementioned organisms were found in surveys conducted during 2017, 2018 and 2019.
In late 2018 the UK Forestry Commission announced the first finding of the bark beetle Ips
typographus in the wider environment in the UK at a woodland in Kent, England. This finding and
has prompted a coordinated response from DAFM and DAERA including additional risk-based
surveys and monitoring in 2019.
The finding of Ips typographus in late 2018 in a woodland in Kent, England represents an
increased threat of the introduction of this bark beetle to Ireland and prompted a coordinated
response on the island of Ireland from DAFM and DAERA. As part of the additional risk-based
surveys in 2019 DAFM in collaboration with Coillte established a supplementary network of risk-
based bark beetle monitoring plots distributed through the Coillte estate. These new targeted
monitoring plots complement and enhance the existing systematically distributed network of
plots.

Ireland’s Forests – Statistics 2020
64
Table 36. List of harmful organisms for which Ireland has Protected Zone status.
Protected Zone Organism
Cephalcia lariciphila (European web-spinning larch sawfly)
Gilpinia hercyniae (European spruce sawfly)
Gremmeniella abietina (Brunchorstia disease)
Dendroctonus micans (great spruce bark beetle)
Ips amitinus (small spruce bark beetle)
Ips cembrae (large larch bark beetle)
Ips duplicatus (northern bark beetle)
Ips sexdentatus (six-toothed bark beetle)
Ips typographus (eight-tooted spruce bark beetle)
Hypoxylon mammatum (hypoxylon canker)
Cryphonectria parasitica (chestnut blight)
Thaumetopoea processionae (oak processionary moth)
Dryocosmus kuriphilus (oriental chestnut gall wasp)
7.2.2 Other Regulated Organisms Other harmful organisms listed in the EU Plant Health Directive of significance which also require
mandatory annual surveys and reporting include Anoplophora chinensis (citrus long-horn beetle),
Anoplophora glabripennis (Asian long-horn beetle), Bursaphelenchus xylophilus (pine wood
nematode), Monochamus spp. (sawyer beetle), Phytophthora ramorum and Gibberella circinata
(pitch canker of pine). In 2019 Ireland also increased its participation in EU co-funded surveys
for EU priority pests (including Monochamus spp. and B. xylophilus) and initiated new surveys for
EU priority pests including Agrilus auroguttatus (gold-spotted oak borer) and Dendrolimus
sibiricus (Siberian silk moth). EU priority pests are those pests whose potential economic,
environmental or social impact is the most severe for the Union territory. There were no findings
of any EU priority pests in Irish forests in 2019.
7.2.3 Surveys In surveys for the above regulated organisms and for general forest health monitoring purposes,
a network of observation points, pheromone traps, bait logs and sampling points distributed
around the country in public and private forests and forest nurseries is used. The Forestry
Inspectorate also deals with queries and reports from the industry and general public in relation
to forest and tree health issues including reports submitted via the web-based Tree Check App.
This may involve site visits and taking of samples for laboratory analysis. This diagnostic and
advisory service is part of the National Forest Protection Policy.
In September 2016 Dothistroma Needle Blight (DNB) was confirmed in Ireland for the first time.
It was identified as being present on Scot’s pine trees at two privately owned (grant aided) forests,
one in southwest Limerick and one in northwest Cork. Samples taken from Scot’s pine trees at
the two forests in early August were analysed and laboratory results confirmed the presence of
D. septosporum in early September. Surveys during 2019 brought the number of findings of DNB
to 38. These findings were across 15 counties, affecting Scot’s pine (Pinus sylvestris), lodgepole
pine (P. contorta) and Corsican pine (P. nigra). Figure 32 indicates the findings as of 31st
December 2018 as illustrated on a 10 x 10km grid square basis.

Department of Agriculture, Food & the Marine
65
In January 2018, another needle blight of pine, brown spot needle blight (BSNB) caused by the
fungal pathogen Lecanosticta acicola was detected in Ireland for the first time in an arboretum in
Co. Wexford on mountain pine (P. mugo) and Scots pine. Follow up surveys for this needle blight
led to a second finding in a forest in Co. Wexford. There were no further findings of L. acicola in
2019.
In the EU, the movement of plants for planting is regulated through the plant passport system. In
Ireland therefore there are regular inspections of nurseries each year. The Department will only
grant authorisation to issue a plant passport if a place of production and its immediate vicinity is
free of the relevant harmful organisms. Further information on the DNB finding can be found on
the following link:
https://www.agriculture.gov.ie/forestservice/treediseases/dothistromaneedleblight/.
Figure 32. Findings of Dothistroma Needle Blight in Ireland 2016-2018.
Ireland’s Forests – Statistics 2020
66
7.2.4 Ash Dieback (Hymenoscyphus fraxineus)
Following the first confirmed finding of the Ash Dieback disease in October 2012, on imported
trees used in forestry plantations, intensive surveys for the disease have been conducted year on
year since. In addition to forest surveys, staff in the wider Department conducted surveys in
horticultural nurseries, garden centres, private gardens, roadside landscaping and farm agri-
environment scheme plantings. The surveys conducted in 2019 included a targeted survey of
forestry plantations and a systematic survey of National Forest Inventory points across the
country. By the end of 2019 there had been findings in ash in over 650 locations in various
settings – forests, nurseries and garden centres, on farm planting, roadside planting, hedgerows
and private gardens in all 26 counties. In 2019, due to the wide distribution of Chalara Ash
Dieback Disease reports of the disease from the general public in non-grant aided ash trees, for
example garden trees and hedgerow trees, were not routinely sampled for laboratory analysis
and are not accounted for in the figure of 650. In light of the increasing numbers of findings DAFM
has switched to mapping findings on the basis of whether the disease has been found in 10km
grid squares rather than showing and recording individual findings. Figure 33 displays the
findings as of 31st December 2019 as illustrated on a 10x10km grid square basis.
While H. fraxineus is not a regulated disease under the EU Plant Health Directive (Council
Directive 2000/29/EC) a Ministerial Order to provide for measures to prevent the spread of H.
fraxineus in the genus Fraxinus L. was introduced on the 6th November 2012 (S.I. 431 of 2012).
It restricted the movement of ash plants and seed into Ireland as well as imposing restrictions on
ash wood imports. Further to the adoption of the ‘All Ireland Chalara Control Strategy’ in July
2013, which was developed jointly with the Department of Agriculture and Rural Development
(DARD) in Northern Ireland, the Department continued its co-operation with the UK authorities
throughout 2016. The legislation in relation to ash wood imports was updated in 2015 (S.I. No
479 of 2015). The new Order restated the provisions contained in the previous Order as they
pertain to plant and plant products but introduced a number of changes in relation to the
documentary requirements around the importation of ash wood, the required pre-importation
treatments, as well as taking into account the change in the scientific name of the organism in
2014. In April 2018, DAFM commenced a review of the national response to ash dieback including
the Reconstitution Scheme on the basis that eradication of the disease is no longer a possibility.
This included a stakeholder and public consultation period, detailed field consideration of
damage level evaluation together with a broader range of silvicultural and management options
with the assistance of Teagasc and international experts. Support schemes were reviewed to
ensure the continued relevance of DAFM’s response and value for money, and to ensure that the
forest owner is provided with a broader range of silvicultural and management options.
Consideration is currently being given to the financial aspects of the scheme. This review
continued through 2019 and a further round of stakeholder consultation was launched in late
2019.
For update information on Ash Dieback disease please visit the following webpage:
http://www.agriculture.gov.ie/forestservice/treediseases/ashdiebackchalara/.

Department of Agriculture, Food & the Marine
67
Figure 33. Ash Dieback findings in Ireland 2012 – 2019.
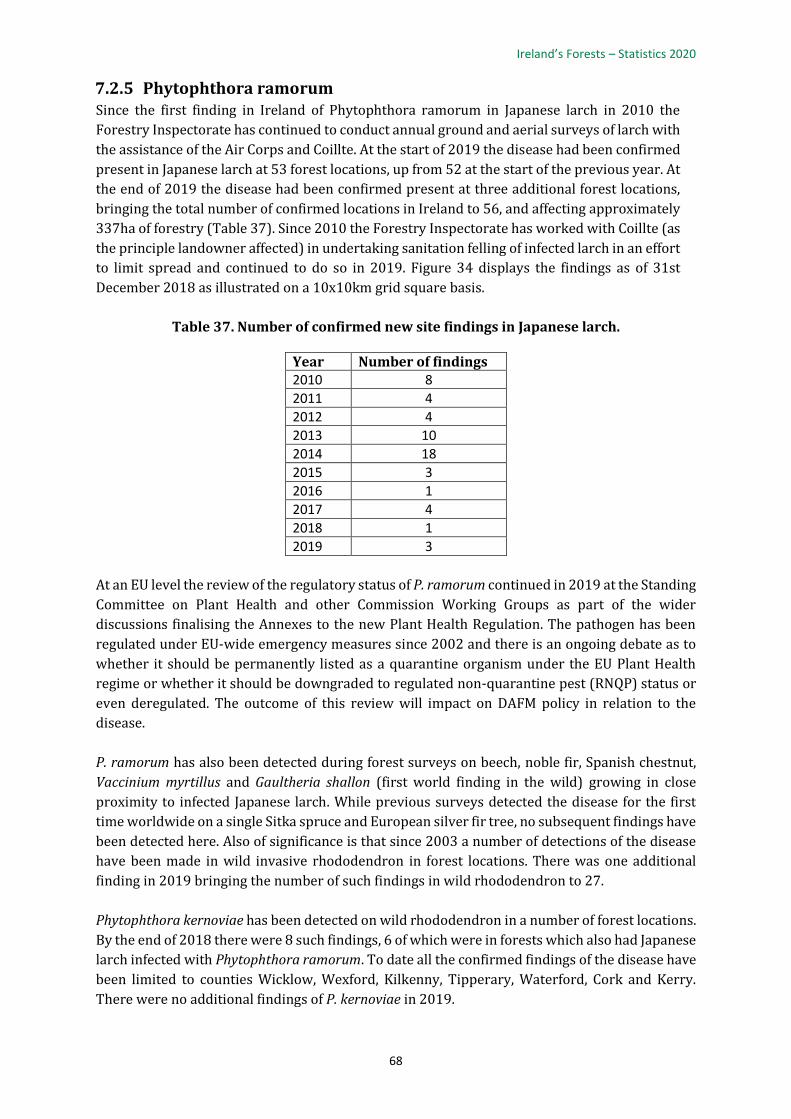
Ireland’s Forests – Statistics 2020
68
7.2.5 Phytophthora ramorum Since the first finding in Ireland of Phytophthora ramorum in Japanese larch in 2010 the
Forestry Inspectorate has continued to conduct annual ground and aerial surveys of larch with
the assistance of the Air Corps and Coillte. At the start of 2019 the disease had been confirmed
present in Japanese larch at 53 forest locations, up from 52 at the start of the previous year. At
the end of 2019 the disease had been confirmed present at three additional forest locations,
bringing the total number of confirmed locations in Ireland to 56, and affecting approximately
337ha of forestry (Table 37). Since 2010 the Forestry Inspectorate has worked with Coillte (as
the principle landowner affected) in undertaking sanitation felling of infected larch in an effort
to limit spread and continued to do so in 2019. Figure 34 displays the findings as of 31st
December 2018 as illustrated on a 10x10km grid square basis.
Table 37. Number of confirmed new site findings in Japanese larch.
Year Number of findings 2010 8
2011 4
2012 4
2013 10
2014 18
2015 3
2016 1
2017 4
2018 1
2019 3
At an EU level the review of the regulatory status of P. ramorum continued in 2019 at the Standing
Committee on Plant Health and other Commission Working Groups as part of the wider
discussions finalising the Annexes to the new Plant Health Regulation. The pathogen has been
regulated under EU-wide emergency measures since 2002 and there is an ongoing debate as to
whether it should be permanently listed as a quarantine organism under the EU Plant Health
regime or whether it should be downgraded to regulated non-quarantine pest (RNQP) status or
even deregulated. The outcome of this review will impact on DAFM policy in relation to the
disease.
P. ramorum has also been detected during forest surveys on beech, noble fir, Spanish chestnut,
Vaccinium myrtillus and Gaultheria shallon (first world finding in the wild) growing in close
proximity to infected Japanese larch. While previous surveys detected the disease for the first
time worldwide on a single Sitka spruce and European silver fir tree, no subsequent findings have
been detected here. Also of significance is that since 2003 a number of detections of the disease
have been made in wild invasive rhododendron in forest locations. There was one additional
finding in 2019 bringing the number of such findings in wild rhododendron to 27.
Phytophthora kernoviae has been detected on wild rhododendron in a number of forest locations.
By the end of 2018 there were 8 such findings, 6 of which were in forests which also had Japanese
larch infected with Phytophthora ramorum. To date all the confirmed findings of the disease have
been limited to counties Wicklow, Wexford, Kilkenny, Tipperary, Waterford, Cork and Kerry.
There were no additional findings of P. kernoviae in 2019.

Department of Agriculture, Food & the Marine
69
Figure 34. Phytophtora ramorum findings in Ireland 2010-2018.

Ireland’s Forests – Statistics 2020
70
7.3 EU Plant Health Directive & Protected Zone Monitoring
Import inspections of wood and wood products from Third Countries regulated under the EU
Plant Health Directive are routinely conducted to ensure compliance with entry requirements as
part of the Customs clearance process (Tables 38 and 39). In 2019, 545 third country
consignments received a documentary check and if appropriate to the requirements, were
physically inspected (Table 38). Nine were found to be non-compliant with the import
requirements. Appropriate measures were taken where non-compliances were detected
depending on the nature of the non-compliance.
Under the EU internal markets regime goods coming from within the EU are not subject to
Customs clearance but monitored to ensure Ireland’s Protected Zone requirements are met.
DAFM operates two designated Border Inspection Posts in Dublin and Cork ports for import
controls from Third countries and has an office in Waterford port. Shipments coming into the
other ports and airports are covered from these locations if required.
In 2018 the special measures introduced in 2013 by the European Commission regarding
inspections of wood packaging material associated with certain stone commodities imported into
the EU from China were replaced by a new Commission Implementing Decision (2018/1127/EU)
which expanded the range of commodities to be inspected and includes goods from Belarus as
well as China. In 2019, 111 containerised consignments from China were inspected, with eight
non-compliances detected where appropriate phytosanitary measures were imposed (Table 39).
In addition, the Forestry Inspectorate carries out monitoring of Portuguese wood packaging
material in relation to the threat of pine wood nematode (as required under Commission
Implementing Decision 2012/535 as amended) and wood packaging from other countries.
The Forestry Inspectorate also provides advice and deals with queries regarding import and
export requirements related to wood/wood products and forest reproductive material.
Phytosanitary Certificates may also be issued to accompany certain consignments leaving the free
trade area of the EU.
In 2019 Brexit preparedness work dominated the work of the Forest Health Section particularly
in relation to contingency planning for a no-deal exit from the EU in March and October 2019 and
the impacts of such an event on imports and exports of forestry products (including wood
packaging material) to and from the UK. Efforts focussed on developing adequate infrastructure,
IT systems and staff to cope with the eventuality of a no-deal exit which threatened during the
year.

Department of Agriculture, Food & the Marine
71
Table 38. Third Country Timber Import Inspections from January to December 2019.
Country Number of
Inspections Not Regulated or
Compliant Non-Compliant
USA 482 473 9 Canada 20 20 0 China 13 13 0 Egypt 7 7 0 Russia 5 5 0 South Africa 2 2 0 Nicaragua 2 2 0 Switzerland 2 2 0 Brazil 2 2 0 Guyana 1 1 0 Ukraine 1 1 0 Honduras 1 1 0 Malaysia 1 1 0 Guatemala 1 1 0 Namibia 1 1 0 Australia 1 1 0 Tunisia 1 1 0 Turkey 1 1 0 Bosnia & Herzegovina 1 1 0
Total 545 536 9
Table 39. Wood Packaging Inspections from Jan to Dec 2019.
Country Number of Inspections Compliant Non-Compliant
China 111 103 8
Portugal 5 2 3
Other 7 5 2
Total 123 110 13

Ireland’s Forests – Statistics 2020
72
7.4 ISPM No. 15 (IPPC International Standard for Wood Packaging
Material)
In relation to exports (in addition to import controls), the Forestry Inspectorate is responsible for
the implementation of the FAO, IPPC, International Standard for Phytosanitary Measures (ISPM)
No. 15, Guidelines for Regulating Wood Packaging Material in International Trade. ISPM No. 15
describes phytosanitary measures to reduce the risk of introduction and/or spread of quarantine
pests associated with wood packaging material made of raw wood, in use in international trade.
Wood packaging material, which is being exported from Ireland to most non-EU countries around
the world, is required to comply with ISPM No. 15. ISPM No. 15 thereby facilitates exports by Irish
companies of goods of all kinds, which are being transported using wooden pallets, crates, loose
wood dunnage etc. In practice wood packaging material made from unprocessed raw wood and
used in supporting, protecting or carrying a commodity, must be heat treated or fumigated in a
specified manner and each individual unit of the wood packaging material must be stamped on at
least two sides with the officially approved ISPM No. 15 mark verifying the treatment and
incorporating the country code and the registration number of the producer of the packaging.
ISPM No. 15 currently does not apply to wood packaging material which is being dispatched to
other EU Member States. The following services are available in relation to ISPM No. 15:
• Registration of producers of wood packaging material and kiln operators in association
with NSAI
• Advice to wood packaging material manufacturers and kiln operators concerning ISPM
No. 15
• Advice to importing and exporting companies concerning ISPM No. 15
To the end of 2019, there were 54 companies registered to operate under the scheme in Ireland.
Companies in the scheme are inspected to ensure compliance with agreed Standard Operating
Procedures and that the wood packaging material is fully compliant with the standard.

Department of Agriculture, Food & the Marine
73
7.5 Abiotic
This section details the extent of damage to the forest estate arising from non-living or abiotic sources.
7.5.1 Forest fires
Forest fires normally occur each year in Ireland and reach their peak in spring, particularly in
forests established on formerly unenclosed land, with a preponderance of purple moor grass and
heather vegetation. Figure 35 shows the area of forests damaged by fire from 1930 to 2019. In
the late 1970’s and early 1980’s, considerable areas of public forest were burnt. Fire damage
levels were high in both public and private forests in 2010 and 2011 following protracted dry
periods in spring. The high level of forest fire damage in 2017 is primarily attributed to the Cloosh
fire in Co. Galway, which impacted approximately 1,500 ha of forest.
Estimates of fires in privately-owned forests for the periods 1985-2005, 2010-2016 and 2018-
2019 were derived by multiplying the proportion of public forest area destroyed by fire each year
by the private forest area. In 2017 the private estate was directly estimated due to large single
event at Cloosh, which would not be representative of the private estate.
Figure 35. Area of forest damaged by fire 1930-2019.

Ireland’s Forests – Statistics 2020
74
8. Forest Reproductive Material DAFM is responsible for implementing Council Directive 1999/105/EC on the marketing of forest
reproductive material. Forest reproductive material (FRM) is a collective term to describe seeds,
plants and cuttings, which are important for forestry purposes. The aim of the legislation is to
ensure that forest reproductive material, which is marketed, is from approved suitable sources
and is clearly labelled and identified throughout the entire process from tree seed collection to
processing, storage, forest nursery production and delivery to the final forest user. In recent years
the Forestry Inspectorate has being participating in the ongoing EU review of seed and
propagating material legislation.
DAFM provides the following services in relation to forest reproductive material:
• Registration of suppliers of forest reproductive material - seed collectors, nurseries, seed
and plant importers and brokers
• Registration of seed stands Issuing of Certificates of Provenance for seed collections
• Advice on forest seed and plant regulations
DAFM is also the National Designated Authority in Ireland for the OECD Scheme for the
Certification of Forest Reproductive Material Moving in International Trade. The object of the
international OECD Scheme is to encourage the production and use of forest seeds, parts of plants
and plants that have been collected, transported, processed, raised and distributed in a manner
that ensures their trueness to name.
Forest plants may also be subject to the requirements of the EU Plant Health Directive, Council
Directive 2000/29/EC on protective measures against the introduction into the Community of
organisms harmful to plants or plant products and against their spread within the Community.
Key statistics
• 99 Seed Collection Permits and 20 Master Certificates of Provenance were issued in 2019 in
relation to home collected forest reproductive material.
• 12 new sources of forest basic material were added to the National Register of Basic Material
in 2019. The total area on the register at the end of 2019 was 4,340 ha.
• Limited volumes of acorns were collected from home sources in 2019 due to an indifferent
seed year. Infrequent mast years are common in oak species due to range of climatic and
genetic factors.
• The majority of pedunculate oak acorns were sourced from Select Stands of Dutch
provenance, while the majority of sessile oak acorns were sourced from Source Identified
Stands of Irish provenance.
• There has been a considerable year on year increase in the amount of downy birch seed sown
in Irish forest tree nurseries.
• Increasingly improved seed (Qualified and Tested) is being utilised for the main conifer
species: Sitka spruce, Norway spruce, Douglas fir and Scots pine.
• The Irish Sitka spruce tree improvement programme produced a small amount of seed (0.5
kg) in 2019; this was supplemented with 2 million plants produced by vegetative
propagation from improved hedge orchards.
• Improved seed from the Danish and British tree improvement programmes make up the bulk
of Sitka spruce sowing in 2019 (≈70 %).

Department of Agriculture, Food & the Marine
75
8.1 Seed Collection permits and master certificates of provenance
In 2019, 99 Seed Collection Permits were issued – an increase on the previous year (57 issued in
2018). During 2019, 20 Master Certificates of Provenance were issued (46 issued in 2018). These
figures vary from year to year depending on availability of suitable seed and levels of demand.
8.2 National Register of Approved Basic Material
In accordance with EC Directive 1999/105/EC, each EU Member State holds a national register
of approved forest basic material. DAFM is responsible for the national register and updates it
annually. New entities are evaluated according to criteria described in the Directive and following
inspection entered on the register according to four different categories.
• Source identified: Reproductive material derived from basic material which may be either a
seed source or stand located within a single region of provenance.
• Selected: Reproductive material derived from basic material which shall be a stand located
within a single region of provenance, which has been phenotypically selected at the
population level.
• Qualified: Reproductive material derived from basic material which shall be seed orchards,
parents of families, clones or clonal mixtures, the components of which have been
phenotypically selected at the individual level and which meets certain prescribed
requirements
• Tested: Reproductive material derived from basic material which shall consist of stands, seed
orchards, parents of families, clones or clonal mixtures. The superiority of the reproductive
material must have been demonstrated by comparative testing or an estimate of the
superiority of the reproductive material calculated from genetic evaluation of the
components of the basic material.
The total area of approved forest basic material on the National Register of Basic Material now
stands at 4,340 ha (Table 40). Additions in 2019 included six Sitka spruce and two Douglas fir
stands, approved as Selected of unknown origin. A downy birch seed collection area established
using the progeny of the birch tree improvement programme was approved as Selected. Three
privately owned oak stands were also entered on the register in 2019. These included a Selected
pedunculate oak stand, likely of Dutch origin, on the Coolattin Estate in Co. Wicklow. A Source
Identified sessile stand, also in Coolattin Co. Wicklow, and a source identified stand in Stradbally
Co. Laois.

Ireland’s Forests – Statistics 2020
76
Table 40. Summary of the 2019 National Register of Approved Basic Material by forest
reproductive material category and area (ha).
Species Source Identified Selected Qualified Tested Total
Abies procera - 13 - - 13
Acer pseudoplatanus - 54 3 - 57
Alnus cordata - 1 - - 1
Alnus glutinosa 113 0 2 - 115
betula pubescens 30 13 0.8 - 44
Castanea sativa - 8 2 - 10
Chamaecyparis lawsoniana - 3 - - 3
Cryptomeria japonica 3 - - - 3
Cupressus macrocarpa - 1 - - 1
Fagus sylvatica - 79 - - 79
Fraxinus excelsior 136 22 4 - 162
Larix decidua - 17 - - 17
Larix kaempferi - 37 - - 37
Larix x eurolepis - - 3 - 3
Mixed Species Stands 53 - - - 53
Picea abies - 290 - - 290
Picea sitchensis - 451 3 3 457
Pinus contorta - 105 2 - 108
Pinus nigra var. maritima - 63 - - 63
Pinus radiata - 19 - - 19
Pinus sylvestris 28 162 5 - 195
Prunus avium - - 0.8 - 0.8
Pseudotsuga menziesii - 233 - - 233
Quercus petraea 931 508 - - 1,439
Quercus robur 472 384 - - 856
Sequoia sempervirens 1 - - - 1
Taxus baccata 34 - - - 34
Thuja plicata - 19 - - 19
Tsuga heterophylla - 28 - - 28
Total 1,801 2,511 25 3 4,340

Department of Agriculture, Food & the Marine
77
8.3 Utilisation of Forest Reproductive Material in Afforestation and
Reforestation
Tables 41 and 42 summarise data on seed used in Irish forest nurseries for the period 2015-2019
for broadleaf and conifer species respectively22. Table 43 lists kgs of seed used in Irish forest
nurseries in 2019 by FRM category.
Table 41. Main broadleaf species sown (kgs seed & number of plants (‘000)) in forest
nurseries (2015-2019).
Species
2015 2016 2017 2018 2019
kg Plants ('000)
kg Plants ('000)
kg Plants ('000)
kg Plants ('000)
kg Plants ('000)
Acer pseudoplatanus
233 1,314 100 564 153 863 15 85 95 536
Alnus glutinosa 128 3,840 117 3,510 113 3,390 92 2,760 118 3,540
Betula pendula 6 180 10 300 7 210 8 240 8 240
Betula pubescens
35 1,050 49 1,470 54 1,620 52 1,560 60 1,800
Fagus sylvatica 936 936 466 466 1,040 1,040 683 683 870 870
Fraxinus excelsior
2 2 - - - - -
Quercus petrea 659 53 190 15 5,363 429 4,268 341 1,400 112
Quercus robur 6,840 547 24,635 1,971 20,663 1,653 25,302 2,024 15,406 1,232
Table 42. Main conifer species sown (kgs seed & number of plants (‘000)) (2015-2019).
Species
2015 2016 2017 2018 2019
kg Plants ('000)
kg Plants ('000)
kg Plants ('000)
kg Plants ('000)
kg Plants ('000)
Larix decidua 5 300 1 60 0.3 18 0.3 18 0.6 36
Picea abies 84 2,940 71 2,485 101 3,535 91 3,185 104 3,640
Picea sitchensis 298 29,800 326 32,600 280 28,000 247 24,700 380 38,000
Pinus contorta 32 2,880 17 1,530 23 2,070 22 1,980 25 2,250
Pinus sylvestris 30 1,500 48 2,400 67 3,350 80 4,000 46 2,300 Pseudotsuga menziesii 26 650 18 450 20 500 19 475 30 750
22 Data on seed utilisation was sourced from Coillte CGA and None-So-Hardy (Forestry) LTD.

Ireland’s Forests – Statistics 2020
78
Table 43. Main conifer and broadleaf sown (kgs seed & number plants (‘000)) in 2019 by
species and FRM category.
Species
Source ID Selected Qualified Tested
kg Plants ('000)
kg Plants ('000)
kg Plants ('000)
kg Plants ('000)
Acer pseudoplatanus 77 434 - - 18 102 - -
Alnus glutinosa - - 114 3,428 3 98 - -
Betula pendula - - 8 225 - - - -
Betula pubescens 50 1,512 10 288 - - - -
Fagus sylvatica - - 870 870 - - - -
Fraxinus excelsior - - - - - - - -
Larix decidua - - 0.6 36 - - - -
Picea abies - - 50 1,750 49 1,710 5 175
Picea sitchensis 5 525 144 14,375 - - 231 23,050
Pinus contorta - - 24 2,157 1.0 90 - -
Pinus sylvestris - - 5 250 41 2,042 - -
Pseudotsuga menziesii - - - - - - 30 745
Quercus petraea 1,280 102 120 10 - - - -
Quercus robur - - 15,406 1,232 - - - -
Department of Agriculture, Food & the Marine
79
9. International comparators
9.1 Introduction
This chapter compares the status of Irish forests with European and global forests. Comparisons
are primarily from 2015 when the FAO Global Forest Resources Assessment and the State of
Europe’s Forests were published. Also presented are figures on roundwood harvest, increment
and forest expansion in the EU 28.
Key statistics
• At 10.9%, forest cover in Ireland in 2015 was one of the lowest in the EU, where the
average forest cover was 33.5%; Worldwide forest cover was 30.6%;
• In 2015, public forest ownership in Ireland was at 54%, close to the EU average of 59%;
• Annual roundwood harvest in 2010 was 2.7 million m3, compared with an EU average of
18.9 million m3 in the same year;
• Fellings represented at 47% of annual increment in 2012, which was below the EU
average of 59%, reflecting the relatively young age of Ireland’s forests in comparison to
the rest of Europe;
• Of all the EU Member States, since 1990 Ireland has had the highest rate of increase in
forest expansion as a percentage of total forest cover.

Ireland’s Forests – Statistics 2020
80
9.2 Global & EU 28 Forest Cover
Despite having afforested more than 320,000 ha since 1990, Ireland remains one of the least
forested countries in Europe. In 2015, when the FAO Global Forest Resources Assessment was
published, Ireland had 10.9% forest cover, compared with a total forest cover of 33.5% in the EU
28 and a 30.6% forest cover worldwide (Figure 36). In 2015 total Irish forest cover represented
0.8% of the total European forest cover (Figure 37 & 38).
Figure 36. Global forest cover (Source: FAO Global Forest Resources Assessment 2015).
Figure 37. Forest area (million ha) and share (percentage) of land area by country
(Source: State of Europe’s Forests 2015).

Department of Agriculture, Food & the Marine
81
Figure 38. Forest cover in EU 28 (Source: State of Europe’s Forests 2015).
9.3 Forest comparison: EU 28
The State of Europe’s Forests reports on the status and trends in European forests and offers a
comparison of Irish forests with European counterparts. In 2015 at the time of the latest report,
public forest ownership in Ireland was at 54%, close to the EU average of 59% (Figure 39). Due
to afforestation, the proportion of privately owned forest is increasing in Ireland. Germany has
the highest total growing stock of the EU 28, at over 3.6 billion m³ (Figure 40).
Figure 39. Forest ownership in the EU 28 (State of Europe’s Forests 2015).
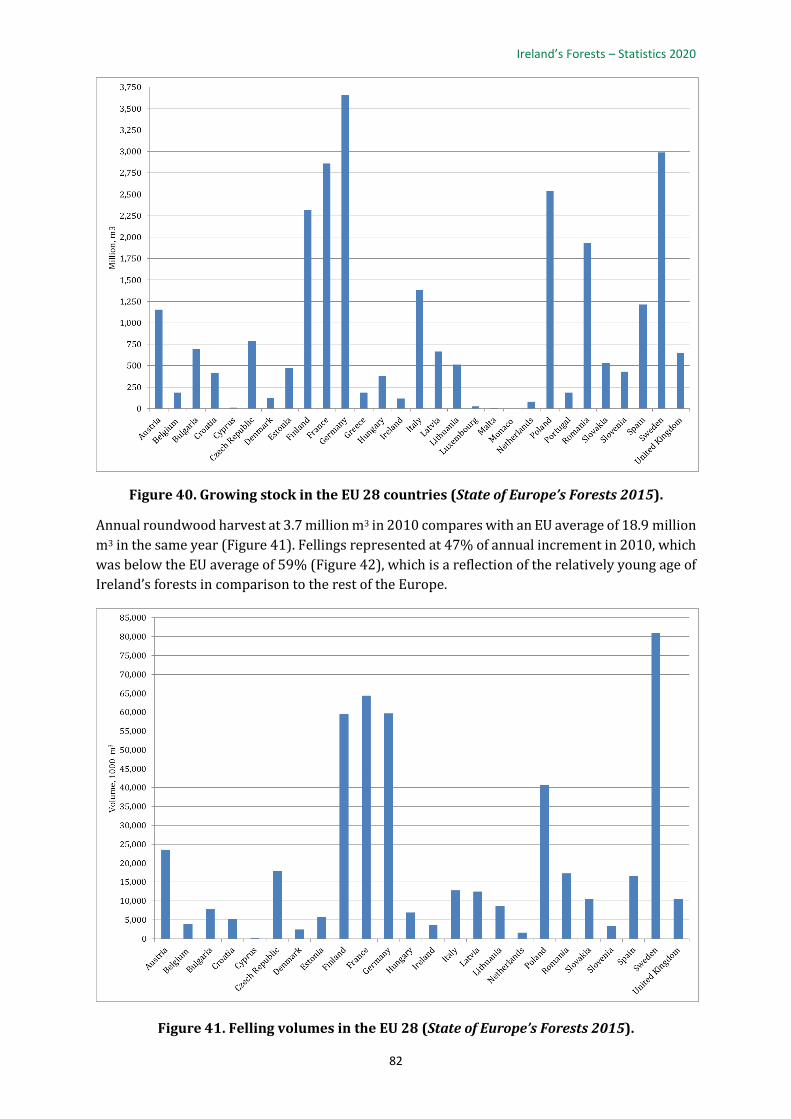
Ireland’s Forests – Statistics 2020
82
Figure 40. Growing stock in the EU 28 countries (State of Europe’s Forests 2015).
Annual roundwood harvest at 3.7 million m3 in 2010 compares with an EU average of 18.9 million
m3 in the same year (Figure 41). Fellings represented at 47% of annual increment in 2010, which
was below the EU average of 59% (Figure 42), which is a reflection of the relatively young age of
Ireland’s forests in comparison to the rest of the Europe.
Figure 41. Felling volumes in the EU 28 (State of Europe’s Forests 2015).

Department of Agriculture, Food & the Marine
83
Figure 42. Harvest as a percentage of net annual increment (State of Europe’s Forests 2015).
9.4 European Forest Expansion Rate
According to the State of Europe’s Forests 2015 report, since 1990 Spain has had the greatest
annual expansion of forests at 184,000 ha, France at 102,000 ha and Turkey at 93,000 ha. The
annual rate of change, expressed as a percentage of total forest area is highest for Iceland (4.6%),
Ireland (2.0%) and Spain (1.2%) for the period 1990-2015 (Figure 43).
Figure 43. Annual % rate of change in forest area by country 1990-2015 (State of Europe’s
Forests 2015).

NOTES
____________________________________________________________________________
____________________________________________________________________________
____________________________________________________________________________
____________________________________________________________________________
____________________________________________________________________________
____________________________________________________________________________
____________________________________________________________________________
____________________________________________________________________________
____________________________________________________________________________
____________________________________________________________________________
____________________________________________________________________________
____________________________________________________________________________
____________________________________________________________________________
____________________________________________________________________________
____________________________________________________________________________
____________________________________________________________________________
____________________________________________________________________________
____________________________________________________________________________