Forest Products Floor Joists · PDF fileFloor joists are designed as single-span simply...
19
United States Department of Partially Agriculture Forest Service Forest Continuous Products Laboratory Research Floor Joists Paper Lawrence A. Soltis FPL 461
Transcript of Forest Products Floor Joists · PDF fileFloor joists are designed as single-span simply...
United States Department of PartiallyAgriculture
Forest Service
Forest Continuous Products Laboratory
Research Floor Joists Paper
Lawrence A. SoltisFPL 461
Abstract
Floor joists are designed as single-span simply supported beams. The feasibility of reducing joist size by forming partially continuous joists is reported. The partially continuous joists are formed by moment connections at the center support of a two-span beam. Three connection types were investigated: Truss plates, finger joints, and glued plywood side plates. Three sizes of joists-2 by 6, 2 by 8, and 2 by 10 and high and low density species-were included.
The results indicate it is feasible to develop partial continuity by a moment connection at the center support. However, specific design criteria cannot be made until connection design procedures are further developed.
Keywords: Beams, joists, timber construction, buildings, residential, connections, moment, truss plates, finger joints, plywood.
December 1985
Soltis, Lawrence A. Partially continuous floor joists. Res. Pap. FPL 461. Madison. WI: U.S. Department of Agriculture, Forest Service, Forest Products Laboratory; 1985. 16 p.
A limited number of free copies of this publication are available to the public from the Forest Products Laboratory, One Gifford Pinchot Drive, Madison, WI 53705-2398. Laboratory publications are sent to over 1,000 libraries in the United States and elsewhere.
The Laboratory is maintained in cooperation with the University of Wisconsin.
PartiallyContinuousFloor Joists1
Lawrence A. Soltis, Supervisory Research General Engineer Forest Products Laboratory, Madison, WI
Introduction
Floor joists are presently designed for strength and stiffness as single-span beams, simply supported and loaded with uniform dead and live loads. Joist stiffness often governs the design without the full strength of the joist being utilized. The joist stiffness could be increased if the single span could be made continuous by spanning floor joists over two or more spans. Thus, in residential construction where floor joists often consist of two simply supported spans, a reduction in joist size is feasible if the two simply supported spans could be moment connected to produce a two-span, continuous-floor joist. However, the additional cost of the moment connection must be less than the material savings from reducing the joist size or increasing joist spacing.
This study investigates the feasibility of continuous floor joists for residential construction. It was partially supported by the U.S. Department of Housing and Urban Development (HUD) whose objectives were to investigate arange of joint types, joist sizes, and species. Additionally HUD required off-the-shelf materials and normal work skills to insure that the performance observed from research results would be similar to that obtained in the residential construction market.
Three joint types were requested by HUD: (1) Truss plates, (2) finger joints, and (3) glued plywood side plates. Three joist sizes and species were tested: 2 by 6 Douglas Fir-Larch and Spruce-Pine-Fir; 2 by 8 Douglas Fir-Larch and Spruce-Pine-Fir; and 2 by 10 Douglas Fir-Larch and White Woods. White Woods includes a group of species as defined by the National Forest Products Association (NFPA) (1982).
1In cooperation with the U.S. Department of Housing and Urban Development.
Nailed side-plated joints were not included in this study. Preliminary analysis showed that the material required for the side plates would exceed the material savings of the joist.
Partial moment capacity was developed for the three joint types studied. A moment connection that attains full continuity is very difficult to fabricate due to the nature of timber members and their fasteners. There is slip between members connected with most currently used fasteners; thus, full moment capacity is not attained and only partial continuity is achievable.
The results of this study indicate that a high degree of continuity can be attained for floor joists subjected to design floor loads. However, a lower degree of continuity is attained at ultimate load levels. These pilot study results indicate partially continuous beams are feasible. However, the scope of work was limited and does not provide statistically valid recommendations, moment design procedures, and effects of longer term loading.
Past and Current Work
Stiffness design for floor systems is, in general, based on deflection criteria due to static uniform loads. A U.S. Department of Commerce (1973b) review of deflection criteria of national and international codes indicates most limit joist deflection to some proportion of span length when subjected to uniform static load. The most common criteria, and that specified by HUD (1973), is that maximum joist deflection is not to exceed the span/360 when subjected to static live load of 40 lb/ft2.
Floor design for both stiffness and strength requirements is based on individual floor joist design. Current design practice (NFPA 1982) considers the floor system rather than single joist response for the strength criterion by allowing an increase in bending stress for repetitive member use. It does not allow an increase for the stiffness criterion. Numerous analytic and experimental studies [American Plywood Association (APA) 1970; Corder and others 1975; McCutcheon 1977; Onysko 1970; Polensek and others 1972; Sliker 1972; Thomson and others 1975] attest to an increase in stiffness due to composite action of nailed and glued and nailed one- and two-layer subfloor systems. Load sharing of concentrated loads to adjacent joists (Polensek and others 1972; Sliker 1972, Williston and others 1962) and two-way plate action (Polensek and others 1972; Thomson and others 1975; Vanderbilt and others 1974) have also been recognized.
Several studies have shown increased stiffness of floor systems by using continuous spans. Hurst (1965) found two-span construction to reduce floor deflection by an average of 27 percent with a 10 percent increase in lumber for side-plated moment connections at the center supports. The National Association of Homebuilders (NAHB) (1961) found similar results for two-span construction with single-lapped moment connections. The APA (undated) increased stiffness using two-span construction consisting of acantilevered simple span spliced to a shorter simple span. The reverse curvature produced by the cantilever reduces adjacent midspan deflection. The NFPA (1973) presents two-span design tables for continuous members with no splices.
The aforementioned continuous beam studies considered nailed moment connected joints and were generally designed for moment capacity by considering allowable lateral nail resistances acting through some distance. No attempt was made to correlate the experimental deflection results to continuous beam theory.
The degree of continuity provided by a nailed moment connection is dependent on the nail slip. The use of linear or nonlinear load-slip data will influence the connection analysis. Kent and others (1966) developed design criteria for single-lapped, rotation-resistant joints based on a linear load-slip relationship. They found the loss of continuity at the joint was compensated for by the double stiffness of the lapped joint. Rodda (1967) incorporated joint slippage to modify the standard slope-deflection equations. His method used an iterative moment-rotation process based on nonlinear load-slip data. Boyd (1959) developed empirical moment-rotation equations based on limited tests of scale-modeled connections. Current design practice (Gurfinkel 1973) is based on linear relationships.
For joints subjected to combined moment, shear, and axial loads, Rodda (1967) found the effects of the shear and axial load can be neglected if moment is predominant.
Other types of joints are feasible to produce moment connections. Hugo and others (1977) studied the feasibility of end joining wooden beams with glued steel plates.
Truss plates have been used for transversely and axially loaded joints. Rodda’s (1967) theory is equally applicable to nailed or truss-plated joints based on the rotational slip of the joint. The Truss Plate Institute (TPI) (1978) and the American Society for Testing and Materials (ASTM) (1977) present methods for joint design based on shear resistance and tooth slip of the plate. Beineke (1974) has developed amathematical model of a semirigid truss-plated joint using the concept of a fictitious adhesive which mimics the slip of the joint.
Another joint included in this study is the finger joint. Primarily used for joining glued-laminated beam laminations, finger joints have also been used for comer joints in furniture (Richards 1962) and for rigid trusses (Hoyle and others 1973; Pincus and others 1966). The latter studies observe joints to be almost “fully” fixed. Pincus and others (1966) warns of calculating moments on an elastic basis if the joints fail inelastically, but neglects this as being on the conservative side.
The types of finger joints and their corresponding geometry and strength have been documented (Eby 1968; Richards 1963; Selbo 1963). As the primary use has been in laminated beams, most of the studies on finger joints relate to tension or flatwise bending (Bolger and others 1962; Moody’ 1971; Porter and others 1972; Strickler and others 1970). Currently finger joints are designed to meet the strength and quality control requirements of the U.S. Department of Commerce Voluntary Product Standard PS 56-73 (1973a) and the American Institute of Timber Construction (AITC) Inspection Manual 200-63 (1963).
Glued plywood side plates are another type of joint included in this study. Previous research has shown that properly applied adhesives are generally stronger than the wood they bond (Doyle 1964; River and others 1981; Zoring and others 1974). Failures are generally rolling shear in the plywood side plates.
1Moody, R. C. Evaluation of finger-jointed Douglas-fir 2 by 6’s in tension and bending. Unpublished report on file at the Forest Products Laboratory, Madison, WI; 1970.
2
- - - - - - - - - -
Methods and Results
The study had three phases. Phase 1 included basic property tests for modulus of elasticity, specific gravity, and moisture content. These data were used to assign test specimens to fastener groupings for Phases 2 and 3. Phase 2 consisted of tests on single-span beams, simply supported and loaded by third-point concentrated loads to produce pure bending. Nondestructive loads were first applied to the simple spans; then joints were inserted at midspan and the specimens were loaded to their ultimate capacity. The objective was to gather data on strength and stiffness of joints subjected to pure moment. Phase 3 consisted of tests on two-span beams with a moment-connected joint at the center support and loaded by uniformly distributed load. The objective was to simulate end-use joist construction and observe continuous-span performance.
MaterialsA premise of the study was to use off-the-shelf materials
and normal work skills. Thus materials were acquired locally on an “as is” basis.
Two groups of lumber were selected to represent high and low specific gravity materials. The high specific gravity lumber was No. 2 and better Douglas Fir-Larch for all three sizes, 2 by 6, 2 by 8, and 2 by 10. The low specific gravity lumber was No. 2 and better Spruce-Pine-Fir for the 2 by 6 and 2 by 8 sizes and White Woods for the 2 by 10 size. Two combinations of species were required for the lowspecific gravity lumber because of local availability.
Five replications were tested for each combination of size, species, and joint type in Phases 2 and 3. Sixteen-foot-long pieces were used in Phase 2 for a 15-foot simple span. Twelve-, fourteen-, and sixteen-foot-long pieces were used in each of the two spans in Phase 3 resulting in two-span total lengths of 22, 26, and 30 feet for the 2 by 6, 2 by 8, and 2 by 10 sizes, respectively.
Three joint types were tested-truss plate, finger joint, and glued plywood side-plated connections.
The truss plates were commercially available 16-gauge plates conforming to ASTM A-446 (Structural Quality) Grade A steel. Truss plate teeth were 0.41 inch long and 0.15 inch wide with 4.8 teeth/in2 of plate.
The truss plates were only approximately sized since there is no commonly accepted design method for truss plates subjected to moment. Manufacturers’ axial load plate ratings were used for stresses at the extreme fibers. Linear and plastic stress distributions resulted in two different plate sizes when equating the internal bending couple to the moment capacity of the joists. An “in-between” rounded-off value was then used to size the plates. Only one size plate was tested in this pilot study for each species-size joist combination (table 1). Joints were fabricated with plates on both sides of the member.
The finger joints were commercially fabricated with the finger joint profile appearing on the wide face of the lumber and conforming to American National Standards Institute Voluntary Product Standard PS 56-73 (U.S. Department of Commerce 1973a).
The glued side-plated connections consisted of 1/2-inch, 5-ply CDX plywood glued with face grain parallel to joist direction. The glue was phenol-resorcinol. Assembly consisted of a double-spread application (assembly time =30 min) followed by an overnight cure under 150 to 175 lb/in2 pressure. Joints had plates on both sides of the member.
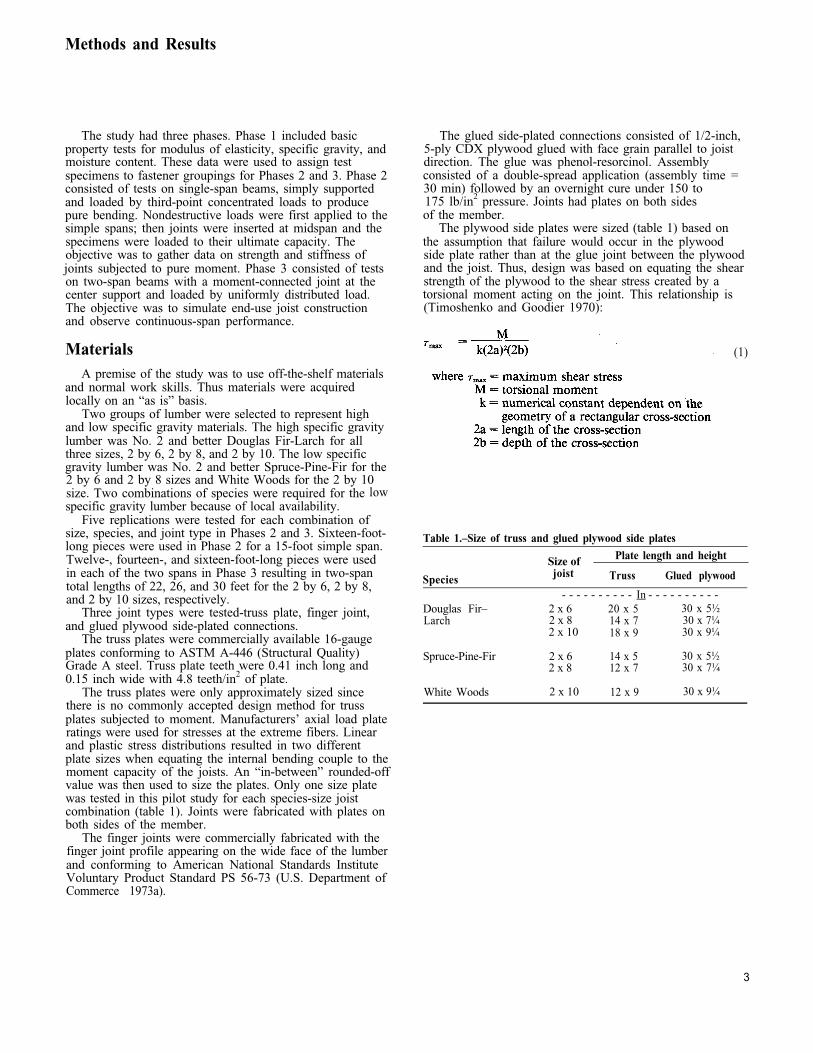
The plywood side plates were sized (table 1) based on the assumption that failure would occur in the plywood side plate rather than at the glue joint between the plywood and the joist. Thus, design was based on equating the shear strength of the plywood to the shear stress created by atorsional moment acting on the joint. This relationship is (Timoshenko and Goodier 1970):
(1)
Table 1.–Size of truss and glued plywood side plates
Size of Plate length and height
Species joist Truss Glued plywood
In - - - - - - - - - -Douglas Fir– 2 x 6 20 x 5 30 x 5½ Larch 2 x 8 14 x 7 30 x 7¼
2 x 10 18 x 9 30 x 9¼
Spruce-Pine-Fir 2 x 6 14 x 5 30 x 5½ 2 x 8 12 x 7 30 x 7¼
White Woods 2 x 10 12 x 9 30 x 9¼
3
Phase 1The specific gravity and modulus of elasticity (MOE)
were determined for all lumber. Specific gravity was determined from weight and volume measurements of each piece. The modulus of elasticity was the average MOE for the entire length of piece determined by flatwise bending in a commercial tester. The commercial tester, an E-computer, computes the dynamic MOE by measuring its mass on one end during a period of vibration. MOE was not corrected for span-depth ratio or moisture content; these small effects were not deemed important for this pilot study.
The pieces were ordered by MOE and assigned to one of the three joint types for Phase 2 and 3 testing (table 2). The assignments were intended to minimize the variability by testing groups of specimens with similar MOE’s,
The moisture content was determined by moisture meter at various times during testing. Values ranged from 8 to 14 percent for the Douglas Fir-Larch; 7 to 9 percent for the Spruce-Pine-Fir; and 6 to 9 percent for the White Woods. The wider variation in the Douglas Fir-Larch was size related; the 2 by 6 and 2 by 8’s were in the 8 to 10 percent range while the 2 by 10’s were in the 11 to 14 percent range.
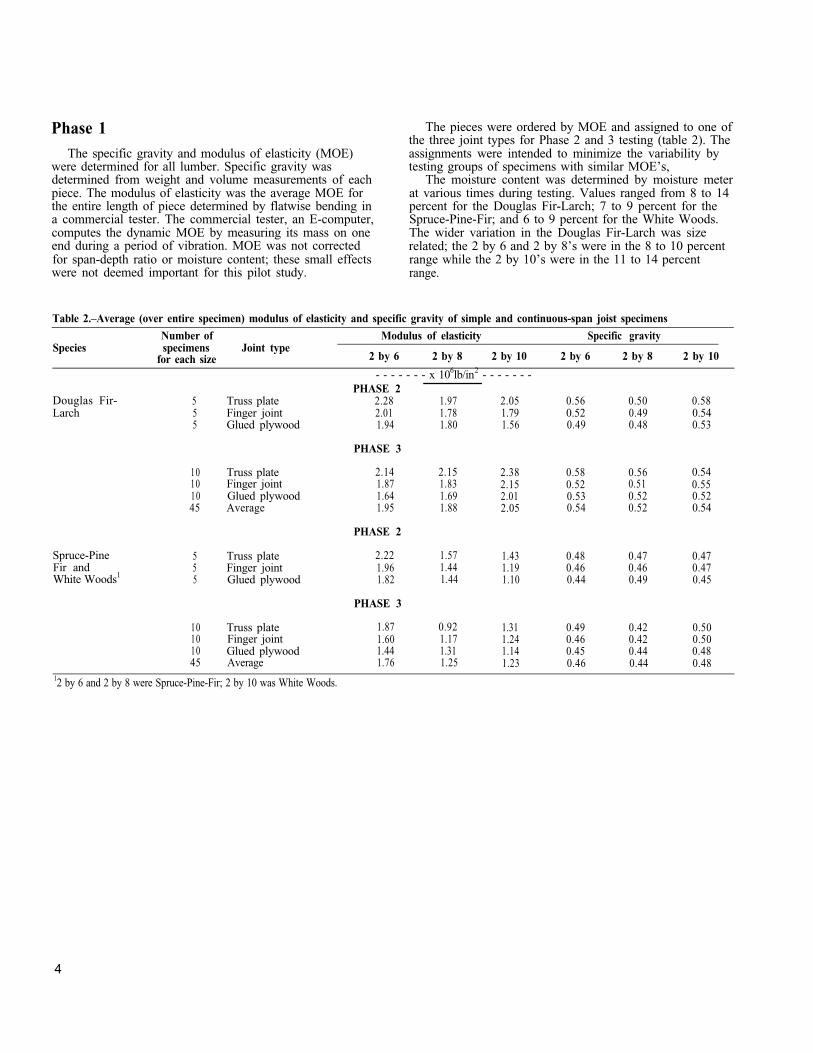
Table 2.–Average (over entire specimen) modulus of elasticity and specific gravity of simple and continuous-span joist specimens
Number of Modulus of elasticity Specific gravity Species specimens Joint type
for each size 2 by 6 2 by 8 2 by 10 2 by 6 2 by 8 2 by 10
Douglas Fir-Larch
555
Truss plate Finger joint Glued plywood
Truss plate Finger jointGlued plywood Average
Truss plate Finger joint Glued plywood
Truss plate Finger joint Glued plywood Average
- - - - - - - x 106lb/in2 - - - - - - -PHASE 2
2.28 1.97 2.052.01 1.78 1.791.94 1.80 1.56
0.56 0.50 0.580.52 0.49 0.540.49 0.48 0.53
PHASE 3
2.14 2.15 2.38 0.58 0.56 0.541.87 1.83 2.15 0.52 0.51 0.551.64 1.69 2.01 0.53 0.52 0.521.95 1.88 2.05 0.54 0.52 0.54
PHASE 2
2.22 1.57 1.43 0.48 0.47 0.471.96 1.44 1.19 0.46 0.46 0.471.82 1.44 1.10 0.44 0.49 0.45
PHASE 3
1.87 0.92 1.31 0.49 0.42 0.501.60 1.17 1.24 0.46 0.42 0.501.44 1.31 1.14 0.45 0.44 0.481.76 1.25 1.23 0.46 0.44 0.48
10101045
555
Spruce-PineFir and White Woods1
10101045
12 by 6 and 2 by 8 were Spruce-Pine-Fir; 2 by 10 was White Woods.
4
- - - - - - - - - - - -
Phase 2Phase 2 tests were to determine joint strength and
stiffness when subjected to pure moment. Nondestructive third-point loads were first applied to simple-supported, 15-foot-span specimens; then joints were inserted at midspan and the specimens were loaded to their ultimate capacity. The load was deformation controlled at a rate of 0.3 in/min. Tests were conducted in an interior noncontrolled environment.
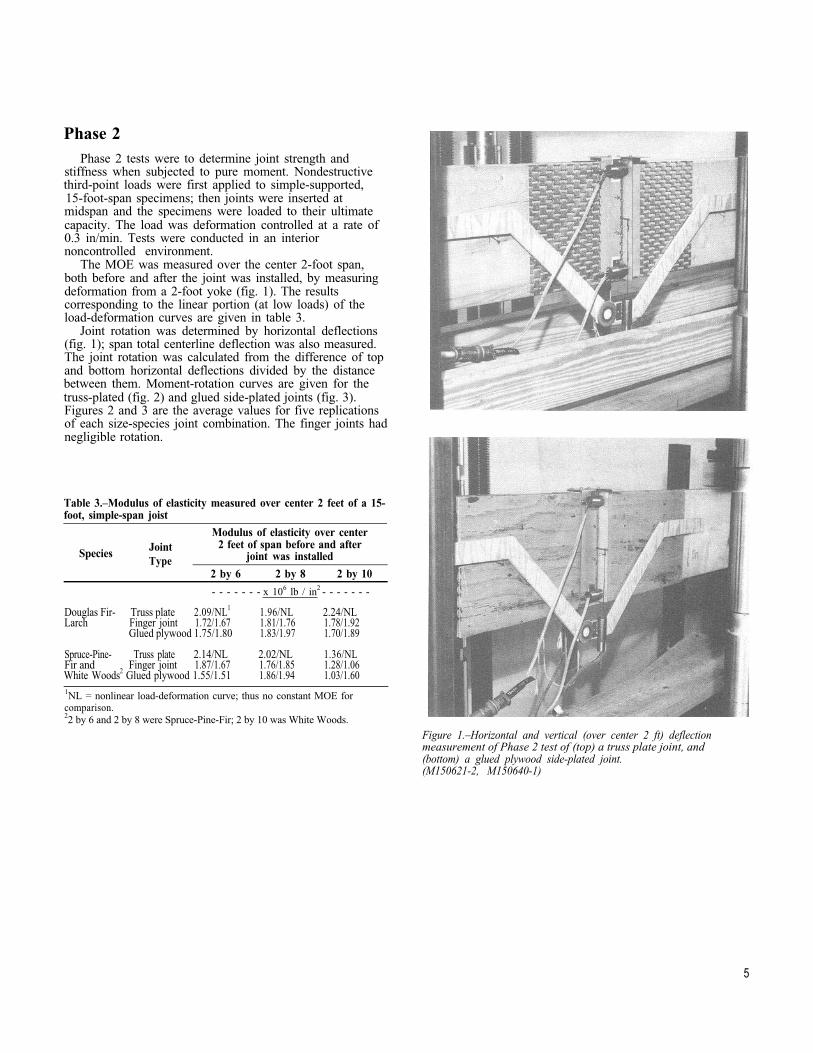
The MOE was measured over the center 2-foot span, both before and after the joint was installed, by measuring deformation from a 2-foot yoke (fig. 1). The results corresponding to the linear portion (at low loads) of the load-deformation curves are given in table 3.
Joint rotation was determined by horizontal deflections (fig. 1); span total centerline deflection was also measured. The joint rotation was calculated from the difference of top and bottom horizontal deflections divided by the distance between them. Moment-rotation curves are given for the truss-plated (fig. 2) and glued side-plated joints (fig. 3). Figures 2 and 3 are the average values for five replications of each size-species joint combination. The finger joints had negligible rotation.
Table 3.–Modulus of elasticity measured over center 2 feet of a 15-foot, simple-span joist
Modulus of elasticity over center Joint 2 feet of span before and after
SpeciesType joint was installed
2 by 6 2 by 8 2 by 10
Douglas Fir- Truss plate 2.09/NL1
Larch Finger joint 1.72/1.67Glued plywood 1.75/1.80
Spruce-Pine- Truss plate 2.14/NLFir and Finger joint 1.87/1.67White Woods2 Glued plywood 1.55/1.51
- x 106 lb / in2 -
1.96/NL 2.24/NL1.81/1.76 1.78/1.921.83/1.97 1.70/1.89
2.02/NL 1.36/NL1.76/1.85 1.28/1.061.86/1.94 1.03/1.60
1NL = nonlinear load-deformation curve; thus no constant MOE for comparison. 22 by 6 and 2 by 8 were Spruce-Pine-Fir; 2 by 10 was White Woods.
Figure 1.–Horizontal and vertical (over center 2 ft) deflection measurement of Phase 2 test of (top) a truss plate joint, and (bottom) a glued plywood side-plated joint. (M150621-2, M150640-1)
5
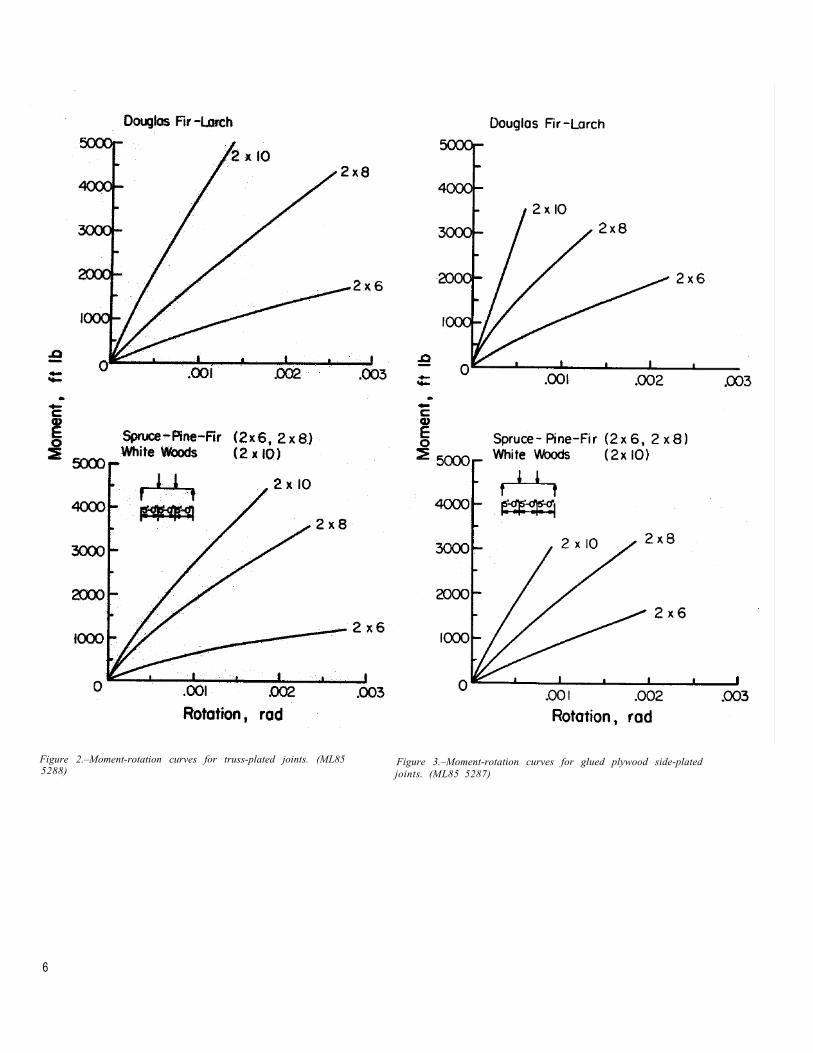
Figure 2.–Moment-rotation curves for truss-plated joints. (ML85 Figure 3.–Moment-rotation curves for glued plywood side-plated5288) joints. (ML85 5287)
6
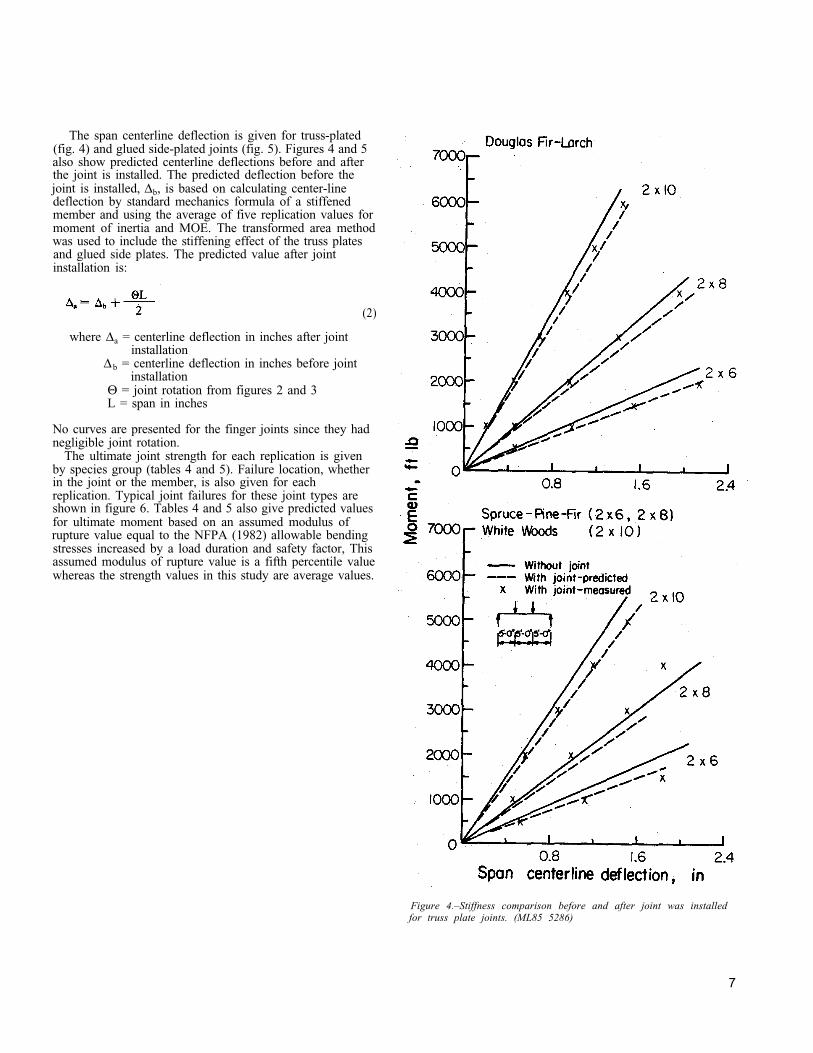
The span centerline deflection is given for truss-plated (fig. 4) and glued side-plated joints (fig. 5). Figures 4 and 5 also show predicted centerline deflections before and after the joint is installed. The predicted deflection before the joint is installed, ∆b, is based on calculating center-line deflection by standard mechanics formula of a stiffened member and using the average of five replication values for moment of inertia and MOE. The transformed area method was used to include the stiffening effect of the truss plates and glued side plates. The predicted value after joint installation is:
(2)
where ∆a = centerline deflection in inches after joint installation
∆ b = centerline deflection in inches before joint installation
Θ = joint rotation from figures 2 and 3 L = span in inches
No curves are presented for the finger joints since they had negligible joint rotation.
The ultimate joint strength for each replication is given by species group (tables 4 and 5). Failure location, whether in the joint or the member, is also given for each replication. Typical joint failures for these joint types are shown in figure 6. Tables 4 and 5 also give predicted values for ultimate moment based on an assumed modulus of rupture value equal to the NFPA (1982) allowable bending stresses increased by a load duration and safety factor, This assumed modulus of rupture value is a fifth percentile value whereas the strength values in this study are average values.
Figure 4.–Stiffness comparison before and after joint was installed for truss plate joints. (ML85 5286)
7
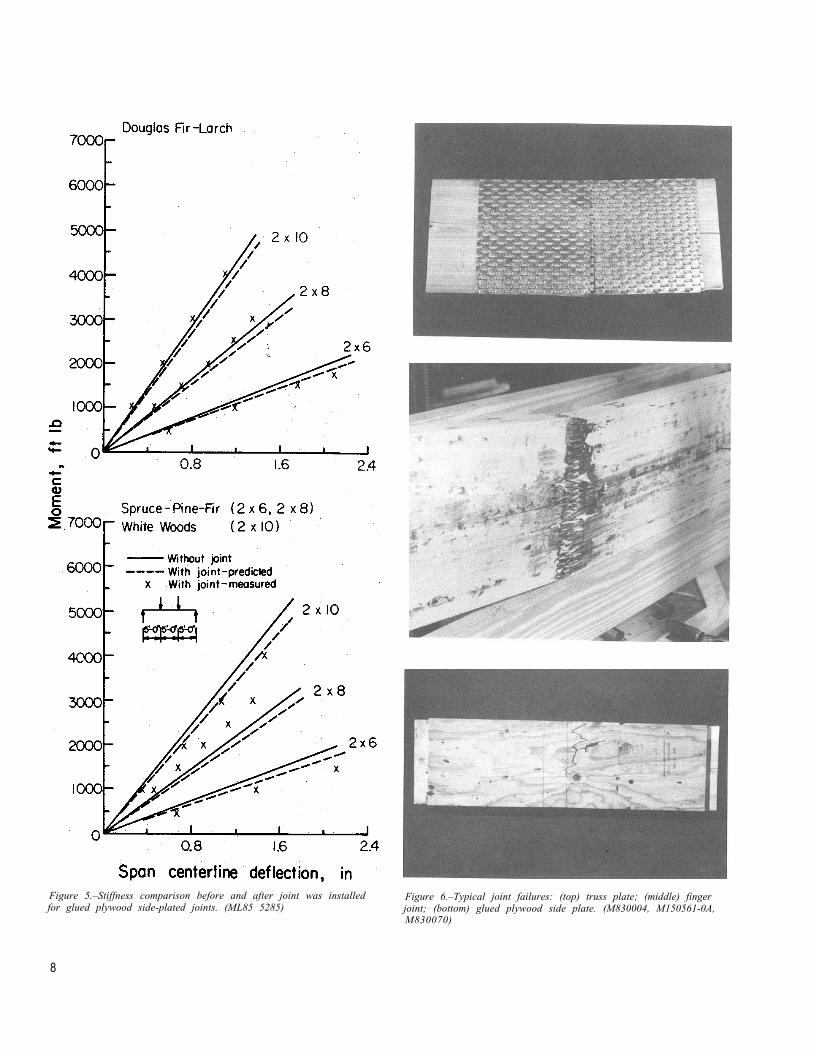
Figure 5.–Stiffness comparison before and after joint was installed Figure 6.–Typical joint failures: (top) truss plate; (middle) finger for glued plywood side-plated joints. (ML85 5285) joint; (bottom) glued plywood side plate. (M830004, M150561-0A,
M830070)
8
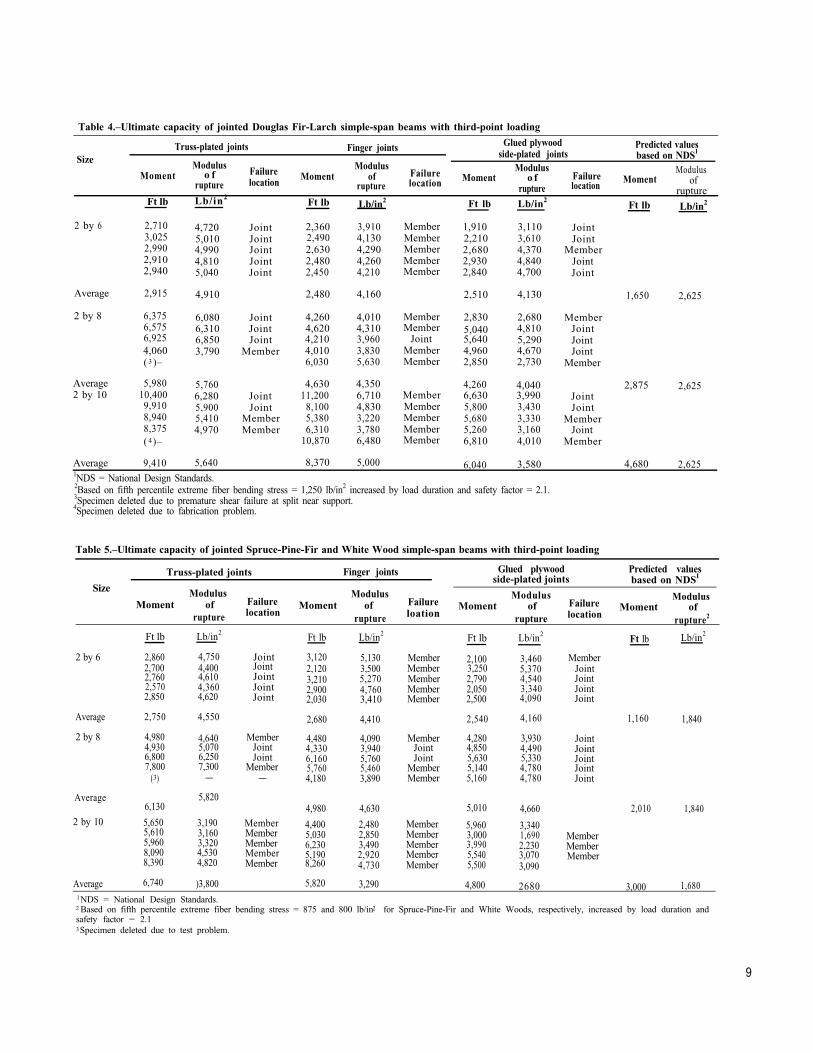
Table 4.–Ultimate capacity of jointed Douglas Fir-Larch simple-span beams with third-point loading
Glued plywood Predicted valuesTruss-plated joints Finger joints side-plated joints based on NDS1
Size Modulus Modulus Modulus ModulusMoment o f of Failure o f Failure Moment oflocationrupture
Failure Momentrupture location Moment
rupture location ruptureFt lb Lb/in2
Ft lb Lb/in2 Ft lb Lb/in2Ft lb Lb/in2
2 by 6 2,7103,0252,9902,9102,940
4,720 Joint 3,910 Member2,3602,4902,630
1,910 3,110 Joint2,210 3,610 Joint2,680 4,370 Member2,930 4,840 Joint2,840 4,700 Joint
4,130 Member4,290 Member
5,010 Joint4,990 Joint4,810 Joint 2,480 4,260 Member5,040 Joint 2,450 4,210 Member
4,910 2,480 4,160
6,080 Joint 4,260 4,010 Member6,310 Joint 4,620
Average 2,915
2 by 8 6,3756,5756,9254,060( 3 )–
2,510 4,130 1,650 2,625
2,830 2,680 Member4,810 Joint5,290 Joint4,670 Joint2,730 Member
4,310 Member 5,0405,6404,9602,850
4,210 Joint3,9606,850 JointMember 4,010 3,830 Member
6,030 5,630 Member3,790
Average 5,980 5,760 4,630 4,350 4,260 4,0402 by 10 10,400 6,280 Joint 11,200 6,710 Member 6,630 3,990 Joint
9,910 5,900 Joint 8,100 4,830 Member 5,800 3,430 Joint8,940 5,410 Member 5,380 3,220 Member 5,680 3,330 Member8,375 4,970 Member 6,310 3,780 Member 5,260 3,160 Joint( 4)– 10,870 6,480 Member 6,810 4,010 Member
2,875 2,625
Average 9,410 5,640 8,370 5,000 6,040 3,580 4,680 2,6251NDS = National Design Standards.2Based on fifth percentile extreme fiber bending stress = 1,250 lb/in2 increased by load duration and safety factor = 2.1.3Specimen deleted due to premature shear failure at split near support.4Specimen deleted due to fabrication problem.
Table 5.–Ultimate capacity of jointed Spruce-Pine-Fir and White Wood simple-span beams with third-point loading
Glued plywood Predicted valuesTruss-plated joints Finger joints side-plated joints based on NDS1
Size Modulus Modulus Modulus ModulusMoment of Failure Moment of Failure Moment of Failure Moment of
rupture locationrupture loation rupture location rupture2
Ft lb Lb/in2 Ft lb Lb/in2 Ft lb Lb/in2Ft lb Lb/in2
2 by 6 2,8602,7002,7602,5702,850
4,7504,4004,6104,3604,620
JointJointJointJointJoint
3,1202,1203,2102,9002,030
5,1303,5005,2704,7603,410
MemberMemberMemberMemberMember
2,1003,2502,7902,0502,500
3,4605,3704,5403,3404,090
MemberJointJointJointJoint
Average 2,750 4,550 2,680 4,410 2,540 4,160 1,160 1,840
2 by 8 4,9804,9306,8007,800
4,6405,0706,2507,300
MemberJointJoint
Member
4,4804,3306,1605,760
4,0903,9405,7605,460
MemberJointJoint
Member
4,2804,8505,6305,140
3,9304,4905,3304,780
JointJointJointJoint
(3) — — 4,180 3,890 Member 5,160 4,780 Joint
Average6,130
5,8204,980 4,630 5,010 4,660 2,010 1,840
2 by 10 5,6505,6105,9608,0908,390
3,1903,1603,3204,5304,820
MemberMemberMemberMemberMember
4,4005,0306,2305,1908,260
2,4802,8503,4902,9204,730
MemberMemberMemberMemberMember
5,9603,0003,9905,5405,500
3,3401,6902,2303,0703,090
MemberMemberMember
Average 6,740 )3,800 5,820 3,290 4,800 2680 3,000 1,6801NDS = National Design Standards. 2 Based on fifth percentile extreme fiber bending stress = 875 and 800 lb/in2
safety factor = 2.1 3Specimen deleted due to test problem.
for Spruce-Pine-Fir and White Woods, respectively, increased by load duration and
9
Phase 3
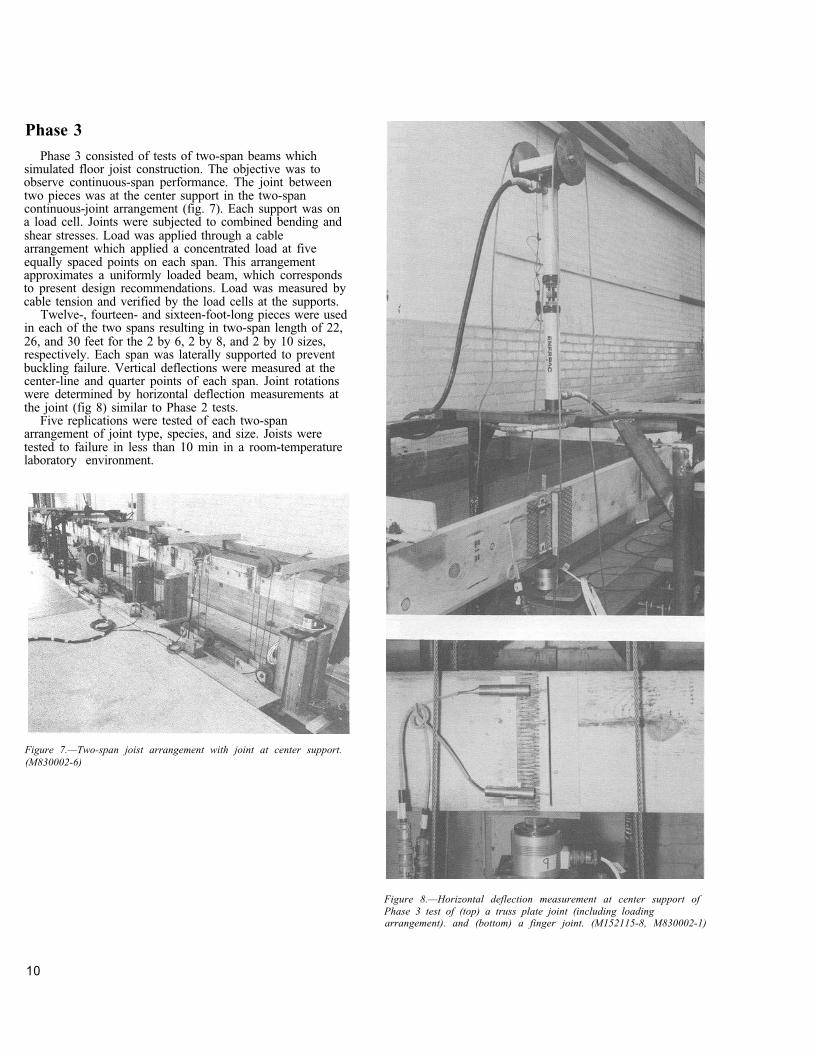
Phase 3 consisted of tests of two-span beams which simulated floor joist construction. The objective was to observe continuous-span performance. The joint between two pieces was at the center support in the two-span continuous-joint arrangement (fig. 7). Each support was on a load cell. Joints were subjected to combined bending and shear stresses. Load was applied through a cable arrangement which applied a concentrated load at five equally spaced points on each span. This arrangement approximates a uniformly loaded beam, which corresponds to present design recommendations. Load was measured by cable tension and verified by the load cells at the supports.
Twelve-, fourteen- and sixteen-foot-long pieces were used in each of the two spans resulting in two-span length of 22, 26, and 30 feet for the 2 by 6, 2 by 8, and 2 by 10 sizes, respectively. Each span was laterally supported to prevent buckling failure. Vertical deflections were measured at the center-line and quarter points of each span. Joint rotations were determined by horizontal deflection measurements at the joint (fig 8) similar to Phase 2 tests.
Five replications were tested of each two-span arrangement of joint type, species, and size. Joists were tested to failure in less than 10 min in a room-temperature laboratory environment.
Figure 7.—Two-span joist arrangement with joint at center support. (M830002-6)
Figure 8.—Horizontal deflection measurement at center support of Phase 3 test of (top) a truss plate joint (including loading arrangement). and (bottom) a finger joint. (M152115-8, M830002-1)
10
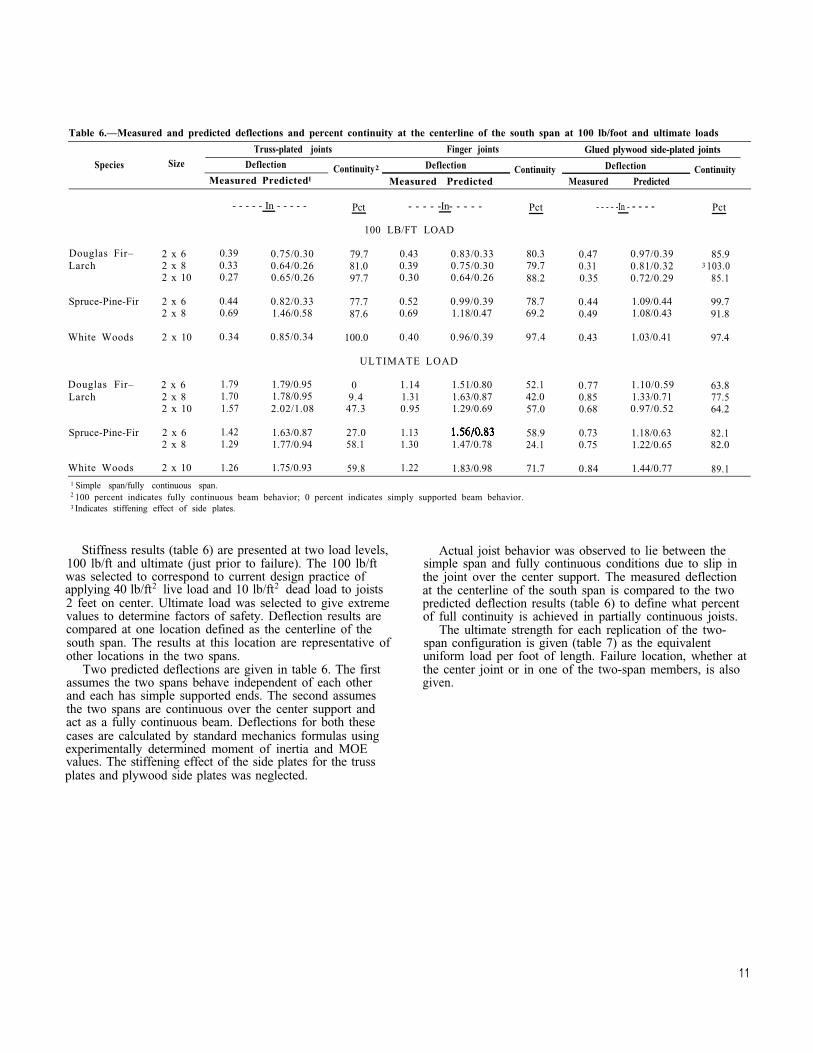
Table 6.—Measured and predicted deflections and percent continuity at the centerline of the south span at 100 lb/foot and ultimate loads
Truss-plated joints Finger joints Glued plywood side-plated joints
Species Size Deflection Continuity2 Deflection Continuity Deflection ContinuityMeasured Predicted1 Measured Predicted Measured Predicted
- - - - - In - - - - - Pct - - - - -In- - - - - Pct - - - - -In - - - - - Pct
100 LB/FT LOAD
Douglas Fir– 2 x 6 0.39 0.75/0.30 79.7 0.43 0.83/0.33 80.3 0.47 0.97/0.39 85.9Larch 2 x 8 0.33 0.64/0.26 81.0 0.39 0.75/0.30 79.7 0.31 0.81/0.32 3 103.0
2 x 10 0.27 0.65/0.26 97.7 0.30 0.64/0.26 88.2 0.35 0.72/0.29 85.1
Spruce-Pine-Fir 2 x 6 0.44 0.82/0.33 77.7 0.52 0.99/0.39 78.7 0.44 1.09/0.44 99.72 x 8 0.69 1.46/0.58 87.6 0.69 1.18/0.47 69.2 0.49 1.08/0.43 91.8
White Woods 2 x 10 0.34 0.85/0.34 100.0 0.40 0.96/0.39 97.4 0.43 1.03/0.41 97.4
ULTIMATE LOAD
Douglas Fir– 2 x 6 1.79 1.79/0.95 0 1.14 1.51/0.80 52.1 0.77 1.10/0.59 63.8Larch 2 x 8 1.70 1.78/0.95 9.4 1.31 1.63/0.87 42.0 0.85 1.33/0.71 77.5
2 x 10 1.57 2.02/1.08 47.3 0.95 1.29/0.69 57.0 0.68 0.97/0.52 64.2
Spruce-Pine-Fir 2 x 6 1.42 1.63/0.87 27.0 1.13 58.9 0.73 1.18/0.63 82.12 x 8 1.29 1.77/0.94 58.1 1.30 1.47/0.78 24.1 0.75 1.22/0.65 82.0
White Woods 2 x 10 1.26 1.75/0.93 59.8 1.22 1.83/0.98 71.7 0.84 1.44/0.77 89.11 Simple span/fully continuous span. 2 100 percent indicates fully continuous beam behavior; 0 percent indicates simply supported beam behavior. 3 Indicates stiffening effect of side plates.
Stiffness results (table 6) are presented at two load levels, 100 lb/ft and ultimate (just prior to failure). The 100 lb/ft was selected to correspond to current design practice of applying 40 lb/ft2 live load and 10 lb/ft2 dead load to joists 2 feet on center. Ultimate load was selected to give extreme values to determine factors of safety. Deflection results are compared at one location defined as the centerline of the south span. The results at this location are representative of other locations in the two spans.
Two predicted deflections are given in table 6. The first assumes the two spans behave independent of each other and each has simple supported ends. The second assumes the two spans are continuous over the center support and act as a fully continuous beam. Deflections for both these cases are calculated by standard mechanics formulas using experimentally determined moment of inertia and MOE values. The stiffening effect of the side plates for the truss plates and plywood side plates was neglected.
Actual joist behavior was observed to lie between the simple span and fully continuous conditions due to slip in the joint over the center support. The measured deflection at the centerline of the south span is compared to the two predicted deflection results (table 6) to define what percent of full continuity is achieved in partially continuous joists.
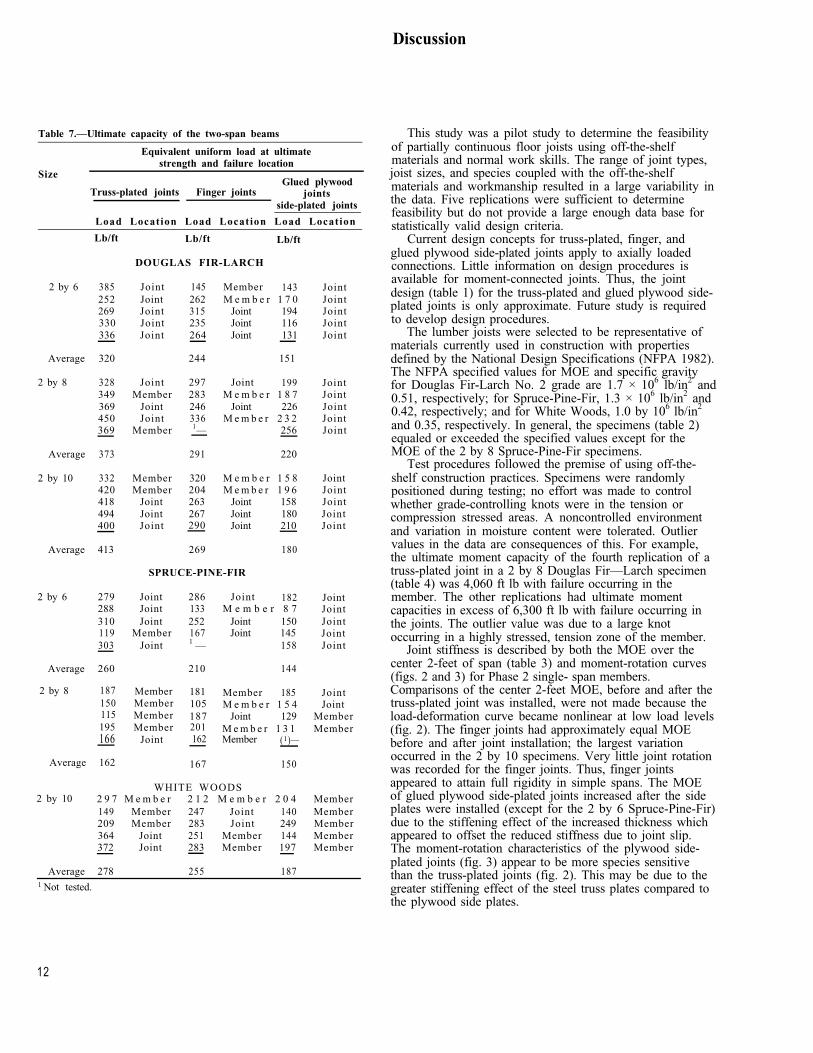
The ultimate strength for each replication of the two-span configuration is given (table 7) as the equivalent uniform load per foot of length. Failure location, whether at the center joint or in one of the two-span members, is also given.
11
Discussion
Table 7.—Ultimate capacity of the two-span beams
Equivalent uniform load at ultimate strength and failure location
SizeGlued plywood
Truss-plated joints Finger joints jointsside-plated joints
Load Location Load Location Load Location
Lb/ft Lb/ft Lb/ft
DOUGLAS FIR-LARCH
2 by 6 385 Joint 145 Member 143 Joint252 Joint 262 M e m b e r 1 7 0 Joint269 Joint 315 Joint 194 Joint330 Joint 235 Joint 116 Joint336 Joint 264 Joint 131 Joint
Average 320 244 151
2 by 8 328 Joint 297 Joint 199 Joint349 Member 283 M e m b e r 1 8 7 Joint369 Joint 246 Joint 226 Joint450 Joint 336 M e m b e r 2 3 2 Joint369 Member 1— 256 Joint
Average 373 291 220
2 by 10 332 Member 320 M e m b e r 1 5 8 Joint420 Member 204 M e m b e r 1 9 6 Joint418 Joint 263 Joint 158 Joint494 Joint 267 Joint 180 Joint400 Joint 290 Joint 210 Joint
Average 413 269 180
SPRUCE-PINE-FIR
2 by 6 279 Joint 286 Joint 182 Joint288 Joint 133 M e m b e r 8 7 Joint310 Joint 252 Joint 150 Joint119 Member 167 Joint 145 Joint303 Joint 1 — 158 Joint
Average 260 210 144
2 by 8 187 Member 181 Member 185 Joint150 Member 105 M e m b e r 1 5 4 Joint115 Member 187 Joint 129 Member195 Member 201 M e m b e r 1 3 1 Member166 Joint 162 Member (1)—
Average 162 167 150
WHITE WOODS 2 by 10 2 9 7 M e m b e r 2 1 2 M e m b e r 2 0 4 Member
149 Member 247 Joint 140 Member209 Member 283 Joint 249 Member364 Joint 251 Member 144 Member372 Joint 283 Member 197 Member
Average 278 255 1871 Not tested.
This study was a pilot study to determine the feasibility of partially continuous floor joists using off-the-shelf materials and normal work skills. The range of joint types, joist sizes, and species coupled with the off-the-shelf materials and workmanship resulted in a large variability in the data. Five replications were sufficient to determine feasibility but do not provide a large enough data base for statistically valid design criteria.
Current design concepts for truss-plated, finger, and glued plywood side-plated joints apply to axially loaded connections. Little information on design procedures is available for moment-connected joints. Thus, the joint design (table 1) for the truss-plated and glued plywood side-plated joints is only approximate. Future study is required to develop design procedures.
The lumber joists were selected to be representative of materials currently used in construction with properties defined by the National Design Specifications (NFPA 1982). The NFPA specified values for MOE and specific gravity for Douglas Fir-Larch No. 2 grade are 1.7 × 10⁶ lb/in2 and 0.51, respectively; for Spruce-Pine-Fir, 1.3 × 10⁶ lb/in2 and 0.42, respectively; and for White Woods, 1.0 by 106 lb/in2
and 0.35, respectively. In general, the specimens (table 2) equaled or exceeded the specified values except for the MOE of the 2 by 8 Spruce-Pine-Fir specimens.
Test procedures followed the premise of using off-the-shelf construction practices. Specimens were randomly positioned during testing; no effort was made to control whether grade-controlling knots were in the tension or compression stressed areas. A noncontrolled environment and variation in moisture content were tolerated. Outlier values in the data are consequences of this. For example, the ultimate moment capacity of the fourth replication of atruss-plated joint in a 2 by 8 Douglas Fir—Larch specimen (table 4) was 4,060 ft lb with failure occurring in the member. The other replications had ultimate moment capacities in excess of 6,300 ft lb with failure occurring in the joints. The outlier value was due to a large knot occurring in a highly stressed, tension zone of the member.
Joint stiffness is described by both the MOE over the center 2-feet of span (table 3) and moment-rotation curves (figs. 2 and 3) for Phase 2 single- span members. Comparisons of the center 2-feet MOE, before and after the truss-plated joint was installed, were not made because the load-deformation curve became nonlinear at low load levels (fig. 2). The finger joints had approximately equal MOE before and after joint installation; the largest variation occurred in the 2 by 10 specimens. Very little joint rotation was recorded for the finger joints. Thus, finger joints appeared to attain full rigidity in simple spans. The MOE of glued plywood side-plated joints increased after the side plates were installed (except for the 2 by 6 Spruce-Pine-Fir) due to the stiffening effect of the increased thickness which appeared to offset the reduced stiffness due to joint slip. The moment-rotation characteristics of the plywood side-plated joints (fig. 3) appear to be more species sensitive than the truss-plated joints (fig. 2). This may be due to the greater stiffening effect of the steel truss plates compared to the plywood side plates.
12
Overall simple-span joist stiffness before and after the joint was installed is compared in figures 4 and 5. For all size joists, for both truss- and glued side-plated connections, the predicted centerline deflections based on the moment-rotation curves (figs. 2 and 3) are larger after the joint was installed than before. The measured and predicted centerline deflection agree reasonably well for the 2 by 6 and 2 by 10 sizes. Agreement for the 2 by 8 size for the Spruce-Pine-Fir species was not as good. The MOE of 2 by 8 Spruce-Pine-Fir specimens has already been noted as being low (table 2); the material was observed to have alarge number of grade-controlling knots. The truss and plywood side plates appear to have locally stiffened these specimens by covering the knots; thus using a low MOE results in larger predicted centerline deflection before and after joint installation than was measured in the locally stiffened specimens.
The ultimate moment capacity of the jointed simple span exceeded that predicted for an unjoined member in all cases (tables 4 and 5). The predicted values already include a combined duration of load and safety factor of 2.1 and astatistical factor to reduce average values to fifth percentile values. The ultimate capacities exceeded these predicted values from about 1.5 to 2.5 times; thus, factors of safety on strength between ultimate average values and allowable fifth percentile values range from about 3 to 5.
The joint failures were typical for each connection type. Truss plate failures (fig. 6a) began as ruptures in the truss plate in the extreme tension stress zone; the neutral axis then shifted towards the compression zone with further tensile rupturing in the plate followed by buckling of the plate in the extreme compression stress area resulting in plate failure. When finger joint failures occurred (fig. 6b), they were similar to truss plate failures. Initial failure occurred in the teeth or glueline in the extreme tension stress area followed by the neutral axis shifting towards the compression stress zone until the joint failed. The plywood side plate failed in rolling shear (highlighted in fig. 6c).
One would expect an equal number of failures to occur in the joint and in the member if the joint was designed to have the same strength as the member. Truss-plated joints for the 2 by 6 size in both species bad all failures (tables 4 and 5) occurring in the joints which implies these joints may have been underdesigned. On the other hand, the 2 by 10 Spruce-Pine-Fir had all failures occurring in the member which implies these may have been over- designed. It appears the elementary design approach used is not applicable for truss plate design.
Out of 30 finger joints, only 3 failures occurred in the joints (tables 4 and 5); the remaining were member failures. Member failures usually began at a knot in the extreme tension stress area. One would expect most failures to occur in the member since knots are not allowed in the vicinity of finger joints. However, for a higher grade material containing fewer defects, one would expect more joint failures.
Failures of the plywood side-plated joints are distributed between the member and the joints except for the 2 by 8Spruce-Pine-Fir specimens where all failures occurred in the plywood side plates. These specimens, again, had low MOE’s; thus, the stiffer side plate provided most of the resistance resulting in failure. It appears the design approach for moment based on rolling shear strength of the plywood is an acceptable method if the 2 by 8 Spruce-Pine-Fir results are neglected. (However, as discussed later, the design approach should be modified to include shear effects.)
The performances of two-span joists are given at two load levels. The first corresponds to a design-allowable load based on NDS recommendations; the second corresponds to ultimate load. The measured and predicted centerline deflections of one span are used to define the percent of full continuity achieved by each joint type (table 6). The truss-plated joints at allowable load achieved from 77.7 to 100 percent of full continuity. Within this range, the 2 by 6 size in both species had the lowest continuity values while the 2by 10 size in both species had the highest. This may be related to the design procedure; the 2 by 6 truss-plated joints appeared to be underdesigned while the 2 by 10 joints overdesigned. It should also be noted that larger deflections occurred in the 2 by 8 Spruce-Pine-Fir specimens which had low MOE values. At ultimate load, the truss-plated joints lost much of the continuity value; this was again more pronounced in the 2 by 6 than the 2 by 10 size.
The finger joints at allowable load achieved from 69.2 to 97.4 percent continuity (table 6). The lowest value was for the low MOE 2 by 8 Spruce- Pine-Fir specimens. Overall the percent continuity is lower than would be expected from the results of the simple-span (Phase 2) tests. The simple- span tests showed virtually no rotation in the joint indicating 100 percent continuity. These contradictory results may be caused by the joint location. The joint was located over a support in the continuous beam tests and at midspan in the simple-span tests. This presents two possible explanations. The first is the combined effect of moment and shear. The continuous beam joint was at both the maximum moment and maximum shear location whereas it was at a zero shear location in the simple span. The second explanation is that the support reaction of the continuous beam may have induced a stress concentration by not allowing vertical movement of the member as in the simple-span situation. At ultimate load, the finger joints had a further loss in the continuity value.
The plywood side-plated joints at allowable load achieved from 85.1 to 103.0 percent of full continuity. It is possible to have more than 100 percent continuity because the stiffening effect of the side plates is being compared to acontinuous beam with no side plates. The design approach for stiffness appears to give satisfactory results to achieve continuity; however, the design approach for strength should be modified to include shear effects. At ultimate load, the plywood side plates have a loss but still attain ahigh percent of continuity.
13
Conclusions
Strength values (table 7) can be compared to an allowable value of 100 lb/ft to determine a strength factor of safety. Truss-plated and linger joints have factors of safety in excess of two except for the previously discussed 2 by 8 Spruce-Pine-Fir specimens. The majority of the failures were at the joint for the 2 by 6 truss-plated members, again indicating these joints may have been underdesigned.
About half the failures were at the finger joints in the two-span tests whereas almost all the failures were in the member in the simple-span tests. It again appears the combined shear and bending effects in the continuous span give contradictory results to the pure moment condition in the simple span.
The plywood side-plated joints had low factors of safety, ranging from 1.44 to 2.20. All joint failures were rolling shear failures in the plywood side members. It appears the shear effects, which were neglected in the design procedure, are important. All the failures occurred in the joints of the Douglas Fir-Larch specimens and were about equally divided between the joints and members in the Spruce-Pine-Fir/White Woods specimens. This contrasted somewhat with the results of the simple-span tests in which about two-thirds of the failures were in the joints for each species. No explanations are evident from this contrast but it does appear the combined shear and bending stress of the continuous beam study do influence the failure location.
All two-span joists were short-term loaded on both spans. Future research is necessary for long duration loads and unsymmetrical span loading.
It is feasible to moment connect two simple-span floor joists to produce a two-span partially continuous floor joist. The partial continuity may result in a reduction of joist size or an increase in joist spacing due to increased stiffness compared to a simple span. The number of joint types, member sizes, and species included in this pilot study as well as the limited joint designs and number of replications preclude specific recommendations for design criteria.
The percent continuity one could achieve is related to the joint design. The truss- and plywood side-plated joint designs were based on elementary mechanics procedures which neglect shear effects. Thus, mixed results were obtained when comparing results from simple spans with centerline joints (constant moment, no shear) to two spans with a joint at the center support (maximum moment and shear). This limited study did not develop design criteria which includes the effects of combined shear and bending stresses.
14
Literature Cited
15
2 . 2 - 1 1 / 8 5
16
The Forest Products Laboratory (USDA Forest Service) has served as the national center for wood utilization research since 1910. The Laboratory, on the University of Wisconsin-Madison campus, has achieved worldwide recognition for its contribution to the knowledge and better use of wood.
Early research at the Laboratory helped establish U.S. industries that produce pulp and paper, lumber, structural beams, plywood, particleboard and wood furniture, and other wood products. Studies now in progress provide a basis for more effective management and use of our timber resource by answering critical questions on its basic characteristics and on its conversion for use in a variety of consumer applications.
Unanswered questions remain and new ones will arise because of changes in the timber resource and increased use of wood products. As we approach the 21st Century, scientists at the Forest Products Laboratory will continue to meet the challenge posed by these questions.