FOREST PATCH OCCUPANCY BY SUMATRAN … patch occupancy by sumatran hornbills in a fragmented...
113
FOREST PATCH OCCUPANCY BY SUMATRAN HORNBILLS IN A FRAGMENTED LANDSCAPE OF SOUTHERN SUMATRA, INDONESIA by YOK YOK HADIPRAKARSA (Under the Direction of JOHN P. CARROLL AND ROBERT J. COOPER) ABSTRACT Understanding habitat requirements for Sumatran hornbills at broad-scales are required for future conservation and management. I identified habitat relationships and resource selection among forest patches, the probability of forest patches being occupied by hornbills, and developed spatially explicit habitat model (SEHM) to predict probability of Sumatran hornbill occurrence at broad scale. With the combination of stochastic events and habitat loss, small- bodied territorial species groups may face extirpation in the future due to dispersal limitation. Large-bodied non-territorial species had a better probability to persist in fragmented landscapes. Application of spatially explicit modeling has great potential to fill a knowledge gap for hornbill conservation priorities at broad scales. Evaluating efficiency of conservation research and management are recommended for future hornbill studies. Maintaining remnant forest patches in proximity to large neighborhood forest complexes is imperative for future hornbill persistence. INDEX WORDS: AIC, Anorrhinus galeritus, Antracocceros albirostris, Antracocceros malayanus, Aceros corrugatus, Berenicornis comatus, Buceros rhinoceros, Buceros bicornis, Distribution, Forest fragmentation, Hornbill conservation, Indonesia, Logistic regression, Occupancy estimates, Patch occupancy, Sumatran hornbills, Sumatra, Rhinoplax vigil, Rhyticeros undulatus, Spatial explicit model, detection probability
Transcript of FOREST PATCH OCCUPANCY BY SUMATRAN … patch occupancy by sumatran hornbills in a fragmented...

FOREST PATCH OCCUPANCY BY SUMATRAN HORNBILLS IN A FRAGMENTED
LANDSCAPE OF SOUTHERN SUMATRA, INDONESIA
by
YOK YOK HADIPRAKARSA
(Under the Direction of JOHN P. CARROLL AND ROBERT J. COOPER)
ABSTRACT
Understanding habitat requirements for Sumatran hornbills at broad-scales are required
for future conservation and management. I identified habitat relationships and resource selection
among forest patches, the probability of forest patches being occupied by hornbills, and
developed spatially explicit habitat model (SEHM) to predict probability of Sumatran hornbill
occurrence at broad scale. With the combination of stochastic events and habitat loss, small-
bodied territorial species groups may face extirpation in the future due to dispersal limitation.
Large-bodied non-territorial species had a better probability to persist in fragmented landscapes.
Application of spatially explicit modeling has great potential to fill a knowledge gap for hornbill
conservation priorities at broad scales. Evaluating efficiency of conservation research and
management are recommended for future hornbill studies. Maintaining remnant forest patches in
proximity to large neighborhood forest complexes is imperative for future hornbill persistence.
INDEX WORDS: AIC, Anorrhinus galeritus, Antracocceros albirostris, Antracocceros
malayanus, Aceros corrugatus, Berenicornis comatus, Buceros rhinoceros, Buceros bicornis, Distribution, Forest fragmentation, Hornbill conservation, Indonesia, Logistic regression, Occupancy estimates, Patch occupancy, Sumatran hornbills, Sumatra, Rhinoplax vigil, Rhyticeros undulatus, Spatial explicit model, detection probability

FOREST PATCH OCCUPANCY BY SUMATRAN HORNBILLS IN A FRAGMENTED
LANDSCAPE OF SOUTHERN SUMATRA, INDONESIA
by
YOK YOK HADIPRAKARSA
B. S., University of Pakuan, Indonesia, 2000
A Thesis Submitted to the Graduate Faculty of The University of Georgia in Partial Fulfillment
of the Requirements for the Degree
MASTER OF SCIENCE
ATHENS, GEORGIA
2008

© 2008
Yok Yok Hadiprakarsa
All Rights Reserved

FOREST PATCH OCCUPANCY BY SUMATRAN HORNBILLS IN A FRAGMENTED
LANDSCAPE OF SOUTHERN SUMATRA, INDONESIA.
by
YOK YOK HADIPRAKARSA
Major Professor: John. P Carroll Robert J. Cooper
Committee: Nathan P. Nibbelink
Michael J. Conroy
Electronic Version Approved: Maureen Grasso Dean of the Graduate School The University of Georgia August 2008

iv
ACKNOWLEDGEMENTS
I am thankful for all of the assistance during the project and my time as a master’s
student at the University of Georgia. My research project was funded by The Wildlife
Conservation Society (WCS), Oriental Bird Club (OBC) and Chester Zoo and done in
collaboration with the Indonesian Directorate General of Nature Protection and Conservation
(PHKA). I also would like to express my gratitude the Graduate School of University of Georgia
for providing me teaching assistantship for my master’s study.
First, I would like to thank my major advisor, Dr. John P. Carroll for kindness to accept
me as one of his students and Dr. Robert J. Cooper for willingness to became my co-advisor.
Their guidance, advice and continuous encouragement during my study and thesis writing were
very valuable. I also thank my committee members Dr. Michael J. Conroy and Dr. Nathan P.
Nibbelink for their valuable advice on my thesis. I am also thankful to Dr. Jeffry Hepinstall who
introduced me to spatial modeling.
I would also like to express my gratitude to Drs. Margaret F. Kinnaird and Timothy G.
O’Brien who introduced me with the magnificent of Indonesia hornbills and the world of field
biologist and patiently thought me how to be a good one in the field. I’m also thank to senior
biologist at WCS – International Program and Indonesia Program, Dr. Robert J. Lee, Dr. Noviar
Andayani, Dr. Nick Brickle and Dr. Collin Polle for their sincere assistance and bringing me to
study abroad. I am also thankful the Puget Sound Chapter of the American Association of
Zookepers (AAZK) providing me a funding to purchase computer for my study and special

v
thanks to Eric Kowalcyzk from Woodland Park Zoo, Seattle for continuously providing
encouragement to studied Indonesia hornbills.
I am thankful to all friends in Athens: Fathur, Ahmad, Pak Hadi, Ibu Dewi, Shameer,
Woon Kyong Kang, Zaki Nuraeni, Agung Santoso and special thanks to Bu Iesye, Emilio
Champac, I thank you all for all the kindness and fun. It has been a great experience for me to
study at Warnell School of Forestry & Natural Resources, especially with the sincere support and
friendship from my fellow graduate students. I would like to thank to Andrew Zharenka, Susan
E. Felige, Michael Parrish and Cooper’s lab. Special thank to The Carroll family who helped me
settled here in Athens. I really appreciate what you all have done for me.
I also would like to thank to Nurul L. Winarni and Aslan Baco for your friendship and
deep discussion and technical helps during my study and thesis writing. It has been such a
wonderful experience for me to work with all sincere supports, fun, and friendship from my
colleagues and friends at the Wildlife Conservation Society – Indonesia Program. I would like to
thank to Diah A. Dwiyahreni, Maya D, Anton Nurcahyo, Muhammad Iqbal, Donny Gunaryadi,
Hariyo T. Wibisono, Untung Wijayanto, Sunarto, Meyner Nusalawo, Ryan Triharyana, Agung
Hawari, Cep Dedi Permadi, Big Antono and Harry Alexander. To all my project field assistant
and collaborator, Sumarji, Ridwan, Agus Ahmadi, Agus Bagas, Wahyu Hidayat and Adam Sori,
I thank you all for being patience and dedicated work in the field.
Finally, my greatest gratitude for my wife and son, my mother, father and mother-law,
and all of my brothers and sisters, for their endlessly support, patient, care, and love given to me
during study and over my entire life.

vi
TABLE OF CONTENTS
Page
ACKNOWLEDGEMENTS........................................................................................................... iv
LIST OF TABLES....................................................................................................................... viii
LIST OF FIGURES .........................................................................................................................x
CHAPTER
1 INTRODUCTION AND STUDY SITE........................................................................1
Introduction ...............................................................................................................1
Study site ...................................................................................................................6
Literature cited ..........................................................................................................8
2 RELATIONSHIP OF HABITAT AND RESOURCE SELECTION TO SUMATRAN
HORNBILL PATCH OCCUPANCY IN SOUTHERN SUMATRA, INDONESIA
.................................................................................................................................19
Abstract ...................................................................................................................20
Introduction .............................................................................................................20
Methods ...................................................................................................................25
Results .....................................................................................................................29
Discussion ...............................................................................................................31
Literature cited ........................................................................................................34
vii
3 PREDICTING PROBABILITY OF OCCURRENCE OF SUMATRAN
HORNBILLS IN A FRAGMENTED LANDSCAPE IN SOUTHERN
SUMATRA, INDONESIA......................................................................................59
Abstract ...................................................................................................................60
Introduction .............................................................................................................60
Methods ...................................................................................................................64
Results .....................................................................................................................68
Discussion ...............................................................................................................71
Literature cited ........................................................................................................76
4 CONCLUSIONS .........................................................................................................99

viii
LIST OF TABLES
Page
Table 1.1: Common names, scientific names and current conservation status of hornbills
occurring in Sumatra, Indonesia .....................................................................................17
Table 2.1: Scientific names with weight, territorial, elevation distributions, home range and daily
travels for nine species of Sumatran hornbill .................................................................43
Table 2.2: Patch and transect characteristics in sampled areas, Lampung Province, Sumatra,
Indonesia.. .......................................................................................................................44
Table 2.3: Description of covariates used in occupancy estimation as a function of resource
selection and habitat relationships in Lampung Province, Sumatra, Indonesia..............45
Table 2.4: Estimates of occupancy (ψ) and detection probability (p) from the top ranked models
for seven hornbill species as a function of resource selection in Lampung Province,
Sumatra, Indonesia..........................................................................................................46
Table 2.5: Estimates (ψ) and detection probability (p) from the top ranked models for seven
hornbill species as a function of habitat relationships in Lampung Province, Sumatra,
Indonesia. ........................................................................................................................50
Table 3.1: Spatial statistics of forest patches derived from LANDSAT ETM+ 7 analysis in
southern Sumatra landscape, Indonesia, during 2000.....................................................86
Table 3.2: Common and scientific names with weight, territorial, elevations distributions, home
range and daily travels of 4 species of Sumatran hornbills ............................................87

ix
Table 3.3: Summary of model selection procedures and parameter estimates to develop models
of probability of occurrences for 4 Sumatran hornbills in Lampung Province, Sumatra,
Indonesia .........................................................................................................................88
Table 3.4: Predicted mean proportion of patch occupancy and hornbill occurrences in non-
surveyed forest patches of four hornbill species in Lampung Province, Sumatra,
Indonesia. Note: AG = A. galeritus, BR = B. rhinoceros, RU = R. undulatus, RV = R.
vigil. ................................................................................................................................90
Table 3.5: Predicted mean proportion of patch occupancy and hornbill occurrences with
observed occurrences in surveyed forest patches of four hornbill species in Lampung
Province, Sumatra, Indonesia. Note: AG = A. galeritus, BR = B. rhinoceros, RU = R.
undulatus, RV = R. vigil. Predicted occurrences are bolded when the model suggested
that the species was present but not actually observed, and italicized when the model
predicted no occurrence, but we actually found the species to be present.. ...................91

x
LIST OF FIGURES
Page
Figure 1.1: Location of Lampung Province, Sumatra, Indonesia ..................................................18
Figure 2.1: Map of study area in southern Sumatra Landscape, Indonesia. Enlargement shows
forest in 2000’s, elevation and surveyed forest patch locations....................................53
Figure 2.2: Distribution of nine hornbill species in forest patches categories by size and patch
isolation in Lampung Province, Sumatra, Indonesia ....................................................54
Figure 2.3: Total summed model of proportion of patch occupied as a function of resource
selection for seven hornbill species in Lampung Province, Sumatra, Indonesia.
(Abbreviations: BR = B. rhinoceros; BB = B. bicornis; RV = R. vigil; RU = R.
undulatus; AC = A. corrugatus; BC = B. comatus; AG = A. galeritus).......................55
Figure 2.4: General parameter estimates from the best model for proportion of patch occupied
and detection probability (mean + 1SE) as a function of habitat relationships for seven
Sumatran hornbill species in Lampung Province, Sumatra, Indonesia. (Abbreviations:
BR = B. rhinoceros; BB = B. bicornis; RV = R. vigil; RU = R. undulatus; AC = A.
corrugatus; BC = B. comatus; AG = A. galeritus). .....................................................56
Figure 2.5: Parameter estimates with species-specific habitat disturbance covariates (mean +
1SE). Proportion of patch occupied and detection probability for seven Sumatran
hornbill species in Lampung Province, Sumatra, Indonesia. (A) B. rhinoceros; (B) B.
bicornis; (C) R. vigil; (D) R. undulatus; (E) A. corrugatus; (F) B. comatus; (G) A.
galeritus.........................................................................................................................57

xi
Figure 2.6: Parameter estimates with species-specific response to forest size covariates (mean ±
1SE). Bars represent proportion of patches occupied and detection probability for five
Sumatran hornbill species in Lampung Province, Sumatra, Indonesia. (A) B.
rhinoceros; (B) R. undulatus; (C) R. vigil; (D) B. comatus; (E) A. galeritus................58
Figure 3.1: Predicted probability of occurrence maps for 4 hornbill species in Lampung
Province, Sumatra, Indonesia. (A) A. galeritus, (B) B. rhinoceros, (C) R. undulatus,
(D) R. vigil. Patches that were surveyed during field research are outlines in red and
those that have not been surveyed are not outlined. Number on each patch represents
of patch ID.....................................................................................................................92
Figure 3.2: Percentage of total patch area of prediction occurrences in non-surveyed (A) and
surveyed areas (B) for 4 Sumatran hornbills in Lampung Province, Sumatra,
Indonesia. Note: AG = A. galeritus, BR = B. rhinoceros, RU = R. undulatus, RV = R.
vigil .....................................................................................................................96
Figure 3.3: Percentage of probability of presences in non-surveyed forest patches, grouped by
forest patch size (A) and forest isolation (B) for 4 Sumatran hornbills in Lampung
Province, Sumatra, Indonesia. Note: AG = A. galeritus, BR = B. rhinoceros, RU = R.
undulatus, RV = R. vigil. ...............................................................................................97
Figure 3.4: Receiver operating characteristic (ROC) plots of developed models of 4 hornbill
species. (A) A. galeritus, (B) B. rhinoceros, (C) R. undulatus, (D) R. vigil. Note:
Diagonal segment produced by ties. S.E was under the non-parametric assumption, P
was asymptotic significance with null hypothesis of true area = 0.5. AUC values of >
0.7 are considered a good fit and > 0.9 is very good. Ot was optimum threshold
selected. .....................................................................................................................98

CHAPTER 1
INTRODUCTION AND STUDY SITE
INTRODUCTION
During the last 20 years, the island of Sumatra has experienced some of the highest rates
of deforestation in the world (e.g. Laurance 1999, Holmes 2001). During 1985 – 1997, 6.7
million ha of forest were lost (FWI/GFW 2002) and all major protected areas on the island were
impacted (Kinnaird et al. 2003, Linkie et al. 2004, Gaveau et al. 2007). The World Bank (2001)
reported at Lampung Province has the second highest deforestation rate of any Sumatra province,
with approximately 44% of forest cover lost over the last 12 years. There, the average forest size
has declined by a factor of four, and the number of fragments has doubled (Hadiprakarsa et al.
2007). Today, Lampung Province is the most densely human-populated and the poorest
province in Sumatra (188 people/km2; data from Indonesia’s Central Bureau of Statistic 2000);
burgeoning human populations and the coincident deforestation continue to eliminate wildlife
habitat, and what remains is highly fragmented.
Hornbills (Family Bucerotidae) are the most widespread, large, frugivorous birds in the
Old World tropics (Kemp 1995). Indonesia is home for 13 hornbill species, making this country
the richest and the most important country for hornbill conservation in Asia. With 9 species, the
second largest island of Sumatra is the most diverse hornbill island in the country and in Asia
realm. Sumatran hornbills inhabit lowland to mountain evergreen rainforest at elevations up to
1800 m, but most are commonly found in the primary, lowland evergreen rainforest (MacKinnon
et al. 1993, Table 1.1). In southern Sumatra, Lampung province, most of the remnant forest

2
patches are occupied by hornbills with at least one species found in most forest patches
(Hadiprakarsa et al. 2007). The largest forest patch in the landscape, Bukit Barisan Selatan
National Park (BBSNP), holds most of the hornbill species.
The Indonesia Government has provided legal protection to the entire hornbill family in
Indonesia (Noerdjito and Maryanto 2001). The IUCN has listed nearly half of Indonesian
hornbills as Threatened and one considered Vulnerable; the main threats are habitat loss, habitat
fragmentation and hunting (IUCN 2007). Most of common species have been studied with at
least some aspects of their biology investigated. However, much of this information comes from
Thailand (e.g. Tsuji et al. 1987, Poonswad et al. 1988, Kanwatanakid-Savini and Poonswad
2007). In Indonesia, a few studies of hornbills were conducted in Kalimantan and Sulawesi (e.g.
Leighton 1982, Suryadi et al. 1998, Kinnaird and O'Brien 1999). However, there are still
information gaps for hornbill species in Sumatra and studies are limited to the 4 common species
(Anggraini et al. 2001, Hadiprakarsa and Kinnaird 2004, Hadiprakarsa et al. 2007). Detailed
status and distribution of hornbills, breeding biology, demographic studies, movement patterns
and dispersal are generally unavailable for most of the species (Kinnaird and O'Brien 2007).
Therefore, this gap in data makes it difficult for management and conservation of these species.
From desert arid regions of Africa to tropical rainforest in Asia, hornbills play unique
roles in the folklore and rituals in many human cultures. There are also economical and political
implications of hornbill conservations (Kemp 1995, Kinnaird and O'Brien 2007). Hornbill body
parts, such as tail feathers, heads and casques are used as costume ornamentation for cultural
ceremonies (Kinnaird and O'Brien 2007). In Asia, at least two-thirds of hornbill species have
been hunted and exploited for consumption (Bennett 2000, Johnson et al. 2003, Setha 2004,
Datta 2007, Oliver and Wilkinson 2007). TRAFFIC Southeast Asia has only reported a few

3
records of hornbills as part of the pet trade in Sumatra during 1997-2001 (Sheperd et al. 2004).
However, this information was reported for only a single province in west Sumatra, therefore
hunting and trade of Sumatra hornbills occur at unknown rates (Y. Hadiprakarsa, personal
observation).
Asian hornbills are large-bodied species, ranging from 0.5 to 2.5 kg (Kemp 1995) and are
highly frugivorous (Kinnaird et al. 1996, Hadiprakarsa and Kinnaird 2004). Hornbills are
capable of moving long distances to search for fruit resources that are patchily distributed and
fluctuate over time (Tsuji et al. 1987, Suryadi et al. 1998, Holbrook et al. 2002). Hornbill studies
in Asia (Kinnaird 1998) and Africa (Holbrook and Smith 2000) have found that hornbills are
very effective in dispersing seeds, thus it has been suggested that hornbills may play important
ecological roles in forest regeneration. To fulfill their energy requirements, hornbills rely
heavily on fruit and a small number of small vertebrates and invertebrates in their diet. Food
habit studies on various hornbills in Asia showed that figs (Ficus spp.) comprise 69% to 98% of
their overall diet (Poonswad et al. 1983, Kinnaird et al. 1996, Datta and Rawat 2003,
Hadiprakarsa and Kinnaird 2004). However, their diet may change slightly during the breeding
season to adjust nutrient supplies for chick development (Poonswad et al. 2004).
Hornbills are secondary cavity nesting birds, and are excavate to unearth their own nest
cavities. A previous study found that suitable natural cavities for hornbill nests are commonly
found within large trees with a diameter at breast height (DBH) over 65 cm (Poonswad et al.
2000, Cahill 2003). Therefore, availability of suitable tree cavities is a key factor for
maintaining hornbill populations (Kemp 1995). Synthesizing from numerous hornbill studies in
Asia, there are 3 indispensable features required for hornbill persistence: 1) ample food
resources, 2) an adequate number of large trees with suitable nest cavities for hornbills to breed,

4
and 3) sufficient habitat area to support viable populations. These critical components of their
natural history make them susceptible to fragmentation of tropical forest (Terborgh and Winter
1980, Lambert 1992, Datta 1998, Anggraini et al. 2001), and also to reduction in quality of forest
habitats (Kinnaird and O'Brien 2007).
With increasing tropical forest loss and isolation of remaining forest patches, persistence
of forest species is likely to be dependent on their ability to persist in fragmented landscapes.
Island biogeography theory (MacArthur and Wilson 2001) and metapopulation theory (Levins
1969) have provided a conceptual basis for evaluating the contributions of colonization and
extinction of wildlife in a fragmented landscape. Several studies have suggested that forest
fragmentation can affect bird community richness (e.g. Telleria et al. 2003, Sodhi et al. 2005),
distribution (e.g.Waltert et al. 2004, Veech 2006), abundance (e.g.Lampila et al. 2005, Stouffer
et al. 2006), forest occupancy (e.g. Villard et al. 1999, Gibson et al. 2004) and in extreme cases,
can lead to species extinction (e.g.Newmark 1991, Castelletta et al. 2000). Most of the major
fragmentation studies have come from the Neotropics and have concentrated on understory and
small—bodied bird species in relatively few forest patches (e.g. McGarigal and McComb 1995,
Stouffer and Bierregaard 1995, Christiansen and Pitter 1997, Lee et al. 2002). However, there is
a paucity of studies on the effects of fragmentation on large, canopy-dwelling (Galleti 1996) and
wide-ranging bird species, especially those in the Asian tropics (Laurance and Bierregaard
1997).
Hornbill populations may be able to persist in small forest patches and disturbed habitats
in a landscape (Datta 1998, O'Brien et al. 1998, Raman and Mudappa 2003, Sitompul et al.
2004), but this ability likely varies among species according to habitat needs, landscape
configurations, and dispersal abilities. Few studies have directly addressed the effects of habitat

5
fragmentation at the landscape level on Asian hornbills; most have mainly considered the impact
on one or two species in predominantly forested landscapes. A study on the effect of forest
fragmentation on hornbill communities in southern Sumatra (Hadiprakarsa et al. 2007) found
that forest patch size is important to maintain the hornbill community, specifically for large
bodied and wide ranging hornbill species. Previous studies in India (Raman and Mudappa
2003), Thailand (Pattanavibool and Dearden 2002) and Sumba, Indonesia (Sitompul et al. 2004)
reported similar results. Therefore, more understanding of the effect of anthropogenic habitat
change on distribution and occupancy patterns of hornbills is a prerequisite to their habitat
conservation and management.
Conserving hornbills and their habitat in fragmented landscapes must include
understanding and application of biological studies, and integration with conservation action.
Each species has a specific habitat requirements (Wiens 1989). Identifying key habitat variables
with their spatial arrangement to which a species responds, and developing habitat models to
predict species occupancy, are important tools to develop species conservation plans (Gibson et
al. 2004, MacKenzie 2006) and for landscape conservation planning (Sanderson et al. 2002).
Many ecological studies have been done using species occurrences to model habitat
relationships (e.g., Donovan and Flather 2002, Gibson et al. 2004, Moore and Swihart 2005),
resources selection (MacKenzie 2006), and estimating colonization and local extinction from site
occupancy (MacKenzie et al. 2003). However, collecting such information without taking
detection probability into account could lead to a seriously biased result (MacKenzie et al. 2006).
Several studies have shown that imperfectly detecting species is a common problem in many
wildlife studies (MacKenzie et al. 2006). Recently, MacKenzie et al. (2006) developed a
likelihood-based method for estimating the proportion of area (patch) occupied when species are

6
detected imperfectly and detection probability varies among species or habitats. Here, species
detection probability is defined as the probability of detecting at least one individual of the
species during a particular sampling occasion. With careful use, applications of this method
provide biologists with a better and more efficient utilization of collection data.
The major goal of this research was to assess patch occupancy characteristics of hornbills
in Lampung province and to assess spatial and environmental characteristics important in
predicting hornbill community persistence in forest patches, thereby extending the initial work of
Hadiprakarsa et al. (2007).
The first objective of this study was to identify habitat relationships and resource
selection among Sumatran hornbill species. I describe the best habitat parameters to predict
hornbill occupancy in a fragmented landscape in Chapter 2.
Second, I performed a spatial modeling exercise to predict probability of occurrences for
Sumatran hornbills at a broad scale. In Chapter 3, I develop spatially explicit habitat models
(SEHM) of four Sumatran hornbills to predict probability of occurrence as an approach to
identify habitat requirement at broad scales that can provide an alternative management tool for
hornbill conservation in a fragmented landscape in southern Sumatra, Indonesia.
STUDY SITE
The study was conducted in the Southern Sumatra landscape, encompassing
approximately 3.5 million ha of land and stretching across the province of Lampung and a small
portion in Bengkulu province, Sumatra (3o45'S and 103o40'E, Figure 1). The topographical
gradient ranges from gentle slopes (<16.5o) to steep slopes (> 16.5o), with elevation from 0 to
2200 m above sea level. Forest type varied from lowland to montane dipterocap forest. The
annual rainfall is generally high, ranging between 2000–4000 mm and temperature ranges from

7
20–34o Celsius, although there can be severe droughts during El Niño Southern Oscillation
phenomena (Hedges et al. 2005). Lampung province contains 2 large and important protected
areas, Bukit Barisan Selatan National Park (BBSNP) and Way Kambas National Park (WKNP).
These two national parks serve as a major wildlife refuges for a number of charismatic and
endangered mammals species, such as Sumatra tiger (Panthera tigris), Asian elephant (Elephas
maximus), Sumatran rhino (Dicerorhinus sumatrensis) (Foose and van Strien 1997, Franklin et
al. 1999), and more than 200 species of birds (van Marle and Voous 1988, Y. Hadiprakarsa
unpublished data).
Between the late 1950s and 1989, much of Lampung’s forest was cleared as part of the
Indonesian Government’s Transmigration Program. This government program moved people
from Java to Sumatra in large numbers. By 1981, 60% of the population of southern Sumatra
consisted of transmigrants. This was followed by a period of spontaneous migration of people
leaving the overcrowded, neighboring island of Java (Benoit et al. 1989). In the 1980s, 30 native
forest patches existed in Lampung province ranging in size from 452 ha to 205,440 ha. However,
by 2000s, as much as 35% of forest cover was lost, and several patches present in the 1980s had
disappeared (Hadiprakarsa et al. 2007). Remnant forest patches in 2000 were dominated by
lowland evergreen forest (<500 msl) to hill forest areas (1000 msl). These patches were
surrounded by dense human settlement, plantations and an agricultural matrix. Most of forest
loss in the landscape occurred in the outside of two national parks (Gaveau et al. 2007) and was
primarily caused by illegal logging and agricultural practices, such as coffee plantation (Kinnaird
et al. 2003, Gaveau et al. 2007). (IUCN 2007, UNEP-WCMC 2007)

8
LITERATURE CITED
Anggraini, K., M. F. Kinnaird, and T. G. O'Brien. 2001. The effects of fruit availability and
habitat disturbance on an assemblage of Sumatran hornbills. Bird Conservation
International 10:189-202.
Bennett, E. L. 2000. Saving Borneo's bacon: The sustainability of hunting in Sarawak and Sabah.
Pages 305-324 in J. G. Robinson, and E. L. Bennett, editors. Columbia University Press,
New York.
Benoit, D., P. Levang, M. Pain, and O. Sevin. 1989. Transmigration et migrations spontanées en
Indonesie: Propinsi Lampung. Departemen Transmigrasi, Jakarta, Indonesia and
ORSTOM, Bondy, France.
Cahill, A. J. 2003. Nest-site characteristics of the Red-knobbed Hornbill Aceros cassidix and
Sulawesi Dwarf Hornbill Penelopides exarhatus. Ibis 145:E97-E113.
Castelletta, M., N. S. Sodhi, and R. Subaraj. 2000. Heavy Extinctions of Forest Avifauna in
Singapore: Lessons for Biodiversity Conservation in Southeast Asia. Conservation
Biology 14:1870-1880.
Christiansen, M. B., and E. Pitter. 1997. Species loss in a forest bird community near Lagoa
Santa in southeastern Brazil. Biological Conservation 80:23-32.
Datta, A. 1998. Hornbill abundance in unlogged forest, selectively logged forest and a forest
plantation in Arunachal Pradesh, India. Oryx 32:285-294.
_____. 2007. Hunting for hornbilss: approaches to conservation in Arunachal Pradesh, north-east
India. Pages 41 in Proceedings of The Active Management of Hornbills and their
Habitats for Conservation, Proceedings of the 4th International Hornbill Conference,
Mabula Game Lodge, Bela- Bela, South Africa.

9
Datta, A., and G. S. Rawat. 2003. Foraging Patterns of Sympatric Hornbills during the
Nonbreeding Season in Arunachal Pradesh, Northeast India. BIOTROPICA 35:208-218.
Donovan, T., and C. Flather. 2002. Relationships among north American songbird trends, habitat
fragmentation, and landscape occupancy. Ecological Applications 12:364-374.
Foose, T. J., and N. van Strien. 1997. Asian Rhinos - Status survey and conservation action plan.
IUCN, Gland, Switzerland and Cambridge, UK.
Franklin, N., Bastoni, Sriyanto, D. Siswomartono, J. Manansang, and R. Tilson. 1999. Last of the
Indonesian tigers: a causes for optimism. Pages 130-147 in J. Seidensticker, S. Christie,
and P. Jackson, editors. Riding the tiger: Tiger Conservation in Human-dominated
Landscapes. Cambridge University Press, Cambridge, UK.
FWI/GFW. 2002. The State of the Forest: Indonesia. Forest Watch Indonesia, Bogor, Indonesia
and Global Forest Watch, Washington, DC.
Galleti, M. 1996. Fruits and frugivores in a Brazilian Atlantic Forest. University of Cambridge,
U.K.: Unpublished Ph.D. thesis. .
Gaveau, D. L. A., H. Wandono, and F. Setiabudi. 2007. Three decades of deforestation in
southwest Sumatra: Have protected areas halted forest loss and logging, and promoted re-
growth? Biological Conservation 134:495-504.
Gibson, L., B. Wilson, D. Cahill, and J. Hill. 2004. Spatial prediction of rufous bristlebird habitat
in a coastal heathland: a GIS-based approach. Journal of Applied Ecology 41:213-223.
Hadiprakarsa, Y., and M. F. Kinnaird. 2004. Foraging characteristics of an assemblage of four
Sumatran hornbill species. Bird Conservation International 14:S53-S62.
Hadiprakarsa, Y., M. F. Kinnaird, M. Iqbal, and T. G. O'Brien. 2007. Effects of forest
fragmentation on hornbills across the southern Sumatran landscape. Pages 80-91 in

10
Proceedings of The Active Management of Hornbills and their Habitats for Conservation,
Proceedings of the 4th International Hornbill Conference. Mabula Game Lodge, Bela-
Bela, South Africa.
Hedges, S., M. J. Tyson, A. F. Sitompul, M. F. Kinnaird, and D. Gunaryadi. 2005. Distribution,
status, and conservation needs of Asian elephants(Elephas maximus) in Lampung
Province, Sumatra, Indonesia. Biological Conservation 124:35-48.
Holbrook, K. M., and T. B. Smith. 2000. Seed dispersal and movement patterns in two species of
Ceratogymna hornbills in a West African tropical lowland forest. Oecologia 125:249-
257.
Holbrook, K. M., T. B. Smith, and B. D. Hardesty. 2002. Implications of long-distance
movements of frugivorous rain forest hornbills. Ecography 25:745-749.
Holmes, D. A. 2001. Deforestation in Indonesia: A Review of the Situation in Sumatra,
Kalimantan, and Sulawesi. World Bank. Jakarta, Indonesia.
IUCN. 2007. 2007 IUCN Red List of Threatened Species On the World Wide Web:
http://www.redlist.org (Accessed on 22 October 2007)
Johnson, A., M. Singh, Dongdala, and O. Vongsa. 2003. Wildlife hunting and use in the Nam Ha
national protected area: Implications for rural livelihoods and biodiversity conservation.
Vientisnr, Lao PDR: Wildlife Conservation Society.
Kanwatanakid-Savini, C., and P. Poonswad. 2007. Feeding ecology and food selection of four
sympatric hornbill species at Khao Yai National Park, Thailand. Pages 195 in
Proceedings of The Active Management of Hornbills and their Habitats for Conservation,
Proceedings of the 4th International Hornbill Conference. Mabula Game Lodge, Bela-
Bela, South Africa.

11
Kemp, A. 1995. The Hornbills. Oxford University Press Oxford.
Kinnaird, M., and T. G. O'Brien. 2007. The Ecology and Conservation of Asian Hornbills:
Farmers of the Forest. The University of Chicago Press, Chicago.
Kinnaird, M. F. 1998. Evidence for Effective Seed Dispersal by the Sulawesi Red-Knobbed
Hornbill, Aceros cassidix. BIOTROPICA 30:50-55.
Kinnaird, M. F., and T. G. O'Brien. 1999. Breeding ecology of the Sulawesi Red-Knobbed
Hornbill Aceros cassidix. Ibis 141:60-69.
Kinnaird, M. F., T. G. O'Brien, and S. Suryadi. 1996. Population fluctuation in Sulawesi Red-
knobbed Hornbills: tracking figs in space and time. Auk 113:431-440.
Kinnaird, M. F., E. W. Sanderson, T. G. O'Brien, H. T. Wibisono, and G. Woolmer. 2003.
Deforestation Trends in a Tropical Landscape and Implications for Endangered Large
Mammals. Conservation Biology 17:245-257.
Lambert, F. R. 1992. The Consequences of Selective Logging for Bornean Lowland Forest
Birds. Philosophical Transactions: Biological Sciences 335:443-457.
Lampila, P., M. Monkkonen, and A. Desrochers. 2005. Demographic Responses by Birds to
Forest Fragmentation. Conservation Biology 19:1537-1546.
Laurance, W. F. 1999. Reflections on the tropical deforestation crisis. Biological Conservation
91:109-117.
Laurance, W. F., and R. O. Bierregaard. 1997. Tropical Forest Remnants: Ecology, Management,
and Conservation of Fragmented Communities. University of Chicago Press, Chicago.
Lee, M., L. Fahrig, K. Freemark, and D. Currie. 2002. Importance of patch scale vs landscape
scale on selected forest birds. Oikos 96:110-118.

12
Leighton, M. 1982. Fruit Resources and Patterns of Feeding, Spacing and Grouping Among
Sympatric Bornean Hornbills (Bucerotidae). PhD Dissertation, University of California,
Davis.
Levins, R. 1969. Some demographic and genetic consequences of environmental heterogeneity
for biological control. Bulletin of the Entomological Society of America:237-240.
Linkie, M., R. J. Smith, and N. Leader-Williams. 2004. Mapping and predicting deforestation
patterns in the lowlands of Sumatra. Biodiversity and Conservation 13:1809-1818.
MacArthur, R. H., and E. O. Wilson. 2001. The theory of island biogeography. Princeton
University Press Princeton, NJ.
MacKenzie, D. I. 2006. Modeling the Probability of Resource Use: The Effect of, and Dealing
with, Detecting a Species Imperfectly. Journal of Wildlife Management 70:367-374.
MacKenzie, D. I., J. D. Nichols, J. E. Hines, M. G. Knutson, and A. B. Franklin. 2003.
Estimating Site Occupancy, Colonization, and Local Extinction when a Species is
Detected Imperfectly. Ecology 84:2200-2207.
MacKenzie, D. I., J. D. Nichols, J. A. Royle, K. H. Pollock, L. L. Bailey, and J. E. Hines, editors.
2006. Occupancy Estimation and Modeling: Inferring Patterns and Dynamics of Species
Occurrence. Academic Press, San Diego, USA.
MacKinnon, J., K. Phillipps, P. Andrew, and F. Rozendaal. 1993. A field guide to the birds of
Borneo, Sumatra, Java, and Bali. Oxford University Press, Oxford.
McGarigal, K., and W. C. McComb. 1995. Relationships Between Landscape Structure and
Breeding Birds in the Oregon Coast Range. Ecological Monographs 65:235-260.

13
Moore, J. E., and R. K. Swihart. 2005. Modeling patch occupancy by forest rodents:
Incorporating detectability and spatial autocorrelation with hierarchically structured data.
Journal of Wildlife Management 69:933-949.
Newmark, W. D. 1991. Tropical fragmentation and the extinction of understorey birds in the
Eastern Usambara mountains. Conservation Biology 5:67-78.
Noerdjito, M., and I. Maryanto. 2001. Jenis-jenis hayati yang dilindungi perundang-undangan
Indonesia (In Indonesian). Balitbang Zoologi (Museum Zoologicum Bogoriense)
Puslitbang Biologi-LIPI and The Nature Conservancy, Bogor.
O'Brien, T. G., M. F. Kinnaird, P. Jepson, and I. Setiawan. 1998. Effect of forest size and
structure on the distribution of Sumba Wreathed Hornbills Aceros everetti. Pages 209-
217 in Proceedings of The Asian Hornbills: Ecology and Conservation, Proceedings of
the Second Asian Hornbill Workshop, Bangkok.
Oliver, W. L. R., and R. Wilkinson. 2007. Philipine hornbills conservation programme. Pages
13-30 in Proceedings of The Active Management of Hornbills and their Habitats for
Conservation, Proceedings of the 4 International Hornbill Conference, Mabula Game
Lodge, Bela- Bela, South Africa.
Pattanavibool, A., and P. Dearden. 2002. Fragmentation and wildlife in montane evergreen
forests, northern Thailand;. Biological Conservation 107:155-164.
Poonswad, P., V. Chimchome, K. Plongmai, and P. Chuailua. 2000. Factors influencing the
reproduction of Asian Hornbills. Pages 1740-1755 in Proceedings of the 22nd
International Ornithological Congress. Durban.

14
Poonswad, P., a. Tsuji, and N. Jirawatkavi. 2004. Estimation of nutrients delivered to nest
inmates by four sympatric species of hornbills in Khao Yai National Park, Thailand.
ORNITHOLOGICAL SCIENCE 3:99-112.
Poonswad, P., A. Tsuji, and C. Ngarmpongsai. 1983. A study of the breeding biology of
hornbills (Bucerotidae) in Thailand. Pages 239-265 in Proceedings of a
Delacour/International Foundation for the Conservation of Birds in Captivity.
_____. 1988. A comparative ecological study of four sympatric hornbills (Family Bucerotidae)
in Thailand. Acta XIX congressus Internationalis Ornithologi 2:2781-2791.
Raman, T., and D. Mudappa. 2003. Correlates of hornbill distribution and abundance in
rainforest fragments in the southern Western Ghats, India. Bird Conservation
International 13:199-212.
Sanderson, E. W., K. H. Redford, A. Vedder, P. B. Coppolillo, and S. E. Ward. 2002. A
conceptual model for conservation planning based on landscape species requirements.
Landscape and Urban Planning 58:41-56.
Setha, T. 2004. The status and conservation of hornbills in Cambodia. Bird Conservation
International 14:S5-S11.
Sheperd, C. R., J. Sukumaran, and S. A. Wich. 2004. Open season: An analysis of the pet trade
in Medan, Sumatra 1997-2001. TRAFFIC Southeast Asia. Petaling Jaya, Selangor
Malaysia.
Sitompul, A. F., M. F. Kinnaird, and T. G. O'Brien. 2004. Size matters: the effects of forest
fragmentation and resource availability on the endemic Sumba Hornbill Aceros everetti.
Bird Conservation International 14:S23-S37.

15
Sodhi, N. S., T. M. Lee, L. P. Koh, and R. R. Dunn. 2005. A century of avifaunal turnover in a
small tropical rainforest fragment. Animal Conservation 8:217-222.
Stouffer, P. C., and R. O. Bierregaard. 1995. Use of Amazonian Forest Fragments by Understory
Insectivorous Birds. Ecology 76:2429-2445.
Stouffer, P. C., R. O. Bierregaard, C. Strong, and T. E. Lovejoy. 2006. Long-Term Landscape
Change and Bird Abundance in Amazonian Rainforest Fragments. Conservation Biology
20:1212-1223.
Suryadi, S., M. F. Kinnaird, and T. G. O'Brien. 1998. Home ranges and daily movements of the
Sulawesi red-knobbed hornbill Aceros cassidix during the non-breeding season. Pages
159-170 in Proceedings of The Asian hornbills: ecology and conservation. Thai Studies
in Biodiversity.
Telleria, J. L., R. Baquero, and T. Santos. 2003. Effects of forest fragmentation on European
birds: implications of regional differences in species richness. Journal of Biogeography
30:621-628.
Terborgh, J., and B. Winter. 1980. Some causes of extinction Pages 119-113 in M. E. Soule, and
B. A. Wilcox, editors. Conservation biology: An Evolutionary-Ecological Perspective.
Sinauer, Sunderland, Massachusetts.
Tsuji, A., P. Poonswad, and N. Jirawatkari. 1987. Application of radio tracking to study ranging
pattern of hornbills (Bucerotidae) in Thailand. Pages 316-351 in Proceedings of
Proceedings of the Jean Delacour/International Foundation for the Conservation of Birds
Symposium on Breeding Birds in Captivity.

16
UNEP-WCMC. 2007. UNEP-WCMC Species Database: CITES-Listed Species On the World
Wide Web: http://www.cites.org/eng/resources/species.html (Accessed on 22 October
2007)
van Marle, J. G., and K. H. Voous. 1988. The birds of Sumatra: an annotated check-list. Pages 1-
265 in British Ornithological Union Check-list 10. British Ornithological Union, Tring,
UK.
Veech, J. A. 2006. Increasing and Declining Populations of Northern Bobwhites Inhabit
Different Types of Landscapes. Journal of Wildlife Management 70:922-930.
Villard, M.-A., M. K. Trzcinski, and G. Merriam. 1999. Fragmentation Effects on Forest Birds:
Relative Influence of Woodland Cover and Configuration on Landscape Occupancy.
Conservation Biology 13:774-783.
Waltert, M., A. Mardiastuti, and M. Muhlenberg. 2004. Effects of Land Use on Bird Species
Richness in Sulawesi, Indonesia. Conservation Biology 18:1339-1346.
Wiens, J. A. 1989. Spatial Scaling in Ecology. Functional Ecology 3:385-397.
World Bank. 2001. Indonesia: Environment and Natural Resource Management in a Time of
Transition. The World Bank. Washington D.C.

17
Table 1.1.Common names, scientific names and current conservation status of hornbills occurring in Sumatra, Indonesia.
Conservation Status Scientific Name1 Common Name1 Weight/ranging pattern2
INDO3 IUCN4 CITES5
Berenicornis comatus White-crowned Hornbill 1.3 – 1.4 kg/Territorial P NT II
Aceros corrugatus Wrinkled Hornbill 1.3 – 1.6 kg/Non-territorial P NT I
Rhyticeros undulatus Wreathed Hornbill 1.9 – 2.5 kg/Non-territorial P LC II
Buceros bicornis Great-pied Hornbill 2.6 – 3.4 kg/Non-territorial P NT I
Buceros rhinoceros Rhinoceros Hornbill 2 – 2.9 kg/Non-territorial P NT II
Rhinoplax vigil Helmeted Hornbill 2.5 – 3.1 kg/Non-territorial P NT I
Anorrhinus galeritus Bushy-crested Hornbill 0.9 – 1.2 kg/Territorial P LC II
Anthracoceros albirostris Oriental Pied Hornbill 0.6 – 0.7 kg/Territorial P LC II
Anthracoceros malayanus Malay Black Hornbill 0.6 – 1 kg/Territorial P NT II 1 Kemp (2001), 2 Kemp (1995), 3Indonesia Natural Resources Act No. 5, 1990 and Indonesia Government Regulation No. 7, 1999; 4
International Union for Conservation of Nature and Natural Resources (IUCN) 2007. 5 United Nations Environment Programme-
World Conservation Monitoring Centre (UNEP-WCMC) 2007. Abbreviation: P= Protected; NT=Near threatened; LC=Least concern;
I and II, appendices in Convention on International Trade in Endangered Species of Wild Fauna and Flora (CITES).

18
Figure 1.1. Location of Lampung Province, Sumatra, Indonesia.

CHAPTER 2
RELATIONSHIP OF HABITAT AND RESOURCE SELECTION TO SUMATRAN
HORNBILL PATCH OCCUPANCY IN SOUTHERN SUMATRA, INDONESIA1
1 Hadiprakarsa, Y., M. F. Kinnaird, T.G. O’Brien, R. Cooper and J.P. Carroll. To be submitted to Biological Conservation

20
ABSTRACT
Globally, Asian hornbill persistence is under fire due to habitat destruction by
anthropogenic causes. The ability of hornbills to persist in the landscape is species-specific with
respect to resource availability, habitat quality and landscape configuration. However, which
environmental variables are cues for hornbills to occupy forest patches are still unknown. We
investigated the relationship between habitat and resources to the probability of forest patches
being occupied by Sumatran hornbills. Our results indicate positive relationships of resources
availability, habitat characteristics, and landscape characteristics to the probability of a patch
being occupied by seven Sumatran hornbills and their detection probability. The large-bodied
non-territorial species appeared to be more flexible to occupied forest patches in fragmented
landscape. In addition, fruit resources were an important covariate to their proportion of patches
occupied. For small-bodied territorial species, availability of large trees as potential nest trees
was more important to their patch occupancy. Probability of patch occupancy was higher on low
disturbance forest patches for four hornbill species. Forest patch size was an important covariate
to estimate probability of patch occupied for at least five species of hornbills. In general, patch
isolation appeared to not have a strong affect as a covariate to estimate patch occupancy for
hornbills.
INTRODUCTION
Habitat characteristics and resource availability exert a strong influence on bird
communities and each species within the community has specific requirements (e.g., Wiens et al.
1987, Wiens 1992). The relationship between wildlife species and their habitats has been a
central issue in conservation biology studies as one of an information input for conservation
planning (e.g. Gu and Swihart 2004, MacKenzie et al. 2006). Identifying key habitat variables

21
with their spatial arrangement to which a species responds and habitat modeling to predict
species occupancy are important to develop conservation management plans for species (Gibson
et al. 2004, MacKenzie 2006) and for landscape conservation planning (Sanderson et al. 2002).
From empirical evidence, distribution and abundance, or at least occupancy of species, are
influenced by a number of factors including habitat quality (e.g., Sieving and Karr 1997, Watson
et al. 2004) and resource availability (e.g., Blake and Loiselle 1991, Kinnaird et al. 1996, Telleria
et al. 2003). However, when habitats become fragmented, these processes may add complexity
by taking account spatial arrangement of fragments must be incorporated into the process
(Villard et al. 1999, Radford and Bennett 2007).
Many ecological studies have been done using species occurrences to model habitat
relationships (e.g., Donovan and Flather 2002, Gibson et al. 2004, Moore and Swihart 2005,
MacKenzie 2006). However, this approach could lead to a serious bias due to the imperfect
detection of the target species (MacKenzie et al. 2006). Consequently, falsely predicting species
absence may be a potential source of error (Gu and Swihart 2004). Recently, MacKenzie et al.
(2006) developed a likelihood-based method for estimating the proportion of an area (patch)
occupied when the species are detected imperfectly and detection varies among species or
habitats.
Habitat fragmentation is a process through which a focal habitat type is partially or
completely removed, thereby altering its original configuration. Combination of the effects of
fragmentation, habitat loss and changes in configuration can potentially reduce population
persistence in a landscape (Villard et al. 1999). Many empirical studies suggest that forest
fragmentation can negatively effect forest bird community richness (e.g. Telleria et al. 2003,
Sodhi et al. 2005), distribution (e.g.Waltert et al. 2004, Veech 2006), abundance (e.g.Lampila et

22
al. 2005, Stouffer et al. 2006), forest occupancy (e.g. Villard et al. 1999, Gibson et al. 2004), and
in extreme cases lead to species extinction (e.g.Newmark 1991, Castelletta et al. 2000). Most of
the forest fragmentation studies on birds have come from the Neotropics and have concentrated
on understory and small—bodied species in relatively few forest patches (e.g. McGarigal and
McComb 1995, Stouffer and Bierregaard 1995, Christiansen and Pitter 1997, Lee et al. 2002).
However, there is a paucity of studies on the effects of fragmentation on large, canopy-dwelling
(Galleti 1996), and wide-ranging species, especially those in the Asian tropics (Laurance and
Bierregaard 1997).
During the last 20 years, the island of Sumatra has experienced some of the highest rates
of deforestation in the world (e.g. Laurance 1999, Holmes 2001). During 1985 – 1997, 6.7
million ha of forest were lost (FWI/GFW 2002) and all major protected areas on the island were
affected (Kinnaird et al. 2003, Linkie et al. 2004, Gaveau et al. 2007). The World Bank (2001)
reported that Lampung Province had the second highest deforestation rate of any Sumatra
province, with approximately 44% of forest cover lost over the last 12 years. There, average
forest size has declined by a factor of four, and the number of fragments has doubled
(Hadiprakarsa et al. 2007). Today, Lampung Province is the most densely human-populated and
the poorest province in Sumatra (191 people/km2; data from Indonesia’s Central Bureau of
Statistic 2000); burgeoning human populations and the coincident deforestation continue to
eliminate habitat, and what remains is highly fragmented (Hadiprakarsa et al. 2007).
Indonesia is a home for 13 hornbill (Order Coraciiformes, Family: Bucerotidae) species,
making this country the richest and the most important country for hornbill conservation in Asia
(Kinnaird and O'Brien 2007). With nine species, the second largest island, Sumatra, is the most
diverse hornbill island in the country and in the Asia realm. Sumatran hornbills inhabit lowland

23
to mountain evergreen rainforest at elevations up to 1800 m, but most are commonly found in the
primary, lowland evergreen rainforest (MacKinnon et al. 1993), Table 1). In Indonesia, few
hornbill studies were conducted in Kalimantan and Sulawesi (e.g. Leighton 1982, Suryadi et al.
1998, Kinnaird and O'Brien 1999). However, there are still information gaps for hornbill species
in Sumatra and existing information is limited to the 4 common species (Anggraini et al. 2001,
Hadiprakarsa and Kinnaird 2004, Hadiprakarsa et al. 2007). Conversely, detailed status and
distribution of hornbills, breeding biology, demographic studies, movement patterns and
dispersal are generally unavailable for most of the species (Kinnaird and O'Brien 2007).
Therefore, this knowledge gap makes it difficult to setup management and conservation priorities
of these species.
Asian hornbills are large-bodied species and are highly frugivorous (0.5 to 2.5 kg)
(Kinnaird et al. 1996, Hadiprakarsa and Kinnaird 2004). To fulfill their energy requirements,
hornbills rely heavily on fruit and a small number of small vertebrates and invertebrates in their
diet. Although nearly 500 fruit species are eaten by Asian hornbills, figs (Ficus spp.) comprise a
large proportion with an average of 69% to 98% of their overall diet (Poonswad et al. 1983,
Kinnaird et al. 1996, Datta and Rawat 2003, Hadiprakarsa and Kinnaird 2004). Their diet may
change slightly during the breeding season to adjust nutrient supplies for chick development
(Poonswad et al. 2004). In search of fruit resources that are patchily distributed, hornbills are
capable of traveling long distances (Tsuji et al. 1987, Suryadi et al. 1998, Holbrook et al. 2002).
Hornbill studies in Asia (Kinnaird 1998) and Africa (Holbrook and Smith 2000) have found that
hornbills are very effective in dispersing seeds, thus it has been suggested that hornbills are
critical agents of rain forest regeneration by dispersing seed effectively compared with other

24
frugivore species (Kinnaird 1998, Holbrook and Smith 2000, Wang and Smith 2002, Kinnaird
and O'Brien 2007).
Hornbills are secondary cavity nesting birds, and unable to excavate their own nest
cavities. A previous study found that suitable natural cavities for hornbill nests are commonly
found within large trees with a diameter at breast height over 65 cm (Poonswad et al. 2000,
Cahill 2003). Numerous Asian hornbill ecological studies, in India (Kannan and James 1999,
e.g., Datta 2001, Raman and Mudappa 2003), Thailand (e.g., Tsuji et al. 1987, Poonswad et al.
1988, Poonswad et al. 2000, Kanwatanakid-Savini and Poonswad 2007) and Indonesia (e.g.,
Leighton 1982, Kinnaird et al. 1996, Hadiprakarsa and Kinnaird 2004), showed that availability
of fruit resources, availability of large trees with suitable nest cavities and primary forest that can
hold their populations are three main features for hornbills to survive. However, alarming rates
of forest lost, deterioration of the forest landscape, and fragmentation by anthropogenic causes
has reduced current hornbill habitat in all Asia regions (Kinnaird and O'Brien 2007).
Hornbill populations may be able to persist in small forest patches and disturbed habitats
in a landscape (Datta 1998, O'Brien et al. 1998, Raman and Mudappa 2003, Sitompul et al.
2004), but this ability likely varies among species according to habitat needs, landscape
configurations, and dispersal abilities (Hadiprakarsa et al. 2007). In addition, when hornbills live
in a fragmented landscape it is likely they are forced to occupy the existing forest patches in the
landscape to maintain their persistence. However, which environmental variables, such as habitat
quality or resources, are more important as a cue for hornbills to occupy a forest patch are still
unknown. Extending from initial work of Hadiprakarsa et al. (2007), in this study we
investigated the relationship between habitat and resources as environmental predictors to the
probability of forest patches being occupied by Sumatran hornbills.
25
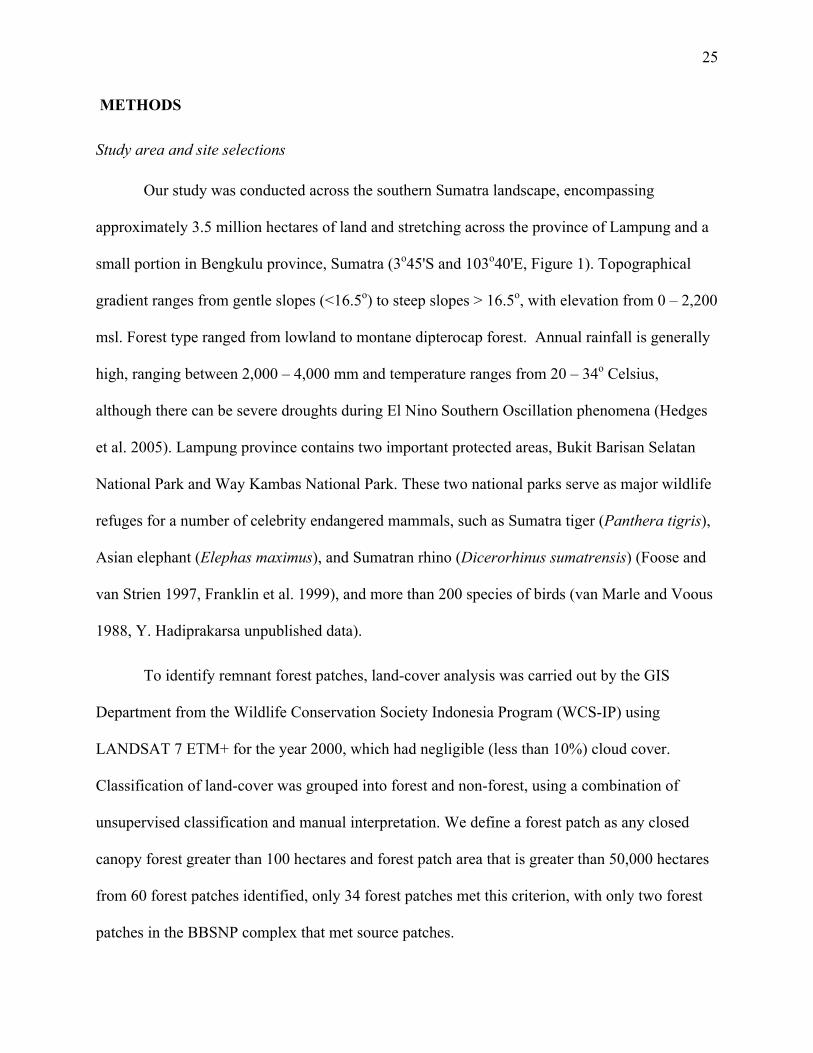
METHODS
Study area and site selections
Our study was conducted across the southern Sumatra landscape, encompassing
approximately 3.5 million hectares of land and stretching across the province of Lampung and a
small portion in Bengkulu province, Sumatra (3o45'S and 103o40'E, Figure 1). Topographical
gradient ranges from gentle slopes (<16.5o) to steep slopes > 16.5o, with elevation from 0 – 2,200
msl. Forest type ranged from lowland to montane dipterocap forest. Annual rainfall is generally
high, ranging between 2,000 – 4,000 mm and temperature ranges from 20 – 34o Celsius,
although there can be severe droughts during El Nino Southern Oscillation phenomena (Hedges
et al. 2005). Lampung province contains two important protected areas, Bukit Barisan Selatan
National Park and Way Kambas National Park. These two national parks serve as major wildlife
refuges for a number of celebrity endangered mammals, such as Sumatra tiger (Panthera tigris),
Asian elephant (Elephas maximus), and Sumatran rhino (Dicerorhinus sumatrensis) (Foose and
van Strien 1997, Franklin et al. 1999), and more than 200 species of birds (van Marle and Voous
1988, Y. Hadiprakarsa unpublished data).
To identify remnant forest patches, land-cover analysis was carried out by the GIS
Department from the Wildlife Conservation Society Indonesia Program (WCS-IP) using
LANDSAT 7 ETM+ for the year 2000, which had negligible (less than 10%) cloud cover.
Classification of land-cover was grouped into forest and non-forest, using a combination of
unsupervised classification and manual interpretation. We define a forest patch as any closed
canopy forest greater than 100 hectares and forest patch area that is greater than 50,000 hectares
from 60 forest patches identified, only 34 forest patches met this criterion, with only two forest
patches in the BBSNP complex that met source patches.

26
For each forest patch, a series of patch metric variables related to its size and isolation
were quantified. We used the patch Analyst extension version 2.3 for ArcGIS 9.x (Rampel and
Carr 2003) to measure patch size and size of nearest neighboring patch. Patch isolations, a metric
that represents distance (in km) to the nearest neighbor patch, distance to source patch and
number of patches that serve as a stepping stone to the source forest, was extracted using Nearest
Features extension version 3.8 for ArcView 3.x (Jenness 2004). Since many variables were
correlated across sites, we used principal component analysis (PCA) to summarize variation in
the data set and identify groups of inter-correlated variables to classify forest patches for survey
site selections. The PCA results grouped the forest patches into three patch size classes and two
isolation categories: small (< 1,000 ha), medium (1,000 – 5,000 ha) and large (> 5,000 – 50,000
ha), and if the patch was not isolated and located close to (< 5 km) or isolated and far from (>5
km) nearest patches and the source forest. With roughly an equal number of forest patches in
each size and isolation patch groups, we randomly selected 18 from the 34 forest patches to be
surveyed encompassing approximately 92% of the sampling area in a landscape. Most of the
surveyed forest patches were under some form of protected management status by provincial or
central government, ranging from nature forest reserves to national parks. Only one small forest
patch had a limited production forest status (Table 2.2).
Hornbill occupancy
Hornbills were surveyed during January to August 2003 in 18 forest patches across the
landscape. We used standard line transect methods (Buckland et al. 2001) to obtain hornbill
detection histories for occupancy estimation analysis. The numbers of transects walked and
transect length varied according to the forest size category and accessibility (Table 2.2). Each
transect was walked in the morning (0600-1000) and afternoon (1300-1700) on at least two days

27
for each forest patches. The detection of hornbills from visual, vocal or wing beat data, or non-
detection, was recorded for each occasion.
As transects were identified and marked, we quantified hornbill resources and habitat
quality within the forest adjacent to the line transects every 200 m with 15 m width on either side
of the transect. To assess hornbill resources, we counted the number of reproductive-sized hemi-
epiphyte fig trees (Ficus spp.; FIGS) and potential nest site trees, which I defined as trees with a
diameter at breast height (DBH) above 45 cm. Later, We estimated density (trees/ha) on each
resource parameter to be more useful for occupancy analysis. We evaluated habitat quality by
looking at the level of anthropogenic habitat disturbance. We recorded occurrences of logged
trees that meet criteria as potential nest site trees and occurrences of human activities indicated
by cutting marks, abandoned campfires or direct encounters with humans (DIST). At each
transect location, elevations (ELEV) were extracted as a global landscape covariate. In addition,
two patch covariates of forest patch size (SIZE) and degree of patch isolation (ISOL) were
obtained from the patch selection process. Elevation and slope data were extracted from a digital
elevation model (DEM) from the NASA Shuttle Radar Topographic Mission (Rabus et al. 2003).
We used the computer program PRESENCE v.2.2 to estimate the proportion of patches
occupied (PAO) and to model the factors associated with hornbill occupancy (
€
ψ) using a
likelihood-based method. This method assumes that (1) the community of species is closed to
additions (immigration and colonization), deletions (emigration or extinction) or other changes
during the study, (2) species are not falsely identified, and (3) the probability of detecting a
species at one site is independent of the probability of detecting the species at all other sites (see
MacKenzie et al. 2006). I explored the importance of covariates by modeling parameters as a
logit function of habitat variables, resource availability, and landscape characteristics. All

28
continuous variables were standardized (Table 2.3). The set of a priori candidate models was
developed based on experience and the literature. We developed a basic model that represented
the spatially explicit habitat model, where occupancy (
€
ψ ) and probability of detection (p) were
constant across forest patches. Potential covariates for occupancy and detection were then
allowed to vary, individually or in combination, i.e. ψ (covariate) p (covariate), ψ (.) p
(covariate), ψ (covariate) p (.).
Akaike’s Information Criterion (AIC) values were used as the basis to rank candidate
models and for model selection (Burnham and Anderson 2002). The most parsimonious model
for the observed data was used to estimate hornbill occupancy. When there were a number of top
ranked models with similar AIC weights model averaging was applied to estimate occupancy
from multiple models for each species (Burnham and Anderson 2002), where,
€
ω i = AIC
individual model weight and
€
ˆ θ l = individual occupancy estimate:
€
ˆ θ A = ϖ il=1
m
∑ ˆ θ l (1)
€
S.E . ˆ θ A( ) = ω il=1
m
∑ Var ˆ θ l | Ml( ) + ˆ θ l −ˆ θ 2( )
2 (2)
To determine which covariates were most important in predicting occupancy model,
model weights were summed for all models with that particular variable (Burnham and Anderson
2002). As a result, variables with high summed weights could be considered to be more
important in explaining variation in the response variable (MacKenzie et al. 2006).

29
RESULTS
Over 391 km were walked in 18 forest patches, all nine Sumatran hornbills were recorded
with at least one species recorded in every surveyed forest patch. Overall, most species were
recorded in the large forest patches with the highest number of species recorded found in source
patches (Figure 2). The common hornbill species, B. rhinoceros and R. undulatus were found in
89% and 78% of the forests patches, respectively whereas A. galeritus was found in just over
half of the forests (50%). R. vigil and B. bicornis were sighted in only 39% and 22% of the
forest patches, respectively. The more elusive species, A. albirostris, and A. malayanus, were
sighted only once or twice during the survey and were found only in the large and source forest
patches.
Because of low sample size (< 2 detection histories) for A. malayanus and A. albirostris,
only seven species were used in the analysis: B. rhinoceros, B. bicornis, R. vigil, A. undulatus A.
corrugatus, B. comatus and A. galeritus. In 18 forest patches, I recorded 366 hornbills on 56
transects with a varying number of sampling occasions from two to eight. However due to
double detection within single occasions, only 216 hornbill occurrences were included in the
analysis. The naïve estimates of occupancy varied among species. B. rhinoceros had the highest
naïve estimate (0.61), followed by R. undulatus, A. galeritus, R. vigil, B. bicornis and A.
corrugatus (0.45, 0.37, 0.29, 0.09, and 0.07, respectively). Also, the elusive species B. comatus
had the lowest naïve estimate (0.04, Table 4).
Resources selection functions
The best models for each species indicated differences in occupancy rate among species
with respect to fig density and potential nesting trees density (Table 2.4). Only two species had
simplest models, with constant occupancy and constant detection probability, was chosen as the

30
top model for only two species, R. undulatus and A. corrugatus (0.661 ± 0.126 and 0.091 ± 0.049
respectively; Table 2.4).
For other species, the ‘best’ model from the set of candidate models for each species
often included figs and density of potential nesting trees as important covariates for predicting
occupancy. Summing Akaike weights (w) of the models revealed that, with the exception of R.
undulatus and A. corrugatus, fig density and potential nesting tree density were the most
important covariates for large-bodied, non-territorial species (B. rhinoceros, B. bicornis and R.
vigil) with respect to occupancy, with summed model weight more than 50%. Potential nest tree
density was the most important variable for A. galeritus, the only small-bodied territorial species
(Figure 2.3).
Habitat relationships
Most surveyed forest patches were surrounded by a human-made matrix. Consequently,
the forest interiors were subject to some level of anthropogenic disturbance such as, illegal
logging, hunting, and land clearing for agriculture. We explored the importance of habitat quality
and patch metrics in species-specific models. The top ranked models revealed, the importance of
habitat disturbance and patch characteristics on occupancy rates for all seven-hornbill species
(Table 2.5). The highest proportion of patches occupied was found for the three large-bodied
and non-territorial species, B. rhinoceros, R. vigil and R. undulatus (Figure 2.4). For B.
rhinoceros, probability of occupancy was related to habitat disturbance level and elevation
distributions with AIC weighting (w) of 1.0 and SE = 0.05 (Table 2.5). For R. vigil, elevation
was an important covariate with respect to species occupancy (AICw = 0.66).
Probability of patch occupancy was higher in low disturbance forest patches for B.
rhinoceros, B. bicornis, B. comatus and A. galeritus (Figure 2.5). Forest patch size was an

31
important covariate in estimating occupancy for at least five hornbill species (Figure 2.6). In
general, patch isolation did not have strong affect as on patch occupancy for hornbills. For the
nomadic species, A. undulatus, habitat disturbance and patch size had no effects on the
probability of patch occupancy (Figure. 2.5 and 2.6).
Detection probability
Patterns of detection probability with respect of resource selection and habitat
relationship varied among species. Detection probabilities for large-bodied, non-territorial
species were often affected by one or more landscape characteristics of patch size, elevation and
patch isolation (Table 2.4 and 2.5). For two small-bodied territorial species, B. comatus and A.
galeritus, detection probability was affected by patch isolation. For most of hornbill species,
detection probability was high in forest patches with a high intensity of disturbance (Figure 2.5).
DISCUSSION
In this study, patch occupancy and detection probability were related to resource
availability, habitat characteristics and landscape characteristics. The large-bodied non-territorial
hornbill species appeared to be more flexible in their occupancy of forest patches in this
fragmented landscape. However, fruit resources, represented by hemi-epiphyte fig tree (Ficus
spp.) density, were an important covariate in the occupancy models.
Large-bodied species are capable fliers (Tsuji et al. 1987, Poonsward and Tsuji 1994,
Suryadi et al. 1998, Holbrook et al. 2002) and easily move between isolated forest patches in
search of transient resources: in this case, widely dispersed fruit resources and nesting sites in
large emergent trees with natural cavities. With this ability, larger species tend to be more
frugivorous (Poonswad et al. 1983, Hadiprakarsa and Kinnaird 2004) and rely on patchily
distributed fruit resources (Sitompul et al. 2004). As forest patch size decreases, the density of

32
resources may remain similar to larger forests, but the total number of resources declines.
Kinnaird and O’Brien (2007) suggested that the probability of finding a fruiting fig (Ficus spp.)
at any given time, is much lower as forest size declines because of asynchronous fruiting.
Although fig density is an important predictor of the probability of a patch being occupied, we
expect that fig density alone does not reflecting availability of ripe fruit within the landscape.
Kannan and James (1999) suggested that fruit diversity within a fragmented landscape may be a
more crucial aspect for hornbill communities (i.e., food is available all year round).
Kinnaird and O’Brien (2005) and Kinnaird et al. (1996) have demonstrated that hornbill
density in large intact forests can be affected by the density of large strangling figs, and monthly
variation in hornbill density is related to the availability of ripe fig fruit. It is possible that small
patches do not contain enough large fig trees to ensure an adequate monthly food supply month
to support resident populations. In such a situation, although a small patch might serve as a
temporary source of food or nest-sites, self-sustaining populations would not be expected.
The availability of figs as a food source for the small-bodied territorial hornbills, A.
galeritus, B. comatus and A. corrugatus, is of less important to their occupancy. With movement
restriction for this hornbill group, Leighton (1982) and Kinnaird and O’Brien (2007) suggested
that these species tends to be more of a generalist in their diet preference and rely primarily on
small fruit crops within a territory or have the ability to shift to alternate food sources such as
animal prey, leaves or gum. Conversely, availability of potential nesting trees is more defendable
for this group of species. This was explained when the potential nesting trees covariate the top
ranked model in their occupancy model selection.
Most small hornbills are territorial and sedentary and are probably less inclined to
venture to distant, unknown patches (Kinnaird and O'Brien 2007). Small-bodied territorial

33
hornbills were conspicuously absent from most forest patches, illustrating that small and isolated
forest patches may not retain species with poor dispersal capabilities (Laidlaw 2000, Brook et al.
2003). Regardless of the size of forest patches within the fragmented landscape, small patches
located within hornbill ranging distance of large patches is crucial to maintain a movement
network to source patches, where vast hornbill resources are remain.
Management implications
The results from this study suggest that hornbills may be able to persist in fragmented
landscapes. However, the ability to occupy forest patches was driven by species-specific
requirements of resources, habitats and landscape configuration. Despite differences in number
of species and occupancy, forests shared similar resource availability as well as levels of
disturbance. This result supports the notion that small forests may simply not support enough
trees to provide a sustaining resource base for a resident population of hornbills. In addition,
degree of exchange among individuals within hornbill populations inhabit different forest
patches has important implications for the maintenance of genetic diversity. We found that
small-bodied territorial hornbills tend to be more affected by habitat fragmentation. When
distance to the nearest vacant forest patch exceeds dispersal abilities, it is likely that the
probability of occupy an isolated patch very low, and their populations may eventually disappear
through a combination of stochastic events and habitat loss.
From a hornbill community perspective, the proximity of forest fragments and living in a
large neighborhood comprised of a number of fragments within flying range is an essential key
for their long-term persistence (Hadiprakarsa 2007; Kinnaird and O’Brien 2007). Therefore, in
order to deploy effective hornbill conservation, the maintenance of remnant forest patches in

34
close proximity in a large neighborhood forest complex is required for long-term persistence of a
Sumatran hornbill community.
LITERATURE CITED
Anggraini, K., M. F. Kinnaird, and T. G. O'Brien. 2001. The effects of fruit availability and
habitat disturbance on an assemblage of Sumatran hornbills. Bird Conservation
International 10:189-202.
Blake, J. G., and B. A. Loiselle. 1991. Variation in Resource Abundance Affects Capture Rates
of Birds in Three Lowland Habitats in Costa Rica. The Auk 108:114-130.
Brook, B. W., N. S. Sodhi, and P. K. L. Ng. 2003. Catastrophic extinctions follow deforestation
in Singapore. Nature 424:420-426.
Buckland, S. T., D. R. Anderson, K. P. Burnham, J. L. Laake, D. L. Borchers, K. Burnham, and
L. Thomas. 2001. Introduction to Distance Sampling: estimating abundance of biological
populations. Oxford University Press, Oxford.
Burnham, K. P., and D. R. Anderson. 2002. Model selection and and multi-model inference. .
Second Edition edition. Springer-Verlag, New York, USA.
Cahill, A. J. 2003. Nest-site characteristics of the Red-knobbed Hornbill Aceros cassidix and
Sulawesi Dwarf Hornbill Penelopides exarhatus. Ibis 145:E97-E113.
Castelletta, M., N. S. Sodhi, and R. Subaraj. 2000. Heavy Extinctions of Forest Avifauna in
Singapore: Lessons for Biodiversity Conservation in Southeast Asia. Conservation
Biology 14:1870-1880.
Christiansen, M. B., and E. Pitter. 1997. Species loss in a forest bird community near Lagoa
Santa in southeastern Brazil. Biological Conservation 80:23-32.

35
Datta, A. 1998. Hornbill abundance in unlogged forest, selectively logged forest and a forest
plantation in Arunachal Pradesh, India. Oryx 32:285-294.
_____. 2001. An ecological study of sympatric hornbills and fruiting patterns in a tropical forest
in Arunachal Pradesh. PhD Dissertation, Saurashtra University, Rajkot, India.
Datta, A., and G. S. Rawat. 2003. Foraging Patterns of Sympatric Hornbills during the
Nonbreeding Season in Arunachal Pradesh, Northeast India. BIOTROPICA 35:208-218.
Donovan, T., and C. Flather. 2002. Relationships among north American songbird trends, habitat
fragmentation, and landscape occupancy. Ecological Applications 12:364-374.
Foose, T. J., and N. van Strien. 1997. Asian Rhinos - Status survey and conservation action plan.
IUCN, Gland, Switzerland and Cambridge, UK.
Franklin, N., Bastoni, Sriyanto, D. Siswomartono, J. Manansang, and R. Tilson. 1999. Last of the
Indonesian tigers: a causes for optimism. Pages 130-147 in J. Seidensticker, S. Christie,
and P. Jackson, editors. Riding the tiger: Tiger Conservation in Human-dominated
Landscapes. Cambridge University Press, Cambridge, UK.
FWI/GFW. 2002. The State of the Forest: Indonesia. Forest Watch Indonesia, Bogor, Indonesia
and Global Forest Watch, Washington, DC.
Galleti, M. 1996. Fruits and frugivores in a Brazilian Atlantic Forest. PhD Dissertation,
University of Cambridge, U. K.
Gaveau, D. L. A., H. Wandono, and F. Setiabudi. 2007. Three decades of deforestation in
southwest Sumatra: Have protected areas halted forest loss and logging, and promoted re-
growth? Biological Conservation 134:495-504.
Gibson, L., B. Wilson, D. Cahill, and J. Hill. 2004. Spatial prediction of rufous bristlebird habitat
in a coastal heathland: a GIS-based approach. Journal of Applied Ecology 41:213-223.

36
Gu, W., and R. K. Swihart. 2004. Absent or undetected? Effects of non-detection of species
occurrence on wildlife habitat models. Biological Conservation 116:195-203.
Hadiprakarsa, Y., and M. F. Kinnaird. 2004. Foraging characteristics of an assemblage of four
Sumatran hornbill species. Bird Conservation International 14:S53-S62.
Hadiprakarsa, Y., M. F. Kinnaird, M. Iqbal, and T. G. O'Brien. 2007. Effects of forest
fragmentation on hornbills across the southern Sumatran landscape. Pages 80-91 in
Proceedings of The Active Management of Hornbills and their Habitats for Conservation,
Proceedings of the 4th International Hornbill Conference. Mabula Game Lodge, Bela-
Bela, South Africa.
Hedges, S., M. J. Tyson, A. F. Sitompul, M. F. Kinnaird, and D. Gunaryadi. 2005. Distribution,
status, and conservation needs of Asian elephants(Elephas maximus) in Lampung
Province, Sumatra, Indonesia. Biological Conservation 124:35-48.
Holbrook, K. M., and T. B. Smith. 2000. Seed dispersal and movement patterns in two species of
Ceratogymna hornbills in a West African tropical lowland forest. Oecologia 125:249-
257.
Holbrook, K. M., T. B. Smith, and B. D. Hardesty. 2002. Implications of long-distance
movements of frugivorous rain forest hornbills. Ecography 25:745-749.
Holmes, D. A. 2001. Deforestation in Indonesia: A Review of the Situation in Sumatra,
Kalimantan, and Sulawesi. World Bank. Jakarta, Indonesia.
Jenness, J. 2004. Nearest features (nearfeat. avx) extension for ArcView 3. x, v. 3.8a Available
at, http://www.jennessent.com/arcview/nearest_features.htm.

37
Kannan, R., and D. A. James. 1999. Fruiting Phenology and the Conservation of the Great Pied
Hornbill (Buceros bicornis) in the Western Ghats of Southern India. BIOTROPICA
31:167-177.
Kanwatanakid-Savini, C., and P. Poonswad. 2007. Feeding ecology and food selection of four
sympatric hornbill species at Khao Yai National Park, Thailand. Pages 195 in
Proceedings of The Active Management of Hornbills and their Habitats for Conservation,
Proceedings of the 4th International Hornbill Conference. Mabula Game Lodge, Bela-
Bela, South Africa.
Kemp, A. 2001. Familiy Bucerotidae (hornbills). in J. del Hoyo, A. Elliot, and J. Sargatal,
editors. Handbook of the Birds of the World Lynx Editions, Barcelona.
Kinnaird, M., and T. G. O'Brien. 2007. The Ecology and Conservation of Asian Hornbills:
Farmers of the Forest. The University of Chicago Press, Chicago.
Kinnaird, M. F. 1998. Evidence for Effective Seed Dispersal by the Sulawesi Red-Knobbed
Hornbill, Aceros cassidix. BIOTROPICA 30:50-55.
Kinnaird, M. F., and T. G. O'Brien. 1999. Breeding ecology of the Sulawesi Red-Knobbed
Hornbill Aceros cassidix. Ibis 141:60-69.
_____. 2005. Fast Foods of The Forest: The Influence of Figs on Primates and Hornbills Across
Wallace's Line. Pages 155-184 in J. L. Dew, and J. P. Boubli, editors. Tropical Fruits and
Frugivores: The Search for Strong Interactors. Springer.
Kinnaird, M. F., T. G. O'Brien, and S. Suryadi. 1996. Population fluctuation in Sulawesi Red-
knobbed Hornbills: tracking figs in space and time. Auk 113:431-440.

38
Kinnaird, M. F., E. W. Sanderson, T. G. O'Brien, H. T. Wibisono, and G. Woolmer. 2003.
Deforestation Trends in a Tropical Landscape and Implications for Endangered Large
Mammals. Conservation Biology 17:245-257.
Laidlaw, R. K. 2000. Effects of Habitat Disturbance and Protected Areas on Mammals of
Peninsular Malaysia. Conservation Biology 14:1639-1648.
Lampila, P., M. Monkkonen, and A. Desrochers. 2005. Demographic Responses by Birds to
Forest Fragmentation. Conservation Biology 19:1537-1546.
Laurance, W. F. 1999. Reflections on the tropical deforestation crisis. Biological Conservation
91:109-117.
Laurance, W. F., and R. O. Bierregaard. 1997. Tropical Forest Remnants: Ecology, Management,
and Conservation of Fragmented Communities. University of Chicago Press, Chicago.
Lee, M., L. Fahrig, K. Freemark, and D. Currie. 2002. Importance of patch scale vs landscape
scale on selected forest birds. Oikos 96:110-118.
Leighton, M. 1982. Fruit Resources and Patterns of Feeding, Spacing and Grouping Among
Sympatric Bornean Hornbills (Bucerotidae). PhD Dissertation, University of California,
Davis.
Linkie, M., R. J. Smith, and N. Leader-Williams. 2004. Mapping and predicting deforestation
patterns in the lowlands of Sumatra. Biodiversity and Conservation 13:1809-1818.
MacKenzie, D. I. 2006. Modeling the Probability of Resource Use: The Effect of, and Dealing
with, Detecting a Species Imperfectly. Journal of Wildlife Management 70:367-374.
MacKenzie, D. I., J. D. Nichols, J. A. Royle, K. H. Pollock, L. L. Bailey, and J. E. Hines, editors.
2006. Occupancy Estimation and Modeling: Inferring Patterns and Dynamics of Species
Occurrence. Academic Press, San Diego, USA.

39
MacKinnon, J., K. Phillipps, P. Andrew, and F. Rozendaal. 1993. A field guide to the birds of
Borneo, Sumatra, Java, and Bali. Oxford University Press, Oxford.
McGarigal, K., and W. C. McComb. 1995. Relationships Between Landscape Structure and
Breeding Birds in the Oregon Coast Range. Ecological Monographs 65:235-260.
Moore, J. E., and R. K. Swihart. 2005. Modeling patch occupancy by forest rodents:
Incorporating detectability and spatial autocorrelation with hierarchically structured data.
Journal of Wildlife Management 69:933-949.
Newmark, W. D. 1991. Tropical fragmentation and the extinction of understorey birds in the
Eastern Usambara mountains. Conservation Biology 5:67-78.
O'Brien, T. G., M. F. Kinnaird, P. Jepson, and I. Setiawan. 1998. Effect of forest size and
structure on the distribution of Sumba Wreathed Hornbills Aceros everetti. Pages 209-
217 in Proceedings of The Asian Hornbills: Ecology and Conservation, Proceedings of
the Second Asian Hornbill Workshop, Bangkok.
Poonswad, P., V. Chimchome, K. Plongmai, and P. Chuailua. 2000. Factors influencing the
reproduction of Asian Hornbills. Pages 1740-1755 in Proceedings of the 22nd
International Ornithological Congress. Durban.
Poonswad, P., a. Tsuji, and N. Jirawatkavi. 2004. Estimation of nutrients delivered to nest
inmates by four sympatric species of hornbills in Khao Yai National Park, Thailand.
ORNITHOLOGICAL SCIENCE 3:99-112.
Poonswad, P., A. Tsuji, and C. Ngarmpongsai. 1983. A study of the breeding biology of
hornbills (Bucerotidae) in Thailand. Pages 239-265 in Proceedings of a
Delacour/International Foundation for the Conservation of Birds in Captivity.

40
_____. 1988. A comparative ecological study of four sympatric hornbills (Family Bucerotidae)
in Thailand. Acta XIX congressus Internationalis Ornithologi 2:2781-2791.
Poonsward, P., and A. Tsuji. 1994. Ranges of males of the great hornbill Buceros bicornis,
brown hornbill Ptilolaemus tickelli and wreathed hornbill Rhyticeros undulatus in Khao
Yai National Park, Thailand. Ibis 136:79-86.
Rabus, B., M. Einder, A. Roth, and R. Balmer. 2003. The shuttle rada topography mission-a new
class of digital elevation models acquired by spaceborne radar. Photogrammetry and
Remote Sensing 57:241-262.
Radford, J. Q., and A. F. Bennett. 2007. The relative importance of landscape properties for
woodland birds in agricultural environments. Journal of Applied Ecology 44:737-747.
Raman, T., and D. Mudappa. 2003. Correlates of hornbill distribution and abundance in
rainforest fragments in the southern Western Ghats, India. Bird Conservation
International 13:199-212.
Rampel, R. S., and A. Carr. 2003. Patch analyst Extension for ArcView 2.3. Available at,
http://flash.lakeheadu.ca/~rrempel/patch/index.html.
Sanderson, E. W., K. H. Redford, A. Vedder, P. B. Coppolillo, and S. E. Ward. 2002. A
conceptual model for conservation planning based on landscape species requirements.
Landscape and Urban Planning 58:41-56.
Sieving, K. E., and J. R. Karr. 1997. Avian extinction and persistence mechanisms in lowland
Panama. Pages 156-170 in W. F. Laurance, and R. O. Bierregaard, editors. Tropical
forest remnants: ecology, management, and conservation of fragmented communities. .
University of Chicago Press, Chicago.

41
Sitompul, A. F., M. F. Kinnaird, and T. G. O'Brien. 2004. Size matters: the effects of forest
fragmentation and resource availability on the endemic Sumba Hornbill Aceros everetti.
Bird Conservation International 14:S23-S37.
Sodhi, N. S., T. M. Lee, L. P. Koh, and R. R. Dunn. 2005. A century of avifaunal turnover in a
small tropical rainforest fragment. Animal Conservation 8:217-222.
Stouffer, P. C., and R. O. Bierregaard. 1995. Use of Amazonian Forest Fragments by Understory
Insectivorous Birds. Ecology 76:2429-2445.
Stouffer, P. C., R. O. Bierregaard, C. Strong, and T. E. Lovejoy. 2006. Long-Term Landscape
Change and Bird Abundance in Amazonian Rainforest Fragments. Conservation Biology
20:1212-1223.
Suryadi, S., M. F. Kinnaird, and T. G. O'Brien. 1998. Home ranges and daily movements of the
Sulawesi red-knobbed hornbill Aceros cassidix during the non-breeding season. Pages
159-170 in Proceedings of The Asian hornbills: ecology and conservation. Thai Studies
in Biodiversity.
Telleria, J. L., R. Baquero, and T. Santos. 2003. Effects of forest fragmentation on European
birds: implications of regional differences in species richness. Journal of Biogeography
30:621-628.
Tsuji, A., P. Poonswad, and N. Jirawatkari. 1987. Application of radio tracking to study ranging
pattern of hornbills (Bucerotidae) in Thailand. Pages 316-351 in Proceedings of
Proceedings of the Jean Delacour/International Foundation for the Conservation of Birds
Symposium on Breeding Birds in Captivity.

42
van Marle, J. G., and K. H. Voous. 1988. The birds of Sumatra: an annotated check-list. Pages 1-
265 in British Ornithological Union Check-list 10. British Ornithological Union, Tring,
UK.
Veech, J. A. 2006. Increasing and Declining Populations of Northern Bobwhites Inhabit
Different Types of Landscapes. Journal of Wildlife Management 70:922-930.
Villard, M.-A., M. K. Trzcinski, and G. Merriam. 1999. Fragmentation Effects on Forest Birds:
Relative Influence of Woodland Cover and Configuration on Landscape Occupancy.
Conservation Biology 13:774-783.
Waltert, M., A. Mardiastuti, and M. Muhlenberg. 2004. Effects of Land Use on Bird Species
Richness in Sulawesi, Indonesia. Conservation Biology 18:1339-1346.
Wang, B. C., and T. B. Smith. 2002. Closing the seed dipersal loop. Trends in Ecology &
Evolution 17:379-385.
Watson, J. E. M., R. J. Whittaker, and T. P. Dawson. 2004. Habitat structure and proximity to
forest edge affect the abundance and distribution of forest-dependent birds in tropical
coastal forests of southeastern Madagascar. Pages 311-327 in.
Wiens, J., J. Rotenberry, and B. Horne. 1987. Habitat Occupancy Patterns of North American
Shrubsteppe Birds: The Effects of Spatial Scale. Oikos 48:132-147.
Wiens, J. A. 1992. The ecology of bird communities. Volume 1. Foundations and patterns.
Cambridge University Press, New York.
World Bank. 2001. Indonesia: Environment and Natural Resource Management in a Time of
Transition. The World Bank. Washington D.C.
(Tsuji et al. 1987, MacKinnon et al. 1993, Poonsward and Tsuji 1994, Kemp 2001)

43
Table 2.1. Scientific names with weight, territorial, elevation distributions, and home range and daily travels for nine species of
Sumatran hornbill.
Speciesa Weight (g)b Territorial b,c Elevation distribution (m) b,g
Home range (km 2) Daily travel (km)
Rhyticeros
undulatus 1,950 - 2,515 no 0 - 2500 28d 10 - 15d
corrugatus 1,273 - 1,590 no 0 - 200 ?
Buceros
rhinoceros 2,180 - 2,580 no 0 - 1000 ? > 3c,h
bicronis 2,211 - 3,400 no 0 - 1000 16.9d 10 -15 d
Rhinoplax
vigil 2,500 - 3,100 no 0 - 1000 ?
Berenicornis
comatus 1,470 - 1,476 yes 0 - 1000 ? < 2c,h
Anorrhinus
galerritus 933 - 1,172 yes 0 - 1800 1.5f < 2.5c,h
Anthracoceros
albirostris 624 - 738 yes 0 - 700 5e 4
malayanus 633 - 1,050 yes 0 - 200 3.3 2c,h a Kemp 2001; b Kemp 1995; c Kinnaird and O'Brien 2007; d Poonswad and Tsuji 1994; e Tsuji et al. 1986; f WCS-IP Unpublished data;
g MacKinnon et al. 1993; h Simulation result

44
Table 2.2.Patch and transect characteristics in sampled areas, Lampung Province, Sumatra, Indonesia.
No Forest Patch Protection Status* Category± Transect
Length (Km) Number of Transect Replication
1 Bukit Barisan Selatan (North) NP O 4 2 4
2 Bukit Barisan Selatan (South) NP O 22.2 11 44 3 G. Tanggang NR S, I 2 1 4
4 G. Seminung NR S 2 1 4
5 Air Naningan Kecil NR S, I 2 1 4 6 Mulang Mayang LF S 2 2 4
7 G. Betung NR S, I 2 1 4
8 Lima Kunci NP S 2 1 4
9 G. Pesawaran NR M, I 3 2 4 10 G. Pesagi NR M, 4 2 4
11 G.Rajabasa NR M, I 3 2 4
12 G. Tanggamus NR M, I 2.7 2 4 13 G. Sekincau NP M 2.4 2 6
14 Batu Tegi NR L 5.74 2 4
15 Tangkit Tebak NR L, I 4.2 3 4 16 Ulu Belu NR L 3 2 8
17 Way Kambas NP L, I 25 15 17
18 Lombok Area NP L 6 3 6 *NP = National Park; NR = Nature Reserve; LF = Limited production forest ±O = Source area; S = Small; M = Medium; L = Large; I
= Isolated.

45
Table 2.3. Description of covariates used in occupancy estimation as a function of resource selection and habitat relationships in
Lampung Province, Sumatra, Indonesia.
No Covariate Code Variable Type Data type Values
1 Human disturbance Dist Habitat quality Categorical 1 = High, 0 = Low
2 Potential nesting tree density Pods Resources Continuous 0 - 10.7 trees/ha
3 Figs density Figs Resources Continuous 0 - 4.96 trees/ha
4 Patch size Size Landscape Continuous 159.89 - 149,505 ha
5 Patch isolation Isol Landscape Continuous 1 = Isolated, 0 = Not isolated
6 Elevation Elev Landscape Continuous 22.8 - 1,806.54 m
7 Slope Slop Landscape Continuous 0.71 - 37.56 degree

46
Table 2.4. Estimates of occupancy (ψ) and detection probability (p) from the top ranked models for seven hornbill species as a
function of resource selection in Lampung Province, Sumatra, Indonesia.
Model ∆AIC w K -2l
€
ˆ ψ s.e
€
ˆ p Naïve
1. B. rhinoceros
1.1 ψ (Figs + Pods), p (Elev + Size + Isol) 0.00 0.36 7 244.15 0.681 0.115 0.531 0.6071 1.2 ψ (Figs), p (Elev + Size + Isol) 0.70 0.25 6 246.85 0.716 0.093 0.519 1.3 ψ (Pods), p (Elev + Size + Isol) 0.98 0.22 6 247.13 0.685 0.102 0.531 1.4 ψ (.), p (Elev + Size + Isol) 1.57 0.16 5 249.72 0.725 0.074 0.516 1.5 ψ (Figs + Pods), p (Size) 5.09 0.03 5 253.24 0.641 0.108 0.600
Model averaged 0.716 0.125 2. B. bicornis
2.1 ψ (Figs), p (.) 0.00 0.38 3 47.66 0.758 0.497 0.030 0.0893 2.2 ψ (Figs), p (Elev) 1.52 0.18 4 47.18 0.729 0.480 0.033 2.3 ψ (Figs), p (Isol) 1.55 0.18 4 47.21 0.760 0.513 0.031 2.4 ψ (Figs), p (Size) 1.98 0.14 4 47.64 0.742 0.485 0.031 2.5 ψ (Figs), p (Elev + Size + Isol) 5.16 0.03 6 46.82 0.744 0.551 0.034
Model averaged 0.682 0.1621
Notes: ψ is the probability a site is occupied by hornbill species and p is the probability of detecting hornbill in j th survey where ψ(.)
p(.) assumes that hornbills presence and detection probability are constant across sites, ∆AIC is the difference in AIC values between
each model with the low (best) model, w is the AIC model weight, K is the number of parameters in the model, -2l is twice the
negative log-likelihood e,
€
ˆ ψ is the estimated overall occupancy probability,
€
ˆ p is the estimated overall detection probability.
(Continued)

47
Table. 2.4. Continued
Model ∆AIC w K -2l
€
ˆ ψ s.e
€
ˆ p Naïve
3. R. vigil
3.1 ψ (Figs + Pods), p (Elev + Size + Isol) 0.00 0.28 7 143.94 0.480 0.148 0.269 0.286 3.2 ψ (Pods), p (Elev + Size + Isol) 0.58 0.21 6 146.52 0.494 0.147 0.263 3.3 ψ (Figs + Pods), p (Size) 1.03 0.17 5 148.97 0.415 0.116 0.404 3.4 ψ (.), p (Elev + Size + Isol) 1.35 0.14 5 149.29 0.578 0.125 0.246 3.5 ψ (Figs), p (Elev + Size + Isol) 2.07 0.10 6 148.01 0.571 0.144 0.249 3.6 ψ (Pods), p (Size) 2.26 0.09 4 152.20 0.400 0.103 0.405
Model averaged 0.488 0.200 4. R. undulatus
4.1 ψ (.), p (.) 0.00 0.16 2 193.59 0.661 0.126 0.249 0.466 4.2 ψ (.), p (Size) 0.14 0.15 3 191.73 0.632 0.115 0.271 4.3 ψ (Figs), p (.) 0.61 0.12 3 192.20 0.652 0.149 0.252 4.4 ψ (Pods), p (.) 0.87 0.11 3 192.46 0.673 0.152 0.247 4.5 ψ (.), p (Elev) 0.97 0.10 3 192.56 0.653 0.125 0.260 4.6 ψ (Pods), p (Size) 1.35 0.08 4 190.94 0.643 0.144 0.265 4.7 ψ (Figs), p (Size) 1.55 0.08 4 191.14 0.621 0.144 0.271 4.8 ψ (Figs + Pods), p (.) 1.61 0.07 4 191.20 0.663 0.167 0.250 4.9 ψ (.), p (Isol) 1.96 0.06 3 193.55 0.666 0.133 0.248 4.10 ψ (Figs), p (Elev) 1.97 0.06 4 191.56 0.642 0.152 0.262 4.12 ψ (Pods), p (Elev) 2.21 0.05 4 191.80 0.663 0.153 0.255
Model averaged 0.682 0.162 (Continued)

48
Table. 2.4. Continued
Model ∆AIC w K -2l
€
ˆ ψ s.e
€
ˆ p Naïve
5. A. corrugatus
5.1 ψ (.), p (.) 0.00 0.72 2 46.47 0.091 0.049 0.337 0.0714
5.2 ψ (Figs), p (.) 1.91 0.28 3 46.38 0.091 0.062 0.338
Model averaged 0.091 0.003 6. B. comatus
6.1 ψ (.), p (Isol) 0.00 0.24 3 26.71 0.216 0.196 0.044 0.0357
6.2 ψ (.), p (.) 0.64 0.18 2 29.35 0.119 0.126 0.090
6.3 ψ (Pods), p (Isol) 1.57 0.11 4 26.28 0.271 0.353 0.041
6.4 ψ (.), p (Elev) 1.69 0.11 3 28.40 0.121 0.119 0.087
6.5 ψ (Figs), p (Elev) 1.84 0.10 4 26.55 0.124 0.148 0.087
6.6 ψ (Pods), p (.) 2.53 0.07 3 29.24 0.124 0.154 0.089
6.7 ψ (.), p (Size) 2.64 0.07 3 29.35 0.118 0.135 0.090
6.8 ψ (Figs + Pods), p (.) 2.91 0.06 4 27.62 0.126 0.186 0.086
6.9 ψ (Pods), p (Elev) 3.26 0.05 4 27.97 0.148 0.184 0.087
6.10 ψ (Pods), p (Size) 4.53 0.03 4 29.24 0.120 0.157 0.092
Model averaged 0.162 0.072 (Continued)

49
Table. 2.4. Continued
Model ∆AIC w K -2l
€
ˆ ψ s.e
€
ˆ p
7. A. galeritus
7.1 ψ (Pods), p (Isol) 0.00 0.17 4 173.43 0.581 0.156 0.258 0.3750 7.2 ψ (Pods), p (Elev) 0.18 0.16 4 173.61 0.680 0.188 0.212 7.3 ψ (Pods), p (.) 0.23 0.16 3 175.66 0.647 0.161 0.218 7.4 ψ (Figs + Pods), p (Isol) 1.42 0.09 5 172.85 0.553 0.165 0.272 7.5 ψ (.), p (Elev) 1.51 0.08 3 176.94 0.686 0.164 0.213 7.6 ψ (Pods), p (Size) 1.73 0.07 4 175.16 0.679 0.180 0.206 7.7 ψ (Figs + Pods), p (Elev) 2.00 0.06 5 173.43 0.643 0.201 0.222 7.8 ψ (Figs + Pods), p (.) 2.02 0.06 4 175.45 0.621 0.178 0.226 7.9 ψ (.), p (Isol) 2.10 0.06 3 177.53 0.555 0.123 0.272 7.10 ψ (Figs), p (Elev) 2.81 0.04 4 176.24 0.684 0.187 0.214
Model averaged 0.612 0.176

50
Table 2.5. Estimates (ψ) and detection probability (p) from the top ranked models for seven
hornbill species as a function of habitat relationships in Lampung Province, Sumatra, Indonesia.
Model AIC ΔAIC w K -2l
1. B. rhinoceros
1.1 psi(Elev + Dist),p(Elev) 251.9 0.00 1.00 5 241.90
1.2 psi(Isol + Dist),p(Elev) 264.8 12.88 0.00 5 254.78
1.3 psi(Elev + Size + Isol + Dist),p(Elev) 269 17.10 0.00 7 255.00
2. B. bicornis
2.1 psi(Dist),p(.) 53.15 0.00 0.26 3 47.15
2.2 psi(Isol),p(.) 53.47 0.32 0.22 3 47.47
2.3 psi(Dist),p(Elev) 53.75 0.60 0.19 4 45.75
2.4 psi(Dist),p(Isol) 54.64 1.49 0.12 4 46.64
2.5 psi(Dist),p(Size) 55.08 1.93 0.10 4 47.08
2.6 psi(Isol),p(Elev) 55.19 2.04 0.09 4 47.19
3. R. vigil
3.1 psi(Elev),p(Size) 158.2 0.00 0.66 4 150.17
3.2 psi(Elev + Dist),p(Size) 159.8 1.65 0.29 5 149.82
3.3 psi(Elev + Size + Isol),p(.) 164.3 6.17 0.03 5 154.34
3.4 psi(Elev + Size + Isol),p(Elev) 165.6 7.41 0.02 6 153.58
3.5 psi(Elev + Size + Isol + Dist),p(.) 166.2 8.01 0.01 6 154.18
Notes: ψ is the probability a site is occupied by hornbill species and p is the probability of
detecting hornbill in jth survey, ∆AIC is the difference in AIC values between each model with
the low model, w is the AIC model weight, K is the number of parameters in the model, -2l is
twice the negative log-likelihood.
(Continued)

51
Table 2.5. Continued
Model AIC ∆AIC w K -2l
4. R. undulatus
4.1 psi(Size),p(Size) 190.4 0.00 0.86 4 182.44
4.2 psi(Size),p(Elev) 194.6 4.18 0.11 4 186.62
4.3 psi(Isol + Dist),p(Size) 198 7.51 0.02 5 187.95
4.4 psi(Isol + Dist),p(.) 199.6 9.12 0.01 4 191.56
4.5 psi(Isol + Dist),p(Elev) 200 9.59 0.01 5 190.03
5. A. corrugatus 5.1 psi(Isol),p(.) 46.57 0.00 0.55 3 40.57
5.2 psi(Dist),p(.) 46.95 0.38 0.45 3 40.95
6. B. comatus 6.1 psi(.),p(.) 33.35 0.00 0.14 2 29.35
6.2 psi(Dist),p(Elev) 33.93 0.58 0.10 4 25.93
6.3 psi(Size),p(Elev) 34.04 0.69 0.10 4 26.04
6.4 psi(Elev),p(Elev) 34.37 1.02 0.08 4 26.37
6.5 psi(.),p(Elev) 34.4 1.05 0.08 3 28.40
6.6 psi(Size),p(Isol) 34.56 1.21 0.07 4 26.56
6.7 psi(Dist),p(.) 34.57 1.22 0.07 3 28.57
6.8 psi(Isol),p(Isol) 34.71 1.36 0.07 4 26.71
6.9 psi(Size),p(.) 34.86 1.51 0.06 3 28.86
6.10 psi(Elev),p(.) 35.02 1.67 0.06 3 29.02
6.11 psi(.),p(Size) 35.35 2 0.05 3 29.35
(Continued)

52
Table 2.5. Continued
Model AIC ∆AIC w K -2l
7. A. galeritus 7.1 psi(Isol + Dist),p(Isol) 178.7 0.00 0.26 5 168.71
7.2 psi(Elev),p(Isol) 179.2 0.00 0.25 4 171.19
7.3 psi(Elev),p(.) 179.9 0.73 0.18 3 173.92
7.4 psi(Elev),p(Elev) 181.5 2.31 0.08 4 173.50
7.5 psi(Size),p(Isol) 181.5 2.32 0.08 4 173.51
7.6 psi(Dist),p(Isol) 181.7 2.53 0.07 4 173.72
7.7 psi(Elev),p(Size) 181.8 2.60 0.07 4 173.79
7.8 psi(Dist),p(.) 182.7 3.50 0.04 3 176.69
7.9 psi(.),p(Elev) 182.9 3.75 0.04 3 176.94
7.10 psi(Dist),p(Elev) 183.1 3.88 0.04 4 175.07
7.11 psi(.),p(Isol) 183.5 4.34 0.03 3 177.53
7.12 psi(Size),p(.) 183.7 4.55 0.03 3 177.74

53
Figure 2.1. Map of study area in southern Sumatra landscape, Indonesia. Enlargement shows
forest cover in 2000’s, elevation and surveyed forest patch locations.

54
Figure 2.2. Distribution of nine hornbill species in forest patch categories by size and patch
isolation in Lampung Province, Sumatra, Indonesia.

55
Figure 2.3. Total summed model of proportion of patch occupied as a function of resource
selection for seven hornbill species in Lampung Province, Sumatra, Indonesia. (Abbreviations:
BR = B. rhinoceros; BB = B. bicornis; RV = R. vigil; RU = R. undulatus; AC = A. corrugatus;
BC = B. comatus; AG = A. galeritus).

56
Figure 2.4. General parameter estimates from the best model for proportion of patch occupied
and detection probability (mean + 1SE) as a function of habitat relationships for seven Sumatran
hornbill species in Lampung Province, Sumatra, Indonesia. (Abbreviations: BR = B. rhinoceros;
BB = B. bicornis; RV = R. vigil; RU = R. undulatus; AC = A. corrugatus; BC = B. comatus; AG
= A. galeritus).

57
Figure 2.5. Parameter estimates with species-spesific habitat disturbance covariates (mean +
1SE). Proportion of patch occupied and detection probability for seven Sumatran hornbill
species in Lampung Province, Sumatra, Indonesia. (A) B. rhinoceros; (B) B. bicornis; (C) R.
vigil; (D) R. undulatus; (E) A. corrugatus; (F) B. comatus; (G) A. galeritus.
(d) B. comatus (e) A. corrugatus

58
Figure 2.6. Parameter estimates with species-specific response to forest patch size covariates (mean +
1SE). Bars represent proportion of patch occupied and detection probability for five Sumatran
hornbill species in Lampung Province, Sumatra, Indonesia. (A) B. rhinoceros; (B) R. undulatus;
(C) R. vigil; (D) B. comatus; (E) A. galeritus.

CHAPTER 3
PREDICTING PROBABILITY OF OCCURRENCE OF SUMATRAN HORNBILLS IN A
FRAGMENTED LANDSCAPE IN SOUTHERN SUMATRA, INDONESIA1
1 Hadiprakarsa, Y, O’Brien, T. G, Kinnaird, M. F, Cooper, R. J. and Carroll, J. P To be submitted to Journal of Applied Ecology

60
ABSTRACT
Management and conservation of wide ranging species is difficult due to their requirements of
space and resources. Hornbills in Southeast Asia are large birds and are capable of utilizing large
blocks of habitat on forested landscapes to satisfy their daily requirements. However, hornbill
persistence has been threatened due to extensive deforestation and the trend has been for rapid
decline in the future. We develop spatially explicit habitat models (SEHM), based on habitat,
human impacts, and occupancy analysis on 18 forests and fragments, for four Sumatran hornbills
(Anorrhinus galeritus, Buceros rhinoceros, Rhinoplax vigil, and Ryhticeros undulatus) to predict
probability of their occurrence in a fragmented landscape in southern Sumatra, Indonesia.
Among the three large-bodied generalist species, elevation and slope were important parameters
for species detection rate and occupancy. The importance of proximity to the settlements for
detecting A. galeritus may be explained indirectly on the predictive model results. Although our
models predicting occurrence were noisy, we found that to obtain robust predictive modeling
results for hornbill occurrences at broad scale, we suggest to cautiously choosing modeling
development strategy. To improve hornbill sampling design protocol, we suggest more
evaluation of survey techniques to improve detection rates. Our modeling results showed great
potential of this method to predicting hornbill occurrences that can be use as an alternative tool
to land managers to develop conservation priorities for Sumatran hornbills.
INTRODUCTION
More than 50% of natural habitats have been destroyed in tropical countries of the world;
much of this has been tropical rainforest (World Resources Institute 2000). Consequently,
wildlife populations have been forced to persist in forest pockets across fragmented landscapes
that are surrounded by a human-made matrix (Greenberg 1996, Bunnell 1999). The management

61
and conservation of wide ranging species is especially difficult due to their large requirements of
space (Mortberg 2001, Osborne et al. 2001, Schadt et al. 2002, Kinnaird and O'Brien 2007).
Conservation plans require an extensive knowledge of the species and how they utilize various
components of their ecosystems (Sanderson et al. 2002, Schadt et al. 2002, Shriner et al. 2006).
However, gathering this information requires a significant resource and often this information is
unavailable or is derived only from a single site.
With an alarming rate of forest loss, of the formerly forested landscape of Indonesia has
deteriorated and become fragmented by anthropogenic activity (Kinnaird and O'Brien 2007).
During the last 20 years, the island of Sumatra has experienced some of the highest rates of
deforestation in the world (e.g. Laurance 1999, Holmes 2001). During 1985 – 1997, 6.7 million
ha of forest were lost (FWI/GFW 2002) and all major protected areas on the island were
impacted (Kinnaird et al. 2003, Linkie et al. 2004, Gaveau et al. 2007). Lampung Province, the
southernmost province on the island, has witnessed the second highest deforestation rate of any
Sumatra province, with approximately 44% of forest cover lost over the last 12 years (World
Bank 2001). Today, with population density more than 191 people/km2 (Indonesia’s Central
Bureau of Statistic 2001), Lampung Province is the most densely populated and the poorest
province in Sumatra. As a result, remnant forest area in Lampung has declined, with the average
forest size declining by a factor of four, and the number of fragments doubling. Burgeoning
human populations and the coincident deforestation continue to eliminate wildlife habitat, and
what remains is highly fragmented (Hadiprakarsa et al. 2007).
Hornbills are a wildlife group of special interest in Asia. With 9 species, the second
largest island of Sumatra is the most diverse hornbill island in the country and in the Asia realm.
Asian hornbills are the largest frugivorous birds in the tropics. To fulfill their daily energy

62
requirements, hornbills are able to consume fruits up to 33% of their body weight (Poonswad et
al. 1998) and are capable of traveling long distance to track fruit resources that are patchily
distributed (Tsuji et al. 1987, Suryadi et al. 1998, Holbrook et al. 2002). Compared with other
wildlife seed dispersing agents, hornbills disperse large amount of unharmed seeds effectively
away from parent trees (Kinnaird 1998, Holbrook and Smith 2000, Wang and Smith 2002).
Thus, hornbills plat an important role in ecological functions of tropical rainforest by
maintaining forest regeneration and may promote forest ecosystem integrity (Kinnaird and
O'Brien 2007).
Previous Asian hornbill studies have shown that availability of fruit resources,
availability of large trees with suitable nest cavities, and primary forest that can hold their
populations are 3 main features necessary for hornbills to survive (e.g., Leighton 1982,
Poonswad et al. 1988, Kinnaird et al. 1996, Kannan and James 1999, Poonswad et al. 2000,
Datta 2001, Hadiprakarsa and Kinnaird 2004, Kanwatanakid-Savini and Poonswad 2007).
Unfortunately, habitat loss and deterioration has reduced current hornbill habitat throughout Asia
(Kinnaird and O'Brien 2007). The ability of hornbills to persist in this situation likely varies
among species according to habitat needs, landscape configurations, and dispersal abilities (Datta
1998, O'Brien et al. 1998, Raman and Mudappa 2003, Sitompul et al. 2004, Hadiprakarsa et al.
2007, Kinnaird and O'Brien 2007). However, in Indonesia, detailed information on hornbill
status, distribution and movement patterns are generally unavailable for most species (Kinnaird
and O'Brien 2007). Therefore, conserving hornbills at a broad scale in fragmented landscapes
become problematic.
Rapid development of geographic information system (GIS) and remote sensing (RS)
technology in few past decades has been critically important for both investigating the habitat

63
requirements of species and for conservation planning at a broad scale (e.g., Guisan and
Zimmermann 2000, Luoto et al. 2002, Linkie et al. 2004, Balaguru et al. 2006). The most
common application for this approach is to use species occurrence data to model a species
distribution (e.g., Cowley et al. 2000, Austin 2002, Munoz et al. 2005) and habitat requirements
(e.g., Brotons et al. 2004, Gibson et al. , Linkie et al. 2007) at a broad scale. Usually, the species
distribution data are correlated with a number of environmental predictors (Guisan and
Zimmermann 2000, Brotons et al. 2004). However, knowledge of the probability of detecting
these species during a survey is important for determining the reliability of predictive model
output (Shriner et al. 2006, Linkie et al. 2007). Spatially explicit habitat modeling (SEHM) is
one method that has been shown to be a good approach to identify habitat suitability and
proportion of occupancy using species occurrences data (Lennon 1999, Palma et al. 1999, Schadt
et al. 2002, Linkie et al. 2006).
Logistic regression is a common approach for assessing the relationship between
environmental characteristics and species occurrence (Osborne et al. 2001, Bradford et al. 2003,
Linkie et al. 2006). However, non-detection of a species at a site does not mean the species is
absent, unless detection probabilities are 100% (P = 1.0). Therefore, dealing with this type of
data can be problematic using ordinary logistic regression due to non-detection error that leads to
biased parameter estimation (Gu and Swihart 2004). Thus, MacKenzie et al. (2005) suggested
that field researchers collect data and undertake analysis that explicitly incorporates detection
probability to reduce these biases.
In this study, we aimed to develop spatially explicit habitat model (SEHM) of Sumatran
hornbill probability of occurrence as an approach to identify habitat requirements over a broad

64
scale that can provide an alternative management tool for hornbill conservation in the
fragmented landscape of southern Sumatra, Indonesia.
METHODS
Study area and site selection
Our study was conducted across the southern Sumatra landscape, encompassing
approximately 3.5 million ha of land and stretching across the province of Lampung and a small
portion in Bengkulu province, (3o45'S and 103o40'E, Figure 1, Chapter 2). The topographical
gradient ranges from gentle slopes (<16.5o) to steep slopes (>16.5o), with elevation from 0 to
2200 msl. Forest type ranged from lowland to montane dipterocap forest. Annual rainfall is
generally high, ranging between 2,000 – 4,000 mm and temperature range from 20 – 34o Celsius,
although there can be severe droughts during the El Niño Southern Oscillation phenomena
(Hedges et al. 2005). Lampung province contains two important protected areas, Bukit Barisan
Selatan National Park (BBSNP) and Way Kambas National Park (WKNP). These two national
parks serve as a major wildlife refuges for a number of celebrity endangered mammal species,
such as Sumatra tiger (Panthera tigris), Asian elephant (Elephas maximus), Sumatran rhino
(Dicerorhinus sumatrensis) (Foose and van Strien 1997, Franklin et al. 1999), and more than 200
species of birds (van Marle and Voous 1988, Y. Hadiprakarsa unpublished data).
To identify remnant forest patches, land-cover analysis was carried out by the GIS
Department from the WCS Indonesia Program using LANDSAT 7 ETM+ for the year 2000,
which had negligible (less than 10%) cloud cover. Classification of land-cover was grouped into
forest and non-forest, and used a combination of unsupervised classification and manual
interpretation. We defined a forest patch as any closed canopy forest greater than 100 ha and we
defined forest patch areas greater than 50,000 ha as source patches. From 60 forest patches
65
identified, only 34 forest patches met this criterion with only 2 forest patches in the BBSNP
complex that qualified as source patches criteria (Table 3.1).
For each forest patch, a series of patch metric variables related to its size and isolation
was quantified. We used the Patch Analyst extension version 2.3 for ArcView (Rampel and Carr
2003) to measure patch size and size of nearest neighboring patch. Patch isolation was
represented by distance (in km) to the nearest neighbor patch, distance to the source patch and
the number of patches that could serve as a stepping stone to the source forest, which were
extracted using the Nearest Features extension version 3.8 for ArcView (Jenness 2004). Since
many variables were correlated across sites, we used principal component analysis (PCA) to
summarize variation in the data set and identify groups with inter-correlated variables to classify
forest patches for survey site selections. The PCA results grouped the forest patches into three
size classes and two isolation categories: small (< 1,000 ha), medium (1,000 – 5,000 ha) and
large (> 5,000 – 50,000 ha), and if the patch was located close (< 5 km) to or far (>5 km) from
nearest patches and the source forest.
With roughly an equal number of forest patches in each size and isolation patch groups,
we randomly selected 18 from 34 forest patches to be surveyed encompassing approximately
92% of the sampling area in the landscape. Most of the selected forest patches were situated in
lowland forest (0 – 500 msl) to hill forest (500 – 100 msl) with gentle slope (< 16.5o, Table 1),
and were under some form of protected management status by provincial or central government,
ranging from nature forest reserves to national parks. Only one forest patch had limited
production forest status.

66
Hornbill surveys
Hornbills were surveyed during January to August 2003 in the 18 forest patches across
the landscape. We used standard distance sampling (line transect) methods (Buckland et al.
2001) to obtain hornbill detection histories for occupancy estimation analysis. A total of 56 line
transects was established with numbers and transect length varied according to forest size
category (Table 3, Chapter 2). Each transect was walked in the morning (0600-1000) and
afternoon (1300-1700) on at least 2 days for each forest patch. The detection of hornbills from
visual, vocal or wing beat data, or non-detection, was recorded on each occasion.
Landscape variables
We assessed 5 landscape parameters that we believed had the potential to affect hornbill
occurrence: forest patch size (SIZE), mean proximity to settlements (DIVE), public roads
(DIRE), elevation (ELEV) and slope (SLOP). Public roads and settlement were digitized from
1:50,000 maps produced by the Indonesian National Coordination Agency for Surveys and
Mapping (Bogor, Indonesia) and measured as the Euclidian distance to the nearest transect.
Elevation and slope data were obtained from a digital elevation model (DEM) from the NASA
Shuttle Radar Topographic Mission (Rabus et al. 2003). All spatial predictor variables were
converted into 100 m2 raster GRID format. We chose 56 sampling points that were randomly
selected within each transect. At each sampling point spatial characteristics were extracted and
log10 transformed.
Statistical analysis and model design
The best way to assess a predictive model is to test it with independent data collected
outside the dataset used to build the model (Fielding 2002); these data were unavailable in this
study. Therefore, before we ran the analysis, hornbill occurrence data were partitioned using the

67
K-fold or 2 partitioning method (Smith ,1994), with randomly and unequally sized groups called
the validation subset and training subset (Smith 1994, Fielding and Bell 1997). Fielding (2002)
suggests that the training subset should be larger than the validation subset. To determine the
ratio of data partitioning between the validation subset and training subset, we used heuristic
determination (Huberty 1994):
R = [1 + (p -1)1/2]-1 (1)
where R is the ratio of data partition and p is the number predictors. As a result, on each species,
33% (n = 19) of data were used as a validation subset and 67% (n = 37) data for training subset.
We used a 3-step process to develop a SEHM of hornbill occurrence in Lampung
province. First, we used the software PRESENCE to predict a hornbill detection probability
using hornbill detection histories on a subset of the data. Models included detection probability
as a constant p(.), or as affected by various combinations of site-specific covariates, such as
elevation. Second, results from the best detection probability (p) were incorporated into logistic
regression analysis to determine which landscape covariates, individually or in combination, best
explained the probability of hornbill presence (ψ). Candidate models from this analysis were
ranked by their Akaike Information Criterion (AIC) values (Burnham and Anderson 2002).
Third, the best candidate model was used to estimate the probability of patches occupied by each
hornbill species. For the final logistic regression model the probability of hornbill occurrence (P)
was constructed into a logistic regression model,
€
P =e(β0 +∑β iXi)1+ e(β0 +∑β iXi)
(2)
where β0 is the constant coefficient (intercept), βi is a selected independent variable coefficients
and Xi represent their associated resultant variables. The prediction maps of hornbill occurrence

68
were made by loading raster datasets of the predictor variable into ArcGIS 9.2 (ESRI, Redlands,
CA) and entering the final model equations into the raster calculator.
Model evaluation
To evaluate model performance and optimum threshold selection from the logistic
regression models for each hornbill species, we used area under the receiver operating
characteristic curve (AUC) of the receiver operating characteristic (ROC) plots (Fielding and
Bell 1997, Cantor et al. 1999). The ROC plot-based approach measures predictive power from
predictions (occupied and not occupied) of species distributions (Pearce and Ferrier 2000, Liu et
al. 2005), and has shown effectiveness in ecological modeling studies (e.g., Osborne et al. ,
Schadt et al. 2002, Linkie et al. 2004). To determine the optimum threshold of hornbill presence
from SEHM prediction results, we selected the single point in the ROC plots that was closest to
the upper-left corner (0,1). Cantor et al. (1999) suggest that the point at this corner represents a
perfect classification with 100% sensitivity and specificity. ROC plots and AUC were calculated
using SPSS software (SPSS 2007), the results are reported as the AUC ± standard error (SE) and
tests that the model results do not differ from chance (i.e., AUC = 0.5). The resultant AUC
values range from 0.5 to 1.0, where values above 0.7 indicate an accurate model fit and above
0.9 indicate a highly accurate model (Swets 1988).
RESULTS
From hornbill surveys in 18 forest patches, all 9 Sumatran hornbills were recorded with
at least one species recorded in every surveyed forest patch. We observed 366 hornbills on 56
transects with sampling occasions varying from 2 to 8 on each forest patch. Most observed
hornbills were identified by calls or wing beats (78%), and only 22% were identified visually.
However, because some hornbill species were detected twice or more within a single occasion,

69
only 216 observations qualified to be used in the analysis. We excluded 5 hornbill species that
had small numbers of total occurrences (< 6 occurrence), B. bicornis, A. corrugatus, A. galeritus,
A. albirostris and A. malayanus. As the result, only four common species were used in the final
analysis (Table 2).
The majority of our transect sampling was in lowland forest (0 – 500 msl) and hill forest
(500 – 1000 msl), with slope terrain that was accessible by observers. Due to study area and
logistical limitations, within each forest patch most of our transect sampling points were set up
relatively close with an averaged separation < 1 km apart. None of the surveyed forest patches
lacked anthropogenic disturbance (Chapter 2) and most of transects were relatively near
settlements and public roads (an average of 4.22 km with minimum distance of 0.17 km for
proximity to public roads and average of 8.19 km with minimum distance of 1.17 to 26 km for
proximity to settlements).
By comparing AIC values of competing models for each species, spatially related
gradient covariates, elevation and slopes, were important parameters to explain detection rate of
the 3 large-bodied generalist hornbill species, B. rhinoceros, R. vigil and R. undulatus.
Probability of occupancy and detection for B. rhinoceros were positively related to elevation (ψ
(Elev) = 0.87 ± 0.06, p(Elev) = 0.51 ± 0.06), and were supported with AIC weight > 50% (Table
3.3). Exploring other landscape covariates that reflected habitat disturbance, proximity to roads
and settlement, had weak support to explain detection probability of these species. However,
probability of occupancy for R. undulatus and A. galeritus was affected by proximity to
settlement with summed Akaike weight nearly 100% (Table 3.3). In contrast, for A. galeritus, the
only small-bodied territorial species in the analysis, proximity to settlement appeared to
influence their detection. Despite the largest detection probability of any of the study species, it

70
showed the most precision (0.18 ± 0.05, Model 4.1, Table 3.3). The top ranked result from each
species was then used to construct the SEHM of their probability of occurrence across the
landscape.
Visual inspection of SEHM model results shows that the importance of proximity to
settlement for detecting A. galeritus may partly explain occupancy model results. As depicted on
the SEHM predictions map (Figure 3.1-A), the higher probability of occurrence of this species
was found in areas distant to settlement. Conversely, B. rhinoceros and R. vigil showed a
relatively similar distribution of probability of occurrences in the landscape, which was
correlated with landscape terrain (Figure 3.1 B, D). The most generalist and nomadic species,
prediction of R. undulatus occurrence in the landscape likely showed actual representation of the
species occurrence (Figure 3.1-C). Most of the remnant forest patches in the landscape were
accessible for this species.
Using optimum threshold values that we selected from ROC plots results (Figure 3.4), the
probabilities of presence from SEHM predictions in surveyed and non-surveyed forest patches
indicated a similar pattern among hornbill species (Table 3.4 and 3.5). Overall, with the
exception of R. undulatus, hornbills were predicted to be absent from most non-surveyed patches
(Figure 3.2 - A). In contrast, the probability of species being present in surveyed patches was
higher (Figure 3.2-B). Forest patches those were larger than 1000 ha and not isolated received a
high percentage of the forest patch area that was predicted to be occupied by hornbills (Figure
3.3). From 16 of these forest patches, 11 (Patch ID: 1 - 11) were situated mostly within the Bukit
Barisan Selatan Landscape as defined by Gaveau et al. (2007). Five forest patches (Patch ID: 12
- 16) were mainly disturbed mangrove forest near Way Kambas National Park. One forest patch

71
(patch ID 12) nearly disappeared during the study due to heavy encroachments. Therefore, these
patches may not really all be potential habitat for hornbills.
Model evaluation of SEHM prediction results indicated that the highest model accuracy
was found for the small-bodied territorial species, A. galeritus, with 66% of the time random
selection from positive group (Sensitivity) will have a score greater than a random selection from
negative class (Specificity, Figure 3.3). B. rhinoceros and R. vigil had 57% and 52% of global
model predictions correctly classified, respectively. In contrast, model performance for the most
generalist and wide ranging species, R. undulatus, was the lowest among hornbill predication
models; only 44% from model predictions were correctly classified.
DISCUSSION
Our modeling approach to understanding hornbill occupancy of forest patches in Sumatra
provided a diversity of outcomes. Our models generally proved to be noisy and provided some
occupancy errors in both directions. That is, we predicted hornbill presence in patches were we
did not find them and we found hornbills in patches where we predicted them to not occur. This
model noise may be a result of a number of factors. For example, researchers often depend on
bold morphological characteristics and loud vocalization and wing beats, hornbills were easy to
identify by an observer during surveys. However, these cues may become less obvious when
hornbills occupy patchy environments in fragmented landscapes so that the probability of
detecting the species is more difficult. In our study, hornbill probability of detection never
exceeded 0.5. We suggest that species-specific characteristics related to the appearance and
behavior of the species, as well as the local habitat or surrounding landscape, may influence the
species detection probability.

72
The original field data used in the models was developed to attempt distance sampling
estimates of hornbill abundance using line transect. Therefore, we did not account for spatial
autocorrelation into our model. However, with clustered localization of our sampling points, we
suspected that our sampling might not be free from a spatial autocorrelation effect. Ecological
studies implicitly assume an underlying spatial pattern in the species distribution and their
environment, and there is a tendency of neighboring sample units to possess similar values than
would be expected by random chance (Legendre 1993, Smith 1994, Augustin et al. 1998).
Lichstein et al. (2002) and Betts et al. (2006) found that models that ignore the spatial
autocorrelation tend to overestimate the importance of environmental variables and could include
variables that have little or no relevance. Therefore, to avoid or reduce spatial autocorrelation
affects in future modeling studies, we suggest independently evaluating the spatial
autocorrelation effect or incorporating it into the model (as autocovariate) to calibrate model
performances. Some ecological modeling studies have found, that predictive accuracy and model
versatility tend to improve when incorporating an autocovariate term into model development
(Legendre 1993, Augustin et al. 1998, Betts et al. 2006).
Model performance and hornbill behavior
With the exception of small-bodied and territorial species, hornbills vary widely in their
ability or willingness to cross unsuitable areas in the fragmented landscape (Kinnaird & O’Brien
2007). From the SHEM prediction map results, we showed how nomadic behavior was
beneficial for R. undulatus to occupy all of the remnant forest patches in the landscape (Figure
3.1-C). Among hornbill species in Asia, the genus Rhyticeros is the most widespread, occurring
on more oceanic islands than any other genus (Kinnaird & O’Brien 2007). Some incidental
observations also recorded that R. undulatus was able to cross the 3-km wide Bali strait (van

73
Ballen personal communication.) and was able to cross between forest patches over a densely
populated area in the main capital city of Lampung Province (Y. Hadiprakarsa personal
observation).
Occupancy of A. galeritus was influenced by proximity to settlement; we also suggest it
is affected by population density. The probability of occupancy of this species was influenced
by the availability of large trees, which they need for nesting (Chapter 2). The increase of
population density may lead to the removal of large trees through agricultural encroachment or
illegal logging to support their livelihood. Kinnaird et al. (2003) and Gaveau et al. (2007)
reported that agricultural encroachment, mostly converted into coffee plantations (O'Brien and
Kinnaird 2003), was the most important factor that caused deforestation in Bukit Barisan Selatan
National Park and its surroundings. Laurance et al. (2002) also found a similar result in the
Amazonian rainforest with other species.
For the habitat-restricted species, the model for A. galeritus performed better compared to
models for the other large-bodied generalist species. Although B. rhinoceros and R. undulatus
have adequate occurrence data compared with the other species, prediction results for these
species showed poor agreement with the actual occurrences. Generalist species that occur over a
wide range of habitat types are often difficult to model, whereas species that are more limited in
habitat utilization are likely to modeled well (Dettmers and Bart 1999, Dettmers et al. 2002).
On numerous occasions, a species was predicted to be present in a forest patch but was
not observed during surveys; for wide ranging species, this result may reflect their true flexibility
to utilize virtually the whole landscape in search of a transient resource that is patchily
distributed. This phenomenon also was explained by the density fluctuation for some hornbill
species (Kinnaird et al. 1996, Anggraini et al. 2001). Conversely, species with restricted ranges,

74
a different result observed, likely due to detection probability being higher. However, when this
group of species was confirmed absent from a particular forest patch, it is likely the species was
extirpated due to unfavorable causes or some stochastic event.
Our model performances were somewhat below average with respect to AUC index
references (Swets 1988). We suspected that our model development strategy using K=2
partitioning method had influenced to the overall model performance. Wiens (2002) suggested
that performance of models is related to the tools used to construct or provide information to the
models, the data used to drive the models and the internal structure of the model themselves. In
addition the partitioning method can influence error rates; consequently, if data are partitioned,
the size of training set must be decreased and this can reduce model accuracy (Fielding and Bell
1997, Guisan and Zimmermann 2000).
Our model prediction results were probably affected by the relatively small data set used
to build the models and low detection probability. Karl et al. (2002) found that error rates of
predicting species occurrence with small sample size characterized by high estimates of
commission error (when species is predicted to be present in a forest patch but is not observed)
and high variability in omission error (when species is predicted to be absent but is observed)
estimates. Therefore, to improve model results for future work, we advise evaluating sampling
protocol designs for hornbill surveys that can capture more variability in habitat relationships at
broad scales. In this case, in accordance with MacKenzie and Royle (2005), for surveying large-
bodied, wide-ranging species with large home ranges, we suggesting retain an optimum number
of surveyed forest patches but with more repeated surveys. Conversely, for small-bodied species
with range restrictions, adding more forest patches to be surveyed will be sufficient to capture
more variability for these species.

75
Conclusions
Our results suggest that acceptable predictive models at the landscape scale can be
developed with extra caution on model development strategy. Incidence-based models may be
valid for predicting patch occupancies by filled occupancies for non-sampled patches, at the time
and place where data were collected. However, this model may fail when used as a forecasting
tool to predict future distribution patterns (Castellon and Sieving 2006).
With the large area requirements of suitable habitat for Sumatran hornbills to persist in
the landscape, conservation action for these species requires a better understanding of
relationships between species and habitat requirements. The lack of such information represents
a gap in our knowledge of habitat conservation priorities for hornbills. This study is one of the
first to apply spatial explicit modeling to predict probability of occurrence of hornbills in broad
scale. Our modeling result showed a great potential of this method to predicting hornbill
occurrences.
Application of this model will allow us to improve efficiency of conservation efforts on
hornbills. Forest patches, which have not been surveyed for hornbills, can be prioritized to allow
for better partitioning of limited conservation resources available. In addition, our model
suggests that there should be high probabilities of the species occurrence in some forest patches
where they were not detected. This suggests that we should re-survey those sites and if they are
truly not present, assessing the potential of conservation priority to the site will be beneficial
hornbill management in the future. Therefore, we would recommend further studies for
application of spatial explicit modeling approach as an alterative tool for assessing habitat
requirements for Sumatran hornbills at broad scales. Furthermore, this tool would be beneficial

76
aid for land managers to setup conservation priorities for Indonesian hornbills in fragmented
landscapes.
LITERATURE CITED
Anggraini, K., M. F. Kinnaird, and T. G. O'Brien. 2001. The effects of fruit availability and
habitat disturbance on an assemblage of Sumatran hornbills. Bird Conservation
International 10:189-202.
Augustin, N. H., M. A. Mugglestone, and S. T. Buckland. 1998. The role of simulation in
modelling spatially correlated data. Environmetrics 9:175-196.
Austin, M. P. 2002. Spatial prediction of species distribution: an interface between ecological
theory and statistical modeling. Ecological Modeling 157:101-118.
Balaguru, B., S. Britto, N. Nagamurugan, D. Natarajan, and S. Soosairaj. 2006. Identifying
conservation priority zones for effective management of tropical forests in Eastern Ghats
of India. Biodiversity and Conservation 15:1529-1543.
Betts, M. G., A. W. Diamond, G. J. Forbes, M. A. Villard, and J. S. Gunn. 2006. The importance
of spatial autocorrelation, extent and resolution in predicting forest bird occurrence.
Ecological Modelling 191:197-224.
Bradford, D., A. Neale, M. Nash, D. Sada, and J. Jaeger. 2003. Habitat patch occupancy by toads
(Bufo punctatus) in a naturally fragmented desert landscape. Ecology 84:1012-1023.
Brotons, L., W. Thuiller, M. Araujo, and A. Hirzel. 2004. Presence-absence versus presence-only
modelling methods for predicting bird habitat suitability. Ecography 27:437-448.
Buckland, S. T., D. R. Anderson, K. P. Burnham, J. L. Laake, D. L. Borchers, K. Burnham, and
L. Thomas. 2001. Introduction to Distance Sampling: estimating abundance of biological
populations. Oxford University Press, Oxford.

77
Bunnell, F. L. 1999. What habitat is an island ? Pages 1-31 in J. Rochelle, L. Lehmann, and J.
Wisniewski, editors. Forest fragmentation: wildlife and management implications. Brill,
Leiden.
Burnham, K. P., and D. R. Anderson. 2002. Model selection and and multi-model inference. .
Second Edition edition. Springer-Verlag, New York, USA.
Cantor, S., C. Sun, G. Tortolero-Luna, R. Richards-Kortum, and M. Follen. 1999. A comparison
of C/B ratios from studies using receiver operating characteristic curve analysis. Journal
of Clinical Epidemiology 52:885-892.
Castellon, T. D., and K. E. Sieving. 2006. An Experimental Test of Matrix Permeability and
Corridor Use by an Endemic Understory Bird. Conservation Biology 20:135-145.
Cowley, M. J. R., R. J. Wilson, J. L. Leon-Cortes, D. Gutierrez, C. R. Bulman, and C. D.
Thomas. 2000. Habitat-based statistical models for predicting the spatial distribution of
butterflies and day-flying moths in a fragmented landscape. Journal of Applied Ecology
37:60-72.
Datta, A. 1998. Hornbill abundance in unlogged forest, selectively logged forest and a forest
plantation in Arunachal Pradesh, India. Oryx 32:285-294.
_____. 2001. An ecological study of sympatric hornbills and fruiting patterns in a tropical forest
in Arunachal Pradesh. PhD Dissertation, Saurashtra University, Rajkot, India.
Dettmers, R., and J. Bart. 1999. A GIS modelling method aplied to predicting forest songbird
habitat. Ecological Applications 9:152-163.
Dettmers, R., D. A. Buehler, and J. B. Bartlett. 2002. A test and comparison of wildlife-habitat
modeling techniques for predicting bird occurence at a regional scale. Pages 607 - 623 in
J. M. Scott, P. J. Heglund, M. L. Morrison, J. B. Haufler, M. G. Raphael, W. A. Wall, and

78
S. F. B., editors. Predicting species occurrences: issues of accuracy and scale. Island
Press, Washington, D. C.
Fielding, A., and J. Bell. 1997. A review of methods for the assessment of prediction errors in
conservation presence/absence models. Environmental Conservation 24:38-49.
Fielding, A. H. 2002. What are the approriate characteristic of an accuracy measure? Island
Press, Washington, D. C., Washington, DC.
Foose, T. J., and N. van Strien. 1997. Asian Rhinos - Status survey and conservation action plan.
IUCN, Gland, Switzerland and Cambridge, UK.
Franklin, N., Bastoni, Sriyanto, D. Siswomartono, J. Manansang, and R. Tilson. 1999. Last of the
Indonesian tigers: a causes for optimism. Pages 130-147 in J. Seidensticker, S. Christie,
and P. Jackson, editors. Riding the tiger: Tiger Conservation in Human-dominated
Landscapes. Cambridge University Press, Cambridge, UK.
FWI/GFW. 2002. The State of the Forest: Indonesia. Forest Watch Indonesia, Bogor, Indonesia
and Global Forest Watch, Washington, DC.
Gaveau, D. L. A., H. Wandono, and F. Setiabudi. 2007. Three decades of deforestation in
southwest Sumatra: Have protected areas halted forest loss and logging, and promoted re-
growth? Biological Conservation 134:495-504.
Gibson, L., B. Barrett, and A. Burbidge. 2007. Dealing with uncertain absences in habitat
modelling: a case study of a rare ground-dwelling parrot. Diversity and Distributions
13:704-713.
Greenberg, R. 1996. Managed forest patches and the diversity of birds in southern Mexico. Pages
59-90 in J. Schelhas, and R. Greenberg, editors. Forest Patches in Tropical Landscapes.
Island Press, Washington D.C.

79
Gu, W., and R. K. Swihart. 2004. Absent or undetected? Effects of non-detection of species
occurrence on wildlife habitat models. Biological Conservation 116:195-203.
Guisan, A., and N. Zimmermann. 2000. Predictive habitat distribution models in ecology.
Ecological Modelling 135:147-186.
Hadiprakarsa, Y., and M. F. Kinnaird. 2004. Foraging characteristics of an assemblage of four
Sumatran hornbill species. Bird Conservation International 14:S53-S62.
Hadiprakarsa, Y., M. F. Kinnaird, M. Iqbal, and T. G. O'Brien. 2007. Effects of forest
fragmentation on hornbills across the southern Sumatran landscape. Pages 80-91 in
Proceedings of The Active Management of Hornbills and their Habitats for Conservation,
Proceedings of the 4th International Hornbill Conference. Mabula Game Lodge, Bela-
Bela, South Africa.
Hedges, S., M. J. Tyson, A. F. Sitompul, M. F. Kinnaird, D. Gunaryadi, and Aslan. 2005.
Distribution, status, and conservation needs of Asian elephants (Elephas maximus) in
Lampung Province, Sumatra, Indonesia. Biological Conservation 124:35-48.
Holbrook, K. M., and T. B. Smith. 2000. Seed dispersal and movement patterns in two species of
Ceratogymna hornbills in a West African tropical lowland forest. Oecologia 125:249-
257.
Holbrook, K. M., T. B. Smith, and B. D. Hardesty. 2002. Implications of long-distance
movements of frugivorous rain forest hornbills. Ecography 25:745-749.
Holmes, D. A. 2001. Deforestation in Indonesia: A Review of the Situation in Sumatra,
Kalimantan, and Sulawesi. World Bank. Jakarta, Indonesia.
Huberty, C. J. 1994. Applied discriminant analysis. John Wiley & Sons. New York, New York.
80
Indonesia’s Central Bureau of Statistic. 2001. Population Density per Square Kilometer by
Province 1971, 1980, 1990, 1995 and 2000 On the World Wide Web:
http://www.bps.go.id/sector/population/tables.shtml (Accessed on 12 February 2008)
Jenness, J. 2004. Nearest features (nearfeat. avx) extension for ArcView 3. x, v. 3.8a Available
at, http://www.jennessent.com/arcview/nearest_features.htm.
Kannan, R., and D. A. James. 1999. Fruiting Phenology and the Conservation of the Great Pied
Hornbill (Buceros bicornis) in the Western Ghats of Southern India1. BIOTROPICA
31:167-177.
Kanwatanakid-Savini, C., and P. Poonswad. 2007. Feeding ecology and food selection of four
sympatric hornbill species at Khao Yai National Park, Thailand. Pages 195 in
Proceedings of The Active Management of Hornbills and their Habitats for Conservation,
Proceedings of the 4th International Hornbill Conference. Mabula Game Lodge, Bela-
Bela, South Africa.
Kinnaird, M., and T. G. O'Brien. 2007. The Ecology and Conservation of Asian Hornbills:
Farmers of the Forest. The University of Chicago Press, Chicago.
Kinnaird, M. F. 1998. Evidence for Effective Seed Dispersal by the Sulawesi Red-Knobbed
Hornbill, Aceros cassidix. BIOTROPICA 30:50-55.
Kinnaird, M. F., T. G. O'Brien, and S. Suryadi. 1996. Population fluctuation in Sulawesi Red-
knobbed Hornbills: tracking figs in space and time. Auk 113:431-440.
Kinnaird, M. F., E. W. Sanderson, T. G. O'Brien, H. T. Wibisono, and G. Woolmer. 2003.
Deforestation Trends in a Tropical Landscape and Implications for Endangered Large
Mammals. Conservation Biology 17:245-257.

81
Laurance, W., A. Albernaz, G. Schroth, P. Fearnside, S. Bergen, E. Venticinque, and C. Da
Costa. 2002. Predictors of deforestation in the Brazilian Amazon. Journal of
Biogeography 29:737-748.
Laurance, W. F. 1999. Reflections on the tropical deforestation crisis. Biological Conservation
91:109-117.
Legendre, P. 1993. Spatial Autocorrelation: Trouble or New Paradigm? Ecology 74:1659-1673.
Leighton, M. 1982. Fruit Resources and Patterns of Feeding, Spacing and Grouping Among
Sympatric Bornean Hornbills (Bucerotidae). PhD Dissertation, University of California,
Davis.
Lennon, J. J. 1999. Resource selection functions: taking space seriously? Trends in Ecology &
Evolution 14:399-400.
Lichstein, J. W., T. R. Simons, S. A. Shriner, and K. E. Franzreb. 2002. Spatial autocorrelation
and autoregressive models in ecology. Ecological Monographs 72:445-463.
Linkie, M., G. Chapron, D. Martyr, J. Holden, and N. Leader-Williams. 2006. Assessing the
viability of tiger subpopulations in a fragmented landscape. Journal of Applied Ecology
43:576-586.
Linkie, M., Y. Dinata, A. Nugroho, and I. A. Haidir. 2007. Estimating occupancy of a data
deficient mammalian species living in tropical rainforests: Sun bears in the Kerinci Seblat
region, Sumatra. Biological Conservation 137:20-27.
Linkie, M., R. J. Smith, and N. Leader-Williams. 2004. Mapping and predicting deforestation
patterns in the lowlands of Sumatra. Biodiversity and Conservation 13:1809-1818.
Liu, C. R., P. M. Berry, T. P. Dawson, and R. G. Pearson. 2005. Selecting thresholds of
occurrence in the prediction of species distributions. Ecography 28:385-393.

82
Luoto, M., M. Kuussaari, and T. Toivonen. 2002. Modelling butterfly distribution based on
remote sensing data. Journal of Biogeography 29:1027-1037.
Mackenzie, D., and J. Royle. 2005. Methodological Insights: Designing Occupancy Studies:
General Advice and Allocating Survey Effort. Journal of Applied Ecology 42:1105-1114.
MacKenzie, D. I., J. D. Nichols, N. Sutton, K. Kawanishi, and L. L. Bailey. 2005. Improving
Inferences in Population Studies of Rare Species that Are Detected Imperfectly. Ecology
86:1101-1113.
Mortberg, U. M. 2001. Resident bird species in urban forest remnants; landscape and habitat
perspectives. Landscape Ecology 16:193-203.
Munoz, A., R. Real, A. Barbosa, and J. Vargas. 2005. Modelling the distribution of Bonelli's
eagle in Spain: implications for conservation planning. Diversity and Distributions
11:477-486.
O'Brien, T. G., and M. F. Kinnaird. 2003. Caffeine and conservation. Science 300.
O'Brien, T. G., M. F. Kinnaird, P. Jepson, and I. Setiawan. 1998. Effect of forest size and
structure on the distribution of Sumba Wreathed Hornbills Aceros everetti. Pages 209-
217 in Proceedings of The Asian Hornbills: Ecology and Conservation, Proceedings of
the Second Asian Hornbill Workshop, Bangkok.
Osborne, P. E., J. C. Alonso, and R. G. Bryant. 2001. Modelling landscape-scale habitat use
using GIS and remote sensing: a case study with great bustards. Journal of Applied
Ecology 38:458-471.
Palma, L., P. Beja, and M. Rodrigues. 1999. The use of sighting data to analyse Iberian lynx
habitat and distribution. Journal of Applied Ecology 36:812-824.

83
Pearce, J., and S. Ferrier. 2000. Evaluating the predictive performance of habitat models
developed using logistic regression. Ecological Modelling 133:225-245.
Poonswad, P., V. Chimchome, K. Plongmai, and P. Chuailua. 2000. Factors influencing the
reproduction of Asian Hornbills. Pages 1740-1755 in Proceedings of the 22nd
International Ornithological Congress. Durban.
Poonswad, P., A. Tsuji, N. Jirawatkavi, and V. Chimchome. 1998. Some aspect of food and
feeding ecology of sympatric species of hornbills species in Khao Yai National Park,
Thailand. Pages 137-153 in P. Poonswad, editor. The Asian Hornbills: Ecology abd
Conservation. National Center for Genetic Engineering and Biotechnology, Bangkok.
Poonswad, P., A. Tsuji, and C. Ngarmpongsai. 1988. A comparative ecological study of four
sympatric hornbills (Family Bucerotidae) in Thailand. Acta XIX congressus
Internationalis Ornithologi 2:2781-2791.
Rabus, B., M. Einder, A. Roth, and R. Balmer. 2003. The shuttle rada topography mission-a new
class of digital elevation models acquired by spaceborne radar. Photogrammetry and
Remote Sensing 57:241-262.
Raman, T., and D. Mudappa. 2003. Correlates of hornbill distribution and abundance in
rainforest fragments in the southern Western Ghats, India. Bird Conservation
International 13:199-212.
Rampel, R. S., and A. Carr. 2003. Patch analyst Extension for ArcView 2.3. Available at,
http://flash.lakeheadu.ca/~rrempel/patch/index.html.
Sanderson, E. W., K. H. Redford, A. Vedder, P. B. Coppolillo, and S. E. Ward. 2002. A
conceptual model for conservation planning based on landscape species requirements.
Landscape and Urban Planning 58:41-56.

84
Schadt, S., E. Revilla, T. Wiegand, F. Knauer, P. Kaczensky, U. Breitenmoser, L. Bufka, J.
Cerveny, P. Koubek, T. Huber, C. Stanisa, and L. Trepl. 2002. Assessing the suitability
of central European landscapes for the reintroduction of Eurasian lynx. Journal of
Applied Ecology 39:189-203.
Shriner, S. A., K. R. Wilson, and C. H. Flather. 2006. Reserve networks based on richness
hotspots and representation vary with scale. Ecological Applications 16:1660-1673.
Sitompul, A. F., M. F. Kinnaird, and T. G. O'Brien. 2004. Size matters: the effects of forest
fragmentation and resource availability on the endemic Sumba Hornbill Aceros everetti.
Bird Conservation International 14:S23-S37.
Smith, P. A. 1994. Autocorrelation in logistic regression modelling of species' distributions.
Global Ecology and Biogeography Letters 4:47-61.
SPSS. 2007. SPSS for Windows Release 16.0.0. SPSS Inc.
Suryadi, S., M. F. Kinnaird, and T. G. O'Brien. 1998. Home ranges and daily movements of the
Sulawesi red-knobbed hornbill Aceros cassidix during the non-breeding season. Pages
159-170 in Proceedings of The Asian hornbills: ecology and conservation. Thai Studies
in Biodiversity.
Swets, J. A. 1988. Measuring the accuracy of diagnostic systems. Science 240:1285-1293.
Tsuji, A., P. Poonswad, and N. Jirawatkari. 1987. Application of radio tracking to study ranging
pattern of hornbills (Bucerotidae) in Thailand. Pages 316-351 in Proceedings of
Proceedings of the Jean Delacour/International Foundation for the Conservation of Birds
Symposium on Breeding Birds in Captivity.

85
van Marle, J. G., and K. H. Voous. 1988. The birds of Sumatra: an annotated check-list. Pages 1-
265 in British Ornithological Union Check-list 10. British Ornithological Union, Tring,
UK.
Wang, B. C., and T. B. Smith. 2002. Closing the seed dipersal loop. Trends in Ecology &
Evolution 17:379-385.
Wiens, J. A. 2002. Predicting species occurrences: Progress, Problems, and Prospects. Pages 739
- 749 in J. M. Scott, P. J. Heglund, M. L. Morrison, J. B. Haufler, M. G. Raphael, W. A.
Wall, and S. F. B., editors. Predicting species occurrences: issues of accuracy and scale.
Island Press, Washington, D. C.
World Bank. 2001. Indonesia: Environment and Natural Resource Management in a Time of
Transition. The World Bank. Washington D.C.
World Resources Institute. 2000. World Resources. World Resources Institute. Washington,
D.C.

86
Table 3.1. Spatial statistics of forest patches derived from LANDSAT ETM+ 7 analysis in
southern Sumatra landscape, Indonesia, during 2000.
Remnant Candidate Selected
Patch number 60 34 18 Patch size (ha)
Min 0.17 153.6 153.81 Max 149,505.19 149,505.19 149,505.19
Mean 6,796.84 11,962.51 20,036.19 ST.Dev 24,109.30 31,051.10 40,775.16
Total 399,989.09 398,842.15 367,640.41
Nearest patch distance (km) Min 0.20 0.20 0.20 Max 55.94 55.94 55.94
Mean 2.30 3.72 5.55 STDEV 7.10 9.68 12.89
Forest area by elevation category (ha)a
Lowland (0 - 500 m dpl) 195,436.46 195105.03 175,802.82 Hill (500 - 1000 m dpl) 123,084.29 122,650.20 119,888.36
Lower montane (1000 - 1500 m dpl) 73,046.54 72,665.12 64,870.17 Upper montane (1500 - 2200 m dpl) 8,421.80 8,421.80 7,079.07
Forest area by slope category (ha)b
Gentle slope <16.5 Degree 315,824.06 318,622.22 290,622.22 Steep slope >16.5 Degree 84,165.03 80,219.92 77,018.19
a Forest by 4 elevation-based categories proposed by van Steenis (1961),
b Slope categories proposed by Gaveau et al. (2007).

87
Table 3.2. Common and scientific names with weight, territorial, elevation distributions, and
home range and daily travels of 4 species of Sumatran hornbills.
Speciesa Weight (g)b Territorial b,c
Elevation distribution
(m) b,g
Home range (km2)
Daily travel (km)
Wreathed hornbill (Rhyticeros undulatus) 1,950 - 2,515 no 0 - 2500 28d > 5
Rhinoceros hornbill (Buceros rhinoceros) 2,180 - 2,580 no 0 - 1000 ? 10 – 15d
Helmeted hornbill (Rhinoplax vigil) 2,500 - 3,100 no 0 - 1000 ?
Bushy-crested hornbill (Anorrhinus galeritus) 933 - 1,172 yes 0 - 1800 1.5f < 2.5c,h
Bushy-crested hornbill
aKemp 2001; bKemp 1995; cKinnaird and O'Brien 2007; dPoonswad and Tsuji 1994; eTsuji et al.
1986; fWCS-IP Unpublished data; gMacKinnon et al. 1993; hSimulation result.

88
Table 3.3. Summary of model selection procedures and parameter estimate to develop models of probability of occurrence for 4
Sumatran hornbills in Lampung Province, Sumatra, Indonesia.
Model AIC ΔAIC w K -2l ψ S.E p S.E 1. B. rhinoceros
1.1 psi(Elev),p(Elev) 165.89 0 0.42 4 157.89 0.87 0.06 0.51 0.06 1.2 psi(Elev),p(Elev + Slop) 167.86 1.97 0.16 5 157.86 1.3 psi(Elev),p(Elev + Dive) 167.88 1.99 0.15 5 157.88 1.4 psi(Elev),p(Elev + Dire) 167.88 1.99 0.15 5 157.88 1.5 psi(Elev),p(Elev + Dire + Dive) 169.83 3.94 0.06 6 157.83 1.6 psi(Elev),p(Elev + Slop + Dive) 169.84 3.95 0.06 6 157.84 1.7 psi(Elev),p(Elev + Slop + Dire) 169.84 3.95 0.05 6 157.84
2. R. vigil 2.1 psi(.),p(Slop) 104.23 0 0.28 3 98.23 0.41 0.10 0.47 0.07 2.2 psi(Elev),p(Slop) 105.65 1.42 0.14 4 97.65 2.3 psi(.),p(Slop + Dire) 105.96 1.73 0.12 4 97.96 2.4 psi(.),p(Elev + Slop) 106.22 1.99 0.10 4 98.22 2.5 psi(.),p(Slop + Dive) 106.22 1.99 0.10 4 98.22 2.6 psi(Dive),p(Slop) 106.23 2 0.10 4 98.23 2.7 psi(Elev),p(Slop + Dire) 107.19 2.96 0.06 5 97.19 2.8 psi(Elev),p(Elev + Slop) 107.53 3.3 0.05 5 97.53 2.9 psi(Elev),p(Slop + Dive) 107.64 3.41 0.05 5 97.64
2.10 psi(.),p(Slop + Dire + Dive) 107.82 3.59 0.04 5 97.82
Notes: ψ is the probability a site is occupied by hornbill species and p is the probability of detecting hornbill in j th survey, ∆AIC is
the difference in AIC values between each model with the low model, w is the AIC model weight, K is the number of parameters in
the model. (Continued)

89
Table 3.3. Continued
Model AIC ΔAIC w K -2l ψ S.E p S.E
3. R. undulatus 3.1 psi(Dive),p(Elev) 128.28 0 0.24 4 120.28 0.63 0.13 0.29 0.08 3.2 psi(Dive),p(Dire) 128.41 0.13 0.23 4 120.41 3.3 psi(Dive),p(Dive) 128.56 0.28 0.21 4 120.56 3.4 psi(Dive),p(Elev + Dive) 130.08 1.8 0.10 5 120.08 3.5 psi(Dive),p(Elev + Dire) 130.27 1.99 0.09 5 120.27 3.6 psi(Dive),p(Dive + Dire) 130.29 2.01 0.09 5 120.29 3.7 psi(.),p(Dive) 131.35 3.07 0.05 3 125.35
4. A. galeritus 4.1 psi(Elev),p(Dive) 116.47 0.33 0.37 4 108.47 0.79 0.11 0.18 0.05 4.2 psi(Elev),p(Elev) 117.99 1.85 0.12 4 109.99 4.3 psi(Elev),p(Slop) 118.11 1.97 0.12 4 110.11 4.4 psi(Elev),p(Dir) 118.13 1.99 0.11 4 110.13 4.5 psi(Elev),p(Elev + Slop + Dive) 118.83 2.69 0.08 6 106.83 4.6 psi(Elev),p(Elev + Dire + Dive) 119.02 2.88 0.07 6 107.02
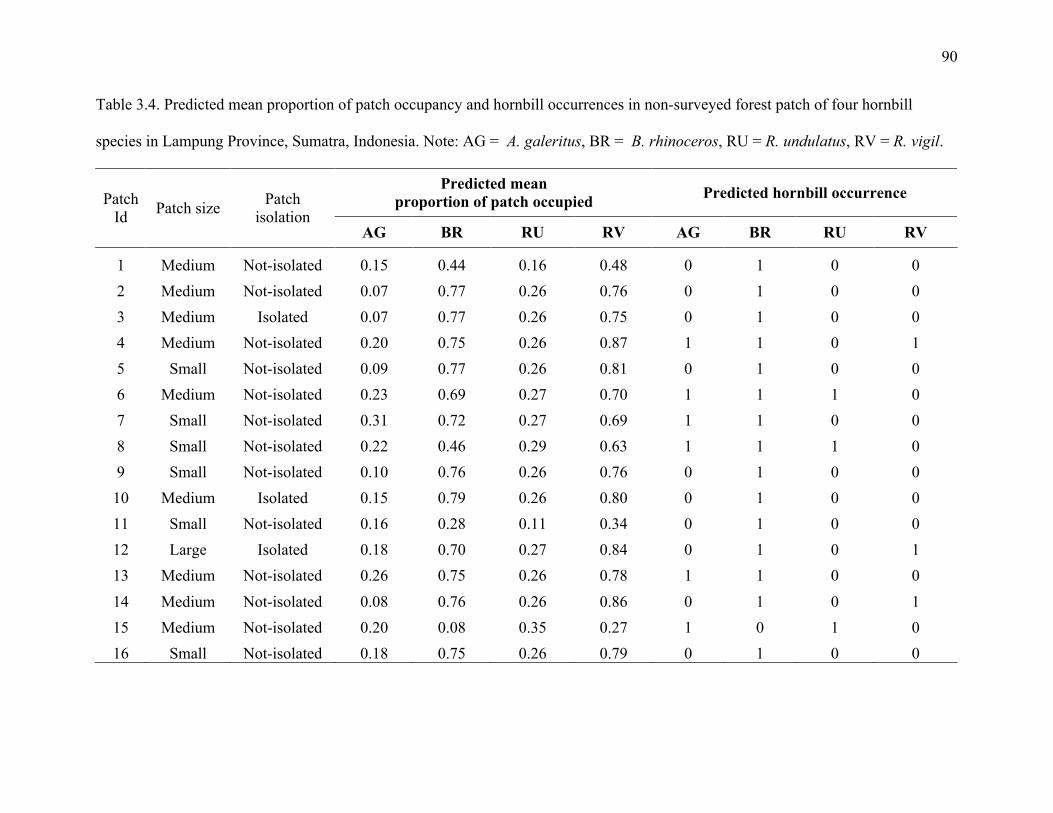
90
Table 3.4. Predicted mean proportion of patch occupancy and hornbill occurrences in non-surveyed forest patch of four hornbill
species in Lampung Province, Sumatra, Indonesia. Note: AG = A. galeritus, BR = B. rhinoceros, RU = R. undulatus, RV = R. vigil.
Predicted mean proportion of patch occupied Predicted hornbill occurrence Patch
Id Patch size Patch isolation
AG BR RU RV AG BR RU RV
1 Medium Not-isolated 0.15 0.44 0.16 0.48 0 1 0 0 2 Medium Not-isolated 0.07 0.77 0.26 0.76 0 1 0 0 3 Medium Isolated 0.07 0.77 0.26 0.75 0 1 0 0 4 Medium Not-isolated 0.20 0.75 0.26 0.87 1 1 0 1 5 Small Not-isolated 0.09 0.77 0.26 0.81 0 1 0 0 6 Medium Not-isolated 0.23 0.69 0.27 0.70 1 1 1 0 7 Small Not-isolated 0.31 0.72 0.27 0.69 1 1 0 0 8 Small Not-isolated 0.22 0.46 0.29 0.63 1 1 1 0 9 Small Not-isolated 0.10 0.76 0.26 0.76 0 1 0 0 10 Medium Isolated 0.15 0.79 0.26 0.80 0 1 0 0 11 Small Not-isolated 0.16 0.28 0.11 0.34 0 1 0 0 12 Large Isolated 0.18 0.70 0.27 0.84 0 1 0 1 13 Medium Not-isolated 0.26 0.75 0.26 0.78 1 1 0 0 14 Medium Not-isolated 0.08 0.76 0.26 0.86 0 1 0 1 15 Medium Not-isolated 0.20 0.08 0.35 0.27 1 0 1 0 16 Small Not-isolated 0.18 0.75 0.26 0.79 0 1 0 0

91
Table 3.5. Predicted mean proportion of patch occupancy and hornbill occurrences with observed occurrences in surveyed forest patch
of four hornbill species in Lampung Province, Sumatra, Indonesia. Note: AG = A. galeritus, BR = B. rhinoceros, RU = R. undulatus,
RV = R. vigil. Predicted occurrences are bolded when the model suggested that the species was present but not actually observed, and
italicized when the model predicted no occurrence, but we actually found the species to be present.
Predicted mean proportion of patch occupied Predicted hornbill occurrence Observed hornbill
occurrence Patch Id
Patch size
Patch isolation AG BR RU RV AG BR RU RV AG BR RU RV
17 Small Isolated 0.19 0.69 0.27 0.81 1 1 1 0 0 1 1 0 18 Small Isolated 0.05 0.80 0.26 0.84 0 1 0 1 0 1 1 0 19 Medium Isolated 0.01 0.58 0.21 0.69 0 1 0 0 0 1 1 0 20 Large Isolated 0.01 0.40 0.23 0.46 0 1 0 0 1 1 1 1 21 Large Isolated 0.19 0.63 0.28 0.76 0 1 1 0 0 1 1 1 22 Medium Not-isolated 0.04 0.74 0.26 0.69 0 1 0 0 0 1 1 0 23 Small Not-isolated 0.28 0.71 0.27 0.83 1 1 0 1 0 0 1 0 24 Medium Isolated 0.36 0.77 0.26 0.84 1 1 0 1 1 1 0 0 25 Large Not-isolated 0.33 0.16 0.33 0.12 1 0 1 0 1 1 1 0 26 Medium Isolated 0.23 0.72 0.27 0.83 1 1 0 1 0 1 0 0 27 Small Isolated 0.18 0.11 0.27 0.10 0 0 1 0 0 1 0 0 28 Medium Not-isolated 0.26 0.76 0.26 0.84 1 1 0 1 1 0 1 0 29 Large Not-isolated 0.09 0.75 0.26 0.83 0 1 0 1 1 1 1 1 30 Large Not-isolated 0.21 0.78 0.26 0.84 1 1 0 1 1 1 0 1 31 Small Not-isolated 0.62 0.06 0.36 0.06 1 0 1 0 1 1 1 1 32 Small Not-isolated 0.61 0.07 0.36 0.08 1 0 1 0 0 1 1 0 33 Source Source 0.48 0.07 0.36 0.07 1 0 1 0 1 1 1 1 34 Source Source 0.11 0.74 0.26 0.70 0 1 0 0 1 1 1 1

92
Figure 3.1. Predicted probability of occurrence maps for 4 hornbill species in Lampung Province, Sumatra, Indonesia. (A) A.
galeritus, (B) B. rhinoceros, (C) R. undulatus, (D) R. vigil. Patches that were surveyed during field research are outlined in red and
those that have not been surveyed are not outlined. Number on each patch represent of patch ID.
(A)

93
(B)

94
(C)

95
(D)

96
Figure 3.2. Percentage of total patch area of prediction occurrences in non-surveyed (A) and
surveyed area (B) for 4 Sumatran hornbills in Lampung Province, Sumatra, Indonesia. Note: AG
= A. galeritus, BR = B. rhinoceros, RU = R. undulatus, RV = R. vigil.

97
Figure 3.3. Percentage of probability of presences in non-surveyed forest patches. Grouped by
forest patch size (A) and forest isolation (B) for 4 Sumatran hornbills in Lampung Province,
Sumatra, Indonesia. Note: AG = A. galeritus, BR = B. rhinoceros, RU = R. undulatus, RV = R.
vigil.

98
Figure 3.4. Receiver operating characteristic (ROC) plots of developed model of 4 hornbill
species. (A) A. galeritus, (B) B. rhinoceros, (C) R. undulatus, (D) R. vigil. Note: Diagonal
segment produced by ties. S.E was under the non-parametric assumption, P was asymptotic
significance with null hypothesis of true area = 0.5. AUC values of > 0.7 is considered good fit
and > 0.9 is very good. Ot was optimum threshold selected.

99
CHAPTER 4
CONCLUSIONS
Important of resource and habitat quality to hornbill occupancy
Occupancy estimation results suggest a positive relationship of resources availability and
habitat characteristics, as well as landscape characteristics to the patch occupancy of seven
Sumatran hornbills and their detection probability. Fig density and potential nesting tree density
were important covariates to patch occupancy estimates for three large-bodied, non-territorial
species (B. rhinoceros, B. bicornis and R. vigil) with summed model weights of more than 50%.
With movement restriction for small-bodied and territorial species, availability of potential
nesting trees was more important for this group of species.
Patch occupancy was higher in low disturbance forest patches for all four hornbill
species. Forest patch size was an important covariate to estimate probability of patch occupancy
for at least five species of hornbill. In general, patch isolation appeared to not have a strong
affect as a covariate to estimate patch occupancy for hornbills. The ability to occupy forest
patches was driven by species-specific requirements of resources, habitats and landscape
configuration.
The large-bodied non-territorial hornbill species appeared to be more flexible in their
ability to occupy forest patches in a fragmented landscape. For small bodied species, distance to
the nearest vacant forest patch tends to exceed dispersal abilities, it is likely that the probability

100
of occupying an isolated patch becomes very low, and their populations may eventually
disappear through a combination of stochastic events and habitat loss.
Predicting Sumatran hornbill occurrences
For three large-bodied generalist species, B. rhinoceros, R. vigil and R. undulatus,
elevation and slopes, were important parameters to species detection rate. Patch occupancy and
detection estimates for B. rhinoceros were positively related to elevation. For R. undulatus and
A. galeritus, patch occupancy was affected by proximity to settlement with summed Akaike
weight nearly 100%.
Model evaluation of SEHM results showed A. galeritus, had the highest accuracy (66%),
whereas B. rhinoceros and R. vigil had 57% and 52% of global model predictions correctly
classified, respectively. In contrast, model performance for the most generalist and wide ranging
species, R. undulatus, was the lowest among hornbill predication models; only 44% from model
predictions was correctly classified. Generalist species in this model tend to be difficult to model,
whereas species that are more limited in habitat utilization are likely to be modeled well.
Because of clustered localization of our sampling points, we suspected that our sampling
might not be free from spatial autocorrelation effects. Therefore, independent evaluation of
spatial autocorrelation effects or incorporating these effects into the model (as an autocovariate)
may be beneficial to reduce spatial autocorrelation effects. In addition, with low probability of
detection over large areas and a relatively small data set used to build the models, these may
have also influenced model prediction results.
Because of low detection probability for hornbills, I suggest an improved sampling
design protocol for hornbill surveys. For large-bodied, wide-ranging species with large home

101
ranges, I suggest retaining an optimum number of surveyed forest patches, but with more
repeated surveys. Conversely, for small-bodied species with range restrictions, adding more
forest patches to be surveys will be sufficient to capture more variability for these species.
Application of this model showed a great potential of this method to predicting hornbill
occurrences and can be used as a tool to improve efficiency of conservation efforts for hornbills.
Model results suggest that there should be high probabilities of the species occurrence in some
forest patches where they were not detected. If hornbills are truly not present, then the
conservation potential of those sites should be assessed for future hornbill management.
Furthermore, this tool should be a beneficial aid for land managers to setup conservation
priorities for Indonesian hornbill in fragmented landscapes.