Forest Monitoring in the United States - Homepage | UNECE
39
U.S. Forest Inventory and Analysis Overview 2015 F I A Forest Monitoring in the United States Evolution and Impact in a Changing World W. Brad Smith Associate National Program Manager, FIA A partnership program for over 80 years
Transcript of Forest Monitoring in the United States - Homepage | UNECE

U.S. Forest Inventory and Analysis Overview 2015
F I A
Forest Monitoring in the United States
Evolution and Impact in a Changing World
W. Brad Smith
Associate National Program Manager, FIA
A partnership program for over 80 years

U.S. Forest Inventory and Analysis Overview 2015
F I A The Inventory Vision
since 1928
Provide an integrated inventory and monitoring program capable of providing current, scientifically reliable
indicators of sustainable forestry
Common definitions,
standard protocols, and
core consistency across
spatial scales over time
1934 Michigan field crews

U.S. Forest Inventory and Analysis Overview 2015
F I A U.S. inventory operations cover 300+ million
hectares of forest across 12 time zones … and over 100 degrees of latitude!
From the Artic
Circle to the
Tropic of
Capricorn.
From the Virgin
Islands to Palau,
west of Sidney
Offices Portland
Ogden
Knoxville
St Paul
DC
How do you
sample uniformly
over such a large
area?

U.S. Forest Inventory and Analysis Overview 2015
F I A Soccer provides a solution…
or more specifically triangle tessellated hexagons>
Base hexagon positioned over
the conterminous United States
2011
2012
2013
2014
2015
Plot intensity
1X
2X
3X
1/16 of Base
Subdivided into smaller hexagons
The systematic grid allows flexible analysis using spatial layer overlays of the client’s choice to summarize data.
The hex cell grid allows equal
spacing of samples regardless
of latitude.
Measure Year
Cell = 2,500 ha
Sampled by year

U.S. Forest Inventory and Analysis Overview 2015
F I A
Sample Plot
A 4-point
cluster plot
with nested
elements for
efficient
sampling
Total area 0.4 ha
Total area of subplots 0.07 ha
7.3 m 18.0 m
36.6 m
2.1 m
2.1 m
3.7 m

U.S. Forest Inventory and Analysis Overview 2015
F I A
Quality by Design
Quality Assurance (QA)
• 20,000 forest plots measured annually across the U.S.
• 1,600 or 8% of these plots are randomly revisited the same year to verify measurement quality
Accuracy
• Area +/- 1% per million hectares
• Volume +/- 3% per 100 million cubic meters

U.S. Forest Inventory and Analysis Overview 2015
F I A
Inventory Budget for U.S.
The U.S. inventory costs about 1.5 million per year per 6 million hectares of forest or the average
forest area of an EU country
Partners contribute 6.9 million annually
138,000 per 6 million ha
FIA contracts 10.0 million annually
200,000 per 6 million ha
Euro basis
U.S. Forest Inventory and Analysis Overview 2015
F I A
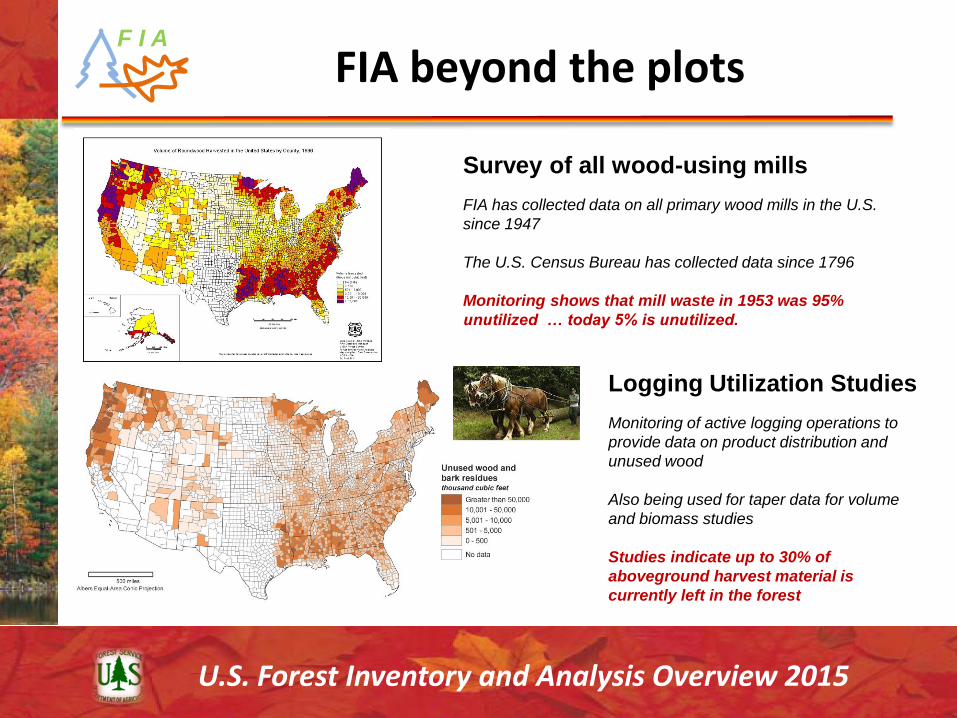
FIA beyond the plots
Survey of all wood-using mills
FIA has collected data on all primary wood mills in the U.S.
since 1947
The U.S. Census Bureau has collected data since 1796
Monitoring shows that mill waste in 1953 was 95%
unutilized … today 5% is unutilized.
Logging Utilization Studies
Monitoring of active logging operations to
provide data on product distribution and
unused wood
Also being used for taper data for volume
and biomass studies
Studies indicate up to 30% of
aboveground harvest material is
currently left in the forest

U.S. Forest Inventory and Analysis Overview 2015
F I A
Ownership and Biomass
Forest Ownership Studies
Began in 1953 and FIA has conducted 4
National Ownership studies since 1978
Provides data on the goals and objectives of the
nation’s 10 million private forest landowners
Forest Biomass Reporting
FIA has reported U.S. forest carbon to IPCC
annually since 1994
A new study is in progress to improve biomass
estimation for a broader range of customers

U.S. Forest Inventory and Analysis Overview 2015
F I A
Invasive Species Monitoring Percent of forested subplots invaded by at least one monitored invasive plant
Health Risk Monitoring
FIA data is used to assist the Forest Health Protection Program (FHP) in modeling and evaluating areas at significant risk of insect and disease mortality
Forest Health

U.S. Forest Inventory and Analysis Overview 2015
F I A
Forest Fuel Monitoring
FIA data shows where fuels are
building… Integrating a humidity
index and the West will look far
worse than the East
Acres burned
0
2
4
6
8
10
12
19
60
19
65
19
70
19
75
19
80
19
85
19
90
19
95
20
00
20
05
Millio
n a
cre
s
Continued monitoring will be
crucial to evaluating the effects of
fuel treatments and the interval at
which fuels return
Down woody material
Recent fire trends

U.S. Forest Inventory and Analysis Overview 2015
F I A
Forest cover- then and now
Change since 1873 Census map FIA product in the current National Atlas of the U.S.
1873 Census forest cover map

U.S. Forest Inventory and Analysis Overview 2015
F I A
FIA Reporting Spans Spatial Scales
Local
Sub-State region State Regional/
National
Global National multi-sector Multi-national Process

U.S. Forest Inventory and Analysis Overview 2015
F I A
In depth analysis of forestry related events…
U.S. Department of Agriculture - Forest Service - Research & Development
Forest Inventory and AnalysisThe Nation’s Forest Census
F I A
Forest Products Journal, May 2011

U.S. Forest Inventory and Analysis Overview 2015
F I A
The main events: 2005-2009
Source: Census Bureau
Source: Forest Inventory and Analysis
1,000 mills close
Housing starts decline 75%
1 million jobs lost … more forest-related jobs lost than the U.S. auto
industry that received a government bailout!
Source: Bureau of Labor Statistics

U.S. Forest Inventory and Analysis Overview 2015
F I A
AVAILABLE on
FIA website in
5 other languages
Spanish
French
Russian
Chinese
Portuguese
U.S. Forest Facts & Trends
summary of
the status
and trends
in the
nation’s
forests
English measure Metric measure

U.S. Forest Inventory and Analysis Overview 2015
F I A
Moving
forward

U.S. Forest Inventory and Analysis Overview 2015
F I A
WHERE DO TREES GROW AND WHY?
Ecological Provinces or Biomes
Current Extent of Forests
Important Tree Species Ranges
Types of Forest Communities
WHAT LIVES IN THE FOREST?
Wildlife Habitat
Forest Birds
Forest Fish and Aquatic Species
Forest Mammals
WHAT SHAPES THE FOREST?
Native Plants, Insects, Diseases
Non-native Plants, Insects, Diseases
Wildland Fire as a Natural Disturbance
Wildland Fire Management
Providing Quality Wood Products While
Sustaining Our Forests
Planted Forests
Our Changing Forests
HOW WE BENEFIT FROM FORESTS
Clean Water
Wilderness
Nature-Based Outdoor Recreation
Agroforestry
Urban Forests
Carbon Stocks
Wood Products in Everyday Life
Forest Industries Keep America
Working
OUR FUTURE FORESTS
Who Owns the Forests
America’s Private Forest Owners
Public Forest Ownership
Forests and the Carbon Cycle
Forests on the Move
CONTENTS
A new Forest Atlas
http://forest-atlas.fs.fed.us/
FIA is working with ESRI to produce additional online products

U.S. Forest Inventory and Analysis Overview 2015
F I A
Felled Tree Biomass Study
10 species in the West (250 trees thru 2014)
20 species in the East (450 trees thru 2014)
Species representing 75% of the nation’s forest volume
Cooperators/Technical assistance
6 Universities
4 Industries and NGOs
U.S. Forest Products Laboratory
Forest Management Service Center
Compatible component
measures will allow
maximum user flexibility

U.S. Forest Inventory and Analysis Overview 2015
F I A
Land Cover/Land Use Studies
National Land Cover Dataset (NLCD)
FIA data used to validate the tree cover layer of this multi-
class dataset
Image Change Estimation (ICE)
A new FIA project to classify the land use,
land cover, and change for all FIA plots
(forest and non-forest) on the NAIP schedule
(~ 375,000 plots or every 5km, every 3 years)
National Agriculture Imagery Program (NAIP) -1 meter resolution

U.S. Forest Inventory and Analysis Overview 2015
F I A Using the entire FIA plot grid for
Image Change Estimation (ICE)
375,000 total
grid plots
FIA will have field
samples on 75%
of total land area

U.S. Forest Inventory and Analysis Overview 2015
F I A
Image Change Estimation (ICE)
Agent of Change (% of total)
Georgia example
Most
harvest
area
replanted
(not same
area but
reflective of
trend)

U.S. Forest Inventory and Analysis Overview 2015
F I A
Linked remote-sensing products dramatically reduce
variability in vegetation estimates for difficult-to-reach
environments such as interior Alaska.
A swath of high-resolution lidar 3-D forest canopy measurements near Tok, Alaska.
An approach with LIDAR and Landsat together reduced
estimates of residual variability for biomass by up to 36
percent relative to using Landsat alone.
New Frontiers in Alaska
Lidar point cloud.

U.S. Forest Inventory and Analysis Overview 2015
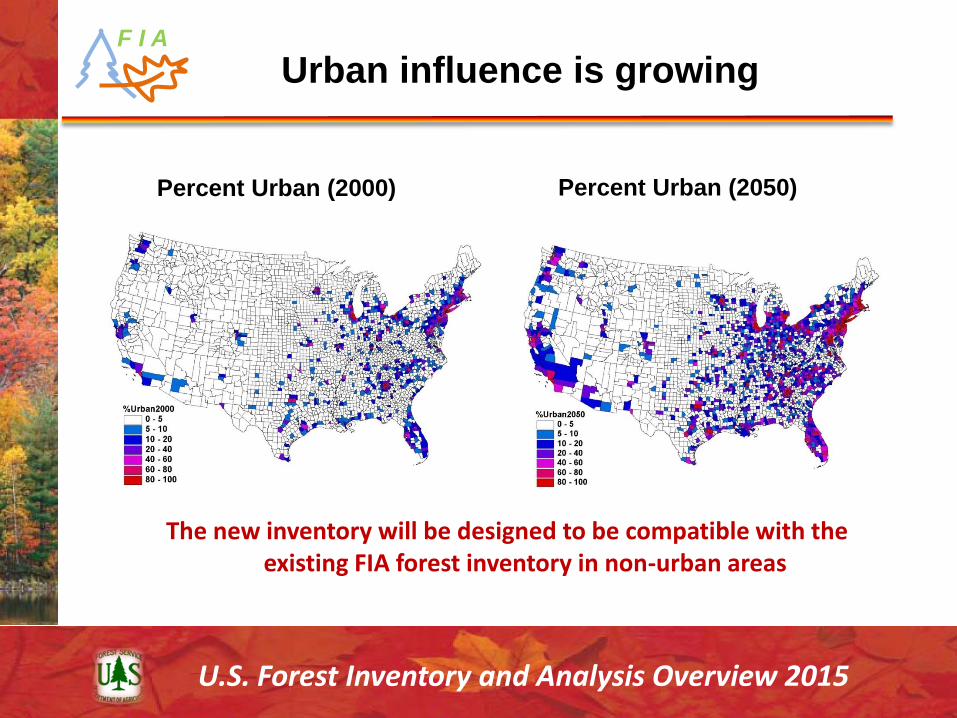
F I A Monitoring Urban Land
new national legislation includes urban tree monitoring
U.S. Forest Inventory and Analysis Overview 2015
F I A
Percent Urban (2050) Percent Urban (2000)
Urban influence is growing
The new inventory will be designed to be compatible with the existing FIA forest inventory in non-urban areas

U.S. Forest Inventory and Analysis Overview 2015
F I A
Traditional FIA vs Urban 1/6 Acre Plot
Urban FIA plot design: -1/6 Acre Subplot, 48’ Radius: tree sample -Four 6.8’ radius Microplots: sapling sub-sample - Four 2 m radius micro plots
- 0.002 ha, 14.6 m radius: Standard
FIA plot
Urban
FIA plot

U.S. Forest Inventory and Analysis Overview 2015
F I A
Initial surveys- 8 cities
Providence
Baltimore
Austin
St Louis
Houston
Des Moines
Milwaukee Madison

U.S. Forest Inventory and Analysis Overview 2015
F I A
Extend Owner Survey to urban areas
• Different focus
• Different questions
• Same foundational sampling frame
• Same processing engine
• Can be integrated with other FIA
data

U.S. Forest Inventory and Analysis Overview 2015
F I A International Activity Many processes- similar questions
Tarapoto
Montreal
Helsinki
ITTO
DZ Africa
Lepaterique
Key:
Near East
ATO
Forest Europe

U.S. Forest Inventory and Analysis Overview 2015
F I A
International Projects
North American Forestry Commission (Canada, US, Mexico)
• Revised FAO ecozone map
• Built North American Database
Reviewing and providing assistance on
new national inventory and carbon
monitoring programs in Brazil and Peru
Other NFIs: Viet Nam, Ecuador, Honduras, Bangladesh
Review FRA CFRQ variables for Montreal Process and
submit issues to the Global Advisory Group (AG)
Participate in ECE activities including Global
Objectives on Forests study

U.S. Forest Inventory and Analysis Overview 2015
F I A
Consistent with Koppen climate map (FAO requirement) Consistente con Koppen mapa climático (requisito de la FAO)
Conformément à Koppen carte climatique (exigence de la FAO)
Consistent with existing North American maps (NA
requirement) De acuerdo con los mapas existentes de América del Norte (requisito NA)
Conformément aux cartes nord-américaines existantes (exigence NA)
Bailey Ecoregions (Level 2)
Omernick Ecoregions (Level 2/3)
Koppen Bailey Level 2 Omernick (CEC) Level 3
FAO Ecozone Map criteria

U.S. Forest Inventory and Analysis Overview 2015
F I A All criteria met and final map 90+% Bailey/Omernick compliant Todos los criterios se encontraron y mapa final 90 +% Bailey / Omernick compatible Tous les critères sont réunis et carte finale de 90 +% Bailey / Omernick conforme
http://www.cec.org/Page.asp?PageID=924&ContentID=25137&AA_SiteLanguageID=1
U.S. Forest Inventory and Analysis Overview 2015
F I A
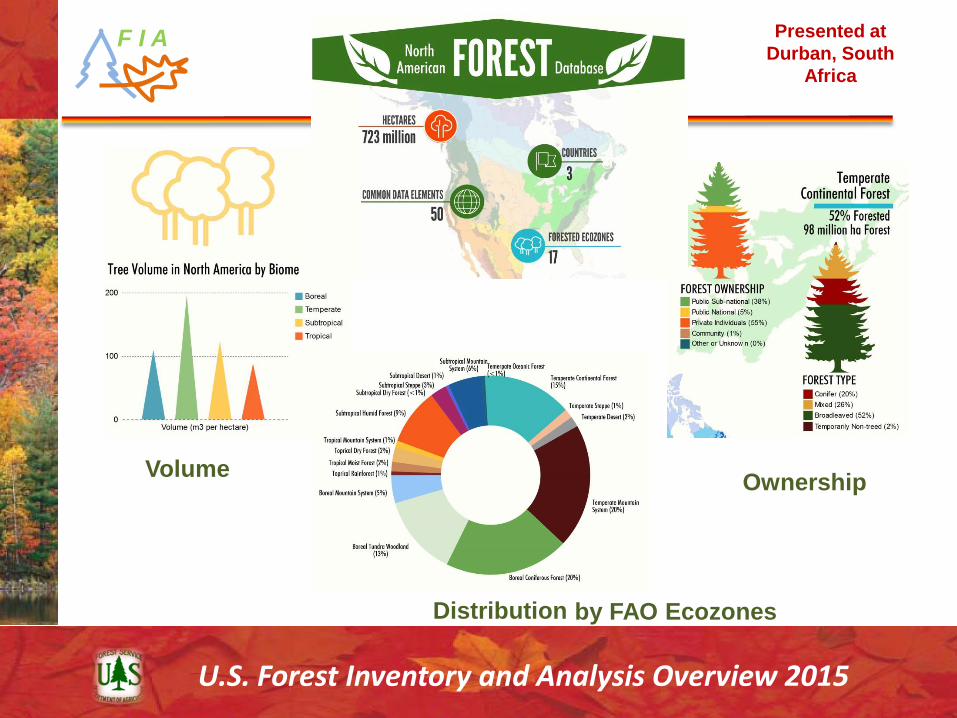
Volume
Distribution
Ownership
Presented at
Durban, South
Africa
by FAO Ecozones

U.S. Forest Inventory and Analysis Overview 2015
F I A
Employment in Foresty and Logging reported to FRA 2015Country 2000 2005 2010
United States 75 70 55
Canada 86 70 52
Mexico
Total 161 140 107
1000 persons
Total US and Canada
Primary Forestry
Employment 2013 (1000 persons)
Pulp and
paper
product
manu-
facturing
Wood
product
manu-
facturing
In-forest
activities Total
437 454 111 1,001
Identifying FRA reporting issues

U.S. Forest Inventory and Analysis Overview 2015
F I A
Agri-
culture Built-up Barren
Unclass-
ified
Tree% Status Code 4 5 6 7
10-24% sparse forest 13 131 131
25-60% open forest 14
60+% closed forest 15
2- Shrubland
0% treeless 20 202 202
1-4% sparse trees 21 212 212
5-9% open trees 22 222 222
3- Grassland (includes herbaceous)
0% treeless 30 303 303
1-4% sparse trees 31 313 313
5-9% open trees 32 323 323
4- Cropland
0% treeless 40 404
1-4% sparse trees 41 414
5-9% open trees 42 424
10-24% sparse forest 43 434
25-60% open forest 44 444
60+% closed forest 45 455
5- Developed land
0% treeless 50 505
1-4% sparse trees 51 515
5-9% open trees 52 525
10-24% sparse forest 53 535
25-60% open forest 54 545
60+% closed forest 55 555
Level 1 Earth Cover class and
percent of tree crown cover WaterForest land
Shrub
land
Grass
land
Rangeland ***
81 2 3
151
1- Treeland
PRIMARY USE CLASS*
301 1/
141
201 1/
311 1/
321 1/
211 1/
221 1/
FAO international classes for treed land
>10% cover potential
OWL= other wooded land (tree/shrub cover 5-9% or <5m)
OLWT= other land with tree cover >10% -includes urban
TOF= trees outside forest (<10% cover)
Forest (tree cover >10% + >5m)Establish compatible land
cover and use classifications
with focus on trees
Consistent
and
reduces
double
counting

U.S. Forest Inventory and Analysis Overview 2015
F I A
Into our virtual future?
Scientists and field crews are
already experimenting with body-
mount 3D cameras on plots.
Drone camera
New
School?
Old school?

U.S. Forest Inventory and Analysis Overview 2015
F I A
2015 FIA Science Symposium
Pushing Boundaries –
New Directions in Inventory Techniques & Applications
December 8-10, 2015 Portland Marriot Downtown Waterfront
Portland, Oregon USA
Portland
Anticipated attendees 200
Presentations 136
TOPICS
• Tree biomass estimation
• Inventory challenges in Alaska
• Forest health indicators
• Forest carbon accounting
• Improving estimates of growth, removals,
and mortality
• Land use/cover change monitoring
• Socio-economic dimensions of forests
• Urban Inventory
JOIN US!
U.S. Forest Inventory and Analysis Overview 2015
F I A
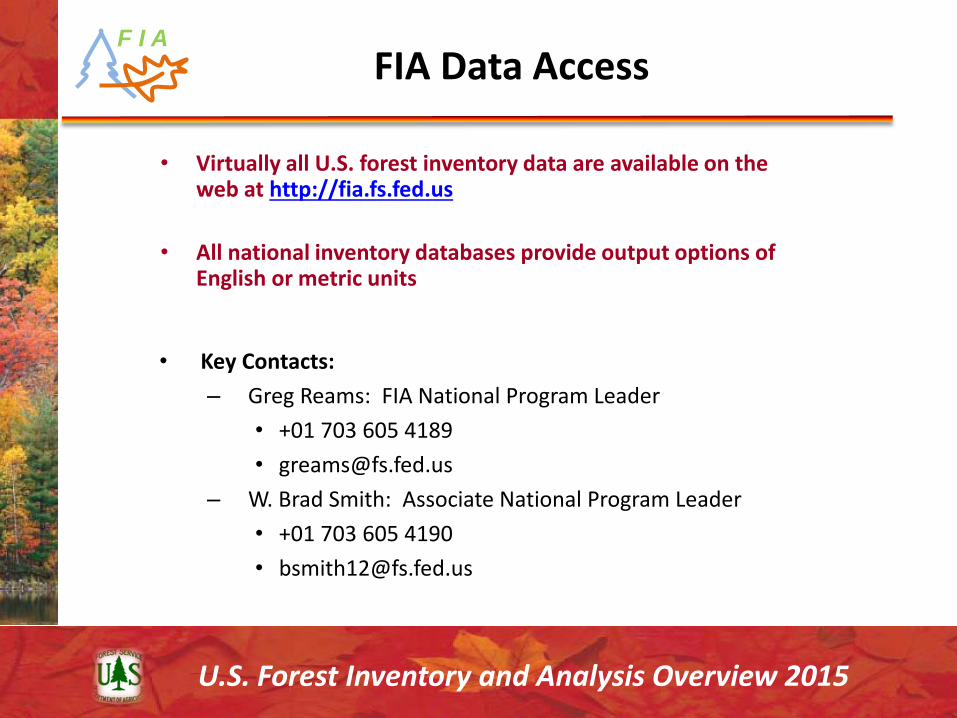
FIA Data Access
• Virtually all U.S. forest inventory data are available on the web at http://fia.fs.fed.us
• All national inventory databases provide output options of English or metric units
• Key Contacts:
– Greg Reams: FIA National Program Leader
• +01 703 605 4189
– W. Brad Smith: Associate National Program Leader
• +01 703 605 4190

U.S. Forest Inventory and Analysis Overview 2015
F I A
QUESTIONS?