
Dissecting Tropical Plant Diversity with Forest Plots and a Molecular ...

FOREST HISTORY OF THE LAST 12,000 YEARS
BASED ON PLANT MACROFOSSIL ANALYSIS
OF LAKE SEDIMENT FROM SOUTHWESTERN B.C.
by
Newton Wainman
B.Sc., Simon Fraser University, 1974
THESIS SUBMITTED IN PARTIAL FULFILLMENT OF
THE REQUIREMENTS FOR THE DEGREE OF
MASTER OF SCIENCE
in the Department
of
Biological Sciences
@ Newton Wainman 1986 SIMON FRASER UNIVERSITY
January 1986
All rights reserved. This work may not be reproduced in whole or in part, by photocopy
or other means, without permission of the author.
Name:
Degree:
Approval
Newton Wairman
Master of Science
T i t l e of Thesis: Forest History of the Last 12,000 Years Based on Plant Macrofossil Analysis o f Lake Sediment i n Southestern B.C.
Exmining Committee: .
Chairman: D r . M . J . Smith
Dr. R.W! Mathewes, Associate Professor, Senior Supervisor
Dr. R . C . Brooke, Associate Professor
Exaniner, Department of ogy, Simon Fraser University
Date Approved: 26, 1986
PARTIAL COPYRIGHT LICENSE
I hereby grant t o Simon Fraser Univers l ty the r i g h t t o lend
my thesis, proJect o r extended essay ( the t i t l e o f which i s shown below)
t o users o f the Simon Fraser Univers i ty Library, and t o make p a r t i a l o r
s ing le copies only f o r such users o r i n response t o a reques? from the
l i b r a r y o f any other un ivers i ty , o r o ther educational i n s t i t u t i o n , on
i t s own behalf o r f o r one o f i t s users, I f u r t he r agree t h a t permission
f o r mu l t i p l e copying o f t h i s work f o r scholar ly purposes may be granted
by me o r the Dean o f Graduate Studies. I t i s understood t h a t copying
or pub l i ca t ion o f t h i s work f o r f i nanc ia l gain sha l l not be allowed
without my wr i t t en permission.
T it l e of Thes i s/Project/Extended Essay
Forest History of the Last 12,000 Years Based on Plant Macrofossil
Analysis of Lake Sediment in Southwestern B.C.
Author:
(s ignature)
Newton Wainman
(date)

ABSTRACT
The forest history around Marion Lake in southwestern B.C.
is reconstructed using plant macrofossil analysis, and compared
to a previous reconstruction based on pollen and spore analysis
by R.W. Mathewes.
Thirty mud surface samples were collected in order to
establish the distribution of modern macrofossils. Conifer
needles were more abundant than their seeds, while, for most
other taxa, reproductive structures were more common than
vegetative ones. Needle fragments of Pinus monticola are
overrepresented in the sediments. A proportional relationship
between the log of the average concentration and the frequency
at which macrofossils were encountered suggests a good
dispersion within the basin. The sample sites are separated into
three groups on the basis of their macrofossil floras; offshore
samples, west shore samples and east shore samples.
A sediment core spanning 12,000 years was collected from a
site as close as possible to Mathewes' core. The results of
macrofossil analysis are presented as a percentage diagram for
conifer needles and as an influx diagram for all taxa.
There is good correspondence between macrofossil and pollen
zones, although the start of each pollen zone predates its
macrofossil analogue. Needles of Pinus contorta are found at the
base of the core, followed by a period, 11,500 to 9000 B.P.,
ii i

when the only needles encountered are those of Picea sitchensis.
Abies amabilis and Tsuga heterophylla needles appear at 9000
B.P., rising to maximum levels by 6600 B.P. The first
macrofossils (branchlet units, scale leaves and staminate cone
scaies) of Thuja plicata appear abruptly at 6000 B.P. and rise
rapidly to modern levels. A previous report of Thuja
macrofossils at 10,000 B.P. is likely the result of
contamination at a core segment boundary. Taxus brevifolia may
have been an important component of the forest prior to the
arrival of Thuja plicata.
Fluvial input of macrofossils is important at Marion Lake.
An increase in the total influx coincides with evidence for
increased precipitation after 7000 8.P. Xarked reductions in
influx coincide with periods of peat building upstream from the
present lake. The influx of charcoal parallels the input of
macrofossils, suggesting that charcoal greater than 250 microns
in diameter may enter the lake primarily during periods of highb
runoff and erosion in the watershed.

DEDICATION
To Kathy, Pam and David.

ACKNOWLEDGEMENTS
I would like to acknowledge the assistance of Dr. R.W.
Mathewes who suggested the topic of this thesis and provided
many valuable suggestions throughout. I would also like to
acknowledge the assistance of Dr. R.C. Brooke who helped me with
identifications of plants both in the field and in the lab. I
would like to thank Don McLennan for providing the data on the
basal area of forest trees in the Marion Lake drainage basin and
Ian Walker for working out the sedimentation curve for Marion
Lake. In addition I would like to thank Lorraine Andrusiak for
her assistance in picking charcoal and macrofossils from the
core.

TABLE OF CONTENTS
~pproval .......................................................... ii ~bstract ...................................................... iii ~edication ......................................................... v ~cknowledgements .................................................. vi ~ i s t of Tables .................................................... ix List of Figures .................................................... x
A . INTRODUCTION ................................................... 1 BACKGROUND ................................................. 2 AIMS AND OBJECTIVES ....................................... 5 THE STUDY AREA ........................................ 6
B . THE SURFACE SEDIMENT STUDY ..................................... 8 I . METHODS .................................................... 9
FIELD METHODS ....................................... 9 LABORATORY METHODS ........................................ 12
Sample ~anipulation ................................... 12 . Picking and Sorting ................................... 13
Counting .............................................. 13 I1 . RESULTS AND DISCUSSION .................................... 15
THE SAMPLES ............................................... 15
THE MACROFOSSILS .......................................... 20
Concentration and Frequency ........................... 20
.............. Vegetative and Reproductive Macrofossils 26
Nearshore vs Offshore Comparisons ..................... 36 West Shore vs East Shore Comparisons .................. 40
Comparison With Modern Flora .......................... 43

.......................................... THE SAMPLE SITES 49
............................................. . C THE CORE ANALYSIS 54
................................................... . I METHODS 55
FIELD METHODS ............................................. 55
LABORATORY METHODS ........................................ 56
.................................... I1 . RESULTS AND DISCUSSION 57
.............................................. STRATIGRAPHY 57
THE INFLUX DIAGRAM ........................................ 60
Western Red Cedar History ............................. 60
Western Yew History ................................... 66
Pine History .......................................... 66
Balsam Fir History .................................... 67
Western Hemlock History ............................... 68
Douglas Fir History ................................... 69
Bryozoan Statoblasts .................................. 69
Changing Drainage Patterns ............................. 70
.................................... The Charcoal Record 74
THE PERCENTAGE DIAGRAM .................................... 75
Macrofossil Zonation .................................. 78
D . SUMMARY AND CONCLUSIONS ....................................... 81
SUMMARY ................................................... 82
The Traditional Uses of Macrofossils .................. 82
The Surface Sediment Study ............................ 83
The Macrofossil Diagrams .............................. 84
CONCLUSIONS ........................................ 86
Bibliography ...................................................... 88
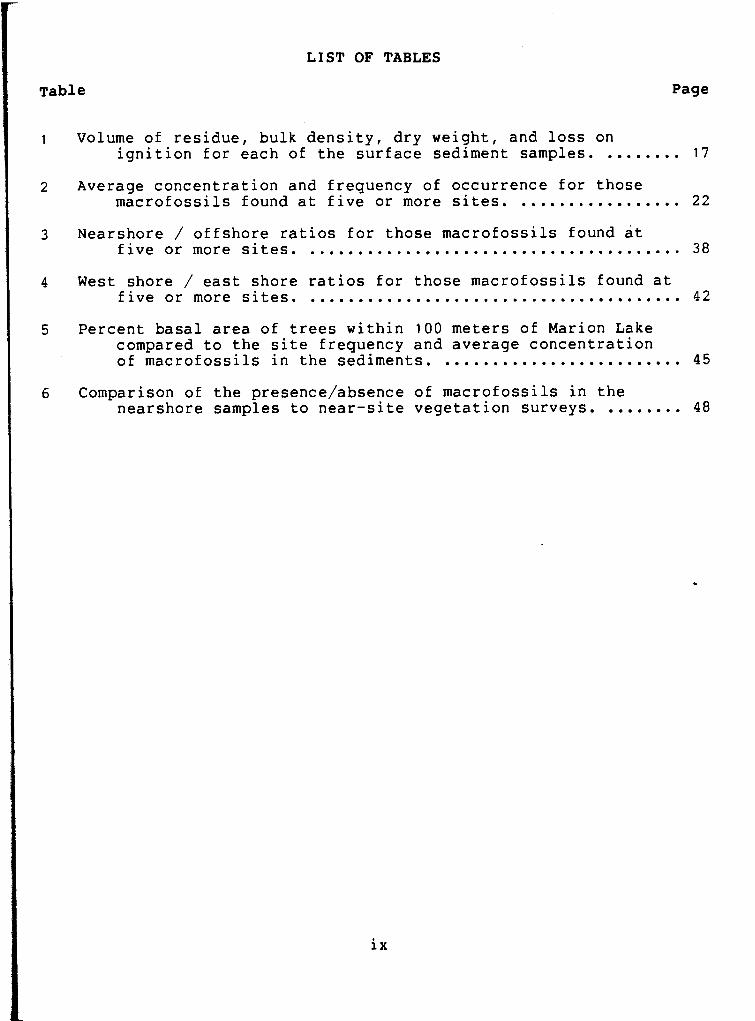
LIST OF TABLES
m able Page
Volume of residue, bulk density, dry weight, and loss on ignition for each of the surface sediment samples. ........ 17
Average concentration and frequency of occurrence for those ................. macrofossils found at five or more sites. 22
Nearshore / offshore ratios for those macrofossils found at five or more sites. ....................................... 38
West shore / east shore ratios for those macrofossils found at five or more sites. ....................................... 42
Percent basal area of trees within 100 meters of Marion Lake compared to the site frequency and average concentration of macrofossils in the sediments. ......................... 45
Comparison of the presence/absence of macrofossils in the nearshore samples to near-site vegetation surveys. ........ 48
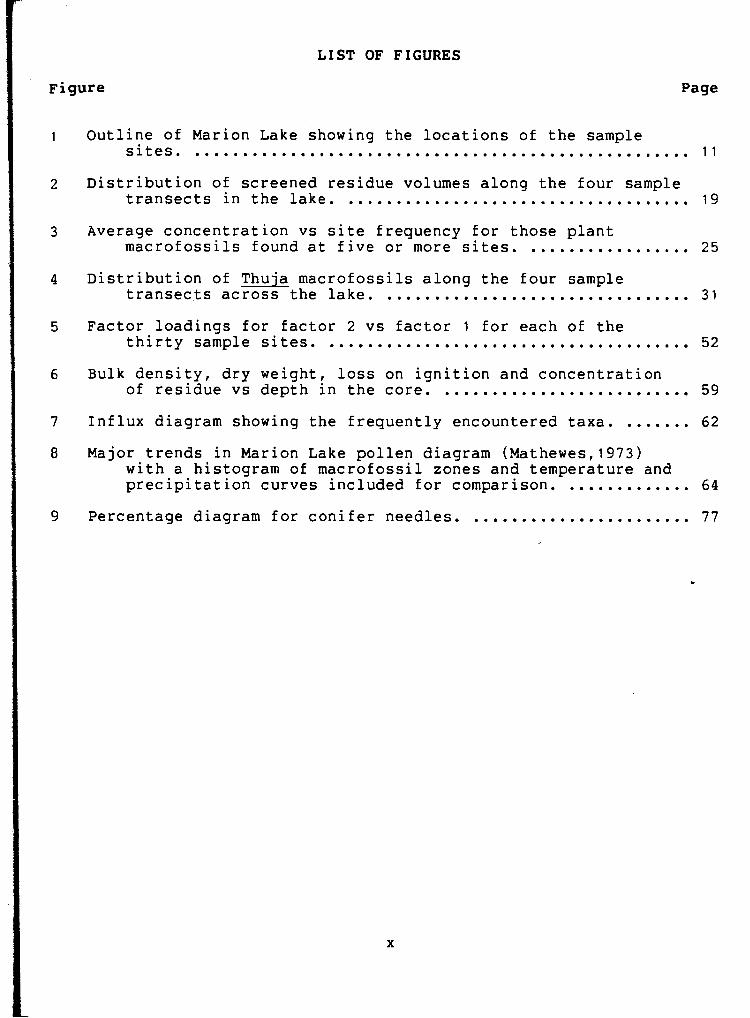
LIST OF FIGURES
Figure Page
Outline of Marion Lake showing the locations of the sample sites. .................................................... 1 1
Distribution of screened residue volumes along the four sample .................................... transects in the lake. 19
Average concentration vs site frequency for those plant ................. macrofossils found at five or more sites. 25
Distribution of Thuja macrofossils along the four sample ................................ transects across the lake. 31
Factor loadings for factor 2 vs factor 1 for each of the ...................................... thirty sample sites. 52
Bulk density, dry weight, loss on ignition and concentration of residue vs depth in the core. .......................... 59
Influx diagram showing the frequently encountered taxa. ....... 62
Major trends in Marion Lake pollen diagram (Mathewes,l973) with a histogram of macrofossil zones and temperature and ............. precipitation curves included for comparison. 64
....................... Percentage diagram for conifer needles. 77

PART A
INTRODUCTION
BACKGROUND
Plant macrofo ssils can be defined as:
"any part of a plant preserved after death which does not require a high power microscope to see it, and which can be manipulated by hand" (Birks11980,p.2).
While once the primary source of information available to
paleoecologists, plant macrofossils have played a secondary role
since the quantitative methods for pollen analysis became well
established in the late 1930's and 1940's (~atts~1978).
Macrofossils have been used to supplement pollen data by
1 ) establishing the local presence of taxa whose pollen or spores are known to travel great distances,
2) providing positive identification, usually to the species level, for taxa whose pollen can only be identified to the Family or Genus level
and
3) providing evidence of taxa whose pollen is rarely found or is not found at all, as is the case with many insect-pollinated species.
More recently it has become common practice, when analyzing a
sediment core, to section the core and extract and count the
macrofossils in each section. The results are often presented in
the form of a macrofossil diagram that is analagous to the
diagrams produced using pollen data.
The first quantitative plant macrofossil study in North
America was produced by Watts and Winter in 1966. They presented
their data as a percentage of the total seed sum, thus
emphasizing the relative abundance of the various macrofossils.
The problem with this method of presentation is that an increase

in one taxon reduces the apparent importance of other taxa, even
though their macrofossils may be as abundant as ever. More
recent studies, by Delcourt (1980) and Watts ( 1 9 7 9 ) ~ for
example, have tended to present the macrofossil data as
concentrations, usually macrofossils per 100 ml of sediment.
Others, such as Birks and Mathewes (1978) and Delcourt (1979)~
have presented their data as a macrofossil influx; the number of
macrofossils deposited per unit area per year.
Regardless of how the data are presented, the problem
remains that, for plant macrofossils, the relationship between
the number of macrofossils found and the abundance of the
'parent' plant is not well established. For example, if a large
number of Thuja plicata needles are found in a core, was the
tree abundant in the forest, or, was there - a tree growing near
to the coring site? Establishing the relationship between
fossils and the community that produced them is within the realm
of taphonomy (Lawrence,l971). A number of recent studies have
attempted to establish this relationship for plants in an effort
to better interpret the macrofossil data.
Some authors have concentrated on the means of transport to
the deposition site, since macrofossils have typically been used
to 'prove' local presence of a taxon. Glaser (1981) found that,
in a treeless snow-covered landscape, leaves and seeds could be
blown beyond the vegetational zones in which they originated.
Bonde (1969) found wind to be a significant means of dispersal
for vegetation of alpine areas. Rydvarden (1971) found that
rivers and streams may carry macrofossils for long distances,
especially those macrofossils with good buoyancy. Burrows (1980)
found evidence of the long distance transport of leaves by
streams from as much as three kilometers away. These studies
question the assumption of local presence of a taxon based upon
the presence of its macrofossils in the sediments.
Other authors have sought to establish a relationship
between the concentration of macrofossils in surface sediments
and the composition of the surrounding vegetation. McQueen
(1969~p.18) found at lake Pounui in New Zealand that:
"plant remains in a densely vegetated swamp were almost exclusively of plants growing in or near the swamp"
and further that:
"in the lake sediments the plant remains represented only the dominant members of the vegetation surrounding the lake".
Birks (1973) demonstrated that lakes in the prairie, deciduous
forest and coniferous forest regions of Minnesota could be L
characterized by the macrofossil floras of their surface
sediments. Drake and Burrows (1980) found there was good
qualitative representation of forest trees in the lake litter of
Lady Lake in New Zealand and for some species there was also
good quantitative representation. Greatrex (1983) found, for
some species, there was a general relationship between
cover-abundance and seed-representation in surface sediment
samples in a small eutrophic lake in England. Dunwiddie (1983)~
in a study of surface sediment samples from a series of ponds on
Mount Rainier in Washington, found a statistically significant

relationship between tree basal area and needle macrofossils for
most conifers. These and other studies have encouraged the use
of plant macrofossils not only as a supplement to pollen but as
b o n a fide tools in their own right.
AIMS AND OBJECTIVES --
While some authors have produced macrofossil diagrams to
supplement their pollen data and others have studied various
aspects of the taphonomy of plant macrofossils, few have used a
study of macrofossils in surface sediments to aid in the
interpretation of a macrofossil diagram from the same site. The
objectives of this study were:
1 ) to compare the distribution and abundance of plant macrofossils in the surface sediments of Marion Lake with the vegetation and topography of the drainage basin,
2 ) to reconstruct the vegetational history of the Marion Lake basin by analyzing the macrofossils in a sediment core, using the results of the surface sample study to aid in the analysis
and
3) to compare the vegetation history based on macrofossil analysis with that of a previous study (Mathewes,l973) based on pollen analysis.
Of special interest was the early history of Thuja plicata
(western red cedar). Mathewes (1973) reported the surprising
occurrence of Thuja macrofossils at Marion Lake about 10,000
years B.P., although the pollen data did not record significant
Cupressaceae until after about 6600 years B.P. The validity of
this early occurrence of Thuja would be tested by a more

I
detailed macrofossil analysis.
THE STUDY AREA - -
Marion Lake is located within the University of British
Columbia Research Forest about 40 km east of Vancouver. The
forest is within the Coast Mountains of British Columbia, and,
although the topography is variable, in excess of 80% of the
area is hilly to mountainous. Elevations range from 250 to 790
meters. The bedrock underlying the area is mainly granodiorite
and quartz diorite covered by glacial till and outwash deposits
of variable thickness (Lacate,1965). The climate of the area is
designated by Koppen as Cfb. It is characterized by wet mild
winters and relatively dry summers. Average annual precipitation
at Marion Lake is about 300 cm per year with over 80% of the
total falling between October and April.
The lake lies in a valley at an elevation of 300 meters in
the transition between the dry and wet subzones of the Coastal
Western Hemlock (CWH) biogeoclimatic zone (~linka~1976). The
lake is 800 meters long and 200 meters wide at its widest point,
covering an area of 13.3 hectares. Mean depth is about 2 meters
with a maximum depth of about 5 to 7 meters depending upon the
time of year. Jacob's Creek feeds the lake from a drainage basin
of about 13 square kilometers. Within this basin there are two
other lakes above Marion Lake. During heavy rainfall the lake
level has been observed to rise as much as 1 meter in 24 hours

and the equivalent total volume of the lake may be flushed out
in 2.3 days (~fford,1967). This has been attributed to the
combination of permeable soils overlying an impermeable basal
till and to the extreme relief of the area.

PART B
THE SURFACE SEDIMENT STUDY

CHAPTER I
METHODS
FIELD METHODS 7
In July 1982 a series of surface-sediment samples were taken
from Marion Lake. The samples were collected from a boat using a
15 by 15 cm Ekman dredge. In order to obtain samples of about
400 ml, the top few cm of each 'grab' were spooned into a
graduated beaker and then placed into self-sealing plastic bags.
The sampling points were located on four west/east transects
across the lake, and also in the channel that runs from the
inlet almost to the outlet (~igure 1). The transects were
positioned and named relative to the grid markers left by the
~nternational Biological Programme study that was ongoing at
Marion Lake from 1962 to 1973 (Efford and ~a11,1973). Nearshore
samples were taken systematically one meter and five meters from
the shoreline on each end of a transect. Offshore samples were
taken at intervals so as to have at least one sample from the
deepest part of the lake along each transect, Additional
samples, not on the transects, were taken from the deep channel.
The sample sites on each transect are named after their transect
and numbered consecutively from west to east. The other sites
are named for the letter of the nearest I.B.P. marker.
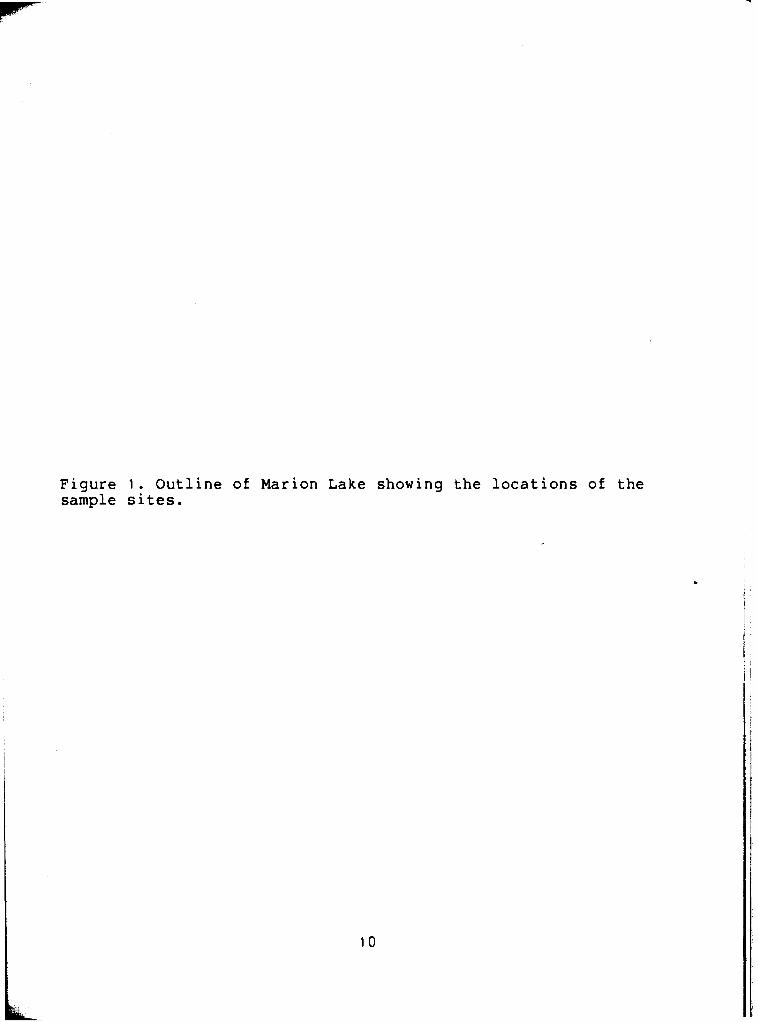
Figure 1 . Outline of Marion Lake showing the locations of the sample sites.

INLET
OUTLET

LABORATORY METHODS
Sampl e Mani pu l a t i o n
The bulk density of each surface sediment sample was determined by
weighing the whole sample and determining its volume by displacement
in a graduated cylinder containing a known volume of water. The dry
weight and loss on ignition were determined by the method of Bengtsson
( 1 9 7 9 ) . To determine the dry weight, 5 cc sediment subsamples, taken
with a plastic syringe, were left overnight in a drying oven at 105
degrees C. To determine the loss on ignition, the dried subsamples
were placed in a muffle furnace for 2 hours at 540 degrees C.
To facilitate the job of picking out macrofossils, sediment
samples were screened under running water using a 250 micron ( 6 0 mesh)
sieve. The debris that did not pass through the sieve, hereafter '- -
referred to as 'residue', was stored in 70 percent alcohol. Because of
unforeseen large volumes, it became necessary to subsample the residue
prior to picking out macrofossils. In order to prevent a few large b
macrofossils from interfering with the subsampling procedure, each
residue sample was first subdivided into a large and a small diameter
fraction using a 2 mm ( 9 mesh) sieve. The wet volume of each small
diameter fraction was determined by displacement using a graduated
cylinder. Where the volume of a small diameter fraction exceeded 15
ml, a subsample was taken by the following method: The residue was
Spread out on a 250 micron mesh using jets of water from a 'shower
type' faucet. Using a spatula, scoops of wet residue were added to
water in a graduated cylinder to yield a displacement volume of 10ml.

The wet volume of each large diameter fraction of the residue was also
measured in order to look at the distribution of residue volumes
within the lake.
P i c k i n g a n d S o r t i n g
The residue samples were picked over for macrofossils using a
stereoscopic microscope. Identifiable plant macrofossils were picked
out using forceps and stored in drops of glycerine in plastic trays,
or, where numbers warranted, in vials of 70% alcohol. The primary
interest was in plant macrofossils of forest species. However, all A-
seeds and fruits were picked, as were bryozoan statoblasts, Chara and - Nitella oospores, Isoetes megaspores and pieces of charcoal. Where
possible, macrofossils were identified by comparison with modern C1-
reference material. The convention used in assigning a taxon is that -
of Watts and Winter (1966). Plant nomenclature follows Taylor and
MacBryde (1977).
C o u n t i n g L
Since many macrofossils, especially conifer needles, were
fragmented (Plate I-4), the following counting strategy was adopted: -- - 1 ) where a whole needle was encountered it was counted as one,
2) where an identifiable tip or base of a needle was encountered it was also counted as-one,
3 ) where an unidentifiable tip or base was encountered it was counted as an unknown,
4) all portions of needles without the tip or the base were ignored,
and

5) for fruits, seeds and other macrofossils any portion that represented half or more of the original was counted as a whole.
The counting of Pinus monticola needle fragments (Plate 1-5)
presented a special problem because most of the fragments were missing
both tip and base. In this case, the length, in millimeters, of each
fragment was measured and the total length in cm recorded.
Where a 10 ml subsample was taken from a small diameter fraction
of the residue, the numbers of macrofossils counted were scaled up as
follows:
no. in 10 ml subsample x vol. of fraction (ml) Scaled no. = ..............................................
10 ml
For each macrofossil type in each sample, the concentration per 100 ml
of sediment was calculated as follows:
where: C = concentration per 100 ml L = total number in large diameter fraction S = total number in small diameter fraction V = volume of sediment sample (ml)

CHAPTER I I
RESULTS AND DISCUSSION
THE SAMPLES -
Similar volumes were used for the surface sediment samples and all
have similar bulk densities (Table 1). However, the nearshore samples,
collected 1 and 5 meters from shore, have both lower dry weights and
higher losses on ignition than the offshore samples, collected 20 or
more meters from shore. Mean dry weights were 65.1 f 18.9 g (per kg of
wet residue) for nearshore and 75.5 + 15.2 g for offshore samples. Loss on ignition averages were 53.5 f 15.5 % of dry weight for
nearshore and 27.2 2 6.75 % of dry weight for offshore samples. Using
a Mann-Whitney two-sample rank test, the difference in loss on
ignition between nearshore and offshore samples was statistically
significant (p<0.0001). The differences in dry weight (p<0.1) and bulk
density (p>0.1) where not significant.
The high losses on ignition and the low dry weights of the
nearshore surface sediment samples are due to an abundance of plant
litter in these samples. Here most of the residue is plant litter with
only trace amounts of sand. This preponderance of litter in the
nearshore samples can be seen along each transect (~igure 2). The
difference is even more pronounced for the large diameter fraction of
the residue than for the small diameter fraction, suggesting a
nearshore bias towards larger litter. This distribution of residue was
statistically significant for both the large and small diameter
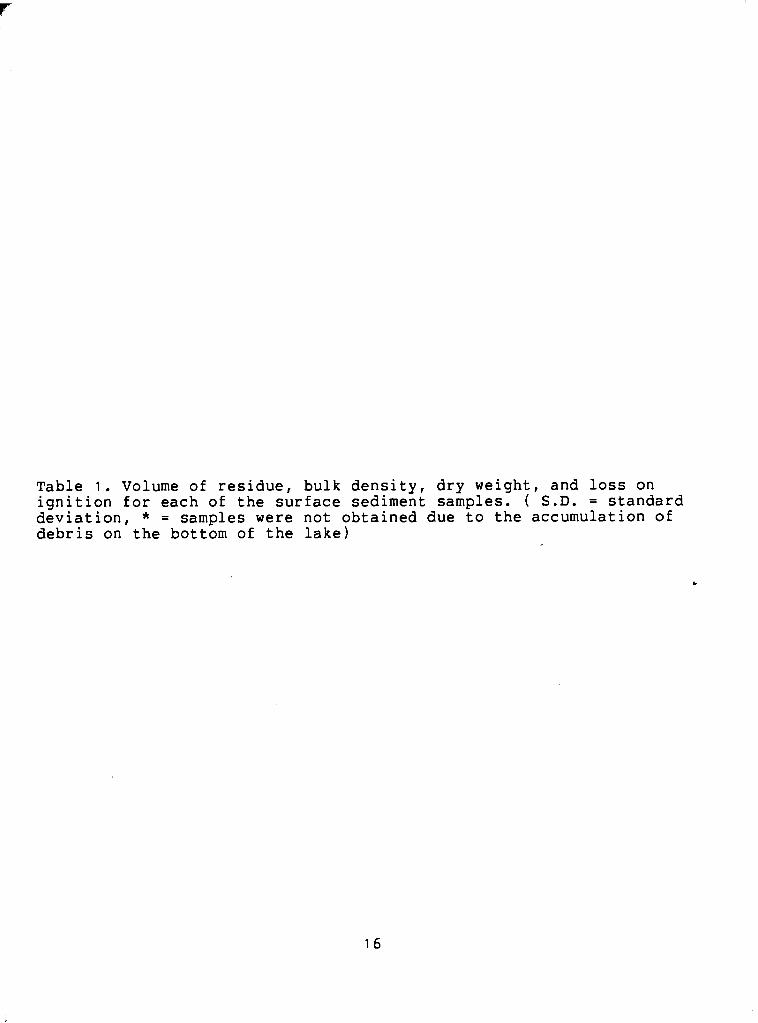
Table 1. Volume of residue, bulk density, dry weight, and loss on ignition for each of the surface sediment samples. ( S.D. = standard deviation, * = samples were not obtained due to the accumulation of debris on the bottom of the lake)

L . I . (%D.W. 1 -------
NEARSHORE SAMPLES
MEAN S.D.
OFFSHORE SAMPLES
MEAN 51.6 S.D. 18.8

Figure 2. Distribution of screened residue volumes along the four sample transects in the lake. The nearshore samples had consistently greater volumes of residue than the offshore samples. This was especially true for the large diameter (greater than 2mm) fraction of the residue. Arrowheads indicate shore.

TRANSECT A
,II A
TRANSECT E A
A
TRANSECT F
1 TRANSECT K Legend n> ~ M M
m < ~ M M
Scale
A A
METERS FROM SHORE

fractions (p<0.0001).
The statistically significant abundance of plant litter in the
nearshore samples supports the findings of other authors. Gasith and
Hasler (1975)~ in their study of airborne litterfall into lakes, found
that for most lakes the input of litter at a distance of 10 meters
from shore was less than 10 percent of the input 1 meter from shore.
Similarly, Odum and Prentki (1978)~ in their study of 5 North American
lake ecosystems, found that litter input to the lakes was proportional
to the length of their forested shorelines. It is clear from the
foregoing that distance from shore is expected to be a major factor in <
the distribution patterns of at least some of the macrofossil taxa. \
THE MACROFOSSILS -
C o n c e n t r a t i o n a n d F r e q u e n c y
Forty different macrofossils were encountered in-the surface
samples. Site frequencies and average concentrations for those . macrofossils found at 5 or more sites are given in Table 2. The site
frequency is simply the number of sites at which a macrofossil was
encountered. Only those macrofossils found at five or more sites are
included, as fewer than five occurrences could not have been
significant using non-parametric statistical tests. Zero values were
not included in the calculation of average concentrations, so the
averages reflect the numbers to be expected at sites where the
macrofossils do occur.

Table 2. Average concentration and frequency of occurrence for those macrofossils found at five or more sites. Zero values were not included in the calculations, so the concentrations reflect the numbers to be expected at sites where the macrofossils do occur.

THUJA PLICATA s c a l e leaves 30 branchle t u n i t s 29 male cone s c a l e s 28
MONOCOT 'node p l a t e s ' 27 UNKNOWN d i s c s 26 PINUS MONTICOLA needles (cm) 25 TSUGA HETEROPHYLLA needles 24 JUNCUS sp. seeds 22 CAREX sp. achenes 20 RUBUS SPECTABILIS/PARVIFLGRUS seeds 19 MYRI CA GALE bud s c a l e s 17 ERICACEAE seeds 15 TSUGA HETEROPHYLLA pol len s a c s 15 THUJA PLICATA seeds 13 NAJAS FLEXILIS seeds 13 CRISTATELLA c f . MUC. s t a t o b l a s t s 12 ISOETES c f . LACUSTRIS megaspores 12 MYRICA GALE seeds 12 UNKNOWN ANIMAL ' s a c s ' 1 1 ABIES AMABILIS needles 10 MENYANTHES TRIFOLIATA seeds 9 DULICHIUM ARUNDINACEUM achenes 9 NITELLA sp. oospores 7 PHYSOCARPUS CAPITATUS seeds 7 UNKNOWN ' p o l l e n s a c s ' 7 ALNUS RUBRA seeds 7 TSUGA HETEROPHYLLA seeds 7 PSEUDOTSUGA MENZIESII needles 6 NUPHAR LUTEA subsp. POLYSEPALA seeds 5

For plant macrofossils, the relationship between the log of the
average concentration and the site frequency is linear (E'igure 3). For
vegetative macrofossils,
log [ AVE. CONC. 1 = -0.534 + 0.0734 SITE FREQUENCY
for reproductive macrofossils,
log [ AVE. CONC. 1 = -0.352 + 0.0580 SITE FREQUENCY.
The fit is somewhat better for vegetative macrofossils (r2=0.668) than
for reproductive ones (r2=0.417). The regressions are significant
(p<0.005, vegetative; p<0.01, reproductive). ~eproductive macrofossils
are those parts of the plant normally dispersed for the purpose of
reproduction, such as seeds, fruits, megaspores and oospores. All
other macrofossils, including bud scales, male cones scales and pollen
sacs, are considered to be vegetative.
One of the critical questions in the analysis of macrofossil data
is to what extent macrofossils are dispersed from the point of origin.
Birks (1973) showed macrofossils are not well dispersed in a series of
small lakes in Minnesota. If macrofossils are not well dispersed one.
would expect at least some of the macrofossils found at only a few
sites to be present at high concentrations.
In my own study, as can be seen from the linear relationship
between the log of the average concentration and the site frequency,
those macrofossils found at high concentrations were found at most
sites. With the exception of Nitella oospores, all macrofossils found
at average concentrations in excess of 5 per 100 ml were found at more
than half the sites. Even Tsuqa pollen sacs, found at an average
concentration of only 1.46 per 100 ml, were found at half the sites.

Figure 3. Average concentration vs site frequency for those plant macrofossils found at five or more sites. The frequency is proportional to the log of the average concentration. The fit is somewhat better for vegetative macrofossils (shaded circles,r2=66.8) than for reproductive ones (open squares,r2=41.7).

Legend '8 VEGETATIVE
REPRODUCTIVE
! I I I I I
5 10 15 20 25 30
SITE FREQUENCY
It is not surprising that macrofossils found at average concentrations
less than 0.5 per 100 ml were less frequently encountered given that
the average sample size was only 400 ml. Macrofossils found at fewer
than five sites never exceeded an average concentration of 2.8 per 100
ml and most were less than 1 per 100 ml. Thus it seems macrofossils
are well dispersed in Marion Lake.
V e g e t at i v e a n d R e p r o d u c t i v e M a c r o f o s s i 1 s
Vegetative macrofossils were found at significantly greater
average concentrations (pc0.05, Mann-~hitney test) and at
significantly more sites (p<0.025) than reproductive ones. Most of
this difference can be attributed to a preponderance of vegetative
macrofossils of the forest trees as compared to their seeds (Table 2).
Despite the occurrence of vegetative Thuja plicata macrofossils at all
sites at an average concentration of 300 per ml, Thuja seeds were
found at only 13 of the 30 sites at an average concentration of 1 per
ml. Tsuga heterophylla needles were found at 24 sites at an average
concentration of 7 per ml while Tsuqa seeds were found at only 7 sites
at an average concentration of 0.5 per ml. Similarly, needles of Pinus
monticola, Abies amabilis and Pseudotsuga menziesii were found at 25,
10 and 6 sites respectively while the seeds of these species were
found at fewer than 5 sites.
The three most frequently encountered and most abundantly found
macrofossils are vegetative fragments of Thuja plicata. Thuja
branchlets (plate 1 - 1 ) are made up of scale leaves (plate I-2,a and b)
arranged in four rows. Although some of the scale leaves resulted from

Plate I. 1-3; Thu'a plicata macrofossils; 1-branchlet units ( ~ 6 ) : 2-scale leaves*. a-mlddles, b-sides: 3a-male cone ( ~ 1 6 ) . 3b-male cone scale ( ~ 1 6 ) ; 4-Abies amabilis needles ( ~ 4 ) ; 5-pinus monticola needles ( ~ 2 ) .

PLATE I

the break-up of branchlet units during processing, many were observed
in the sediments prior to screening. Scale leaves were found at all
sites and branchlet units at 29 of the 30 sites. Thuja male cones
(Plate I-3a) are made up of several scales (Plate I-3b) which were
found at 28 of the 30 sites.
Figure 4 shows the distribution of Thuja macrofossils along the
four transects across the lake. They are more abundant in the
nearshore sites than offshore, and more abundant in the west shore
than in the east shore sites. The only offshore sites with appreciable
concentrations of these macrofossils were those along transects A and
EA adjacent to the main inlet stream. This suggests that many Thuja
macrofossils enter the lake through fluvial transport. Attempts to
take surface sediment samples at sites A3 and C1 were unsuccessful due
to the abundance of debris, including many Thuja branchlets, which
prevented the jaws of the Ekman dredge from closing properly.
Since the surface sediment residue consists mostly of plant
debris, the abundance of Thuja in the nearshore sites could be
expected from the abundance of total residue at these locations.
However, the abundance of Thuja in the west shore sites was
unexpected, since there was no significant difference in residue
volume between the two shores. The sorting of macrofossils within the
lake is more complicated than just the nearshore/offshore dichotomy
suggested by the residue volumes.
The origin of the fourth most frequently encountered macrofossils
is uncertain, although they may be 'node plates' from monocot stems

Figure 4. Distribution of Thuja macrofossils along the four sample transects across the lake. There were more macrofossils in the nearshore sites than offshore, and more in the west shore sites than in the east shore sites (note changes in scale, arrowheads indicate shore) See Figure 1 for the transect locations.

Iw OOL / St138WflN

Plate 11. Assorted seeds, fruits and achenes: 1-Alnus rubra 2-Betula papyrifera ( ~ 8 ) ; 3-Physocarpus c a p i t a t u s 2 x 1 2 ) ; ~ - (x'12),'-parviflorus, b-spectabilis: 5-M rica qale (x12), a- b-fruit with bractlets; 6-Ericaceae ( x l h v a c c i n i u m sp., b-Gaultheria shallon; 7-Juncus sp. ( ~ 2 4 ) ; 8-Carex sp. ( ~ 8 ) ; 9-Dulichium a r u n d i n a c e u m m 10-~en~anthestrifoliata (x12
ubus fruit,

PLATE I I

Plate 111. 1-Nitella sp. oospores ( ~ 2 4 ) ; 2-Chara sp. oospores ( ~ 2 4 ) ; 3-Isoetes cf. lacustris megaspores ( ~ 3 6 ) ; 4-Tsuga heterophylla pollen sacs(x12); 5-Myrica ale bud scales ( ~ 1 2 ) ; 6-Monocot 'node plates' ( ~ 2 4 ) ; 7-tiny discs (x24 f ; 8-Bryozoan statoblasts ( ~ 1 2 1 , a-Fredricella sp., b-Cristatella cf. mucedo; 9-Unknown animal 'sacs' ( ~ 4 ) .

PLATE I II
(Plate 111-6). The fifth most frequently encountered macrofossils are
small black discs referred to in the tables as 'unknown discs' (Plate
111-7). The discs are most likely of animal origin, perhaps egg cases,
as there was no apparent placental attachment as might be expected
with seeds. Next to branchlets of Thuja plicata the most frequently
encountered conifer leaves are needle fragments of Pinus monticola
(Plate 1-5) and needles of Tsuga heterophylla, found at 25 and 24
sites respectively.
The preponderance of coniferous vegetative macrofossils can be
contrasted with the preponderance of reproductive macrofossils of
other taxa. With the exception of the 'node plates' and Myrica gale
bud scales (Plate 111-5), the macrofossils of all other taxa were
reproductive structures. A representative sample of these reproductive
structures are shown in Plates I1 and 111. The dichotomy between the
forest conifers and the other taxa is probably due to the good
preservation of conifer leaves compared to leaves of other taxa
(~unwiddie~l983; Drake and Burrows,l980).
N e a r s h o r e vs O f f s h o r e C o m p a r i s o n s
The nearshore skew seen in the distribution of residue volumes and
in the distribution of Thuja macrofossils is a pattern that is
repeated for many other macrofossils (Table 3). A few macrofossils are
lumped together into higher taxonomic groups. Seeds from berries of
Vaccinium ovalifolium , Vaccinium parvifolium and Gaultheria shallon
were encountered (Plate 11-6,a and b). Individually, none of these
seeds are found frequently enough for their distributions to be

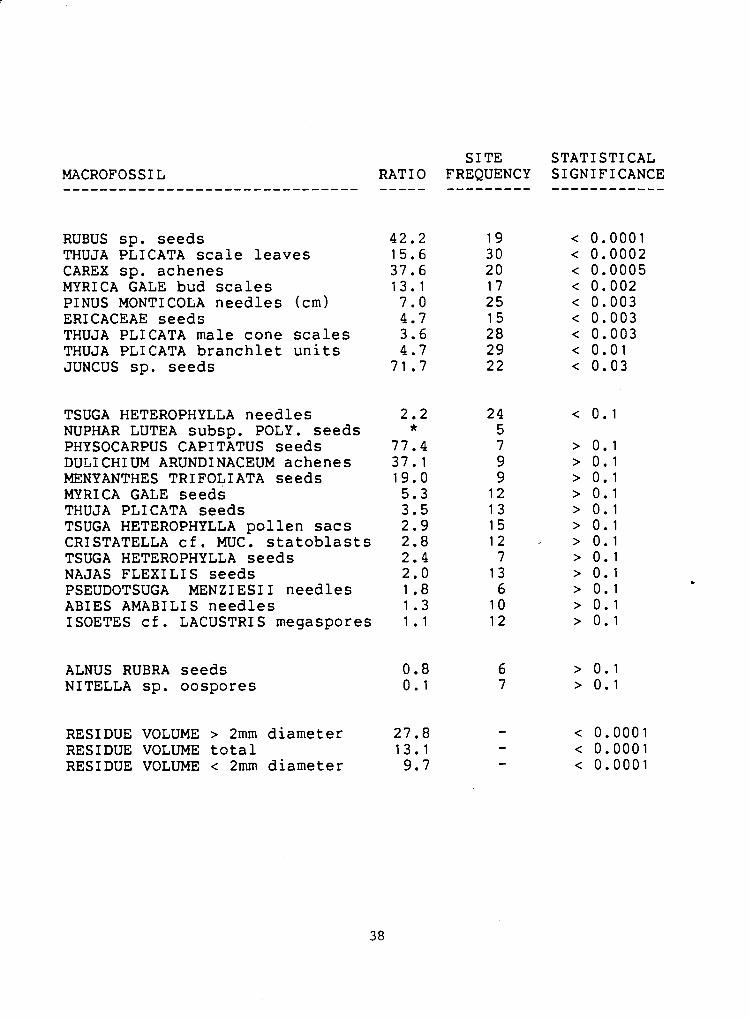
Table 3. Nearshore / offshore ratios for those macrofossils found at five or more sites. The ratios were calculated by dividing a taxon's average concentration in the nearshore sites by its average concentration in the offshore sites. The macrofossils.are listed in order of the statistical significance of their distributions as calculated by a Mann-Whitney two sample rank test. Where the significance is equal they are listed in order of their nearshore/offshore ratios. Only those distributions with a probability < 0.05 are considered to be statistically significant. (*=there were no macrofossils found in the offshore sites so the ratio could not be calculated)
RUBUS sp. seeds THUJA PLICATA s c a l e leaves CAREX sp. achenes MYRI CA GALE bud s c a l e s PINUS MONTICOLA needles (cm) ERICACEAE seeds THUJA PLICATA male cone s c a l e s THUJA PLICATA branchlet u n i t s JUNCUS sp. seeds
TSUGA HETEROPHYLLA needles NUPHAR LUTEA subsp. POLY. seeds PHYSOCARPUS CAPITATUS seeds DULICHIUM ARUNDINACEUM achenes MENYANTHES TRIFOLIATA seeds MYRICA GALE seeds THUJA PLICATA seeds TSUGA HETEROPHYLLA pol len s a c s CRISTATELLA c f . MUC. s t a t o b l a s t s TSUGA HETEROPHYLLA seeds NAJAS FLEX1 LI S seeds PSEUDOTSUGA MENZIESII needles ABIES AMABILIS needles ISOETES c f . LACUSTRIS megaspores
ALNUS RUBRA seeds NITELLA sp. oospores
RESIDUE VOLUME > 2mm diameter 27.8 RESIDUE VOLUME t o t a l 13 .1 RESIDUE VOLUME < 2mm diameter 9.7
statistically significant. Since they are all heath shrubs with seeds
of similar size and shape, their macrofossils were tallied as
Ericaceae. Similar groupings were made for species of Rubus, Juncus
and Carex (plate 11, 4a and b, 7 and 8).
The most statistically significant differences occur where the
macrofossil is found at many sites, and where its nearshore/offshore
ratio is highly skewed. The distributions of those macrofossils found
at only a few sites are not statistically significant even when the
nearshore/offshore ratios are highly skewed. For example, although the
nearshore/offshore ratio for Physocarpus capitatus seeds (Plate 11-31
is 77.4 to 1, the difference in seed abundance between the shores is
not significant (p>0.1) because the seeds were found at only 7 sites.
On the other hand, the difference for Thuja scale leaves is highly
significant (p<0.0002), even though the nearshore/offshore ratio is
only 15.6 to 1, because the scale leaves were found at all thirty
sites.
. Nearly all macrofossils are more abundantly found in the nearshore
samples than in the offshore samples. Conspicuous in the group whose
nearshore/offshore distributions are statistically different are
Rubus Carex, Ericaceae and Juncus. The local representatives of these - 1
taxa tend to produce seeds and fruits that have limited dispersal by
wind. The coniferous macrofossils with the most significantly skewed
nearshore/offshore distributions are the smallest ones, Thuja plicata
scale leaves and male cone scales and Pinus monticola needle
fragments.

The only macrofossils more abundantly found in the offshore
samples than in the nearshore samples are seeds of -- Alnus rubra and
oospores of the aquatic alga Nitella. In the case of Nitella, it is
not surprising that there should be as many or more macrofossils in
the offshore sites as in the nearshore sites. In the case of Alnus
however, it is likely that many seeds enter the lake via Jacob's
Creek, the main inlet stream. Alnus can be found growing along Jacob's
Creek and its tributaries while few were encountered in a survey of
the lake margin.
W e s t S h o r e v s E a s t S h o r e Cornpari s o n s
Although there is no significant difference in screened residue
volume between the two shores, there was a significant difference in
the distribution of some macrofossils. The macrofossils with the most
significantly skewed west shore distributions are those of trees and
shrubs (Table 4). The preponderance of forest macrofossils on the west
shore can be explained by the topographic differences between the two
shorelines. The west slope is steep and in most places the forest
extends almost to the shore. It is likely that many macrofossils fall
directly into the lake and that many others are washed down the slope
during periods of heavy rain. The east slope, on the other hand, is
not so steep and there is a sedge mat along most of its length. In
some places the forest is up to fifty meters from shore. Here it is
likely that fewer forest macrofossils fall directly into the lake. In
addition, sedge mats are known to act as filters preventing many
macrofossils that might otherwise enter the lake in surface runoff
from reaching the lake ma rake and Burrows,l980; McQueen,l969).

Table 4. West shore / east shore ratios for those macrofossils found at five or more sites. The maximum site frequency is sixteen since there were only sixteen nearshore sites ( five or fewer meters from shore 1 . The ratios were calculated by dividing a macrofossil's average concentration in the west shore sites by its-average concentration in the east shore sites. The macrofossils are listed in order of the statistical significance of their west shore / east shore distributions as calculated by a Mann-Whitney two sample rank test. Where the significance is equal they are listed in order of their west shore / east shore ratios. (*=there were none found in the east shore sites so the ratio could not be calculated)
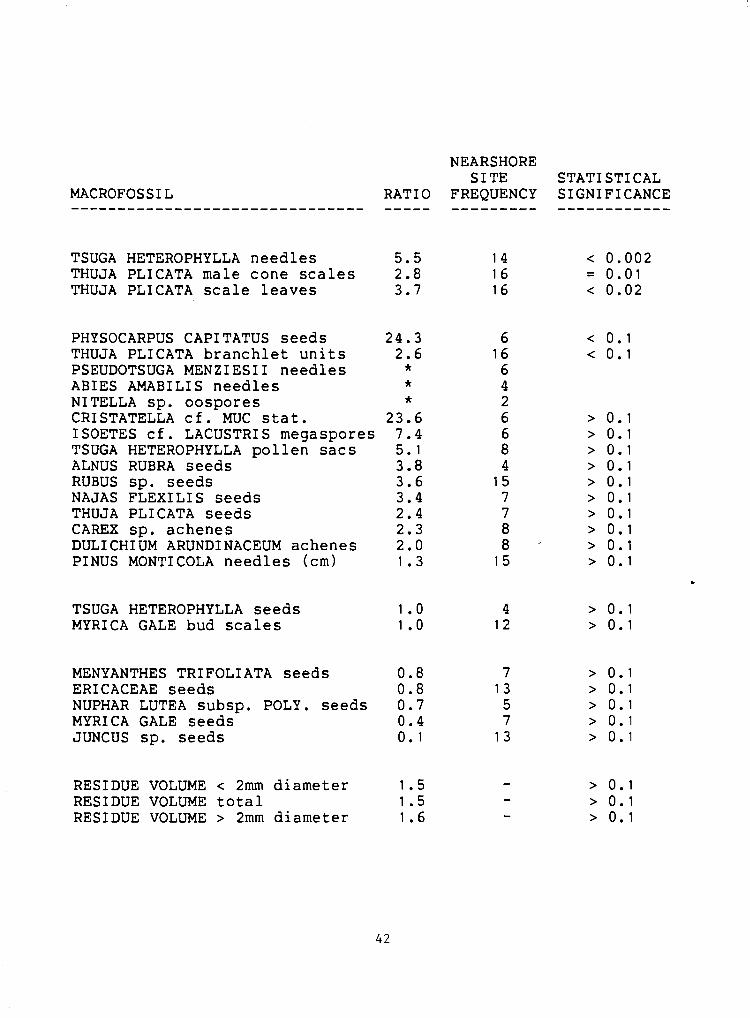
TSUGA HETEROPHYLLA needles 5.5 14 < 0.002 THUJA PLICATA male cone s c a l e s 2.8 16 = 0.01 THUJA PLICATA s c a l e leaves 3.7 16 < 0.02
PHYSOCARPUS CAPITATUS seeds 24.3 THUJA PLICATA branchlet u n i t s 2.6 PSEUDOTSUGA MENZIESII needles * ABIES AMABILIS needles * NITELLA sp. oospores * CRISTATELLA c f . MUC s t a t . 23.6 ISOETES c f . LACUSTRIS megaspores 7.4 TSUGA HETEROPHYLLA pol len sacs 5.1 ALNUS RUBRA seeds 3.8 RUBUS sp. seeds 3.6 NAJAS FLEXILIS seeds 3.4 THUJA PLICATA seeds 2.4 CAREX sp. achenes 2.3 DULICHIUM ARUNDINACEUM achenes 2.0 PINUS MONTICOLA needles (cm) 1.3
TSUGA HETEROPHYLLA seeds 1 .O 4 > 0.1 MYRI CA GALE bud s c a l e s 1 .O 12 > 0.1
MENYANTHES TRIFOLIATA seeds 0.8 7 > 0.1 ERICACEAE seeds 0.8 13 > 0.1 NUPHAR LUTEA subsp. POLY. seeds 0.7 5 > 0.1 MYRICA GALE seeds 0.4 7 > 0.1 JUNCUS sp. seeds 0.1 13 > 0.1
RESIDUE VOLUME < 2mm diameter 1.5 - > 0.1 RESIDUE VOLUME t o t a l 1.5 - > 0.1 RESIDUE VOLUME > 2mm diameter 1.6 - > 0.1

Still, some macrofossils are more abundant in the east shore
sites. These tend to be taxa associated with the sedge mat. However,
none of the east shore skewed distributions are statistically
significant. This is probably because there is a narrow sedge zone
along the west shore, enough to minimize the difference in
'marshiness' between the two sides of the lake.
C o m p a r i s o n W i t h M o d e r n F l o r a
The frequency of occurrence and average concentration of conifer
macrofossils were compared to the relative abundance of the trees in
the surrounding forest ma able 5). As might be expected from the
abundance of its macrofossils, Thuja plicata is abundant in the
forest, accounting for 56 percent of the total basal area within 100
meters of Marion Lake. Similarly, Tsuqa heterophylla, which accounts
for 35 percent of the basal area, was found at 24 of the 30 sample
sites.
Pseudotsuqa menziesii needles were found at only 6 sites. The tree
is not very common within 100 meters of the lake due to a lack of
suitably dry sites but accounts for 7 percent of the basal area within
1000 meters. Pseudotsuqa needles may be poorly represented in part due
to the difficulty of identifying fragments. Differentiation from Tsuga
may depend upon the length to width ratio unless microtome
cross-sections are examined (~unwiddie~l985).
Abies amabilis needles were found at 10 sites despite the fact the
tree accounts for only 3 percent of the total basal area. There are,
however, several large trees that grow along the inlet stream. Pinus
Table 5. Percent basal area of trees within 100 meters of Marion Lake compared to the site frequency and average concentration of macrofossils in the sediments. The concentration is in numbers per 100 ml of sediment, the frequency out of a total possible 30. Basal areas supplied by Donald McLennan ( 1 9 8 1 ) . (*=present but not encountered during sampling
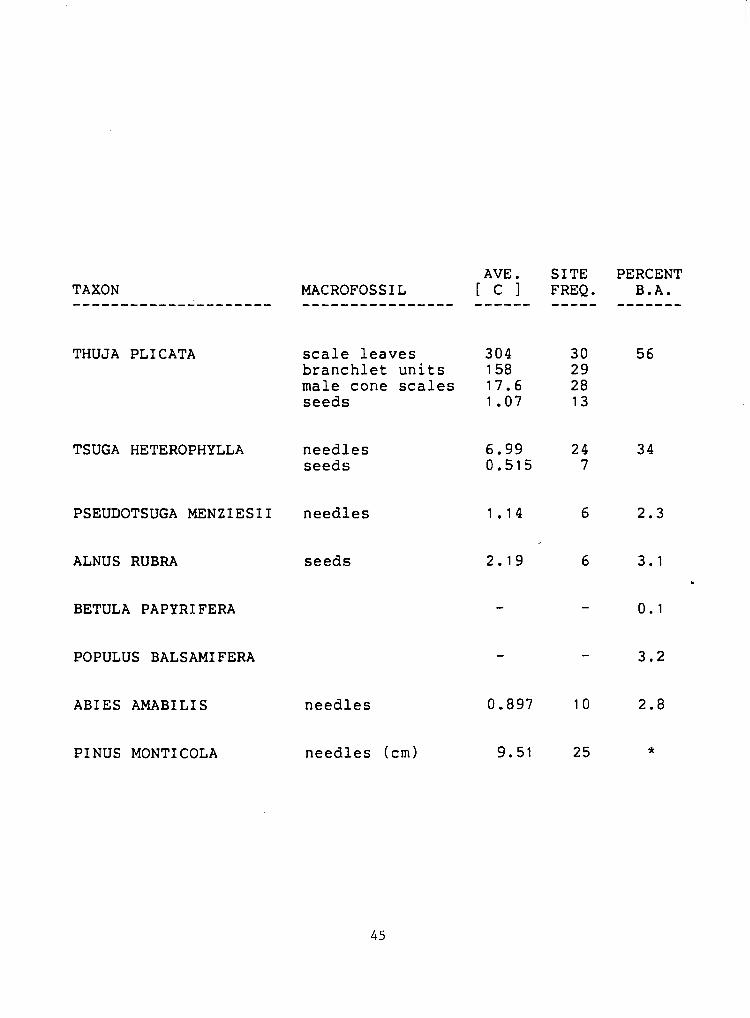
THUJA PLI CATA scale leaves 304 30 56 branchlet units 158 29 male cone scales 17.6 28 seeds 1.07 13
TSUGA HETEROPHYLLA needles seeds
PSEUDOTSUGA MENZIESII needles 1.14 6 2.3
ALNUS RUBRA seeds
BETULA PAPYRIFERA
POPULUS BALSAMIFERA - - 3 . 2
ABIES AMABILIS needles 0.897 10 2.8
PINUS MONTI COLA needles (cm) 9.51 25 *

monticola needle fragments were found at 25 of the 30 sample sites
despite the fact the tree is rarely found in the forest. It seems that
the small fragments of these needles, often only a few mm in length,
are well dispersed in the lake.
In September 1982 a qualitative vegetation survey was conducted
adjacent to each pair of nearshore sample sites. The presence of all
trees and shrubs encountered from the lake margin to and including the
edge of the forest was noted. Table 6 compares the presence/absence of
macrofossils in the sixteen nearshore sediment samples to the
presence/absence of the species in the adjacent vegetation survey.
Macrofossils of the conifers are needles or needle fragments (their
seeds were encountered only where their needles were present) while,
for other taxa, they are seeds or other reproductive structures. The
only exception is for the shrub, Myrica gale, where fruits occur only
where the bud scales are encountered.
Four of the fourteen tree species, all non-coniferous, and ten of L
the sixteen shrubs are not represented in the macrofossil flora.
Species not encountered in the macrofossil flora yet often noted in
the vegetation survey may be underrepresented by macrofossil analysis.
Included in this category are the trees Pyrus fusca and Acer
circinatum, and the shrubs Cornus canadensis, Ledum qroenlandicum,
Lonicera involucrata, Menziesia ferruqinea, Salix sp., Sambucus
racemosa and Spiraea douqlasii.
Species not often encountered in the vegetation survey yet often
represented in the macrofossil flora may be overrepresented by

Table 6. Comparison of the presence/absence of macrofossils in the nearshore samples to near-site vegetation surveys. Numbers left of the solid line indicate, for those sites where the macrofossil was present, the number of times the species was present in and absent from the adjacent vegetation survey. Numbers right of the solid line indicate, for those sites where the macrofossil was absent, the number of times the species was present in and absent from the adjacent . vegetation survey. Macrofossils of trees are needles or needle fragments while those of other taxa, with the exception of ~yrica gale bud scales, are reproductive structures.

TREES
ABIES AMABILIS ACER CI RCINATUM ALNUS RUBRA BETULA PAPYRIFERA PICEA SITCHENSIS PINUS MONTI COLA POPULUS TRICHOCARPA PRUNUS EMARGINATA PYRUS FUSCA PSEUDOTSUGA MENZIESII SORBUS SITCHENSIS TAXUS BREVIFOLIA THUJA PLI CATA TSUGA HETEROPHYLLA
SHRUBS
CORNUS CANADENSIS GAULTHERIA SHALLON KALMIA sp. LEDUM GROENLANDICUM LONICERA INVOLUCRATA MENZIESI A FERRUGINEA MYRICA GALE OPLOPANAX HORRIDUM PHYSOCARPUS CAPITATUS RIBES sp. RUBUS PARVIFLORUS RUBUS SPECTABILIS SALIX sp. SAMBUCUS RACEMOSA SPIRAEA DOUGLAS11 VACCINIUM sp.
NEARSHORE S I TES WHERE MACROFOSSILS
PRESENT
NUMBER OF SITES WHERE TAXON
Present Absent ------- ------
NEARSHORE SITES WHERE MACROFOSSILS
ABSENT
NUMBER OF SITES WHERE TAXON

macrofossil analysis. Species in this category are the tree Pinus
monticola and possibly the shrub Rubus parviflorus. Species
encountered often in both the macrofossil flora and the vegetation
survey may be good candidates for macrofossil analysis since the
macrofossils tend to be found where the plants are observed. Species
in this category are the trees, Thuja plicata and Tsuqa heterophylla
and the shrub, Myrica gale.
THE SAMPLE SITES -
In looking at the distributions of the various macrofossils within the
lake differences were seen between the nearshore and offshore and
between the west shore and east shore sites. The nearshore samples
tended to contain a greater variety of macrofossils as well as greater
concentrations of any given macrofossil. The west shore sites had
greater concentrations of forest-derived macrofossils than the other
sites. Thus it appears that knowing the macrofossil composition of a
sample may allow one to infer its position within the lake and vice '
versa. To illustrate these results the macrofossil data were subjected
to a principal factor analysis.
Principal factor analysis is essentially a descriptive technique
(Harris,1975). It reduces the complexity of the data by transforming a
large number of correlated variables into a smaller set of
uncorrelated factors. The percentage of the total variance accounted
for by each factor is calculated. Factors that account for a large
percentage of the total variance can be investigated further while
those that account for little variance can be ignored. For each factor

a weighting coefficient, or factor loading, is calculated for each of
the samples. These factor loadings can help define the underlying
dimension of the factor.
The first two principal factors account for 37.7 percent of the
total variance in the data while the remaining 28 factors account for
53.3 percent. By comparing the individual factor scores for each site
it is possible to characterize the sites according to their position
in the lake. Figure 5 shows a plot of the loadings for factor 2 vs the
loadings for factor 1 in each of the 30 sample sites.
The first principal factor, accounting for 25 percent of the
variance between the samples, appears to describe the difference
between the west shore samples and all other samples in the lake. The
west shore sites score above the mean for factor 1 while the east
shore sites and the offshore sites, with one exception, score below
, the mean. It would seem that the west shore / east shore dichotomy is
in reality a west shore / any other location dichotomy. Also L
interesting is the fact that the only other site to have a factor
loading above the mean for factor 1 was site EA4. his site is
adjacent to the inlet stream where its 'forest character' is likely
due to the washing in of macrofossils by Jacob's Creek.
The second principal factor describes the difference between
nearshore and offshore sites. All the nearshore east and most of the
nearshore west sites have high loadings for factor 2, whereas the
factor 2 loadings for most offshore sites are low. The only nearshore
sites to have low loadings for factor 2 are F2, F1 and EA1. Sites F1
Figure 5. Factor loadings for factor 2 vs factor 1 for each of the thirty sample sites. The offshore sites are shown by crosses, the east shore sites by open circles and the west shore sites by shaded squares. The west shore sites score high for factor 1. The nearshore sites in general score high for factor 2. The one site that was markedly different from all the other sites was site EA4 (lower right) which was opposite the inlet stream. See Figure 1 for the location of the sample sites. (~S=nearshore)
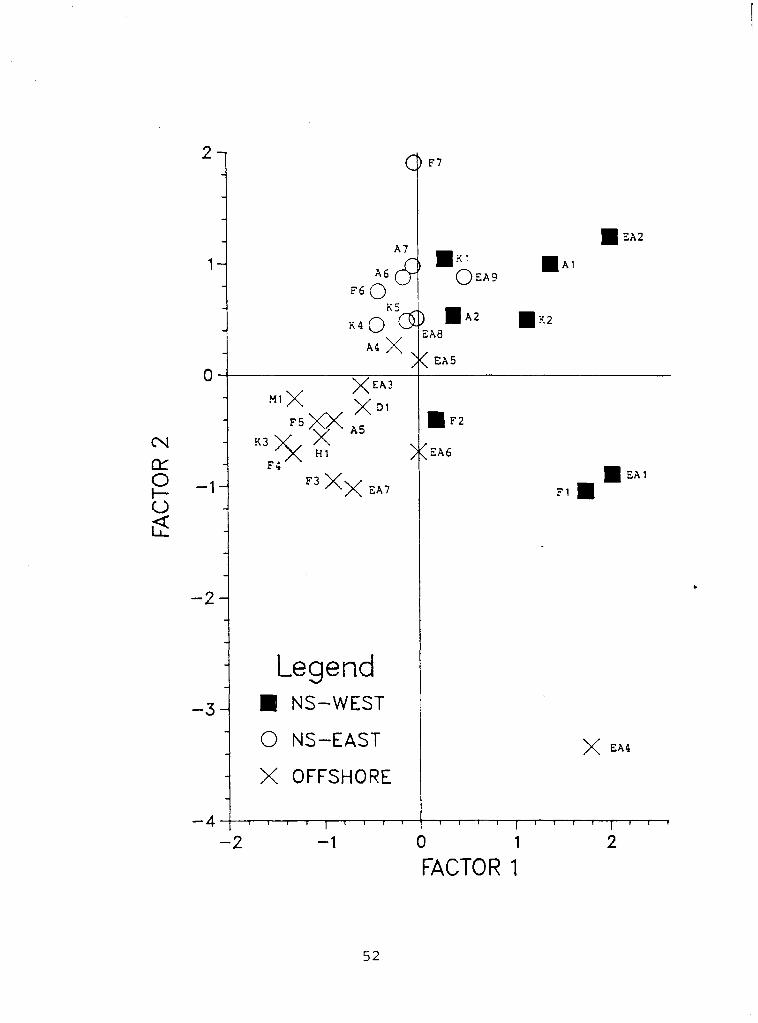
Legend NS-WEST
O NS-EAST
X OFFSHORE
0 1
FACTOR 1

and F2 are adjacent to a small surface runoff inlet which may have
reduced their nearshore character. The dry weights of these two
samples were markedly higher than for any of the other nearshore
samples (see Table 1 ) .

PART C
THE CORE ANALYSIS

CHAPTER I
METHODS
FIELD METHODS
In June 1982 a sediment core was obtained from a location as close
as possible to the coring site of Mathewes ( 1 9 7 3 ) . A platform was
constructed by lashing together two small boats and anchoring them
over the coring site in about 6 meters of water. An attempt was made
to obtain a complete core using a 7.5 cm diameter Livingstone piston
corer (Cushing and Wright, 1965) . However, friction prevented sampling
with this large diameter corer at depths beyond about 7 meters into
the sediment. Consequently, a second core was taken at an adjacent
site using a 5 cm diameter corer. A sediment sequence was obtained
from the surface to the basal clay at a depth of 8.6 meters. The core
segments were brought to the surface a meter at a time and extruded
into a plastic trough. Any suspect portions of a segment, such as L
'slop' in the top few centimeters, were discarded and the remaining
wrapped in cellophane and tinfoil for transport back to the
laboratory.
An additional core was obtained from the same site the following
year because of a suspicion that the first core may have been
contaminated at the 7 and 8 meter drive boundaries. This time the
sampling drives were started at the half meter marks; i.e. from 1.5 -
2.5 m, 2.5 - 3.5 m, and so on, such that the boundaries of the
previous core segments would fall in the middle of the new segments.
LABORATORY METHODS
In the lab the cores were examined for detritus zones and other
obvious variations in texture or colour. In order to obtain as many
macrofossils as possible it was decided to analyze the large diameter
core down to the level of the Mazama volcanic ash, found at a depth of
5.78 meters into the sediment. This ash fall occurred about 6600 years
ago (Powers and Wilcox,1964). Below the level of the ash the small
diameter ( 5 cm ) core was used since the large diameter core was
unreliable due to sampling problems.
Each section of core representing a drive of one meter was divided
into 10 equal segments. Below the level of 8 meters the small diameter
core was divided into segments of 5 cm in an attempt to obtain a more
detailed look at early postglacial changes. The bulk density, dry
weight and loss on ignition of each core segment were determined,
using the same method as was used for the surface samples, in order to
plot their changes over time. Each core segment was screened and b
analyzed for macrofossils following the method used for the surface
samples.
CHAPTER I I
RESULTS AND DISCUSSION
STRATIGRAPHY
As reported by Mathewes ( 1 9 7 3 ) the core consists of olive-brown
gyttja which darkened rapidly upon exposure to air. Detritus zones
which were found at various intervals correspond well with those found
by Mathewes in 1973. The ash from the eruption of Mount Mazama was
encountered at a depth of 5.78 meters in the large diameter core and
at a depth of 5.90 meters in the small diameter core. At the base of
the core the sediment grades rapidly into a blue-grey clay at a depth
of 8.6 meters. These values are in close agreement with those of
Mathewes who found the Mazama ash at a depth of 6.00 meters and the
glacial clay at a depth of 8.65 meters. The two cores were similar
enough that dates from the Mathewes core, scaled relative to the
markers of the ash and the basal clay, were used for my own core.
Plots of the bulk density, dry weight, loss on ignition, and
concentration of residue vs depth in the core are given in Figure 6.
The bulk density and dry weight gradually increase with depth as
expected. The loss on ignition gradually decreases with depth. The
concentration of residue (greater than 250 microns in diameter) is
quite variable mainly due to the many detritus zones encountered in
the core. The samples taken to determine the bulk density and dry
weight were not taken from obvious detritus zones.

Figure 6.: Bulk density, dry weight, loss on ignition and concentration of residue vs depth in the core. Bulk density and dry weight gradually increase with depth. Loss on ignition gradually decreases with depth. The residue concentration was quite variable. High concentrations of residue ( greater than 250 microns in diameter) were associated with detritus zones in the core.

THE INFLUX DIAGRAM -
The macrofossil data were plotted using the MICHIGRANA computer
program (Futyma and Meachan,l984) for plotting pollen-stratigraphic
data. Once the data is placed in a plotfile, the program allows
percentage, concentration and influx diagrams to be easily plotted.
Some scaling of the macrofossil data and volume units was necessary in
order to use the program, since it was designed for the higher
concentrations expected in pollen studies.
Figure 7 is an influx diagram showing the frequently encountered
taxa. The influx of macrofossils was calculated by multiplying the
number of macrofossils per cm3 by the sedimentation rate in cm per
year to yield an influx in numbers per cm2 per year. The unit used in
plotting the diagram is number of macrofossils per 1000 cm2 per year.
This unit was used as a compromise that allowed rare taxa to show up
yet prevented excessively high values for abundant taxa. Values used
for the sedimentation rate were calculated by Ian Walker, based on . radiocarbon dates from the Mathewes (1973) core. A simplified version
of Mathewes' (1973) pollen diagram is given as Figure 8. Unless stated
otherwise, references to pollen and to the pollen diagram in the
following discussion refer to Figure 8.
W e s t e r n R e d C e d a r H i s t o r y
The earliest appearance of Thuja plicata as a macrofossil is at a
depth of 5.35 meters, or about 6000 years B.P. This contrasts with the
Mathewes core where Thuja type pollen (could be other Cupressaceae)

Figure 7. Influx diagram showing the frequently encountered taxa. The influx of macrofossils was calculated by multiplying the number of macrofossils per cm3 by the sedimentation rate in cm per year to yield an influx in numbers per 1000 cm2 per year. Ten times auxiliary curves highlight the changes in influx. (C-14 dates from Mathewes, 1973)
L
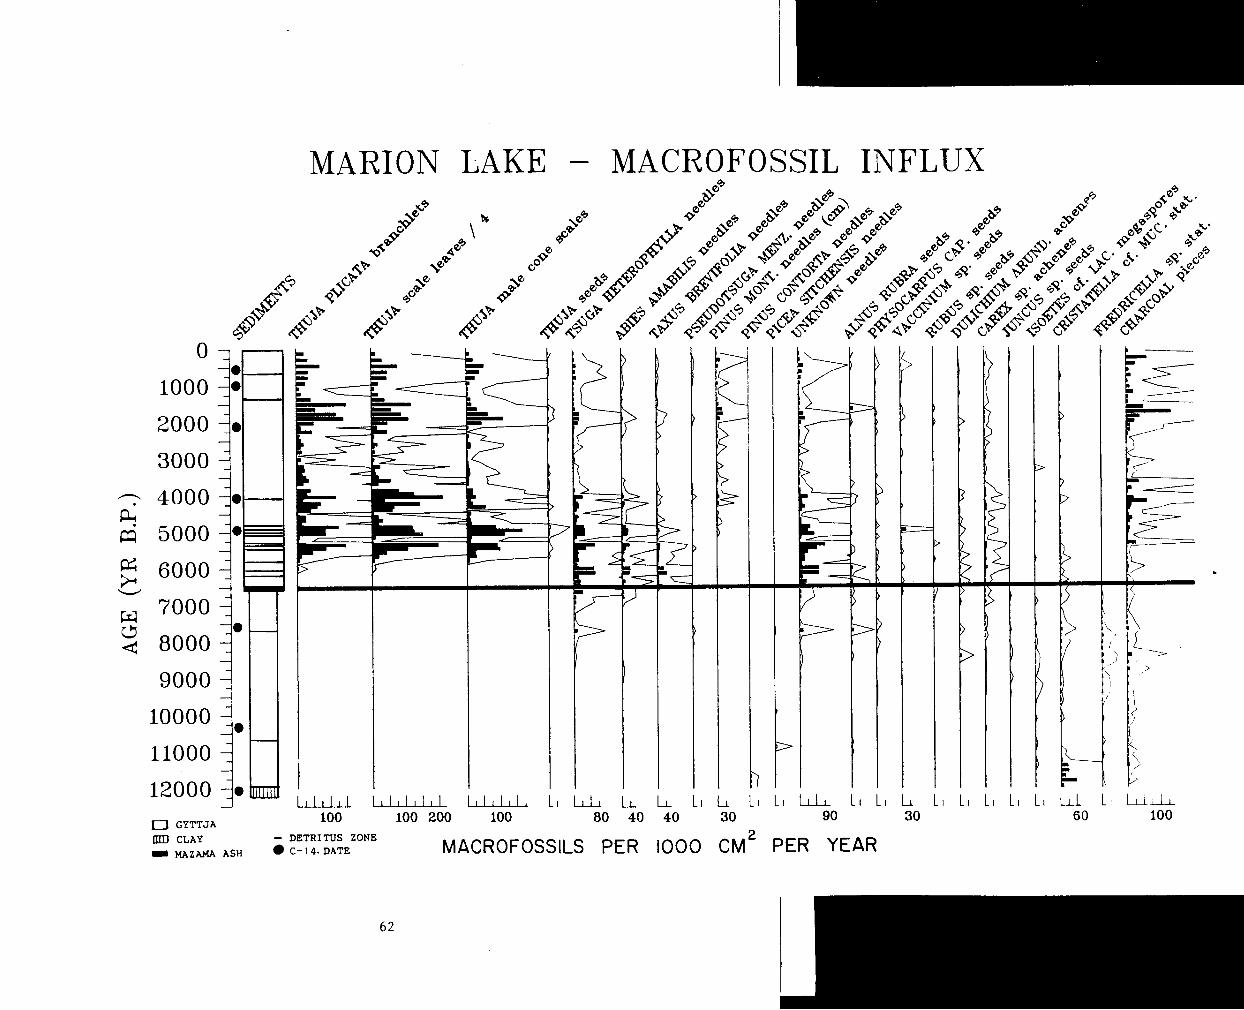
MARION LAKE - MACROFOSSIL I N F L U X
0 GYTTJA
CLAY MAZAMA ASH
I I I L I I I I L l L L l L l I L l L l 1 L , L l L , L l L l u L l L L L L 100 100 200 100 80 40 40 30 90 30 60 100
- DETRITUS ZONE C-14 . DATE MACROFOSSILS PER IOOO C M ~ PER YEAR
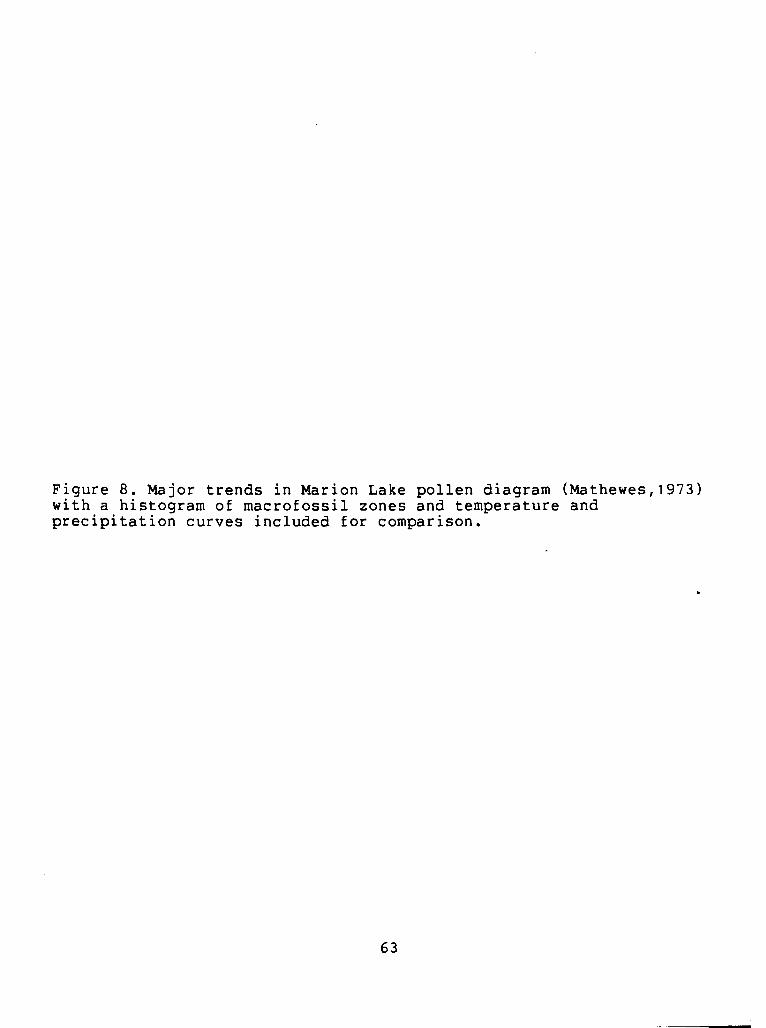
Figure 8. Major trends in Marion Lake pollen diagram (Mathewes,l973) with a histogram of macrofossil zones and temperature and precipitation curves included for comparison.

- A -
N 4 O a c D Y m m & W N 4
TSUGA HETEROPHYLLA
THUJA TYPE
'SEUDOTSUGA MENZIESII
?I NUS CONTORTA
'TERIDI UM AQUI LI NUM PSUGA MERTENS I ANA PICEA 4BI ES
RLNUS
SALIX SHEPHERDIA CANADENSIS
INFERRPD CLIMATIC HISTORY
POLLEN ZONES
XXCROFOSSI L ZONES

was found to a depth of 7.35 meters or about 7800 years B . P . In
addition, Mathewes found sporadic occurrences of Thuja type pollen and - macrofossils at a depth of 8 meters or about 10,000 years B . P . Similar
sporadic ocurrences of Thuja macrofossils at the top of the seventh
and eighth core segments in my first core prompted recoring the site
with the start of each drive offset 50 cm from those of the previous
core. Examination of the residue from the core segments surrounding
the seven and eight meter marks in this second core revealed no Thuja
macrofossils. Thuja macrofossils found at the seven and eight meter
marks in my first core were present due to contamination at the core
boundaries. Since the Thuja macrofossils reported by Mathewes were
also at the start of a drive it is likely that they too were the
result of contamination.
Thuja type pollen found as far back as 7800 years B . P . is probably
of some other taxa such as Chamaecyparis or Juniperus. The record of
Thuja macrofossils in the form of scale leaves, branchlet units, male
cone scales and seeds is overwhelming, from their initial appearance,
in the core to the present. It is highly unlikely that Thuja could
have been in the drainage basin from 7800 B . P . without some occurrence
of macrofossils in the core prior to 6000 B . P . For the 500 year period
prior to the appearance of Thuja the influxes of Tsuqa, Abies and
Taxus needles are at their maximum levels. Considering the ubiquity of
the Thuja macrofossils, especially the vegetative ones which were
found in - all surface samples, it seems more likely that Thuja entered
the basin not long before the macrofossils first appear in the core
about 6000 B . P . It is at about this time that Thuja pollen begins to

consistently exceed five percent of total.
W e s t e r n Y e w H i s t o r y
Taxus brevifolia needles first appear just prior to the Mazama ash
at 6600 years B.P. Its history is often not documented by pollen
studies perhaps due to the difficulty in distinguishing it from
Cupressaceae. Taxus is presently of minor importance in the Pacific
Northwest and most authors assume a minor role in the past. The
macrofossil evidence suggests that Taxus may have been a more
important component of the forest around Marion Lake prior to the
arrival and expansion of Thuja plicata. For a period of 1100 years,
from about 6500 to 5400 B.P., the influx of Taxus needles is as high
as that of Abies amabilis and is nearly half that of Tsuqa
heterophylla. The input of Taxus needles averages 35 per core segment
over 1 1 consecutive segments. In the modern surface sediment study
Taxus needles were found at only three sites at an average
concentration equivalent to 3 per core segment. It is not until after
the appearance of Thuja that Taxus needles decline. From 5000 B.P. to
the present Taxus needles are only rarely encountered in the core. It
is possible that Thuja displaced Taxus as both species prefer moist
sites (Krajina et a1.,1982). Such an interpretation points out the
need for a Taxus category on Pacific Northwest pollen diagrams.
P i n e H i s t o r y
The only evidence of Pinus contorta found in the core was needles
found in one sample just above, and two samples just below the
clay/gyttja interface at the base of the core. No identifiable

macrofossils were found more than 10 cm into the basal clay. The Pinus
contorta - needles occur at a point where its pollen is nearly 100
percent of the total. Pinus contorta has been noted in many other
Pacific Northwest studies as one of the first immigrants on recently
deglaciated terrain (Mathewes,l985). The species seems to have played
an important role in the U.B.C. research forest only in the initial
period following deglaciation. Its consistent presence in the pollen
record since then is most likely due to regional transport or from
stunted individuals on nearby rock outcrops (McLennan and Mathewes,
1985).
Pinus monticola needle fragments are first found at a depth of
4.45 meters or about 5100 years B.P. They increase to the present day,
although only isolated individuals are found in the forest around
Marion Lake today (McLennan,l981). The consistent occurrence of needle
fragments in the core from 5100 years B.P. is probably a result of
their overrepresentation as was seen in the surface Sample study.
Although Pinus monticola pollen is found below 8 meters . (Mathewes,l973), it is not found in excess of 1 percent of the total
below a depth of 4.3 meters.
B a l s a m F i r H i s t o r y
The first occurrence of Abies needles is at a depth of 7.55 meters
or about 9000 years B.P. However, they are not frequently encountered
below 6.35 meters or about 7000 years B.P. The pollen record suggests
that prior to 10,000 years B.P. Abies was at least as common as it is
today. This is not reflected in the macrofossil record even though

there is a good correspondence above 7.55 meters between the
occurrence of Abies needles and the presence of pollen. The needles
found are probably all of Abies amabilis. The earlier pollen, on the
other hand, is possibly that of Abies lasiocarpa from higher
altitudes. Needles of Abies lasiocarpa may not have been incorporated
in the sediments as a result of the long distance to the lake. A
similar situation was seen with Pseudotsuqa menziesii in the surface
sample study where, although the tree is present on the hillsides
today, the needles are only rarely encountered in the surface samples.
W e s t e r n H e m l o c k H i s t o r y
The first occurrence of Tsuga heterophylla needles is at a depth
of 7.35 meters or about 8600 years B.P. Tsuga pollen was found by
Mathewes at the clay-gyttja interface about 12,000 years B.P. However,
it'does not consistently exceed 10 percent of the total pollen until
its needles are found in abundance about 8000 B.P. There is a peak
exceeding 20 percent of the total pollen around 10,000 years B.P. in
the Mathewes diagram, and there are similar peaks in other Pacific
Northwest diagrams, although the macrofossils are not encountered at
this time in the Marion Lake core. However, all macrofossils are
uncommon during the early postglacial. It may be Tsuga was present but
its needles were not making their way to the coring site due to
differences in the drainage characteristics of the basin (see Changing
Drainage Patterns).

D o u g l a s F i r H i s t o r y
Needles of Pseudotsuga menziesii are first found at a depth of
7.05 meters or about 8000 years B.P. Pollen of Pseudotsuga, up to 10
percent of the total, is found from 10,000 B.P. However, needles of
Pseudotsuqa were rarely encountered in the surface sediment samples
even though the tree is consistently present, 7 percent of total basal
area, on the hillsides around the lake. Since influxes of all
macrofossils were low prior to 7000 B.P., it is likely that
Pseudotsuga was present, probably away from the lakeshore, from about
10,000 B.P. without needles being transported to the coring site. The
low influx of Pseudotsuqa needles may indicate a lack of suitably dry
sites near the lake as its needles are more frequently encountered in
other Pacific Northwest studies (~wynar, 1985).
B r y o z o a n S t a t o b l a s t s
The significance of the peak of Cristatella cf. mucedo statoblasts
(Plate 111-8,b) at the base of the core is uncertain. However, this
species rarely occurs in polluted water or where oxygen content falls
below 30 percent (Reynolds,l976). Perhaps the cool clear waters of the
early postglacial were conducive to its growth and the subsequent
reduction in numbers an indication of eutrophication of the lake. The
peak of Fredricella sp. statoblasts (plate 111-8,a), found between
9500 and 7500 B.P., is in the middle of the postglacial xerothermic
interval (~athewes and Heusser,l981) suggesting a possible
relationship with warmer summer temperatures.

C h a n g i ng D r a i n a g e P a t t e r n s
Several lines of evidence indicate that much of the organic matter
in Marion Lake is allochthonous, brought into the lake via inlet
streams and surface runoff. Odum ( 1 9 7 8 ) reports that allochthonous
input of particulate organic carbon in Marion Lake is in excess of 70
grams/m2/yr and that more than 80% of this input is fluvial. The
detritus zones in the core contained sand leading Mathewes ( 1973 ) to
suggest that they were deposited during periods of high fluvial input.
Most of the macrofossils in the core are found in these detritus
zones. There is a thick detritus layer on the bottom of the lake near
the inlet stream. Mclennan ( 1 9 8 1 ) found that stream erosion accounted
for about 67% of the total pollen input into Marion Lake sediment.
Changes that alter the flow rate and patterns of erosion in the Marion
Lake catchment are therefore likely to be reflected in the abundance
of macrofossils deposited.
There is a drop in influx of all taxa between 3 meters and 1.5
meters in the core. This portion of the core spans some 1700 years
from 3700 to 2000 years B.P. An additional period of reduced influx is
seen circa 1300 B.P. It is most likely that during these periods there
was some major change in the drainage pattern of the basin. A layer of
peat along Jacob's Creek about 300 meters upstream from from the lake
attests to the past presence of a significant depositional basin. A
photograph of the upper layers of this peat bed can be seen can be
seen in Plate IV. It is apparent from the photograph that late peat
accumulation was intermittent, with alluvial lenses of sandy or silty
sediment interspersed. The changes in macrofossil input to Marion Lake

Plate IV. Photograph showing dark layer of peat, buried by alluvium, along Jacob's Creek upstream from Marion Lake. A radiocarbon date from the base of the peat coincides with the start of a period of reduced influx of macrofossils circa 3700 years B.P. A date from the top of the peat (0.3-0.4 on rod) coincides with a second period of reduced influx circa 1300 years B.P.
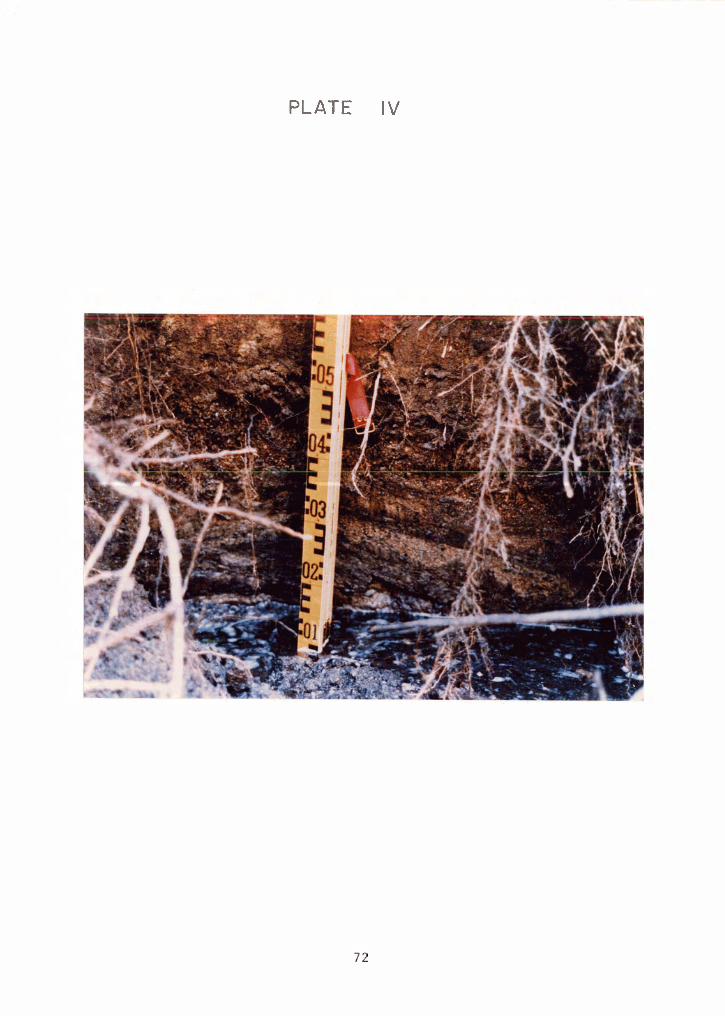
PLATE I V

likely represent the filtering effect of this ancient sediment trap.
The base of the peat bed was dated at 3900 f 160 years B.P.
(SFU-305). This coincides almost exactly with the sudden and marked
decrease in macrofossil influx into the lake circa 3700 B.P. Further,
a sample of peat from the top of the bed was dated at 1330 f 60 years
B.P. (Beta-14267). This coincides well with the second decrease in
macrofossil influx seen circa 1300 B.P. It seems that the input of
macrofossils to Marion Lake has been reduced by this settling basin
upstream from the lake. The origin of the basin is unknown, although
there presently is, and likely was, beaver activity along Jacob's
Creek. The outlet to the lake is an ideal place for a dam and evidence
of past activity there remains. A rise in water level by a few meters
would be sufficient to cover much of the floodplain above the present
lake.
Prior to 7000 B.P. the influx of all macrofossils is very low.
These low early influxes are possibly evidence of the postglacial
xerothermic interval (~athewes and Heusser, 1981). There is no
indication of a depositional basin upstream from the present lake
during this time. As most of the macrofossils in the core are found in
the detritus zones that appear to result from periods of high runoff
and erosion in the watershed, an extended period of reduced average
annual precipitation would likely result in a period of reduced
macrofossil influx, especially if the reduction occurred during peak
periods.

T h e C h a r c o a l R e c o r d
It is interesting to note that during the 1700 year period of
reduced macrofossil influx, 3700 to 2000 years B.P., the influx of
charcoal was also reduced. Further, the reduced macrofossil influx
circa 1300 B.P. and the low values prior to 7000 B.P. are also
reflected in a reduced charcoal influx. This suggests the charcoal
pieces counted in this study also enter the lake during periods of
high runoff and erosion in the watershed. Such an interpretation has
interesting implications for the use of charcoal data from this lake.
If most of the charcoal is fluvially derived, a marked increase of
charcoal could be an indication of increased precipitation and erosion
of catchment soils rather than of fire activity at the time of
deposition.
When one compares the record of charcoal in Marion Lake to a
precipitation curve for the area (Mathewes and Heusser,l981), the
increased charcoal due to increased precipitation hypothesis seems to
hold up. A simplification of this curve is appended to the pollen
diagram in Figure 8. One of the most significant aspects of the curve
is the suggestion of a marked increase in annual precipitation in the
mid Holocene. To quote R.W. Mathewes ( 1985,p415),
"Although the nature of early to mid Holocene climate is controversial, there is widespread agreement among geologists and paleobotanists that the climate of the late Holocene became colder and wetter".
There is a marked increase in influx of charcoal in the core following
this accepted increase in average annual precipitation.

The association of increased charcoal influx with a wetter climate
can be explained in that oniy charcoal pieces retained on a 250 micron
sieve were counted. Pieces of charcoal as large as this are probably
not carried long distances by wind. Burzynski ( 1 9 8 4 ) found that pieces
of this size and larger fall within 1 kilometer of the burn site even
when wind speeds are as high as 20 kilometers per hour. It seems more
likely this charcoal would enter the lake via erosion from the soil
during periods of high runoff.
THE PERCENTAGE DIAGRAM -
Figure 9 is a percentage diagram including only 'needles' of
conifers. Seeds were too uncommon to plot. Although Thuja branchlets
and scale leaves are not strictly equivalent to needles, they were
used in the the calculation of the percentages. The number of scale
leaves was divided by 4, since it takes four scale leaves to make one
branchlet unit. The total length in cm of Pinus monticola needle . fragments was used since whole needles were rarely encountered.
One obvious change in the percentage diagram is the marked
increase in the needle sum at about the level of the Mazama ash some
6600 years B.P. This increase precedes the appearance of Thuja plicata
macrofossils in the core by about 600 years and coincides well with
the increase in mean annual precipitation predicted upon the basis of
pollen transfer functions (~athewes and Heusser,l981). It is not
surprising that an increase in needle sum should coincide with an
increase in mean annual precipitation given the abundant evidence to

Figure 9. Percentage diagram for conifer needles. Zones were determined using the pollen zonation program developed by Gordon and Birks (1972). ((2-14 dates from Mathewes,l973)

MARION LAKE - MACROFOSSIL P E R C E N T A G E
.J
a GYTI'JA IlKU CLAY - D E T R I T U S ZONE
(I MAZAMA A S H C - 1 4 D A T E PERCENT OF MACRO SUM

suggest macrofossils are washed into the lake during periods of high
runoff.
Surprisingly, this increase in needle sum is not reflected in the
pollen sum. McLennan (1981) found as much as 67% of the pollen
deposited in Marion Lake could be attributed to fluvial input. One
would think that as more macrofossils are washing in more pollen
should be washing in. However, it is likely that, as the waters of
Jacob's Creek slow upon entering the lake, the larger and heavier
macrofossils settle out while the smaller and lighter pollen grains
are carried on. Pollen trapping in the outlet (~c~ennan,l981) shows
large losses occur by flushing into the outlet stream.
From its first occurrence as a macrofossil in the core about 6000
years B.P., Thuja plicata quickly dominates the needle sum. The
initial reduction in the percentages of other needles coinciding with
the arrival of Thuja are a result of the new arrival-and do not
represent a real reduction in numbers. Subsequent reductions in the L
percentages of - 1 ~ b i e s Taxus and Tsuga represent reductions in the
numbers of these needles in the core. The only needles to increase in
percentage after the arrival of Thuja were fragments of Pinus
monticola needles which did not appear in the core until about 5100
years B.P.
Macrofossil Z o n a t i o n
The data for the macrofossil percentage diagram were zoned using
the 'Zonation' program developed by Gordon and Birks (1972). This
program was designed to numerically split pollen diagrams into zones
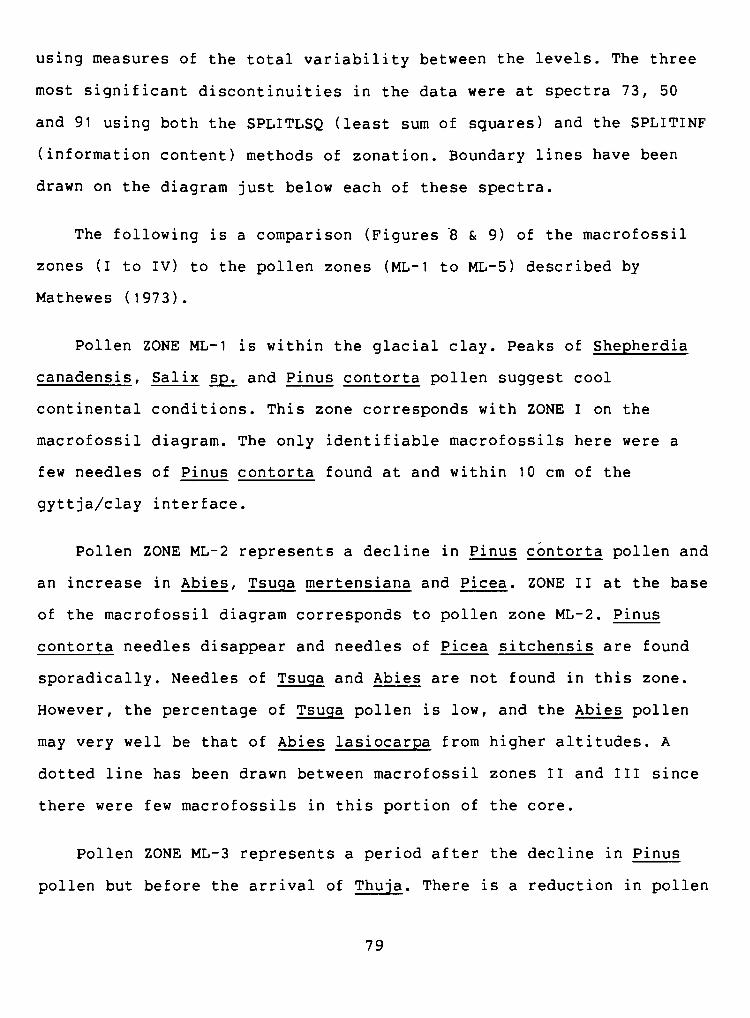
using measures of the total variability between the levels. The three
most significant discontinuities in the data were at spectra 73, 50
and 91 using both the SPLITLSQ (least sum of squares) and the SPLITINF
(information content) methods of zonation. Boundary lines have been
drawn on the diagram just below each of these spectra.
The following is a comparison (Figures -8 & 9) of the macrofossil
zones (I to IV) to the pollen zones (ML-1 to ML-5) described by
Mathewes (1973).
Pollen ZONE ML-1 is within the glacial clay. Peaks of Shepherdia
canadensis, Salix sp. and Pinus contorta pollen suggest cool
continental conditions. This zone corresponds with ZONE I on the
macrofossil diagram. The only identifiable macrofossils here were a
few needles of Pinus contorta found at and within 10 cm of the
gyttja/clay interface.
Pollen ZONE ML-2 represents a decline in Pinus contorta pollen and
an increase in Abies, Tsuga mertensiana and Picea. ZONE I1 at the base
of the macrofossil diagram corresponds to pollen zone ML-2. Pinus
contorta needles disappear and needles of Picea sitchensis are found
sporadically. Needles of Tsuqa and Abies are not found in this zone.
However, the percentage of Tsuqa pollen is low, and the Abies pollen
may very well be that of Abies lasiocarpa from higher altitudes. A
dotted line has been drawn between macrofossil zones I1 and I11 since
there were few macrofossils in this portion of the core.
Pollen ZONE ML-3 represents a period after the decline in Pinus
pollen but before the arrival of Thuja. There is a reduction in pollen
of Picea and Abies but the latter increases again towards the end of
the zone. There is an increase in Tsuga heterophylla and Pseudotsuqa
menziesii. Taxus pollen is not recorded. This zone corresponds with
macrofossil ZONE 111. Abies amabilis needles are found and increase
along with Taxus brevifolia towards the end of the zone. Picea needles
disappear except for a single occurrence in the middle of the zone.
Tsuga heterophylla needles are found as are needles of Pseudotsuga
menziesii, even though the latter appear to be poorly represented in
the macrofossil flora on the basis of the surface sample study. m his
zone overlaps with the postglacial xerothermic interval (Mathewes and
Heusser,l981).
Pollen ZONE ML-4 represents the probable local arrival and
subsequent increase of Thuja plicata. This zone corresponds with
macrofossil ZONE IV, although the pollen diagram once again
establishes the start of the zone prior to the date established by the
macrofossil diagram. Thuja pollen likely arrived before the tree,
although prior to 6600 years B.P. the Thuja type pollen is possibly of
other Cupressaceae. The overwhelming abundance of Thuja macrofossils
from 6000 years B.P. to the present and the total absence prior to
6000 years B.P. suggest that Thuja was not present near the lake prior
to this date.
Pollen ZONE ML-5 is not found on the macrofossil diagram. This
zone represents an increase in the occurrence of successional species
mostly due to historical forest disturbance. Since successional
species were poorly represented in the surface sample study, the
absence of this zone on the macrofossil diagram is not surprising.

PART D
SUMMARY AND CONCLUSIONS

SUMMARY
The Traditional Uses of Macrofossils
The traditional uses of plant macrofossil data to supplement
pollen data are well established (~atts,1980). The validities of two
main uses, to establish the local presence of taxa whose pollen
travels long distances on the wind, and to establish the specific
identity of taxa whose pollen is not easily differentiated, have been
confirmed by this study.
According to the pollen data, Thuja plicata was potentially
present but rare in the Marion Lake drainage basin as early as 7800
years B . P . The macrofossil data suggest it is unlikely ~ h u j a was in
the drainage basin much prior to 6000 years B.P. Thuja macrofossils
predominate from their first appearance in the core at 6000 B . P . For
500 years prior to this date the influxes of other taxa are at their
maximums with no evidence of Thuja and ~ h u j a macrofossils were most
ubiquitous in the surface sediment study. The earlier report of
macrofossils at 10,000 years B . P . by Mathewes (1973) is likely the
result of contamination at a core segment boundary.
Taxus brevifolia was not recorded in the pollen diagram. The
macrofossil diagram establishes Taxus as an important local species
for a period of about 1100 years from 6500 to 5400 years B.P. During
this period the influxes of Taxus, Abies amabilis and Tsuga
heterophylla needles are higher than at any other time. Twenty percent
are -' Taxus twenty percent are ~ b i e s and the remaining are Tsuga.
T h e S u r f a c e S e d i m e n t S t u d y
Whether macrofossils can be used to produce meaningful vegetation
reconstructions, analagous to those produced using pollen data,
depends upon whether they are sufficiently mixed and dispersed to
represent the composition of the local vegetation ma irks and
Birks,1980). A particular site may be biased in favour of some taxa
over others, but this bias should be predictable from the location of
the site. This study has shown that, in ~arion Lake, there is a good
dispersal of coniferous macrofossils and that some of the biases in
the dispersal can be predicted from the location of the site.
There are significantly more macrofossils from forest species in
the west shore sites than in the east shore sites. Conversely, there
were more sedge marsh macrofossils in the east shore sites than in the
west shore sites. These differences result from differences in the
topography and vegetation composition between the shores. The west
shore is steeper without the bordering sedge marsh than can be found 6
along the east shore.
Offshore sites are macrofossil poor relative to the nearshore
sites but macrofossils of conifers are consistently present. The
occurrence of upland taxa in offshore sampling sites appears to be the
result of fluvial input, mainly by Jacob's Creek. Lenses of detritus,
resulting from periods of high runoff and erosion in the watershed,
were the main source of macrofossils in the core. A change in the
I drainage pattern can drastically alter the input of macrofossils, as
1 seen in the reduced influx of all macrofossils between 3700 and 2000
I

years B.P. ~vidence indicates that a past depositional basin above the
present lake may have been responsible for this reduction.
Vegetative macrofossils, mainly of the forest conifers, were found
at significantly greater average concentrations (p<0.05) and at
significantly more sites (~~0.025) than were reproductive
macrofossils. For most other taxa, reproductive structures were more
abundant than vegetative ones. Branchlet units, scale leaves and
staminate cone scales of Thuja plicata are ubiquitous. It would be
difficult to take a surface sediment sample of 100 ml or more from
Marion Lake without obtaining evidence of Thuja.
Although Pseudotsuga menziesii is consistently present, accounting
for 7 percent of the total basal area within 1000 meters of the lake
(McLennan, 19811, its needles were rarely encountered in the surface
samples. Pinus monticola needle fragments, on the other hand, were
found at most sites despite the fact that it accounts for less than 1
percent of the total basal area. b
The Macrofossil D i a g r a m s
The establishment of local presence using macrofossils is more
conclusive but there is generally good agreement between the
macrofossil and pollen dates. Pinus contorta needles are present at
the clay/gyttja boundary 12,000 years B.P. at a time when pine pollen
is at its maximum. Pinus monticola needles are present from 5100 B.P.
The pollen is present from 10,000 B.P. but rarely exceeds 1 percent of
the total until the needles appear. Abies amabilis needles appear at
9000 B.P. but do not become common until 7000 B.P. Abies pollen is at

its maximum between 12,000 and 10,000 B.P. and becomes common again at
about 7000 B.P. The early pollen is likely that of Abies lasiocarpa
from higher altitudes. Tsuqa heterophylla needles first occur at 8600
B.P. becoming common by 7000 B.P. Tsuga pollen peaks briefly at 10,000
B.P. but does not again exceed 10 percent of the total until the
needles become common. Picea sitchensis needles are found between
10,000 and 11,000 years B.P. at a time when pollen is at its maximum.
Pseudotsuga menziesii needles first occur at 8000 B.P. while pollen is
common from 10,000 B.P. The needles are never common in the core
probably indicating the tree occupied drier sites away from the lake.
Paleoecological interpretations based upon the macrofossil
diagrams are similar to those based upon the pollen diagram. There is
a good correspondence between the zones on the macrofossil percentage
diagram and those on the pollen diagram although the start of each
pollen zone predates its macrofossils analogue. This is to be expected
given the long distance transport of pollen relative-to macrofossils.
The only pollen zone that did not have a macrofossil analogue was ZONE
ML-5, representing a historical increase in successional species which
were poorly represented as macrofossils in the surface sediment study.
The increase in influx of macrofossils of all kinds just prior to
6600 years B.P. corresponds with a period in which it is generally
accepted that the climate in the area became cooler and wetter
(Mathewes,1985). In a lake where fluvial input of macrofossils is
important, it is not surprising that a long term increase in
macrofossil influx for most types should coincide with a period of
increased average annual precipitation. Conversely, the low influx of
macrofossils prior to 7000 B.P. may be evidence of a postglacial
xerothermic interval (~athewes and Heusser,l981). The influx of
charcoal parallels the influx of macrofossils suggesting that pieces
of charcoal greater than 250 microns in diameter enter the lake
primarily during periods of high runoff and erosion in the watershed
rather than as a result of fire activity at the time of deposition.
Together, the percentage and influx diagrams provide a more
accurate reflection of the forest composition than either could alone.
During the period of reduced influx, from 3700 to 2000 years B.P., the
percentage diagram shows the relative abundance of needles in the core
remained essentially unchanged. When the percentages of all other taxa
drop drastically with the rapid expansion of Thuja, the influx diagram
shows their needles are as abundant as ever in the core.
CONCLUSIONS
The surface sediment study provided insights which were valuable L
in the interpretation of the macrofossil diagrams. The demonstrated
ubiquity of its macrofossils was important in establishing the first
local presence of Thuja plicata at 6000 years B.P. The evidence that
upland macrofossils are present in the offshore sites as a result of
fluvial input, largely by the main inlet stream, allows an increase in
the total influx of macrofossils in the core to be interpreted as an
indication of increased runoff and erosion in the drainage basin. In a
lake with a major inlet stream, a prolonged increase in the total
influx of macrofossils may be an indication of an increase in the

average annual precipitation or of an increase during peak periods.
The log of the average concentration vs site frequency plot showed
those macrofossils found in high concentrations were found at most
sites, suggesting the dispersion necessary for a good reconstruction
based upon macrofossils.
There is a good representation of most forest conifers as
macrofossils in the core. A history based solely upon plant
macrofossil analysis from this site would probably be as valid as one
based solely upon pollen analysis, provided the macrofossil influx was
continuously high. The history from 7000 to 12,000 B.P. is less
certain due to low influxes, although the pollen evidence is not
contradicted by the macrofossil evidence during this time. A
percentage diagram complements an influx diagram when total influxes
are variable. There is no doubt that a combined macrofossil / pollen
study is superior to a study based upon pollen or macrofossils alone,
especially where the influx of macrofossils is high; An offshore site
under the influence of an inlet stream may be a good place to collect
upland macrofossils but is apt to show a variable total influx.
BIBLIOGRAPHY
Bengtsson, L. 1979. Chemical analysis. P Changes in the Temperate zone- in thk B: Lake G d X r e ~nvironments (ed. B - --- Geological Programme, project 158.
113-132 in Paleoecological Last 15000 Years. Subproject -- ,E. ~er~lund),ernational
Birks, H.H. 1973. Modern macrofossil assemblages in lake sediments in Minnesota. p. 173-190 in Quaternary Plant Ecoloqy (eds. H.J.B. Birks and R.G. west), Blackwell, Oxford.
- _ _ _ _ _ _ _ _ _ _ ,1980. Plant macrofossils in Quaternary lake sediments. Arch. Hydrobiol. Beih.,
----------- and R.W. Mathewes, 1978. Studies in the vegetational history of Scotland V. Late Devensian and early ~landrian pollen and macrofossil stratigraphy at Abernethy forest, Inverness-shire. New Phytoloqist, 80, 455-484. -
Birks, H.J.B. and H.H. Birks, 1980. Quaternary ~aleoecoloqy. ~dward Arnold, London.
Bonde, E.K. 1969. Plant dissemules in wind-blown debris from a glacier in Colorado. Arctic - and ~lpine Research, 1, 135-139.
Burrows, C.J. 1980. Long distance dispersal of plant macrofossils. - New Zealand -- J. of Botany, l8, 321-322.
Burzynski, M, 1984. Prehistoric -- Fires and Vegetation Changes as Recorded in Peat from New Brunswick Bogs. University of NG ---- Brunswick, M.Sc. thesis.
Cushing, E.J. and H.E. Wright, 1965. Hand operated piston corers for lake sediments. Ecoloqy, 46(3), 380-384.
Cwynar, L.C. 1985. A forest history from Kirk Lake in the foothills of the North Cascades. Unpublished manuscript.
Delcourt, H.R. 1979. Late Quaternary vegetational history of the eastern highland rim and adjacent Cumberland Plateau of Tennessee. Ecological Monoqraphs, 49(3), 255-280.
Delcourt, P.A. 1980. Goshen springs: late Quaternary vegetation record for southern Alabama. Ecoloqy, - I 6(2) 371-386.
Drake, H. and C.J. Burrows, 1980. The influx of potential macrofossils into Lady lake , North Westland, New Zealand. - New Zealand J. of Botany, l8, 257-287.
Dunwiddie, P.W. 1983. Holocene Forest Dynamics -- on Mount Rainier, Washinqton. University of Washington, Ph.D. thesis.

------_-_______ 1984. 'Dichotomous key to conifer foliage in the Pacific Northwest. Northwest Science, 59(3) ,185-191.
Efford, 1 . A . 1967. Temporal and spatial differences in phytoplankton productivity in Marion lake, British Columbia. J. Fisheries Res. - Board Canada, 24, 2283-2307. -
--__________ and Hall, K.J. 1975. Marion lake - an analysis of a lake ecosystem. p199-213 in Energy Flow its ~iological ~imensions. A - stud of the I .B.P. ~anada.(eds)~.~.~. Cameron and L.W. Y-- Billingsly. Roy. Soc. of Canada.
Futyma, R.P. and C. A. Meacham, 1984. - The Michiqrana program for - processing pollen-stratigraphic data using M.T.S. Unpublished manual.
Gasith, A . and A.D. Hasler, 1975. Airborne litterfall as a source of organic matter in lakes. Limnol. Oceanogr., -, 21 253-258.
Glaser, P.H. 1981. Transport and deposition of leaves and seeds on tundra: a late-glacial analog. Arctic - and ~lpine Research, 13(2),173-182.
Gordon, A . D . and H.J.B. irks, 1972. Numerical methods in Quaternary paleoecology. - New Phytologist, _ f 71 961-979.
Greatrex, P.A. 1983. Interpretation of macrofossil assemblages from surface sampling of macroscopic plant remains in mire communities.
71,773-791. J. of Ecoloqy, - -- Harris, R.J., 1975. - A Primer - of Multivariate Statistics. Academic
Press, New York.
Hill, R.S. 1981. Consequences of long-distance dispersal of plant macrofossils. New Zealand J. of Botany, 19, 241-242. L -- -
Krajina, V. 1969. Ecology of forest trees of British Columbia. Ecology of Western North America 2. Dept. of Botany, University of British -- - Columbia.
----------- et al., 1982. Distribution and Ecoloqical Characteristics - of Trees and Shrubs of British Columbia. University of British - - Columbia, Faculty ofForestry.
Lacate, D . S . 1965. Forest land classification for the university of British Columbia Research Forest. Dept. ---- For. Publ. No. 1107.
Lawrence, D . R . 1971. The nature and structure of paleoecology. J. of Paleontoloqy, 45(4), 593-607.
Mathewes, R.W. 1973. A palynological study of postglacial vegetation changes in the University Research Forest, southwestern ~ritish Columbia. Can. J. of Bot., 51(11) ,2085-2103.

-------------- 1985. ~aleobotanical evidence for climatic change in southern British Columbia during late-glacial and Holocene time. p. 397-422 in Climatic Change in Canada 5: Critical Periods in the -- Quaternary Climatic History ofNorthern North ~merica. ed. C.R. Harrington. Syllogeus, 55.
-------------- and L.E. Heusser, 1981. A 12,000 year palynological record of temperature and precipitation trends in southwestern British Columbia. Can. J. of Bot., - 59, 707-710.
McLennan, D.S., 1981. Pollen transport - and representation in the Coast Mountains - of ~ritish Columbia. M.Sc. thesis, Simon Fraser University.
-------------- and R.W. Mathewes, 1985. Pollen transport and re~resentation in the Coast Mountains of British Columbia. I. ~ l b w e r i n ~ phenology and aerial deposition. --- Can. J. of Botany, 62(10). 2154-2164.
McQueen, B.R. 1969. Macroscopic plant remains in recent lake sediments. Tuatara, 17, 13-19.
Odum, W.E. and R.T. Prentki, 1978. Analysis of five North American ecosytems IV. Allochthonous carbon inputs. Verh. Internat. Verein. Limnol., 20, 574-580.
Powers, H.A. and R.E. ~ilcox, 1964. Volcanic ash from Mount Mazama ( Crater Lake ) and from Glacier Peak. Science, 144, 1334-1336.
Reynolds, J.D. 1976. Occurrence of the fresh water Bryozoan, - ~ristatella mucedo Cuvier, in British Columbia. ~iesis,
365-366.
Ryvarden, L. 1971. Studies in seed dispersal I. rapping of diaspore~ in the alpine zone at Finse, Norway. Norw. J. Bot.. l 8 , 215-226.
Taylor, R.C. and B. MacBryde, 1977. Vascular Plants of British Columbia, a Descriptive Resource Inventory. university of British Columbia press, Vancouver, B.C.
Watts, W.A. 1978. Plant macrofossils and Quaternary paleoecology. pp 53-67 in Biolo and Quaternary Environments (eds. D. Walker and J.C. G u p p d t r a l i a n Academy of Science.
----------- 1979. Late Quaternary vegetation of Central Appalachia and the New Jersey coastal plain. Ecoloqical Monoqraphs, 49(4), 427-469.
----------- and T.C. Winter, 1966. Plant macrofossils from Kirchner marsh, Minnesota - a paleoecological study. Geol. Soc . ~merica Bull., - I 77 1339-1360.


