Forensic Testing of Post Tensioned Concrete … Testing of Post Tensioned Concrete Girders ......
113
CAIT-UTC-033 Forensic Testing of Post Tensioned Concrete Girders Final Report July 2014 Wing Hong (Louis) Lo Graduate Student Utah State University Logan UT 84332 Paul J. Barr Professor Utah State University Logan UT 84332 Marv W. Halling Professor Utah State University Logan UT 84332 External Project Manager Russ Scovil Utah Department of Transportation In cooperation with Rutgers, The State University of New Jersey And State of Utah Department of Transportation And U.S. Department of Transportation Federal Highway Administration
Transcript of Forensic Testing of Post Tensioned Concrete … Testing of Post Tensioned Concrete Girders ......
CAIT-UTC-033
Forensic Testing of Post Tensioned Concrete Girders
Final ReportJuly 2014
Wing Hong (Louis) LoGraduate Student
Utah State UniversityLogan UT 84332
Paul J. BarrProfessor
Utah State UniversityLogan UT 84332
Marv W. HallingProfessor
Utah State UniversityLogan UT 84332
External Project ManagerRuss Scovil
Utah Department of Transportation
In cooperation withRutgers, The State University of New Jersey
AndState of Utah
Department of TransportationAnd
U.S. Department of TransportationFederal Highway Administration

Disclaimer StatementThe contents of this report relfect the views of the authors, who are responsible for the facts and the
accuracy of the information presented herein. This document is disseminated under the sponsorship of theDepartment of Transportation, University Transportation Centers Program, in the interest of information
exchange. The U.S. Government assumes no liability for the contents or use thereof.
TECHNICAL REPORT STANDARD TITLE PAGE
1. Report No. 2. Government Accession No. 3. Recipient’s Catalog No.
CAIT-UTC-0334. Title and Subtitle 5. Report Date
July 2014Forensic Testing of Post Tensioned Concrete Girders 6. Performing Organization Code
CAIT/Utah State7. Author(s) 8. Performing Organization Report No.
Wing Hong (Louis) Lo, Paul J. Barr, Marv W. Halling CAIT-UTC-0339. Performing Organization, Name and Address 10. Work Unit No.
Center for Advanced Infrastructure and TransportationUtah State University4110 Old Main HillLogan, UT 84332
11. Contract or Grant No.
DTRT12-G-UTC1612. Sponsoring Agency Name and Address 13. Type of Report and Period Covered
Center for Advanced Infrastructure and Transportation Final ReportRutgers, The State University of New Jersey 7/1/13 - 7/6/2014100 Brett Road 14. Sponsoring Agency Code
Piscataway, NJ 0885415. Supplementary Notes
U.S Department of Transportation/Research and Innovative Technology Administration1200 New Jersey Avenue, SEWashington, DC 20590-000116. Abstract
Recently, two separate Interstate 15 highway bridges over the 400 South roadway in Orem, Utah were demolishedafter 50 years of service. A total of four post-tensioned girders were salvaged from both the north-bound andsouth-bound bridge. A series of tests was performed with these girders in the System Material And StructuralHealth Laboratory (SMASH Lab). The girders were tested with different loading criteria to determine thestrength and material properties of the girder. The experimental results were compared with the AmericanAssociation of State Highway and Transportation Officials Load Resistance Factored Design (AASHTO LRFD)Bridge Design Specifications and a finite-element model using ANSYS. The AASHTO LRFD Specification wasfairly conservative on predicting capacity and capable of predicting the type of failure that occurred. The ANSYSmodel was developed and calibrated to model the girder behavior. The concrete properties in the model weresignificantly adjusted in order to be comparable to the experimental results. Further exploration in ANSYS needsto be done to precisely model the actual behavior of the girder.
17. Key Words 18 Distributional Statement
Accelerated Bridge Construction, Precast, Deck, Panels,Losses19. Security Classification 20. Security Classification (of this page) 21. No. of Pages 22. Price
Unclassified Unclassified 113
Form DOT F 1700.7 (8-09)
Contents Chapter 1 INTRODUCTION ........................................................................................................................ 1
Chapter 2 LITERATURE REVIEW ............................................................................................................. 2
Comparison of Prestress Losses for a Prestress Concrete Bridge Made with High-Performance
Concrete (Barr et al., 2008) ....................................................................................................................... 2
Dynamic Characteristic of Post-tensioned Girder with web openings (Grace et al., 1996)...................... 3
Parametric Study of Posttensioned Inverted-T Bridge System for Improved Durability and Increased
Span-to-Depth Ratio ( Nayal et al., 2010) ................................................................................................ 6
Testing of Two 50-Year-Old Precast Post-Tensioned Concrete Bridge Girders (Eder et al., 2005) ........ 8
Structural Evaluation of a 34-Year-Old Precast Post-Tensioned Concrete Girder (Habib Tabatabai,
Timoth J. Dickson, 1993) .......................................................................................................................... 9
Evaluation of Effective Prestress Force in 28-Year-Old Prestressed Concrete Bridge Beams (Pessiki et
al., 1996) ................................................................................................................................................. 11
Chapter 3 BRIDGE DESCRIPTION .......................................................................................................... 13
Girder Description .................................................................................................................................. 14
Girder Reinforcements ............................................................................................................................ 16
Chapter 4 EXPERIMENTATION .............................................................................................................. 19
Moment Cracking Test ........................................................................................................................... 22
Capacity Testing ..................................................................................................................................... 26
Flexural Capacity Test ........................................................................................................................ 27
1-d Test................................................................................................................................................ 32
2-d & 4-d Test ..................................................................................................................................... 37
Summary of the experimental results ...................................................................................................... 45
Chapter 5 COMPARISON OF TESTED RESULTS TO AASHTO LRFD DESIGN AND ANSYS ........ 48
Prestressing losses ................................................................................................................................... 48
Moment Capacity .................................................................................................................................... 59
Shear Capacity ........................................................................................................................................ 63
Finite Element Modeling ........................................................................................................................ 72

CONCLUSION ........................................................................................................................................... 90
REFERENCE .............................................................................................................................................. 92
APPENDIX A. Cracking Moment Test Data ........................................................................................... 93
APPENDIX B. Bridge Plans .................................................................................................................... 95
APPENDIX C. ANSYS Model Code ..................................................................................................... 101
List of Figures
Figure 1 Elevation view of the bridge ......................................................................................................... 13
Figure 2 Cross section of the bridge ........................................................................................................... 14
Figure 3 Side view of the girder.................................................................................................................. 15
Figure 4 Cross section at the midspan (Section A-A) ................................................................................. 15
Figure 5 Cross section at the end span (Section B-B) ................................................................................. 16
Figure 6 Configuration of the post-tensioned steel rods ............................................................................. 18
Figure 7 Mild reinforcing of the girders ..................................................................................................... 18
Figure 8 Set up with the reaction frame and two girders ............................................................................ 19
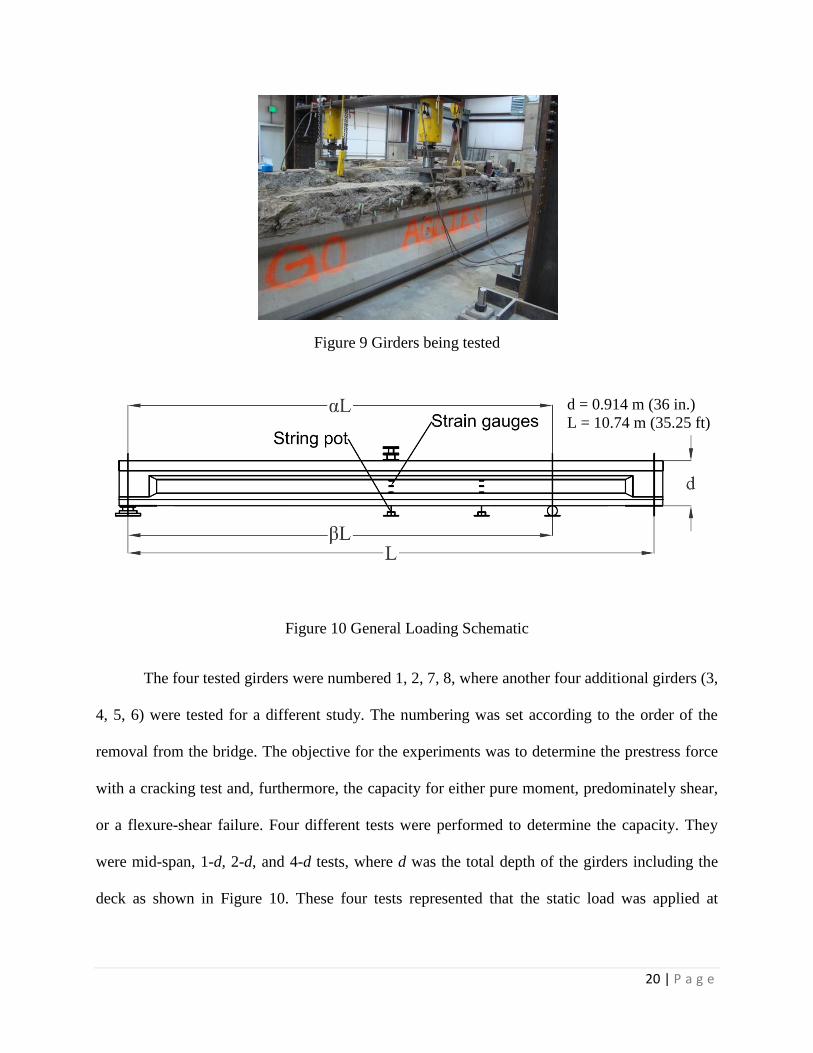
Figure 9 Girders being tested ...................................................................................................................... 20
Figure 10 General Loading Schematic ........................................................................................................ 20
Figure 11 Positions of Strain Gauges .......................................................................................................... 22
Figure 12 Strain gauge attached across the crack on bottom of girder ....................................................... 23
Figure 13 Girder 7 cracking moment test data ............................................................................................ 24
Figure 14 Cracking during midspan flexural test ........................................................................................ 28
Figure 15 Ultimate failure for midspan flexural test ................................................................................... 29
Figure 16 Moment vs. Deflection for midspan flexural test ....................................................................... 29
Figure 17 Shear vs. Deflection for midspan flexural test ............................................................................ 30
Figure 18 Longitudinal strain distribution at the midspan .......................................................................... 31
Figure 19 Longitudinal strain distribution at the third span ........................................................................ 31
Figure 20 Set up for 1-d tests ...................................................................................................................... 32
Figure 21 Shear vs. Deflection plot for G2-1d(a) ....................................................................................... 33
Figure 22 Shear vs. Deflection plot for G2-1d(b) ....................................................................................... 34
Figure 23 Moment vs. Deflection plot for G2-1d(a) ................................................................................... 35
Figure 24 Moment vs. Deflection plot for G2-1d(b)................................................................................... 36
Figure 25 Cracks under the loading location prior to ultimate failure ........................................................ 36
Figure 26 Diagonal cracks near the support ................................................................................................ 37
Figure 27 Compressive failure for G2-1d(a) ............................................................................................... 37
Figure 28 Cracks and crushes prior to failure ............................................................................................. 38
Figure 29 Shear failure in G1-2d(a) ............................................................................................................ 39
Figure 30 Moment vs. Deflection plot for G1-2d(a) ................................................................................... 40
Figure 31 Moment vs. Deflection plot for G7-2d(b)................................................................................... 40
Figure 32 Shear vs. Deflection plot for G1-2d(a) ....................................................................................... 41
Figure 33 Shear vs. Deflection plot for G7-2d(b) ....................................................................................... 41
Figure 34 Compressive failure in G7-4d(a) ................................................................................................ 42
Figure 35 Moment vs. Deflection plot for G7-4d(a) ................................................................................... 43
Figure 36 Moment vs. Deflection plot for G1-4d(b)................................................................................... 43
Figure 37 Shear vs. Deflection plot for G7-4d(a) ....................................................................................... 44
Figure 38 Shear vs. Deflection plot for G1-4d(b) ....................................................................................... 44
Figure 39 Overall shear results vs. distance, αL ......................................................................................... 47
Figure 40 Overall moment results vs. distance, αL..................................................................................... 47
Figure 41 Strut-and-tie model of the girder ................................................................................................ 69
Figure 42 Defined stress-strain curve in ANSYS for the post-tensioned steel ........................................... 74
Figure 43 Geometric Shape for SOLID65 .................................................................................................. 75
Figure 44 Geometric Shape for LINK8 ...................................................................................................... 76
Figure 45 Geometric Shape for CONTA173&TARGE170 ........................................................................ 77
Figure 46 Reinforcing smearing in the deck ............................................................................................... 78
Figure 47 Initial deformation due to prestressing ....................................................................................... 79
Figure 48 Elevation view of the 1-d test FEM ............................................................................................ 79
Figure 49 Comparison of the crack propagation near loading location for 1-d test (left: G3-1d(a), right:
FEM) ........................................................................................................................................................... 80
Figure 50 Overview of cracks from the 1-d test FEM ................................................................................ 80
Figure 51 Shear vs. deflection curve comparison for 1-d test ..................................................................... 81
Figure 52 Elevation view of the 2-d test FEM ............................................................................................ 82
Figure 53 Elevation view of the 4-d test FEM ............................................................................................ 83
Figure 54 Comparison of the crack propagation near loading location for 2-d test (left: G1-2d(a), right:
FEM) ........................................................................................................................................................... 83
Figure 55 Comparison of the crack propagation near loading location for 4-d test (left: G7-4d(a), right:
FEM) ........................................................................................................................................................... 83
Figure 56 Overview of cracks from the 2-d test FEM ................................................................................ 84
Figure 57 Overview of cracks from the 4-d test FEM ................................................................................ 84
Figure 58 Shear vs. deflection curves comparison for 2-d test ................................................................... 85
Figure 59 Shear vs. deflection curves comparison for 4-d test ................................................................... 85
Figure 60 Elevation view of the midspan test FEM .................................................................................... 86
Figure 61 Comparison of the crack failure near loading location for midspan test (left: G8-midspan, right:
FEM) ........................................................................................................................................................... 87
Figure 62 Overview of cracks from the midspan test FEM ........................................................................ 87
Figure 63 Moment vs. deflection curves comparison for midspan test ...................................................... 88
List of Tables
Table 1 Dimensions for each test ................................................................................................................ 21
Table 2 Prestresssing values for each girder ............................................................................................... 26
Table 3 Overall results for all tests ............................................................................................................. 45
Table 4 Prestress losses using Simplified Method ...................................................................................... 52
Table 5 Time-dependent losses from Refined Method ............................................................................... 58
Table 6 Prestress losses using Refined Method .......................................................................................... 58
Table 7 Comparison on Effective prestress with different methods ........................................................... 59
Table 8 k value for different types of tendon .............................................................................................. 62
Table 9 Comparison of the theoretical moment capacity to measured value for each test ......................... 62
Table 10 Components in shear capacity for each shear test ........................................................................ 67
Table 11 Comparison of theoretical shear capacities to measured for each shear test ............................... 68
Table 12 Corresponding Material Numbers ................................................................................................ 73
Table 13 Comparison of the capacity between the experimental and FEM results .................................... 89
1 | P a g e
Chapter 1
INTRODUCTION
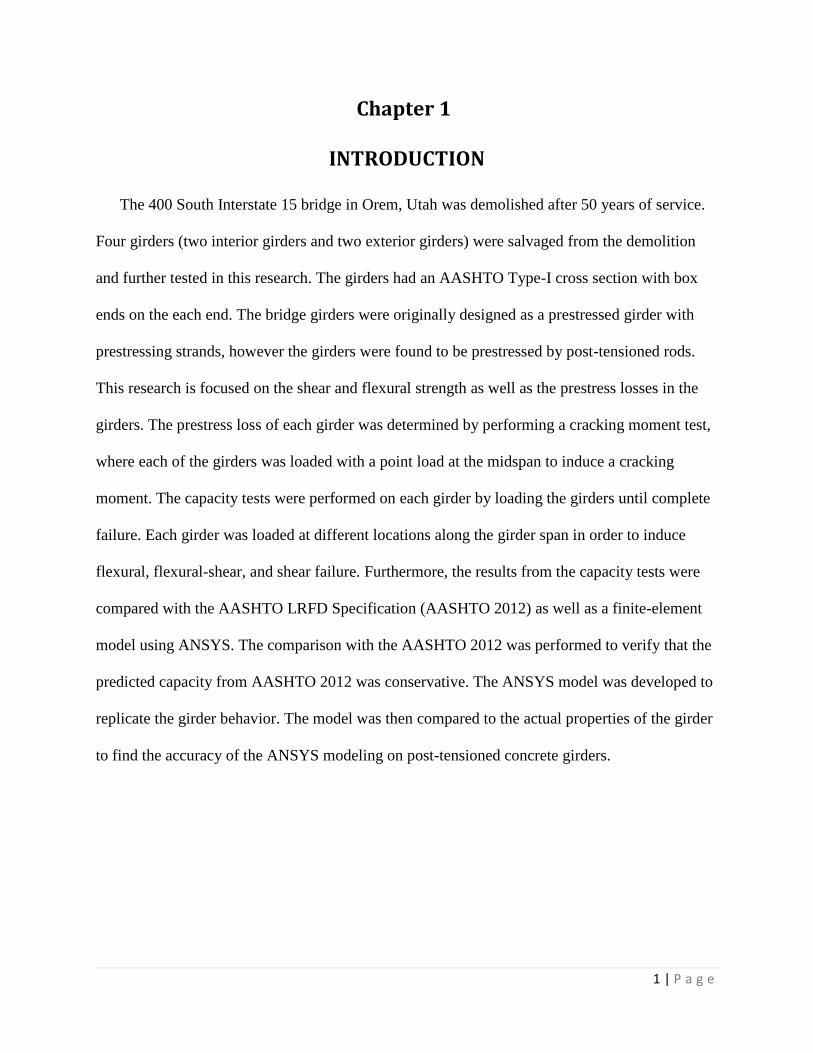
The 400 South Interstate 15 bridge in Orem, Utah was demolished after 50 years of service.
Four girders (two interior girders and two exterior girders) were salvaged from the demolition
and further tested in this research. The girders had an AASHTO Type-I cross section with box
ends on the each end. The bridge girders were originally designed as a prestressed girder with
prestressing strands, however the girders were found to be prestressed by post-tensioned rods.
This research is focused on the shear and flexural strength as well as the prestress losses in the
girders. The prestress loss of each girder was determined by performing a cracking moment test,
where each of the girders was loaded with a point load at the midspan to induce a cracking
moment. The capacity tests were performed on each girder by loading the girders until complete
failure. Each girder was loaded at different locations along the girder span in order to induce
flexural, flexural-shear, and shear failure. Furthermore, the results from the capacity tests were
compared with the AASHTO LRFD Specification (AASHTO 2012) as well as a finite-element
model using ANSYS. The comparison with the AASHTO 2012 was performed to verify that the
predicted capacity from AASHTO 2012 was conservative. The ANSYS model was developed to
replicate the girder behavior. The model was then compared to the actual properties of the girder
to find the accuracy of the ANSYS modeling on post-tensioned concrete girders.
2 | P a g e
Chapter 2
LITERATURE REVIEW
Comparison of Prestress Losses for a Prestress Concrete Bridge Made with
High-Performance Concrete (Barr et al., 2008)
This research was focused on comparing the experimentally determined prestress losses
of high-performance concrete to the predicted losses calculated using the AASHTO LRFD and a
HPC method that was based on the findings from NCHRP 18-06. The data was obtained by
monitoring a bridge on the SR18/SR516 in the state of Washington for 3 years from the time of
casting. This bridge was a precast, prestressed three-span bridge with two span length of 23.3 m
(76.4 ft) long of the first and third spans and 40.6 m (133 ft) long for the second span. The width
of the bridge was 11.6 m (38 ft) which carries two lanes of traffic. There were five prestressed
concrete girders fabricated with high-performance concrete tested in this research. These five
girders were from the first and the third girders from Span 1, and the first three girders from
Span 2. Each girder was constructed with the Washington W74MG girder cross-section that had
a depth of 1867 mm (73.5 in.). Each girder was monitored using four vibrating-wire strain gages
with integral thermistors at two 1.52 m (5 ft) from the girder end nearest Pier 2 and at midspan.
At each instrumentation location, gages were placed at the bottom of each girder and in the web
to monitor the concrete temperature and longitudinal strains.
The test results showed that average measured prestress losses for the Span 2 girders
were 385 MPa (55.8 ksi) corresponding to 27.5% of the jacking stress. For the Span 1
instrumented girders the average measured losses were 227 MPa (32.9 ksi) corresponding to
16.2% of the jacking stress. The major sources of these losses were from elastic shortening,
3 | P a g e
creep, and shrinkage, while the relaxation of the steel was neglected due to its minimal effect. A
comparison was performed of the measured and predicted prestress loss after nearly 3 years
using the AASHTO LRFD and NCHRP 18-07 method. The AASHTO LRFD prestress loss was
20.0% higher than average measured prestress loss for the Span 2 girder. In contrast, the
predicted prestress losses using the NCHRP 18-07 method was 16% smaller. For the Span 1
girders, the AASHTO LRFD calculated loss was within 2% of the measured loss, while
calculated loss from the NCHRP 18-07 method was about 22% smaller than the measured value.
This research focused on four major sources of prestress losses, which were elastic
shortening, creep and shrinkage, and differential shrinkage. The result showed that the AASHTO
LRFD method predicted smaller loss magnitude in comparison to the measured values in terms
of the elastic shortening losses for both Span 1 and Span 2 girders. However, the calculated
prestress loss values from the NCHRP method were relatively closer to the measured losses.
Regarding the creep and shrinkage losses, the AASHTO LRFD method overestimated the losses
for the Span 2 girder but not for the Span 1 girder. On the other hand, the NCHRP method
underestimated the losses for both Span 1 and Span 2 girders. For the differential shrinkage
losses, the NCHRP procedure predicted a fairly close magnitude of the average measured losses
for both the Span 1 and Span 2 girders. The AASHTO LRFD method does not explicitly include
differential shrinkage into the prestress loss calculations.
Dynamic Characteristic of Post-tensioned Girder with web openings (Grace et
al., 1996)
This study focused on investigating the dynamic characteristics of post-tensioned
concrete girders with web openings. The investigation was performed with experimental and
4 | P a g e
analytical specimens subjected to a repeated cyclic loading. There were nine girders constructed
and tested with span lengths of 5.0 m (16 ft 5 in.). The girders were cast in groups of three based
on their cross-sectional shapes, which were rectangular, T, and I shape. The size of the
rectangular girders was 76 mm (3 in.) wide by 203 mm (8 in.) deep. For the T shape, the flange
width was 178 mm (7 in.) with a depth of 51 mm (2 in.) and the web had the same size as the
rectangular girders. The I-shape girders also had a 178 by 51 mm (7 by 2 in.) flange and a 76 mm
(3 in.) wide by 152 mm (6 in.) deep web. Each of the three groups contained three girders
constructed with none, one, and two web openings located vertically at the neutral axis of the
cross-section and longitudinally at midspan. The openings had a depth of 7.64 cm (3 in.) and
width of 40.75 cm (16 in.). The web of each girder was reinforced with two #3 rebars at the top
and bottom, and one straight post-tensioned 7-wire strand at one-quarter of the cross-section
from the top, plus two post-tensioned 7-wire strands in parabolic shape. The nominal diameter of
the strands was 7.94 mm (5/16 in.). The parabolic strands were 25 mm (1 in.) below the neutral
axis at the end points. Moreover, for T and I shape girder, there were two extra #3 rebars placed
at the flange. Shear reinforcement was placed with a spacing of 15.28 cm (6 in.) through the
entire span of each girder but the spacing was reduced to 2.54 cm (1 in.) at the ends and in the
regions to each side of the opening.
There were five different tests used to experimentally investigate the girder behavior.
They were impact load test, log-decrement test, fatigue load test, static load test, and ultimate
load test. The impact load test was used to determine the natural frequencies for each girder
through the frequency spectrum response. Subsequently the log-decrement test was used to
quantify the damping characteristics. Finally, stiffness, strains, and prestress forces were
measured and recorded during the fatigue load test, static load test, and ultimate load test.
5 | P a g e
Regarding the natural frequencies of each girder, an additional analytical study was utilized to
determine the theoretical natural frequencies and the corresponding mode shapes of vibration of
the girders. The GTSTRUDL finite element analysis computer program was used to complete the
theoretical analysis.
Regarding the natural frequency, the result from both the experimental and theoretical
analysis showed that the natural frequency of mode shape 1 had a minimal effect for each girder.
However, the placement of web openings significantly affected the natural frequency of mode
shape 2. The largest decrease was 16.5% for the I-shape girder with two web openings. The
damping ratios were also determined before and after fatigue loading in order to quantify the
effect on the damping characteristics for each girder due to fatigue loading. However, there was
negligible effect on the damping characteristics of the girders. The cracking patterns were
recorded. The cracks were preliminarily concentrated within the midspan region near the web
openings due to shear stress and at the bottom of the girder due to flexural stress. Finally, for the
ultimate load test, the changes of prestress force and deflection responses were monitored during
loading. The results showed that the prestress force remained nearly constant for the top post-
tensioned strand until the load was approximately 26.7 kN (6 kips), then the prestress force
suddenly increased at the ultimate load, which was 31.15 kN (7 kips). However, the prestress
forces of the bottom two parabolic strands exponentially increased until 26.7 kN (6 kips).
Likewise, these two strands had large increases between 26.7 and 31.15 kN (6 and 7 kips).
Additionally, the deflection responses were approximately linear until 10 kN (2.25 kips). Based
on the results of the ultimate load test, the placement of web openings did not significantly affect
the overall capacity and deflection response for T and I shape girders but it reduced the ductility
6 | P a g e
of the girders. For rectangular girders, the load carrying capacity was reduced depending on the
placement of web openings.
Parametric Study of Posttensioned Inverted-T Bridge System for Improved
Durability and Increased Span-to-Depth Ratio (Nayal et al., 2010)
This study was conducted to investigate the major parameters that limit the performance
of a post-tensioned Invert-T (PT-IT) bridge system in order to improve the durability and span-
to-depth ratio of PT-IT girders. In this research, five major parameters influenced the
performance of the PT-IT bridge system, which were section properties, construction scenario,
concrete strength, creep and shrinkage model, and timing.
Regarding the section properties, there were six standard IT-shape cross sections
including IT 500, IT 600, IT 700, IT 800, IT 900, and IT 1000. Three concrete compressive
strengths were utilized for both the girders and deck, which were 41.37, 55.16, and 68.95 MPa (6,
8, and 10 ksi) for girders and 20.68, 24.13, and 27.58 MPa (3, 3.5, and 4 ksi) for the deck. In
order to analyze the creep-and-shrinkage effect, five standard models including AASTO LRFD,
American Concrete Institute (ACI) 2009, Comite Euro-International du Beton-Federation
International de la Precontrainte (CEB-FIP) 90, National Highway Research Program (NCHRP)
496, and self-consolidating concrete (SCC) were compared. There were four construction
scenarios considered for this study in terms of the order of casting and times of post-tensioning.
The first scenario was casting the deck and diaphragm concrete at the same time to provide
continuity, and then applied post-tensioning to the entire system after the concrete hardened. The
second scenario was casting the diaphragm concrete first to provide continuity, then applying the
post-tensioning to the IT-section only when the concrete hardened, and cast the deck last. The
7 | P a g e
third construction scenario was casting the deck after the diaphragm was cast and hardened, and
then applying post-tensioning to the entire system. The last scenario contained two stages of
post-tensioning. In this scenario, the diaphragm was cast first, then after it hardened, post-
tensioning was applied to balance stresses due to the weight of the deck. As soon as the deck was
cast and hardened, the second stage of post-tensioning was applied to balance stresses due to the
weight of barriers and live load. Lastly, the timing factor for this parametric study was defined
by three categories. These three categories were the age of girder when cutting prestressing
strands, the time from casting of the deck to applying the post-tensioning, and the time from
cutting the prestressing strands to casting the deck.
In conclusion, the construction scenario was determined to be the third option as the best
option because of its cost effectiveness, highest span-to-depth ratio, and crack-free deck criteria.
Also, the result showed that the increase of the concrete strength of the girder significantly
increased the maximum possible span length of the girder. Regarding the creep-and-shrinkage
models investigated, there was no significant effect on the estimation of prestress losses in
pretensioning strands and post-tensioning tendon but the time-dependent restraining moments
were noticeably affected. In the consideration of the effect of timing, the diaphragm concrete was
recommended to be cast between two and four months after the girder’s casting while the
concern for the timing of casting deck concrete was redundant. The recommendation also
showed that the post-tensioning force needed to be applied shortly after casting the deck.
8 | P a g e
Testing of Two 50-Year-Old Precast Post-Tensioned Concrete Bridge Girders
(Eder et al., 2005)
Two 50-year-old, I-shape, post-tensioned concrete bridge girders were salvaged from a
bridge in Hamilton County, Ohio. The girders were tested in order to determine their ultimate
strength for reference to similar girders in service. The two I-shape girders were constructed as a
13.7 m (45 ft) long precast concrete girders with four 29 mm (1-1/8 in.) diameter post-tensioned
steel bars. These two girders had a depth of 1016 mm (40 in.) with a 152 mm (6 in.) wide web
and 406 mm (16 in.) wide flanges. Two bars were placed at the center of the web and bent at
1.37 m (4.5 ft) apart from the midspan to create a harped profile. Another two straight bars were
located at the bottom flange. No. 4 shear reinforcement was utilized at the spacing of 230 mm (9
in.) along the entire length of the girder. A 197-mm (7.75-in.) thick concrete deck was cast prior
to testing in order to perform a more realistic in-situ experiment. The concrete compressive and
tensile strength of the girders were measured using four compression tests and two split cylinder
tests. The average measured compressive strength was 68 MPa (9.8 ksi) and the average
measured tensile strength was 6.3 MPa (800 psi). The yield strength of the post-tensioned steel
bars was 700 MPa (100 ksi), whereas the tensile strength and elastic modulus were also
measured to be 1000 MPa (144 ksi) and 175 GPa (25,300 ksi), respectively.
During the test, cracking visibly initiated at approximately 400 kN (90 kips) of applied
load at midspan. Additionally, the cracking moment due to the applied load and a total cracking
moment due to both dead load and the applied load were calculated, which were 976 and 1123
kN-m (720 and 828 kip-ft), respectively. The actually moment capacity was also determined by
using the measured concrete and steel strength. The analytical capacity was calculated as 2130
9 | P a g e
kN-m (1570 kip-ft). According to the experimental results, the maximum applied loads were 693
and 670 kN (156 and 151 kips) at midspan for Girder 1 and Girder 2. These loads correspond to
maximum moments at midspan of 1690 and 1640 kN-m (1248 and 1208 kip-ft), and the total
maximum moment due to both dead load and maximum applied load were 1839 and 1784 kN-m
(1356 and 1316 kips-ft). Regarding the post-tensioning forces in the steel bars, the post-
tensioning force per bar was calculated to be 223 kN (50 kips) corresponding to a stress of 414
MPa (50 ksi). The post-tensioning losses could not be determined in this study because of the
unavailability of information. However, an estimated post-tensioning loss of 37 precent was
reasonably assumed given that the yield strength of the bar was 700 MPa (100 ksi).
Structural Evaluation of a 34-Year-Old Precast Post-Tensioned Concrete
Girder (Habib Tabatabai, Timoth J. Dickson, 1993)
A load test of a bridge girder built in 1958 was performed for the study at Skokie,
Illinois. The bridge girder was removed from the I-94 bridge over US 81 in Fargo, North Dakota.
The purpose of the test was to compare the cracking moment and flexural capacity of the girder
with the predicted values. The moment-curvature and load-deflection relationships were also
compared between measured result and analytical predicted result.
The tested girder had a length of 13.2 m (43 ft 4 in.) with an AASHTO Type-II cross-
section. It contained three post-tensioning tendons arranging in two layers at the bottom. The top
tendon included 16 wires that were 6 mm (0.25 in.) in diameter and 12 that were 6 mm (0.25 in.)
in diameter for the bottom two tendons. The distance between the centroid of tendons and the
10 | P a g e
centroid of the cross section was 97 mm (3.83 in.) at the girder ends and 275 mm (10.83 in.) at
the midspan.
The load test was designed with two symmetric point loads applied near both ends so that
a constant moment region was produced within the midspan region. Also, there were a total of
nine strain gauges in groups of three that were attached on the tested girder. Those three sets
were all longitudinally located at the midspan region and they were vertically located at the top
of the girder, the compressive zone of the girder, and the bottom of the girder, respectively along
the depth of the girder. The test included a cracking load and an ultimate load test. Both tests
were used to determine the cracking moment, decompression load, and the moment strength.
Furthermore, material property tests were performed. Three cores of concrete were extracted
from the girder after the failure test and used to determine the compressive strength and the
modulus of elasticity of the concrete. Also, four pieces of the post-tensioned wires were tested to
determine the modulus of elasticity and the ultimate strength.
Regarding the material properties, the result showed that the average compressive
strength was measured to be 74.5 MPa (10,800 psi) and the average concrete modulus of
elasticity was 37,600 MPa (5450 ksi). The average ultimate tensile strength of the post-
tensioning wire was 1766 MPa (256 ksi) while the average modulus of elasticity was
approximately 193,000 MPa (28,000 ksi). The effective prestress in the tendons was measured to
be 945 MPa (137 ksi) and the total prestress loss was 17.5%. Regarding the ultimate capacity
results, the total moment (applied and self-weight moment) was 934 kN-m (689 kip-ft) where the
crack visibly occurred at the midspan. The maximum total moment was 1481 kN-m (1092 kip-
ft). At this load, the girder failed in compression at the top flange near the midspan.
11 | P a g e
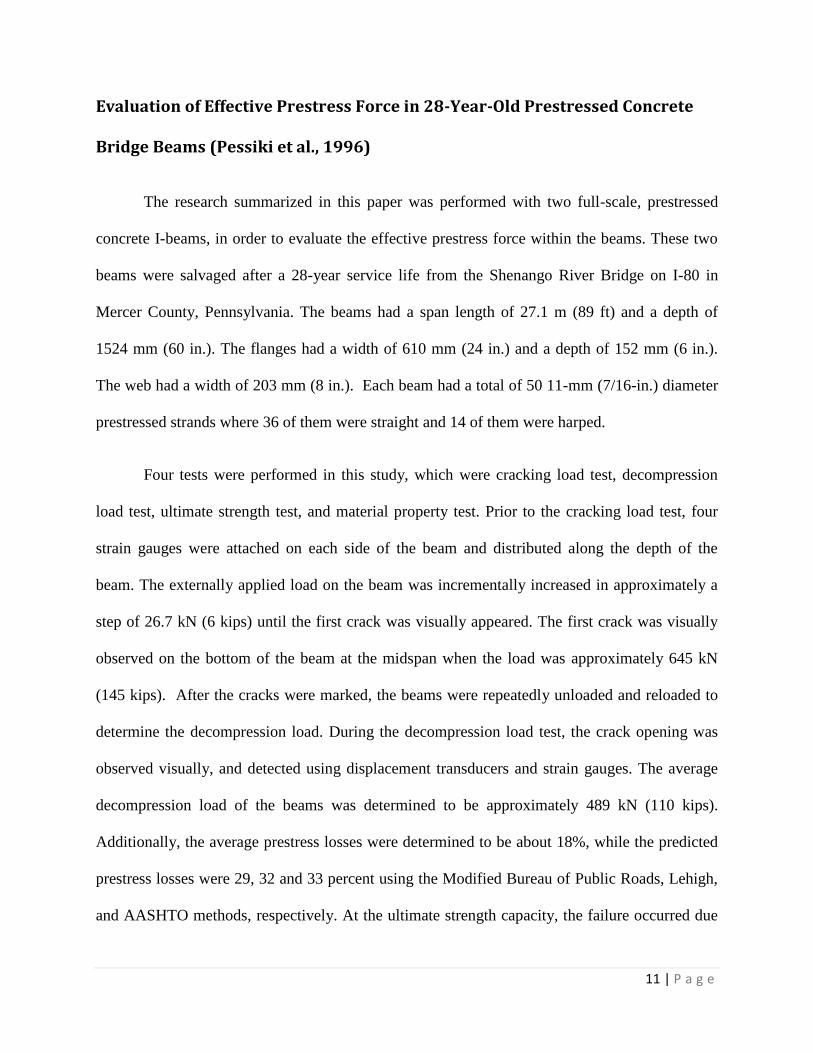
Evaluation of Effective Prestress Force in 28-Year-Old Prestressed Concrete
Bridge Beams (Pessiki et al., 1996)
The research summarized in this paper was performed with two full-scale, prestressed
concrete I-beams, in order to evaluate the effective prestress force within the beams. These two
beams were salvaged after a 28-year service life from the Shenango River Bridge on I-80 in
Mercer County, Pennsylvania. The beams had a span length of 27.1 m (89 ft) and a depth of
1524 mm (60 in.). The flanges had a width of 610 mm (24 in.) and a depth of 152 mm (6 in.).
The web had a width of 203 mm (8 in.). Each beam had a total of 50 11-mm (7/16-in.) diameter
prestressed strands where 36 of them were straight and 14 of them were harped.
Four tests were performed in this study, which were cracking load test, decompression
load test, ultimate strength test, and material property test. Prior to the cracking load test, four
strain gauges were attached on each side of the beam and distributed along the depth of the
beam. The externally applied load on the beam was incrementally increased in approximately a
step of 26.7 kN (6 kips) until the first crack was visually appeared. The first crack was visually
observed on the bottom of the beam at the midspan when the load was approximately 645 kN
(145 kips). After the cracks were marked, the beams were repeatedly unloaded and reloaded to
determine the decompression load. During the decompression load test, the crack opening was
observed visually, and detected using displacement transducers and strain gauges. The average
decompression load of the beams was determined to be approximately 489 kN (110 kips).
Additionally, the average prestress losses were determined to be about 18%, while the predicted
prestress losses were 29, 32 and 33 percent using the Modified Bureau of Public Roads, Lehigh,
and AASHTO methods, respectively. At the ultimate strength capacity, the failure occurred due
12 | P a g e
to crushing of concrete at the compression zone for both beam under the average ultimate load of
1121 kN (252 kips). The average midspan deflection was recorded to be 240 mm (9.45 in.).
Lastly, the results from the material property tests showed that the average compressive strength
of the concrete was 58.2 MPa (8440 psi), which was 65% greater than the original design
strength. The average compressive modulus of elasticity was also determined as 34.1 GPa (4945
ksi).
13 | P a g e
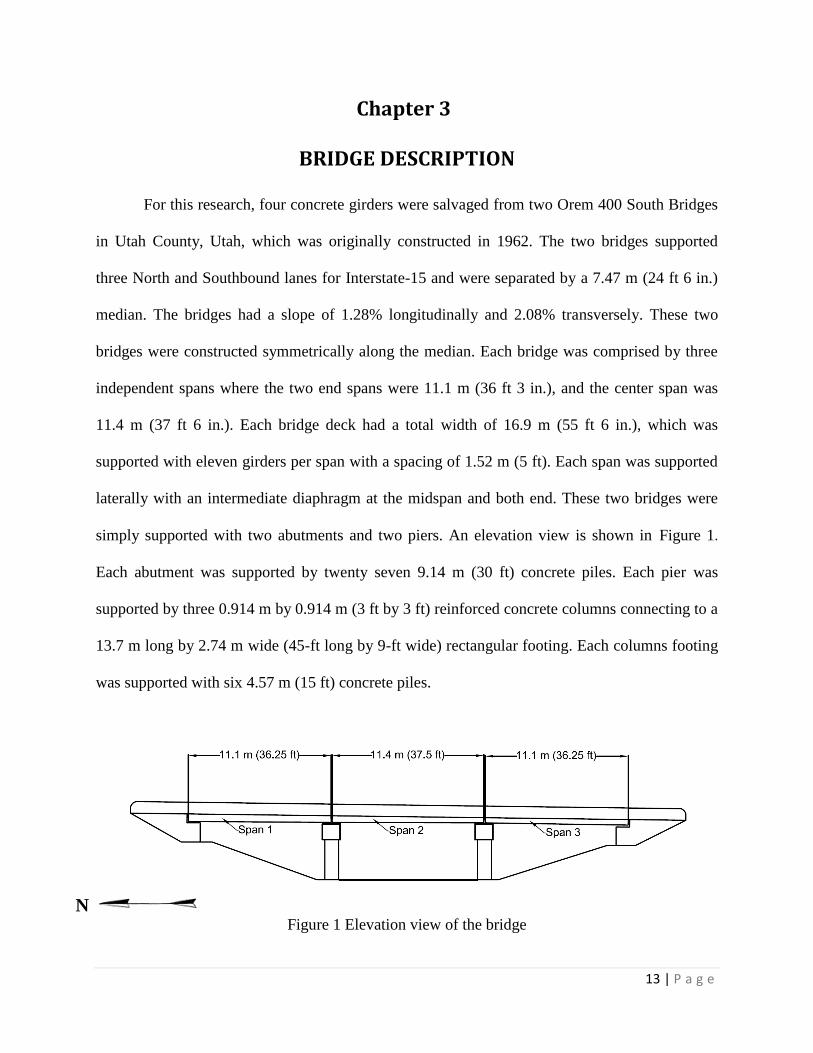
Chapter 3
BRIDGE DESCRIPTION
For this research, four concrete girders were salvaged from two Orem 400 South Bridges
in Utah County, Utah, which was originally constructed in 1962. The two bridges supported
three North and Southbound lanes for Interstate-15 and were separated by a 7.47 m (24 ft 6 in.)
median. The bridges had a slope of 1.28% longitudinally and 2.08% transversely. These two
bridges were constructed symmetrically along the median. Each bridge was comprised by three
independent spans where the two end spans were 11.1 m (36 ft 3 in.), and the center span was
11.4 m (37 ft 6 in.). Each bridge deck had a total width of 16.9 m (55 ft 6 in.), which was
supported with eleven girders per span with a spacing of 1.52 m (5 ft). Each span was supported
laterally with an intermediate diaphragm at the midspan and both end. These two bridges were
simply supported with two abutments and two piers. An elevation view is shown in Figure 1.
Each abutment was supported by twenty seven 9.14 m (30 ft) concrete piles. Each pier was
supported by three 0.914 m by 0.914 m (3 ft by 3 ft) reinforced concrete columns connecting to a
13.7 m long by 2.74 m wide (45-ft long by 9-ft wide) rectangular footing. Each columns footing
was supported with six 4.57 m (15 ft) concrete piles.
Figure 1 Elevation view of the bridge
N
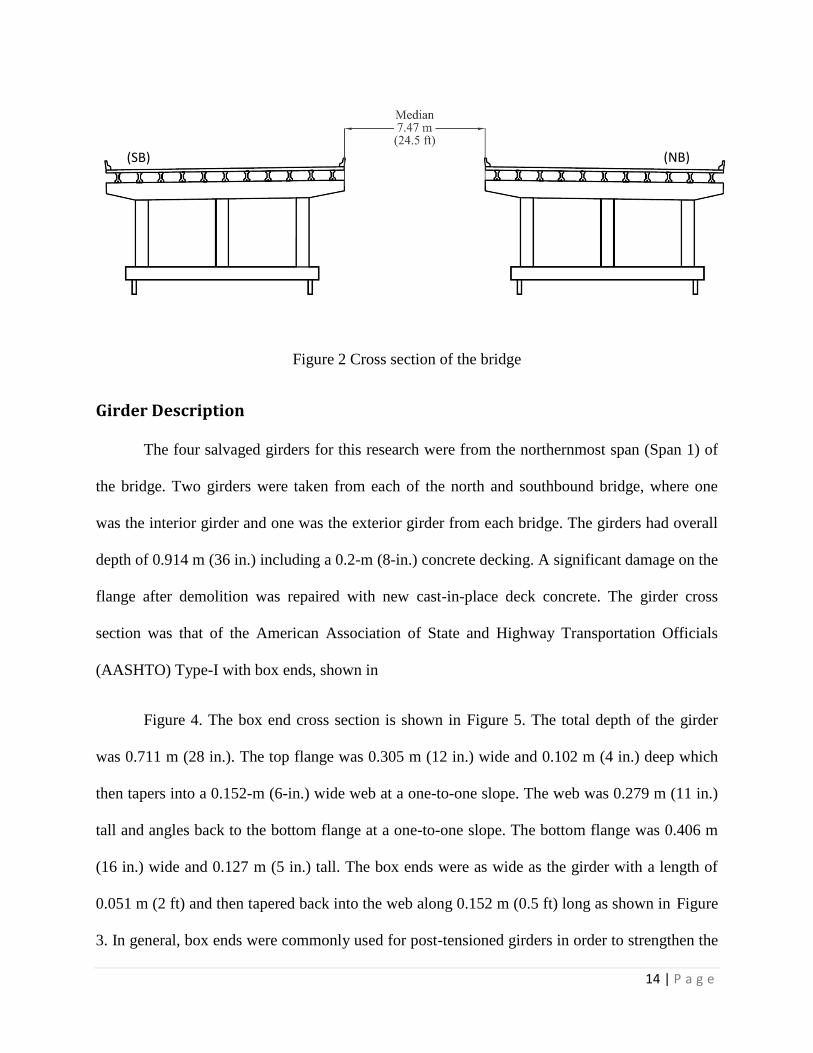
14 | P a g e
Figure 2 Cross section of the bridge
Girder Description
The four salvaged girders for this research were from the northernmost span (Span 1) of
the bridge. Two girders were taken from each of the north and southbound bridge, where one
was the interior girder and one was the exterior girder from each bridge. The girders had overall
depth of 0.914 m (36 in.) including a 0.2-m (8-in.) concrete decking. A significant damage on the
flange after demolition was repaired with new cast-in-place deck concrete. The girder cross
section was that of the American Association of State and Highway Transportation Officials
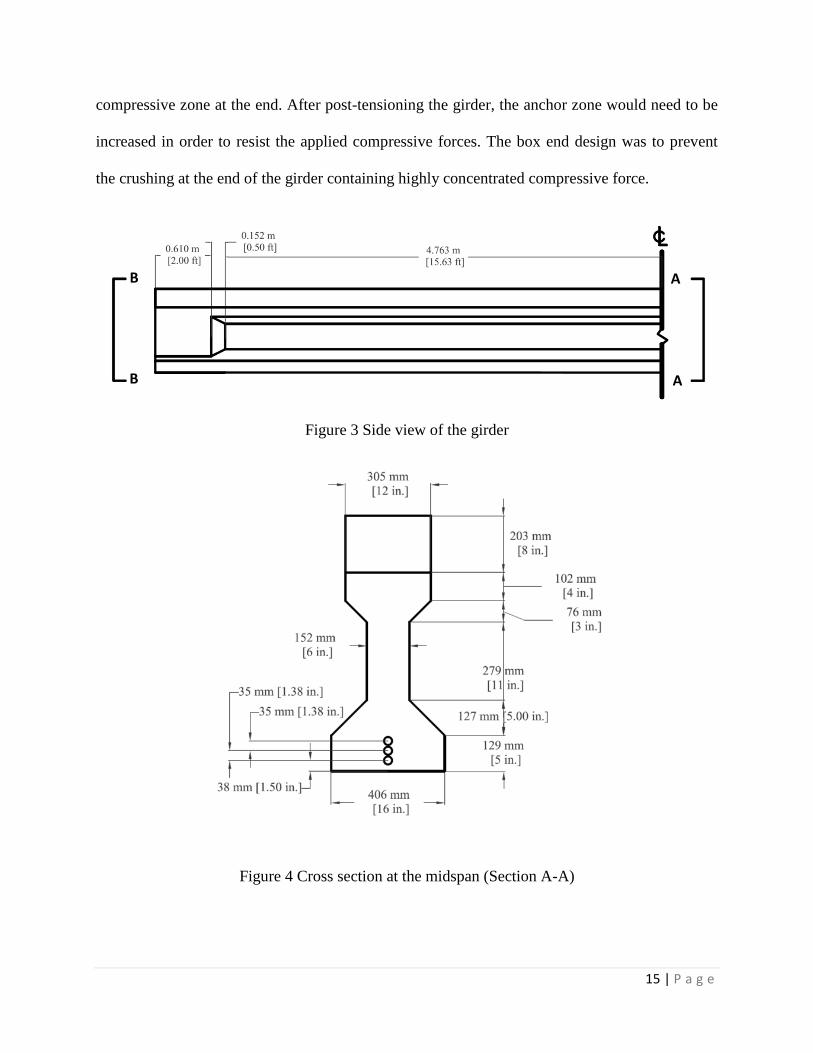
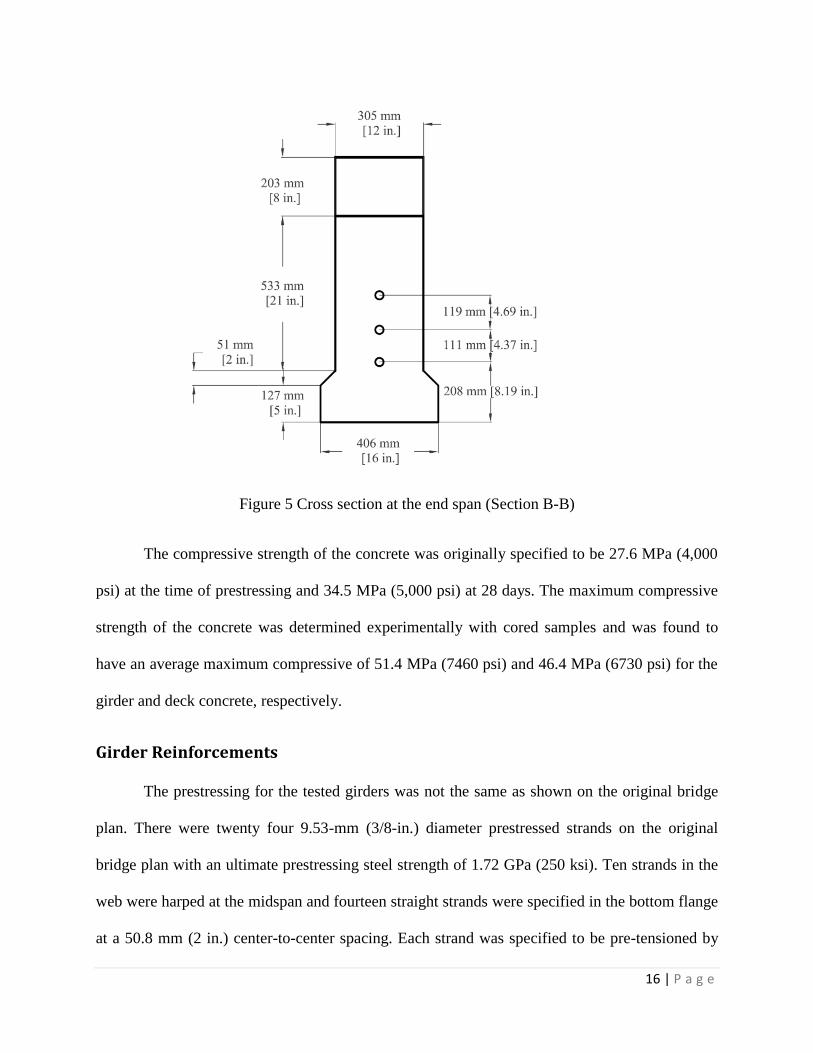
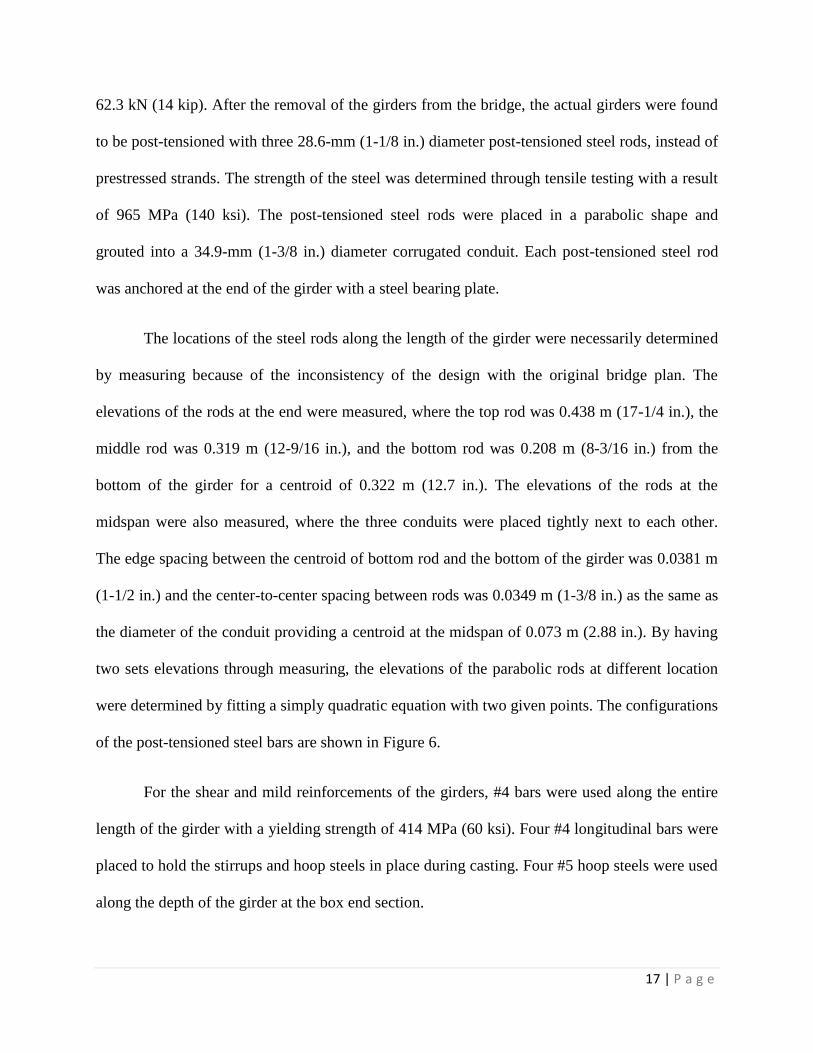
(AASHTO) Type-I with box ends, shown in
Figure 4. The box end cross section is shown in Figure 5. The total depth of the girder
was 0.711 m (28 in.). The top flange was 0.305 m (12 in.) wide and 0.102 m (4 in.) deep which
then tapers into a 0.152-m (6-in.) wide web at a one-to-one slope. The web was 0.279 m (11 in.)
tall and angles back to the bottom flange at a one-to-one slope. The bottom flange was 0.406 m
(16 in.) wide and 0.127 m (5 in.) tall. The box ends were as wide as the girder with a length of
0.051 m (2 ft) and then tapered back into the web along 0.152 m (0.5 ft) long as shown in Figure
3. In general, box ends were commonly used for post-tensioned girders in order to strengthen the
(SB) (NB)
15 | P a g e
compressive zone at the end. After post-tensioning the girder, the anchor zone would need to be
increased in order to resist the applied compressive forces. The box end design was to prevent
the crushing at the end of the girder containing highly concentrated compressive force.
Figure 3 Side view of the girder
Figure 4 Cross section at the midspan (Section A-A)
A
A B
B
16 | P a g e
Figure 5 Cross section at the end span (Section B-B)
The compressive strength of the concrete was originally specified to be 27.6 MPa (4,000
psi) at the time of prestressing and 34.5 MPa (5,000 psi) at 28 days. The maximum compressive
strength of the concrete was determined experimentally with cored samples and was found to
have an average maximum compressive of 51.4 MPa (7460 psi) and 46.4 MPa (6730 psi) for the
girder and deck concrete, respectively.
Girder Reinforcements
The prestressing for the tested girders was not the same as shown on the original bridge
plan. There were twenty four 9.53-mm (3/8-in.) diameter prestressed strands on the original
bridge plan with an ultimate prestressing steel strength of 1.72 GPa (250 ksi). Ten strands in the
web were harped at the midspan and fourteen straight strands were specified in the bottom flange
at a 50.8 mm (2 in.) center-to-center spacing. Each strand was specified to be pre-tensioned by
17 | P a g e
62.3 kN (14 kip). After the removal of the girders from the bridge, the actual girders were found
to be post-tensioned with three 28.6-mm (1-1/8 in.) diameter post-tensioned steel rods, instead of
prestressed strands. The strength of the steel was determined through tensile testing with a result
of 965 MPa (140 ksi). The post-tensioned steel rods were placed in a parabolic shape and
grouted into a 34.9-mm (1-3/8 in.) diameter corrugated conduit. Each post-tensioned steel rod
was anchored at the end of the girder with a steel bearing plate.
The locations of the steel rods along the length of the girder were necessarily determined
by measuring because of the inconsistency of the design with the original bridge plan. The
elevations of the rods at the end were measured, where the top rod was 0.438 m (17-1/4 in.), the
middle rod was 0.319 m (12-9/16 in.), and the bottom rod was 0.208 m (8-3/16 in.) from the
bottom of the girder for a centroid of 0.322 m (12.7 in.). The elevations of the rods at the
midspan were also measured, where the three conduits were placed tightly next to each other.
The edge spacing between the centroid of bottom rod and the bottom of the girder was 0.0381 m
(1-1/2 in.) and the center-to-center spacing between rods was 0.0349 m (1-3/8 in.) as the same as
the diameter of the conduit providing a centroid at the midspan of 0.073 m (2.88 in.). By having
two sets elevations through measuring, the elevations of the parabolic rods at different location
were determined by fitting a simply quadratic equation with two given points. The configurations
of the post-tensioned steel bars are shown in Figure 6.
For the shear and mild reinforcements of the girders, #4 bars were used along the entire
length of the girder with a yielding strength of 414 MPa (60 ksi). Four #4 longitudinal bars were
placed to hold the stirrups and hoop steels in place during casting. Four #5 hoop steels were used
along the depth of the girder at the box end section.
18 | P a g e
Figure 6 Configuration of the post-tensioned steel rods
The shear reinforcements were two side-by-sides #4 rebars with a top hook extended
0.127 m (5 in.) into the deck. The stirrups started at 0.0381 m (1.5 in.) from the girder end and
then had a spacing of 0.152 m (6 in.) for 1.52 m (5 ft). At this point, the stirrup spacing changed
to 0.305 m (12 in.) for 7.92 m (26 ft) and then back to a spacing of 0.152 m (6 in.) with a 0.0381
m (1.5 in.) edge spacing at the end. The configuration of shear reinforcements is shown in Figure
7.
Figure 7 Mild reinforcing of the girders

19 | P a g e
Chapter 4
EXPERIMENTATION
For this study, four girders were tested to determine the effective prestress force in
addition to the flexural and shear capacities. All of the experiments were performed at the
System Material and Structural Health Laboratory (SMASH Lab), which is part of the Utah
Transportation Center (UTC) at Utah State University. The SMASH Lab is located at 1500
Canyon Road, Logan Utah. It has been used for conducting large-scale structural testing on
campus since Spring 2009. The lab is equipped with a strong floor, reaction frame, hydraulic
rams, and a Vishay 5000 data acquisition system. The strong floor has a thickness of 0.914 m (3
ft). It is made of reinforced concrete with conduits spaced every 0.914 m (3 ft) in order to adapt
the various loading positions of the reaction frame. The reaction frame is a steel frame with two
columns, which were bolted to the strong floor through the conduits. The two columns are
connected with a steel beam. The hydraulic rams were held at the bottom of the beam. The
maximum static load that the ram used in this experiment can apply was 222 kN (500 kip). The
Vishay 5000 data acquisition system was utilized for monitoring load cells, strain gauges, and
LVDTs that were used for this experiment.
Figure 8 Set up with the reaction frame and two girders
20 | P a g e
Figure 9 Girders being tested
Figure 10 General Loading Schematic
The four tested girders were numbered 1, 2, 7, 8, where another four additional girders (3,
4, 5, 6) were tested for a different study. The numbering was set according to the order of the
removal from the bridge. The objective for the experiments was to determine the prestress force
with a cracking test and, furthermore, the capacity for either pure moment, predominately shear,
or a flexure-shear failure. Four different tests were performed to determine the capacity. They
were mid-span, 1-d, 2-d, and 4-d tests, where d was the total depth of the girders including the
deck as shown in Figure 10. These four tests represented that the static load was applied at
d = 0.914 m (36 in.)
L = 10.74 m (35.25 ft)
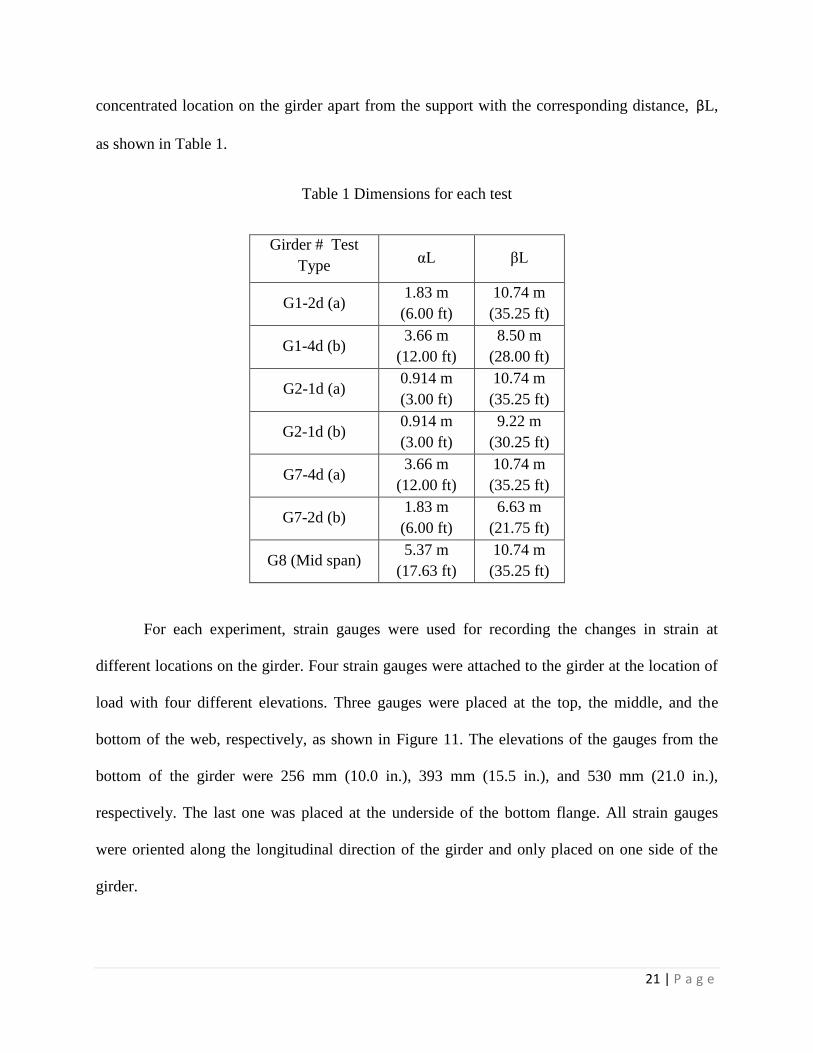
21 | P a g e
concentrated location on the girder apart from the support with the corresponding distance, βL,
as shown in Table 1.
Table 1 Dimensions for each test
Girder # Test
Type αL βL
G1-2d (a) 1.83 m
(6.00 ft)
10.74 m
(35.25 ft)
G1-4d (b) 3.66 m
(12.00 ft)
8.50 m
(28.00 ft)
G2-1d (a) 0.914 m
(3.00 ft)
10.74 m
(35.25 ft)
G2-1d (b) 0.914 m
(3.00 ft)
9.22 m
(30.25 ft)
G7-4d (a) 3.66 m
(12.00 ft)
10.74 m
(35.25 ft)
G7-2d (b) 1.83 m
(6.00 ft)
6.63 m
(21.75 ft)
G8 (Mid span) 5.37 m
(17.63 ft)
10.74 m
(35.25 ft)
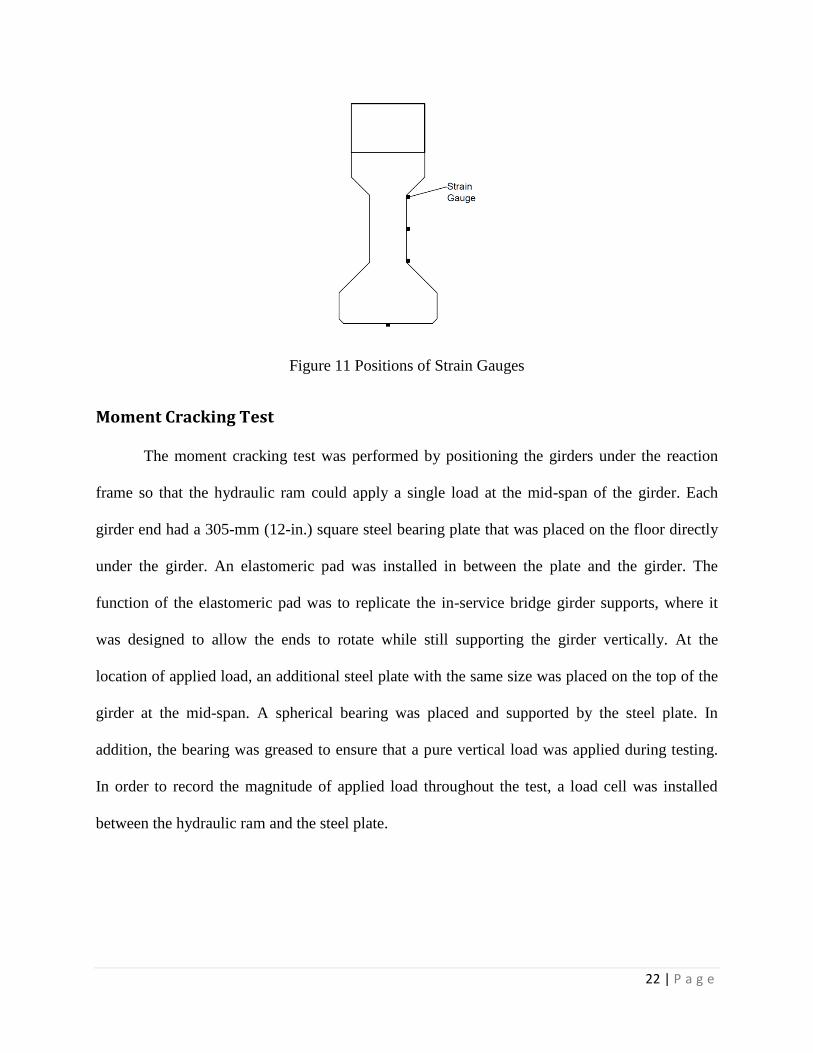
For each experiment, strain gauges were used for recording the changes in strain at
different locations on the girder. Four strain gauges were attached to the girder at the location of
load with four different elevations. Three gauges were placed at the top, the middle, and the
bottom of the web, respectively, as shown in Figure 11. The elevations of the gauges from the
bottom of the girder were 256 mm (10.0 in.), 393 mm (15.5 in.), and 530 mm (21.0 in.),
respectively. The last one was placed at the underside of the bottom flange. All strain gauges
were oriented along the longitudinal direction of the girder and only placed on one side of the
girder.
22 | P a g e
Figure 11 Positions of Strain Gauges
Moment Cracking Test
The moment cracking test was performed by positioning the girders under the reaction
frame so that the hydraulic ram could apply a single load at the mid-span of the girder. Each
girder end had a 305-mm (12-in.) square steel bearing plate that was placed on the floor directly
under the girder. An elastomeric pad was installed in between the plate and the girder. The
function of the elastomeric pad was to replicate the in-service bridge girder supports, where it
was designed to allow the ends to rotate while still supporting the girder vertically. At the
location of applied load, an additional steel plate with the same size was placed on the top of the
girder at the mid-span. A spherical bearing was placed and supported by the steel plate. In
addition, the bearing was greased to ensure that a pure vertical load was applied during testing.
In order to record the magnitude of applied load throughout the test, a load cell was installed
between the hydraulic ram and the steel plate.
23 | P a g e
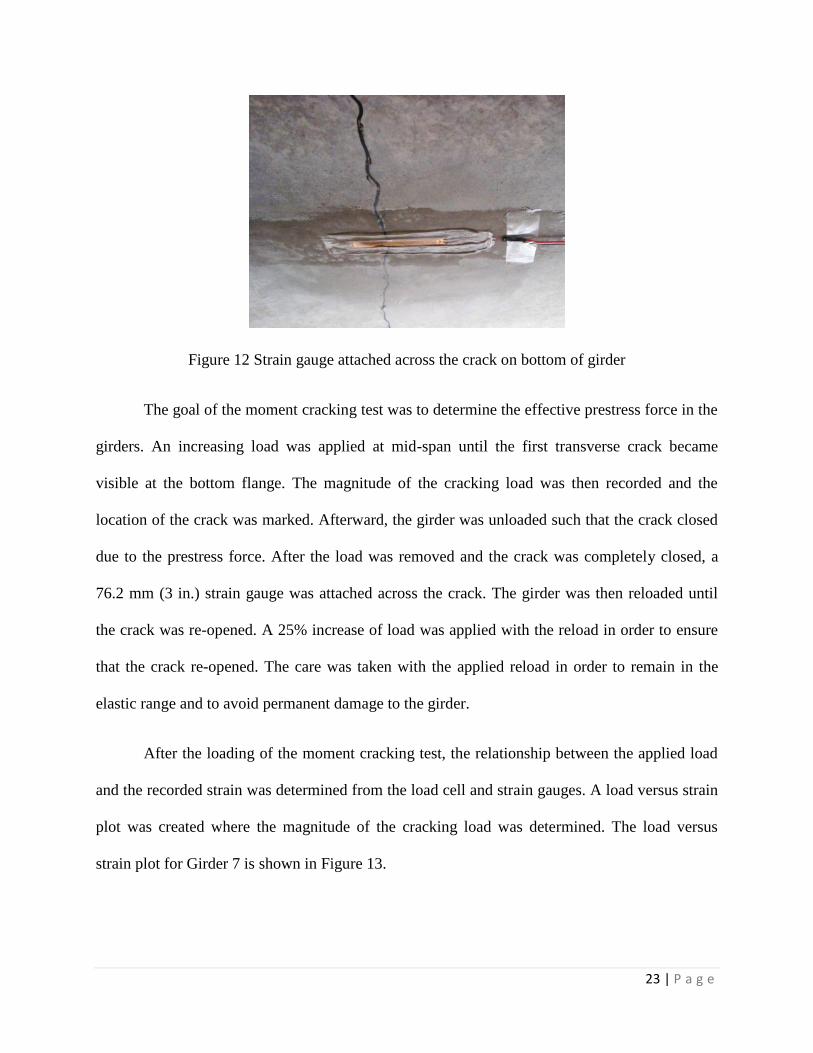
Figure 12 Strain gauge attached across the crack on bottom of girder
The goal of the moment cracking test was to determine the effective prestress force in the
girders. An increasing load was applied at mid-span until the first transverse crack became
visible at the bottom flange. The magnitude of the cracking load was then recorded and the
location of the crack was marked. Afterward, the girder was unloaded such that the crack closed
due to the prestress force. After the load was removed and the crack was completely closed, a
76.2 mm (3 in.) strain gauge was attached across the crack. The girder was then reloaded until
the crack was re-opened. A 25% increase of load was applied with the reload in order to ensure
that the crack re-opened. The care was taken with the applied reload in order to remain in the
elastic range and to avoid permanent damage to the girder.
After the loading of the moment cracking test, the relationship between the applied load
and the recorded strain was determined from the load cell and strain gauges. A load versus strain
plot was created where the magnitude of the cracking load was determined. The load versus
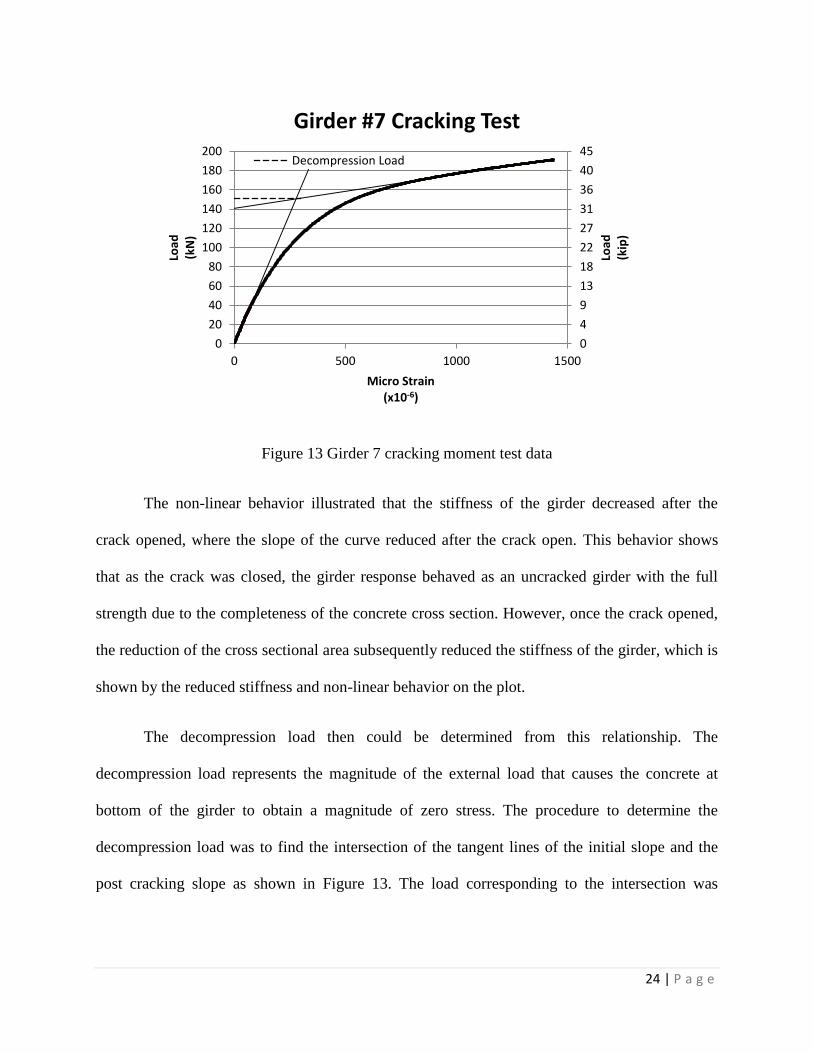
strain plot for Girder 7 is shown in Figure 13.
24 | P a g e
Figure 13 Girder 7 cracking moment test data
The non-linear behavior illustrated that the stiffness of the girder decreased after the
crack opened, where the slope of the curve reduced after the crack open. This behavior shows
that as the crack was closed, the girder response behaved as an uncracked girder with the full
strength due to the completeness of the concrete cross section. However, once the crack opened,
the reduction of the cross sectional area subsequently reduced the stiffness of the girder, which is
shown by the reduced stiffness and non-linear behavior on the plot.
The decompression load then could be determined from this relationship. The
decompression load represents the magnitude of the external load that causes the concrete at
bottom of the girder to obtain a magnitude of zero stress. The procedure to determine the
decompression load was to find the intersection of the tangent lines of the initial slope and the
post cracking slope as shown in Figure 13. The load corresponding to the intersection was
0
4
9
13
18
22
27
31
36
40
45
0
20
40
60
80
100
120
140
160
180
200
0 500 1000 1500
Load
(kip
)
Load
(kN
)
Micro Strain(x10-6)
Girder #7 Cracking Test
Decompression Load
25 | P a g e
defined as the decompression load for that particular tested girder. The total stress at the bottom
of a prestressed concrete girder can be calculated by Eq. 1.
Under the condition with the decompression load, the stress, σ, is zero. Then, Eq. 1 can
be used to calculate the total effective prestressing force, P, throughout the entire girder. The
prestressing force for each individual rod can be simply calculated by dividing P by the number
of post-tensioned rods, which is three for this case. Additionally, prestressing stress on each rod
can also be calculated using Eq. 2
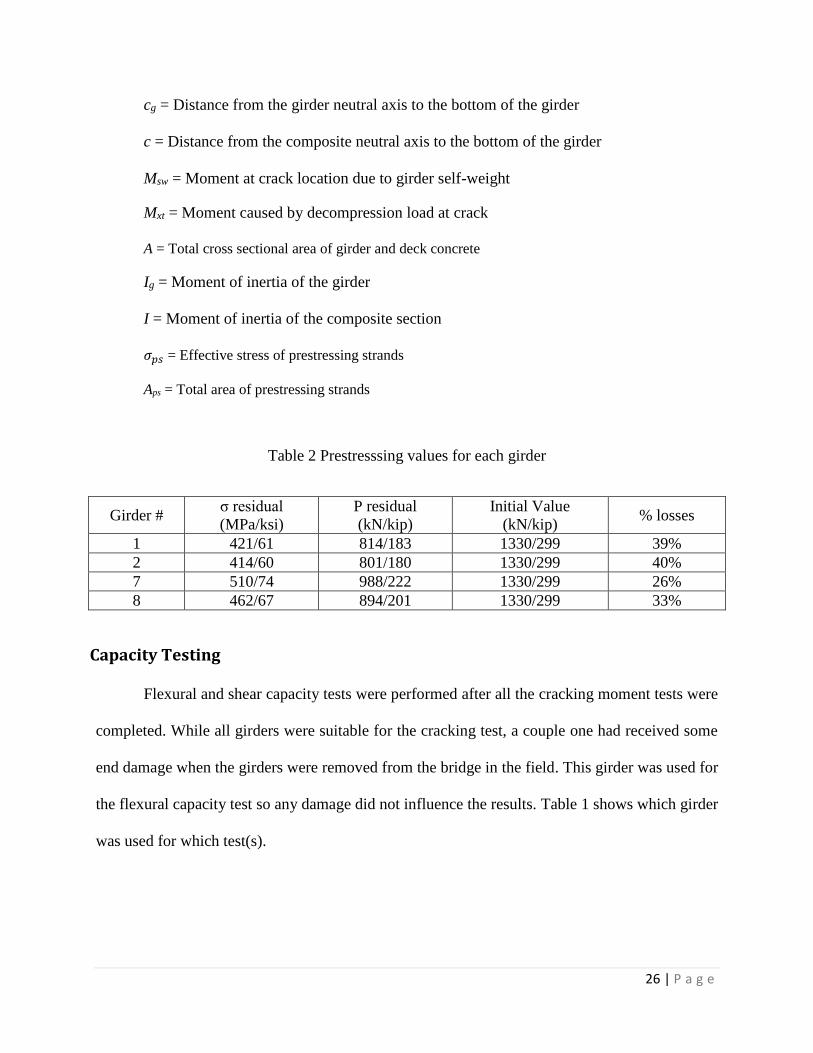
The calculated effective prestressing values for the tested girders in comparison to the
initial values are shown in Table 2. Since the prestressing design in the plan was different than
the actual design, the equivalent initial prestressing values were calculated with the original
prestressing force taken from the bridge plan (see Appendix B) and the actual geometry of the
post-tensioned rods. The average residual prestressing force was 876 kN (197 kip).
𝜎 = −𝑃
𝐴−𝑃𝑒𝑝𝑔𝑐𝑔
𝐼𝑔+𝑀𝑠𝑤𝑐𝑔
𝐼𝑔+𝑀𝑥𝑡𝑐
𝐼
Eq. 1
𝜎𝑝𝑠 =𝑃
𝐴𝑝𝑠
Eq. 2
where
σ = Stress at the bottom of the girder
P = Effective prestressing force
ep = Eccentricity of the prestressing force from the centroid of the girder
26 | P a g e
cg = Distance from the girder neutral axis to the bottom of the girder
c = Distance from the composite neutral axis to the bottom of the girder
Msw = Moment at crack location due to girder self-weight
Mxt = Moment caused by decompression load at crack
A = Total cross sectional area of girder and deck concrete
Ig = Moment of inertia of the girder
I = Moment of inertia of the composite section
𝜎𝑝𝑠 = Effective stress of prestressing strands
Aps = Total area of prestressing strands
Table 2 Prestresssing values for each girder
Girder # σ residual
(MPa/ksi)
P residual
(kN/kip)
Initial Value
(kN/kip) % losses
1 421/61 814/183 1330/299 39%
2 414/60 801/180 1330/299 40%
7 510/74 988/222 1330/299 26%
8 462/67 894/201 1330/299 33%
Capacity Testing
Flexural and shear capacity tests were performed after all the cracking moment tests were
completed. While all girders were suitable for the cracking test, a couple one had received some
end damage when the girders were removed from the bridge in the field. This girder was used for
the flexural capacity test so any damage did not influence the results. Table 1 shows which girder
was used for which test(s).
27 | P a g e
Flexural Capacity Test
Girder 8 was selected for the midspan flexural test. In addition to the strain gauges
attached at the midspan from the cracking test, an extra set of strain gauges with the same
configuration was also attached at a distance of one third of the span length from one end of the
girder. All the strain gauges were only attached on one side of the girder. Furthermore, string
potentiometers (String pot) were attached to both sides of the girder at the strain gauges
instrumentation location in addition to the center of the supports. The string pots at the supports
were to measure the deformation of the elastomeric pad during testing such that the actual girder
deflections were obtained by subtracting the pad deformation from the deflection readings.
In order to increase the reliability of the test results and reduce measurement errors,
accurate calibration on the sensors were performed prior to testing. All sensors were initialized to
zero before the testing initiated. The string pots and load cells were also initially calibrated in
order to provide accurate results. The calibration of the load cell was obtained by applying a
small load on it and monitoring the output from the Vishay to confirm that the calibration was
correct. The calibration of the string pots were performed by lifting the string by a predetermined
amount and comparing it with the Vishay output to ensure both values were equivalent.
The applied load for girders was increased monotonically throughout testing until failure.
During loading process, the first crack appeared at the bottom flange directly beneath the
location of the load. As the loading process continued, additional cracks appeared with a larger
angle and propagate out along the bottom flange. The ultimate load was obtained when the
concrete in the deck fail in compression. Figure 14 shows the loading and cracking that appeared
during the testing.
28 | P a g e
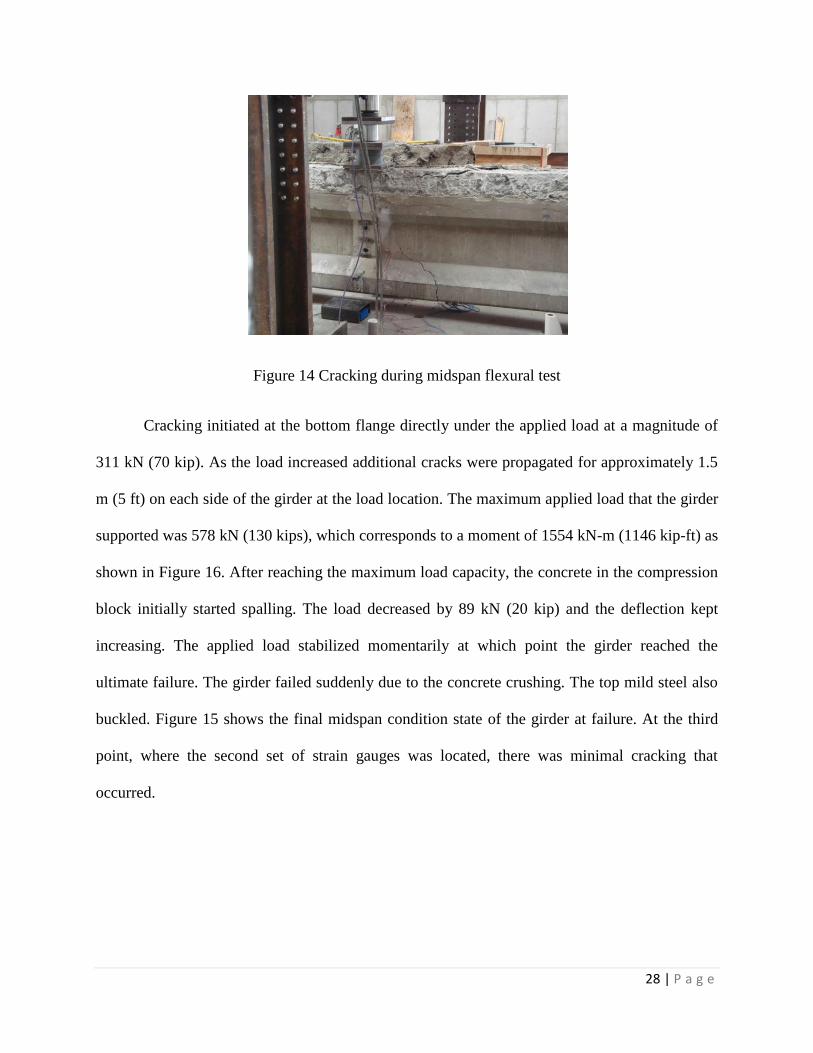
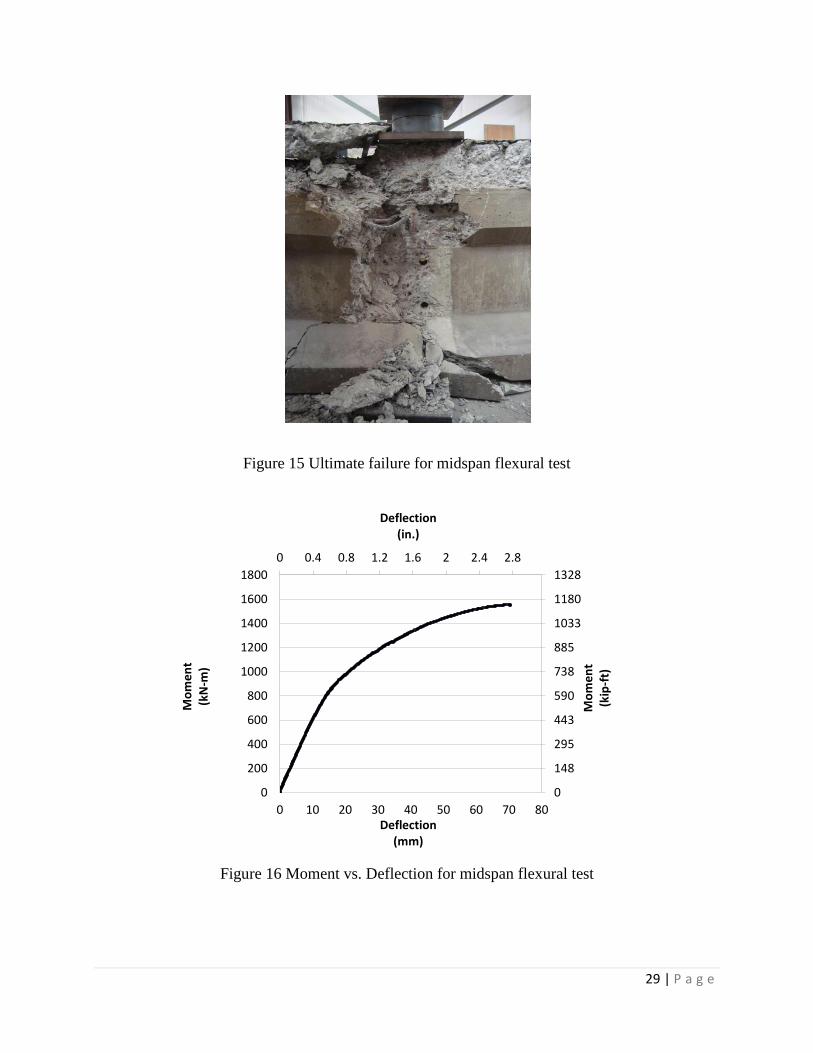
Figure 14 Cracking during midspan flexural test
Cracking initiated at the bottom flange directly under the applied load at a magnitude of
311 kN (70 kip). As the load increased additional cracks were propagated for approximately 1.5
m (5 ft) on each side of the girder at the load location. The maximum applied load that the girder
supported was 578 kN (130 kips), which corresponds to a moment of 1554 kN-m (1146 kip-ft) as
shown in Figure 16. After reaching the maximum load capacity, the concrete in the compression
block initially started spalling. The load decreased by 89 kN (20 kip) and the deflection kept
increasing. The applied load stabilized momentarily at which point the girder reached the
ultimate failure. The girder failed suddenly due to the concrete crushing. The top mild steel also
buckled. Figure 15 shows the final midspan condition state of the girder at failure. At the third
point, where the second set of strain gauges was located, there was minimal cracking that
occurred.
29 | P a g e
Figure 15 Ultimate failure for midspan flexural test
Figure 16 Moment vs. Deflection for midspan flexural test
0
148
295
443
590
738
885
1033
1180
1328
0 0.4 0.8 1.2 1.6 2 2.4 2.8
0
200
400
600
800
1000
1200
1400
1600
1800
0 10 20 30 40 50 60 70 80
Mo
me
nt
(kip
-ft)
Deflection(in.)
Mo
me
nt
(kN
-m)
Deflection(mm)
30 | P a g e
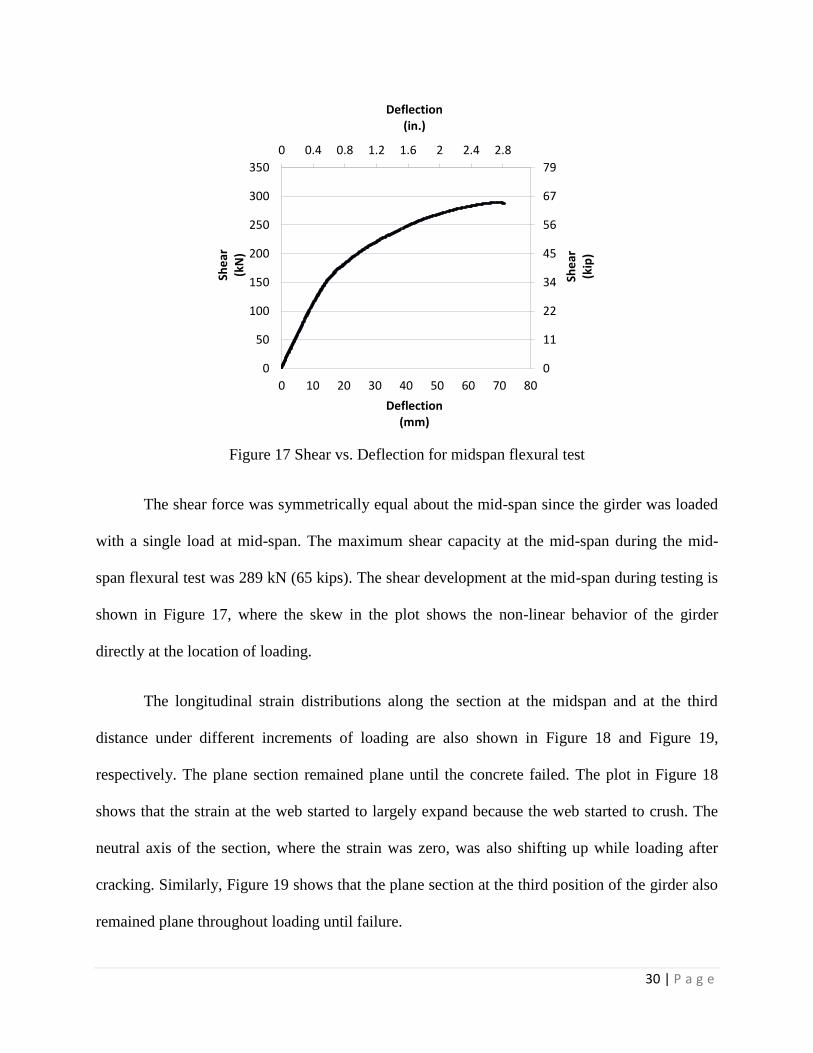
Figure 17 Shear vs. Deflection for midspan flexural test
The shear force was symmetrically equal about the mid-span since the girder was loaded
with a single load at mid-span. The maximum shear capacity at the mid-span during the mid-
span flexural test was 289 kN (65 kips). The shear development at the mid-span during testing is
shown in Figure 17, where the skew in the plot shows the non-linear behavior of the girder
directly at the location of loading.
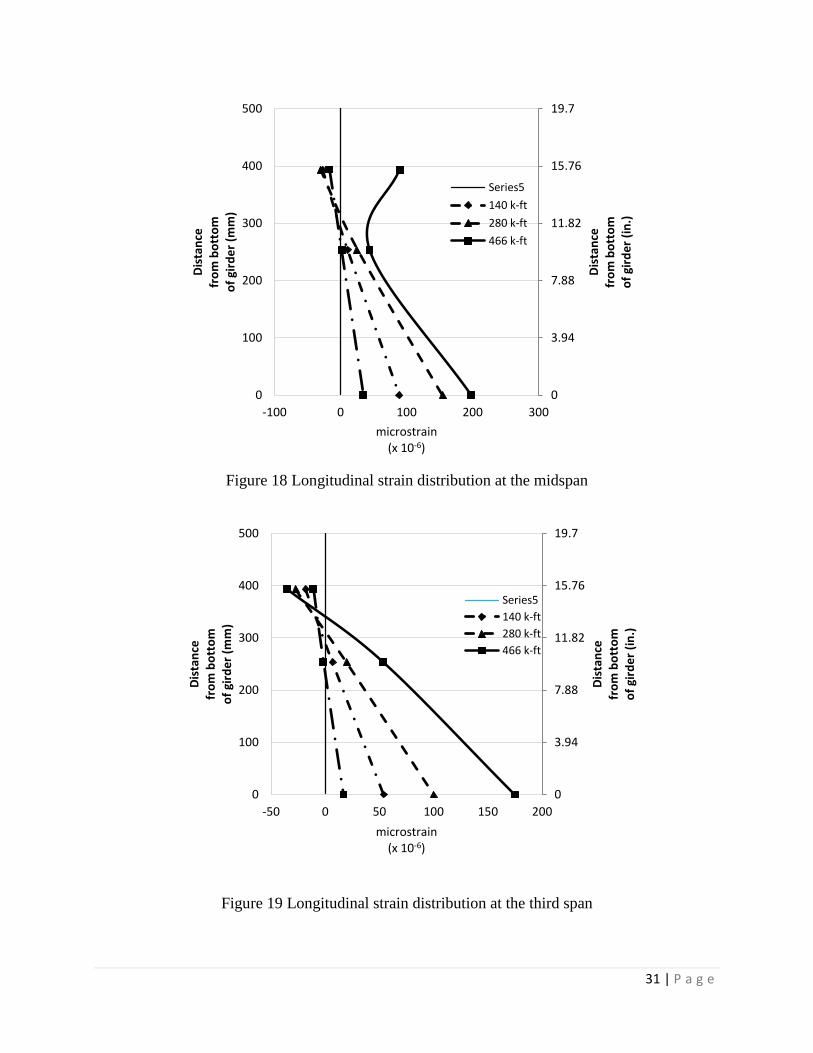
The longitudinal strain distributions along the section at the midspan and at the third
distance under different increments of loading are also shown in Figure 18 and Figure 19,
respectively. The plane section remained plane until the concrete failed. The plot in Figure 18
shows that the strain at the web started to largely expand because the web started to crush. The
neutral axis of the section, where the strain was zero, was also shifting up while loading after
cracking. Similarly, Figure 19 shows that the plane section at the third position of the girder also
remained plane throughout loading until failure.
0
11
22
34
45
56
67
79
0 0.4 0.8 1.2 1.6 2 2.4 2.8
0
50
100
150
200
250
300
350
0 10 20 30 40 50 60 70 80
She
ar(k
ip)
Deflection(in.)
She
ar(k
N)
Deflection(mm)
31 | P a g e
Figure 18 Longitudinal strain distribution at the midspan
Figure 19 Longitudinal strain distribution at the third span
0
3.94
7.88
11.82
15.76
19.7
0
100
200
300
400
500
-100 0 100 200 300
Dis
tan
ce
fro
m b
ott
om
o
f gi
rde
r (i
n.)
Dis
tan
cefr
om
bo
tto
m
of
gird
er
(mm
)
microstrain(x 10-6)
Series5
140 k-ft
280 k-ft
466 k-ft
0
3.94
7.88
11.82
15.76
19.7
0
100
200
300
400
500
-50 0 50 100 150 200
Dis
tan
ce
fro
m b
ott
om
o
f gi
rde
r (i
n.)
Dis
tan
cefr
om
bo
tto
m
of
gird
er
(mm
)
microstrain(x 10-6)
Series5
140 k-ft
280 k-ft
466 k-ft

32 | P a g e
1-d Test
Due to the brittle nature of shear failures, shear capacity tests were performed at distance
of 1-d, 2-d, and 4-d, where d represents the total depth from the girder bottom to the top of the
deck concrete. Each testing location performed twice in order to increase the reliability of the
results. Girder #2 was used for both of the 1-d tests. These tests were named G2-1d(a) and G2-
1d(b). The loading was performed by monotonically applying the load from the ram at the first
end until failure. The supports were then repositioned and the load was applied at the non-tested
end. For this testing, the load was applied at a distance of d, 0.914 m (3 ft) from the center of the
support with a span length of 10.9 m (35.25 ft) for G1-1d(a) and 9.0 m (29.64 ft) for G1-1d(b).
The change in span length for the second test was adjusted to minimize the effect of one test on
another. The ram and load cell positioning for the shear tests were the same as the mid-span
flexural test as shown in Figure 20.
Figure 20 Set up for 1-d tests
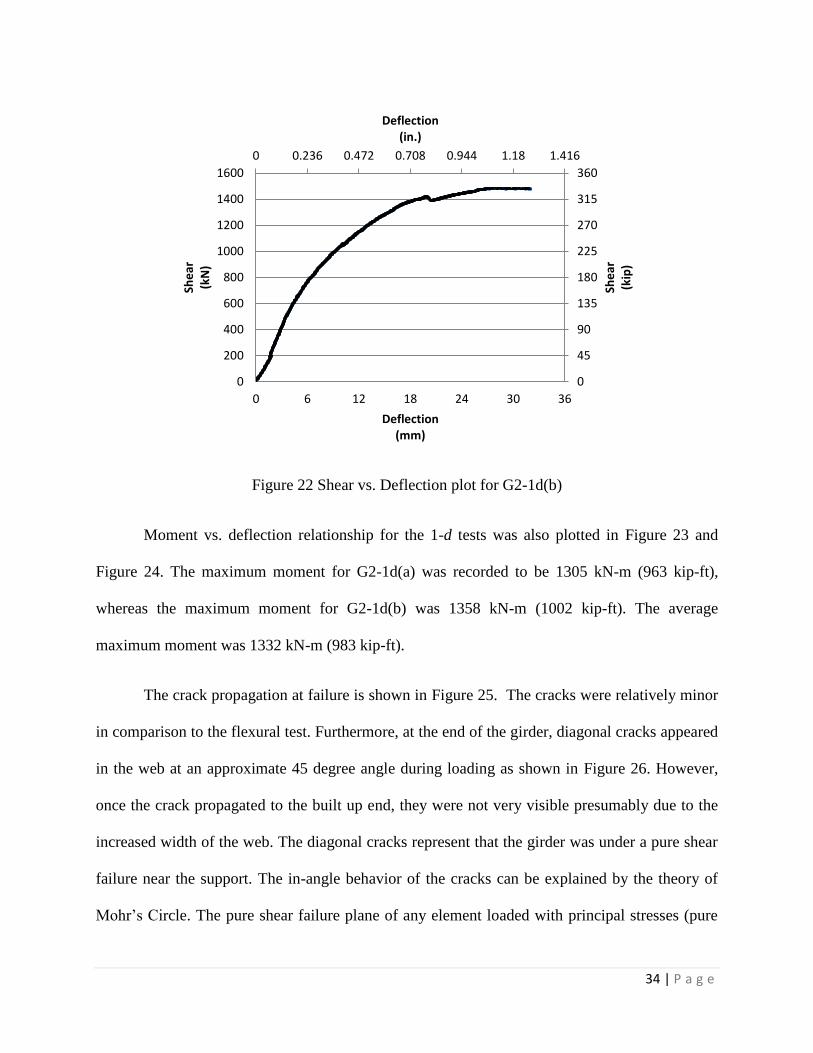
Shear vs. deflection plots from the 1-d tests are shown in Figure 21 and Figure 22. The
plot shows that the girder remained nearly elastically until the magnitude of shear reached
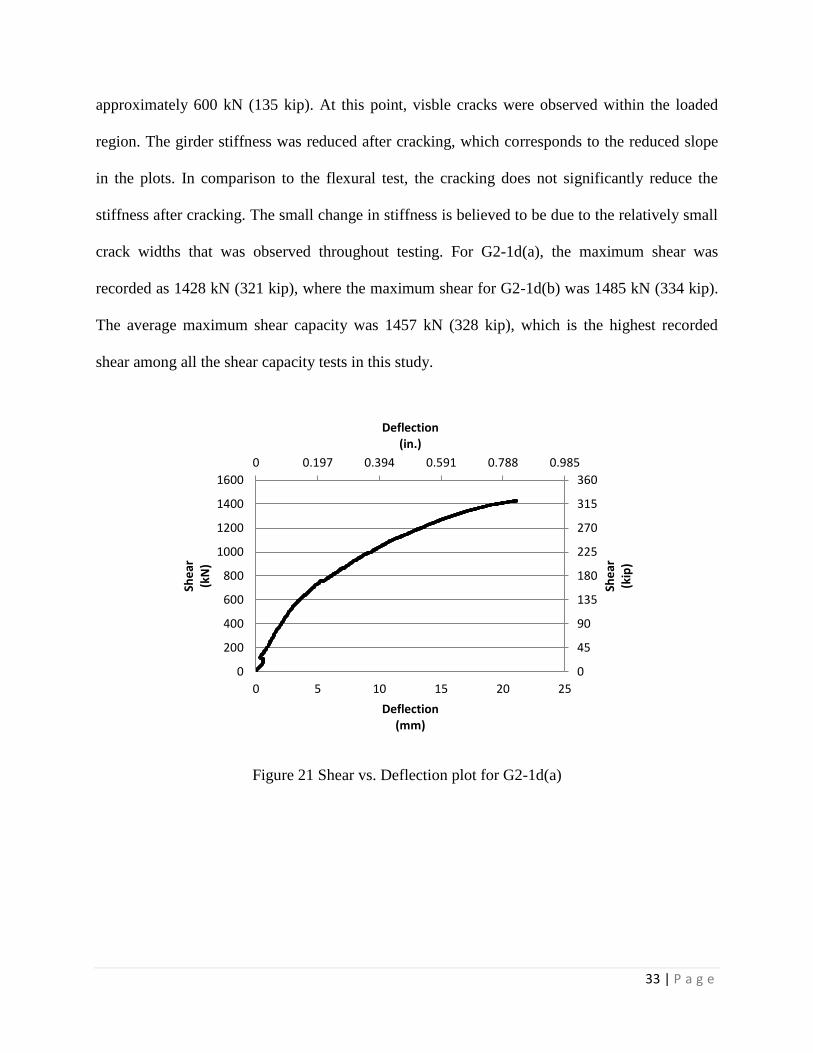
33 | P a g e
approximately 600 kN (135 kip). At this point, visble cracks were observed within the loaded
region. The girder stiffness was reduced after cracking, which corresponds to the reduced slope
in the plots. In comparison to the flexural test, the cracking does not significantly reduce the
stiffness after cracking. The small change in stiffness is believed to be due to the relatively small
crack widths that was observed throughout testing. For G2-1d(a), the maximum shear was
recorded as 1428 kN (321 kip), where the maximum shear for G2-1d(b) was 1485 kN (334 kip).
The average maximum shear capacity was 1457 kN (328 kip), which is the highest recorded
shear among all the shear capacity tests in this study.
Figure 21 Shear vs. Deflection plot for G2-1d(a)
0 0.197 0.394 0.591 0.788 0.985
0
45
90
135
180
225
270
315
360
0
200
400
600
800
1000
1200
1400
1600
0 5 10 15 20 25
Deflection(in.)
She
ar(k
ip)
She
ar
(kN
)
Deflection(mm)
34 | P a g e
Figure 22 Shear vs. Deflection plot for G2-1d(b)
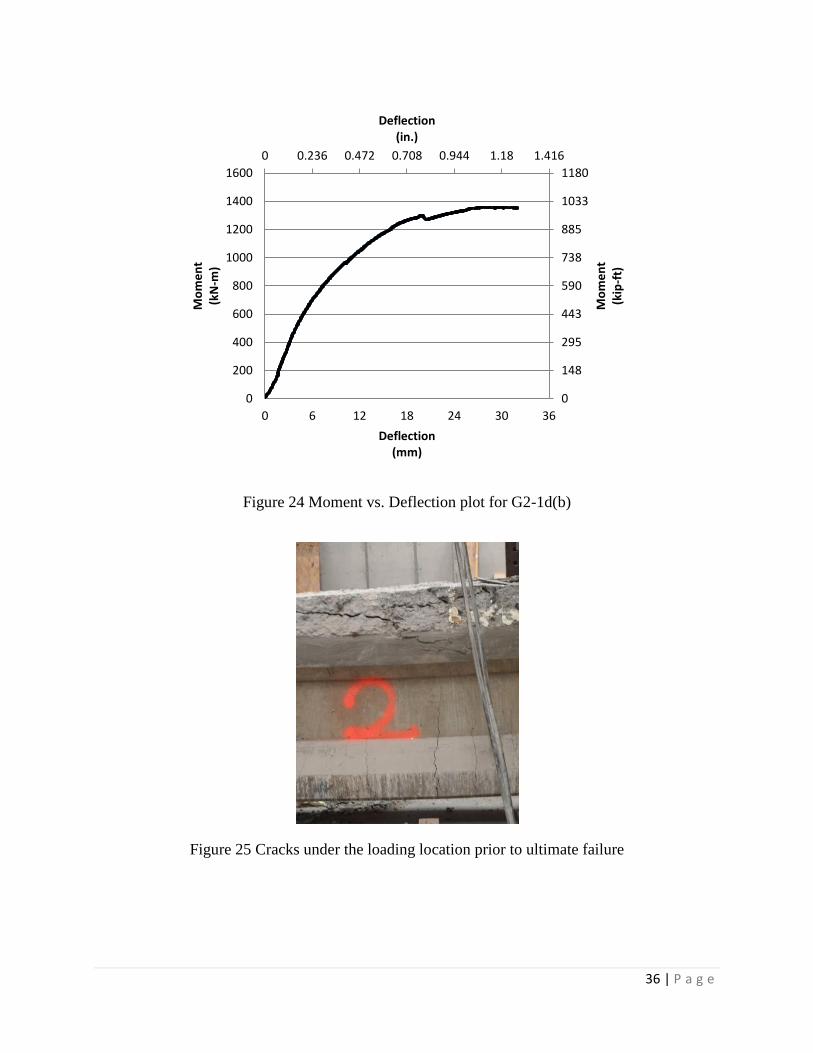
Moment vs. deflection relationship for the 1-d tests was also plotted in Figure 23 and
Figure 24. The maximum moment for G2-1d(a) was recorded to be 1305 kN-m (963 kip-ft),
whereas the maximum moment for G2-1d(b) was 1358 kN-m (1002 kip-ft). The average
maximum moment was 1332 kN-m (983 kip-ft).
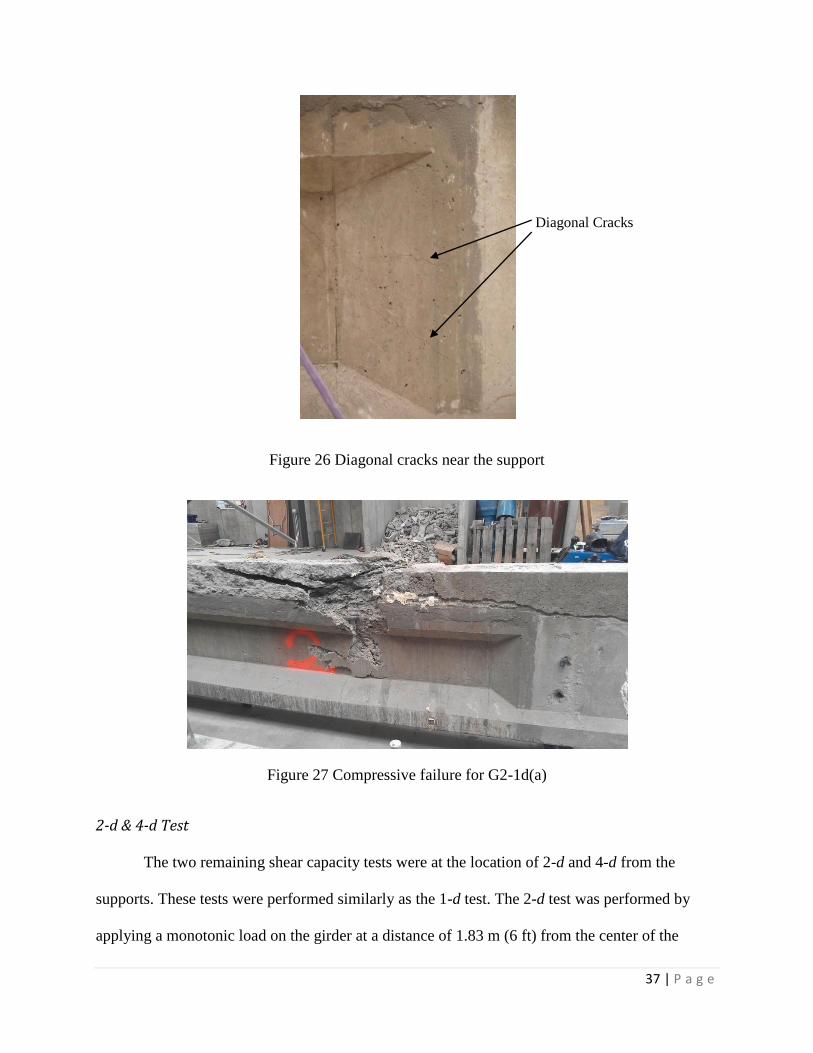
The crack propagation at failure is shown in Figure 25. The cracks were relatively minor
in comparison to the flexural test. Furthermore, at the end of the girder, diagonal cracks appeared
in the web at an approximate 45 degree angle during loading as shown in Figure 26. However,
once the crack propagated to the built up end, they were not very visible presumably due to the
increased width of the web. The diagonal cracks represent that the girder was under a pure shear
failure near the support. The in-angle behavior of the cracks can be explained by the theory of
Mohr’s Circle. The pure shear failure plane of any element loaded with principal stresses (pure
0 0.236 0.472 0.708 0.944 1.18 1.416
0
45
90
135
180
225
270
315
360
0
200
400
600
800
1000
1200
1400
1600
0 6 12 18 24 30 36
Deflection(in.)
She
ar(k
ip)
She
ar
(kN
)
Deflection(mm)
35 | P a g e
axial plane stresses with no plane shear) always appears in a 45 degree angle. The concrete
element near the end of the girder was under pure axial load on each plane (Principal plane
stress) with nearly no plane shear because insufficient bending moments were acting on the
girder nearby the support. As the load increased vertical cracks developed. These cracks
continued to widen whereas the shear crack widths remained relatively constant. At the ultimate
failure, the concrete compression block crushed as shown in Figure 27. Despite the proximity to
the end, the 1-d tested girder failed under a combined shear and flexural stress due to the
presence of the large end block.
Figure 23 Moment vs. Deflection plot for G2-1d(a)
0 0.236 0.472 0.708 0.944
0
148
295
443
590
738
885
1033
0
200
400
600
800
1000
1200
1400
0 6 12 18 24
Deflection(in.)
Mo
me
nt
(kip
-ft)
Mo
me
nt
(kN
-m)
Deflection(mm)
36 | P a g e
Figure 24 Moment vs. Deflection plot for G2-1d(b)
Figure 25 Cracks under the loading location prior to ultimate failure
0 0.236 0.472 0.708 0.944 1.18 1.416
0
148
295
443
590
738
885
1033
1180
0
200
400
600
800
1000
1200
1400
1600
0 6 12 18 24 30 36
Deflection(in.)
Mo
me
nt
(kip
-ft)
Mo
me
nt
(kN
-m)
Deflection(mm)
37 | P a g e
Figure 26 Diagonal cracks near the support
Figure 27 Compressive failure for G2-1d(a)
2-d & 4-d Test
The two remaining shear capacity tests were at the location of 2-d and 4-d from the
supports. These tests were performed similarly as the 1-d test. The 2-d test was performed by
applying a monotonic load on the girder at a distance of 1.83 m (6 ft) from the center of the
Diagonal Cracks
38 | P a g e
support and a distance of 3.66 m (12 ft) for 4-d test. Girder #1 and #7 were utilized to perform
these two tests. Each test was performed on a girder. Girder #1 was used to perform the 2-d test
(G1-2d(a)) first on one end, then the 4-d test (G1-4d(b)) was performed with a shorter span
length of 7.85 m (25.75 ft) on the other end. The 4-d test (G7-4d(a)) was first performed on
Girder #7 with the full span length. Then the 2-d test (G7-2d(b)) was performed on the shorter
span length of 6.32 m (20.75 ft). The alternating loading for the testing was performed to
minimize the effect from one test to the other.
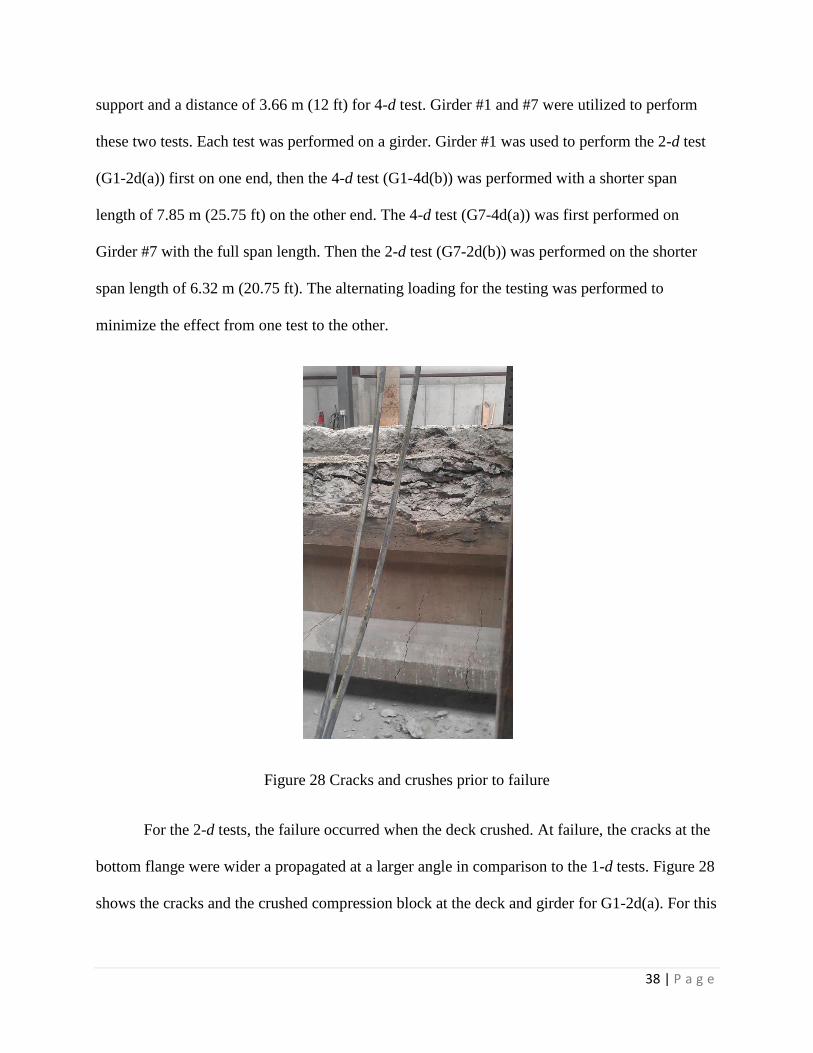
Figure 28 Cracks and crushes prior to failure
For the 2-d tests, the failure occurred when the deck crushed. At failure, the cracks at the
bottom flange were wider a propagated at a larger angle in comparison to the 1-d tests. Figure 28
shows the cracks and the crushed compression block at the deck and girder for G1-2d(a). For this
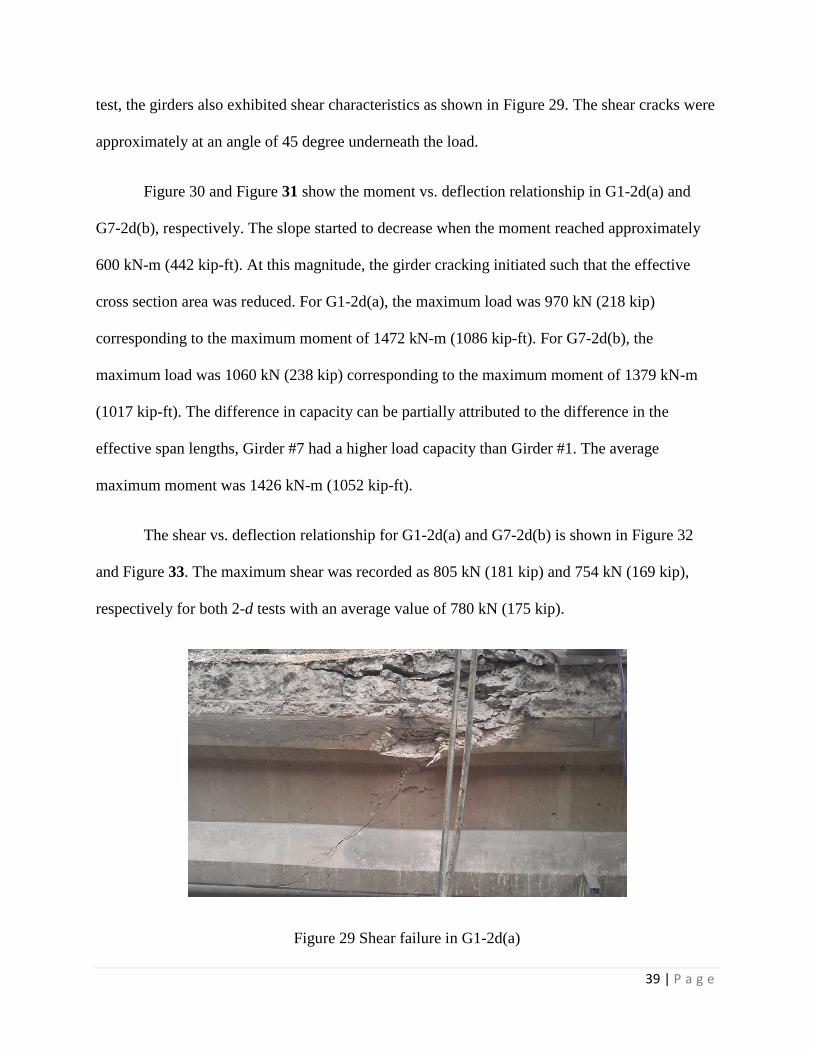
39 | P a g e
test, the girders also exhibited shear characteristics as shown in Figure 29. The shear cracks were
approximately at an angle of 45 degree underneath the load.
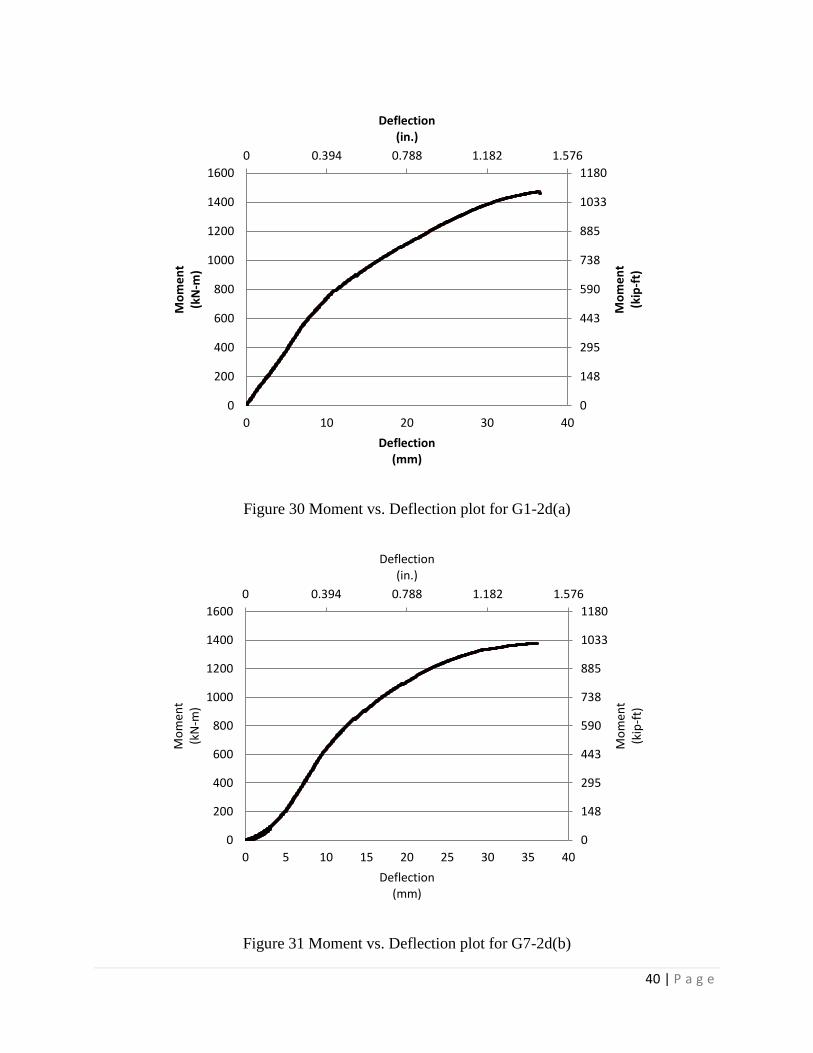
Figure 30 and Figure 31 show the moment vs. deflection relationship in G1-2d(a) and
G7-2d(b), respectively. The slope started to decrease when the moment reached approximately
600 kN-m (442 kip-ft). At this magnitude, the girder cracking initiated such that the effective
cross section area was reduced. For G1-2d(a), the maximum load was 970 kN (218 kip)
corresponding to the maximum moment of 1472 kN-m (1086 kip-ft). For G7-2d(b), the
maximum load was 1060 kN (238 kip) corresponding to the maximum moment of 1379 kN-m
(1017 kip-ft). The difference in capacity can be partially attributed to the difference in the
effective span lengths, Girder #7 had a higher load capacity than Girder #1. The average
maximum moment was 1426 kN-m (1052 kip-ft).
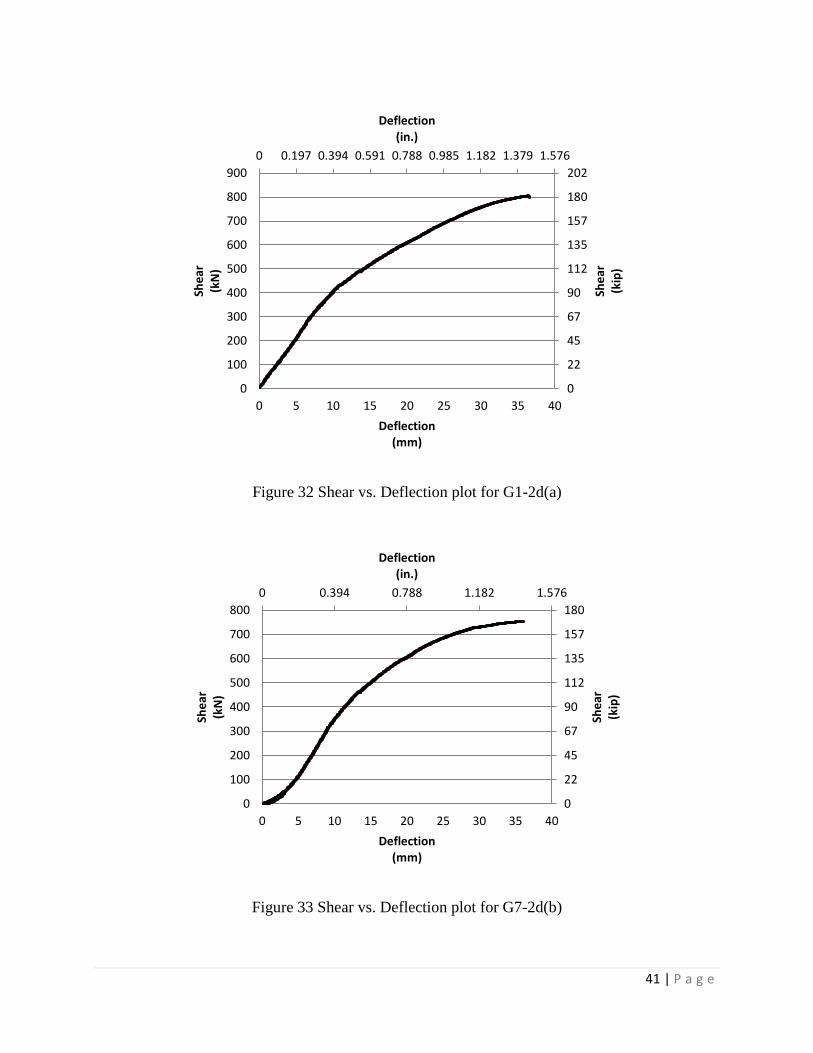
The shear vs. deflection relationship for G1-2d(a) and G7-2d(b) is shown in Figure 32
and Figure 33. The maximum shear was recorded as 805 kN (181 kip) and 754 kN (169 kip),
respectively for both 2-d tests with an average value of 780 kN (175 kip).
Figure 29 Shear failure in G1-2d(a)
40 | P a g e
Figure 30 Moment vs. Deflection plot for G1-2d(a)
Figure 31 Moment vs. Deflection plot for G7-2d(b)
0 0.394 0.788 1.182 1.576
0
148
295
443
590
738
885
1033
1180
0
200
400
600
800
1000
1200
1400
1600
0 10 20 30 40
Deflection(in.)
Mo
me
nt
(kip
-ft)
Mo
me
nt
(kN
-m)
Deflection(mm)
0 0.394 0.788 1.182 1.576
0
148
295
443
590
738
885
1033
1180
0
200
400
600
800
1000
1200
1400
1600
0 5 10 15 20 25 30 35 40
Deflection(in.)
Mo
men
t(k
ip-f
t)
Mo
men
t(k
N-m
)
Deflection(mm)
41 | P a g e
Figure 32 Shear vs. Deflection plot for G1-2d(a)
Figure 33 Shear vs. Deflection plot for G7-2d(b)
0 0.197 0.394 0.591 0.788 0.985 1.182 1.379 1.576
0
22
45
67
90
112
135
157
180
202
0
100
200
300
400
500
600
700
800
900
0 5 10 15 20 25 30 35 40
Deflection(in.)
She
ar(k
ip)
She
ar(k
N)
Deflection(mm)
0 0.394 0.788 1.182 1.576
0
22
45
67
90
112
135
157
180
0
100
200
300
400
500
600
700
800
0 5 10 15 20 25 30 35 40
Deflection(in.)
She
ar(k
ip)
She
ar(k
N)
Deflection(mm)
42 | P a g e
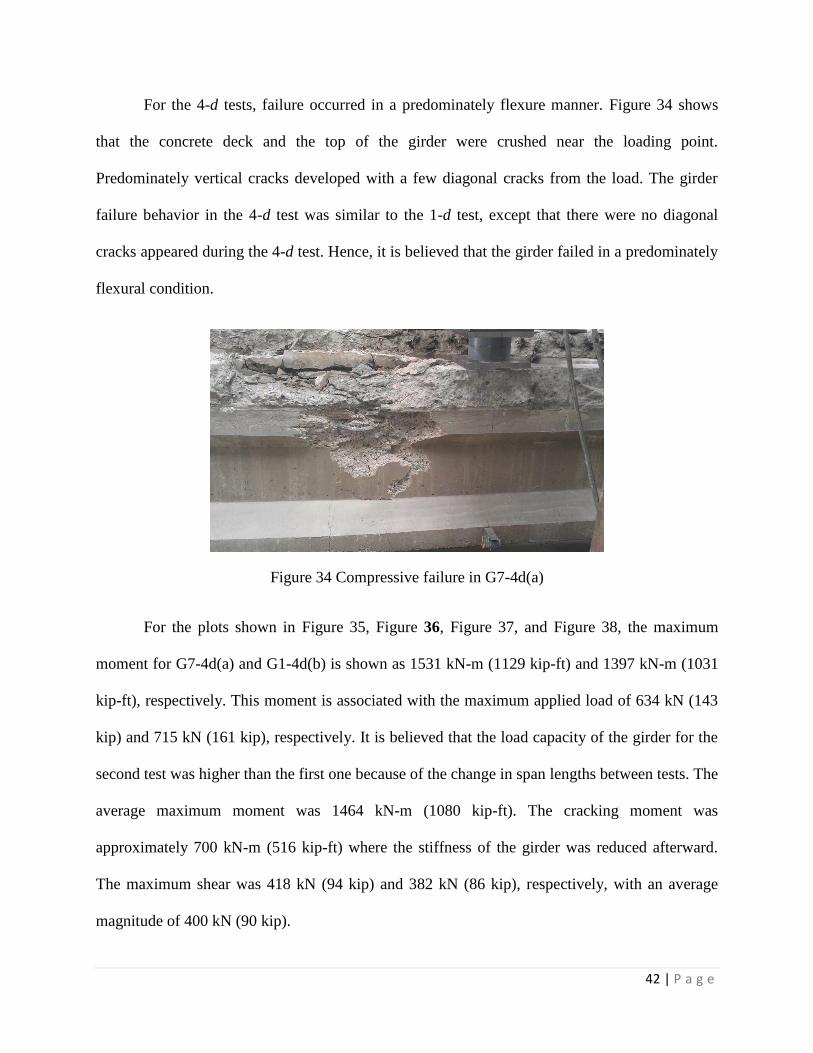
For the 4-d tests, failure occurred in a predominately flexure manner. Figure 34 shows
that the concrete deck and the top of the girder were crushed near the loading point.
Predominately vertical cracks developed with a few diagonal cracks from the load. The girder
failure behavior in the 4-d test was similar to the 1-d test, except that there were no diagonal
cracks appeared during the 4-d test. Hence, it is believed that the girder failed in a predominately
flexural condition.
Figure 34 Compressive failure in G7-4d(a)
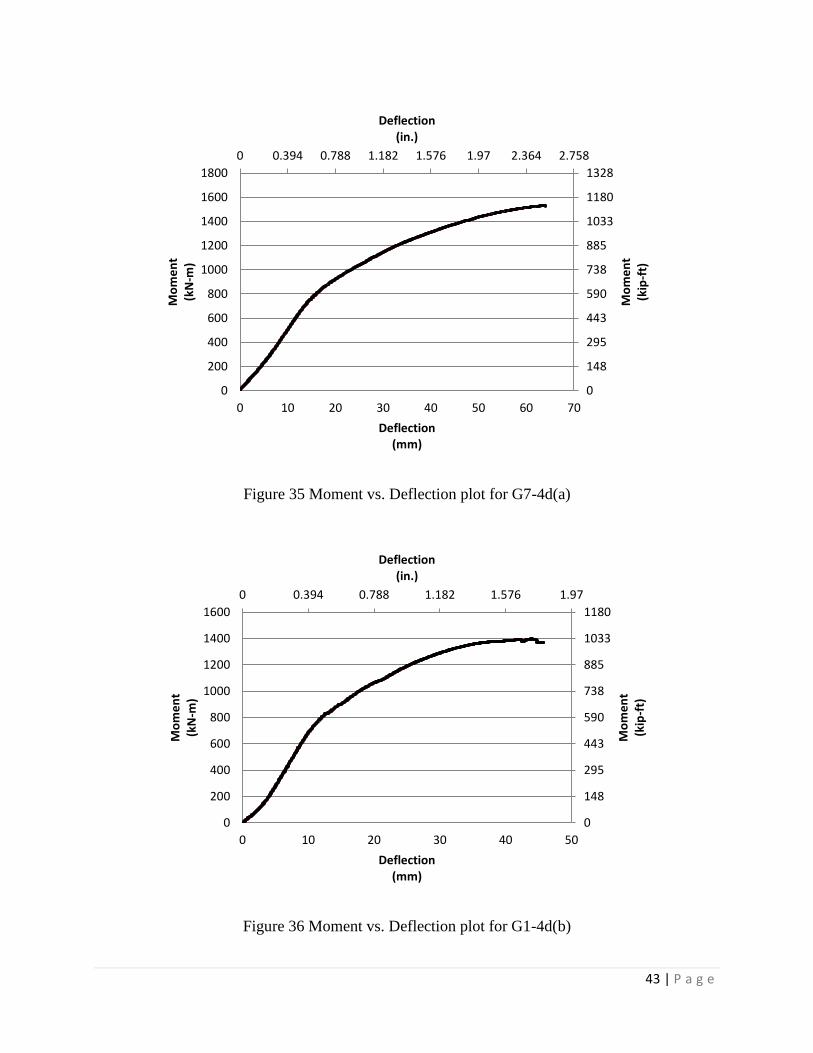
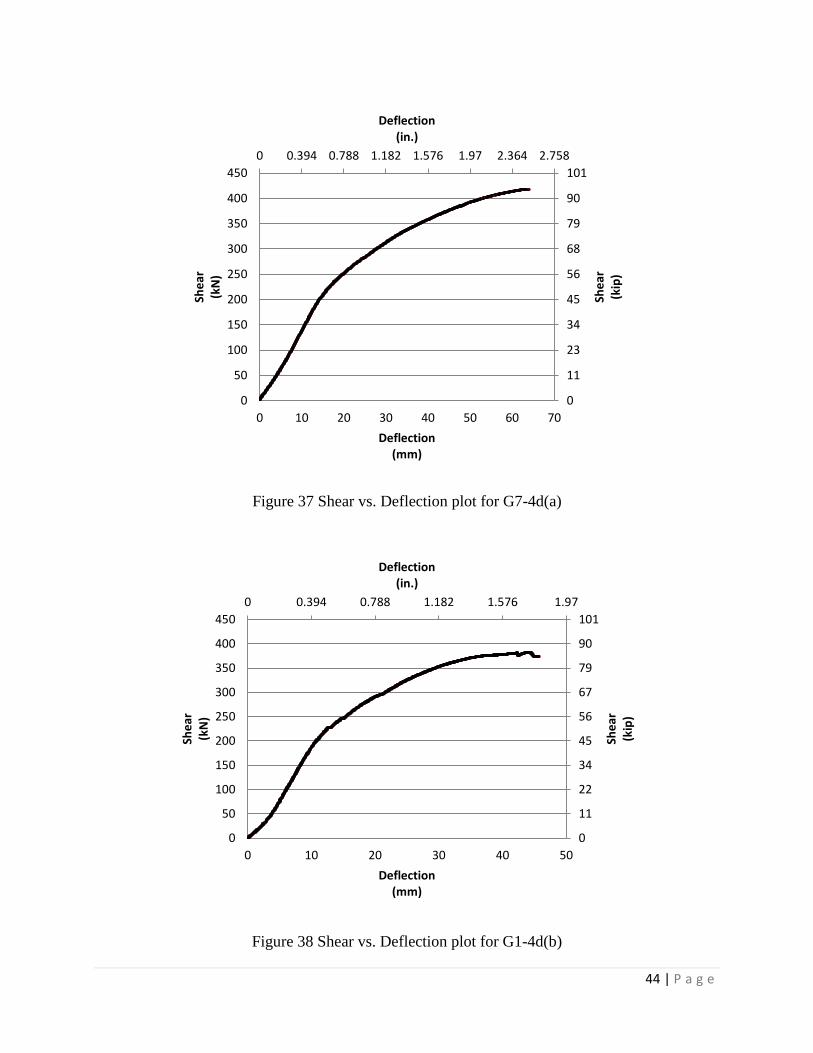
For the plots shown in Figure 35, Figure 36, Figure 37, and Figure 38, the maximum
moment for G7-4d(a) and G1-4d(b) is shown as 1531 kN-m (1129 kip-ft) and 1397 kN-m (1031
kip-ft), respectively. This moment is associated with the maximum applied load of 634 kN (143
kip) and 715 kN (161 kip), respectively. It is believed that the load capacity of the girder for the
second test was higher than the first one because of the change in span lengths between tests. The
average maximum moment was 1464 kN-m (1080 kip-ft). The cracking moment was
approximately 700 kN-m (516 kip-ft) where the stiffness of the girder was reduced afterward.
The maximum shear was 418 kN (94 kip) and 382 kN (86 kip), respectively, with an average
magnitude of 400 kN (90 kip).
43 | P a g e
Figure 35 Moment vs. Deflection plot for G7-4d(a)
Figure 36 Moment vs. Deflection plot for G1-4d(b)
0 0.394 0.788 1.182 1.576 1.97 2.364 2.758
0
148
295
443
590
738
885
1033
1180
1328
0
200
400
600
800
1000
1200
1400
1600
1800
0 10 20 30 40 50 60 70
Deflection(in.)
Mo
me
nt
(kip
-ft)
Mo
me
nt
(kN
-m)
Deflection(mm)
0 0.394 0.788 1.182 1.576 1.97
0
148
295
443
590
738
885
1033
1180
0
200
400
600
800
1000
1200
1400
1600
0 10 20 30 40 50
Deflection(in.)
Mo
me
nt
(kip
-ft)
Mo
me
nt
(kN
-m)
Deflection(mm)
44 | P a g e
Figure 37 Shear vs. Deflection plot for G7-4d(a)
Figure 38 Shear vs. Deflection plot for G1-4d(b)
0 0.394 0.788 1.182 1.576 1.97 2.364 2.758
0
11
23
34
45
56
68
79
90
101
0
50
100
150
200
250
300
350
400
450
0 10 20 30 40 50 60 70
Deflection(in.)
She
ar(k
ip)
She
ar(k
N)
Deflection(mm)
0 0.394 0.788 1.182 1.576 1.97
0
11
22
34
45
56
67
79
90
101
0
50
100
150
200
250
300
350
400
450
0 10 20 30 40 50
Deflection(in.)
She
ar(k
ip)
She
ar(k
N)
Deflection(mm)
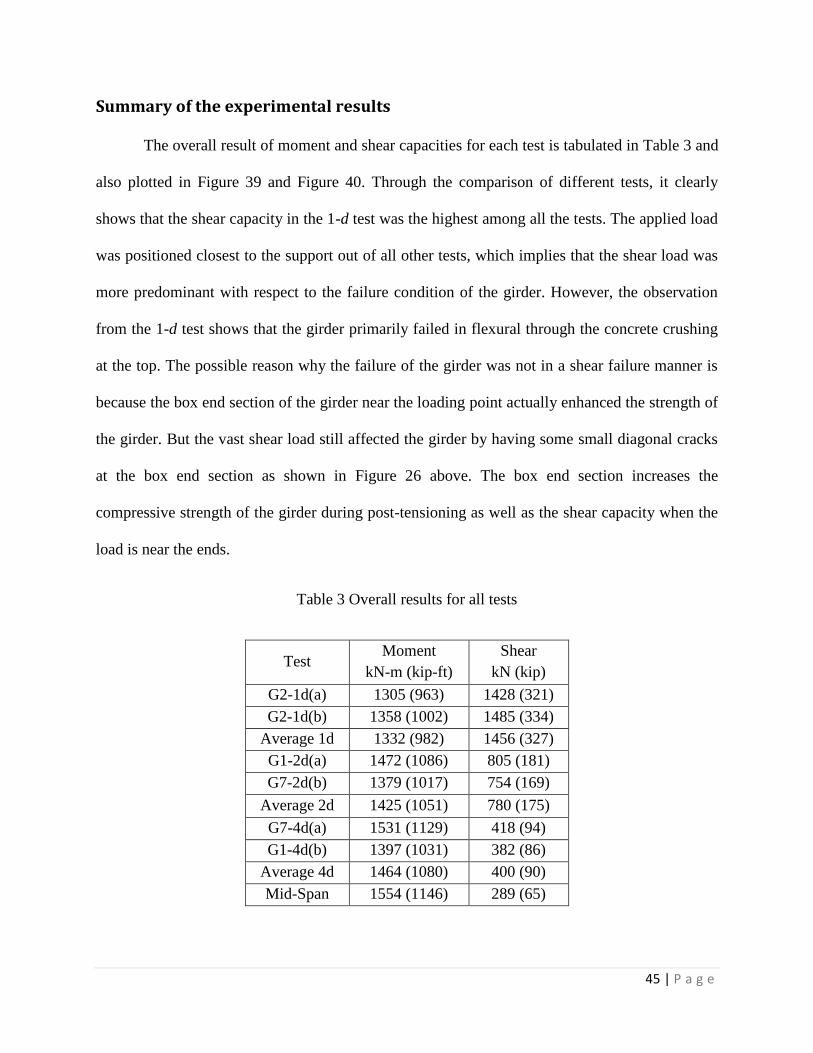
45 | P a g e
Summary of the experimental results
The overall result of moment and shear capacities for each test is tabulated in Table 3 and
also plotted in Figure 39 and Figure 40. Through the comparison of different tests, it clearly
shows that the shear capacity in the 1-d test was the highest among all the tests. The applied load
was positioned closest to the support out of all other tests, which implies that the shear load was
more predominant with respect to the failure condition of the girder. However, the observation
from the 1-d test shows that the girder primarily failed in flexural through the concrete crushing
at the top. The possible reason why the failure of the girder was not in a shear failure manner is
because the box end section of the girder near the loading point actually enhanced the strength of
the girder. But the vast shear load still affected the girder by having some small diagonal cracks
at the box end section as shown in Figure 26 above. The box end section increases the
compressive strength of the girder during post-tensioning as well as the shear capacity when the
load is near the ends.
Table 3 Overall results for all tests
Test Moment
kN-m (kip-ft)
Shear
kN (kip)
G2-1d(a) 1305 (963) 1428 (321)
G2-1d(b) 1358 (1002) 1485 (334)
Average 1d 1332 (982) 1456 (327)
G1-2d(a) 1472 (1086) 805 (181)
G7-2d(b) 1379 (1017) 754 (169)
Average 2d 1425 (1051) 780 (175)
G7-4d(a) 1531 (1129) 418 (94)
G1-4d(b) 1397 (1031) 382 (86)
Average 4d 1464 (1080) 400 (90)
Mid-Span 1554 (1146) 289 (65)

46 | P a g e
For the 2-d test, the shear capacity is the second highest in this study. The failure was in a
flexural-shear manner as expected due to the high-shear load. For this test, the box end section
did not influence the shear capacity since the load was further away from the girder end in
comparison to the 1-d test. As the loading was placed further away from the support, the flexural
loading effect becomes more significant, in other word, the shear effect becomes less significant.
The 4-d tests and mid-span had the largest flexural influence as expected with a relatively minor
shear load effect. Figure 39 shows the decreasing trend of the shear capacity with respect to the
distance between the load and near support, αL.
In addition, the moment capacities for all tests were relatively closed. The average
maximum moment among all tests is 1444 kN-m (1065 kip-ft) with a standard deviation of 6%,
which means the moment capacities for all tests are not really varied in comparison to the shear
capacities. However, there is still a mild increasing trend of moment capacity along with αL, as
shown in Figure 40. However, the moment capacities along the entire girder are still fairly
consistent.
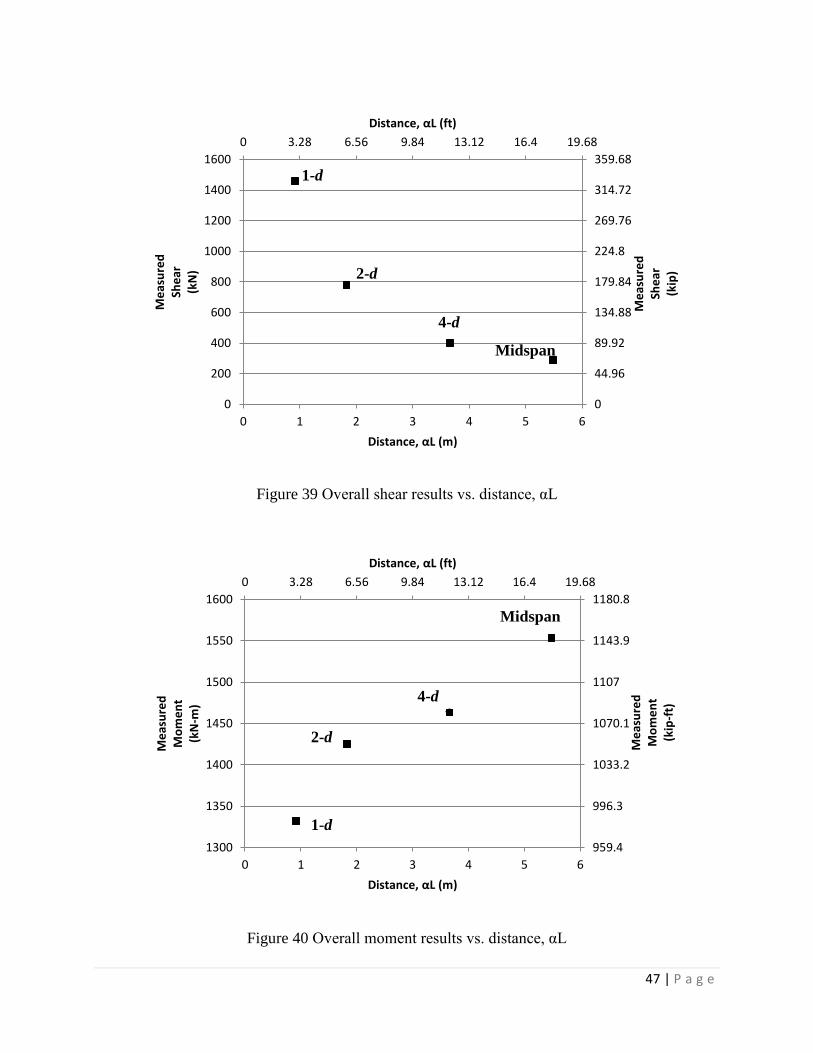
47 | P a g e
Figure 39 Overall shear results vs. distance, αL
Figure 40 Overall moment results vs. distance, αL
0 3.28 6.56 9.84 13.12 16.4 19.68
0
44.96
89.92
134.88
179.84
224.8
269.76
314.72
359.68
0
200
400
600
800
1000
1200
1400
1600
0 1 2 3 4 5 6
Distance, αL (ft)
Me
asu
red
She
ar(k
ip)
Me
asu
red
She
ar(k
N)
Distance, αL (m)
0 3.28 6.56 9.84 13.12 16.4 19.68
959.4
996.3
1033.2
1070.1
1107
1143.9
1180.8
1300
1350
1400
1450
1500
1550
1600
0 1 2 3 4 5 6
Distance, αL (ft)
Me
asu
red
Mo
me
nt
(kip
-ft)
Me
asu
red
Mo
me
nt
(kN
-m)
Distance, αL (m)
1-d
2-d
4-d
Midspan
1-d
2-d
4-d
Midspan
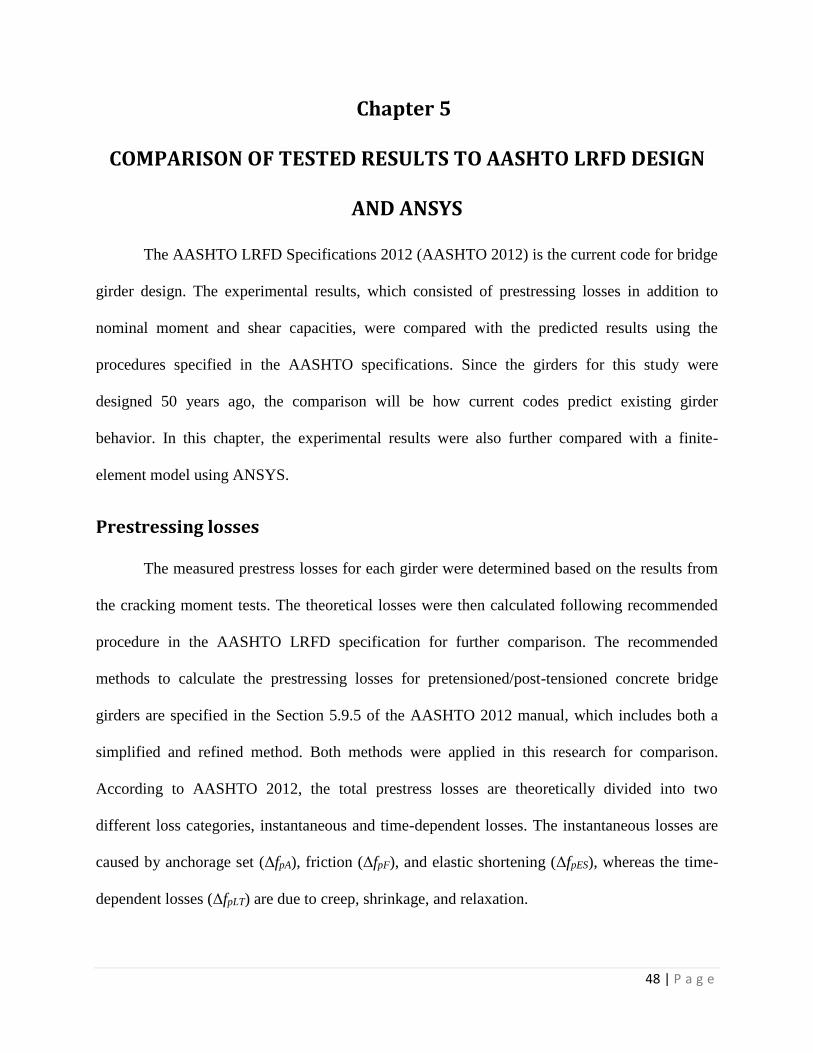
48 | P a g e
Chapter 5
COMPARISON OF TESTED RESULTS TO AASHTO LRFD DESIGN
AND ANSYS
The AASHTO LRFD Specifications 2012 (AASHTO 2012) is the current code for bridge
girder design. The experimental results, which consisted of prestressing losses in addition to
nominal moment and shear capacities, were compared with the predicted results using the
procedures specified in the AASHTO specifications. Since the girders for this study were
designed 50 years ago, the comparison will be how current codes predict existing girder
behavior. In this chapter, the experimental results were also further compared with a finite-
element model using ANSYS.
Prestressing losses
The measured prestress losses for each girder were determined based on the results from
the cracking moment tests. The theoretical losses were then calculated following recommended
procedure in the AASHTO LRFD specification for further comparison. The recommended
methods to calculate the prestressing losses for pretensioned/post-tensioned concrete bridge
girders are specified in the Section 5.9.5 of the AASHTO 2012 manual, which includes both a
simplified and refined method. Both methods were applied in this research for comparison.
According to AASHTO 2012, the total prestress losses are theoretically divided into two
different loss categories, instantaneous and time-dependent losses. The instantaneous losses are
caused by anchorage set (ΔfpA), friction (ΔfpF), and elastic shortening (ΔfpES), whereas the time-
dependent losses (ΔfpLT) are due to creep, shrinkage, and relaxation.
49 | P a g e
Simplified Method
The total prestress losses (ΔfpT), according to the simplified method, for a post-tensioned
concrete girder are calculated using Eq. 3, which is the sum of the various components of losses
mentioned previously in this section.
Δ𝑓𝑝𝑇 = Δ𝑓𝑝𝐹 + Δ𝑓𝑝𝐴 + Δ𝑓𝑝𝐸𝑆 + Δ𝑓𝑝𝐿𝑇
Eq. 3
The approach to estimate the instantaneous losses is the same for both the simplified and
refined method. The friction losses are caused by the friction developed between the internal
post-tensioned tendons and the duct wall, which is defined as Eq. 4. The loss due to anchorage
set is caused by the axial movement of the tendon prior to seating of the wedges or the anchorage
gripping device. The recommended value of movement, δ, for bar tendons is 1.59 mm (0.0625
in.) as recommended in Section C5.9.5.2.1 in AASHTO 2012. The anchorage loss then is
calculated based on Hooke’s Law using Eq. 5. The loss due to elastic shortening occurs at the
time of girder tensioning. For post-tensioned members, the short-term loss due to elastic
shortening can generally be minimized by retensioning the post-tensioning strand or bar during
construction. The elastic shortening losses in post-tensioned members can be determined by Eq.
6.
Δ𝑓𝑝𝐹 = 𝑓𝑝𝑗(1 − 𝑒−(𝐾𝑥+𝜇𝛼))
Eq. 4
ΔfpA = Epδ
L
Eq. 5

50 | P a g e
Δ𝑓𝑝𝐸𝑆 =𝑁 − 1
2𝑁
𝐴𝑝𝑠𝑓𝑝𝑏𝑡(𝐼𝑔 + 𝑒𝑚2 𝐴𝑔) − 𝑒𝑚𝑀𝑔𝐴𝑔
𝐴𝑝𝑠(𝐼𝑔 + 𝑒𝑚2 𝐴𝑔) −𝐴𝑔𝐼𝑔𝐸𝑐𝑖𝐸𝑝
Eq. 6
where
fpj = stress in the prestressing steel at jacking (99.7 ksi)
x = length of a prestressing tendon from the jacking end to any point under consideration
(18.125 ft)
K = wobble friction coefficient (0.0002)
μ = coefficient of friction (0.3)
α = sum of the absolute values of angular change of prestressing steel path from jacking
end, or from the nearest jacking end if tensioning is done equally at both ends, to the
point under investigation (0.1102)
δ = axial deformation in prestressing tendons prior to seating (0.0625 in.)
L = length of the tendon (435 in.)
Aps = area of prestressing steel (2.98 in.2)
Ag = gross area of girder cross-section (276 in.2)
Eci = modulus of elasticity of concrete at transfer (4070 ksi)
Ep = modulus of elasticity of prestressing tendons (29000 ksi)
em = average eccentricity at midspan (8.34 in.)
fpbt = stress in prestressing steel immediately prior to transfer (99.7 ksi)
Ig = moment of inertia of the gross concrete section (28500 in.4)
Mg = midspan moment due to member self-weight (46.1 kip-ft)
N = number of identical prestressing tendons (3.0)
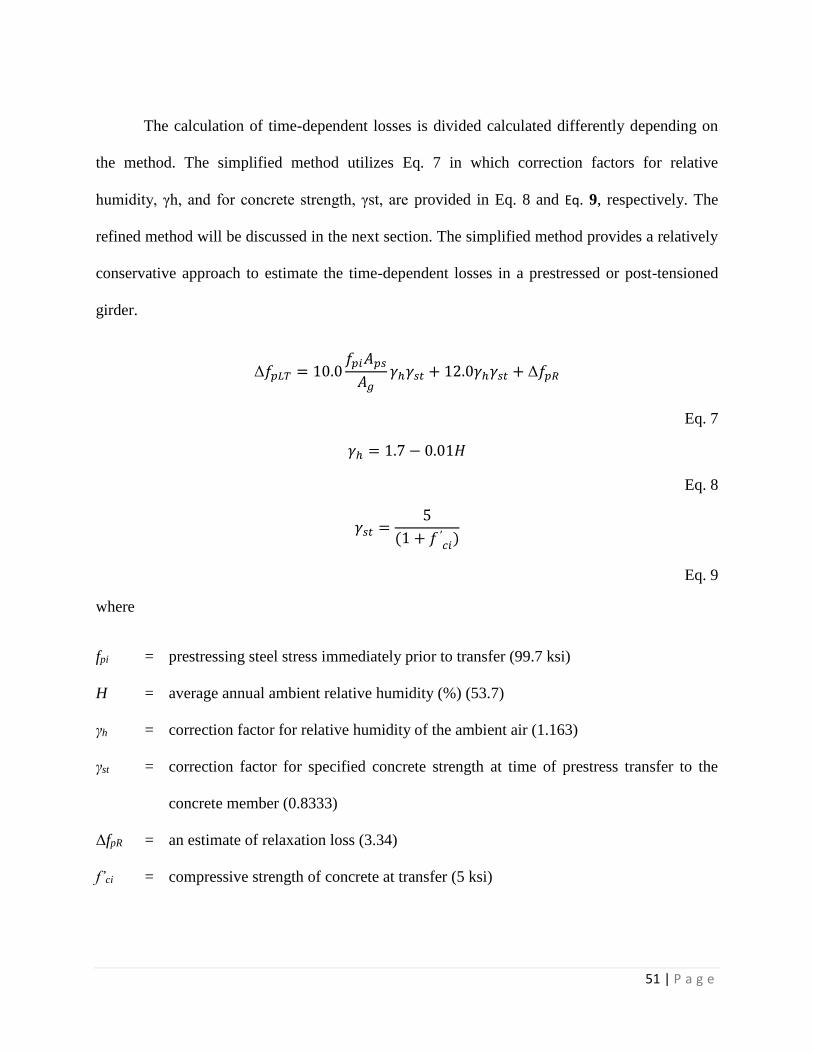
51 | P a g e
The calculation of time-dependent losses is divided calculated differently depending on
the method. The simplified method utilizes Eq. 7 in which correction factors for relative
humidity, γh, and for concrete strength, γst, are provided in Eq. 8 and Eq. 9, respectively. The
refined method will be discussed in the next section. The simplified method provides a relatively
conservative approach to estimate the time-dependent losses in a prestressed or post-tensioned
girder.
Δ𝑓𝑝𝐿𝑇 = 10.0𝑓𝑝𝑖𝐴𝑝𝑠
𝐴𝑔𝛾ℎ𝛾𝑠𝑡 + 12.0𝛾ℎ𝛾𝑠𝑡 + Δ𝑓𝑝𝑅
Eq. 7
𝛾ℎ = 1.7 − 0.01𝐻
Eq. 8
𝛾𝑠𝑡 =5
(1 + 𝑓 ′𝑐𝑖)
Eq. 9
where
fpi = prestressing steel stress immediately prior to transfer (99.7 ksi)
H = average annual ambient relative humidity (%) (53.7)
γh = correction factor for relative humidity of the ambient air (1.163)
γst = correction factor for specified concrete strength at time of prestress transfer to the
concrete member (0.8333)
ΔfpR = an estimate of relaxation loss (3.34)
f’ci = compressive strength of concrete at transfer (5 ksi)
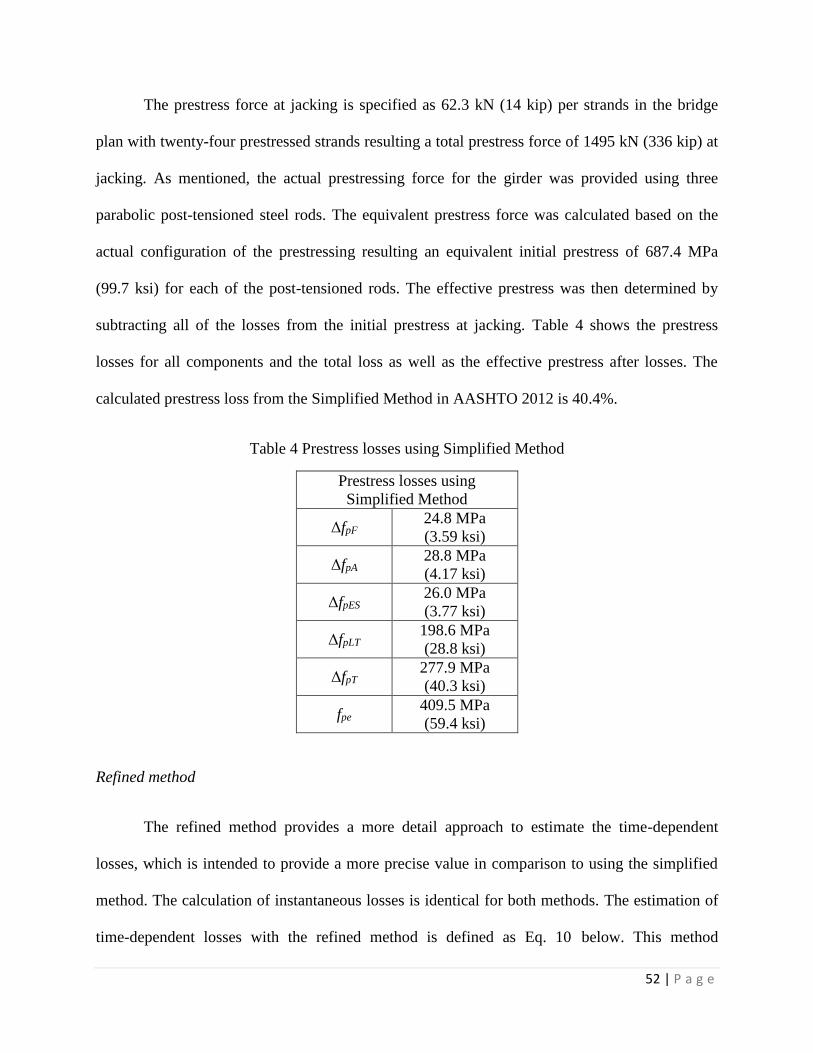
52 | P a g e
The prestress force at jacking is specified as 62.3 kN (14 kip) per strands in the bridge
plan with twenty-four prestressed strands resulting a total prestress force of 1495 kN (336 kip) at
jacking. As mentioned, the actual prestressing force for the girder was provided using three
parabolic post-tensioned steel rods. The equivalent prestress force was calculated based on the
actual configuration of the prestressing resulting an equivalent initial prestress of 687.4 MPa
(99.7 ksi) for each of the post-tensioned rods. The effective prestress was then determined by
subtracting all of the losses from the initial prestress at jacking. Table 4 shows the prestress
losses for all components and the total loss as well as the effective prestress after losses. The
calculated prestress loss from the Simplified Method in AASHTO 2012 is 40.4%.
Table 4 Prestress losses using Simplified Method
Prestress losses using
Simplified Method
ΔfpF 24.8 MPa
(3.59 ksi)
ΔfpA 28.8 MPa
(4.17 ksi)
ΔfpES 26.0 MPa
(3.77 ksi)
ΔfpLT 198.6 MPa
(28.8 ksi)
ΔfpT 277.9 MPa
(40.3 ksi)
fpe 409.5 MPa
(59.4 ksi)
Refined method
The refined method provides a more detail approach to estimate the time-dependent
losses, which is intended to provide a more precise value in comparison to using the simplified
method. The calculation of instantaneous losses is identical for both methods. The estimation of
time-dependent losses with the refined method is defined as Eq. 10 below. This method

53 | P a g e
considers separate two periods of long-term losses. They are the time between transfer and deck
placement, and between deck placement and final time, which correspond to the subscripts id
and df, respectively, in the equation.
Δ𝑓𝑝𝐿𝑇 = (𝛥𝑓𝑝𝑆𝑅 + 𝛥𝑓𝑝𝐶𝑅 + 𝛥𝑓𝑝𝑅1)𝑖𝑑 + (Δ𝑓𝑝𝑆𝐷 + Δ𝑓𝑝𝐶𝐷 + Δ𝑓𝑝𝑅2 − Δ𝑓𝑝𝑆𝑆)𝑑𝑓
Eq. 10
where
ΔfpSR = prestress loss due to shrinkage of girder concrete between transfer and deck
placement
ΔfpCR = prestress loss due to creep of girder concrete between transfer and deck placement
ΔfpR1 = prestress loss due to relaxation of post-tensioning bars between time of transfer and
deck placement
ΔfpR2 = prestress loss due to relaxation of post-tensioning bars in composite section between
time of deck placement and final time
ΔfpSD = prestress loss due to shrinkage of girder concrete between time of deck placement and
final time
ΔfpCD = prestress loss due to creep of girder concrete between time of deck placement and
final time
ΔfpSS = prestress gain due to shrinkage of deck in composite section
The significance of dividing two periods of losses is based on the difference of section
properties at these two periods. Eq. 11, Eq. 12, and Eq. 13 are used to calculate the long-term
prestress losses between transfer and deck placement with the girder-only properties, where Eq.
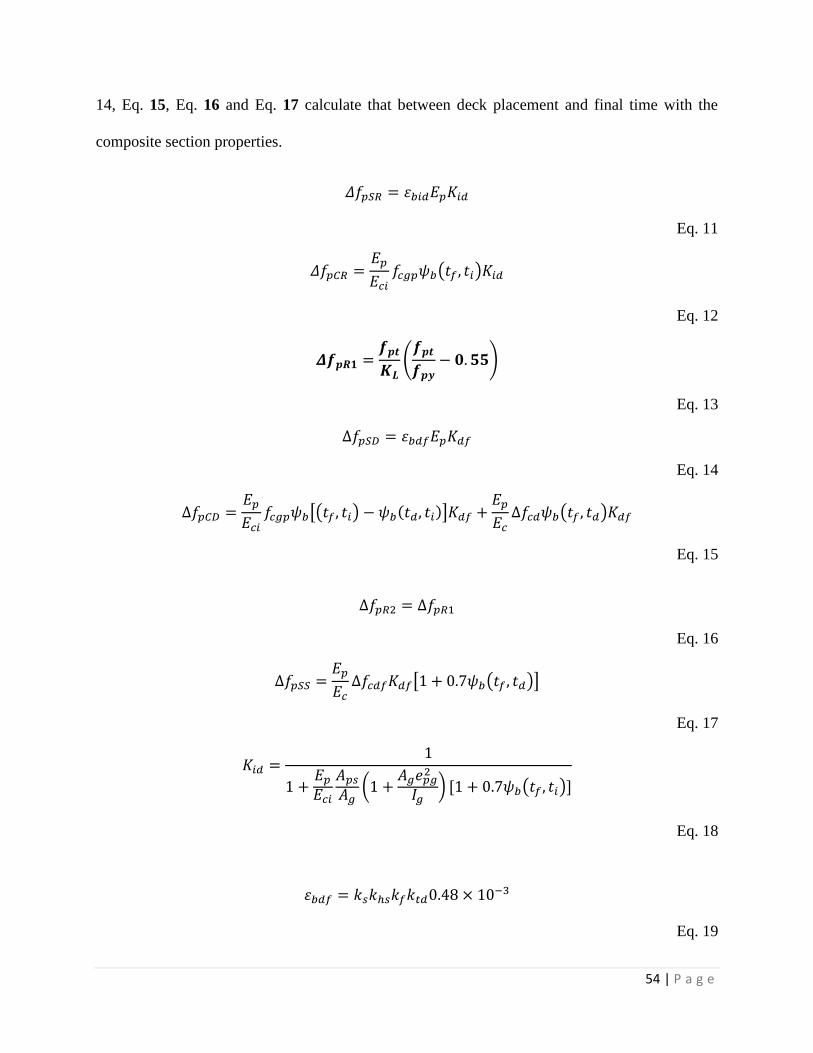
54 | P a g e
14, Eq. 15, Eq. 16 and Eq. 17 calculate that between deck placement and final time with the
composite section properties.
𝛥𝑓𝑝𝑆𝑅 = 𝜀𝑏𝑖𝑑𝐸𝑝𝐾𝑖𝑑
Eq. 11
𝛥𝑓𝑝𝐶𝑅 =𝐸𝑝
𝐸𝑐𝑖𝑓𝑐𝑔𝑝𝜓𝑏(𝑡𝑓 , 𝑡𝑖)𝐾𝑖𝑑
Eq. 12
𝜟𝒇𝒑𝑹𝟏 =𝒇𝒑𝒕
𝑲𝑳(𝒇𝒑𝒕
𝒇𝒑𝒚− 𝟎. 𝟓𝟓)
Eq. 13
∆𝑓𝑝𝑆𝐷 = 𝜀𝑏𝑑𝑓𝐸𝑝𝐾𝑑𝑓
Eq. 14
∆𝑓𝑝𝐶𝐷 =𝐸𝑝
𝐸𝑐𝑖𝑓𝑐𝑔𝑝𝜓𝑏[(𝑡𝑓, 𝑡𝑖) − 𝜓𝑏(𝑡𝑑, 𝑡𝑖)]𝐾𝑑𝑓 +
𝐸𝑝
𝐸𝑐∆𝑓𝑐𝑑𝜓𝑏(𝑡𝑓 , 𝑡𝑑)𝐾𝑑𝑓
Eq. 15
∆𝑓𝑝𝑅2 = ∆𝑓𝑝𝑅1
Eq. 16
∆𝑓𝑝𝑆𝑆 =𝐸𝑝
𝐸𝑐∆𝑓𝑐𝑑𝑓𝐾𝑑𝑓[1 + 0.7𝜓𝑏(𝑡𝑓 , 𝑡𝑑)]
Eq. 17
𝐾𝑖𝑑 =1
1 +𝐸𝑝𝐸𝑐𝑖
𝐴𝑝𝑠𝐴𝑔
(1 +𝐴𝑔𝑒𝑝𝑔2
𝐼𝑔) [1 + 0.7𝜓𝑏(𝑡𝑓 , 𝑡𝑖)]
Eq. 18
𝜀𝑏𝑑𝑓 = 𝑘𝑠𝑘ℎ𝑠𝑘𝑓𝑘𝑡𝑑0.48 × 10⁻³
Eq. 19
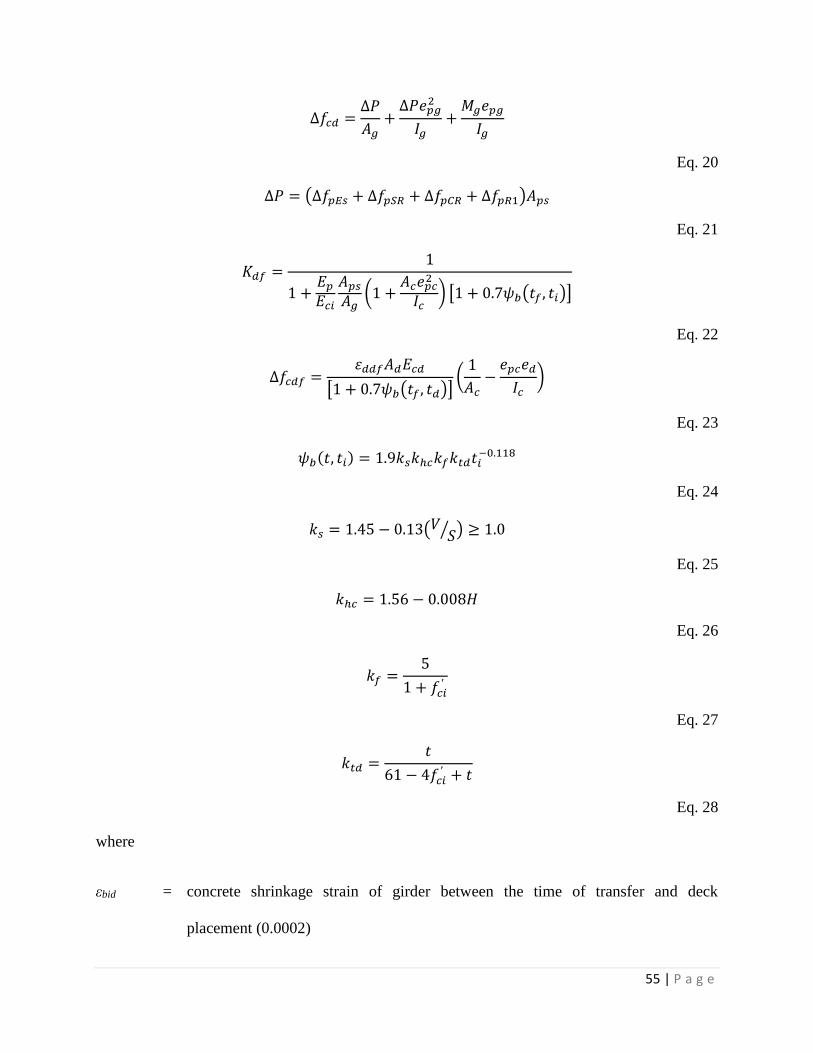
55 | P a g e
∆𝑓𝑐𝑑 =∆𝑃
𝐴𝑔+∆𝑃𝑒𝑝𝑔
2
𝐼𝑔+𝑀𝑔𝑒𝑝𝑔
𝐼𝑔
Eq. 20
∆𝑃 = (∆𝑓𝑝𝐸𝑠 + ∆𝑓𝑝𝑆𝑅 + ∆𝑓𝑝𝐶𝑅 + ∆𝑓𝑝𝑅1)𝐴𝑝𝑠
Eq. 21
𝐾𝑑𝑓 =1
1 +𝐸𝑝𝐸𝑐𝑖
𝐴𝑝𝑠𝐴𝑔
(1 +𝐴𝑐𝑒𝑝𝑐2
𝐼𝑐) [1 + 0.7𝜓𝑏(𝑡𝑓 , 𝑡𝑖)]
Eq. 22
∆𝑓𝑐𝑑𝑓 =𝜀𝑑𝑑𝑓𝐴𝑑𝐸𝑐𝑑
[1 + 0.7𝜓𝑏(𝑡𝑓 , 𝑡𝑑)](1
𝐴𝑐−𝑒𝑝𝑐𝑒𝑑
𝐼𝑐)
Eq. 23
𝜓𝑏(𝑡, 𝑡𝑖) = 1.9𝑘𝑠𝑘ℎ𝑐𝑘𝑓𝑘𝑡𝑑𝑡𝑖−0.118
Eq. 24
𝑘𝑠 = 1.45 − 0.13(𝑉 𝑆⁄ ) ≥ 1.0
Eq. 25
𝑘ℎ𝑐 = 1.56 − 0.008𝐻
Eq. 26
𝑘𝑓 =5
1 + 𝑓𝑐𝑖′
Eq. 27
𝑘𝑡𝑑 =𝑡
61 − 4𝑓𝑐𝑖′ + 𝑡
Eq. 28
where
εbid = concrete shrinkage strain of girder between the time of transfer and deck
placement (0.0002)
56 | P a g e
Kid = transformed section coefficient that accounts for time-dependent interaction
between concrete and bonded steel in the section being considered for time period
between transfer and deck placement (0.8507)
epg = eccentricity of prestressing force with respect to centroid of girder: positive in
common construction where it is below girder centroid (8.34 in.)
fcgp = concrete stresses at the prestressing centroid due to the prestressing force after
jacking and self-weight of the member at the sections of maximum moment (1.65
ksi)
Ψb(tf,, ti) = girder creep coefficient at final time due to loading introduced at transfer
tf = final age (18587 days)
ti = age at transfer (28 days)
td = age at deck placement (56 days)
fpt = stress in prestressing tendons immediately after transfer, taken not less than 0.55fpy
(107.5 ksi)
KL = 30 for low relaxation strands and 7 for other prestressing steel (7.0)
εbdf = shrinkage strain of girder between time of deck placement and final time (0.00022)
Kdf = transformed section coefficient that accounts for time-dependent interaction
between concrete and bonded steel in the section being considered for time period
between deck placement and final time (0.858)
epc = eccentricity of prestressing force with respect to centroid of composite section,
positive in typical construction where prestressing force is below centroid of
section (12.6 in.)
Ac = area of section calculated using the gross composite concrete section properties of

57 | P a g e
the girder and the deck and the deck-to-girder modular ratio (372 in.2)
Ic = moment of inertia of section calculated using the gross composite concrete section
properties of the girder and the deck and the deck-to- girder modular ratio at
service (65218 in.4)
Δfcd = change in concrete stress at centroid of prestressing tendons due to long-term
losses between transfer and deck placement, combined with deck weight and
superimposed loads (0.4 ksi)
Δfcdf = change in concrete stress at centroid of prestressing tendons due to shrinkage of
deck concrete (0.9 ksi)
ΔP = change in prestressing force prior to deck placement (58.6 kip)
Ec = modulus of elasticity of concrete at 28 days strength (4070 ksi)
Ecd = modulus of elasticity of deck concrete (3640 ksi)
Ad = area of deck concrete (504 in.2)
ed = eccentricity of deck with respect to the gross composite section, positive in typical
construction where deck is above girder (7.04 in.)
H = relative humidity (%). In the absence of better information, H may be taken from
Figure 5.4.2.3.3-1 in AASHTO 2012 (53.7)
ks = factor for the effect of the volume-to-surface ratio of the component (1.054)
kf = factor for the effect of concrete strength (0.833)
khc = humidity factor for creep (1.13)
ktd = time development factor (0.406)
t = maturity of concrete (day), defined as age of concrete between time of loading for
creep calculations, or end of curing for shrinkage calculations, and time being
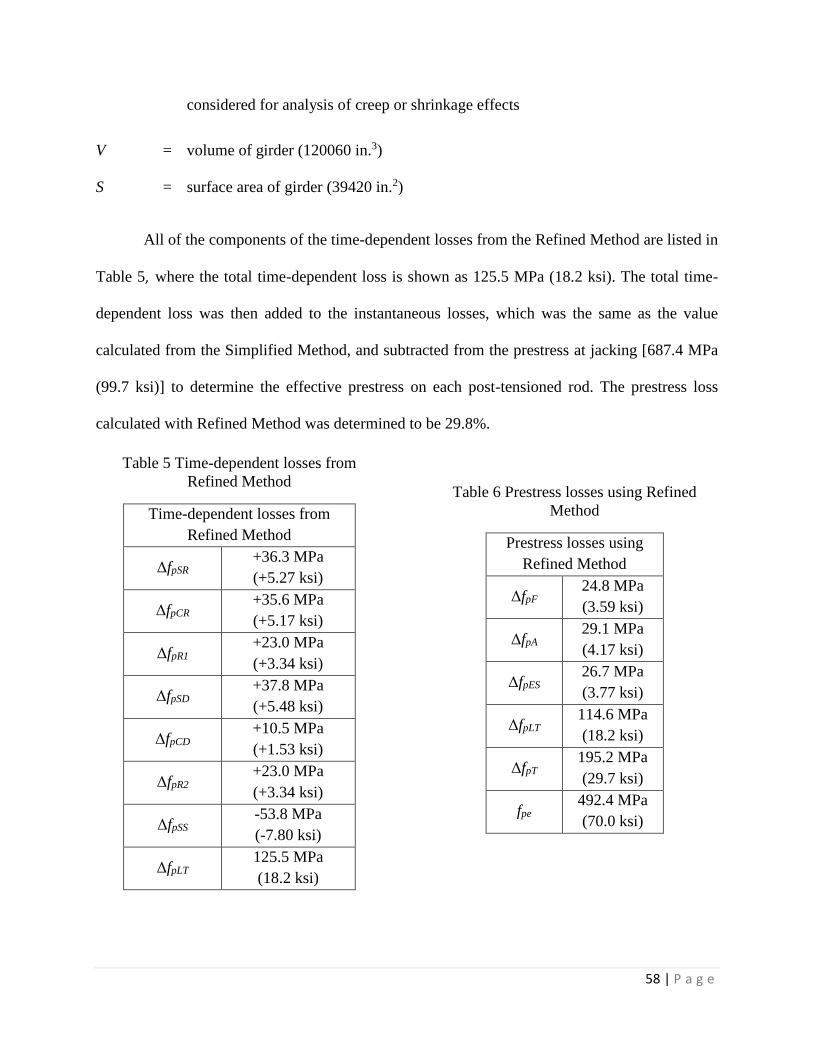
58 | P a g e
considered for analysis of creep or shrinkage effects
V = volume of girder (120060 in.3)
S = surface area of girder (39420 in.2)
All of the components of the time-dependent losses from the Refined Method are listed in
Table 5, where the total time-dependent loss is shown as 125.5 MPa (18.2 ksi). The total time-
dependent loss was then added to the instantaneous losses, which was the same as the value
calculated from the Simplified Method, and subtracted from the prestress at jacking [687.4 MPa
(99.7 ksi)] to determine the effective prestress on each post-tensioned rod. The prestress loss
calculated with Refined Method was determined to be 29.8%.
Table 5 Time-dependent losses from
Refined Method
Time-dependent losses from
Refined Method
ΔfpSR +36.3 MPa
(+5.27 ksi)
ΔfpCR +35.6 MPa
(+5.17 ksi)
ΔfpR1 +23.0 MPa
(+3.34 ksi)
ΔfpSD +37.8 MPa
(+5.48 ksi)
ΔfpCD +10.5 MPa
(+1.53 ksi)
ΔfpR2 +23.0 MPa
(+3.34 ksi)
ΔfpSS -53.8 MPa
(-7.80 ksi)
ΔfpLT 125.5 MPa
(18.2 ksi)
Table 6 Prestress losses using Refined
Method
Prestress losses using
Refined Method
ΔfpF 24.8 MPa
(3.59 ksi)
ΔfpA 29.1 MPa
(4.17 ksi)
ΔfpES 26.7 MPa
(3.77 ksi)
ΔfpLT 114.6 MPa
(18.2 ksi)
ΔfpT 195.2 MPa
(29.7 ksi)
fpe 492.4 MPa
(70.0 ksi)

59 | P a g e
Comparison between AASHTO and Cracking Moment tests for Effective prestress
The average effective prestress based on the cracking moment tests was 457.1 MPa (65.5
ksi). Table 7 shows a comparison between the average measured results and the values from
AASHTO both methods. The effective prestress calculated with AASHTO Simplified method
overestimated the prestress losses. The effective stress is 9.31% lower than the tested average,
which reflects that the simplified method in AASHTO is considered as the more conservative
method as expected. However, the AASHTO Refined Method predicts the calculated effective
prestress of 482.7 MPa (70.0 ksi), which corresponds to a difference of 6.87% higher than the
tested average. The Refined Method in the AASHTO LRFD specifications underestimated the
prestress losses as expected because this method is preferred to be a more precise and less
conservative approach.
Table 7 Comparison on Effective prestress with different methods
Method Calculated Effective
Prestress
% difference from
tested average
Cracking Moment tests 457.1 MPa
(65.5 ksi) N/A
AASHTO Simplified Method 409.5 MPa
(59.4 ksi) -9.31 %
AASHTO Refined Method 482.7 MPa
(70.0 ksi) 6.87%
Moment Capacity
The measured moment capacities for each girder were compared to the calculated value
in accordance to procedures from the AASHTO specification (2012) as well as the finite-element
model using ANSYS. Section 5.7.3.2 in AASHTO 2012 describes the method of calculating
flexural resistance with a prestressed concrete structure. The nominal flexural capacity (Mn) is
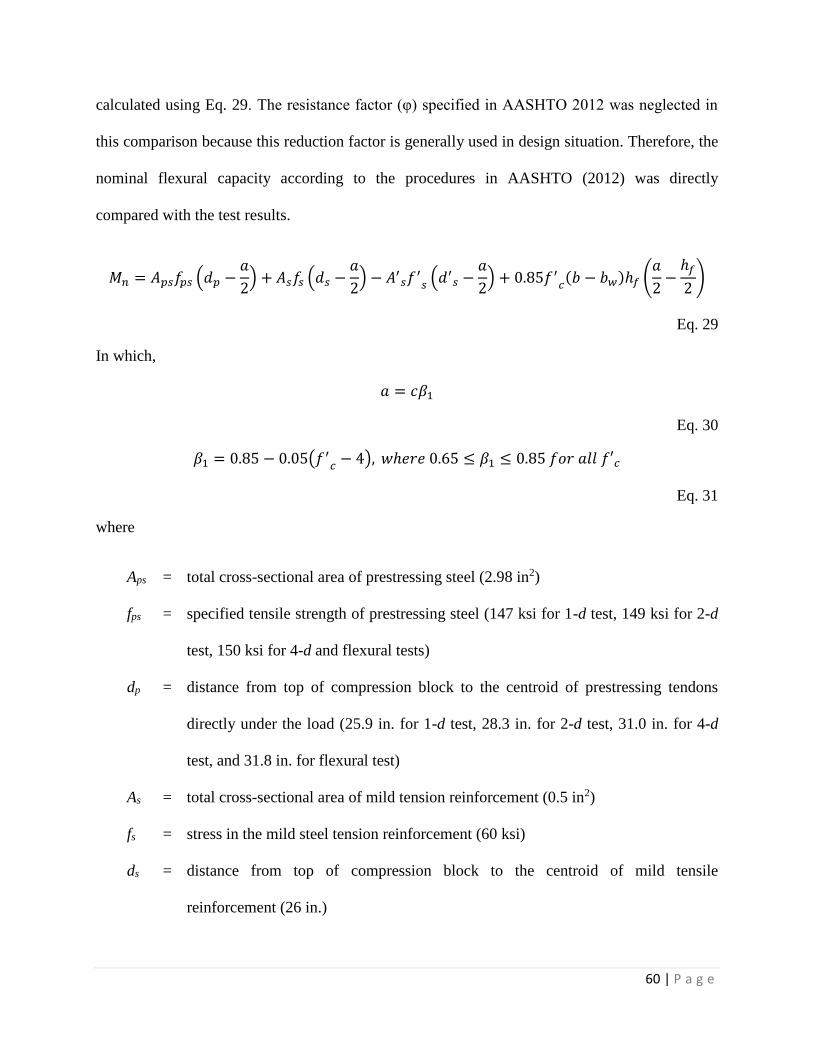
60 | P a g e
calculated using Eq. 29. The resistance factor (φ) specified in AASHTO 2012 was neglected in
this comparison because this reduction factor is generally used in design situation. Therefore, the
nominal flexural capacity according to the procedures in AASHTO (2012) was directly
compared with the test results.
𝑀𝑛 = 𝐴𝑝𝑠𝑓𝑝𝑠 (𝑑𝑝 −𝑎
2) + 𝐴𝑠𝑓𝑠 (𝑑𝑠 −
𝑎
2) − 𝐴′𝑠𝑓
′𝑠(𝑑′𝑠 −
𝑎
2) + 0.85𝑓′
𝑐(𝑏 − 𝑏𝑤)ℎ𝑓 (
𝑎
2−ℎ𝑓
2)
Eq. 29
In which,
𝑎 = 𝑐𝛽1
Eq. 30
𝛽1 = 0.85 − 0.05(𝑓′𝑐− 4), 𝑤ℎ𝑒𝑟𝑒 0.65 ≤ 𝛽1 ≤ 0.85 𝑓𝑜𝑟 𝑎𝑙𝑙 𝑓′𝑐
Eq. 31
where
Aps = total cross-sectional area of prestressing steel (2.98 in2)
fps = specified tensile strength of prestressing steel (147 ksi for 1-d test, 149 ksi for 2-d
test, 150 ksi for 4-d and flexural tests)
dp = distance from top of compression block to the centroid of prestressing tendons
directly under the load (25.9 in. for 1-d test, 28.3 in. for 2-d test, 31.0 in. for 4-d
test, and 31.8 in. for flexural test)
As = total cross-sectional area of mild tension reinforcement (0.5 in2)
fs = stress in the mild steel tension reinforcement (60 ksi)
ds = distance from top of compression block to the centroid of mild tensile
reinforcement (26 in.)
61 | P a g e
A’s = total cross-sectional area of mild compression reinforcement (2 in2)
f’s = stress in the mild steel compression reinforcement (60 ksi)
d’s = distance from top of compression block to the centroid of mild compression
reinforcement (4 in.)
f’c = 28-day compressive strength of deck concrete (6.7 ksi)
b = effective width of the compression face of the member (12 in.)
bw = web width of the member (12 in. for 1-d test, 6 in. for other tests)
hf = compression flange depth (8 in.)
a = depth of the equivalent compressive stress block (5.11 in. for 1-d test, 5.17 in. for
2-d test, 5.22 in. for 4-d test, and 5.24 in. for flexural test)
c = Distance from top of compression block to the neutral axis (7.15 in. for 1-d test,
7.23 in. for 2-d test, 7.30 in. for 4-d test, and 7.32 in. for flexural test)
β1 = stress block factor (0.715)
The nominal flexural capacity was determined by taking the moment about the top of the
cross section and then combining the resultant moment produced from all structural components
in the girder, which are prestressing steel, mild tension reinforcement, mild compression
reinforcement, and the concrete in compression. The location of neutral axis (c) for the study
was determined by Eq. 32. The constant, k, is specified in AASHTO and is dependent on the
yield strength (fpy) and ultimate strength (fpu) of the prestressing steel. The k is defined by Eq. 33
or Table 8. The post-tensioned bar for the tested girder is identified as Type 1, high-strength bar,
which corresponds to a k value of 0.38 according to Table 8. The tensile stress in the post-
tensioned bars during testing for moment capacity is defined by Eq. 34 and it is limited by the
ultimate strength of the steel.
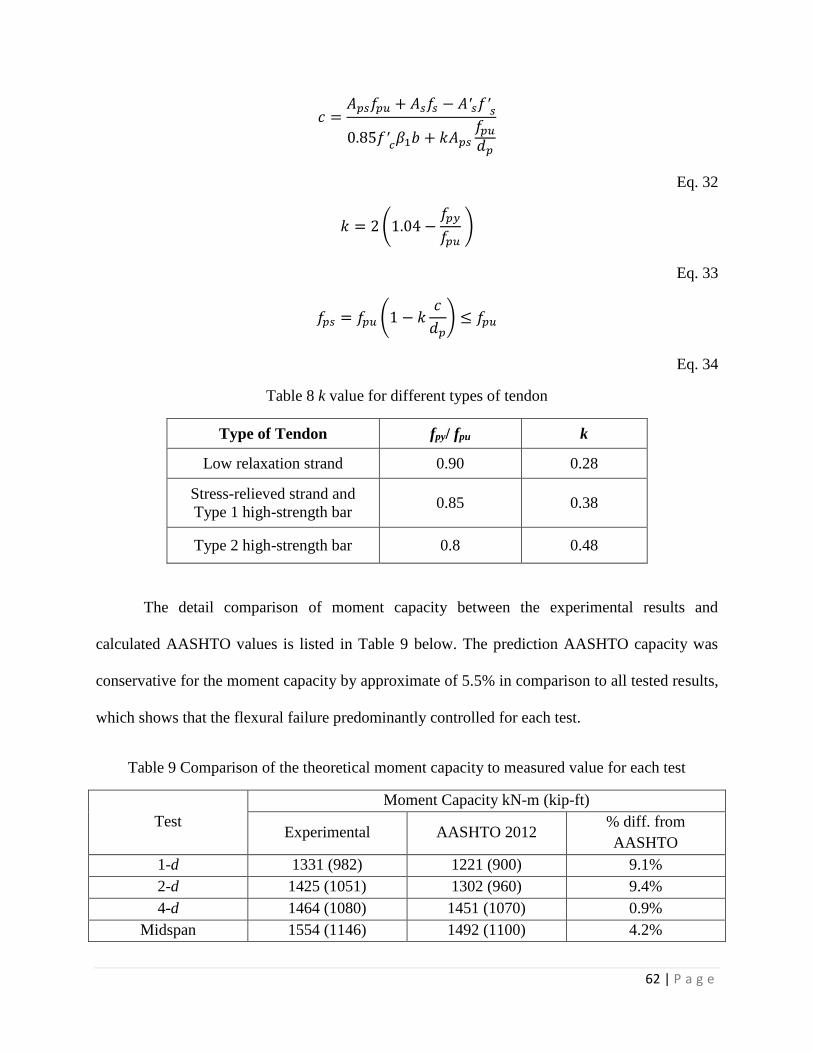
62 | P a g e
𝑐 =𝐴𝑝𝑠𝑓𝑝𝑢 + 𝐴𝑠𝑓𝑠 − 𝐴′𝑠𝑓′
𝑠
0.85𝑓′𝑐𝛽1𝑏 + 𝑘𝐴𝑝𝑠
𝑓𝑝𝑢𝑑𝑝
Eq. 32
𝑘 = 2(1.04 −𝑓𝑝𝑦
𝑓𝑝𝑢 )
Eq. 33
𝑓𝑝𝑠 = 𝑓𝑝𝑢 (1 − 𝑘𝑐
𝑑𝑝) ≤ 𝑓𝑝𝑢
Eq. 34
Table 8 k value for different types of tendon
Type of Tendon fpy/ fpu k
Low relaxation strand 0.90 0.28
Stress-relieved strand and
Type 1 high-strength bar 0.85 0.38
Type 2 high-strength bar 0.8 0.48
The detail comparison of moment capacity between the experimental results and
calculated AASHTO values is listed in Table 9 below. The prediction AASHTO capacity was
conservative for the moment capacity by approximate of 5.5% in comparison to all tested results,
which shows that the flexural failure predominantly controlled for each test.
Table 9 Comparison of the theoretical moment capacity to measured value for each test
Test
Moment Capacity kN-m (kip-ft)
Experimental AASHTO 2012 % diff. from
AASHTO
1-d 1331 (982) 1221 (900) 9.1%
2-d 1425 (1051) 1302 (960) 9.4%
4-d 1464 (1080) 1451 (1070) 0.9%
Midspan 1554 (1146) 1492 (1100) 4.2%
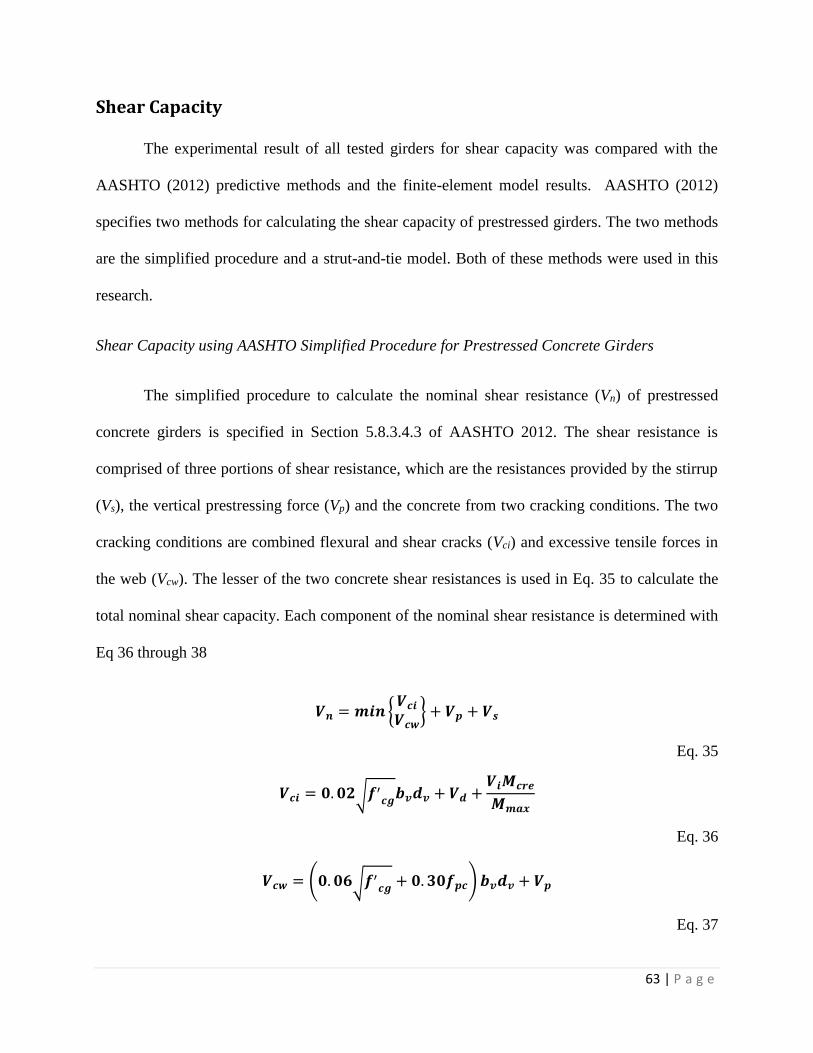
63 | P a g e
Shear Capacity
The experimental result of all tested girders for shear capacity was compared with the
AASHTO (2012) predictive methods and the finite-element model results. AASHTO (2012)
specifies two methods for calculating the shear capacity of prestressed girders. The two methods
are the simplified procedure and a strut-and-tie model. Both of these methods were used in this
research.
Shear Capacity using AASHTO Simplified Procedure for Prestressed Concrete Girders
The simplified procedure to calculate the nominal shear resistance (Vn) of prestressed
concrete girders is specified in Section 5.8.3.4.3 of AASHTO 2012. The shear resistance is
comprised of three portions of shear resistance, which are the resistances provided by the stirrup
(Vs), the vertical prestressing force (Vp) and the concrete from two cracking conditions. The two
cracking conditions are combined flexural and shear cracks (Vci) and excessive tensile forces in
the web (Vcw). The lesser of the two concrete shear resistances is used in Eq. 35 to calculate the
total nominal shear capacity. Each component of the nominal shear resistance is determined with
Eq 36 through 38
𝑽𝒏 = 𝒎𝒊𝒏 {𝑽𝒄𝒊𝑽𝒄𝒘
} + 𝑽𝒑 + 𝑽𝒔
Eq. 35
𝑽𝒄𝒊 = 𝟎. 𝟎𝟐√𝒇′𝒄𝒈𝒃𝒗𝒅𝒗 + 𝑽𝒅 +𝑽𝒊𝑴𝒄𝒓𝒆
𝑴𝒎𝒂𝒙
Eq. 36
𝑽𝒄𝒘 = (𝟎. 𝟎𝟔√𝒇′𝒄𝒈 + 𝟎. 𝟑𝟎𝒇𝒑𝒄)𝒃𝒗𝒅𝒗 + 𝑽𝒑
Eq. 37
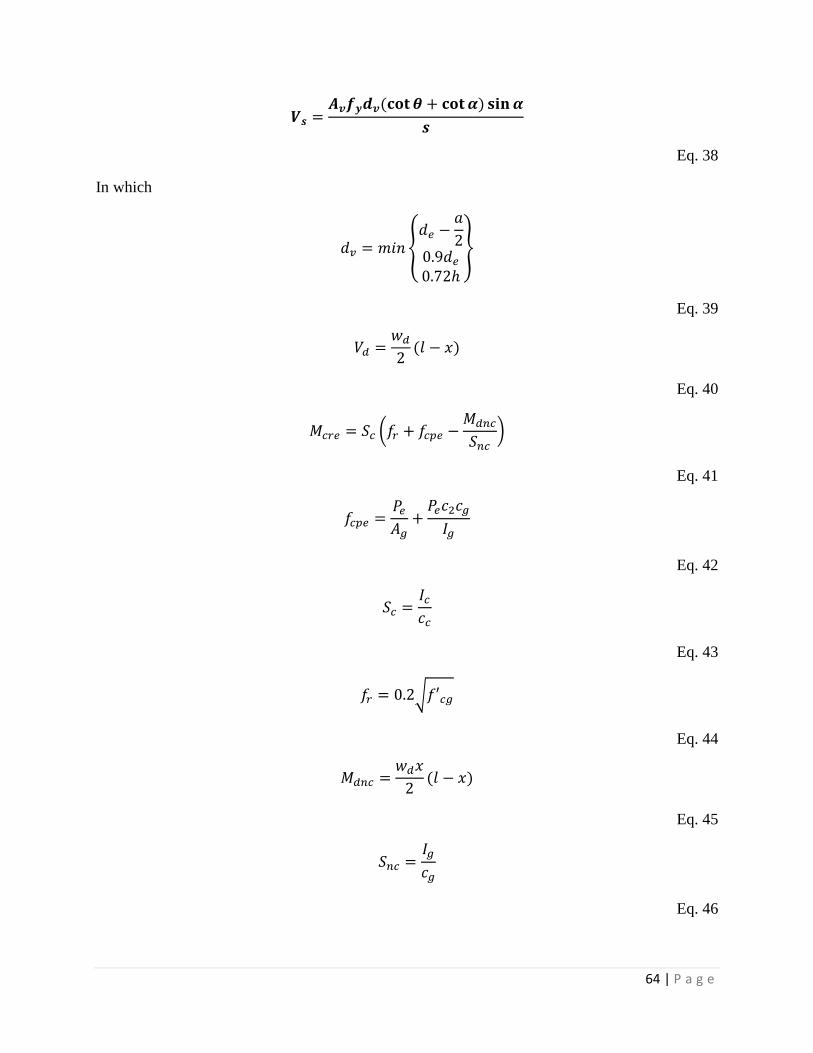
64 | P a g e
𝑽𝒔 =𝑨𝒗𝒇𝒚𝒅𝒗(𝐜𝐨𝐭 𝜽 + 𝐜𝐨𝐭𝜶) 𝐬𝐢𝐧𝜶
𝒔
Eq. 38
In which
𝑑𝑣 = 𝑚𝑖𝑛{𝑑𝑒 −
𝑎
20.9𝑑𝑒0.72ℎ
}
Eq. 39
𝑉𝑑 =𝑤𝑑2(𝑙 − 𝑥)
Eq. 40
𝑀𝑐𝑟𝑒 = 𝑆𝑐 (𝑓𝑟 + 𝑓𝑐𝑝𝑒 −𝑀𝑑𝑛𝑐
𝑆𝑛𝑐)
Eq. 41
𝑓𝑐𝑝𝑒 =𝑃𝑒𝐴𝑔+𝑃𝑒𝑐2𝑐𝑔
𝐼𝑔
Eq. 42
𝑆𝑐 =𝐼𝑐𝑐𝑐
Eq. 43
𝑓𝑟 = 0.2√𝑓′𝑐𝑔
Eq. 44
𝑀𝑑𝑛𝑐 =𝑤𝑑𝑥
2(𝑙 − 𝑥)
Eq. 45
𝑆𝑛𝑐 =𝐼𝑔
𝑐𝑔
Eq. 46
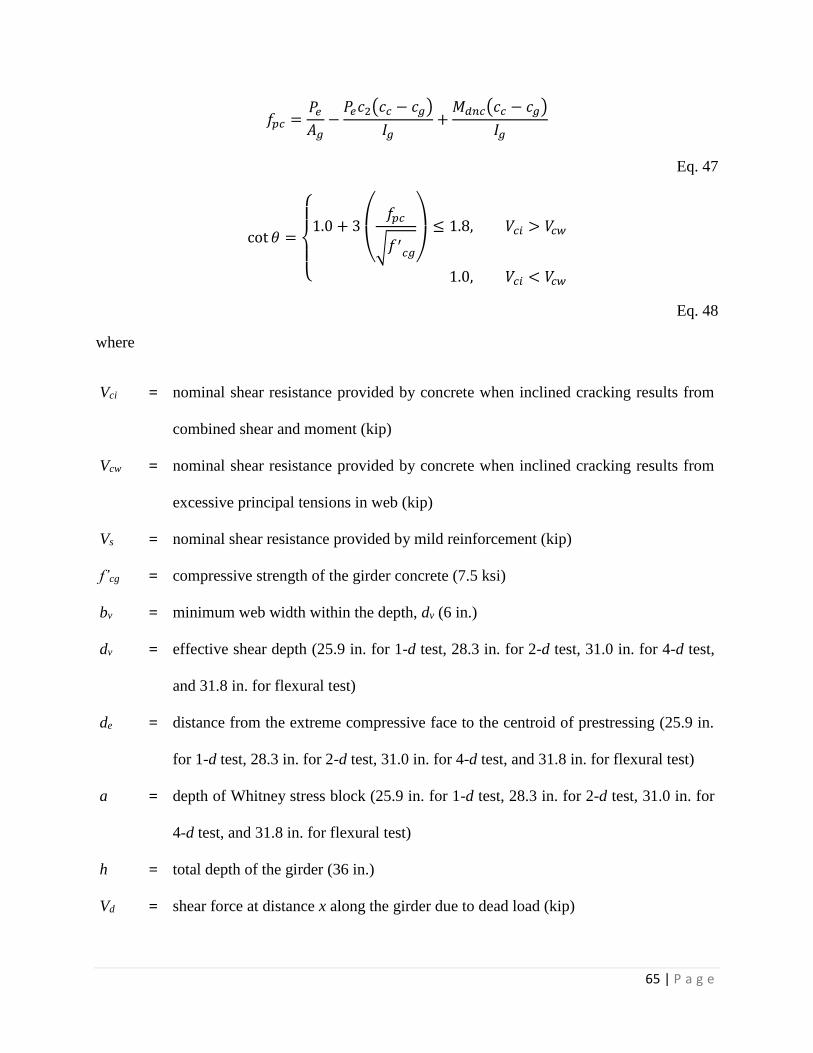
65 | P a g e
𝑓𝑝𝑐 =𝑃𝑒𝐴𝑔−𝑃𝑒𝑐2(𝑐𝑐 − 𝑐𝑔)
𝐼𝑔+𝑀𝑑𝑛𝑐(𝑐𝑐 − 𝑐𝑔)
𝐼𝑔
Eq. 47
cot 𝜃 =
{
1.0 + 3
(
𝑓𝑝𝑐
√𝑓′𝑐𝑔)
≤ 1.8, 𝑉𝑐𝑖 > 𝑉𝑐𝑤
1.0, 𝑉𝑐𝑖 < 𝑉𝑐𝑤
Eq. 48
where
Vci = nominal shear resistance provided by concrete when inclined cracking results from
combined shear and moment (kip)
Vcw = nominal shear resistance provided by concrete when inclined cracking results from
excessive principal tensions in web (kip)
Vs = nominal shear resistance provided by mild reinforcement (kip)
f’cg = compressive strength of the girder concrete (7.5 ksi)
bv = minimum web width within the depth, dv (6 in.)
dv = effective shear depth (25.9 in. for 1-d test, 28.3 in. for 2-d test, 31.0 in. for 4-d test,
and 31.8 in. for flexural test)
de = distance from the extreme compressive face to the centroid of prestressing (25.9 in.
for 1-d test, 28.3 in. for 2-d test, 31.0 in. for 4-d test, and 31.8 in. for flexural test)
a = depth of Whitney stress block (25.9 in. for 1-d test, 28.3 in. for 2-d test, 31.0 in. for
4-d test, and 31.8 in. for flexural test)
h = total depth of the girder (36 in.)
Vd = shear force at distance x along the girder due to dead load (kip)
66 | P a g e
Vi = shear force at distance x along the girder due to externally applied loads (kip)
Mcre = cracking moment (25.9 in. for 1-d test, 28.3 in. for 2-d test, 31.0 in. for 4-d test, and
31.8 in. for flexural test)
Mmax = maximum moment along the girder due to externally applied loads (kip-ft)
Sc = section modulus of the composite section (2780 in.3)
Snc = section modulus of the non-composite section (1807 in.3)
Ic = moment of inertia of composite section (47739 in.4)
Ig = moment of inertia of non-composite section (22750 in.4)
cc = distance from the bottom of the girder to the composite neutral axis (17.17 in.)
cg = distance from the bottom of the girder to the non-composite neutral axis (12.59 in.)
fcpe = compressive stress in concrete due to effective prestress forces (ksi)
Mdnc = moment due to dead load acting on the non-composite section (kip-ft)
fr = modulus of rupture of concrete (0.58 ksi)
fpc = compressive stress in concrete after all prestress losses occurred at the composite
centroid (ksi)
Pe = effective prestress force after all prestress losses occurred (199.7 kip)
c2 = distance from the centroid of prestressing to the girder neutral axis (in.)
Vp = vertical component of the effective prestress force (25.9 in. for 1-d test, 28.3 in. for
2-d test, 31.0 in. for 4-d test, and 31.8 in. for flexural test)
wd = uniform distributed dead load along the girder (0.387 kip/ft)
x = distance from the center of near support to the center of applied load (in.)
l = distance between supports (35.25 ft)
Av = area of shear reinforcement within a distance s (in.2)
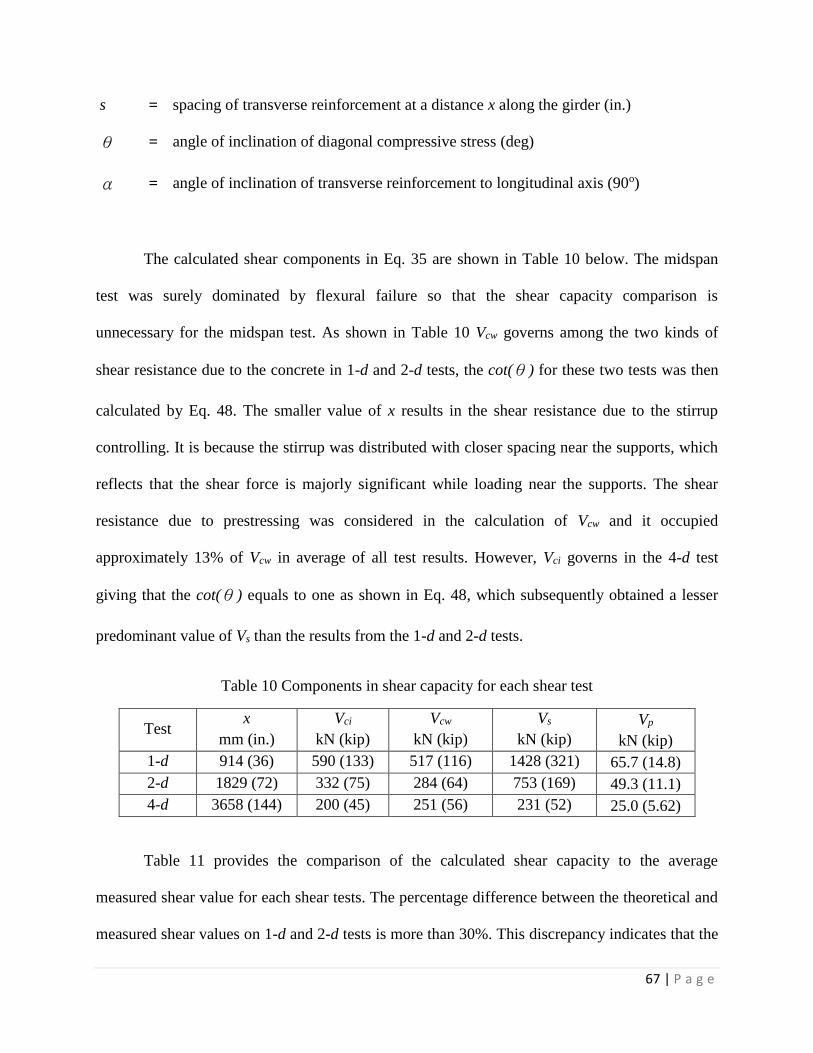
67 | P a g e
s = spacing of transverse reinforcement at a distance x along the girder (in.)
θ = angle of inclination of diagonal compressive stress (deg)
α = angle of inclination of transverse reinforcement to longitudinal axis (90o)
The calculated shear components in Eq. 35 are shown in Table 10 below. The midspan
test was surely dominated by flexural failure so that the shear capacity comparison is
unnecessary for the midspan test. As shown in Table 10 Vcw governs among the two kinds of
shear resistance due to the concrete in 1-d and 2-d tests, the cot(θ) for these two tests was then
calculated by Eq. 48. The smaller value of x results in the shear resistance due to the stirrup
controlling. It is because the stirrup was distributed with closer spacing near the supports, which
reflects that the shear force is majorly significant while loading near the supports. The shear
resistance due to prestressing was considered in the calculation of Vcw and it occupied
approximately 13% of Vcw in average of all test results. However, Vci governs in the 4-d test
giving that the cot(θ) equals to one as shown in Eq. 48, which subsequently obtained a lesser
predominant value of Vs than the results from the 1-d and 2-d tests.
Table 10 Components in shear capacity for each shear test
Test x
mm (in.)
Vci
kN (kip)
Vcw
kN (kip)
Vs
kN (kip)
Vp
kN (kip)
1-d 914 (36) 590 (133) 517 (116) 1428 (321) 65.7 (14.8)
2-d 1829 (72) 332 (75) 284 (64) 753 (169) 49.3 (11.1)
4-d 3658 (144) 200 (45) 251 (56) 231 (52) 25.0 (5.62)
Table 11 provides the comparison of the calculated shear capacity to the average
measured shear value for each shear tests. The percentage difference between the theoretical and
measured shear values on 1-d and 2-d tests is more than 30%. This discrepancy indicates that the
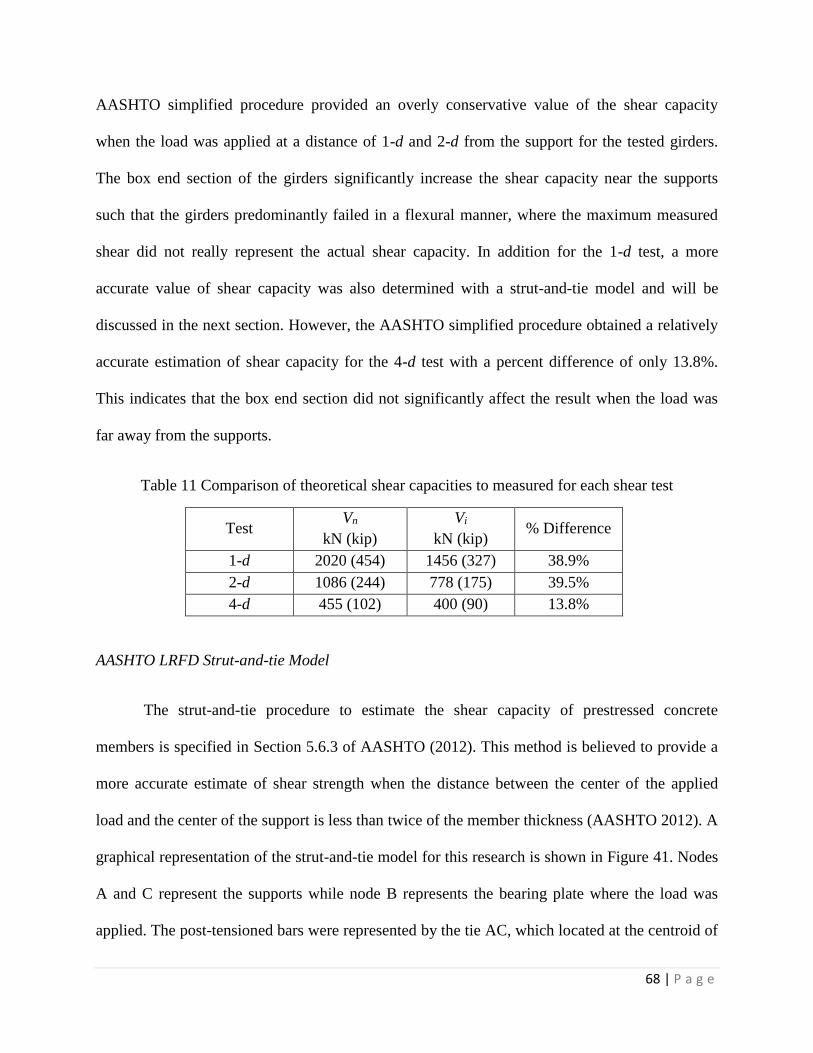
68 | P a g e
AASHTO simplified procedure provided an overly conservative value of the shear capacity
when the load was applied at a distance of 1-d and 2-d from the support for the tested girders.
The box end section of the girders significantly increase the shear capacity near the supports
such that the girders predominantly failed in a flexural manner, where the maximum measured
shear did not really represent the actual shear capacity. In addition for the 1-d test, a more
accurate value of shear capacity was also determined with a strut-and-tie model and will be
discussed in the next section. However, the AASHTO simplified procedure obtained a relatively
accurate estimation of shear capacity for the 4-d test with a percent difference of only 13.8%.
This indicates that the box end section did not significantly affect the result when the load was
far away from the supports.
Table 11 Comparison of theoretical shear capacities to measured for each shear test
Test Vn
kN (kip)
Vi
kN (kip) % Difference
1-d 2020 (454) 1456 (327) 38.9%
2-d 1086 (244) 778 (175) 39.5%
4-d 455 (102) 400 (90) 13.8%
AASHTO LRFD Strut-and-tie Model
The strut-and-tie procedure to estimate the shear capacity of prestressed concrete
members is specified in Section 5.6.3 of AASHTO (2012). This method is believed to provide a
more accurate estimate of shear strength when the distance between the center of the applied
load and the center of the support is less than twice of the member thickness (AASHTO 2012). A
graphical representation of the strut-and-tie model for this research is shown in Figure 41. Nodes
A and C represent the supports while node B represents the bearing plate where the load was
applied. The post-tensioned bars were represented by the tie AC, which located at the centroid of
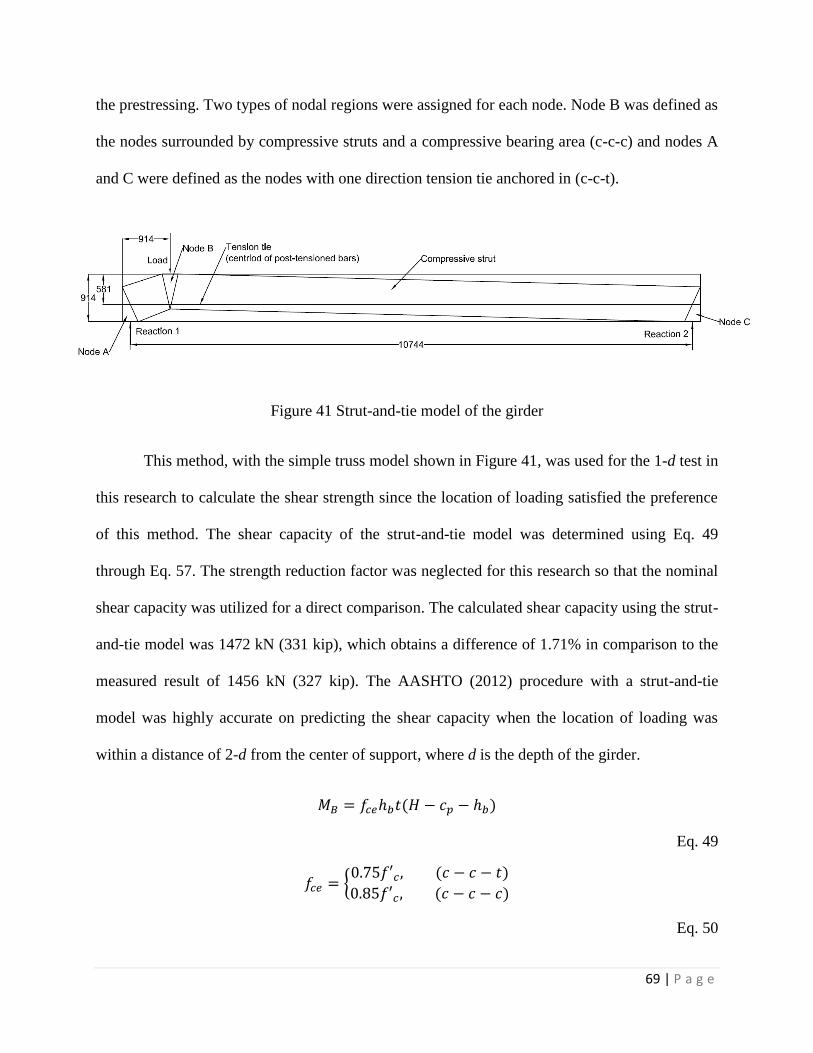
69 | P a g e
the prestressing. Two types of nodal regions were assigned for each node. Node B was defined as
the nodes surrounded by compressive struts and a compressive bearing area (c-c-c) and nodes A
and C were defined as the nodes with one direction tension tie anchored in (c-c-t).
Figure 41 Strut-and-tie model of the girder
This method, with the simple truss model shown in Figure 41, was used for the 1-d test in
this research to calculate the shear strength since the location of loading satisfied the preference
of this method. The shear capacity of the strut-and-tie model was determined using Eq. 49
through Eq. 57. The strength reduction factor was neglected for this research so that the nominal
shear capacity was utilized for a direct comparison. The calculated shear capacity using the strut-
and-tie model was 1472 kN (331 kip), which obtains a difference of 1.71% in comparison to the
measured result of 1456 kN (327 kip). The AASHTO (2012) procedure with a strut-and-tie
model was highly accurate on predicting the shear capacity when the location of loading was
within a distance of 2-d from the center of support, where d is the depth of the girder.
𝑀𝐵 = 𝑓𝑐𝑒ℎ𝑏𝑡(𝐻 − 𝑐𝑝 − ℎ𝑏)
Eq. 49
𝑓𝑐𝑒 = {0.75𝑓′𝑐, (𝑐 − 𝑐 − 𝑡)
0.85𝑓′𝑐, (𝑐 − 𝑐 − 𝑐)
Eq. 50
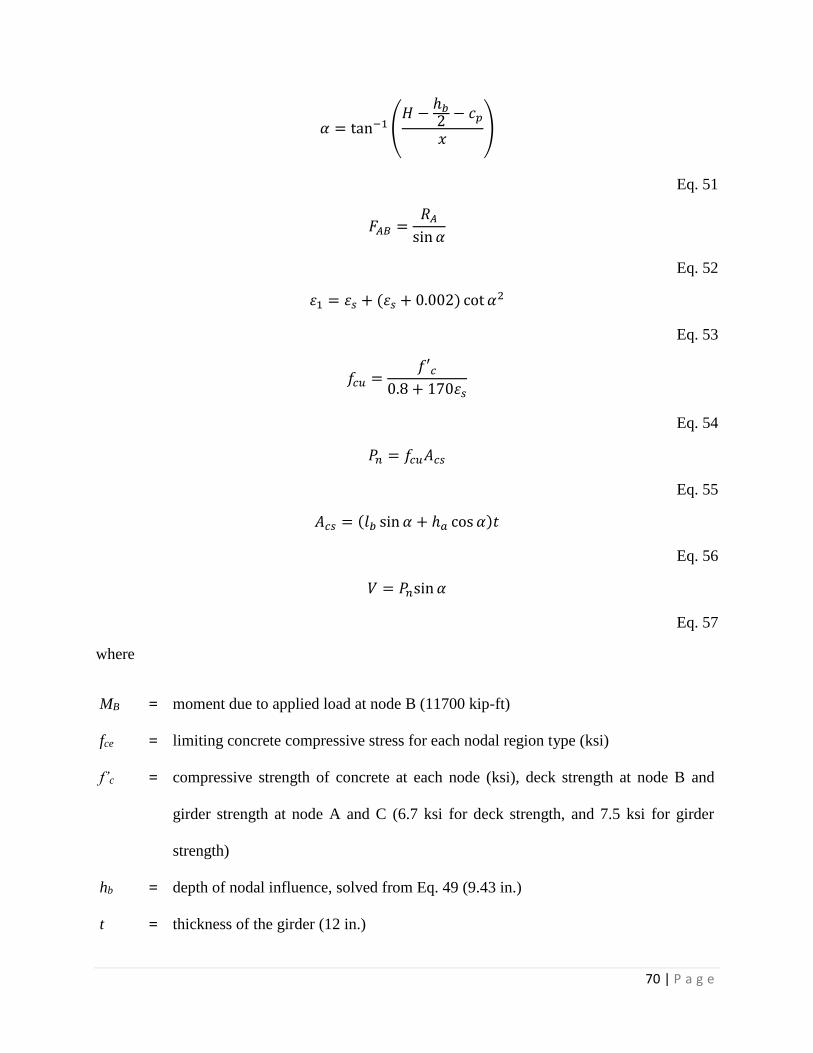
70 | P a g e
𝛼 = tan−1(𝐻 −
ℎ𝑏2 − 𝑐𝑝
𝑥)
Eq. 51
𝐹𝐴𝐵 =𝑅𝐴sin 𝛼
Eq. 52
𝜀1 = 𝜀𝑠 + (𝜀𝑠 + 0.002) cot 𝛼2
Eq. 53
𝑓𝑐𝑢 =𝑓′𝑐
0.8 + 170𝜀𝑠
Eq. 54
𝑃𝑛 = 𝑓𝑐𝑢𝐴𝑐𝑠
Eq. 55
𝐴𝑐𝑠 = (𝑙𝑏 sin 𝛼 + ℎ𝑎 cos 𝛼)𝑡
Eq. 56
𝑉 = 𝑃𝑛sin 𝛼
Eq. 57
where
MB = moment due to applied load at node B (11700 kip-ft)
fce = limiting concrete compressive stress for each nodal region type (ksi)
f’c = compressive strength of concrete at each node (ksi), deck strength at node B and
girder strength at node A and C (6.7 ksi for deck strength, and 7.5 ksi for girder
strength)
hb = depth of nodal influence, solved from Eq. 49 (9.43 in.)
t = thickness of the girder (12 in.)
71 | P a g e
H = total depth of the girder (36 in.)
cp = distance from bottom of the girder to centroid of the prestressing (13.125 in.)
α = angle between strut AB to tie AC (26.8o)
x = distance from center of the support to center of the applied load (36 in.)
FAB = axial compressive force in strut AB (722 kip)
RA = reaction force at node A due to loading at node B
ε1 = principal tensile strain in cracked concrete due to applied loads (0.0161)
εs = tensile strain in concrete in the dircection of tie AC (0.00165)
fcu = limiting concrete compressive stress (2.12 ksi)
Pn = nominal concrete compressive force in strut AB (735 kip)
Acs = effective cross-sectional area of the strut (346 in.2)
lb = width of the bearing plate at node A (12 in.)
ha = twice of cp (26.25 in.)
V = nominal shear capacity of the girder (331 kip)
The AASHTO 2012 Simplified Procedure discussed in previous section overpredicted
shear capacity for this research. The box end section of the tested girders significantly increased
the shear capacity of the girder near the reaction. It is believed that this is because the girder
predominantly failed in flexure, where the measured shear capacity was not representative for the
actual shear capacity. However, the strut-and-tie model still provided an accurate prediction on
the shear capacity for the 1-d test.
72 | P a g e
Finite Element Modeling
ANSYS Mechanical 13.0 was the finite element modeling software used for this research
to demonstrate and analyze the nonlinear behavior of the girders. Finite element modeling is a
way to accurately analyze the behavior of a mechanism by discretizing the model into small
elements with a finite size, then performing an analysis on each element until all results
converge. ANSYS was utilized for this research to replicate the physical testing and provide a
computerized analysis on each girder for additional comparison of results.
For this research, an identical finite-element model was used to perform each test, which
are the 1-d, 2-d, 4-d, and flexural tests. Each analysis was performed by changing the location of
the applied load to the location of the corresponding experiment. ANSYS can be operated by
either utilizing the Graphical User Interface (GUI) or by inputting commands. For this research,
the entire preprocessing procedure was performed by using the command option, where the post-
processing procedure was performed using the GUI. The preprocessing procedure involved an
iterative process to create an optimized model. A text file was then created to save all the
commands to conveniently iterate the procedure by importing the commands directly from the
text file. The command text file is shown in Appendix C.
At the beginning of the preprocessing, 3-D solid volumes were needed to model the
prototype of the girder. There are many predefined commands to create volumes. Two ways
were used in this research. Volumes were created by connecting “keypoints” or using a
predefined command in ANSYS called “BLOCK”. However, the command “BLOCK” is limited
to create hexahedral volumes only. Therefore, this command was applied when only creating the
prototype of steel plates and the decking. Keypoints were defined with a coordinate in x, y, and z
direction and a user defined number for being called out during the entire procedure. At least
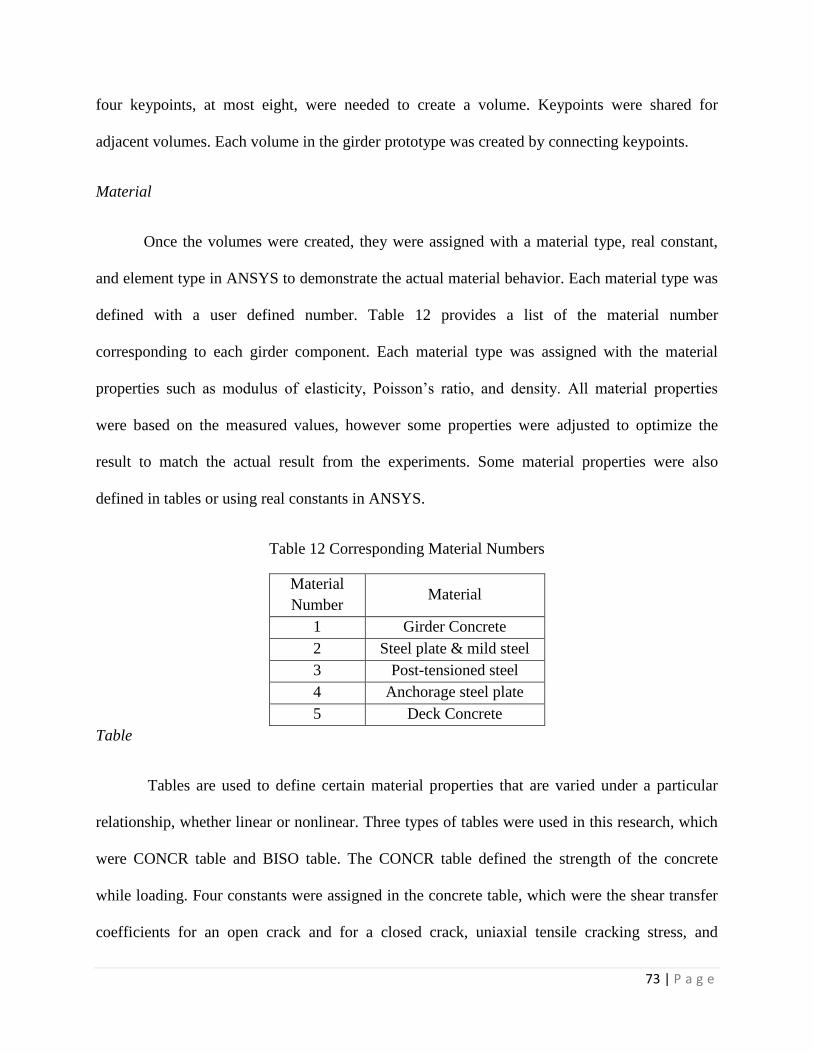
73 | P a g e
four keypoints, at most eight, were needed to create a volume. Keypoints were shared for
adjacent volumes. Each volume in the girder prototype was created by connecting keypoints.
Material
Once the volumes were created, they were assigned with a material type, real constant,
and element type in ANSYS to demonstrate the actual material behavior. Each material type was
defined with a user defined number. Table 12 provides a list of the material number
corresponding to each girder component. Each material type was assigned with the material
properties such as modulus of elasticity, Poisson’s ratio, and density. All material properties
were based on the measured values, however some properties were adjusted to optimize the
result to match the actual result from the experiments. Some material properties were also
defined in tables or using real constants in ANSYS.
Table 12 Corresponding Material Numbers
Material
Number Material
1 Girder Concrete
2 Steel plate & mild steel
3 Post-tensioned steel
4 Anchorage steel plate
5 Deck Concrete
Table
Tables are used to define certain material properties that are varied under a particular
relationship, whether linear or nonlinear. Three types of tables were used in this research, which
were CONCR table and BISO table. The CONCR table defined the strength of the concrete
while loading. Four constants were assigned in the concrete table, which were the shear transfer
coefficients for an open crack and for a closed crack, uniaxial tensile cracking stress, and
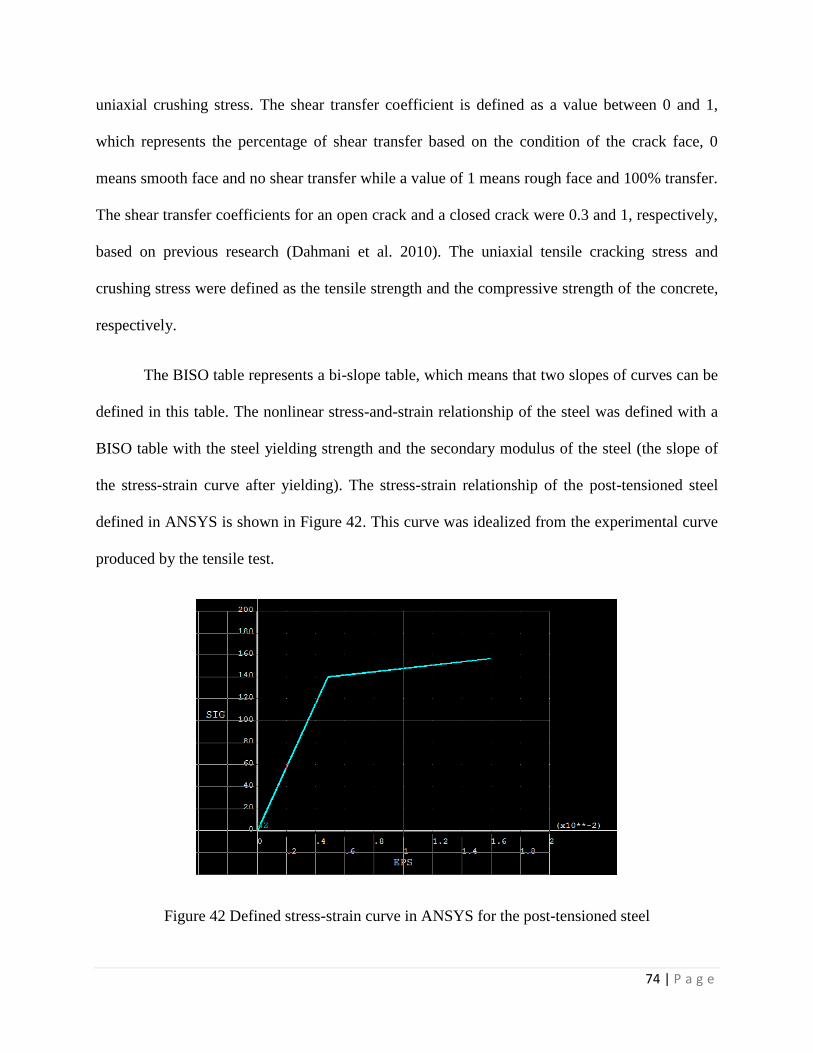
74 | P a g e
uniaxial crushing stress. The shear transfer coefficient is defined as a value between 0 and 1,
which represents the percentage of shear transfer based on the condition of the crack face, 0
means smooth face and no shear transfer while a value of 1 means rough face and 100% transfer.
The shear transfer coefficients for an open crack and a closed crack were 0.3 and 1, respectively,
based on previous research (Dahmani et al. 2010). The uniaxial tensile cracking stress and
crushing stress were defined as the tensile strength and the compressive strength of the concrete,
respectively.
The BISO table represents a bi-slope table, which means that two slopes of curves can be
defined in this table. The nonlinear stress-and-strain relationship of the steel was defined with a
BISO table with the steel yielding strength and the secondary modulus of the steel (the slope of
the stress-strain curve after yielding). The stress-strain relationship of the post-tensioned steel
defined in ANSYS is shown in Figure 42. This curve was idealized from the experimental curve
produced by the tensile test.
Figure 42 Defined stress-strain curve in ANSYS for the post-tensioned steel
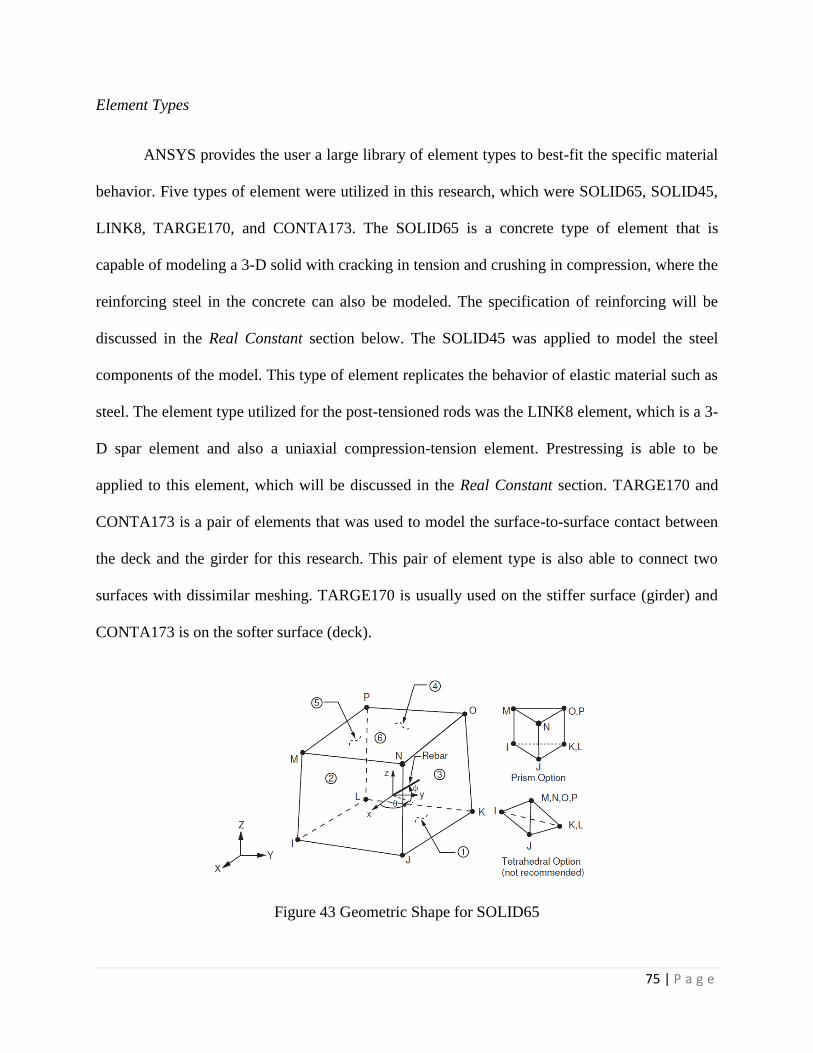
75 | P a g e
Element Types
ANSYS provides the user a large library of element types to best-fit the specific material
behavior. Five types of element were utilized in this research, which were SOLID65, SOLID45,
LINK8, TARGE170, and CONTA173. The SOLID65 is a concrete type of element that is
capable of modeling a 3-D solid with cracking in tension and crushing in compression, where the
reinforcing steel in the concrete can also be modeled. The specification of reinforcing will be
discussed in the Real Constant section below. The SOLID45 was applied to model the steel
components of the model. This type of element replicates the behavior of elastic material such as
steel. The element type utilized for the post-tensioned rods was the LINK8 element, which is a 3-
D spar element and also a uniaxial compression-tension element. Prestressing is able to be
applied to this element, which will be discussed in the Real Constant section. TARGE170 and
CONTA173 is a pair of elements that was used to model the surface-to-surface contact between
the deck and the girder for this research. This pair of element type is also able to connect two
surfaces with dissimilar meshing. TARGE170 is usually used on the stiffer surface (girder) and
CONTA173 is on the softer surface (deck).
Figure 43 Geometric Shape for SOLID65
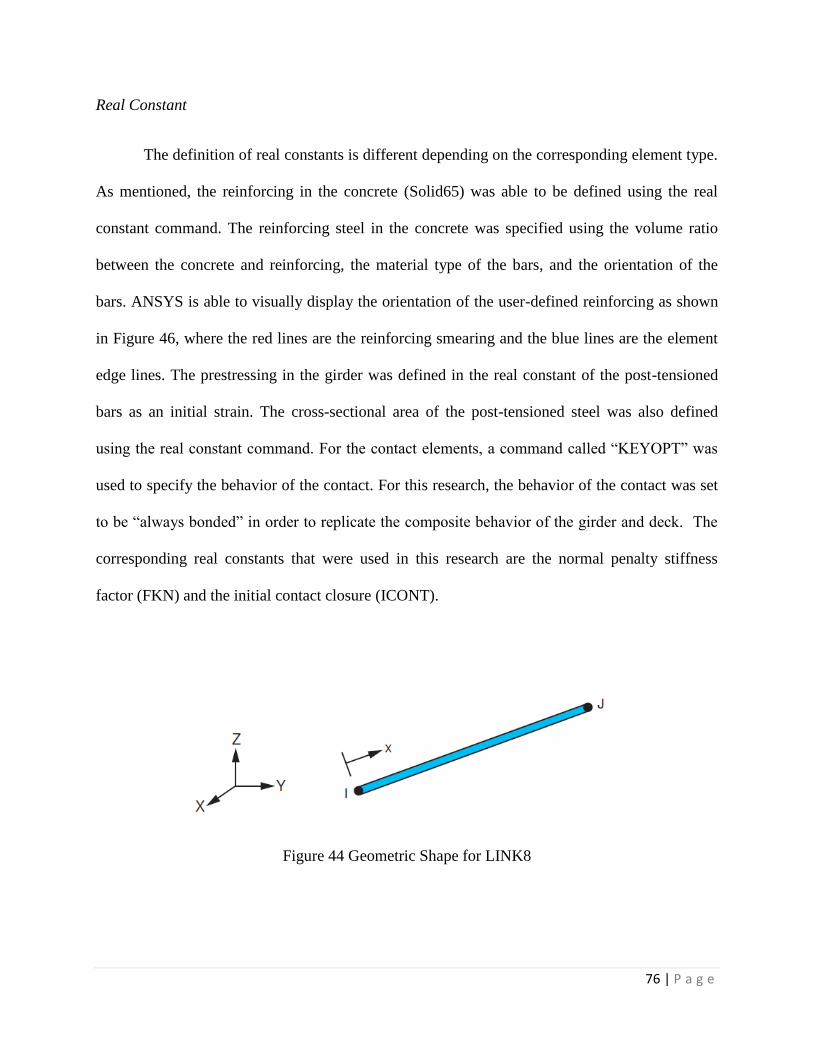
76 | P a g e
Real Constant
The definition of real constants is different depending on the corresponding element type.
As mentioned, the reinforcing in the concrete (Solid65) was able to be defined using the real
constant command. The reinforcing steel in the concrete was specified using the volume ratio
between the concrete and reinforcing, the material type of the bars, and the orientation of the
bars. ANSYS is able to visually display the orientation of the user-defined reinforcing as shown
in Figure 46, where the red lines are the reinforcing smearing and the blue lines are the element
edge lines. The prestressing in the girder was defined in the real constant of the post-tensioned
bars as an initial strain. The cross-sectional area of the post-tensioned steel was also defined
using the real constant command. For the contact elements, a command called “KEYOPT” was
used to specify the behavior of the contact. For this research, the behavior of the contact was set
to be “always bonded” in order to replicate the composite behavior of the girder and deck. The
corresponding real constants that were used in this research are the normal penalty stiffness
factor (FKN) and the initial contact closure (ICONT).
Figure 44 Geometric Shape for LINK8
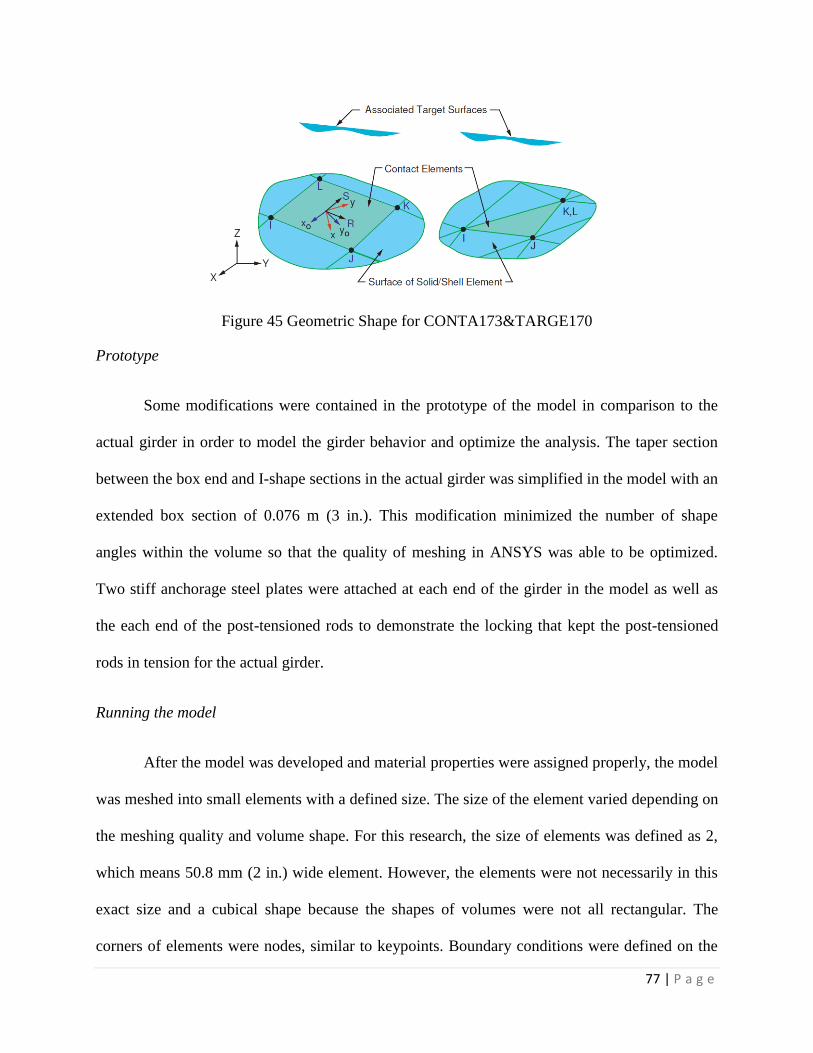
77 | P a g e
Figure 45 Geometric Shape for CONTA173&TARGE170
Prototype
Some modifications were contained in the prototype of the model in comparison to the
actual girder in order to model the girder behavior and optimize the analysis. The taper section
between the box end and I-shape sections in the actual girder was simplified in the model with an
extended box section of 0.076 m (3 in.). This modification minimized the number of shape
angles within the volume so that the quality of meshing in ANSYS was able to be optimized.
Two stiff anchorage steel plates were attached at each end of the girder in the model as well as
the each end of the post-tensioned rods to demonstrate the locking that kept the post-tensioned
rods in tension for the actual girder.
Running the model
After the model was developed and material properties were assigned properly, the model
was meshed into small elements with a defined size. The size of the element varied depending on
the meshing quality and volume shape. For this research, the size of elements was defined as 2,
which means 50.8 mm (2 in.) wide element. However, the elements were not necessarily in this
exact size and a cubical shape because the shapes of volumes were not all rectangular. The
corners of elements were nodes, similar to keypoints. Boundary conditions were defined on the
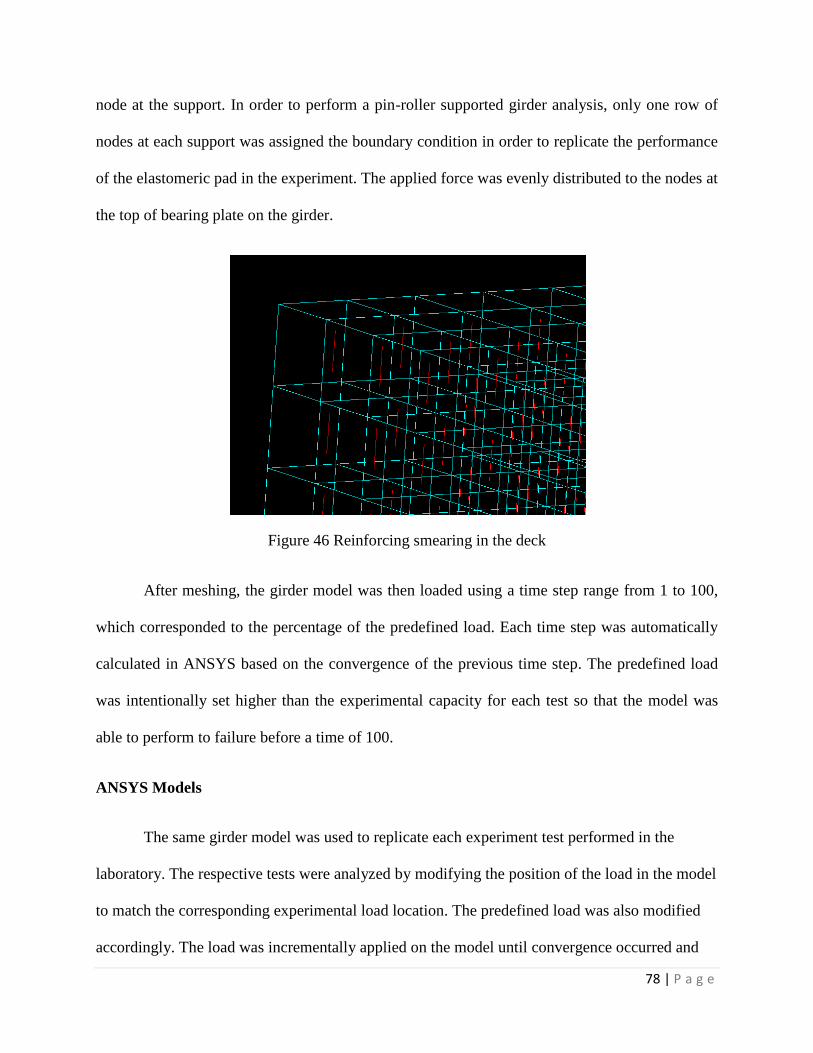
78 | P a g e
node at the support. In order to perform a pin-roller supported girder analysis, only one row of
nodes at each support was assigned the boundary condition in order to replicate the performance
of the elastomeric pad in the experiment. The applied force was evenly distributed to the nodes at
the top of bearing plate on the girder.
Figure 46 Reinforcing smearing in the deck
After meshing, the girder model was then loaded using a time step range from 1 to 100,
which corresponded to the percentage of the predefined load. Each time step was automatically
calculated in ANSYS based on the convergence of the previous time step. The predefined load
was intentionally set higher than the experimental capacity for each test so that the model was
able to perform to failure before a time of 100.
ANSYS Models
The same girder model was used to replicate each experiment test performed in the
laboratory. The respective tests were analyzed by modifying the position of the load in the model
to match the corresponding experimental load location. The predefined load was also modified
accordingly. The load was incrementally applied on the model until convergence occurred and
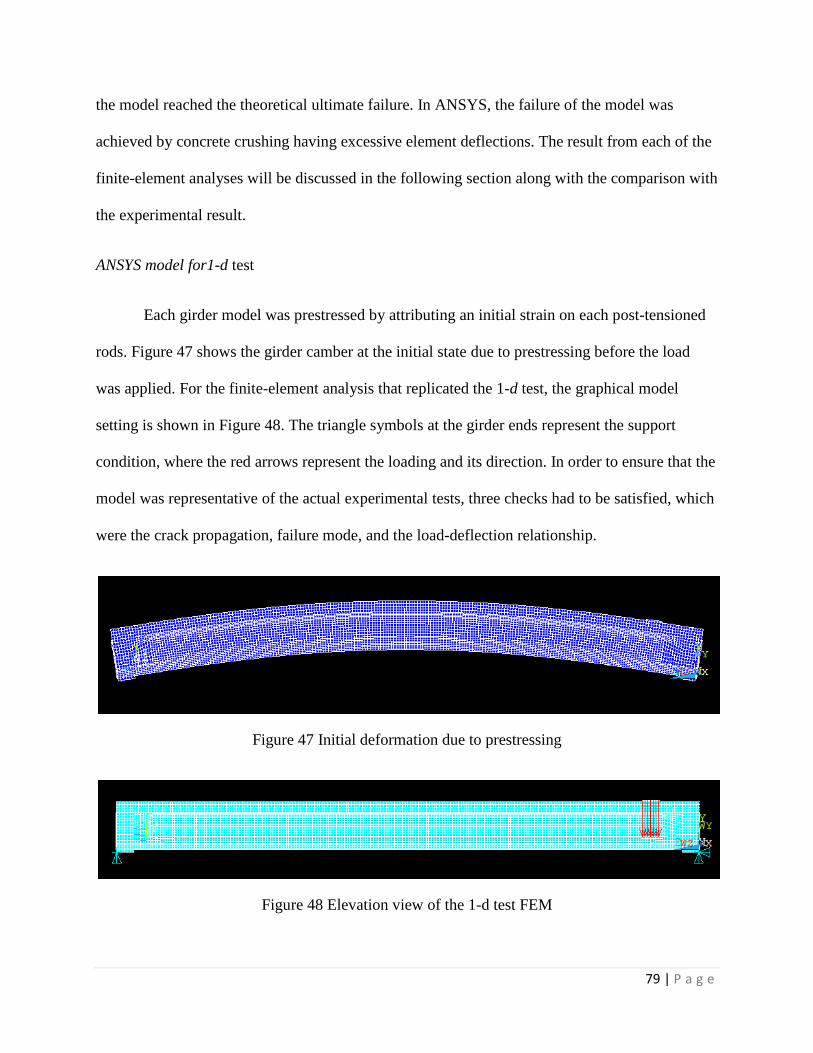
79 | P a g e
the model reached the theoretical ultimate failure. In ANSYS, the failure of the model was
achieved by concrete crushing having excessive element deflections. The result from each of the
finite-element analyses will be discussed in the following section along with the comparison with
the experimental result.
ANSYS model for1-d test
Each girder model was prestressed by attributing an initial strain on each post-tensioned
rods. Figure 47 shows the girder camber at the initial state due to prestressing before the load
was applied. For the finite-element analysis that replicated the 1-d test, the graphical model
setting is shown in Figure 48. The triangle symbols at the girder ends represent the support
condition, where the red arrows represent the loading and its direction. In order to ensure that the
model was representative of the actual experimental tests, three checks had to be satisfied, which
were the crack propagation, failure mode, and the load-deflection relationship.
Figure 47 Initial deformation due to prestressing
Figure 48 Elevation view of the 1-d test FEM
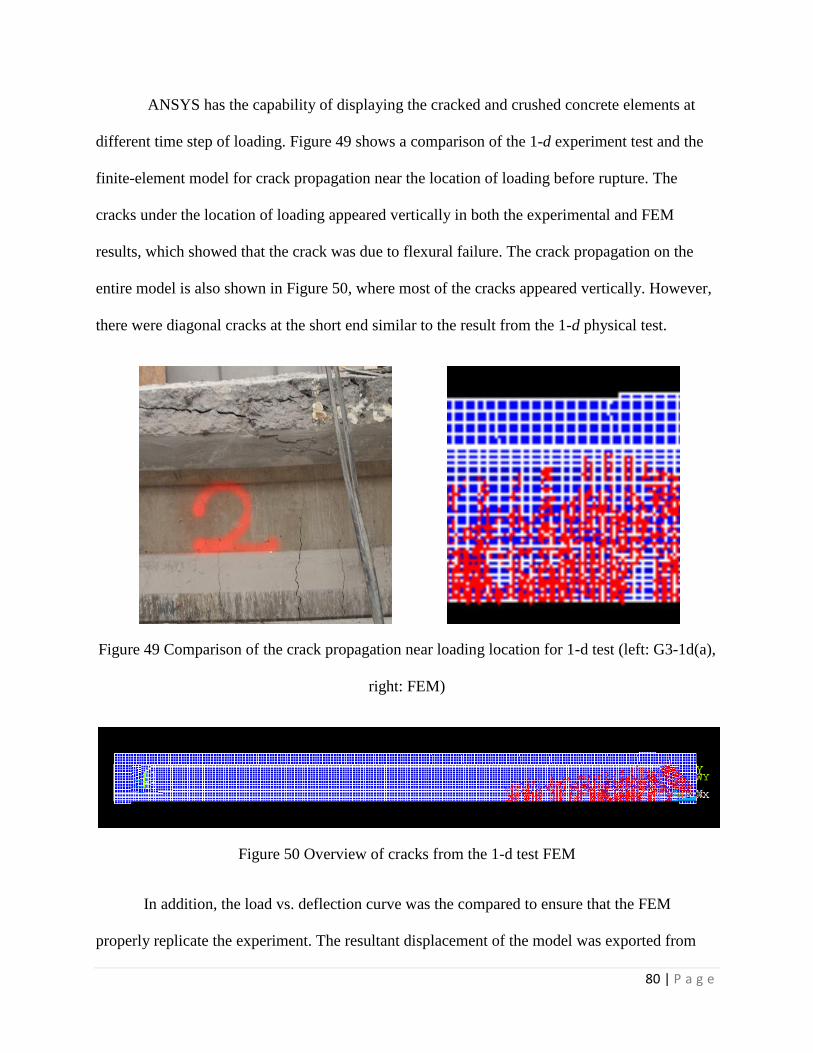
80 | P a g e
ANSYS has the capability of displaying the cracked and crushed concrete elements at
different time step of loading. Figure 49 shows a comparison of the 1-d experiment test and the
finite-element model for crack propagation near the location of loading before rupture. The
cracks under the location of loading appeared vertically in both the experimental and FEM
results, which showed that the crack was due to flexural failure. The crack propagation on the
entire model is also shown in Figure 50, where most of the cracks appeared vertically. However,
there were diagonal cracks at the short end similar to the result from the 1-d physical test.
Figure 49 Comparison of the crack propagation near loading location for 1-d test (left: G3-1d(a),
right: FEM)
Figure 50 Overview of cracks from the 1-d test FEM
In addition, the load vs. deflection curve was the compared to ensure that the FEM
properly replicate the experiment. The resultant displacement of the model was exported from
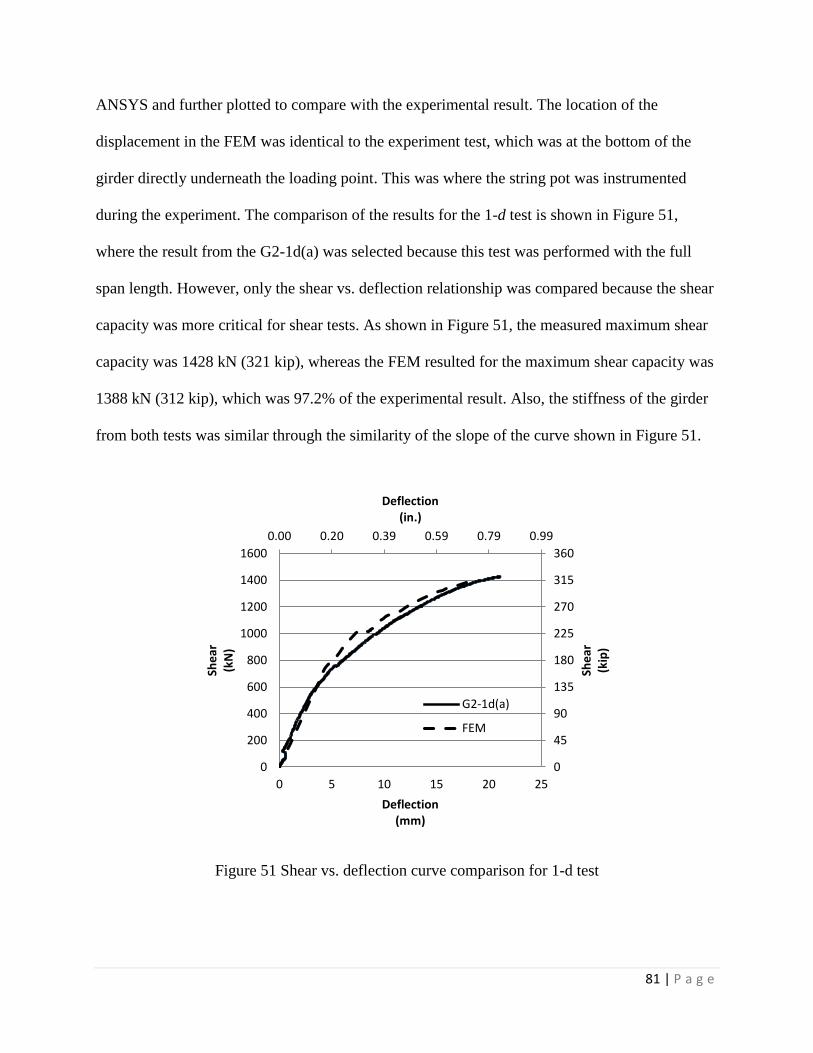
81 | P a g e
ANSYS and further plotted to compare with the experimental result. The location of the
displacement in the FEM was identical to the experiment test, which was at the bottom of the
girder directly underneath the loading point. This was where the string pot was instrumented
during the experiment. The comparison of the results for the 1-d test is shown in Figure 51,
where the result from the G2-1d(a) was selected because this test was performed with the full
span length. However, only the shear vs. deflection relationship was compared because the shear
capacity was more critical for shear tests. As shown in Figure 51, the measured maximum shear
capacity was 1428 kN (321 kip), whereas the FEM resulted for the maximum shear capacity was
1388 kN (312 kip), which was 97.2% of the experimental result. Also, the stiffness of the girder
from both tests was similar through the similarity of the slope of the curve shown in Figure 51.
Figure 51 Shear vs. deflection curve comparison for 1-d test
0.00 0.20 0.39 0.59 0.79 0.99
0
45
90
135
180
225
270
315
360
0
200
400
600
800
1000
1200
1400
1600
0 5 10 15 20 25
Deflection(in.)
She
ar(k
ip)
She
ar
(kN
)
Deflection(mm)
G2-1d(a)
FEM
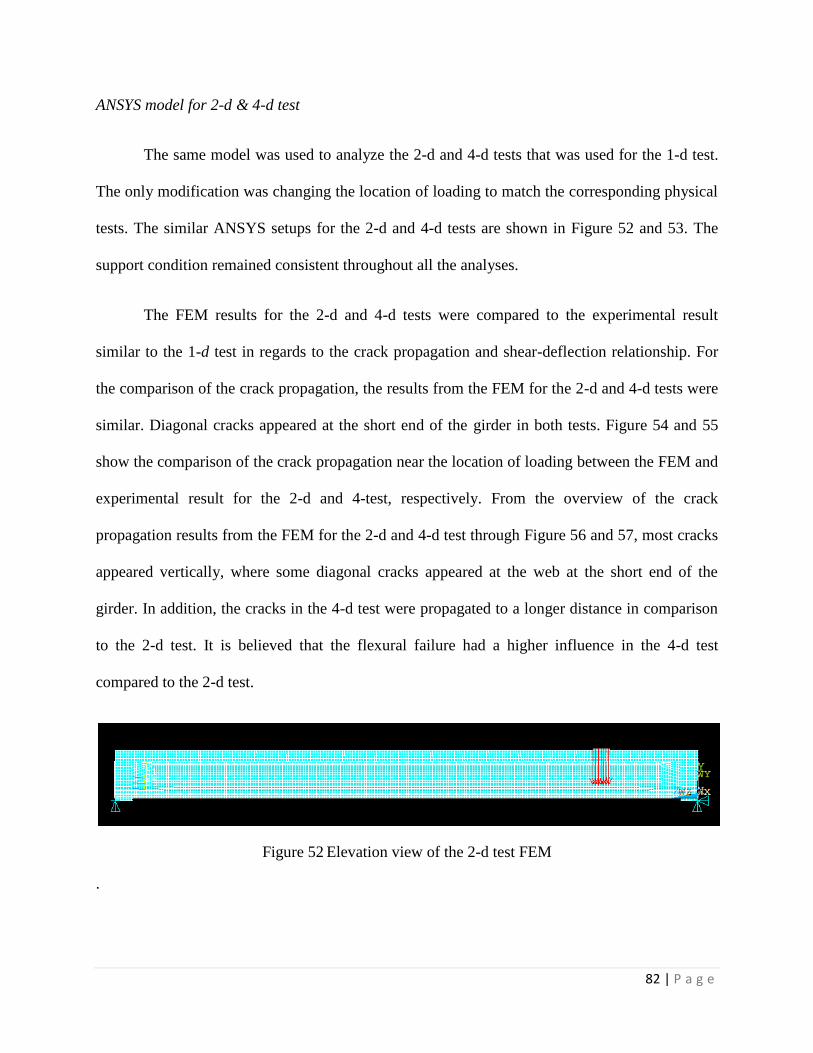
82 | P a g e
ANSYS model for 2-d & 4-d test
The same model was used to analyze the 2-d and 4-d tests that was used for the 1-d test.
The only modification was changing the location of loading to match the corresponding physical
tests. The similar ANSYS setups for the 2-d and 4-d tests are shown in Figure 52 and 53. The
support condition remained consistent throughout all the analyses.
The FEM results for the 2-d and 4-d tests were compared to the experimental result
similar to the 1-d test in regards to the crack propagation and shear-deflection relationship. For
the comparison of the crack propagation, the results from the FEM for the 2-d and 4-d tests were
similar. Diagonal cracks appeared at the short end of the girder in both tests. Figure 54 and 55
show the comparison of the crack propagation near the location of loading between the FEM and
experimental result for the 2-d and 4-test, respectively. From the overview of the crack
propagation results from the FEM for the 2-d and 4-d test through Figure 56 and 57, most cracks
appeared vertically, where some diagonal cracks appeared at the web at the short end of the
girder. In addition, the cracks in the 4-d test were propagated to a longer distance in comparison
to the 2-d test. It is believed that the flexural failure had a higher influence in the 4-d test
compared to the 2-d test.
Figure 52 Elevation view of the 2-d test FEM
.
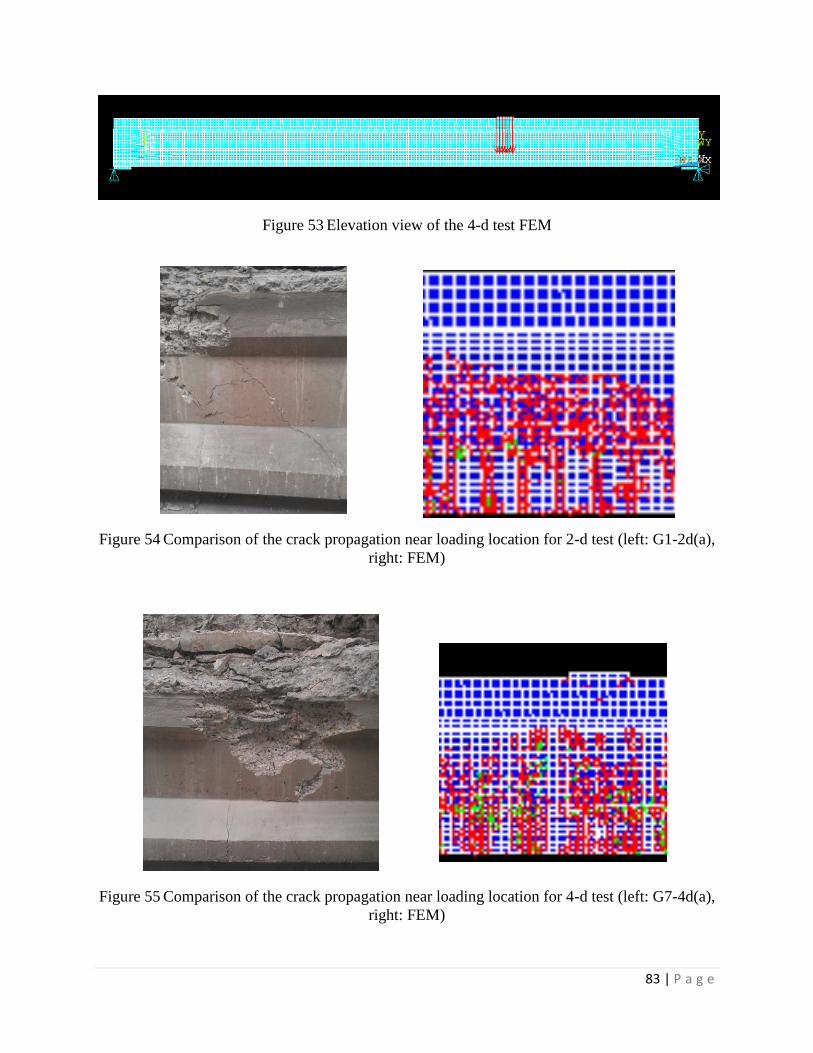
83 | P a g e
Figure 53 Elevation view of the 4-d test FEM
Figure 54 Comparison of the crack propagation near loading location for 2-d test (left: G1-2d(a),
right: FEM)
Figure 55 Comparison of the crack propagation near loading location for 4-d test (left: G7-4d(a),
right: FEM)
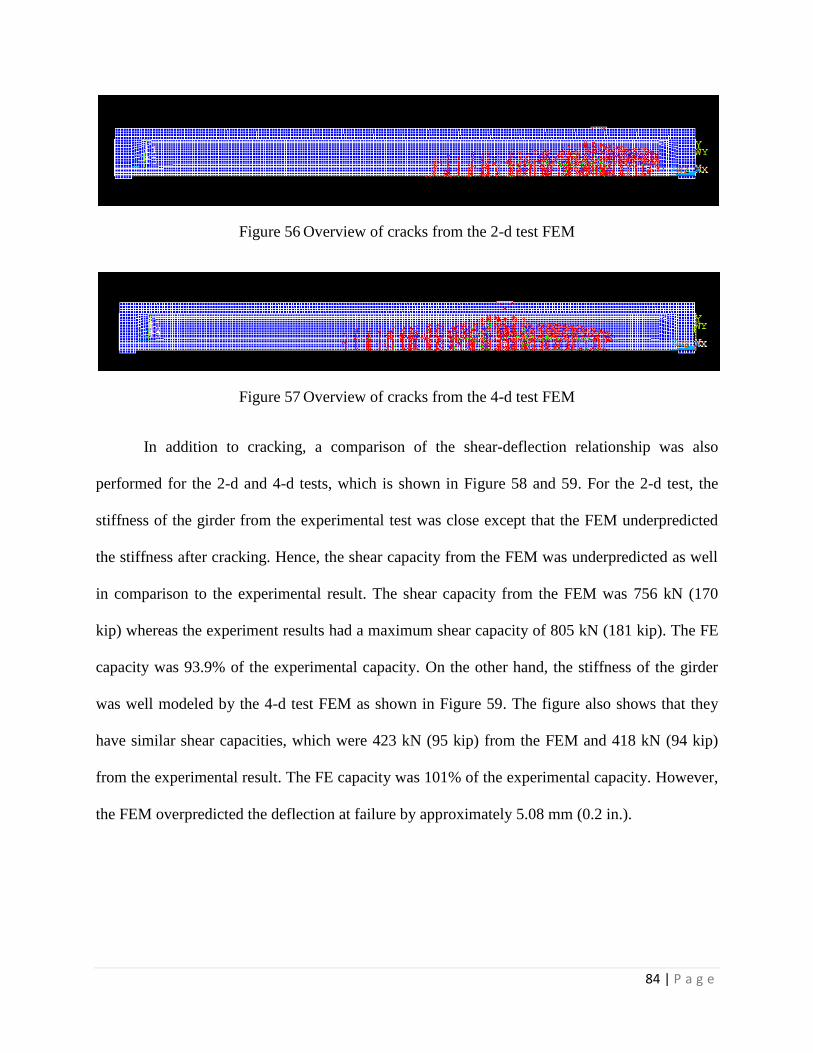
84 | P a g e
Figure 56 Overview of cracks from the 2-d test FEM
Figure 57 Overview of cracks from the 4-d test FEM
In addition to cracking, a comparison of the shear-deflection relationship was also
performed for the 2-d and 4-d tests, which is shown in Figure 58 and 59. For the 2-d test, the
stiffness of the girder from the experimental test was close except that the FEM underpredicted
the stiffness after cracking. Hence, the shear capacity from the FEM was underpredicted as well
in comparison to the experimental result. The shear capacity from the FEM was 756 kN (170
kip) whereas the experiment results had a maximum shear capacity of 805 kN (181 kip). The FE
capacity was 93.9% of the experimental capacity. On the other hand, the stiffness of the girder
was well modeled by the 4-d test FEM as shown in Figure 59. The figure also shows that they
have similar shear capacities, which were 423 kN (95 kip) from the FEM and 418 kN (94 kip)
from the experimental result. The FE capacity was 101% of the experimental capacity. However,
the FEM overpredicted the deflection at failure by approximately 5.08 mm (0.2 in.).
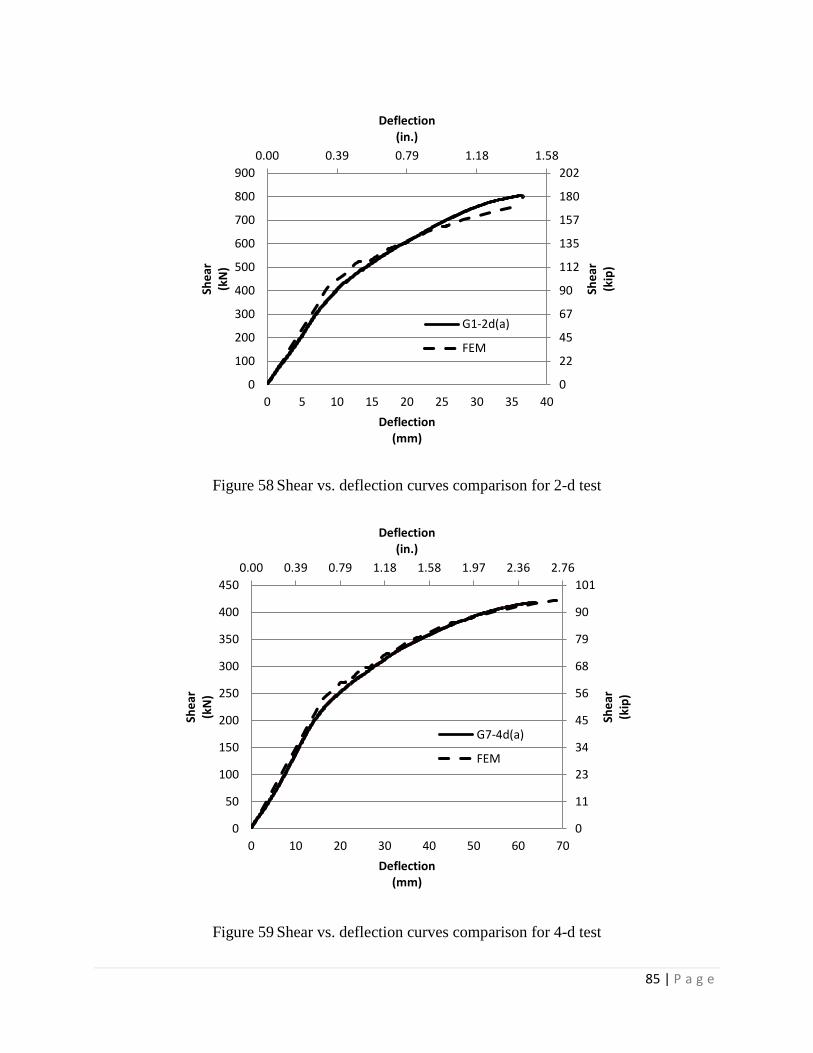
85 | P a g e
Figure 58 Shear vs. deflection curves comparison for 2-d test
Figure 59 Shear vs. deflection curves comparison for 4-d test
0.00 0.39 0.79 1.18 1.58
0
22
45
67
90
112
135
157
180
202
0
100
200
300
400
500
600
700
800
900
0 5 10 15 20 25 30 35 40
Deflection(in.)
She
ar(k
ip)
She
ar(k
N)
Deflection(mm)
G1-2d(a)
FEM
0.00 0.39 0.79 1.18 1.58 1.97 2.36 2.76
0
11
23
34
45
56
68
79
90
101
0
50
100
150
200
250
300
350
400
450
0 10 20 30 40 50 60 70
Deflection(in.)
She
ar(k
ip)
She
ar(k
N)
Deflection(mm)
G7-4d(a)
FEM
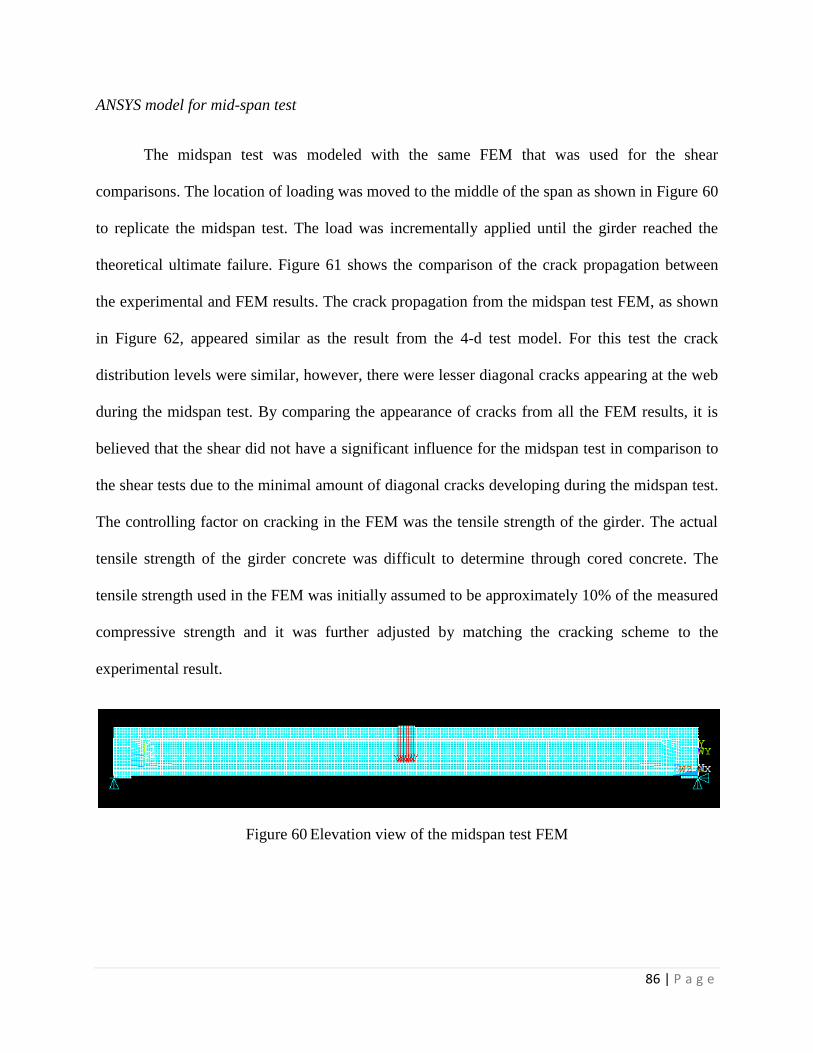
86 | P a g e
ANSYS model for mid-span test
The midspan test was modeled with the same FEM that was used for the shear
comparisons. The location of loading was moved to the middle of the span as shown in Figure 60
to replicate the midspan test. The load was incrementally applied until the girder reached the
theoretical ultimate failure. Figure 61 shows the comparison of the crack propagation between
the experimental and FEM results. The crack propagation from the midspan test FEM, as shown
in Figure 62, appeared similar as the result from the 4-d test model. For this test the crack
distribution levels were similar, however, there were lesser diagonal cracks appearing at the web
during the midspan test. By comparing the appearance of cracks from all the FEM results, it is
believed that the shear did not have a significant influence for the midspan test in comparison to
the shear tests due to the minimal amount of diagonal cracks developing during the midspan test.
The controlling factor on cracking in the FEM was the tensile strength of the girder. The actual
tensile strength of the girder concrete was difficult to determine through cored concrete. The
tensile strength used in the FEM was initially assumed to be approximately 10% of the measured
compressive strength and it was further adjusted by matching the cracking scheme to the
experimental result.
Figure 60 Elevation view of the midspan test FEM
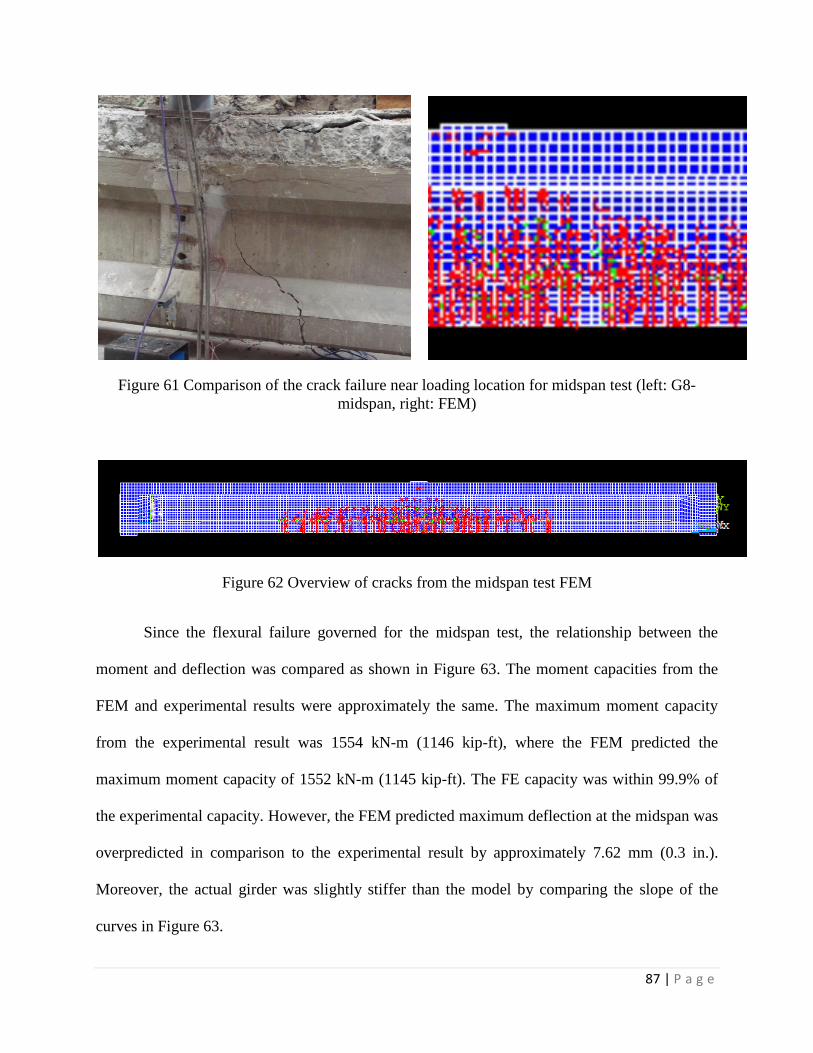
87 | P a g e
Figure 61 Comparison of the crack failure near loading location for midspan test (left: G8-
midspan, right: FEM)
Figure 62 Overview of cracks from the midspan test FEM
Since the flexural failure governed for the midspan test, the relationship between the
moment and deflection was compared as shown in Figure 63. The moment capacities from the
FEM and experimental results were approximately the same. The maximum moment capacity
from the experimental result was 1554 kN-m (1146 kip-ft), where the FEM predicted the
maximum moment capacity of 1552 kN-m (1145 kip-ft). The FE capacity was within 99.9% of
the experimental capacity. However, the FEM predicted maximum deflection at the midspan was
overpredicted in comparison to the experimental result by approximately 7.62 mm (0.3 in.).
Moreover, the actual girder was slightly stiffer than the model by comparing the slope of the
curves in Figure 63.
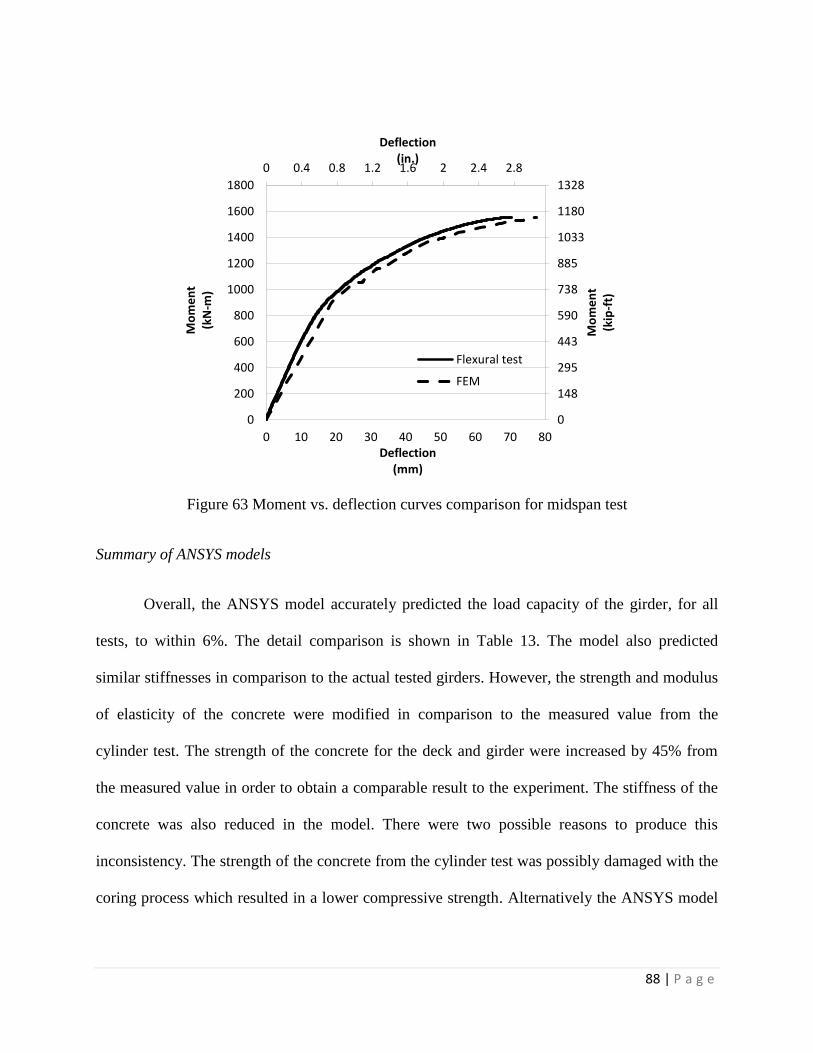
88 | P a g e
Figure 63 Moment vs. deflection curves comparison for midspan test
Summary of ANSYS models
Overall, the ANSYS model accurately predicted the load capacity of the girder, for all
tests, to within 6%. The detail comparison is shown in Table 13. The model also predicted
similar stiffnesses in comparison to the actual tested girders. However, the strength and modulus
of elasticity of the concrete were modified in comparison to the measured value from the
cylinder test. The strength of the concrete for the deck and girder were increased by 45% from
the measured value in order to obtain a comparable result to the experiment. The stiffness of the
concrete was also reduced in the model. There were two possible reasons to produce this
inconsistency. The strength of the concrete from the cylinder test was possibly damaged with the
coring process which resulted in a lower compressive strength. Alternatively the ANSYS model
0
148
295
443
590
738
885
1033
1180
1328
0 0.4 0.8 1.2 1.6 2 2.4 2.8
0
200
400
600
800
1000
1200
1400
1600
1800
0 10 20 30 40 50 60 70 80
Mo
me
nt
(kip
-ft)
Deflection(in.)
Mo
me
nt
(kN
-m)
Deflection(mm)
Flexural test
FEM
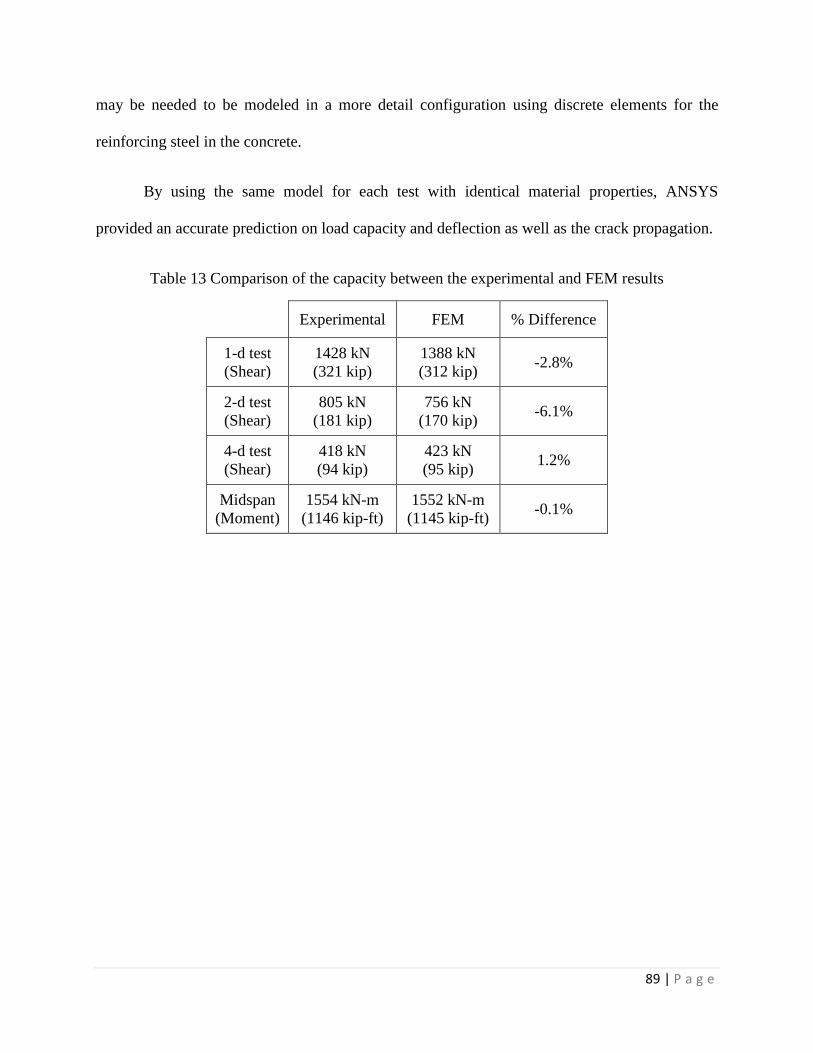
89 | P a g e
may be needed to be modeled in a more detail configuration using discrete elements for the
reinforcing steel in the concrete.
By using the same model for each test with identical material properties, ANSYS
provided an accurate prediction on load capacity and deflection as well as the crack propagation.
Table 13 Comparison of the capacity between the experimental and FEM results
Experimental FEM % Difference
1-d test
(Shear)
1428 kN
(321 kip)
1388 kN
(312 kip) -2.8%
2-d test
(Shear)
805 kN
(181 kip)
756 kN
(170 kip) -6.1%
4-d test
(Shear)
418 kN
(94 kip)
423 kN
(95 kip) 1.2%
Midspan
(Moment)
1554 kN-m
(1146 kip-ft)
1552 kN-m
(1145 kip-ft) -0.1%
90 | P a g e
CONCLUSION
Four 50-year-old post-tensioned girders were tested to determine the prestress losses,
shear and moment capacities. The results were then compared to the AASHTO LRFD
Specification and an ANSYS finite-element model.
The measured prestress losses of the girders was 35% on average, where the AASHTO
LRFD Specification predicted an upper and lower bound of the prestress losses with the
Simplified Method and Refined Method. The prestress losses predicted using the Simplified
Method was 40.4% and 29.8% using the Refined Method. The Simplified Method provided a
more conservative result as expected. It is interesting to notice that the prestress losses of the
post-tensioned girders in this research was approximately 35% after 50 years of service, which
was closed to the assumed prestress losses in Eder et al., 2005, for the 50-year-old post-tensioned
bridge girder. The AASHTO 2012 obtained a fairly accurate prediction on determining the
moment capacity in comparison to the experimental result. The average percent difference
between both results was approximately 5.5%. However, the shear capacity was overly predicted
using the procedures in the AASHTO LRFD Design in comparison to the shear tested result. The
percent difference for the 1-d, 2-d, and 4-d tests was 38.9%, 39.5%, and 13.8%, respectively. The
average percent difference was approximately 31%. This overprediction indicated that the
girders were failed in a flexural manner, which matched the compressive failure on the girders
during the experiments.
The ANSYS model was able to obtain a comparable result in terms of modeling the
stiffness of the girder, the shear and moment capacity for each test, and the deflection. The
percent difference in capacity between the experimental and FEM results was 2.8% for the 1-d
test, 6.1% for the 2-d test, 1.2% for the 4-d test, and 0.1% for the midspan test. This was less

91 | P a g e
than 3% on average. However, the concrete material properties in the model were increased
significantly comparing to the actual properties. Further understanding on ANSYS modeling
may be required to idealize the FEM result.
92 | P a g e
REFERENCE
AASHTO. (2012). AASHTO LRFD Design Manual. AASHTO, Washington, D.C.
ANSYS, Inc. (2009). Element Reference. ANSYS, Canonsburg, PA.
Barr, P. J., Kukay, B. M., and Halling, M. W. (2008), “Comparison of Prestress Losses for a
Prestress Concrete Bridge Made with High-Performance Concrete.” Journal of Bridge
Engineering, 468-475.
Dahmani, L., Khennane, A., and Kaci, S. (2010), “Crack Identification in Reinforced Concrete
Beams Using ANSYS Software.” Strength of Materials, 42( 2), 232-240.
Eder, R. W., Miller, R. A., Baseheart, T. M., and Swanson, J. A. (2005). “Testing of Two 50-
Year-Old Precast Post-Tensioned Concrete Bridge Girders.” PCI Journal, 90-95.
Grace, N. F., and Ross, B. (1996), “Dynamic Characteristic of Post-Tensioned Girder with web
openings.” Journal of Structural Engineering, 643-650.
Nayal, R., Peterman, R. J., and Esmaeily, A. (2010), “Parametric Study of Posttensioned
Inverted-T Bridge System for Improved Durability and Increased Span-to-Depth Ratio.”
Journal of Bridge Engineering, 731-739.
Pessiki, S., Kaczinski, M., and Wescott, H. H. (1996). “Evaluation of Effective Prestress Force in
28-Year-Old Prestressed Concrete Bridge Beams.” PCI Journal, 78-89.
Tabatabai, H., and Dickson, T. J. (1993). “Structural Evaluation of a 34-Year-Old Precast Post-
Tensioned Concrete Girder.” PCI Journal, 50-63.
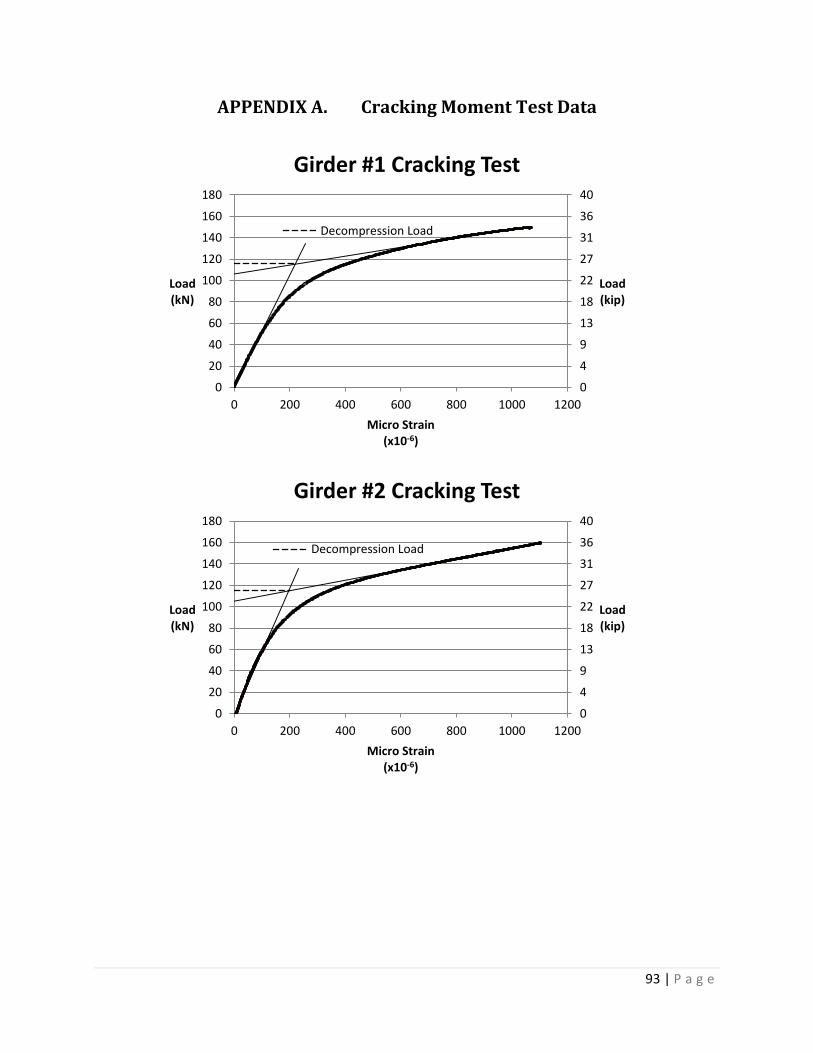
93 | P a g e
APPENDIX A. Cracking Moment Test Data
0
4
9
13
18
22
27
31
36
40
0
20
40
60
80
100
120
140
160
180
0 200 400 600 800 1000 1200
Load(kip)
Load(kN)
Micro Strain(x10-6)
Girder #1 Cracking Test
Decompression Load
0
4
9
13
18
22
27
31
36
40
0
20
40
60
80
100
120
140
160
180
0 200 400 600 800 1000 1200
Load(kip)
Load(kN)
Micro Strain(x10-6)
Girder #2 Cracking Test
Decompression Load
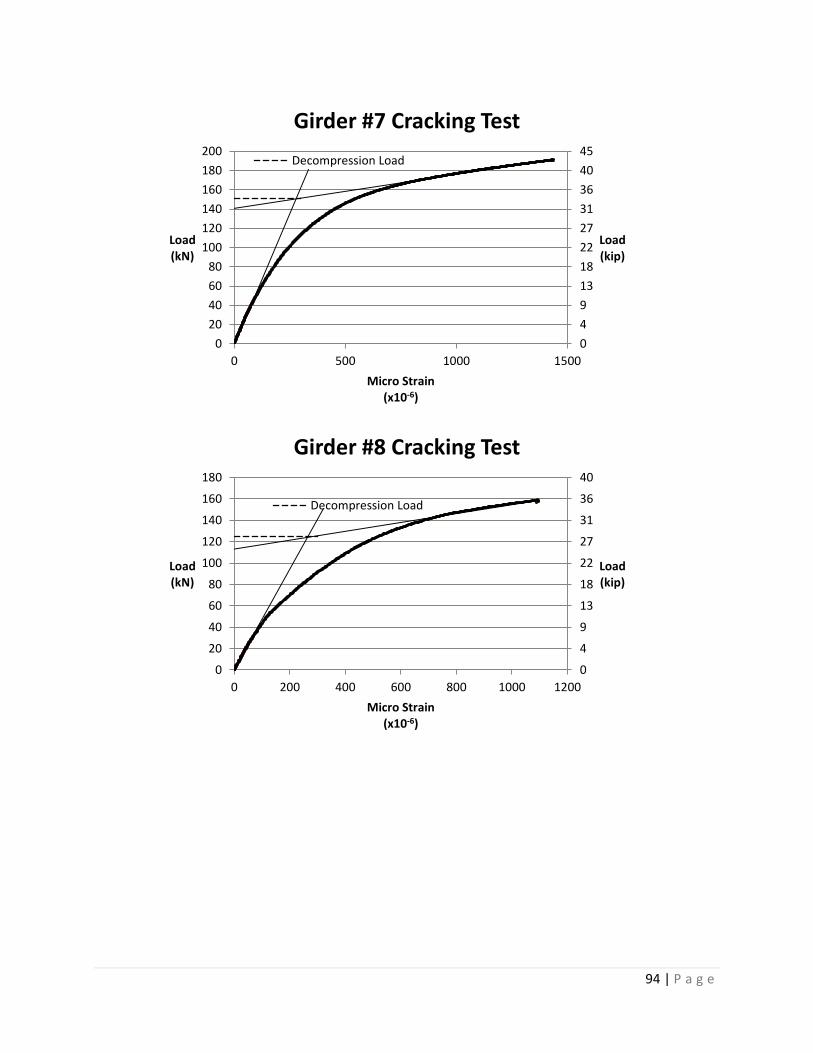
94 | P a g e
0
4
9
13
18
22
27
31
36
40
45
0
20
40
60
80
100
120
140
160
180
200
0 500 1000 1500
Load(kip)
Load(kN)
Micro Strain(x10-6)
Girder #7 Cracking Test
Decompression Load
0
4
9
13
18
22
27
31
36
40
0
20
40
60
80
100
120
140
160
180
0 200 400 600 800 1000 1200
Load(kip)
Load(kN)
Micro Strain(x10-6)
Girder #8 Cracking Test
Decompression Load
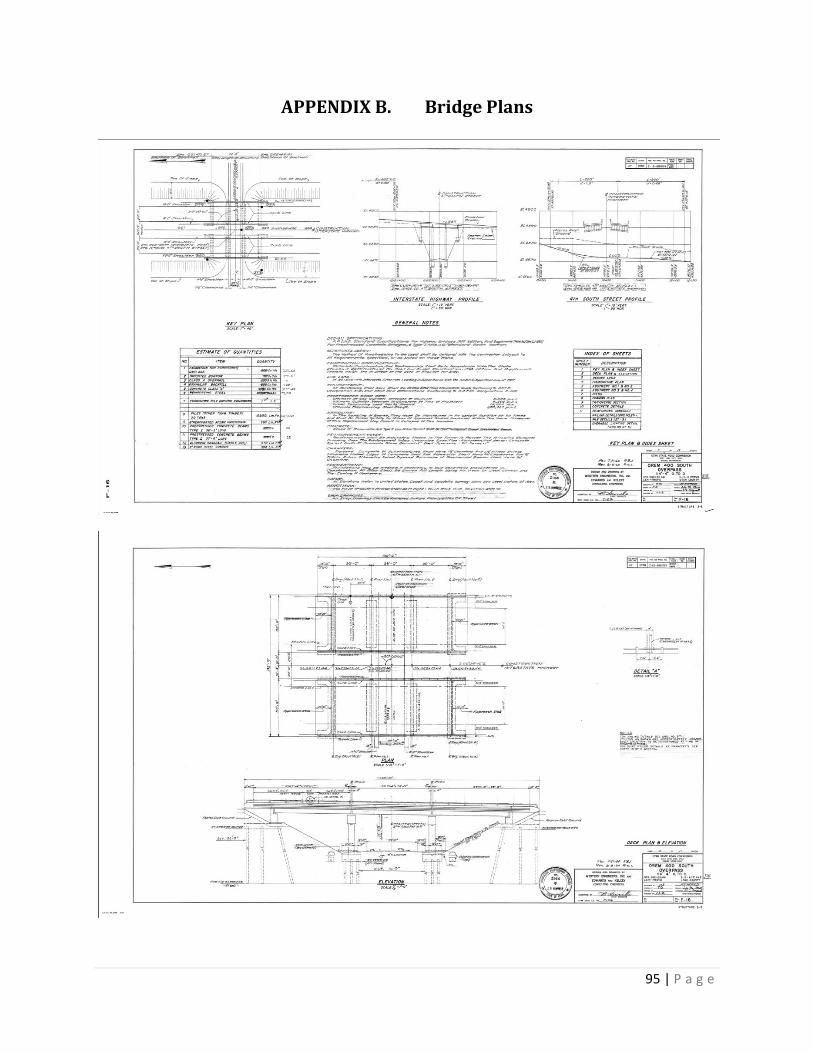
95 | P a g e
APPENDIX B. Bridge Plans
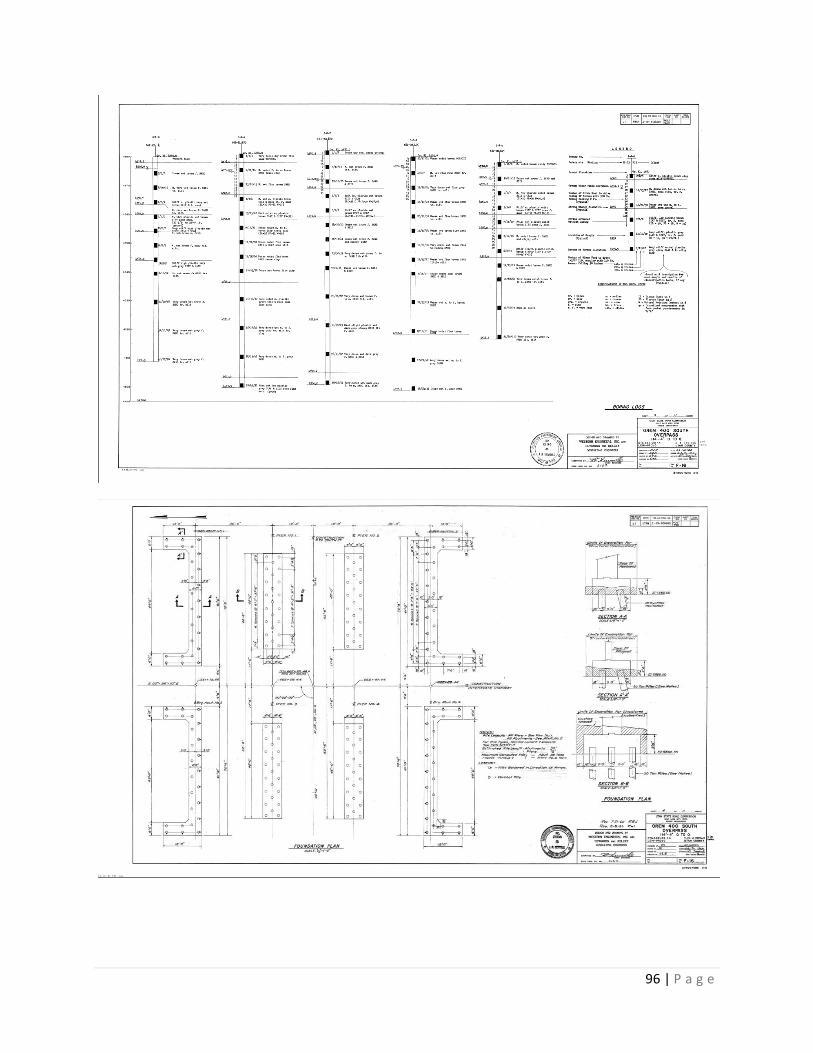
96 | P a g e
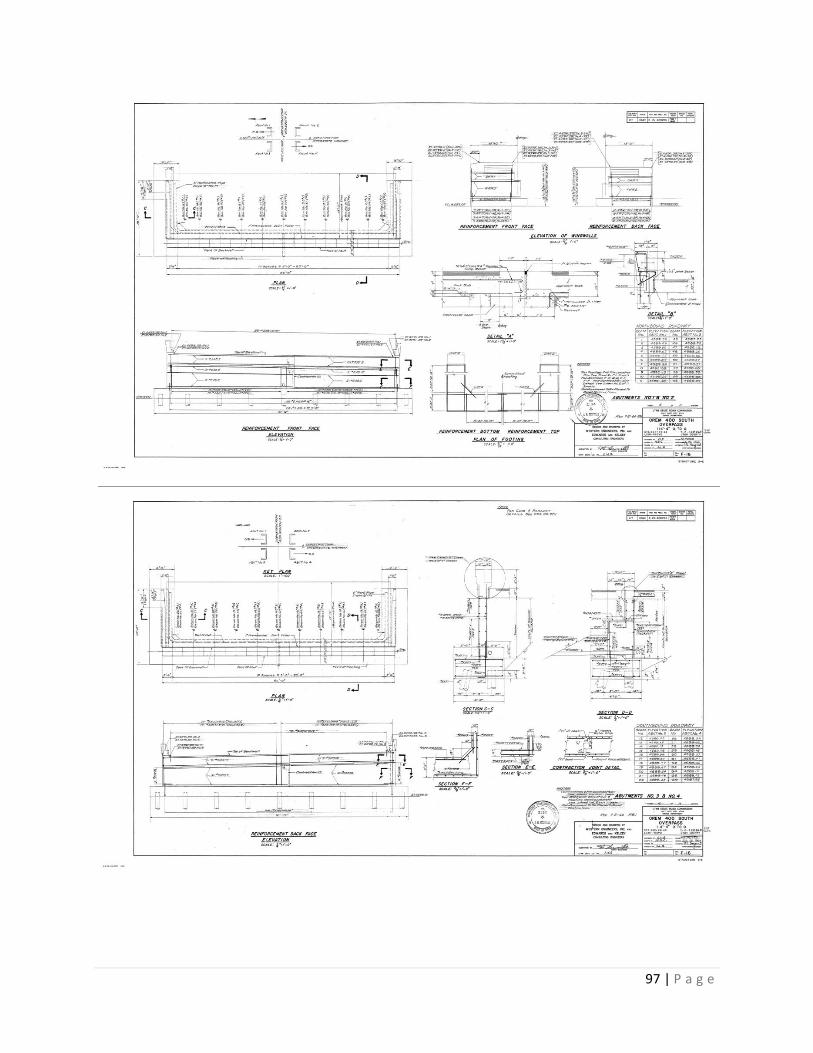
97 | P a g e
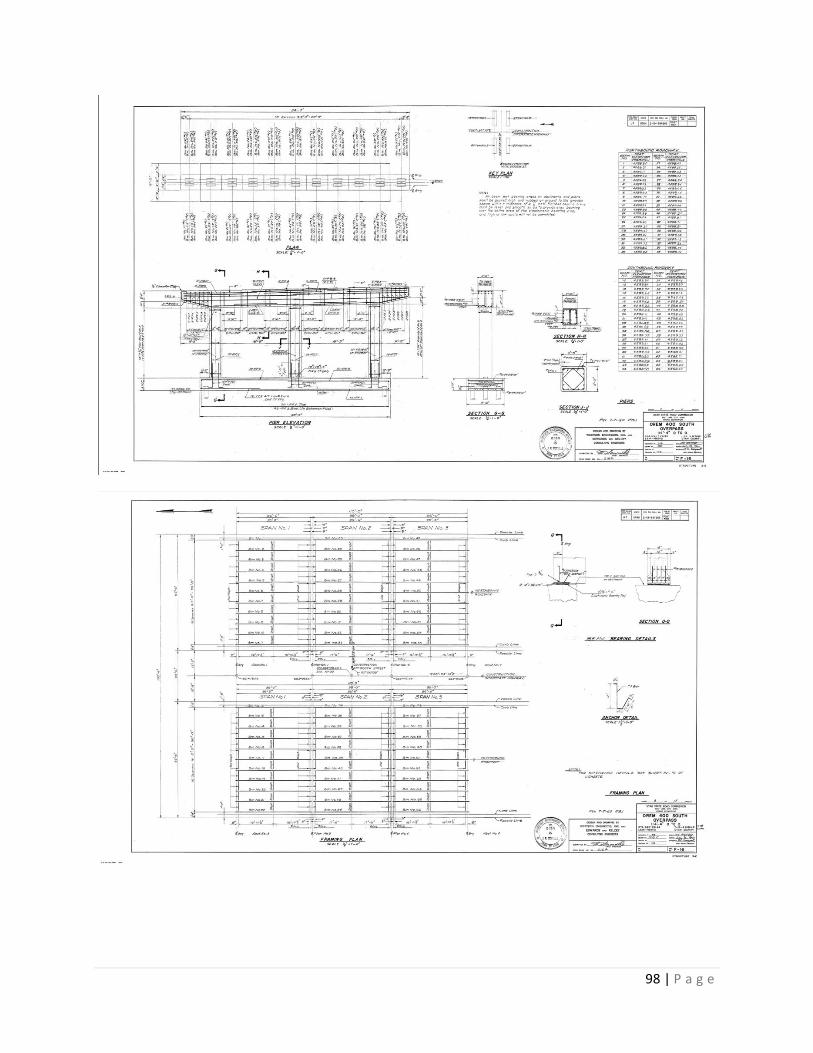
98 | P a g e
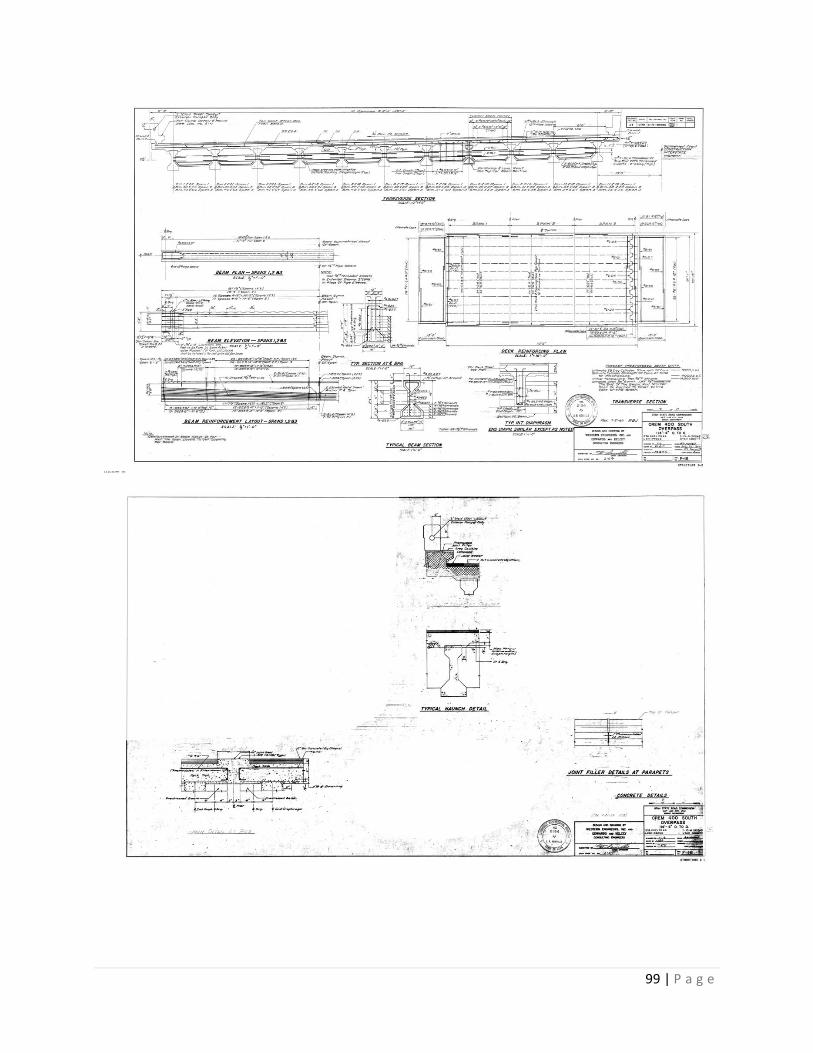
99 | P a g e
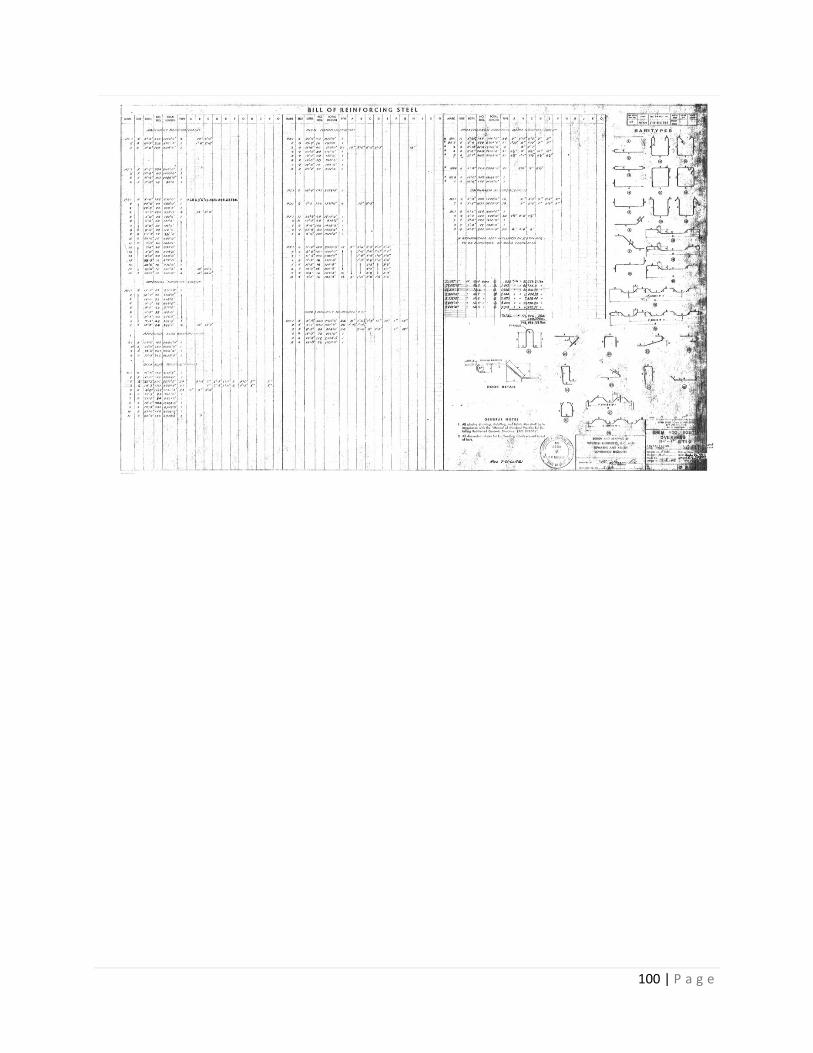
100 | P a g e

101 | P a g e
APPENDIX C. ANSYS Model Code
finish
/clear
/title,GIRDER
/VIEW,1,1,1,1 ! Window 2 ISO (isometric
projection) view
/prep7
!Units in Kips and inches
Es=29000
Emus=0.3
fy=60
Eps=29000
fpsy=140
Esu=5000000
fyu=10000
Ec=4500
fc=10.5
ft=1.2
Emuc=0.2
Ecd=2000 !Deck
fcd=9.7
ftd=1.1
Emucd=0.2
MP,EX,1,Ec
MP,PRXY,1,Emuc
MP,DENS,1,1.188E-4
TB,CONCR,1
TBDATA,,0.3,1,ft,fc !see element types
MP,EX,2,Es
MP,PRXY,2,Emus
TB,BISO,2
TBDATA,,fy,2.9
MP,EX,3,Eps
MP,PRXY,3,Emus
TB,BISO,3
TBDATA,,fpsy,1500
MP,EX,4,Esu
MP,PRXY,4,0
TB,BISO,4
TBDATA,,fyu,500000
MP,EX,5,Ecd
MP,PRXY,5,Emucd
MP,DENS,5,1.188E-4
TB,CONCR,5
TBDATA,,0.3,1,ftd,fcd
R,1
R,3,1,0.003 !post-tensioned steel
R,4,2,0.011,90 !6"oc shear
reinforcements
R,5,2,0.0056,90 !12"oc shear
reinforcements
R,6,2,0.018,90 !deck reinforcements
R,8,,,0.01,,1E-10
R,10,2,0.022,90,,2,0.009
RMORE,,90 !6"oc at box end with
double reinf.
ET,1,Solid65
ET,2,Link8
ET,3,Solid45
ET,4,Targe170
ET,5,CONTA173
KEYOPT,5,4,2
KEYOPT,5,2,2
KEYOPT,5,6,0
KEYOPT,5,7,0
KEYOPT,5,8,2
KEYOPT,5,9,1
KEYOPT,5,11,0
KEYOPT,5,12,5
!Volume
K,1,0,0
K,2,2,0
K,3,7,0
K,4,9,0
K,5,14,0
K,6,16,0
K,7,0,5
102 | P a g e
K,8,2,7
K,9,14,7
K,10,16,5
K,11,7,28
K,12,9,28
K,13,2,28
K,14,14,28
Kgen,2,1,14,1,,,27
Kgen,2,1,14,1,,,408
Kgen,2,1,14,1,,,435
K,57,2,24,27
K,58,14,24,27
K,59,5,21,27
K,60,11,21,27
K,61,5,10,27
K,62,11,10,27
K,63,5,0,27
K,64,11,0,27
K,65,5,28,27
K,66,11,28,27
Kgen,2,57,66,1,,,381
K,77,2,36
K,78,14,36
K,79,2,36,435
K,80,14,36,435
v,11,3,4,12,53,45,46,54 !middle long rectangle
v,13,2,3,11,27,16,17,25
v,12,4,5,14,26,18,19,28
v,54,46,47,56,40,32,33,42
v,55,44,45,53,41,30,31,39
v,26,18,64,66,40,32,74,76 !side rectangles in
the middle
v,65,63,17,25,75,73,31,39
v,62,64,20,24,72,74,34,38 !side trapezoid in the
middle
v,21,15,63,61,35,29,73,71
v,66,60,58,28,76,70,68,42
v,27,57,59,65,41,67,69,75
v,9,5,6,10,23,19,20,24 !side trapezoid at the
end
v,7,1,2,8,21,15,16,22
v,37,33,34,38,51,47,48,52
v,35,29,30,36,49,43,44,50
vsel,all
vsel,u,loc,x,7,9
WPOFF,,,12
VSBW,all
WPOFF,,,411
VSBW,all
WPSTYL,DEFA
vsel,all !cut for different stirrup spacing
WPOFF,,,27
VSBW,all
WPOFF,,,34.5
VSBW,all
WPOFF,,,312
VSBW,all
WPOFF,,,34.5
VSBW,all
WPSTYL,DEFA
!Bearing plates
*DO,i,0,423,423
BLOCK,0,2,0,-2,0+i,12+i
BLOCK,2,7,0,-2,0+i,12+i
BLOCK,7,9,0,-2,0+i,12+i
BLOCK,9,14,0,-2,0+i,12+i
BLOCK,14,16,0,-2,0+i,12+i
vsel,s,loc,y,-2,0
vsel,r,loc,z,0+i,12+i
vglue,all
*ENDDO
vsel,all
vglue,all
!Rods plates
BLOCK,5,7,0,28,-0.75,0
BLOCK,7,9,0,28,-0.75,0
BLOCK,9,11,0,28,-0.75,0
BLOCK,5,7,0,28,435,435.75
BLOCK,7,9,0,28,435,435.75
BLOCK,9,11,0,28,435,435.75
vsel,all
vglue,all
!infinite stiff side plates
vsel,s,loc,z,0,27
vsel,a,loc,z,412,435
103 | P a g e
WPROTA,,,-90
WPOFF,,,-5
VSBW,all
WPOFF,,,-6
VSBW,all
WPSTYL,DEFA
!Parabolic post-tensioned rods
vsel,all
WPROTA,,,-90
WPOFF,,,-8
VSBW,all
WPSTYL,DEFA
vsel,all
!CUTTING for Rods
INC=21.75
*DO,PR,-217.5,217.5-INC,INC
*IF,PR,NE,217.5-INC,THEN
WPOFF,,,PR+217.5+INC
vsel,s,loc,x,7,9
VSBW,all
WPSTYL,DEFA
*ENDIF
*IF,PR,EQ,-217.5,THEN
vsel,s,loc,z,(PR+217.5-5),(PR+217.5+INC)
*ELSEIF,PR,EQ,217.5-INC,THEN
vsel,s,loc,z,(PR+217.5),(PR+217.5+INC+5)
*ELSE
vsel,s,loc,z,(PR+217.5),(PR+217.5+INC)
*ENDIF
vsel,r,loc,x,7,9
!Top Rod
WPOFF,,,PR+217.5
SP1=(PR*PR)/3638.94217084792+1.5+2*1.375
SP2=((PR+INC)*(PR+INC))/3638.9421708479
2+1.5+2*1.375
WPROTA,,-90
WPOFF,,,SP1
*AFUN,DEG
WPROTA,,ATAN((SP1-SP2)/INC)
VSBW,all
WPSTYL,DEFA
!MIDDLE ROD
WPOFF,,,PR+217.5
SP3=(PR*PR)/4883.22576355819+1.5+1.375
SP4=((PR+INC)*(PR+INC))/4883.2257635581
9+1.5+1.375
WPROTA,,-90
WPOFF,,,SP3
*AFUN,DEG
WPROTA,,ATAN((SP3-SP4)/INC)
VSBW,all
WPSTYL,DEFA
!BOTTOM ROD
WPOFF,,,PR+217.5
SP5=(PR*PR)/7073.83158449819+1.5
SP6=((PR+INC)*(PR+INC))/7073.8315844981
9+1.5
WPROTA,,-90
WPOFF,,,SP5
*AFUN,DEG
WPROTA,,ATAN((SP5-SP6)/INC)
VSBW,all
WPSTYL,DEFA
*ENDDO
Block,2,14,28,36,0,435 !concrete Deck
!MOVE THIS BLOCK TO MOVE LOAD
BLOCK,2,14,36,37,72-6,72+6 !midspan
test:217.5,1-d:36,2-d:72,4-d:144
vsel,s,loc,y,28,37
vglue,all
vsel,s,loc,z,0,27
vsel,a,loc,z,408,435
vsel,r,loc,y,0,28
vatt,1,10,1 !box end
vsel,s,loc,z,27,61.5
vsel,a,loc,z,373.5,408
vsel,r,loc,y,0,28
vatt,1,4,1 !near end
concrete 6" oc
vsel,s,loc,z,61.5,373.5
vsel,r,loc,y,0,28
vatt,1,5,1 !Middle
concrete 12" oc
vsel,s,loc,z,-0.75,0
vsel,a,loc,z,435,435.75
vatt,4,1,3
104 | P a g e
!Assign properties and mesh the rods
*DO,PR,-217.5,217.5-INC,INC
SP1=(PR*PR)/3638.94217084792+1.5+2*1.375
SP2=((PR+INC)*(PR+INC))/3638.9421708479
2+1.5+2*1.375
SP3=(PR*PR)/4883.22576355819+1.5+1.375
SP4=((PR+INC)*(PR+INC))/4883.2257635581
9+1.5+1.375
SP5=(PR*PR)/7073.83158449819+1.5
SP6=((PR+INC)*(PR+INC))/7073.8315844981
9+1.5
!Top rod
*IF,PR,EQ,-217.5,THEN
lsel,s,loc,z,(PR+217.5-5),(PR+217.5+INC)
*ELSEIF,PR,EQ,217.5-INC,THEN
lsel,s,loc,z,(PR+217.5),(PR+217.5+INC+5)
*ELSE
lsel,s,loc,z,(PR+217.5),(PR+217.5+INC)
*ENDIF
lsel,r,loc,x,8
*AFUN,DEG
LOCAL,11,0,8,SP1,PR+217.5,,ATAN((SP1-
SP2)/INC)
lsel,r,loc,y,0
latt,3,3,2
ESIZE,2
LMESH,all
CSYS,0
!Mid rod
*IF,PR,EQ,-217.5,THEN
lsel,s,loc,z,(PR+217.5-5),(PR+217.5+INC)
*ELSEIF,PR,EQ,217.5-INC,THEN
lsel,s,loc,z,(PR+217.5),(PR+217.5+INC+5)
*ELSE
lsel,s,loc,z,(PR+217.5),(PR+217.5+INC)
*ENDIF
lsel,r,loc,x,8
*AFUN,DEG
LOCAL,12,0,8,SP3,PR+217.5,,ATAN((SP3-
SP4)/INC)
lsel,r,loc,y,0
latt,3,3,2
ESIZE,2
LMESH,all
CSYS,0
!Bottom rod
*IF,PR,EQ,-217.5,THEN
lsel,s,loc,z,(PR+217.5-5),(PR+217.5+INC)
*ELSEIF,PR,EQ,217.5-INC,THEN
lsel,s,loc,z,(PR+217.5),(PR+217.5+INC+5)
*ELSE
lsel,s,loc,z,(PR+217.5),(PR+217.5+INC)
*ENDIF
lsel,r,loc,x,8
*AFUN,DEG
LOCAL,13,0,8,SP5,PR+217.5,,ATAN((SP5-
SP6)/INC)
lsel,r,loc,y,0
latt,3,3,2
ESIZE,2
LMESH,all
CSYS,0
*ENDDO
vsel,s,loc,y,36,37
vsel,a,loc,y,-2,0
vatt,2,1,3
vsel,s,loc,y,28,37
vsel,a,loc,y,-2,0
vsel,all
vplot,all
vsel,s,loc,y,-2,28
esize,2
vsweep,all
esel,s,mat,,1
nsle,s
nsel,r,loc,y,28
REAL,8
TYPE,4
ESURF
vsel,s,loc,y,28,36
vatt,5,6,1 !deck
concrete
vsel,s,loc,y,28,37
esize,2
vsweep,all
esel,s,mat,,5
nsle,s

105 | P a g e
nsel,r,loc,y,28
REAL,8
TYPE,5
ESURF
Allsel,all
!TAKES CORD SYSTEM BACK TO
DEFAULT POSSITION
wpstyl,defa
NSEL,S,LOC,Y,-2
NSEL,R,LOC,Z,435.5
d,all,ux
d,all,uy
NSEL,S,LOC,Y,-2
NSEL,R,LOC,Z,0
d,all,ux
d,all,uz
d,all,uy
finish
/solu
Nsel,s,loc,y,37
*Get,Ncount,node,0,count
F=250
!midspan test:150,1-d:400,2-d:250,4-d:160
f,all,Fy,-F/Ncount
allsel,all
cnvtol,f,,0.05,2,0.01
nsubst,200
outres,all,all
autots,1
ncnv,2
LNSRCH,AUTO
NLGEOM,OFF
neqit,200
pred,on
time,100
!Percent of the force you wanna go to
solve