Foreign Trade - JFTC
92
No. 46 主要内容 (本論編) Ⅰ.貿易概況 輸出/輸入/貿易収支と貿易総額/外国為替レートの変化と貿易指数の動き/四半期別増減寄与 Ⅱ.主要国別・地域別貿易 アジア(中国・韓国・台湾・ASEAN・タイ・インドネシア・その他アジア)/米国/ EU(ド イツ・英国)/大洋州/中南米(ブラジル・メキシコ)/ロシア/中東/アフリカ Ⅲ.主要商品別貿易 食料品/木材/鉱物性燃料/化学製品/鉄鋼/織物用糸・繊維製品、衣類・同付属品/電算機 類(含周辺機器)及び同部分品/半導体等電子部品/音響・映像機器/通信機/自動車/船舶・ 航空機類/科学光学機器 (資料編) 2020 年の日本の貿易/貿易構造/原油の輸入/為替相場/国際商品相場/日本経済の動向/ 技術貿易/国際収支/対外・対内直接投資/経済協力/国際比較/ 2020 年の主な動き/ 2021 年の政治・経済の主な日程/各国の貿易統計情報/わが国をめぐる経済連携協定の締結・ 交渉状況/ 2021 年度わが国貿易収支、経常収支の見通し 日本貿易の現状 Foreign Trade 2021 日本貿易の現状Foreign Trade 2021 新型コロナの影響を受け、貿易額は大幅に減少 輸出入とも2年連続マイナスだが、貿易収支は黒字転化 ISBN978-4-931574-33-5 C0033 ¥500E 定価 550円(本体500円+税)
Transcript of Foreign Trade - JFTC

No.46
主要内容(本論編)Ⅰ.貿易概況輸出/輸入/貿易収支と貿易総額/外国為替レートの変化と貿易指数の動き/四半期別増減寄与
Ⅱ.主要国別・地域別貿易アジア(中国・韓国・台湾・ASEAN・タイ・インドネシア・その他アジア)/米国/EU(ドイツ・英国)/大洋州/中南米(ブラジル・メキシコ)/ロシア/中東/アフリカ
Ⅲ.主要商品別貿易食料品/木材/鉱物性燃料/化学製品/鉄鋼/織物用糸・繊維製品、衣類・同付属品/電算機類(含周辺機器)及び同部分品/半導体等電子部品/音響・映像機器/通信機/自動車/船舶・航空機類/科学光学機器
(資料編)2020年の日本の貿易/貿易構造/原油の輸入/為替相場/国際商品相場/日本経済の動向/技術貿易/国際収支/対外・対内直接投資/経済協力/国際比較/2020年の主な動き/2021年の政治・経済の主な日程/各国の貿易統計情報/わが国をめぐる経済連携協定の締結・交渉状況/2021年度わが国貿易収支、経常収支の見通し
日本貿易の現状Foreign Trade
2021
日本貿易の現状 F
ore
ign
Tra
de
20
21
新型コロナの影響を受け、貿易額は大幅に減少輸出入とも2年連続マイナスだが、貿易収支は黒字転化
ISBN978-4-931574-33-5C0033 ¥500E
定価 550円(本体500円+税)

No.46
日本貿易の現状Foreign Trade
2021新型コロナの影響を受け、貿易額は大幅に減少輸出入とも2年連続マイナスだが、貿易収支は黒字転化
―はじめに― 5年前の2016年に起こった二つの想定外といえば、ピンとくる方も多いだろう。6月に行われたBREXITの是非を問う国民投票で離脱が残留を上回ったことと、11月のアメリカ大統領選挙においてトランプ氏が当選したことである。想定外の事態に呆然としつつ、不思議な既視感を覚えた記憶がある。 これら二つの想定外は、丁度昨年末から今年初めにかけて結末を迎えた。それに大きく影響を与えたのが新型コロナの世界的流行という新たな想定外だったのは、何とも皮肉なことだ。二つの想定外が収まることで、ディールではなく協調が、感情ではなく理性が、不確実性ではなく予測可能性が徐々に世界に戻ってくると思うが、荒波は未だ静まっていない。 振り返れば歴史は繰り返している。自国第一主義も世界的な疫病の流行も人類はここ100年余りの間に経験をしており、歴史を紐解けば得られる教訓や対策も多い。過去に比べ現代では脅威は驚くほど早く伝播するが、対処のスピードも(人為による遅延を除けば)飛躍的に早くなっている。 他方で温暖化をはじめとする地球規模の課題は年々深刻になっている。過去に前例や経験がないことへの対応に必要なのは、解決のための仮説を打ち立てる分析力と想像力だろう。AIやDXによって、人類は人知をはるかに上回る分析力を手に入れた一方で、想像力については依然として人知に頼る部分が大きい。そう思われてきた。AIは鳥を見て空を飛びたいとは思わない。しかし演算速度の進歩により、大量のデータをAIに注ぎ込むことで将来を予測し、対策を立てることが出来るようになってきた。過去に経験があるものは記録を紐解き、経験がないものはデータの解析と演算により将来を精緻に予想することが可能になりつつある。 経験があるものにもないものにも、先を予想して対応するのに重要なのはデータである。知らぬ間に掛かった色眼鏡を外し、フェイクニュースやオルタナティブファクトの誘惑に負けることなく、内に潜むバイアスをも乗り越えて、データが語ることに真摯に耳を傾けたい。 大航海時代を支えたのは、いにしえから空を眺めて得た膨大な天測データと、それをもとに船の位置を知ることを可能にした四分儀(六分儀の原型)だった。我々もデータを手掛かりに大海原に漕ぎ出そうではないか。 本誌の創刊は1976年、先人から脈々と引き継いで46号を迎えた。想定外のことが起こった2020年のデータで更新された本誌が、過去を知り未来を見通す一助となれば幸いである。
日本貿易会 政策業務第三グループ長 兼 調査グループ長 山本 大介
―Introduction―Many of you may easily recall two big surprises that
happened five years ago in 2016.One was the UK Referendum in June that resulted in
the BREXIT as the votes for Leave surpassed the votes for Remain. Another was the USA presidential election in November that resulted in the triumph of Mr. Trump. I was taken aback by these unexpected results, but at the same time, I remember this inexplicable sense of déjà vu.
These two unexpected events have reached their finales toward the end of 2020 and in early 2021. Ironically, a newly emerged unforeseen event, COVID-19 pandemic, had a huge impact on both of them. Once those unexpected events die down, I expect to see cooperation over negotiation, reason over emotion, and predictability over uncertainty eventually back in the world. However, we are still in the midst of this turmoil.
Looking back, we can see that history repeats itself. During the past one hundred years or so, we already have experienced nationalisms and pandemics. And the experiences can teach us many lessons and measures. Any threats can travel faster now than in the past, but the development of countermeasures is also as dramatically rapid unless there’s an intended/unintended sabotage involved.
In the meantime, world-wide challenges including g lobal warming are becoming more and more critical every year. To find countermeasures against unexperienced challenges, what we need is our ability to analyze and to be creative so that we can come up with hypotheses that lead us to the best answer. Although we now own the power to analyze beyond human capacity thanks to the artificial intelligence (AI) and digital transformation, creative thinking still depends heavily on human capacity. At least, we have believed so. AI doesn’t dream of flying by watching a bird fly. However, it allows us to be able to predict future events and seek for countermeasures thanks to the huge amount of data in it and its advancing operation speed. By learning from the past records together with analyzing and calculating the data over unexperienced events, we are beginning to be able to predict the future more precisely.
With or without experiences, what is important is to have data to predict and be ready for the future. We shall carefully listen to what data has to say without prejudices that we even don’t realize that we developed them or without giving in to the temptation of fake news and “alternative facts”, and biases behind them.
In the Age of Exploration, people sailed out to the vast expanse of the oceans with a great deal of celestial observation data that people accumulated by looking in the sky since ancient times and the quadrant (the ancestor of sextant) that enabled people to know the location of the ship based on that data. Let us also sail out to the ocean of global trade with data in hand.
Since 1976 when the “Foreign Trade” was first published, it has been carried on to the 46th edition this year. I sincerely hope that this will be of help to you in learning from the past and foreseeing the future through the data presented here of the year 2020, a year of an unanticipated event.
YAMAMOTO DaisukeGroup Leader,
Third Policy Proposal Group & Research GroupJapan Foreign Trade Council, Inc.
本書のご利用にあたって
1. 財務省「通関統計」の発表時期の関係により、本書記載の2020年分につきましては以下の数値を採用しています。
①輸 出 : 確報値 ②輸 入 : 速報値2. 本書は日英併記となっています。ただし、図表の一部は英文表記のみで、品目の表記は以下の表の略記を用いています。
統計品目表 Statistical Classification of Commodities
About this data book
1. The information used in this data book is based on the Trade Statistics issued by the Ministry of Finance. Due to the availability of the data, the figures for 2020 used in this book are as follows:
①Export: Detailed Data ②Import :Provisional Data (HS-code Basis)2. This is written both in Japanese and English. However,
some of the charts are only labeled in English and commodity names are written in abbreviations in the chart below.
輸出 Export 輸入 Import輸出総額 Grand Total 輸入総額 Grand Total1.食料品 Foodstuff 1.食料品 Foodstuff2.原料品 Raw Materials 魚介類・同調製品 Fish & Fish Preparation3.鉱物性燃料 Mineral Fuels 肉類・同調製品 Meat & Meat Preparation4.化学製品 Chemicals 穀物・同調製品 Cereals, Cereal Preparation有機化合物 Organic Chemicals 野菜 Vegetables医薬品 Medical Products 果実 Fruitsプラスチック Plastic Materials 2.原料品 Raw Materials
5.原料別製品 Manufactured Goods 木材 Wood鉄鋼 Iron & Steel Products 非鉄金属鉱 Ore of Nonferrous非鉄金属 Nonferrous Metals 鉄鉱石 Iron Ore & Concentrates金属製品 Manufactures of Metals 大豆 Soy Beans織物用糸・繊維製品 Textile Yarn, Fabrics 3.鉱物性燃料 Mineral Fuels非金属鉱物製品 Non-metallic Mineral Ware 原油及び粗油 Petroleumゴム製品 Rubber manufactured 石油製品 Petroleum Products紙類・紙製品 Paper & Paper Manufactures (揮発油) (Petroleum Spirits)
6.一般機械 Machinery 液化天然ガス LNG原動機 Power Generating Machine 液化石油ガス LPG電算機類(含周辺機器) Computers & Units 石炭 Coal電算機類の部分品 Parts of Computer 4.化学製品 Chemicals半導体等製造装置 Semicon Machinery etc. 有機化合物 Organic Chemicals金属加工機械 Metalworking Machinery 医薬品 Medical Productsポンプ・遠心分離機 Pump & Centrifuges 5.原料別製品 Manufactured Goods建設用・鉱山用機械 Construction Machines 鉄鋼 Iron & Steel Products荷役機械 Mechanical Handling Equip. 非鉄金属 Nonferrous Metals加熱用・冷却用機器 Heating or Cooling Equipments 金属製品 Manufactures of Metals繊維機械 Textile Machines 織物用糸・繊維製品 Textile Yarn, Fabricsベアリング Ball or Roller Bearings 非金属鉱物製品 Non-metallic Mineral Ware
7.電気機器 Electrical Machinery 木製品等(除家具) Wood & Cork manufactured半導体等電子部品 Semiconductors etc. 6.一般機械 Machinery(IC) (IC) 原動機 Power Generating Machine音響・映像機器 Audio & Visual Apparatus 電算機類(含周辺機器) Computers & Units(映像記録・再生機器) (Video Rec. or Repro App.) 電算機類の部分品 Parts of Computer(テレビ受像機) (Television Receivers) 7.電気機器 Electrical Machinery音響・映像機器の部分品 Parts of Audio, Visual App. 半導体等電子部品 Semiconductors etc.重電機器 Electrical Power Machinery (IC) (IC)通信機 Telephony, Telegraphy 絶縁電線・絶縁ケーブル Insulated Wire and Cable電気計測機器 Electrical Measuring 音響映像機器(含部品) Audio & Visual Apparatus電気回路等の機器 Electrical Apparatus 重電機器 Electrical Power Machinery電池 Batteries & Accumulators 通信機 Telephony, Telegraphy
8.輸送用機器 Transport Equipment (電話機) (Telephone Sets)自動車 Motor Vehicles 電気計測機器 Electrical Measuring(乗用車) (Passenger Motor Car) 8.輸送用機器 Transport Equipment(バス・トラック) (Buses & Trucks) 自動車 Motor Vehicles自動車の部分品 Parts of Motor Vehicles 自動車の部分品 Parts of Motor Vehicles二輪自動車 Motorcycles, Autocycles 航空機類 Aircraft航空機類 Aircraft 9.その他 Others船舶 Ships 科学光学機器 Scientific, Optical Inst.
9.その他 Others 衣類・同付属品 Clothing & Accessories科学光学機器 Scientific, Optical Inst. 家具 Furniture写真用・映画用材料 Photographic Supplies バック類 Bags

The Trade Statistics of Japan are the information on exports from Japan to foreign countries and imports to Japan from foreign countries based on the customs declaration required and submitted to the customs for clearance in accordance with Japan’s Customs Law (for this reason, it is also called Customs Statistics) and are periodically issued by the Ministry of Finance. There are three types of foreign trade related statistics: (1) Trade Statistics, (2) Other Trade Related Statistics*, and (3) Statistics on Arrival of Aircraft & Entrance of Vessels. In general, statistics on trade refers only to the type (1). Trade Statistics do not include the following: low-value (less than 200,000 yen) exports/imports, travelers’ belongings, smuggled items, gifts of no commercial value, goods under temporary admission procedure (released temporarily for trade fairs, exhibitions, etc. or shipping containers for repetitive uses). Exports are booked on FOB (free on board) basis, which means freight and insurance etc. are not included, and imports are booked on CIF (cost, insurance and freight) basis, which means freight and insurance etc. are included. Among the trade statistics, export/import value for the first 10 days and the first 20 days of the month are also issued enabling people in trade business to capture trends before the end of the month. Preliminary reports of the month are quickly issued around 20th of the following month. These reports also provide information by commodity, by area or country, and trade indices and make it possible to capture export/import trends and analyze in detail. Preliminary reports on export/import values of the previous month by major commodities and by trade partners are released by the Ministry of Finance as well as regional customs around 20th of the month. The Ministry of Finance also releases the Japan’s total trade value for the previous month, for the first 10 days (released in the period between 21st and the end of the month), and for first 20 days (released within the first 10 days the following month). Published trade statistics are available online. Statistics by regional customs are also available in addition to aggregated national data. Each customs’ web site also provides trade related information as well as seasonable topics to raise more awareness of the trade statistics.
*Other Trade Related Statistics include the following: Statistics on Gold Coins and Monetary Gold, Statistics on Equipment and Consuming Goods Loaded on Ships/Aircraft Engaged in External Trade, and Statistics on Goods in Transit.
「貿易統計」とは、関税法の規定に基づき、日本から外国への輸出及び外国から日本への輸入について、税関に提出された輸出入の申告を集計し、定期的に財務省が公表している統計です。この統計は、税関を通過する際に提出された輸出入の申告書等に基づいて作成されていることから「通関統計」とも呼ばれています。外国貿易等に関する統計には、(1)普通貿易統計、(2)特殊貿易統計*、(3)船舶・航空機統計の3種類があり、貿易統計といった場合、通常は普通貿易統計のことを指します。貿易統計には輸出入のうち少額貨物(1件当たり 20万円以下の貨物)、旅客用品、密輸品、 無償の寄贈品、無償の一時的輸出入貨物(例えば、興行用品、見本市等への出品物又は運送のため反復使用されるコンテナ類)等は含まれていません。また計上価格は、輸出では運賃・保険料等を含まないFOB(本船渡し)価格、一方の輸入は運賃・保険料等を含むCIF(運賃保険料込み)価格で計上されています。貿易統計は、各月の上旬、上中旬分の輸出入金額が順次発表されるため月間の貿易動向を事前に知ることができ、月次の速報も翌月下旬には発表されるなど速報性に優れています。その他、品目別、地域(国)別、貿易指数等のデータも利用可能なため、輸出入動向を詳細に分析することが可能です。公表時期は毎月20日前後であり、前月分の輸出入額の「速報値」を主要品目・主要国ベースで財務省及び各税関でプレス発表しています。全国分の輸出入総額については財務省が公表しており、上旬分(当月下旬公表)、上中旬分(翌月上旬公表)も公表しています。公表された貿易統計は、インターネットによる閲覧が可能であり、全国分の他に統計報告税関別のデ―タも入手可能です。なお各税関では貿易統計を広く理解してもらう取り組みとして、貿易に関する情報や季節の話題などを特集して発表しています。*金貨及び貨幣用金についての金統計、積み込まれた船用品・機用品についての船用品・機用品統計、本邦を通過する外国貨物についての通過貿易統計の3つにより構成される統計。
貿易統計とは What are The Trade Statistics of Japan?
税関名 管轄函館税関 北海道、青森県、岩手県及び秋田県
東京税関 山形県、群馬県、埼玉県、千葉県(一部)、東京都、新潟県及び山梨県
横浜税関 宮城県、福島県、茨城県、栃木県、千葉県(一部)及び神奈川県名古屋税関 長野県、岐阜県、静岡県、愛知県及び三重県
大阪税関 富山県、石川県、福井県、滋賀県、京都府、大阪府、奈良県及び和歌山県
神戸税関 兵庫県、鳥取県、島根県、岡山県、広島県、徳島県、香川県、愛媛県及び高知県
門司税関 山口県、福岡県(一部)、佐賀県(一部)、長崎県(一部)、大分県及び宮崎県
長崎税関 福岡県(一部)、佐賀県(一部)、長崎県(一部)、熊本県及び鹿児島県
沖縄地区税関 沖縄県
Source: 文章は財務省の公式サイトなどを基に日本貿易会作成。 表は税関の公式サイトを基に日本貿易会作成。 図は税関の公式サイト。 (Text) Prepared by JFTC based on MOF’s website etc. (Table) Prepared by JFTC based on Japan Customs’ website. (Chart) Japan Customs’ website.

日本貿易の現状 -2021年版- 目次Foreign Trade 2021 Index
本論編 Main Chapter
Ⅰ.貿易概況 ・・・・・・・・・・・・・・・・・・・・・・・・・・・・・・・・・・・・・・・・・・・・・・・・・・・・・・・・・・・・・・・・・・・・・・・・・・・・・・・・・・・・・・・・・・・・・・・・・・・・・・・・・・・・・・・・・・・・ 2
Overview of Trade ・・・・・・・・・・・・・・・・・・・・・・・・・・・・・・・・・・・・・・・・・・・・・・・・・・・・・・・・・・・・・・・・・・・・・・・・・・・・・・・・・・・・・・・・・・・・・・・・・・・・・・ 3
1.輸出:2年連続の減少、新型コロナが響く、過去11番目の水準 ・・・・・・・・・・・・・・・・・・・・・・・・・・・・・・・・・・・・・・・・ 2
Exports: Exports down for second consecutive year reflecting impact of COVID-19,
eleventh lowest on record ・・・・・・・・・・・・・・・・・・・・・・・・・・・・・・・・・・・・・・・・・・・・・・・・・・・・・・・・・・・・・・・・・・・・・・・・・・・・・・・・・・・・・・・・・ 3
2.輸入:2年連続の減少、原油価格下落で大幅減、過去11番目の水準 ・・・・・・・・・・・・・・・・・・・・・・・・・・・・・・・・・ 4
Imports: Imports down for second consecutive year, declined crude oil price contributes
sharp drop, eleventh lowest on record ・・・・・・・・・・・・・・・・・・・・・・・・・・・・・・・・・・・・・・・・・・・・・・・・・・・・・・・・・・・・・・・・・・・・・・・・ 5
3.貿易収支と貿易総額:3年ぶりの貿易黒字、貿易総額は136.1兆円 ・・・・・・・・・・・・・・・・・・・・・・・・・・・・・・・・・・ 6
Total Trade Value and Trade Balance (Customs-cleared Basis): Surplus after deficit for
two years, Total Trade Value of ¥136.1 trillion ・・・・・・・・・・・・・・・・・・・・・・・・・・・・・・・・・・・・・・・・・・・・・・・・・・・・・・・・・・・・・・・・ 7
4.外国為替レートの変化と貿易指数の動き ・・・・・・・・・・・・・・・・・・・・・・・・・・・・・・・・・・・・・・・・・・・・・・・・・・・・・・・・・・・・・・・・・・・ 8
Foreign Exchange and Trade Index Fluctuations ・・・・・・・・・・・・・・・・・・・・・・・・・・・・・・・・・・・・・・・・・・・・・・・・・・・・・・・・・・・・ 9
⑴外国為替レート:3年連続で円高が進行 ・・・・・・・・・・・・・・・・・・・・・・・・・・・・・・・・・・・・・・・・・・・・・・・・・・・・・・・・・・・・・・・・・ 8
Foreign Exchange: Yen continues appreciating for third consecutive year ・・・・・・・・・・・・・・・・・・・・・・ 9
⑵輸出指数:数量のマイナスにより、輸出金額は2年連続で減少 ・・・・・・・・・・・・・・・・・・・・・・・・・・・・・・・・・・ 8
Export Indices: Export value down for second consecutive year, reflecting
declined volume ・・・・・・・・・・・・・・・・・・・・・・・・・・・・・・・・・・・・・・・・・・・・・・・・・・・・・・・・・・・・・・・・・・・・・・・・・・・・・・・・・・・・・・・・・・・・・・・・・・ 9
⑶輸入指数:数量・価格ともマイナスで、輸入金額は2年連続で減少 ・・・・・・・・・・・・・・・・・・・・・・・・・・・・ 8
Import Indices: Both import volume and unit value indices negative
Import value index negative for second consecutive year ・・・・・・・・・・・・・・・・・・・・・・・・・・・・・・・・・・・・・・・・・・・・ 9
5.四半期別増減寄与 Quarterly Contribution ・・・・・・・・・・・・・・・・・・・・・・・・・・・・・・・・・・・・・・・・・・・・・・・・・・・・・・・・・・・・・・・・・・ 10
⑴国別 By Country ・・・・・・・・・・・・・・・・・・・・・・・・・・・・・・・・・・・・・・・・・・・・・・・・・・・・・・・・・・・・・・・・・・・・・・・・・・・・・・・・・・・・・・・・・・・・・・・ 10
⑵商品別 By Commodity ・・・・・・・・・・・・・・・・・・・・・・・・・・・・・・・・・・・・・・・・・・・・・・・・・・・・・・・・・・・・・・・・・・・・・・・・・・・・・・・・・・・・・・・ 11
Ⅱ.主要国別・地域別貿易 ・・・・・・・・・・・・・・・・・・・・・・・・・・・・・・・・・・・・・・・・・・・・・・・・・・・・・・・・・・・・・・・・・・・・・・・・・・・・・・・・・・・・・・・・・・・・・・・・・ 12
Trade by Major Area and Country ・・・・・・・・・・・・・・・・・・・・・・・・・・・・・・・・・・・・・・・・・・・・・・・・・・・・・・・・・・・・・・・・・・・・・・・・・・・・・・・ 13
1.アジア:貿易収支は4.6兆円の黒字、貿易総額は73.8兆円 ・・・・・・・・・・・・・・・・・・・・・・・・・・・・・・・・・・・・・・・・・・・・・ 12
Asia: Balance of trade surplus of ¥4.6 trillion, Total Trade Value of ¥73.8 trillion ・・・・・・・・・・・・・・・・・・・ 13
⑴中国:輸出は2年ぶりに増加、輸入は2年連続の減少 ・・・・・・・・・・・・・・・・・・・・・・・・・・・・・・・・・・・・・・・・・・・・・・・・・ 14
China: Exports up after one year of decrease, imports down for second consecutive year ・・・ 15
⑵韓国:輸出は3年連続、輸入は2年連続の減少 ・・・・・・・・・・・・・・・・・・・・・・・・・・・・・・・・・・・・・・・・・・・・・・・・・・・・・・・・・・ 16
Korea: Exports up for three years and imports down for two years ・・・・・・・・・・・・・・・・・・・・・・・・・・・・・・・ 17
⑶台湾:輸出は4年連続の増加、輸入は2年連続の減少 ・・・・・・・・・・・・・・・・・・・・・・・・・・・・・・・・・・・・・・・・・・・・・・・・・ 18
Taiwan: Exports up for four years, imports down for two years ・・・・・・・・・・・・・・・・・・・・・・・・・・・・・・・・・・・・ 19
⑷ ASEAN:輸出入とも2年連続の減少 ・・・・・・・・・・・・・・・・・・・・・・・・・・・・・・・・・・・・・・・・・・・・・・・・・・・・・・・・・・・・・・・・・・・・・・ 20
ASEAN: Both exports and imports down for second consecutive year ・・・・・・・・・・・・・・・・・・・・・・・・・・ 21
⑸タイ:輸出入とも2年連続の減少 ・・・・・・・・・・・・・・・・・・・・・・・・・・・・・・・・・・・・・・・・・・・・・・・・・・・・・・・・・・・・・・・・・・・・・・・・・・ 22
Thailand: Both exports and imports down for second consecutive year ・・・・・・・・・・・・・・・・・・・・・・・・ 23
⑹インドネシア:輸出入とも2年連続の減少 ・・・・・・・・・・・・・・・・・・・・・・・・・・・・・・・・・・・・・・・・・・・・・・・・・・・・・・・・・・・・・ 24
Indonesia: Both exports and imports down for second consecutive year ・・・・・・・・・・・・・・・・・・・・・・・ 25
⑺その他アジア:輸出入とも2年連続の減少 ・・・・・・・・・・・・・・・・・・・・・・・・・・・・・・・・・・・・・・・・・・・・・・・・・・・・・・・・・・・・・ 26
Other Asian countries: Both exports and imports down for second consecutive year ・・・・・・・ 27
2.米国:輸出入とも2年連続の減少 ・・・・・・・・・・・・・・・・・・・・・・・・・・・・・・・・・・・・・・・・・・・・・・・・・・・・・・・・・・・・・・・・・・・・・・・・・・・・・・ 28
USA: Both exports and imports down for second consecutive year ・・・・・・・・・・・・・・・・・・・・・・・・・・・・・・・・・・ 29
3.EU:輸出は2年連続の減少、輸入は4年ぶりの減少 ・・・・・・・・・・・・・・・・・・・・・・・・・・・・・・・・・・・・・・・・・・・・・・・・・・・・・・・ 30
EU: Exports down for two years, imports turn downward after increasing for three years ・・・・・ 31
⑴ドイツ:輸出入とも2年連続の減少 ・・・・・・・・・・・・・・・・・・・・・・・・・・・・・・・・・・・・・・・・・・・・・・・・・・・・・・・・・・・・・・・・・・・・・・・ 32
Germany: Both exports and imports down for second consecutive year ・・・・・・・・・・・・・・・・・・・・・・・ 33
⑵英国:輸出入とも2年連続の減少 ・・・・・・・・・・・・・・・・・・・・・・・・・・・・・・・・・・・・・・・・・・・・・・・・・・・・・・・・・・・・・・・・・・・・・・・・・・ 34
UK: Both exports and imports down for second consecutive year ・・・・・・・・・・・・・・・・・・・・・・・・・・・・・・・・ 35
4.大洋州:輸出入とも2年連続の減少 ・・・・・・・・・・・・・・・・・・・・・・・・・・・・・・・・・・・・・・・・・・・・・・・・・・・・・・・・・・・・・・・・・・・・・・・・・・・ 36
Oceania: Both exports and imports down for second consecutive year ・・・・・・・・・・・・・・・・・・・・・・・・・・・・・ 37
5.中南米:輸出入とも2年連続の減少 ・・・・・・・・・・・・・・・・・・・・・・・・・・・・・・・・・・・・・・・・・・・・・・・・・・・・・・・・・・・・・・・・・・・・・・・・・・・ 38
Central South America: Both exports and imports down for second consecutive year ・・・・・・・・・ 39
⑴ブラジル:輸出は2年連続の減少、輸入は2年ぶりに減少 ・・・・・・・・・・・・・・・・・・・・・・・・・・・・・・・・・・・・・・・・・・ 40
Brazil: Exports down for two years, imports down after increasing for one year ・・・・・・・・・・・・・・ 41
⑵メキシコ:輸出入とも2年連続の減少 ・・・・・・・・・・・・・・・・・・・・・・・・・・・・・・・・・・・・・・・・・・・・・・・・・・・・・・・・・・・・・・・・・・・・ 42
Mexico: Both exports and imports down for second consecutive year ・・・・・・・・・・・・・・・・・・・・・・・・・・ 43
6.ロシア:輸出入とも2年連続の減少 ・・・・・・・・・・・・・・・・・・・・・・・・・・・・・・・・・・・・・・・・・・・・・・・・・・・・・・・・・・・・・・・・・・・・・・・・・・・ 44
Russia: Both exports and imports down for second consecutive year ・・・・・・・・・・・・・・・・・・・・・・・・・・・・・・・ 45
7.中東:輸出入ともに2年連続の減少 ・・・・・・・・・・・・・・・・・・・・・・・・・・・・・・・・・・・・・・・・・・・・・・・・・・・・・・・・・・・・・・・・・・・・・・・・・・・ 46
Middle East: Both exports and imports down for second consecutive year ・・・・・・・・・・・・・・・・・・・・・・・・ 47
8.アフリカ:輸出は4年ぶりに減少、輸入は横ばい ・・・・・・・・・・・・・・・・・・・・・・・・・・・・・・・・・・・・・・・・・・・・・・・・・・・・・・・・・ 48
Africa: Exports down after increasing for three years, imports flat ・・・・・・・・・・・・・・・・・・・・・・・・・・・・・・・・・・・・・ 49
Ⅲ.主要商品別貿易 ・・・・・・・・・・・・・・・・・・・・・・・・・・・・・・・・・・・・・・・・・・・・・・・・・・・・・・・・・・・・・・・・・・・・・・・・・・・・・・・・・・・・・・・・・・・・・・・・・・・・・・・・・・・ 50
Trade by Major Commodity ・・・・・・・・・・・・・・・・・・・・・・・・・・・・・・・・・・・・・・・・・・・・・・・・・・・・・・・・・・・・・・・・・・・・・・・・・・・・・・・・・・・・・・・・ 51
1.食料品:輸出は8年連続の増加、輸入は2年連続の減少 ・・・・・・・・・・・・・・・・・・・・・・・・・・・・・・・・・・・・・・・・・・・・・・・・・ 50
Foodstuff: Exports up for eighth consecutive year, imports down for second
consecutive year ・・・・・・・・・・・・・・・・・・・・・・・・・・・・・・・・・・・・・・・・・・・・・・・・・・・・・・・・・・・・・・・・・・・・・・・・・・・・・・・・・・・・・・・・・・・・・・・・・・・・・ 51
2.木材:輸入は2年連続の減少 ・・・・・・・・・・・・・・・・・・・・・・・・・・・・・・・・・・・・・・・・・・・・・・・・・・・・・・・・・・・・・・・・・・・・・・・・・・・・・・・・・・・・ 52
Wood: Imports down for second consecutive year ・・・・・・・・・・・・・・・・・・・・・・・・・・・・・・・・・・・・・・・・・・・・・・・・・・・・・・・・ 53
3.鉱物性燃料:輸出は4年ぶり、輸入は2年連続の減少 ・・・・・・・・・・・・・・・・・・・・・・・・・・・・・・・・・・・・・・・・・・・・・・・・・・・・ 54
Mineral Fuels: Exports down for first time in four years, imports down for second
consecutive year ・・・・・・・・・・・・・・・・・・・・・・・・・・・・・・・・・・・・・・・・・・・・・・・・・・・・・・・・・・・・・・・・・・・・・・・・・・・・・・・・・・・・・・・・・・・・・・・・・・・・・ 55
4.化学製品:輸出入とも2年連続の減少 ・・・・・・・・・・・・・・・・・・・・・・・・・・・・・・・・・・・・・・・・・・・・・・・・・・・・・・・・・・・・・・・・・・・・・・・・ 56
Chemicals: Both exports and imports down for second consecutive year ・・・・・・・・・・・・・・・・・・・・・・・・・・ 57
5.鉄鋼:輸出入とも2年連続の減少 ・・・・・・・・・・・・・・・・・・・・・・・・・・・・・・・・・・・・・・・・・・・・・・・・・・・・・・・・・・・・・・・・・・・・・・・・・・・・・・ 58
Iron & Steel Products: Both exports and imports down for second consecutive year ・・・・・・・・・・・ 59
6.織物用糸・繊維製品:輸出は2年連続の減少、輸入は2年ぶりに増加
衣類・同付属品:輸入は2年連続の減少 ・・・・・・・・・・・・・・・・・・・・・・・・・・・・・・・・・・・・・・・・・・・・・・・・・・・・・・・・・・・・・・・・・・・・ 60
Textile Yarn, Fabrics: Exports down for two years and imports up after three years of decline;
Clothing & Accessories: Imports down for two years ・・・・・・・・・・・・・・・・・・・・・・・・・・・・・・・・・・・・・・・・・・・・・・・・・・・・・ 61
7.電算機類(含周辺機器):輸出は3年連続の減少、輸入は4年連続の増加
電算機類の部分品:輸出は3年連続、輸入は4年ぶりの減少 ・・・・・・・・・・・・・・・・・・・・・・・・・・・・・・・・・・・・・・・・・・・ 62
Computers & Units: Exports down for third consecutive year, imports up for fourth
consecutive year; Parts of Computer:Exports down for third consecutive year,
imports down for the first time in four years ・・・・・・・・・・・・・・・・・・・・・・・・・・・・・・・・・・・・・・・・・・・・・・・・・・・・・・・・・・・・・・・・・・ 63
8.半導体等電子部品:輸出は2年ぶりに増加、輸入は2年連続の減少 ・・・・・・・・・・・・・・・・・・・・・・・・・・・・・・・・・ 64
Semiconductors etc.: Exports up after one year of decrease, imports down for two years ・・・・ 65
9.音響・映像機器:輸出は8年連続の減少、輸入は4年ぶりの減少 ・・・・・・・・・・・・・・・・・・・・・・・・・・・・・・・・・・・・・ 66
Audio & Visual Apparatus: Exports down for eighth consecutive year, imports down
after three years of increase ・・・・・・・・・・・・・・・・・・・・・・・・・・・・・・・・・・・・・・・・・・・・・・・・・・・・・・・・・・・・・・・・・・・・・・・・・・・・・・・・・・・・・・ 67
10.通信機:輸出は3年連続の減少、輸入は横ばい ・・・・・・・・・・・・・・・・・・・・・・・・・・・・・・・・・・・・・・・・・・・・・・・・・・・・・・・・・・・ 68
Telephony, Telegraphy: Exports down for third consecutive year, imports flat ・・・・・・・・・・・・・・・・・・・・ 69
11.自動車:輸出入とも2年連続の減少 ・・・・・・・・・・・・・・・・・・・・・・・・・・・・・・・・・・・・・・・・・・・・・・・・・・・・・・・・・・・・・・・・・・・・・・・・・ 70
Motor Vehicles: Both exports and imports down for second consecutive year ・・・・・・・・・・・・・・・・・・ 71

12.船舶・航空機類:航空機類輸入は3年ぶりに減少 ・・・・・・・・・・・・・・・・・・・・・・・・・・・・・・・・・・・・・・・・・・・・・・・・・・・・・・ 72
Ships and Aircraft: Aircraft imports down after increasing for two years ・・・・・・・・・・・・・・・・・・・・・・・・・・・ 73
13.科学光学機器:輸出は3年連続、輸入は2年連続の減少 ・・・・・・・・・・・・・・・・・・・・・・・・・・・・・・・・・・・・・・・・・・・・・・・・ 74
Scientific, Optical Instruments: Exports down for third consecutive year,
imports down for second consecutive year ・・・・・・・・・・・・・・・・・・・・・・・・・・・・・・・・・・・・・・・・・・・・・・・・・・・・・・・・・・・・・・・・ 75
資料編 Data Chapter
1.2020年の日本の貿易 Japan's Trade in 2020 ・・・・・・・・・・・・・・・・・・・・・・・・・・・・・・・・・・・・・・・・・・・・・・・・・・・・・・・・・・・・・・・・ 78
⑴ 月別貿易 Exports and Imports by Month ・・・・・・・・・・・・・・・・・・・・・・・・・・・・・・・・・・・・・・・・・・・・・・・・・・・・・・・・・・・・・・・・・・・・ 78
⑵ 貿易指数 Indices of Trade ・・・・・・・・・・・・・・・・・・・・・・・・・・・・・・・・・・・・・・・・・・・・・・・・・・・・・・・・・・・・・・・・・・・・・・・・・・・・・・・・・・・・・・・・ 79
⑶ 商品別輸出 Exports by Principal Commodity ・・・・・・・・・・・・・・・・・・・・・・・・・・・・・・・・・・・・・・・・・・・・・・・・・・・・・・・・・・・・・・ 80
⑷ 商品別輸入 Imports by Principal Commodity ・・・・・・・・・・・・・・・・・・・・・・・・・・・・・・・・・・・・・・・・・・・・・・・・・・・・・・・・・・・・・・ 81
⑸ 地域別輸出 Exports by Area/Country ・・・・・・・・・・・・・・・・・・・・・・・・・・・・・・・・・・・・・・・・・・・・・・・・・・・・・・・・・・・・・・・・・・・・・・・・ 82
⑹ 地域別輸入 Imports by Area/Country ・・・・・・・・・・・・・・・・・・・・・・・・・・・・・・・・・・・・・・・・・・・・・・・・・・・・・・・・・・・・・・・・・・・・・・・・ 83
⑺ 地域別貿易収支 Trade Balance by Area/Country ・・・・・・・・・・・・・・・・・・・・・・・・・・・・・・・・・・・・・・・・・・・・・・・・・・・・・・・・・ 84
⑻ 国別貿易(2020年) Exports and Imports by Area/Country ・・・・・・・・・・・・・・・・・・・・・・・・・・・・・・・・・・・・・・・・・・・・・ 85
2.貿易構造 Trade Structure ・・・・・・・・・・・・・・・・・・・・・・・・・・・・・・・・・・・・・・・・・・・・・・・・・・・・・・・・・・・・・・・・・・・・・・・・・・・・・・・・・・・・・・・・・・ 90
⑴ 貿易額と伸び率 Trade Value and Growth ・・・・・・・・・・・・・・・・・・・・・・・・・・・・・・・・・・・・・・・・・・・・・・・・・・・・・・・・・・・・・・・・・・・ 90
⑵ 地域別輸出構成比 Ratio of Exports by Area/Country ・・・・・・・・・・・・・・・・・・・・・・・・・・・・・・・・・・・・・・・・・・・・・・・・・・・・ 91
⑶ 地域別輸入構成比 Ratio of Imports by Area/Country ・・・・・・・・・・・・・・・・・・・・・・・・・・・・・・・・・・・・・・・・・・・・・・・・・・・・ 92
⑷ 地域別貿易収支 Trade Balance by Area/Country ・・・・・・・・・・・・・・・・・・・・・・・・・・・・・・・・・・・・・・・・・・・・・・・・・・・・・・・・・ 93
⑸ 主要地域別貿易 Trade by Major Area/Country ・・・・・・・・・・・・・・・・・・・・・・・・・・・・・・・・・・・・・・・・・・・・・・・・・・・・・・・・・・・・ 94
①対アジア貿易 Trade with Asia ・・・・・・・・・・・・・・・・・・・・・・・・・・・・・・・・・・・・・・・・・・・・・・・・・・・・・・・・・・・・・・・・・・・・・・・・・・・・・・・ 94
②対中国貿易 Trade with China ・・・・・・・・・・・・・・・・・・・・・・・・・・・・・・・・・・・・・・・・・・・・・・・・・・・・・・・・・・・・・・・・・・・・・・・・・・・・・・・・ 96
③対米国貿易 Trade with USA ・・・・・・・・・・・・・・・・・・・・・・・・・・・・・・・・・・・・・・・・・・・・・・・・・・・・・・・・・・・・・・・・・・・・・・・・・・・・・・・・・・ 98
④対EU貿易 Trade with EU ・・・・・・・・・・・・・・・・・・・・・・・・・・・・・・・・・・・・・・・・・・・・・・・・・・・・・・・・・・・・・・・・・・・・・・・・・・・・・・・・・・・・・・ 100
⑤対中東貿易 Trade with Middle East ・・・・・・・・・・・・・・・・・・・・・・・・・・・・・・・・・・・・・・・・・・・・・・・・・・・・・・・・・・・・・・・・・・・・・・・・ 102
⑹ 主要貿易相手先 Top 10 Trade Partners ・・・・・・・・・・・・・・・・・・・・・・・・・・・・・・・・・・・・・・・・・・・・・・・・・・・・・・・・・・・・・・・・・・・・・ 104
⑺ 貿易取引通貨別比率 Ratio of Trade by Currency ・・・・・・・・・・・・・・・・・・・・・・・・・・・・・・・・・・・・・・・・・・・・・・・・・・・・・・・・・ 106
⑻ 商品別輸出構成比 Ratio of Exports by Commodity ・・・・・・・・・・・・・・・・・・・・・・・・・・・・・・・・・・・・・・・・・・・・・・・・・・・・・・ 107
⑼ 商品別輸入構成比 Ratio of Imports by Commodity ・・・・・・・・・・・・・・・・・・・・・・・・・・・・・・・・・・・・・・・・・・・・・・・・・・・・・・ 108
⑽ 輸出入上位10品目 Top 10 Trade Commodities ・・・・・・・・・・・・・・・・・・・・・・・・・・・・・・・・・・・・・・・・・・・・・・・・・・・・・・・・・・・ 109
⑾ 製品輸入 Imports of Manufactured Products by Type ・・・・・・・・・・・・・・・・・・・・・・・・・・・・・・・・・・・・・・・・・・・・・・・・・・・ 110
⑿ 主要資源の輸入集中度(2020年) Major Resources-Dependency on Imports 2020 ・・・・・・・・・・ 111
⒀ 主要港別の貿易 Value of Trade by Port of Clearance ・・・・・・・・・・・・・・・・・・・・・・・・・・・・・・・・・・・・・・・・・・・・・・・・・・・・ 112
⒁ 航空貨物主要商品別貿易 Air Cargo Exports and Imports by Principal Commodity ・・・・・・・・・・・・ 113
3.原油の輸入 Imports of Petroleum ・・・・・・・・・・・・・・・・・・・・・・・・・・・・・・・・・・・・・・・・・・・・・・・・・・・・・・・・・・・・・・・・・・・・・・・・・・・・・・・ 114
⑴ 輸入額・輸入量・輸入価格(通関ベース) Value, Quantity and Unit Value
(Customs-cleared Basis) ・・・・・・・・・・・・・・・・・・・・・・・・・・・・・・・・・・・・・・・・・・・・・・・・・・・・・・・・・・・・・・・・・・・・・・・・・・・・・・・・・・・・・・・・・・ 114
⑵ 地域・国別輸入構成比(数量ベース) Ratio of Imports by Area/Country (Quantity Basis) ・・・ 114
⑶ OPECの動向 Recent OPEC Developments ・・・・・・・・・・・・・・・・・・・・・・・・・・・・・・・・・・・・・・・・・・・・・・・・・・・・・・・・・・・・・・・・ 115
4.為替相場 Foreign Exchange Rate ・・・・・・・・・・・・・・・・・・・・・・・・・・・・・・・・・・・・・・・・・・・・・・・・・・・・・・・・・・・・・・・・・・・・・・・・・・・・・・・ 116
⑴ 変動相場制移行後の円相場 Value of Yen after Introduction of Floating Exchange
Rate System ・・・・・・・・・・・・・・・・・・・・・・・・・・・・・・・・・・・・・・・・・・・・・・・・・・・・・・・・・・・・・・・・・・・・・・・・・・・・・・・・・・・・・・・・・・・・・・・・・・・・・・・・・・・・ 116
⑵ 2020年の東京外国為替市場 Foreign Exchange Rate in Tokyo interbank 2020 ・・・・・・・・・・・・・・・・・・ 117
⑶ 主要通貨の対ドル為替相場 Value of Major Currencies against the US Dollar ・・・・・・・・・・・・・・・・・・・・ 117
5.国際商品相場 Fluctuation of International Commodity ・・・・・・・・・・・・・・・・・・・・・・・・・・・・・・・・・・・・・・・・・・・・・・・・ 118
6.日本経済の動向 Developments in the Japanese Economy ・・・・・・・・・・・・・・・・・・・・・・・・・・・・・・・・・・・・・・・・・・・・ 119
⑴ 景気の変化 Change of the Economic Condition ・・・・・・・・・・・・・・・・・・・・・・・・・・・・・・・・・・・・・・・・・・・・・・・・・・・・・・・・・・ 119
⑵ 基調判断の変化 Assessment of the Current State of the Japanese Economy ・・・・・・・・・・・・・・・・・・ 120
7.技術貿易 Trade in Technology ・・・・・・・・・・・・・・・・・・・・・・・・・・・・・・・・・・・・・・・・・・・・・・・・・・・・・・・・・・・・・・・・・・・・・・・・・・・・・・・・・・・・ 122
8.国際収支(IMFベース) Balance of Payments ・・・・・・・・・・・・・・・・・・・・・・・・・・・・・・・・・・・・・・・・・・・・・・・・・・・・・・・・・・・・・ 123
⑴ 総括表 Summary ・・・・・・・・・・・・・・・・・・・・・・・・・・・・・・・・・・・・・・・・・・・・・・・・・・・・・・・・・・・・・・・・・・・・・・・・・・・・・・・・・・・・・・・・・・・・・・・・・・・ 123
⑵ サービス収支 Services Balance ・・・・・・・・・・・・・・・・・・・・・・・・・・・・・・・・・・・・・・・・・・・・・・・・・・・・・・・・・・・・・・・・・・・・・・・・・・・・・・・ 124
9.対外・対内直接投資(地域・業種別(2019年)) Outward/Inward Direct Investment
breakdown by Area and Industry (2019) ・・・・・・・・・・・・・・・・・・・・・・・・・・・・・・・・・・・・・・・・・・・・・・・・・・・・・・・・・・・・・・・・・・・・・・ 125
⑴ 対外直接投資(地域・業種別(2019年)) Outward Direct Investment by Area and
Industry (2019) ・・・・・・・・・・・・・・・・・・・・・・・・・・・・・・・・・・・・・・・・・・・・・・・・・・・・・・・・・・・・・・・・・・・・・・・・・・・・・・・・・・・・・・・・・・・・・・・・・・・・・・・ 125
⑵ 対内直接投資(地域・業種別(2019年)) Inward Direct Investment by Area and
Industry (2019) ・・・・・・・・・・・・・・・・・・・・・・・・・・・・・・・・・・・・・・・・・・・・・・・・・・・・・・・・・・・・・・・・・・・・・・・・・・・・・・・・・・・・・・・・・・・・・・・・・・・・・・・ 126
10.経済協力 Economic Cooperation ・・・・・・・・・・・・・・・・・・・・・・・・・・・・・・・・・・・・・・・・・・・・・・・・・・・・・・・・・・・・・・・・・・・・・・・・・・・・・ 127
⑴ わが国の経済協力 Japan's Economic Cooperation ・・・・・・・・・・・・・・・・・・・・・・・・・・・・・・・・・・・・・・・・・・・・・・・・・・・・ 127
⑵ わが国政府開発援助(ODA)の地域的配分 Japan's Distribution of ODA by Recipient Area ・・ 128
⑶ わが国政府開発援助(ODA)の受取国順位 Ranking of Top Recipients of Japan's ODA ・・・・・ 128
⑷ 日本が最大の援助供与国となっている国一覧 List of Countries in which Japan is their
Top Donor ・・・・・・・・・・・・・・・・・・・・・・・・・・・・・・・・・・・・・・・・・・・・・・・・・・・・・・・・・・・・・・・・・・・・・・・・・・・・・・・・・・・・・・・・・・・・・・・・・・・・・・・・・・・・・ 129
11.国際比較 Comparisons with Major Countries ・・・・・・・・・・・・・・・・・・・・・・・・・・・・・・・・・・・・・・・・・・・・・・・・・・・・・・・・・・・ 130
⑴ 貿易額 Trade Value ・・・・・・・・・・・・・・・・・・・・・・・・・・・・・・・・・・・・・・・・・・・・・・・・・・・・・・・・・・・・・・・・・・・・・・・・・・・・・・・・・・・・・・・・・・・・・・・ 130
⑵ 世界貿易に占めるシェア Share in the World Trade ・・・・・・・・・・・・・・・・・・・・・・・・・・・・・・・・・・・・・・・・・・・・・・・・・・・・ 131
⑶ 貿易の商品構成 Details of Traded Goods/Services ・・・・・・・・・・・・・・・・・・・・・・・・・・・・・・・・・・・・・・・・・・・・・・・・・・・・ 132
⑷ 貿易依存度 Trade Dependency ・・・・・・・・・・・・・・・・・・・・・・・・・・・・・・・・・・・・・・・・・・・・・・・・・・・・・・・・・・・・・・・・・・・・・・・・・・・・・・・ 133
⑸ 貿易特化係数 Trade Specialization Coefficient ・・・・・・・・・・・・・・・・・・・・・・・・・・・・・・・・・・・・・・・・・・・・・・・・・・・・・・・・・・・ 134
⑹ 交易条件 Terms of Trade ・・・・・・・・・・・・・・・・・・・・・・・・・・・・・・・・・・・・・・・・・・・・・・・・・・・・・・・・・・・・・・・・・・・・・・・・・・・・・・・・・・・・・・・ 134
⑺ 経常収支 Current Accounts ・・・・・・・・・・・・・・・・・・・・・・・・・・・・・・・・・・・・・・・・・・・・・・・・・・・・・・・・・・・・・・・・・・・・・・・・・・・・・・・・・・・ 135
⑻ 外貨準備高 Foreign Reserves ・・・・・・・・・・・・・・・・・・・・・・・・・・・・・・・・・・・・・・・・・・・・・・・・・・・・・・・・・・・・・・・・・・・・・・・・・・・・・・・・・ 135
⑼ 名目国内総生産 Nominal GDP ・・・・・・・・・・・・・・・・・・・・・・・・・・・・・・・・・・・・・・・・・・・・・・・・・・・・・・・・・・・・・・・・・・・・・・・・・・・・・・・ 136
⑽ 実質経済成長率 Real GDP Growth ・・・・・・・・・・・・・・・・・・・・・・・・・・・・・・・・・・・・・・・・・・・・・・・・・・・・・・・・・・・・・・・・・・・・・・・・・・ 136
⑾ その他の国・地域の実質経済成長率 Real GDP Growth in Other Areas/Countries ・・・・・・・・・・・ 137
⑿ 消費者物価上昇率 Changes in Consumer Prices ・・・・・・・・・・・・・・・・・・・・・・・・・・・・・・・・・・・・・・・・・・・・・・・・・・・・・・・ 137
⒀ 中央銀行政策金利等 Policy Interest Rate, etc. ・・・・・・・・・・・・・・・・・・・・・・・・・・・・・・・・・・・・・・・・・・・・・・・・・・・・・・・・・・・・ 138
⒁ 各国とのFTAカバー率比較 Comparison of FTA Coverage Ratio ・・・・・・・・・・・・・・・・・・・・・・・・・・・・・・・・・・・ 139
12.2020年の主な動き Development in Major Issues 2020 ・・・・・・・・・・・・・・・・・・・・・・・・・・・・・・・・・・・・・・・・・・・・・・ 140
13.2021年の政治・経済の主な日程 Major Political/Economic Events in 2021 ・・・・・・・・・・・・・・・・・・ 148
14.各国の貿易統計情報 Trade Statistics of Major Area/Country ・・・・・・・・・・・・・・・・・・・・・・・・・・・・・・・・・・・・・・ 149
15.わが国をめぐる経済連携協定の締結・交渉状況 EPAs etc. concluded or under
negotiation by Japan ・・・・・・・・・・・・・・・・・・・・・・・・・・・・・・・・・・・・・・・・・・・・・・・・・・・・・・・・・・・・・・・・・・・・・・・・・・・・・・・・・・・・・・・・・・・・・・・・ 150
16.2021年度わが国貿易収支、経常収支の見通し ・・・・・・・・・・・・・・・・・・・・・・・・・・・・・・・・・・・・・・・・・・・・・・・・・・・・・・・・・・・・・・・ 152
FY2021 Outlook for Japan's Trade Balance and Current Account ・・・・・・・・・・・・・・・・・・・・・・・・・・・・・・・・ 162

本 論 編Main Chapter

貿易概況 Overview of TradeⅠ Ⅰ本論編▶I.貿易概況2 Main Chapter▶I.Overview of Trade 3
Source: 財務省貿易統計より作成。 Compiled from MOF's Trade Statistics on a Customs-cleared Basis.
品目 Items
金額Value
(10億円)[¥ billion]
伸率Growth(%)
寄与度Contribution
degree(%)
自動車Motor Vehicles
9,580(11,971) ▲ 20.0 ▲ 3.1
半導体等電子部品Semiconductors etc.
4,077(4,006) 1.8 0.1
自動車の部分品Parts of Motor Vehicles
2,912(3,602) ▲ 19.1 ▲ 0.9
鉄鋼Iron & Steel Products
2,574(3,074) ▲ 16.3 ▲ 0.7
半導体等製造装置Semicon Machinery etc.
2,517(2,467) 2.0 0.1
上位5品目 合計Top 5 total 21,660 ー ▲ 4.5
全品目 合計Grand total
68,407(76,932) ▲ 11.1 ▲ 11.1
注:( )内の数字は2019年の金額。Note: Figures in ( ) are value in 2019.
相手国 Partners
金額Value
(10億円)[¥ billion]
伸率Growth(%)
寄与度Contribution
degree(%)
中国China
15,083(14,682) 2.7 0.5
米国USA
12,612(15,255) ▲ 17.3 ▲ 3.4
韓国Korea
4,766(5,044) ▲ 5.5 ▲ 0.4
台湾Taiwan
4,739(4,689) 1.1 0.1
香港Hong Kong
3,415(3,665) ▲ 6.8 ▲ 0.3
上位5ヵ国 合計Top 5 total 40,615 ー ▲ 3.5
全品目 合計Grand total
68,407(76,932) ▲ 11.1 ▲ 11.1
注:( )内の数字は2019年の金額。Note: Figures in ( ) are value in 2019.
1. Exports: Exports down for second consecutive year reflecting impact of COVID-19, eleventh lowest on record
◆ In 2020, Japan’s exports decreased for two years, falling 11% to ¥68.4 trillion. On a volume basis, exports went down 11.8% for two years. By commodity category, Motor Vehicles exports (USA, UAE, and UK), exports of Parts of Motor Vehicles (USA, Indonesia, and Thailand), and Mineral Fuels exports (Australia, USA, and Chile) declined reflecting the impact of COVID-19 pandemic.
◆ By area, exports to Asia went down 5% to ¥39.2 trillion. By country, exports to China (up 3% to ¥15.1 trillion) surpassed exports to USA (down 17% to ¥12.6 trillion). China became Japan’s largest export partner after being the second largest for one year.
◆ In 2020, the percentage of yen-denominated exports was 38% (up 1 percentage point from a year earlier).*Country, area or commodity names in parentheses indicate top contributors of the category. The same applies hereafter.
◆ 2020年の輸出は68.4兆円(前年比▲11%)となり、2年連続で減少した。数量ベースでも▲11.8%となり2年連続で減少した。商品別では、新型コロナウイルス感染拡大の影響などを背景に、自動車(米国、UAE、英国)、自動車の部分品(米国、インドネシア、タイ)、鉱物性燃料(オーストラリア、米国、チリ)などが減少した。
◆ 地域別では、アジア向けは39.2兆円(同▲5%)となった。また国別では中国向けが15.1兆円(同+3%)となり、米国向けの12.6兆円(同▲17%)を上回り、2年ぶりにわが国最大の輸出相手国となった。
◆ 2020年の輸出取引における円建て比率は、38%(同+1ポイント)となった。*文中におけるカッコ内の国・地域、品目は寄与度の高いものを意味する(次頁以降同)。
2011 12 13 14 15 16 17 18 19 20
100,000
80,000
60,000
40,000
20,000
0(C.Y.)
[¥ billion](10億円)
その他Others
ロシアRussia
中東Middle East
アジアAsia
EU
米国USA
10,018 11,188 12,928 13,649 15,225 14,143 15,113 15,470 15,255 12,6127,619 6,501 7,000 7,585 7,985 7,982 8,657 9,209 8,955
6,462
36,686 34,85537,867 39,518 40,329 37,107
42,920 44,736 41,32739,224
1,955 2,2622,478
2,988 3,1672,585
2,350 2,4342,356
1,809941 1,0051,069
972 618555
674 805783
62865,546 63,748
69,774 70,03675,61473,093
78,286 76,932
68,407
81,479
その他商品Other Commodities
輸送用機器TransportEquipment
電気機器Electrical Machinery
一般機械Machinery
原料別製品Manufactured Goods
化学製品Chemicals
2011 12 13 14 15 16 17 18 19 20
100,000
80,000
60,000
40,000
20,000
0(C.Y.)
[¥ billion](10億円)
6,798 6,365 7,507 7,818 7,759 7,123 8,192 8,922 8,739 8,5408,786 8,442 9,177 9,464 9,220 7,847 8,686 9,136 8,407 7,505
13,803 12,843 13,359 14,218 14,424 13,614 15,685 16,508 15,122 13,142
11,600 11,405 12,052 12,650 13,28912,322
13,695 14,142 13,20812,821
14,033 14,99516,332 16,907 18,141
17,33818,232 18,877
18,11814,455
76,93270,036
73,09369,774
63,74865,54668,407
75,614 78,28681,479
化学製品Chemicals
8,54012%
原料別製品Manufactured Goods
7,50511%
一般機械Machinery
13,14219%
電気機器ElectricalMachinery
12,82119%
輸送用機器TransportEquipment
14,45521%
その他Others9,41014%
食料品Foodstuff
7911%
原料品Raw Materials
1,0201% 鉱物性燃料
Mineral Fuels7231%
鉄鋼Iron & Steel
Products2,574
4%
半導体等電子部品Semiconductors etc.
4,0776%
自動車Motor
Vehicles9,58014%
自動車の部分品Parts of Motor
Vehicles2,912
4%Total
¥68,407billion
アジアAsia
39,22457%
北米North
America13,385
20%
中国China
15,08322%
韓国Korea4,766
7%
台湾Taiwan4,739
7%
香港Hong Kong
3,4155%
タイThailand
2,7234%
大洋州Oceania1,688
2%
米国USA
12,61218%
中南米CentralSouth
America2,285
3%
西欧WesternEurope7,65411%
中東欧・ロシア等Central & Eastern
Europe, Russia, etc.1,513
2%中東
MiddleEast
1,8093%
アフリカAfrica8481%
Total¥68,407billion
■2020 対世界輸出(国・地域別) Exports to World by Area/Country●輸出国・地域内訳 Exports, by Area/Country ●輸出商品内訳 Exports, by Commodity●輸出上位国 Top Countries by Value of Exports ●輸出上位品目 Top Items by Value of Exports
●輸出推移(国・地域別) Exports to World by Area/Country ●輸出推移 (商品別) Exports to World by Commodity
■2020 対世界輸出(商品別) Exports to World by Commodity
1.輸出:2年連続の減少、新型コロナが響く、過去11番目の水準

2. Imports: Imports down for second consecutive year, declined crude oil price contributes sharp drop, eleventh lowest on record
◆ In 2020, Japan’s imports decreased for two years, falling 14% to ¥67.7 trillion. On a volume basis, imports went down for two years, declining 6.6%. By commodity category, imports of Petroleum (Saudi Arabia, UAE, and Qatar), LNG (Liquefied Natural Gas) (Australia, Qatar, and Indonesia), and Coal (Australia, USA, and Indonesia) decreased, reflecting declined crude oil price.
◆ By country, imports from China, Japan’s largest import partner, decreased for two years, falling 5.3% to ¥17.5 trillion.
◆ Mineral Fuels imports accounted for 17% (down 5 percentage points from a year earlier) of Japan’s imports as the price of crude oil (CIF) declined for two years (down 29% to $47/barrel). The ratio of product imports was 67% (up 4 percentage points).
◆ The percentage of yen-denominated imports in 2020 was 27% (up 2 percentage points from a year earlier).
2.輸入:2年連続の減少、原油価格下落で大幅減、過去11番目の水準
◆ 2020年の輸入は、67.7兆円(前年比▲14%)となり、2年連続で減少した。数量ベースでも▲6.6%と2年連続で減少した。商品別では、原油価格の下落を背景に原油及び粗油(サウジアラビア、UAE、カタール)、LNG(オーストラリア、カタール、インドネシア)、石炭(オーストラリア、米国、インドネシア)が減少した。
◆ 国別では、最大の輸入相手国である中国からの輸入が17.5兆円(▲5.3%)となり、2年連続で減少した。
◆ 輸入に占める鉱物性燃料のシェアは、原油入着価格が47ドル/バレル(同▲29%)と2年連続で下落したことを受け、17%(同▲5ポイント)となった。また、製品輸入比率は67%(同+4ポイント)となった。
◆ 2020年の輸入取引における円建て比率は、27%(同+2ポイント)となった。
その他Others
ロシアRussia
中東Middle East
アジアAsia
EU
米国USA
2011 12 13 14 15 16 17 18 19 20
100,000
80,000
60,000
40,000
20,000
0(C.Y.)
[¥ billion](10億円)
5,931 6,082 6,815 7,543 8,060 7,322 8,090 9,015 8,6406,411 6,642 7,649 8,169 8,625 8,152 8,757 9,718 9,722
30,391 31,30635,972 38,618 38,358
33,19937,026 39,218 37,413
12,832 13,54215,667
15,826 9,571
6,5018,243
10,3758,852
1,514 1,660
2,3082,619
1,905
1,2271,551
1,7231,561
78,60070,68968,111
82,70385,909
81,243 78,40675,379
66,042
7,4277,789
34,610
5,5571,146
67,737
その他商品Other Commodities
電気機器Electrical Machinery
一般機械Machinery
化学製品Chemicals
鉱物性燃料Mineral Fuels
食料品Foodstuff
2011 12 13 14 15 16 17 18 19 20
100,000
80,000
60,000
40,000
20,000
0(C.Y.)
[¥ billion](10億円)
5,854 5,852 6,473 6,732 7,002 6,363 7,018 7,247 7,192 6,675
21,816 24,088 27,444 27,69218,218
12,052 15,840 19,294 16,95111,260
6,098 5,9266,464 6,864
7,7487,111
7,5678,550 8,163
7,790
4,970 5,0045,969 6,761
7,068
6,3577,214
7,950 7,5837,033
7,989 8,43810,309 11,532
12,014
10,79212,048
12,33811,992
11,346
78,60081,24385,909
78,40675,379
66,042 67,73768,111 70,689
82,703
鉱物性燃料
MineralFuels
11,26017%
その他Others9,96515%
食料品Foodstuff
6,67510%
原料品Raw Materials
4,5107%
原油及び粗油Petroleum
4,6467%
LNG3,217
5%
化学製品Chemicals
7,79012%
原料別製品Manufactured Goods
6,55910%
一般機械Machinery
7,03310%
電気機器ElectricalMachinery
11,34617%
輸送用機器TransportEquipment
2,5994%
衣類・同付属品Clothing & Accessories
2,7244%
Total¥67,737billion
アジアAsia
34,61051%
大洋州Oceania4,327
6%
北米North
America8,58413%
中東Middle East
5,5578%
中国China
17,47826%
韓国Korea2,838
4%
オーストラリアAustralia
3,8056%
米国USA
7,42711%
中南米Central South
America2,929
4%
西欧WesternEurope8,97013%
中東欧・ロシア等Central & Eastern
Europe, Russia, etc.1,839
3%
サウジアラビアSaudi Arabia
1,9693%
アラブ首長国連邦
UAE1,749
3%
アフリカAfrica9201%
Total¥67,737billion
■2020 対世界輸入(国・地域別) Imports from World by Area/Country●輸入国・地域内訳 Imports, by Area/Country ●輸入商品内訳 Imports, by Commodity●輸入上位国 Top Countries by Value of Imports ●輸入上位品目 Top Items by Value of Imports
●輸入推移(国・地域別) Imports from World by Area/Country ●輸入推移(商品別) Imports from World by Commodity
■2020 対世界輸入(商品別) Imports from World by Commodity
本論編▶I.貿易概況4 Main Chapter▶I.Overview of Trade 5
Source: 財務省貿易統計より作成。 Compiled from MOF's Trade Statistics on a Customs-cleared Basis.
品目 Items
金額Value
(10億円)[¥ billion]
伸率Growth(%)
寄与度Contribution
degree(%)
原油及び粗油Petroleum
4,646(7,969) ▲ 41.7 ▲ 4.2
液化天然ガスLNG
3,217(4,350) ▲ 26.0 ▲ 1.4
医薬品Medical Products
3,152(3,092) 1.9 0.1
通信機Telephony, Telegraphy
2,849(2,846) 0.1 0.0
衣類・同付属品Clothing & Accessories
2,724(3,205) ▲ 15.0 ▲ 0.6
上位5品目 合計Top 5 total 16,587 ー ▲ 6.2
全品目 合計Grand total
67,737(78,600) ▲ 13.8 ▲ 13.8
注:( )内の数字は2019年の金額。Note: Figures in ( ) are value in 2019.
相手国 Partners
金額Value
(10億円)[¥ billion]
伸率Growth(%)
寄与度Contribution
degree(%)
中国China
17,478(18,454) ▲ 5.3 ▲ 1.2
米国USA
7,427(8,640) ▲ 14.0 ▲ 1.5
オーストラリアAustralia
3,805(4,958) ▲ 23.2 ▲ 1.5
台湾Taiwan
2,856(2,928) ▲ 2.4 ▲ 0.1
韓国Korea
2,838(3,227) ▲ 12.1 ▲ 0.5
上位5ヵ国 合計Top 5 total 34,405 ー ▲ 4.8
全品目 合計Grand total
67,737(78,600) ▲ 13.8 ▲ 13.8
注:( )内の数字は2019年の金額。Note: Figures in ( ) are value in 2019.
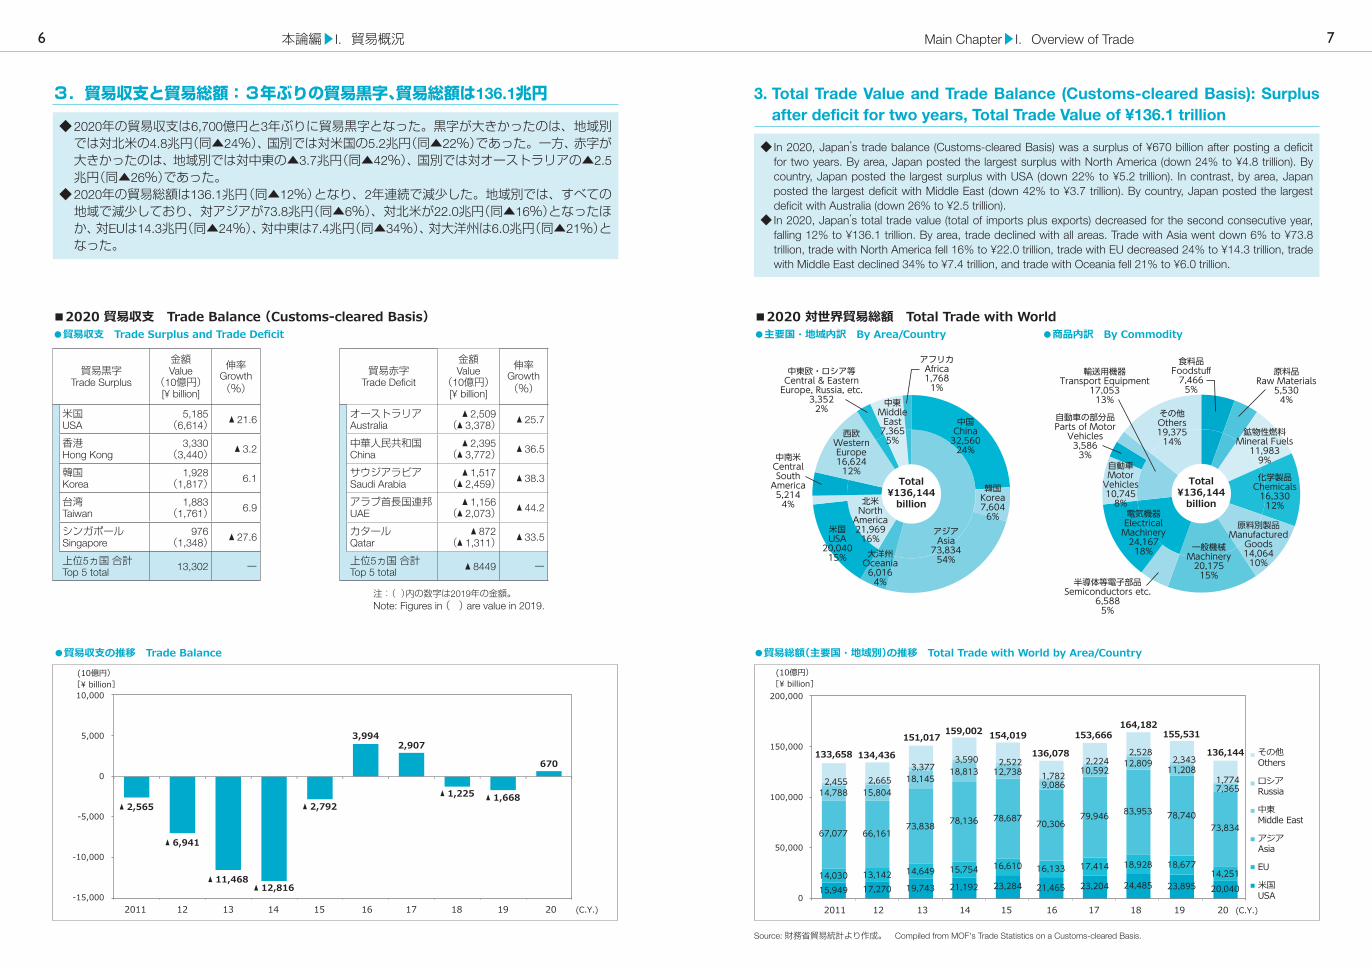
3. Total Trade Value and Trade Balance (Customs-cleared Basis): Surplus after deficit for two years, Total Trade Value of ¥136.1 trillion
◆ In 2020, Japan’s trade balance (Customs-cleared Basis) was a surplus of ¥670 billion after posting a deficit for two years. By area, Japan posted the largest surplus with North America (down 24% to ¥4.8 trillion). By country, Japan posted the largest surplus with USA (down 22% to ¥5.2 trillion). In contrast, by area, Japan posted the largest deficit with Middle East (down 42% to ¥3.7 trillion). By country, Japan posted the largest deficit with Australia (down 26% to ¥2.5 trillion).
◆ In 2020, Japan’s total trade value (total of imports plus exports) decreased for the second consecutive year, falling 12% to ¥136.1 trillion. By area, trade declined with all areas. Trade with Asia went down 6% to ¥73.8 trillion, trade with North America fell 16% to ¥22.0 trillion, trade with EU decreased 24% to ¥14.3 trillion, trade with Middle East declined 34% to ¥7.4 trillion, and trade with Oceania fell 21% to ¥6.0 trillion.
3.貿易収支と貿易総額:3年ぶりの貿易黒字、貿易総額は136.1兆円
◆ 2020年の貿易収支は6,700億円と3年ぶりに貿易黒字となった。黒字が大きかったのは、地域別では対北米の4.8兆円(同▲24%)、国別では対米国の5.2兆円(同▲22%)であった。一方、赤字が大きかったのは、地域別では対中東の▲3.7兆円(同▲42%)、国別では対オーストラリアの▲2.5兆円(同▲26%)であった。
◆ 2020年の貿易総額は136.1兆円(同▲12%)となり、2年連続で減少した。地域別では、すべての地域で減少しており、対アジアが73.8兆円(同▲6%)、対北米が22.0兆円(同▲16%)となったほか、対EUは14.3兆円(同▲24%)、対中東は7.4兆円(同▲34%)、対大洋州は6.0兆円(同▲21%)となった。
2011 12 13 14 15 16 17 18 19 20 (C.Y.)
▲ 2,565
▲ 6,941
▲ 11,468▲ 12,816
▲ 2,792
3,9942,907
▲ 1,225 ▲ 1,668
670
10,000
5,000
0
-5,000
-10,000
-15,000
[¥ billion](10億円)
その他Others
ロシアRussia
中東Middle East
アジアAsia
EU
米国USA
2011 12 13 14 15 16 17 18 19 20 (C.Y.)
[¥ billion](10億円)
200,000
150,000
100,000
50,000
015,949 17,270 19,743 21,192 23,284 21,465 23,204 24,485 23,895 20,04014,030 13,142 14,649 15,754 16,610 16,133 17,414 18,928 18,677
14,251
67,077 66,16173,838 78,136 78,687 70,306
79,946 83,953 78,74073,834
14,788 15,80418,145
18,813 12,7389,086
10,59212,809
11,208
7,3652,455 2,665
3,3773,590 2,522
1,7822,224
2,5282,343
1,774
151,017
134,436133,658 136,144
155,531164,182
153,666
136,078
154,019159,002
電気機器ElectricalMachinery
24,16718%
輸送用機器Transport Equipment
17,05313%
食料品Foodstuff
7,4665%
原料品Raw Materials
5,5304%
鉱物性燃料Mineral Fuels
11,9839%
化学製品Chemicals
16,33012%
原料別製品Manufactured
Goods14,064
10%一般機械
Machinery20,175
15%半導体等電子部品
Semiconductors etc.6,588
5%
自動車Motor
Vehicles10,745
8%
自動車の部分品Parts of Motor
Vehicles3,586
3%
その他Others19,375
14%
Total¥136,144
billion
アジアAsia
73,83454%
北米North
America21,969
16%
中国China
32,56024%
韓国Korea7,604
6%
大洋州Oceania6,016
4%
米国USA
20,04015%
中南米CentralSouth
America5,214
4%
西欧WesternEurope16,624
12%
中東欧・ロシア等Central & Eastern
Europe, Russia, etc.3,352
2% 中東Middle
East7,365
5%
アフリカAfrica1,768
1%
Total¥136,144
billion
■2020 貿易収支 Trade Balance (Customs-cleared Basis) ●貿易収支 Trade Surplus and Trade Deficit ●主要国・地域内訳 By Area/Country ●商品内訳 By Commodity
●貿易収支の推移 Trade Balance ●貿易総額(主要国・地域別)の推移 Total Trade with World by Area/Country
■2020 対世界貿易総額 Total Trade with World
Source: 財務省貿易統計より作成。 Compiled from MOF's Trade Statistics on a Customs-cleared Basis.
本論編▶I.貿易概況6 Main Chapter▶I.Overview of Trade 7
貿易赤字Trade Deficit
金額Value
(10億円)[¥ billion]
伸率Growth(%)
オーストラリアAustralia
▲ 2,509(▲ 3,378) ▲ 25.7
中華人民共和国China
▲ 2,395(▲ 3,772) ▲ 36.5
サウジアラビアSaudi Arabia
▲ 1,517(▲ 2,459) ▲ 38.3
アラブ首長国連邦UAE
▲ 1,156(▲ 2,073) ▲ 44.2
カタールQatar
▲ 872(▲ 1,311) ▲ 33.5
上位5ヵ国 合計Top 5 total ▲ 8449 ー
注:( )内の数字は2019年の金額。Note: Figures in ( ) are value in 2019.
貿易黒字Trade Surplus
金額Value
(10億円)[¥ billion]
伸率Growth(%)
米国USA
5,185(6,614) ▲ 21.6
香港Hong Kong
3,330(3,440) ▲ 3.2
韓国Korea
1,928(1,817) 6.1
台湾Taiwan
1,883(1,761) 6.9
シンガポールSingapore
976(1,348) ▲ 27.6
上位5ヵ国 合計Top 5 total 13,302 ー

4. Foreign Exchange and Trade Index Fluctuations
(1) Foreign Exchange: Yen continues appreciating for third consecutive year◆ The average yen-dollar exchange rate for the year as a whole was ¥107 (down 2% from the previous year).
On an annual basis, the yen continued appreciating against the U.S. dollar for the third consecutive year. Since 2017, the foreign exchange market has fluctuated in a narrow range, which was between ¥102 and ¥112 in 2020.
(2) Export Indices: Export value down for second consecutive year, reflecting declined volume◆ The export volume index was negative (▲11.8%) for the second consecutive year, reflecting the impact of
COVID-19. By quarter, the export volume index remained negative for ten straight quarters since it turned negative in the third quarter of 2018.
◆ The export unit value index was positive (+0.8%) after being negative for a year. By quarter, the export unit value index that remained negative for four straight quarters since the third quarter in 2019 turned positive in the third quarter of 2020.
◆ The export value decreased for the second consecutive year, falling 11.1%, reflecting the declined volume.
(3) Import Indices: Both import volume and unit value indices negative Import value index negative for second consecutive year
◆ The import volume index was negative (▲6.6%) for the second consecutive year. By quarter, import volume index remained negative for straight five quarters since it turned negative in the fourth quarter of 2019.
◆ The import unit value index was negative (▲7.7%) for the second consecutive year, reflecting the declined crude oil prices. By quarter, the import unit value index remained negative for straight six quarters since when it turned negative in the third quarter of 2019.
◆ The import value decreased for the second consecutive year, falling 13.8%, reflecting the declined volume and unit value.
4.外国為替レートの変化と貿易指数の動き
(1)外国為替レート:3年連続で円高が進行◆ 2020年の円の対ドルレートは107円(前年比▲2%)となり、年ベースでは3年連続の円高となった。2017年以降、通年では小幅な値動きに終始しており、2020年は102円から112円のレンジで推移した。
(2)輸出指数:数量のマイナスにより、輸出金額は2年連続で減少◆ 2020年の輸出数量指数の伸び率は、新型コロナウイルスの影響などを背景に前年比▲11.8%となり、2年連続でマイナスとなった。四半期ごとの動きをみると、2018年第3四半期にマイナスに転じて以降、10期連続でマイナスが続いた。
◆ 2020年の輸出価格指数の伸び率は、同+0.8%となり、2年ぶりにプラスとなった。四半期ごとの動きをみると、2019年第3四半期以降、4期連続でマイナスが続いたが、2020年第3四半期にプラスに転じた。
◆ 2020年の輸出金額は、数量のマイナスにけん引され、同▲11.1%と2年連続で減少した。
(3)輸入指数:数量・価格ともマイナスで、輸入金額は2年連続で減少◆ 2020年の輸入数量指数の伸び率は、同▲6.6%となり、2年連続でマイナスとなった。四半期ごとの動きをみると、2019年第4四半期にマイナスに転じて以降、5期連続でマイナスが続いた。
◆ 2020年の輸入価格指数の伸び率は、原油価格の下落などを背景に同▲7.7%となり、2年連続でマイナスとなった。四半期ごとの動きをみると、2019年第3四半期にマイナスに転じて以降、6期連続でマイナスが続いた。
◆ 2020年の輸入金額は、数量・価格ともマイナスだったことにより、同▲13.8%と2年連続で減少した。
円ドルレート Exchange Rate
2011 12 13 14 15 16 17 18 19 20
70
80
90
100
110
120
130
(C.Y.)
(¥/$)
79.8 79.8
97.6
105.8
121.0
108.8 112.2 110.4 109.0
106.8
円ドルレート Exchange Rate
2019.1Q 2Q 3Q 4Q 2020.1Q 2Q 3Q 4Q
100
105
110
115
120
(¥/$)
(四半期)
110.2 109.9
107.3108.7 108.9
107.6
106.2104.5
2011〜2020 円ドルレート Exchange Rate
円ドルレート(四半期別) Exchange Rate (Quarterly)
Note : 伸び率は対前年同期比、グラフ中の数値は金額の伸び率、数量指数=金額指数/価格指数。 Export and import growth are up/down from a year earlier.
Figures in the graphs represent growth in value. Value indices divided by unit value indices make quantum indices.
Source:財務省貿易統計より作成。 Compiled from MOF's Trade Statistics on a Customs-cleared Basis.
輸出指数の変動 Fluctuations of Export Indices 輸入指数の変動 Fluctuations of Import Indices
10
20
15
5
-5
-25
-15
-20
-10
0
(%)
(四半期)2019.1Q 2Q 3Q 4Q 20.1Q 2Q 3Q 4Q
10
20
15
5
-5
-30
-15
-20
-25
-10
0
(%)
(四半期)2019.1Q 2Q 3Q 4Q 20.1Q 2Q 3Q 4Q
Quantum index
Unit value index
Value index
数量指数
価格指数
金額指数
Quantum index
Unit value index
Value index
数量指数
価格指数
金額指数
-5.0 -6.1-2.3 -3.8 -5.5
-25.1
-15.0
-1.9
1.1 0.7
-2.8 -4.2 -0.1
-0.4
2.2 1.1
-3.9 -5.5 -5.0-7.8
-5.5
-25.3
-13.0
-0.7-1.7 -0.1 2.3
-4.4 -6.8 -4.8-11.4
-3.4-0.1
0.0
-7.0
-7.8 -0.1-11.9
-9.9
-8.8-1.9
-0.1
-4.9
-11.9
-7.2
-16.0
-20.1
-12.0
本論編▶I.貿易概況8 Main Chapter▶I.Overview of Trade 9
Source: 日本銀行の統計より作成。 Compiled from BOJ's Statistics.
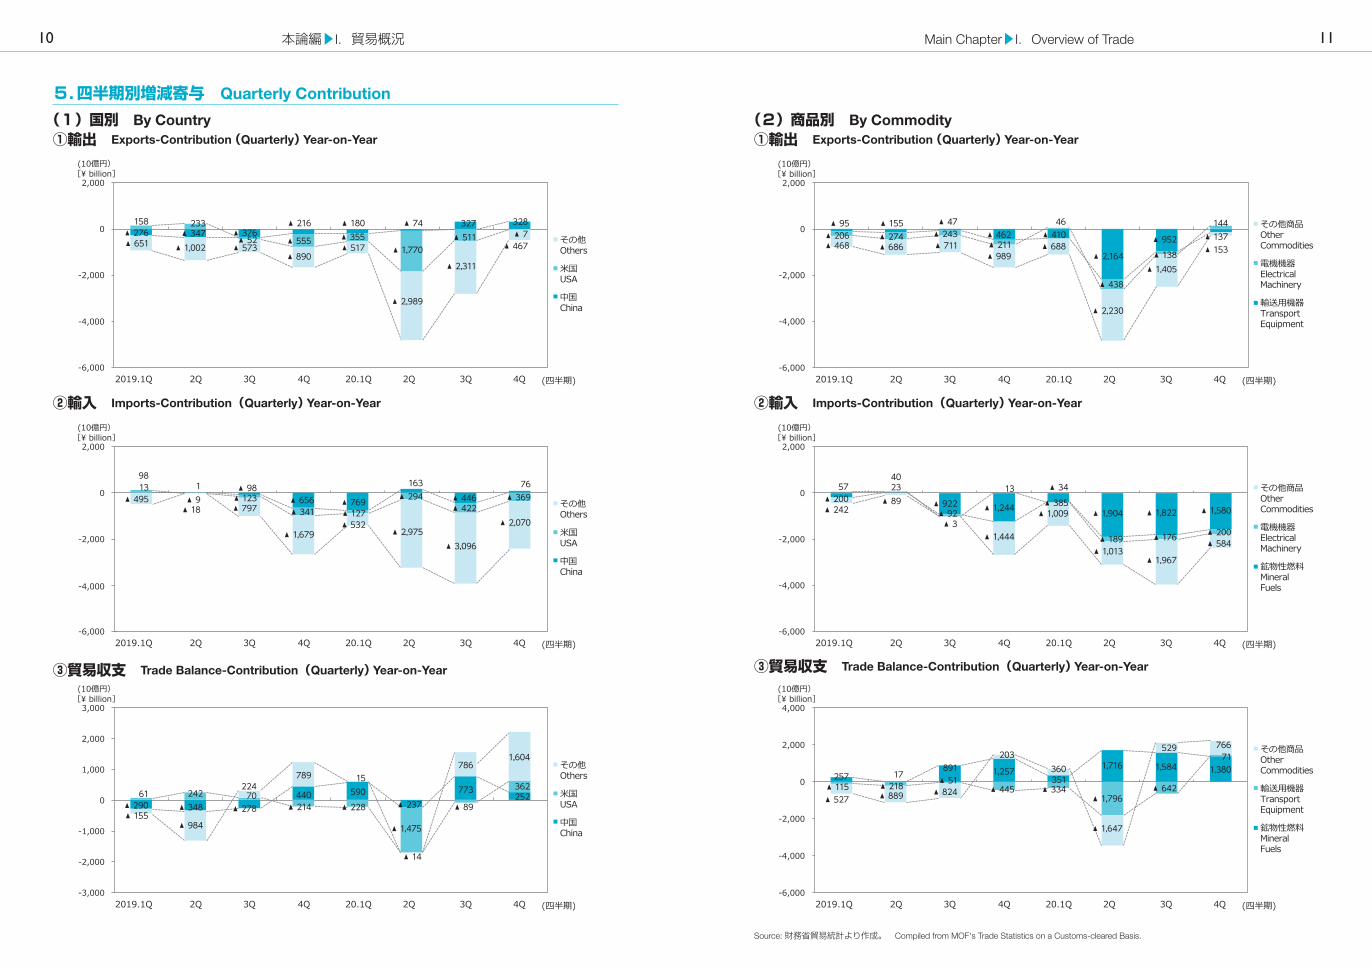
(2)商品別 By Commodity①輸出 Exports-Contribution (Quarterly) Year-on-Year
②輸入 Imports-Contribution (Quarterly) Year-on-Year
③貿易収支 Trade Balance-Contribution (Quarterly) Year-on-Year
(1)国別 By Country①輸出 Exports-Contribution (Quarterly) Year-on-Year
②輸入 Imports-Contribution (Quarterly) Year-on-Year
③貿易収支 Trade Balance-Contribution (Quarterly) Year-on-Year
[¥ billion](10億円)
その他Others
米国USA
中国China
▲ 276 ▲ 347 ▲ 376▲ 216 ▲ 180 ▲ 74 327 328158 233
▲ 52 ▲ 555 ▲ 355▲ 1,770
▲ 511 ▲ 7▲ 651 ▲ 1,002 ▲ 573
▲ 890▲ 517
▲ 2,989
▲ 2,311
▲ 467
-6,000
-4,000
-2,000
0
2,000
2019.1Q 2Q 3Q 4Q 20.1Q 2Q 3Q 4Q (四半期)
[¥ billion](10億円)
その他商品Other Commodities
電機機器Electrical Machinery
輸送用機器Transport Equipment
▲ 95 ▲ 155 ▲ 47▲ 462 ▲ 410
▲ 2,164
▲ 952 ▲ 137▲ 206 ▲ 274 ▲ 243▲ 211
46
▲ 438
▲ 138
144
▲ 468 ▲ 686 ▲ 711▲ 989
▲ 688
▲ 2,230
▲ 1,405
▲ 153
-6,000
-4,000
-2,000
0
2,000
2019.1Q 2Q 3Q 4Q 20.1Q 2Q 3Q 4Q (四半期)
その他Others
米国USA
中国China
13 1 ▲ 98▲ 656 ▲ 769
163▲ 446
7698
▲ 9 ▲ 123▲ 341 ▲ 127
▲ 294▲ 422
▲ 369▲ 495▲ 18 ▲ 797
▲ 1,679▲ 532
▲ 2,975▲ 3,096
▲ 2,070
-6,000
-4,000
-2,000
0
2,000
2019.1Q 2Q 3Q 4Q 20.1Q 2Q 3Q 4Q (四半期)
[¥ billion](10億円)
その他商品Other Commodities
電機機器Electrical Machinery
鉱物性燃料MineralFuels
▲ 20023
▲ 922 ▲ 1,244 ▲ 385▲ 1,904 ▲ 1,822 ▲ 1,580
5740
▲ 92
13 ▲ 34
▲ 189 ▲ 176 ▲ 200
▲ 242▲ 89
▲ 3▲ 1,444
▲ 1,009
▲ 1,013▲ 1,967
▲ 584
-6,000
-4,000
-2,000
0
2,000
2019.1Q 2Q 3Q 4Q 20.1Q 2Q 3Q 4Q (四半期)
[¥ billion](10億円)
2019.1Q 2Q 3Q 4Q 20.1Q 2Q 3Q 4Q (四半期)
[¥ billion](10億円)
その他Others
米国USA
中国China
▲ 290 ▲ 348 ▲ 278440 590
▲ 237773
25261 242 70▲ 214 ▲ 228
▲ 1,475
▲ 89
362
▲ 155▲ 984
224789 15
▲ 14
7861,604
-3,000
-2,000
-1,000
0
1,000
2,000
3,000[¥ billion](10億円)
その他商品Other Commodities
輸送用機器TransportEquipment
鉱物性燃料MineralFuels
257 17891 1,257
3511,716 1,584 1,380
▲ 115 ▲ 218 ▲ 51▲ 445 ▲ 334
▲ 1,796▲ 642
71
▲ 527 ▲ 889 ▲ 824
203360
▲ 1,647
529 766
-6,000
-4,000
-2,000
0
2,000
4,000
2019.1Q 2Q 3Q 4Q 20.1Q 2Q 3Q 4Q (四半期)
5.四半期別増減寄与 Quarterly Contribution
本論編▶I.貿易概況10 Main Chapter▶I.Overview of Trade 11
Source: 財務省貿易統計より作成。 Compiled from MOF's Trade Statistics on a Customs-cleared Basis.
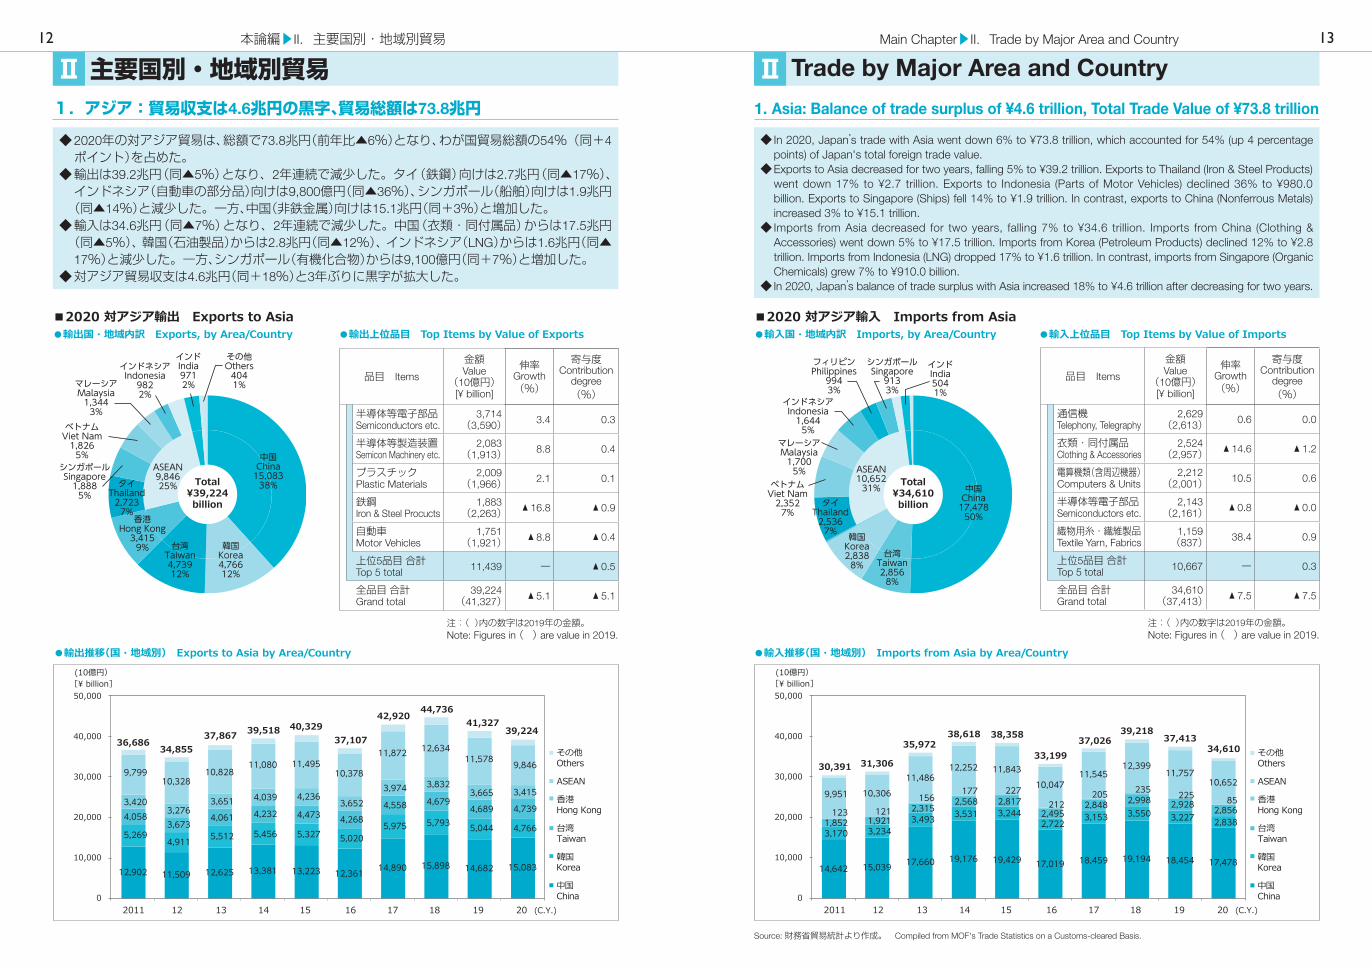
◆ In 2020, Japan’s trade with Asia went down 6% to ¥73.8 trillion, which accounted for 54% (up 4 percentage points) of Japan's total foreign trade value.
◆ Exports to Asia decreased for two years, falling 5% to ¥39.2 trillion. Exports to Thailand (Iron & Steel Products) went down 17% to ¥2.7 trillion. Exports to Indonesia (Parts of Motor Vehicles) declined 36% to ¥980.0 billion. Exports to Singapore (Ships) fell 14% to ¥1.9 trillion. In contrast, exports to China (Nonferrous Metals) increased 3% to ¥15.1 trillion.
◆ Imports from Asia decreased for two years, falling 7% to ¥34.6 trillion. Imports from China (Clothing & Accessories) went down 5% to ¥17.5 trillion. Imports from Korea (Petroleum Products) declined 12% to ¥2.8 trillion. Imports from Indonesia (LNG) dropped 17% to ¥1.6 trillion. In contrast, imports from Singapore (Organic Chemicals) grew 7% to ¥910.0 billion.
◆ In 2020, Japan’s balance of trade surplus with Asia increased 18% to ¥4.6 trillion after decreasing for two years.
1.アジア:貿易収支は4.6兆円の黒字、貿易総額は73.8兆円
◆ 2020年の対アジア貿易は、総額で73.8兆円(前年比▲6%)となり、わが国貿易総額の54%(同+4ポイント)を占めた。
◆ 輸出は39.2兆円(同▲5%)となり、2年連続で減少した。タイ(鉄鋼)向けは2.7兆円(同▲17%)、インドネシア(自動車の部分品)向けは9,800億円(同▲36%)、シンガポール(船舶)向けは1.9兆円(同▲14%)と減少した。一方、中国(非鉄金属)向けは15.1兆円(同+3%)と増加した。◆ 輸入は34.6兆円(同▲7%)となり、2年連続で減少した。中国(衣類・同付属品)からは17.5兆円(同▲5%)、韓国(石油製品)からは2.8兆円(同▲12%)、インドネシア(LNG)からは1.6兆円(同▲17%)と減少した。一方、シンガポール(有機化合物)からは9,100億円(同+7%)と増加した。
◆ 対アジア貿易収支は4.6兆円(同+18%)と3年ぶりに黒字が拡大した。
2011 12 13 14 15 16 17 18 19 20 (C.Y.)
[¥ billion](10億円)
50,000
40,000
30,000
20,000
10,000
0
その他Others
ASEAN
香港Hong Kong
台湾Taiwan
韓国Korea
中国China
12,902 11,509 12,625 13,381 13,223 12,361 14,890 15,898 14,682 15,083
5,2694,911 5,512 5,456 5,327 5,020
5,975 5,793 5,044 4,7664,058
3,6734,061 4,232 4,473 4,268
4,558 4,6794,689 4,739
3,4203,276
3,651 4,039 4,2363,652
3,974 3,8323,665 3,415
9,79910,328
10,82811,080 11,495
10,378
11,872 12,63411,578 9,846
39,22436,686
34,85537,867 37,107
40,32939,51842,920
44,73641,327
2011 12 13 14 15 16 17 18 19 20 (C.Y.)
[¥ billion](10億円)
50,000
40,000
30,000
20,000
10,000
0
その他Others
ASEAN
香港Hong Kong
台湾Taiwan
韓国Korea
中国China
14,642 15,039 17,660 19,176 19,429 17,019 18,459 19,194 18,454 17,478
3,170 3,2343,493 3,531 3,244
2,7223,153 3,550 3,227 2,8381,852 1,921
2,3152,568 2,817
2,4952,848 2,998 2,928 2,856123 121
156177 227
212205 235 225 859,951 10,306
11,48612,252 11,843
10,04711,545
12,39911,757
10,652
34,610
30,391 31,306
35,97233,199
38,35838,618 39,21837,41337,026
ASEAN10,652
31% 中国China
17,47850%
台湾Taiwan2,856
8%
韓国Korea2,838
8%
タイThailand
2,5367%
ベトナムViet Nam
2,3527%
マレーシアMalaysia
1,7005%
インドネシアIndonesia
1,6445%
フィリピンPhilippines
9943%
シンガポールSingapore
9133%
インドIndia5041%
Total¥34,610billion
ASEAN9,84625%
中国China
15,08338%
韓国Korea4,76612%
台湾Taiwan4,73912%
香港Hong Kong
3,4159%
タイThailand
2,7237%
シンガポールSingapore
1,8885%
ベトナムViet Nam
1,8265%
マレーシアMalaysia
1,3443%
インドネシアIndonesia
9822%
インドIndia9712%
その他Others
4041%
Total¥39,224billion
■2020 対アジア輸出 Exports to Asia●輸出国・地域内訳 Exports, by Area/Country ●輸入国・地域内訳 Imports, by Area/Country●輸出上位品目 Top Items by Value of Exports ●輸入上位品目 Top Items by Value of Imports
●輸出推移(国・地域別) Exports to Asia by Area/Country ●輸入推移(国・地域別) Imports from Asia by Area/Country
■2020 対アジア輸入 Imports from Asia
1. Asia: Balance of trade surplus of ¥4.6 trillion, Total Trade Value of ¥73.8 trillion
主要国別・地域別貿易 Trade by Major Area and CountryⅡ Ⅱ
Source: 財務省貿易統計より作成。 Compiled from MOF's Trade Statistics on a Customs-cleared Basis.
12 13Main Chapter▶II.Trade by Major Area and Country本論編▶II.主要国別・地域別貿易
品目 Items
金額Value
(10億円)[¥ billion]
伸率Growth(%)
寄与度Contribution
degree(%)
通信機Telephony, Telegraphy
2,629(2,613) 0.6 0.0
衣類・同付属品Clothing & Accessories
2,524(2,957) ▲ 14.6 ▲ 1.2
電算機類(含周辺機器)Computers & Units
2,212(2,001) 10.5 0.6
半導体等電子部品Semiconductors etc.
2,143(2,161) ▲ 0.8 ▲ 0.0
織物用糸・繊維製品Textile Yarn, Fabrics
1,159(837) 38.4 0.9
上位5品目 合計Top 5 total 10,667 ー 0.3
全品目 合計Grand total
34,610(37,413) ▲ 7.5 ▲ 7.5
注:( )内の数字は2019年の金額。Note: Figures in ( ) are value in 2019.
品目 Items
金額Value
(10億円)[¥ billion]
伸率Growth(%)
寄与度Contribution
degree(%)
半導体等電子部品Semiconductors etc.
3,714(3,590) 3.4 0.3
半導体等製造装置Semicon Machinery etc.
2,083(1,913) 8.8 0.4
プラスチックPlastic Materials
2,009(1,966) 2.1 0.1
鉄鋼Iron & Steel Procucts
1,883(2,263) ▲ 16.8 ▲ 0.9
自動車Motor Vehicles
1,751(1,921) ▲ 8.8 ▲ 0.4
上位5品目 合計Top 5 total 11,439 ー ▲ 0.5
全品目 合計Grand total
39,224(41,327) ▲ 5.1 ▲ 5.1
注:( )内の数字は2019年の金額。Note: Figures in ( ) are value in 2019.

(1) China: Exports up after one year of decrease, imports down for second consecutive year◆ In 2020, Japan’s trade with China went down 2% to ¥32.6 trillion, which accounted for 24% (up 3 percentage
points) of Japan's total foreign trade value.◆ Exports to China increased after one year of decrease, growing 3% to ¥15.1 trillion. China became Japan’
s largest export partner surpassing USA for the first time in two years. Exports of Nonferrous Metals (up 41% to ¥550.0 billion), Motor Vehicles (up 16% to ¥910.0 billion), and Plastic Materials (up 9% to ¥890.0 billion) increased. In contrast, Organic Chemicals exports went down 33% to ¥460.0 billion.
◆ Imports from China decreased for the second consecutive year, falling 5% to ¥17.5 trillion. Imports of Clothing & Accessories (down 18% to ¥1.5 trillion), Parts of Computer (down 26% to ¥270.0 billion), and Parts of Motor Vehicles (down 23% to ¥250.0 billion) went down. In contrast, Textile Yarn, Fabrics exports went up 68% to ¥850.0 billion.
◆ In 2020, Japan’s balance of trade deficit with China narrowed after one year of growth, dropping 37% to ¥2.4 trillion.
(1)中国:輸出は2年ぶりに増加、輸入は2年連続の減少◆ 2020年の対中国貿易は、総額で32.6兆円(前年比▲2%)となり、わが国貿易総額の24%(同+3ポイント)を占めた。
◆ 輸出は15.1兆円(同+3%)と2年ぶりに増加し、2年ぶりに米国を上回り、最大の輸出相手国となった。非鉄金属が5,500億円(同+41%)、自動車が9,100億円(同+16%)、プラスチックが8,900億円(同+9%)と増加した。一方、有機化合物が4,600億円(同▲33%)と減少した。
◆ 輸入は17.5兆円(同▲5%)となり、2年連続で減少した。衣類・同付属品が1.5兆円(同▲18%)、電算機類の部分品が2,700億円(同▲26%)、自動車の部分品が2,500億円(同▲23%)と減少した。一方、織物用糸・繊維製品が8,500億円(同+68%)と増加した。
◆ 対中国貿易収支は▲2.4兆円(同▲37%)と2年ぶりに赤字が縮小した。
2011 12 13 14 15 16 17 18 19 20 (C.Y.)
[¥ billion](10億円)
20,000
15,000
10,000
5,000
0
その他商品Other Commodities
輸送用機器Transport Equipment
電気機器Electrical Machinery
一般機械Machinery
原料別製品Manufactured Goods
化学製品Chemicals1,695 1,601 2,055 2,090 2,023 1,877 2,300 2,546 2,542 2,535
1,827 1,594 1,714 1,777 1,719 1,536 1,755 1,817 1,666 1,781
3,1312,388 2,464 2,564 2,540 2,525
3,312 3,885 3,397 3,410
2,9242,729
2,797 3,037 3,129 2,909
3,3763,400
3,039 3,2021,259
1,1011,245 1,380 1,179 1,237
1,3961,538
1,506 1,59612,361
13,22313,38112,625
11,50912,902
15,08314,68215,898
14,890
2011 12 13 14 15 16 17 18 19 20 (C.Y.)
[¥ billion](10億円)
25,000
20,000
15,000
10,000
5,000
0
その他商品Other Commodities
電気機器Electrical Machinery
一般機械Machinery
原料別製品Manufactured Goods
化学製品Chemicals
食料品Foodstuff747 801 880 934 975 866 911 946 900 820
1,059 824 912 1,039 1,122 978 1,129 1,292 1,196 1,0781,807 1,738 1,972 2,238 2,289 1,960 2,119 2,271 2,209 2,2892,367 2,481 2,969 3,262 3,191 2,801 3,113 3,311 3,385 3,4083,635 3,955
4,9475,608 5,655
5,0545,480 5,572 5,295 5,099
19,19418,45917,019
19,42919,17617,660
15,03914,642
17,47818,454
食料品Foodstuff8205%
化学製品Chemicals1,0786%
原料別製品ManufacturedGoods2,28913%
一般機械Machinery3,40820%
電気機器ElectricalMachinery5,09929%
輸送用機器TransportEquipment4152%
その他Others4,09223%
Total¥17,478billion
原料品Raw Materials
2362%
化学製品Chemicals
2,53517%
原料別製品Manufactured
Goods1,78112%
一般機械Machinery
3,41023%
電気機器ElectricalMachinery
3,20221%
輸送用機器TransportEquipment
1,59611%
その他Others2,09314%
Total¥15,083billion
■2020 対中国輸出 Exports to China●輸出商品内訳 Exports, by Commodity ●輸入商品内訳 Imports, by Commodity●輸出上位品目 Top Items by Value of Exports ●輸入上位品目 Top Items by Value of Imports
●輸出推移(商品別) Exports to China by Commodity ●輸入推移(商品別) Imports from China by Commodity
■2020 対中国輸入 Imports from China
Source: 財務省貿易統計より作成。 Compiled from MOF's Trade Statistics on a Customs-cleared Basis.
14 15Main Chapter▶II.Trade by Major Area and Country本論編▶II.主要国別・地域別貿易
品目 Items
金額Value
(10億円)[¥ billion]
伸率Growth(%)
寄与度Contribution
degree(%)
通信機Telephony, Telegraphy
1,950(2,017) ▲ 3.3 ▲ 0.4
電算機類(含周辺機器)Computers & Units
1,884(1,641) 14.8 1.3
衣類・同付属品Clothing & Accessories
1,476(1,791) ▲ 17.6 ▲ 1.7
織物用糸・繊維製品Textile Yarn, Fabrics
850(507) 67.6 1.9
音響映像機器(含部品)Audio & Visual Apparatus
755(729) 3.6 0.1
上位5品目 合計Top 5 total 6,915 ー 1.2
全品目 合計Grand total
17,478(18,454) ▲ 5.3 ▲ 5.3
注:( )内の数字は2019年の金額。Note: Figures in ( ) are value in 2019.
品目 Items
金額Value
(10億円)[¥ billion]
伸率Growth(%)
寄与度Contribution
degree(%)
半導体等電子部品Semiconductors etc.
1,004(981) 2.4 0.2
半導体等製造装置Semicon Machinery etc.
958(901) 6.4 0.4
自動車Motor Vehicles
911(787) 15.8 0.8
プラスチックPlastic Materials
886(816) 8.7 0.5
科学光学機器Scientific, Optical Inst.
685(750) ▲ 8.7 ▲ 0.4
上位5品目 合計Top 5 total 4,444 ー 1.4
全品目 合計Grand total
15,083(14,682) 2.7 2.7
注:( )内の数字は2019年の金額。Note: Figures in ( ) are value in 2019.
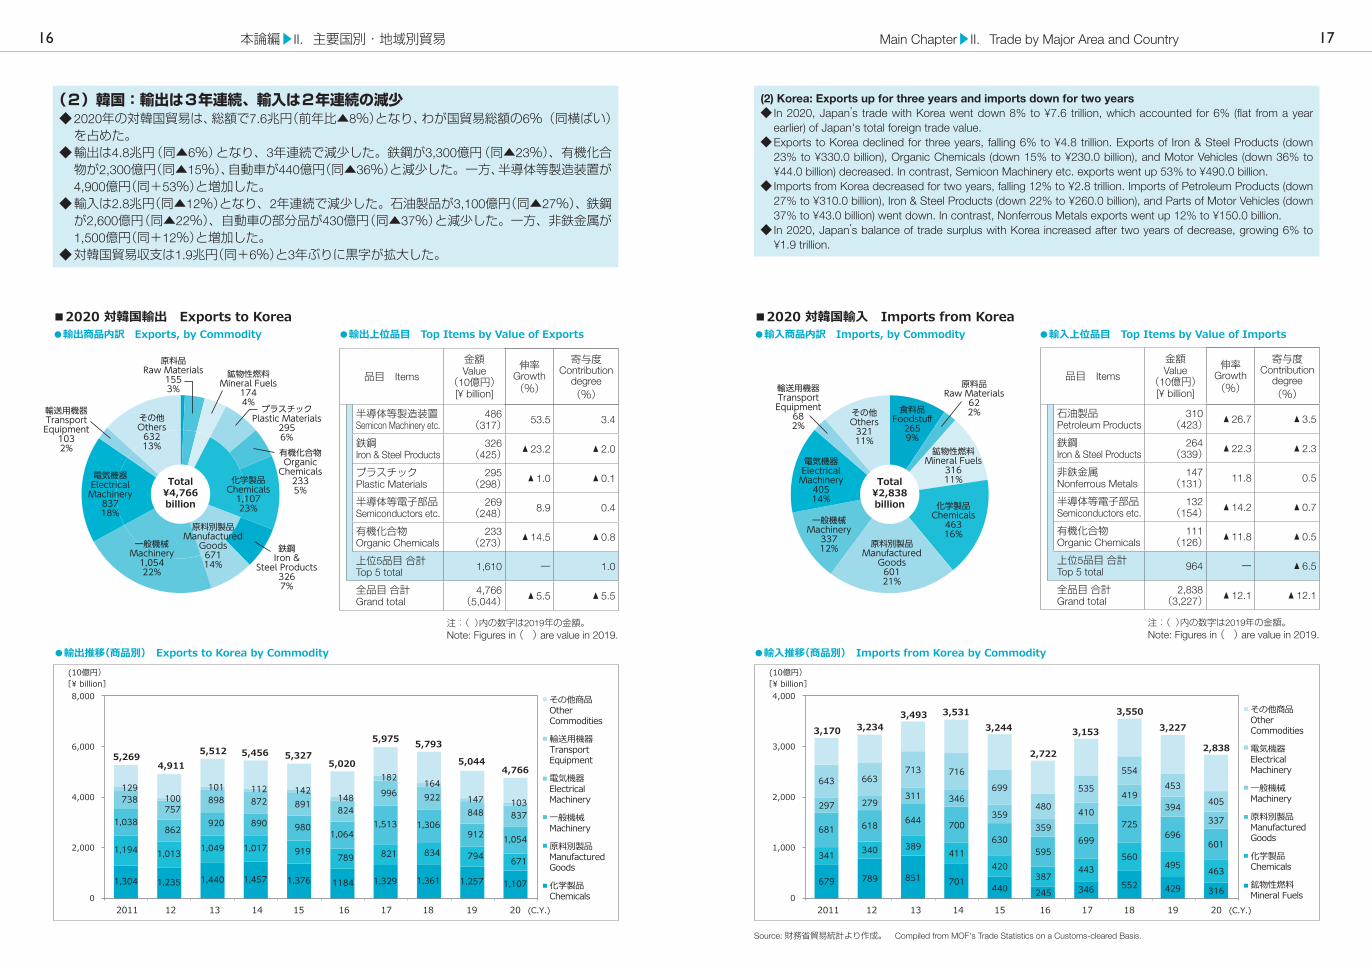
(2) Korea: Exports up for three years and imports down for two years◆ In 2020, Japan’s trade with Korea went down 8% to ¥7.6 trillion, which accounted for 6% (flat from a year
earlier) of Japan's total foreign trade value.◆ Exports to Korea declined for three years, falling 6% to ¥4.8 trillion. Exports of Iron & Steel Products (down
23% to ¥330.0 billion), Organic Chemicals (down 15% to ¥230.0 billion), and Motor Vehicles (down 36% to ¥44.0 billion) decreased. In contrast, Semicon Machinery etc. exports went up 53% to ¥490.0 billion.
◆ Imports from Korea decreased for two years, falling 12% to ¥2.8 trillion. Imports of Petroleum Products (down 27% to ¥310.0 billion), Iron & Steel Products (down 22% to ¥260.0 billion), and Parts of Motor Vehicles (down 37% to ¥43.0 billion) went down. In contrast, Nonferrous Metals exports went up 12% to ¥150.0 billion.
◆ In 2020, Japan’s balance of trade surplus with Korea increased after two years of decrease, growing 6% to ¥1.9 trillion.
(2)韓国:輸出は3年連続、輸入は2年連続の減少◆ 2020年の対韓国貿易は、総額で7.6兆円(前年比▲8%)となり、わが国貿易総額の6%(同横ばい)を占めた。
◆ 輸出は4.8兆円(同▲6%)となり、3年連続で減少した。鉄鋼が3,300億円(同▲23%)、有機化合物が2,300億円(同▲15%)、自動車が440億円(同▲36%)と減少した。一方、半導体等製造装置が4,900億円(同+53%)と増加した。
◆ 輸入は2.8兆円(同▲12%)となり、2年連続で減少した。石油製品が3,100億円(同▲27%)、鉄鋼が2,600億円(同▲22%)、自動車の部分品が430億円(同▲37%)と減少した。一方、非鉄金属が1,500億円(同+12%)と増加した。
◆ 対韓国貿易収支は1.9兆円(同+6%)と3年ぶりに黒字が拡大した。
2011 12 13 14 15 16 17 18 19 20 (C.Y.)
[¥ billion](10億円)
8,000
6,000
4,000
2,000
0
その他商品Other Commodities
輸送用機器Transport Equipment
電気機器Electrical Machinery
一般機械Machinery
原料別製品Manufactured Goods
化学製品Chemicals
1,304 1,235 1,440 1,457 1,376 1184 1,329 1,361 1,257 1,107
1,194 1,013 1,049 1,017 919789 821 834 794 671
1,038862
920 890 9801,064
1,513 1,306912 1,054
738757
898 872 891 824
996 922848 837
129100
101 112 142148
182 164
147 103
5,975
5,0205,3275,4565,512
4,9115,269 5,044
4,766
5,793
2011 12 13 14 15 16 17 18 19 20 (C.Y.)
[¥ billion](10億円)
4,000
3,000
2,000
1,000
0
その他商品Other Commodities
電気機器Electrical Machinery
一般機械Machinery
原料別製品Manufactured Goods
化学製品Chemicals
鉱物性燃料Mineral Fuels
679 789 851 701440 245 346 552 429 316
341 340 389411
420387
443560
495 463
681 618 644 700630
595699
725696
601
297 279311 346
359359
410
419394
337
643 663713 716
699
480
535
554453
405
3,227
2,838
3,2343,1703,493 3,531
3,244
2,722
3,153
3,550
食料品Foodstuff
2659%
原料品Raw Materials
622%
鉱物性燃料Mineral Fuels
31611%
化学製品Chemicals
46316%
原料別製品Manufactured
Goods60121%
一般機械Machinery
33712%
電気機器ElectricalMachinery
40514%
輸送用機器TransportEquipment
682%
その他Others
32111%
Total¥2,838billion
化学製品Chemicals
1,10723%
原料別製品Manufactured
Goods67114%
一般機械Machinery
1,05422%
原料品Raw Materials
1553%
鉱物性燃料Mineral Fuels
1744%
プラスチックPlastic Materials
2956%有機化合物Organic
Chemicals2335%
鉄鋼Iron &
Steel Products3267%
電気機器ElectricalMachinery
83718%
輸送用機器TransportEquipment
1032%
その他Others
63213%
Total¥4,766billion
■2020 対韓国輸出 Exports to Korea●輸出商品内訳 Exports, by Commodity ●輸入商品内訳 Imports, by Commodity●輸出上位品目 Top Items by Value of Exports ●輸入上位品目 Top Items by Value of Imports
●輸出推移(商品別) Exports to Korea by Commodity ●輸入推移(商品別) Imports from Korea by Commodity
■2020 対韓国輸入 Imports from Korea
Source: 財務省貿易統計より作成。 Compiled from MOF's Trade Statistics on a Customs-cleared Basis.
16 17Main Chapter▶II.Trade by Major Area and Country本論編▶II.主要国別・地域別貿易
品目 Items
金額Value
(10億円)[¥ billion]
伸率Growth(%)
寄与度Contribution
degree(%)
石油製品Petroleum Products
310(423) ▲ 26.7 ▲ 3.5
鉄鋼Iron & Steel Products
264(339) ▲ 22.3 ▲ 2.3
非鉄金属Nonferrous Metals
147(131) 11.8 0.5
半導体等電子部品Semiconductors etc.
132(154) ▲ 14.2 ▲ 0.7
有機化合物Organic Chemicals
111(126) ▲ 11.8 ▲ 0.5
上位5品目 合計Top 5 total 964 ー ▲ 6.5
全品目 合計Grand total
2,838(3,227) ▲ 12.1 ▲ 12.1
注:( )内の数字は2019年の金額。Note: Figures in ( ) are value in 2019.
品目 Items
金額Value
(10億円)[¥ billion]
伸率Growth(%)
寄与度Contribution
degree(%)
半導体等製造装置Semicon Machinery etc.
486(317) 53.5 3.4
鉄鋼Iron & Steel Products
326(425) ▲ 23.2 ▲ 2.0
プラスチックPlastic Materials
295(298) ▲ 1.0 ▲ 0.1
半導体等電子部品Semiconductors etc.
269(248) 8.9 0.4
有機化合物Organic Chemicals
233(273) ▲ 14.5 ▲ 0.8
上位5品目 合計Top 5 total 1,610 ー 1.0
全品目 合計Grand total
4,766(5,044) ▲ 5.5 ▲ 5.5
注:( )内の数字は2019年の金額。Note: Figures in ( ) are value in 2019.

(3) Taiwan: Exports up for four years, imports down for two years◆ In 2020, Japan’s trade with Taiwan flat from a year earlier at ¥7.6 trillion, which accounted for 6% (up 1
percentage point) of Japan's total foreign trade value.◆ Exports to Taiwan grew 1% to ¥4.7 trillion, increasing for the fourth consecutive year. Exports of
Semiconductor etc. (up 15% to ¥820.0 billion), Nonferrous Metals (up 24% to ¥200.0 billion), and Electrical Measuring (up 23% to ¥120.0 billion) increased. In contrast, exports of Organic Chemicals declined 37% to ¥140.0 billion.
◆ Imports from Taiwan decreased for the second consecutive year, falling 2% to ¥2.9 trillion. Imports of Iron & Steel Products (down 19% to ¥72.0 billion), imports of Manufactures of Metals (down 12% to ¥71.0 billion), and imports of Fish & Fish Preparation (down 18% to ¥43.0 billion) went down. In contrast, imports of Semiconductors etc. increased 7% to ¥1.2 trillion.
◆ In 2020, Japan’s balance of trade surplus with Taiwan increased for two years, growing 7% to ¥1.9 trillion.
(3)台湾:輸出は4年連続の増加、輸入は2年連続の減少◆ 2020年の対台湾貿易は、総額で7.6兆円(前年比横ばい)となり、わが国貿易総額の6%(同+1ポイント)を占めた。
◆ 輸出は4.7兆円(同+1%)となり、4年連続で増加した。半導体等電子部品が8,200億円(同+15%)、非鉄金属が2,000億円(同+24%)、電気計測機器が1,200億円(同+23%)と増加した。一方、有機化合物が1,400億円(同▲37%)と減少した。
◆ 輸入は2.9兆円(同▲2%)となり、2年連続で減少した。鉄鋼が720億円(同▲19%)、金属製品が710億円(同▲12%)、魚介類・同調製品が430億円(同▲18%)と減少した。一方、半導体等電子部品は1.2兆円(同+7%)と増加した。
◆ 対台湾貿易収支は1.9兆円(同+7%)と2年連続で黒字が拡大した。
2011 12 13 14 15 16 17 18 19 20 (C.Y.)
[¥ billion](10億円)
6,000
4,000
2,000
0
その他商品Other Commodities
輸送用機器Transport Equipment
電気機器Electrical Machinery
一般機械Machinery
原料別製品Manufactured Goods
化学製品Chemicals
894 803 878 894 865 821 908 980 936 891
727 645 694 712 656 550 649 664 533 565
722595 650 734 829 917 850 775 942 855
961878
906 897 1,027 9921,092 1,154 1,107 1,281
192202
246 253 300 287302 342 374 353
4,689 4,739
4,0583,673
4,061 4,2324,473
4,2684,558 4,679
2011 12 13 14 15 16 17 18 19 20 (C.Y.)
[¥ billion](10億円)
0
500
1,000
1,500
2,000
2,500
3,000
3,500
その他商品Other Commodities
電気機器Electrical Machinery
一般機械Machinery
原料別製品Manufactured Goods
化学製品Chemicals
食料品Foodstuff71 69 63 71 79 77 85 83 83 69
194 189 220 241 266 226 263 325 291 240252 247 280 315 305 260 305 329 309 269148 143 163 197 209 190
222 260 277243
650 727996
1,1391,324
1,1741,380
1,391 1,332 1,415
2,928 2,856
1,852 1,921
2,3152,568
2,817
2,495
2,8482,998
食料品Foodstuff
692%
原料品Raw Materials
833%
化学製品Chemicals
2408%
原料別製品Manufactured
Goods2699%
一般機械Machinery
2438%
電気機器Electrical Machinery
1,41550%
輸送用機器TransportEquipment
462%
その他Others
48517%
Total¥2,856billion
食料品Foodstuff912%
化学製品Chemicals89119%
原料別製品ManufacturedGoods56512%
一般機械Machinery85518%
電気機器ElectricalMachinery1,28127%
輸送用機器TransportEquipment3537%
その他Others62213%
Total¥4,739billion
■2020 対台湾輸出 Exports to Taiwan●輸出商品内訳 Exports, by Commodity ●輸入商品内訳 Imports, by Commodity●輸出上位品目 Top Items by Value of Exports ●輸入上位品目 Top Items by Value of Imports
●輸出推移(商品別) Exports to Taiwan by Commodity ●輸入推移(商品別) Imports from Taiwan by Commodity
■2020 対台湾輸入 Imports from Taiwan
18 19Main Chapter▶II.Trade by Major Area and Country本論編▶II.主要国別・地域別貿易
Source: 財務省貿易統計より作成。 Compiled from MOF's Trade Statistics on a Customs-cleared Basis.
品目 Items
金額Value
(10億円)[¥ billion]
伸率Growth(%)
寄与度Contribution
degree(%)
半導体等電子部品Semiconductors etc.
1,185(1,107) 7.1 2.7
通信機Telephony, Telegraphy
75(57) 32.2 0.6
鉄鋼Iron & Steel Products
72(89) ▲ 19.4 ▲ 0.6
金属製品Manufactures of Metals
71(81) ▲ 12.1 ▲ 0.3
電算機類(含周辺機器)Computers & Units
70(72) ▲ 3.8 ▲ 0.1
上位5品目 合計Top 5 total 1,473 ー 2.3
全品目 合計Grand total
2,856(2,928) ▲ 2.4 ▲ 2.4
注:( )内の数字は2019年の金額。Note: Figures in ( ) are value in 2019.
品目 Items
金額Value
(10億円)[¥ billion]
伸率Growth(%)
寄与度Contribution
degree(%)
半導体等電子部品Semiconductors etc.
818(714) 14.6 2.2
半導体等製造装置Semicon Machinery etc.
518(583) ▲ 11.1 ▲ 1.4
プラスチックPlastic Materials
271(250) 8.3 0.4
自動車Motor Vehicles
270(288) ▲ 6.2 ▲ 0.4
非鉄金属Nonferrous Metals
204(165) 23.7 0.8
上位5品目 合計Top 5 total 2,082 ー 1.7
全品目 合計Grand total
4,739(4,689) 1.1 1.1
注:( )内の数字は2019年の金額。Note: Figures in ( ) are value in 2019.

(4) ASEAN: Both exports and imports down for second consecutive year◆ In 2020, Japan’s trade with ASEAN went down 12% to ¥20.5 trillion, which accounted for 15% (flat from a
year earlier) of Japan's total foreign trade value.◆ Exports to ASEAN declined for two years, falling 15% to ¥9.8 trillion. Exports to Thailand (Iron & Steel
Products) (down 17% to ¥2.7 trillion), exports to Indonesia (Parts of Motor Vehicles) (down 36% to ¥980.0 billion), and exports to Singapore (Ships) (down 14% to ¥1.9 trillion) went down. Exports to ASEAN countries except Vietnam and Laos all decreased.
◆ Imports from ASEAN declined for the second consecutive year, falling 9% to ¥10.7 trillion. Imports from Indonesia (LNG)(down 17% to ¥1.6 trillion), imports from Thailand (Audio & Visual Apparatus)(down 8% to ¥2.5 trillion), and imports from Malaysia (LNG)(down 12% to ¥1.7 trillion) decreased.
◆ In 2020, Japan’s balance of trade with ASEAN was a deficit (¥810.0 billion) for the second consecutive year.
(4)ASEAN:輸出入とも2年連続の減少◆ 2020年の対ASEAN貿易は、総額で20.5兆円(前年比▲12%)となり、わが国貿易総額の15%(同横ばい)を占めた。
◆ 輸出は9.8兆円(同▲15%)となり、2年連続で減少した。タイ(鉄鋼)向けは2.7兆円(同▲17%)、インドネシア(自動車の部分品)向けは9,800億円(同▲36%)、シンガポール(船舶)向けは1.9兆円(同▲14%)となるなど、ベトナム、ラオスを除き減少した。◆ 輸入は10.7兆円(同▲9%)となり、2年連続で減少した。インドネシア(LNG)からは1.6兆円(同▲17%)、タイ(音響映像機器(含部品))からは2,5兆円(同▲8%)、マレーシア(LNG)からは1.7兆円(同▲12%)となった。
◆ 対ASEAN貿易収支は▲8,100億円と2年連続で赤字となった。
2011 12 13 14 15 16 17 18 19 20
[¥ billion](10億円)
15,000
10,000
5,000
0
その他Others
ベトナムViet Nam
インドネシアIndonesia
マレーシアMalaysia
タイThailand
シンガポールSingapore
2,170 1,859 2,047 2,225 2,403 2,155 2,541 2,584 2,199 1,888
2,989 3,489 3,507 3,320 3,386 2,974 3,300 3,562 3,291 2,723
1,496 1,413 1,497 1,4531,318
1,431 1,539 1,449
1,344
1,412 1,619 1,662 1,560 1,3961,230
1,502 1,743
1,524
982
764 8571,029 1,253 1,516
1,411
1,688 1,814
1,797
1,826
11,578
9,8469,79910,328
10,828 11,080 11,49510,378
11,87212,634
1,487
(C.Y.) 2011 12 13 14 15 16 17 18 19 20 (C.Y.)
[¥ billion](10億円)
15,000
10,000
5,000
0
その他Others
ベトナムViet Nam
フィリピンPhilippines
インドネシアIndonesia
マレーシアMalaysia
タイThailand
1,953 1,886 2,150 2,300 2,472 2,190 2,550 2,771 2,536
2,426 2,6212,901 3,087 2,602
1,8782,162 2,091 1,926 1,700
2,716 2,5762,813 2,716 2,390
1,9892,231 2,379 1,982
1,644
712 745901 1,076
1,074
9831,096 1,152
1,156994
920 1,2031,389 1,631
1,832
1,7662,079
2,3352,451
2,352
11,75710,652
9,951 10,30611,486
12,252 11,843
10,047
11,54512,399
2,765
タイThailand
2,53624%
ベトナムViet Nam
2,35222%マレーシア
Malaysia1,70016%
インドネシアIndonesia
1,64415%
フィリピンPhilippines
9949%
シンガポールSingapore
9139%
その他Others
5125%
Total¥10,652billion
タイThailand
2,72328%
シンガポールSingapore
1,88819%
ベトナムViet Nam
1,82619%
マレーシアMalaysia
1,34414%
インドネシアIndonesia
98210%
フィリピンPhilippines
94010%
Total¥9,846billion
■2020 対ASEAN輸出 Exports to ASEAN●輸出国内訳 Exports, by Country ●輸入国内訳 Imports, by Country●輸出上位品目 Top Items by Value of Exports ●輸入上位品目 Top Items by Value of Imports
●輸出推移(国別) Exports to ASEAN by Country ●輸入推移 (国別) Imports from ASEAN by Country
■2020 対ASEAN輸入 Imports from ASEAN
20 21Main Chapter▶II.Trade by Major Area and Country本論編▶II.主要国別・地域別貿易
Source: 財務省貿易統計より作成。 Compiled from MOF's Trade Statistics on a Customs-cleared Basis.
品目 Items
金額Value
(10億円)[¥ billion]
伸率Growth(%)
寄与度Contribution
degree(%)
衣類・同付属品Clothing & Accessories
886(974) ▲ 9.0 ▲ 0.7
液化天然ガスLNG
697(983) ▲ 29.1 ▲ 2.4
通信機Telephony, Telegrapy
554(493) 12.4 0.5
絶縁電線及び絶縁ケーブルInsulated Wire and Cable
493(538) ▲ 8.3 ▲ 0.4
半導体等電子部品Semiconductors etc.
361(409) ▲ 11.6 ▲ 0.4
上位5品目 合計Top 5 total 2,992 ー ▲ 3.4
全品目 合計Grand total
10,652(11,757) ▲ 9.4 ▲ 9.4
注:( )内の数字は2019年の金額。Note: Figures in ( ) are value in 2019.
品目 Items
金額Value
(10億円)[¥ billion]
伸率Growth(%)
寄与度Contribution
degree(%)
半導体等電子部品Semiconductors etc.
969(886) 9.4 0.7
鉄鋼Iron & Steel Products
723(957) ▲ 24.5 ▲ 2.0
自動車の部分品Parts of Motor Vehicles
403(629) ▲ 35.9 ▲ 1.9
電気回路等の機器Electrical Apparatus
364(409) ▲ 11.0 ▲ 0.4
自動車Motor Vehiccles
364(559) ▲ 34.8 ▲ 1.7
上位5品目 合計Top 5 total 2,824 ー ▲ 5.3
全品目 合計Grand total
9,846(11,578) ▲ 15.0 ▲ 15.0
注:( )内の数字は2019年の金額。Note: Figures in ( ) are value in 2019.

(5) Thailand: Both exports and imports down for second consecutive year◆ In 2020, Japan’s trade with Thailand went down 13% to ¥5.3 trillion, which broke the highest record and
accounted for 4% (flat from a year earlier) of Japan's total foreign trade value.◆ Exports to Thailand decreased for two years, falling 17% to ¥2.7 trillion. Iron & Steel Products exports (down
32% to ¥290.0 billion), exports of Parts of Motor Vehicles (down 28% to ¥210.0 billion), and exports of Manufactures of Metals (down 25% to ¥84.0 billion) went down.
◆ Imports from Thailand decreased for two years, dropping 8% to ¥2.5 trillion. Imports of Audio & Visual Apparatus (down 26% to ¥94.0 billion), imports of Parts of Motor Vehicles (down 23% to ¥80.0 billion), and imports of Fish & Fish Preparation (down 16% to ¥91.0 billion) declined. In contrast, imports of Motor Vehicles increased 2.9 times from a year earlier to ¥100.0 billion.
◆ In 2020, Japan’s balance of trade surplus with Thailand narrowed for the second consecutive year, falling 64% to ¥190.0 billion.
(5)タイ:輸出入とも2年連続の減少◆ 2020年の対タイ貿易は、総額で過去最大の5.3兆円(前年比▲13%)となり、わが国貿易総額の4%(同横ばい)を占めた。◆ 輸出は2.7兆円(同▲17%)となり、2年連続で減少した。鉄鋼が2,900億円(同▲32%)、自動車の部分品が2,100億円(同▲28%)、金属製品が840億円(同▲25%)となった。
◆ 輸入は2.5兆円(同▲8%)となり、2年連続で減少した。音響映像機器(含部品)が940億円(同▲26%)、自動車の部分品が800億円(同▲23%)、魚介類・同調整品が910億円(同▲16%)と減少した。一方、自動車は1,000億円(同+2.9倍)と増加した。
◆ 対タイ貿易収支は1,900億円(同▲64%)と2年連続で黒字が縮小した。
2011 12 13 14 15 16 17 18 19 20 (C.Y.)
[¥ billion](10億円)
4,000
3,000
2,000
1,000
0
その他商品OtherCommodities
輸送用機器TransportEquipment
電気機器ElectricalMachinery
一般機械Machinery
原料別製品ManufacturedGoods
化学製品Chemicals
284 253 282 293 300 283 313 351 340 311
694 760 819 834 695 807 899780 594
725 1,004 913 856 797684
710 749 713563
574
615 614 594 612571
667719
655
571
351
496 483 323 368
336350
372376
304
3,291
2,7232,989
3,489 3,5073,320 3,386
2,9743,300
3,562
822
2011 12 13 14 15 16 17 18 19 20 (C.Y.)
[¥ billion](10億円)
3,000
2,000
1,000
0
その他商品OtherCommodities
輸送用機器TransportEquipment
電気機器ElectricalMachinery
一般機械Machinery
原料別製品ManufacturedGoods
食料品Foodstuff
378 369 394 412 470 427 460 468 462 429
223 203 265 285 296 258 275 295 291 246239 256
301 342 359 297 329 368 359 320359 333
405453
508463
642685 725
65796 130136
126127
123
129161 162
212
2,7652,536
1,953 1,886
2,1502,300
2,472
2,190
2,5502,771
肉類・同調製品Meat & Meat Preparation
2088%
魚介類・同調製品Fish & Fish Preparation
914%
原料品Raw
Materials793%
化学製品Chemicals
24810%
原料別製品Manufactured
Goods24610%
一般機械Machinery
32013%
電気機器ElectricalMachinery
65726%
輸送用機器TransportEquipment
2128%
その他Others
34314% 食料品
Foodstuff 429 17%
Total¥2,536billion
化学製品Chemicals31111%
原料別製品ManufacturedGoods59422%
一般機械Machinery56321%
電気機器ElectricalMachinery57121%
輸送用機器TransportEquipment30411%
その他Others28310%
Total¥2,723billion
■2020 対タイ輸出 Exports to Thailand●輸出商品内訳 Exports, by Commodity ●輸入商品内訳 Imports, by Commodity●輸出上位品目 Top Items by Value of Exports ●輸入上位品目 Top Items by Value of Imports
●輸出推移(商品別) Exports to Thailand by Commodity ●輸入推移(商品別) Imports from Thailand by Commodity
■2020 対タイ輸入 Imports from Thailand
Source: 財務省貿易統計より作成。 Compiled from MOF's Trade Statistics on a Customs-cleared Basis.
22 23Main Chapter▶II.Trade by Major Area and Country本論編▶II.主要国別・地域別貿易
品目 Items
金額Value
(10億円)[¥ billion]
伸率Growth(%)
寄与度Contribution
degree(%)
肉類・同調製品Meat & Meat Preparation
208(220) ▲ 5.3 ▲ 0.4
通信機Telephony, Telegraphy
183(183) 0.1 0.0
自動車Motor Vehiccles
103(36) 186.1 2.4
音響映像機器(含部品)Audio & Visual Apparatus
94(128) ▲ 26.2 ▲ 1.2
電算機類(含周辺機器)Computers & Units
93(97) ▲ 3.6 ▲ 0.1
上位5品目 合計Top 5 total 683 ー 0.7
全品目 合計Grand total
2,536(2,765) ▲ 8.3 ▲ 8.3
注:( )内の数字は2019年の金額。Note: Figures in ( ) are value in 2019.
品目 Items
金額Value
(10億円)[¥ billion]
伸率Growth(%)
寄与度Contribution
degree(%)
鉄鋼Iron & Steel Products
293(432) ▲ 32.2 ▲ 4.2
自動車の部分品Parts of Motor Vehicles
214(298) ▲ 28.3 ▲ 2.6
半導体等電子部品Semiconductors etc.
192(217) ▲ 11.8 ▲ 0.8
原動機Power Generating Machine
127(154) ▲ 17.8 ▲ 0.8
非鉄金属Nonferrous Metals
125(123) 1.5 0.1
上位5品目 合計Top 5 total 950 ー ▲ 8.4
全品目 合計Grand total
2,723(3,291) ▲ 17.2 ▲ 17.2
注:( )内の数字は2019年の金額。Note: Figures in ( ) are value in 2019.

(6) Indonesia: Both exports and imports down for second consecutive year◆ In 2020, Japan’s trade with Indonesia decreased 25% to ¥2.6 trillion, which accounted for 2% (flat from a year
earlier) of Japan's total foreign trade value.◆ Exports to Indonesia decreased for the second consecutive year, falling 36% to ¥980.0 billion. Exports of
Parts of Motor Vehicles (down 54% to ¥81.0 billion), Power Generating Machine exports (down 56% to ¥65.0 billion), and exports of Iron & Steel Products (down 34% to 120.0 billion) went down.
◆ Imports from Indonesia decreased for the second consecutive year, declining 17% to ¥1.6 trillion. Imports of LNG (down 60% to ¥98.0 billion), Coal (down 25% to ¥230.0 billion), and Insulated Wire and Cable (down 19% to ¥86.0 billion) went down.
◆ In 2020, Japan’s balance of trade deficit with Indonesia increased after decreasing for one year, rising 45% to ¥660.0 billion.
(6)インドネシア:輸出入とも2年連続の減少◆ 2020年の対インドネシア貿易は、総額で2.6兆円(前年比▲25%)となり、わが国貿易総額の2%(同横ばい)を占めた。◆ 輸出は9,800億円(同▲36%)となり、2年連続で減少した。自動車の部分品が810億円(同▲
54%)、原動機は650億円(同▲56%)、鉄鋼が1,200億円(同▲34%)となった。◆ 輸入は1.6兆円(同▲17%)となり、2年連続で減少した。LNGが980億円(同▲60%)、石炭が2,300億円(同▲25%)、絶縁電線・絶縁ケーブルが860億円(同▲19%)となった。
◆ 対インドネシア貿易収支は▲6,600億円(同+45%)と2年ぶりに赤字が拡大した。
2011 12 13 14 15 16 17 18 19 20 (C.Y.)
[¥ billion](10億円)
その他商品OtherCommodities
輸送用機器TransportEquipment
電気機器ElectricalMachinery
一般機械Machinery
原料別製品ManufacturedGoods
化学製品Chemicals
2,000
1,500
1,000
500
0
115 141 147 132 149 152 142 130
321 363 394 378 353 314 378 415 364250
418 480476 450 379
322388
484418
238
169189 207 197
177165
180194
181
126
287
355 306258
207181
270
355
271
131
1,524
982
1,412
1,619 1,6621,560
1,3961,230
1,502
1,743
146116
2011 12 13 14 15 16 17 18 19 20 (C.Y.)
[¥ billion](10億円)
3,500
3,000
2,500
2,000
1,500
1,000
500
0
その他商品OtherCommodities
電気機器ElectricalMachinery
原料別製品ManufacturedGoods
鉱物性燃料Mineral Fuels
原料品Raw Materials
食料品Foodstuff
97 111 116 104 117 119 123⦆ 123
513 383 395 389 433 406 413 552 338 377
1,4231,382
1,468 1,322905
629746 717
566 330
284269
308307
306
269287
309
280224
116122
148162
169
147171
189
191163
1,982
1,644
2,7162,576
2,813 2,716
2,390
1,9892,231
2,379
11197
食料品Foodstuff
1237%
原料品Raw Materials
37723%
鉱物性燃料Mineral Fuels
33020%
化学製品Chemicals
875%
原料別製品Manufactured
Goods22414%
一般機械Machinery
755%
電気機器Electrical Machinery
16310%
輸送用機器TransportEquipment
513%
その他Others
21513%
Total¥1,644billion
原料品Raw Materials
283%
化学製品Chemicals
13013%
原料別製品Manufactured
Goods25025%一般機械
Machinery23824%
電気機器ElectricalMachinery
12613%
輸送用機器TransportEquipment
13113%
その他Others
687%
Total¥982billion
■2020 対インドネシア輸出 Exports to Indonesia●輸出商品内訳 Exports, by Commodity ●輸入商品内訳 Imports, by Commodity●輸出上位品目 Top Items by Value of Exports ●輸入上位品目 Top Items by Value of Imports
●輸出推移(商品別) Exports to Indonesia by Commodity ●輸入推移(商品別) Imports from Indonesia by Commodity
■2020 対インドネシア輸入 Imports from Indonesia
Source: 財務省貿易統計より作成。 Compiled from MOF's Trade Statistics on a Customs-cleared Basis.
24 25Main Chapter▶II.Trade by Major Area and Country本論編▶II.主要国別・地域別貿易
品目 Items
金額Value
(10億円)[¥ billion]
伸率Growth(%)
寄与度Contribution
degree(%)
石炭Coal
226(301) ▲ 25.0 ▲ 3.8
非鉄金属鉱Ore of Nonferrous
143(109) 31.4 1.7
液化天然ガスLNG
98(243) ▲ 59.6 ▲ 7.3
衣類・同付属品Clothing & Accessories
95(115) ▲ 17.6 ▲ 1.0
絶縁電線及び絶縁ケーブルInsulated Wire and Cable
86(107) ▲ 19.2 ▲ 1.0
上位5品目 合計Top 5 total 648 ー ▲ 11.4
全品目 合計Grand total
1,644(1,982) ▲ 17.0 ▲ 17.0
注:( )内の数字は2019年の金額。Note: Figures in ( ) are value in 2019.
品目 Items
金額Value
(10億円)[¥ billion]
伸率Growth(%)
寄与度Contribution
degree(%)
鉄鋼Iron & Steel Products
123(186) ▲ 33.9 ▲ 4.1
自動車の部分品Parts of Motor Vehicles
81(176) ▲ 53.8 ▲ 6.2
原動機Power Generating Machine
65(147) ▲ 55.8 ▲ 5.4
非鉄金属Nonferrous Metals
39(48) ▲ 18.9 ▲ 0.6
プラスチックPlastic Materials
39(49) ▲ 20.4 ▲ 0.7
上位5品目 合計Top 5 total 347 ー ▲ 17.0
全品目 合計Grand total
982(1,524) ▲ 35.6 ▲ 35.6
注:( )内の数字は2019年の金額。Note: Figures in ( ) are value in 2019.

(7) Other Asian countries: Both exports and imports down for second consecutive year◆ In 2020, Japan’s trade with other Asian countries, which is made up of 12 countries excluding China, Asian
NIEs (4 countries), and ASEAN (10 countries) out of 26 countries in Asia, decreased 17% to ¥2.1 trillion, which accounted for 3% (flat from a year earlier) of Japan's total trade with Asia.*Singapore is included in both Asian NIEs and ASEAN countries.
◆ Exports to other Asian countries decreased for the second consecutive year, dropping 18% to ¥1.4 trillion, which accounted for 4% (flat from a year earlier) of Japan’s total exports to Asia. Exports to India (Iron & Steel Products), which accounted for around 70% of the total exports to other Asian countries, decreased for the second consecutive year, dropping 19% to ¥970.0 billion. Exports to Sri Lanka (Motor Vehicles)(down 43% to ¥40.0 billion) and Mongolia (Motor Vehicles)(down 43% to ¥36.0 billion) dropped.
◆ Imports from other Asian countries decreased for the second consecutive year, declining 15% to ¥700.0 billion, which accounted for 2% (flat from a year earlier) of Japan’s total imports from Asia. Imports from India (Non-metallic Mineral Ware), which accounted for around 70% of the total imports from other Asian countries, went down for the second consecutive year, falling 14% to ¥500.0 billion. Imports from Bangladesh (Clothing & Accessories) declined 13% to ¥140.0 billion. Imports from Sri Lanka (Clothing & Accessories) dropped 28% to ¥26.0 billion.
◆ In 2020, Japan's balance of trade surplus with other Asian countries narrowed for the second consecutive year, falling 20% to ¥670.0 billion.
(7)その他アジア:輸出入とも2年連続の減少◆ アジア26ヵ国のうち、中国(1)、アジアNIEs(4)、ASEAN(10)を除いた12ヵ国との2020年の貿易は、総額で2.1兆円(前年比▲17%)となり、対アジア貿易総額の3%(同横ばい)を占めた。*シンガポールは、アジアNIEsとASEANの両方に含まれる。
◆ 輸出は1.4兆円(同▲18%)と2年連続で減少し、アジア向け輸出の4%(同横ばい)を占めた。うち7割を占めるインド(鉄鋼)向けは9,700億円(同▲19%)となり、2年連続で減少した。その他、スリランカ(自動車)向けは400億円(同▲43%)、モンゴル(自動車)向けは360億円(同▲43%)となった。
◆ 輸入は7,000億円(同▲15%)と2年連続で減少し、アジアからの輸入の2%(同横ばい)を占めた。うち7割を占めるインド(非金属鉱物製品)からは5,000億円(同▲14%)となり、2年連続で減少した。その他、バングラデシュ(衣類・同付属品)からは1,400億円(同▲13%)、スリランカ(衣類・同付属品)からは260億円(同▲28%)となった。
◆ 対その他アジア貿易収支は6,700億円(同▲20%)と2年連続で黒字が縮小した。
[¥ billion](10億円)
2,000
1,500
1,000
500
0
その他Others
マカオMacao
バングラデシュBangladesh
スリランカSri Lanka
パキスタンPakistan
インドIndia
2011 12 13 14 15 16 17 18 19 20 (C.Y.)
882 845 839 861981 889 993
1,215 1,197971
135 135 139 171203
210261
232135
12475 3696
14176
98
138
69
408679 85
123
166172
195
173
155
1601821 29
33
4033
48
67
37
32
1,669
1,3751,238
1,157 1,1901,330
1,5751,427
1,651
1,899
57
2011 12 13 14 15 16 17 18 19 20 (C.Y.)
[¥ billion](10億円)
1,000
750
500
250
0
その他Others
バングラデシュBangladesh
スリランカSri Lanka
パキスタンPakistan
インドIndia
543558
690 739 589509 600 607 586
504
37 34
4635
31
29
48 39 33
24
22 22
2930
33
26
28 30 36
26
45 57
8799
131
132
131 159 161
140
823
701653 686
860914
798
703
817 842
インドIndia50472%
バングラデシュBangladesh
14020%
スリランカSri Lanka
264%
パキスタンPakistan
243%
Total¥701billion
Total¥1,375billion
マカオMacao
322%
インドIndia97170%
バングラデシュBangladesh
16012%
パキスタンPakistan
1249%
スリランカSri Lanka
403%
モンゴルMongolia
363%
■2020 対その他アジア輸出 Exports to other Asian countries●輸出国内訳 Exports, by Country ●輸入国内訳 Imports, by Country●輸出上位品目 Top Items by Value of Exports ●輸入上位品目 Top Items by Value of Imports
●輸出推移(国別) Exports to other Asian countries by Country ●輸入推移(国別) Imports from other Asian countries by Country
■2020 対その他アジア輸入 Imports from other Asian countries
Source: 財務省貿易統計より作成。 Compiled from MOF's Trade Statistics on a Customs-cleared Basis.
26 27Main Chapter▶II.Trade by Major Area and Country本論編▶II.主要国別・地域別貿易
品目 Items
金額Value
(10億円)[¥ billion]
伸率Growth(%)
寄与度Contribution
degree(%)
衣類・同付属品Clothing & Accessories
152(179) ▲ 15.5 ▲ 3.4
有機化合物Organic Chemicals
84(85) ▲ 0.5 ▲ 0.1
石油製品Petroleum Products
69(59) 17.6 1.3
魚介類・同調製品Fish & Fish Preparation
48(55) ▲ 12.3 ▲ 0.8
非金属鉱物製品Non-metallic Mineral Ware
33(45) ▲ 26.7 ▲ 1.5
上位5品目 合計Top 5 total 386 ー ▲ 4.4
全品目 合計Grand total
701(823) ▲ 14.8 ▲ 14.8
注:( )内の数字は2019年の金額。Note: Figures in ( ) are value in 2019.
品目 Items
金額Value
(10億円)[¥ billion]
伸率Growth(%)
寄与度Contribution
degree(%)
鉄鋼Iron & Steel Products
140(186) ▲ 24.4 ▲ 2.7
非鉄金属Nonferrous Metals
120(109) 10.3 0.7
自動車Motor Vehicles
108(139) ▲ 22.7 ▲ 1.9
プラスチックPlastic Materials
89(95) ▲ 6.0 ▲ 0.3
有機化合物Organic Chemicals
53(46) 15.4 0.4
上位5品目 合計Top 5 total 509 ー ▲ 3.9
全品目 合計Grand total
1,375(1,669) ▲ 17.6 ▲ 17.6
注:( )内の数字は2019年の金額。Note: Figures in ( ) are value in 2019.
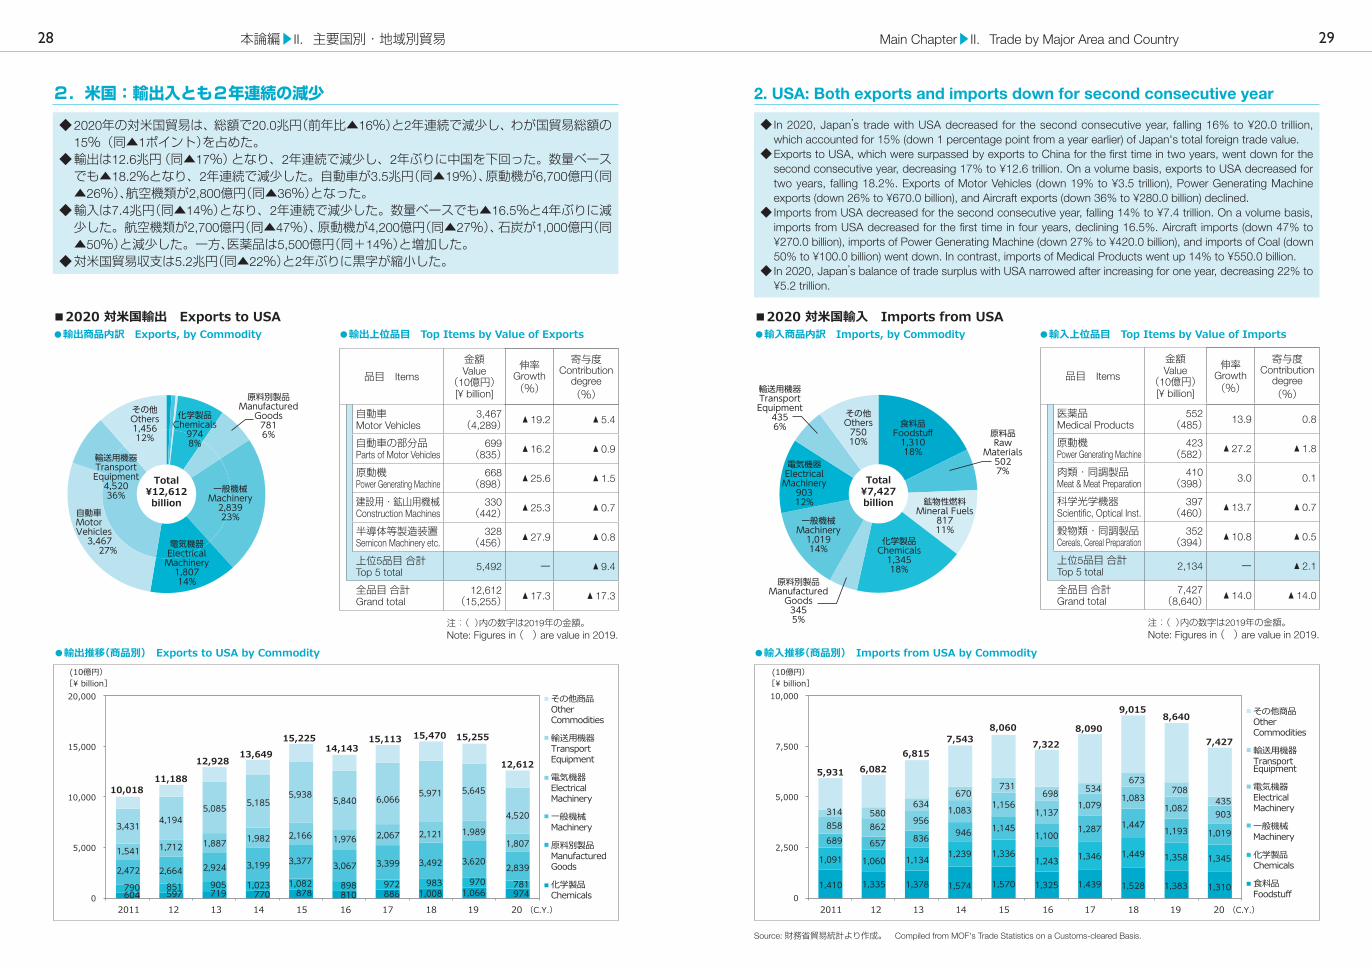
2. USA: Both exports and imports down for second consecutive year
◆ In 2020, Japan’s trade with USA decreased for the second consecutive year, falling 16% to ¥20.0 trillion, which accounted for 15% (down 1 percentage point from a year earlier) of Japan's total foreign trade value.
◆ Exports to USA, which were surpassed by exports to China for the first time in two years, went down for the second consecutive year, decreasing 17% to ¥12.6 trillion. On a volume basis, exports to USA decreased for two years, falling 18.2%. Exports of Motor Vehicles (down 19% to ¥3.5 trillion), Power Generating Machine exports (down 26% to ¥670.0 billion), and Aircraft exports (down 36% to ¥280.0 billion) declined.
◆ Imports from USA decreased for the second consecutive year, falling 14% to ¥7.4 trillion. On a volume basis, imports from USA decreased for the first time in four years, declining 16.5%. Aircraft imports (down 47% to ¥270.0 billion), imports of Power Generating Machine (down 27% to ¥420.0 billion), and imports of Coal (down 50% to ¥100.0 billion) went down. In contrast, imports of Medical Products went up 14% to ¥550.0 billion.
◆ In 2020, Japan’s balance of trade surplus with USA narrowed after increasing for one year, decreasing 22% to ¥5.2 trillion.
2.米国:輸出入とも2年連続の減少
◆ 2020年の対米国貿易は、総額で20.0兆円(前年比▲16%)と2年連続で減少し、わが国貿易総額の15%(同▲1ポイント)を占めた。
◆ 輸出は12.6兆円(同▲17%)となり、2年連続で減少し、2年ぶりに中国を下回った。数量ベースでも▲18.2%となり、2年連続で減少した。自動車が3.5兆円(同▲19%)、原動機が6,700億円(同▲26%)、航空機類が2,800億円(同▲36%)となった。
◆ 輸入は7.4兆円(同▲14%)となり、2年連続で減少した。数量ベースでも▲16.5%と4年ぶりに減少した。航空機類が2,700億円(同▲47%)、原動機が4,200億円(同▲27%)、石炭が1,000億円(同▲50%)と減少した。一方、医薬品は5,500億円(同+14%)と増加した。
◆ 対米国貿易収支は5.2兆円(同▲22%)と2年ぶりに黒字が縮小した。
2011 12 13 14 15 16 17 18 19 20 (C.Y.)
[¥ billion](10億円)
その他商品Other Commodities
輸送用機器TransportEquipment
電気機器Electrical Machinery
一般機械Machinery
原料別製品ManufacturedGoods
化学製品Chemicals
20,000
15,000
10,000
5,000
0
604 597 719 770 878 810 886 1,008 1,066 974790 851 905 1,023 1,082 898 972 983 970 7812,472 2,664 2,924 3,199 3,377 3,067 3,399 3,492 3,620
2,839
1,541 1,712 1,887 1,982 2,166 1,976 2,067 2,121 1,9891,807
3,431 4,1945,085 5,185
5,9385,840 6,066 5,971 5,645
4,520
15,255
12,612
10,01811,188
12,92813,649
15,22514,143
15,113 15,470
2011 12 13 14 15 16 17 18 19 20 (C.Y.)
[¥ billion](10億円)
10,000
7,500
5,000
2,500
0
その他商品Other Commodities
輸送用機器TransportEquipment
電気機器Electrical Machinery
一般機械Machinery
化学製品Chemicals
食料品Foodstuff
1,410 1,335 1,378 1,574 1,570 1,325 1,439 1,528 1,383 1,310
1,091 1,060 1,134 1,239 1,3361,243 1,346 1,449 1,358 1,345
689 657 836 946 1,1451,100
1,287 1,4471,193 1,019
858 862956
1,083 1,1561,137
1,0791,083
1,082 903314 580634
670731
698 534673
708435
8,640
7,427
5,931 6,0826,815
7,5438,060
7,3228,090
9,015
食料品Foodstuff
1,31018%
原料品Raw
Materials5027%
鉱物性燃料Mineral Fuels
81711%
化学製品Chemicals
1,34518%
一般機械Machinery
1,01914%
電気機器ElectricalMachinery
90312%
輸送用機器TransportEquipment
4356%
その他Others
75010%
原料別製品Manufactured
Goods3455%
Total¥7,427billion
化学製品Chemicals
9748%
原料別製品Manufactured
Goods7816%
一般機械Machinery
2,83923%
電気機器ElectricalMachinery
1,80714%
自動車MotorVehicles 3,467 27%
輸送用機器TransportEquipment
4,52036%
その他Others1,45612%
Total¥12,612billion
■2020 対米国輸出 Exports to USA●輸出商品内訳 Exports, by Commodity ●輸入商品内訳 Imports, by Commodity●輸出上位品目 Top Items by Value of Exports ●輸入上位品目 Top Items by Value of Imports
●輸出推移(商品別) Exports to USA by Commodity ●輸入推移(商品別) Imports from USA by Commodity
■2020 対米国輸入 Imports from USA
Source: 財務省貿易統計より作成。 Compiled from MOF's Trade Statistics on a Customs-cleared Basis.
28 29Main Chapter▶II.Trade by Major Area and Country本論編▶II.主要国別・地域別貿易
品目 Items
金額Value
(10億円)[¥ billion]
伸率Growth(%)
寄与度Contribution
degree(%)
医薬品Medical Products
552(485) 13.9 0.8
原動機Power Generating Machine
423(582) ▲ 27.2 ▲ 1.8
肉類・同調製品Meat & Meat Preparation
410(398) 3.0 0.1
科学光学機器Scientific, Optical Inst.
397(460) ▲ 13.7 ▲ 0.7
穀物類・同調製品Cereals, Cereal Preparation
352(394) ▲ 10.8 ▲ 0.5
上位5品目 合計Top 5 total 2,134 ー ▲ 2.1
全品目 合計Grand total
7,427(8,640) ▲ 14.0 ▲ 14.0
注:( )内の数字は2019年の金額。Note: Figures in ( ) are value in 2019.
品目 Items
金額Value
(10億円)[¥ billion]
伸率Growth(%)
寄与度Contribution
degree(%)
自動車Motor Vehicles
3,467(4,289) ▲ 19.2 ▲ 5.4
自動車の部分品Parts of Motor Vehicles
699(835) ▲ 16.2 ▲ 0.9
原動機Power Generating Machine
668(898) ▲ 25.6 ▲ 1.5
建設用・鉱山用機械Construction Machines
330(442) ▲ 25.3 ▲ 0.7
半導体等製造装置Semicon Machinery etc.
328(456) ▲ 27.9 ▲ 0.8
上位5品目 合計Top 5 total 5,492 ー ▲ 9.4
全品目 合計Grand total
12,612(15,255) ▲ 17.3 ▲ 17.3
注:( )内の数字は2019年の金額。Note: Figures in ( ) are value in 2019.
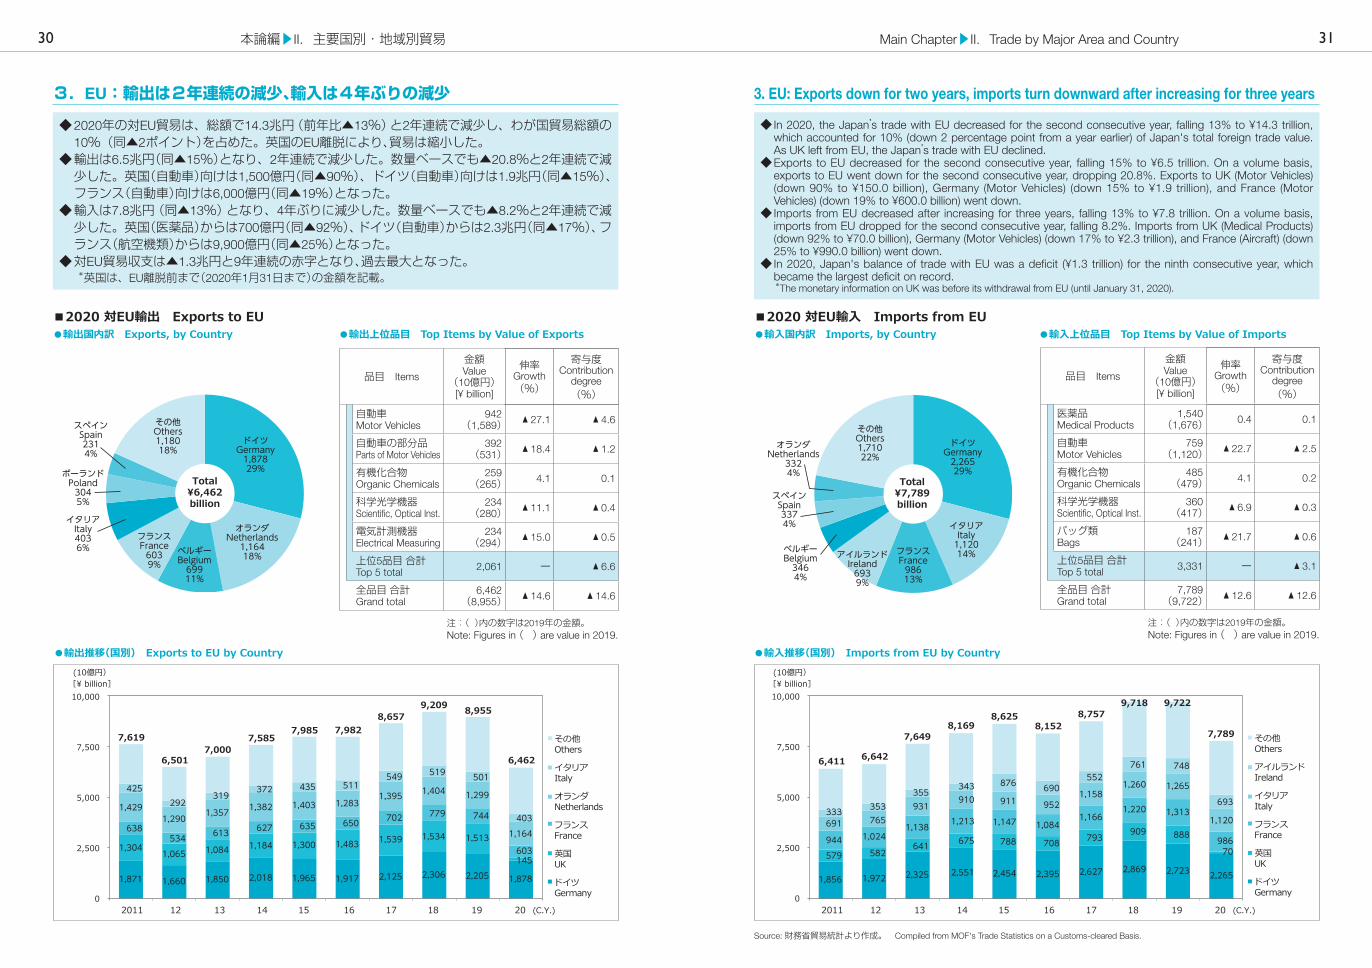
3. EU: Exports down for two years, imports turn downward after increasing for three years
◆ In 2020, the Japan’s trade with EU decreased for the second consecutive year, falling 13% to ¥14.3 trillion, which accounted for 10% (down 2 percentage point from a year earlier) of Japan's total foreign trade value. As UK left from EU, the Japan’s trade with EU declined.
◆ Exports to EU decreased for the second consecutive year, falling 15% to ¥6.5 trillion. On a volume basis, exports to EU went down for the second consecutive year, dropping 20.8%. Exports to UK (Motor Vehicles) (down 90% to ¥150.0 billion), Germany (Motor Vehicles) (down 15% to ¥1.9 trillion), and France (Motor Vehicles) (down 19% to ¥600.0 billion) went down.
◆ Imports from EU decreased after increasing for three years, falling 13% to ¥7.8 trillion. On a volume basis, imports from EU dropped for the second consecutive year, falling 8.2%. Imports from UK (Medical Products) (down 92% to ¥70.0 billion), Germany (Motor Vehicles) (down 17% to ¥2.3 trillion), and France (Aircraft) (down 25% to ¥990.0 billion) went down.
◆ In 2020, Japan's balance of trade with EU was a deficit (¥1.3 trillion) for the ninth consecutive year, which became the largest deficit on record.
*The monetary information on UK was before its withdrawal from EU (until January 31, 2020).
3.EU:輸出は2年連続の減少、輸入は4年ぶりの減少
◆ 2020年の対EU貿易は、総額で14.3兆円(前年比▲13%)と2年連続で減少し、わが国貿易総額の10%(同▲2ポイント)を占めた。英国のEU離脱により、貿易は縮小した。
◆ 輸出は6.5兆円(同▲15%)となり、2年連続で減少した。数量ベースでも▲20.8%と2年連続で減少した。英国(自動車)向けは1,500億円(同▲90%)、ドイツ(自動車)向けは1.9兆円(同▲15%)、フランス(自動車)向けは6,000億円(同▲19%)となった。
◆ 輸入は7.8兆円(同▲13%)となり、4年ぶりに減少した。数量ベースでも▲8.2%と2年連続で減少した。英国(医薬品)からは700億円(同▲92%)、ドイツ(自動車)からは2.3兆円(同▲17%)、フランス(航空機類)からは9,900億円(同▲25%)となった。
◆ 対EU貿易収支は▲1.3兆円と9年連続の赤字となり、過去最大となった。*英国は、EU離脱前まで(2020年1月31日まで)の金額を記載。
2011 12 13 14 15 16 17 18 19 20 (C.Y.)
[¥ billion](10億円)
10,000
7,500
5,000
2,500
0
その他Others
イタリアItaly
オランダNetherlands
フランスFrance
英国UK
ドイツGermany
1,871 1,660 1,850 2,018 1,965 1,917 2,125 2,306 2,205 1,878
1,3041,065 1,084 1,184 1,300 1,483 1,539 1,534 1,513
145
638534 613 627 635 650 702 779 744
603
1,4291,290 1,357 1,382 1,403 1,283
1,395 1,404 1,299
1,164
425292
319372 435 511
549 519 501
403
8,955
6,462
7,619
6,5017,000
7,5857,985 7,982
8,6579,209
2011 12 13 14 15 16 17 18 19 20 (C.Y.)
[¥ billion](10億円)
10,000
7,500
5,000
2,500
0
その他Others
アイルランドIreland
イタリアItaly
フランスFrance
英国UK
ドイツGermany
1,856 1,972 2,325 2,551 2,454 2,395 2,627 2,869 2,723 2,265
579 582641 675 788 708 793 909 888
70944 1,024
1,138 1,213 1,147 1,0841,166
1,220 1,313
986
691 765931
910 911 9521,158
1,260 1,265
1,120333 353
355 343 876 690552
761 748
693
9,722
7,789
6,411 6,642
7,6498,169
8,6258,152
8,7579,718
ドイツGermany2,26529%
イタリアItaly1,12014%フランス
France98613%
アイルランドIreland6939%
ベルギーBelgium3464%
スペインSpain3374%
オランダNetherlands
3324%
その他Others1,71022%
Total¥7,789billion
ドイツGermany1,87829%
オランダNetherlands1,16418%ベルギー
Belgium69911%
フランスFrance6039%
イタリアItaly4036%
ポーランドPoland3045%
スペインSpain2314%
その他Others1,18018%
Total¥6,462billion
■2020 対EU輸出 Exports to EU●輸出国内訳 Exports, by Country ●輸入国内訳 Imports, by Country ●輸出上位品目 Top Items by Value of Exports ●輸入上位品目 Top Items by Value of Imports
●輸出推移(国別) Exports to EU by Country ●輸入推移(国別) Imports from EU by Country
■2020 対EU輸入 Imports from EU
Source: 財務省貿易統計より作成。 Compiled from MOF's Trade Statistics on a Customs-cleared Basis.
30 31Main Chapter▶II.Trade by Major Area and Country本論編▶II.主要国別・地域別貿易
品目 Items
金額Value
(10億円)[¥ billion]
伸率Growth(%)
寄与度Contribution
degree(%)
医薬品Medical Products
1,540(1,676) 0.4 0.1
自動車Motor Vehicles
759(1,120) ▲ 22.7 ▲ 2.5
有機化合物Organic Chemicals
485(479) 4.1 0.2
科学光学機器Scientific, Optical Inst.
360(417) ▲ 6.9 ▲ 0.3
バッグ類Bags
187(241) ▲ 21.7 ▲ 0.6
上位5品目 合計Top 5 total 3,331 ー ▲ 3.1
全品目 合計Grand total
7,789(9,722) ▲ 12.6 ▲ 12.6
注:( )内の数字は2019年の金額。Note: Figures in ( ) are value in 2019.
品目 Items
金額Value
(10億円)[¥ billion]
伸率Growth(%)
寄与度Contribution
degree(%)
自動車Motor Vehicles
942(1,589) ▲ 27.1 ▲ 4.6
自動車の部分品Parts of Motor Vehicles
392(531) ▲ 18.4 ▲ 1.2
有機化合物Organic Chemicals
259(265) 4.1 0.1
科学光学機器Scientific, Optical Inst.
234(280) ▲ 11.1 ▲ 0.4
電気計測機器Electrical Measuring
234(294) ▲ 15.0 ▲ 0.5
上位5品目 合計Top 5 total 2,061 ー ▲ 6.6
全品目 合計Grand total
6,462(8,955) ▲ 14.6 ▲ 14.6
注:( )内の数字は2019年の金額。Note: Figures in ( ) are value in 2019.
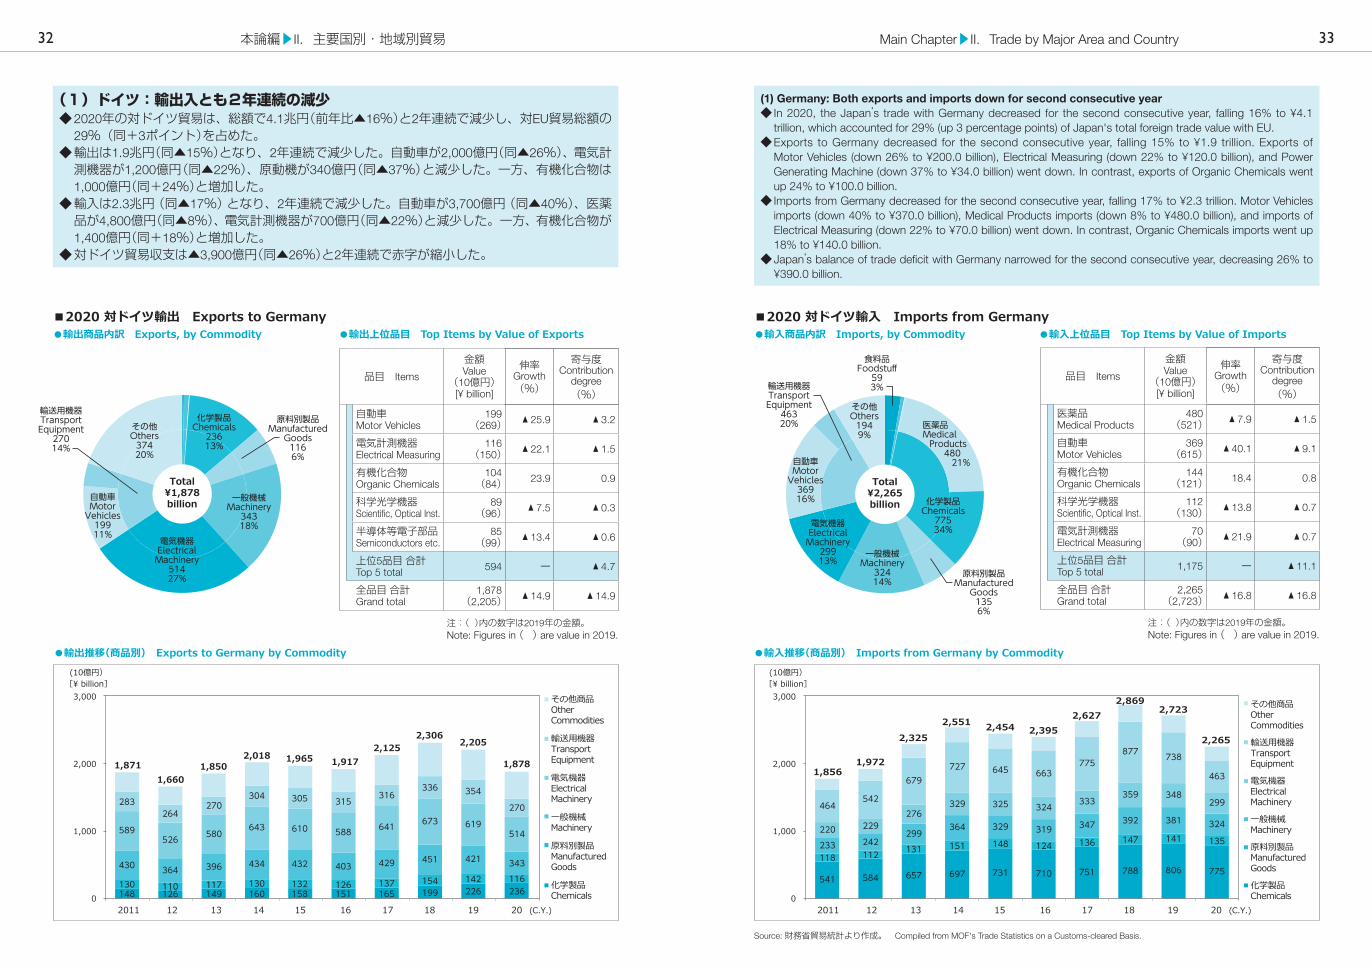
(1) Germany: Both exports and imports down for second consecutive year◆ In 2020, the Japan’s trade with Germany decreased for the second consecutive year, falling 16% to ¥4.1
trillion, which accounted for 29% (up 3 percentage points) of Japan's total foreign trade value with EU.◆ Exports to Germany decreased for the second consecutive year, falling 15% to ¥1.9 trillion. Exports of
Motor Vehicles (down 26% to ¥200.0 billion), Electrical Measuring (down 22% to ¥120.0 billion), and Power Generating Machine (down 37% to ¥34.0 billion) went down. In contrast, exports of Organic Chemicals went up 24% to ¥100.0 billion.
◆ Imports from Germany decreased for the second consecutive year, falling 17% to ¥2.3 trillion. Motor Vehicles imports (down 40% to ¥370.0 billion), Medical Products imports (down 8% to ¥480.0 billion), and imports of Electrical Measuring (down 22% to ¥70.0 billion) went down. In contrast, Organic Chemicals imports went up 18% to ¥140.0 billion.
◆ Japan’s balance of trade deficit with Germany narrowed for the second consecutive year, decreasing 26% to ¥390.0 billion.
(1)ドイツ:輸出入とも2年連続の減少◆ 2020年の対ドイツ貿易は、総額で4.1兆円(前年比▲16%)と2年連続で減少し、対EU貿易総額の
29%(同+3ポイント)を占めた。◆ 輸出は1.9兆円(同▲15%)となり、2年連続で減少した。自動車が2,000億円(同▲26%)、電気計測機器が1,200億円(同▲22%)、原動機が340億円(同▲37%)と減少した。一方、有機化合物は1,000億円(同+24%)と増加した。
◆ 輸入は2.3兆円(同▲17%)となり、2年連続で減少した。自動車が3,700億円(同▲40%)、医薬品が4,800億円(同▲8%)、電気計測機器が700億円(同▲22%)と減少した。一方、有機化合物が1,400億円(同+18%)と増加した。
◆ 対ドイツ貿易収支は▲3,900億円(同▲26%)と2年連続で赤字が縮小した。
2011 12 13 14 15 16 17 18 19 20 (C.Y.)
[¥ billion](10億円)
3,000
2,000
1,000
0
その他商品Other Commodities
輸送用機器TransportEquipment
電気機器Electrical Machinery
一般機械Machinery
原料別製品ManufacturedGoods
化学製品Chemicals148 126 149 160 158 151 165 199 226 236
130 110 117 130 132 126 137 154 142 116430 364 396 434 432 403 429 451 421 343
589526 580
643 610 588 641 673 619514
283264
270304 305 315 316
336 354
270
2,205
1,8781,8711,660
1,8502,018 1,965 1,917
2,1252,306
2011 12 13 14 15 16 17 18 19 20 (C.Y.)
[¥ billion](10億円)
3,000
2,000
1,000
0
その他商品Other Commodities
輸送用機器Transport Equipment
電気機器Electrical Machinery
一般機械Machinery
原料別製品Manufactured Goods
化学製品Chemicals
541 584 657 697 731 710 751 788 806 775118 112 131 151 148 124 136 147 141 135233 242
299364 329 319 347 392 381 324220 229
276329 325 324 333
359 348299464
542
679727 645 663
775877 738
463
2,723
2,265
1,8561,972
2,3252,551 2,454 2,395
2,6272,869
化学製品Chemicals77534%
輸送用機器TransportEquipment46320%
食料品Foodstuff593%
原料別製品ManufacturedGoods1356%
一般機械Machinery32414%
電気機器ElectricalMachinery29913%
自動車MotorVehicles36916%
その他Others1949%
Total¥2,265billion
医薬品 Medical
Products 480
21%
輸送用機器TransportEquipment27014%
化学製品Chemicals23613%
原料別製品ManufacturedGoods1166%
一般機械Machinery34318%
電気機器ElectricalMachinery51427%
自動車MotorVehicles19911%
その他Others37420%
Total¥1,878billion
■2020 対ドイツ輸出 Exports to Germany●輸出商品内訳 Exports, by Commodity ●輸入商品内訳 Imports, by Commodity●輸出上位品目 Top Items by Value of Exports ●輸入上位品目 Top Items by Value of Imports
●輸出推移(商品別) Exports to Germany by Commodity ●輸入推移(商品別) Imports from Germany by Commodity
■2020 対ドイツ輸入 Imports from Germany
Source: 財務省貿易統計より作成。 Compiled from MOF's Trade Statistics on a Customs-cleared Basis.
32 33Main Chapter▶II.Trade by Major Area and Country本論編▶II.主要国別・地域別貿易
品目 Items
金額Value
(10億円)[¥ billion]
伸率Growth(%)
寄与度Contribution
degree(%)
医薬品Medical Products
480(521) ▲ 7.9 ▲ 1.5
自動車Motor Vehicles
369(615) ▲ 40.1 ▲ 9.1
有機化合物Organic Chemicals
144(121) 18.4 0.8
科学光学機器Scientific, Optical Inst.
112(130) ▲ 13.8 ▲ 0.7
電気計測機器Electrical Measuring
70(90) ▲ 21.9 ▲ 0.7
上位5品目 合計Top 5 total 1,175 ー ▲ 11.1
全品目 合計Grand total
2,265(2,723) ▲ 16.8 ▲ 16.8
注:( )内の数字は2019年の金額。Note: Figures in ( ) are value in 2019.
品目 Items
金額Value
(10億円)[¥ billion]
伸率Growth(%)
寄与度Contribution
degree(%)
自動車Motor Vehicles
199(269) ▲ 25.9 ▲ 3.2
電気計測機器Electrical Measuring
116(150) ▲ 22.1 ▲ 1.5
有機化合物Organic Chemicals
104(84) 23.9 0.9
科学光学機器Scientific, Optical Inst.
89(96) ▲ 7.5 ▲ 0.3
半導体等電子部品Semiconductors etc.
85(99) ▲ 13.4 ▲ 0.6
上位5品目 合計Top 5 total 594 ー ▲ 4.7
全品目 合計Grand total
1,878(2,205) ▲ 14.9 ▲ 14.9
注:( )内の数字は2019年の金額。Note: Figures in ( ) are value in 2019.

(2) UK: Both exports and imports down for second consecutive year◆ In 2020, the Japan’s trade with UK decreased for the second consecutive year, falling 24% to ¥1.8 trillion,
which accounted for 1% (flat from a year earlier) of Japan's total foreign trade value.◆ Exports to UK decreased for the second consecutive year, falling 24% to ¥1.1 trillion. Motor Vehicles exports
(down 31% to ¥220.0 billion), exports of Power Generating Machine (down 41% to ¥67.0 billion), and Batteries & Accumulators exports (down 36% to ¥34.0 billion) went down. In contrast, exports of Medical Products increased 58% to ¥45.0 billion.
◆ Imports from UK decreased for the second consecutive year, dropping 23% to ¥680.0 billion. Imports of Power Generating Machine (down 51% to ¥65.0 billion), Motor Vehicles imports (down 32% to ¥100.0 billion), and imports of Medical Products (down 29% to ¥110.0 billion) fell. In contrast, imports of Nonferrous Metals grew 68% to ¥45.0 billion.
◆ Japan’s balance of trade surplus with UK narrowed for after increasing for one year, decreasing 26% to ¥460.0 billion.
(2)英国:輸出入とも2年連続の減少◆ 2020年の対英国貿易は、総額で1.8兆円(前年比▲24%)と2年連続で減少し、わが国貿易総額の
1%(同横ばい)を占めた。◆ 輸出は1.1兆円(同▲24%)となり、2年連続で減少した。自動車が2,200億円(同▲31%)、原動機が670億円(同▲41%)、電池が340億円(同▲36%)と減少した。一方、医薬品が450億円(同+58%)と増加した。
◆ 輸入は6,800億円(同▲23%)となり、2年連続で減少した。原動機が650億円(同▲51%)、自動車が1,000億円(同▲32%)、医薬品は1,100億円(同▲29%)と減少した。一方、非鉄金属は450億円(同+68%)と増加した。◆ 対英国貿易収支は4,600億円(同▲26%)と2年ぶりに黒字が縮小した。
53 48111
52 51 60 60 79 112 83 9588 81 73 80 61 69 87 67 53234 235 252 261 245 254 294 299 281 197
158 129 155 175 178 161178
210198
134
367 267 278 345 441 463478
452431
291
1,513
1,145
1,304
1,065 1,0841,184
1,300
1,483 1,539 1,534
2011 12 13 14 15 16 17 18 19 20 (C.Y.)
[¥ billion](10億円)
2,000
1,500
1,000
500
0
その他商品Other Commodities
輸送用機器TransportEquipment
電気機器Electrical Machinery
一般機械Machinery
原料別製品ManufacturedGoods
化学製品Chemicals
2011 12 13 14 15 16 17 18 19 20 (C.Y.)
[¥ billion](10億円)
1,000
800
600
200
400
0
その他商品Other Commodities
輸送用機器Transport Equipment
電気機器Electrical Machinery
一般機械Machinery
原料別製品Manufactured Goods
化学製品Chemicals
215 178 182 173224 173 228 229 230 170
6050 57 67
6047
49 56 5968
80106 96 115
125116
133203 188
116
63 61 94 8986
8076
78 86
7455 71
87 95112
144
154
181 169
120
685
579
888
582641 675
788708
793
909
医薬品 Medical
Products 114
16%化学製品Chemicals 170 25%
輸送用機器TransportEquipment
12017%
食料品Foodstuff
497%
原料別製品Manufactured
Goods68
10%
一般機械Machinery
11617%
電気機器ElectricalMachinery
7411%
自動車Motor
Vehicles10115%
その他Others
8212%
Total¥685billion
輸送用機器TransportEquipment
29125%
化学製品Chemicals
95 8%
原料別製品Manufactured
Goods535%
一般機械Machinery
19717%
電気機器ElectricalMachinery
13412%
自動車Motor Vehicles
22119%
その他Others
35031%
Total¥1,145billion
■2020 対英国輸出 Exports to UK●輸出商品内訳 Exports, by Commodity ●輸入商品内訳 Imports, by Commodity●輸出上位品目 Top Items by Value of Exports ●輸入上位品目 Top Items by Value of Imports
●輸出推移(商品別) Exports to UK by Commodity ●輸入推移(商品別) Imports from UK by Commodity
■2020 対英国輸入 Imports from UK
Source: 財務省貿易統計より作成。 Compiled from MOF's Trade Statistics on a Customs-cleared Basis.
34 35Main Chapter▶II.Trade by Major Area and Country本論編▶II.主要国別・地域別貿易
品目 Items
金額Value
(10億円)[¥ billion]
伸率Growth(%)
寄与度Contribution
degree(%)
医薬品Medical Products
114(160) ▲ 28.7 ▲ 5.2
自動車Motor Vehicles
101(148) ▲ 31.7 ▲ 5.3
原動機Power Generating Machine
65(133) ▲ 51.0 ▲ 7.7
非鉄金属Nonferrous Metals
45(27) 68.2 2.0
科学光学機器Scientific, Optical Inst.
31(33) ▲ 6.1 ▲ 0.2
上位5品目 合計Top 5 total 356 ー ▲ 16.3
全品目 合計Grand total
685(888) ▲ 22.8 ▲ 22.8
注:( )内の数字は2019年の金額。Note: Figures in ( ) are value in 2019.
品目 Items
金額Value
(10億円)[¥ billion]
伸率Growth(%)
寄与度Contribution
degree(%)
自動車Motor Vehicles
221(318) ▲ 30.7 ▲ 6.5
原動機Power Generating Machine
67(115) ▲ 41.5 ▲ 3.1
医薬品Medical Products
45(29) 57.8 1.1
自動車の部分品Parts of Motor Vehicles
38(55) ▲ 30.4 ▲ 1.1
電池Batteries & Accumulators
34(53) ▲ 36.0 ▲ 1.3
上位5品目 合計Top 5 total 405 ー ▲ 10.9
全品目 合計Grand total
1,145(1,513) ▲ 24.3 ▲ 24.3
注:( )内の数字は2019年の金額。Note: Figures in ( ) are value in 2019.
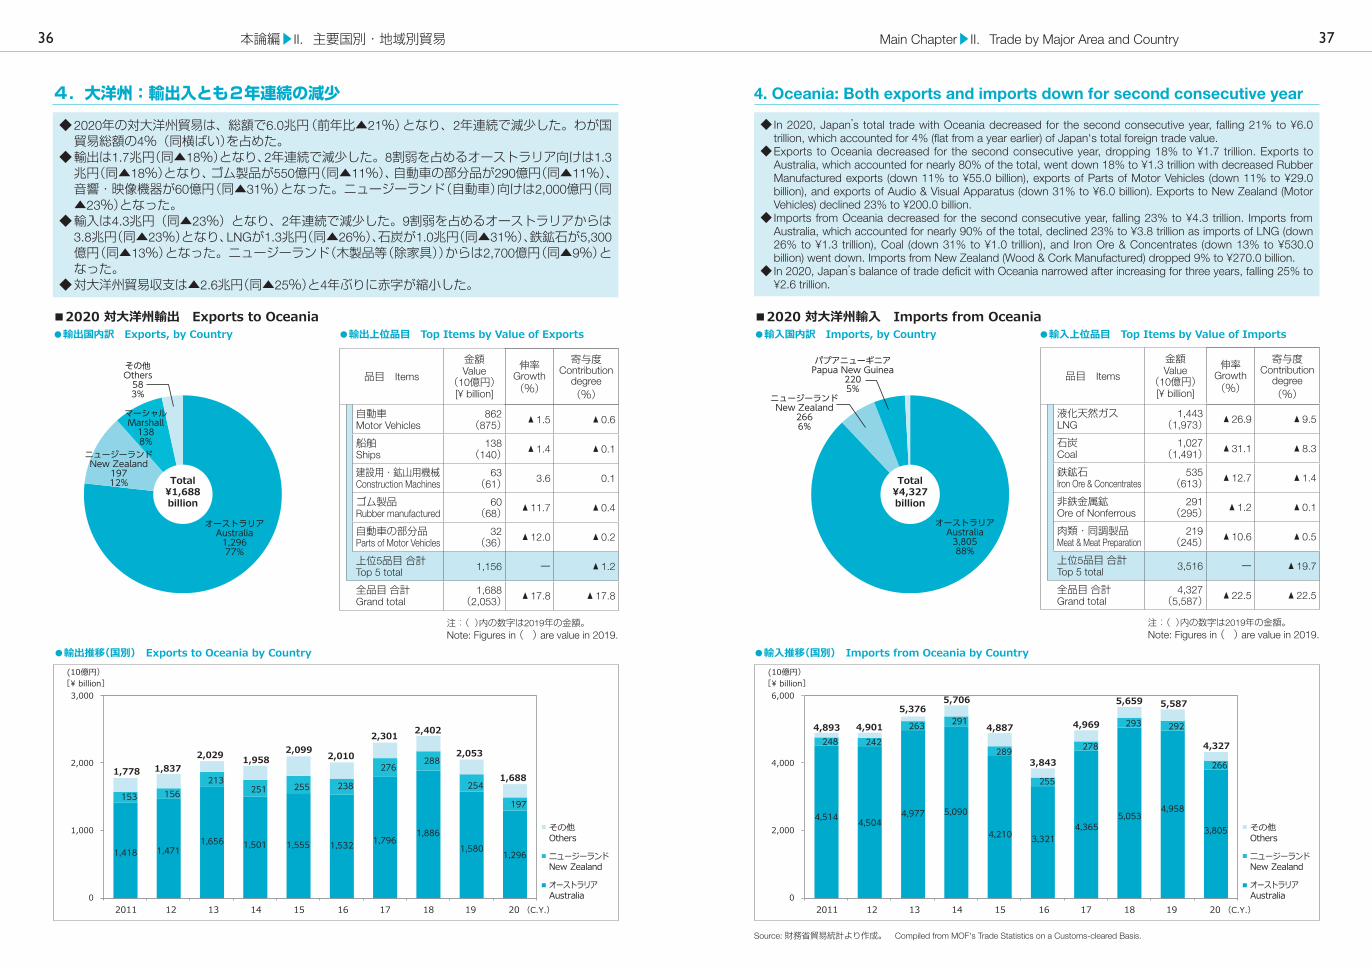
4. Oceania: Both exports and imports down for second consecutive year
◆ In 2020, Japan’s total trade with Oceania decreased for the second consecutive year, falling 21% to ¥6.0 trillion, which accounted for 4% (flat from a year earlier) of Japan's total foreign trade value.
◆ Exports to Oceania decreased for the second consecutive year, dropping 18% to ¥1.7 trillion. Exports to Australia, which accounted for nearly 80% of the total, went down 18% to ¥1.3 trillion with decreased Rubber Manufactured exports (down 11% to ¥55.0 billion), exports of Parts of Motor Vehicles (down 11% to ¥29.0 billion), and exports of Audio & Visual Apparatus (down 31% to ¥6.0 billion). Exports to New Zealand (Motor Vehicles) declined 23% to ¥200.0 billion.
◆ Imports from Oceania decreased for the second consecutive year, falling 23% to ¥4.3 trillion. Imports from Australia, which accounted for nearly 90% of the total, declined 23% to ¥3.8 trillion as imports of LNG (down 26% to ¥1.3 trillion), Coal (down 31% to ¥1.0 trillion), and Iron Ore & Concentrates (down 13% to ¥530.0 billion) went down. Imports from New Zealand (Wood & Cork Manufactured) dropped 9% to ¥270.0 billion.
◆ In 2020, Japan’s balance of trade deficit with Oceania narrowed after increasing for three years, falling 25% to ¥2.6 trillion.
◆ 2020年の対大洋州貿易は、総額で6.0兆円(前年比▲21%)となり、2年連続で減少した。わが国貿易総額の4%(同横ばい)を占めた。
◆ 輸出は1.7兆円(同▲18%)となり、2年連続で減少した。8割弱を占めるオーストラリア向けは1.3兆円(同▲18%)となり、ゴム製品が550億円(同▲11%)、自動車の部分品が290億円(同▲11%)、音響・映像機器が60億円(同▲31%)となった。ニュージーランド(自動車)向けは2,000億円(同▲23%)となった。
◆ 輸入は4.3兆円(同▲23%)となり、2年連続で減少した。9割弱を占めるオーストラリアからは3.8兆円(同▲23%)となり、LNGが1.3兆円(同▲26%)、石炭が1.0兆円(同▲31%)、鉄鉱石が5,300億円(同▲13%)となった。ニュージーランド(木製品等(除家具))からは2,700億円(同▲9%)となった。
◆ 対大洋州貿易収支は▲2.6兆円(同▲25%)と4年ぶりに赤字が縮小した。
2011 12 13 14 15 16 17 18 19 20 (C.Y.)
[¥ billion](10億円)
その他Others
ニュージーランドNew Zealand
オーストラリアAustralia
3,000
2,000
1,000
0
1,418 1,4711,656 1,501 1,555 1,532 1,796
1,886 1,580
1,296
153 156213
251 255 238
276 288
254
197
2,053
1,6881,778 1,8372,029 1,958
2,099 2,010
2,301 2,402
[¥ billion](10億円)
6,000
4,000
2,000
0
その他Others
ニュージーランドNew Zealand
オーストラリアAustralia
2011 12 13 14 15 16 17 18 19 20 (C.Y.)
4,514 4,5044,977 5,090
4,210 3,3214,365
5,0534,958
3,805
248 242
263 291
289
255
278
293 292
266
5,587
4,327
4,893 4,901
5,3765,706
4,887
3,843
4,969
5,659
オーストラリアAustralia
3,80588%
ニュージーランドNew Zealand
2666%
パプアニューギニアPapua New Guinea
2205%
Total¥4,327billion
オーストラリアAustralia
1,29677%
ニュージーランドNew Zealand
19712%
マーシャルMarshall
1388%
その他Others
583%
Total¥1,688billion
●輸入国内訳 Imports, by Country●輸出上位品目 Top Items by Value of Exports ●輸入上位品目 Top Items by Value of Imports
●輸入推移(国別) Imports from Oceania by Country
■2020 対大洋州輸入 Imports from Oceania
4.大洋州:輸出入とも2年連続の減少
■2020 対大洋州輸出 Exports to Oceania●輸出国内訳 Exports, by Country
●輸出推移(国別) Exports to Oceania by Country
Source: 財務省貿易統計より作成。 Compiled from MOF's Trade Statistics on a Customs-cleared Basis.
36 37Main Chapter▶II.Trade by Major Area and Country本論編▶II.主要国別・地域別貿易
品目 Items
金額Value
(10億円)[¥ billion]
伸率Growth(%)
寄与度Contribution
degree(%)
自動車Motor Vehicles
862(875) ▲ 1.5 ▲ 0.6
船舶Ships
138(140) ▲ 1.4 ▲ 0.1
建設用・鉱山用機械Construction Machines
63(61) 3.6 0.1
ゴム製品Rubber manufactured
60(68) ▲ 11.7 ▲ 0.4
自動車の部分品Parts of Motor Vehicles
32(36) ▲ 12.0 ▲ 0.2
上位5品目 合計Top 5 total 1,156 ー ▲ 1.2
全品目 合計Grand total
1,688(2,053) ▲ 17.8 ▲ 17.8
注:( )内の数字は2019年の金額。Note: Figures in ( ) are value in 2019.
品目 Items
金額Value
(10億円)[¥ billion]
伸率Growth(%)
寄与度Contribution
degree(%)
液化天然ガスLNG
1,443(1,973) ▲ 26.9 ▲ 9.5
石炭Coal
1,027(1,491) ▲ 31.1 ▲ 8.3
鉄鉱石Iron Ore & Concentrates
535(613) ▲ 12.7 ▲ 1.4
非鉄金属鉱Ore of Nonferrous
291(295) ▲ 1.2 ▲ 0.1
肉類・同調製品Meat & Meat Preparation
219(245) ▲ 10.6 ▲ 0.5
上位5品目 合計Top 5 total 3,516 ー ▲ 19.7
全品目 合計Grand total
4,327(5,587) ▲ 22.5 ▲ 22.5
注:( )内の数字は2019年の金額。Note: Figures in ( ) are value in 2019.

5. Central South America: Both exports and imports down for second consecutive year
◆ In 2020, Japan’s Trade with Central South America decreased for the second consecutive year, falling 18% to ¥5.2 trillion, which accounted for 4% (flat from a year earlier) of Japan's total foreign trade value.
◆ Exports to Central South America decreased for the second consecutive year, falling 29% to ¥2.3 trillion. Exports to Mexico (Motor Vehicles) declined 23% to ¥890.0 billion. Exports to Panama (Ships) went down 26% to ¥490.0 billion. Exports to the Bahamas (Ships) dropped 84% to ¥22.0 billion.
◆ Imports from Central South America decreased for the second consecutive year, falling 8% to ¥2.9 trillion. Imports from Brazil (Iron Ore & Concentrates) went down 8% to ¥800.0 billion. Imports from Mexico (Audio & Visual Apparatus) declined 10% to ¥580.0 billion. Imports from Peru (Ore of Nonferrous) went down 13% to ¥230.0 billion. In contrast, imports from Panama (Ore of Nonferrous) grew 3.5 times from a year earlier to ¥52.0 billion.
◆ In 2020, Japan’s balance of trade with Central South America turned to a deficit (¥640.0 billion) after running a surplus for two years.
◆ 2020年の対中南米貿易は、総額で5.2兆円(前年比▲18%)と2年連続で減少し、わが国貿易総額の4%(同横ばい)を占めた。
◆ 輸出は2.3兆円(同▲29%)となり、2年連続で減少した。メキシコ(自動車)向けは8,900億円(同▲23%)、パナマ(船舶)向けは4,900億円(同▲26%)、バハマ(船舶)向けは220億円(同▲84%)となった。
◆ 輸入は2.9兆円(同▲8%)となり、2年連続で減少した。ブラジル(鉄鉱石)からは8,000億円(同▲8%)、メキシコ(音響映像機器(含部品))からは5,800億円(同▲10%)、ペルー(非鉄金属鉱)からは2,300億円(同▲13%)と減少した。一方、パナマ(非鉄金属鉱)からは520億円(同+3.5倍)と増加した。
◆ 対中南米貿易収支は▲6,400億円と3年ぶりに赤字に転化した。
2011 12 13 14 15 16 17 18 19 20 (C.Y.)
[¥billion](10億円)
5,000
4,000
3,000
2,000
1,000
0
その他Others
コロンビアColombia
パナマPanama
チリChile
メキシコMexico
ブラジルBrazil494 473 500 476 303 380 442 410 315
815 844946 1,126 1,268
1,158 1,2641,283 1,158
895
187 159166 181 202
170197 220 223
108
1,190 1,133 943 742 570615
615653
665
491
119 120 145 117103
113 123 123
86
3,221
2,285
3,528 3,435 3,5603,375
3,0023,154
3,3993,563
120
553
2011 12 13 14 15 16 17 18 19 20 (C.Y.)
[¥ billion](10億円)
4,000
3,000
2,000
1,000
0
その他Others
プエルトリコPuerto Rico
ペルーPeru
チリChile
メキシコMexico
ブラジルBrazil
1,009 9521,070 1,024 910 734 804 761 872 801
317 351 412 453 575625 649 700
644580
782 744776 861 726
589 734 800 725702
187 224251 186
150145
234 263 268232
141207 184
211215
206 226 235225
3,1682,929
2,772 2,821
3,293 3,196 3,075
2,726
3,156 3,226
158
ブラジルBrazil80127%
チリChile70224%
メキシコMexico
58020%
ペルーPeru2328%
プエルトリコPuerto Rico
2258%
その他Others
39013%
Total¥2,929billion
メキシコMexico89539%
パナマPanama49121%
ブラジルBrazil41018%
チリChile31514%
その他Others1738%
Total¥2,285billion
●輸入国内訳 Imports, by Country ●輸入上位品目 Top Items by Value of Imports
●輸入推移(国別) Imports from Central South America by Country
■2020 対中南米輸入 Imports from Central South America
5.中南米:輸出入とも2年連続の減少
■2020 対中南米輸出 Exports to Central South America●輸出国内訳 Exports, by Country ●輸出上位品目 Top Items by Value of Exports
●輸出推移(国別) Exports to Central South America by Country
Source: 財務省貿易統計より作成。 Compiled from MOF's Trade Statistics on a Customs-cleared Basis.
38 39Main Chapter▶II.Trade by Major Area and Country本論編▶II.主要国別・地域別貿易
品目 Items
金額Value
(10億円)[¥ billion]
伸率Growth(%)
寄与度Contribution
degree(%)
非鉄金属鉱Ore of Nonferrous
605(606) ▲ 0.2 ▲ 0.0
石炭Coal
332(355) ▲ 6.5 ▲ 0.7
鉄鉱石Iron Ore & Concentrates
317(343) ▲ 7.5 ▲ 0.8
有機化合物Organic Chemicals
183(187) ▲ 2.3 ▲ 0.1
魚介類・同調製品Fish & Fish Preparation
182(206) ▲ 11.7 ▲ 0.8
上位5品目 合計Top 5 total 1,619 ー ▲ 2.5
全品目 合計Grand total
2,929(3,168) ▲ 7.5 ▲ 7.5
注:( )内の数字は2019年の金額。Note: Figures in ( ) are value in 2019.
品目 Items
金額Value
(10億円)[¥ billion]
伸率Growth(%)
寄与度Contribution
degree(%)
船舶Ships
485(741) ▲ 34.6 ▲ 8.0
自動車Motor Vehicles
382(620) ▲ 38.4 ▲ 7.4
自動車の部分品Parts of Motor Vehicles
245(307) ▲ 20.3 ▲ 1.9
鉄鋼Iron & Steel Products
196(232) ▲ 15.5 ▲ 1.1
原動機Power Generating Machine
92(119) ▲ 22.9 ▲ 0.8
上位5品目 合計Top 5 total 1,399 ー ▲ 19.2
全品目 合計Grand total
2,285(3,221) ▲ 29.1 ▲ 29.1
注:( )内の数字は2019年の金額。Note: Figures in ( ) are value in 2019.

(1) Brazil: Exports down for two years, imports down after increasing for one year◆ In 2020, Japan’s Trade with Brazil declined after growing for three years, falling 13% to ¥1.1 trillion, which
accounted for 21% (up 1 percentage points) of Japan’s total foreign trade value with Central South America.◆ Exports to Brazil declined for two years, falling 23% to ¥320.0 billion. Exports of Motor Vehicles (down
69% to ¥9.1 billion), exports of Parts of Motor Vehicles (down 19% to ¥66.0 billion), and exports of Pump & Centrifuges (down 55% to ¥7.2 billion) went down.
◆ Imports from Brazil decreased after increasing for one year, falling 8% to ¥800.0 billion. Imports of Iron Ore & Concentrates (down 9% to ¥310.0 billion), Meat & Meat Preparation imports (down 12% to ¥87.0 billion), and Aircraft imports (down 98% to ¥200 million) went down. In contrast, imports of Cereals, Cereal Preparation went up 11% to ¥120.0 billion.
◆ In 2020, Japan's balance of trade deficit with Brazil increased for the second consecutive year, rising 5% to ¥490.0 billion.
(1)ブラジル:輸出は2年連続の減少、輸入は2年ぶりに減少◆ 2020年の対ブラジル貿易は、総額で1.1兆円(前年比▲13%)と4年ぶりに減少し、対中南米貿易総額の21%(同+1ポイント)を占めた。
◆ 輸出は3,200億円(同▲23%)となり、2年連続で減少した。自動車が91億円(同▲69%)、自動車の部分品が660億円(同▲19%)、ポンプ・遠心分離機が72億円(同▲55%)となった。
◆ 輸入は8,000億円(同▲8%)となり、2年ぶりに減少した。鉄鉱石が3,100億円(同▲9%)、肉類・同調製品が870億円(同▲12%)、航空機類が2億円(同▲98%)と減少した。一方、穀物・同調製品が1,200億円(同+11%)と増加した。
◆ 対ブラジル貿易収支は▲4,900億円(同+5%)と2年連続で赤字が拡大した。
2011 12 13 14 15 16 17 18 19 20 (C.Y.)
[¥ billion](10億円)
600
500
400
300
200
100
0
その他商品Other Commodities
輸送用機器TransportEquipment
電気機器Electrical Machinery
一般機械Machinery
原料別製品ManufacturedGoods
化学製品Chemicals
44 44 50 53 50 40 42 48 48 46
59 56 74 68 7045 54 53 39
157 134170 142 128
72 90 109 97 72
6762
7565 61
3953
6356
47
133129
140136
131
78
105
134129
85
410
315
494473
553
500476
303
380
442
49
2011 12 13 14 15 16 17 18 19 20 (C.Y.)
[¥ billion](10億円)
1,200
1,000
800
600
400
200
0
その他商品Other Commodities
原料別製品Manufactured Goods
化学製品Chemicals
原料品Raw Materials
食料品Foodstuff
239 231338
246 292 262 241 194301 291
594552
545567
407
292 379386
399 358
4947
4761
65
6057 66
7073
10796
108118
115
8189 81
7261
872801
1,009952
1,0701,024
910
734804
761
食料品Foodstuff
29136%
肉類・同調製品Meat &
Meat Preparation87
11%
鉄鉱石Iron Ore & Concentrates
30638%
原料品Raw Materials
35845%
化学製品Chemicals
739%
原料別製品Manufactured Goods
618%
Total¥801billion
化学製品Chemicals
4615%
原料別製品Manufactured
Goods39
13% 原動機Power
GeneratingMachine
186%
電気機器ElectricalMachinery
4715%
自動車の部分品
Parts ofMotor
Vehicles66
21%
輸送用機器TransportEquipment
8527%
自動車Motor Vehicles
93%
その他Others
206%
一般機械Machinery
7223%
Total¥315billion
■2020 対ブラジル輸出 Exports to Brazil●輸出商品内訳 Exports, by Commodity ●輸入商品内訳 Imports, by Commodity●輸出上位品目 Top Items by Value of Exports ●輸入上位品目 Top Items by Value of Imports
●輸出推移(商品別) Exports to Brazil by Commodity ●輸入推移(商品別) Imports from Brazil by Commodity
■2020 対ブラジル輸入 Imports from Brazil
Source: 財務省貿易統計より作成。 Compiled from MOF's Trade Statistics on a Customs-cleared Basis.
40 41Main Chapter▶II.Trade by Major Area and Country本論編▶II.主要国別・地域別貿易
品目 Items
金額Value
(10億円)[¥ billion]
伸率Growth(%)
寄与度Contribution
degree(%)
鉄鉱石Iron Ore & Concentrates
306(335) ▲ 8.6 ▲ 3.3
穀物・同調製品Cereals, Cereal Preparation
121(108) 11.4 1.4
肉類・同調製品Meat & Meat Preparation
87(100) ▲ 12.4 ▲ 1.4
有機化合物Organic Chemicals
51(41) 22.4 1.1
鉄鋼Iron & Steel Products
24(36) ▲ 32.8 ▲ 1.3
上位5品目 合計Top 5 total 589 ー ▲ 3.6
全品目 合計Grand total
801(872) ▲ 8.2 ▲ 8.2
注:( )内の数字は2019年の金額。Note: Figures in ( ) are value in 2019.
品目 Items
金額Value
(10億円)[¥ billion]
伸率Growth(%)
寄与度Contribution
degree(%)
自動車の部分品Parts of Motor Vehicles
66(82) ▲ 19.2 ▲ 3.8
有機化合物Organic Chemicals
31(30) 2.8 0.2
原動機Power Generating Machine
18(23) ▲ 21.8 ▲ 1.2
鉄鋼Iron & Steel Products
16(17) ▲ 6.2 ▲ 0.3
電気計測機器Electrical Measuring
10(12) ▲ 21.5 ▲ 0.6
上位5品目 合計Top 5 total 140 ー ▲ 5.7
全品目 合計Grand total
315(410) ▲ 23.1 ▲ 23.1
注:( )内の数字は2019年の金額。Note: Figures in ( ) are value in 2019.

(2) Mexico: Both exports and imports down for second consecutive year◆ In 2020, Japan’s Trade with Mexico declined 18% to ¥1.5 trillion, which accounted for 28% (flat from a year
earlier) of Japan’s total foreign trade value with Central South America.◆ Exports to Mexico decreased for the second consecutive year, falling 23% to ¥890.0 billion. Exports of Motor
Vehicles (down 32% to ¥120.0 billion), Parts of Motor Vehicles exports (down 20% to ¥150.0 billion), and exports of Iron & Steel Products (down 23% to ¥120.0 billion) went down.
◆ Imports from Mexico decreased for the second consecutive year, falling 10% to ¥580.0 billion. Imports of Audio & Visual Apparatus (down 33% to ¥29.0 billion), imports of Parts of Motor Vehicles (down 29% to ¥29.0 billion), and Petroleum imports (down 73% to ¥3.7 billion) went down. In contrast, imports of Nonferrous Metals grew 2.4 times from a year earlier to ¥18.0 billion.
◆ In 2020, Japan's balance of trade surplus with Mexico narrowed for the third consecutive year, dropping 39% to ¥320.0 billion.
(2)メキシコ:輸出入とも2年連続の減少◆ 2020年の対メキシコ貿易は、総額で1.5兆円(前年比▲18%)となり、対中南米貿易総額の28%(同横ばい)を占めた。
◆ 輸出は8,900億円(同▲23%)となり、2年連続で減少した。自動車が1,200億円(同▲32%)、自動車の部分品が1,500億円(同▲20%)、鉄鋼が1,200億円(同▲23%)となった。
◆ 輸入は5,800億円(同▲10%)となり、2年連続で減少した。音響映像機器(含部品)が290億円(同▲33%)、自動車の部分品が290億円(同▲29%)、原油及び粗油が37億円(同▲73%)と減少した。一方、非鉄金属は180億円(同2.4倍)と増加した。
◆ 対メキシコ貿易収支は3,200億円(同▲39%)と3年連続で黒字が縮小した。
2011 12 13 14 15 16 17 18 19 20 (C.Y.)
[¥ billion](10億円)
1,500
1,000
500
0
その他商品Other Commodities
輸送用機器TransportEquipment
電気機器Electrical Machinery
一般機械Machinery
原料別製品ManufacturedGoods
化学製品Chemicals
24 25 34 42 39 42 43 38 126 136 166 220 242 217 241 259 229 176 122 143
204244 280
249 292 291
244 178
170 155192
194214
207 181 204
188
157 249 252
274
334409
367 413 388
368
273
1,158
895815 844
946
1,126
1,2681,158
1,264 1,283
23 422011 12 13 14 15 16 17 18 19 20 (C.Y.)
[¥ billion](10億円)
800
600
400
200
0
その他商品Other Commodities
輸送用機器TransportEquipment
電気機器Electrical Machinery
鉱物性燃料Mineral Fuels
原料品Raw Materials
食料品Foodstuff68 73 92 100 111 118 127 138 132
34 45 49 61 62 71 66 60 49 434
95145
88 9727 14
60 75102
96
113106
135 154186
157
2127
3132
36
60 75 7975
64
644580
317351
412453
575625
649700
1112
30
その他Others
6010%
肉類・同調製品Meat &
Meat Preparation67
12%
食料品Foodstuff
13223%原料品
Raw Materials437%
鉱物性燃料MineralFuels142%
化学製品Chemicals
224%原料別製品
ManufacturedGoods
275%
一般機械Machinery
6010%
電気機器ElectricalMachinery
15727%
輸送用機器TransportEquipment
64 11% Total
¥580billion
鉄鋼Iron & Steel
Products 117
13%
原料別製品Manufactured
Goods17620%
一般機械Machinery
17820%電気機器
ElectricalMachinery
15718%
自動車の部分品
Parts of MotorVehicles
14817%
輸送用機器Transport
Equipment273 30%
その他Others
667%
化学製品Chemicals
384%
自動車 MotorVehicles12214%
Total¥895billion
■2020 対メキシコ輸出 Exports to Mexico●輸出商品内訳 Exports, by Commodity ●輸入商品内訳 Imports, by Commodity●輸出上位品目 Top Items by Value of Exports ●輸入上位品目 Top Items by Value of Imports
●輸出推移(商品別) Exports to Mexico by Commodity ●輸入推移(商品別) Imports from Mexico by Commodity
■2020 対メキシコ輸入 Imports from Mexico
Source: 財務省貿易統計より作成。 Compiled from MOF's Trade Statistics on a Customs-cleared Basis.
42 43Main Chapter▶II.Trade by Major Area and Country本論編▶II.主要国別・地域別貿易
品目 Items
金額Value
(10億円)[¥ billion]
伸率Growth(%)
寄与度Contribution
degree(%)
肉類・同調製品Meat & Meat Preparation
67(67) 0.4 0.0
通信機Telephony, Telegraphy
52(60) ▲ 12.8 ▲ 1.2
果実Fruits
40(41) ▲ 3.2 ▲ 0.2
科学光学機器Scientific, Optical inst.
38(37) 5.2 0.3
電算機類(含周辺機器)Computers & Units
33(26) ▲ 28.2 ▲ 1.1
上位5品目 合計Top 5 total 230 ー 0.1
全品目 合計Grand total
580(644) ▲ 10.0 ▲ 10.0
注:( )内の数字は2019年の金額。Note: Figures in ( ) are value in 2019.
品目 Items
金額Value
(10億円)[¥ billion]
伸率Growth(%)
寄与度Contribution
degree(%)
自動車の部分品Parts of Motor Vehicles
148(186) ▲ 20.2 ▲ 3.2
自動車Motor Vehicles
122(180) ▲ 32.0 ▲ 5.0
鉄鋼Iron & Steel Products
117(152) ▲ 23.5 ▲ 3.1
原動機Power Generating Machine
43(51) ▲ 15.9 ▲ 0.7
金属製品Manufactures of Metals
33(44) ▲ 26.0 ▲ 1.0
上位5品目 合計Top 5 total 463 ー ▲ 13.0
全品目 合計Grand total
895(1,158) ▲ 22.7 ▲ 22.7
注:( )内の数字は2019年の金額。Note: Figures in ( ) are value in 2019.

6. Russia: Both exports and imports down for second consecutive year
◆ In 2020, Japan’s trade with Russia decreased for the second consecutive year, falling 24% to ¥1.8 trillion, which accounted for 1% (flat from a year earlier) of Japan's total foreign trade value.
◆ Exports to Russia decreased for the second consecutive year, falling 20% to ¥630.0 billion. Motor Vehicles exports (down 23% to ¥260.0 billion), exports of Parts of Motor Vehicles (down 25% to ¥69.0 billion), and exports of Construction Machines (down 32% to ¥30.0 billion) went down.
◆ Imports from Russia decreased for the second consecutive year, falling 27% to ¥1.1 trillion. Imports of Petroleum (down 56% to ¥190.0 billion), LNG imports (down 25% to ¥250.0 billion), and imports of Coal (down 22% to ¥200.0 billion) went down. In contrast, imports of Nonferrous Metals grew 12% to ¥240.0 billion.
◆ In 2020, Japan’s balance of trade deficit with Russia narrowed for the second consecutive year, falling 33% to ¥520.0 billion.
6.ロシア:輸出入とも2年連続の減少
◆ 2020年の対ロシア貿易は、総額で1.8兆円(前年比▲24%)と2年連続で減少し、わが国貿易総額の1%(同横ばい)を占めた。
◆ 輸出は6,300億円(同▲20%)となり、2年連続で減少した。自動車が2,600億円(同▲23%)、自動車の部分品が690億円(同▲25%)、建設用・鉱山用機械が300億円(同▲32%)となった。
◆ 輸入は1.1兆円(同▲27%)となり、2年連続で減少した。原油及び粗油が1,900億円(同▲56%)、LNGが2,500億円(同▲25%)、石炭が2,000億円(同▲22%)と減少した。一方、非鉄金属が2,400億円(同+12%)と増加した。
◆ 対ロシア貿易収支は▲5,200億円(同▲33%)と2年連続で赤字が縮小した。
2011 12 13 14 15 16 17 18 19 20 (C.Y.)
[¥ billion](10億円)
1,200
1,000
400
200
800
600
0
その他商品Other Commodities
輸送用機器TransportEquipment
電気機器Electrical Machinery
一般機械Machinery
原料別製品ManufacturedGoods
化学製品Chemicals
12 12 16 17 16 13 17⦆
20 ⦆19 ⦆2089 87 109 92 67 50 62 71 69 54
145 137 158 12997 90 122 136 141 116
48 4350
4934 32
44 61 56 52
616680
678621
351 323379
461 437 337
783
628
9411,005
1,069
972
618555
674
805
2011 12 13 14 15 16 17 18 19 20(C.Y.)
[¥ billion](10億円)
3,000
2,000
1,000
0
その他商品Other Commodities
原料別製品Manufactured Goods
鉱物性燃料Mineral Fuels
食料品Foodstuff
116 123 121 125 121 134 145 126 107
1,1351,285
1,899 2,153
1,483856
1,075 1,190 1,090 684
190174
184
238
206
172
261 299
253
270
1,561
1,146
1,5141,660
2,308
2,619
1,905
1,227
1,5511,723
123
食料品Foodstuff
1079%
原料品Raw
Materials625%
原油及び粗油
Petroleum19217%
LNG25222%
鉱物性燃料Mineral Fuels
68460%
原料別製品Manufactured
Goods27024% Total
¥1,146billion
化学製品Chemicals
203%
原料別製品Manufactured
Goods54
9% 一般機械
Machinery11619%
電気機器ElectricalMachinery
528%
自動車 Motor Vehicles 263 42%
輸送用機器TransportEquipment
33754%
その他Others
36 6%
鉱物性燃料Mineral Fuels
41%
Total¥628billion
■2020 対ロシア輸出 Exports to Russia●輸出商品内訳 Exports, by Commodity ●輸入商品内訳 Imports, by Commodity●輸出上位品目 Top Items by Value of Exports ●輸入上位品目 Top Items by Value of Imports
●輸出推移(商品別) Exports to Russia by Commodity ●輸入推移(商品別) Imports from Russia by Commodity
■2020 対ロシア輸入 Imports from Russia
Source: 財務省貿易統計より作成。 Compiled from MOF's Trade Statistics on a Customs-cleared Basis.
44 45Main Chapter▶II.Trade by Major Area and Country本論編▶II.主要国別・地域別貿易
品目 Items
金額Value
(10億円)[¥ billion]
伸率Growth(%)
寄与度Contribution
degree(%)
液化天然ガスLNG
252(338) ▲ 25.4 ▲ 5.5
非鉄金属Nonferrous Metals
242(216) 12.4 1.7
石炭Coal
195(250) ▲ 22.0 ▲ 3.5
原油及び粗油Petroleum
192(435) ▲ 55.8 ▲ 15.6
魚介類・同調製品Fish & Fish Preparation
103(121) ▲ 15.2 ▲ 1.2
上位5品目 合計Top 5 total 984 ー ▲ 24.1
全品目 合計Grand total
1,146(1,561) ▲ 26.6 ▲ 26.6
注:( )内の数字は2019年の金額。Note: Figures in ( ) are value in 2019.
品目 Items
金額Value
(10億円)[¥ billion]
伸率Growth(%)
寄与度Contribution
degree(%)
自動車Motor Vehicles
263(341) ▲ 22.8 ▲ 9.9
自動車の部分品Parts of Motor Vehicles
69(91) ▲ 24.6 ▲ 2.9
ゴム製品Rubber manufactured
34(44) ▲ 22.2 ▲ 1.2
建設用・鉱山用機械Construction Machines
30(44) ▲ 32.0 ▲ 1.8
原動機Power Generating Machine
28(37) ▲ 24.0 ▲ 1.1
上位5品目 合計Top 5 total 424 ー ▲ 17.0
全品目 合計Grand total
628(783) ▲ 19.8 ▲ 19.8
注:( )内の数字は2019年の金額。Note: Figures in ( ) are value in 2019.
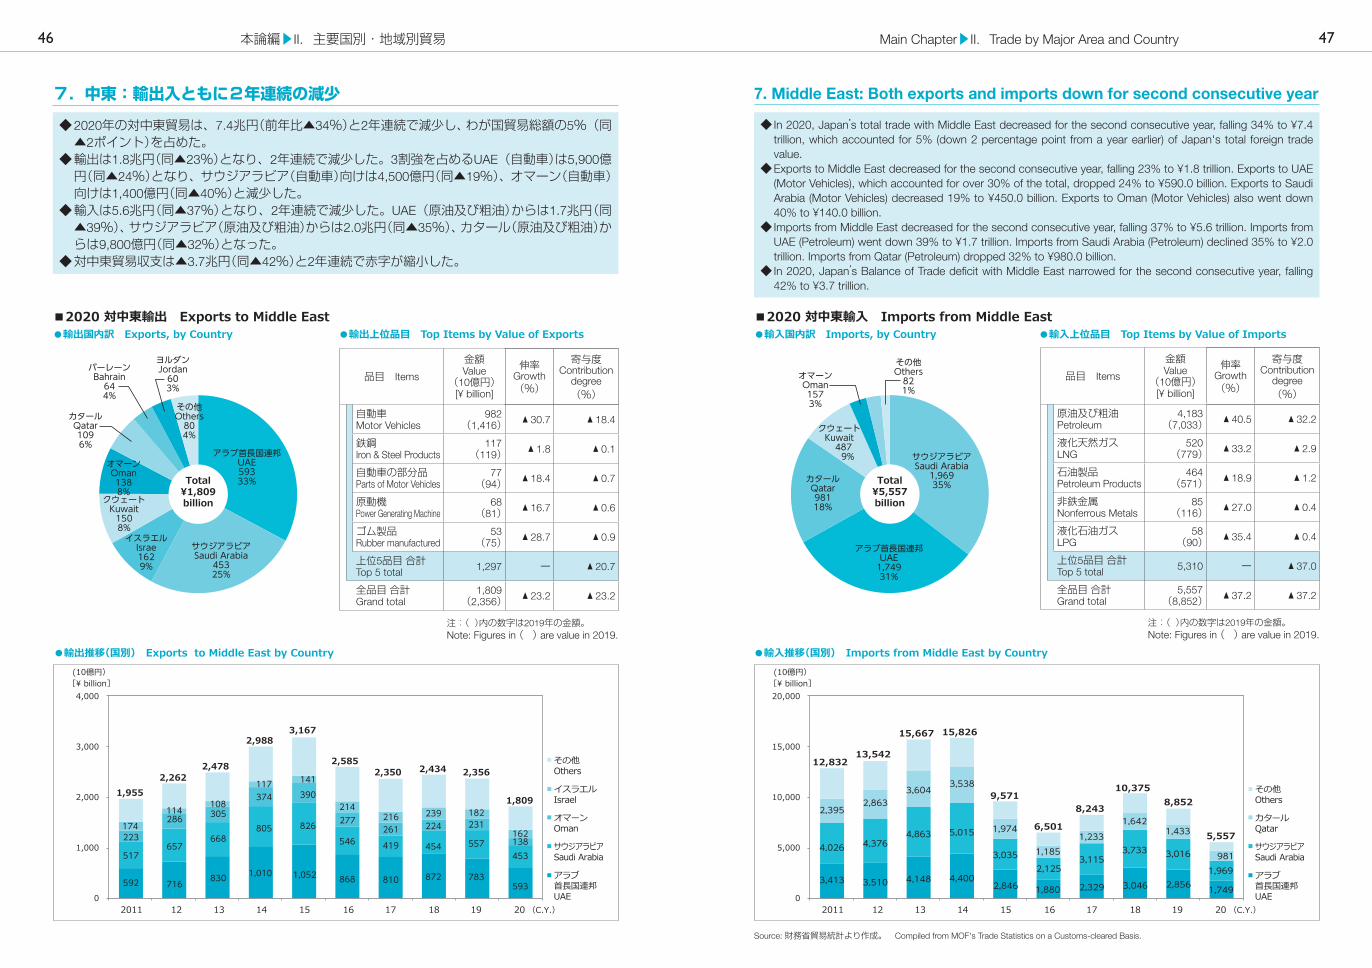
7. Middle East: Both exports and imports down for second consecutive year
◆ In 2020, Japan’s total trade with Middle East decreased for the second consecutive year, falling 34% to ¥7.4 trillion, which accounted for 5% (down 2 percentage point from a year earlier) of Japan's total foreign trade value.
◆ Exports to Middle East decreased for the second consecutive year, falling 23% to ¥1.8 trillion. Exports to UAE (Motor Vehicles), which accounted for over 30% of the total, dropped 24% to ¥590.0 billion. Exports to Saudi Arabia (Motor Vehicles) decreased 19% to ¥450.0 billion. Exports to Oman (Motor Vehicles) also went down 40% to ¥140.0 billion.
◆ Imports from Middle East decreased for the second consecutive year, falling 37% to ¥5.6 trillion. Imports from UAE (Petroleum) went down 39% to ¥1.7 trillion. Imports from Saudi Arabia (Petroleum) declined 35% to ¥2.0 trillion. Imports from Qatar (Petroleum) dropped 32% to ¥980.0 billion.
◆ In 2020, Japan’s Balance of Trade deficit with Middle East narrowed for the second consecutive year, falling 42% to ¥3.7 trillion.
7.中東:輸出入ともに2年連続の減少
◆ 2020年の対中東貿易は、7.4兆円(前年比▲34%)と2年連続で減少し、わが国貿易総額の5%(同▲2ポイント)を占めた。
◆ 輸出は1.8兆円(同▲23%)となり、2年連続で減少した。3割強を占めるUAE(自動車)は5,900億円(同▲24%)となり、サウジアラビア(自動車)向けは4,500億円(同▲19%)、オマーン(自動車)向けは1,400億円(同▲40%)と減少した。
◆ 輸入は5.6兆円(同▲37%)となり、2年連続で減少した。UAE(原油及び粗油)からは1.7兆円(同▲39%)、サウジアラビア(原油及び粗油)からは2.0兆円(同▲35%)、カタール(原油及び粗油)からは9,800億円(同▲32%)となった。
◆ 対中東貿易収支は▲3.7兆円(同▲42%)と2年連続で赤字が縮小した。
2011 12 13 14 15 16 17 18 19 20 (C.Y.)
[¥ billion](10億円)
4,000
3,000
2,000
1,000
0
その他Others
イスラエルIsrael
オマーンOman
サウジアラビアSaudi Arabia
アラブ首長国連邦UAE
592 716 830 1,010 1,052 868 810 872 783 593
517657
668805 826
546 419 454 557 453
223
286 305
374 390
277 261 224 231
138 174
114 108
117 141
214 216 239 182
162
2,356
1,8091,955
2,2622,478
2,9883,167
2,5852,350 2,434
2011 12 13 14 15 16 17 18 19 20 (C.Y.)
[¥ billion](10億円)
20,000
15,000
10,000
5,000
0
その他Others
カタールQatar
サウジアラビアSaudi Arabia
アラブ首長国連邦UAE
3,413 3,510 4,148 4,4002,846 1,880 2,329 3,046 2,856 1,749
4,026 4,3764,863 5,015
3,0352,125
3,115 3,733 3,016
1,969
2,3952,863
3,6043,538
1,974
1,185 1,233
1,642 1,433
981
8,852
5,557
12,83213,542
15,667 15,826
9,571
6,501
8,243
10,375
サウジアラビアSaudi Arabia
1,96935%
アラブ首長国連邦UAE
1,74931%
カタールQatar98118%
クウェートKuwait 487 9%
オマーンOman1573%
その他Others
821%
Total¥5,557billion
アラブ首長国連邦UAE59333%
サウジアラビアSaudi Arabia
45325%
イスラエルIsrae1629%
クウェートKuwait
1508%
オマーンOman1388%
カタールQatar1096%
バーレーンBahrain
644%
ヨルダンJordan
603%
その他Others
804%
Total¥1,809billion
■2020 対中東輸出 Exports to Middle East●輸出国内訳 Exports, by Country ●輸入国内訳 Imports, by Country
●輸出推移(国別) Exports to Middle East by Country ●輸入推移(国別) Imports from Middle East by Country
■2020 対中東輸入 Imports from Middle East●輸出上位品目 Top Items by Value of Exports ●輸入上位品目 Top Items by Value of Imports
Source: 財務省貿易統計より作成。 Compiled from MOF's Trade Statistics on a Customs-cleared Basis.
46 47Main Chapter▶II.Trade by Major Area and Country本論編▶II.主要国別・地域別貿易
品目 Items
金額Value
(10億円)[¥ billion]
伸率Growth(%)
寄与度Contribution
degree(%)
原油及び粗油Petroleum
4,183(7,033) ▲ 40.5 ▲ 32.2
液化天然ガスLNG
520(779) ▲ 33.2 ▲ 2.9
石油製品Petroleum Products
464(571) ▲ 18.9 ▲ 1.2
非鉄金属Nonferrous Metals
85(116) ▲ 27.0 ▲ 0.4
液化石油ガスLPG
58(90) ▲ 35.4 ▲ 0.4
上位5品目 合計Top 5 total 5,310 ー ▲ 37.0
全品目 合計Grand total
5,557(8,852) ▲ 37.2 ▲ 37.2
注:( )内の数字は2019年の金額。Note: Figures in ( ) are value in 2019.
品目 Items
金額Value
(10億円)[¥ billion]
伸率Growth(%)
寄与度Contribution
degree(%)
自動車Motor Vehicles
982(1,416) ▲ 30.7 ▲ 18.4
鉄鋼Iron & Steel Products
117(119) ▲ 1.8 ▲ 0.1
自動車の部分品Parts of Motor Vehicles
77(94) ▲ 18.4 ▲ 0.7
原動機Power Generating Machine
68(81) ▲ 16.7 ▲ 0.6
ゴム製品Rubber manufactured
53(75) ▲ 28.7 ▲ 0.9
上位5品目 合計Top 5 total 1,297 ー ▲ 20.7
全品目 合計Grand total
1,809(2,356) ▲ 23.2 ▲ 23.2
注:( )内の数字は2019年の金額。Note: Figures in ( ) are value in 2019.

8. Africa: Exports down after increasing for three years, imports flat
◆ In 2020, Japan’s trade with Africa turned to decrease after increasing for three years, falling 7% to ¥1.8 trillion, which accounted for 1% (flat from a year earlier) of Japan's total foreign trade value.
◆ Exports to Africa decreased after increasing for three years, falling 14% to ¥850.0 billion. Exports to South Africa (Motor Vehicles) (down 32% to ¥180.0 billion), Kenya (Motor Vehicles) (down 18 % to ¥77.0 billion), and Nigeria (Pump & Centrifuges) (down 29% to ¥31.0 billion) dropped.
◆ Imports from Africa were flat from a year earlier at ¥920.0 billion. Imports from South Africa (Nonferrous Metals), which accounted for around 65% of the total, went up 10% to ¥610.0 billion. Imports from Egypt (Petroleum Products ) increased 2.2 times from a year earlier to ¥33.0 billion. Imports from Nigeria (LNG) rose 32% to ¥73.0 billion. In contrast, imports from Mozambique (Coal) declined 74% to ¥6.1 billion.
◆ In 2020, Japan's balance of trade with Africa turned to a deficit (¥74.0 billion) after running a surplus for one year.
8.アフリカ:輸出は4年ぶりに減少、輸入は横ばい
◆ 2020年の対アフリカ貿易は、総額で1.8兆円(前年比▲7%)と4年ぶりに減少し、わが国貿易総額の1%(同横ばい)を占めた。
◆ 輸出は8,500億円(同▲14%)となり、4年ぶりに減少した。南アフリカ共和国(自動車)向けは1,800億円(同▲32%)、ケニア(自動車)向けは770億円(同▲18%)、ナイジェリア(ポンプ・遠心分離機)向けは310億円(同▲29%)となった。
◆ 輸入は9,200億円(同横ばい)となった。6割台半ばを占める南アフリカ共和国(非鉄金属)からは6,100億円(同+10%)、エジプト(石油製品)からは330億円(同+2.2倍)、ナイジェリア(LNG)からは730億円(同+32%)と増加した。一方、モザンビーク(石炭)からは61億円(同▲74%)と減少した。
◆ 対アフリカ貿易収支は▲720億円と2年ぶりに赤字に転化した。
2011 12 13 14 15 16 17 18 19 20 (C.Y.)
[¥ billion](10億円)
1,200
1,000
400
600
200
800
0
その他Others
南アフリカ共和国South Africa
ケニアKenya
ナイジェリアNigeria
リベリアLiberia
エジプトEgypt
107 140 118 151 155 124 94 110 99 104
263 183171 111 105 119 91 128 221 230
5050 63 76 43 36
36 36
43 31
50 53 89 101 112 81
86 99
93 77
344324 338 343
325
242 282 278
263 178
1,115
984
848
1,053 1,0321,106
1,036
839 843900
2011 12 13 14 15 16 17 18 19 20 (C.Y.)
[¥ billion](10億円)
2,000
1,500
500
1,000
0
その他Others
南アフリカ共和国South Africa
ナイジェリアNigeria
アルジェリアAlgeria
22 35 88 169 112 37 34 21 41 27 132
381 345
473341
94 88 101 56 73
675
511 659
604
598
458 534 568 559 614
918 920
1,366
1,696
1,8641,783
1,395
798931 991
南アフリカ共和国South Africa
61467%ナイジェリア
Nigeria 73 8%
エジプトEgypt
334%
モロッコMorocco
323%
アルジェリアAlgeria
273% その他
Others14015%
Total¥920billion
リベリアLiberia23027%
南アフリカ共和国South Africa
17821%エジプト
Egypt10412%
ケニアKenya
779%
ナイジェリアNigeria
314%
タンザニアTanzania
273%
その他Others
20124%
Total¥848billion
■2020 対アフリカ輸出 Exports to Africa●輸出国内訳 Exports, by Country ●輸入国内訳 Imports, by Country ●輸出上位品目 Top Items by Value of Exports ●輸入上位品目 Top Items by Value of Imports
●輸出推移(国別) Exports to Africa by Country ●輸入推移(国別) Imports from Africa by Country
■2020 対アフリカ輸入 Imports from Africa
Source: 財務省貿易統計より作成。 Compiled from MOF's Trade Statistics on a Customs-cleared Basis.
48 49Main Chapter▶II.Trade by Major Area and Country本論編▶II.主要国別・地域別貿易
品目 Items
金額Value
(10億円)[¥ billion]
伸率Growth(%)
寄与度Contribution
degree(%)
非鉄金属Nonferrous Metals
471(376) 25.3 10.4
液化天然ガスLNG
54(42) 28.3 1.3
魚介類Fish & Fish Preparation
48(44) 8.9 0.4
鉄鉱石Iron Ore & Concentrates
44(50) ▲ 12.2 ▲ 0.7
石油製品Petroleum Products
37(19) 95.9 2.0
上位5品目 合計Top 5 total 654 ー 13.4
全品目 合計Grand total
920(918) 0.2 0.2
注:( )内の数字は2019年の金額。Note: Figures in ( ) are value in 2019.
品目 Items
金額Value
(10億円)[¥ billion]
伸率Growth(%)
寄与度Contribution
degree(%)
自動車Motor Vehicles
244(322) ▲ 24.0 ▲ 7.9
船舶Ships
224(219) 2.6 0.6
鉄鋼Iron & Steel Products
72(72) ▲ 0.2 ▲ 0.0
自動車の部分品Parts of Motor Vehicles
31(41) ▲ 24.1 ▲ 1.0
原動機Power Generating Machine
29(29) ▲ 2.6 ▲ 0.1
上位5品目 合計Top 5 total 600 ー ▲ 8.4
全品目 合計Grand total
848(984) ▲ 13.8 ▲ 13.8
注:( )内の数字は2019年の金額。Note: Figures in ( ) are value in 2019.
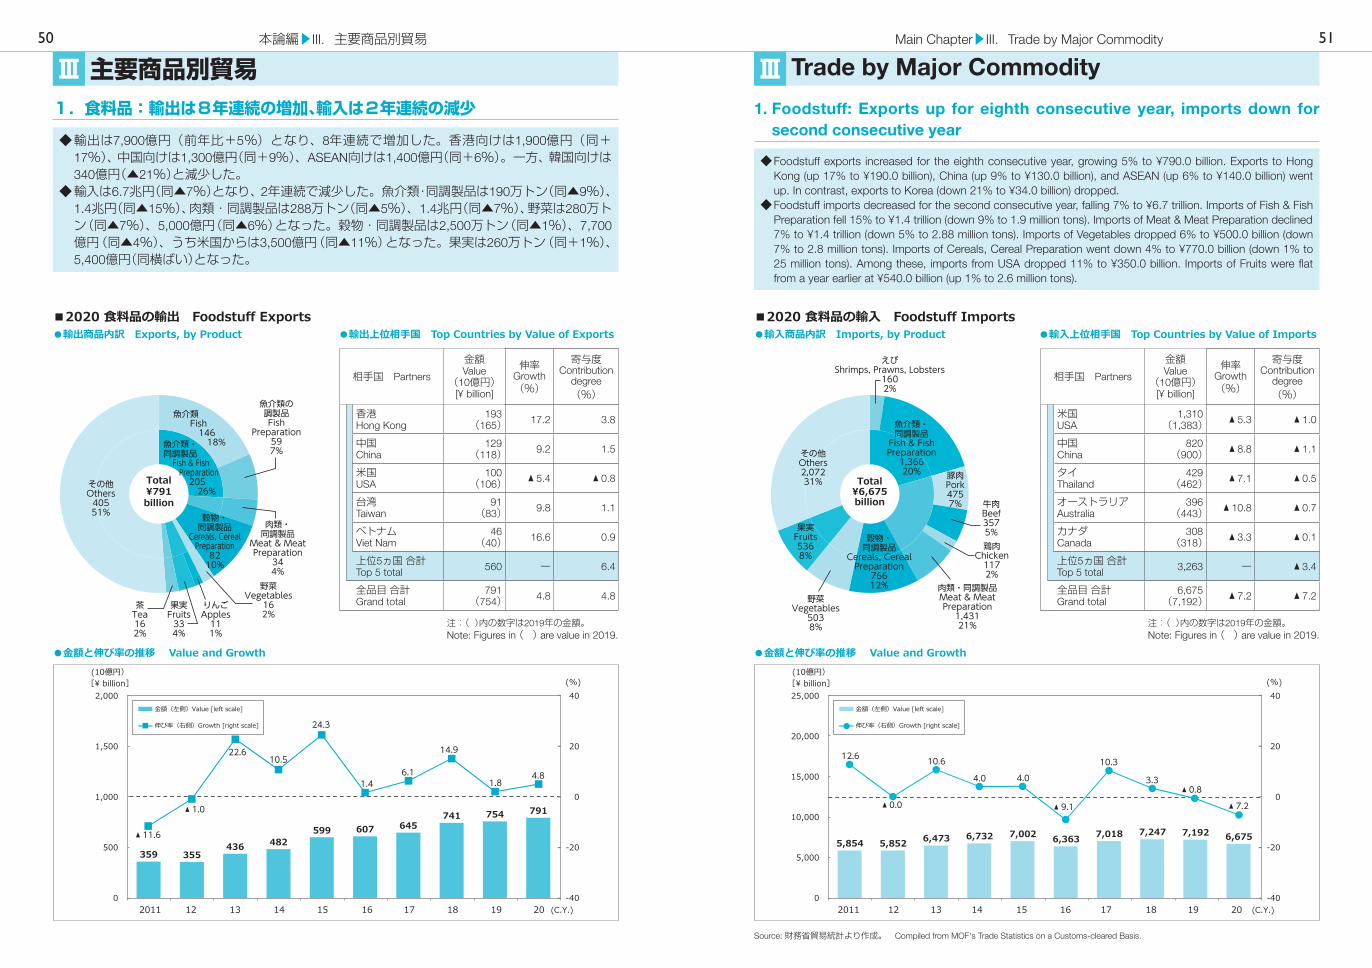
主要商品別貿易1. Foodstuff: Exports up for eighth consecutive year, imports down for
second consecutive year
◆ Foodstuff exports increased for the eighth consecutive year, growing 5% to ¥790.0 billion. Exports to Hong Kong (up 17% to ¥190.0 billion), China (up 9% to ¥130.0 billion), and ASEAN (up 6% to ¥140.0 billion) went up. In contrast, exports to Korea (down 21% to ¥34.0 billion) dropped.
◆ Foodstuff imports decreased for the second consecutive year, falling 7% to ¥6.7 trillion. Imports of Fish & Fish Preparation fell 15% to ¥1.4 trillion (down 9% to 1.9 million tons). Imports of Meat & Meat Preparation declined 7% to ¥1.4 trillion (down 5% to 2.88 million tons). Imports of Vegetables dropped 6% to ¥500.0 billion (down 7% to 2.8 million tons). Imports of Cereals, Cereal Preparation went down 4% to ¥770.0 billion (down 1% to 25 million tons). Among these, imports from USA dropped 11% to ¥350.0 billion. Imports of Fruits were flat from a year earlier at ¥540.0 billion (up 1% to 2.6 million tons).
1.食料品:輸出は8年連続の増加、輸入は2年連続の減少
◆ 輸出は7,900億円(前年比+5%)となり、8年連続で増加した。香港向けは1,900億円(同+17%)、中国向けは1,300億円(同+9%)、ASEAN向けは1,400億円(同+6%)。一方、韓国向けは340億円(▲21%)と減少した。
◆ 輸入は6.7兆円(同▲7%)となり、2年連続で減少した。魚介類・同調製品は190万トン(同▲9%)、1.4兆円(同▲15%)、肉類・同調製品は288万トン(同▲5%)、1.4兆円(同▲7%)、野菜は280万トン(同▲7%)、5,000億円(同▲6%)となった。穀物・同調製品は2,500万トン(同▲1%)、7,700億円(同▲4%)、うち米国からは3,500億円(同▲11%)となった。果実は260万トン(同+1%)、5,400億円(同横ばい)となった。
2011 12 13 14 15 16 17 18 19 20 (C.Y.)
[¥ billion](10億円)
359 355436 482
599 607 645741 754 791
▲ 11.6
▲ 1.0
22.610.5
24.3
1.46.1
14.9
1.84.8
金額(左側)Value [left scale]
伸び率(右側)Growth [right scale]
-40
-20
0
20
40 (%)
0
500
1,000
1,500
2,000
(C.Y.)
[¥ billion](10億円)
-40
-20
0
20
40 (%)
0
10,000
5,000
15,000
20,000
25,000金額(左側)Value [left scale]
伸び率(右側)Growth [right scale]
2011 12 13 14 15 16 17 18 19 20
5,854 5,852 6,473 6,732 7,002 6,363 7,018 7,247 7,192 6,675
12.6
▲ 0.0
10.6
4.0 4.0
▲ 9.1
10.3
3.3▲ 0.8
▲ 7.2
魚介類・同調製品
Fish & FishPreparation
1,36620% 豚肉
Pork4757%
鶏肉Chicken
1172%
牛肉Beef3575%
肉類・同調製品Meat & MeatPreparation
1,43121%
穀物・同調製品
Cereals, CerealPreparation
76612%
野菜Vegetables
5038%
果実Fruits5368%
その他Others2,07231%
えびShrimps, Prawns, Lobsters
1602%
Total¥6,675billion
魚介類 Fish 146 18%魚介類・
同調製品 Fish & Fish Preparation 205 26%
魚介類の調製品Fish
Preparation597%
肉類・同調製品
Meat & MeatPreparation
344%
穀物・同調製品
Cereals, CerealPreparation
8210%
野菜Vegetables
162%
りんごApples
111%
果実Fruits
334%
茶Tea162%
その他Others
40551%
Total¥791billion
■2020 食料品の輸出 Foodstuff Exports●輸出商品内訳 Exports, by Product ●輸入商品内訳 Imports, by Product●輸出上位相手国 Top Countries by Value of Exports ●輸入上位相手国 Top Countries by Value of Imports
●金額と伸び率の推移 Value and Growth ●金額と伸び率の推移 Value and Growth
■2020 食料品の輸入 Foodstuff Imports
Trade by Major CommodityⅢ Ⅲ50 51
Source: 財務省貿易統計より作成。 Compiled from MOF's Trade Statistics on a Customs-cleared Basis.
Main Chapter▶III.Trade by Major Commodity本論編▶III.主要商品別貿易
相手国 Partners
金額Value
(10億円)[¥ billion]
伸率Growth(%)
寄与度Contribution
degree(%)
米国USA
1,310(1,383) ▲ 5.3 ▲ 1.0
中国China
820(900) ▲ 8.8 ▲ 1.1
タイThailand
429(462) ▲ 7.1 ▲ 0.5
オーストラリアAustralia
396(443) ▲ 10.8 ▲ 0.7
カナダCanada
308(318) ▲ 3.3 ▲ 0.1
上位5ヵ国 合計Top 5 total 3,263 ー ▲ 3.4
全品目 合計Grand total
6,675(7,192) ▲ 7.2 ▲ 7.2
注:( )内の数字は2019年の金額。Note: Figures in ( ) are value in 2019.
相手国 Partners
金額Value
(10億円)[¥ billion]
伸率Growth(%)
寄与度Contribution
degree(%)
香港Hong Kong
193(165) 17.2 3.8
中国China
129(118) 9.2 1.5
米国USA
100(106) ▲ 5.4 ▲ 0.8
台湾Taiwan
91(83) 9.8 1.1
ベトナムViet Nam
46(40) 16.6 0.9
上位5ヵ国 合計Top 5 total 560 ー 6.4
全品目 合計Grand total
791(754) 4.8 4.8
注:( )内の数字は2019年の金額。Note: Figures in ( ) are value in 2019.

2. Wood: Imports down for second consecutive year
◆ Wood imports decreased for the second consecutive year, falling 22% to ¥280.0 billion. Imports of Lumber, which accounted for nearly 80% of the total, went down 21% to ¥220.0 billion. Imports of Logs, which accounted for over 20% of the total, declined 23% to ¥58.0 billion (down 23% to 2.22 million cubic meters).
◆ Imports of Wood from Canada decreased 36% to ¥55.0 billion and imports of Wood from USA fell 6% to ¥59.0 billion in North America. Imports of Wood from EU went down 15% to ¥77.0 billion with declined imports from Finland (down 18% to ¥24.0 billion) and Austria (down 32% to ¥8.6 billion). Imports of Wood from Asia fell 25% to ¥32.0 billion with decreased imports from China (down 21% to ¥14.0 billion) and Malaysia (down 34% to ¥6.2 billion). Imports of Wood from New Zealand dropped 27% to ¥5.7 billion and imports of Wood from Chile dropped 37% to ¥6.1 billion. Imports of Wood from Russia also went down 23% to ¥39.0 billion.
2.木材:輸入は2年連続の減少
◆ 輸入は2,800億円(前年比▲22%)となり、2年連続で減少した。8割弱を占める製材は2,200億円(同▲21%)、2割強を占める丸太は222万㎥(同▲23%)、580億円(同▲23%)となった。◆ 米材は、カナダから550億円(同▲36%)、米国から590億円(同▲6%)となった。EUからの欧州材は770億円(同▲15%)、うちフィンランドから240億円(同▲18%)、オーストリアから86億円(同▲32%)となった。アジアからの南洋材は320億円(同▲25%)、うち中国から140億円(同▲21%)、マレーシアから62億円(同▲34%)となった。NZ・チリ材は、ニュージーランドから57億円(同▲27%)、チリから61億円(同▲37%)となった。ロシアからの北洋材は390億円(同▲23%)となった。
2011 12 13 14 15 16 17 18 19 20 (C.Y.)
[¥ billion](10億円)
-50
-25
0
25
50 (%)
0
500
1,000
1,500
2,000金額(左側)Value [left scale]
伸び率(右側)Growth [right scale]
347 323459 430 396 367 385 408 357
279
6.2
▲ 6.8
42.0
▲ 6.3▲ 8.0 ▲ 7.2
4.8 5.9
▲ 12.4
▲ 21.9
アジアAsia32
11%
中国China
145%
カンボジアCambodia
73%
フィリピンPhilippines
62%
米国USA59
21%
カナダ Canada
55 20%
北米North
America11441%
フィンランドFinland
248%スウェーデン
Sweden238%
EU77
28%
オーストリアAustria
93%
ニュージーランドNew Zealand
62%
チリChile
62%
ロシアRussia
3914%
その他Others
52%
Total¥279billion
■2020 木材の輸入 Wood Imports●輸入国・地域内訳 Imports, by Area/Country ●輸入上位相手国 Top Countries by Value of Imports ●金額と伸び率の推移 Value and Growth
52 53
Source: 財務省貿易統計より作成。 Compiled from MOF's Trade Statistics on a Customs-cleared Basis.
Main Chapter▶III.Trade by Major Commodity本論編▶III.主要商品別貿易
相手国 Partners
金額Value
(10億円)[¥ billion]
伸率Growth(%)
寄与度Contribution
degree(%)
米国USA
59(63) ▲ 6.3 ▲ 1.1
カナダCanada
55(86) ▲ 35.8 ▲ 8.6
ロシアRussia
39(51) ▲ 22.7 ▲ 3.2
フィンランドFinland
24(29) ▲ 18.0 ▲ 1.5
スウェーデンSweden
23(24) ▲ 1.1 ▲ 0.1
上位5ヵ国 合計Top 5 total 200 ー ▲ 14.5
全品目 合計Grand total
279(357) ▲ 21.9 ▲ 21.9
注:( )内の数字は2019年の金額。Note: Figures in ( ) are value in 2019.

3. Mineral Fuels: Exports down for first time in four years, imports down for second consecutive year
◆ Mineral Fuels exports decreased for the first time in four years, falling 48% to ¥720.0 billion. Among these, exports of Petroleum Products (Gas Oil, Kerosene, Petroleum Spirits, etc.) went down 52% to ¥640.0 billion.
◆ Mineral Fuels imports plummeted 34% to ¥11.3 trillion, which accounted for 17% of Japan’s total imports (down 5 percentage points from a year earlier), reflecting the falling crude oil price. Imports of Petroleum, which accounted for nearly 40% of the total and is the largest import item of all, declined 42% to ¥4.6 trillion (down 16% to 150.0 million kiloliters). CIF (cost, insurance, and freight) prices dropped for two years, falling 29% to $47.4/barrel. Imports of Petroleum Products declined 19% to ¥1.2 trillion. Imports of Petroleum Spirits, which accounted for nearly 80% of the total imports of Petroleum Products, went down 16% to ¥970.0 billion (down 11% to 31.0 million kiloliters). Imports of LNG (Liquefied Natural Gas), which accounted for nearly 30% of the total, decreased 26% to ¥3.2 trillion (down 4% to 74.0 million tons). Imports of Coal fell 33% to ¥1.7 trillion (down 7% to 170.0 million tons). Among these, imports of Coking Coal went down 31% to ¥900.0 billion (down 5% to 110.0 million tons). Imports of LPG (Liquefied Petroleum Gas) decreased 19% to ¥430.0 billion (down 7% to 9.8 million tons).
3.鉱物性燃料:輸出は4年ぶり、輸入は2年連続の減少
◆ 輸出は7,200億円(前年比▲48%)となり、4年ぶりに減少した。うち石油製品(軽油・灯油・揮発油等)は、6,400億円(同▲52%)となった。
◆ 輸入は、原油価格の下落を背景に11.3兆円(同▲34%)と、輸入総額の17%(同▲5ポイント)を占めることとなった。うち4割強を占め、わが国最大の輸入品目である原油及び粗油は、1.5億KL(同▲16%)、4.6兆円(同▲42%)となった。原油入着価格は、通年で47.4ドル/バレル(同▲29%)となり2年連続で下落した。石油製品は1.2兆円(同▲19%)、うち8割弱を占める揮発油は3,100万KL(同▲11%)、9,700億円(同▲16%)となった。3割弱を占めるLNG(液化天然ガス)は7,400万トン(同▲4%)、3.2兆円(同▲26%)となった。石炭は1.7億トン(同▲7%)、1.7兆円(同▲33%)となった。うち一般炭は1.1億トン(同▲5%)、9,000億円(同▲31%)となった。LPG(液化石油ガス)は、980万トン(同▲7%)、4,300億円(同▲19%)となった。
2011 12 13 14 15 16 17 18 19 20 (C.Y.)
[¥ billion](10億円)
-80
-20
-40
-60
0
20
80
60
40
(%)
金額(左側)Value [left scale]
伸び率(右側)Growth [right scale]
0
2,000
4,000
6,000
8,000
1,247 1,0261,533 1,517
1,245898 1,117 1,304 1,383
723
12.9
▲ 17.8
49.5
▲ 1.0
▲ 17.9▲ 27.9
24.416.8
6.0
▲ 47.7
2011 12 13 14 15 16 17 18 19 20 (C.Y.)
[¥ billion](10億円)
-80
-60
-40
-20
0
20
80
60
40
(%)
0
20,000
40,000
60,000
80,000金額(左側)Value [left scale] 伸び率(右側)Growth [right scale]
21,816 24,08827,444 27,692
12,05215,840
19,294 16,95111,260
25.4
10.4 13.9
0.9
▲ 34.2▲ 33.8
31.421.8
▲ 12.1
▲ 33.6
18,218
サウジアラビアSaudi Arabia
1,83716%
アラブ首長国連邦
UAE1,46513%
原油及び粗油Petroleum
4,64641%
オーストラリアAustralia
1,29211%
LNG3,21729%
マレーシアMalaysia
4244%
カタールQatar3613%
石油製品PetroleumProducts
1,24611%
LPG4314%
石炭Coal
1,701 15%
Total¥11,260billion
灯油Kerosene
11015%
揮発油Petroleum Spirits
9213%
潤滑油・グリスLubricating oils
10214%
石油製品PetroleumProducts
64088%
その他Others
8312%
軽油Gas Oil
17124%
Total¥723billion
■2020 鉱物性燃料の輸出 Mineral Fuels Exports●輸出商品内訳 Exports, by Product ●輸入商品、国内訳 Imports, by Product & Country●輸出上位相手国 Top Countries by Value of Exports ●輸入上位相手国 Top Countries by Value of Imports
●金額と伸び率の推移 Value and Growth ●金額と伸び率の推移 Value and Growth
■2020 鉱物性燃料の輸入 Mineral Fuels Imports
54 55
Source: 財務省貿易統計より作成。 Compiled from MOF's Trade Statistics on a Customs-cleared Basis.
Main Chapter▶III.Trade by Major Commodity本論編▶III.主要商品別貿易
相手国 Partners
金額Value
(10億円)[¥ billion]
伸率Growth(%)
寄与度Contribution
degree(%)
オーストラリアAustralia
2,392(3,331) ▲ 28.2 ▲ 5.5
サウジアラビアSaudi Arabia
1,889(2,913) ▲ 35.2 ▲ 6.0
アラブ首長国連邦UAE
1,669(2,762) ▲ 39.6 ▲ 6.4
カタールQatar
964(1,410) ▲ 31.6 ▲ 2.6
米国USA
817(1,103) ▲ 25.9 ▲ 1.7
上位5ヵ国 合計Top 5 total 7,731 ー ▲ 22.3
全品目 合計Grand total
11,260(16,951) ▲ 33.6 ▲ 33.6
注:( )内の数字は2019年の金額。Note: Figures in ( ) are value in 2019.
相手国 Partners
金額Value
(10億円)[¥ billion]
伸率Growth(%)
寄与度Contribution
degree(%)
韓国Korea
174(192) ▲ 9.2 ▲ 1.3
中国China
101(152) ▲ 33.9 ▲ 3.7
オーストラリアAustralia
96(332) ▲ 70.9 ▲ 17.0
シンガポールShingapore
80(81) ▲ 1.3 ▲ 0.1
マレーシアMalaysia
57(65) ▲ 12.5 ▲ 0.6
上位5ヵ国 合計Top 5 total 508 ー ▲ 22.7
全品目 合計Grand total
723(1,383) ▲ 47.7 ▲ 47.7
注:( )内の数字は2019年の金額。Note: Figures in ( ) are value in 2019.

4. Chemicals: Both exports and imports down for second consecutive year
◆ Chemicals exports decreased for the second consecutive year, falling 2% to ¥8.5 trillion. Exports of Organic Chemicals went down 18% to ¥1.6 trillion. Plastic Materials were flat from a year earlier at ¥2.4 trillion. In contrast, exports of Medical Products rose 14% to ¥840.0 billion (up 2% to 43 million kilograms). By area and country, exports to Asia, which accounted for three quarters of the total, declined 3% to ¥6.2 trillion with decreased exports to Korea (down 12% to ¥1.1 trillion). Exports to USA also went down 9% to ¥970 billion.
◆ Chemicals imports went down for the second consecutive year, falling 5% to ¥7.8 trillion. Imports of Organic Chemicals decreased 2% to ¥1.7 trillion. In contrast, imports of Medical Products increased 2% to ¥3.2 trillion (down 1% to 100 million kilograms). By area and country, imports from EU declined 1% to ¥2.5 trillion with decreased imports from Germany (down 4% to ¥780.0 billion). Imports from China (down 10% to ¥ 1.1 trillion), UK (down 26% to ¥170.0 billion), and Taiwan (down 17% to ¥240.0 billion) dropped.
4.化学製品:輸出入とも2年連続の減少
◆ 輸出は8.5兆円(前年比▲2%)となり、2年連続で減少した。うち有機化合物は1.6兆円(同▲18%)、プラスチックは2.4兆円(同横ばい)となった。一方、医薬品は4,300万KG(同+2%)、8,400億円(同+14%)と増加した。地域別では、全体の4分の3を占めるアジア向けは6.2兆円(同▲3%)、うち韓国向けは1.1兆円(同▲12%)となった。米国向けは9,700億円(同▲9%)となった。
◆ 輸入は7.8兆円(同▲5%)となり、2年連続で減少した。うち有機化合物は1.7兆円(同▲2%)となった。一方、医薬品は1.0億KG(同▲1%)、3.2兆円(同+2%)と金額ベースでは増加した。地域別では、EUからは2.5兆円(同▲1%)、うちドイツからは7,800億円(同▲4%)となった。中国からは1.1兆円(同▲10%)、英国からは1,700億円(同▲26%)、台湾からは2,400億円(同▲17%)となった。
2011 12 13 14 15 16 17 18 19 20 (C.Y.)
[¥ billion](10億円)
-60
-20
-40
0
20
60
40
(%)
0
10,000
5,000
15,000
20,000
30,000
25,000
6,798 6,3657,507 7,818 7,759 7,123
8,192 8,922 8,739 8,540
▲ 1.8▲ 6.4
18.0
4.1
▲ 0.7▲ 8.2
15.08.9
▲ 2.0 ▲ 2.3
金額(左側)Value [left scale] 伸び率(右側)Growth [right scale]
2011 12 13 14 15 16 17 18 19 20 (C.Y.)
[¥ billion](10億円)
-30
-20
-10
0
10
30
20
(%)
0
10,000
5,000
15,000
20,000
30,000
25,000
6,098 5,926 6,464 6,864 7,748 7,111 7,5678,550 8,163 7,790
13.4
▲ 2.8
9.16.2
12.9
▲ 8.2
6.4
13.0
▲ 4.5 ▲ 4.6
金額(左側)Value [left scale] 伸び率(右側)Growth [right scale]
有機化合物Organic
Chemicals1,65021%
無機化合物InorganicChemicals
5868%
医薬品MedicalProducts
3,15240%
精油・香料・化粧品類
Essential oils,Perfumery,Cosmetics
4606%
プラスチックPlastic
Materials88111%
その他Others1,06114%
Total¥7,790billion
有機化合物Organic
Chemicals1,55618%
キシレンXylene
1502%
医薬品MedicalProducts
83610%
化粧品Cosmetics
6828% 精油・香料・
化粧品類Essential oils,
Perfumery,Cosmetics
91411%ポリエチレン
Polyethylene1081%
プラスチックPlastic
Materials2,42028%
その他Others2,81433% Total
¥8,540billion
■2020 化学製品の輸出 Chemicals Exports●輸出商品内訳 Exports, by Product ●輸入商品内訳 Imports, by Product●輸出上位相手国 Top Countries by Value of Exports ●輸入上位相手国 Top Countries by Value of Imports
●金額と伸び率の推移 Value and Growth ●金額と伸び率の推移 Value and Growth
■2020 化学製品の輸入 Chemicals Imports
56 57
Source: 財務省貿易統計より作成。 Compiled from MOF's Trade Statistics on a Customs-cleared Basis.
Main Chapter▶III.Trade by Major Commodity本論編▶III.主要商品別貿易
相手国 Partners
金額Value
(10億円)[¥ billion]
伸率Growth(%)
寄与度Contribution
degree(%)
米国USA
1,345(1,358) ▲ 1.0 ▲ 0.2
中国China
1,078(1,196) ▲ 9.8 ▲ 1.4
ドイツGermany
775(806) ▲ 3.8 ▲ 0.4
韓国Korea
463(495) ▲ 6.5 ▲ 0.4
アイルランドIreland
436(461) ▲ 5.3 ▲ 0.3
上位5ヵ国 合計Top 5 total 4,098 ー ▲ 2.7
全品目 合計Grand total
7,790(8,163) ▲ 4.6 ▲ 4.6
注:( )内の数字は2019年の金額。Note: Figures in ( ) are value in 2019.
相手国 Partners
金額Value
(10億円)[¥ billion]
伸率Growth(%)
寄与度Contribution
degree(%)
中国China
2,535(2,542) ▲ 0.3 ▲ 0.1
韓国Korea
1,107(1,257) ▲ 11.9 ▲ 1.7
米国USA
974(1,066) ▲ 8.6 ▲ 1.1
台湾Taiwan
891(936) ▲ 4.9 ▲ 0.5
香港Hong Kong
342(337) 1.3 0.1
上位5ヵ国 合計Top 5 total 5,849 ー ▲ 3.3
全品目 合計Grand total
8,540(8,739) ▲ 2.3 ▲ 2.3
注:( )内の数字は2019年の金額。Note: Figures in ( ) are value in 2019.

5. Iron & Steel Products: Both exports and imports down for second consecutive year
◆ In 2020, world crude steel production went down 1% from a year earlier to 1,860.0 million tons. Japan’s domestic crude steel production decreased 16% to 83.19 million tons.
◆ Iron & Steel Products exports fell for the second consecutive year, declining 16% to ¥2.6 trillion (down 5% to 32.0 million tons on a volume basis). By area and country, exports to Asia went down 17% to ¥1.9 trillion (down 6% to 25.0 million tons) with decreased exports to Thailand (down 32% to ¥290.0 billion, down 27% to 3.8 million tons), Korea (down 23% to ¥330.0 billion, down 11% to 4.8 million tons), and Indonesia (down 34% to ¥120.0 billion, down 26% to 1.5 million tons).
◆ Iron & Steel Products imports decreased for the second consecutive year, falling 26% to ¥700.0 billion (down 21% to 6.6 million tons). By area and country, imports from Asia declined 25% to ¥530.0 billion (down 20% to 5.6 million tons) with decreased imports from Korea (down 22% to ¥260.0 billion, down 16% to 3.2 million tons), China (down 30% to ¥130.0 billion, down 32% to 1.0 million tons), and Taiwan (down 19% to ¥72.0 billion, down 11% to 900,000 tons).
5.鉄鋼:輸出入とも2年連続の減少
◆ 2020年の世界の粗鋼生産量は18.6億トン(前年比同▲1%)、日本国内の粗鋼生産量は、8,319万トン(同▲16%)となった。
◆ 輸出は3,200万トン(同▲5%)、2.6兆円(同▲16%)と2年連続で減少した。アジア向けは2,500万トン(同▲6%)、1.9兆円(同▲17%)となった。うちタイ向けは380万トン(同▲27%)、2,900億円(同▲32%)、韓国向けは480万トン(同▲11%)、3,300億円(同▲23%)、インドネシア向けは150万トン(同▲26%)、1,200億円(同▲34%)となった。
◆ 輸入は660万トン(同▲21%)、7,000億円(同▲26%)と2年連続で減少した。アジアからは560万トン(同▲20%)、5,300億円(同▲25%)となった。うち韓国からは320万トン(同▲16%)、2,600億円(同▲22%)、中国からは100万トン(同▲32%)、1,300億円(同▲30%)、台湾からは90万トン(同▲11%)、720億円(同▲19%)となった。
2011 12 13 14 15 16 17 18 19 20 (C.Y.)
[¥ billion](10億円)
-60
-40
-20
0
60
40
20
(%)
0
5,000
10,000
15,000
20,000
3,709 3,496 3,793 3,958 3,668 2,843 3,284 3,441 3,074 2,574
0.9
▲ 5.8
8.54.4
▲ 7.3
▲ 22.5
15.5
4.8
▲ 10.7▲ 16.3
金額(左側)Value [left scale] 伸び率(右側)Growth [right scale]
2011 12 13 14 15 16 17 18 19 20 (C.Y.)
[¥ billion](10億円)
-80
-40
0
80
40
(%)
0
1,000
500
1,500
2,000
3,000
2,500
945 807 801
986 844
706 920
1,019 948
705
24.0
▲ 14.6
▲ 0.7
23.1
▲ 14.4 ▲ 16.3
30.3
10.7
▲ 6.9▲ 25.6
金額(左側)Value [left scale] 伸び率(右側)Growth [right scale]
フラットロール製品Flat‐rolled
Products29442%
合金鉄Ferro‐alloys
18025%
棒・形鋼・線Iron & Steel Wire,
Bars90
13%
管・管用継手Tubes, Pipes &
Fittings10515%
その他Others
365%
Total¥705billion
中国China31312% タイ
Thailand1917%
韓国Korea1827%
フラットロール製品Flat‐rolled Products
1,56661%
中国China
773%
韓国Korea
632%
タイThailand
572%
棒・形鋼・線Iron & Steel Wire,
Bars 338 13%
台湾Taiwan
502%
韓国Korea
472%
ビレット・シートバー等
Bloom, Billets, Sheet Bars
1676% その他
Others50320%
Total¥2,574billion
■2020 鉄鋼の輸出 Iron & Steel Products Exports●輸出商品、国・地域内訳 Exports, by Product & Area/Country ●輸入商品内訳 Imports, by Product●輸出上位相手国 Top Countries by Value of Exports ●輸入上位相手国 Top Countries by Value of Imports
●金額と伸び率の推移 Value and Growth ●金額と伸び率の推移 Value and Growth
■2020 鉄鋼の輸入 Iron & Steel Products Imports
58 59
Source: 財務省貿易統計より作成。 Compiled from MOF's Trade Statistics on a Customs-cleared Basis.
Main Chapter▶III.Trade by Major Commodity本論編▶III.主要商品別貿易
相手国 Partners
金額Value
(10億円)[¥ billion]
伸率Growth(%)
寄与度Contribution
degree(%)
中国China
502(495) 1.6 0.3
韓国Korea
326(425) ▲ 23.2 ▲ 3.2
タイThailand
293(432) ▲ 32.2 ▲ 4.5
台湾Taiwan
168(176) ▲ 5.0 ▲ 0.3
ベトナムViet Nam
139(144) ▲ 3.6 ▲ 0.2
上位5ヵ国 合計Top 5 total 1,427 ー ▲ 7.9
全品目 合計Grand total
2,574(3,074) ▲ 16.3 ▲ 16.3
注:( )内の数字は2019年の金額。Note: Figures in ( ) are value in 2019.
相手国 Partners
金額Value
(10億円)[¥ billion]
伸率Growth(%)
寄与度Contribution
degree(%)
韓国Korea
264(339) ▲ 22.3 ▲ 8.0
中国China
128(183) ▲ 30.1 ▲ 5.8
台湾Taiwan
72(89) ▲ 19.4 ▲ 1.8
カザフスタンKazakhstan
38(53) ▲ 28.6 ▲ 1.6
ブラジルBrazil
24(36) ▲ 32.8 ▲ 1.2
上位5ヵ国 合計Top 5 total 525 ー ▲ 18.5
全品目 合計Grand total
705(948) ▲ 25.6 ▲ 25.6
注:( )内の数字は2019年の金額。Note: Figures in ( ) are value in 2019.
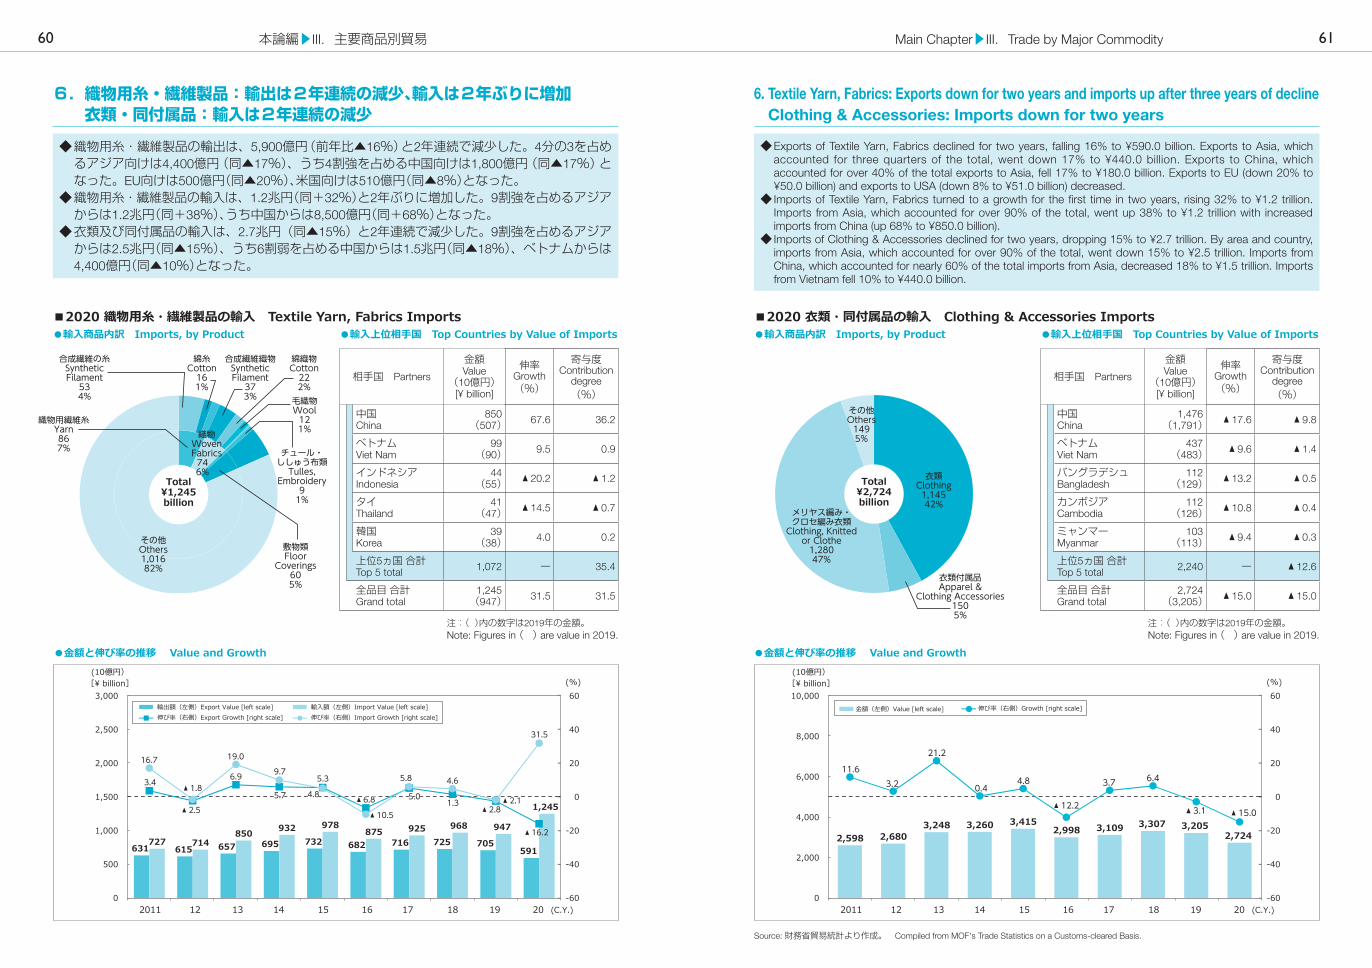
6. Textile Yarn, Fabrics: Exports down for two years and imports up after three years of decline Clothing & Accessories: Imports down for two years
◆ Exports of Textile Yarn, Fabrics declined for two years, falling 16% to ¥590.0 billion. Exports to Asia, which accounted for three quarters of the total, went down 17% to ¥440.0 billion. Exports to China, which accounted for over 40% of the total exports to Asia, fell 17% to ¥180.0 billion. Exports to EU (down 20% to ¥50.0 billion) and exports to USA (down 8% to ¥51.0 billion) decreased.
◆ Imports of Textile Yarn, Fabrics turned to a growth for the first time in two years, rising 32% to ¥1.2 trillion. Imports from Asia, which accounted for over 90% of the total, went up 38% to ¥1.2 trillion with increased imports from China (up 68% to ¥850.0 billion).
◆ Imports of Clothing & Accessories declined for two years, dropping 15% to ¥2.7 trillion. By area and country, imports from Asia, which accounted for over 90% of the total, went down 15% to ¥2.5 trillion. Imports from China, which accounted for nearly 60% of the total imports from Asia, decreased 18% to ¥1.5 trillion. Imports from Vietnam fell 10% to ¥440.0 billion.
6.織物用糸・繊維製品:輸出は2年連続の減少、輸入は2年ぶりに増加 衣類・同付属品:輸入は2年連続の減少
◆ 織物用糸・繊維製品の輸出は、5,900億円(前年比▲16%)と2年連続で減少した。4分の3を占めるアジア向けは4,400億円(同▲17%)、うち4割強を占める中国向けは1,800億円(同▲17%)となった。EU向けは500億円(同▲20%)、米国向けは510億円(同▲8%)となった。
◆ 織物用糸・繊維製品の輸入は、1.2兆円(同+32%)と2年ぶりに増加した。9割強を占めるアジアからは1.2兆円(同+38%)、うち中国からは8,500億円(同+68%)となった。
◆ 衣類及び同付属品の輸入は、2.7兆円(同▲15%)と2年連続で減少した。9割強を占めるアジアからは2.5兆円(同▲15%)、うち6割弱を占める中国からは1.5兆円(同▲18%)、ベトナムからは4,400億円(同▲10%)となった。
2011 12 13 14 15 16 17 18 19 20 (C.Y.)
[¥ billion](10億円)
-60
-20
-40
0
60
40
20
(%)
0
1,000
2,000
3,000
500
1,500
2,500
輸出額(左側)Export Value [left scale]伸び率(右側)Export Growth [right scale]
輸入額(左側)Import Value [left scale]伸び率(右側)Import Growth [right scale]
631 615 657 695 732 682 716 725 705 591
727 714850 932 978
875 925 968 947
1,245
3.4
▲ 2.5
6.9
5.75.7
5.3
▲ 6.8▲ 6.8 5.05.01.3
▲ 2.8
▲ 16.2
16.7
▲ 1.8
19.0
9.7
4.84.8
▲ 10.5
5.8 4.6
▲ 2.1
31.5
2011 12 13 14 15 16 17 18 19 20 (C.Y.)
[¥ billion](10億円)
-60
-40
-20
0
20
60
40
(%)
0
4,000
2,000
6,000
8,000
10,000金額(左側)Value [left scale] 伸び率(右側)Growth [right scale]
2,598 2,6803,248 3,260 3,415
2,998 3,109 3,307 3,205 2,724
11.63.2
21.2
0.44.8
▲ 12.2
3.7 6.4
▲ 3.1▲ 3.1 ▲ 15.0
衣類Clothing1,14542%
衣類付属品Apparel &
Clothing Accessories1505%
メリヤス編み・クロセ編み衣類
Clothing, Knittedor Clothe
1,28047%
その他Others
1495%
Total¥2,724billion
合成繊維の糸SyntheticFilament534%
綿糸Cotton161%
合成繊維織物SyntheticFilament373%
綿織物Cotton222%毛織物Wool121%
チュール・ししゅう布類Tulles,
Embroidery91%
敷物類Floor
Coverings605%
その他Others1,01682%
織物WovenFabrics74 6%
織物用繊維糸Yarn867%
Total¥1,245billion
■2020 織物用糸・繊維製品の輸入 Textile Yarn, Fabrics Imports●輸入商品内訳 Imports, by Product ●輸入商品内訳 Imports, by Product●輸入上位相手国 Top Countries by Value of Imports ●輸入上位相手国 Top Countries by Value of Imports
●金額と伸び率の推移 Value and Growth ●金額と伸び率の推移 Value and Growth
■2020 衣類・同付属品の輸入 Clothing & Accessories Imports
60 61
Source: 財務省貿易統計より作成。 Compiled from MOF's Trade Statistics on a Customs-cleared Basis.
Main Chapter▶III.Trade by Major Commodity本論編▶III.主要商品別貿易
相手国 Partners
金額Value
(10億円)[¥ billion]
伸率Growth(%)
寄与度Contribution
degree(%)
中国China
1,476(1,791) ▲ 17.6 ▲ 9.8
ベトナムViet Nam
437(483) ▲ 9.6 ▲ 1.4
バングラデシュBangladesh
112(129) ▲ 13.2 ▲ 0.5
カンボジアCambodia
112(126) ▲ 10.8 ▲ 0.4
ミャンマーMyanmar
103(113) ▲ 9.4 ▲ 0.3
上位5ヵ国 合計Top 5 total 2,240 ー ▲ 12.6
全品目 合計Grand total
2,724(3,205) ▲ 15.0 ▲ 15.0
注:( )内の数字は2019年の金額。Note: Figures in ( ) are value in 2019.
相手国 Partners
金額Value
(10億円)[¥ billion]
伸率Growth(%)
寄与度Contribution
degree(%)
中国China
850(507) 67.6 36.2
ベトナムViet Nam
99(90) 9.5 0.9
インドネシアIndonesia
44(55) ▲ 20.2 ▲ 1.2
タイThailand
41(47) ▲ 14.5 ▲ 0.7
韓国Korea
39(38) 4.0 0.2
上位5ヵ国 合計Top 5 total 1,072 ー 35.4
全品目 合計Grand total
1,245(947) 31.5 31.5
注:( )内の数字は2019年の金額。Note: Figures in ( ) are value in 2019.

◆ Exports of Computers & Units decreased for the third consecutive year, falling 15% to ¥300.0 billion. Exports to Asia went down 9% to ¥74.0 billion with declined exports to China (down 10% to ¥26.0 billion). Exports to EU declined 11% to ¥100.0 billion with decreased exports to Netherlands (down 31% to ¥30.0 billion). Exports to USA also decreased 23% to ¥97.0 billion.
◆ Exports of Parts of Computer went down for the third consecutive year, falling 10% to ¥870.0 billion. Exports to Asia fell 6% to ¥440.0 billion with declined exports to China (down 7% to ¥170.0 billion).
◆ Imports of Computers & Units increased for the fourth consecutive year, growing 9% to ¥2.4 trillion. Imports from Asia went up 11% to ¥2.2 trillion with increased imports from China (up 15% to ¥1.9 trillion). In contrast, imports from USA went down 15% to ¥100.0 billion. Imports from EU dropped 16% to ¥44.0 billion.
◆ Imports of Parts of Computer decreased for the first time in four years, falling 21% to ¥410.0 billion. Imports from Asia went down 20% to ¥390.0 billion with dropped imports from China (down 26% to ¥270.0 billion). Imports from EU decreased 47% to ¥10.0 billion and imports from USA fell 15% to ¥10.0 billion.
7.電算機類(含周辺機器):輸出は3年連続の減少、輸入は4年連続の増加 電算機類の部分品:輸出は3年連続、輸入は4年ぶりの減少
◆ 電算機類(含周辺機器)の輸出は、3,000億円(前年比▲15%)と3年連続で減少した。アジア向けは740億円(同▲9%)、うち中国向けは260億円(同▲10%)となった。EU向けは1.000億円(同▲11%)、うちオランダ向けは300億円(同▲31%)となった。米国向けは970億円(同▲23%)となった。
◆ 電算機類の部分品の輸出は、8,700億円(同▲10%)と3年連続で減少した。アジア向けは4,400億円(同▲6%)、うち中国向けは1,700億円(同▲7%)となった。
◆ 電算機類(含周辺機器)の輸入は、2.4兆円(同+9%)と4年連続で増加した。アジアからは2.2兆円(同+11%)、うち中国からは1.9兆円(同+15%)と増加した。一方、米国からは1,000億円(同▲15%)、EUからは440億円(同▲16%)と減少した。
◆ 電算機類の部分品の輸入は、4,100億円(同▲21%)と4年ぶりに減少した。アジアからは3,900億円(同▲20%)、うち中国からは2,700億円(同▲26%)となった。EUからは100億円(同▲47%)、米国からは100億円(同▲15%)となった。
2011 12 13 14 15 16 17 18 19 20 (C.Y.)
[¥ billion](10億円)
-60
-20
-40
0
60
40
20
(%)
0
2,000
1,000
3,000
5,000
4,000
6,000
1,126 1,052 1,202 1,194 1,207 1,008 1,095 1,061 967 868
445 431 494 496 498 455 501 503 524 413
▲ 11.7▲ 6.6
14.3
▲ 0.7
1.1
▲ 16.4
8.6
▲ 3.1▲ 8.9 ▲ 10.2
▲ 22.0
▲ 3.1▲ 3.1
14.5
0.6 0.4▲ 8.7
10.3
0.34.2
▲ 21.3
輸出額(左側)Export Value [left scale]伸び率(右側)Export Growth [right scale]
輸入額(左側)Import Value [left scale]伸び率(右側)Import Growth [right scale]
2011 12 13 14 15 16 17 18 19 20 (C.Y.)
[¥ billion](10億円)
-60
-20
-40
0
60
20
40
(%)
0
2,000
6,000
4,000
8,000
377 338 360 361 384 347 384 376 361 305
1,612 1,6481,928 2,122 1,973 1,724 1,966 2,029 2,211 2,400▲ 15.6
▲ 10.3
6.66.60.2
6.2
▲ 9.410.4
▲ 2.0 ▲ 4.0 ▲ 15.3
4.1 2.3
16.910.1
▲ 7.0▲ 12.6
14.0
3.29.0 8.6
輸出額(左側)Export Value [left scale]伸び率(右側)Export Growth [right scale]
輸入額(左側)Import Value [left scale]伸び率(右側)Import Growth [right scale]
中国China1,88479%
アジアAsia
2,21292%
タイThailand
934%
台湾Taiwan
703%
シンガポールSingapore
592%
米国 USA 101 4%
EU442%
その他Others
432%
Total¥2,400billion
中国 China 167 19%
ベトナムVietnam
637%
タイThailand
516%アジア
Asia44051%
米国USA21024%
オランダNetherlands
14617% EU
17821%
中東Middle East
91%
その他Others
324%
Total¥868billion
■2020 電算機類の部分品の輸出 Parts of Computer Exports●輸出国・地域内訳 Exports, by Area/Country ●輸入国・地域内訳 Imports, by Area/Country●輸出上位相手国 Top Countries by Value of Exports ●輸入上位相手国 Top Countries by Value of Imports
●金額と伸び率の推移 Value and Growth ●金額と伸び率の推移 Value and Growth
■2020 電算機類(含周辺機器)の輸入 Computers & Units Imports
7. Computers & Units: Exports down for third consecutive year, imports up for fourth consecutive year Parts of Computer: Exports down for third consecutive year, imports down for the first time in four years
62 63
Source: 財務省貿易統計より作成。 Compiled from MOF's Trade Statistics on a Customs-cleared Basis.
Main Chapter▶III.Trade by Major Commodity本論編▶III.主要商品別貿易
相手国 Partners
金額Value
(10億円)[¥ billion]
伸率Growth(%)
寄与度Contribution
degree(%)
中国China
1,884(1,641) 14.8 11.0
米国USA
101(119) ▲ 14.9 ▲ 0.8
タイThailand
93(97) ▲ 3.6 ▲ 0.2
台湾Taiwan
70(72) ▲ 3.8 ▲ 0.1
シンガポールSingapore
59(66) ▲ 10.0 ▲ 0.3
上位5ヵ国 合計Top 5 total 2,208 ー 9.6
全品目 合計Grand total
2,400(2,211) 8.6 8.6
注:( )内の数字は2019年の金額。Note: Figures in ( ) are value in 2019.
相手国 Partners
金額Value
(10億円)[¥ billion]
伸率Growth(%)
寄与度Contribution
degree(%)
米国USA
210(249) ▲ 15.9 ▲ 4.1
中国China
167(180) ▲ 7.3 ▲ 1.4
オランダNetherlands
146(159) ▲ 8.2 ▲ 1.3
ベトナムViet Nam
63(67) ▲ 6.3 ▲ 0.4
タイThailand
51(45) 14.4 0.7
上位5ヵ国 合計Top 5 total 636 ー ▲ 6.6
全品目 合計Grand total
868(967) ▲ 10.2 ▲ 10.2
注:( )内の数字は2019年の金額。Note: Figures in ( ) are value in 2019.
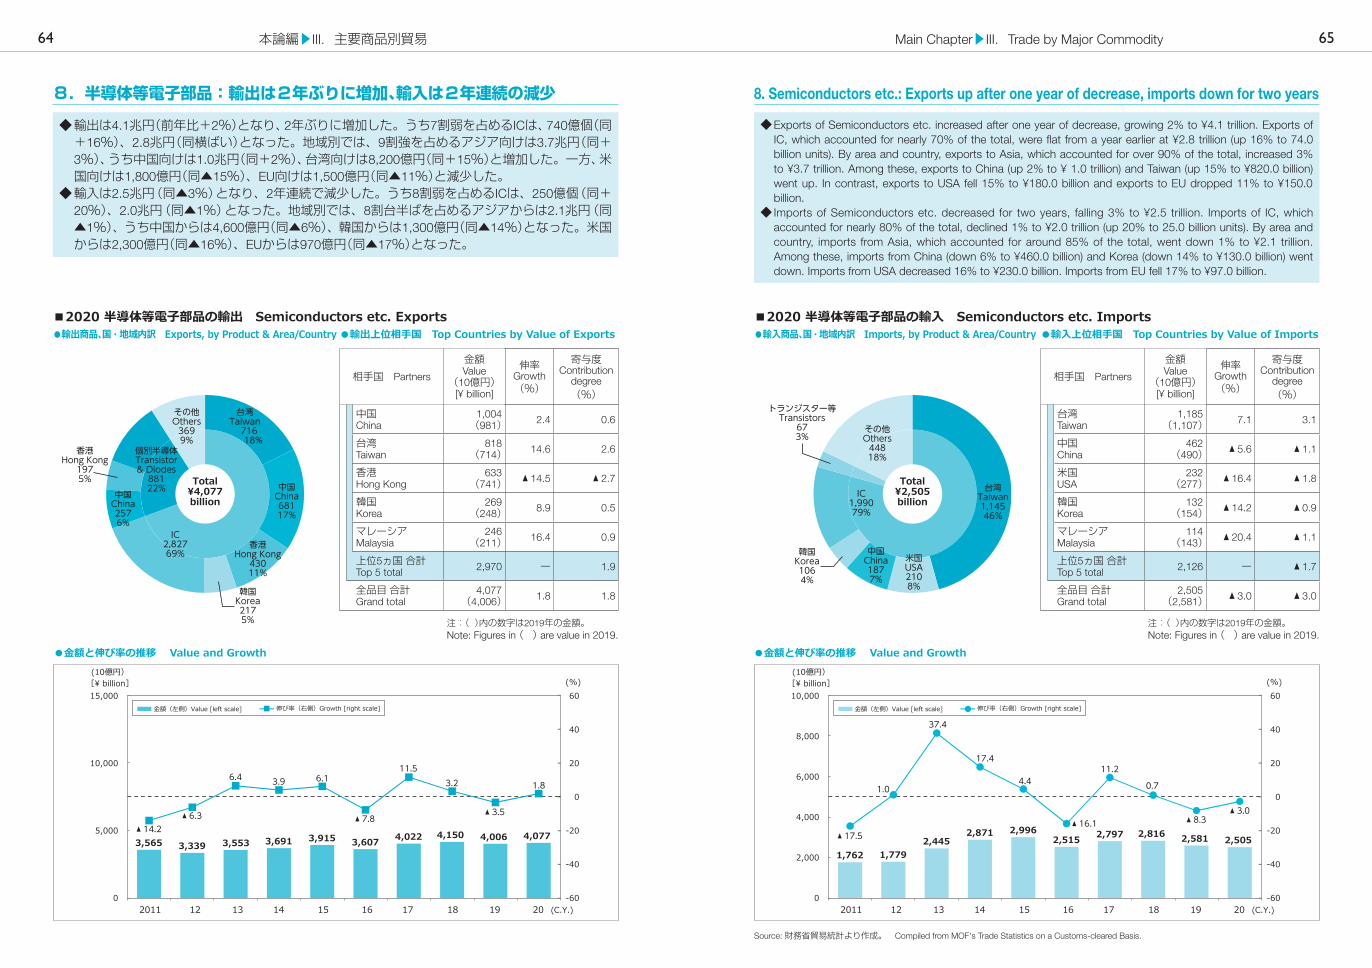
8. Semiconductors etc.: Exports up after one year of decrease, imports down for two years
◆ Exports of Semiconductors etc. increased after one year of decrease, growing 2% to ¥4.1 trillion. Exports of IC, which accounted for nearly 70% of the total, were flat from a year earlier at ¥2.8 trillion (up 16% to 74.0 billion units). By area and country, exports to Asia, which accounted for over 90% of the total, increased 3% to ¥3.7 trillion. Among these, exports to China (up 2% to ¥ 1.0 trillion) and Taiwan (up 15% to ¥820.0 billion) went up. In contrast, exports to USA fell 15% to ¥180.0 billion and exports to EU dropped 11% to ¥150.0 billion.
◆ Imports of Semiconductors etc. decreased for two years, falling 3% to ¥2.5 trillion. Imports of IC, which accounted for nearly 80% of the total, declined 1% to ¥2.0 trillion (up 20% to 25.0 billion units). By area and country, imports from Asia, which accounted for around 85% of the total, went down 1% to ¥2.1 trillion. Among these, imports from China (down 6% to ¥460.0 billion) and Korea (down 14% to ¥130.0 billion) went down. Imports from USA decreased 16% to ¥230.0 billion. Imports from EU fell 17% to ¥97.0 billion.
2011 12 13 14 15 16 17 18 19 20 (C.Y.)
[¥ billion](10億円)
-60
-20
-40
0
20
40
60 (%)
0
5,000
10,000
15,000
3,565 3,339 3,553 3,691 3,915 3,607 4,022 4,150 4,006 4,077 ▲ 14.2
▲ 6.3
6.4 3.9 6.1
▲ 7.8
11.53.2
▲ 3.5
1.8
金額(左側)Value [left scale] 伸び率(右側)Growth [right scale]
2011 12 13 14 15 16 17 18 19 20 (C.Y.)
[¥ billion](10億円)
-60
-20
-40
0
40
20
60 (%)
0
2,000
4,000
6,000
10,000
8,000
金額(左側)Value [left scale] 伸び率(右側)Growth [right scale]
1,762 1,7792,445
2,871 2,9962,515 2,797 2,816 2,581 2,505 ▲ 17.5
1.0
37.4
17.4
4.4
▲ 16.1
11.2
0.7
▲ 8.3▲ 3.0
台湾Taiwan1,14546%
IC1,99079%
中国China1877%
米国USA2108%
韓国Korea1064%
トランジスター等Transistors
673%
その他Others44818%
Total¥2,505billion
台湾Taiwan 716
18%
中国China68117%
香港Hong Kong
43011%
IC2,82769%
韓国Korea2175%
中国China2576%
個別半導体Transistor& Diodes
88122%
香港Hong Kong
1975%
その他Others
3699%
Total¥4,077billion
■2020 半導体等電子部品の輸出 Semiconductors etc. Exports●輸出商品、国・地域内訳 Exports, by Product & Area/Country ●輸入商品、国・地域内訳 Imports, by Product & Area/Country●輸出上位相手国 Top Countries by Value of Exports ●輸入上位相手国 Top Countries by Value of Imports
●金額と伸び率の推移 Value and Growth ●金額と伸び率の推移 Value and Growth
■2020 半導体等電子部品の輸入 Semiconductors etc. Imports
8.半導体等電子部品:輸出は2年ぶりに増加、輸入は2年連続の減少
◆ 輸出は4.1兆円(前年比+2%)となり、2年ぶりに増加した。うち7割弱を占めるICは、740億個(同+16%)、2.8兆円(同横ばい)となった。地域別では、9割強を占めるアジア向けは3.7兆円(同+3%)、うち中国向けは1.0兆円(同+2%)、台湾向けは8,200億円(同+15%)と増加した。一方、米国向けは1,800億円(同▲15%)、EU向けは1,500億円(同▲11%)と減少した。
◆ 輸入は2.5兆円(同▲3%)となり、2年連続で減少した。うち8割弱を占めるICは、250億個(同+20%)、2.0兆円(同▲1%)となった。地域別では、8割台半ばを占めるアジアからは2.1兆円(同▲1%)、うち中国からは4,600億円(同▲6%)、韓国からは1,300億円(同▲14%)となった。米国からは2,300億円(同▲16%)、EUからは970億円(同▲17%)となった。
64 65
Source: 財務省貿易統計より作成。 Compiled from MOF's Trade Statistics on a Customs-cleared Basis.
Main Chapter▶III.Trade by Major Commodity本論編▶III.主要商品別貿易
相手国 Partners
金額Value
(10億円)[¥ billion]
伸率Growth(%)
寄与度Contribution
degree(%)
台湾Taiwan
1,185(1,107) 7.1 3.1
中国China
462(490) ▲ 5.6 ▲ 1.1
米国USA
232(277) ▲ 16.4 ▲ 1.8
韓国Korea
132(154) ▲ 14.2 ▲ 0.9
マレーシアMalaysia
114(143) ▲ 20.4 ▲ 1.1
上位5ヵ国 合計Top 5 total 2,126 ー ▲ 1.7
全品目 合計Grand total
2,505(2,581) ▲ 3.0 ▲ 3.0
注:( )内の数字は2019年の金額。Note: Figures in ( ) are value in 2019.
相手国 Partners
金額Value
(10億円)[¥ billion]
伸率Growth(%)
寄与度Contribution
degree(%)
中国China
1,004(981) 2.4 0.6
台湾Taiwan
818(714) 14.6 2.6
香港Hong Kong
633(741) ▲ 14.5 ▲ 2.7
韓国Korea
269(248) 8.9 0.5
マレーシアMalaysia
246(211) 16.4 0.9
上位5ヵ国 合計Top 5 total 2,970 ー 1.9
全品目 合計Grand total
4,077(4,006) 1.8 1.8
注:( )内の数字は2019年の金額。Note: Figures in ( ) are value in 2019.

9. Audio & Visual Apparatus: Exports down for eighth consecutive year, imports down after three years of increase
◆ Exports of Audio & Visual Apparatus decreased for the eighth consecutive year, falling 16% to ¥570.0 billion. Exports of Visual Apparatus went down 16% to ¥340.0 billion. Among these, exports of Video Recording or Reproduction Apparatus (DVD & VCR Equipment), dropped 14% to ¥260.0 billion (down 12% to 8.6 million units). Exports of Television Receivers decreased 23% to ¥81.0 billion (down 23% to 3.9 million units). Exports of Parts of Audio, Visual Apparatus fell 17% to ¥190.0 billion. Exports of Audio Apparatus declined 11% to ¥40.0 billion.
◆ Imports of Audio & Visual Apparatus decreased after three years of increase, falling 7% to ¥1.3 trillion. Imports from Asia declined 3% to ¥1.1 trillion. Among these, imports from China rose 4% to ¥760.0 billion. Imports of Video Recording or Reproduction Apparatus, which accounted for a quarter of the total, dropped 10% to ¥310.0 billion (down 1% to 35.0 million units).
2011 12 13 14 15 16 17 18 19 20 (C.Y.)
[¥ billion](10億円)
-60
-40
-20
0
40
20
60 (%)
0
1,000
2,000
3,000
4,000金額(左側)Value [left scale] 伸び率(右側)Growth [right scale]
1,2491,300
1,121989 989
857 820 764 679 569
▲ 18.3
4.1
▲ 13.7▲ 11.8
▲ 0.0
▲ 13.3
▲ 4.3 ▲ 6.8▲ 11.1
▲ 16.3
2011 12 13 14 15 16 17 18 19 20 (C.Y.)
[¥ billion](10億円)
-50
-25
0
25
50(%)
0
1,000
2,000
3,000
4,000金額(左側)Value [left scale] 伸び率(右側)Growth [right scale]
1,453
1,109
1,186 1,232 1,2211,089 1,212
1,369 1,276 1,268
▲ 10.7
▲ 23.7
6.94.0
▲ 0.9▲ 10.8
11.34.6 7.9
▲ 6.8
Total¥1,276billion
映像記録・再生機器
Video Recording orReproduction
Apparatus31124%
アンプ・スピーカー・マイク
Amplifiers,Loudspeakers &
Microphones24619%
音響・映像機器の部分品Parts of Audio, Visual Apparatus
161%
その他Others
64851%
ラジオRadio-Broadcast
Receivers554%
映像記録・再生機器Video
Recording orReproduction
Apparatus25845%
映像機器Visual
Apparatus33960%
テレビ受像機TV Receivers
8114%
アンプ・スピーカー・マイクAmplifiers,
Loudspeakers & Microphones285%
ラジオRadio-
BroadcastReceivers
81%
音響機器Audio
Apparatus407%
音響・映像機器の部分品
Parts of Audio,Visual Apparatus
18933% Total
¥569billion
■2020 音響・映像機器(含部品)の輸出 Audio & Visual Apparatus Exports●輸出商品内訳 Exports, by Product ●輸入商品内訳 Imports, by Product●輸出上位相手国 Top Countries by Value of Exports ●輸入上位相手国 Top Countries by Value of Imports
●金額と伸び率の推移 Value and Growth ●金額と伸び率の推移 Value and Growth
■2020 音響・映像機器(含部品)の輸入 Audio & Visual Apparatus Imports
9.音響・映像機器:輸出は8年連続の減少、輸入は4年ぶりの減少
◆ 音響・映像機器(含部品)の輸出は、5,700億円(前年比▲16%)と8年連続で減少した。映像機器は3,400億円(同▲16%)、うち映像記録・再生機器(DVDやVTR機器類)は860万台(同▲12%)、2,600億円(同▲14%)となった。テレビは390万台(同▲23%)、810億円(同▲23%)となった。音響・映像機器の部分品は1,900億円(同▲17%)、音響機器は400億円(同▲11%)となった。
◆ 音響・映像機器(含部品)の輸入は、1.3兆円(同▲7%)と4年ぶりに減少した。アジアからは1.1兆円(同▲3%)、うち中国からは7,600億円(同+4%)となった。4分の1を占める映像記録・再生機器は3,500万台(同▲1%)、3,100億円(同▲10%)となった。
66 67
Source: 財務省貿易統計より作成。 Compiled from MOF's Trade Statistics on a Customs-cleared Basis.
Main Chapter▶III.Trade by Major Commodity本論編▶III.主要商品別貿易
相手国 Partners
金額Value
(10億円)[¥ billion]
伸率Growth(%)
寄与度Contribution
degree(%)
中国China
755(729) 3.6 1.9
タイThailand
94(128) ▲ 26.2 ▲ 2.5
マレーシアMalaysia
94(96) ▲ 2.4 ▲ 0.2
米国USA
82(117) ▲ 30.0 ▲ 2.6
台湾Taiwan
41(49) ▲ 16.4 ▲ 0.6
上位5ヵ国 合計Top 5 total 1,066 ー ▲ 3.8
全品目 合計Grand total
1,276(1,369) ▲ 6.8 ▲ 6.8
注:( )内の数字は2019年の金額。Note: Figures in ( ) are value in 2019.
相手国 Partners
金額Value
(10億円)[¥ billion]
伸率Growth(%)
寄与度Contribution
degree(%)
米国USA
165(201) ▲ 18.2 ▲ 5.4
中国China
147(167) ▲ 11.8 ▲ 2.9
オランダNetherlands
39(38) 1.6 0.1
香港Hong Kong
26(33) ▲ 22.1 ▲ 1.1
メキシコMexico
21(21) 1.6 0.0
上位5ヵ国 合計Top 5 total 397 ー ▲ 9.2
全品目 合計Grand total
569(679) ▲ 16.3 ▲ 16.3
注:( )内の数字は2019年の金額。Note: Figures in ( ) are value in 2019.

10. Telephony, Telegraphy: Exports down for third consecutive year, imports flat
◆ Exports of Telephony, Telegraphy decreased for the third consecutive year, dropping 16% to ¥380.0 billion. By area and country, exports to Asia, which accounted for nearly 60% of the total, went down 5% to ¥210.0 billion with declined exports to China (down 3% to ¥84.0 billion) and Thailand (down 39% to ¥16.0 billion). Exports to USA dropped 22% to ¥84.0 billion.
◆ Imports of Telephony, Telegraphy were flat from a year earlier at ¥2.8 trillion. Among these, imports of Telephone Sets went down 5% to ¥1.6 trillion (up 4% to 35.0 million units). By area and country, imports from Asia, which accounted for over 90% of the total, increased 1% to ¥2.6 trillion. Imports from China, which accounted for around 75% of the total imports from Asia, fell 3% to ¥1.9 trillion. Imports from Korea grew 12% to ¥47.0 billion. Imports from USA dropped 15% to ¥77.0 billion and imports from EU went up 9% to ¥75.0 billion.
2011 12 13 14 15 16 17 18 19 20 (C.Y.)
[¥ billion](10億円)
-60
-20
-40
0
40
20
60 (%)
0
1,000
500
1,500
2,000
3,000
2,500
金額(左側)Value [left scale] 伸び率(右側)Growth [right scale]
518 471 531 621723
617 713579
447 377
▲ 15.3▲ 9.1
12.716.8 16.5
▲ 14.7
15.6
▲ 18.8 ▲ 22.8▲ 15.7
2011 12 13 14 15 16 17 18 19 20 (C.Y.)
[¥ billion](10億円)
-60
-20
-40
0
20
60
40
(%)
0
2,000
4,000
8,000
6,000
10,000金額(左側)Value [left scale] 伸び率(右側)Growth [right scale]
1,5762,149
2,679 2,865 2,933 2,7223,109 3,087 2,846 2,849
25.8
36.3
24.7
7.02.4
▲ 7.2
14.2
▲ 0.7▲ 7.8
0.1
Total¥2,849billion
中国China1,95068%
アジアAsia
2,62992%
ベトナムViet Nam
2198%
タイThailand
1836%
マレーシアMalaysia
973%
台湾Taiwan
753%
米国USA773%
EU753%
メキシコMexico
522%
Total¥377billion
中国China 84
22% ベトナムViet Nam
287%
台湾Taiwan
267%アジア
Asia21457% 香港
Hong Kong246%
米国USA84
22%
ドイツGermany
154% EU
4913%
その他Others
298%
■2020 通信機の輸出 Telephony, Telegraphy Exports●輸出国・地域内訳 Exports, by Area/Country ●輸入国・地域内訳 Imports, by Area/Country●輸出上位相手国 Top Countries by Value of Exports ●輸入上位相手国 Top Countries by Value of Imports
●金額と伸び率の推移 Value and Growth ●金額と伸び率の推移 Value and Growth
■2020 通信機の輸入 Telephony, Telegraphy Imports
10.通信機:輸出は3年連続の減少、輸入は横ばい
◆ 通信機の輸出は、3,800億円(前年比▲16%)と3年連続で減少した。6割弱を占めるアジア向けは2,100億円(同▲5%)、うち中国向けは840億円(同▲3%)、タイ向けは160億円(同▲39%)となった。米国向けは、840億円(同▲22%)となった。
◆ 通信機の輸入は、2.8兆円(同横ばい)となった。うち電話機は3,500万台(同+4%)、1.6兆円(同▲5%)となった。地域別では、9割強を占めるアジアからは2.6兆円(同+1%)、うち7割台半ばを占める中国からは1.9兆円(同▲3%)、韓国からは470億円(同+12%)となった。米国からは770億円(同▲15%)、EUからは750億円(同+9%)となった。
68 69
Source: 財務省貿易統計より作成。 Compiled from MOF's Trade Statistics on a Customs-cleared Basis.
Main Chapter▶III.Trade by Major Commodity本論編▶III.主要商品別貿易
相手国 Partners
金額Value
(10億円)[¥ billion]
伸率Growth(%)
寄与度Contribution
degree(%)
中国China
1,950(2,017) ▲ 3.3 ▲ 2.4
ベトナムViet Nam
219(162) 35.2 2.0
タイThailand
183(183) 0.1 0.0
マレーシアMalaysia
97(83) 16.8 0.5
米国USA
77(90) ▲ 14.9 ▲ 0.5
上位5ヵ国 合計Top 5 total 2,526 ー ▲ 0.3
全品目 合計Grand total
2,849(2,846) 0.1 0.1
注:( )内の数字は2019年の金額。Note: Figures in ( ) are value in 2019.
相手国 Partners
金額Value
(10億円)[¥ billion]
伸率Growth(%)
寄与度Contribution
degree(%)
米国USA
84(108) ▲ 22.1 ▲ 5.4
中国China
84(87) ▲ 3.1 ▲ 0.6
ベトナムViet Nam
28(26) 7.0 0.4
台湾Taiwan
26(12) 121.7 3.3
香港Hong Kong
24(28) ▲ 11.4 ▲ 0.7
上位5ヵ国 合計Top 5 total 247 ー ▲ 3.0
全品目 合計Grand total
377(447) ▲ 15.7 ▲ 15.7
注:( )内の数字は2019年の金額。Note: Figures in ( ) are value in 2019.

11. Motor Vehicles: Both exports and imports down for second consecutive year
◆ Motor Vehicles exports decreased for the second consecutive year, falling 20% to ¥9.6 trillion (down 21% to 4.84 million units). Among these, exports of Passenger Motor Car went down 19% to ¥8.6 trillion (down 21% to 4.28 million units). Exports of Buses & Trucks fell 26% to ¥900.0 billion (down 22% to 510,000 units). By area and country, exports to USA dropped 19% to ¥3.5 trillion (down 20% to 1.4 million units). Exports to Asia decreased 9% to ¥1.8 trillion (down 16% to 800,000 units) despite increased exports to China (up 16% to ¥910.0 billion, up 14% to 290,000 units). Exports to Middle East fell 31% to ¥980.0 billion (down 28% to 460,000 units). Exports to EU dropped 27% to ¥940.0 billion (down 29% to 470,000 units). Exports of Parts of Motor Vehicles went down 19% to ¥2.9 trillion.
◆ Motor Vehicles imports declined for the second consecutive year, falling 17% to ¥1.2 trillion (down 15% to 310,000 units). Imports from EU went down 23% to ¥760.0 billion (down 23% to 180,000 units). Imports from USA dropped 16% to ¥110.0 billion (down 27% to 21,000 units). In contrast, imports from Asia increased 86% to ¥130.0 billion (up 62% to 69,000 units). Imports of Parts of Motor Vehicles went down 24% to ¥670.0 billion.
2011 12 13 14 15 16 17 18 19 20 (C.Y.)
[¥ billion](10億円)
(%)
金額(左側)Value [left scale] 伸び率(右側)Growth [right scale]
8,204 9,225 10,413 10,919 12,046 11,333 11,825 12,307 11,9719,580
▲ 10.6
12.4 12.94.9
10.3
▲ 5.9
4.3 4.1
▲ 2.7 ▲ 20.0
-60
-20
-40
0
40
20
60
0
20,000
10,000
30,000
40,000
2011 12 13 14 15 16 17 18 19 20 (C.Y.)
[¥ billion](10億円)
(%)
金額(左側)Value [left scale] 伸び率(右側)Growth [right scale]
-60
-20
-40
0
40
20
60
0
2,000
1,000
4,000
3,000
5,000
735908
1,086 1,162 1,140 1,178 1,307 1,428 1,408 1,165
23.4 23.519.5
7.1
▲ 1.9
3.410.9 9.3
▲ 1.4 ▲ 17.3
米国USA11210%
ドイツGermany
36932%
EU75965%
イタリアItaly847%オーストリア
Austria635%
ハンガリーHungary
444%
南アフリカ共和国South Africa
363%
その他Others
12811%
アジアAsia13111%
タイThailand
1039%
Total¥1,165billion
中国China91111% アジア
Asia1,75120%
米国USA
3,46740%
北米North America
3,76244%
カナダCanada
2953%
大洋州Oceania
86210%
オーストラリアAustralia
7218%
中南米CentralSouth
America3824%
ロシアRussia2633%
アラブ首長国連邦
UAE2813%
サウジアラビアSaudi Arabia
2603%
中東Middle East
98211%
その他Others
6367%
Total¥9,580billion
■2020 自動車の輸出 Motor Vehicles Exports●輸出国・地域内訳 Exports, by Area/Country ●輸入国・地域内訳 Imports, by Area/Country●輸出上位相手国 Top Countries by Value of Exports ●輸入上位相手国 Top Countries by Value of Imports
●金額と伸び率の推移 Value and Growth ●金額と伸び率の推移 Value and Growth
■2020 自動車の輸入 Motor Vehicles Imports
11.自動車:輸出入とも2年連続の減少
◆ 自動車の輸出は、484万台(前年比▲21%)、9.6兆円(同▲20%)と2年連続で減少した。うち乗用車は428万台(同▲21%)、8.6兆円(同▲19%)、バス・トラックは51万台(同▲22%)、9,000億円(同▲26%)となった。地域別では、米国向けは140万台(同▲20%)、3.5兆円(同▲19%)、アジア向けは80万台(同▲16%)、1.8兆円(同▲9%)、うち中国向けは29万台(同+14%)、9,100億円(同+16%)となった。中東向けは46万台(同▲28%)、9,800億円(同▲31%)、EU向けは47万台(同▲29%)、9,400億円(同▲27%)となった。自動車の部分品は2.9兆円(同▲19%)となった。
◆ 自動車の輸入は、31万台(同▲15%)、1.2兆円(同▲17%)と2年連続で減少した。EUからは18万台(同▲23%)、7,600億円(同▲23%)、米国からは2.1万台(同▲27%)、1,100億円(同▲16%)と減少した。一方、アジアからは6.9万台(同+62%)、1,300億円(同+86%)と増加した。自動車の部分品は6,700億円(同▲24%)となった。
70 71
Source: 財務省貿易統計より作成。 Compiled from MOF's Trade Statistics on a Customs-cleared Basis.
Main Chapter▶III.Trade by Major Commodity本論編▶III.主要商品別貿易
相手国 Partners
金額Value
(10億円)[¥ billion]
伸率Growth(%)
寄与度Contribution
degree(%)
ドイツGermany
369(615) ▲ 40.1 ▲ 17.5
米国USA
112(133) ▲ 16.0 ▲ 1.5
タイThailand
103(36) 186.1 4.8
英国UK
101(148) ▲ 31.7 ▲ 3.3
イタリアItary
84(85) ▲ 1.6 ▲ 0.1
上位5ヵ国 合計Top 5 total 768 ー ▲ 17.7
全品目 合計Grand total
1,165(1,408) ▲ 17.3 ▲ 17.3
注:( )内の数字は2019年の金額。Note: Figures in ( ) are value in 2019.
相手国 Partners
金額Value
(10億円)[¥ billion]
伸率Growth(%)
寄与度Contribution
degree(%)
米国USA
3,467(4,289) ▲ 19.2 ▲ 6.9
中国China
911(787) 15.8 1.0
オーストラリアAustralia
721(704) 2.4 0.1
カナダCanada
295(375) ▲ 21.3 ▲ 0.7
アラブ首長国連邦UAE
281(425) ▲ 33.8 ▲ 1.2
上位5ヵ国 合計Top 5 total 5,675 ー ▲ 7.6
全品目 合計Grand total
9,580(11,971) ▲ 20.0 ▲ 20.0
注:( )内の数字は2019年の金額。Note: Figures in ( ) are value in 2019.
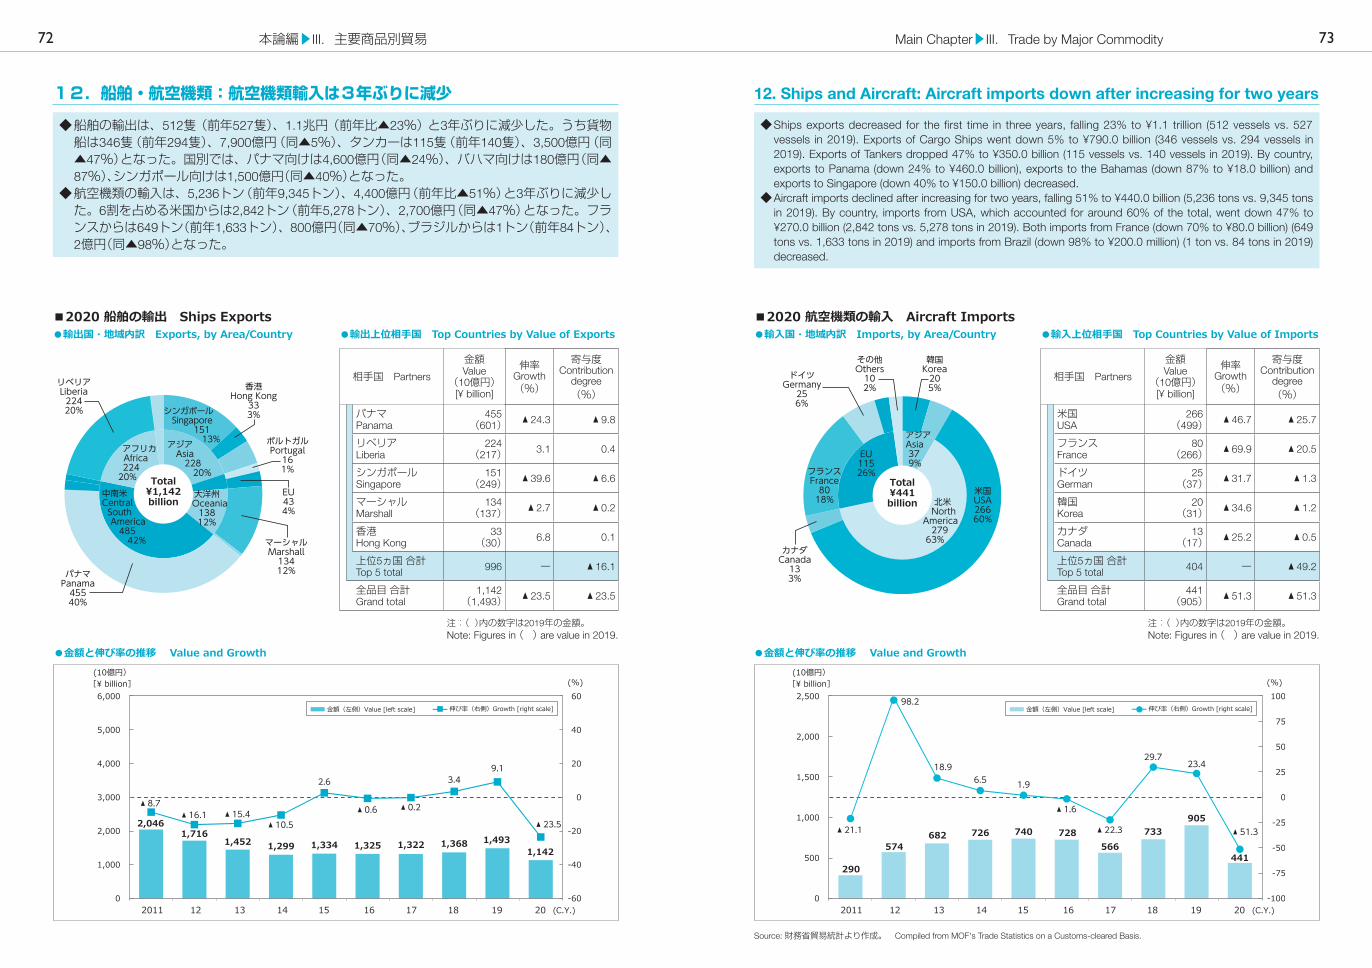
12. Ships and Aircraft: Aircraft imports down after increasing for two years
◆ Ships exports decreased for the first time in three years, falling 23% to ¥1.1 trillion (512 vessels vs. 527 vessels in 2019). Exports of Cargo Ships went down 5% to ¥790.0 billion (346 vessels vs. 294 vessels in 2019). Exports of Tankers dropped 47% to ¥350.0 billion (115 vessels vs. 140 vessels in 2019). By country, exports to Panama (down 24% to ¥460.0 billion), exports to the Bahamas (down 87% to ¥18.0 billion) and exports to Singapore (down 40% to ¥150.0 billion) decreased.
◆ Aircraft imports declined after increasing for two years, falling 51% to ¥440.0 billion (5,236 tons vs. 9,345 tons in 2019). By country, imports from USA, which accounted for around 60% of the total, went down 47% to ¥270.0 billion (2,842 tons vs. 5,278 tons in 2019). Both imports from France (down 70% to ¥80.0 billion) (649 tons vs. 1,633 tons in 2019) and imports from Brazil (down 98% to ¥200.0 million) (1 ton vs. 84 tons in 2019) decreased.
金額(左側)Value [left scale] 伸び率(右側)Growth [right scale]
2011 12 13 14 15 16 17 18 19 20 (C.Y.)
[¥ billion](10億円)
-60
-20
-40
0
60
40
20
(%)
0
1,000
3,000
2,000
6,000
5,000
4,000
2,0461,716
1,452 1,299 1,334 1,325 1,322 1,368 1,493 1,142
▲ 8.7▲ 16.1 ▲ 15.4
▲ 10.5
2.6
▲ 0.6 ▲ 0.2
3.49.1
▲ 23.5
2011 12 13 14 15 16 17 18 19 20 (C.Y.)
[¥ billion](10億円)
-100
-75
-50
50
25
0
-25
75
100(%)
0
1,000
500
1,500
2,000
2,500金額(左側)Value [left scale] 伸び率(右側)Growth [right scale]
290
574682 726 740 728
566733
905
441
▲ 21.1
98.2
18.96.5 1.9
▲ 1.6
▲ 22.3
29.723.4
▲ 51.3
アジアAsia 37 9%
米国USA26660%
韓国Korea
205%
北米 NorthAmerica 279 63%
カナダCanada
133%
フランスFrance
8018%
EU11526%
ドイツGermany
256%
その他Others
102%
Total¥441billion
リベリアLiberia22420% シンガポール
Singapore 151 13%アジア Asia 228 20%
香港Hong Kong
333%
ポルトガルPortugal
161%
EU434%
マーシャルMarshall
13412%
大洋州 Oceania
13812%
パナマPanama
45540%
中南米Central South America 485 42%
アフリカAfrica 224
20% Total¥1,142billion
■2020 船舶の輸出 Ships Exports●輸出国・地域内訳 Exports, by Area/Country ●輸入国・地域内訳 Imports, by Area/Country●輸出上位相手国 Top Countries by Value of Exports ●輸入上位相手国 Top Countries by Value of Imports
●金額と伸び率の推移 Value and Growth ●金額と伸び率の推移 Value and Growth
■2020 航空機類の輸入 Aircraft Imports
12.船舶・航空機類:航空機類輸入は3年ぶりに減少
◆ 船舶の輸出は、512隻(前年527隻)、1.1兆円(前年比▲23%)と3年ぶりに減少した。うち貨物船は346隻(前年294隻)、7,900億円(同▲5%)、タンカーは115隻(前年140隻)、3,500億円(同▲47%)となった。国別では、パナマ向けは4,600億円(同▲24%)、バハマ向けは180億円(同▲87%)、シンガポール向けは1,500億円(同▲40%)となった。
◆ 航空機類の輸入は、5,236トン(前年9,345トン)、4,400億円(前年比▲51%)と3年ぶりに減少した。6割を占める米国からは2,842トン(前年5,278トン)、2,700億円(同▲47%)となった。フランスからは649トン(前年1,633トン)、800億円(同▲70%)、ブラジルからは1トン(前年84トン)、2億円(同▲98%)となった。
72 73
Source: 財務省貿易統計より作成。 Compiled from MOF's Trade Statistics on a Customs-cleared Basis.
Main Chapter▶III.Trade by Major Commodity本論編▶III.主要商品別貿易
相手国 Partners
金額Value
(10億円)[¥ billion]
伸率Growth(%)
寄与度Contribution
degree(%)
米国USA
266(499) ▲ 46.7 ▲ 25.7
フランスFrance
80(266) ▲ 69.9 ▲ 20.5
ドイツGerman
25(37) ▲ 31.7 ▲ 1.3
韓国Korea
20(31) ▲ 34.6 ▲ 1.2
カナダCanada
13(17) ▲ 25.2 ▲ 0.5
上位5ヵ国 合計Top 5 total 404 ー ▲ 49.2
全品目 合計Grand total
441(905) ▲ 51.3 ▲ 51.3
注:( )内の数字は2019年の金額。Note: Figures in ( ) are value in 2019.
相手国 Partners
金額Value
(10億円)[¥ billion]
伸率Growth(%)
寄与度Contribution
degree(%)
パナマPanama
455(601) ▲ 24.3 ▲ 9.8
リベリアLiberia
224(217) 3.1 0.4
シンガポールSingapore
151(249) ▲ 39.6 ▲ 6.6
マーシャルMarshall
134(137) ▲ 2.7 ▲ 0.2
香港Hong Kong
33(30) 6.8 0.1
上位5ヵ国 合計Top 5 total 996 ー ▲ 16.1
全品目 合計Grand total
1,142(1,493) ▲ 23.5 ▲ 23.5
注:( )内の数字は2019年の金額。Note: Figures in ( ) are value in 2019.
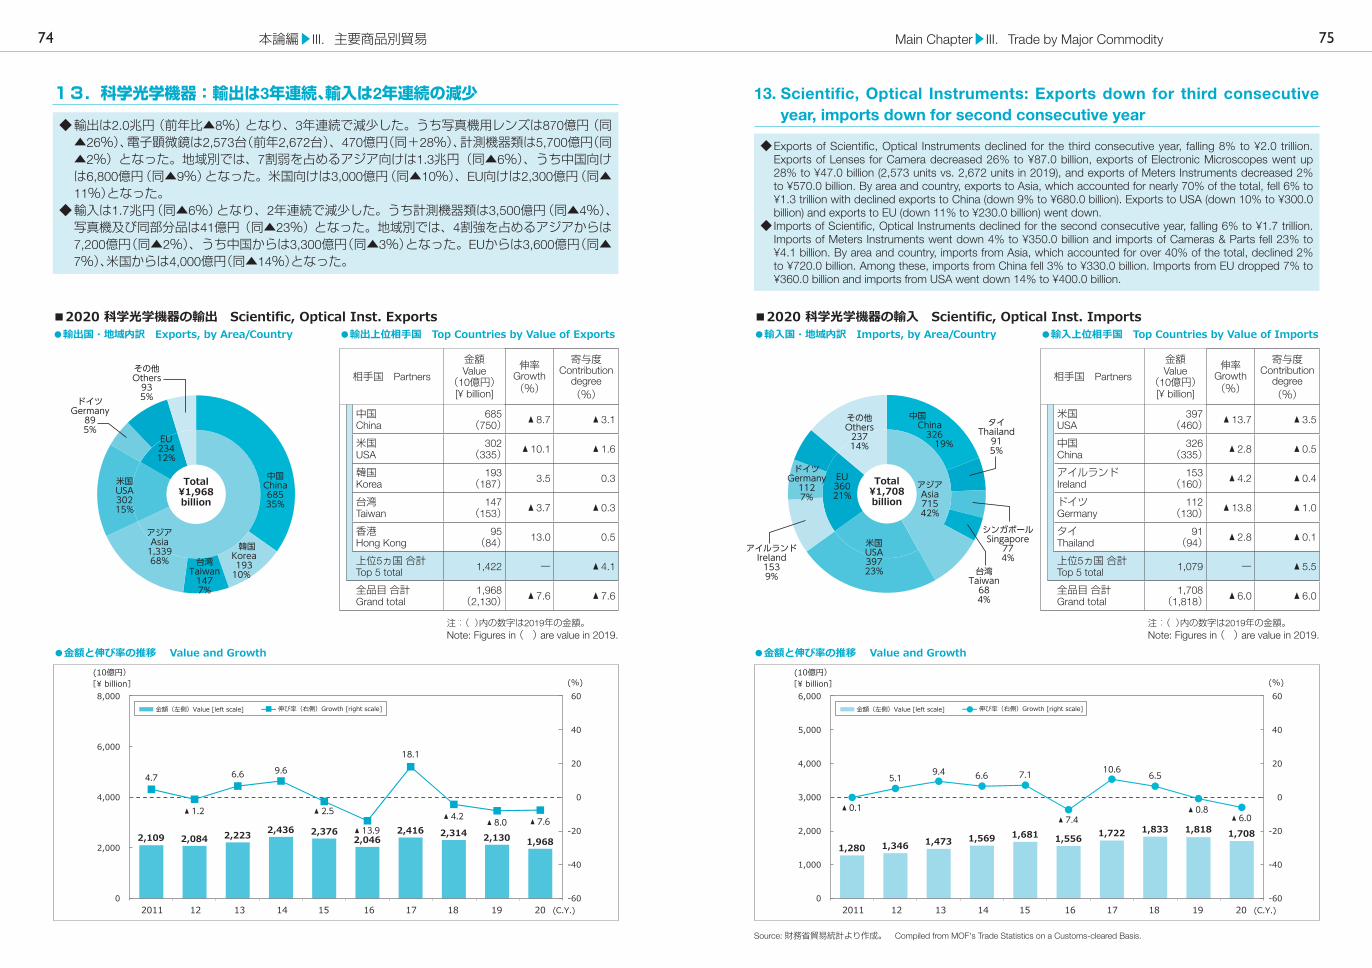
13. Scientific, Optical Instruments: Exports down for third consecutive year, imports down for second consecutive year
◆ Exports of Scientific, Optical Instruments declined for the third consecutive year, falling 8% to ¥2.0 trillion. Exports of Lenses for Camera decreased 26% to ¥87.0 billion, exports of Electronic Microscopes went up 28% to ¥47.0 billion (2,573 units vs. 2,672 units in 2019), and exports of Meters Instruments decreased 2% to ¥570.0 billion. By area and country, exports to Asia, which accounted for nearly 70% of the total, fell 6% to ¥1.3 trillion with declined exports to China (down 9% to ¥680.0 billion). Exports to USA (down 10% to ¥300.0 billion) and exports to EU (down 11% to ¥230.0 billion) went down.
◆ Imports of Scientific, Optical Instruments declined for the second consecutive year, falling 6% to ¥1.7 trillion. Imports of Meters Instruments went down 4% to ¥350.0 billion and imports of Cameras & Parts fell 23% to ¥4.1 billion. By area and country, imports from Asia, which accounted for over 40% of the total, declined 2% to ¥720.0 billion. Among these, imports from China fell 3% to ¥330.0 billion. Imports from EU dropped 7% to ¥360.0 billion and imports from USA went down 14% to ¥400.0 billion.
金額(左側)Value [left scale] 伸び率(右側)Growth [right scale]
2011 12 13 14 15 16 17 18 19 20 (C.Y.)
[¥ billion](10億円)
-60
-20
-40
0
40
20
60(%)
0
4,000
2,000
6,000
8,000
2,109 2,084 2,223 2,436 2,3762,046
2,416 2,314 2,130 1,968
4.7
▲ 1.2
6.6 9.6
▲ 2.5
▲ 13.9
18.1
▲ 4.2 ▲ 8.0 ▲ 7.6
-60
-20
-40
0
40
20
60
0
3,000
2,000
1,000
5,000
4,000
6,000
2011 12 13 14 15 16 17 18 19 20 (C.Y.)
[¥ billion](10億円)
(%)
金額(左側)Value [left scale] 伸び率(右側)Growth [right scale]
1,280 1,346 1,473 1,569 1,681 1,556 1,722 1,833 1,818 1,708
▲ 0.1
5.19.4 6.6 7.1
▲ 7.4
10.6 6.5
▲ 0.8▲ 6.0
中国 China 326 19%
アジアAsia71542%
タイThailand915%
シンガポールSingapore774%
台湾Taiwan684%
米国USA39723%
アイルランドIreland1539%
EU36021%
ドイツGermany1127%
その他Others23714%
Total¥1,708billion
中国China68535%
アジアAsia
1,33968%
韓国Korea193
10% 台湾
Taiwan1477%
米国USA30215%
EU23412%
ドイツGermany
895%
その他Others
935%
Total¥1,968billion
■2020 科学光学機器の輸出 Scientific, Optical Inst. Exports●輸出国・地域内訳 Exports, by Area/Country ●輸入国・地域内訳 Imports, by Area/Country●輸出上位相手国 Top Countries by Value of Exports ●輸入上位相手国 Top Countries by Value of Imports
●金額と伸び率の推移 Value and Growth ●金額と伸び率の推移 Value and Growth
■2020 科学光学機器の輸入 Scientific, Optical Inst. Imports
13.科学光学機器:輸出は3年連続、輸入は2年連続の減少
◆ 輸出は2.0兆円(前年比▲8%)となり、3年連続で減少した。うち写真機用レンズは870億円(同▲26%)、電子顕微鏡は2,573台(前年2,672台)、470億円(同+28%)、計測機器類は5,700億円(同▲2%)となった。地域別では、7割弱を占めるアジア向けは1.3兆円(同▲6%)、うち中国向けは6,800億円(同▲9%)となった。米国向けは3,000億円(同▲10%)、EU向けは2,300億円(同▲11%)となった。
◆ 輸入は1.7兆円(同▲6%)となり、2年連続で減少した。うち計測機器類は3,500億円(同▲4%)、写真機及び同部分品は41億円(同▲23%)となった。地域別では、4割強を占めるアジアからは7,200億円(同▲2%)、うち中国からは3,300億円(同▲3%)となった。EUからは3,600億円(同▲7%)、米国からは4,000億円(同▲14%)となった。
74 75
Source: 財務省貿易統計より作成。 Compiled from MOF's Trade Statistics on a Customs-cleared Basis.
Main Chapter▶III.Trade by Major Commodity本論編▶III.主要商品別貿易
相手国 Partners
金額Value
(10億円)[¥ billion]
伸率Growth(%)
寄与度Contribution
degree(%)
米国USA
397(460) ▲ 13.7 ▲ 3.5
中国China
326(335) ▲ 2.8 ▲ 0.5
アイルランドIreland
153(160) ▲ 4.2 ▲ 0.4
ドイツGermany
112(130) ▲ 13.8 ▲ 1.0
タイThailand
91(94) ▲ 2.8 ▲ 0.1
上位5ヵ国 合計Top 5 total 1,079 ー ▲ 5.5
全品目 合計Grand total
1,708(1,818) ▲ 6.0 ▲ 6.0
注:( )内の数字は2019年の金額。Note: Figures in ( ) are value in 2019.
相手国 Partners
金額Value
(10億円)[¥ billion]
伸率Growth(%)
寄与度Contribution
degree(%)
中国China
685(750) ▲ 8.7 ▲ 3.1
米国USA
302(335) ▲ 10.1 ▲ 1.6
韓国Korea
193(187) 3.5 0.3
台湾Taiwan
147(153) ▲ 3.7 ▲ 0.3
香港Hong Kong
95(84) 13.0 0.5
上位5ヵ国 合計Top 5 total 1,422 ー ▲ 4.1
全品目 合計Grand total
1,968(2,130) ▲ 7.6 ▲ 7.6
注:( )内の数字は2019年の金額。Note: Figures in ( ) are value in 2019.

資 料 編Data Chapter
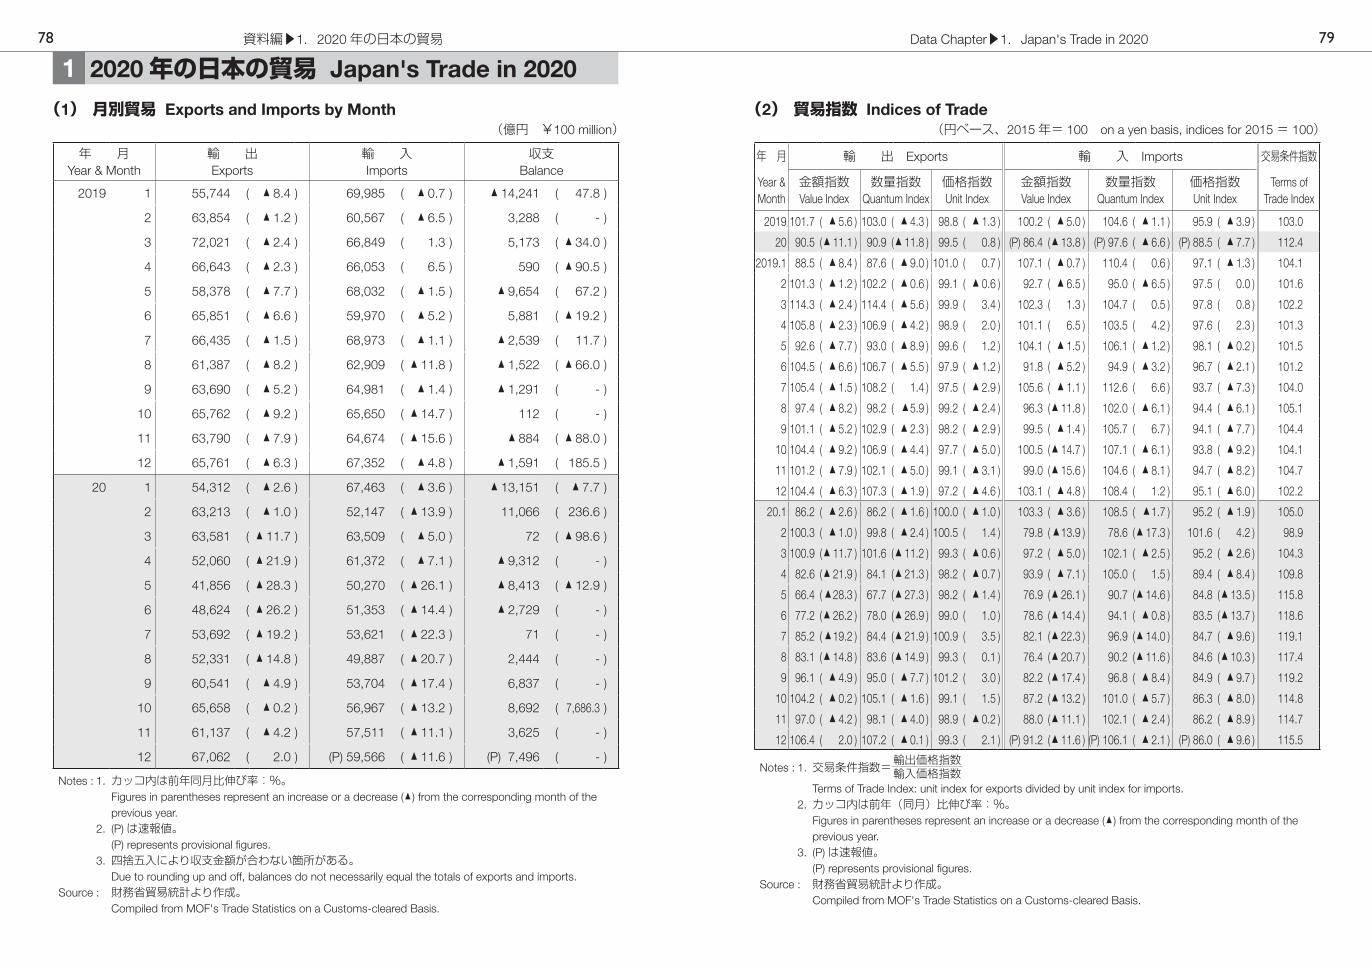
(1) 月別貿易 Exports and Imports by Month
1 2020年の日本の貿易 Japan's Trade in 2020
(2) 貿易指数 Indices of Trade(円ベース、2015年= 100 on a yen basis, indices for 2015= 100)(億円 ¥100 million)
年 月Year & Month
輸 出Exports
輸 入Imports
収支Balance
2019 1 55,744 ( ▲ 8.4 ) 69,985 ( ▲ 0.7 ) ▲ 14,241 ( 47.8 )
2 63,854 ( ▲ 1.2 ) 60,567 ( ▲ 6.5 ) 3,288 ( - )
3 72,021 ( ▲ 2.4 ) 66,849 ( 1.3 ) 5,173 ( ▲ 34.0 )
4 66,643 ( ▲ 2.3 ) 66,053 ( 6.5 ) 590 ( ▲ 90.5 )
5 58,378 ( ▲ 7.7 ) 68,032 ( ▲ 1.5 ) ▲ 9,654 ( 67.2 )
6 65,851 ( ▲ 6.6 ) 59,970 ( ▲ 5.2 ) 5,881 ( ▲ 19.2 )
7 66,435 ( ▲ 1.5 ) 68,973 ( ▲ 1.1 ) ▲ 2,539 ( 11.7 )
8 61,387 ( ▲ 8.2 ) 62,909 ( ▲ 11.8 ) ▲ 1,522 ( ▲ 66.0 )
9 63,690 ( ▲ 5.2 ) 64,981 ( ▲ 1.4 ) ▲ 1,291 ( - )
10 65,762 ( ▲ 9.2 ) 65,650 ( ▲ 14.7 ) 112 ( - )
11 63,790 ( ▲ 7.9 ) 64,674 ( ▲ 15.6 ) ▲ 884 ( ▲ 88.0 )
12 65,761 ( ▲ 6.3 ) 67,352 ( ▲ 4.8 ) ▲ 1,591 ( 185.5 )
20 1 54,312 ( ▲ 2.6 ) 67,463 ( ▲ 3.6 ) ▲ 13,151 ( ▲ 7.7 )
2 63,213 ( ▲ 1.0 ) 52,147 ( ▲ 13.9 ) 11,066 ( 236.6 )
3 63,581 ( ▲ 11.7 ) 63,509 ( ▲ 5.0 ) 72 ( ▲ 98.6 )
4 52,060 ( ▲ 21.9 ) 61,372 ( ▲ 7.1 ) ▲ 9,312 ( - )
5 41,856 ( ▲ 28.3 ) 50,270 ( ▲ 26.1 ) ▲ 8,413 ( ▲ 12.9 )
6 48,624 ( ▲ 26.2 ) 51,353 ( ▲ 14.4 ) ▲ 2,729 ( - )
7 53,692 ( ▲ 19.2 ) 53,621 ( ▲ 22.3 ) 71 ( - )
8 52,331 ( ▲ 14.8 ) 49,887 ( ▲ 20.7 ) 2,444 ( - )
9 60,541 ( ▲ 4.9 ) 53,704 ( ▲ 17.4 ) 6,837 ( - )
10 65,658 ( ▲ 0.2 ) 56,967 ( ▲ 13.2 ) 8,692 ( 7,686.3 )
11 61,137 ( ▲ 4.2 ) 57,511 ( ▲ 11.1 ) 3,625 ( - )
12 67,062 ( 2.0 ) (P) 59,566 ( ▲ 11.6 ) (P) 7,496 ( - )
Notes : 1. カッコ内は前年同月比伸び率:%。 Figures in parentheses represent an increase or a decrease (▲ ) from the corresponding month of the
previous year. 2. (P)は速報値。 (P) represents provisional figures. 3. 四捨五入により収支金額が合わない箇所がある。 Due to rounding up and off, balances do not necessarily equal the totals of exports and imports.Source : 財務省貿易統計より作成。 Compiled from MOF's Trade Statistics on a Customs-cleared Basis.
年 月 輸 出 Exports 輸 入 Imports 交易条件指数
Year & Month
金額指数Value Index
数量指数Quantum Index
価格指数Unit Index
金額指数Value Index
数量指数Quantum Index
価格指数Unit Index
Terms of Trade Index
2019 101.7 ( ▲ 5.6 ) 103.0 ( ▲ 4.3 ) 98.8 ( ▲ 1.3 ) 100.2 ( ▲ 5.0 ) 104.6 ( ▲ 1.1 ) 95.9 ( ▲ 3.9 ) 103.0
20 90.5 (▲ 11.1 ) 90.9 (▲ 11.8 ) 99.5 ( 0.8 ) (P) 86.4 (▲ 13.8 ) (P) 97.6 ( ▲ 6.6 ) (P) 88.5 ( ▲ 7.7 ) 112.4
2019.1 88.5 ( ▲ 8.4 ) 87.6 ( ▲ 9.0 ) 101.0 ( 0.7 ) 107.1 ( ▲ 0.7 ) 110.4 ( 0.6 ) 97.1 ( ▲ 1.3 ) 104.1
2 101.3 ( ▲ 1.2 ) 102.2 ( ▲ 0.6 ) 99.1 ( ▲ 0.6 ) 92.7 ( ▲ 6.5 ) 95.0 ( ▲ 6.5 ) 97.5 ( 0.0 ) 101.6
3 114.3 ( ▲ 2.4 ) 114.4 ( ▲ 5.6 ) 99.9 ( 3.4 ) 102.3 ( 1.3 ) 104.7 ( 0.5 ) 97.8 ( 0.8 ) 102.2
4 105.8 ( ▲ 2.3 ) 106.9 ( ▲ 4.2 ) 98.9 ( 2.0 ) 101.1 ( 6.5 ) 103.5 ( 4.2 ) 97.6 ( 2.3 ) 101.3
5 92.6 ( ▲ 7.7 ) 93.0 ( ▲ 8.9 ) 99.6 ( 1.2 ) 104.1 ( ▲ 1.5 ) 106.1 ( ▲ 1.2 ) 98.1 ( ▲ 0.2 ) 101.5
6 104.5 ( ▲ 6.6 ) 106.7 ( ▲ 5.5 ) 97.9 ( ▲ 1.2 ) 91.8 ( ▲ 5.2 ) 94.9 ( ▲ 3.2 ) 96.7 ( ▲ 2.1 ) 101.2
7 105.4 ( ▲ 1.5 ) 108.2 ( 1.4 ) 97.5 ( ▲ 2.9 ) 105.6 ( ▲ 1.1 ) 112.6 ( 6.6 ) 93.7 ( ▲ 7.3 ) 104.0
8 97.4 ( ▲ 8.2 ) 98.2 ( ▲5.9 ) 99.2 ( ▲ 2.4 ) 96.3 (▲ 11.8 ) 102.0 ( ▲ 6.1 ) 94.4 ( ▲ 6.1 ) 105.1
9 101.1 ( ▲ 5.2 ) 102.9 ( ▲ 2.3 ) 98.2 ( ▲ 2.9 ) 99.5 ( ▲ 1.4 ) 105.7 ( 6.7 ) 94.1 ( ▲ 7.7 ) 104.4
10 104.4 ( ▲ 9.2 ) 106.9 ( ▲ 4.4 ) 97.7 ( ▲ 5.0 ) 100.5 (▲ 14.7 ) 107.1 ( ▲ 6.1 ) 93.8 ( ▲ 9.2 ) 104.1
11 101.2 ( ▲ 7.9 ) 102.1 ( ▲ 5.0 ) 99.1 ( ▲ 3.1 ) 99.0 (▲ 15.6 ) 104.6 ( ▲ 8.1 ) 94.7 ( ▲ 8.2 ) 104.7
12 104.4 ( ▲ 6.3 ) 107.3 ( ▲ 1.9 ) 97.2 ( ▲ 4.6 ) 103.1 ( ▲ 4.8 ) 108.4 ( 1.2 ) 95.1 ( ▲ 6.0 ) 102.2
20.1 86.2 ( ▲ 2.6 ) 86.2 ( ▲ 1.6 ) 100.0 ( ▲ 1.0 ) 103.3 ( ▲ 3.6 ) 108.5 ( ▲ 1.7 ) 95.2 ( ▲ 1.9 ) 105.0
2 100.3 ( ▲ 1.0 ) 99.8 ( ▲ 2.4 ) 100.5 ( 1.4 ) 79.8 ( ▲13.9 ) 78.6 (▲ 17.3 ) 101.6 ( 4.2 ) 98.9
3 100.9 (▲ 11.7 ) 101.6 (▲ 11.2 ) 99.3 ( ▲ 0.6 ) 97.2 ( ▲ 5.0 ) 102.1 ( ▲ 2.5 ) 95.2 ( ▲ 2.6 ) 104.3
4 82.6 (▲ 21.9 ) 84.1 (▲ 21.3 ) 98.2 ( ▲ 0.7 ) 93.9 ( ▲ 7.1 ) 105.0 ( 1.5 ) 89.4 ( ▲ 8.4 ) 109.8
5 66.4 ( ▲28.3 ) 67.7 (▲ 27.3 ) 98.2 ( ▲ 1.4 ) 76.9 (▲ 26.1 ) 90.7 (▲ 14.6 ) 84.8 (▲ 13.5 ) 115.8
6 77.2 (▲ 26.2 ) 78.0 (▲ 26.9 ) 99.0 ( 1.0 ) 78.6 (▲ 14.4 ) 94.1 ( ▲ 0.8 ) 83.5 (▲ 13.7 ) 118.6
7 85.2 ( ▲19.2 ) 84.4 (▲ 21.9 ) 100.9 ( 3.5 ) 82.1 (▲ 22.3 ) 96.9 (▲ 14.0 ) 84.7 ( ▲ 9.6 ) 119.1
8 83.1 (▲ 14.8 ) 83.6 (▲ 14.9 ) 99.3 ( 0.1 ) 76.4 (▲ 20.7 ) 90.2 (▲ 11.6 ) 84.6 (▲ 10.3 ) 117.4
9 96.1 ( ▲ 4.9 ) 95.0 ( ▲ 7.7 ) 101.2 ( 3.0 ) 82.2 (▲ 17.4 ) 96.8 ( ▲ 8.4 ) 84.9 ( ▲ 9.7 ) 119.2
10 104.2 ( ▲ 0.2 ) 105.1 ( ▲ 1.6 ) 99.1 ( 1.5 ) 87.2 (▲ 13.2 ) 101.0 ( ▲ 5.7 ) 86.3 ( ▲ 8.0 ) 114.8
11 97.0 ( ▲ 4.2 ) 98.1 ( ▲ 4.0 ) 98.9 ( ▲ 0.2 ) 88.0 (▲ 11.1 ) 102.1 ( ▲ 2.4 ) 86.2 ( ▲ 8.9 ) 114.7
12 106.4 ( 2.0 ) 107.2 ( ▲ 0.1 ) 99.3 ( 2.1 ) (P) 91.2 (▲ 11.6 ) (P) 106.1 ( ▲ 2.1 ) (P) 86.0 ( ▲ 9.6 ) 115.5
Notes : 1. 交易条件指数=輸出価格指数輸入価格指数 Terms of Trade Index: unit index for exports divided by unit index for imports. 2. カッコ内は前年(同月)比伸び率:%。 Figures in parentheses represent an increase or a decrease (▲ ) from the corresponding month of the
previous year. 3. (P)は速報値。 (P) represents provisional figures.Source : 財務省貿易統計より作成。 Compiled from MOF's Trade Statistics on a Customs-cleared Basis.
資料編▶1.2020年の日本の貿易78 Data Chapter▶1.Japan's Trade in 2020 79

(3) 商品別輸出 Exports by Principal Commodity (4) 商品別輸入 Imports by Principal Commodity
品 名
Commodity
2019 2020
金額(億円)
前年比伸び率(%)
金額(億円)
前年比伸び率(%)
(¥100 million)Change from previous year
(¥100 million)Change from previous year
1 食料品 Foodstuff 7,543 1.8 7,907 4.82 原料品 Raw Materials 10,336 ▲ 10.6 10,203 ▲ 1.33 鉱物性燃料 Mineral Fuels 13,830 6.0 7,231 ▲ 47.74 化学製品 Chemicals 87,391 ▲ 2.0 85,398 ▲ 2.3有機化合物 Organic Chemicals 19,071 ▲ 7.0 15,556 ▲ 18.4医薬品 Medical Products 7,331 13.0 8,360 14.0プラスチック Plastic Materials 24,297 ▲ 5.0 24,199 ▲ 0.4
5 原料別製品 Manufactured Goods 84,070 ▲ 8.0 75,052 ▲ 10.7鉄鋼 Iron & Steel Products 30,740 ▲ 10.7 25,739 ▲ 16.3非鉄金属 Nonferrous Metals 13,684 ▲ 9.6 15,895 16.2金属製品 Manufactures of Metals 12,166 ▲ 6.6 10,422 ▲ 14.3織物用糸・繊維製品 Textile Yarn, Fabrics 7,049 ▲ 2.8 5,908 ▲ 16.2非金属鉱物製品 Non-metallic Mineral Ware 8,573 ▲ 4.7 7,300 ▲ 14.8ゴム製品 Rubber manufactured 8,825 ▲ 2.4 7,025 ▲ 20.4紙類・紙製品 Paper & Paper Manufactures 2,800 ▲ 14.3 2,576 ▲ 8.0
6 一般機械 Machinery 151,216 ▲ 8.4 131,421 ▲ 13.1原動機 Power Generating Machine 27,279 ▲ 7.5 21,692 ▲ 20.5電算機類(含周辺機器) Computers & Units 3,606 ▲ 4.0 3,054 ▲ 15.3電算機類の部分品 Parts of Computer 9,667 ▲ 8.9 8,682 ▲ 10.2半導体等製造装置 Semicon Machinery etc. 24,670 ▲ 9.6 25,167 2.0金属加工機械 Metalworking Machinery 10,652 ▲ 12.7 7,771 ▲ 27.0ポンプ遠心分離機 Pump & Centrifuges 12,295 ▲ 5.1 11,732 ▲ 4.6建設用・鉱山用機械 Construction Machines 11,397 ▲ 7.6 8,966 ▲ 21.3荷役機械 Mechanical Handling Equip. 6,457 ▲ 9.6 4,979 ▲ 22.9加熱用・冷却用機器 Heating or Cooling Equipments 4,236 ▲ 5.3 3,700 ▲ 12.7繊維機械 Textile Machines 2,249 ▲ 15.3 1,812 ▲ 19.5ベアリング Ball or Roller Bearings 4,646 ▲ 6.8 3,688 ▲ 20.6
7 電気機器 Electrical Machinery 132,077 ▲ 6.6 128,211 ▲ 2.9半導体等電子部品 Semiconductors etc. 40,060 ▲ 3.5 40,771 1.8 (IC) (IC) 28,361 ▲ 2.3 28,272 ▲ 0.3音響・映像機器 Audio & Visual Apparatus 4,509 ▲ 12.1 3,792 ▲ 15.9 (映像記録・再生機器) (Video Rec. or Repro App.) 3,012 ▲ 17.3 2,585 ▲ 14.2 (テレビ受像機) (Television Receivers) 1,051 3.2 810 ▲ 22.9音響・映像機器の部分品 Parts of Audio, Visual App. 2,282 ▲ 9.0 1,894 ▲ 17.0重電機器 Electrical Power Machinery 9,437 ▲ 1.1 9,923 5.2通信機 Telephony, Telegraphy 4,472 ▲ 22.8 3,768 ▲ 15.7電気計測機器 Electrical Measuring 16,268 ▲ 6.4 15,311 ▲ 5.9電気回路等の機器 Electrical Apparatus 18,515 ▲ 10.9 17,412 ▲ 6.0電池 Batteries & Accumulators 5,432 ▲ 10.2 5,191 ▲ 4.4
8 輸送用機器 Transport Equipment 181,180 ▲ 4.0 144,548 ▲ 20.2自動車 Motor Vehicles 119,712 ▲ 2.7 95,798 ▲ 20.0 (乗用車) (Passenger Motor Car) 106,820 ▲ 2.3 86,335 ▲ 19.2 (バス・トラック) (Buses & Trucks) 12,228 ▲ 5.4 9,016 ▲ 26.3自動車の部分品 Parts of Motor Vehicles 36,017 ▲ 9.8 29,124 ▲ 19.1二輪自動車 Motorcycles, Autocycles 2,674 ▲ 20.7 2,246 ▲ 16.0航空機類 Aircraft 4,946 3.2 3,224 ▲ 34.8船舶 Ships 14,928 9.1 11,420 ▲ 23.5
9 その他 Others 101,674 ▲ 4.9 94,096 ▲ 7.5科学光学機器 Scientific, Optical Inst. 21,297 ▲ 8.0 19,680 ▲ 7.6写真用・映画用材料 Photographic Supplies 5,276 ▲ 1.0 4,937 ▲ 6.4
総 額 Grand Total 769,317 ▲ 5.6 684,066 ▲ 11.1
Source : 財務省貿易統計より作成。 Compiled from MOF's Trade Statistics on a Customs-cleared Basis.
品 名
Commodity
2019 2020
金額(億円)
前年比伸び率(%)
金額(億円)
前年比伸び率(%)
(¥100 million)Change from previous year
(¥100 million)Change from previous year
1 食料品 Foodstuff 71,916 ▲ 0.8 66,753 ▲ 7.2魚介類・同調製品 Fish a& Fish Preparation 16,092 ▲ 3.2 13,665 ▲ 15.1肉類・同調製品 Meat & Meat Preparation 15,401 1.6 14,311 ▲7.1穀物・同調製品 Cereals, Cereal Preparation 7,973 ▲ 1.5 7,662 ▲3.9野菜 Vegetables 5,369 ▲ 2.5 5,033 ▲6.3果実 Fruits 5,386 ▲ 2.1 5,362 ▲0.4
2 原料品 Raw Materials 48,612 ▲ 2.6 45,095 ▲7.2木材 Wood 3,573 ▲ 12.4 2,791 ▲21.9非鉄金属鉱 Ore of Nonferrous 13,779 ▲ 11.8 13,818 0.3鉄鉱石 Iron Ore & Concentrates 11,883 15.4 10,271 ▲ 13.6大豆 Soy Beans 1,673 ▲ 1.6 1,592 ▲ 4.9
3 鉱物性燃料 Mineral Fuels 169,506 ▲ 12.1 112,598 ▲ 33.6原油及び粗油 Petroleum 79,690 ▲ 10.5 46,460 ▲ 41.7石油製品 Petroleum Products 15,373 ▲ 25.9 12,460 ▲ 18.9(揮発油) (Petroleum Spirits) 11,590 ▲ 23.8 9,747 ▲ 15.9液化天然ガス LNG 43,498 ▲ 8.2 32,167 ▲ 26.0液化石油ガス LPG 5,328 ▲ 22.9 4,309 ▲ 19.1石炭 Coal 25,282 ▲ 10.1 17,008 ▲ 32.7
4 化学製品 Chemicals 81,635 ▲ 4.5 77,900 ▲ 4.6有機化合物 Organic Chemicals 16,911 ▲ 12.7 16,502 ▲ 2.4医薬品 Medical Products 30,919 4.4 31,518 1.9
5 原料別製品 Manufactured Goods 70,684 ▲ 5.2 65,589 ▲ 7.2鉄鋼 Iron & Steel Products 9,480 ▲ 6.9 7,050 ▲ 25.6非鉄金属 Nonferrous Metals 17,502 ▲ 12.5 17,211 ▲ 1.7金属製品 Manufactures of Metals 12,998 0.6 11,356 ▲ 12.6織物用糸・繊維製品 Textile Yarn, Fabrics 9,470 ▲ 2.1 12,454 31.5非金属鉱物製品 Non-metallic Mineral Ware 6,944 ▲ 6.6 5,700 ▲ 17.9木製品等(除家具) Wood & Cork manufactured 7,648 ▲ 3.4 6,167 ▲ 19.4
6 一般機械 Machinery 75,826 ▲ 4.6 70,334 ▲ 7.2原動機 Power Generating Machine 12,312 ▲ 15.0 8,969 ▲ 27.2電算機類(含周辺機器) Computers & Units 22,108 9.0 24,003 8.6電算機類の部分品 Parts of Computer 5,240 4.2 4,125 ▲ 21.3
7 電気機器 Electrical Machinery 119,920 ▲ 2.8 113,462 ▲ 5.4半導体等電子部品 Semiconductors etc. 25,814 ▲ 8.3 25,048 ▲ 3.0 (IC) (IC) 20,083 ▲ 9.3 19,896 ▲ 0.9絶縁電線・絶縁ケーブル Insulated Wire and Cable 8,245 0.8 7,487 ▲ 9.2音響映像機器(含部品) Audio & Visual Apparatus 13,686 7.9 12,761 ▲ 6.8重電機器 Electrical Power Machinery 6,641 1.3 6,045 ▲ 9.0通信機 Telephony, Telegraphy 28,463 ▲ 7.8 28,486 0.1 (電話機) (Telephone Sets) 16,943 ▲ 13.9 16,030 ▲ 5.4電気計測機器 Electrical Measuring 7,628 ▲ 2.9 6,365 ▲ 16.6
8 輸送用機器 Transport Equipment 35,607 2.0 25,987 ▲ 27.0自動車 Motor Vehicles 14,084 ▲ 1.4 11,651 ▲ 17.3自動車の部分品 Parts of Motor Vehicles 8,906 ▲ 9.7 6,741 ▲ 24.3航空機類 Aircraft 9,053 23.4 4,410 ▲ 51.3
9 その他 Others 112,289 ▲ 1.4 99,652 ▲ 11.3科学光学機器 Scientific, Optical Inst. 18,179 ▲ 0.8 17,083 ▲ 6.0衣類・同付属品 Clothing & Accessories 32,045 ▲ 3.1 27,240 ▲ 15.0家具 Furniture 7,879 1.2 7,479 ▲ 5.1バッグ類 Bags 6,437 4.7 5,055 ▲ 21.5
総 額 Grand Total 785,995 ▲ 5.0 677,369 ▲ 13.8
Source : 財務省貿易統計より作成。 Compiled from MOF's Trade Statistics on a Customs-cleared Basis.
資料編▶1.2020年の日本の貿易80 Data Chapter▶1.Japan's Trade in 2020 81

(5) 地域別輸出 Exports by Area/Country(億円 ¥100 million)
地域(国)名
Area/Country
2019 2020金 額 (前年比)構成比 金 額 (前年比)構成比
ValueChange from previous year %
Share % Value
Change from previous year %
Share %
ア ジ ア Asia 413,268 ( ▲7.6 ) 53.7 392,244 ( ▲5.1 ) 57.3中 国 China 146,819 ( ▲7.6 ) 19.1 150,828 ( 2.7 ) 22.0香 港 Hong Kong 36,654 ( ▲4.4 ) 4.8 34,145 ( ▲6.8 ) 5.0台 湾 Taiwan 46,885 ( 0.2 ) 6.1 47,391 ( 1.1 ) 6.9韓 国 Korea 50,438 ( ▲12.9 ) 6.6 47,662 ( ▲5.5 ) 7.0シ ン ガ ポ ー ル Singapore 21,988 ( ▲14.9 ) 2.9 18,885 ( ▲14.1 ) 2.8タ イ Thailand 32,906 ( ▲7.6 ) 4.3 27,231 ( ▲17.2 ) 4.0マ レ ー シ ア Malaysia 14,490 ( ▲5.8 ) 1.9 13,435 ( ▲7.3 ) 2.0イ ン ド ネ シ ア Indonesia 15,243 ( ▲12.6 ) 2.0 9,819 ( ▲35.6 ) 1.4フ ィ リ ピ ン Philippines 11,613 ( ▲6.6 ) 1.5 9,404 ( ▲19.0 ) 1.4ベ ト ナ ム Viet Nam 17,971 ( ▲0.9 ) 2.3 18,261 ( 1.6 ) 2.7イ ン ド India 11,965 ( ▲1.5 ) 1.6 9,711 ( ▲18.8 ) 1.4大 洋 州 Oceania 20,534 ( ▲14.5 ) 2.7 16,885 ( ▲17.8 ) 2.5オーストラリア Australia 15,798 ( ▲16.2 ) 2.1 12,963 ( ▲17.9 ) 1.9北 米 North America 162,222 ( ▲1.7 ) 21.1 133,852 ( ▲17.5 ) 19.6米 国 USA 152,545 ( ▲1.4 ) 19.8 126,125 ( ▲17.3 ) 18.4カ ナ ダ Canada 9,677 ( ▲6.0 ) 1.3 7,727 ( ▲20.2 ) 1.1中 南 米 Central South America 32,214 ( ▲5.2 ) 4.2 22,846 ( ▲29.1 ) 3.3ブ ラ ジ ル Brazil 4,102 ( ▲7.1 ) 0.5 3,154 ( ▲23.1 ) 0.5メ キ シ コ Mexico 11,577 ( ▲9.8 ) 1.5 8,949 ( ▲22.7 ) 1.3チ リ Chile 2,233 ( 1.4 ) 0.3 1,080 ( ▲51.6 ) 0.2西 欧 Western Europe 90,104 ( ▲4.0 ) 11.7 76,540 ( ▲15.1 ) 11.2ド イ ツ Germany 22,051 ( ▲4.4 ) 2.9 18,776 ( ▲14.9 ) 2.7英 国 UK 15,132 ( ▲1.4 ) 2.0 11,453 ( ▲24.3 ) 1.7フ ラ ン ス France 7,435 ( ▲4.5 ) 1.0 6,026 ( ▲19.0 ) 0.9オ ラ ン ダ Netherlands 12,987 ( ▲7.5 ) 1.7 11,640 ( ▲10.4 ) 1.7イ タ リ ア Italy 5,014 ( ▲3.3 ) 0.7 4,033 ( ▲19.6 ) 0.6中東欧・ロシア等 Central & Eastern Europe, Russia, etc. 17,572 ( 2.2 ) 2.3 15,132 ( ▲13.9 ) 2.2ロ シ ア Russia 7,826 ( ▲2.8 ) 1.0 6,278 ( ▲19.8 ) 0.9中 東 Middle East 23,564 ( ▲3.2 ) 3.1 18,086 ( ▲23.2 ) 2.6アラブ首長国連邦 UAE 7,827 ( ▲10.2 ) 1.0 5,933 ( ▲24.2 ) 0.9サウジアラビア Saudi Arabia 5,567 ( 22.6 ) 0.7 4,526 ( ▲18.7 ) 0.7ク ウ ェ ー ト Kuwait 1,872 ( ▲4.2 ) 0.2 1,504 ( ▲19.7 ) 0.2イ ラ ン Iran 72 ( ▲90.6 ) 0.0 86 ( 18.2 ) 0.0ア フ リ カ Africa 9,838 ( 9.3 ) 1.3 8,480 ( ▲13.8 ) 1.2南アフリカ共和国 South Africa 2,633 ( ▲5.3 ) 0.3 1,783 ( ▲32.3 ) 0.3
総 額 Grand Total 769,317 ( ▲5.6 ) 100.0 684,066 ( ▲11.1 ) 100.0
( E U ) 89,553 ( ▲2.8 ) 11.6 64,618 ( ▲14.6 ) 9.4( B R I C S ) 173,346 ( ▲7.0 ) 22.5 171,754 ( ▲0.9 ) 25.1
Note : BRICSはブラジル、ロシア、インド、中国、南アフリカ共和国より本会算出。 Figures for BRICS are calculated from Brazil, Russia, India, China and South Africa by JFTC.Source : 財務省貿易統計より作成。 Compiled from MOF's Trade Statistics on a Customs-cleared Basis.
(6) 地域別輸入 Imports by Area/Country(億円 ¥100 million)
地域(国)名
Area/Country
2019 2020金 額 (前年比)構成比 金 額 (前年比)構成比
ValueChange from previous year %
Share % Value
Change from previous year %
Share %
ア ジ ア Asia 374,130 ( ▲4.6 ) 47.6 346,096 ( ▲7.5 ) 51.1中 国 China 184,537 ( ▲3.9 ) 23.5 174,776 ( ▲5.3 ) 25.8香 港 Hong Kong 2,251 ( ▲4.1 ) 0.3 849 ( ▲62.3 ) 0.1台 湾 Taiwan 29,276 ( ▲2.3 ) 3.7 28,563 ( ▲2.4 ) 4.2韓 国 Korea 32,271 ( ▲9.1 ) 4.1 28,380 ( ▲12.1 ) 4.2シ ン ガ ポ ー ル Singapore 8,512 ( ▲20.9 ) 1.1 9,125 ( 7.2 ) 1.3タ イ Thailand 27,651 ( ▲0.2 ) 3.5 25,363 ( ▲8.3 ) 3.7マ レ ー シ ア Malaysia 19,263 ( ▲7.9 ) 2.5 17,003 ( ▲11.7 ) 2.5イ ン ド ネ シ ア Indonesia 19,820 ( ▲16.7 ) 2.5 16,443 ( ▲17.0 ) 2.4フ ィ リ ピ ン Philippines 11,561 ( 0.3 ) 1.5 9,935 ( ▲14.1 ) 1.5ベ ト ナ ム Viet Nam 24,509 ( 5.0 ) 3.1 23,525 ( ▲4.0 ) 3.5イ ン ド India 5,855( ▲3.6 ) 0.7 5,045( ▲13.8 ) 0.7大 洋 州 Oceania 55,868 ( ▲1.3 ) 7.1 43,273 ( ▲22.5 ) 6.4オーストラリア Australia 49,576 ( ▲1.9 ) 6.3 38,053 ( ▲23.2 ) 5.6北 米 North America 99,350 ( ▲3.7 ) 12.6 85,840 ( ▲13.6 ) 12.7米 国 USA 86,402 ( ▲4.2 ) 11.0 74,275 ( ▲14.0 ) 11.0カ ナ ダ Canada 12,864 ( ▲0.7 ) 1.6 11,483 ( ▲10.7 ) 1.7中 南 米 Central South America 31,683 ( ▲1.8 ) 4.0 29,295 ( ▲7.5 ) 4.3ブ ラ ジ ル Brazil 8,723 ( 14.6 ) 1.1 8,010 ( ▲8.2 ) 1.2メ キ シ コ Mexico 6,440 ( ▲8.0 ) 0.8 5,798 ( ▲10.0 ) 0.9チ リ Chile 7,253 ( ▲9.4 ) 0.9 7,016 ( ▲3.3 ) 1.0西 欧 Western Europe 103,941 ( 0.2 ) 13.2 89,705 ( ▲13.7 ) 13.2ド イ ツ Germany 27,226 ( ▲5.1 ) 3.5 22,649 ( ▲16.8 ) 3.3英 国 UK 8,876 ( ▲2.4 ) 1.1 6,849 ( ▲22.8 ) 1.0フ ラ ン ス France 13,127 ( 7.6 ) 1.7 9,865 ( ▲24.8 ) 1.5オ ラ ン ダ Netherlands 3,432 ( ▲2.7 ) 0.4 3,320 ( ▲3.3 ) 0.5イ タ リ ア Italy 12,648 ( 0.4 ) 1.6 11,201 ( ▲11.4 ) 1.7中東欧・ロシア等 Central & Eastern Europe, Russia, etc. 23,330 ( ▲8.4 ) 3.0 18,387 ( ▲21.2 ) 2.7ロ シ ア Russia 15,606 ( ▲9.4 ) 2.0 11,460 ( ▲26.6 ) 1.7中 東 Middle East 88,515 ( ▲14.7 ) 11.3 55,568 ( ▲37.2 ) 8.2アラブ首長国連邦 UAE 28,555 ( ▲6.3 ) 3.6 17,494 ( ▲38.7 ) 2.6サウジアラビア Saudi Arabia 30,158 ( ▲19.2 ) 3.8 19,694 ( ▲34.7 ) 2.9ク ウ ェ ー ト Kuwait 7,508 ( ▲6.2 ) 1.0 4,871 ( ▲35.1 ) 0.7イ ラ ン Iran 1,269 ( ▲66.7 ) 0.2 36 ( ▲97.1 ) 0.0ア フ リ カ Africa 9,175 ( ▲7.4 ) 1.2 9,196 ( 0.2 ) 1.4南アフリカ共和国 South Africa 5,591 ( ▲1.6 ) 0.7 6,137 ( 9.8 ) 0.9
総 額 Grand Total 785,995 ( ▲5.0 ) 100.0 677,369 ( ▲13.8 ) 100.0
( E U ) 97,222 ( 0.0 ) 12.4 77,893 ( ▲12.6 ) 11.5( B R I C S ) 220,313 ( ▲3.6 ) 28.0 205,427 ( ▲6.8 ) 30.3
Note : BRICSはブラジル、ロシア、インド、中国、南アフリカ共和国より本会算出。 Figures for BRICS are calculated from Brazil, Russia, India, China and South Africa by JFTC.Source : 財務省貿易統計より作成。 Compiled from MOF's Trade Statistics on a Customs-cleared Basis.
資料編▶1.2020年の日本の貿易82 Data Chapter▶1.Japan's Trade in 2020 83

(7) 地域別貿易収支 Trade Balance by Area/Country(億円 ¥100 million)
地域(国)名
Area/Country
2019 2020金 額 前年比増減額 金 額 前年比増減額
Value Change from previous year Value Change from
previous yearア ジ ア Asia 39,138 ‒ 16,040 46,149 7,011中 国 China ▲ 37,718 ‒ 4,759 ▲ 23,948 13,770香 港 Hong Kong 34,403 ‒ 1,574 33,296 ‒ 1,107台 湾 Taiwan 17,609 792 18,828 1,218韓 国 Korea 18,167 ‒ 4,254 19,282 1,115シ ン ガ ポ ー ル Singapore 13,475 ‒ 1,606 9,759 ‒ 3,716タ イ Thailand 5,256 ‒ 2,662 1,868 ‒ 3,388マ レ ー シ ア Malaysia ▲ 4,773 750 ▲ 3,567 1,206イ ン ド ネ シ ア Indonesia ▲ 4,577 1,782 ▲ 6,625 ‒ 2,048フ ィ リ ピ ン Philippines 51 ‒ 856 ▲ 531 ‒ 582ベ ト ナ ム Viet Nam ▲ 6,538 ‒ 1,327 ▲ 5,264 1,274イ ン ド India 6,110 29 4,667 ‒ 1,443大 洋 州 Oceania ▲ 35,334 ‒ 2,765 ▲ 26,389 8,945オーストラリア Australia ▲ 33,778 ‒ 2,112 ▲ 25,090 8,688北 米 North America 62,872 1,054 48,012 ‒ 14,861米 国 USA 66,143 1,590 51,850 ‒ 14,294カ ナ ダ Canada ▲ 3,187 ‒ 531 ▲ 3,756 ‒ 569中 南 米 Central South America 531 ‒ 1,200 ▲ 6,448 ‒ 6,980ブ ラ ジ ル Brazil ▲ 4,621 ‒ 1,424 ▲ 4,856 ‒ 235メ キ シ コ Mexico 5,137 ‒ 694 3,151 ‒ 1,986チ リ Chile ▲ 5,020 782 ▲ 5,936 ‒ 916西 欧 Western Europe ▲ 13,837 ‒ 4,032 ▲ 13,164 673ド イ ツ Germany ▲ 5,175 462 ▲ 3,873 1,302英 国 UK 6,256 9 4,604 ‒ 1,652フ ラ ン ス France ▲ 5,692 ‒ 1,282 ▲ 3,839 1,853オ ラ ン ダ Netherlands 9,555 ‒ 955 8,320 ‒ 1,235イ タ リ ア Italy ▲ 7,634 ‒ 217 ▲ 7,168 467中東欧・ロシア等 Central & Eastern Europe, Russia, etc. ▲ 5,758 2,513 ▲ 3,255 2,503ロ シ ア Russia ▲ 7,780 1,392 ▲ 5,182 2,598中 東 Middle East ▲ 64,951 14,462 ▲ 37,482 27,469アラブ首長国連邦 UAE ▲ 20,728 1,017 ▲ 11,561 9,167サウジアラビア Saudi Arabia ▲ 24,591 8,197 ▲ 15,168 9,423ク ウ ェ ー ト Kuwait ▲ 5,636 417 ▲ 3,367 2,269イ ラ ン Iran ▲ 1,197 1,844 49 1,246ア フ リ カ Africa 663 1,574 ▲ 716 ‒ 1,378南アフリカ共和国 South Africa ▲ 2,958 ‒ 57 ▲ 4,354 ‒ 1,397
総 額 Grand Total ▲ 16,678 ‒ 4,433 6,697 23,376
( E U ) ▲ 7,669 ‒ 2,576 ▲ 13,275 ‒ 5,606( B R I C S ) ▲ 46,967 ‒ 4,819 ▲ 33,673 13,294
Notes: 1. ▲は輸入超過、他は輸出超過。 ‒は輸入超過幅拡大あるいは輸出超過幅縮小を示す。他は輸出超過幅拡大あるいは輸入超過幅縮小
を示す。 ▲ represents a deficit. Figures without a mark represent a surplus. (‒ ) indicates an increase in deficit or a decrease in surplus. Figures without (‒ ) indicate an increase in surplus or a decrease in deficit. 2. BRICSはブラジル、ロシア、インド、中国、南アフリカ共和国より本会算出。 Figures for BRICS are calculated from Brazil, Russia, India, China and South Africa by JFTC.Source : 財務省貿易統計より作成。 Compiled from MOF's Trade Statistics on a Customs-cleared Basis.
(8) 国別貿易(2020年)Exports and Imports by Area/Country(千円 ¥1,000)
地理圏Geographical zone 国(地域)名 Area/Country 輸 出
Exports輸 入Imports
ア ジ ア 州 ASIA CONTINENT 41,121,096,880 40,255,902,675アジアAsia
大 韓 民 国 Republic of Korea 4,766,235,115 2,838,002,834北 朝 鮮 North Korea 0 0中 華 人 民 共 和 国 People's Republic of China 15,082,825,244 17,477,576,596台 湾 Taiwan 4,739,058,801 2,856,297,912モ ン ゴ ル Mongolia 36,370,057 1,551,633香 港 Hong Kong 3,414,521,581 84,916,209ベ ト ナ ム Viet Nam 1,826,065,037 2,352,466,999タ イ Thailand 2,723,059,400 2,536,308,065シ ン ガ ポ ー ル Singapore 1,888,473,925 912,528,348マ レ ー シ ア Malaysia 1,343,525,613 1,700,266,948ブ ル ネ イ Brunei 11,032,344 186,243,969フ ィ リ ピ ン Philippines 940,428,049 993,510,574イ ン ド ネ シ ア Indonesia 981,863,640 1,644,318,064カ ン ボ ジ ア Cambodia 51,777,088 172,850,021ラ オ ス Laos 15,730,230 13,785,757ミ ャ ン マ ー Myanmar 64,428,805 139,243,303イ ン ド India 971,122,410 504,469,940パ キ ス タ ン Pakistan 124,342,311 24,162,428ス リ ラ ン カ Sri Lanka 39,541,986 26,186,361モ ル デ ィ ブ Maldives 2,082,117 277,193バ ン グ ラ デ シ ュ Bangladesh 160,410,743 140,273,965東 テ ィ モ ー ル Timor-Leste 707,275 1,913,779マ カ オ Macao 31,623,617 1,552,738ア フ ガ ニ ス タ ン Afghanistan 3,984,572 20,750ネ パ ー ル Nepal 4,846,480 787,971ブ ー タ ン Bhutan 383,532 59,111
中東MiddleEast
イ ラ ン Iran 8,561,248 3,617,933イ ラ ク Iraq 39,191,247 19,340,589バ ー レ ー ン Bahrain 63,617,016 52,633,315サ ウ ジ ア ラ ビ ア Saudi Arabia 452,594,546 1,969,376,478ク ウ ェ ー ト Kuwait 150,438,907 487,101,951カ タ ー ル Qatar 108,601,882 980,545,509オ マ ー ン Oman 137,808,767 156,632,508イ ス ラ エ ル Israel 161,555,046 131,543,867ヨ ル ダ ン Jordan 60,269,927 3,320,880シ リ ア Syria 972,202 49,811レ バ ノ ン Lebanon 10,852,417 2,463,373ア ラ ブ 首 長 国 連 邦 United Arab Emirates 593,300,553 1,749,434,739イ エ メ ン Yemen 20,496,212 692,018ヨルダン川西岸及びガザ The West Bank and Gaza Strip 354,799 44,999
中東欧・ロシア等Central & Eastern Europe, Russia, etc.
ア ゼ ル バ イ ジ ャ ン Azerbaijan 5,892,931 4,675,739ア ル メ ニ ア Armenia 817,238 2,212,090ウ ズ ベ キ ス タ ン Uzbekistan 15,178,263 932,604カ ザ フ ス タ ン Kazakhstan 38,738,399 79,124,332キ ル ギ ス Kyrgyz 1,599,676 63,872タ ジ キ ス タ ン Tajikistan 386,645 147,884
資料編▶1.2020年の日本の貿易84 Data Chapter▶1.Japan's Trade in 2020 85

地理圏Geographical zone 国(地域)名 Area/Country 輸 出
Exports輸 入Imports
ト ル ク メ ニ ス タ ン Turkmenistan 12,350,875 8,324ジ ョ ー ジ ア Georgia 13,078,112 2,368,392
ヨ ー ロ ッ パ 州 EUROPE CONTINENT 9,079,232,070 10,719,650,622西欧Western Europe
ア イ ス ラ ン ド Iceland 4,868,478 9,732,097ノ ル ウ ェ ー Norway 107,923,744 156,541,043ス ウ ェ ー デ ン Sweden 133,435,432 301,064,306デ ン マ ー ク Denmark 48,788,573 237,298,948英 国 United Kingdom 1,145,327,953 684,884,869ア イ ル ラ ン ド Ireland 95,069,448 693,347,923オ ラ ン ダ Netherlands 1,163,982,579 331,961,772ベ ル ギ ー Belgium 699,139,353 345,615,507ル ク セ ン ブ ル ク Luxembourg 40,454,290 8,844,955フ ラ ン ス France 602,590,461 986,493,482モ ナ コ Monaco 127,381 262,760ア ン ド ラ Andorra 7,664 14,600ド イ ツ Germany 1,877,599,004 2,264,856,472ス イ ス Switzerland 513,979,229 795,369,206ポ ル ト ガ ル Portugal 52,392,387 45,263,095ス ペ イ ン Spain 230,971,419 336,653,237ジ ブ ラ ル タ ル(英)Gibraltar (UK) 12,685,195 1,321イ タ リ ア Italy 403,312,554 1,120,077,298マ ル タ Malta 12,423,792 18,645,505フ ィ ン ラ ン ド Finland 41,744,727 170,832,841オ ー ス ト リ ア Austria 113,248,909 210,679,163セ ル ビ ア Serbia 2,107,765 65,104,089ギ リ シ ャ Greece 26,149,972 81,304,651キ プ ロ ス Cyprus 16,452,317 106,419ト ル コ Turkey 284,342,085 73,566,179ク ロ ア チ ア Croatia 4,034,323 10,991,535ス ロ ベ ニ ア Slovenia 17,205,882 16,169,098ボスニア・ヘルツェゴビナ Bosnia and Herzegovina 242,674 1,247,837北 マ ケ ド ニ ア North Macedonia 2,902,770 1,734,475モ ン テ ネ グ ロ Montenegro 340,607 68,434コ ソ ボ Kosovo 179,245 30,941フ ェ ロ ー 諸 島(丁)Faroe Islands (Denmark) 0 1,520,396バ チ カ ン Vatican City 15,332 168,200
中東欧・ロシア等Central & Eastern Europe, Russia, etc.
ポ ー ラ ン ド Poland 303,703,001 100,545,756ロ シ ア Russia 627,807,047 1,146,001,901ハ ン ガ リ ー Hungary 169,199,524 113,669,071ア ル バ ニ ア Albania 209,639 1,781,252ル ー マ ニ ア Romania 42,725,280 107,717,979ブ ル ガ リ ア Bulgaria 18,094,547 14,417,429エ ス ト ニ ア Estonia 15,148,642 13,229,708ラ ト ビ ア Latvia 4,458,964 8,649,139リ ト ア ニ ア Lithuania 6,135,757 28,841,442ウ ク ラ イ ナ Ukraine 54,183,539 56,915,351ベ ラ ル ー シ Belarus 5,288,717 3,103,032モ ル ド バ Moldova 422,597 2,258,909チ ェ コ Czech Republic 159,484,048 117,149,157ス ロ バ キ ア Slovakia 18,325,224 34,917,842
地理圏Geographical zone 国(地域)名 Area/Country 輸 出
Exports輸 入Imports
北 ア メ リ カ 州 NORTH AMERICA CONTINENT 14,995,873,642 9,537,423,882北米North America
グリーンランド(丁)Greenland (Denmark) 4,447 8,234,942カ ナ ダ Canada 772,711,156 1,148,308,530ア メ リ カ 合 衆 国 United States of America 12,612,459,438 7,427,481,952
中南米Central South America
メ キ シ コ Mexico 894,875,426 579,763,500グ ア テ マ ラ Guatemala 23,377,905 18,168,687ホ ン ジ ュ ラ ス Honduras 6,606,938 6,003,761ベ リ ー ズ Belize 2,545,482 458,225エ ル サ ル バ ド ル El Salvador 10,087,137 1,944,119ニ カ ラ グ ア Nicaragua 5,251,029 2,818,918コ ス タ リ カ Costa Rica 22,271,972 44,942,495パ ナ マ Panama 491,083,056 51,902,081バ ミ ュ ー ダ(英)Bermuda (UK) 899,516 1,363バ ハ マ The Bahamas 22,007,347 502,482ジ ャ マ イ カ Jamaica 18,124,980 1,432,305タークス及びカイコス諸島(英) Turks, and Caicos Islands (UK) 213,609 0バ ル バ ド ス Barbados 11,919,448 12,065トリニダード・トバゴ Trinidad and Tobago 13,462,524 3,016,993キ ュ ー バ Cuba 1,372,859 1,215,380ハ イ チ Haiti 1,753,745 318,769ド ミ ニ カ 共 和 国 Dominican Republic 17,066,535 12,753,480プ エ ル ト リ コ(米)Puerto Rico (USA) 58,487,947 225,161,056米 領 バ ー ジ ン 諸 島 US Virgin Islands 44,573 1,497蘭 領 ア ン テ ィ ー ル Netherlands Antilles 1,393,826 5,809仏 領 西 イ ン ド 諸 島 French West Indies 1,674,118 10,853ケ イ マ ン 諸 島(英)Cayman Islands (UK) 1,310,906 2,705,018グ レ ナ ダ Grenada 555,134 0セ ン ト ル シ ア St. Lucia 806,977 658アンティグア・バーブーダ Antigua and Barbuda 878,651 2,764英 領 バ ー ジ ン 諸 島 British Virgin Islands 544,698 2,154ド ミ ニ カ Dominica 353,835 27,212モ ン ト セ ラ ト(英)Montserrat (UK) 28,448 482セントクリストファー・ネービス St. Christopher and Nevis 782,131 282セ ン ト ビ ン セ ン ト St. Vincent 536,418 225,095英 領 ア ン ギ ラ British Anguilla 205,127 955サン・バルテルミー島(仏)St. Barthelemy (France) 176,304 0
南 ア メ リ カ 州 SOUTH AMERICA CONTINENT 673,941,959 1,976,075,525中南米Central South America
コ ロ ン ビ ア Colombia 85,710,237 49,708,937ベ ネ ズ エ ラ Venezuela 1,906,255 4,015,373ガ イ ア ナ Guyana 6,077,312 509,256ス リ ナ ム Suriname 5,377,120 351,875仏 領 ギ ア ナ French Guiana 305,311 0エ ク ア ド ル Ecuador 24,561,459 95,976,677ペ ル ー Peru 49,964,963 232,463,316ボ リ ビ ア Bolivia 7,156,581 23,737,001チ リ Chile 107,998,803 701,569,121ブ ラ ジ ル Brazil 315,440,010 800,996,851パ ラ グ ア イ Paraguay 7,278,069 7,482,032ウ ル グ ア イ Uruguay 4,372,771 3,843,196ア ル ゼ ン チ ン Argentine 57,790,527 55,223,203
資料編▶1.2020年の日本の貿易86 Data Chapter▶1.Japan's Trade in 2020 87
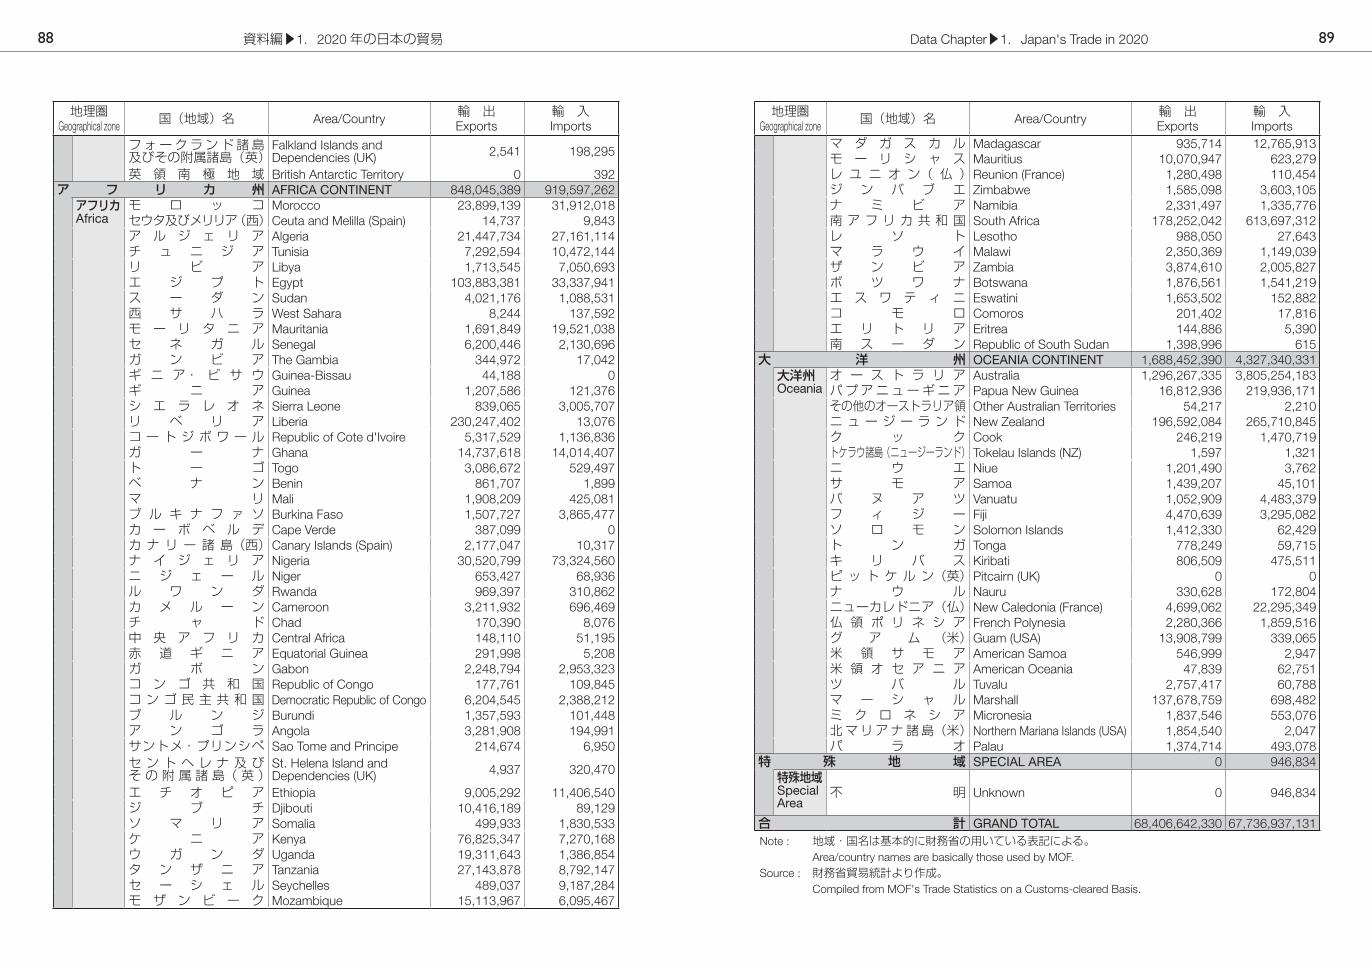
地理圏Geographical zone 国(地域)名 Area/Country 輸 出
Exports輸 入Imports
フォークランド諸島 及びその附属諸島(英)
Falkland Islands and Dependencies (UK) 2,541 198,295
英 領 南 極 地 域 British Antarctic Territory 0 392ア フ リ カ 州 AFRICA CONTINENT 848,045,389 919,597,262アフリカAfrica
モ ロ ッ コ Morocco 23,899,139 31,912,018セウタ及びメリリア(西)Ceuta and Melilla (Spain) 14,737 9,843ア ル ジ ェ リ ア Algeria 21,447,734 27,161,114チ ュ ニ ジ ア Tunisia 7,292,594 10,472,144リ ビ ア Libya 1,713,545 7,050,693エ ジ プ ト Egypt 103,883,381 33,337,941ス ー ダ ン Sudan 4,021,176 1,088,531西 サ ハ ラ West Sahara 8,244 137,592モ ー リ タ ニ ア Mauritania 1,691,849 19,521,038セ ネ ガ ル Senegal 6,200,446 2,130,696ガ ン ビ ア The Gambia 344,972 17,042ギ ニ ア・ ビ サ ウ Guinea-Bissau 44,188 0ギ ニ ア Guinea 1,207,586 121,376シ エ ラ レ オ ネ Sierra Leone 839,065 3,005,707リ ベ リ ア Liberia 230,247,402 13,076コ ー ト ジ ボ ワ ー ル Republic of Cote d'Ivoire 5,317,529 1,136,836ガ ー ナ Ghana 14,737,618 14,014,407ト ー ゴ Togo 3,086,672 529,497ベ ナ ン Benin 861,707 1,899マ リ Mali 1,908,209 425,081ブ ル キ ナ フ ァ ソ Burkina Faso 1,507,727 3,865,477カ ー ボ ベ ル デ Cape Verde 387,099 0カ ナ リ ー 諸 島(西)Canary Islands (Spain) 2,177,047 10,317ナ イ ジ ェ リ ア Nigeria 30,520,799 73,324,560ニ ジ ェ ー ル Niger 653,427 68,936ル ワ ン ダ Rwanda 969,397 310,862カ メ ル ー ン Cameroon 3,211,932 696,469チ ャ ド Chad 170,390 8,076中 央 ア フ リ カ Central Africa 148,110 51,195赤 道 ギ ニ ア Equatorial Guinea 291,998 5,208ガ ボ ン Gabon 2,248,794 2,953,323コ ン ゴ 共 和 国 Republic of Congo 177,761 109,845コ ン ゴ 民 主 共 和 国 Democratic Republic of Congo 6,204,545 2,388,212ブ ル ン ジ Burundi 1,357,593 101,448ア ン ゴ ラ Angola 3,281,908 194,991サントメ・プリンシペ Sao Tome and Principe 214,674 6,950セ ン ト ヘ レ ナ 及 び そ の 附 属 諸 島( 英 )
St. Helena Island and Dependencies (UK) 4,937 320,470
エ チ オ ピ ア Ethiopia 9,005,292 11,406,540ジ ブ チ Djibouti 10,416,189 89,129ソ マ リ ア Somalia 499,933 1,830,533ケ ニ ア Kenya 76,825,347 7,270,168ウ ガ ン ダ Uganda 19,311,643 1,386,854タ ン ザ ニ ア Tanzania 27,143,878 8,792,147セ ー シ ェ ル Seychelles 489,037 9,187,284モ ザ ン ビ ー ク Mozambique 15,113,967 6,095,467
地理圏Geographical zone 国(地域)名 Area/Country 輸 出
Exports輸 入Imports
マ ダ ガ ス カ ル Madagascar 935,714 12,765,913モ ー リ シ ャ ス Mauritius 10,070,947 623,279レ ユ ニ オ ン( 仏 )Reunion (France) 1,280,498 110,454ジ ン バ ブ エ Zimbabwe 1,585,098 3,603,105ナ ミ ビ ア Namibia 2,331,497 1,335,776南 ア フ リ カ 共 和 国 South Africa 178,252,042 613,697,312レ ソ ト Lesotho 988,050 27,643マ ラ ウ イ Malawi 2,350,369 1,149,039ザ ン ビ ア Zambia 3,874,610 2,005,827ボ ツ ワ ナ Botswana 1,876,561 1,541,219エ ス ワ テ ィ ニ Eswatini 1,653,502 152,882コ モ ロ Comoros 201,402 17,816エ リ ト リ ア Eritrea 144,886 5,390南 ス ー ダ ン Republic of South Sudan 1,398,996 615
大 洋 州 OCEANIA CONTINENT 1,688,452,390 4,327,340,331大洋州Oceania
オ ー ス ト ラ リ ア Australia 1,296,267,335 3,805,254,183パプアニューギニア Papua New Guinea 16,812,936 219,936,171その他のオーストラリア領 Other Australian Territories 54,217 2,210ニ ュ ー ジ ー ラ ン ド New Zealand 196,592,084 265,710,845ク ッ ク Cook 246,219 1,470,719トケラウ諸島(ニュージーランド) Tokelau Islands (NZ) 1,597 1,321ニ ウ エ Niue 1,201,490 3,762サ モ ア Samoa 1,439,207 45,101バ ヌ ア ツ Vanuatu 1,052,909 4,483,379フ ィ ジ ー Fiji 4,470,639 3,295,082ソ ロ モ ン Solomon Islands 1,412,330 62,429ト ン ガ Tonga 778,249 59,715キ リ バ ス Kiribati 806,509 475,511ピ ッ ト ケ ル ン(英)Pitcairn (UK) 0 0ナ ウ ル Nauru 330,628 172,804ニューカレドニア(仏)New Caledonia (France) 4,699,062 22,295,349仏 領 ポ リ ネ シ ア French Polynesia 2,280,366 1,859,516グ ア ム (米)Guam (USA) 13,908,799 339,065米 領 サ モ ア American Samoa 546,999 2,947米 領 オ セ ア ニ ア American Oceania 47,839 62,751ツ バ ル Tuvalu 2,757,417 60,788マ ー シ ャ ル Marshall 137,678,759 698,482ミ ク ロ ネ シ ア Micronesia 1,837,546 553,076北マリアナ諸島(米)Northern Mariana Islands (USA) 1,854,540 2,047パ ラ オ Palau 1,374,714 493,078
特 殊 地 域 SPECIAL AREA 0 946,834特殊地域Special Area
不 明 Unknown 0 946,834
合 計 GRAND TOTAL 68,406,642,330 67,736,937,131Note : 地域・国名は基本的に財務省の用いている表記による。 Area/country names are basically those used by MOF.Source : 財務省貿易統計より作成。 Compiled from MOF's Trade Statistics on a Customs-cleared Basis.
資料編▶1.2020年の日本の貿易88 Data Chapter▶1.Japan's Trade in 2020 89

2 貿易構造 Trade Structure
(1) 貿易額と伸び率 Trade Value and Growth (2) 地域別輸出構成比 Ratio of Exports by Area/Country (%)日本貿易(通関ベース) Trade of Japan (Customs-cleared Basis) 世界貿易
World Trade輸出 Exports(FOB) 輸入 Imports(CIF) 貿易収支 Blance(億円) 前年比(%) (億円) 前年比(%) (億円) 前年比(%)(億ドル)前年比(%)
(¥100 million) Change from previous year (¥100 million) Change from
previous year (¥100 million) Change from previous year ($100 million) Change from
previous year1980 昭和 55年 293,825 ( 30.4 ) 319,953 ( 32.0 ) ▲ 26,129 ( 52.5 ) 20,361 ( 22.7 )
81 56 334,690 ( 13.9 ) 314,641 ( ▲ 1.7 ) 20,048 ( - ) 20,144 ( ▲ 1.1 )82 57 344,325 ( 2.9 ) 326,563 ( 3.8 ) 17,762 ( ▲ 11.4 ) 18,858 ( ▲ 6.4 )83 58 349,093 ( 1.4 ) 300,148 ( ▲ 8.1 ) 48,945 ( 175.6 ) 18,460 ( ▲ 2.1 )84 59 403,253 ( 15.5 ) 323,211 ( 7.7 ) 80,042 ( 63.5 ) 19,557 ( 5.9 )85 60 419,557 ( 4.0 ) 310,849 ( ▲ 3.8 ) 108,707 ( 35.8 ) 19,529 ( ▲ 0.1 )86 61 352,897 ( ▲ 15.9 ) 215,507 ( ▲ 30.7 ) 137,390 ( 26.4 ) 21,385 ( 9.5 )87 62 333,152 ( ▲ 5.6 ) 217,369 ( 0.9 ) 115,783 ( ▲ 15.7 ) 25,155 ( 17.6 )88 63 339,392 ( 1.9 ) 240,063 ( 10.4 ) 99,329 ( ▲ 14.2 ) 28,689 ( 14.0 )89 平成元年 378,225 ( 11.4 ) 289,786 ( 20.7 ) 88,440 ( ▲ 11.0 ) 30,989 ( 8.0 )
1990 2 414,569 ( 9.6 ) 338,552 ( 16.8 ) 76,017 ( ▲ 14.0 ) 34,897 ( 12.6 )91 3 423,599 ( 2.2 ) 319,002 ( ▲ 5.8 ) 104,597 ( 37.6 ) 35,114 ( 0.6 )92 4 430,123 ( 1.5 ) 295,274 ( ▲ 7.4 ) 134,849 ( 28.9 ) 37,792 ( 7.6 )93 5 402,024 ( ▲ 6.5 ) 268,264 ( ▲ 9.1 ) 133,761 ( ▲ 0.8 ) 37,947 ( 0.4 )94 6 404,976 ( 0.7 ) 281,043 ( 4.8 ) 123,932 ( ▲ 7.3 ) 43,283 ( 14.1 )95 7 415,309 ( 2.6 ) 315,488 ( 12.3 ) 99,821 ( ▲ 19.5 ) 51,676 ( 19.4 )96 8 447,313 ( 7.7 ) 379,934 ( 20.4 ) 67,379 ( ▲ 32.5 ) 54,061 ( 4.6 )97 9 509,380 ( 13.9 ) 409,562 ( 7.8 ) 99,818 ( 48.1 ) 55,923 ( 3.4 )98 10 506,450 ( ▲ 0.6 ) 366,536 ( ▲ 10.5 ) 139,914 ( 40.2 ) 55,031 ( ▲ 1.6 )99 11 475,476 ( ▲ 6.1 ) 352,680 ( ▲ 3.8 ) 122,795 ( ▲ 12.2 ) 57,194 ( 3.9 )
2000 12 516,542 ( 8.6 ) 409,384 ( 16.1 ) 107,158 ( ▲ 12.7 ) 64,540 ( 12.8 )01 13 489,792 ( ▲ 5.2 ) 424,155 ( 3.6 ) 65,637 ( ▲ 38.7 ) 61,964 ( ▲ 4.0 )02 14 521,090 ( 6.4 ) 422,275 ( ▲ 0.4 ) 98,814 ( 50.5 ) 65,007 ( 4.9 )03 15 545,484 ( 4.7 ) 443,620 ( 5.1 ) 101,863 ( 3.1 ) 75,908 ( 16.8 )04 16 611,700 ( 12.1 ) 492,166 ( 10.9 ) 119,533 ( 17.3 ) 92,226 ( 21.5 )05 17 656,565 ( 7.3 ) 569,494 ( 15.7 ) 87,072 ( ▲ 27.2 ) 105,103 ( 14.0 )06 18 752,462 ( 14.6 ) 673,443 ( 18.3 ) 79,019 ( ▲ 9.2 ) 121,314 ( 15.4 )07 19 839,314 ( 11.5 ) 731,359 ( 8.6 ) 107,955 ( 36.6 ) 140,313 ( 15.7 )08 20 810,181 ( ▲ 3.5 ) 789,547 ( 8.0 ) 20,633 ( ▲ 80.9 ) 161,697 ( 15.2 )09 21 541,706 ( ▲ 33.1 ) 514,994 ( ▲ 34.8 ) 26,712 ( 29.5 ) 125,630 ( ▲ 22.3 )
2010 22 673,996 ( 24.4 ) 607,650 ( 18.0 ) 66,347 ( 148.4 ) 153,065 ( 21.8 )11 23 655,465 ( ▲ 2.7 ) 681,112 ( 12.1 ) ▲ 25,647 ( - ) 183,416 ( 19.8 )12 24 637,476 ( ▲ 2.7 ) 706,886 ( 3.8 ) ▲ 69,411 ( 170.6 ) 185,172 ( 1.0 )13 25 697,742 ( 9.5 ) 812,425 ( 14.9 ) ▲ 114,684 ( 65.2 ) 189,662 ( 2.4 )14 26 730,930 ( 4.8 ) 859,091 ( 5.7 ) ▲ 128,161 ( 11.8 ) 190,072 ( 0.2 )15 27 756,139 ( 3.4 ) 784,055 ( ▲ 8.7 ) ▲ 27,916 ( ▲ 78.2 ) 165,557 ( ▲ 12.9 )16 28 700,358 ( ▲ 7.4 ) 660,420 ( ▲ 15.8 ) 39,938 ( - ) 160,440 ( ▲ 3.1 )17 29 782,865 ( 11.8 ) 753,792 ( 14.1 ) 29,072 ( ▲ 27.2 ) 177,399 ( 10.6 )18 30 814,788 ( 4.1 ) 827,033 ( 9.7 ) ▲ 12,246 ( - ) 194,724 ( 9.8 )19 令和元年 769,317 ( ▲ 5.6 ) 785,995 ( ▲ 5.0 ) ▲ 16,678 ( 36.2 ) 189,330 ( ▲ 2.8 )20 2 684,066 ( ▲ 11.1 ) (P) 677,369 ( ▲ 13.8 ) (P) 6,697 ( - ) - ( - )
Notes : 1. 世界貿易は輸出額(FOB)。 World trade value is based on FOB values. 2. (P)は速報値。 (P) represents provisional figures.Source : 財務省貿易統計および世界貿易機関の統計より作成。 Compiled from MOF's Trade Statistics on a Customs-cleared Basis and WTO's Statistics.
地域(国)名 Area/Country 2000 2005 2010 2015 2020
ア ジ ア Asia 41.1 48.4 56.1 53.3 57.3中 国 China 6.3 13.5 19.4 17.5 22.0香 港 Hong Kong 5.7 6.0 5.5 5.6 5.0台 湾 Taiwan 7.5 7.3 6.8 5.9 6.9韓 国 Korea 6.4 7.8 8.1 7.0 7.0シ ン ガ ポ ー ル Singapore 4.3 3.1 3.3 3.2 2.8タ イ Thailand 2.8 3.8 4.4 4.5 4.0マ レ ー シ ア Malaysia 2.9 2.1 2.3 1.9 2.0イ ン ド ネ シ ア Indonesia 1.6 1.5 2.1 1.8 1.4フ ィ リ ピ ン Philippines 2.1 1.5 1.4 1.5 1.4ベ ト ナ ム Viet Nam 0.4 0.6 1.1 2.0 2.7イ ン ド India 0.5 0.6 1.2 1.3 1.4
大 洋 州 Oceania 2.1 2.6 2.7 2.8 2.5オーストラリア Australia 1.8 2.1 2.1 2.1 1.9ニュージーランド New Zealand 0.3 0.4 0.2 0.3 0.3
北 米 North America 31.3 24.0 16.6 21.4 19.6米 国 USA 29.7 22.5 15.4 20.1 18.4カ ナ ダ Canada 1.6 1.5 1.2 1.2 1.1
中 南 米 Central South America 4.4 4.2 5.7 4.5 3.3ブ ラ ジ ル Brazil 0.5 0.5 0.8 0.6 0.5メ キ シ コ Mexico 1.1 1.2 1.2 1.7 1.3チ リ Chile 0.1 0.2 0.4 0.3 0.2
西 欧 Western Europe 17.4 14.8 11.9 10.7 11.2ド イ ツ Germany 4.2 3.1 2.6 2.6 2.7英 国 UK 3.1 2.5 1.8 1.7 1.7フ ラ ン ス France 1.6 1.3 0.9 0.8 0.9オ ラ ン ダ Netherlands 2.6 2.2 2.1 1.9 1.7イ タ リ ア Italy 1.2 1.0 0.7 0.6 0.6
中東欧・ロシア等 Central & Eastern Europe, Russia, etc. 0.5 1.7 2.1 1.8 2.2ロ シ ア Russia 0.1 0.8 1.0 0.8 0.9
中 東 Middle East 2.0 2.8 3.3 4.2 2.6アラブ首長国連邦 UAE 0.5 0.8 1.0 1.4 0.9サウジアラビア Saudi Arabia 0.6 0.7 0.8 1.1 0.7ク ウ ェ ー ト Kuwait 0.1 0.2 0.2 0.3 0.2イ ラ ン Iran 0.1 0.2 0.3 0.0 0.0
ア フ リ カ Africa 1.1 1.4 1.6 1.4 1.2南アフリカ共和国 South Africa 0.4 0.6 0.5 0.4 0.3
総 額 Grand Total 100.0 100.0 100.0 100.0 100.0 (金額:億円) (¥100 million) (516,542) (656,565) (673,996) (756,139) (684,066)
( E U ) 16.3 14.7 11.3 10.6 9.4( B R I C S ) 7.9 15.8 22.9 20.7 25.1
Notes : 1. EUは、2000年は EU15ヵ国、2005年は EU25ヵ国、2010年は EU27ヵ国、2015年は EU28ヵ国、2020年は EU27ヵ国の数値(2020年 1月まで EU28ヵ国の数値)。
EU data were taken from 15 EU member countries in 2000, from 25 EU member countries in 2005, from 27 EU member countries in 2010, from 28 EU member countries in 2015 and from 27 EU member countries in 2020 (28 EU member countries until January, 2020). 2. BRICSはブラジル、ロシア、インド、中国、南アフリカより本会算出。 Figures for BRICS are calculated from Brazil, Russia, India, China and South Africa by JFTC.Source : 財務省貿易統計より作成。 Compiled from MOF's Trade Statistics on a Customs-cleared Basis.
資料編▶2.貿易構造90 Data Chapter▶2.Trade Structure 91

(3) 地域別輸入構成比 Ratio of Imports by Area/Country (%) (4) 地域別貿易収支 Trade Balance by Area/Country (億円 ¥100 million)
地域(国)名 Area/Country 2000 2005 2010 2015 2020
ア ジ ア Asia 41.7 44.4 45.3 48.9 51.1中 国 China 14.5 21.0 22.1 24.8 25.8香 港 Hong Kong 0.4 0.3 0.2 0.3 0.1台 湾 Taiwan 4.7 3.5 3.3 3.6 4.2韓 国 Korea 5.4 4.7 4.1 4.1 4.2シ ン ガ ポ ー ル Singapore 1.7 1.3 1.2 1.2 1.3タ イ Thailand 2.8 3.0 3.0 3.2 3.7マ レ ー シ ア Malaysia 3.8 2.8 3.3 3.3 2.5イ ン ド ネ シ ア Indonesia 4.3 4.0 4.1 3.0 2.4フ ィ リ ピ ン Ph ilippines 1.9 1.5 1.1 1.4 1.5ベ ト ナ ム Viet Nam 0.7 0.9 1.2 2.3 3.5イ ン ド India 0.7 0.6 0.8 0.8 0.7
大 洋 州 Oceania 4.7 5.4 7.1 6.2 6.4オーストラリア Australia 3.9 4.8 6.5 5.4 5.6ニュージーランド New Zealand 0.6 0.5 0.4 0.4 0.4
北 米 North America 21.3 14.2 11.3 11.7 12.7米 国 USA 19.0 12.4 9.7 10.3 11.0カ ナ ダ Canada 2.3 1.7 1.6 1.4 1.7
中 南 米 Central South America 2.9 3.1 4.1 3.9 4.3ブ ラ ジ ル Brazil 0.8 0.9 1.4 1.2 1.2メ キ シ コ Mexico 0.6 0.5 0.5 0.7 0.9チ リ Chile 0.7 1.0 1.1 0.9 1.0
西 欧 Western Europe 13.6 12.4 10.6 11.9 13.2ド イ ツ Germany 3.4 3.5 2.8 3.1 3.3英 国 UK 1.7 1.3 0.9 1.0 1.0フ ラ ン ス France 1.7 1.7 1.5 1.5 1.5オ ラ ン ダ Netherlands 0.5 0.4 0.6 0.4 0.5イ タ リ ア Italy 1.4 1.3 1.0 1.2 1.7
中東欧・ロシア等 Central & Eastern Eupope, Russia, etc. 1.5 1.6 2.8 3.3 2.7ロ シ ア Russia 1.2 1.2 2.3 2.4 1.7
中 東 Middle East 13.0 17.0 17.1 12.2 8.2アラブ首長国連邦 UAE 3.9 4.9 4.2 3.6 2.6サウジアラビア Saudi Arabia 3.7 5.6 5.2 3.9 2.9ク ウ ェ ー ト Kuwait 1.3 1.5 1.5 1.0 0.7イ ラ ン Iran 1.4 2.0 1.6 0.5 0.0
ア フ リ カ Africa 1.3 1.9 1.7 1.8 1.4南アフリカ共和国 South Africa 0.8 1.1 1.0 0.8 0.9
総 額 Grand Total 100.0 100.0 100.0 100.0 100.0 (金額:億円) (¥100 million) (409,384) (569,494) (607,650) (784,055) (677,369)
( E U ) 12.3 11.4 9.6 11.0 11.5( B R I C S ) 18.0 24.8 27.7 29.9 30.3
Notes : 1. EUは、2000年は EU15ヵ国、2005年は EU25ヵ国、2010年は EU27ヵ国、2015年は EU28ヵ国、2020年は EU27ヵ国の数値(2020年 1月まで EU28ヵ国の数値)。
EU data were taken from 15 EU member countries in 2000, from 25 EU member countries in 2005, from 27 EU member countries in 2010, from 28 EU member countries in 2015 and from 27 EU
member countries in 2020 (28 EU member countries until January, 2020). 2. BRICSはブラジル、ロシア、インド、中国、南アフリカより本会算出。 Figures for BRICS are calculated from Brazil, Russia, India, China and South Africa by JFTC.Source : 財務省貿易統計より作成。 Compiled from MOF's Trade Statistics on a Customs-cleared Basis.
地域(国)名 Area/Country 2000 2005 2010 2015 2020
ア ジ ア Asia 41,915 65,169 103,163 19,702 46,149中 国 China ▲ 26,669 ▲ 31,386 ▲ 3,274 ▲ 62,055 ▲ 23,948香 港 Hong Kong 27,500 37,951 35,714 40,086 33,296台 湾 Taiwan 19,439 28,150 25,696 16,552 18,828韓 国 Korea 11,040 24,507 29,562 20,827 19,282シ ン ガ ポ ー ル Singapore 15,503 12,954 14,939 14,461 9,759タ イ Thailand 3,271 7,601 11,537 9,145 1,868マ レ ー シ ア Malaysia ▲ 661 ▲ 2,365 ▲ 4,428 ▲ 11,490 ▲ 3,567イ ン ド ネ シ ア Indonesia ▲ 9,484 ▲ 12,812 ▲ 10,817 ▲ 9,941 ▲ 6,625フ ィ リ ピ ン Philippines 3,294 1,495 2,740 743 ▲ 531ベ ト ナ ム Viet Nam ▲ 717 ▲ 1,053 ▲ 2 ▲ 3,158 ▲ 5,264イ ン ド India ▲ 163 358 2,929 3,926 4,667
大 洋 州 Oceania ▲ 8,191 ▲ 13,839 ▲ 25,311 ▲ 27,889 ▲ 26,389オーストラリア Australia ▲ 6,721 ▲ 13,357 ▲ 25,563 ▲ 26,551 ▲ 25,090ニュージーランド New Zealand ▲ 1,001 ▲ 70 ▲ 710 ▲ 332 ▲ 691
北 米 North America 74,347 77,102 43,143 69,825 48,012米 国 USA 75,770 77,312 44,626 71,648 51,850カ ナ ダ Canada ▲ 1,325 ▲ 134 ▲ 1,414 ▲ 1,734 ▲ 3,756
中 南 米 Central South America 10,820 9,926 13,891 3,005 ▲ 6,448ブ ラ ジ ル Brazil ▲ 512 ▲ 1,887 ▲ 3,165 ▲ 4,339 ▲ 4,856メ キ シ コ Mexico 3,044 4,849 5,337 6,925 3,151チ リ Chile ▲ 2,354 ▲ 4,614 ▲ 4,407 ▲ 5,234 ▲ 5,936
西 欧 Western Europe 34,331 26,840 15,853 ▲ 12,447 ▲ 13,164ド イ ツ Germany 7,833 902 876 ▲ 4,894 ▲ 3,873英 国 UK 8,893 9,235 6,818 5,112 4,604フ ラ ン ス France 1,125 ▲ 845 ▲ 3,168 ▲ 5,126 ▲ 3,839オ ラ ン ダ Netherlands 11,406 12,131 10,829 10,758 8,320イ タ リ ア Italy 515 ▲ 1,259 ▲ 1,053 ▲ 4,763 ▲ 7,168
中東欧・ロシア等 Central & Eastern Europe, Russia, etc. ▲ 3,521 2,083 ▲ 2,944 ▲ 12,471 ▲ 3,255ロ シ ア Russia ▲ 4,324 ▲ 1,874 ▲ 7,093 ▲ 12,871 ▲ 5,182
中 東 Middle East ▲ 42,633 ▲ 78,407 ▲ 81,701 ▲ 64,043 ▲ 37,482アラブ首長国連邦 UAE ▲ 13,269 ▲ 22,607 ▲ 19,262 ▲ 17,941 ▲ 11,561サウジアラビア Saudi Arabia ▲ 11,982 ▲ 27,101 ▲ 25,814 ▲ 22,093 ▲ 15,168ク ウ ェ ー ト Kuwait ▲ 4,753 ▲ 7,126 ▲ 7,765 ▲ 5,502 ▲ 3,367イ ラ ン Iran ▲ 5,160 ▲ 9,921 ▲ 7,979 ▲ 3,586 49
ア フ リ カ Africa 92 ▲ 1,874 255 ▲ 3,596 ▲ 716南アフリカ共和国 South Africa ▲ 1,227 ▲ 2,501 ▲ 3,008 ▲ 2,728 ▲ 4,354
総 額 Grand Total 107,158 87,072 66,347 ▲ 27,916 6,697( E U ) 33,890 31,817 17,948 ▲ 6,398 ▲ 13,275( B R I C S ) ▲ 32,895 ▲ 37,290 ▲ 13,612 ▲ 78,066 ▲ 33,673
Notes : 1. ▲は輸入超過、他は輸出超過。 ▲ indicates a deficit. Figures without a mark indicate a surplus. 2. BRICSはブラジル、ロシア、インド、中国、南アフリカ共和国より本会算出。 Figures for BRICS are calculated from Brazil, Russia, India, China and South Africa by JFTC.Source : 財務省貿易統計より作成。 Compiled from MOF's Trade Statistics on a Customs-cleared Basis.
資料編▶2.貿易構造92 Data Chapter▶2.Trade Structure 93

(5) 主要地域別貿易 Trade by Major Area/Country①対アジア貿易 Trade with Asia(輸出 Exports)
品名 Commodity
2019 2020金額 前年比伸び率 金額 前年比伸び率(億円) (%) (億円) (%)(¥100 million) Change from
previous year (¥100 million) Change from previous year
総 額 Grand Total 413,268 ▲ 7.6 392,244 ▲ 5.11 食 料 品 Foodstuff 5,476 1.4 5,929 8.32 原 料 品 Raw Materials 8,217 ▲ 12.5 8,224 0.13 鉱 物 性 燃 料 Mineral Fuels 6,755 ▲ 11.4 4,949 ▲ 26.74 化 学 製 品 Chemicals 64,146 ▲ 3.4 62,127 ▲ 3.1
有 機 化 合 物 Organic Chemicals 13,770 ▲ 8.6 10,220 ▲ 25.8医 薬 品 Medical Products 2,656 16.5 2,832 6.7プ ラ ス チ ッ ク Plastic Materials 19,665 ▲ 4.8 20,086 2.1
5 原 料 別 製 品 Manufactured Goods 57,124 ▲ 10.5 52,526 ▲ 8.0鉄 鋼 Iron & Steel Products 22,634 ▲ 13.8 18,830 ▲ 16.8非 鉄 金 属 Nonferrous Metals 11,476 ▲ 11.6 13,811 20.3金 属 製 品 Manufactures of Metals 7,144 ▲ 8.3 6,251 ▲ 12.5織 物 用 糸・ 繊 維 製 品 Textile Yarn, Fabrics 5,293 ▲ 2.7 4,395 ▲ 17.0非 金 属 鉱 物 製 品 Non-metallic Mineral Ware 5,672 ▲ 4.8 4,912 ▲ 13.4ゴ ム 製 品 Rubber manufactured 2,512 ▲ 5.5 2,050 ▲ 18.4紙 類・ 紙 製 品 Paper & Paper Manufactures 2,188 ▲ 13.5 2,114 ▲ 3.4
6 一 般 機 械 Machinery 80,326 ▲ 11.5 74,778 ▲ 6.9原 動 機 Power Generating Machine 10,962 ▲ 11.9 9,569 ▲ 12.7電算機類(含周辺機器)Computers & Units 815 ▲ 15.2 739 ▲ 9.2電 算 機 類 の 部 分 品 Parts of Computer 4,678 ▲ 11.4 4,396 ▲ 6.0半 導 体 等 製 造 装 置 Semicon Machinery etc. 19,135 ▲ 15.6 20,827 8.8金 属 加 工 機 械 Metalworking Machinery 5,700 ▲ 17.9 4,677 ▲ 17.9ポ ン プ 遠 心 分 離 機 Pump & Centrifuges 6,471 ▲ 4.1 6,344 ▲ 2.0建 設 用・ 鉱 山 用 機 械 Construction Machines 2,314 ▲ 19.8 1,721 ▲ 25.6荷 役 機 械 Mechanical Handling Equip. 3,081 ▲ 8.2 2,275 ▲ 26.2加 熱 用・ 冷 却 用 機 器 Heating or Cooling Equipments 2,031 ▲ 5.5 1,740 ▲ 14.3繊 維 機 械 Textile Machines 1,859 ▲ 12.0 1,496 ▲ 19.5ベ ア リ ン グ Ball or Roller Bearings 2,503 ▲ 8.2 2,163 ▲ 13.6
7 電 気 機 器 Electrical Machinery 89,532 ▲ 6.9 90,728 1.3半 導 体 等 電 子 部 品 Semiconductors etc. 35,900 ▲ 2.6 37,136 3.4( I C )(IC) 26,466 ▲ 1.2 26,720 1.0音 響・ 映 像 機 器 Audio & Visual Apparatus 1,754 ▲ 23.6 1,364 ▲ 22.2(映像記録・再生機器)(Video Rec. or Repro App.) 1,259 ▲ 26.3 1,035 ▲ 17.8( テ レ ビ 受 像 機 )(Television Receivers) 291 ▲ 20.7 177 ▲ 39.3音響・映像機器の部分品 Parts of Audio, Visual App. 1,552 ▲ 13.2 1,405 ▲ 9.4重 電 機 器 Electrical Power Machinery 4,911 ▲ 6.6 5,481 11.6通 信 機 Telephony, Telegraphy 2,257 ▲ 31.5 2,137 ▲ 5.3電 気 計 測 機 器 Electrical Measuring 9,230 ▲ 7.4 9,334 1.1電 気 回 路 等 の 機 器 Electrical Apparatus 13,977 ▲ 11.8 13,657 ▲ 2.3電 池 Batteries & Accumulators 1,955 ▲ 8.0 1,936 ▲ 1.0
8 輸 送 用 機 器 Transport Equipment 39,056 ▲ 5.4 33,244 ▲ 14.9自 動 車 Motor Vehicles 19,209 ▲ 1.9 17,513 ▲ 8.8( 乗 用 車 )(Passenger Motor Car) 15,271 1.1 14,835 ▲ 2.9(バス・トラック)(Buses & Trucks) 3,553 ▲ 11.9 2,416 ▲ 32.0自 動 車 の 部 分 品 Parts of Motor Vehicles 14,932 ▲ 14.5 11,830 ▲ 20.8二 輪 自 動 車 Motorcycles, Autocycles 318 0.1 247 ▲ 22.4航 空 機 類 Aircraft 241 20.9 138 ▲ 42.7船 舶 Ships 3,263 40.2 2,276 ▲ 30.2
9 そ の 他 Others 62,637 ▲ 5.7 59,740 ▲ 4.6科 学 光 学 機 器 Scientific, Optical Inst. 14,227 ▲ 10.1 13,391 ▲ 5.9写 真 用・ 映 画 用 材 料 Photographic Supplies 3,373 1.5 3,457 2.5
(輸入 Imports)
品名 Commodity
2019 2020金額 前年比伸び率 金額 前年比伸び率(億円) (%) (億円) (%)(¥100 million) Change from
previous year (¥100 million) Change from previous year
総 額 Grand Total 374,130 ▲ 4.6 346,096 ▲ 7.51 食 料 品 Foodstuff 23,653 ▲ 1.5 21,769 ▲ 8.0
魚 介 類・ 同 調 製 品 Fish & Fish Preparation 8,083 ▲ 2.8 6,787 ▲ 16.0肉 類・ 同 調 製 品 Meat & Meat Preparation 3,364 ▲ 1.5 3,020 ▲ 10.2穀 物・ 同 調 製 品 Cereals, Cereal Preparation 833 1.8 901 8.2野 菜 Vegetables 3,532 ▲ 2.4 3,258 ▲ 7.8果 実 Fruits 2,219 ▲ 1.5 2,200 ▲ 0.8
2 原 料 品 Raw Materials 12,008 ▲ 14.7 11,611 ▲ 3.3木 材 Wood 425 ▲ 6.0 320 ▲ 24.8非 鉄 金 属 鉱 Ore of Nonferrous 2,402 ▲ 39.5 2,572 7.1鉄 鉱 石 Iron Ore & Concentrates 382 134.0 270 ▲ 29.2大 豆 Soy Beans 26 ▲ 4.6 25 ▲ 5.0
3 鉱 物 性 燃 料 Mineral Fuels 20,846 ▲ 20.0 14,934 ▲ 28.4原 油 及 び 粗 油 Petroleum 888 ▲ 38.3 433 ▲ 51.2石 油 製 品 Petroleum Products 6,328 ▲ 23.8 4,859 ▲ 23.2( 揮 発 油 )(Petroleum Spirits) 3,466 ▲ 15.6 2,814 ▲ 18.8液 化 天 然 ガ ス LNG 9,855 ▲ 15.1 6,981 ▲ 29.2液 化 石 油 ガ ス LPG 68 ▲ 1.8 68 ▲ 0.7石 炭 Coal 3,403 ▲ 13.7 2,434 ▲ 28.5
4 化 学 製 品 Chemicals 29,711 ▲ 8.6 27,390 ▲ 7.8有 機 化 合 物 Organic Chemicals 7,317 ▲ 16.9 7,036 ▲ 3.8医 薬 品 Medical Products 2,995 0.5 3,152 5.2
5 原 料 別 製 品 Manufactured Goods 46,212 ▲ 3.2 43,346 ▲ 6.2鉄 鋼 Iron & Steel Products 7,049 ▲ 3.1 5,321 ▲ 24.5非 鉄 金 属 Nonferrous Metals 5,328 ▲ 13.4 4,482 ▲ 15.9金 属 製 品 Manufactures of Metals 10,777 1.0 9,574 ▲ 11.2織 物 用 糸・ 繊 維 製 品 Textile Yarn, Fabrics 8,372 ▲ 2.4 11,588 38.4非 金 属 鉱 物 製 品 Non-metallic Mineral Ware 4,838 ▲ 7.2 4,087 ▲ 15.5木 製 品 等( 除 家 具 )Wood & Cork manufactured 5,084 ▲ 2.6 4,175 ▲ 17.9
6 一 般 機 械 Machinery 50,445 ▲ 0.9 49,144 ▲ 2.6原 動 機 Power Generating Machine 2,568 ▲ 17.8 2,075 ▲ 19.2電算機類(含周辺機器)Computers & Units 20,013 8.3 22,120 10.5電 算 機 類 の 部 分 品 Parts of Computer 4,867 5.0 3,876 ▲ 20.4
7 電 気 機 器 Electrical Machinery 97,324 ▲ 3.8 93,966 ▲ 3.4半 導 体 等 電 子 部 品 Semiconductors etc. 21,611 ▲ 8.7 21,429 ▲ 0.8( I C )(IC) 16,413 ▲ 9.5 16,795 2.3絶縁電線・絶縁ケーブル Insulated Wire and Cable 7,839 0.1 7,101 ▲ 9.4音響映像機器(含部品)Audio & Visual Apparatus 11,527 7.5 11,140 ▲ 3.4重 電 機 器 Electrical Power Machinery 5,477 1.8 4,954 ▲ 9.5通 信 機 Telephony, Telegraphy 26,129 ▲ 8.6 26,286 0.6( 電 話 機 )(Telephone Sets) 16,934 ▲ 13.9 16,023 ▲ 5.4電 気 計 測 機 器 Electrical Measuring 3,030 ▲ 3.2 2,611 ▲ 13.8
8 輸 送 用 機 器 Transport Equipment 10,111 ▲ 3.1 8,963 ▲ 11.3自 動 車 Motor Vehicles 706 ▲ 3.9 1,314 86.1自 動 車 の 部 分 品 Parts of Motor Vehicles 6,511 ▲ 5.6 4,944 ▲ 24.1航 空 機 類 Aircraft 522 17.0 370 ▲ 29.0
9 そ の 他 Others 83,821 ▲ 1.7 74,971 ▲ 10.6科 学 光 学 機 器 Scientific, Optical Inst. 7,318 ▲ 0.4 7,152 ▲ 2.3衣 類・ 同 付 属 品 Clothing & Accessories 29,567 ▲ 3.5 25,244 ▲ 14.6家 具 Furniture 6,976 2.3 6,733 ▲ 3.5バ ッ グ 類 Bags 3,945 2.7 3,113 ▲ 21.1
貿 易 収 支 Trade Balance 39,138 ▲ 29.1 46,149 17.9Note : 2019年は北朝鮮、モンゴル、ベトナム、カンボジア、ラオスを加えた 26ヵ国ベース、2020年はモンゴル、ベト
ナム、カンボジア、ラオスを加えた 25ヵ国ベース。 Data on data on North Korea, Mongolia, Viet Nam, Cambodia and Laos were added to "Asia" to form 26 countries in
2019, Mongolia, Viet Nam, Cambodia and Laos were added to "Asia" to form 25 countries in 2020.Source : 財務省貿易統計より作成。 Compiled from MOF's Trade Statistics on a Customs-cleared Basis.
資料編▶2.貿易構造94 Data Chapter▶2.Trade Structure 95

②対中国貿易 Trade with China(輸出 Exports)
品名 Commodity
2019 2020金額 前年比伸び率 金額 前年比伸び率(億円) (%) (億円) (%)(¥100 million) Change from
previous year (¥100 million) Change from previous year
総 額 Grand Total 146,819 ▲ 7.6 150,828 2.71 食 料 品 Foodstuff 1,183 21.5 1,293 9.22 原 料 品 Raw Materials 2,499 ▲ 37.7 2,365 ▲ 5.43 鉱 物 性 燃 料 Mineral Fuels 1,524 ▲ 9.6 1,008 ▲ 33.94 化 学 製 品 Chemicals 25,422 ▲ 0.2 25,350 ▲ 0.3
有 機 化 合 物 Organic Chemicals 6,829 ▲ 12.7 4,550 ▲ 33.4医 薬 品 Medical Products 1,457 27.8 1,580 8.4プ ラ ス チ ッ ク Plastic Materials 8,157 ▲ 1.6 8,863 8.7
5 原 料 別 製 品 Manufactured Goods 16,665 ▲ 8.3 17,806 6.8鉄 鋼 Iron & Steel Products 4,945 ▲ 11.9 5,024 1.6非 鉄 金 属 Nonferrous Metals 3,866 ▲ 6.6 5,455 41.1金 属 製 品 Manufactures of Metals 2,626 ▲ 5.3 2,482 ▲ 5.5織 物 用 糸・ 繊 維 製 品 Textile Yarn, Fabrics 2,155 ▲ 4.8 1,781 ▲ 17.4非 金 属 鉱 物 製 品 Non-metallic Mineral Ware 1,817 ▲ 7.5 1,758 ▲ 3.3ゴ ム 製 品 Rubber manufactured 682 ▲ 5.9 606 ▲ 11.1紙 類・ 紙 製 品 Paper & Paper Manufactures 518 ▲ 19.1 656 26.6
6 一 般 機 械 Machinery 33,967 ▲ 12.6 34,099 0.4原 動 機 Power Generating Machine 4,605 ▲ 11.0 4,761 3.4電算機類(含周辺機器)Computers & Units 293 ▲ 17.1 263 ▲ 10.3電 算 機 類 の 部 分 品 Parts of Computer 1,803 ▲ 3.7 1,672 ▲ 7.3半 導 体 等 製 造 装 置 Semicon Machinery etc. 9,006 ▲ 16.6 9,579 6.4金 属 加 工 機 械 Metalworking Machinery 2,348 ▲ 32.0 2,347 ▲ 0.0ポ ン プ 遠 心 分 離 機 Pump & Centrifuges 2,610 ▲ 8.3 2,646 1.4建 設 用・ 鉱 山 用 機 械 Construction Machines 367 ▲ 5.3 239 ▲ 34.9荷 役 機 械 Mechanical Handling Equip. 972 1.0 757 ▲ 22.1加 熱 用・ 冷 却 用 機 器 Heating or Cooling Equipments 727 ▲ 14.9 708 ▲ 2.6繊 維 機 械 Textile Machines 1,162 8.2 976 ▲ 16.0ベ ア リ ン グ Ball or Roller Bearings 929 ▲ 7.2 991 6.6
7 電 気 機 器 Electrical Machinery 30,390 ▲ 10.6 32,016 5.4半 導 体 等 電 子 部 品 Semiconductors etc. 9,806 ▲ 10.6 10,037 2.4( I C )(IC) 6,949 ▲ 13.5 6,814 ▲ 1.9音 響・ 映 像 機 器 Audio & Visual Apparatus 876 ▲ 26.0 742 ▲ 15.4(映像記録・再生機器)(Video Rec. or Repro App.) 679 ▲ 27.8 613 ▲ 9.7( テ レ ビ 受 像 機 )(Television Receivers) 153 ▲ 26.8 83 ▲ 45.3音響・映像機器の部分品 Parts of Audio, Visual App. 792 ▲ 5.5 730 ▲ 7.9重 電 機 器 Electrical Power Machinery 2,079 2.0 2,553 22.8通 信 機 Telephony, Telegraphy 867 ▲ 45.5 840 ▲ 3.1電 気 計 測 機 器 Electrical Measuring 3,560 ▲ 1.9 3,938 10.6電 気 回 路 等 の 機 器 Electrical Apparatus 5,158 ▲ 15.2 5,418 5.1電 池 Batteries & Accumulators 897 ▲ 9.7 853 ▲ 4.9
8 輸 送 用 機 器 Transport Equipment 15,061 ▲ 2.1 15,963 6.0自 動 車 Motor Vehicles 7,867 23.4 9,111 15.8( 乗 用 車 )(Passenger Motor Car) 7,856 23.5 9,103 15.9(バス・トラック)(Buses & Trucks) 11 ▲ 20.0 8 ▲ 28.4自 動 車 の 部 分 品 Parts of Motor Vehicles 6,853 ▲ 21.1 6,451 ▲ 5.9二 輪 自 動 車 Motorcycles, Autocycles 33 43.5 66 102.3航 空 機 類 Aircraft 33 49.9 35 6.1船 舶 Ships - ZENGEN 3 ZENZO
9 そ の 他 Others 20,108 ▲ 1.6 20,929 4.1科 学 光 学 機 器 Scientific, Optical Inst. 7,503 ▲ 9.9 6,847 ▲ 8.7写 真 用・ 映 画 用 材 料 Photographic Supplies 1,118 6.7 1,139 1.9
(輸入 Imports)
品名 Commodity
2019 2020金額 前年比伸び率 金額 前年比伸び率(億円) (%) (億円) (%)(¥100 million) Change from
previous year (¥100 million) Change from previous year
総 額 Grand Total 184,537 ▲ 3.9 174,776 ▲ 5.31 食 料 品 Foodstuff 8,995 ▲ 4.9 8,200 ▲ 8.8
魚 介 類・ 同 調 製 品 Fish & Fish Preparation 2,942 ▲ 4.0 2,461 ▲ 16.3肉 類・ 同 調 製 品 Meat & Meat Preparation 1,135 ▲ 5.1 910 ▲ 19.8穀 物・ 同 調 製 品 Cereals, Cereal Preparation 326 ▲ 3.6 340 4.1野 菜 Vegetables 2,621 ▲ 4.3 2,436 ▲ 7.0果 実 Fruits 783 ▲ 2.7 756 ▲ 3.4
2 原 料 品 Raw Materials 2,345 9.4 2,033 ▲ 13.3木 材 Wood 170 ▲ 6.6 135 ▲ 20.6非 鉄 金 属 鉱 Ore of Nonferrous 20 ▲ 16.0 13 ▲ 31.1鉄 鉱 石 Iron Ore & Concentrates 178 929.9 61 ▲ 65.5大 豆 Soy Beans 26 ▲ 5.0 25 ▲ 4.4
3 鉱 物 性 燃 料 Mineral Fuels 1,156 ▲ 29.0 729 ▲ 36.9原 油 及 び 粗 油 Petroleum - - - -石 油 製 品 Petroleum Products 514 ▲ 21.1 449 ▲ 12.7( 揮 発 油 )(Petroleum Spirits) 152 28.5 133 ▲ 12.8液 化 天 然 ガ ス LNG 23 ZENZO - ZENGEN液 化 石 油 ガ ス LPG 0 ▲ 12.1 0 58.2石 炭 Coal 319 1.0 124 ▲ 61.2
4 化 学 製 品 Chemicals 11,959 ▲ 7.5 10,782 ▲ 9.8有 機 化 合 物 Organic Chemicals 3,589 ▲ 7.6 3,274 ▲ 8.8医 薬 品 Medical Products 806 ▲ 10.1 768 ▲ 4.7
5 原 料 別 製 品 Manufactured Goods 22,091 ▲ 2.7 22,889 3.6鉄 鋼 Iron & Steel Products 1,833 ▲ 5.5 1,281 ▲ 30.1非 鉄 金 属 Nonferrous Metals 2,062 ▲ 12.4 1,455 ▲ 29.5金 属 製 品 Manufactures of Metals 6,760 1.0 6,147 ▲ 9.1織 物 用 糸・ 繊 維 製 品 Textile Yarn, Fabrics 5,068 ▲ 3.8 8,495 67.6非 金 属 鉱 物 製 品 Non-metallic Mineral Ware 2,602 ▲ 5.2 2,224 ▲ 14.5木 製 品 等( 除 家 具 )Wood & Cork manufactured 1,309 ▲ 3.9 1,159 ▲ 11.5
6 一 般 機 械 Machinery 33,850 2.2 34,084 0.7原 動 機 Power Generating Machine 1,128 ▲ 31.5 836 ▲ 25.9電算機類(含周辺機器)Computers & Units 16,415 9.4 18,843 14.8電 算 機 類 の 部 分 品 Parts of Computer 3,619 5.4 2,690 ▲ 25.7
7 電 気 機 器 Electrical Machinery 52,948 ▲ 5.0 50,994 ▲ 3.7半 導 体 等 電 子 部 品 Semiconductors etc. 4,897 ▲ 2.6 4,624 ▲ 5.6( I C )(IC) 1,994 ▲ 3.5 1,866 ▲ 6.4絶縁電線・絶縁ケーブル Insulated Wire and Cable 2,195 ▲ 7.6 1,918 ▲ 12.6音響映像機器(含部品)Audio & Visual Apparatus 7,292 6.1 7,555 3.6重 電 機 器 Electrical Power Machinery 3,615 3.6 3,273 ▲ 9.5通 信 機 Telephony, Telegraphy 20,168 ▲ 11.3 19,497 ▲ 3.3( 電 話 機 )(Telephone Sets) 14,483 ▲ 14.5 13,354 ▲ 7.8電 気 計 測 機 器 Electrical Measuring 1,458 ▲ 3.9 1,229 ▲ 15.7
8 輸 送 用 機 器 Transport Equipment 4,871 ▲ 4.5 4,147 ▲ 14.9自 動 車 Motor Vehicles 51 ▲ 8.1 33 ▲ 35.0自 動 車 の 部 分 品 Parts of Motor Vehicles 3,287 ▲ 6.8 2,542 ▲ 22.7航 空 機 類 Aircraft 24 56.3 35 43.8
9 そ の 他 Others 46,321 ▲ 5.7 40,918 ▲ 11.7科 学 光 学 機 器 Scientific, Optical Inst. 3,351 ▲ 0.4 3,257 ▲ 2.8衣 類・ 同 付 属 品 Clothing & Accessories 17,909 ▲ 7.9 14,759 ▲ 17.6家 具 Furniture 4,639 1.4 4,523 ▲ 2.5バ ッ グ 類 Bags 2,626 ▲ 0.1 2,050 ▲ 21.9
貿 易 収 支 Trade Balance ▲ 37,718 14.4 ▲ 23,948 ▲ 36.5Source : 財務省貿易統計より作成。 Compiled from MOF's Trade Statistics on a Customs-cleared Basis.
資料編▶2.貿易構造96 Data Chapter▶2.Trade Structure 97

③対米国貿易 Trade with USA(輸出 Exports)
品名 Commodity
2019 2020金額 前年比伸び率 金額 前年比伸び率(億円) (%) (億円) (%)(¥100 million) Change from
previous year (¥100 million) Change from previous year
総 額 Grand Total 152,545 ▲ 1.4 126,125 ▲ 17.31 食 料 品 Foodstuff 1,062 6.8 1,004 ▲ 5.42 原 料 品 Raw Materials 779 2.3 894 14.83 鉱 物 性 燃 料 Mineral Fuels 1,314 45.3 454 ▲ 65.54 化 学 製 品 Chemicals 10,660 5.7 9,742 ▲ 8.6
有 機 化 合 物 Organic Chemicals 1,670 ▲ 11.6 1,599 ▲ 4.2医 薬 品 Medical Products 2,722 33.3 2,687 ▲ 1.3プ ラ ス チ ッ ク Plastic Materials 1,981 ▲ 2.0 1,651 ▲ 16.7
5 原 料 別 製 品 Manufactured Goods 9,702 ▲ 1.3 7,809 ▲ 19.5鉄 鋼 Iron & Steel Products 1,889 ▲ 7.4 1,290 ▲ 31.7非 鉄 金 属 Nonferrous Metals 1,128 6.3 881 ▲ 21.9金 属 製 品 Manufactures of Metals 2,433 1.8 2,072 ▲ 14.8織 物 用 糸・ 繊 維 製 品 Textile Yarn, Fabrics 559 ▲ 4.6 513 ▲ 8.2非 金 属 鉱 物 製 品 Non-metallic Mineral Ware 1,311 ▲ 4.1 1,120 ▲ 14.6ゴ ム 製 品 Rubber manufactured 2,052 2.6 1,702 ▲ 17.1紙 類・ 紙 製 品 Paper & Paper Manufactures 315 ▲ 16.3 219 ▲ 30.4
6 一 般 機 械 Machinery 36,199 3.7 28,391 ▲ 21.6原 動 機 Power Generating Machine 8,976 ▲ 1.8 6,676 ▲ 25.6電算機類(含周辺機器)Computers & Units 1,252 3.7 968 ▲ 22.7電 算 機 類 の 部 分 品 Parts of Computer 2,492 0.9 2,096 ▲ 15.9半 導 体 等 製 造 装 置 Semicon Machinery etc. 4,558 58.1 3,285 ▲ 27.9金 属 加 工 機 械 Metalworking Machinery 2,375 0.2 1,595 ▲ 32.8ポ ン プ 遠 心 分 離 機 Pump & Centrifuges 2,303 ▲ 4.1 2,204 ▲ 4.3建 設 用・ 鉱 山 用 機 械 Construction Machines 4,415 10.0 3,298 ▲ 25.3荷 役 機 械 Mechanical Handling Equip. 1,571 ▲ 7.1 1,184 ▲ 24.7加 熱 用・ 冷 却 用 機 器 Heating or Cooling Equipments 975 0.3 883 ▲ 9.4繊 維 機 械 Textile Machines 110 ▲ 10.1 71 ▲ 35.2ベ ア リ ン グ Ball or Roller Bearings 872 ▲ 3.1 636 ▲ 27.0
7 電 気 機 器 Electrical Machinery 19,887 ▲ 6.2 18,073 ▲ 9.1半 導 体 等 電 子 部 品 Semiconductors etc. 2,118 ▲ 9.4 1,809 ▲ 14.6( I C )(IC) 1,003 ▲ 11.8 813 ▲ 18.9音 響・ 映 像 機 器 Audio & Visual Apparatus 1,575 3.1 1,424 ▲ 9.6(映像記録・再生機器)(Video Rec. or Repro App.) 965 ▲ 3.8 860 ▲ 10.9( テ レ ビ 受 像 機 )(Television Receivers) 448 20.8 399 ▲ 10.9音響・映像機器の部分品 Parts of Audio, Visual App. 437 11.0 221 ▲ 49.4重 電 機 器 Electrical Power Machinery 1,883 1.8 2,168 15.2通 信 機 Telephony, Telegraphy 1,082 ▲ 14.2 843 ▲ 22.1電 気 計 測 機 器 Electrical Measuring 3,025 ▲ 7.5 2,668 ▲ 11.8電 気 回 路 等 の 機 器 Electrical Apparatus 2,111 ▲ 3.9 1,877 ▲ 11.1電 池 Batteries & Accumulators 1,805 ▲ 20.3 1,804 ▲ 0.1
8 輸 送 用 機 器 Transport Equipment 56,451 ▲ 5.5 45,199 ▲ 19.9自 動 車 Motor Vehicles 42,889 ▲ 5.2 34,666 ▲ 19.2( 乗 用 車 )(Passenger Motor Car) 41,915 ▲ 5.2 34,204 ▲ 18.4(バス・トラック)(Buses & Trucks) 966 0.7 457 ▲ 52.7自 動 車 の 部 分 品 Parts of Motor Vehicles 8,346 ▲ 10.2 6,993 ▲ 16.2二 輪 自 動 車 Motorcycles, Autocycles 564 ▲ 34.7 503 ▲ 10.7航 空 機 類 Aircraft 4,337 10.6 2,787 ▲ 35.7船 舶 Ships - - - -
9 そ の 他 Others 16,493 1.2 14,558 ▲ 11.7科 学 光 学 機 器 Scientific, Optical Inst. 3,355 ▲ 0.8 3,017 ▲ 10.1写 真 用・ 映 画 用 材 料 Photographic Supplies 963 ▲ 4.9 731 ▲ 24.1
(輸入 Imports)
品名 Commodity
2019 2020金額 前年比伸び率 金額 前年比伸び率(億円) (%) (億円) (%)(¥100 million) Change from
previous year (¥100 million) Change from previous year
総 額 Grand Total 86,402 ▲ 4.2 74,275 ▲ 14.01 食 料 品 Foodstuff 13,832 ▲ 9.5 13,101 ▲ 5.3
魚 介 類・ 同 調 製 品 Fish a& Fish Preparation 1,302 ▲ 15.1 1,127 ▲ 13.5肉 類・ 同 調 製 品 Meat & Meat Preparation 3,977 ▲ 5.8 4,096 3.0穀 物・ 同 調 製 品 Cereals, Cereal Preparation 3,943 ▲ 18.3 3,515 ▲ 10.8野 菜 Vegetables 846 ▲ 1.9 785 ▲ 7.3果 実 Fruits 1,060 ▲ 9.5 1,052 ▲ 0.8
2 原 料 品 Raw Materials 5,428 12.3 5,020 ▲ 7.5木 材 Wood 625 ▲ 18.1 586 ▲ 6.3非 鉄 金 属 鉱 Ore of Nonferrous 927 170.6 665 ▲ 28.3鉄 鉱 石 Iron Ore & Concentrates 262 21.8 181 ▲ 31.1大 豆 Soy Beans 1,182 0.6 1,158 ▲ 2.0
3 鉱 物 性 燃 料 Mineral Fuels 11,032 3.2 8,171 ▲ 25.9原 油 及 び 粗 油 Petroleum 1,781 12.4 797 ▲ 55.3石 油 製 品 Petroleum Products 1,310 1.3 1,172 ▲ 10.6( 揮 発 油 )(Petroleum Spirits) 669 14.7 708 5.8液 化 天 然 ガ ス LNG 1,968 29.8 2,224 13.0液 化 石 油 ガ ス LPG 3,815 ▲ 12.1 2,890 ▲ 24.2石 炭 Coal 2,158 10.2 1,088 ▲ 49.6
4 化 学 製 品 Chemicals 13,585 ▲ 6.2 13,452 ▲ 1.0有 機 化 合 物 Organic Chemicals 2,903 ▲ 9.9 2,659 ▲ 8.4医 薬 品 Medical Products 4,847 4.6 5,523 13.9
5 原 料 別 製 品 Manufactured Goods 4,038 ▲ 0.7 3,450 ▲ 14.6鉄 鋼 Iron & Steel Products 176 ▲ 7.4 154 ▲ 12.4非 鉄 金 属 Nonferrous Metals 1,060 3.7 972 ▲ 8.3金 属 製 品 Manufactures of Metals 854 4.6 668 ▲ 21.7織 物 用 糸・ 繊 維 製 品 Textile Yarn, Fabrics 251 2.7 199 ▲ 20.7非 金 属 鉱 物 製 品 Non-metallic Mineral Ware 768 ▲ 1.5 653 ▲ 14.9木 製 品 等( 除 家 具 )Wood & Cork manufactured 240 ▲ 3.2 180 ▲ 25.0
6 一 般 機 械 Machinery 11,932 ▲ 17.5 10,191 ▲ 14.6原 動 機 Power Generating Machine 5,818 ▲ 18.3 4,235 ▲ 27.2電算機類(含周辺機器)Computers & Units 1,186 22.4 1,010 ▲ 14.9電 算 機 類 の 部 分 品 Parts of Computer 120 ▲ 12.0 102 ▲ 15.1
7 電 気 機 器 Electrical Machinery 10,816 ▲ 0.1 9,033 ▲ 16.5半 導 体 等 電 子 部 品 Semiconductors etc. 2,771 ▲ 7.5 2,317 ▲ 16.4( I C )(IC) 2,604 ▲ 6.8 2,105 ▲ 19.2絶縁電線・絶縁ケーブル Insulated Wire and Cable 207 21.9 168 ▲ 19.0音響映像機器(含部品)Audio & Visual Apparatus 1,166 8.3 817 ▲ 30.0重 電 機 器 Electrical Power Machinery 303 ▲ 16.5 279 ▲ 7.9通 信 機 Telephony, Telegraphy 901 ▲ 3.6 767 ▲ 14.9( 電 話 機 )(Telephone Sets) 3 ▲ 12.8 2 ▲ 31.3電 気 計 測 機 器 Electrical Measuring 2,151 ▲ 5.5 1,689 ▲ 21.5
8 輸 送 用 機 器 Transport Equipment 7,082 5.2 4,355 ▲ 38.5自 動 車 Motor Vehicles 1,327 32.0 1,115 ▲ 16.0自 動 車 の 部 分 品 Parts of Motor Vehicles 505 ▲ 27.9 361 ▲ 28.6航 空 機 類 Aircraft 4,992 4.9 2,662 ▲ 46.7
9 そ の 他 Others 8,657 ▲ 1.3 7,503 ▲ 13.3科 学 光 学 機 器 Scientific, Optical Inst. 4,597 ▲ 0.0 3,968 ▲ 13.7衣 類・ 同 付 属 品 Clothing & Accessories 127 ▲ 5.4 92 ▲ 27.6家 具 Furniture 154 13.5 134 ▲ 12.9バ ッ グ 類 Bags 27 ▲ 3.1 20 ▲ 24.9
貿 易 収 支 Trade Balance 66,143 2.5 51,850 ▲ 21.6Source : 財務省貿易統計より作成。 Compiled from MOF's Trade Statistics on a Customs-cleared Basis.
資料編▶2.貿易構造98 Data Chapter▶2.Trade Structure 99

④対 EU貿易 Trade with EU(輸出 Exports)
品名 Commodity
2019 2020金額 前年比伸び率 金額 前年比伸び率(億円) (%) (億円) (%)(¥100 million) Change from
previous year (¥100 million) Change from previous year
総 額 Grand Total 89,553 ▲ 2.8 64,618 ▲ 14.61 食 料 品 Foodstuff 369 9.6 316 0.42 原 料 品 Raw Materials 864 ▲ 5.2 584 ▲ 17.63 鉱 物 性 燃 料 Mineral Fuels 578 32.8 178 ▲ 61.24 化 学 製 品 Chemicals 8,506 ▲ 1.4 8,150 5.1
有 機 化 合 物 Organic Chemicals 2,645 2.7 2,594 4.1医 薬 品 Medical Products 1,121 ▲ 23.8 1,002 17.1プ ラ ス チ ッ ク Plastic Materials 1,744 ▲ 7.3 1,585 ▲ 1.5
5 原 料 別 製 品 Manufactured Goods 5,427 ▲ 9.1 3,992 ▲ 17.0鉄 鋼 Iron & Steel Products 684 ▲ 5.3 534 ▲ 8.1非 鉄 金 属 Nonferrous Metals 661 ▲ 20.0 490 ▲ 4.5金 属 製 品 Manufactures of Metals 1,308 ▲ 4.4 920 ▲ 19.8織 物 用 糸・ 繊 維 製 品 Textile Yarn, Fabrics 653 ▲ 3.0 496 ▲ 19.9非 金 属 鉱 物 製 品 Non-metallic Mineral Ware 966 ▲ 9.6 738 ▲ 19.4ゴ ム 製 品 Rubber manufactured 982 ▲ 13.9 661 ▲ 23.8紙 類・ 紙 製 品 Paper & Paper Manufactures 169 0.4 147 ▲ 10.1
6 一 般 機 械 Machinery 20,190 ▲ 8.8 14,217 ▲ 19.3原 動 機 Power Generating Machine 3,825 ▲ 6.9 1,897 ▲ 31.4電算機類(含周辺機器)Computers & Units 1,285 ▲ 3.5 1,021 ▲ 10.6電 算 機 類 の 部 分 品 Parts of Computer 2,032 ▲ 13.7 1,781 ▲ 10.3半 導 体 等 製 造 装 置 Semicon Machinery etc. 608 ▲ 27.7 671 12.7金 属 加 工 機 械 Metalworking Machinery 1,674 ▲ 7.5 825 ▲ 46.2ポ ン プ 遠 心 分 離 機 Pump & Centrifuges 1,997 ▲ 8.6 1,689 ▲ 8.3建 設 用・ 鉱 山 用 機 械 Construction Machines 2,427 ▲ 2.3 1,691 ▲ 18.7荷 役 機 械 Mechanical Handling Equip. 741 ▲ 12.4 513 ▲ 23.9加 熱 用・ 冷 却 用 機 器 Heating or Cooling Equipments 689 ▲ 1.6 451 ▲ 13.4繊 維 機 械 Textile Machines 105 ▲ 20.2 72 ▲ 22.0ベ ア リ ン グ Ball or Roller Bearings 790 ▲ 7.1 496 ▲ 32.8
7 電 気 機 器 Electrical Machinery 14,999 ▲ 7.2 11,870 ▲ 9.9半 導 体 等 電 子 部 品 Semiconductors etc. 1,736 ▲ 12.4 1,487 ▲ 11.1( I C )(IC) 789 ▲ 21.2 624 ▲ 18.7音 響・ 映 像 機 器 Audio & Visual Apparatus 772 ▲ 16.9 601 ▲ 12.7(映像記録・再生機器)(Video Rec. or Repro App.) 543 ▲ 15.4 464 ▲ 7.7( テ レ ビ 受 像 機 )(Television Receivers) 191 ▲ 19.3 95 ▲ 37.0音響・映像機器の部分品 Parts of Audio, Visual App. 159 0.2 123 ▲ 14.4重 電 機 器 Electrical Power Machinery 1,497 3.8 1,196 ▲ 2.5通 信 機 Telephony, Telegraphy 808 ▲ 9.8 494 ▲ 32.3電 気 計 測 機 器 Electrical Measuring 2,944 1.2 2,339 ▲ 15.0電 気 回 路 等 の 機 器 Electrical Apparatus 1,400 ▲ 14.8 1,027 ▲ 16.0電 池 Batteries & Accumulators 1,113 ▲ 10.9 625 ▲ 0.4
8 輸 送 用 機 器 Transport Equipment 24,507 2.8 15,627 ▲ 23.7自 動 車 Motor Vehicles 15,889 15.3 9,415 ▲ 27.1( 乗 用 車 )(Passenger Motor Car) 15,482 16.7 9,043 ▲ 27.8(バス・トラック)(Buses & Trucks) 407 ▲ 19.7 372 ▲ 7.6自 動 車 の 部 分 品 Parts of Motor Vehicles 5,310 ▲ 0.5 3,923 ▲ 18.4二 輪 自 動 車 Motorcycles, Autocycles 1,241 ▲ 18.4 960 ▲ 19.4航 空 機 類 Aircraft 163 6.3 149 3.4船 舶 Ships 668 ▲ 47.8 431 ▲ 26.5
9 そ の 他 Others 14,113 3.2 9,681 ▲ 6.1科 学 光 学 機 器 Scientific, Optical Inst. 2,797 ▲ 3.2 2,343 ▲ 11.1写 真 用・ 映 画 用 材 料 Photographic Supplies 754 ▲ 5.7 437 ▲ 15.5
(輸入 Imports)
品名 Commodity
2019 2020金額 前年比伸び率 金額 前年比伸び率(億円) (%) (億円) (%)(¥100 million) Change from
previous year (¥100 million) Change from previous year
総 額 Grand Total 97,222 0.0 77,893 ▲ 12.61 食 料 品 Foodstuff 11,206 2.8 9,732 ▲ 8.9
魚 介 類・ 同 調 製 品 Fish & Fish Preparation 665 13.9 500 ▲ 20.3肉 類・ 同 調 製 品 Meat & Meat Preparation 2,127 5.9 1,710 ▲ 19.2穀 物・ 同 調 製 品 Cereals, Cereal Preparation 540 13.6 456 ▲ 4.8野 菜 Vegetables 435 ▲ 6.3 459 6.9果 実 Fruits 201 ▲ 5.6 197 ▲ 1.5
2 原 料 品 Raw Materials 2,938 1.8 2,557 ▲ 11.4木 材 Wood 905 ▲ 7.4 769 ▲ 14.9非 鉄 金 属 鉱 Ore of Nonferrous 133 ▲ 23.9 147 10.3鉄 鉱 石 Iron Ore & Concentrates 17 *1115 0 ▲ 99.9大 豆 Soy Beans - ZENGEN 0 ZENZO
3 鉱 物 性 燃 料 Mineral Fuels 274 ▲ 54.3 155 ▲ 42.0原 油 及 び 粗 油 Petroleum - ZENGEN - -石 油 製 品 Petroleum Products 257 ▲ 23.5 137 ▲ 45.6( 揮 発 油 )(Petroleum Spirits) 181 ▲ 31.0 79 ▲ 55.8液 化 天 然 ガ ス LNG - ZENGEN - -液 化 石 油 ガ ス LPG 1 23.8 0 ▲ 46.6石 炭 Coal 0 2789.2 0 ▲ 91.2
4 化 学 製 品 Chemicals 27,536 ▲ 0.8 25,137 ▲ 1.3有 機 化 合 物 Organic Chemicals 4,787 ▲ 5.3 4,853 4.1医 薬 品 Medical Products 16,756 3.0 15,401 0.4
5 原 料 別 製 品 Manufactured Goods 5,873 ▲ 4.4 4,669 ▲ 12.5鉄 鋼 Iron & Steel Products 434 ▲ 6.7 295 ▲ 26.3非 鉄 金 属 Nonferrous Metals 1,228 ▲ 9.6 1,096 11.3金 属 製 品 Manufactures of Metals 1,098 ▲ 8.1 841 ▲ 18.8織 物 用 糸・ 繊 維 製 品 Textile Yarn, Fabrics 674 0.5 472 ▲ 23.4非 金 属 鉱 物 製 品 Non-metallic Mineral Ware 835 ▲ 8.1 650 ▲ 16.6木 製 品 等( 除 家 具 )Wood & Cork manufactured 543 ▲ 7.7 563 4.2
6 一 般 機 械 Machinery 11,139 ▲ 4.6 7,966 ▲ 15.3原 動 機 Power Generating Machine 3,299 ▲ 8.4 1,712 ▲ 17.3電算機類(含周辺機器)Computers & Units 555 11.0 443 ▲ 16.5電 算 機 類 の 部 分 品 Parts of Computer 207 ▲ 2.4 102 ▲ 47.1
7 電 気 機 器 Electrical Machinery 8,603 0.8 6,877 ▲ 11.9半 導 体 等 電 子 部 品 Semiconductors etc. 1,211 ▲ 7.1 967 ▲ 16.6( I C )(IC) 951 ▲ 17.1 781 15.5絶縁電線・絶縁ケーブル Insulated Wire and Cable 129 11.3 131 17.9音響映像機器(含部品)Audio & Visual Apparatus 480 8.9 388 1.8重 電 機 器 Electrical Power Machinery 758 7.0 656 ▲ 2.4通 信 機 Telephony, Telegraphy 718 ▲ 6.5 748 8.6( 電 話 機 )(Telephone Sets) 6 18.8 3 ▲ 39.7電 気 計 測 機 器 Electrical Measuring 2,120 1.6 1,484 ▲ 17.7
8 輸 送 用 機 器 Transport Equipment 16,252 5.2 10,227 ▲ 30.3自 動 車 Motor Vehicles 11,200 ▲ 3.7 7,586 ▲ 22.7自 動 車 の 部 分 品 Parts of Motor Vehicles 1,356 ▲ 10.5 991 ▲ 22.2航 空 機 類 Aircraft 3,203 82.9 1,154 ▲ 63.1
9 そ の 他 Others 13,401 1.3 10,574 ▲ 15.8科 学 光 学 機 器 Scientific, Optical Inst. 4,166 ▲ 1.8 3,595 ▲ 6.9衣 類・ 同 付 属 品 Clothing & Accessories 1,819 2.7 1,372 ▲ 20.3家 具 Furniture 609 1.0 488 ▲ 15.0バ ッ グ 類 Bags 2,408 7.9 1,874 ▲ 21.7
貿 易 収 支 Trade Balance ▲ 7,669 50.6 ▲ 13,275 ▲ 1.4Note : *を付した数値は、昨年に対する倍率を示す。 Figures followed by * indicates ratio to the previous year's record.Source : 財務省貿易統計より作成。 Compiled from MOF's Trade Statistics on a Customs-cleared Basis.
資料編▶2.貿易構造100 Data Chapter▶2.Trade Structure 101
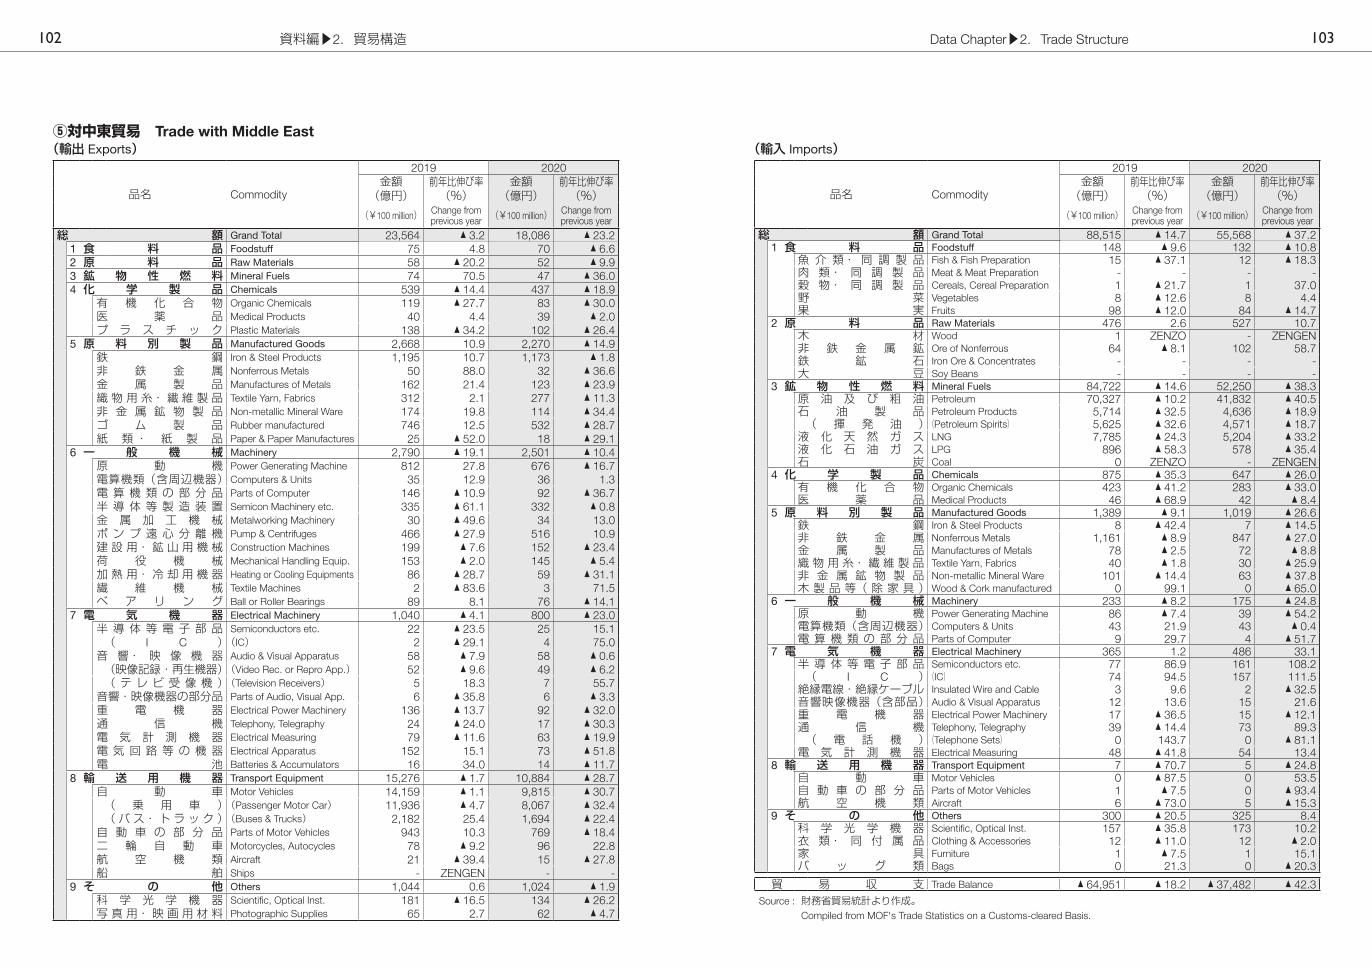
⑤対中東貿易 Trade with Middle East(輸出 Exports)
品名 Commodity
2019 2020金額 前年比伸び率 金額 前年比伸び率(億円) (%) (億円) (%)(¥100 million) Change from
previous year (¥100 million) Change from previous year
総 額 Grand Total 23,564 ▲ 3.2 18,086 ▲ 23.21 食 料 品 Foodstuff 75 4.8 70 ▲ 6.62 原 料 品 Raw Materials 58 ▲ 20.2 52 ▲ 9.93 鉱 物 性 燃 料 Mineral Fuels 74 70.5 47 ▲ 36.04 化 学 製 品 Chemicals 539 ▲ 14.4 437 ▲ 18.9
有 機 化 合 物 Organic Chemicals 119 ▲ 27.7 83 ▲ 30.0医 薬 品 Medical Products 40 4.4 39 ▲ 2.0プ ラ ス チ ッ ク Plastic Materials 138 ▲ 34.2 102 ▲ 26.4
5 原 料 別 製 品 Manufactured Goods 2,668 10.9 2,270 ▲ 14.9鉄 鋼 Iron & Steel Products 1,195 10.7 1,173 ▲ 1.8非 鉄 金 属 Nonferrous Metals 50 88.0 32 ▲ 36.6金 属 製 品 Manufactures of Metals 162 21.4 123 ▲ 23.9織 物 用 糸・ 繊 維 製 品 Textile Yarn, Fabrics 312 2.1 277 ▲ 11.3非 金 属 鉱 物 製 品 Non-metallic Mineral Ware 174 19.8 114 ▲ 34.4ゴ ム 製 品 Rubber manufactured 746 12.5 532 ▲ 28.7紙 類・ 紙 製 品 Paper & Paper Manufactures 25 ▲ 52.0 18 ▲ 29.1
6 一 般 機 械 Machinery 2,790 ▲ 19.1 2,501 ▲ 10.4原 動 機 Power Generating Machine 812 27.8 676 ▲ 16.7電算機類(含周辺機器)Computers & Units 35 12.9 36 1.3電 算 機 類 の 部 分 品 Parts of Computer 146 ▲ 10.9 92 ▲ 36.7半 導 体 等 製 造 装 置 Semicon Machinery etc. 335 ▲ 61.1 332 ▲ 0.8金 属 加 工 機 械 Metalworking Machinery 30 ▲ 49.6 34 13.0ポ ン プ 遠 心 分 離 機 Pump & Centrifuges 466 ▲ 27.9 516 10.9建 設 用・ 鉱 山 用 機 械 Construction Machines 199 ▲ 7.6 152 ▲ 23.4荷 役 機 械 Mechanical Handling Equip. 153 ▲ 2.0 145 ▲ 5.4加 熱 用・ 冷 却 用 機 器 Heating or Cooling Equipments 86 ▲ 28.7 59 ▲ 31.1繊 維 機 械 Textile Machines 2 ▲ 83.6 3 71.5ベ ア リ ン グ Ball or Roller Bearings 89 8.1 76 ▲ 14.1
7 電 気 機 器 Electrical Machinery 1,040 ▲ 4.1 800 ▲ 23.0半 導 体 等 電 子 部 品 Semiconductors etc. 22 ▲ 23.5 25 15.1( I C )(IC) 2 ▲ 29.1 4 75.0音 響・ 映 像 機 器 Audio & Visual Apparatus 58 ▲ 7.9 58 ▲ 0.6(映像記録・再生機器)(Video Rec. or Repro App.) 52 ▲ 9.6 49 ▲ 6.2( テ レ ビ 受 像 機 )(Television Receivers) 5 18.3 7 55.7音響・映像機器の部分品 Parts of Audio, Visual App. 6 ▲ 35.8 6 ▲ 3.3重 電 機 器 Electrical Power Machinery 136 ▲ 13.7 92 ▲ 32.0通 信 機 Telephony, Telegraphy 24 ▲ 24.0 17 ▲ 30.3電 気 計 測 機 器 Electrical Measuring 79 ▲ 11.6 63 ▲ 19.9電 気 回 路 等 の 機 器 Electrical Apparatus 152 15.1 73 ▲ 51.8電 池 Batteries & Accumulators 16 34.0 14 ▲ 11.7
8 輸 送 用 機 器 Transport Equipment 15,276 ▲ 1.7 10,884 ▲ 28.7自 動 車 Motor Vehicles 14,159 ▲ 1.1 9,815 ▲ 30.7( 乗 用 車 )(Passenger Motor Car) 11,936 ▲ 4.7 8,067 ▲ 32.4(バス・トラック)(Buses & Trucks) 2,182 25.4 1,694 ▲ 22.4自 動 車 の 部 分 品 Parts of Motor Vehicles 943 10.3 769 ▲ 18.4二 輪 自 動 車 Motorcycles, Autocycles 78 ▲ 9.2 96 22.8航 空 機 類 Aircraft 21 ▲ 39.4 15 ▲ 27.8船 舶 Ships - ZENGEN - -
9 そ の 他 Others 1,044 0.6 1,024 ▲ 1.9科 学 光 学 機 器 Scientific, Optical Inst. 181 ▲ 16.5 134 ▲ 26.2写 真 用・ 映 画 用 材 料 Photographic Supplies 65 2.7 62 ▲ 4.7
(輸入 Imports)
品名 Commodity
2019 2020金額 前年比伸び率 金額 前年比伸び率(億円) (%) (億円) (%)(¥100 million) Change from
previous year (¥100 million) Change from previous year
総 額 Grand Total 88,515 ▲ 14.7 55,568 ▲ 37.21 食 料 品 Foodstuff 148 ▲ 9.6 132 ▲ 10.8
魚 介 類・ 同 調 製 品 Fish & Fish Preparation 15 ▲ 37.1 12 ▲ 18.3肉 類・ 同 調 製 品 Meat & Meat Preparation - - - -穀 物・ 同 調 製 品 Cereals, Cereal Preparation 1 ▲ 21.7 1 37.0野 菜 Vegetables 8 ▲ 12.6 8 4.4果 実 Fruits 98 ▲ 12.0 84 ▲ 14.7
2 原 料 品 Raw Materials 476 2.6 527 10.7木 材 Wood 1 ZENZO - ZENGEN非 鉄 金 属 鉱 Ore of Nonferrous 64 ▲ 8.1 102 58.7鉄 鉱 石 Iron Ore & Concentrates - - - -大 豆 Soy Beans - - - -
3 鉱 物 性 燃 料 Mineral Fuels 84,722 ▲ 14.6 52,250 ▲ 38.3原 油 及 び 粗 油 Petroleum 70,327 ▲ 10.2 41,832 ▲ 40.5石 油 製 品 Petroleum Products 5,714 ▲ 32.5 4,636 ▲ 18.9( 揮 発 油 )(Petroleum Spirits) 5,625 ▲ 32.6 4,571 ▲ 18.7液 化 天 然 ガ ス LNG 7,785 ▲ 24.3 5,204 ▲ 33.2液 化 石 油 ガ ス LPG 896 ▲ 58.3 578 ▲ 35.4石 炭 Coal 0 ZENZO - ZENGEN
4 化 学 製 品 Chemicals 875 ▲ 35.3 647 ▲ 26.0有 機 化 合 物 Organic Chemicals 423 ▲ 41.2 283 ▲ 33.0医 薬 品 Medical Products 46 ▲ 68.9 42 ▲ 8.4
5 原 料 別 製 品 Manufactured Goods 1,389 ▲ 9.1 1,019 ▲ 26.6鉄 鋼 Iron & Steel Products 8 ▲ 42.4 7 ▲ 14.5非 鉄 金 属 Nonferrous Metals 1,161 ▲ 8.9 847 ▲ 27.0金 属 製 品 Manufactures of Metals 78 ▲ 2.5 72 ▲ 8.8織 物 用 糸・ 繊 維 製 品 Textile Yarn, Fabrics 40 ▲ 1.8 30 ▲ 25.9非 金 属 鉱 物 製 品 Non-metallic Mineral Ware 101 ▲ 14.4 63 ▲ 37.8木 製 品 等( 除 家 具 )Wood & Cork manufactured 0 99.1 0 ▲ 65.0
6 一 般 機 械 Machinery 233 ▲ 8.2 175 ▲ 24.8原 動 機 Power Generating Machine 86 ▲ 7.4 39 ▲ 54.2電算機類(含周辺機器)Computers & Units 43 21.9 43 ▲ 0.4電 算 機 類 の 部 分 品 Parts of Computer 9 29.7 4 ▲ 51.7
7 電 気 機 器 Electrical Machinery 365 1.2 486 33.1半 導 体 等 電 子 部 品 Semiconductors etc. 77 86.9 161 108.2( I C )(IC) 74 94.5 157 111.5絶縁電線・絶縁ケーブル Insulated Wire and Cable 3 9.6 2 ▲ 32.5音響映像機器(含部品)Audio & Visual Apparatus 12 13.6 15 21.6重 電 機 器 Electrical Power Machinery 17 ▲ 36.5 15 ▲ 12.1通 信 機 Telephony, Telegraphy 39 ▲ 14.4 73 89.3( 電 話 機 )(Telephone Sets) 0 143.7 0 ▲ 81.1電 気 計 測 機 器 Electrical Measuring 48 ▲ 41.8 54 13.4
8 輸 送 用 機 器 Transport Equipment 7 ▲ 70.7 5 ▲ 24.8自 動 車 Motor Vehicles 0 ▲ 87.5 0 53.5自 動 車 の 部 分 品 Parts of Motor Vehicles 1 ▲ 7.5 0 ▲ 93.4航 空 機 類 Aircraft 6 ▲ 73.0 5 ▲ 15.3
9 そ の 他 Others 300 ▲ 20.5 325 8.4科 学 光 学 機 器 Scientific, Optical Inst. 157 ▲ 35.8 173 10.2衣 類・ 同 付 属 品 Clothing & Accessories 12 ▲ 11.0 12 ▲ 2.0家 具 Furniture 1 ▲ 7.5 1 15.1バ ッ グ 類 Bags 0 21.3 0 ▲ 20.3
貿 易 収 支 Trade Balance ▲ 64,951 ▲ 18.2 ▲ 37,482 ▲ 42.3Source : 財務省貿易統計より作成。 Compiled from MOF's Trade Statistics on a Customs-cleared Basis.
資料編▶2.貿易構造102 Data Chapter▶2.Trade Structure 103

(輸出 Exports) (100億円 ¥10 billion %) 2005 2010 2015 2020
国(地域)名Area/Country
金額Value
構成比Share
国(地域)名Area/Country
金額Value
構成比Share
国(地域)名Area/Country
金額Value
構成比Share
国(地域)名Area/Country
金額Value
構成比Share
1 米国USA 1,481 22.5 中国China 1,309 19.4 米国USA 1,522 20.1 中国China 1,508 22.0
2 中国China 884 13.5 米国USA 1,037 15.4 中国China 1,322 17.5 米国USA 1,261 18.4
3 韓国Korea 515 7.8 韓国Korea 546 8.1 韓国Korea 533 7.0 韓国Korea 477 7.0
4 台湾Taiwan 481 7.3 台湾Taiwan 459 6.8 台湾Taiwan 447 5.9 台湾Taiwan 474 6.9
5 香港Hong Kong 397 6.0 香港Hong Kong 370 5.5 香港Hong Kong 424 5.6 香港Hong Kong 341 5.0
6 タイThailand 248 3.8 タイThailand 299 4.4 タイThailand 339 4.5 タイThailand 272 4.0
7 ドイツGermany 206 3.1 シンガポールSingapore 221 3.3 シンガポールSingapore 240 3.2 シンガポールSingapore 189 2.8
8 シンガポールSingapore 203 3.1 ドイツGermany 178 2.6 ドイツGermany 196 2.6 ドイツGermany 188 2.7
9 英国UK 166 2.5 マレーシアMalaysia 154 2.3 オーストラリアAustralia 155 2.1 ベトナムViet Nam 183 2.7
10 オランダNetherlands 145 2.2 オランダNetherlands 143 2.1 ベトナムViet Nam 152 2.0 マレーシアMalaysia 134 2.0
Top 10 Total 4,725 72.0 Top 10 Total 4,717 70.0 Top 10 Total 5,331 70.5 Top 10 Total 5,027 73.5Grand Total 6,566 100.0 Grand Total 6,740 100.0 Grand Total 7,561 100.0 Grand Total 6,841 100.0
(輸入 Imports) 2005 2010 2015 2020
国(地域)名Area/Country
金額Value
構成比Share
国(地域)名Area/Country
金額Value
構成比Share
国(地域)名Area/Country
金額Value
構成比Share
国(地域)名Area/Country
金額Value
構成比Share
1 中国China 1,198 21.0 中国China 1,341 22.1 中国China 1,943 24.8 中国China 1,748 25.8
2 米国USA 707 12.4 米国USA 591 9.7 米国USA 806 10.3 米国USA 743 11.0
3 サウジアラビアSaudi Arabia 317 5.6 オーストラリアAustralia 395 6.5 オーストラリアAustralia 421 5.4 オーストラリアAustralia 381 5.6
4 アラブ首長国連邦UAE 280 4.9 サウジアラビアSaudi Arabia 315 5.2 韓国Korea 324 4.1 台湾Taiwan 286 4.2
5 オーストラリアAustralia 271 4.8 アラブ首長国連邦UAE 257 4.2 サウジアラビアSaudi Arabia 304 3.9 韓国Korea 284 4.2
6 韓国Korea 270 4.7 韓国Korea 250 4.1 アラブ首長国連邦UAE 285 3.6 タイThailand 254 3.7
7 インドネシアIndonesia 230 4.0 インドネシアIndonesia 248 4.1 台湾Taiwan 282 3.6 ベトナムViet Nam 235 3.5
8 台湾Taiwan 199 3.5 台湾Taiwan 202 3.3 マレーシアMalaysia 260 3.3 ドイツGermany 226 3.3
9 ドイツGermany 197 3.5 マレーシアMalaysia 199 3.3 タイThailand 247 3.2 サウジアラビアSaudi Arabia 197 2.9
10 タイThailand 172 3.0 タイThailand 184 3.0 ドイツGermany 245 3.1 アラブ首長国連邦UAE 175 2.6
Top 10 Total 3,839 67.4 Top 10 Total 3,982 65.5 Top 10 Total 5,117 65.3 Top 10 Total 4,528 66.8Grand Total 5,695 100.0 Grand Total 6,076 100.0 Grand Total 7,841 100.0 Grand Total 6,774 100.0
(6) 主要貿易相手先 Top 10 Trade Partners(総額 Total Trade) (100億円 ¥10 billion %)
2020 2020
地域名Area
金額Value
構成比Share 国(地域)名
Area/Country金額Value
構成比Share
1 アジアAsia 7,383 54.2 1 中国 +香港
China + Hong Kong 3,606 26.5
(BRICS) 3,772 27.7 2 中国China 3,256 23.9
(ASEAN) 2,050 15.1 3 米国USA 2,004 14.7
2 北米North America 2,197 16.1 4 韓国
Korea 760 5.6
3 西欧Western Europe 1,662 12.2 5 台湾
Taiwan 760 5.6
(EU) 1,425 10.5 6 タイThailand 526 3.9
4 中東Middle East 737 5.4 7 オーストラリア
Australia 510 3.7
5 大洋州Oceania 602 4.4 8 ベトナム
Viet Nam 418 3.1
6 中南米Central South America 521 3.8 9 ドイツ
Germany 414 3.0
7 中東欧・ロシア等C&E Europe, Russia, etc. 335 2.5 10 香港
Hong Kong 350 2.6
8 アフリカAfrica 177 1.3
Grand Total 13,614 100.0
(貿易収支 Trade Balance) 2020 2020
(+)
国(地域)名Area/Country
金額Value
(-)国名
Country金額Value
1 米国USA 518 1 オーストラリア
Australia ▲ 251
2 香港Hong Kong 333 2 中国
China ▲ 239
3 韓国Korea 193 3 サウジアラビア
Saudi Arabia ▲ 152
4 台湾Taiwan 188 4 アラブ首長国連邦
UAE ▲ 116
5 シンガポールSingapore 98 5 カタール
Qatar ▲ 87
6 オランダNetherlands 83 6 イタリア
Italy ▲ 72
7 インドIndia 47 7 インドネシア
Indonesia ▲ 66
8 英国UK 46 8 チリ
Chile ▲ 59
9 メキシコMexico 32 9 ベトナム
Viet Nam ▲ 53
10 タイThailand 19 10 ロシア
Russia ▲ 52
Source : 財務省貿易統計より作成。 Compiled from MOF's Trade Statistics on a Customs-cleared Basis.
資料編▶2.貿易構造104 Data Chapter▶2.Trade Structure 105

(輸出 Exports) (輸入 Imports) (%)対世界 ドル 円 ユーロ その他 ドル 円 ユーロ その他Trade with the World US$ ¥ € Others US$ ¥ € Others
2016 上期 1st Half 51.2 37.1 6.1 5.6 66.9 26.1 4.1 2.9下期 2nd Half 51.0 37.0 6.0 6.0 66.7 26.8 3.9 2.6
17 上期 1st Half 51.3 36.2 6.1 6.4 69.0 24.5 3.9 2.6下期 2nd Half 51.2 35.9 6.4 6.5 68.9 24.2 4.1 2.8
18 上期 1st Half 49.2 37.3 6.6 6.9 68.5 24.6 4.0 2.9下期 2nd Half 50.4 36.7 6.3 6.6 69.8 23.7 3.7 2.8
19 上期 1st Half 49.4 37.1 6.8 6.7 67.9 25.2 3.8 3.1下期 2nd Half 49.7 37.2 6.6 6.5 67.4 25.5 3.9 3.2
20 上期 1st Half 48.3 38.8 6.2 6.7 66.5 26.5 3.6 3.4下期 2nd Half 48.5 37.7 6.2 7.6 64.8 27.8 3.8 3.6
対米国 ドル 円 ユーロ その他 ドル 円 ユーロ その他Trade with USA US$ ¥ € Others US$ ¥ € Others
2016 上期 1st Half 85.9 13.9 0.1 0.1 75.8 23.4 0.7 0.1下期 2nd Half 86.7 13.1 0.2 0.0 73.7 25.2 0.9 0.2
17 上期 1st Half 86.5 13.3 0.2 0.0 77.0 22.2 0.6 0.2下期 2nd Half 87.0 12.8 0.2 0.0 77.3 21.8 0.7 0.2
18 上期 1st Half 86.1 13.5 0.2 0.2 76.9 21.8 1.1 0.2下期 2nd Half 87.2 12.5 0.2 0.1 77.3 21.8 0.8 0.1
19 上期 1st Half 85.8 13.9 0.2 0.1 77.8 21.2 0.9 0.1下期 2nd Half 85.6 14.2 0.2 0.0 74.6 24.3 1.0 0.1
20 上期 1st Half 84.6 15.1 0.2 0.1 74.9 24.4 0.6 0.1下期 2nd Half 87.4 12.5 0.2 -0.1 73.7 25.6 0.4 0.3
対EU ドル 円 ユーロ その他 ドル 円 ユーロ その他Trade with EU US$ ¥ € Others US$ ¥ € Others
2016 上期 1st Half 16.3 31.1 46.5 6.1 10.3 56.4 29.7 3.6下期 2nd Half 15.4 30.5 47.9 6.2 9.9 59.2 27.8 3.1
17 上期 1st Half 15.4 30.3 47.9 6.4 11.5 55.3 29.9 3.3下期 2nd Half 14.2 29.5 51.0 5.3 11.7 54.1 30.5 3.7
18 上期 1st Half 15.2 29.0 50.0 5.8 13.1 53.4 29.6 3.9下期 2nd Half 14.5 29.8 49.8 5.9 14.2 54.0 28.3 3.5
19 上期 1st Half 14.4 30.2 50.3 5.1 13.1 55.3 27.5 4.1下期 2nd Half 14.8 29.5 50.6 5.1 13.7 54.5 27.9 3.9
20 上期 1st Half 13.7 32.8 52.0 1.5 11.5 57.9 27.7 2.9下期 2nd Half 10.3 33.0 55.8 0.9 11.6 28.3 57.1 3.0
対アジア ドル 円 ユーロ その他 ドル 円 ユーロ その他Trade with Asia US$ ¥ € Others US$ ¥ € Others
2016 上期 1st Half 49.2 45.8 - 5.0 70.5 25.7 0.4 3.4下期 2nd Half 48.6 46.1 - 5.3 70.4 25.9 0.4 3.3
17 上期 1st Half 49.5 44.6 - 5.9 70.7 25.3 0.4 3.6下期 2nd Half 49.0 44.6 - 6.4 71.6 24.2 0.5 3.7
18 上期 1st Half 46.8 46.6 - 6.6 69.7 25.9 0.5 3.9下期 2nd Half 48.2 45.3 - 6.5 71.2 24.5 0.4 3.9
19 上期 1st Half 46.3 46.8 - 6.9 69.3 26.1 0.4 4.2下期 2nd Half 47.0 46.2 - 6.8 68.9 26.3 0.4 4.4
20 上期 1st Half 45.8 47.1 - 7.1 68.6 26.4 0.4 4.6下期 2nd Half 45.2 47.3 - 7.5 68.0 27.1 0.4 4.5
Note : 比率は金額比率。 Ratios are expressed on a value basis.Source : 財務省の統計より作成。 Compiled from MOF's Statistics.
(7) 貿易取引通貨別比率 Ratio of Trade by Currency
品名 Commodity2005 2010 2015 2020構成比 構成比 構成比 構成比Share Share Share Share
総 額 Grand Total 100.0 100.0 100.0 100.01 食料品 Foodstuff 0.5 0.6 0.8 1.22 原料品 Raw Materials 1.1 1.4 1.5 1.53 鉱物性燃料 Mineral Fuels 0.7 1.6 1.6 1.14 化学製品 Chemicals 8.9 10.3 10.3 12.5有機化合物 Organic Chemicals 2.9 2.8 2.8 2.3医薬品 Medical Products 0.6 0.6 0.6 1.2プラスチック Plastic Materials 2.6 3.5 3.2 3.5
5 原料別製品 Manufactured Goods 11.3 13.0 12.2 11.0鉄鋼 Iron & Steel Products 4.6 5.5 4.9 3.8非鉄金属 Nonferrous Metals 1.2 2.0 1.9 2.3金属製品 Manufactures of Metals 1.4 1.5 1.6 1.5織物用糸・繊維製品 Textile Yarn, Fabrics 1.1 0.9 1.0 0.9非金属鉱物製品 Non-metallic Mineral Ware 1.2 1.4 1.2 1.1ゴム製品 Rubber manufactured 1.2 1.4 1.3 1.0紙類・紙製品 Paper & Paper Manufactures 0.4 0.4 0.4 0.4
6 一般機械 Machinery 20.3 19.8 19.1 19.2原動機 Power Generating Machine 3.3 3.5 3.4 3.2電算機類(含周辺機器) Computers & Units 1.2 0.7 0.5 0.4電算機類の部分品 Parts of Computer 2.5 1.9 1.6 1.3半導体等製造装置 Semicon Machinery etc. - 2.5 2.1 3.7金属加工機械 Metalworking Machinery 1.8 1.3 1.7 1.1ポンプ遠心分離機 Pump & Centrifuges 1.5 1.7 1.7 1.7建設用・鉱山用機械 Construction Machines 1.4 1.3 1.3 1.3荷役機械 Mechanical Handling Equip. 1.0 0.9 0.9 0.7加熱用・冷却用機器 Heating or Cooling Equipments 0.8 0.7 0.5 0.5繊維機械 Textile Machines 0.4 0.3 0.3 0.3ベアリング Ball or Roller Bearings 0.5 0.6 0.6 0.5
7 電気機器 Electrical Machinery 22.2 18.8 17.6 18.7半導体等電子部品 Semiconductors etc. 6.7 6.2 5.2 6.0(IC) (IC) 4.4 4.1 3.5 4.1音響・映像機器 Audio & Visual Apparatus 2.9 1.4 0.8 0.6(映像記録・再生機器)(Video Rec. or Repro App.) 1.9 1.2 0.6 0.4(テレビ受像機) (Television Receivers) 0.7 0.1 0.2 0.1音響・映像機器の部分品 Parts of Audio, Visual App. 2.0 0.8 0.5 0.3重電機器 Electrical Power Machinery 1.0 1.1 1.2 1.5通信機 Telephony, Telegraphy 0.8 0.9 1.0 0.6電気計測機器 Electrical Measuring 1.8 1.7 1.9 2.2電気回路等の機器 Electrical Apparatus 2.6 2.6 2.5 2.5電池 Batteries & Accumulators 0.5 0.5 0.6 0.8
8 輸送用機器 Transport Equipment 23.1 22.6 24.0 21.1自動車 Motor Vehicles 15.1 13.6 15.9 14.0(乗用車) (Passenger Motor Car) 13.4 11.7 13.8 12.6(バス・トラック) (Buses & Trucks) 1.6 1.8 2.0 1.3自動車の部分品 Parts of Motor Vehicles 4.3 4.6 4.6 4.3二輪自動車 Motorcycles, Autocycles 1.0 0.4 0.4 0.3航空機類 Aircraft 0.2 0.3 0.8 0.5船舶 Ships 1.9 3.3 1.8 1.7
9 その他 Others 11.8 11.9 13.0 13.8科学光学機器 Scientific, Optical Inst. 3.8 3.0 3.1 2.9写真用・映画用材料 Photographic Supplies 0.8 0.6 0.6 0.7
Source : 財務省貿易統計より作成。 Compiled from MOF's Trade Statistics on a Customs-cleared Basis.
(8) 商品別輸出構成比 Ratio of Exports by Commodity (%)
資料編▶2.貿易構造106 Data Chapter▶2.Trade Structure 107

品名 Commodity2005 2010 2015 2020構成比 構成比 構成比 構成比Share Share Share Share
総 額 Grand Total 100.0 100.0 100.0 100.01 食料品 Foodstuff 9.8 8.6 8.9 9.9魚介類・同調製品 Fish & Fish Preparation 2.7 2.1 2.0 2.0肉類・同調製品 Meat & Meat Preparation 1.9 1.6 1.8 2.1穀物・同調製品 Cereals, Cereal Preparation 1.1 1.2 1.1 1.1野菜 Vegetables 0.7 0.6 0.7 0.7果実 Fruits 0.7 0.6 0.7 0.8
2 原料品 Raw Materials 6.2 7.8 6.2 6.7木材 Wood 0.9 0.5 0.5 0.4非鉄金属鉱 Ore of Nonferrous 1.7 2.4 1.8 2.0鉄鉱石 Iron Ore & Concentrates 1.1 2.2 1.4 1.5大豆 Soy Beans 0.3 0.3 0.3 0.2
3 鉱物性燃料 Mineral Fuels 25.6 28.6 23.2 16.6原油及び粗油 Petroleum 15.5 15.5 10.4 6.9石油製品 Petroleum Products 2.6 2.6 2.3 1.8 (揮発油) (Petroleum Spirits) 1.9 2.0 1.7 1.4液化天然ガス LNG 3.5 5.7 7.0 4.7液化石油ガス LPG 1.2 1.3 0.8 0.6石炭 Coal 2.7 3.5 2.5 2.5
4 化学製品 Chemicals 7.6 8.9 9.9 11.5有機化合物 Organic Chemicals 2.1 2.2 2.1 2.4医薬品 Medical Products 1.6 2.5 3.7 4.7
5 原料別製品 Manufactured Goods 9.5 8.9 9.0 9.7鉄鋼 Iron & Steel Products 1.4 1.3 1.1 1.0非鉄金属 Nonferrous Metals 2.6 2.6 2.1 2.5金属製品 Manufactures of Metals 1.3 1.3 1.6 1.7織物用糸・繊維製品 Textile Yarn, Fabrics 1.1 1.0 1.2 1.8非金属鉱物製品 Non-metallic Mineral Ware 1.1 0.9 1.0 0.8木製品等(除家具) Wood & Cork manufactured 1.2 1.0 1.0 0.9
6 一般機械 Machinery 9.9 7.9 9.0 10.4原動機 Power Generating Machine 1.1 1.1 1.4 1.3電算機類(含周辺機器) Computers & Units 3.6 2.5 2.5 3.5電算機類の部分品 Parts of Computer 1.6 0.9 0.6 0.6
7 電気機器 Electrical Machinery 13.0 13.3 15.3 16.8半導体等電子部品 Semiconductors etc. 4.1 3.5 3.8 3.7 (IC) (IC) 3.6 2.9 2.6 2.9絶縁電線・絶縁ケーブル Insulated Wire and Cable - 0.8 0.9 1.1音響映像機器(含部品) Audio & Visual Apparatus 2.8 2.7 1.6 1.9重電機器 Electrical Power Machinery 0.8 0.7 0.8 0.9通信機 Telephony, Telegraphy 0.7 2.1 3.7 4.2 (電話機) (Telephone Sets) - - - 2.4電気計測機器 Electrical Measuring 0.9 0.7 0.9 0.9
8 輸送用機器 Transport Equipment 3.6 2.8 4.0 3.8自動車 Motor Vehicles 1.6 1.0 1.5 1.7自動車の部分品 Parts of Motor Vehicles 0.7 0.8 1.1 1.0航空機類 Aircraft 0.9 0.6 0.9 0.7
9 その他 Others 14.9 13.2 14.5 14.7科学光学機器 Scientific, Optical Inst. 2.6 2.1 2.1 2.5衣類・同付属品 Clothing & Accessories 4.3 3.8 4.4 4.0家具 Furniture 1.0 0.8 1.0 1.1バッグ類 Bags 0.7 0.7 0.8 0.7
Source : 財務省貿易統計より作成。 Compiled from MOF's Trade Statistics on a Customs-cleared Basis.
(9) 商品別輸入構成比 Ratio of Imports by Commodity (%)(輸出 Exports) (%)
2005 2010 2015 2020 品目 Commodity Share 品目 Commodity Share 品目 Commodity Share 品目 Commodity Share1 自 動 車 15.1自 動 車 13.6自 動 車 15.9自 動 車 14.0
Motor Vehicles Motor Vehicles Motor Vehicles Motor Vehicles
2 半導体等電子部品 6.7半導体等電子部品 6.2半導体等電子部品 5.2半導体等電子部品 6.0Semiconductors etc. Semiconductors etc. Semiconductors etc. Semiconductors etc.
3 鉄 鋼 4.6鉄 鋼 5.5鉄 鋼 4.9自動車の部分品 4.3Iron & Steel Products Iron & Steel Products Iron & Steel Products Parts of Motor Vehicles
4 自動車の部分品 4.3自動車の部分品 4.6自動車の部分品 4.6鉄 鋼 3.8Parts of Motor Vehicles Parts of Motor Vehicles Parts of Motor Vehicles Iron & Steel Products
5 科 学 光 学 機 器 3.8プ ラ ス チ ッ ク 3.5原 動 機 3.4半導体等製造装置 3.7Scientific, Optical Inst. Plastic Materials Power Generating Machine Semicon Machinery etc.
6 原 動 機 3.3原 動 機 3.5プ ラ ス チ ッ ク 3.2プ ラ ス チ ッ ク 3.5Power Generating Machine Power Generating Machine Plastic Materials Plastic Materials
7 有 機 化 合 物 2.9船 舶 3.3科 学 光 学 機 器 3.1原 動 機 3.2Organic Chemicals Ships Scientific, Optical Inst. Power Generating Machine
8 映 像 機 器 2.7科 学 光 学 機 器 3.0有 機 化 合 物 2.8科 学 光 学 機 器 2.9Visual Apparatus Scientific, Optical Inst. Organic Chemicals Scientific, Optical Inst.
9 プ ラ ス チ ッ ク 2.6有 機 化 合 物 2.8電気回路等の機器 2.5電気回路等の機器 2.5Plastic Materials Organic Chemicals Electrical Apparatus Electrical Apparatus
10 電気回路等の機器 2.6電気回路等の機器 2.6電 気 計 測 機 器 1.9非 鉄 金 属 2.3Electrical Apparatus Electrical Apparatus Electrical Measuring Nonferrous Metals
(輸入 Imports) (%) 2005 2010 2015 2020 品目 Commodity Share 品目 Commodity Share 品目 Commodity Share 品目 Commodity Share1 原 油 及 び 粗 油 15.5原 油 及 び 粗 油 15.5原 油 及 び 粗 油 10.4原 油 及 び 粗 油 6.9
Petroleum Petroleum Petroleum Petroleum
2 衣類・同付属品 4.3液 化 天 然 ガ ス 5.7液 化 天 然 ガ ス 7.0液 化 天 然 ガ ス 4.7 Clothing & Accessories LNG LNG LNG
3 半導体等電子部品 4.1衣類・同付属品 3.8衣類・同付属品 4.4医 薬 品 4.7Semiconductors etc. Clothing & Accessories Clothing & Accessories Medical Products
4 電算機類(含周辺機器) 3.6半導体等電子部品 3.5半導体等電子部品 3.8通 信 機 4.2Computers & Units Semiconductors etc. Semiconductors etc. Telephony, Telegraphy
5 液 化 天 然 ガ ス 3.5石 炭 3.5通 信 機 3.7衣類・同付属品 4.0LNG Coal Telephony, Telegraphy Clothing & Accessories
6 音響映像機器(含部品) 2.8 音響映像機器(含部品) 2.7医 薬 品 3.7半導体等電子部品 3.7Audio & Visual Apparatus Audio & Visual Apparatus Medical Products Semiconductors etc.
7 魚介類・同調製品 2.7非 鉄 金 属 2.6石 炭 2.5 電算機類(含周辺機器) 3.5Fish & Fish Preparation Nonferrous Metals Coal Computers & Units
8 石 炭 2.7石 油 製 品 2.6 電算機類(含周辺機器) 2.5非 鉄 金 属 2.5Coal Petroleum Products Computers & Units Nonferrous Metals
9 石 油 製 品 2.6 電算機類(含周辺機器) 2.5石 油 製 品 2.3科 学 光 学 機 器 2.5Petroleum Products Computers & Units Petroleum Products Scientific, Optical Inst.
10 非 鉄 金 属 2.6医 薬 品 2.5非 鉄 金 属 2.1石 炭 2.5Nonferrous Metals Medical Products Nonferrous Metals Coal
Source : 財務省貿易統計より作成。 Compiled from MOF's Trade Statistics on a Customs-cleared Basis.
(10) 輸出入上位 10品目 Top 10 Trade Commodities
資料編▶2.貿易構造108 Data Chapter▶2.Trade Structure 109

(億円 ¥100 million %)製 品 製 品 輸 入 比 率 Share in total imports輸入額 合計 化学製品 原料別製品 一般機械 電気機器 輸送用機器 その他
Value Grand Total Chemicals Manufactured Goods Machinery Electrical
MachineryTransport
Equipment Others
2011 351,705 51.6 9.0 8.9 7.3 11.7 2.6 12.212 359,801 50.9 8.4 7.8 7.1 11.9 3.3 12.413 419,680 51.7 8.0 7.7 7.3 12.7 3.4 12.514 458,952 53.4 8.0 8.1 7.9 13.4 3.6 12.415 483,322 61.6 9.9 9.0 9.0 15.3 4.0 14.516 436,150 66.0 10.8 9.2 9.6 16.3 4.7 15.417 477,966 63.4 10.0 9.1 9.6 16.0 4.2 14.518 511,708 61.9 10.3 9.0 9.6 14.9 4.2 13.819 495,961 63.1 10.4 9.0 9.6 15.3 4.5 14.320 452,923 66.9 11.5 9.7 10.4 16.8 3.8 14.7
(2020年の製品輸入 Imports of Manufactured Products 2020) (億円 ¥100 million %)
品名Commodity
数量Quantity
金額Value
構成比Share
前年比増減(▲)率Change from previous year
数量Quantity
金額Value
製 品 輸 入 総 額 Total of Manufactured Products 452,923 100.0 ▲ 8.7化 学 製 品 Chemicals 77,900 17.2 ▲ 4.6有 機 化 合 物 Organic Chemicals 16,502 3.6 ▲ 2.4医 薬 品 Medical Products 103,552,852 (キロ ㎏) 31,518 7.0 ▲ 1.4 1.9原 料 別 製 品 Manufactured Goods 65,589 14.5 ▲ 7.2鉄 鋼 Iron & Steel Products 6,573,213(トン t) 7,050 1.6 ▲ 21.0 ▲ 25.6非 鉄 金 属 Nonferrous Metals 2,630,998(トン t) 17,211 3.8 ▲ 20.5 ▲ 1.7金 属 製 品 Manufactures of Metals 11,356 2.5 ▲ 12.6織物用糸・繊維製品 Textile Yarn, Fabrics 12,454 2.7 31.5非金属鉱物製品 Non-metallic Mineral Ware 5,700 1.3 ▲ 17.9木製品等(除家具) Wood & Cork manufactured 6,167 1.4 ▲ 19.4一 般 機 械 Machinery 70,334 15.5 ▲ 7.2原 動 機 Power Generating Machine 8,969 2.0 ▲ 27.2電算機類(含周辺機器) Computers & Units 108,825(千台 1,000 Units) 24,003 5.3 0.4 8.6電算機類の部分品 Parts of Computer 4,125 0.9 ▲ 21.3電 気 機 器 Electrical Machinery 113,462 25.1 ▲ 5.4半導体等電子部品 Semiconductors etc. 25,048 5.5 ▲ 3.0 ( I C )(IC) 24,524(百万個 Million Units) 19,896 4.4 19.5 ▲ 0.9絶縁電線・絶縁ケーブル Insulated Wire and Cable 7,487 1.7 ▲ 9.2音響映像機器(含部品) Audio & Visual Apparatus 12,761 2.8 ▲ 6.8重 電 機 器 Electrical Power Machinery 6,045 1.3 ▲ 9.0通 信 機 Telephony, Telegraphy 28,486 6.3 0.1 ( 電 話 機 )Telephone Sets 16,030 3.5 ▲ 5.4電 気 計 測 機 器 Electrical Measuring 6,365 1.4 ▲ 16.6輸 送 用 機 器 Transport Equipment 25,987 5.7 ▲ 27.0自 動 車 Motor Vehicles 310,020(台 Units) 11,651 2.6 ▲ 14.9 ▲ 17.3自動車の部分品 Parts of Motor Vehicles 6,741 1.5 ▲ 24.3航 空 機 類 Aircraft 4,410 1.0 ▲ 51.3そ の 他 Others 99,652 22.0 ▲ 11.3科 学 光 学 機 器 Scientific, Optical Inst. 17,083 3.8 ▲ 6.0衣類・同付属品 Clothing & Accessories 27,240 6.0 ▲ 15.0家 具 Furniture 7,479 1.7 ▲ 5.1バ ッ グ 類 Bags 5,055 1.1 ▲ 21.5
Source : 財務省貿易統計より作成。 Compiled from MOF's Trade Statistics on a Customs-cleared Basis.
(11) 製品輸入 Imports of Manufactured Products by Type (12) 主要資源の輸入集中度(2020年) Major Resources ― Dependency on Imports 2020
(金額ベース based on value)1 位 2 位 3 位 上位3ヵ国の
品名 国名 価額 (百万円)シェア 国名 価額 (百万円)シェア 国名 価額 (百万円)シェア 輸入シェア
Commodity Country Value (¥ million)
Share(%) Country Value
(¥ million)Share(%) Country Value
(¥ million)Share(%)
Top 3's Share(%)
石 炭 オーストラリア 1,022,912 60.1 インドネシア 226,173 13.3 ロ シ ア 195,025 11.5 84.9
Coal Australia Indonesia Russia
原 油 サウジアラビア 58,559,333 40.1 アラブ首長国連邦 45,988,402 31.5 クウェート 13,086,485 9.0 80.6
Petroleum Saudi Arabia UAE Kuwait
液化天然ガス オーストラリア 1,291,629 40.2 マレーシア 424,346 13.2 カ タ ー ル 361,324 11.2 64.6
LNG Australia Malaysia Qatar
鉄 鉱 石 オーストラリア 534,779 52.1 ブ ラ ジ ル 305,889 29.8 カ ナ ダ 73,635 7.2 89.0
Iron Ore &Concentrates
Australia Brazil Canada
木 材 米 国 58,605 21.0 カ ナ ダ 55,067 19.7 ロ シ ア 39,230 14.1 54.8
Wood USA Canada Russia
非 鉄 金 属 鉱 チ リ 410,825 29.7 オーストラリア 224,220 16.2 インドネシア 142,705 10.3 56.3
Ore of Nonferrous
Chile Australia Indonesia
魚介類・同調製品 中 国 246,085 18.0 チ リ 137,998 10.1 米 国 112,663 8.2 36.4
Fish & FishPreparation
China Chile USA
大 豆 米 国 115,829 72.8 カ ナ ダ 22,141 13.9 ブ ラ ジ ル 18,463 11.6 98.3
Soy Beans USA Canada Brazil
とうもろこし 米 国 224,590 63.9 ブ ラ ジ ル 120,523 34.3 南アフリカ 3,106 0.9 99.0
Maize USA Brazil South Africa
小 麦 米 国 76,411 46.9 カ ナ ダ 59,453 36.5 オーストラリア 26,431 16.2 99.7
Wheat USA Canada Australia
Note : 原油は数量ベース(kl)。 Data on Petroleum are based upon quantity.Source : 財務省貿易統計より作成。 Compiled from MOF's Trade Statistics on a Customs-cleared Basis.
資料編▶2.貿易構造110 Data Chapter▶2.Trade Structure 111

(13) 主要港別の貿易 Value of Trade by Port of Clearance
(輸出 Exports) (億円 ¥100 million)Year
Port
2016金額 Value(比率 Share)
2017金額 Value(比率 Share)
2018金額 Value(比率 Share)
2019金額 Value(比率 Share)
2020金額 Value(比率 Share)
伸び率(%)Change
from previous
year
伸び率(%)Change
from previous
year
伸び率(%)Change
from previous
year
伸び率(%)Change
from previous
year
伸び率(%)Change
from previous
year
総 額Grand Total
700,358 ▲ 7.4 782,865 11.8 814,788 4.1 769,317 ▲ 5.6 684,066 ▲ 11.1
東 京 港Tokyo
58,204(8.3%)
▲ 6.8 58,621(7.5%)
0.7 60,398(7.4%)
3.0 58,237(7.6%)
▲ 3.6 52,333(7.7%)
▲ 10.1
横 浜 港Yokohama
68,847(9.8%)
▲ 8.6 71,772(9.2%)
4.2 77,187(9.5%)
7.5 69,461(9.0%)
▲ 10.0 58,199(8.5%)
▲ 16.2
千 葉 港Chiba
7,536(1.1%)
▲ 24.2 7,871(1.0%)
4.5 8,961(1.1%)
13.8 7,180(0.9%)
▲ 19.9 5,903(0.9%)
▲ 17.8
川 崎 港Kawasaki
12,597(1.8%)
▲ 19.5 11,198(1.4%)
▲ 11.1 11,144(1.4%)
▲ 0.5 11,167(1.5%)
0.2 8,940(1.3%)
▲ 19.9
名 古 屋 港Nagoya
107,455(15.3%)
▲ 6.3 117,421(15.0%)
9.3 124,845(15.3%)
6.3 123,068(16.0%)
▲ 1.4 104,152(15.2%)
▲ 15.4
四 日 市 港Yokkaichi
7,959(1.1%)
▲ 13.8 8,026(1.0%)
0.8 8,364(1.0%)
4.2 8,361(1.1%)
▲ 0.0 7,252(1.1%)
▲ 13.3
神 戸 港Kobe
51,101(7.3%)
▲ 7.9 56,317(7.2%)
10.2 58,198(7.1%)
3.3 55,571(7.2%)
▲ 4.5 49,010(7.2%)
▲ 11.8
大 阪 港Osaka
31,445(4.5%)
▲ 8.0 36,742(4.7%)
16.8 42,427(5.2%)
15.5 37,742(4.9%)
▲ 11.0 38,088(5.6%)
0.9
博 多 港Hakata
14,821(2.1%)
▲ 8.5 19,268(2.5%)
30.0 27,665(3.4%)
43.6 29,773(3.9%)
7.6 28,108(4.1%)
▲ 5.6
下 関 港Shimonoseki
5,358(0.8%)
0.9 7,848(1.0%)
46.5 6,625(0.8%)
▲ 15.6 4,775(0.6%)
▲ 27.9 5,920(0.9%)
24.0
(輸入 Imports) (億円 ¥100 million)Year
Port
2016金額 Value(比率 Share)
2017金額 Value(比率 Share)
2018金額 Value(比率 Share)
2019金額 Value(比率 Share)
2020金額 Value(比率 Share)
伸び率(%)Change
from previous
year
伸び率(%)Change
from previous
year
伸び率(%)Change
from previous
year
伸び率(%)Change
from previous
year
伸び率(%)Change
from previous
year
総 額Grand Total
660,420 ▲ 15.8 753,792 14.1 827,033 9.7 785,995 ▲ 5.0 677,369 ▲ 13.8
東 京 港Tokyo
105,873(16.0%)
▲ 6.9 117,011(15.5%)
10.5 116,565(14.1%)
▲ 0.4 114,913(14.6%)
▲ 1.4 109,720(16.2%)
▲ 4.5
横 浜 港Yokohama
37,999(5.8%)
▲ 17.8 41,336(5.5%)
8.8 47,538(5.7%)
15.0 48,920(6.2%)
2.9 40,390(6.0%)
▲ 17.4
千 葉 港Chiba
26,585(4.0%)
▲ 25.3 33,145(4.4%)
24.7 39,644(4.8%)
19.6 32,682(4.2%)
▲ 17.6 24,864(3.7%)
▲ 23.9
川 崎 港Kawasaki
17,334(2.6%)
▲ 28.6 22,248(3.0%)
28.4 23,652(2.9%)
6.3 23,571(3.0%)
▲ 0.3 18,211(2.7%)
▲ 22.7
名 古 屋 港Nagoya
44,804(6.8%)
▲ 17.0 48,656(6.5%)
8.6 53,368(6.5%)
9.7 50,849(6.5%)
▲ 4.7 43,164(6.4%)
▲ 15.1
四 日 市 港Yokkaichi
11,273(1.7%)
▲ 32.2 13,653(1.8%)
21.1 17,188(2.1%)
25.9 15,869(2.0%)
▲ 7.7 10,775(1.6%)
▲ 32.1
神 戸 港Kobe
29,008(4.4%)
▲ 11.2 32,356(4.3%)
11.5 34,385(4.2%)
6.3 33,103(4.2%)
▲ 3.7 30,017(4.4%)
▲ 9.3
大 阪 港Osaka
43,412(6.6%)
▲ 13.2 47,553(6.3%)
9.5 49,713(6.0%)
4.5 47,781(6.1%)
▲ 3.9 45,146(6.7%)
▲ 5.5
博 多 港Hakata
9,237(1.4%)
▲ 17.0 9,855(1.3%)
6.7 10,414(1.3%)
5.7 10,465(1.3%)
0.5 9,944(1.5%)
▲ 5.0
下 関 港Shimonoseki
2,272(0.3%)
▲ 11.9 2,473(0.3%)
8.8 2,466(0.3%)
▲ 0.3 2,283(0.3%)
▲ 7.4 1,947(0.3%)
▲ 14.7
Source : 日本関税協会『外国貿易概況』より作成。 Compiled from "The Summary Report on Trade of Japan" published by Japan Tariff Association.
(14) 航空貨物主要商品別貿易 Air Cargo Exports and Imports by Principal Commodity(輸出 Exports) (億円 ¥100 million)
Year
Commodity
2016金額 Value
2017金額 Value
2018金額 Value
2019金額 Value
2020金額 Value
伸び率(%)Change
from previous
year
伸び率(%)Change
from previous
year
伸び率(%)Change
from previous
year
伸び率(%)Change
from previous
year
伸び率(%)Change
from previous
year
総 額Total 200,830 ▲ 4.0 233,004 16.0 239,139 2.6 223,439 ▲ 6.6 214,303 ▲ 4.1
食 料 品Foodstuff 757 7.4 896 18.4 1,179 31.7 1,229 4.2 1,458 18.7
繊維および同製品Textiles 1,442 ▲ 0.1 1,530 6.1 1,642 7.3 1,623 ▲ 1.2 1,422 ▲ 12.3
化 学 製 品Chemicals 16,574 ▲ 1.4 19,421 17.2 22,074 13.7 22,107 0.1 24,192 9.4
非金属鉱物製品Non-metallic Mineral Ware 2,828 ▲ 1.6 3,211 13.5 3,371 5.0 3,033 ▲ 10.0 2,715 ▲ 10.5
金属および同製品Metal & Metal Products 6,374 ▲ 5.8 7,405 16.2 7,663 3.5 7,327 ▲ 4.4 7,738 5.6
機 械 機 器Machinery Equipments 122,428 ▲ 6.1 140,078 14.4 145,247 3.7 133,781 ▲ 7.9 126,065 ▲ 5.8
事 務 用 機 器Office Machines 4,551 ▲ 12.0 5,158 13.3 5,006 ▲ 2.9 4,324 ▲ 13.6 4,261 ▲ 1.5
映 像 機 器Visual Apparatus 3,075 ▲ 6.2 2,985 ▲ 2.9 2,715 ▲ 9.1 2,169 ▲ 20.1 2,079 ▲ 4.1
半導体等電子部品Semiconductors etc. 33,671 ▲ 7.5 37,880 12.5 39,289 3.7 38,164 ▲ 2.9 38,971 2.1
科学光学機器Scientific, Optical Inst. 12,629 ▲ 10.0 14,817 17.3 14,692 ▲ 0.8 13,011 ▲ 11.4 11,668 ▲ 10.3
そ の 他Others 50,427 0.5 60,464 19.9 57,963 ▲ 4.1 54,340 ▲ 6.2 50,711 ▲ 6.7
(輸入 Imports) (億円 ¥100 million)Year
Commodity
2016金額 Value
2017金額 Value
2018金額 Value
2019金額 Value
2020金額 Value
伸び率(%)Change
from previous
year
伸び率(%)Change
from previous
year
伸び率(%)Change
from previous
year
伸び率(%)Change
from previous
year
伸び率(%)Change
from previous
year
総 額Total 187,588 ▲ 8.3 208,437 11.1 222,814 6.9 215,782 ▲ 3.2 200,758 ▲ 7.0
食 料 品Foodstuff 2,986 14.5 3,986 33.5 3,028 ▲ 24.0 2,800 ▲ 7.5 2,551 ▲ 8.9
原料および燃料Raw Materials & Fuels 977 ▲ 13.0 1,039 6.3 1,125 8.3 1,165 3.6 1,335 18.7
化 学 製 品Chemicals 33,704 ▲ 7.7 33,160 ▲ 1.6 37,136 12.0 38,378 3.3 38,538 3.8
医 薬 品Medical Products 24,097 ▲ 5.8 22,394 ▲ 7.1 25,335 13.1 27,509 8.6 27,638 9.1
機 械 機 器Machinery Equipments 116,663 ▲ 8.4 133,540 14.5 142,315 6.6 134,610 ▲ 5.4 122,271 ▲ 14.1
事 務 用 機 器Office Machines 12,087 ▲ 12.6 14,187 17.4 15,320 8.0 16,684 8.9 17,350 13.3
音響・映像機器Audio & Visual Apparatus 3,674 ▲ 7.8 4,365 18.8 4,572 4.7 4,872 6.6 4,401 ▲ 3.7
半導体等電子部品Semiconductors etc. 20,589 ▲ 11.1 24,347 18.3 24,812 1.9 22,599 ▲ 8.9 22,207 ▲ 10.5
航 空 機Aircraft 6,482 ▲ 1.5 4,882 ▲ 24.7 6,570 34.6 8,250 25.6 3,780 ▲ 42.5
科学光学機器Scientific, Optical Inst. 11,832 ▲ 7.0 13,475 13.9 14,439 7.2 14,101 ▲ 2.3 13,032 ▲ 9.7
そ の 他Others 33,257 ▲ 10.0 36,713 10.4 39,209 6.8 38,829 ▲ 1.0 36,063 ▲ 8.0
Source : 日本関税協会『外国貿易概況』より作成。 Compiled from "The Summary Report on Trade of Japan" published by Japan Tariff Association.
資料編▶2.貿易構造112 Data Chapter▶2.Trade Structure 113
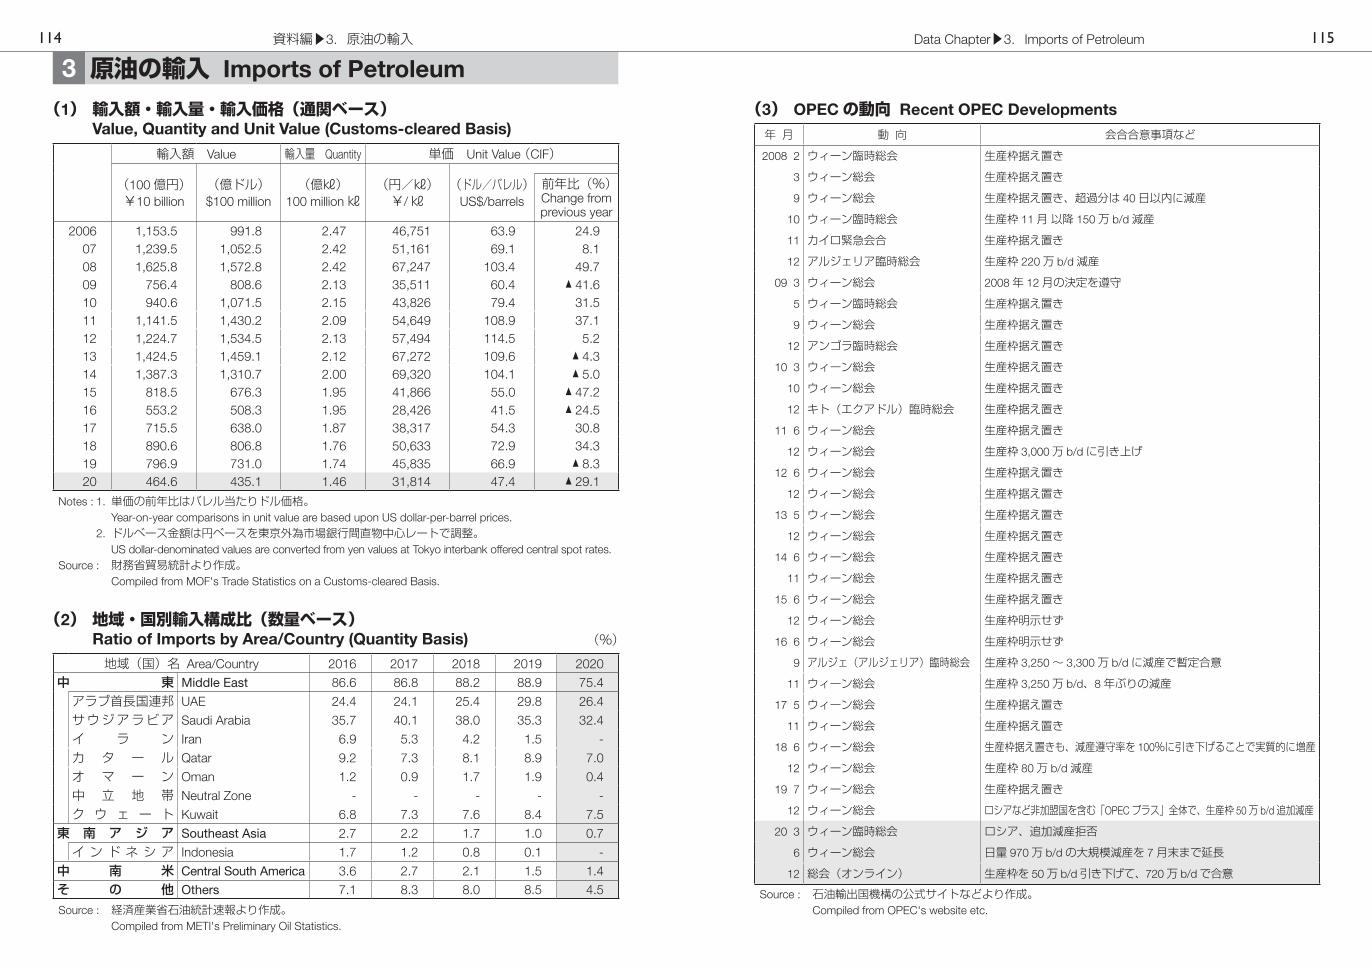
3 原油の輸入 Imports of Petroleum
(1) 輸入額・輸入量・輸入価格(通関ベース) Value, Quantity and Unit Value (Customs-cleared Basis)
(3) OPECの動向 Recent OPEC Developments
輸入額 Value 輸入量 Quantity 単価 Unit Value (CIF)
(100億円)¥10 billion
(億ドル)$100 million
(億㎘)100 million ㎘
(円/㎘)¥/㎘
(ドル/バレル)US$/barrels
前年比(%)Change from previous year
2006 1,153.5 991.8 2.47 46,751 63.9 24.907 1,239.5 1,052.5 2.42 51,161 69.1 8.108 1,625.8 1,572.8 2.42 67,247 103.4 49.709 756.4 808.6 2.13 35,511 60.4 ▲ 41.610 940.6 1,071.5 2.15 43,826 79.4 31.511 1,141.5 1,430.2 2.09 54,649 108.9 37.112 1,224.7 1,534.5 2.13 57,494 114.5 5.213 1,424.5 1,459.1 2.12 67,272 109.6 ▲ 4.314 1,387.3 1,310.7 2.00 69,320 104.1 ▲ 5.015 818.5 676.3 1.95 41,866 55.0 ▲ 47.216 553.2 508.3 1.95 28,426 41.5 ▲ 24.517 715.5 638.0 1.87 38,317 54.3 30.818 890.6 806.8 1.76 50,633 72.9 34.319 796.9 731.0 1.74 45,835 66.9 ▲ 8.320 464.6 435.1 1.46 31,814 47.4 ▲ 29.1
Notes : 1. 単価の前年比はバレル当たりドル価格。 Year-on-year comparisons in unit value are based upon US dollar-per-barrel prices. 2. ドルベース金額は円ベースを東京外為市場銀行間直物中心レートで調整。 US dollar-denominated values are converted from yen values at Tokyo interbank offered central spot rates.Source : 財務省貿易統計より作成。 Compiled from MOF's Trade Statistics on a Customs-cleared Basis.
年 月 動 向 会合合意事項など
2008 2 ウィーン臨時総会 生産枠据え置き
3 ウィーン総会 生産枠据え置き
9 ウィーン総会 生産枠据え置き、超過分は 40日以内に減産
10 ウィーン臨時総会 生産枠 11月 以降 150万 b/d減産
11 カイロ緊急会合 生産枠据え置き
12 アルジェリア臨時総会 生産枠 220万 b/d減産
09 3 ウィーン総会 2008年 12月の決定を遵守
5 ウィーン臨時総会 生産枠据え置き
9 ウィーン総会 生産枠据え置き
12 アンゴラ臨時総会 生産枠据え置き
10 3 ウィーン総会 生産枠据え置き
10 ウィーン総会 生産枠据え置き
12 キト(エクアドル)臨時総会 生産枠据え置き
11 6 ウィーン総会 生産枠据え置き
12 ウィーン総会 生産枠 3,000万 b/dに引き上げ
12 6 ウィーン総会 生産枠据え置き
12 ウィーン総会 生産枠据え置き
13 5 ウィーン総会 生産枠据え置き
12 ウィーン総会 生産枠据え置き
14 6 ウィーン総会 生産枠据え置き
11 ウィーン総会 生産枠据え置き
15 6 ウィーン総会 生産枠据え置き
12 ウィーン総会 生産枠明示せず
16 6 ウィーン総会 生産枠明示せず
9 アルジェ(アルジェリア)臨時総会 生産枠 3,250~ 3,300万 b/dに減産で暫定合意
11 ウィーン総会 生産枠 3,250万 b/d、8年ぶりの減産
17 5 ウィーン総会 生産枠据え置き
11 ウィーン総会 生産枠据え置き
18 6 ウィーン総会 生産枠据え置きも、減産遵守率を 100%に引き下げることで実質的に増産
12 ウィーン総会 生産枠 80万 b/d減産
19 7 ウィーン総会 生産枠据え置き
12 ウィーン総会 ロシアなど非加盟国を含む「OPECプラス」全体で、生産枠 50万 b/d追加減産
20 3 ウィーン臨時総会 ロシア、追加減産拒否
6 ウィーン総会 日量 970万 b/dの大規模減産を 7月末まで延長
12 総会(オンライン) 生産枠を 50万 b/d引き下げて、720万 b/dで合意
Source : 石油輸出国機構の公式サイトなどより作成。 Compiled from OPEC's website etc.
(2) 地域・国別輸入構成比(数量ベース) Ratio of Imports by Area/Country (Quantity Basis) (%)
地域(国)名 Area/Country 2016 2017 2018 2019 2020
中 東 Middle East 86.6 86.8 88.2 88.9 75.4
アラブ首長国連邦 UAE 24.4 24.1 25.4 29.8 26.4
サウジアラビア Saudi Arabia 35.7 40.1 38.0 35.3 32.4
イ ラ ン Iran 6.9 5.3 4.2 1.5 -
カ タ ー ル Qatar 9.2 7.3 8.1 8.9 7.0
オ マ ー ン Oman 1.2 0.9 1.7 1.9 0.4
中 立 地 帯 Neutral Zone - - - - -
ク ウ ェ ー ト Kuwait 6.8 7.3 7.6 8.4 7.5
東 南 ア ジ ア Southeast Asia 2.7 2.2 1.7 1.0 0.7
イ ン ド ネ シ ア Indonesia 1.7 1.2 0.8 0.1 -
中 南 米 Central South America 3.6 2.7 2.1 1.5 1.4
そ の 他 Others 7.1 8.3 8.0 8.5 4.5
Source : 経済産業省石油統計速報より作成。 Compiled from METI's Preliminary Oil Statistics.
資料編▶3.原油の輸入114 Data Chapter▶3.Imports of Petroleum 115

4 為替相場 Foreign Exchange Rate
(1) 変動相場制移行後の円相場 Value of Yen after Introduction of Floating Exchange Rate System
(2) 2020年の東京外国為替市場 Foreign Exchange Rate in Tokyo interbank 2020
(1米ドル当たり・円 ¥ per U.S.$)
年 月Year & Month
円 Yen ユーロ年・月末値
EuroEnd of period
最 高Highest
最 安Lowest
平 均Average 前年(同月)比(%)
Change from a year earlier
1982 217.80 ① 278.10 ⑪ 249.07 ▲11.5 -83 227.50 ① 247.35 ⑧ 237.48 4.9 -84 222.10 ③ 251.58 ⑫ 237.53 ▲0.0 -85 200.35 ⑪ 263.40 ② 238.54 ▲0.4 -86 152.90 ⑧ 203.00 ① 168.51 41.6 -87 123.00 ⑫ 159.15 ① 144.62 16.5 -88 120.80 ⑪ 136.70 ⑨ 128.15 12.9 -89 124.10 ① 150.35 ⑥ 137.96 ▲7.1 -
1990 124.30 ⑩ 160.10 ④ 144.80 ▲4.7 -91 125.20 ⑫ 141.80 ⑥ 134.54 7.6 -92 119.15 ⑩ 134.75 ④ 126.65 6.2 -93 100.40 ⑧ 125.95 ① 111.18 13.9 -94 96.35 ⑪ 113.60 ① 102.23 8.8 -95 79.75 ④ 104.70 ⑨ 94.06 8.7 -96 103.97 ② 116.18 ⑫ 108.79 ▲13.5 -97 110.68 ⑥ 131.60 ⑫ 121.00 ▲10.1 -98 113.81 ⑩ 147.64 ⑧ 130.90 ▲7.6 -99 101.35 ⑪ 124.75 ⑤ 113.91 14.9 102.91
2000 101.46 ① 114.98 ⑫ 107.77 5.7 106.5501 113.57 ① 132.08 ⑫ 121.53 ▲11.3 116.5102 115.63 ⑦ 135.04 ② 125.31 ▲3.0 125.0803 106.93 ⑫ 121.48 ② 115.93 8.1 133.7404 101.83 ⑫ 114.80 ⑤ 108.18 7.2 141.6105 101.87 ① 121.40 ⑫ 110.16 ▲1.8 139.8306 109.02 ⑤ 119.80 ⑩ 116.31 ▲5.3 156.5007 107.29 ⑪ 124.14 ⑥ 117.76 ▲1.2 166.6608 87.19 ⑫ 110.48 ⑧ 103.37 13.9 127.9609 84.82 ⑪ 101.24 ④ 93.54 10.5 132.00
2010 80.24 ⑪ 94.70 ④ 87.78 6.6 107.9011 75.52 ⑩ 85.53 ④ 79.81 10.0 100.7112 76.11 ② 86.63 ⑫ 79.81 0.0 114.7113 86.83 ① 105.41 ⑫ 97.63 ▲18.3 145.0514 100.76 ② 121.86 ⑫ 105.85 ▲7.8 146.5415 115.85 ① 125.66 ⑥ 121.03 ▲12.5 131.7716 99.00 ⑥ 121.49 ① 108.84 11.2 122.7017 107.59 ⑨ 118.18 ① 112.16 ▲3.0 134.9418 104.64 ③ 114.55 ⑩ 110.39 1.6 127.0019 104.46 ⑧ 112.24 ④ 109.01 1.3 122.54
2020 101.60 ③ 112.18 ② 106.78 2.1 126.951 107.65 110.30 109.34 ▲0.4 120.302 108.32 112.18 109.96 0.4 120.323 101.60 111.49 107.29 3.7 119.554 106.41 109.38 107.93 3.5 116.005 106.00 107.99 107.31 2.3 119.136 106.39 109.69 107.56 0.5 121.087 104.20 108.16 106.78 1.3 124.138 105.10 107.04 106.04 0.2 125.479 104.55 106.39 105.74 1.6 124.17
10 104.13 106.11 105.24 2.7 122.1411 103.20 105.48 104.40 4.3 124.3812 103.09 104.58 103.82 5.2 126.95
Notes : 1. ドルは東京外為市場銀行間直物中心相場。 As for dollars, Tokyo interbank offered central spot-deal rates. 2. 前年比騰落率は IMF方式により算出。 Changes from a year earlier are calculated in an IMF method. 3. ○は月を示す。 Numbers in circles represent months.Source : 日本銀行調査統計局『金融経済統計月報』、国際通貨基金の統計などより作成。 Compiled from Bank of Japan's (BOJ) "Financial and Economic Statistics Monthly" and IFS etc.
ドル ユーロ期初値 108.05 1月 6日 120.61 1月 6日期末値 103.47 12月 30日 126.82 12月 30日
Note : 東京外為市場銀行間直物中心日中平均相場。 Tokyo interbank offered central spot-deal rates, average per day.Source : 日本銀行の統計より作成。 Compiled from BOJ's Statistics.
ユーロ参加国の推移
1999.1.1 欧州連合 11ヵ国で単一通貨ユーロを導入 (ベルギー、ドイツ、スペイン、フランス、アイルランド、イタリア、ルクセンブルク、オランダ、オーストリア、 ポルトガル、フィンランド)2001.1.1 ギリシャがユーロを導入し、12ヵ国に2007.1.1 スロベニアがユーロを導入し、13ヵ国に2008.1.1 キプロス、マルタがユーロを導入し、15ヵ国に2009.1.1 スロバキアがユーロを導入し、16ヵ国に2011.1.1 エストニアがユーロを導入し、17ヵ国に2014.1.1 ラトビアがユーロを導入し、18ヵ国に2015.1.1 リトアニアがユーロを導入し、19ヵ国に2020.1.31 イギリスが離脱し、18ヵ国に
(3) 主要通貨の対ドル為替相場 Value of Major Currencies against the US Dollar
Notes : 1. 円相場は東京外為市場銀行間直物中心相場。 Yen rates are monthly averages of Tokyo interbank offered central spot rates. 2. 欧州通貨はニューヨーク市場対顧客電信売相場正午の月平均。 Euro rates are monthly averages of telegraphic transfer selling (TTS) rates quoted at noon at the New
York foreign exchange market.Source : 内閣府『海外経済データ 月次アップデート』より作成。 Compiled from "Kaigai Keizai Data" published by Cabinet Office.
0.0
1.0
2.0
3.0
4.0
5.0
6.0
7.0
8.0
9.0
0
20
40
60
80
100
120
140
160
180
11.1 4 7 10 12.1 4 7 10 13.1 4 7 10 14.1 4 7 10 15.1 4 7 10 16.1 4 7 10 17.1 4 7 10 18.1 4 7 10 19.1 4 7 10 20.1 4 7 10
Japanese Yen (JPY) Thai Baht (THB) Taiwan Dollar (TWD) Korean Won (KRW) Chinese Yuan (CNY)
HongKong Dollar (HKD) Malaysian Ringgit (MYR) Singapore Dollar (SGD) Euro (EUR)
(JPY/KRW/TWD/THB) (EUR/CNY/HKD/SGD/MYR)
HKD
CNY
JPY(左目盛 Le� scale)
THB(左目盛 Le� scale)
MYR
TWD(左目盛 Le� scale)
SGD
EUR
KRW(左目盛 Le� scale)
11.10.28史上最高値(中心値=76.00円)
資料編▶4.為替相場116 Data Chapter▶4.Foreign Exchange Rate 117

5 国際商品相場 Fluctuation of International Commodity
(1) 景気の変化 Change of the Economic Condition年 月
Year & MonthCRB先物指数
CRB Index
ロイター指数The Reuters Commodity Index(1931.9.18 = 100)
2010 505 ( 23.7 ) 2,552 ( 22.6 )
11 632 ( 25.1 ) 3,061 ( 20.0 )
12 564 ( ▲ 10.8 ) 3,004 ( ▲ 1.9 )
13 529 ( ▲ 6.1 ) 2,777 ( ▲ 7.5 )
14 521 ( ▲ 1.5 ) 2,525 ( ▲ 9.1 )
15 412 ( ▲ 20.9 ) 2,328 ( ▲ 7.8 )
16 406 ( ▲ 1.5 ) 2,329 ( 0.0 )
17 413 ( 1.8 ) 2,472 ( 6.1 )
18 418 ( 1.1 ) 2,337 ( ▲ 5.5 )
19 399 ( ▲ 4.5 ) 2,359 ( 0.9 )
2020 391 ( ▲ 6.5 ) 2,397 ( 2.6 )
1 415 ( ▲ 2.6 ) 2,486 ( 5.1 )
2 399 ( ▲ 6.0 ) 2,409 ( 3.0 )
3 354 ( ▲ 17.2 ) 2,266 ( ▲ 2.3 )
4 334 ( ▲ 21.8 ) 2,150 ( ▲ 5.9 )
5 348 ( ▲ 20.3 ) 2,236 ( ▲ 3.2 )
6 360 ( ▲ 15.8 ) 2,201 ( ▲ 6.6 )
7 377 ( ▲ 8.4 ) 2,280 ( ▲ 0.8 )
8 404 ( 0.3 ) 2,396 ( 2.9 )
9 411 ( 2.0 ) 2,463 ( 7.1 )
10 416 ( 0.3 ) 2,536 ( 6.0 )
11 427 ( 4.0 ) 2,679 ( 12.6 )
12 444 ( 10.8 ) 2,661 ( 12.2 )
Notes : 1. カッコ内は前年(同月)比伸び率:%。 Figures in parentheses represent an increase or a decrease (▲ ) from the corresponding
months of the previous year. 2. 指数は月次および年次平均値。 The Index is a monthly or yearly average.Source : 内閣府『海外経済データ 月次アップデート』より作成。 Compiled from "Kaigai Keizai Data" published by Cabinet Office.
景 気
Business cycle
主な出来事
Incident
実質経済成長率(%)
Real GDP Growth
消費者物価指数
(前年比 %)Consumer Price
Index (Change from previous year)
公定歩合(年末値)(年率%)Central bank discount rate (end of year)
1977 昭和 52 4.0 8.1 4.2578 53 52年 10月~ 55年 2月 5.3 4.2 3.5079 54 (好 況) 1979.11. 第 2次石油危機 6.5 3.7 6.25
1980 55 1.1 7.7 7.2581 56 2.9 4.9 5.5082 57 2.8 2.8 5.5083 58
58年 2月~ 60年 6月 1.6 1.9 5.0084 59 (ハイテク景気) 3.1 2.3 5.0085 60 1985.9. G5プラザ合意 5.1 2.0 5.0086 61 3.0 0.6 3.0087 62 3.8 0.1 2.5088 63 61年 11月~平 3年 2月 6.8 0.7 2.5089 平成 元 (バブル景気) 5.3 2.3 4.25
1990 2 1990.8. イラクのクウェート侵攻 5.2 3.1 6.0091 3 1991.1. 湾岸戦争勃発 3.4 3.3 4.5092 4 1.0 1.6 3.2593 5 1993.12. ガットウルグアイ・ラウンド交渉妥結 0.2 1.3 1.7594 6 1.1 0.7 1.7595 7
5年 10月~ 9年 5月2.6 ▲ 0.1 0.50
96 8(カンフル景気)
3.1 0.1 0.5097 9 1997.7. アジア通貨・金融危機発生 1.0 1.8 0.5098 10 ▲ 1.3 0.6 0.5099 11 11年 1月~ 12年 11月 ▲ 0.3 ▲ 0.3 0.50
2000 12 (IT景気) 2.8 ▲ 0.7 0.5001 13 2001.9. 米国同時多発テロ事件発生 0.4 ▲ 0.7 0.1002 14 0.0 ▲ 0.9 0.1003 15 2003.3. イラク戦争 1.5 ▲ 0.3 0.1004 16 14年 2月~ 19年 10月 2.2 0.0 0.1005 17 (いざなみ景気) 1.8 ▲ 0.3 0.1006 18 2006.7. 日銀、ゼロ金利解除 1.4 0.3 0.4007 19 2007.8. 米国サブプライムローン危機勃発 1.5 0.0 0.7508 20 2008.9. リーマン・ショック ▲ 1.2 1.4 0.3009 21 2009.10. 欧州債務危機勃発 ▲ 5.7 ▲ 1.4 0.30
2010 22 4.1 ▲ 0.7 0.3011 23 2011.3. 東日本大震災 0.0 ▲ 0.3 0.3012 24 1.4 0.0 0.3013 25 2.0 0.4 0.3014 26 2014.3. ロシア、ウクライナ南部クリミアを編入 0.3 2.7 0.3015 27 1.6 0.8 0.3016 28 2016.6. 英国、国民投票で EU離脱を決定 0.8 ▲ 0.1 0.3017 29 2017.3. 英国、EUに離脱を正式通知 1.7 0.5 0.3018 30 2018.6~ 7. 平成 30年 7月豪雨 0.6 1.0 0.3019 令和 元 2019.5. 「令和」に改元 0.3 0.5 0.3020 2 2020.3. WHO、新型コロナ「パンデミック」と表明 ▲ 4.8 0.0 0.30
Notes : 1. 実質経済成長率は、80年までは 68SNA・90暦年基準、81年以降は 93SNA・95暦年基準、1995年以降は内閣府 2017年2月 13日公表の連鎖方式による。
Real GDP growth was calculated by the SNA68 on the 1990 calendar-year basis until 1980; by the SNA93 on the 1995 calendar-year basis in 1981 and thereafter; and by the chain method released on 13th Feb. 2017 by Cabinet Office in 1995 and thereafter.
2. 消費者物価指数は、総務省の各暦年基準に基づく。 Consumer Price Index was compiled from the CPI data on a calendar year basis published by Ministry of Internal Affairs and
Communications (MOIAC).Source : 内閣府 資料(旧経済企画庁『国民経済計算年報』、旧総務庁『消費者物価指数年報』含む)、日本銀行『物価指数月報』『経
済統計年報』などより作成。 Compiled from data available from Cabinet Office (including the ex-Economic Planning Agency's "Annual Report on National
Accounts" and the ex-Management and Coordination Agency's "Annual Report on the Consumer Price Index"), BOJ's "Price Indexes Monthly" and "Economic Statistics Annual", etc.
6 日本経済の動向 Developments in the Japanese Economy
�︱︱�︱︱�
�︱�︱�
���
�︱�︱����
�︱︱�︱︱�
資料編 Data Chapter▶6.日本経済の動向 Developments in the Japanese Economy 119資料編 Data Chapter▶5.国際商品相場 Fluctuation of International Commodity118

(2) 基調判断の変化 Assessment of the Current State of the Japanese Economy
報告月Reporting
month
該当月Corre-
spondingmonth
基調判断Assessment of the current state of
the Japanese economy
輸出Exports
輸入Imports
2019年1月Jan.
2018年11月Nov.
景気は、緩やかに回復している。The Japanese economy is recovering at a moderate pace.
このところ弱含んでいる。Exports are in a weak tone recently.
おおむね横ばいとなっている。Imports are almost flat.
2月Feb.
12月Dec.
景気は、緩やかに回復している。The Japanese economy is recovering at a moderate pace.
このところ弱含んでいる。Exports are in a weak tone recently.
おおむね横ばいとなっている。Imports are almost flat.
3月Mar.
2019年1月Jan.
景気は、このところ輸出や生産の一部に弱さもみられるが、緩やかに回復している。The Japanese economy is recovering at a moderate pace while weakness is seen recently in exports and industrial production in some sectors.
このところ弱含んでいる。Exports are in a weak tone recently.
おおむね横ばいとなっている。Imports are almost flat.
4月Apr.
2月Feb.
景気は、このところ輸出や生産の一部に弱さもみられるが、緩やかに回復している。The Japanese economy is recovering at a moderate pace while weakness is seen recently in exports and industrial production in some sectors.
このところ弱含んでいる。Exports are in a weak tone recently.
おおむね横ばいとなっている。Imports are almost flat.
5月May
3月Mar.
景気は、輸出や生産の弱さが続いているものの、緩やかに回復している。The Japanese economy is recovering at a moderate pace while weakness in exports and industrial production continues.
弱含んでいる。Exports are in a weak tone.
おおむね横ばいとなっている。Imports are almost flat.
6月Jun.
4月Apr.
景気は、輸出や生産の弱さが続いているものの、緩やかに回復している。The Japanese economy is recovering at a moderate pace while weakness in exports and industrial production continues.
弱含んでいる。Exports are in a weak tone.
おおむね横ばいとなっている。Imports are almost flat.
7月Jul.
5月May
景気は、輸出を中心に弱さが続いているものの、緩やかに回復している。The Japanese economy is recovering at a moderate pace while weakness continuing mainly in exports.
弱含んでいる。Exports are in a weak tone.
おおむね横ばいとなっている。Imports are almost flat.
8月Aug.
6月Jun.
景気は、輸出を中心に弱さが続いているものの、緩やかに回復している。The Japanese economy is recovering at a moderate pace while weakness continuing mainly in exports.
弱含んでいる。Exports are in a weak tone.
おおむね横ばいとなっている。Imports are almost flat.
9月Sep.
7月Jul.景気は、輸出を中心に弱さが続いているものの、緩やかに回復している。The Japanese economy is recovering at a moderate pace while weakness continuing mainly in exports.
弱含んでいる。Exports are in a weak tone.
おおむね横ばいとなっている。Imports are almost flat.
10月Oct.
8月Aug.
景気は、輸出を中心に弱さが長引いているものの、緩やかに回復している。The Japanese economy is recovering at a moderate pace while weakness lasting longer mainly in exports.
弱含んでいる。Exports are in a weak tone.
おおむね横ばいとなっている。Imports are almost flat.
11月Nov.
9月Sep.
景気は、輸出を中心に弱さが長引いているものの、緩やかに回復している。The Japanese economy is recovering at a moderate pace while weakness lasting longer mainly in exports.
弱含んでいる。Exports are in a weak tone.
おおむね横ばいとなっている。Imports are almost flat.
12月Dec.
10月Oct.
景気は、輸出が引き続き弱含むなかで、製造業を中心に弱さが一段と増しているものの、緩やかに回復している。The Japanese economy is recovering at a moderate pace, while weakness mainly among manufacturers is increasing further, as exports are continuing in a weak tone.
弱含んでいる。Exports are in a weak tone.
おおむね横ばいとなっている。Imports are almost flat.
2020年1月Jan.
11月Nov.
景気は、輸出が引き続き弱含むなかで、製造業を中心に弱さが一段と増しているものの、緩やかに回復している。The Japanese economy is recovering at a moderate pace, while weakness mainly among manufacturers is increasing further, as exports are continuing in a weak tone.
弱含んでいる。Exports are in a weak tone.
おおむね横ばいとなっている。Imports are almost flat.
報告月Reporting
month
該当月Corre-
spondingmonth
基調判断Assessment of the current state of
the Japanese economy
輸出Exports
輸入Imports
2月Feb.
12月Dec.
景気は、輸出が弱含むなかで、製造業を中心に弱さが一段と増した状態が続いているものの、緩やかに回復している。The Japanese economy is recovering at a moderate pace, while increased weakness mainly among manufacturers is continuing, as exports remain in a weak tone.
弱含んでいる。Exports are in a weak tone.
このところ弱含んでいる。Imports are in a weak tone recently.
3月Mar.
2020年1月Jan.
景気は、新型コロナウイルス感染症の影響により、足下で大幅に下押しされており、厳しい状況にある。The Japanese economy is in severe situation, extremly depressed by the Novel Coronavirus.
弱含んでいる。Exports are in a weak tone.
感染症の影響により、このところ減少している。Imports are on a decline recently due to the influence of the infectious disease.
4月Apr.
2月Feb.
景気は、新型コロナウイルス感染症の影響により、急速に悪化しており、極めて厳しい状況にある。The Japanese economy is getting worse rapidly in an extremely severe situation, due to the Novel Coronavirus.
感染症の影響により、このところ減少している。Exports are on a decline recently, due to the influence of the infectious disease.
感染症の影響により、このところ減少している。Imports are on a decline recently due to the influence of the infectious disease.
5月May
3月Mar.
景気は、新型コロナウイルス感染症の影響により、急速な悪化が続いており、極めて厳しい状況にある。The Japanese economy is worsening rapidly in an extremely severe situation, due to the Novel Coronavirus.
感染症の影響により、急速に減少している。Exports are decreasing rapidly, due to the influence of the infectious disease.
感染症の影響は残るものの、このところ下げ止まりつつある。Imports are bottoming out, although the influence of the infectious disease remains.
6月Jun.
4月Apr.
景気は、新型コロナウイルス感染症の影響により、極めて厳しい状況にあるが、下げ止まりつつある。The Japanese economy is still in an extremely severe situation due to the Novel Coronavirus, but it almost stopped deteriorating.
感染症の影響により、急速に減少している。Exports are decreasing rapidly, due to the influence of the infectious disease.
感染症の影響は残るものの、このところ下げ止まりつつある。Imports are bottoming out, although the influence of the infectious disease remains.
7月Jul.
5月May
景気は、新型コロナウイルス感染症の影響により、依然として厳しい状況にあるが、このところ持ち直しの動きがみられる。The Japanese economy is still in a severe situation due to the Novel Coronavirus, but it is showing movements of picking up recently.
感染症の影響は残るものの、下げ止まりつつある。Exports are bottoming out, although the influence of the infectious disease remains.
このところ下げ止まっている。Imports bottom out recently.
8月Aug.
6月Jun.
景気は、新型コロナウイルス感染症の影響により、依然として厳しい状況にあるが、このところ持ち直しの動きがみられる。The Japanese economy is still in a severe situation due to the Novel Coronavirus, but it is showing movements of picking up recently.
持ち直しの動きがみられる。Exports show movements of picking up.
このところ下げ止まっている。Imports bottom out recently.
9月Sep.
7月Jul.景気は、新型コロナウイルス感染症の影響により、依然として厳しい状況にあるが、このところ持ち直しの動きがみられる。The Japanese economy is still in a severe situation due to the Novel Coronavirus, but it is showing movements of picking up recently.
持ち直している。Exports are picking up.
おおむね横ばいとなっている。Imports level off.
10月Oct.
8月Aug.
景気は、新型コロナウイルス感染症の影響により、依然として厳しい状況にあるが、持ち直しの動きがみられる。The Japanese economy is still in a severe situation due to the Novel Coronavirus, but it is showing movements of picking up.
持ち直している。Exports are picking up.
このところ弱含んでいる。Imports are in a weak tone recently.
11月Nov.
9月Sep.
景気は、新型コロナウイルス感染症の影響により、依然として厳しい状況にあるが、持ち直しの動きがみられる。The Japanese economy is still in a severe situation due to the Novel Coronavirus, but it is showing movements of picking up.
持ち直している。Exports are picking up.
このところ弱含んでいる。Imports are in a weak tone recently.
12月Dec.
10月Oct.
景気は、新型コロナウイルス感染症の影響により、依然として厳しい状況にあるが、持ち直しの動きがみられる。The Japanese economy is still in a severe situation due to the Novel Coronavirus, but it is showing movements of picking up.
増加している。Exports are increasing.
おおむね横ばいとなっている。Imports are leveling off.
Source : 内閣府『月例経済報告』より作成。 Compiled from Cabinet Office's "Monthly Economic Report".
資料編▶6.日本経済の動向120 Data Chapter▶6.Developments in the Japanese Economy 121

■ 産業別 By Industry (億円 ¥100 million)
(輸出 Exports) F.Y.2015 F.Y.2016 F.Y.2017 F.Y.2018 F.Y.2019
全 産 業 All Industries 39,498 35,719 38,844 38,711 36,626
製 造 業 Manufacturing Industries 38,626 34,778 38,209 38,227 35,966
医 薬 品 Medicines 4,771 4,442 6,592 6,401 6,258
化 学 Chemicals and Allied Product 774 586 590 597 560
鉄 鋼 Iron & Steel 104 92 131 122 175
電気機械器具 Electrical Machinery, Equipment and Supplies 1,669 1,646 1,811 1,912 1,839
輸送用機械器具 Transportation Equipment 23,277 21,500 21,647 21,634 19,537
建 設 業 Construction 30 46 31 32 51
その他非製造業 Other Non-manufacturing Industries 842 895 604 452 609
(輸入 Imports)
全 産 業 All Industries 6,026 4,529 6,298 5,910 5,436
製 造 業 Manufacturing Industries 4,945 3,656 4,773 4,348 3,845
医 薬 品 Medicines 1,758 1,424 2,107 1,760 1,679
化 学 Chemicals and Allied Product 180 189 174 169 133
電気機械器具 Electrical Machinery, Equipment and Supplies 357 244 247 344 229
輸送用機械器具 Transportation Equipment 320 334 351 397 287
情 報 通 信 Information and Communications 910 649 1,198 1,269 1,349
建 設 業 Construction 3 2 2 1 2
その他非製造業 Other Non-manufacturing Industries 1,078 871 1,523 1,561 1,589
■ 地域・国別 By Area/Country (億円 ¥100 million)
(輸出 Exports) F.Y.2015 F.Y.2016 F.Y.2017 F.Y.2018 F.Y.2019
全 世 界 Grand Total 39,498 35,719 38,844 38,711 36,626
米 国 USA 15,979 13,824 12,779 14,062 13,812
ヨ ー ロ ッ パ Europe 5,942 5,368 7,159 6,640 6,372
ア ジ ア Asia 14,403 13,594 14,540 15,008 13,829
(輸入 Imports)
全 世 界 Grand Total 6,026 4,529 6,298 5,910 5,436
米 国 USA 4,249 3,280 3,941 3,926 3,940
ヨ ー ロ ッ パ Europe 1,414 1,086 2,097 1,551 1,292
貿 易 収 支 Trade Balance 33,472 31,190 32,546 32,801 31,190
Source : 総務省『科学技術研究調査結果』より作成。 Compiled from MOIAC's report on Investigations into Science and Technology.
7 技術貿易 Trade in Technology
経常収支貿 易・ 貿易収支 サービス 第一次 第二次サービス 輸 出 輸 入 収 支 所得収支 所得収支収 支 前年比(%) 前年比(%)
Year Current account
Goods & services Goods Exports
Change from
previous year
Imports
Change from
previous year
Services Primary income
Secondary income
2013 44,566 ▲122,521 ▲87,734 678,290 9.5 766,024 15.7 ▲34,786 176,978 ▲9,892
14 39,215 ▲134,988 ▲104,653 740,747 9.2 845,400 10.4 ▲30,335 194,148 ▲19,945
15 165,194 ▲28,169 ▲8,862 752,742 1.6 761,604 ▲9.9 ▲19,307 213,032 ▲19,669
16 213,910 43,888 55,176 690,927 ▲8.2 635,751 ▲16.5 ▲11,288 191,478 ▲21,456
17 227,779 42,206 49,113 772,535 11.8 723,422 13.8 ▲6,907 206,843 ▲21,271
18 194,001 1,052 11,265 812,263 5.1 800,998 10.7 ▲10,213 212,980 ▲20,031
19 205,259 5,060 3,812 760,309 ▲1.6 756,498 4.6 1,248 213,954 ▲13,755
20(P) 176,976 ▲ 4,905 30,457 673,277 ▲ 17.1 642,820 19.7 ▲ 35,362 207,175 ▲25,294
資本移転等 金融収支 誤差脱漏 外貨準備収支 直接投資 証券投資 金融派生 その他 外貨準備 (年末)
商品 投資 (100万ドル)
Year Capitalaccount
Financialaccount
Directinvestment
Portfolioinvestment
Financialderivatives(other thanreserves)
Otherinvestment
Reserveassets
Net errors&
omissions
Foreign currency reserves
(year-end)($ million)
2013 ▲7,436 ▲4,087 142,459 ▲265,652 55,516 25,085 38,504 ▲41,217 1,266,815
14 ▲2,089 62,782 125,877 ▲48,330 37,644 ▲61,306 8,898 25,656 1,260,548
15 ▲2,714 218,764 161,319 160,294 21,439 ▲130,539 6,251 56,283 1,233,214
16 ▲7,433 286,059 148,587 296,496 ▲16,582 ▲136,662 ▲5,780 79,583 1,216,903
17 ▲2,800 188,113 174,118 ▲56,513 34,523 9,467 26,518 ▲36,866 1,264,283
18 ▲2,105 200,315 148,047 100,528 1,239 ▲76,127 26,628 8,419 1,270,975
19 ▲4,131 247,164 235,314 93,337 3,778 ▲113,305 28,039 46,035 1,323,750
20(P) ▲1,850 179,842 114,640 41,443 8,854 2,926 11,980 4,717 1,394,680
Notes : 1. (P)は速報値。 (P) represents provisional figures. 2. 2013年の計数は、国際収支マニュアル第 5版準拠統計を第 6版の基準により組み替えたもの。 2013C.Y. data based on BPM5 are rearranged in accordance with BPM6.Source : 財務省の公式サイトより作成。 Compiled from MOF's website.
(1) 総括表 Summary (億円 ¥100 million)
8 国際収支(IMFベース) Balance of Payments資料編 Data Chapter▶8.国際収支(IMFベース) Balance of Payments 123資料編 Data Chapter▶7.技術貿易 Trade in Technology122

サービス収支輸送 旅行 その他 委託加工 維持修理 建設
サービス サービス サービス
Year Services Transport Travel Otherservices
Manufacturingservices on
physical inputsowned by
others
Maintenance &
repairservices
n.i.e.
Construction
2013 ▲34,786 ▲7,183 ▲6,545 ▲21,058 ▲7,085 ▲420 2,110
14 ▲30,335 ▲6,653 ▲444 ▲23,239 ▲4,941 ▲5,475 898
15 ▲19,307 ▲6,831 10,902 ▲23,378 ▲5,156 ▲3,362 3,030
16 ▲11,288 ▲6,944 13,267 ▲17,610 ▲4,789 ▲3,790 2,081
17 ▲6,907 ▲6,630 17,796 ▲18,073 ▲5,321 ▲4,529 2,428
18 ▲10,213 ▲10,769 24,160 ▲23,603 ▲4,782 ▲4,970 1,076
19 1,248 ▲8,814 27,023 ▲16,961 ▲3,555 ▲5,724 3,527
20(P) ▲35,362 ▲7,847 5,621 ▲33,136 ▲3,996 ▲5,481 1,755
サービス収支 Services
その他サービス Other services
保険・年金 金融 知的財産権等 通信・ その他業務 個人・ 公的サービス サービス 使用料 コンピュータ・ サービス 文化・ サービス等
情報サービス 娯楽サービス
YearInsurance &
pension services
Financialservices
Charges forthe use ofintellectual
property n.i.e.
Telecommunications,computer &
information services
Other businessservices
Personal,cultural &
recreationalservices
Governmentgoods &
services n.i.e.
2013 ▲6,417 926 13,422 ▲3,553 ▲19,824 ▲948 729
14 ▲3,781 2,182 17,502 ▲8,879 ▲22,989 ▲401 2,645
15 ▲3,890 5,208 23,508 ▲12,246 ▲32,580 ▲766 2,874
16 ▲3,951 6,125 20,700 ▲11,401 ▲25,355 ▲622 3,393
17 ▲4,612 3,149 22,836 ▲10,397 ▲24,615 ▲190 3,179
18 ▲5,042 3,405 25,981 ▲13,680 ▲28,570 ▲29 3,008
19 ▲6,305 6,292 22,480 ▲14,962 ▲21,820 231 2,875
20(P) ▲8,566 5,196 16,059 ▲12,330 ▲28,228 189 2,265
Notes : 1. (P)は速報値。 (P) represents provisional figures. 2. 2013年の計数は、国際収支マニュアル第 5版準拠統計を第 6版の基準により組み替えたもの。 2013C.Y. data based on BPM5 are rearranged in accordance with BPM6.Source : 財務省の公式サイトより作成。 Compiled from MOF's website.
(2) サービス収支 Services Balance (億円 ¥100 million)
9 対外・対内直接投資(地域・業種別(2019年))
(億円 ¥100 million)地域別
By Area
業種別By Industry
全世界 アジア 北 米 中南米 大洋州 欧 州 中東 アフリカ
World Asia North America
Central South
AmericaOceania Europe Middle
East Africa
製 造 業 Manufacturing Total 116,588 28,333 20,383 4,359 3,855 58,695 79 883
食 料 品 Food 5,956 1,449 1,278 137 1,015 1,990 X X
繊 維 Textile 849 423 279 ▲ 13 . 190 . X
木材・パルプ Lumber & pulp 1,569 903 124 260 127 57 14 .
化 学・ 医 薬 Chemicals & pharmaceuticals 45,496 4,519 2,205 197 2,645 35,753 6 27
石 油 Petroleum 426 5 351 X 1 ▲ 1 . .
ゴ ム・ 皮 革 Rubber & leather 3,188 479 1,504 8 X 1,180 . 7
ガラス・土石 Glass & ceramics 2,395 499 343 95 X 1,391 . 11
鉄・非鉄・金属 Iron, non-ferrous & metals 5,350 2,249 828 203 11 1,947 10 X
一般機械器具 General machinery 7,542 3,437 1,894 74 41 1,356 ▲ 7 413
電気機械器具 Electric machinery 15,529 4,090 8,811 203 ▲ 81 2,245 20 .
輸送機械器具 Transportation equipment 22,795 8,587 1,865 1,511 84 10,374 23 384
精密機械器具 Precision machinery 3,170 664 506 11 X 666 2 X
非 製 造 業 Non-manufacturing Total 130,481 31,488 31,087 10,365 7,344 52,060 186 ▲ 2,050
農 ・ 林 業 Farming & forestry 64 ▲ 5 8 22 12 X . .
漁・ 水 産 業 Fishery & marine products 58 ▲ 2 47 X X X . .
鉱 業 Mining 10,353 207 3,264 2,900 2,210 2,010 ▲ 4 X
建 設 業 Construction 1,693 509 860 ▲ 17 374 ▲ 40 12 3
運 輸 業 Transportation 2,672 795 251 563 286 688 ▲ 14 96
通 信 業 Communications 4,005 ▲ 614 ▲ 838 2,162 11 5,918 X ▲ 2,528
卸売・小売業 Wholesale & retail 59,403 6,572 8,913 1,610 1,036 40,989 129 66
金融・保険業 Finance & insurance 36,246 17,626 5,216 5,306 4,461 3,491 40 75
不 動 産 業 Real estate 11,889 2,504 3,111 5,572 28 222 . .
サ ー ビ ス 業 Services ▲ 1,124 3,808 8,362 ▲ 7,932 ▲ 1,151 ▲ 4,288 X 10
合 計 Grand Total 247,068 59,821 51,471 14,724 11,199 110,755 266 ▲ 1,167
Notes : 1. 報告件数が 3件に満たない項目は、個別データ保護の観点から「X」と表示している。 Data items with less than three reports are indicated as "X" for confidentiality. 2. 該当データが存在しない項目は、ピリオド(「.」)で表示している。 When there are no reports, it is indicated as ".". 3. 「製造業」「非製造業」は、各内訳項目、Xに、それぞれ「その他製造業」「その他非製造業」を加え
た合計であり、表上の各業種の合計とは必ずしも一致しない。 "Manufacturing Total" and "Non-manufacturing Total" are not necessarily equal to the sum of the figures
on the table. They also include the undisclosed item "X", and "Other manufacturing"/"Other non-manufacturing" respectively.
4. 各業種レベルでは、各地域は個別国の合計、「全世界」は個別国、Xの合計であるため、「全世界」と表上の各地域の合計とは必ずしも一致しない。
In each industry, figures recorded under "World", which also include the undisclosed item "X", is not necessarily equal to the sum of the regional component.
5. 上記の計数は、関連会社から親会社への投資を、親会社による投資の回収として計上(親子関係原則)。したがって、「国際収支状況」等において公表している直接投資(関連会社から親会社への投資を、親会社による投資の回収として計上せず、グロスで集計(資産負債原則))とは一致しない。
Figures in this table are compiled according to the Directional Principle - that is, investments from an affiliated company in its parent company are recorded as withdrawals from the parent company. Thus, the figures are different from those of direct investment in the Balance of Payments that are compiled according to the Asset and Liability Principle on a gross basis.
Source : 財務省「令和元(平成 31)年中 対外・対内 直接投資」より作成。 Compiled from reports submitted to the MOF on "Outward/Inward Direct Investment, 2019 C.Y.".
(1) 対外直接投資(地域・業種別(2019年)) Outward Direct Investment by Area and Industry (2019)
資料編 Data Chapter▶9.対外・対内直接投資(地域・業種別(2019年)) Outward/Inward Direct Investment breakdown by Area and Industry (2019) 125資料編 Data Chapter▶8.国際収支(IMFベース) Balance of Payments124

(億円 ¥100 million)地域別
By Area
業種別By Industry
全世界 アジア 北 米 中南米 大洋州 欧 州 中東 アフリカ
World Asia North America
Central South
AmericaOceania Europe Middle
East Africa
製 造 業 Manufacturing Total 10,157 936 3,056 1,429 ▲ 18 4,680 74 .
食 料 品 Food 610 114 274 202 . ▲ 2 . .
繊 維 Textile 33 ▲ 2 . . . X . .
木材・パルプ Lumber & pulp 17 37 . X . X . .
化 学・ 医 薬 Chemicals & pharmaceuticals 3,359 ▲ 154 2,610 503 . 321 X .
石 油 Petroleum ▲ 877 . . . . ▲ 877 . .
ゴ ム・ 皮 革 Rubber & leather . . . . . . . .
ガラス・土石 Glass & ceramics ▲ 94 . . 90 X ▲ 201 . .
鉄・非鉄・金属 Iron, non-ferrous & metals 109 ▲ 1 27 6 ▲ 14 55 . .
一般機械器具 General machinery ▲ 672 18 124 81 X ▲ 926 . .
電気機械器具 Electric machinery 3,877 683 9 ▲ 54 X 3,079 .
輸送機械器具 Transportation equipment 3,813 145 4 620 . 2,683 . .
精密機械器具 Precision machinery ▲ 124 X 13 ▲ 92 . ▲ 46 . .
非 製 造 業 Non-manufacturing Total 5,707 2,480 7,798 1,482 208 ▲ 7,016 130 625
農 ・ 林 業 Farming & forestry 8 3 X . . 5 . .
漁・ 水 産 業 Fishery & marine products 9 9 . . . X . .
鉱 業 Mining 42 . X . . X . .
建 設 業 Construction 267 223 42 96 X ▲ 108 3 .
運 輸 業 Transportation 170 42 10 7 75 ▲ 11 . X
通 信 業 Communications ▲ 1,447 ▲ 926 ▲ 867 337 X ▲ 172 X .
卸売・小売業 Wholesale & retail ▲ 4,886 ▲ 215 ▲ 325 640 ▲ 12 ▲ 5,606 15 X
金融・保険業 Finance & insurance 8,875 1,239 7,901 ▲ 100 6 ▲ 153 . X
不 動 産 業 Real estate 349 303 16 21 118 ▲ 275 . X
サ ー ビ ス 業 Services 1,289 663 1,179 78 ▲ 22 ▲ 710 98 .
合 計 Grand Total 15,864 3,416 10,854 2,911 189 ▲ 2,336 204 625
Notes : 1. 報告件数が 3件に満たない項目は、個別データ保護の観点から「X」と表示している。 Data items with less than three reports are indicated as "X" for confidentiality. 2. 該当データが存在しない項目は、ピリオド(「.」)で表示している。 When there are no reports, it is indicated as ".". 3. 「製造業」「非製造業」は、各内訳項目、Xに、それぞれ「その他製造業」「その他非製造業」を加え
た合計であり、表上の各業種の合計とは必ずしも一致しない。 "Manufacturing Total" and "Non-manufacturing Total" are not necessarily equal to the sum of the figures
on the table. They also include the undisclosed item "X", and "Other manufacturing"/"Other non-manufacturing" respectively.
4. 各業種レベルでは、各地域は個別国の合計、「全世界」は個別国、Xの合計であるため、「全世界」と表上の各地域の合計とは必ずしも一致しない。
In each industry, figures recorded under "World", which also include the undisclosed item "X", is not necessarily equal to the sum of the regional component.
5. 上記の計数は、関連会社から親会社への投資を、親会社による投資の回収として計上(親子関係原則)。したがって、「国際収支状況」等において公表している直接投資(関連会社から親会社への投資を、親会社による投資の回収として計上せず、グロスで集計(資産負債原則))とは一致しない。
Figures in this table are compiled according to the Directional Principle - that is, investments from an affiliated company in its parent company are recorded as withdrawals from the parent company. Thus, the figures are different from those of direct investment in the Balance of Payments that are compiled according to the Asset and Liability Principle on a gross basis.
Source : 財務省「令和元(平成 31)年中 対外・対内 直接投資」より作成。 Compiled from reports submitted to the MOF on "Outward/Inward Direct Investment, 2019 C.Y.".
(2) 対内直接投資(地域・業種別(2019年)) Inward Direct Investment by Area and Industry (2019) (1) わが国の経済協力 Japan's Economic Cooperation (億ドル $100 million)項 目 Item 2015 2016 2017 2018
①政府開発援助ODA
贈 与 Bilateral aid 50.2 55.9 55.1 52.9( 無 償 資 金 )Grant aid (26.5)(28.1)(26.2)(26.4)( 技 術 協 力 )Technical cooperation (23.7)(27.8)(28.9)(26.5)二 国 間 貸 付 等 Bilateral loans 11.2 14.2 25.3 7.7
国際機関への出資等 Contribution & subscriptions to international organizations
30.4 33.7 33.8 39.7
計 Total 91.7 103.8 114.2 100.3② その他政府資金
Other official flows
輸出信用(1年超)Export credits (over one year) 1.3 6.6 6.9 2.9直 接 投 資 金 融 等 Direct investment & others ▲ 4.0 34.9 ▲ 26.8 13.3国際機関への融資等 Contribution to multilateral Institutions - - - -
計 Total ▲ 2.8 41.5 ▲ 20.0 16.2③民間資金
Privateflows
輸出信用(1年超)Export credits (over one year) 22.5 26.4 1.7 ▲ 24.4直 接 投 資 Direct investment 445.1 357.7 503.9 716.4証 券 投 資 等 Other bilateral securities & claims 28.5 12.2 77.8 116.3国際機関への融資等 Contributions to multilateral institutions 1.9 ▲ 4.8 ▲ 9.1 2.4
計 Total 497.9 391.5 574.3 810.6④ 非 営 利 団 体 の 贈 与 Grants by NPOs 5.0 3.7 4.8 5.2
総 計 ① + ② + ③ + ④ Grand Total 591.8 540.4 673.2 932.3
Notes : 1. 支出純額ベース。 Net disbursement basis. 2. 東欧、卒業国向け含む。 Includes flows to Eastern Europe and ODA graduates. 3. 無償資金協力には、付保商業債権の金利減免分(貿易保険)含む。 Grant aid includes insured commercial credits with reduced or waived interest payments (credits
insured by trade insurance).
(援助比率 Breakdown of Aid) (%)項 目 Type of aid 2015 2016 2017 2018
政府開発援助ODA
対 G N I 比 % in GNI 0.20 0.20 0.23 0.19グラント・エレメント Grant element 87.3 87.0 86.0 78.5ア ン タ イ ド 比 率 % of untied aid 82.3 86.2 93.1 75.0贈 与 比 率 % of aid 38.2 35.6 36.8 32.4
Notes : 1. グラント・エレメントおよび贈与比率は約束額ベース、前年との 2年間の平均値(債務救済を除く)。 Grant elements and aid percentages are both on a commitment basis representing averages of the last two
years. Debt relief is not included. 2. アンタイド比率は部分アンタイドを含む。 Untied aid includes partially untied aid. 3. 東欧、卒業国向け含む。 Includes flows to Eastern Europe and ODA graduates. 4. グラント・エレメント:援助条件の穏やかさを表示するための指標で、商業条件(金利 10%と仮定)の
借款を G.E.0%とし、条件 (金利、返済期間、据置期間 )が緩和されるに従って G.E.の%が高くなり、贈与の場合はこれが 100%となる(出所:旧通商産業省『経済協力の現状と問題点』)。
Grant element: an index to show softness of ODA terms. GE is deemed to be zero percent for a commercial loan (at an assumed 10% interest rate), and rises as the terms (interest rates, payback periods and grace periods) become softer reaching 100% on an aid (source: the former Ministry of International Trade and Industry's (MITI) "Keizai Kyoryoku no Genjo to Mondaiten" ("Current state and challenges of economic cooperation").
・ 計算式 Formula
GE(%)= 100 ×(1--)〔1-̶ 〕 1 1̶-̶(1+d)aG (1+d)aMr/ad
d(aM- aG) r=金利 interest rate、 a=年間支払回数 number of payment in a year、 d=割引度 discount rate (=(1.1)1
d̶-1)、G=据置期間 grace period、 M=償還期間 maturity (Source: 三省堂『国際開発協力の仕組みと法』。 SANSEIDO Co., Ltd.'s "Kokusai Kyoryoku no Shikumi to Hou" ("Systems of and Rules for International
Cooperation for Development").Source : 外務省公式サイト「2019年版 開発協力参考資料集」などより作成。 Compiled from MOFA's website etc.
10 経済協力 Economic Cooperation資料編 Data Chapter▶10.経済協力 Economic Cooperation 127資料編 Data Chapter▶9.対外・対内直接投資(地域・業種別(2019年)) Outward/Inward Direct Investment breakdown by Area and Industry (2019)126

総額 アジア 中東・北アフリカ
サブサハラ・アフリカ 中南米 大洋州 欧州 その他
Grand Total Asia Middle East
& North AfricaSub-Saharan
AfricaLatin America
& the Caribbean Oceania Europe Others
2015120.1 63.3 14.2 18.9 4.4 1.3 1.1 16.9(100.0)(52.7) (11.8) (15.7) (3.6) (1.1) (0.9) (14.1)
2016134.5 70.4 19.4 14.9 4.3 1.8 4.0 19.7(100.0)(52.3) (14.5) (11.1) (3.2) (1.3) (3.0) (14.6)
2017150.8 90.1 17.4 17.0 3.7 3.2 0.9 18.5(100.0)(59.7) (11.5) (11.3) (2.5) (2.1) (0.6) (12.3)
2018133.0 75.1 16.8 13.3 4.5 2.2 0.8 20.2(100.0)(56.5) (12.7) (10.0) (3.4) (1.6) (0.6) (15.2)
Notes : 1. 支出総額ベース。 Gross Disbursement basis. 2. 卒業国向け援助を含む。 Figures include disbursements for graduate countries. 3. カッコ内は総額に占めるシェア。 Figures in parentheses represent share of grand total. 4. 四捨五入の関係上 、各形態の計が一致しないことがある。 Individual totals may not be equal to the sums of the individual parts because some numbers have
been rounded off.Source : 外務省の公式サイトより作成。 Compiled from MOFA's website.
(2) わが国政府開発援助(ODA)の地域的配分 Japan's Distribution of ODA by Recipient Area (億ドル $100 million %)
1 位 2 位 3 位 4 位 5 位
2015ベトナム インド バングラデシュ ミャンマー イラクViet Nam India Bangladesh Myanmar Iraq(10.7) (8.7) (3.8) (3.5) (3.3)
2016ベトナム インド イラク ミャンマー バングラデシュViet Nam India Iraq Myanmar Bangladesh(11.7) (10.1) (6.2) (5.1) (4.6)
2017インド バングラデシュ ベトナム モンゴル ミャンマーIndia Bangladesh Viet Nam Mongolia Myanmar(15.5) (13.1) (9.3) (5.0) (3.8)
2018インド バングラデシュ ミャンマー イラク ベトナムIndia Bangladesh Myanmar Iraq Viet Nam(13.8) (11.8) (5.4) (4.7) (2.0)
Notes : 1. 支出純額ベース。 Net disbursement basis. 2. 二国間借款のみで国際機関への出資などは含まず。 Data include bilateral loans but do not include contribution and subscriptions to international
organizations. 3. カッコ内は受取金額。 Figures in parentheses represent the value of ODA received.Source : 外務省『2019年版 開発協力白書』などより作成。 Compiled from MOFA's "White Paper on Development Cooperation 2019" etc.
(3) わが国政府開発援助(ODA)の受取国順位 Ranking of Top Recipients of Japan's ODA (億ドル $100 million)
(支出総額ベース、百万ドル Gross disbursement basis, $ million)
2016 金額Value 2017 金額
Value 2018 金額Value
1 インド 1,800.46 インド 2,376.10 インド 2,231.91India India India
2 ベトナム 1,583.47 バングラデシュ 1,421.65 バングラデシュ 1,297.71Viet Nam Bangladesh Bangladesh
3 イラク 628.92 ベトナム 1,389.60 ベトナム 673.85Iraq Viet Nam Viet Nam
4 バングラデシュ 568.28 インドネシア 520.59 フィリピン 562.50Bangladesh Indonesia Philippines
5 ミャンマー 506.82 モンゴル 516.73 ミャンマー 536.90Myanmar Mongolia Myanmar
6 タイ 414.05 タイ 388.61 タイ 270.82Thailand Thailand Thailand
7 ウクライナ 350.8 ミャンマー 379.07 ウズベキスタン 217.55Ukraine Myanmar Uzbekistan
8 フィリピン 301.51 フィリピン 352.30 スリランカ 200.63Philippines Philippines Sri Lanka
9 スリランカ 199.03 ウズベキスタン 272.74 カンボジア 169.07Sri Lanka Uzbekistan Cambodia
10 ウズベキスタン 195.1 スリランカ 224.02 ラオス 89.57Uzbekistan Sri Lanka Laos
11 モンゴル 191.43 カンボジア 188.92 モンゴル 88.18Mongolia Cambodia Mongolia
12 カンボジア 140.92 ラオス 77.39 コスタリカ 48.74Cambodia Laos Costa Rica
13 ラオス 63.78 コスタリカ 55.74 パラグアイ 39.50Laos Costa Rica Paraguay
14 アゼルバイジャン 58.63 アゼルバイジャン 49.97 タジキスタン 37.89Azerbaijan Azerbaijan Tajikistan
15 マレーシア 47.46 マレーシア 34.39 サモア 28.04Malaysia Malaysia Samoa
16 コスタリカ 45.73 ブータン 28.49 キリバス 21.66Costa Rica Bhutan Kiribati
17 パラグアイ 32.02 パラグアイ 23.29 マレーシア 19.09Paraguay Paraguay Malaysia
18 ブータン 19.79 トンガ 22.92 ブータン 18.80Bhutan Tonga Bhutan
19 パラオ 10.48 パラオ 12.97 モルディブ 4.11Palau Palau Maldives
20 モルディブ 8.09 モルディブ 5.55 アンティグア・バーブーダ 2.17Maldives Maldives Antigua and Barbuda
21 セントルシア 5.59 セーシェル 5.49 セントルシア 1.83St. Lucia Seychelles St. Lucia
22 アンティグア・バーブーダ 5.14 セントルシア 4.19 - -Antigua and Barbuda St. Lucia
23 グレナダ 4.34 エリトリア 3.5 - -Grenada Eritrea
24 セントビンセント 3.74 セントビンセント 2.23 - -St. Vincent St. Vincent
Notes : 地域は含まず、卒業国向け援助を除く。 Figures exclude areas and disbursements for graduate countries.参考: 日本が第 2位の援助供与国となっている国は計 29ヵ国(2018年実績)。Reference:The counties which Japan is their second donor are 29 countries in total (disbursements for 2018).Source : 外務省公式サイト「2019年版 開発協力参考資料集」より作成。 Compiled from MOFA's website.
(4) 日本が最大の援助供与国となっている国一覧 List of Countries in which Japan is their Top Donor
資料編▶10.経済協力128 Data Chapter▶10.Economic Cooperation 129

11国際比較 Comparisons with Major Countries
①財 Goods(輸出 Exports) (億ドル $100 million)
日本 米国 ドイツ 英国 フランス イタリア カナダ 中国Japan USA Germany UK France Italy Canada China
2010 7,698 12,785 12,589 4,202 5,238 4,473 3,875 15,77811 8,232 14,825 14,740 5,104 5,965 5,233 4,513 18,98412 7,986 15,457 14,011 4,788 5,687 5,013 4,556 20,48713 7,151 15,796 14,451 5,468 5,810 5,183 4,583 22,09014 6,902 16,205 14,942 5,108 5,814 5,298 4,763 23,42315 6,249 15,026 13,262 4,659 5,063 4,570 4,101 22,73516 6,451 14,510 13,344 4,109 5,012 4,617 3,900 20,97617 6,983 15,463 14,482 4,410 5,353 5,074 4,207 22,63318 7,381 16,640 15,605 4,864 5,822 5,495 4,508 24,86719 7,056 16,432 14,892 4,697 5,715 5,327 4,469 24,995
(輸入 Imports) (億ドル $100 million)日本 米国 ドイツ 英国 フランス イタリア カナダ 中国
Japan USA Germany UK France Italy Canada China2010 6,941 19,692 10,548 5,923 6,111 4,870 4,027 13,962
11 8,554 22,660 12,549 6,809 7,200 5,588 4,636 17,43512 8,858 23,365 11,549 7,028 6,744 4,886 4,763 18,18413 8,332 23,291 11,812 6,622 6,815 4,794 4,758 19,50014 8,122 24,125 12,072 6,941 6,766 4,744 4,753 19,59215 6,481 23,153 10,511 6,300 5,708 4,109 4,301 16,79616 6,077 22,502 10,553 6,367 5,677 4,068 4,129 15,87917 6,721 24,085 11,629 6,410 6,193 4,531 4,437 18,43818 7,485 26,142 12,844 6,723 6,764 5,032 4,705 21,35719 7,210 25,674 12,345 6,958 6,538 4,735 4,637 20,784
(1) 貿易額 Trade Value
②サービス Services(輸出 Exports) (億ドル $100 million)
日本 米国 ドイツ 英国 フランス イタリア カナダ 中国Japan USA Germany UK France Italy Canada China
2010 1,318 5,628 2,203 2,855 2,013 1,002 771 1,77411 1,379 6,232 2,456 3,294 2,353 1,100 860 2,00312 1,338 6,627 2,474 3,356 2,337 1,079 905 2,00613 1,327 6,977 2,676 3,595 2,531 1,113 923 2,05814 1,593 7,370 2,949 3,883 2,720 1,136 913 2,18115 1,583 7,483 2,756 3,690 2,549 975 837 2,17616 1,707 7,618 2,872 3,604 2,585 1,001 862 2,08317 1,820 8,105 3,141 3,717 2,706 1,113 929 2,26418 1,888 8,405 3,376 4,055 2,940 1,225 976 2,69719 2,005 8,533 3,352 4,118 2,871 1,214 991 2,817
(輸入 Imports) (億ドル $100 million)日本 米国 ドイツ 英国 フランス イタリア カナダ 中国
Japan USA Germany UK France Italy Canada China2010 1,629 4,045 2,624 1,848 1,811 1,116 989 1,923
11 1,738 4,269 2,949 1,973 2,023 1,175 1,079 2,46812 1,828 4,417 2,935 1,992 2,022 1,072 1,127 2,80313 1,690 4,405 3,267 2,089 2,276 1,090 1,145 3,29414 1,905 4,667 3,314 2,302 2,525 1,153 1,130 4,30915 1,766 4,762 3,005 2,290 2,334 1,015 1,037 4,33016 1,842 4,904 3,147 2,222 2,368 1,035 1,035 4,49217 1,910 5,228 3,413 2,277 2,489 1,150 1,111 4,64118 1,988 5,391 3,658 2,583 2,663 1,245 1,145 5,20719 2,017 5,643 3,630 2,792 2,628 1,227 1,141 4,970
Source : 世界貿易機関の統計より作成。 Compiled from WTO's Statistics.
①財 Goods(輸出 Exports) (%)
2005 2010 2015 2019日 本 Japan 5.7 5.0 3.8 3.7(金額:億ドル) $100 million (5,949) (7,698) (6,249) (7,056)米 国 USA 8.6 8.4 9.1 8.7ド イ ツ Germany 9.2 8.2 8.0 7.9英 国 UK 3.7 2.7 2.8 2.5フ ラ ン ス France 4.4 3.4 3.1 3.0イ タ リ ア Italy 3.6 2.9 2.8 2.8カ ナ ダ Canada 3.4 2.5 2.5 2.4中 国 China 7.2 10.3 13.7 13.2
合 計 Total 100.0 100.0 100.0 100.0(金額:億ドル) $100 million (105,103) (153,065) (165,557) (189,330)
(輸入 Imports) (%)2005 2010 2015 2019
日 本 Japan 4.8 4.5 3.9 3.7(金額:億ドル) $100 million (5,159) (6,941) (6,481) (7,210)米 国 USA 16.1 12.8 13.8 13.3ド イ ツ Germany 7.2 6.8 6.3 6.4英 国 UK 4.8 3.8 3.8 3.6フ ラ ン ス France 4.7 4.0 3.4 3.4イ タ リ ア Italy 3.6 3.2 2.5 2.5カ ナ ダ Canada 3.0 2.6 2.6 2.4中 国 China 6.1 9.0 10.0 10.8
合 計 Total 100.0 100.0 100.0 100.0(金額:億ドル) $100 million (107,853) (154,362) (167,226) (192,632)
(2) 世界貿易に占めるシェア Share in the World Trade
②サービス Services(輸出 Exports) (%)
2005 2010 2015 2019日 本 Japan 3.8 3.4 3.2 3.3(金額:億ドル) $100 million (997) (1,318) (1,583) (2,005)米 国 USA 13.8 14.4 15.2 14.1ド イ ツ Germany 6.1 5.7 5.6 5.5英 国 UK 9.3 7.3 7.5 6.8フ ラ ン ス France 5.9 5.2 5.2 4.7イ タ リ ア Italy 3.5 2.6 2.0 2.0カ ナ ダ Canada 2.3 2.0 1.7 1.6中 国 China 3.0 4.6 4.4 4.6
合 計 Total 100.0 100.0 100.0 100.0(金額:億ドル) $100 million (26,204) (38,964) (49,296) (60,656)
(輸入 Imports) (%)2005 2010 2015 2019
日 本 Japan 5.4 4.3 3.7 3.5(金額:億ドル) $100 million (1,374) (1,629) (1,766) (2,017)米 国 USA 11.2 10.7 9.9 9.8ド イ ツ Germany 8.2 6.9 6.3 6.3英 国 UK 7.0 4.9 4.8 4.9フ ラ ン ス France 5.2 4.8 4.9 4.6イ タ リ ア Italy 3.7 2.9 2.1 2.1カ ナ ダ Canada 2.6 2.6 2.2 2.0中 国 China 3.3 5.1 9.0 8.7
合 計 Total 100.0 100.0 100.0 100.0(金額:億ドル) $100 million (25,467) (37,849) (47,885) (57,306)Source : 世界貿易機関の統計より作成。 Compiled from WTO's Statistics.
資料編▶11.国際比較130 Data Chapter▶11.Comparisons with Major Countries 131

①財 Goods (2019)(輸出 Exports) (%)
品名 Commodity 日本Japan
米国USA
ドイツGermany
英国UK
フランスFrance
イタリアItaly
カナダCanada
中国China
農 産 物 Agricultural products 1.6 10.0 6.3 7.1 13.2 9.7 14.6 3.3 食 料 Food 1.0 8.3 5.4 6.6 12.1 9.0 11.1 2.8原 燃 料 Fuels & mining products 4.4 14.8 5.1 12.3 5.1 5.6 28.5 3.1 燃 料 Fuels 2.0 12.1 2.5 8.5 3.1 3.3 22.0 1.9工 業 製 品 Manufactures 86.6 63.1 87.1 71.6 79.8 81.7 47.7 92.9 鉄 鋼 Iron & steel 4.0 0.8 1.9 1.2 2.4 3.8 1.3 2.2 化 学 品 Chemicals 11.1 13.6 16.3 14.4 18.8 14.2 8.2 6.4 機械設備 Machinery & transport equipment 58.3 32.6 49.1 36.7 38.9 34.1 26.7 47.8 (自動車) Automotive products 21.6 8.5 16.6 11.0 9.7 7.4 13.6 2.4 繊維製品 Textiles 0.9 0.8 0.9 0.8 0.8 2.2 0.4 4.8 (衣 類) Clothing 0.1 0.4 1.6 1.9 2.3 4.9 0.4 6.1そ の 他 Others 7.3 12.1 1.5 9.0 2.0 2.9 9.2 0.7合 計 Total 100.0 100.0 100.0 100.0 100.0 100.0 100.0 100.0
(輸入 Imports) (%)
品名 Commodity 日本Japan
米国USA
ドイツGermany
英国UK
フランスFrance
イタリアItaly
カナダCanada
中国China
農 産 物 Agricultural products 11.5 7.1 9.4 10.2 10.5 12.1 8.8 9.6 食 料 Food 9.8 6.2 8.0 9.0 9.3 10.0 8.0 6.6原 燃 料 Fuels & mining products 28.0 10.3 12.7 11.0 12.4 17.0 9.9 27.9 燃 料 Fuels 21.6 8.2 8.7 8.1 10.1 12.4 7.2 16.7工 業 製 品 Manufactures 58.8 77.7 76.2 66.1 76.4 69.3 75.2 59.7 鉄 鋼 Iron & steel 1.2 1.3 2.3 1.2 2.1 4.2 2.0 1.2 化 学 品 Chemicals 10.3 10.6 14.4 10.4 13.1 16.2 10.8 10.5 機械設備 Machinery & transport equipment 28.4 42.4 38.3 33.6 36.6 28.6 43.0 37.8 (自動車) Automotive products 3.3 12.4 11.0 10.6 10.8 9.8 16.3 3.9 繊維製品 Textiles 1.2 1.2 1.0 1.0 1.1 1.7 1.0 0.8 (衣 類) Clothing 4.1 3.7 3.2 3.8 3.9 3.7 2.4 0.4そ の 他 Others 1.7 4.9 1.7 12.7 0.7 1.6 6.1 2.8合 計 Total 100.0 100.0 100.0 100.0 100.0 100.0 100.0 100.0
(3) 貿易の商品構成 Details of Traded Goods/Services
②サービス Services (2019)(輸出 Exports) (%)
項目 Item 日本 米国 ドイツ 英国 フランス イタリア カナダ 中国Japan USA Germany UK France Italy Canada China
輸 送 Transportation 13.1 10.7 20.7 9.6 16.5 12.3 14.2 16.3旅 行 Travel 22.6 22.7 12.4 12.1 22.8 41.1 27.1 12.2そ の 他 Others 64.4 66.7 66.9 78.3 60.7 46.6 58.7 71.4合 計 Total 100.0 100.0 100.0 100.0 100.0 100.0 100.0 100.0
(輸入 Imports) (%)
項目 Item 日本 米国 ドイツ 英国 フランス イタリア カナダ 中国Japan USA Germany UK France Italy Canada China
輸 送 Transportation 16.9 19.0 19.2 11.7 19.6 21.5 21.2 21.1旅 行 Travel 10.5 23.9 25.4 25.5 19.1 24.9 30.4 50.5そ の 他 Others 72.6 57.1 55.5 62.8 61.3 53.6 48.4 28.5合 計 Total 100.0 100.0 100.0 100.0 100.0 100.0 100.0 100.0Note : 四捨五入により必ずしも 100%にならない国がある。 Due to rounding up/off, not all totals equal 100 percent.Source : 世界貿易機関の統計より作成。 Compiled from WTO's Statistics.
①財 Goods(輸出 Exports) (%)
日本 米国 ドイツ 英国 フランス イタリア カナダ 中国Japan USA Germany UK France Italy Canada China
2010 13.5 8.5 37.0 16.9 19.8 20.9 24.0 26.111 13.4 9.5 39.3 19.2 20.8 22.8 25.2 25.312 12.9 9.5 39.7 17.7 21.2 24.0 24.9 24.013 13.9 9.4 38.7 19.7 20.7 24.2 24.8 23.014 14.2 9.2 38.4 16.7 20.4 24.5 26.4 22.315 14.2 8.2 39.5 15.9 20.7 24.9 26.3 20.516 13.1 7.8 38.4 15.3 20.3 24.6 25.5 18.717 14.3 7.9 39.3 16.6 20.6 25.9 25.5 18.518 14.9 8.1 39.4 17.0 20.9 26.3 26.3 18.019 13.9 7.7 38.6 16.6 21.0 26.6 25.7 17.4
(輸入 Imports) (%)日本 米国 ドイツ 英国 フランス イタリア カナダ 中国
Japan USA Germany UK France Italy Canada China2010 12.2 13.1 31.0 23.9 23.1 22.8 24.9 23.1
11 13.9 14.6 33.4 25.6 25.1 24.3 25.8 23.312 14.3 14.4 32.7 26.0 25.1 23.4 26.0 21.313 16.2 13.9 31.6 23.8 24.2 22.4 25.8 20.314 16.7 13.8 31.1 22.7 23.7 22.0 26.3 18.615 14.8 12.7 31.3 21.5 23.4 22.4 27.6 15.116 12.3 12.0 30.4 23.7 22.9 21.7 27.0 14.117 13.8 12.3 31.6 24.1 23.9 23.1 26.9 15.018 15.1 12.7 32.4 23.5 24.3 24.1 27.4 15.419 14.2 12.0 32.0 24.6 24.1 23.6 26.7 14.4
(4) 貿易依存度 Trade Dependency
②サービス Services(輸出 Exports) (%)
日本 米国 ドイツ 英国 フランス イタリア カナダ 中国Japan USA Germany UK France Italy Canada China
2010 2.3 3.8 6.5 11.5 7.6 4.7 4.8 2.911 2.2 4.0 6.5 12.4 8.2 4.8 4.8 2.712 2.2 4.1 7.0 12.4 8.7 5.2 4.9 2.313 2.6 4.2 7.2 12.9 9.0 5.2 5.0 2.114 3.3 4.2 7.6 12.7 9.5 5.3 5.1 2.115 3.6 4.1 8.2 12.6 10.4 5.3 5.4 2.016 3.5 4.1 8.3 13.4 10.4 5.3 5.6 1.917 3.7 4.2 8.5 14.0 10.4 5.7 5.6 1.818 3.8 4.1 8.5 14.2 10.5 5.9 5.7 1.919 3.9 4.0 8.7 14.6 10.6 6.1 5.7 2.0
(輸入 Imports) (%)日本 米国 ドイツ 英国 フランス イタリア カナダ 中国
Japan USA Germany UK France Italy Canada China2010 2.9 2.7 7.7 7.4 6.8 5.2 6.1 3.2
11 2.8 2.7 7.9 7.4 7.1 5.1 6.0 3.312 2.9 2.7 8.3 7.4 7.5 5.1 6.2 3.313 3.3 2.6 8.7 7.5 8.1 5.1 6.2 3.414 3.9 2.7 8.5 7.5 8.8 5.3 6.3 4.115 4.0 2.6 8.9 7.8 9.6 5.5 6.7 3.916 3.7 2.6 9.1 8.3 9.6 5.5 6.8 4.017 3.9 2.7 9.3 8.6 9.6 5.9 6.7 3.818 4.0 2.6 9.2 9.0 9.6 6.0 6.7 3.819 4.0 2.6 9.4 9.9 9.7 6.1 6.6 3.5
Note : 輸出(入)依存度=輸出(入)額 国内総生産 Export (Import) Dependency: Export (Import) value divided by GDP.Source : 世界貿易機関の統計および国際通貨基金のデータベースより作成。 Compiled from WTO's Statistics and IMF's IFS database.
資料編▶11.国際比較132 Data Chapter▶11.Comparisons with Major Countries 133

(6) 交易条件 Terms of Trade (2010年 = 100)日本 米国 ドイツ 英国 フランス イタリア カナダ
Japan USA Germany UK France Italy Canada2016 109.4 103.1 102.6 100.7 ‒ 114.1 87.4
17 104.3 ‒ 100.3 ‒ ‒ 112.0 ‒18 ‒ ‒ ‒ ‒ ‒ ‒ ‒
Note : 交易条件= 輸出単価 輸入単価 Terms of Trade : Unit Price of Exports devided by Unit Price of Imports.Source : 国際通貨基金のデータベースより作成。 Compiled from IMF's IFS database etc.
①財 Goods日本 米国 ドイツ 英国 フランス イタリア カナダ 中国
Japan USA Germany UK France Italy Canada China2010 0.05 ▲ 0.21 0.09 ▲ 0.17 ▲ 0.08 ▲ 0.04 ▲ 0.02 0.06
11 ▲ 0.02 ▲ 0.21 0.08 ▲ 0.14 ▲ 0.09 ▲ 0.03 ▲ 0.01 0.0412 ▲ 0.05 ▲ 0.20 0.10 ▲ 0.19 ▲ 0.09 0.01 ▲ 0.02 0.0613 ▲ 0.08 ▲ 0.19 0.10 ▲ 0.10 ▲ 0.08 0.04 ▲ 0.02 0.0614 ▲ 0.08 ▲ 0.20 0.11 ▲ 0.15 ▲ 0.08 0.06 0.00 0.0915 ▲ 0.02 ▲ 0.21 0.12 ▲ 0.15 ▲ 0.06 0.05 ▲ 0.02 0.1516 0.03 ▲ 0.22 0.12 ▲ 0.22 ▲ 0.06 0.06 ▲ 0.03 0.1417 0.02 ▲ 0.22 0.11 ▲ 0.18 ▲ 0.07 0.06 ▲ 0.03 0.1018 ▲ 0.01 ▲ 0.22 0.10 ▲ 0.16 ▲ 0.07 0.04 ▲ 0.02 0.0819 ▲ 0.01 ▲ 0.22 0.09 ▲ 0.19 ▲ 0.07 0.06 ▲ 0.02 0.09
②サービス Services日本 米国 ドイツ 英国 フランス イタリア カナダ 中国
Japan USA Germany UK France Italy Canada China2010 ▲ 0.11 0.16 ▲ 0.09 0.21 0.05 ▲ 0.05 ▲ 0.12 ▲ 0.04
11 ▲ 0.12 0.19 ▲ 0.09 0.25 0.08 ▲ 0.03 ▲ 0.11 ▲ 0.1012 ▲ 0.15 0.20 ▲ 0.09 0.26 0.07 0.00 ▲ 0.11 ▲ 0.1713 ▲ 0.12 0.23 ▲ 0.10 0.27 0.05 0.01 ▲ 0.11 ▲ 0.2314 ▲ 0.09 0.22 ▲ 0.06 0.26 0.04 ▲ 0.01 ▲ 0.11 ▲ 0.3315 ▲ 0.05 0.22 ▲ 0.04 0.23 0.04 ▲ 0.02 ▲ 0.11 ▲ 0.3316 ▲ 0.04 0.22 ▲ 0.05 0.24 0.04 ▲ 0.02 ▲ 0.09 ▲ 0.3717 ▲ 0.02 0.22 ▲ 0.04 0.24 0.04 ▲ 0.02 ▲ 0.09 ▲ 0.3418 ▲ 0.03 0.22 ▲ 0.04 0.22 0.05 ▲ 0.01 ▲ 0.08 ▲ 0.3219 ▲ 0.00 0.20 ▲ 0.04 0.19 0.04 ▲ 0.01 ▲ 0.07 ▲ 0.28
Note : 貿易特化係数= (輸出金額-輸入金額) (輸出金額+輸入金額) 貿易特化係数とは、輸出と輸入の特化関係を示すもので、全く輸入していない場合はプラス 1、全
く輸出していない場合はマイナス 1となる。 Trade Specialization Coefficient: (Export value minus import value) divided by (export value plus import
value). The Trade Specialization Coefficient measures the relationship between exports and imports. If a country does not import at all, it will have plus one and if it does not export at all, minus one.
Source : 世界貿易機関の統計より作成。 Compiled from WTO's Statistics.
(5) 貿易特化係数 Trade Specialization Coefficient
国 名 Country 2018 20192020 2021
実績見込み 見通しProspects Forecasts
日 本 Japan 176.9 181.9 148.0 184.4米 国 USA ▲ 449.7 ▲ 480.2 ▲ 714.6 ▲ 869.1ド イ ツ Germany 297.5 280.2 263.8 291.3英 国 UK ▲ 104.9 ▲ 121.9 ▲ 70.6 ▲ 99.1フ ラ ン ス France ▲ 15.8 ▲ 18.1 ▲ 61.1 ▲ 52.9イ タ リ ア Italy 52.1 59.1 51.8 61.3カ ナ ダ Canada ▲ 42.9 ▲ 35.4 ▲ 30.8 ▲ 28.6
7 ヵ 国 合 計 Total (7 countries) ▲ 86.8 ▲ 134.4 ▲ 413.5 ▲ 512.7その他 OECD諸国 Other OECD 251.0 298.8 336.1 361.3
O E C D 合 計 Grand Total (OECD) 164.2 164.4 ▲ 77.4 ▲ 151.4
(主要グループの経常収支) Current Accounts of Major Groups (10億ドル $ billion)
グループ名 Area 2018 20192020 2021
実績見込み 見通しProspects Forecasts
OECD 加 盟 国 Member of OECD 164.2 164.4 ▲ 77.4 ▲ 151.4OECD 非 加 盟 国 Non-member of OECD中 国 China 25.5 141.3 365.8 580.9新 興 ア ジ ア * Dynamic Asian Economies* 181.8 210.5 198.3 196.4ロ シ ア Russia 113.8 67.4 37.3 44.3ブ ラ ジ ル Brazil ▲ 41.5 ▲ 49.5 ▲ 17.4 ▲ 13.9
世 界 the World 362.6 411.5 411.9 586.9Notes : 1. ▲は赤字。 ▲ represents a deficit. 2. 「新興アジア *」は台湾、香港、マレーシア、フィリピン、シンガポール、タイ、ベトナム。 "Dynamic Asian Economies*" means 7 countries/areas including Taiwan, Hong Kong, Malaysia,
Philippines, Singapore, Thailand, and Viet Nam.Source : Compiled from OECD's "Economic Outlook", No.108, Dec. 2020.
(7) 経常収支 Current Accounts (10億ドル $ billion)
日本 米国 ドイツ 英国 フランス イタリア カナダ 中国Japan USA Germany UK France Italy Canada China
2010 11,047 1,324 2,165 981 1,662 1,589 572 28,75911 12,958 1,480 2,389 1,097 1,719 1,733 658 32,12612 12,681 1,502 2,489 1,171 1,845 1,817 685 33,40913 12,668 1,446 1,982 1,188 1,449 1,455 719 38,49414 12,605 1,301 1,928 1,245 1,434 1,422 747 38,69015 12,332 1,176 1,737 1,481 1,382 1,306 798 34,05416 12,168 1,173 1,853 1,350 1,468 1,360 827 30,97717 12,641 1,233 2,001 1,508 1,564 1,512 867 32,35418 12,705 1,258 1,982 1,727 1,666 1,525 839 31,68219 13,224 1,295 2,238 1,736 1,889 1,753 853 32,229
Notes : 1. 外貨準備高は金を含む。 Includes the value of gold reserves. 2. 中国の金保有量(国内査定額)に関し、2015年は(移行期による)現行国際収支マニュアル第 6版
基準推定値と第 5版基準推定値に IMFが修正を加えた推定値が混在する。 For China in reference to Gold (National Valuation) in 2015, 2015 was the splice point between official
BPM6-basis estimates and IMF converted BPM5-basis estimates.Source : 国際通貨基金のデータベースより作成。 Compiled from IMF's IFS databse.
(8) 外貨準備高 Foreign Reserves (億ドル $100 million)
資料編▶11.国際比較134 Data Chapter▶11.Comparisons with Major Countries 135

日本 米国 ドイツ 英国 フランス イタリア カナダ 中国Japan USA Germany UK France Italy Canada China
2010 57,001 149,921 34,011 24,823 26,463 21,370 16,175 60,34011 61,584 155,426 37,515 26,605 28,669 22,964 17,938 74,92812 62,032 161,970 35,287 27,042 26,848 20,879 18,290 85,39913 51,557 167,849 37,336 27,818 28,117 21,418 18,468 96,24714 48,504 175,273 38,876 30,642 28,550 21,612 18,053 105,25015 43,895 182,248 33,587 29,307 24,400 18,373 15,562 111,14416 49,225 187,150 34,714 26,919 24,741 18,780 15,276 112,27917 48,669 195,194 36,835 26,625 25,957 19,623 16,495 122,64918 49,523 205,802 39,627 28,557 27,871 20,910 17,159 138,41819 50,799 214,277 38,623 28,280 27,164 20,041 17,362 144,025
Note : 本会で米ドルに換算。 Figures were converted into US dollars by JFTC.Source : 国際通貨基金のデータベースより作成。 Compiled from IMF's IFS database.
(9) 名目国内総生産 Nominal GDP (億ドル $100 million)
(10) 実質経済成長率 Real GDP Growth (前年(期)比 Change from previous year/quarter : %)
日本 米国 ドイツ 英国 フランス イタリア カナダJapan USA Germany UK France Italy Canada
2010 4.2 2.6 4.0 2.1 1.8 1.7 3.111 ▲ 0.1 1.6 4.0 1.3 2.2 0.8 3.112 1.5 2.2 0.6 1.4 0.4 ▲ 3.0 1.813 2.0 1.8 0.6 2.2 0.6 ▲ 1.9 2.314 0.4 2.5 2.2 2.9 1.0 0.1 2.915 1.2 3.1 1.2 2.4 1.0 0.7 0.716 0.5 1.7 2.1 1.7 1.0 1.4 1.017 2.2 2.3 2.9 1.7 2.4 1.7 3.218 0.3 3.0 1.3 1.3 1.8 0.8 2.019 0.7 2.2 0.6 1.3 1.5 0.3 1.7
見通し Forecasts20 ▲ 5.3 ▲ 3.7 ▲ 5.5 ▲ 11.2 ▲ 9.1 ▲ 9.1 ▲ 5.421 2.3 3.2 2.8 4.2 6.0 4.3 3.522 1.5 3.5 3.3 4.1 3.3 3.2 2.0
2021Q1 3.0 0.8 4.6 13.9 16.1 8.2 0.6Q2 2.4 3.2 5.1 10.4 12.9 7.8 0.8Q3 2.0 4.4 5.3 4.5 4.4 4.5 1.2Q4 1.6 4.2 4.1 4.5 3.5 3.6 1.6
22Q1 1.2 3.8 3.6 4.5 3.1 1.0 2.0Q2 1.0 3.1 3.7 4.5 2.9 1.0 2.5
Note : 前期比は年率ベース。 Year-on-year comparisons are for the entire year.Source : Compiled from OECD's "Economic Outlook", No.108, Dec. 2020.
(11) その他の国・地域の実質経済成長率 Real GDP Growth in Other Areas/Countries (前年比 Change from previous year : %)
地域(国) Area/Country 2015 2016 2017 2018 2019アジア新興市場及び途上国 Emerging & Developing Asia 6.8 6.8 6.7 6.3 5.5中 国 China 6.9 6.8 6.9 6.7 6.1イ ン ド India 8.0 8.3 7.0 6.1 4.2イ ン ド ネ シ ア Indonesia 4.9 5.0 5.1 5.2 5.0マ レ ー シ ア Malaysia 5.0 4.4 5.8 4.8 4.3ミ ャ ン マ ー Myanmar 7.5 6.4 5.8 6.4 6.5フ ィ リ ピ ン Philippines 6.3 7.1 6.9 6.3 6.0
中 南 米 Latin America & the Caribbean 0.4 ▲ 0.6 1.4 1.1 0.0ア ル ゼ ン チ ン Argentine 2.7 ▲ 2.1 2.8 ▲ 2.6 ▲ 2.1ブ ラ ジ ル Brazil ▲ 3.5 ▲ 3.3 1.3 1.3 1.1チ リ Chile 2.3 1.7 1.2 4.0 1.1メ キ シ コ Mexico 3.3 2.6 2.1 2.2 ▲ 0.3
中 東 及 び 中 央 ア ジ ア Middle East & Central Asia 2.7 4.5 2.6 2.1 1.4ヨーロッパ新興市場及び途上国 Emerging & Developing Europe 1.0 1.9 4.1 3.3 2.1一次産品輸出国(産油国を除く) Non Fuel 5.1 5.1 5.6 5.2 4.3産 油 国 Fuel 0.3 1.5 1.0 0.9 0.2
Note : ▲ は下落率。 ▲ represents a decline.Source : Compiled from IMF's "World Economic Outlook", Oct. 2020.
(12) 消費者物価上昇率 Changes in Consumer Prices (前年比 Change from previous year : %)
日本 米国 ドイツ 英国 フランス イタリア カナダ 中国Japan USA Germany UK France Italy Canada China
2010 ▲ 0.6 1.6 1.1 3.3 1.7 1.6 1.8 3.211 ▲ 0.3 3.1 2.5 4.5 2.3 2.9 2.9 5.512 0.0 2.1 2.2 2.8 2.2 3.3 1.5 2.613 0.4 1.5 1.6 2.6 1.0 1.2 0.9 2.614 2.8 1.6 0.8 1.5 0.6 0.2 1.9 2.115 0.8 0.1 0.7 0.1 0.1 0.1 1.1 1.516 ▲ 0.1 1.3 0.4 0.6 0.3 ▲ 0.1 1.4 2.117 0.5 2.1 1.7 2.7 1.2 1.3 1.6 1.518 1.0 2.4 1.9 2.5 2.1 1.2 2.2 1.919 0.5 1.8 1.4 1.8 1.3 0.6 2.0 2.9
見通し Forecasts2020 0.2 1.4 0.4 0.8 0.5 ▲ 0.1 0.6 2.8
21 0.2 1.9 1.1 0.7 0.4 0.4 0.7 2.322 0.4 1.7 1.3 1.5 0.8 0.8 1.2 2.1
Source : Compiled from OECD's "Economic Outlook", No.108, Dec 2020.
資料編▶11.国際比較136 Data Chapter▶11.Comparisons with Major Countries 137

(13) 中央銀行政策金利等 Policy Interest Rate, etc.(年末および月末 End of Year or End of Month : %)
年 月 日本 米国 英国 ユーロエリア カナダ 中国 ロシアYear & Month Japan USA UK euro area Canada China Russia
(a) (b) (c) (d) (e) (f) (g)2010 0.079 0.00-0.25 0.50 1.00 1.00 5.81 7.75
11 0.075 0.00-0.25 0.50 1.00 1.00 6.56 8.0012 0.076 0.00-0.25 0.50 0.75 1.00 6.00 8.2513 0.068 0.00-0.25 0.50 0.25 1.00 6.00 5.5014 0.066 0.00-0.25 0.50 0.05 1.00 5.60 17.0015 0.038 0.25-0.50 0.50 0.05 0.50 4.35 11.0016 ▲ 0.058 0.50-0.75 0.25 0.00 0.50 4.35 10.0017 ▲ 0.062 1.25-1.50 0.50 0.00 1.00 4.35 7.7518 ▲ 0.055 2.25-2.50 0.75 0.00 1.75 4.35 7.7519 ▲ 0.068 1.50-1.75 0.75 0.00 1.75 4.35 6.25
2020 1 ▲ 0.039 1.5-1.75 0.75 0.00 1.75 4.35 6.252 ▲ 0.025 1.5-1.75 0.75 0.00 1.75 4.35 6.003 ▲ 0.070 0.0-0.25 0.10 0.00 0.25 4.35 6.004 ▲ 0.060 0.0-0.25 0.10 0.00 0.25 4.35 5.505 ▲ 0.073 0.0-0.25 0.10 0.00 0.25 4.35 5.506 ▲ 0.068 0.0-0.25 0.10 0.00 0.25 4.35 4.507 ▲ 0.021 0.0-0.25 0.10 0.00 0.25 4.35 4.258 ▲ 0.057 0.0-0.25 0.10 0.00 0.25 4.35 4.259 ▲ 0.061 0.0-0.25 0.10 0.00 0.25 4.35 4.25
10 ▲ 0.029 0.0-0.25 0.10 0.00 0.25 4.35 4.2511 ▲ 0.032 0.0-0.25 0.10 0.00 0.25 4.35 4.2512 ▲ 0.033 0.0-0.25 0.10 0.00 0.25 4.35 4.25
Notes : (a) 無担保コール翌日物。 Uncollateralized overnight call rate. (b) フェデラル・ファンド・レートの誘導目標値。 Federal fund (FF) target rate. (c) バンク・レート。 Bank rate. (d) 主要リファイナンシング・オペレート。 Main refinancing operation. (e) 翌日物金利ターゲット。 Overnight rate target. ( f) 基準金利。 Base interest rate. (g) 2013年 9月 13日からキー・レート、それ以前はリファイナンス・レート。 Key rate (rates before Sep. 13, 2013 are Refinancing Rate).Source : 中国は中国人民銀行の公式サイト、ロシアはロシア中央銀行の公式サイトおよび内閣府『海外経済
データ 月次アップデート』、それ以外の国は日本銀行調査統計局『金融経済統計月報』などより作成。 For China, compiled from The People's Bank of China's website, for Russia, fromThe Central Bank of
the Russian Federation's website and Cabinet Office's "Kaigai Keizai Data", for other countries, from BOJ's "Monthly Report of Recent Economic and Financial Developments" etc.
(14) 各国との FTAカバー率比較 Comparison of FTA Coverage Ratio
・ 発効・署名交渉状況は 2020年 3月末時点(日本は 2020年 11月末時点)。・「交渉中まで含む」の数字には、交渉妥結済の数字も含まれる。・ 同一の国とマルチの FTA、バイの FTAがともに進行している場合、貿易額は進行順(発効済→署名済→交渉中→その他)にカウント。・小数点第 2位を四捨五入のため合計は必ずしも 100%とならない。・ Status of enforcement, signature and negotiation is as of the end of
March 2020 (Japan, the end of November 2020).・ Figures representing the term "including under negotiation" include
those that already concluded the negotiations.・ When a country is engaged in negotiations for both bilateral and
multilateral FTAs with the same country, trade values are counted in the order of progress (in the order of "in force", "signed", "under negotiation", and "other").・ Figures do not sum up to 100% as they are rounded off to one
decimal place.
Source : 経済産業省『通商白書 2020』などより作成。 Comprised from METI's "White Paper on International Economy and
Trade 2020" etc.
日本Japan
発効済の国・地域 Areas/Countries in force :52.5%署名済みまで含む Including signed :79.0%交渉中まで含む Including under negotiation :86.1%
中国China
発効済の国・地域 Areas/Countries in force :38.4%署名済みまで含む Including signed :38.4%交渉中まで含む Including under negotiation :52.0%
韓国Korea
発効済の国・地域 Areas/Countries in force :69.9%署名済みまで含む Including signed :70.1%交渉中まで含む Including under negotiation :88.6%
米国USA
発効済の国・地域 Areas/Countries in force :39.3%署名済みまで含む Including signed :48.0%交渉中まで含む Including under negotiation :70.0%
EU発効済の国・地域 Areas/Countries in force :33.3%署名済みまで含む Including signed :33.3%交渉中まで含む Including under negotiation :66.2%
発効済In force37.1%
発効済In force37.1%
その他Other13.9%
その他Other13.9%交渉中
Under negotiation7.1%
交渉中Under negotiation
7.1%
RCEP署名済(韓国)
RCEP signed(Korea)
5.3%
RCEP署名済(韓国)
RCEP signed(Korea)
5.3%
発効済(米国)In force(USA)
15.4%
発効済(米国)In force(USA)
15.4%
RCEP署名済(中国)RCEP signed
(China)21.3%
RCEP署名済(中国)RCEP signed
(China)21.3%
貿易額Trade Value¥155,531
billion(2019)
発効済(韓国)In force(Korea)
6.3%
発効済(韓国)In force(Korea)
6.3%
発効済In force32.1%
発効済In force32.1%
交渉中(日本)Under negotiation
(Japan)6.9%
交渉中(日本)Under negotiation
(Japan)6.9%
署名済Signed0.01%
署名済Signed0.01%
交渉中Under negotiation
6.7%
交渉中Under negotiation
6.7%
その他(EU)Other(EU)
15.4%
その他(EU)Other(EU)
15.4%
その他(米国)Other(USA)
11.9%
その他(米国)Other(USA)
11.9%
その他Other20.6%
その他Other20.6%
貿易額Trade Value
$4,532billion
(2019)
発効済(中国)In force(China)
23.3%
発効済(中国)In force(China)
23.3%
発効済(米国)In force(USA)
12.9%
発効済(米国)In force(USA)
12.9%
発効済(EU)In force(EU)
10.4%
発効済(EU)In force(EU)
10.4%
発効済In force23.3%
発効済In force23.3%
交渉妥結済Negotiationconcluded
0.2%
交渉妥結済Negotiationconcluded
0.2%
交渉中(日本)Under negotiation
(Japan)7.3%
交渉中(日本)Under negotiation
(Japan)7.3%
交渉中Under negotiation
11.2%
交渉中Under negotiation
11.2%
その他Other11.4%
その他Other11.4%
貿易額Trade Value
$1,046billion
(2019)
発効済(韓国)In force(Korea)
3.2%
発効済(韓国)In force(Korea)
3.2%
発効済In force36.1%
発効済In force36.1%
署名済(日本)Signed(Japan)
5.3%
署名済(日本)Signed(Japan)
5.3%署名済Signed 3.4%署名済Signed 3.4%
交渉中(EU)Under negotiation
(EU)20.5%
交渉中(EU)Under negotiation
(EU)20.5%
交渉中Under negotiation
1.5%
交渉中Under negotiation
1.5%
その他(中国)Other(China)
13.5%
その他(中国)Other(China)
13.5%
その他Other16.5%
その他Other16.5%
貿易額Trade Value
$4,140billion
(2019)
発効済(韓国)In force(Korea)
2.4%
発効済(韓国)In force(Korea)
2.4%
発効済In force27.4%
発効済In force27.4%
発効済(日本)In force
(Japan)3.5%
発効済(日本)In force
(Japan)3.5%
交渉中(米国)Under negotiation
(USA)18.1%
交渉中(米国)Under negotiation
(USA)18.1%
交渉中Under negotiation
18.5%
交渉中Under negotiation
18.5%
その他(中国)Other(China)
15.7%
その他(中国)Other(China)
15.7%
その他Other14.4%
その他Other14.4%
貿易額Trade Value
$4,599billion
(2019)
(域内貿易含まず)(Excluding regional trade)
資料編▶11.国際比較138 Data Chapter▶11.Comparisons with Major Countries 139

12 2020年の主な動き Development in Major Issues 2020国内・海外月 日 主な動き 内容1 3 米軍、イラン司令官殺害 米軍、イラン革命防衛隊の精鋭組織「コッズ部隊」のカセム・ソレ
イマニ司令官を空爆で殺害。8 イラン、米軍施設攻撃 ソレイマニ司令官が殺害されたことに対する報復として、イラクに
ある駐留米軍基地を弾道ミサイル十数発で攻撃。11 安倍首相、中東歴訪(~ 15日) 安倍首相、サウジアラビア、UAE、オマーンを訪問。中東地域への自
衛隊派遣の目的を説明。11 台湾総統選 中国との一国二制度を拒否する民進党の蔡英文氏が再選。20 中国、新型コロナ発生 中国保健当局、武漢市などで新型コロナウイルス感染症による肺炎
が確認されたことを発表。20 第 201回国会召集(常会) 全世代型社会保障制度、統合型リゾート IR、中東派遣などが焦点。21 世界経済フォーラム年次総会(~ 24日、スイス・ダボス)
主要テーマは「Stakeholders for a Cohesive and Sustainable World」。
31 英、EU離脱 20年末までは移行期間となり、通商を含む将来関係交渉を開始。2 3 ダイヤモンド・プリンセス、横浜港入港 乗員乗客 3,711人を乗せた大型クルーズ船「ダイヤモンド・プリン
セス」内で、新型コロナウイルス感染症が集団発生。4 米トランプ大統領、一般教書演説 就任後の経済成長や雇用回復の実績を示すとともに、医療保険など
で民主党に対抗する主張を展開。11 米トランプ大統領、21会計年度予算教書発表
社会保障プログラムの予算を大幅に削減する一方、国防費と義務的支出を増やし、連邦債務は向こう10年間で30兆ドルを超える見込み。
26 イベント自粛要請 コンサートなどのイベントを今後 2週間自粛し、中止や延期、規模縮小などの措置を取るよう要請。
27 全国小中学校・高校に臨時休校要請 全国すべての小中学校と高校、特別支援学校に対し、3月 2日から春休みまで臨時休校するよう要請。
29 米・タリバン和平合意(カタール・ドーハ)駐留米軍の段階的撤収などを定めた和平合意に署名。3 14 山手線新駅「高輪ゲートウェイ駅」開業 JR東日本の山手線・京浜東北線の新駅「高輪ゲートウェイ駅」が品
川―田町駅間に開業。16 G7首脳テレビ会談 安倍首相、東京五輪・パラリンピックについて、人類が新型コロナ
ウイルスに打ち勝った証として、完全な形で実施したいと表明。24 東京五輪延期決定 安倍首相、IOCバッハ会長と電話会談を行い、東京五輪・パラリンピッ
クを 1年程度延期する方針で一致。25 次世代通信 5G、商用サービス開始 スマートフォン向け次世代通信規格「5G(第 5世代移動通信)」の商
用サービスが国内で始まる。4 7 緊急事態宣言発令 新型コロナウイルス感染症対策本部において、「新型インフルエンザ
等対策特別措置法」に基づく緊急事態宣言を 7都府県に発令。16 G7首脳テレビ会談 WHOの「徹底した見直しと改革のプロセス」が必要との認識で一致。27 新型コロナ、世界の感染者 300万人超える
死者数は 20万 7,000人、うち 80%近くが欧米。感染地域は世界185ヵ国・地域。
5 21 黒川検事長、辞表提出 緊急事態宣言発令下に東京都内の新聞記者宅で賭けマージャンをしていたことを認め、辞表提出。
22 中国、第 13期全国人民代表大会第 3回会議(~ 28日)
世界の感染状況と経済・貿易情勢の不確実性を理由に、20年の実質GDP成長率目標の発表を見送り。
25 新型コロナ緊急事態宣言、全面解除 約 7週間ぶりに東京など 5都道県への緊急事態宣言を解除。25 警察官による黒人暴行死(米・ミネアポリス)
黒人暴行死に対する抗議活動は全米数十の都市に広がり、各地で暴徒化したデモ隊と警察が衝突。
30 民間初の有人宇宙船、打ち上げ成功(米・フロリダ)
米宇宙企業スペース Xが開発した有人宇宙船「クルードラゴン」の打ち上げに成功。民間の有人宇宙船としては初。
6 1 パワハラ防止法施行 厳正な対処方針を策定したうえでの予防研修や相談窓口の設置などが義務化。
18 河井前法相夫妻逮捕 河井克行前法相と妻の案里参議院議員を公選法違反容疑で逮捕。20 都道府県境をまたぐ移動の自粛、全面解除
都道府県境をまたぐ移動の自粛を全面解除するほか、イベントの人数上限も 1,000人に緩和し、プロスポーツの無観客開催を認める。
25 陸上イージス配備を撤回 河野防衛相、陸上配備型迎撃ミサイルシステム「イージス・アショア」の山口、秋田両県への配備方針を撤回。
30 中国、香港国家安全法案可決 中国全人代、香港の統制を強める「香港国家安全維持法案」を可決。
月 日 主な動き 内容7 1 露、憲法改正法案の是非を問う全国投票 約 8割が賛成し、改憲が成立。プーチン大統領は 2036年までの続投
が可能に。1 レジ袋有料化開始 小売業を営む全ての事業者が対象となるプラスチック製買物袋の有
料化が始まり、無料配布は禁止に。1 米国・メキシコ・カナダ協定発効 北米自由貿易協定(NAFTA)に代わる「米国・メキシコ・カナダ協
定(USMCA)」が発効。旧協定の発効以来、26年半ぶりの改定。3 令和 2年 7月豪雨(~ 31日) 九州、中部、東北地方をはじめ、多くの地点で降水量が観測史上 1
位の値を超える。死者 80名以上。広範囲で甚大な被害が発生。5 都知事選、小池氏再選 得票は 350万票を超え、2位以下に大差をつけて圧勝。22 18年度国民健康保険納付率 92.85%(前年度比 +0.40%)、9年連続で改善。22 Go To トラベル開始 新型コロナウイルス感染拡大によって深刻なダメージを受けた旅行
業界の再活性化を目指し、「Go To トラベル」キャンペーンが開始。30 台湾、李登輝元総統死去 台湾出身者で初の総統となり、在任中に総統直接選挙を実現した李
登輝氏が多臓器不全などのため死去。8 4 レバノン首都で大爆発 死傷者多数、30万人以上が住む場所を失う。
9 貨物船、モーリシャス沖で座礁 商船三井がチャーターしていた貨物船「WAKASHIO」がモーリシャス沖で座礁。1,000トン以上の燃料油が流出。
20 IR汚職、秋元司衆院議員を再逮捕 贈賄罪で起訴された中国企業側に裁判で虚偽の証言をするよう依頼し、報酬の現金供与を申し込んだとして、組織犯罪処罰法違反の疑いで再逮捕。
28 安倍首相、辞任表明 持病の再発により職務継続は困難と判断。来年 9月までの自民党総裁任期途中での辞任を陳謝。
9 15 新立憲民主党、旗揚げ 立憲民主、国民民主両党などが合流した「新立憲民主党」が衆参両院議員計 150人で正式に誕生。
15 米商務省、ファーウェイへの輸出規制強化
米商務省、中国の通信機器最大手の華為技術(ファーウェイ)に対し、半導体の出荷を停止。
16 第 202回国会召集(臨時会)、菅内閣が発足
菅自民党総裁が第 99代首相に指名され、菅内閣が発足。安倍前内閣の政策を踏襲する方針を表明。
20 日米首脳電話会談 菅首相、トランプ大統領と就任後初めてとなる電話会談を行い、両首脳は日米同盟を一層強固にすることなどを確認。
22 国連総会、一般討論演説(~ 29日、米・ニューヨーク)
菅首相、一般討論演説(ビデオ)で、2021年の東京五輪・パラリンピックを「安心、安全な大会」とするよう全力を挙げると強調(25日)。
10 1 東証、全株式取引を終日停止 システム障害により全銘柄の売買が終日停止。同じシステムを使う札幌、名古屋、福岡の各証券取所でも全株式取引が停止。
2 米トランプ大統領、新型コロナ感染 新型コロナウイルスの感染検査で陽性だったとツイッターで表明し、直ちに隔離へ。
19 日ベトナム首脳会談(ベトナム・ハノイ)ビジネス目的の短期出張者の往来再開や「自由で開かれたインド太平洋」構想で協力することで一致。
20 日インドネシア首脳会談(インドネシア・ジャカルタ)
日本が 500億円規模の円借款供与を行うことや人の往来の促進で一致。
26 第 203回国会召集(臨時会) 菅首相、所信表明演説で縦割り行政の打破などを訴える。11 1 大阪住民投票 大阪市を廃止して 4つの特別区に再編する大阪都構想の是非を問う
住民投票が行われ、反対多数により、今の大阪市が存続することに。3 米大統領選(米・ワシントン DC) 民主党ジョー・バイデン氏が共和党ドナルド・トランプ氏を破り当選、
民主党は 4年ぶりに政権を奪還。6 経済財政白書 2020年版 副題「コロナ危機:日本経済変革のラストチャンス」。8 立皇嗣の礼 文仁親王、皇位継承順位 1位を国内外に示す。8 ミャンマー総選挙 アウンサンスーチー国家顧問率いる与党・国民民主連盟(NLD)が
大勝。しかし、ミャンマー国軍は選挙に不正があったと主張。15 バッハ IOC会長来日(~ 18日) 菅首相、森会長、小池東京都知事と面会。選手村や国立競技場を視察。16 東アジア地域包括的経済連携(RCEP)に署名
世界経済の 3分の 1近くを占める世界最大規模の自由貿易圏。今後各国で国内手続きを進め、発効を目指す。
17 日豪首脳会談(東京) 安全保障、防衛協力や経済などの分野での両国の協力関係の一層の強化をしていくことで一致。
21 G20リヤド・サミット(~ 23日、サウジアラビア)
オンライン形式で実施。新型コロナウイルスで打撃を受けた世界経済の回復とワクチンの公平な配分に努めるとする首脳宣言を採択。
資料編▶12.2020年の主な動き140 Data Chapter▶12.Development in Major Issues 2020 141
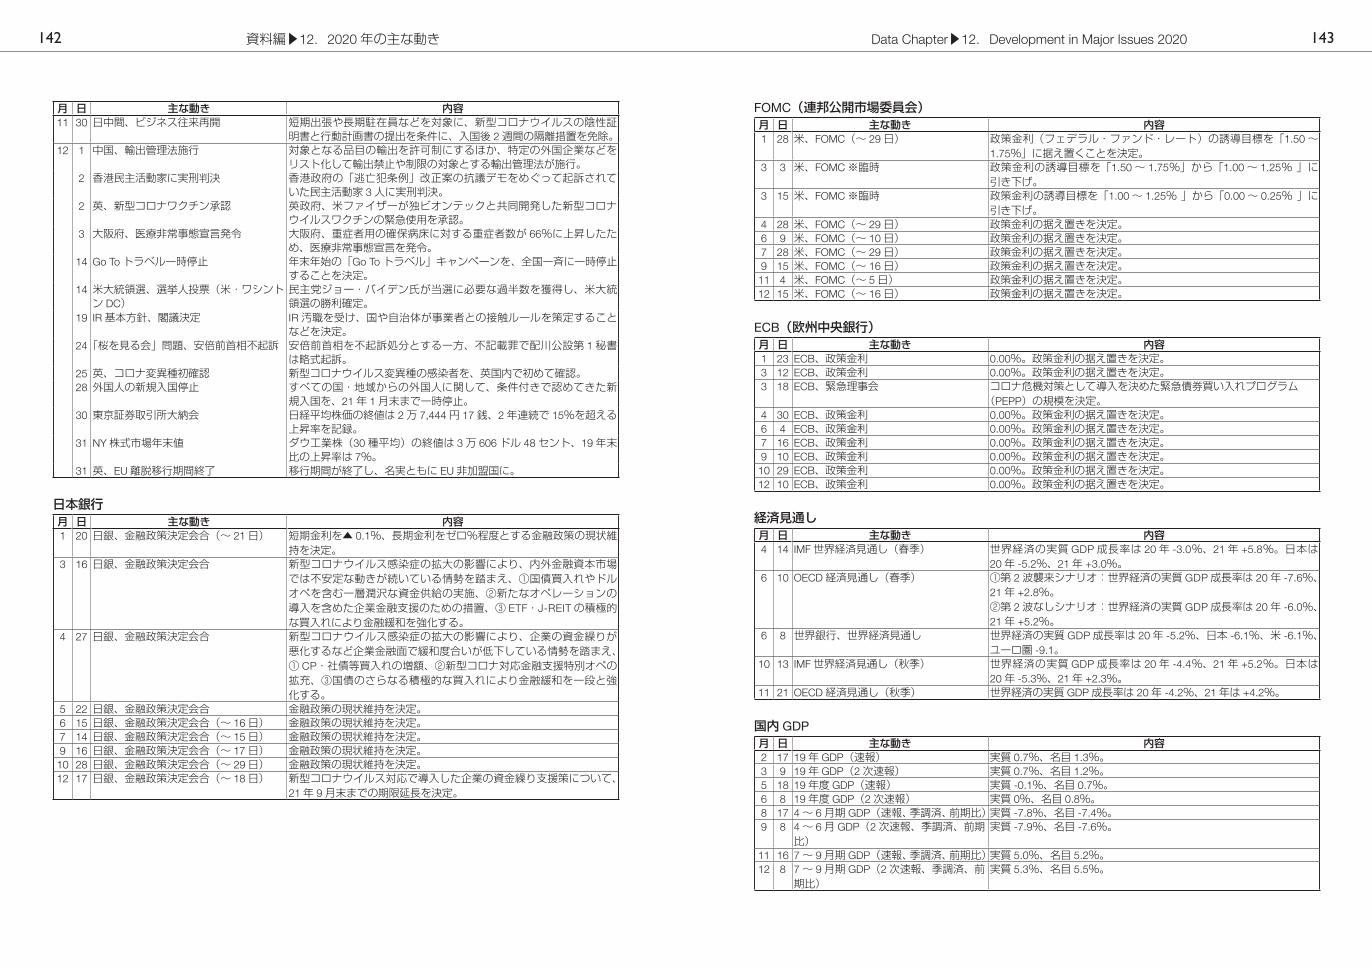
月 日 主な動き 内容11 30 日中間、ビジネス往来再開 短期出張や長期駐在員などを対象に、新型コロナウイルスの陰性証
明書と行動計画書の提出を条件に、入国後 2週間の隔離措置を免除。12 1 中国、輸出管理法施行 対象となる品目の輸出を許可制にするほか、特定の外国企業などを
リスト化して輸出禁止や制限の対象とする輸出管理法が施行。2 香港民主活動家に実刑判決 香港政府の「逃亡犯条例」改正案の抗議デモをめぐって起訴されて
いた民主活動家 3人に実刑判決。2 英、新型コロナワクチン承認 英政府、米ファイザーが独ビオンテックと共同開発した新型コロナ
ウイルスワクチンの緊急使用を承認。3 大阪府、医療非常事態宣言発令 大阪府、重症者用の確保病床に対する重症者数が 66%に上昇したた
め、医療非常事態宣言を発令。14 Go To トラベル一時停止 年末年始の「Go To トラベル」キャンペーンを、全国一斉に一時停止
することを決定。14 米大統領選、選挙人投票(米・ワシントン DC)
民主党ジョー・バイデン氏が当選に必要な過半数を獲得し、米大統領選の勝利確定。
19 IR基本方針、閣議決定 IR汚職を受け、国や自治体が事業者との接触ルールを策定することなどを決定。
24「桜を見る会」問題、安倍前首相不起訴 安倍前首相を不起訴処分とする一方、不記載罪で配川公設第 1秘書は略式起訴。
25 英、コロナ変異種初確認 新型コロナウイルス変異種の感染者を、英国内で初めて確認。28 外国人の新規入国停止 すべての国・地域からの外国人に関して、条件付きで認めてきた新
規入国を、21年 1月末まで一時停止。30 東京証券取引所大納会 日経平均株価の終値は 2万 7,444円 17銭、2年連続で 15%を超える
上昇率を記録。31 NY株式市場年末値 ダウ工業株(30種平均)の終値は 3万 606ドル 48セント、19年末
比の上昇率は 7%。31 英、EU離脱移行期間終了 移行期間が終了し、名実ともに EU非加盟国に。
日本銀行月 日 主な動き 内容1 20 日銀、金融政策決定会合(~ 21日) 短期金利を▲ 0.1%、長期金利をゼロ%程度とする金融政策の現状維
持を決定。3 16 日銀、金融政策決定会合 新型コロナウイルス感染症の拡大の影響により、内外金融資本市場
では不安定な動きが続いている情勢を踏まえ、①国債買入れやドルオペを含む一層潤沢な資金供給の実施、②新たなオペレーションの導入を含めた企業金融支援のための措置、③ ETF・J-REITの積極的な買入れにより金融緩和を強化する。
4 27 日銀、金融政策決定会合 新型コロナウイルス感染症の拡大の影響により、企業の資金繰りが悪化するなど企業金融面で緩和度合いが低下している情勢を踏まえ、① CP・社債等買入れの増額、②新型コロナ対応金融支援特別オペの拡充、③国債のさらなる積極的な買入れにより金融緩和を一段と強化する。
5 22 日銀、金融政策決定会合 金融政策の現状維持を決定。6 15 日銀、金融政策決定会合(~ 16日) 金融政策の現状維持を決定。7 14 日銀、金融政策決定会合(~ 15日) 金融政策の現状維持を決定。9 16 日銀、金融政策決定会合(~ 17日) 金融政策の現状維持を決定。10 28 日銀、金融政策決定会合(~ 29日) 金融政策の現状維持を決定。12 17 日銀、金融政策決定会合(~ 18日) 新型コロナウイルス対応で導入した企業の資金繰り支援策について、
21年 9月末までの期限延長を決定。
FOMC(連邦公開市場委員会)月 日 主な動き 内容1 28 米、FOMC(~ 29日) 政策金利(フェデラル・ファンド・レート)の誘導目標を「1.50~
1.75%」に据え置くことを決定。3 3 米、FOMC※臨時 政策金利の誘導目標を「1.50~ 1.75%」から「1.00~ 1.25% 」に
引き下げ。3 15 米、FOMC※臨時 政策金利の誘導目標を「1.00~ 1.25% 」から「0.00~ 0.25% 」に
引き下げ。4 28 米、FOMC(~ 29日) 政策金利の据え置きを決定。6 9 米、FOMC(~ 10日) 政策金利の据え置きを決定。7 28 米、FOMC(~ 29日) 政策金利の据え置きを決定。9 15 米、FOMC(~ 16日) 政策金利の据え置きを決定。11 4 米、FOMC(~ 5日) 政策金利の据え置きを決定。12 15 米、FOMC(~ 16日) 政策金利の据え置きを決定。
ECB(欧州中央銀行)月 日 主な動き 内容1 23 ECB、政策金利 0.00%。政策金利の据え置きを決定。3 12 ECB、政策金利 0.00%。政策金利の据え置きを決定。3 18 ECB、緊急理事会 コロナ危機対策として導入を決めた緊急債券買い入れプログラム
(PEPP)の規模を決定。4 30 ECB、政策金利 0.00%。政策金利の据え置きを決定。6 4 ECB、政策金利 0.00%。政策金利の据え置きを決定。7 16 ECB、政策金利 0.00%。政策金利の据え置きを決定。9 10 ECB、政策金利 0.00%。政策金利の据え置きを決定。10 29 ECB、政策金利 0.00%。政策金利の据え置きを決定。12 10 ECB、政策金利 0.00%。政策金利の据え置きを決定。
経済見通し月 日 主な動き 内容4 14 IMF世界経済見通し(春季) 世界経済の実質 GDP成長率は 20年 -3.0%、21年 +5.8%。日本は
20年 -5.2%、21年 +3.0%。6 10 OECD経済見通し(春季) ①第 2波襲来シナリオ:世界経済の実質 GDP成長率は 20年 -7.6%、
21年 +2.8%。②第 2波なしシナリオ:世界経済の実質 GDP成長率は 20年 -6.0%、21年 +5.2%。
6 8 世界銀行、世界経済見通し 世界経済の実質 GDP成長率は 20年 -5.2%、日本 -6.1%、米 -6.1%、ユーロ圏 -9.1。
10 13 IMF世界経済見通し(秋季) 世界経済の実質 GDP成長率は 20年 -4.4%、21年 +5.2%。日本は20年 -5.3%、21年 +2.3%。
11 21 OECD経済見通し(秋季) 世界経済の実質 GDP成長率は 20年 -4.2%、21年は +4.2%。
国内 GDP月 日 主な動き 内容2 17 19年 GDP(速報) 実質 0.7%、名目 1.3%。3 9 19年 GDP(2次速報) 実質 0.7%、名目 1.2%。5 18 19年度 GDP(速報) 実質 -0.1%、名目 0.7%。6 8 19年度 GDP(2次速報) 実質 0%、名目 0.8%。8 17 4~ 6月期 GDP(速報、季調済、前期比)実質 -7.8%、名目 -7.4%。9 8 4~ 6月 GDP(2次速報、季調済、前期
比)実質 -7.9%、名目 -7.6%。
11 16 7~ 9月期 GDP(速報、季調済、前期比)実質 5.0%、名目 5.2%。12 8 7~ 9月期 GDP(2次速報、季調済、前
期比)実質 5.3%、名目 5.5%。
資料編▶12.2020年の主な動き142 Data Chapter▶12.Development in Major Issues 2020 143

日銀短観、レポート月 日 主な動き 内容1 22 日銀、1月展望レポート 19年度の実質 GDP成長率は+ 0.8%、20年度は+ 0.9%と、いずれ
も上方修正。4 1 日銀、3月全国企業短期経済観測調査(短
観)業況判断指数(DI)は大企業・製造業で -8と昨年 12月から 8ポイント悪化。大企業・非製造業は +8と同 12ポイント悪化。
28 日銀、4月展望レポート 19年度の実質 GDP成長率は -0.4~ -0.1%、21年度は -5.0~ -3.0%と、いずれも下方修正。
7 1 日銀、6月全国企業短期経済観測調査(短観)
業況判断指数(DI)は大企業・製造業で -34と 3月から 26ポイント悪化。大企業・非製造業は -17と同 25ポイント悪化。
16 日銀、7月展望レポート 20年度の実質 GDP成長率は -4.7%、21年度は +3.3%。10 1 日銀、9月全国企業短期経済観測調査(短
観)業況判断指数(DI)は大企業・製造業で -27と 6月から 7ポイント改善。大企業・非製造業も -12と同 5ポイント改善。
30 日銀、10月展望レポート 20年度の実質 GDP成長率は -5.5%と下方修正、21年度は +3.6%と上方修正。
12 14 日銀、12月全国企業短期経済観測調査(短観)
業況判断指数(DI)は大企業・製造業で -10と 9月から 17ポイント改善。大企業・非製造業は、-5と同 7ポイント改善。
貿易統計・国際収支統計月 日 主な動き 内容1 23 19年分貿易統計(速報) 輸出は 76兆 9,278億円(前年比▲ 5.6%)と 3年ぶりの減少、輸入
は 78兆 5,716億円(同▲ 5.0%)と 3年ぶりの減少、貿易収支は▲1兆 6,438億円と 2年連続の赤字。
2 10 19年国際収支統計(速報) 経常黒字 20兆 597億円(前年比+ 8,375億円)。サービス収支が黒字に転化したことなどから、黒字幅拡大。
4 20 19年度貿易統計(速報) 輸出は 75兆 8,800億円(前年比▲ 6.0%)と 3年ぶりの減少、輸入は 77兆 1,713億円(同▲ 6.3%)と 3年ぶりの減少、貿易収支は▲1兆 2,912億円と 2年連続の赤字。
5 13 18年度国際収支統計(速報) 経常黒字は 19兆 7,615億円、貿易収支は +6,478億円と、いずれも前年度より黒字幅拡大。
7 20 20年上半期分貿易統計(速報) 輸出は 32兆 3,642億円(前年比▲ 15.4%)と 3期連続の減少、輸入は 34兆 6,038億円(同▲ 11.6%)と 3期連続の減少、貿易収支は▲2兆 2,395億円と 4期連続の赤字。
8 11 20年上半期国際収支(速報) 経常収支は 7兆 3,069億円、前年同期より▲ 3兆 3,444億円と黒字幅縮小。
10 19 20年度上半期分貿易統計(速報) 輸出は 30兆 9,114億円(前年比▲ 19.2%)と 4期連続の減少、輸入は 32兆 262億円(同▲ 18.1%)と 3期連続の減少、貿易収支は▲ 1兆 1,148億円と 4期連続の赤字。
11 10 20年度上半期国際収支(速報) 経常黒字は 6兆 6,901億円、前年同期より▲ 3兆 7,938億円と黒字幅縮小、貿易収支は 95億円と黒字転化。
財政月 日 主な動き 内容1 10 19年末外貨準備高 1兆 3,237億 5,000万ドル(前年比 +527億 7,500万ドル)。3 27 20年度予算成立 総額 102兆 6,580億円と過去最大。4 30 第 1次補正予算成立 総額 25兆 6,914億円。全国民一律 10万円現金給付が柱。5 8 19年度末の国の借金 債務残高総額 1,114兆 5,400億円(前年度末比 +11兆 1,856億円)
と過去最大。6 12 第 2次補正予算成立 総額 31兆 9,114億円。12 21 21年度予算案閣議決定 総額 106兆 6,097億円。3年連続で 100兆円を上回る。
人口・労働月 日 主な動き 内容1 17 19年度大学生就職内定率 20年春卒業予定者の内定率 87.1%(19年 12月 1日時点、前年同期
比 0.8ポイント減)。31 19年 12月完全失業率(速報) 2.2%。31 19年平均の完全失業者数(速報) 162万人(前年比▲ 4万人)、10年連続の減少。
3 14 19年度大学生就職内定率 20年春卒業予定者の内定率 88.7%(20年 2月 1日時点、前年同期比 1.0ポイント増)。
4 14 人口推計【総務省統計局】 総人口 1億 2,616万 7,000人(19年 10月 1日時点、前年比▲ 0.22%)と 9年連続で減少。
6 5 19年合計特殊出生率 前年を 0.06ポイント下回る 1.36%。4年連続の低下。
訪日外国人月 日 主な動き 内容1 17 19年訪日外国人数【日本政府観光局】 3,188万 2,100人(前年比 +2.2%)、過去最多を更新。
自動車月 日 主な動き 内容1 6 19年登録車販売台数(速報)【日本自動
車販売協会連合会】328万 4,870台(前年比▲ 1.9%)。
9 19年輸入車新規登録台数(速報)【日本自動車輸入組合】
29万 9,439台(前年比▲ 3.2%)。
31 19年自動車輸出台数【日本自動車工業会】
四輪車は 481.8万台(前年比横ばい)。うち乗用車は 437.3万台(同+0.3%)。
2 28 19年国内自動車生産台数【日本自動車工業会】
四輪車は 968.4万台(前年比▲ 0.5%)。
4 6 19年度輸入車新規登録台数(速報)【日本自動車輸入組合】
29万 2,109台(前年度比▲ 5.1%)。
7 6 20年上半期輸入車新規登録台数(速報)【日本自動車輸入組合】
13万 7,826台(前年同期比▲ 21.7%)。
30 20年上半期自動車輸出台数【日本自動車工業会】
162万 1,968台(前年同期比▲ 32.6%)。
10 6 20年度上半期輸入車新規登録台数(速報)【日本自動車輸入組合】
11万 3,061台(前年同期比▲ 25.7%)。
30 20年度上半期自動車輸出台数【日本自動車工業会】
145万 2,679台(前年同期比▲ 39.2%)。
鉄鋼月 日 主な動き 内容1 23 19年国内粗鋼生産量【日本鉄鋼連盟】 9,928万 4,000トン(前年同期比▲ 3.5%)、5年連続の減少。1 28 19年世界粗鋼生産量【世界鉄鋼協会】 18億 7,000万トン(前年比 +3.4%)、3年連続で過去最高を更新。5 19 19年度国内粗鋼生産量【日本鉄鋼連盟】9,842万 8,000トン(前年度比▲ 4.3%)、3年連続の減少。
資料編▶12.2020年の主な動き144 Data Chapter▶12.Development in Major Issues 2020 145

機械月 日 主な動き 内容1 23 19年工作機械受注額(確報)【日本工作
機械工業会】1兆 2,299億円(前年比▲ 32.3%)、3年ぶりの減少。
2 19 19年機械受注統計 27兆 4,503億円(前年比▲ 6.4%)。5 20 19年度工作機械受注額(確報)【日本工
作機械工業会】1兆 995億円(前年度比▲ 34.9%)、2年連続の減少。
テレビ・PC月 日 主な動き 内容4 21 19年薄型テレビ国内出荷台数【電子情
報技術産業協会】486.7万台(前年比 +7.9%)。
4 22 19年度国内パソコン出荷台数【電子情報技術産業協会】
出荷台数 947.5万台(前年度比 +28.1%)、うちデスクトップ型 65.3万台(同 +43.1%)、ノート型 690.3万台(同 +23.3%)。
10 22 20年上半期パソコン国内出荷台数【電子情報技術産業協会】
出荷台数 495.2万台(前年比 +98.2%)、うちデスクトップ型 65.3万台(同 +49.5%)、ノート型 429.9万台(同 +115.4%)。
地価・住宅月 日 主な動き 内容1 31 19年新設住宅着工戸数 90.5万戸(前年比▲ 4%)、3年連続の減少。3 18 19年 1月 1日時点の公示地価 全国平均(全用途)は前年比 +1.4%と、5年連続の上昇。4 30 19年度新設住宅着工戸数 88.4万戸(前年度比▲ 7.3%)と、減少に転じた。7 1 20年分路線価 全国平均値は前年比 +1.6%。沖縄県 +10.5%、東京都 +5.0%など 21
都道府県で上昇。最高路線価が上昇した都市は 38都市(19年は 33都市)、横ばいの都市は 8都市(13都市)に減少。
9 29 20年 7月 1日時点の基準地価 東京、大阪、名古屋の 3大都市圏は商業地が前年比 +0.7%、住宅地は同▲ 0.3%。
米国経済月 日 主な動き 内容1 15 米 FRB、ベージュブック(地区連銀経済
報告)19年 11月中旬から年末にかけて、米経済は「緩やかな拡大が続いた」と総括し、前回と同じ景況判断を維持。
2 5 米、19年貿易収支 貿易赤字は▲ 8,529億 4,900万ドル(季調済、前年比▲ 2.5%)。27 米、19年 GDP(速報) +2.1%。
3 19 米、19年経常収支 経常赤字は 4,983億 5,100万ドル(前年比▲ 1.5%)と 6年連続の増加、11年ぶりの高水準。
26 米、19年 10~ 12月 GDP(確定、季調済、前期比)
+2.1%。
4 29 米、1~ 3月期 GDP(速報、季調済、前期比)
▲ 4.8%。
5 28 米、1~ 3月期 GDP(2次速報、季調済、前期比)
▲ 5.0%。
6 25 米、1~ 3月期 GDP(確定、季調済、前期比)
▲ 5.0%。
7 30 米、4~ 6月期 GDP(速報、季調済、前期比)
▲ 32.9%。
8 27 米、4~ 6月期 GDP(2次速報、季調済、前期比)
▲ 31.7%。
9 30 米、4~ 6月期 GDP(確定、季調済、前期比)
▲ 31.4%。
10 29 米、7~ 9月期 GDP(速報、季調済、前期比)
+33.1%。
11 25 米、7~ 9月期 GDP(2次速報、季調済、前期比)
+33.1%。
12 22 米、7~ 9月期 GDP(確定、季調済、前期比)
+33.4%。
欧州経済月 日 主な動き 内容1 31 ユーロ圏 19ヵ国、19年 GDP(速報) +1.2%。4 30 ユーロ圏 19ヵ国、1~ 3月期 GDP(速報、
前期比)▲ 3.8%。
7 31 ユーロ圏 19ヵ国、4~ 6月期 GDP(速報、前期比)
▲ 12.1%。
10 30 ユーロ圏 19ヵ国、7~ 9月期 GDP(速報、前期比)
+12.7%。
中国経済月 日 主な動き 内容1 14 中国、19年貿易統計 輸出は 2兆 4,984億ドル(前年比 +0.5%)、輸入は 2兆 768億ドル(同
▲ 2.8%)、貿易総額は 4兆 5,753億ドル(同▲ 1.0%)。17 中国、19年 GDP(速報) +6.1%、1990年(3.9%成長)以来の低水準。
4 17 中国、1~ 3月期 GDP(速報、前年同期比)
▲ 6.8%。
7 16 中国、4~ 6月期 GDP(速報、前年同期比)
+3.2%。
10 19 中国、7~ 9月期 GDP(速報、前年同期比)
+4.9%。
ロシア経済月 日 主な動き 内容2 3 ロシア、19年 GDP(速報) +1.3%。
資料編▶12.2020年の主な動き146 Data Chapter▶12.Development in Major Issues 2020 147
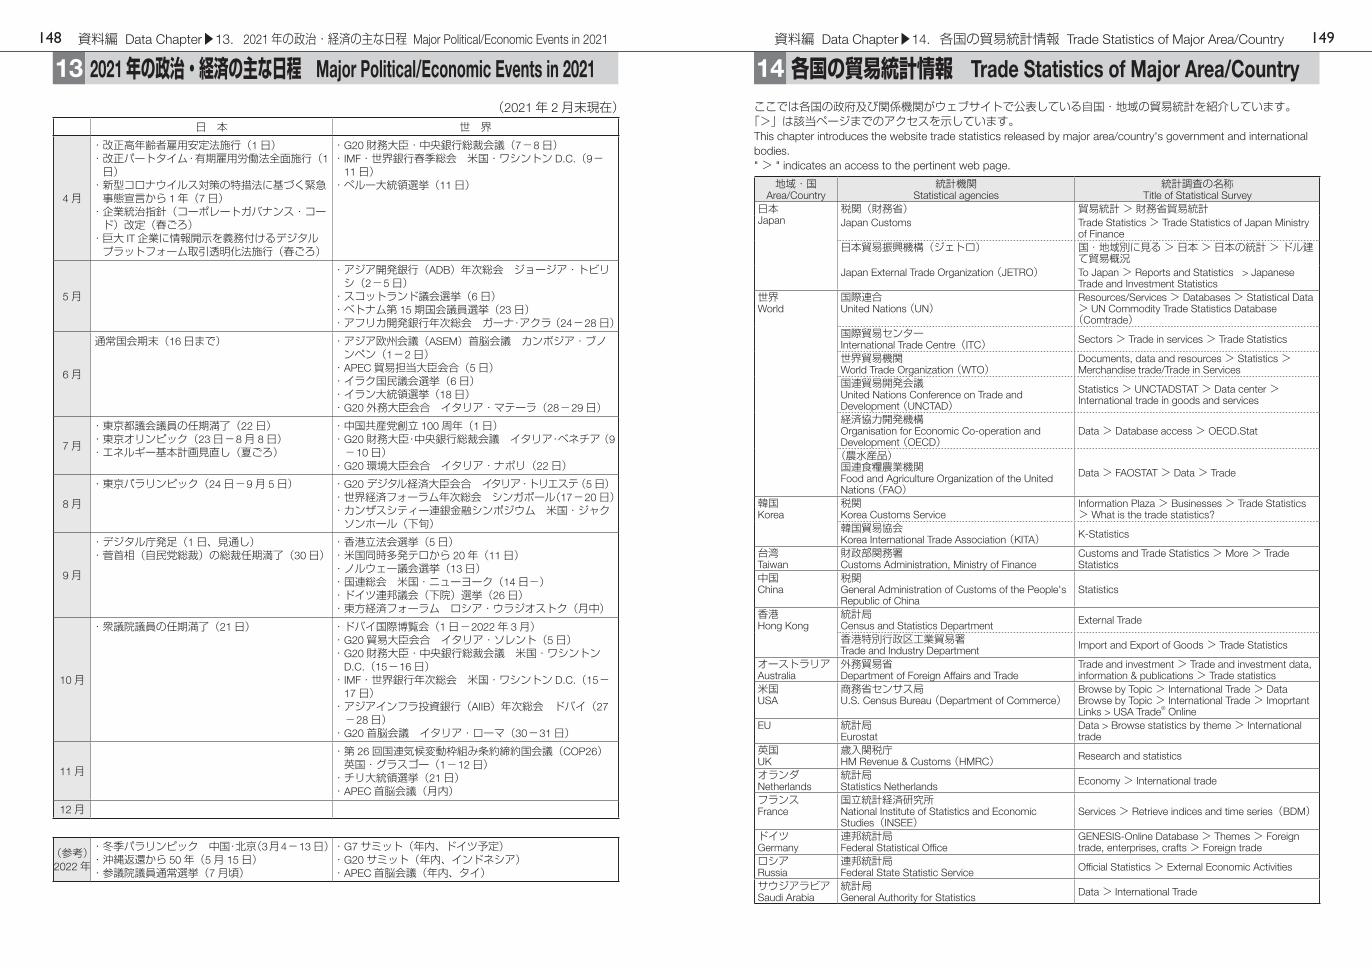
(2021年 2月末現在)日 本 世 界
4月
・改正高年齢者雇用安定法施行(1日)・ 改正パートタイム・有期雇用労働法全面施行(1日)・ 新型コロナウイルス対策の特措法に基づく緊急事態宣言から 1年(7日)
・ 企業統治指針(コーポレートガバナンス・コード)改定(春ごろ)・ 巨大 IT企業に情報開示を義務付けるデジタルプラットフォーム取引透明化法施行(春ごろ)
・G20財務大臣・中央銀行総裁会議(7-8日)・ IMF・世界銀行春季総会 米国・ワシントン D.C.(9-
11日)・ペルー大統領選挙(11日)
5月
・ アジア開発銀行(ADB)年次総会 ジョージア・トビリシ(2-5日)・ スコットランド議会選挙(6日)・ ベトナム第 15期国会議員選挙(23日)・ アフリカ開発銀行年次総会 ガーナ・アクラ(24-28日)
6月
通常国会期末(16日まで) ・ アジア欧州会議(ASEM)首脳会議 カンボジア・ブノンペン(1-2日)・ APEC貿易担当大臣会合(5日)・ イラク国民議会選挙(6日)・イラン大統領選挙(18日)・ G20外務大臣会合 イタリア・マテーラ(28-29日)
7月
・東京都議会議員の任期満了(22日)・東京オリンピック(23日-8月 8日)・エネルギー基本計画見直し(夏ごろ)
・中国共産党創立 100周年(1日)・ G20財務大臣・中央銀行総裁会議 イタリア・ベネチア(9-10日)
・ G20環境大臣会合 イタリア・ナポリ(22日)
8月
・東京パラリンピック(24日-9月 5日) ・G20 デジタル経済大臣会合 イタリア・トリエステ(5日)・ 世界経済フォーラム年次総会 シンガポール(17-20日)・ カンザスシティー連銀金融シンポジウム 米国・ジャクソンホール(下旬)
9月
・デジタル庁発足(1日、見通し)・ 菅首相(自民党総裁)の総裁任期満了(30日)
・香港立法会選挙(5日)・米国同時多発テロから 20年(11日)・ノルウェー議会選挙(13日)・国連総会 米国・ニューヨーク(14日-)・ドイツ連邦議会(下院)選挙(26日)・ 東方経済フォーラム ロシア・ウラジオストク(月中)
10月
・衆議院議員の任期満了(21日) ・ドバイ国際博覧会(1日-2022年 3月)・ G20貿易大臣会合 イタリア・ソレント(5日)・ G20財務大臣・中央銀行総裁会議 米国・ワシントン
D.C.(15-16日)・ IMF・世界銀行年次総会 米国・ワシントン D.C.(15-
17日)・ アジアインフラ投資銀行(AIIB)年次総会 ドバイ(27-28日)
・ G20首脳会議 イタリア・ローマ(30-31日)
11月
・ 第 26回国連気候変動枠組み条約締約国会議(COP26)英国・グラスゴー(1-12日)・チリ大統領選挙(21日)・APEC首脳会議(月内)
12月
(参考)2022年
・ 冬季パラリンピック 中国・北京(3月4-13日)・沖縄返還から 50年(5月 15日)・参議院議員通常選挙(7月頃)
・G7サミット(年内、ドイツ予定)・G20サミット(年内、インドネシア)・APEC首脳会議(年内、タイ)
13 2021年の政治・経済の主な日程 Major Political/Economic Events in 2021ここでは各国の政府及び関係機関がウェブサイトで公表している自国・地域の貿易統計を紹介しています。「>」は該当ページまでのアクセスを示しています。This chapter introduces the website trade statistics released by major area/country's government and international bodies." > " indicates an access to the pertinent web page.
地域・国Area/Country
統計機関Statistical agencies
統計調査の名称Title of Statistical Survey
日本Japan
税関(財務省) 貿易統計 > 財務省貿易統計Japan Customs Trade Statistics > Trade Statistics of Japan Ministry
of Finance日本貿易振興機構(ジェトロ) 国・地域別に見る > 日本 > 日本の統計 > ドル建
て貿易概況Japan External Trade Organization (JETRO) To Japan > Reports and Statistics > Japanese
Trade and Investment Statistics世界World
国際連合United Nations (UN)
Resources/Services > Databases > Statistical Data > UN Commodity Trade Statistics Database (Comtrade)
国際貿易センターInternational Trade Centre(ITC) Sectors > Trade in services > Trade Statistics
世界貿易機関World Trade Organization (WTO)
Documents, data and resources > Statistics >Merchandise trade/Trade in Services
国連貿易開発会議United Nations Conference on Trade and Development (UNCTAD)
Statistics > UNCTADSTAT > Data center > International trade in goods and services
経済協力開発機構Organisation for Economic Co-operation and Development (OECD)
Data > Database access > OECD.Stat
(農水産品)国連食糧農業機関Food and Agriculture Organization of the United Nations (FAO)
Data > FAOSTAT > Data > Trade
韓国Korea
税関Korea Customs Service
Information Plaza > Businesses > Trade Statistics > What is the trade statistics?
韓国貿易協会Korea International Trade Association (KITA) K-Statistics
台湾Taiwan
財政部関務署Customs Administration, Ministry of Finance
Customs and Trade Statistics > More > Trade Statistics
中国China
税関General Administration of Customs of the People's Republic of China
Statistics
香港Hong Kong
統計局Census and Statistics Department External Trade
香港特別行政区工業貿易署Trade and Industry Department Import and Export of Goods > Trade Statistics
オーストラリアAustralia
外務貿易省Department of Foreign Affairs and Trade
Trade and investment > Trade and investment data, information & publications > Trade statistics
米国USA
商務省センサス局U.S. Census Bureau (Department of Commerce)
Browse by Topic > International Trade > DataBrowse by Topic > International Trade > Imoprtant Links > USA Trade® Online
EU 統計局Eurostat
Data > Browse statistics by theme > International trade
英国UK
歳入関税庁HM Revenue & Customs (HMRC) Research and statistics
オランダNetherlands
統計局Statistics Netherlands Economy > International trade
フランスFrance
国立統計経済研究所National Institute of Statistics and Economic Studies(INSEE)
Services > Retrieve indices and time series(BDM)
ドイツGermany
連邦統計局Federal Statistical Office
GENESIS-Online Database > Themes > Foreign trade, enterprises, crafts > Foreign trade
ロシアRussia
連邦統計局Federal State Statistic Service Official Statistics > External Economic Activities
サウジアラビアSaudi Arabia
統計局General Authority for Statistics Data > International Trade
14 各国の貿易統計情報 Trade Statistics of Major Area/Country資料編 Data Chapter▶14.各国の貿易統計情報 Trade Statistics of Major Area/Country 149資料編 Data Chapter▶13.2021年の政治・経済の主な日程 Major Political/Economic Events in 2021148

(2021年 1月 1日現在)
締結済み
EPA(15ヵ国・2地域)
相手国・地域 締結・交渉状況 発効
シンガポール 2002年 1月 13日署名2002年 11月 30日(2007年 9月 2日、改正議定書発効)
メキシコ 2004年 9月 17日署名2005年 4月 1日(2012年 4月 1日、改正議定書発効)
マレーシア 2005年 12月 13日署名 2006年 7月 13日
フィリピン 2006年 9月 9日署名 2008年 12月 11日
チリ 2007年 3月 27日署名 2007年 9月 3日
タイ 2007年 4月 3日署名 2007年 11月 1日
ブルネイ 2007年 6月 18日署名 2008年 7月 31日
インドネシア 2007年 8月 20日署名 2008年 7月 1日
ASEAN 2008年 4月 14日署名 2008年 12月 1日
ベトナム 2008年 12月 25日署名 2009年 10月 1日
スイス 2009年 2月 19日署名 2009年 9月 1日
インド 2011年 2月 15日署名 2011年 8月 1日
ペルー 2011年 5月 31日署名 2012年 3月 1日
オーストラリア 2014年 7月 8日署名 2015年 1月 15日
モンゴル 2015年 2月 10日署名 2016年 6月 7日
EU 2018年 7月 17日署名 2019年 2月 1日
英国 2020年 10月 23日署名 2021年 1月 1日
TPP11(オーストラリア、ブルネイ、カナダ、チリ、マレーシア、メキシコ、ニュージーランド、ペルー、シンガポール、ベトナム)
2018年 3月 8日署名 2018年 12月 30日
日米貿易協定・日米デジタル貿易協定
2019年 10月 7日署名 2020年 1月 1日
東アジア地域包括的経済連携(RCEP)(ASEAN10ヵ国、中国、韓国、オーストラリア、ニュージーランド)
2020年 11月署名 -
交渉中(5ヵ国・
3地域)日中韓自由貿易協定(FTA)
【2010年】第 1回産官学共同研究会合(5/6・7)、第 2回会合(9/1~ 3)、第 3回会合(12/1~ 3)。【2011年】第 4回会合(3/30~ 4/1)、第 5回会合(6/27・28)、第 6回会合(8/31~ 9/2)、第 7回会合(12/14~ 16)。【2012年】産官学共同研究報告書公表(3/30)。第 1回実務協議(6/19・20)、第 2回実務協議(8/21)、第 3回実務協議(9/27)。第 21回 ASEAN関連首脳会議の機会に、日中韓経済貿易大臣会合が開催され、FTA交渉開始を宣言(11/20)。【2013年】準備会合(2/20・21)、FTA交渉第 1回会合(3/26~ 28)、準備会合(6/3・4)、第 2回会合(7/30~ 8/2)、準備会合(10/22・23)、第 3回会合(11/26~ 29)。【2014年】第 4回会合(3/4~ 7)、中間会合(6/17・18)、第 5回会合(9/1~ 5)、第 6回会合(11/24~ 28)。
15わが国をめぐる経済連携協定の締結・交渉状況
日中韓自由貿易協定(FTA)
【2015年】第 6回会合(首席代表会合、1/16・17)、中間会合(3/10~ 12)、第 7回会合(局長 /局次長会合、4/13~ 17)、第 7回会合(首席代表会合、5/12・13)、第 8回会合(局長 /局次長会合、7/20~ 24)、第 8回会合(首席代表会合、9/24・25)、第 9回会合(局長 /局次長会合、12/14~ 18)。【2016年】第 9回会合(首席代表会合、1/18・19)、第 10回会合(局長 /局次長会合、4/5~ 9)、第 10回会合(首席代表会合、6/27・28)。【2017年】第 11回会合(首席代表・局長 /局次長会合、1/9~ 11)、第 12回会合(4/10~ 13)。【2018年】第 13回会合(3/22・23)、第 14回会合(12/6・7)。【2019年】第 15回会合(4/9~ 12)、第 16回会合(11/27~ 29)。
-
湾岸協力理事会(GCC)(FTA)(バーレーン、クウェート、オマーン、カタール、サウジアラビア、アラブ首長国連邦)
【2006年】FTA交渉を正式発表(4/6)。準備会合(5/20・21)、FTA交渉第1回会合(9/21・22)、第 1回非公式中間会合(12/18・19)。【2007年】第 2回会合(1/21・22)、第 2回非公式中間会合(12/9~ 11)。【2008年】第 3回非公式中間会合(7/14~ 16)。【2009年】第 4回非公式中間会合(3/29~ 31)。
-
トルコ(EPA)
【2011年】玄葉外務大臣、枝野経済産業大臣、チャーラヤン・トルコ経済大臣の会談にて、EPAに関する共同研究立ち上げを決定(7/19)。【2012年】共同研究第 1回会合(2/20・21)。【2013年】共同研究第 2回会合(2/26・27)、共同研究報告書発表(7/31)。【2014年】EPA交渉第 1回会合(12/1・2)。【2015年】第 2回会合(4/13~ 17)、第 3回会合(9/7~ 10)。【2016年】第 4回会合(1/25~ 27)、第 5回会合(6/27~ 30)。【2017年】第 6回会合(1/23~ 26)、第 7回会合(9/27~ 29)。【2018年】第 8回会合(1/30~ 2/1)、第 9回会合(4/11~ 13)、第 10回会合(6/11~ 13)、第 11回会合(9/4~ 7)、第 12回会合(12/18~ 21)。【2019年】第 13回会合(2/12~ 15)、第 14回会合(4/2~ 5)、第 15回会合(6/17~ 21)、第 16回会合(8/6~ 9)、第 17回会合(9/30~ 10/4)。
-
韓国(EPA)
【2003年】首脳会談で EPA交渉開始合意。EPA交渉第 1回会合(12/22)。【2004年】第 2回会合(2/23~ 25)、第 3回会合(4/26~ 28)、第 4回会合(6/23~ 25)、第 5回会合(8/23~ 25)、第 6回会合(11/1~ 3)。【2005年】首脳会談で小泉首相が交渉の早期再開を促す(6/20)。【2008年】第 1回実務協議(6/25)、第 2回実務協議(12/4)。【2009年】第 3回実務協議(7/1)、第 4回実務協議(12/21)。【2010年】第 1回局長級事前協議(9/16)。【2011年】第 2回局長級事前協議(5/9)。
-
カナダ(EPA)
【2012年】首脳会談で EPA交渉開始合意(3/25)。EPA交渉第 1回会合(11/26~ 30)。【2013年】第 2回会合(4/22~ 26)、第 3回会合(7/8~ 12)、第 4回会合(11/12~ 14)。【2014年】第 5回会合(3/24~ 28)、第 6回会合(7/28~ 31)、第 7回会合(11/17~ 21)。
-
コロンビア(EPA)
【2012年】首脳会談でEPA交渉開始合意(9/25)。EPA交渉第1回会合(12/17)。【2013年】第 2回会合(5/20~ 24)、第 3回会合(10/28~ 11/1)。【2014年】第 4回会合(2/10~ 14)、第 5回会合(5/12~ 16)、第 6回会合(7/14~ 18)、第 7回会合(9/8~ 12)、第 8回会合(10/27~ 11/7)、第 9回会合(12/15~ 19)。【2015年】第 10回会合(3/2~ 6)、第 11回会合(5/18~ 22)、第 12回会合(7/14~ 17)、第 13回会合(8/31~ 9/4)。
-
Source : 外務省の公式サイトなどより作成。 Compiled from MOFA's website etc.
資料編▶15.わが国をめぐる経済連携協定の締結・交渉状況150 Data Chapter▶15.EPAs etc. concluded or under negotiation by Japan 151

16 2021年度わが国貿易収支、経常収支の見通しⅡ.総括表【通関貿易】
2019年度 実績 2020年度 見込み 2021年度 見通し
(10億円) 対前年度比増減(伸び率) (10億円) 対前年度比増減
(伸び率) (10億円) 対前年度比増減(伸び率)
通関貿易収支 ▲ 1,291 +319 1,519 +2,810 2,986 +1,467
輸 出 75,880 (-6.0%) 67,612 (-10.9%) 73,389 (8.5%)数量要因 -4.4% -10.0% 7.0%価格要因 -1.6% -1.0% 1.5%
輸 入 77,171 (-6.3%) 66,092 (-14.4%) 70,403 (6.5%)数量要因 -2.3% -6.6% 3.2%価格要因 -3.8% -8.3% 3.2%
【経常収支】2019年度 実績 2020年度 見込み 2021年度 見通し
(10億円) 対前年度比増減(伸び率) (10億円) 対前年度比増減
(伸び率) (10億円) 対前年度比増減(伸び率)
貿易・サービス収支 189 +489 ▲ 308 -497 2,619 +2,927
貿易収支 667 +32 3,163 +2,497 4,720 +1,557
輸 出 74,943 (-6.7%) 66,777 (-10.9%) 72,482 (8.5%)輸 入 74,277 (-6.8%) 63,613 (-14.4%) 67,762 (6.5%)
サービス収支 ▲ 478 +457 ▲ 3,471 -2,994 ▲ 2,101 +1,371
第一次所得収支 21,421 -212 18,914 -2,507 19,854 +940
第二次所得収支 ▲ 1,469 +272 ▲ 2,090 -621 ▲ 1,740 +350
経常収支 20,141 +549 16,516 -3,625 20,734 +4,218
(注)金額は表示単位未満を四捨五入しているため計算が合わないことがある。
【前提条件】2019 2020 2021
世界貿易 (暦年) 0.2 % ▲ 7.9 % 7.6 %世界経済 (暦年・実質) 2.8 % ▲ 4.4 % 5.1 % 米 国 2.2 % ▲ 4.6 % 3.3 %ユーロ圏 1.3 % ▲ 8.7 % 5.3 %アジア新興国 5.5 % ▲ 1.3 % 7.7 %
日本経済 (年度・実質) 0.0 % ▲ 6.2 % 3.4 %(注1)アジア新興国市場及び途上国・地域は IMF定義による Emerging and Developing Asia。(注2) 上記の前提条件に加え、11月中旬の外国為替市場および原油市場の動向を参考に、円相場は 2020年
度 106円 /ドル、2021年度 106円 /ドル。原油入着価格は 2020年度 41ドル /バレル、2021年度 50ドル /バレルとの前提条件をおいて積み上げ作業を実施。
2020年 12月 3日(木)
一般社団法人 日本貿易会
Ⅰ.要 旨1.商品別貿易の見通し(通関ベース)● 2020年度 ~ 新型コロナ感染症の影響による世界的な経済縮小により、輸出入ともに大幅に減少
輸出総額は 2019年度比 10.9%減の 67兆 6,120億円となる。内訳は、輸出数量が同 10.0%減少、
輸出価格が同 1.0%低下。新型コロナ危機による世界的な需給両面へのショックに伴い、幅広い品目
で輸出数量が減少する。
輸入総額は 2019年度比 14.4%減の 66兆 920億円となる。内訳は、輸入数量が同 6.6%減少、輸
入価格が同 8.3%低下。資源・素材市況の下落を背景に鉱物性燃料の輸入減が輸入総額を押し下げる。
この結果、通関貿易収支は 1兆 5,190億円の黒字と、3年ぶりの黒字に転じる。
● 2021年度 ~ 輸出入ともに持ち直すも新型コロナ危機前の水準には回復せず
輸出総額は 2020年度比 8.5%増の 73兆 3,890億円となる。内訳は、輸出数量が同 7.0%増加、輸
出価格が同 1.5%上昇。2020年度に大幅に減少した輸送用機器、一般機械、原料別製品等の輸出が
増加に転じる。
輸入総額は 2020年度比 6.5%増の 70兆 4,030億円となる。内訳は、輸入数量が同 3.2%増加、輸
入価格が同 3.2%上昇。原油や石炭の価格上昇で鉱物性燃料の輸入が 2020年度比で 2割近く増加す
る。
輸出入ともに 2020年度比で回復に転じるものの、いずれも新型コロナ危機前の水準には届かない。
通関貿易収支は 2兆 9,860億円の黒字と、2年連続の黒字を計上する。
2.経常収支の見通し● 2020年度 ~ 訪日外国人の消費、海外から受け取る利子・配当が減少し、経常収支黒字は縮小
経常収支黒字は 16兆 5,160億円に縮小する。新型コロナ感染症の影響により、訪日外国人の消費
(いわゆるインバウンド消費)の大幅減により、サービス収支赤字は 2019年度の 4,780億円から 3
兆 4,710億円に拡大する。また、海外から受け取る配当金や投資収益を含む第一次所得収支の黒字
幅は 2019年度の 21兆 4,210億円から 18兆 9,140億円に縮小する。
● 2021年度 ~ 経常収支黒字は 2019年度と同水準に回復
経常収支黒字は 20兆 7,340億円に拡大し、2019年度と同水準に回復する。東京オリンピック・
パラリンピックが新型コロナ感染防止に留意しつつ開催されることを前提に、インバウンド消費を
含むサービス収支の赤字幅は 2兆 1,010億円に縮小する。また、世界的な経済の持ち直しを背景に、
第一次所得収支の黒字幅は 19兆 8,540億円に拡大する。
資料編▶16.2021年度わが国貿易収支、経常収支の見通し152 153Data Chapter▶16.FY2021 Outlook for Japan's Trade Balance and Current Account

Ⅲ .今回見通しのポイント当会の見通しの特徴は、専門委員会参加 8商社が社内外にヒアリング等を行い、それらを商品別
に積み上げて作成している点である。今回の見通しは、新型コロナ感染症の影響により各国経済、
国際貿易、国民生活が厳しい状況にあるなかで、① 2021 年度には主要国で新型コロナの新規感染者
が減少傾向となり、ワクチンや重症化を防止する治療薬の普及により各国経済活動への制約が緩和
される、②国内でも新型コロナ感染症の影響は徐々に鎮静化し、経済活動は正常化に向かうとの前
提条件を設定して作成したものである。
今後の貿易動向は、国内外における新型コロナ感染症を巡る状況に大きく左右されると考えられ
るため、見通しからの上振れ、下振れの可能性は大きいが、今回見通しのポイントとして次の 3点
が挙げられる。
・ 2020年度に大きく落ち込んだ輸出・輸入は、いずれも 2021年度には回復に転じるが、新型
コロナ危機前(2019年度)の水準まで戻らない品目も多く、品目ごとのばらつきが鮮明化す
るというのが、今回われわれが見通し作業を通じて得たシナリオである。
・ 例えば、2020年度下半期に入って米国および欧州向け等の自動車の輸出は回復基調に転じて
いる。しかし、われわれの予測では、本格回復には時間を要し、2021年度の自動車の輸出は、
2019年度の水準まで回復しないと想定する。一方、半導体等電子部品の輸出は、新型コロナ
感染症の影響で一時落ち込んだが、アジア等各国の生産活動再開後は回復に転じ、2020年度
は 2019年度の水準を若干上回り、2021年度も 5G関連の需要増等により順調に伸びると予
測する。
・ また、新型コロナ危機が世界経済に大きな打撃を与えるなかで、貿易収支も大きな影響を受け、
2020年度においては特異な動きも見られることには留意が必要である。われわれの見通しに
よれば、2020年度の輸出総額は 2019年度比 10.9%減少するが、数量要因と価格要因に分解
すると、輸出数量は同▲ 10.0%、輸出価格は同▲ 1.0%である。これは、2020年度上半期に
外需が急減し、輸出の数量が大幅に減少したことを反映している。一方、2020年度の輸入総
額は同 14.4%減少するが、輸入数量は同▲ 6.6%、輸入価格は同▲ 8.3%であり、価格要因が
かなり効いている。これは、世界経済の落ち込みと先行き不透明感により、資源や素材の市
況が下落したことによる部分が大きい。
見通しでは、輸出総額(通関貿易統計ベース)は 2020年度に前年度比 10.9%の減少を記録した後、
2021年度は同 8.5%の増加に転じるとの予測結果になった。
まず、2020年度の輸出は、新型コロナ危機により急減した後、総じて持ち直しに転じている。見
通しにおいては、サプライチェーンの制約が解消するとともに、各国での外出規制等で抑制されて
いた需要が増加に転じることを織り込んだが、それでも 2020年度を通じた輸出の伸び率は 2桁のマ
イナス(2019年度比▲ 10.9%)になると予測する。
次に、2021年度の輸出は、2020年度比で増加に転じるが、伸び率は 1桁(2020年度比+ 8.5%)
にとどまり、商品別に見ると、2019年度の水準まで回復しない品目も多いと予想する。仮にわれわ
れの前提条件に反して、主要国で新型コロナ感染者の増加傾向が継続する、あるいは、ワクチンの
普及が遅延するような場合には、輸出の伸びが下振れる可能性も大きいと認識している。
一方、輸入総額は 2020年度に前年度比 14.4%の減少を記録した後、2021年度は同 6.5%の増加
に転じるとの予測結果になった。
まず、2020年度の輸入の大幅減については、新型コロナ危機が世界経済の需給両面にショックを
与え、資源・素材市況が下落したことにより、価格要因による減少(2019年度比▲ 8.3%)が数量
要因による減少(同▲ 6.6%)よりも大きいことが特徴である。
次に、2021年度の輸入は 2020年度比 6.5%の増加と、2020年度の落ち込みを勘案すれば低い伸
びにとどまると予測した。この理由の一つは、資源・素材市況は当面低水準で推移すると予想され
るため、輸入価格の伸びは低くとどまる(2020年度比+ 3.2%)と想定したためである。さらに、
新型コロナ感染症の影響は徐々に鎮静化に向かい、東京オリンピック・パラリンピックも新型コロ
ナ感染防止に留意しつつ開催されることを前提条件としているが、日本経済の実質 GDP水準は
2021年度中には新型コロナ危機前には戻らないことから、内需回復は緩慢で輸入の回復が遅れると
予想される。
以上の結果、2020年度、2021年度の通関貿易収支は、それぞれ 1兆 5,190億円の黒字、2兆 9,860
億円の黒字になると予測する。
2020年度の経常収支は、新型コロナ感染症の影響を受けて訪日外国人による消費(いわゆるイン
バウンド消費)が減少したこと等により黒字幅が縮小し、16兆 5,160億円の黒字となると予測した。
2021年度の経常収支は、貿易収支の改善、インバウンド消費の持ち直し、第一次所得収支の黒字増
により、20兆 7,340億円の黒字となり、2019年度と同水準の黒字幅に戻る見通しである。主に対
外投融資による利子や配当の受け払いを集計した第一次所得収支は、世界的な経済環境の悪化を反
映して、2020年度、2021年度ともに 2019年度の水準を下回ると予測する。
Ⅳ .主要商品別の見通し(通関ベース)1.輸 出
◆◇◆ 2020年度◆◇◆
世界経済が大きく落ち込んだなかで、2020年度の輸出は 2019年度比 10.9%の減少となる。内訳
は、輸出数量が同 10.0%の減少、輸出価格が同 1.0%の低下である。
資料編▶16.2021年度わが国貿易収支、経常収支の見通し154 155Data Chapter▶16.FY2021 Outlook for Japan's Trade Balance and Current Account

品目別に見ると、自動車等の輸送用機器、鉄鋼、非鉄金属等の原料別製品、原動機等の一般機械
の輸出減が、それぞれ輸出総額を 4.3ポイント、1.8ポイント、1.5ポイント押し下げる。自動車の
輸出は、足元では米国向けをはじめ回復基調となっているが、年度を通じて見ると 2割超減少する。
原料別製品の輸出の約 3分の 1を占める鉄鋼は、ASEAN・韓国向けの回復が緩慢で、2019年度比
25.6%の減少となる。一方、アルミ等の非鉄金属の輸出は、2019年度に下落していた価格が反発し
たことに加え、2020年度下半期には需要が持ち直すことにより、同 10.8%の増加となる。また、原
動機等を含む一般機械は、企業の設備投資意欲の減退を反映して、同 7.8%の減少となる。
2020年度の輸出は幅広い品目で減少を記録するが、そのなかで食料品は、2019年度比 4.5%の増
加となる(ただし、輸出総額に対する寄与度は 0.04ポイントの押し上げにすぎない)。これは、新
型コロナ感染症の影響により外食向け食料品の輸出が落ち込む一方、果実、野菜等内食向け食料品
の輸出が順調に伸びることによるものである。
◆◇◆ 2021年度◆◇◆
世界経済が緩やかな持ち直し傾向に転じ、日本の主要輸出相手国である中国が回復基調を強める
なかで、2021年度の輸出は 2020年度比 8.5%の増加となる。内訳は、輸出数量が同 7.0%の増加、
輸出価格が同 1.5%の上昇である。
品目別に見ると、輸送用機器、一般機械、原料別製品の輸出増が、それぞれ輸出総額を 2.0ポイ
ント、1.7ポイント、1.2ポイント押し上げる。すなわち、2020年度に大幅な輸出減となった品目が
増加に転じるところが大きい。一般機械の輸出は 2019年度と同水準に回復する。一方、輸送用機器
と原料別製品の輸出は 2019年度の水準までは回復しない。輸送用機器のうち、自動車の輸出は、欧
米向けを中心に回復基調を続けるが、やはり 2019年度の水準には戻らない。一般機械のうち、原動
機の輸出は、新型コロナ感染症の影響が鎮静化した後も、環境規制厳格化等の影響で石炭火力発電
所等の需要が弱い動きとなり、2020年度比 6.1%の増加にとどまる。原料別製品のうち、鉄鋼、非
鉄金属の輸出は、価格および数量の緩やかな回復により、それぞれ同 10.5%、同 9.0%の伸びを記
録する。
2.輸 入
◆◇◆ 2020年度◆◇◆
2020年度の輸入は、新型コロナ感染症による世界経済の需給両面へのショックに伴い、2019年
度比 14.4%の減少となる。内訳は、輸入数量が同 6.6%の減少、輸入価格が同 8.3%の低下である。
品目別に見ると、鉱物性燃料、輸送用機器、電気機器が、それぞれ輸入総額を 8.7ポイント、1.2
ポイント、1.0ポイント押し下げる。輸入総額に占めるシェアが大きい鉱物性燃料のうち、原油及び
粗油、LNG、石炭の輸入は、それぞれ 2019年度比で 3~ 5割減少する。新型コロナ感染症による
国内経済活動の停滞を受けた輸入数量の減少に加え、資源市況が下落したことによる部分が大きい。
自動車の輸入は、主要輸入相手先である欧州での生産低迷の影響が大きく、2019年度比 18.8%の減
少となる。また、電気機器のうち、携帯電話等の通信機の輸入は、外出自粛の影響もあって同 5.2%
減少し、半導体等電子部品の輸入は、テレワーク拡大等に伴う需要増で数量は増加するが、価格低
下を主因に同 3.7%減少する。
◆◇◆ 2021年度◆◇◆
2021年度の輸入は、国内経済の持ち直しに伴い、2020年度比 6.5%の増加となる。内訳は、輸入
数量が同 3.2%の増加、輸入価格が同 3.2%の上昇である。
品目別に見ると、鉱物性燃料、原料別製品、食料品が、それぞれ輸入総額を 2.5ポイント、1.6ポ
イント、0.4ポイント押し上げる。鉱物性燃料の輸入は、原油や石炭の価格上昇を主因に 2020年度
比 17.0%の増加に転じる。原料別製品の輸入は同 15.2%の増加に転じ、うち鉄鋼、非鉄金属の輸入
はそれぞれ同 10.4%、同 41.0%の伸びを記録する。また、食料品の輸入は、外食需要の持ち直しに
より魚介類・肉類を中心に同 3.6%の増加に転じる。
Ⅴ.経常収支の見通し◆◇◆ 2020年度◆◇◆
経常収支は 16兆 5,160億円の黒字となるが、黒字幅は 2019年度の 20兆 1,410億円から縮小する。
内訳を見ると、貿易収支は、輸入の減少が輸出の減少より大きく、黒字幅は 2019年度の 6,670億円
から 3兆 1,630億円に拡大する。サービス収支は、新型コロナ感染症の影響によりインバウンド需
要が急減したことを受けて、赤字幅が 2019年度の 4,780億円から 3兆 4,710億円に拡大する。第一
次所得収支は、世界的な経済環境の悪化に伴う投資収益の減少を受けて、黒字幅は 2019年度の 21
兆 4,210億円から縮小し、18兆 9,140億円の黒字となる。
◆◇◆ 2021年度◆◇◆
経常収支は、黒字幅が 2019年度をやや上回る水準に回復し、20兆 7,340億円の黒字となる。内
訳を見ると、貿易収支の黒字は、輸出の伸びが輸入の伸びを上回ることにより、4兆 7,200億円に
拡大する。サービス収支は、インバウンド需要が徐々に回復するなかで、赤字幅が 2兆 1,010億円
に縮小する。第一次所得収支は、世界経済の回復を背景に海外から受け取る配当金や投資収益が持
ち直し、19兆 8,540億円の黒字となる。
以 上
資料編▶16.2021年度わが国貿易収支、経常収支の見通し156 157Data Chapter▶16.FY2021 Outlook for Japan's Trade Balance and Current Account
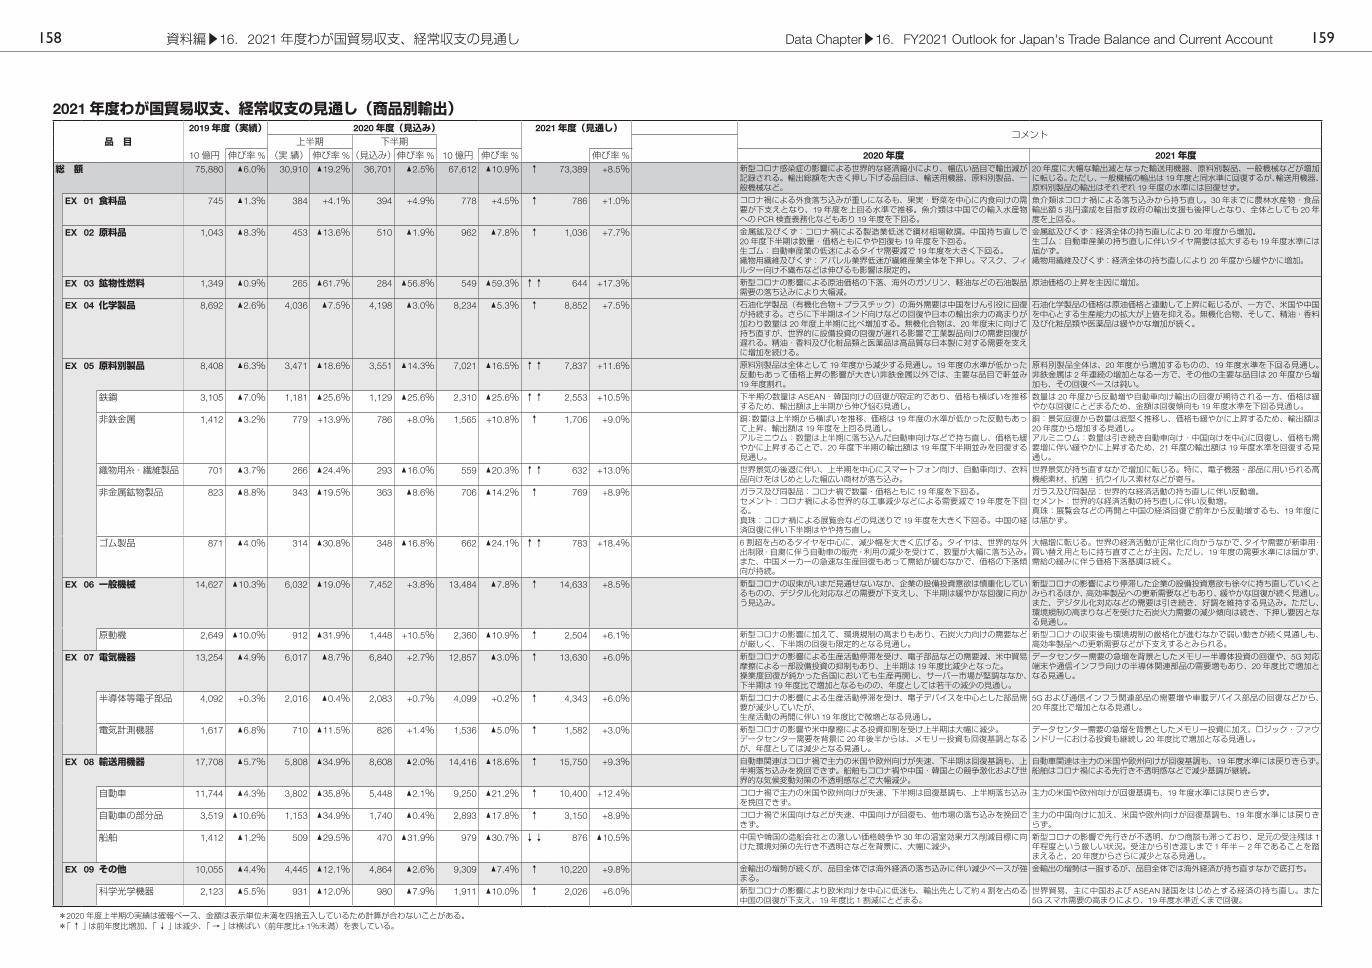
2021年度わが国貿易収支、経常収支の見通し(商品別輸出)
品 目2019年度(実績) 2020年度(見込み) 2021年度(見通し)
コメント 上半期 下半期
10億円 伸び率% (実 績) 伸び率%(見込み)伸び率% 10億円 伸び率% 伸び率% 2020年度 2021年度総 額 75,880 ▲6.0% 30,910 ▲19.2% 36,701 ▲2.5% 67,612 ▲10.9% ↑ 73,389 +8.5% 新型コロナ感染症の影響による世界的な経済縮小により、幅広い品目で輸出減が
記録される。輸出総額を大きく押し下げる品目は、輸送用機器、原料別製品、一般機械など。
20年度に大幅な輸出減となった輸送用機器、原料別製品、一般機械などが増加に転じる。ただし、 一般機械の輸出は 19年度と同水準に回復するが、輸送用機器、原料別製品の輸出はそれぞれ 19年度の水準には回復せず。
EX 01 食料品 745 ▲1.3% 384 +4.1% 394 +4.9% 778 +4.5% ↑ 786 +1.0% コロナ禍による外食落ち込みが重しになるも、果実・野菜を中心に内食向けの需要が下支えとなり、19年度を上回る水準で推移。魚介類は中国での輸入水産物への PCR検査義務化などもあり 19年度を下回る。
魚介類はコロナ禍による落ち込みから持ち直し。30年までに農林水産物・食品輸出額 5兆円達成を目指す政府の輸出支援も後押しとなり、全体としても 20年度を上回る。
EX 02 原料品 1,043 ▲8.3% 453 ▲13.6% 510 ▲1.9% 962 ▲7.8% ↑ 1,036 +7.7% 金属鉱及びくず:コロナ禍による製造業低迷で鋼材相場軟調。中国持ち直しで20年度下半期は数量・価格ともにやや回復も 19年度を下回る。生ゴム:自動車産業の低迷によるタイヤ需要減で 19年度を大きく下回る。織物用繊維及びくず:アパレル業界低迷が繊維産業全体を下押し。マスク、フィルター向け不織布などは伸びるも影響は限定的。
金属鉱及びくず:経済全体の持ち直しにより 20年度から増加。生ゴム:自動車産業の持ち直しに伴いタイヤ需要は拡大するも 19年度水準には届かず。織物用繊維及びくず:経済全体の持ち直しにより 20年度から緩やかに増加。
EX 03 鉱物性燃料 1,349 ▲0.9% 265 ▲61.7% 284 ▲56.8% 549 ▲59.3% ↑↑ 644 +17.3% 新型コロナの影響による原油価格の下落、海外のガソリン、軽油などの石油製品需要の落ち込みにより大幅減。
原油価格の上昇を主因に増加。
EX 04 化学製品 8,692 ▲2.6% 4,036 ▲7.5% 4,198 ▲3.0% 8,234 ▲5.3% ↑ 8,852 +7.5% 石油化学製品(有機化合物+プラスチック)の海外需要は中国をけん引役に回復が持続する。さらに下半期はインド向けなどの回復や日本の輸出余力の高まりが加わり数量は 20年度上半期に比べ増加する。無機化合物は、20年度末に向けて持ち直すが、世界的に設備投資の回復が遅れる影響で工業製品向けの需要回復が遅れる。精油・香料及び化粧品類と医薬品は高品質な日本製に対する需要を支えに増加を続ける。
石油化学製品の価格は原油価格と連動して上昇に転じるが、一方で、米国や中国を中心とする生産能力の拡大が上値を抑える。無機化合物、そして、精油・香料及び化粧品類や医薬品は緩やかな増加が続く。
EX 05 原料別製品 8,408 ▲6.3% 3,471 ▲18.6% 3,551 ▲14.3% 7,021 ▲16.5% ↑↑ 7,837 +11.6% 原料別製品は全体として 19年度から減少する見通し。19年度の水準が低かった反動もあって価格上昇の影響が大きい非鉄金属以外では、主要な品目で軒並み19年度割れ。
原料別製品全体は、20年度から増加するものの、19年度水準を下回る見通し。非鉄金属は 2年連続の増加となる一方で、その他の主要な品目は 20年度から増加も、その回復ペースは鈍い。
鉄鋼 3,105 ▲7.0% 1,181 ▲25.6% 1,129 ▲25.6% 2,310 ▲25.6% ↑↑ 2,553 +10.5% 下半期の数量は ASEAN・韓国向けの回復が限定的であり、価格も横ばいを推移するため、輸出額は上半期から伸び悩む見通し。
数量は 20年度から反動増や自動車向け輸出の回復が期待される一方、価格は緩やかな回復にとどまるため、金額は回復傾向も 19年度水準を下回る見通し。
非鉄金属 1,412 ▲3.2% 779 +13.9% 786 +8.0% 1,565 +10.8% ↑ 1,706 +9.0% 銅:数量は上半期から横ばいを推移、価格は 19年度の水準が低かった反動もあって上昇、輸出額は 19年度を上回る見通し。アルミニウム:数量は上半期に落ち込んだ自動車向けなどで持ち直し、価格も緩やかに上昇することで、20年度下半期の輸出額は 19年度下半期並みを回復する見通し。
銅:景気回復から数量は底堅く推移し、価格も緩やかに上昇するため、輸出額は20年度から増加する見通し。アルミニウム:数量は引き続き自動車向け・中国向けを中心に回復し、価格も需要増に伴い緩やかに上昇するため、21年度の輸出額は 19年度水準を回復する見通し。
織物用糸・繊維製品 701 ▲3.7% 266 ▲24.4% 293 ▲16.0% 559 ▲20.3% ↑↑ 632 +13.0% 世界景気の後退に伴い、上半期を中心にスマートフォン向け、自動車向け、衣料品向けをはじめとした幅広い商材が落ち込み。
世界景気が持ち直すなかで増加に転じる。特に、電子機器・部品に用いられる高機能素材、抗菌・抗ウイルス素材などが寄与。
非金属鉱物製品 823 ▲8.8% 343 ▲19.5% 363 ▲8.6% 706 ▲14.2% ↑ 769 +8.9% ガラス及び同製品:コロナ禍で数量・価格ともに 19年度を下回る。セメント:コロナ禍による世界的な工事減少などによる需要減で 19年度を下回る。真珠:コロナ禍による展覧会などの見送りで 19年度を大きく下回る。中国の経済回復に伴い下半期はやや持ち直し。
ガラス及び同製品:世界的な経済活動の持ち直しに伴い反動増。セメント:世界的な経済活動の持ち直しに伴い反動増。真珠:展覧会などの再開と中国の経済回復で前年から反動増するも、19年度には届かず。
ゴム製品 871 ▲4.0% 314 ▲30.8% 348 ▲16.8% 662 ▲24.1% ↑↑ 783 +18.4% 6割超を占めるタイヤを中心に、減少幅を大きく広げる。タイヤは、世界的な外出制限・自粛に伴う自動車の販売・利用の減少を受けて、数量が大幅に落ち込み。また、中国メーカーの急速な生産回復もあって需給が緩むなかで、価格の下落傾向が持続。
大幅増に転じる。世界の経済活動が正常化に向かうなかで、タイヤ需要が新車用・買い替え用ともに持ち直すことが主因。ただし、19年度の需要水準には届かず、需給の緩みに伴う価格下落基調は続く。
EX 06 一般機械 14,627 ▲10.3% 6,032 ▲19.0% 7,452 +3.8% 13,484 ▲7.8% ↑ 14,633 +8.5% 新型コロナの収束がいまだ見通せないなか、企業の設備投資意欲は慎重化しているものの、デジタル化対応などの需要が下支えし、下半期は緩やかな回復に向かう見込み。
新型コロナの影響により停滞した企業の設備投資意欲も徐々に持ち直していくとみられるほか、高効率製品への更新需要などもあり、緩やかな回復が続く見通し。また、デジタル化対応などの需要は引き続き、好調を維持する見込み。ただし、環境規制の高まりなどを受けた石炭火力需要の減少傾向は続き、下押し要因となる見通し。
原動機 2,649 ▲10.0% 912 ▲31.9% 1,448 +10.5% 2,360 ▲10.9% ↑ 2,504 +6.1% 新型コロナの影響に加えて、環境規制の高まりもあり、石炭火力向けの需要などが厳しく、下半期の回復も限定的となる見通し。
新型コロナの収束後も環境規制の厳格化が進むなかで弱い動きが続く見通しも、高効率製品への更新需要などが下支えするとみられる。
EX 07 電気機器 13,254 ▲4.9% 6,017 ▲8.7% 6,840 +2.7% 12,857 ▲3.0% ↑ 13,630 +6.0% 新型コロナの影響による生産活動停滞を受け、電子部品などの需要減、米中貿易摩擦による一部設備投資の抑制もあり、上半期は 19年度比減少となった。操業度回復が鈍かった各国においても生産再開し、サーバー市場が堅調ななか、下半期は 19年度比で増加となるものの、年度としては若干の減少の見通し。
データセンター需要の急増を背景としたメモリー半導体投資の回復や、5G対応端末や通信インフラ向けの半導体関連部品の需要増もあり、20年度比で増加となる見通し。
半導体等電子部品 4,092 +0.3% 2,016 ▲0.4% 2,083 +0.7% 4,099 +0.2% ↑ 4,343 +6.0% 新型コロナの影響による生産活動停滞を受け、電子デバイスを中心とした部品需要が減少していたが、生産活動の再開に伴い 19年度比で微増となる見通し。
5Gおよび通信インフラ関連部品の需要増や車載デバイス部品の回復などから、20年度比で増加となる見通し。
電気計測機器 1,617 ▲6.8% 710 ▲11.5% 826 +1.4% 1,536 ▲5.0% ↑ 1,582 +3.0% 新型コロナの影響や米中摩擦による投資抑制を受け上半期は大幅に減少。データセンター需要を背景に 20年後半からは、メモリー投資も回復基調となるが、年度としては減少となる見通し。
データセンター需要の急増を背景としたメモリー投資に加え、ロジック・ファウンドリーにおける投資も継続し 20年度比で増加となる見通し。
EX 08 輸送用機器 17,708 ▲5.7% 5,808 ▲34.9% 8,608 ▲2.0% 14,416 ▲18.6% ↑ 15,750 +9.3% 自動車関連はコロナ禍で主力の米国や欧州向けが失速、下半期は回復基調も、上半期落ち込みを挽回できず。船舶もコロナ禍や中国・韓国との競争激化および世界的な気候変動対策の不透明感などで大幅減少。
自動車関連は主力の米国や欧州向けが回復基調も、19年度水準には戻りきらず。船舶はコロナ禍による先行き不透明感などで減少基調が継続。
自動車 11,744 ▲4.3% 3,802 ▲35.8% 5,448 ▲2.1% 9,250 ▲21.2% ↑ 10,400 +12.4% コロナ禍で主力の米国や欧州向けが失速、下半期は回復基調も、上半期落ち込みを挽回できず。
主力の米国や欧州向けが回復基調も、19年度水準には戻りきらず。
自動車の部分品 3,519 ▲10.6% 1,153 ▲34.9% 1,740 ▲0.4% 2,893 ▲17.8% ↑ 3,150 +8.9% コロナ禍で米国向けなどが失速、中国向けが回復も、他市場の落ち込みを挽回できず。
主力の中国向けに加え、米国や欧州向けが回復基調も、19年度水準には戻りきらず。
船舶 1,412 ▲1.2% 509 ▲29.5% 470 ▲31.9% 979 ▲30.7% ↓↓ 876 ▲10.5% 中国や韓国の造船会社との激しい価格競争や 30年の温室効果ガス削減目標に向けた環境対策の先行き不透明さなどを背景に、大幅に減少。
新型コロナの影響で先行きが不透明、かつ商談も滞っており、足元の受注残は 1年程度という厳しい状況。受注から引き渡しまで 1年半- 2年であることを踏まえると、20年度からさらに減少となる見通し。
EX 09 その他 10,055 ▲4.4% 4,445 ▲12.1% 4,864 ▲2.6% 9,309 ▲7.4% ↑ 10,220 +9.8% 金輸出の増勢が続くが、品目全体では海外経済の落ち込みに伴い減少ペースが強まる。
金輸出の増勢は一服するが、品目全体では海外経済が持ち直すなかで底打ち。
科学光学機器 2,123 ▲5.5% 931 ▲12.0% 980 ▲7.9% 1,911 ▲10.0% ↑ 2,026 +6.0% 新型コロナの影響により欧米向けを中心に低迷も、輸出先として約 4割を占める中国の回復が下支え、19年度比 1割減にとどまる。
世界貿易、主に中国および ASEAN諸国をはじめとする経済の持ち直し。また5Gスマホ需要の高まりにより、19年度水準近くまで回復。
*2020年度上半期の実績は確報ベース、金額は表示単位未満を四捨五入しているため計算が合わないことがある。*「↑ 」は前年度比増加、「↓ 」は減少、「→ 」は横ばい(前年度比± 1%未満)を表している。
資料編▶16.2021年度わが国貿易収支、経常収支の見通し158 159Data Chapter▶16.FY2021 Outlook for Japan's Trade Balance and Current Account

2021年度わが国貿易収支、経常収支の見通し(商品別輸入)
品 目2019年度(実績) 2020年度(見込み) 2021年度(見通し)
コメント 上半期 下半期
10億円 伸び率% (実 績) 伸び率%(見込み)伸び率% 10億円 伸び率% 伸び率% 2020年度 2021年度総 額 77,171 ▲ 6.3% 32,017 ▲ 18.1% 34,076 ▲ 10.5% 66,092 ▲ 14.4% ↑ 70,403 +6.5% 新型コロナ感染症の影響による日本の景気悪化を背景に、多くの品目で輸入減が記録される。輸入総額
を大きく押し下げる品目は、鉱物性燃料、輸送用機器、電気機器など。鉱物性燃料、原料別製品、食料品などが、輸入総額を押し上げる。ただし、鉱物性燃料、食料品の輸入はそれぞれ 19年度の水準には回復せず。
IM 01 食料品 7,141 ▲ 1.1% 3,373 ▲ 8.5% 3,274 ▲ 5.2% 6,647 ▲ 6.9% ↑ 6,888 +3.6% コロナ禍による外食需要の落ち込みで、魚介類・肉類は大きく 19年度を下回る。果実・野菜・穀物は比較的堅調だが、おおむね 19年度を下回る見通し。小麦は 19年度の反動で価格は上昇。
外食需要の持ち直しで魚介類・肉類を中心に 20年度を上回る。とうもろこし、小麦は 20年度からの相場持ち直しで価格が上昇。
魚介類 1,552 ▲ 7.1% 661 ▲ 17.5% 678 ▲ 9.6% 1,339 ▲ 13.7% ↑ 1,414 +5.6% コロナ禍で外食向けが落ち込む。さけ・ますは内食向けの伸びによる一定の下支えが働く一方、まぐろ、えびは内食向けの需要が小さく落ち込み幅が相対的に大きい。外食向けの減少で価格も低下。
外食向けの持ち直しで 20年度を上回るも、国内消費の減少傾向もあり 19年度の水準には届かず。
肉類 1,551 +2.0% 734 ▲ 9.3% 707 ▲ 4.8% 1,441 ▲ 7.2% ↑ 1,538 +6.8% コロナ禍で外食向けが落ち込む。内食需要の代替が下支えとなるも全体では 19年度を下回る。価格は外食向けの減少で低下傾向。牛肉は 20年 1月の日米貿易合意成立で豪州・カナダ産から米国産への切り替えが進むが、セーフガード上限で年度内に頭打ちする可能性も。
外食向けの持ち直しなどにより数量・価格ともに 20年度を上回る見通し。
IM 02 原料品 4,900 +0.3% 2,140 ▲ 13.1% 2,454 +0.7% 4,594 ▲ 6.2% ↑ 4,713 +2.6% 原料品全体の金額は 19年度から横ばい。鉄鉱石は、数量が下半期に段階的に回復、それとともに価格も上昇することで金額が増加する一方、非鉄金属鉱は、数量が弱含む銅鉱の影響もあって、輸入額が減少する見通し。
原料品全体の金額は 20年度から増加する。鉄鉱石は、需要の弱さから数量はほぼ横ばい、価格は緩やかに低下するため、金額はやや減少する一方、非鉄金属鉱は、数量の増加と価格の緩やかな上昇が想定される銅鉱の影響もあって増加する見通し。
鉄鉱石 1,231 +19.2% 434 ▲ 27.4% 679 +7.4% 1,113 ▲ 9.5% ↓ 1,045 ▲ 6.1% 下半期の数量は自動車向けなど需要が段階的に回復し、足元までの価格の上昇を踏まえると、金額は前年同期を上回る見通し。
自動車向け以外の需要の弱さもあって数量はほぼ横ばいを推移し、価格も 20年度から緩やかに低下するため、金額は 20年度を下回る見通し。
非鉄金属鉱 1,383 ▲ 6.1% 686 ▲ 1.6% 630 ▲ 8.1% 1,316 ▲ 4.8% ↑↑ 1,469 +11.6% 銅鉱の数量は国内製錬所の定期修理の影響もあって弱含み、価格は上半期からのほぼ横ばいとなることを踏まえると、非鉄金属鉱の輸入額は 19年度を下回る見通し。
銅鉱の数量は定期修理の影響があるものの 20年度から増加。価格も緩やかに上昇することを踏まえると、非鉄金属鉱の輸入額は 20年度から増加する見通し。
IM 03 鉱物性燃料 16,566 ▲ 13.2% 4,532 ▲ 45.1% 5,286 ▲ 36.4% 9,817 ▲ 40.7% ↑↑ 11,485 +17.0% 原油価格の下落や新型コロナの影響による需要低迷により大幅に減少。 原油や石炭の価格上昇を主因におおむね増加に転じる。
原油及び粗油 7,980 ▲ 8.5% 1,669 ▲ 59.0% 2,246 ▲ 42.6% 3,916 ▲ 50.9% ↑↑ 4,946 +26.3% 新型コロナの影響で原油価格下落。経済活動の停滞による需要減少により数量も減少。 原油価格上昇を主因に増加。新型コロナの影響で停滞した経済活動が回復に向かい、数量も増加に転じる見通し。
石油製品 1,571 ▲ 19.4% 493 ▲ 31.9% 689 ▲ 18.7% 1,182 ▲ 24.8% ↑↑ 1,416 +19.8% 原油価格の下落による価格下落を主因に減少。数量は、国内外の石油製品需要減を受け国内製油所は稼働率を落としており、不足した製品の輸入が増加。
原油価格の上昇に伴い価格が上昇。
LNG 4,096 ▲ 15.8% 1,391 ▲ 28.3% 1,361 ▲ 36.9% 2,752 ▲ 32.8% ↑ 3,000 +9.0% LNGはデリバリーされる 3ヵ月前の原油価格にリンクしていることが多く、原油価格の下落に伴い価格が低下。
原油価格の上昇に伴い価格が上昇。数量については、原子力発電の再稼働状況の不透明性や石炭火力発電への逆風は LNG輸入量の増加要因となり得る一方、拡大速度が不透明ながらも再生エネルギーの普及も想定されるため、19年度と比較し LNG輸入量は大きく変動しないと想定。
LPG 526 ▲ 19.7% 175 ▲ 30.8% 272 ▲ 0.5% 446 ▲ 15.1% ↓ 435 ▲ 2.7% 新型コロナの影響により需要が低迷し数量減少。原油価格の下落により価格も低下。 景気回復による工業用の需要増や、在宅勤務の浸透などによる家庭用需要の堅調な推移が見込まれるが、外食産業や自動車用需要はコロナ禍以前の状況への回復が見込めず、数量はほぼ横ばい。価格はやや下落する見通し。
石炭 2,363 ▲ 16.8% 796 ▲ 36.6% 707 ▲ 36.3% 1,502 ▲ 36.4% ↑↑ 1,665 +10.8% 原料炭、一般炭ともに価格・数量の両面で減少幅を大きく広げる。国際市況の悪化に加え、世界的な自動車市場の縮小などに伴う鉄鋼生産の落ち込み、産業用電力需要の減退といった国内事情が下押し。
原料炭、一般炭ともに増加に転じる。価格は、世界需要の持ち直しに伴い緩やかに上昇。数量も、自動車向けを中心とした鉄鋼生産の持ち直し、国内での電力需要の復調を受けて底打ち。
IM 04 化学製品 8,064 ▲ 5.4% 3,938 ▲ 3.4% 3,957 ▲ 0.7% 7,895 ▲ 2.1% ↑ 8,092 +2.5% 石油化学製品:すでに国内需要は回復に転じたが、一部有機化合物の輸入増加の剥落などあり下半期の減少率は上半期とさほど変わらない。医薬品:高齢化に伴う国内需要の伸びに加えて、高い薬効を求める特定の医薬品や医療費抑制を目的とする安価な医薬品に対する選好を背景に、緩やかな増加が続く。
国内景気の回復に伴い数量を中心に緩やかな増加が続く。
IM 05 原料別製品 6,906 ▲ 7.4% 3,322 ▲ 6.9% 3,469 +3.9% 6,790 ▲ 1.7% ↑↑ 7,820 +15.2% 不織布マスクなど衛生用品を中心に織物用糸及び繊維製品が急増、非鉄金属も底堅く推移した一方、鉄鋼や非金属鉱物製品が大幅減になる。
需要回復に後押しされる非鉄金属や鉄鋼の一方、繊維物糸及び繊維製品が落ち着きを見せる。
鉄鋼 893 ▲ 13.4% 338 ▲ 27.9% 309 ▲ 27.3% 647 ▲ 27.6% ↑↑ 714 +10.4% 下半期の数量は中国からの輸入が微増も全体としては横ばい、価格も需要の弱さを反映してほぼ横ばいで推移するため、輸入額は上半期よりも弱含む見通し。
数量では製造・建設・インフラなどで内需が持ち直す一方で、価格は緩やかな回復にとどまるため、輸入額は 20年度から増加するものの、19年度を下回る見通し。
非鉄金属 1,769 ▲ 9.5% 798 ▲ 8.4% 1,000 +11.3% 1,798 +1.6% ↑↑ 2,534 +41.0% アルミニウム:下半期の数量は自動車向けの需要が増加する一方で建材が振るわないため緩やかに持ち直し、価格も緩やかに回復するため、輸入額は 19年度下半期をやや下回る見通し。白金:数量は宝飾品需要が弱含むなか、自動車向け需要が緩やかに回復、価格は上昇傾向が続くため、下半期の輸入額は 19年度下半期を上回る見通し。
アルミニウム:緩やかな景気回復とともに、国内需要や中国向け需要が回復し、価格も上昇傾向を保つため、19年度の輸入額を上回る見通し。白金:数量は自動車向けを中心に 19年度をやや上回る水準まで回復、価格も底堅く推移するので、輸入額は増加する見通し。
織物用糸・繊維製品 926 ▲ 5.2% 762 +59.9% 525 +16.5% 1,286 +38.9% ↓↓ 946 ▲ 26.5% 不織布マスクの数量急増・価格高騰を主因に大幅増。マスク以外でも、衛生用品向けやテント向けの資材、半導体製造用の研磨材などの輸入が増加。
マスク需給の安定化を主因に減少に転じる。衣料品の在庫調整、電気機器・インテリアなどでの巣ごもり需要の一服も、衣料・住居関連品向け資材のほか、研磨材など産業用途品の輸入を下押し。
非金属鉱物製品 666 ▲ 10.0% 277 ▲ 22.3% 304 ▲ 1.8% 581 ▲ 12.8% ↑ 625 +7.6% ガラス及び同製品:上半期は 19年度からほぼ横ばいの動きであり、下半期も 19年度並みの水準となる見通し。ダイヤモンド:下半期の数量は上半期から持ち直すものの、景気減速に伴う雇用・所得環境の悪化もあって前年同期の水準を下回り、価格は需要が弱含むこともあってほぼ横ばいの動きになる見通し。
ガラス及び同製品:景気とともに持ち直すものの、19年度水準には回復せず、価格もほぼ横ばいの見通し。ダイヤモンド:数量は 20年度からやや持ち直すものの、経済水準と同様に 19年度水準を回復せず、価格もほぼ横ばいで推移する見通し。
IM 06 一般機械 7,349 ▲ 7.1% 3,515 ▲ 7.6% 3,443 ▲ 2.9% 6,957 ▲ 5.3% ↓ 6,871 ▲ 1.2% テレワークの急速な広がりに伴い、電算機類の増勢が強まるほか、半導体製造装置も需要が回復。一方、新型コロナの影響で設備投資が抑制され、原動機を中心に大幅に減少。
5Gに関連して半導体製造装置の需要が伸びるほか、景気回復に伴い原動機も緩やかに増加するものの、電算機類がモバイル PCを中心に減少に転じるため、全体としては 20年度から微減となる見通し。
電算機類(含周辺機器)
2,148 +4.6% 1,253 +17.1% 1,229 +14.0% 2,481 +15.5% ↓ 2,263 ▲ 8.8% 19年度から増勢が強まる。テレワークの急速な広がりに伴い、モバイル PC(ノート、タブレット)が大幅増加。その他、キーボードなどの周辺機器、ゲーム用の高性能 PCも好調。
モバイル PCを中心に減少に転じる。巣ごもり生活品目の一つであるゲーム用 PCの増勢も一服。ただし、テレワーク導入の動きが中小企業でも拡大することや、「GIGAスクール」実現に向けて学校への PC供給(主にタブレット)が増加することなどから、急激な落ち込みは回避。
IM 07 電気機器 11,760 ▲ 4.7% 5,278 ▲ 9.2% 5,729 ▲ 3.7% 11,007 ▲ 6.4% ↑ 11,234 +2.1% 新型コロナに伴うテレワーク増を受け、半導体関連・ネットワーク関連通信機器などが増加したが、上半期の携帯電話の販売不振や低価格スマホやタブレット需要増に伴う半導体の価格下落により、電気機器全体の輸入額は減少となる見通し。
通信機は、新型コロナの収束に伴う携帯電話販売の回復と 5G案件の増加によるネットワーク関連機器の増加により、20年度を上回る見通し。また、半導体関連部品は中小企業の設備投資および家計向け需要による下支えで微増となり、電気機器全体としては微増となる見通し。
半導体等電子部品 2,579 ▲ 7.3% 1,230 ▲ 5.0% 1,253 ▲ 2.4% 2,483 ▲ 3.7% ↑ 2,517 +1.3% 経済の不透明感が重しとなるもコロナ禍を受けたテレワーク増加の押し上げなどにより数量は 19年度を上回る。市場全体の供給過剰や低価格のスマホ、タブレット需要の増加で価格は 19年度を下回る。
大企業ではコロナ禍による需要急増の反動減が起きるも、中小企業の設備投資や家庭向け需要が下支えし、数量は微増。世界経済の持ち直しに伴い需給バランスは徐々にタイト化するも、低価格のスマホ、タブレット需要は継続し価格は横ばい。
通信機 2,782 ▲ 8.5% 1,199 ▲ 5.4% 1,438 ▲ 5.0% 2,637 ▲ 5.2% ↑ 2,888 +9.5% 通信機の大半を占める携帯電話は、新型コロナの影響で販売低調かつ新機種に目玉性もないことから、上半期の遅れを取り戻せず、19年度を割る水準にとどまる見通し。一方、テレワークおよび 5G敷設に向けた基地局などのネットワーク関連機器は大きく進展し、携帯電話の不振分をある程度はカバーすると予想。
携帯電話は更新需要のみにとどまるものの、新型コロナの収束に伴い販売が例年並みまで持ち直す見通し。基地局などネットワーク関連機器については、テレワーク需要は落ち着くものの、引き続き 5G関連の設備投資が堅調に推移することが予想されるため、通信機器全体では 20年度を上回る見通し。
IM 08 輸送用機器 3,485 ▲ 0.7% 1,134 ▲ 37.4% 1,435 ▲ 14.2% 2,569 ▲ 26.3% ↑ 2,769 +7.8% 新型コロナの影響により、自動車輸入は主要輸入元である欧州での生産が低迷。部分品輸入も米国、アジアを中心に減少し、航空機類は完成品の受け取り延期もあり半減。下半期は回復基調に転じるも上半期減分は取り戻せず。
景気の回復を背景に自動車および自動車部分品などがけん引するが、19年度水準には戻らず。
自動車 1,417 +2.2% 505 ▲ 30.9% 645 ▲ 6.0% 1,150 ▲ 18.8% ↑↑ 1,273 +10.7% 新型コロナ影響により主要輸入元である欧州での生産低迷の影響が大きく 20年度上半期は大幅な減速。20年度下半期は回復基調も上半期減分は取り戻せず。
欧州の生産正常化を背景に金額・数量ともに回復を見込むも 19年度水準には戻らず。
航空機類 858 +5.5% 194 ▲ 56.0% 264 ▲ 36.7% 458 ▲ 46.6% ↑↑ 562 +22.7% 航空機類は 3- 5年の受注生産ながら、完成品の受け取り延期により下半期は民間の完成品航空機輸入はほぼなくなる見通し。一方、民間の設備更新に伴う部品調達の継続および政府調達の下半期への集中により、下半期の輸入は上半期を上回ると予想。
新型コロナの収束と航空需要の回復とともに、民間航空会社による航空機の完成品・部品調達が持ち直すも、19年度水準には及ばない見通し。
IM 09 その他 11,001 ▲ 3.4% 4,786 ▲ 14.7% 5,030 ▲ 6.7% 9,816 ▲ 10.8% ↑ 10,531 +7.3% 雑製品除く衣類及び同附属品:コロナ禍による落ち込みは下げ止まったが、家具などの巣ごもり需要の恩恵を受ける品目と、バッグ類などの回復が遅れる恐れがある品目が入り交じる。また、精密機器類では、設備投資の見合わせにより計測機器類の回復が遅れる。特殊取扱品:下半期は上半期の金の輸入急増の影響が剥落する。また、国内景気低迷の影響で再輸入品の輸入は 19年度を下回る。
衣料・同附属品は引き続き減少を続けるものの、国内景気の回復に伴い全体としては持ち直し。ただし、その水準は 19年度には及ばない見通し。
衣類・同付属品 3,122 ▲ 6.2% 1,319 ▲ 18.4% 1,302 ▲ 13.6% 2,621 ▲ 16.1% ↓ 2,451 ▲ 6.5% 2桁減に落ち込む。4- 5月の緊急事態宣言下での店舗の閉鎖・営業短縮のほか、外出機会減少・消費者マインドの冷え込みに伴う需要の減退が、輸入を下押し。
引き続き減少。テレワークなど新たな生活様式の定着が、フォーマルウエアや紳士服などの需要を引き続き抑制。加えて、供給サイドの在庫調整も輸入回復の重しに。
製品輸入 48,565 ▲ 5.0% 21,972 ▲ 11.0% 23,062 ▲ 3.4% 45,035 ▲ 7.3% ↑ 47,317 +5.1% 製品輸入比率 68.1%(19年度比+ 5.2ポイント) 製品輸入比率 67.2%(20年度比▲ 0.9ポイント)
* 2020年度上半期の実績は 9桁速報ベース、金額は表示単位未満を四捨五入しているため計算が合わないことがある。* 「↑ 」は前年度比増加、「↓ 」は減少、「→ 」は横ばい(前年度比± 1%未満)を表している。
資料編▶16.2021年度わが国貿易収支、経常収支の見通し160 161Data Chapter▶16.FY2021 Outlook for Japan's Trade Balance and Current Account

FY2021 Outlook for Japan's Trade Balance and Current Account
Overview1. Outlook for Trade by Commodity (Customs-cleared Basis)● FY2020: Exports and imports will greatly decrease due to the global economic slowdown
caused by COVID-19
Total exports are forecast to decrease by 10.9% to 67.6 trillion yen from FY2019. This consists of a 10.0% decline in export volume, and a 1.0% decline in export value. Export volume will decline in a wide range of commodities due to the global impact of the COVID-19 crisis on both supply and demand. Total imports are forecast to decrease by 14.4% to 66.1 trillion yen from FY2019. This consists of a 6.6% decline in import volume, and an 8.3% decline in import value. Declining imports of Mineral Fuels will suppress total imports due to the falling market for resources and materials. As a result, the trade balance will achieve a surplus of 1.5 trillion yen, which is the first surplus in three years.
● FY2021: Exports and imports will recover but not to the level before the COVID-19 crisis
Total exports are forecast to increase by 8.5% over FY2020 to 73.4 trillion yen. This consists of a 7.0% increase in export volume, and a 1.5% increase in export value. Exports of Transport Equipment, Machinery, and Manufactured Goods, etc., will increase once again. Total imports are forecast to increase by 6.5% over FY2020 to 70.4 trillion yen. This consists of a 3.2% increase in import volume, and a 3.2% increase in import value. Imports of Mineral Fuel will increase by almost 20% over FY2020 due to rising prices for crude oil and coal. As a result, both imports and exports will recover compared to FY2020, but not to the levels seen before the COVID-19 crisis. The trade balance will achieve a surplus of 3.0 trillion yen, which is a surplus for the second consecutive year.
2. Outlook for the Current Account● FY2020: Current account surplus will decrease due to a decline in consumption by foreign
visitors to Japan and decline in interest and dividends received from overseas
The current account surplus is forecast to decrease to 16.5 trillion yen. Due to the great decline in consumption by foreign visitors to Japan (so-called "inbound consumption"), the services balance deficit will increase from 478 billion yen in FY2019 to 3.5 trillion yen. The surplus in the primary income balance including dividends and investment income received from overseas will also decline from 21.4 trillion yen in FY2019 to 18.9 trillion yen.
● FY2021: The current account surplus will recover to the same level as FY2019
The current account surplus is forecast to expand to 20.7 trillion yen, which is the same level as in FY2019. Assuming that the Tokyo Olympics/Paralympics is held with measures for preventing the spread of COVID-19, the services balance deficit including inbound consumption will decrease to 2.1 trillion yen. The surplus in the primary income balance will increase to 19.9 trillion yen due to global economic recovery.
Summary Data
[Customs-cleared Trade]FY2019Results
FY2020Forecast
FY2021Forecast
(Billions of Yen)
Year-on-year change(rate)
(Billions of Yen)
Year-on-year change(rate)
(Billions of Yen)
Year-on-year change(rate)
Trade Balance ▲ 1,291 +319 1,519 +2,810 2,986 +1,467
Exports 75,880 (-6.0%) 67,612 (-10.9%) 73,389 (8.5%)Quantum Index -4.4% -10.0% 7.0%
Unit Value -1.6% -1.0% 1.5%
Imports 77,171 (-6.3%) 66,092 (-14.4%) 70,403 (6.5%)Quantum Index -2.3% -6.6% 3.2%
Unit Value -3.8% -8.3% 3.2%
[Current Account Balance]FY2019Results
FY2020Forecast
FY2021Forecast
(Billions of Yen)
Year-on-year change(rate)
(Billions of Yen)
Year-on-year change(rate)
(Billions of Yen)
Year-on-year change(rate)
Goods & Services 189 +489 ▲ 308 -497 2,619 +2,927
Goods 667 +32 3,163 +2,497 4,720 +1,557
Exports 74,943 (-6.7%) 66,777 (-10.9%) 72,482 (8.5%) Imports 74,277 (-6.8%) 63,613 (-14.4%) 67,762 (6.5%)
Services ▲ 478 +457 ▲ 3,471 -2,994 ▲ 2,101 +1,371
Primary Income 21,421 -212 18,914 -2,507 19,854 +940
Secondary Income ▲ 1,469 +272 ▲ 2,090 -621 ▲ 1,740 +350
Current Account 20,141 +549 16,516 -3,625 20,734 +4,218
Note: Due to rounding some amounts may not add up precisely to the totals provided.
[Preconditions]
2019 2020 2021
Global Trade (CY) 0.2% ▲ 7.9% 7.6%
Global Economy (Real growth rate/CY) 2.8% ▲ 4.4% 5.1%
USA 2.2% ▲ 4.6% 3.3%
Euro zone 1.3% ▲ 8.7% 5.3%
Emerging and Developing Asia 5.5% ▲ 1.3% 7.7%
Japanese Economy (Real growth rate/FY) 0.0% ▲ 6.2% 3.4%
Notes : 1. Emerging and Developing Asia is defined by the IMF. 2. In addition to the above preconditions, based on the foreign currency exchange market and crude oil
market trends in mid-November, calculations were performed using a yen/dollar exchange rate of 106 yen/dollar for FY2020, 106 yen/dollar for FY2021, and a CIF crude oil price of 41 dollars/barrel for FY2020 and 50 dollars/barrel for FY2021.
資料編▶16.2021年度わが国貿易収支、経常収支の見通し162 163Data Chapter▶16.FY2021 Outlook for Japan's Trade Balance and Current Account
日本貿易会は、わが国の貿易関連民間中枢機関として広く一般企業団体等を会員に1947年に設立されました。その後、わが国の貿易および貿易業界の一層の健全な発展を図るため、1986年に貿易業界としての団体に改組しました。さらに、2012年4月には社団法人から一般社団法人に移行し、活動を展開しております。 本会の会員には、①商社・貿易関係団体によって構成する正会員、②製造業、金融業、海運業などの貿易関係企業・団体で構成する賛助会員、があります。 本会は、① 政策提言(貿易業界が直面する諸問題に対して、政府関係当局等に建議・要望)② 政府等との意見交換(意見交換を通じて貿易業界をめぐる問題の共通認識を醸成)③ 対外経済交流の推進(在日外国公館との交流、国公賓来日時の接遇)④ 広報活動(わが国貿易・貿易業界の動向を広報、海外における対日理解増進)⑤ 情報収集・調査研究活動(活動の成果を刊行物等として発表)⑥ 情報サービス活動(経済・貿易上の主要問題について講演会、セミナーを開催)⑦ 国際社会貢献活動(NPO法人国際社会貢献センターを設立し、国内外での社会貢献活動を支援)
を主要分野として活動しております。本書も、「④広報活動、⑤情報収集・調査研究活動」のひとつの成果物として刊行しているものです。
法人正会員(41)
伊藤忠商事㈱ 住友商事㈱ ㈱野澤組伊藤忠丸紅鉄鋼㈱ 西華産業㈱ 野村貿易㈱稲畑産業㈱ 全日空商事㈱ 阪和興業㈱岩谷産業㈱ 双日㈱ ㈱日立ハイテク岡谷鋼機㈱ 茶谷産業㈱ ㈱ホンダトレーディング兼松㈱ 蝶理㈱ 丸紅㈱極東貿易㈱ 帝人フロンティア㈱ 三井物産㈱興和㈱ 東京貿易ホールディングス㈱ 三菱商事㈱CBC㈱ 東商アソシエート㈱ 明和産業㈱㈱JALUX 東邦物産㈱ ㈱メタルワンJFE商事㈱ 豊田通商㈱ 森村商事㈱神栄㈱ 長瀬産業㈱ 八木通商㈱神鋼商事㈱ 長田通商㈱ ユアサ商事㈱㈱スマイル 日鉄物産㈱
団体正会員(20)
(一社)大阪貿易協会 日本工作機械輸入協会 日本バナナ輸入組合京都貿易協会 日本自動車輸入組合 日本輸入化粧品協会(一社)神戸貿易協会 日本繊維輸出組合 日本洋酒輸入協会(一社)全国中小貿易業連盟 日本繊維輸入組合 日本羊腸輸入組合(一社)日本化学品輸出入協会 日本船舶輸出組合 (公社)福岡貿易会日本紙類輸入組合 日本鉄道システム輸出組合 (公社)横浜貿易協会日本機械輸出組合 (一社)日本時計輸入協会
2021年3月31日現在(機関名五十音順)
Japan Foreign Trade Council, Inc. (JFTC) was founded in June 1947 as a core private-sector organization in the area of international trade with nationwide membership of private companies and organizations. Following the dramatic changes in Japan’s economic and trade environments which began in the 1970s, JFTC was reorganized in June 1986 to take the form of a trade-industry association with trading companies and trading organizations as its core members. The membership of JFTC is composed of regular members represented by trading companies and trading organizations, and associate members consisting of manufacturers, financial institutions, shipping companies and other companies and organizations with interest in international trade.JFTC’s activities are as follows:1.Policy Proposals Working to improve and develop the international trade environment by submitting specific policy proposals and requests to government authorities concerning problems facing the international trade industry.
2.Exchange of Views with Government and Other Organizations Endeavoring to develop a common awareness of problems facing the international trade industry through the exchange of views with economics-related ministers and government authorities on all levels.
3.Promotion of International Economic Exchange Promoting international economic exchange and mutual understanding through interaction with foreign embassies, consulates, and government offices in Japan and hosting of state and official guests from abroad.
4.Public Relations Activities Undertaking a broad range of public relations activities with the aim of presenting an accurate picture of Japan's international trade and international trade industry, and to promote a better understanding of Japan in foreign countries.
5.Information Gathering and Research Activities Gathering information and undertakes research activities for the benefit of its members and to compile basic reference materials for its own activities. The research results are made available in periodic publications.
6.Information Service Activities Providing timely information services pertaining to important economic and trade problems by organizing lectures and seminars.
7.Contributing to International Society Contributing to domestic and international social services through setting up an NPO “Action for Better International Community (ABIC)” by utilizing the know-how and intellectual properties developed over many years by its member trading companies and embodied in their wealth of human resources.
Regular Member Companies (41)
ALL NIPPON AIRWAYS TRADING CO., LTD. KYOKUTO BOEKI KAISHA, LTD. SHINSHO CORPORATIONCBC CO., LTD. MARUBENI CORPORATION SHINYEI KAISHACHORI CO., LTD. MARUBENI-ITOCHU STEEL INC. SMILE CORP.D. NAGATA CO., LTD. MEIWA CORPORATION SOJITZ CORPORATIONHANWA CO., LTD. METAL ONE CORPORATION SUMITOMO CORPORATIONHITACHI HIGH-TECH CORPORATION MITSUBISHI CORPORATION T. CHATANI & CO., LTD.HONDA TRADING CORPORATION MITSUI & CO., LTD. TEIJIN FRONTIER CO., LTD.INABATA & CO., LTD. MORIMURA BROS., INC. TOHO BUSSAN KAISHA, LTD.ITOCHU CORPORATION NAGASE & CO., LTD. TOKYO BOEKI HOLDINGS CORPORATIONIWATANI CORPORATION NIPPON STEEL TRADING CORPORATION TOSHO ASSOCIATE CORPORATIONJALUX Inc. NOMURA TRADING CO., LTD. TOYOTA TSUSHO CORPORATIONJFE SHOJI TRADE CORPORATION NOSAWA & CO., LTD. YAGI TSUSHO LIMITEDKANEMATSU CORPORATION OKAYA & CO., LTD. YUASA TRADING CO., LTD.KOWA COMPANY, LTD. SEIKA CORPORATION
Associations (20)
COSMETIC IMPORTERS ASSOCIATION OF JAPAN JAPAN SHEEP CASING IMPORTERS ASSOCIATIONFUKUOKA FOREIGN TRADE ASSOCIATION JAPAN SHIP EXPORTERS’ ASSOCIATIONJAPAN AUTOMOBILE IMPORTERS ASSOCIATION JAPAN TEXTILES EXPORTERS ASSOCIATIONTHE JAPAN BANANA IMPORTERS ASSOCIATION THE JAPAN TEXTILES IMPORTERS ASSOCIATIONJAPAN CHEMICAL EXPORTERS AND IMPORTERS ASSOCIATION JAPAN WATCH IMPORTERS’ ASSOCIATIONJAPAN FOREIGN TRADERS ASSOCIATION, INC. JAPAN WINES AND SPIRITS IMPORTERS’ ASSOCIATIONJAPAN MACHINERY CENTER FOR TRADE AND INVESTMENT KOBE FOREIGN TRADE ASSOCIATIONJAPAN MACHINE TOOL IMPORTERS’ ASSOCIATION KYOTO FOREIGN TRADE ASSOCIATIONJAPAN OVERSEAS RAILWAY SYSTEM ASSOCIATION OSAKA FOREIGN TRADE ASSOCIATIONJAPAN PAPER IMPORTERS’ ASSOCIATION YOKOHAMA FOREIGN TRADE ASSOCIATION
As of March 31, 2021 (Alphabetical order)
© Japan Foreign Trade Council, Inc.Printed in Japan●乱丁本・落丁本はお取り替え致します。●無断で複写・複製することを禁じます。All rights reserved, including the right to reproduce this book or portions thereof in any form whatsoever.
2021年 3月 31日 第1刷発行
発 行 所 一般社団法人 日本貿易会 Japan Foreign Trade Council, Inc. 〒 100-0013 東京都千代田区霞が関三丁目 2番 1号
霞が関コモンゲート西館 20階 Kasumigaseki Common Gate West Tower 20F, 3-2-1,
Kasumigaseki, Chiyoda-ku, Tokyo 100–0013, Japan TEL 03(5860)9365 E-mail [email protected] URL https://www.jftc.or.jp
編集・発行人 政策業務第三グループ長 兼 調査グループ長 山本 大介 Yamamoto Daisuke Group Leader Third Policy Proposal Group Research Group
印 刷 所 株式会社 大應
日本貿易の現状 Foreign Trade 2021