
Foreign Trade-Economic Growth Nexus: Evidence from … trade-economic growth... · 126 Foreign...
21
CBN Journal of Applied Statistics Vol. 5 No.1 (June, 2014) 121 Foreign Trade-Economic Growth Nexus: Evidence from Nigeria Nosakhare L. Arodoye and Milton A. Iyoha 1 This study examines the nexus between foreign trade and economic growth in Nigeria using quarterly time-series data for 1981Q1 through 2010Q4. In order to fully account for feedbacks, a vector autoregressive model is utilized. The results show that there is a stable, long- run relationship between foreign trade and economic growth. The variance decomposition results show that the predominant sources of Nigeria economic growth variation are due largely to “own shocks” and foreign trade innovations. The study therefore recommends adoption of trade expansion policies as a means of accelerating economic growth in Nigeria. Keywords: Foreign Trade, Economic Growth, VAR and Nigeria. JEL Classification: F14, O41 1.0 Introduction Economists have long been interested in identifying factors which cause different countries to grow at different rates over time. One of such factors is foreign trade. In the 19 th century, Alfred Marshall declared that ―The causes which determine the economic progress of nations belong to the study of international trade‖, Marshall (1959). D. H. Robertson (1938) famously described exports as an ―engine‖ of growth while Minford et al. (1995) hailed foreign trade as an ―elixir‖ of growth. This subject has continued to elicit responses from trade and growth theorists. For some recent studies on this issue, see Obiora (2009), Omoke and Ugwuanyi (2010), Iyoha and Adamu (2011), Obadan and Okojie (2010), and Safdari and Delqua-Niri (2012). Foreign or international trade concerns the study of the causes and consequences of the international exchange of goods and services, and of the international movement of factors of production. Although Alfred Marshall had no doubts about the beneficent effects of foreign trade, the foreign trade- economic growth nexus has remained controversial. Economists have found that foreign trade is often favorable to growth and may well be a necessary condition for rapid growth for small countries. 1 Department of Economics and Statistics University of Benin, Benin City, Nigeria. Corresponding author’s email: [email protected] or [email protected]
Transcript of Foreign Trade-Economic Growth Nexus: Evidence from … trade-economic growth... · 126 Foreign...

CBN Journal of Applied Statistics Vol. 5 No.1 (June, 2014) 121
Foreign Trade-Economic Growth Nexus:
Evidence from Nigeria
Nosakhare L. Arodoye and Milton A. Iyoha1
This study examines the nexus between foreign trade and economic growth in Nigeria
using quarterly time-series data for 1981Q1 through 2010Q4. In order to fully
account for feedbacks, a vector autoregressive model is utilized. The results show
that there is a stable, long- run relationship between foreign trade and economic
growth. The variance decomposition results show that the predominant sources of
Nigeria economic growth variation are due largely to “own shocks” and foreign
trade innovations. The study therefore recommends adoption of trade expansion
policies as a means of accelerating economic growth in Nigeria.
Keywords: Foreign Trade, Economic Growth, VAR and Nigeria.
JEL Classification: F14, O41
1.0 Introduction
Economists have long been interested in identifying factors which cause
different countries to grow at different rates over time. One of such factors is
foreign trade. In the 19th
century, Alfred Marshall declared that ―The causes
which determine the economic progress of nations belong to the study of
international trade‖, Marshall (1959). D. H. Robertson (1938) famously
described exports as an ―engine‖ of growth while Minford et al. (1995) hailed
foreign trade as an ―elixir‖ of growth. This subject has continued to elicit
responses from trade and growth theorists. For some recent studies on this
issue, see Obiora (2009), Omoke and Ugwuanyi (2010), Iyoha and Adamu
(2011), Obadan and Okojie (2010), and Safdari and Delqua-Niri (2012).
Foreign or international trade concerns the study of the causes and
consequences of the international exchange of goods and services, and of the
international movement of factors of production. Although Alfred Marshall
had no doubts about the beneficent effects of foreign trade, the foreign trade-
economic growth nexus has remained controversial. Economists have found
that foreign trade is often favorable to growth and may well be a necessary
condition for rapid growth for small countries.
1 Department of Economics and Statistics University of Benin, Benin City, Nigeria.
Corresponding author’s email: [email protected] or [email protected]

122 Foreign Trade-Economic Growth Nexus:
Evidence from Nigeria Arodoye & Iyoha
However, it is not a sufficient condition for economic growth and
development. For sustained economic growth and development to occur, the
gains from trade must be complemented by autonomous productivity
increases in the particular economy, savings and investment must rise, and
economic policy must be favorable to private initiative, capital inflows and the
efficient use of resources. Because of the heterogeneity of country size,
natural resources, differences in the external environment and variations in
domestic policy, it has been difficult to obtain a simple and unambiguous
empirical relationship between foreign trade and economic
growth/development.
In recent years, researchers have started to investigate the trade and growth
nexus by using the powerful technique of vector autoregressions pioneered by
Sims (1986). The VAR technique is attractive because it facilitates the study
of the interrelationship among non-stationary time-series variables, treating all
as endogenous. VARs have also been shown to be powerful for time-series
forecasting, for the analysis of short- and long-run dynamics, inpulse response
functions, and forecast error variance decomposition.
This study will therefore adopt this versatile tool to explicate the complex link
between foreign trade and economic growth for Nigeria. In this study, foreign
trade is captured by using 3 proxies, namely, exports, foreign direct
investment and exchange rate. This is an improvement on many previous
studies which simply used exports to proxy foreign trade. It is expected that
this multivariate approach will produce richer and more robust results which
would be of greater benefit to macroeconomic policymakers in Nigeria, which
is an open and oil-dependent economy.
2.0 Stylized Facts about Foreign Trade and Economic Growth in
Nigeria
Nigeria’s economic performance between Independence in 1960 and 2000
was decidedly unimpressive, with the growth rate of real Gross Domestic
Product (GDP) averaging less than 4 percent per annum. It is estimated that
Nigeria received over $228 billion from oil exports between 1981 and 1999
(Udeh, 2000), and yet the number of Nigerians living in abject poverty—
subsisting on less than $1 a day—more than doubled between 1970 and 2000,
and the proportion of the population living in poverty rose from 36 percent to
70 percent over the same period, Iyoha (2010, p. 165).

CBN Journal of Applied Statistics Vol. 5 No.1 (June, 2014) 123
Although the rate of economic growth has improved since 2000, averaging
about 7 percent per annum between 2000 and 2010, Nigeria may still be
considered as a striking example of what Sachs and Warner (2001) have
labeled the ―natural resource curse‖: the systematic tendency for narrowly
specialized primary commodity exporters to grow more slowly than countries
with more diversified exports.
In Nigeria, proceeds from exports were not effectively channeled to economic
growth as a result of corruption, rent seeking and a pervasive lack of
accountability, particularly under the military dictatorships between 1966 and
1999. Above all, serious mistakes were made in macroeconomic management,
including a Dutch disease–generating syndrome in which policy makers
erroneously treated favorable but transitory oil shocks as permanent, Iyoha
(2010, p. 166). This contributed to an important feature noticeable in the
macroeconomic landscape before the return to civilian rule in 1999, namely,
the ―boom and bust‖ cycles generated by the volatility of world oil export
prices. A typical example was the oil boom in the 1970s caused by the
quadrupling of oil prices by the OPEC countries in November 1973 and the
deep recession consequent on the collapse of oil prices in the early 1980s.
However, since 2003, steps have been taken to ―de-couple‖ aggregate
government spending from oil price volatility (and oil export revenue) by the
establishment of the ―Excess Crude Oil‖ Account and more recently, the
―Sovereign Wealth Fund‖. These will now facilitate the proper conduct of
counter-cyclical macroeconomic policy and permit exports to contribute more
effectively to rapid economic growth in Nigeria.
3.0 Foreign Trade and Economic Growth: Theory and Empirics
As originally proposed in the orthodox theories of trade, the theory of
comparative advantage is static; hence it can be questioned whether trade has
any relevance to the dynamic issue of economic development. A consensus
has subsequently emerged that the classical and neoclassical theories could be
used to address the issue of economic development, utilizing the technique of
comparative statics. Haberler (1988) and others have stressed that the
traditional trade theories confer both static gains (direct benefits) and dynamic
gains (also called indirect benefits) on trading countries.
In this context, static gains refer to the increase in income which arises from
greater efficiency in allocating resources along a fixed and given production

124 Foreign Trade-Economic Growth Nexus:
Evidence from Nigeria Arodoye & Iyoha
possibilities frontier while the ―dynamic benefits‖ of trade refer to the
cumulative increases in income that arise from outward shifts of the
production possibilities frontier brought about by a trade-induced movement
along the original frontier. These dynamic benefits have been dubbed the
―growth effects‖ of trade.
According to Harbeler (1988), there are four vital points regarding the
―dynamic‖ benefits of trade on participating less developed countries (LDCs):
First, trade provides material means (capital goods, machinery
and raw and semi-finished materials) indispensable for
economic development. Secondly, and even more important,
trade is the means and vehicle for the dissemination of
technological knowledge, the transmission of ideas, for the
importation of know-how, skills, managerial talents and
entrepreneurship. Thirdly, trade is also the vehicle for the
international movement of capital especially from the
developed to the underdeveloped countries. Fourthly, free
international trade is the best anti-monopoly policy and the best
guarantee for the maintenance of a healthy degree of free
competition (Haberler, 1988, p. 7).
Ideally, international trade leads to an increase in income, in the level of
investment and in the state of technical knowledge in the country. The
increase in investment and improvements in innovations and technological
progress then lead to increased productivity and competitiveness, and trigger a
further increase in trade and in income. This positive feedback continues and
brings about a ―virtuous circle‖ of increased trade, rising income, and
economic development. Nevertheless, experience has shown that successful
export performance requires a broadly supportive policy environment
including macroeconomic stability, public investment in infrastructure and
human capital, and policies that provide adequate incentives for investment in
the export sector. Above all, these policies should be consistent, transparent
and steadily maintained over a long period of time.
Finch and Michalopoulos have recently provided a valuable insight into the
nature of the link between external trade and development. According to
them, it is not solely, or perhaps even mainly, a demand-driven link, whereby
export growth stimulates incomes and output in the rest of the economy.

CBN Journal of Applied Statistics Vol. 5 No.1 (June, 2014) 125
Rather, effective participation in international trade permits economies of
scale not open to small protected economies. By introducing greater market
competition, trade encourages a more efficient utilization of resources and
greater growth in productivity in the whole economy. Moreover, open trading
policies permit quicker adaptation to new technologies and greater flexibility
in responding to international economic developments. Finch and
Michalopoulos (1988, p.132).
3.1 Foreign Trade and Economic Growth: The Empirical Evidence
Using exports as a proxy for trade and growth in income per capita or GNP as
a measure of development, many researchers over the years have attempted to
test the hypothesis of a significant positive relationship between trade and
growth. Many of the studies have been bivariate, comparing exports and
growth but a few others have been multivariate. Many of the studies have
adopted a cross-country approach while some others have used time series
data to study the relationship for selected countries. Most of the empirical
results reported have supported the proposition that exports do indeed
stimulate growth and development.
Among the important cross-country studies, we may mention those
undertaken by Massell et al. (1972), Voivodas (1973), Michaely (1977),
Balassa (1978), Tyler (1981), Salvatore (1983), and Ram (1985). Using a
sample of 11 Latin American countries, Massell et al. (1972) found that
export earnings had a greater impact on output growth than other sources of
foreign exchange earnings such as public external debt and foreign direct
investment. The Voivodas (1973) study concerned 22 LDCs while Michaely
(1977) used correlation analysis to study 41 countries. Balassa (1978) on his
part used the technique of rank correlation and pooled data for 11 countries
covering 1960-73 to study this question.
All these researchers found a strong relationship between exports and
economic growth. Using data for 55 countries, Tyler (1981) also found strong
evidence in favor of the proposition that exports act as a stimulus to growth.
Since most of these studies used bivariate statistical and single equation
regression techniques, they were naturally subject to the criticism of not
allowing for feedback. Salvatore (1983) took care of this by specifying a
simultaneous equations model of trade and development. He estimated it
using a sample of 52 countries and also undertook dynamic simulations. His
simulations revealed that exports in fact stimulate growth. He however

126 Foreign Trade-Economic Growth Nexus:
Evidence from Nigeria Arodoye & Iyoha
interpreted the results as suggesting that trade is a handmaiden of
development rather than an ―engine‖ of growth. Finally, Ram (1985)
investigated the relationship between exports and growth using a sample of 73
LDCs and data for 1960-1977. He found the coefficient of exports to be
statistically significant -- thus, once more, confirming the findings of the
previous researchers that trade stimulates economic growth.
Among the more important time series studies, the following studies may be
mentioned: Emery (1967), Severn (1968), Krueger (1978), Fajana (1979), and
Ekpo and Egwaikhide (1994). Emery (1967) and Severn (1968) used bivariate
regression analysis to investigate the export-growth nexus and found evidence
in favor of exports acting as a stimulus for economic growth. Krueger (1978)
used a simple log-linear specification to analyze the impact of exports on
growth for each of 10 countries using data for 1954-71. She found GNP to
depend more on export earnings than total foreign exchange availability.
Fajana’s (1979) study and that of Ekpo and Egwaikhide (1994) used Nigerian
data. Like the other studies, they found exports to be a key determinant of
economic growth. Similarly, Iyoha’s (1998) study on Nigeria and Fosu’s
(1990) study on African countries also found evidence for a systematic
relation between foreign trade and economic growth.
Hassan (2007) used Vector Auto-Regression (VAR), Impulse Response
Function (IFR) and Granger-causality test to determine the long-term
relationship between exports and domestic economic growth in Saudi Arabia
from 1970 to 2005, and found that the export sector had a significant effect on
economic growth and a positive influence on other economic activities in the
long run.
Obiora (2009) used VAR models to examine the magnitude and sources of
growth spillovers in Nigeria from key trading partners, as well as from the
country’s exchange rate. The results debunked the ―decoupling theory‖, and
confirmed the existence of significant cross-country spillovers from the US
and other major trading partners to Nigeria.
Omoke and Ugwuanyi (2010) used Granger causality and cointegration tests
to investigate the relationship between export, domestic demand and
economic growth in Nigeria. The results from Trace and Maximum Eigen
Value test conducted showed that the variables do not have long-run
relationship, but the Pair-wise Granger Causality test showed that economic

CBN Journal of Applied Statistics Vol. 5 No.1 (June, 2014) 127
growth Granger causes both export and domestic demand, while a bilateral
causality exists between export and domestic demand.
Mustafa (2011) analyzed the relationship between foreign trade and economic
growth in Turkey using VAR and VECM, and employed quarterly data of
GDP, export and import for 1987 through 2007. He found that, in the short
run, GDP growth did not significantly depend on the export growth.
Rahmaddi and Ichihashi (2011) investigated the relationship between exports
and economic growth in Indonesia during the period 1971-2008, using a VAR
model. Based on the analysis conducted in a VECM framework, the authors
found that exports and economic growth exhibit bi-directional causal
structure, and concluded that both exports and economic growth are
significant to the economy of Indonesia.
Sarbapriya Ray (2011) examined the relationship between foreign trade and
economic growth in India, using annual data over the period 1972 – 2011. The
cointegration and Granger causality tests confirmed that economic growth and
foreign trade are cointegrated, implying the existence of a long-run
equilibrium relationship between the two, and the presence of bi-directional
causality which runs from economic growth to foreign trade and vice versa.
Safdari, Mehrizi and Dehqan-Niri (2012) investigated the long-run
relationship between foreign trade and economic growth in Iran between 1975
and 2008 using a Vector Autoregressive model (VAR) and data for real gross
domestic product, total population, trade volume, gross capital formation and
tariffs. Their results showed that total population, trade volume, gross capital
formation and tariffs have positive effect on economic growth.
Our study builds on the more recent time series study of trade and growth.
Basically, we use (growth in) real GDP as a proxy for economic growth while
we utilize exports, foreign direct investment and the nominal exchange rate as
proxies for foreign trade. In order to properly analyze the interrelationships
among these non-stationary time-series variable, we elected to use the new,
powerful and versatile tool of vector autoregressions.
4.0 Methodology
Like many studies which have recently investigated the relationship between
foreign trade and economic growth, this study utilizes the technique of Vector
Autoregressions (VARs). Use of the VAR technique has become attractive

128 Foreign Trade-Economic Growth Nexus:
Evidence from Nigeria Arodoye & Iyoha
since the Nobel Laureate, Christopher Sims (1986), demonstrated that Vector
Autoregression models are particularly powerful tools for investigating the
inter-relationships among non-stationary time-series variables and for
obtaining reliable forecasts. VARs have indeed made it possible for
researchers to address both the relative importance and the dynamic effects of
various shocks on macroeconomic variables.
This study will carry out Unit roots tests of all variables and Pair-wise
Granger Causality tests. Forecast Variance Decomposition and Impulse
Response Functions are applied to examine dynamic interrelationships
between the variables in the VAR system. This study posits a 4-variable VAR
model in which real gross domestic product, exports, foreign direct investment
and the exchange rate are simultaneously interrelated. In order to obtain more
meaningful insights, logarithmic transformations of the variables were
utilized. Thus, the VAR model specified is:
∑
Vt= (R, XPORT, FDI, EXRT), the vector of real gross domestic product,
exports, foreign direct investment and exchange rate
α = intercepts of autonomous variables
Ai = matrix of coefficients of all the variables in the model.
Vt-1 = vector of the lagged variables.
μt = vector of the stochastic error terms.
4.1 Data Issues
This study employs quarterly time-series data on four key macroeconomic
variables, namely, real gross domestic product (RGDP), exports (XPORT),
foreign direct investment (FDI) and exchange rate (EXRT). Three of the
variables, exports, foreign direct investment and exchange rate, are used as
proxies for foreign trade. Since Nigeria is a small open economy, the
exchange rate is expected to play an important role in the macroeconomy. As
a developing country keen to grow rapidly, Nigeria is bound to need and rely
on foreign direct investment. Finally, as an OPEC country highly dependent
on oil exports, use of total exports (which are strongly dominated by oil
exports) is warranted. The data set used was sourced from various issues of
the Statistical Bulletin of the Central Bank of Nigeria.

CBN Journal of Applied Statistics Vol. 5 No.1 (June, 2014) 129
5.0 Econometric Results
Below we present the descriptive statistics, unit root tests, Johansen co-
integration test, Pairwise Granger Causality Tests, Forecast Error Variance
Decomposition and the Impulse Response Functions. The unit root test
provides information on the stationarity properties of the variables and it was
conducted using the Augmented Dickey- Fuller (ADF) test. The co-integration
test provides information on the existence of a long run relationship between
the dependent and explanatory variables and was performed using the
Johansen methodology. The Granger causality test examines the causal
relationships between the logarithm of real gross domestic product, log of
exports, log of foreign direct investment and log of exchange rate in Nigeria.
To analyze the short-run dynamic properties of the variables, we employ the
forecast error variance decomposition and generalized impulse response
analysis.
5.1 Summary of Descriptive Statistics Results
Table 1: Summary of Descriptive Statistics
Source: Authors’ computation using EViews 7.0
Summary descriptive statistics of the log of real GDP, log of exports, log of
foreign direct investment, and log of exchange rate are reported in Table 1.
Normality test uses the null hypothesis of normality against the alternative
hypothesis of non-normality. If the probability value is less than the Jacque
Bera chi-square at the 5% level of significance, the null hypothesis of the
regression is not rejected. Given the results in Table, it is apparent that the
hypothesis that all the variables are normally distributed cannot be rejected
LRGDP LXPORT LFDI LEXRT
Mean 11.30 11.44 8.80 2.90
Median 11.19 12.16 9.91 3.09
Maximum 12.34 14.91 12.18 5.02
Minimum 10.70 6.98 4.15 -0.60
Std. Dev. 0.44 2.48 2.69 1.90
Skewness 0.64 -0.30 -0.50 -0.54
Kurtosis 2.28 1.66 1.87 1.97
Jarque-Bera 10.67 10.88 11.29 11.15
Probability 0.00 0.00 0.00 0.00
Sum 1356.31 1373.39 1046.92 348.25
Sum Sq. Dev. 23.00 733.13 851.09 428.37
Observations 120 120 119 120

130 Foreign Trade-Economic Growth Nexus:
Evidence from Nigeria Arodoye & Iyoha
since all the probabilities are less than the Jarque Bera chi-square distribution.
They pass the significance test at the 1 percent level.
Table 2: ADF Unit Root Test Results (1st differences)
Source: Authors’ Computation Using E-Views 7.0
Table 3: Johansen Cointegration (Or Johansen VAR Cointegration Approach)
Source: Authors’ calculations using E-Views 7.0
We utilize the mean based coefficient of skewness and kurtosis to check the
normality of all the variables used. Skewness measures the direction and
degree of asymmetry. The Skewness coefficient indicates normal curves for
all the variables with the values ranging between -3 and +3. The positive
VariablesADF Test
Statistics
95% Critical
Value of ADF
Order of
integrationRemarks
dLGDP -3.963 -2.886 I(1) Difference Stationary
dLFDI -6.012 -2.886 I(1) Difference Stationary
dLEXRT -9.1147 -2.886 I(1) Difference Stationary
dLXPORT -11.317 -2.886 I(1) Difference Stationary
Unrestricted Cointegration Rank Test (Trace) Hypothesized Trace 0.05
No. of CE(s) Eigenvalue Statistic Critical Value Prob.** None * 0.338983 100.8058 47.85613 0.0000
At most 1 * 0.206515 56.51043 29.79707 0.0000
At most 2 * 0.170885 31.75915 15.49471 0.0001
At most 3 * 0.103644 11.70768 3.841466 0.0006 Trace test indicates 4 cointegrating eqn(s) at the 0.05 level
* denotes rejection of the hypothesis at the 0.05 level
**MacKinnon-Haug-Michelis (1999) p-values
Unrestricted Cointegration Rank Test (Maximum Eigenvalue) Hypothesized Max-Eigen 0.05
No. of CE(s) Eigenvalue Statistic Critical Value Prob.** None * 0.338983 44.29532 27.58434 0.0002
At most 1 * 0.206515 24.75128 21.13162 0.0148
At most 2 * 0.170885 20.05147 14.26460 0.0055
At most 3 * 0.103644 11.70768 3.841466 0.0006 Max-eigenvalue test indicates 4 cointegrating eqn(s) at the 0.05 level
* denotes rejection of the hypothesis at the 0.05 level
**MacKinnon-Haug-Michelis (1999) p-values
CBN Journal of Applied Statistics Vol. 5 No.1 (June, 2014) 131
Kurtosis indicates too few cases at the tail of the distribution. These results
suggest that the use of a VAR model is justified since the hypothesis that the
error vector is Gaussian white noise cannot be rejected.
5.2 Unit Root Test Results
Unit root testing of the variables indicates that all the variables are I(1) series.
Given the results reported in Table 2, we are justified to conduct co-
integration and Granger causality tests between LGDP, LXPORT, LFDI, and
LEXRT.
5.3 Johansen Co-integration Test Results
The results of the multivariate co-integration test based on Johansen’s co-
integration technique reveal that both the trace statistic and maximum Eigen-
value statistic confirm the existence of co-integrating equations among the
variables. Since the variables are co-integrated, the existence of a stable long-
run relationship between the log of real GDP, log of exports, log of exchange
rate, and log of foreign direct investment is confirmed. See Table 3.
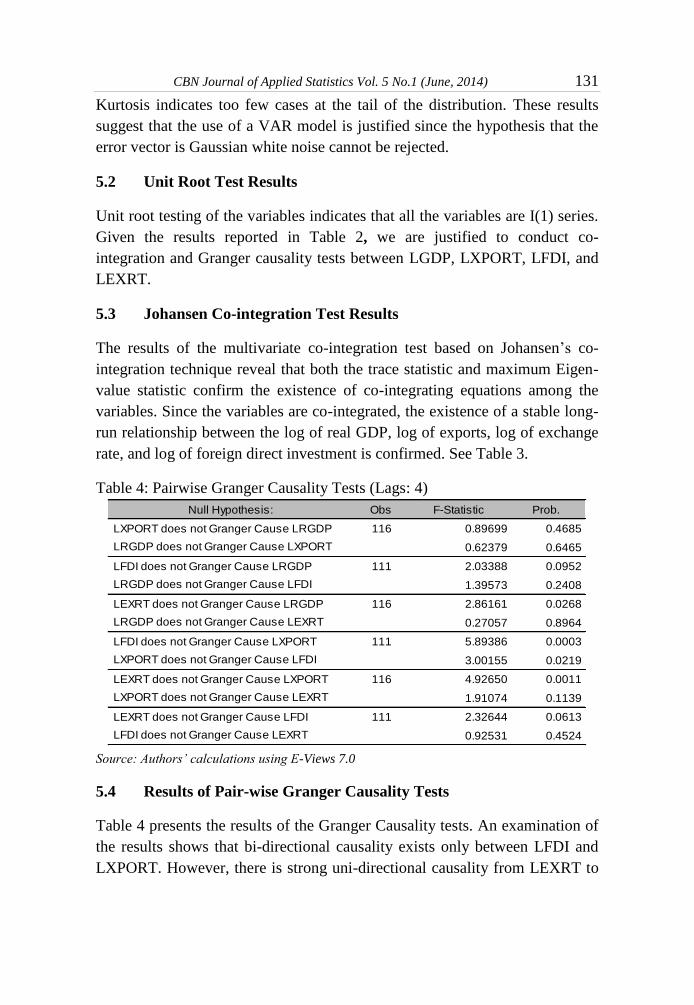
Table 4: Pairwise Granger Causality Tests (Lags: 4)
Source: Authors’ calculations using E-Views 7.0
5.4 Results of Pair-wise Granger Causality Tests
Table 4 presents the results of the Granger Causality tests. An examination of
the results shows that bi-directional causality exists only between LFDI and
LXPORT. However, there is strong uni-directional causality from LEXRT to
Null Hypothesis: Obs F-Statistic Prob.
LXPORT does not Granger Cause LRGDP 116 0.89699 0.4685
0.62379 0.6465
LFDI does not Granger Cause LRGDP 111 2.03388 0.0952
1.39573 0.2408
LEXRT does not Granger Cause LRGDP 116 2.86161 0.0268
0.27057 0.8964
LFDI does not Granger Cause LXPORT 111 5.89386 0.0003
3.00155 0.0219
LEXRT does not Granger Cause LXPORT 116 4.92650 0.0011
1.91074 0.1139
LEXRT does not Granger Cause LFDI 111 2.32644 0.0613
0.92531 0.4524
LRGDP does not Granger Cause LXPORT
LRGDP does not Granger Cause LFDI
LRGDP does not Granger Cause LEXRT
LXPORT does not Granger Cause LFDI
LXPORT does not Granger Cause LEXRT
LFDI does not Granger Cause LEXRT

132 Foreign Trade-Economic Growth Nexus:
Evidence from Nigeria Arodoye & Iyoha
LRDGP and from LFDI to LRGDP. Similarly, there is strong uni-directional
causality from LEXRT to LXPORT and from LEXRT to LFDI.
Source: Authors’ calculations using E-Views 7.0
It follows therefore that the nominal exchange rate is the most strategic
variable in the study as it Granger causes the other 3 variables, viz, real GDP,
foreign direct investment and exports. Conclusively, it can be stated that both
the exchange rate and foreign direct investment have direct impact on real
GDP and thus, economic growth. The exchange rate and FDI also have direct
Table 5: Vector Autoregression Estimates
Sample (adjusted): 1981Q3 2010Q4
Standard errors in ( ) & t-statistics in [ ] LRGDP LXPORT LEXRT LFDI LRGDP(-1) 0.924776 0.210769 -0.052859 -0.360270
(0.09926) (0.28477) (0.19329) (0.33474)
[ 9.31678] [ 0.74013] [-0.27347] [-1.07628]
LRGDP(-2) 0.011156 -0.106554 -0.000921 0.397713
(0.10206) (0.29279) (0.19874) (0.34417)
[ 0.10932] [-0.36392] [-0.00464] [ 1.15558]
LXPORT(-1) -0.019100 0.650523 -0.085220 -0.065709
(0.03450) (0.09899) (0.06719) (0.11636)
[-0.55358] [ 6.57181] [-1.26839] [-0.56473]
LXPORT(-2) 0.002992 0.034005 0.052224 0.069677
(0.03167) (0.09086) (0.06167) (0.10680)
[ 0.09449] [ 0.37425] [ 0.84681] [ 0.65240]
LEXRT(-1) -0.029353 0.365781 1.099966 0.287486
(0.05158) (0.14798) (0.10044) (0.17395)
[-0.56908] [ 2.47176] [ 10.9510] [ 1.65271]
LEXRT(-2) 0.039700 -0.249726 -0.101233 -0.103369
(0.05432) (0.15583) (0.10577) (0.18318)
[ 0.73088] [-1.60250] [-0.95707] [-0.56431]
LFDI(-1) 0.000175 0.118582 0.081413 0.889458
(0.02794) (0.08017) (0.05441) (0.09423)
[ 0.00625] [ 1.47921] [ 1.49622] [ 9.43908]
LFDI(-2) 0.019219 0.073164 -0.052710 -0.037022
(0.02853) (0.08186) (0.05556) (0.09622)
[ 0.67360] [ 0.89380] [-0.94869] [-0.38476]
C 0.723767 0.467948 0.773765 0.361519
(0.44824) (1.28599) (0.87287) (1.51162)
[ 1.61469] [ 0.36388] [ 0.88646] [ 0.23916] R-squared 0.965159 0.990744 0.992648 0.988923
Adj. R-squared 0.962530 0.990046 0.992093 0.988087
Sum sq. resids 0.770135 6.338995 2.920414 8.758592
S.E. equation 0.085237 0.244544 0.165985 0.287451
F-statistic 367.0502 1418.268 1788.925 1182.895
Log likelihood 124.6741 3.469255 48.03146 -15.12136
Akaike AIC -2.011723 0.096187 -0.678808 0.419502
Schwarz SC -1.796902 0.311008 -0.463987 0.634323
Mean dependent 11.32051 11.57491 2.999592 8.928240
S.D. dependent 0.440338 2.451028 1.866639 2.633594 Determinant resid covariance (dof adj.) 8.94E-07

CBN Journal of Applied Statistics Vol. 5 No.1 (June, 2014) 133
impact on exports. However, exports affect real GDP through foreign direct
investment. All in all, using our proxies for foreign trade, it can be concluded
that foreign trade leads to economic growth in Nigeria.
5.5 Results of Forecast Error Variance Decompositions
To further examine the short run dynamic properties of the log of GDP, log of
exports, log of foreign direct investment and log of exchange rate in Nigeria,
we examined the forecast error variance decomposition. The forecast error
variance decomposition for the four variables was obtained and is reported in
Table 6. By definition, the variance decomposition shows the proportion of
forecast error variance for each variable that is attributable to its own
innovation and to innovations in the other endogenous variables.
An examination of the variance decomposition of LGDP in Table 6(i) shows
that the lion’s share of the variation experienced by LGDP is attributed to its
own shock. The contribution of ―own shock‖ is 100% in the first period and
falls to 95.76 at the end of the 10-period horizon. The contribution of the other
3 variables is quite marginal. The highest is by LFDI, which contributes 2.23
% in the tenth period. A similar pattern is displayed by LEXRT where own
shocks also account for a disproportionate share of the total variation. The
contribution of ―own shock‖ is 98.5 % in the first period and falls to 96.4 % in
the tenth period. The contribution of the other 3 variables is marginal with
RGDP accounting for 2 % of the variation.
Table 6: Variance Decomposition of LRGDP, LXPORT, LEXRT, LFDI
FEVD (i) - Variance Decomposition of LRGDP
Period S.E. LRGDP LXPORT LEXRT LFDI 1 0.085237 100.0000 0.000000 0.000000 0.000000
2 0.115507 99.62877 0.196456 0.174758 1.83E-05
3 0.136432 99.37317 0.331059 0.200705 0.095065
4 0.152160 99.05023 0.467231 0.168976 0.313561
5 0.164596 98.64526 0.591296 0.149257 0.614185
6 0.174738 98.17771 0.697023 0.174816 0.950452
7 0.183193 97.65713 0.783736 0.265929 1.293201
8 0.190358 97.08383 0.853290 0.436430 1.626448
9 0.196515 96.45350 0.908238 0.696131 1.942127
10 0.201872 95.76053 0.951075 1.051880 2.236518

134 Foreign Trade-Economic Growth Nexus:
Evidence from Nigeria Arodoye & Iyoha
FEVD (ii) – Variance Decomposition of LXPORT
FEVD (iii) – Variance Decomposition of LEXRT
FEVD (iv) – Variance Decomposition of LFDI
Source: Authors’ calculations using E-Views 7.0
The pattern is different in the case of LXPORT. Although the own shocks of
exports account for 94.89 % of total variation in the first period, its
contribution falls drastically to 32.96 % in the tenth period. In the tenth
period, shocks in the exchange rate account for 40.15 % of the variation while
shocks in foreign direct investment account for 24.36 % of the variation. The
Period S.E. LRGDP LXPORT LEXRT LFDI 1 0.244544 5.103811 94.89619 0.000000 0.000000
2 0.309369 6.414189 87.94032 4.471720 1.173773
3 0.351574 6.175041 78.82613 8.818078 6.180749
4 0.388428 5.458117 69.09512 13.32052 12.12625
5 0.423635 4.730948 60.13330 17.95030 17.18545
6 0.457724 4.103026 52.49031 22.61078 20.79589
7 0.490760 3.584814 46.15616 27.22220 23.03683
8 0.522820 3.161377 40.93060 31.71847 24.18955
9 0.554024 2.815335 36.59389 36.04289 24.54788
10 0.584494 2.532696 32.96000 40.15002 24.35728
Period S.E. LRGDP LXPORT LEXRT LFDI 1 0.165985 0.078342 1.391365 98.53029 0.000000
2 0.249501 0.062129 0.636666 98.45056 0.850645
3 0.312736 0.232680 0.405347 98.01767 1.344304
4 0.365839 0.447449 0.296217 97.70470 1.551636
5 0.412546 0.680238 0.232950 97.46405 1.622758
6 0.454703 0.928458 0.191758 97.25231 1.627474
7 0.493389 1.190651 0.162874 97.04857 1.597901
8 0.529292 1.465053 0.141571 96.84301 1.550362
9 0.562881 1.749799 0.125290 96.63114 1.493776
10 0.594488 2.043061 0.112522 96.41115 1.433264
Period S.E. LRGDP LXPORT LEXRT LFDI 1 0.287451 0.000174 1.025293 2.286458 96.68808
2 0.393188 0.719091 0.710787 6.009131 92.56099
3 0.463358 0.813090 0.690891 9.803657 88.69236
4 0.515544 0.785143 0.718627 13.91788 84.57835
5 0.558412 0.730624 0.744431 18.25096 80.27399
6 0.596135 0.678065 0.753731 22.68129 75.88691
7 0.630876 0.634714 0.746078 27.09158 71.52762
8 0.663802 0.602667 0.725428 31.38650 67.28541
9 0.695556 0.583079 0.696377 35.49608 63.22446
10 0.726495 0.577112 0.662787 39.37393 59.38617

CBN Journal of Applied Statistics Vol. 5 No.1 (June, 2014) 135
pattern of LFDI is rather similar to this. While own shocks account for 98.68
% of the variation in the first period, its contribution falls sharply to 59.38 %
in the last period while exchange rate shocks account for 39.37 $ of the
variation. Summarily, we conclude that the predominant sources of variation
in the rate of economic growth are due largely to own shocks and innovations
in foreign direct investment while the predominant sources of variation in
exchange rate are due mainly to own shocks and innovations in real GDP. The
predominant sources of variation in foreign direct investment are due largely
to own shocks and innovations in the exchange rate while the predominant
sources of variation in exports are due mainly to own shocks and innovations
in the exchange rate and in foreign direct investment.
5.6 Impulse Response Function Analysis
The Impulse Response function simulates over time the effect of a one-time
shock in one equation on itself and on other equations in the entire equation
system; hence it is used to detect interaction among variables. . Results of the
estimated generalized impulse response functions (IRFs) are summarized in
Table 7 and the accompanying Figures. Examination of the graphs for
LRGDP, LXPORT and LFDI shows that their movement with respect to the
identified shocks is consistent with the results of variance decomposition
analysis.
Table 7. Generalised Impulse Response Functions
7.1 Generalised Impulse Responses to one SE shock in the
equation for LRGDP
Unrestricted Vector Autoregressive Model
Horizon LRGDP LXPORT LFDI LEXRT
0 .084412 .053704 -.050981 .0068660
1 .076847 .055975 -.043783 .0052141
2 .070647 .044667 .016347 .9194E-3
3 .065558 .038786 .032709 -.9950E-3
4 .061232 .037116 .037225 -.0025956
5 .057294 .035952 .036729 -.0042329
6 .053633 .034588 .035082 -.0058544
7 .050193 .032889 .032944 -.0074172
8 .046953 .030907 .030561 -.0089070
9 .043898 .028707 .028005 -.010320
10 .041016 .026349 .025332 -.011654

136 Foreign Trade-Economic Growth Nexus:
Evidence from Nigeria Arodoye & Iyoha
7.2 Generalised Impulse Responses to one SE shock in the
equation for LXPORT
5.7 Vector Autoregression estimates
The results are provided in Table 5. Note that all coefficient estimates are
elasticities. Examination of the results shows that the single most important
determinant of each variable is its one-period lagged value. The elasticity of
real GDP with respect to its lagged value is 0.92; the elasticity of exchange
rate with respect to its lagged value is 1.1; the elasticity of FDI with respect to
Generalised Impulse Responses to one SE shock in the equation for LRGDP
LRGDP
Horizon
0.04
0.05
0.06
0.07
0.08
0.09
0 1 2 3 4 5 6 7 8 9 10 10
Unrestricted Vector Autoregressive Model
Horizon LRGDP LXPORT LFDI LEXRT
0 .018158 .24966 .18364 .025591
1 .013116 .19615 .099100 .012128
2 .012939 .16378 .13779 .0069507
3 .012258 .13837 .12543 .0045362
4 .011916 .11968 .11242 .0024244
5 .011566 .10366 .097609 .4766E-3
6 .011191 .089750 .084405 -.0012822
7 .010773 .077528 .072645 -.0028493
8 .010318 .066773 .062294 -.0042399
9 .0098362 .057297 .053166 -.0054721
10 .0093355 .048941 .045113 -.0065628
Generalised Impulse Responses to one SE shock in the equation for LXPORT
LXPORT
Horizon
0.00
0.05
0.10
0.15
0.20
0.25
0 1 2 3 4 5 6 7 8 9 10 10

CBN Journal of Applied Statistics Vol. 5 No.1 (June, 2014) 137
its lagged value is 0.89; and the elasticity of exports with respect to its lagged
value is 0.65. The exchange rate is also an important determinant of exports
(the elasticity of exports with respect to lagged exchange rate is 0.3) and of
foreign direct investment (the elasticity of FDI with respect to lagged
exchange rate is 0.29). All in all, the import and implications of these results
coincide with those of IRF and Variance Decomposition analyses.
7.3 Generalised Impulse Responses to one SE shock in the
equation for LFDI
7.4 Generalised Impulse Responses to one SE shock in the
equation for LEXRT
Unrestricted Vector Autoregressive Model
Horizon LRGDP LXPORT LFDI LEXRT
0 -.0050839 .054161 .84648 .020328
1 -.6179E-3 .089546 .30553 .039023
2 .0056864 .12611 .19683 .038688
3 .0075387 .12295 .13405 .035737
4 .0084463 .11412 .11602 .033422
5 .0088226 .10413 .10408 .031656
6 .0090491 .095122 .095308 .030147
7 .0091902 .087127 .087603 .028789
8 .0092748 .080077 .080811 .027543
9 .0093124 .073843 .074776 .026393
10 .0093104 .068319 .069412 .025326
Unrestricted Vector Autoregressive Model
Horizon LRGDP LXPORT LFDI LEXRT
0 .0035795 .039459 .10627 .16191
1 -.0017175 .098117 .13490 .17964
2 .1423E-3 .11411 .14199 .17925
3 .0029010 .12732 .15475 .17884
4 .0054614 .13876 .16486 .17834
5 .0078815 .14869 .17405 .17763
6 .010166 .15723 .18197 .17670
7 .012320 .16457 .18876 .17561
8 .014347 .17084 .19452 .17435
9 .016249 .17616 .19936 .17295
10 .018029 .18064 .20337 .17142
Generalised Impulse Responses to one SE shock in the equation for LEXRT
LEXRT
Horizon
0.10
0.12
0.14
0.16
0.18
0 1 2 3 4 5 6 7 8 9 10 10

138 Foreign Trade-Economic Growth Nexus:
Evidence from Nigeria Arodoye & Iyoha
6.0 Summary, Conclusion and Policy Recommendations
This paper has analyzed the nexus between foreign trade and economic
growth in Nigeria using the Vector Autoregressive methodology. The results
of the Unit root tests showed that the four variables: real GDP, XPORT, FDI
and EXRT are difference stationary. The Johansen Cointegration test showed
a stable long run relationship between the variables. The Granger causality
tests showed that there is bi-directional causality only between log of exports
and log of FDI while there is uni-directional causality from LEXRT to
LRGDP and from LFDI to LRGDP. Also, it was found that LEXRT Granger
causes LXPORTS and also Granger causes LFDI.
The results of the forecast error variance decomposition analysis showed that
innovations in the variables are mostly explained by their own shocks. The
impulse responses of the log of gross domestic product, log of export and log
of foreign direct investment with respect to the identified shocks (innovations)
are consistent with the results of variance decomposition analysis. Based on
the results obtained, the hypothesis of a positive relationship between foreign
trade and economic growth in Nigeria is validated.
We therefore recommend that trade policies in favor of export expansion
should be encouraged because exports are a driver of economic growth. The
nominal exchange rate also revealed itself as a strategic and versatile variable
for influencing economic growth, Therefore, an exchange rate policy
favorable to export expansion and consistent with Nigeria’s status as a small
open economy is recommended.
References
Balassa, B (1978). ―Exports and Economic Growth: Further Evidence‖.
Journal of Development Economics. 5:181-189, June.
Central Bank of Nigeria. Statistical Bulletin and Annual Report and Statement
of Accounts. Various issues.
Ekpo, A.H. and F. O. Egwaikhide (1994). ―Export and Economic Growth in
Nigeria: A Reconsideration of the Evidence‖. Journal of Economic
Management. 1(1):100-115.
Emery, R.F. (1967). ―The Relation of Exports and Economic Growth‖.
Kyklos. 20(4):470-486, November.
CBN Journal of Applied Statistics Vol. 5 No.1 (June, 2014) 139
Fajana, O. (1979). ―Trade and Growth: The Nigerian Experience‖. World
Development. 7(1):73-78, January.
Finch, D. and C Michalopoulos (1988). ―Development, Trade, and
International Organizations‖. In A. O. Krueger ed., Development with
Trade. San Francisco, CA: ICS Press
Fosu, A. K. (1990). ―Exports and Economic Growth: The African Case‖.
World Development. 18(6):831-835, June.
Haberler, G. (1988). International Trade and Economic Development. San
Francisco, CA: International Center for Economic Growth.
Hassan Alhajhoj, (2007). ―Exports and Economic Growth in Saudi Arabia: A
VAR Model Analysis‖. Journal of Applied Sciences, 7:3649-3658.
Iyoha, M. A. and P. A. Adamu (2011). ―The Impact of External Trade on
Economic Growth in Nigeria: A Roadmap for the Twenty-First
Century‖. West African Social and Management Sciences Review.
2(1):1-30, January.
Iyoha, M.A. (2010). ―Leadership, policy making, and economic growth in
African countries: The case of Nigeria‖. Chapter 6: In D. Brady and
M. Spence (Eds.), Leadership and Growth. Washington, D.C.: World
Bank.
Iyoha, M. A. (1998). ―An Econometric Analysis of the Impact of Trade on
Economic Growth in ECOWAS Countries". Nigerian Economic and
Financial Review. 3(1):25-42, December.
Krueger, A.O. (1978). Foreign Trade Regimes and Economic Development:
Liberalization Attempts and Consequences. Cambridge: National
Bureau of Economic Research and M.A. Ballinger Publication Co.
Marshall, A. 1959. Principles of Economics. 8th
Edition, Macmillan for the
Royal Economic Society.
Massell, B.F., S.R. Pearson and J.B. Fitch (1972). ―Foreign Exchange and
Economic Development: An Empirical Study of Selected Latin
American Countries‖. Review of Economics and Statistics, 54(2),
May.
Michaely, M. (1977). ―Exports and Growth: An Empirical Investigation‖.
Journal of Development Economics, 4(1):49-53, February.

140 Foreign Trade-Economic Growth Nexus:
Evidence from Nigeria Arodoye & Iyoha
Minford, P., J. Riley and E. Nowell (1995). ―The Elixir of Growth: Trade,
Non-traded Goods and Development‖. Centre for Economic Policy
Research Discussion Paper No. 1165.
Mohamed M.R, Chung-Yee Liew and S.S Mazee (2012).‖Export Trade and
Economic Growth in Tanzania: A Disaggregated Approach‖ Journal of
Economics and Sustainable Development. 3(12).
Mustafa, K. (2011).‖An analysis of the Relationship between Foreign Trade
and Economic Growth in Turkey over the period (1980–2009)‖ Lund
University School of Economics and Managemnet.
Obadan, M.I and E.I. Okojie (2010). ―An Empirical Analysis of the Impact of
Trade on Economic Growth in Nigeria‖. Jos Journal of Economics.
4(1).
Obiora, K. I. (2009). ―How Much Do Trading partners Matter for Nigeria’s
Growth? A Contribution to the Debate on Decoupling and Spillovers‖.
Journal of Economic and Monetary Integration, 9(1).
Omoke Philip Chimobi and Ugwuanyi Charles Uche (2010). ―Export,
Domestic demand and Economic Growth in Nigeria: Granger
Causality Analysis‖. European Journal of Social Sciences, 13(2).
Rahmaddi, R. and M. Ichihashi, 2011. ―Exports and Economic Growth in
Indonesia‖. A Causality Approach based on Multi-Variate Correction
Model‖. Journal of International Development and Coorperation,
17(2):53-73.
Ram, R. (1985). ―Exports and Economic Growth: Some Additional
Evidence‖. Economic Development and Cultural Change.
33(2):415425, January.
Robertson, D.H (1938). ―The Future of International Trade‖. Economic
Journal, 48(189), March.
Sachs, J., and A. Warner (2001). ―Natural Resources and Economic
Development: the Curse of Natural Resources.‖ European Economic
Review 45:827-38.
Safdari M, M.A Mehrizi and M-R Dehqan-Niri (2012).‖The Relationship
between Foreign Trade and Economic Growth in Iran‖ American
Journal of Scientific Research.

CBN Journal of Applied Statistics Vol. 5 No.1 (June, 2014) 141
Salvatore, D. (1983). ―A Simultaneous Equations Model of Trade and
Development with Dynamic Policy Simulations". Kyklos. 36(1):66-90,
February.
Sarbapriya, R. 2011. ―Explaining Cointegration and Causality between
Foreign Trade and Economic Growth: Econometric Evidence from
India‖. International Journal of Contemporary Business Studies, vol. 2,
no. 10, October 2011.
Severn, A.K (1968). ―Exports and Economic Growth: Comment‖. Kyklos.
21(3):546-548.
Sims, Christopher.A. (1986). ―Are Forecasting Models Usable for Policy
Analysis?‖ Federal Reserve Bank of Minneapolis Quarterly Review,
vol. 10 (Winter 1986): 2–16.
Tyler, W.G. (1981). ―Growth and Export Expansion in Developing Countries:
Some Empirical Evidence‖. Journal of Development Economics.
9(1):121-130, August.
Udeh, J. (2000). ―Petroleum Revenue Management: The Nigerian
Perspective.‖ Paper presented at World Bank/IFC Petroleum Revenue
Management Workshop, Washington, DC, October 23–24.
Voivodas, C. (1973). ―Exports, Foreign Capital Inflow and Economic
Growth‖. Journal of International Economics. 3(4):337- 34.


![Trade Structure and Economic Growth JITED 2006[1]](https://static.fdocuments.net/doc/165x107/577ce6411a28abf103927cc4/trade-structure-and-economic-growth-jited-20061.jpg)


