Foreign Ownership, Survival and Growth Dynamics in Turkish Manufacturing Erol Taymaz, Middle East...
40
Foreign Ownership, Survival and Growth Dynamics in Turkish Manufacturing Erol Taymaz, Middle East Technical University, Ankara Yesim Üçdoğruk, Dokuz Eylül University, Izmir Kamil Yılmaz, Koç University, Istanbul REF Workshop on Productivity ● 30 November 2012 ● Istanbul
-
Upload
reynard-evans -
Category
Documents
-
view
217 -
download
0
Transcript of Foreign Ownership, Survival and Growth Dynamics in Turkish Manufacturing Erol Taymaz, Middle East...

Foreign Ownership, Survival and Growth Dynamics in Turkish Manufacturing
Erol Taymaz, Middle East Technical University, Ankara
Yesim Üçdoğruk, Dokuz Eylül University, Izmir
Kamil Yılmaz, Koç University, Istanbul
REF Workshop on Productivity ● 30 November 2012 ● Istanbul

Questions Are foreign firms different at the time of
entry? Internal and external funds Knowledge
Do foreign firms survive longer? More productive, larger, etc Footlose
Do foreign firms make life difficult for domestic firms? Competition Spillovers

Questions What are the determinants of firm
(employment) growth? Do foreign firms grow faster than
domestic ones? How does the presence of foreign firms
affect growth prospects of domestic firms

Data Annual Survey of Manufacturing
Industries All private establishments employing 10+
people 1983-2001 period About 10,000 establishments per year
Annual Industry and Service Statistics Database Data for establishments in the service sectors
along with the ones in the industry. 2003-2009 period Simplified survey questionnaires; data series
are no longer comparable with 2001 and before.

Share of Foreign Firms in Manufacturing
1985 1990 1995 2000 2005 20100
5
10
15
20
25
30
35
Employment Value added Number of firms
Sh
are
of f
ore
ign
firm
s (%
)

Survival functions
0 2 4 6 8 10 12 14 160.0
0.2
0.4
0.6
0.8
1.0
Domestic Foreign Domestic LSE
Age
Su
rviv
al r
ate
(%
)

Model
Cox proportional hazard modelhij(t) = hj(t)exp(Xijtβ) Stratified by 2-digit industries Estimated for
New domestic, new foreign and all new firms
Log likelihood ratio test

Descriptive statistics (mean values)
Label Description 1983-2001 dataset 2003-2009 dataset
New firms New foreign New firms New foreign
firms firms
llab Log size (employment) 3.580 4.799 3.480 4.234
lab* Size (employment) 35.86 121.36 32.45 68.97
lgr Growth rate of employment 0.023 0.059 0.014 0.166
exit Exitor 0.108 0.042 0.359 0.079
entry Entrant 0.164 0.129 0.267 0.101
fdi Foreign firm 0.025 1.000 0.023 1.000
lage Log age 1.406 1.500 0.900 1.150
entrelsize Relative entry size -0.330 0.425 -0.723 -0.078
fdiqs Sectoral share of foreign firms 0.113 0.202 0.116 0.209
fdiqr Regional share of foreign firms 0.177 0.219 0.204 0.259
N Number of observations 114906 2881 33749 762
n Number of growth variables 89374 2424 14889 512
* Geometric average

Descriptive statistics (mean values)
Label Description 1983-2001 dataset 2003-2009 dataset
New firms New foreign New firms New foreign
firms firms
fdisupp_q Share of foreign suppliers 0.052 0.077 0.056 0.072
fdibuy_q Share of foreign buyers 0.039 0.070 0.054 0.082
cfdiqs Change in fdiqs 0.006 0.008 0.002 0.006
cfdiqr Change in fdiqr 0.003 0.010 -0.008 0.012
lentrate Sectoral entry rate 0.057 0.049 0.027 0.018
sectgr Sectoral output growth rate 0.075 0.074 0.038 0.050
sectgrpr Sectoral price growth rate 0.484 0.499 0.050 0.042
hhi Herfindahl index 0.051 0.072 0.072 0.069
mes Minimum efficient scale 3.477 3.730 3.253 3.502
N Number of observations 114906 2881 33749 762
n Number of growth variables 89374 2424 14889 512
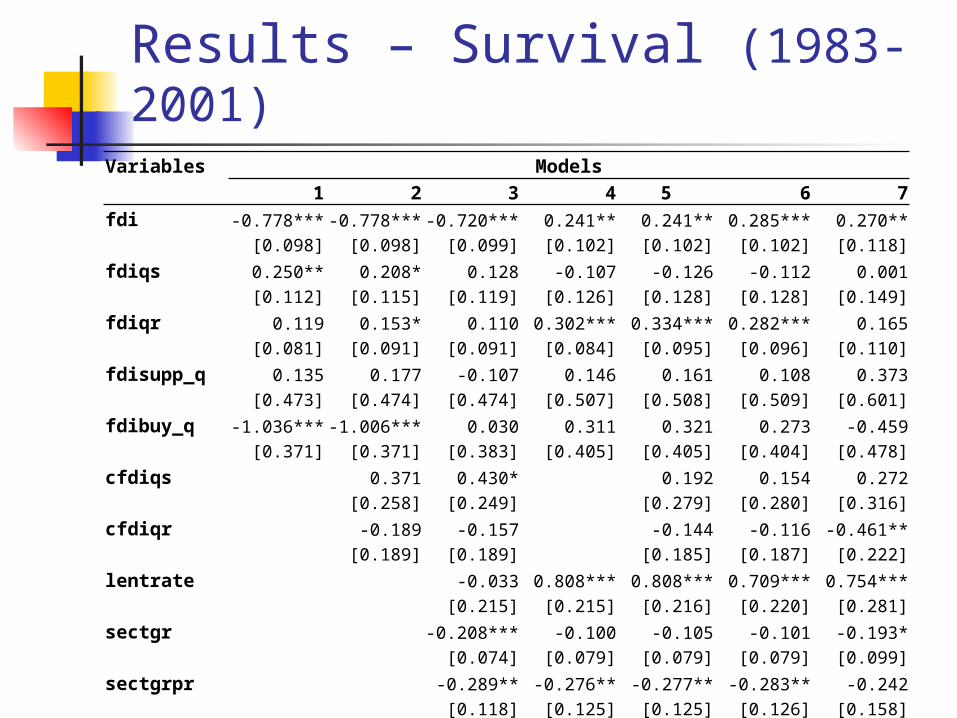
Results – Survival (1983-2001)Variables Models
1 2 3 4 5 6 7fdi -0.778*** -0.778*** -0.720*** 0.241** 0.241** 0.285*** 0.270**
[0.098] [0.098] [0.099] [0.102] [0.102] [0.102] [0.118]fdiqs 0.250** 0.208* 0.128 -0.107 -0.126 -0.112 0.001
[0.112] [0.115] [0.119] [0.126] [0.128] [0.128] [0.149]fdiqr 0.119 0.153* 0.110 0.302*** 0.334*** 0.282*** 0.165
[0.081] [0.091] [0.091] [0.084] [0.095] [0.096] [0.110]fdisupp_q 0.135 0.177 -0.107 0.146 0.161 0.108 0.373
[0.473] [0.474] [0.474] [0.507] [0.508] [0.509] [0.601]fdibuy_q -1.036*** -1.006*** 0.030 0.311 0.321 0.273 -0.459
[0.371] [0.371] [0.383] [0.405] [0.405] [0.404] [0.478]cfdiqs 0.371 0.430* 0.192 0.154 0.272
[0.258] [0.249] [0.279] [0.280] [0.316]cfdiqr -0.189 -0.157 -0.144 -0.116 -0.461**
[0.189] [0.189] [0.185] [0.187] [0.222]lentrate -0.033 0.808*** 0.808*** 0.709*** 0.754***
[0.215] [0.215] [0.216] [0.220] [0.281]sectgr -0.208*** -0.100 -0.105 -0.101 -0.193*
[0.074] [0.079] [0.079] [0.079] [0.099]sectgrpr -0.289** -0.276** -0.277** -0.283** -0.242
[0.118] [0.125] [0.125] [0.126] [0.158]

Results – Survival (1983-2001)Variables Models 1 2 3 4 5 6 7hhi 0.670*** 0.514** 0.520** 0.497** 0.149
[0.184] [0.202] [0.202] [0.203] [0.259]mes -0.307*** -0.516*** -0.517*** -0.467*** -0.386***
[0.035] [0.039] [0.039] [0.039] [0.052]relsize -0.678*** -0.678*** -0.657*** -0.661***
[0.019] [0.019] [0.019] [0.023]lw -0.281*** -0.281*** -0.252*** -0.274***
[0.022] [0.022] [0.022] [0.032]pmargin -0.041 -0.042 0.016 -0.050
[0.066] [0.066] [0.066] [0.078]subinput 0.095 0.094 0.096 0.036
[0.102] [0.102] [0.101] [0.110]suboutput 0.283*** 0.283*** 0.246*** 0.236***
[0.046] [0.046] [0.046] [0.049]kl -0.079*** -0.092***
[0.007] [0.008]ttrans 0.487***
[0.179]rddum -0.148*** [0.045]N 87956 87956 87956 84014 84014 84012 56921Log likelihood -68859 -68857 -68801 -59084 -59084 -59029 -37086

Results - Survival (2003-2009)Variables Models 1 2 3 4 5 6 7fdi -1.138*** -1.140*** -1.108*** -0.460*** -0.462*** -0.395** -0.351**
[0.152] [0.152] [0.152] [0.148] [0.148] [0.157] [0.155]fdiqs -0.056 -0.073 0.113 0.131 0.078 0.047 0.069
[0.096] [0.100] [0.107] [0.125] [0.130] [0.180] [0.182]fdiqr -0.365*** -0.070 0.032 0.042 0.013 -0.001 -0.046
[0.094] [0.148] [0.150] [0.118] [0.186] [0.229] [0.233]fdisupp_q 21.059*** 21.150*** 15.090** 25.283*** 26.106*** 42.750*** 43.049***
[6.991] [6.997] [7.054] [9.040] [9.060] [13.199] [13.179]fdibuy_q -7.576** -7.697** -6.156* -5.674 -6.508 -7.849 -8.141
[3.536] [3.554] [3.591] [4.643] [4.687] [6.437] [6.471]cfdiqs 0.029 0.223 0.546* 0.731* 0.773*
[0.254] [0.262] [0.320] [0.415] [0.420]cfdiqr -0.514*** -0.534*** 0.052 0.236 0.173
[0.182] [0.184] [0.230] [0.305] [0.309]lentrate 0.180 1.255*** 1.229*** 1.627*** 1.597***
[0.241] [0.321] [0.321] [0.503] [0.501]sectgr 0.045 -0.094 -0.090 -0.058 -0.047
[0.060] [0.068] [0.068] [0.100] [0.098]sectgrpr -0.134 -0.364** -0.378** -0.446** -0.489**
[0.138] [0.155] [0.155] [0.213] [0.211]

Results - Survival (2003-2009)Variables Models 1 2 3 4 5 6 7hhi -0.457*** -0.862*** -0.874*** -0.875*** -0.863***
[0.153] [0.195] [0.195] [0.270] [0.270]mes -0.182*** -0.323*** -0.327*** -0.374*** -0.363***
[0.015] [0.022] [0.022] [0.033] [0.033]relsize -0.511*** -0.512*** -0.575*** -0.566***
[0.013] [0.013] [0.018] [0.018]lw 0.012 0.012 0.066* 0.015
[0.027] [0.027] [0.037] [0.038]pmargin -0.000*** -0.000*** -0.000*** -0.000***
[0.000] [0.000] [0.000] [0.000]subinput 0.100 0.101 0.270 0.135
[0.138] [0.138] [0.177] [0.187]suboutput 0.392*** 0.391*** 0.192*** 0.238***
[0.037] [0.037] [0.053] [0.054]kl -0.045*** -0.059***
[0.011] [0.011]ttrans 0.345***
[0.048]rddum -0.241 [0.263]N 18230 18223 18223 16305 16305 12829 12829
Log likelihood -31656 -31640 -31590 -22654 -22653 -12796 -12777

Results of the Cox proportional hazards model
Foreign firms are more likely to survive than domestic firms, but the difference between domestic and foreign firms could be explained to a large extent by their firm-specific characteristics.
Once firm-specific characteristics are controlled for, it is ambiguous if foreign firms can survive more or if they are footloose.
It seems that foreign firms have advantages over domestic firms not because they are foreign, but they are multinational.
Foreign spillover variables have usually weak and ambiguous impact on survival probabilities. This is partly due to the limitation of spillover data.

Results of the Cox proportional hazards model
Negative correlation between sectoral share of foreign firms and survival probability,
but this correlation could be caused by other sector-specific factors (level of concentration, sectoral growth rates, etc.).
Regarding horizontal spillovers, there is a weak evidence that imply that change in the sectoral
share of foreign firms (the dynamic effect of the existence of foreign firms) has a negative impact on survival of domestic firms.
Domestic firms feel the competitive pressures while foreign firms are increasing their market share (through growth or entry), but the level of foreign share itself does not matter much.

Average size of new firms by cohort (entrants after 1992)
0 1 2 3 4 5 6 7 8 9 10
-0.7
-0.6
-0.5
-0.4
-0.3
-0.2
-0.1
0.0
0.1
1992 1993 1994 1995 1996 1997 1998 1999 2000
Age
Re
lativ
e s
ize
(%
)

Average size of new firms by cohort (2003-2008)
0 1 2 3 4 5 6 7
-1.4
-1.2
-1.0
-0.8
-0.6
-0.4
-0.2
0.0
2003 2004 2005 2006 2007 2008
Age
Re
lativ
e s
ize
(%
)
Average size of new FDI firms by cohort (entrants after 1992)
0 1 2 3 4 5 6 7 8 9 10
-0.2
0.0
0.2
0.4
0.6
0.8
1.0
1.2
1992 1993 1994 1995 1996 1997 1998 1999 2000
Age
Re
lativ
e s
ize
(%
)

Average size of new FDI firms by cohort (2003-2009 dataset)
0 1 2 3 4 5 6 7
-1.0
-0.5
0.0
0.5
1.0
1.5
2003 2004 2005 2006 2007 2008
Age
Re
lativ
e s
ize
(%
)

Results As expected, entrants start small: the entry size is
much lower than the average size so that relative size at the time of entry (age 0) is negative for all cohorts.
However, the relative size of new firms increase rapidly over time, and converges towards sector average. The rapid increase in the average size can be explained by two factors: exit of small firms, and growth of new firms.
The first process (exit) has been studied in detail in the preceding section, and it was found that small firms are more likely to exit. If small firms exit, than the average size of remaining firms will increase even if they do not grow at all.
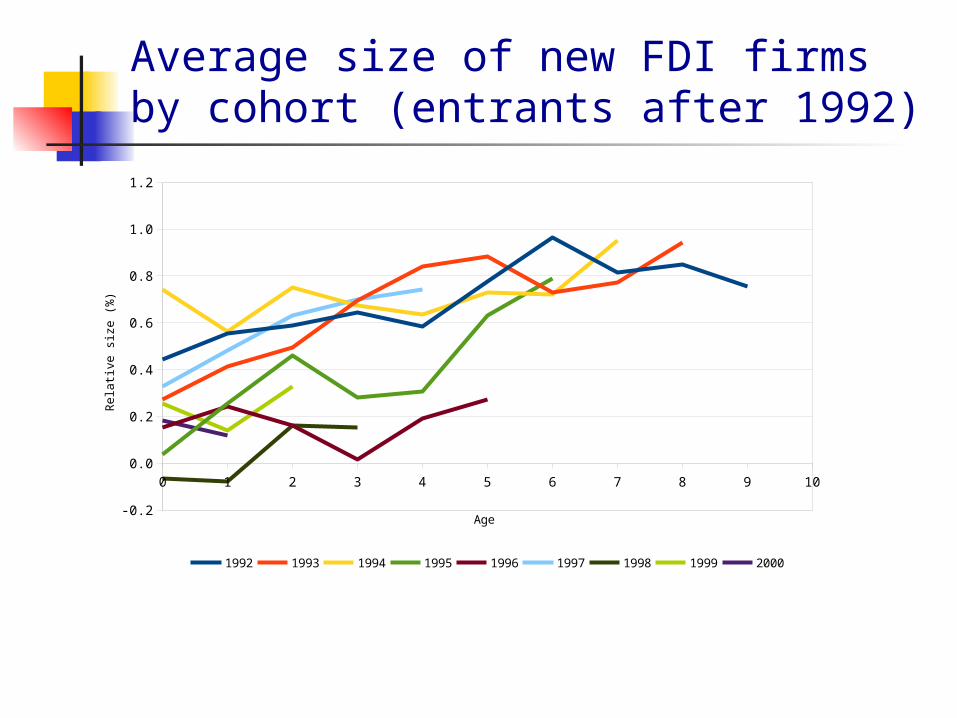
Results The second process, new firm growth, will be studied
in detail in the following subsection. The pattern of growth of new foreign firms: As it is
obvious, the entry size of foreign firms is much higher than the entry size of domestic firms especially in the 1984-2001 period.
The average relative size of new foreign firms also tends to increase over time, as observed in the case of domestic firms.

Average size of exitors by survival duration (1983-2001 dataset)
0 1 2 3 4 5 6 7 8 9 10
-0.8
-0.7
-0.6
-0.5
-0.4
-0.3
-0.2
-0.1
0.0
1 2 3 4 5 6 7 8 9 10
Age
Re
lativ
e s
ize
(%
)

Average size of exitors by survival duration (2003-2009 dataset)
0 1 2 3 4 5 6
-1.6
-1.4
-1.2
-1.0
-0.8
-0.6
-0.4
-0.2
0.0
1 2 3 4 5 6
Age
Re
lativ
e s
ize
(%
)

Average size of survivors by age (1983-2001 dataset)
0 1 2 3 4 5 6 7 8 9 10
-0.5
-0.4
-0.3
-0.2
-0.1
0.0
0.1
0.2
2000 1999 1998 1997 1996 1995 1994 1993 1992
Age
Re
lativ
e s
ize
(%
)

Average size of survivors by age (2003-2009 dataset)
0 1 2 3 4 5 6 7
-0.8
-0.6
-0.4
-0.2
0.0
0.2
0.4
2008 2007 2006 2005 2004 2003
Age
Re
lativ
e s
ize
(%
)

Average size of foreign survivors by age (1983-2001 dataset)
0 1 2 3 4 5 6 7 8 9 10
-0.4
-0.2
0.0
0.2
0.4
0.6
0.8
1.0
1.2
2000 1999 1998 1997 1996 1995 1994 1993 1992
Age
Re
lativ
e s
ize
(%
)

Average size of foreign survivors by age (2003-2009 dataset)
0 1 2 3 4 5 6 7
-1.0
-0.5
0.0
0.5
1.0
1.5
2008 2007 2006 2005 2004 2003
Age
Re
lativ
e s
ize
(%
)

Results Relative size of domestic exitors:
Exitors do not grow much after entry, the smaller the entry size is, the shorter the duration of survival will be,
Exitors tend to become even smaller in a few years preceding their exit.
The visual description of the exit process of domestic firms provide evidence that a part of the increase in the relative size of new firms can be explained by the exit process because smaller firms tend to exit first.

Results The relative size of domestic survivors:
Surviving new firms grow really quite fast and reach sector average in about 5-6 years.
These figures provide visual evidence on the differences between growth patterns of new domestic and foreign firms.
We will use regression analysis to test if there is any statistically significant difference between growth rates of domestic and foreign firms, and to check if spillovers from foreign firms have any affect on the growth rates of domestic firms.

Employment Growth
Unobserved firm-specific effects and the endogeneity of the lagged dependent variable (log(Lt)) in the model
GMM-system method Main limitation: attrition bias because some firms
exit from the market through a non-random process.
Heckman selection model: takes into account the selection (attrition) bias.
Selection and growth equations Growth eq incorporates selectivity-bias correction term Need exogenous variables that affect the selection but not
growth
gi,t+1 =logLt+1 −logLt =β0 logLt + XitβlogLt+1 =α 0 logLt + Xitβ
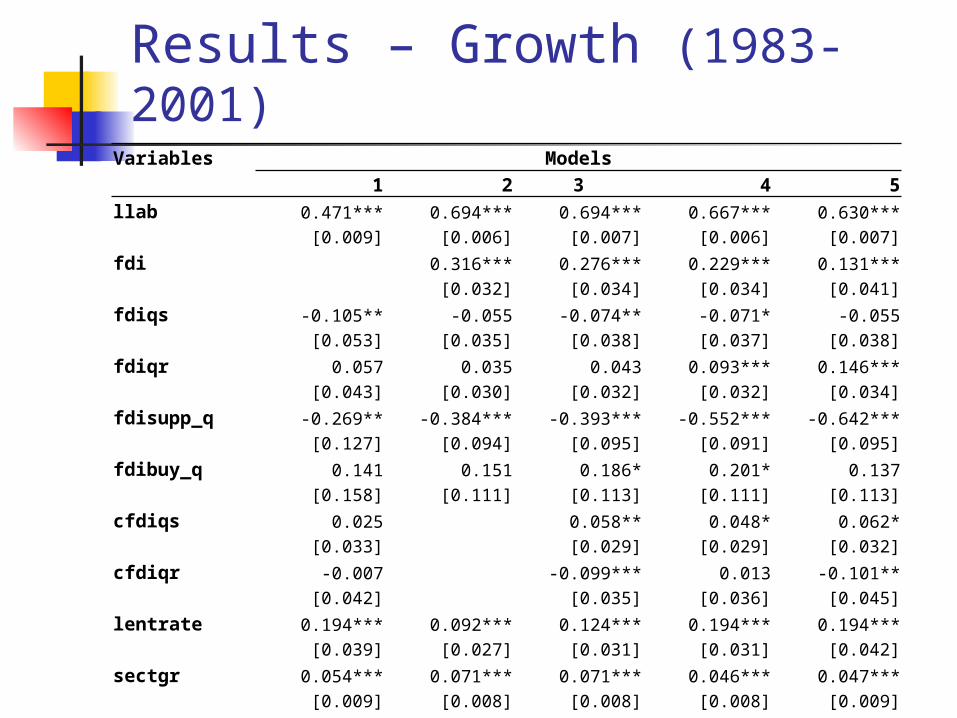
Results – Growth (1983-2001)Variables Models 1 2 3 4 5llab 0.471*** 0.694*** 0.694*** 0.667*** 0.630***
[0.009] [0.006] [0.007] [0.006] [0.007]fdi 0.316*** 0.276*** 0.229*** 0.131***
[0.032] [0.034] [0.034] [0.041]fdiqs -0.105** -0.055 -0.074** -0.071* -0.055
[0.053] [0.035] [0.038] [0.037] [0.038]fdiqr 0.057 0.035 0.043 0.093*** 0.146***
[0.043] [0.030] [0.032] [0.032] [0.034]fdisupp_q -0.269** -0.384*** -0.393*** -0.552*** -0.642***
[0.127] [0.094] [0.095] [0.091] [0.095]fdibuy_q 0.141 0.151 0.186* 0.201* 0.137
[0.158] [0.111] [0.113] [0.111] [0.113]cfdiqs 0.025 0.058** 0.048* 0.062*
[0.033] [0.029] [0.029] [0.032]cfdiqr -0.007 -0.099*** 0.013 -0.101**
[0.042] [0.035] [0.036] [0.045]lentrate 0.194*** 0.092*** 0.124*** 0.194*** 0.194***
[0.039] [0.027] [0.031] [0.031] [0.042]sectgr 0.054*** 0.071*** 0.071*** 0.046*** 0.047***
[0.009] [0.008] [0.008] [0.008] [0.009]sectgrpr 0.043*** 0.151*** 0.155*** 0.060*** 0.108***
[0.014] [0.012] [0.013] [0.013] [0.015]

Results – Growth (1983-2001)Variables Models 1 2 3 4 5hhi -0.295*** -0.335*** -0.318*** -0.317*** -0.480***
[0.090] [0.063] [0.064] [0.062] [0.071]mes 0.378*** 0.192*** 0.197*** 0.181*** 0.194***
[0.014] [0.010] [0.010] [0.011] [0.012]lage -0.070*** -0.070*** -0.051*** 0.030***
[0.004] [0.004] [0.004] [0.005]lw 0.086*** 0.086*** 0.023*** 0.125***
[0.006] [0.006] [0.006] [0.008]pmargin 0.046*** 0.049*** 0.013 0.026*
[0.011] [0.011] [0.011] [0.014]subinput 0.132*** 0.106*** 0.078*** 0.040
[0.020] [0.022] [0.022] [0.027]suboutput -0.128*** -0.131*** -0.141*** -0.121***
[0.019] [0.020] [0.019] [0.023]kl 0.089*** 0.089***
[0.003] [0.004]ttrans 0.056*
[0.033]rddum 0.034*** [0.006]N 70425 68350 68350 68348 47856
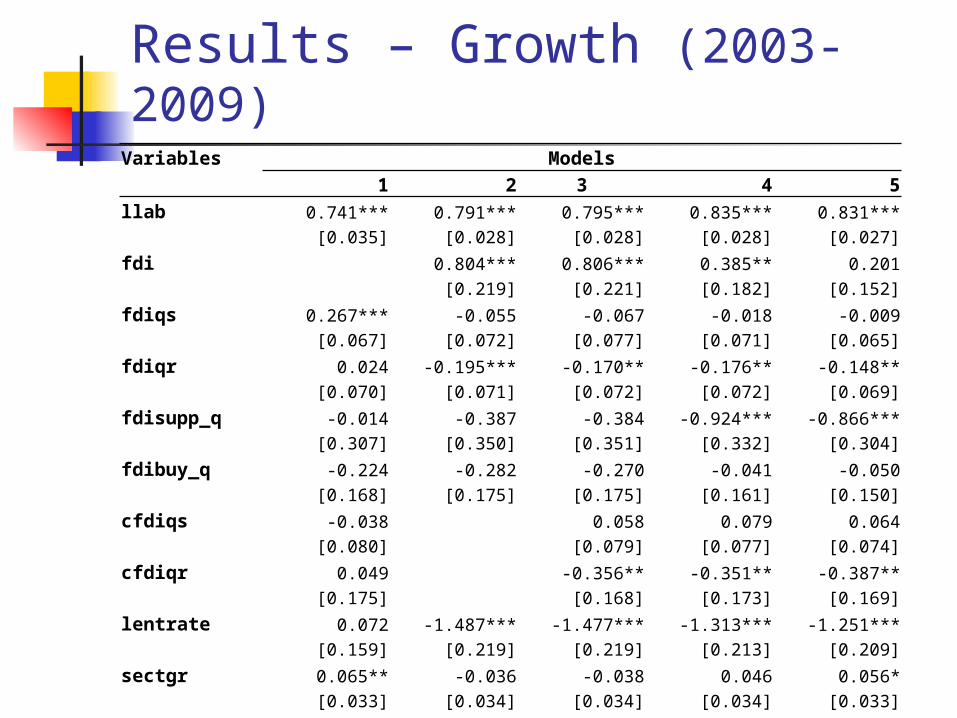
Results – Growth (2003-2009)Variables Models 1 2 3 4 5llab 0.741*** 0.791*** 0.795*** 0.835*** 0.831***
[0.035] [0.028] [0.028] [0.028] [0.027]fdi 0.804*** 0.806*** 0.385** 0.201
[0.219] [0.221] [0.182] [0.152]fdiqs 0.267*** -0.055 -0.067 -0.018 -0.009
[0.067] [0.072] [0.077] [0.071] [0.065]fdiqr 0.024 -0.195*** -0.170** -0.176** -0.148**
[0.070] [0.071] [0.072] [0.072] [0.069]fdisupp_q -0.014 -0.387 -0.384 -0.924*** -0.866***
[0.307] [0.350] [0.351] [0.332] [0.304]fdibuy_q -0.224 -0.282 -0.270 -0.041 -0.050
[0.168] [0.175] [0.175] [0.161] [0.150]cfdiqs -0.038 0.058 0.079 0.064
[0.080] [0.079] [0.077] [0.074]cfdiqr 0.049 -0.356** -0.351** -0.387**
[0.175] [0.168] [0.173] [0.169]lentrate 0.072 -1.487*** -1.477*** -1.313*** -1.251***
[0.159] [0.219] [0.219] [0.213] [0.209]sectgr 0.065** -0.036 -0.038 0.046 0.056*
[0.033] [0.034] [0.034] [0.034] [0.033]sectgrpr 0.176*** 0.203*** 0.205*** 0.172** 0.187***
[0.062] [0.072] [0.072] [0.072] [0.070]

Results – Growth (2003-2009)Variables Models 1 2 3 4 5hhi -0.265*** -0.077 -0.070 -0.112 -0.123*
[0.097] [0.082] [0.082] [0.076] [0.074]mes 0.089*** 0.018 0.016 0.001 0.006
[0.023] [0.017] [0.017] [0.017] [0.016]lage -0.457*** -0.466*** -0.465*** -0.454***
[0.026] [0.026] [0.027] [0.026]lw 0.277*** 0.274*** 0.210*** 0.218***
[0.052] [0.053] [0.051] [0.049]pmargin 0.510*** 0.505*** 0.405*** 0.401***
[0.052] [0.052] [0.057] [0.056]subinput 0.113 0.117 0.116 0.125
[0.092] [0.092] [0.100] [0.096]suboutput 0.047 0.045 0.081** 0.080**
[0.033] [0.033] [0.034] [0.034]kl 0.050*** 0.052***
[0.009] [0.009]ttrans 0.038
[0.023]rddum 0.015
[0.060]N 8617 8437 8437 7450 7450

Results – Growth Model Foreign firms have higher growth rates than
domestic firms, even after controlling for a number of firm-specific variables, including unobserved firm-specific factors.
The presence of foreign firms has a detrimental impact on the growth rate of domestic firms that
either use more inputs from foreign-dominated sectors, or operate in regions where the share of foreign firms in
regional output increase Unexpected result: Foreign presence in supplier
industries has also a negative impact on survival of user firms.

Impact of economic crises on growth and survival
1990 1992 1994 1996 1998 2000 2002 2004 2006 2008 2010
-2.0
-1.5
-1.0
-0.5
0.0
0.5
1.0
1.5
2.0
Survival Growth

Impact of economic crises on survival (by ownership)
1990 1992 1994 1996 1998 2000 2002 2004 2006 2008 2010
-2.0
-1.5
-1.0
-0.5
0.0
0.5
1.0
1.5
2.0
Domestic Foreign

Impact of economic crises on Growth (by ownership)
1990 1992 1994 1996 1998 2000 2002 2004 2006 2008 2010
-2.0
-1.5
-1.0
-0.5
0.0
0.5
1.0
1.5
2.0
Domestic Foreign

Conclusions There are significant differences
between entry characteristics of foreign and domestic plants.
Entry-level differences persist after entry, and foreign plants are more likely to survive.
Although foreign plants are less likely to exit, neither foreign ownership itself nor foreign presence in the market matter for survival.
For growth, however, foreign ownership matters

Thanks …