Foreign Direct Investment in Sub-Saharan Africa ...
47
UNITED NATIONS INDUSTRIAL DEVELOPMENT ORGANIZATION Vienna International Centre, P.O. Box 300, 1400 Vienna, Austria Tel: (+43-1) 26026-0 · www.unido.org · [email protected] OCCASION This publication has been made available to the public on the occasion of the 50 th anniversary of the United Nations Industrial Development Organisation. DISCLAIMER This document has been produced without formal United Nations editing. The designations employed and the presentation of the material in this document do not imply the expression of any opinion whatsoever on the part of the Secretariat of the United Nations Industrial Development Organization (UNIDO) concerning the legal status of any country, territory, city or area or of its authorities, or concerning the delimitation of its frontiers or boundaries, or its economic system or degree of development. Designations such as “developed”, “industrialized” and “developing” are intended for statistical convenience and do not necessarily express a judgment about the stage reached by a particular country or area in the development process. Mention of firm names or commercial products does not constitute an endorsement by UNIDO. FAIR USE POLICY Any part of this publication may be quoted and referenced for educational and research purposes without additional permission from UNIDO. However, those who make use of quoting and referencing this publication are requested to follow the Fair Use Policy of giving due credit to UNIDO. CONTACT Please contact [email protected] for further information concerning UNIDO publications. For more information about UNIDO, please visit us at www.unido.org
Transcript of Foreign Direct Investment in Sub-Saharan Africa ...

UNITED NATIONS INDUSTRIAL DEVELOPMENT ORGANIZATION Vienna International Centre, P.O. Box 300, 1400 Vienna, Austria
Tel: (+43-1) 26026-0 · www.unido.org · [email protected]
OCCASION
This publication has been made available to the public on the occasion of the 50th
anniversary of the
United Nations Industrial Development Organisation.
DISCLAIMER
This document has been produced without formal United Nations editing. The designations
employed and the presentation of the material in this document do not imply the expression of any
opinion whatsoever on the part of the Secretariat of the United Nations Industrial Development
Organization (UNIDO) concerning the legal status of any country, territory, city or area or of its
authorities, or concerning the delimitation of its frontiers or boundaries, or its economic system or
degree of development. Designations such as “developed”, “industrialized” and “developing” are
intended for statistical convenience and do not necessarily express a judgment about the stage
reached by a particular country or area in the development process. Mention of firm names or
commercial products does not constitute an endorsement by UNIDO.
FAIR USE POLICY
Any part of this publication may be quoted and referenced for educational and research purposes
without additional permission from UNIDO. However, those who make use of quoting and
referencing this publication are requested to follow the Fair Use Policy of giving due credit to
UNIDO.
CONTACT
Please contact [email protected] for further information concerning UNIDO publications.
For more information about UNIDO, please visit us at www.unido.org
Foreign Direct Investment inSub-Saharan Africa:Determinants and LocationDecisions
UNITED NATIONS INDUSTRIAL DEVELOPMENT ORGANIZATION
R e s e a r c h a n d Sta t i s t i c s B r a n c h
w o r k i n g p a p e r 0 8 / 2 0 0 8


UNITED NATIONS INDUSTRIAL DEVELOPMENT ORGANIZATIONVienna, 2009
RESEARCH AND STATISTICS BRANCHWORKING PAPER 08/2008
Foreign Direct Investment in Sub-Saharan Africa:
Determinants and Location Decisions
Frank L. BartelsUnit Chief, Strategic Research and Regional Analyses Unit
UNIDO
Stefan KratzschUNIDO Consultant
Markus EicherProject Manager, SEQUA GmbH
The designations employed, descriptions and classifications of countries, and the presentation of the material in this report do not imply the expression of any opinion whatsoever on the part of the Secretariat of the United Nations Industrial Development Organization (UNIDO) concerning the legal status of any country, territory, city or area or of its authorities, or concerning the delimitation of its frontiers or boundaries, or its economic system or degree of development. The responsibility for opinions expressed rests solely with the authors, and publication does not constitute an endorsement by UNIDO of the opinions expressed. Although great care has been taken to maintain the accuracy of information herein, neither UNIDO nor its member States assume any responsibility for consequences, which may arise from the use of the material. This report may be freely quoted or reprinted but acknowledgement is requested. This report has been produced without formal United Nations editing. The views expressed in this report do not necessarily reflect the views of the Secretariat of the UNIDO. Terms such as “developed, “industrialized” and “developing” are intended for statistical convenience and do not necessarily express a judgment. Any indication of, or reference to, a country, institution or other legal entity does not constitute an endorsement.

iii
Abstract
This paper examines the determinants of Foreign Direct Investment decisions in relation to
location factors in Sub-Saharan Africa (SSA). Principal components factor analysis reveals
that foreign firms are primarily concerned with political economy in SSA that ensures a
sound investment climate and transparent legal framework. This finding remains unchanged
when controlled for two clusters of host countries. Other important factors in the investment
location decision are international trade agreements and production inputs.
KEY WORDS: Foreign Direct Investment Motivation, Determinants, Multinational
Enterprises, Sub-Saharan Africa

1
1 Introduction
Sub-Saharan Africa’s (SSA)1 economic performance (Fosu, Krishnan and Ndikumana 2004),
despite improvements regarding commodities and trade with China and India, has been
relatively poor2 in comparison with South-East and East Asia (Arrighi 2002; Ayittey 2005;
Lall and Kraemer-Mbula 2005), where Foreign Direct Investment (FDI) has played a major
role in economic development. Nevertheless, SSA performance since 2002 has improved
with real GDP growth rates moving from 3% to 4% (2002) to 5% to 6% (2006) (IMF 2007).
Growth accounting empiricists have identified sources of total factor productivity that
stimulate FDI (Khawar 2005; Roy and Van den Berg 2006), inter alia positive externalities
derived from investment and trade openness (Bartels 2007), as well as reasons for weak
growth in SSA (Easterly and Levine 1997; Durlauf and Quah 1998; Pattillo et al. 2005). The
analysis indicates the general inability of policy makers in SSA to cohere the complex
institutional and managerial linkages among the ‘deep determinants’ of income3 (Rodrik and
Subramanian 2003). Despite relatively poor SSA economic conditions, FDI inflows have
risen from US$5 billion (1995) to US$18 billion (2005) even though Africa’s share in world
FDI inflows have declined over the long-term (UNCTAD 2006, pp. 40-41; UNIDO 2007[a]).
The global trends within which FDI occurs are: the superior rate of world trade growth
compared to world output growth since 1960s; the superior rate of FDI growth compared to
world trade growth during 1980-2000; three-quarters of world trade occurring internally
within the international operations of Multinational Enterprises (MNEs) as geo-spatially
distributed intra- and inter-firm relations4; the superior rate of growth in vertically integrated
1 Sub-Saharan Africa refers to the following 47 countries: Angola, Benin, Botswana, Burkina Faso, Burundi, Cameroon, Cape Verde, Central African Republic, Chad, Comoros, Congo, Democratic Republic of the Congo, Côte d'Ivoire, Djibouti, Equatorial Guinea, Eritrea, Ethiopia, Gabon, Gambia, Ghana, Guinea, Guinea-Bissau, Kenya, Lesotho, Liberia, Madagascar, Malawi, Mali, Mauritania, Mauritius, Mozambique, Namibia, Niger, Nigeria, Rwanda, Sao Tome and Principe, Senegal, Seychelles, Sierra Leone, Somalia, Sudan, Swaziland, Tanzania, Togo, Uganda, , Zambia, Zimbabwe. South Africa is not included in the sample of SSA countries unless it is explicitly indicated. 2 Sub-Saharan African (SSA) countries feature prominently in the Failed States Index 2007 compiled by Foreign Policy July/August 2007. The 1980-2002 period was one of dismal GDP per capita performance. Thirty out of forty-five SSA economies experienced either negative compound annual growth or between 0% and 1% in real GDP per capita. The rest performed at rates between 1% and 4% real GDP per capita growth [Multilateral Economic Development Efforts in Sub-Saharan Africa, Brett D. Shaefer, Heritage Lectures, No.858, 6 November 2004]. 3 These are geography, institutions and integration with world economic activity. 4 Approximately 70% to 80% of world trade is either within or between, MNEs.

2
intra-industry trade (�30% of world trade) compared to FDI growth; and the superior rate of
growth of financial capitalism compared to world output growth5.
Global inflows of FDI, with twin peaks in 2000 (US$1.4 trillion) and 2006 (US$1.3 trillion),
have been influenced by two major developments (Buckley 2003). The first is market
liberalisation and deregulation associated with multilateral agreements and structural
adjustment conditionalities. MNEs—the main actors intermediating the world economy—
therefore benefit from a wider range of investment locations to suit their strategic and
operational objectives. The second is the managerial capability and tentacular reach of
MNEs that enable worldwide orchestration of integrated production—the spatial location of
manufacturing operations and distribution of services—through horizontal and vertical FDI
(Urata and Kawai 2000; Buckley and Hashai 2004). MNEs act as governors of asset and
information networks of internalised transactions between multi-supply sources,
transformational multi-production bases (Dunning 2003) and multi-sales subsidiaries for
efficient distribution. Thus, MNEs reduce costs and increase market shares and
competitiveness (Bartels and Pass 2000; Buckley and Ghauri 2004).
SSA suffers from the disparities of globalisation (Chang 2007). Its regional trade agreements
are incoherent (Schiff and Winters 2003; Yang and Gupta 2005). Foreign capital is
comparatively sparse (UNCTAD 2006). SSA’s share of world FDI inward stocks is
disappointingly about 1%. Asymmetries persist within the region with the bulk of FDI
inflows to the primary resource sector. Empirical research on FDI in SSA tends to be limited,
with relatively few academic journal articles (Bartels et al. 2002). Given the trade and
financial linkages between industrialised, emerging and developing economies (Ak�n and
Kose 2008), and threats to FDI6, FDI inflows to SSA warrant examination. Of special
interest are FDI location decision determinants. We are primarily interested in determinants
in the pre-investment phase.
This paper identifies, through factor analysis of location variables from 718 foreign investors
and MNEs7 in 11 SSA countries, the determining factors of FDI. The paper is organised as
follows: the next section addresses strands of literature concerning motives for FDI. The 5 See “Unfettered finance is fast reshaping the global economy”, Martin Wolf, Financial Times, 18 June 2007. 6 See “Left in the cold: Foreign bidders find themselves out of favour”, Alan Beattie, Stephanie Kirchgaessner and Raphael Minder, Analysis, Financial Times, 25 April 2008, p. 9. 7 Throughout this paper the terms foreign investors and MNEs are used interchangeably.
3
third section deals with FDI trends. Empirical analysis in the fourth section sheds light on the
determinants of FDI. Section five discusses results. Section six concludes.
2 Literature review
A formal definition for FDI, as a phenomenon of international business, is investment “that
reflects the objective of a resident entity in one economy obtaining a lasting interest in an
enterprise resident in another economy” (IMF 1993, p. 86). The resident entity (foreign
investor) owns an equity capital stake of at least 10% of the ordinary shares in an
incorporated enterprise, or its equivalent for an unincorporated enterprise. This reflects a
long-term relationship between the investor and the enterprise, and implies a significant
degree of influence by the investor in enterprise management8. In contrast, foreign portfolio
investors possess an equity stake of less than 10% (OECD 1996). A direct investment
enterprise can be a subsidiary (a non-resident investor owns more than 50%), associates (an
investors owns 50% or less) and branches (wholly or jointly owned unincorporated
enterprises) either directly or indirectly owned by the foreign investor. The influence by the
foreign investor on the enterprise arises from firm specific ownership, monopolistic or
oligopolistic, advantages that allow MNEs to outperform indigenous firms in international
business and local markets (Kindleberger 1969; Caves 1971; Hymer 1976; Jensen 2006).
The ability to dominate transaction and transformation in international business is due to
MNEs’ internalisation processes and product evolution (Vernon 1966, 1974). The MNE
configures and reconfigures locational decisions as a function of the transaction costs of
stages of production and outsources operational capacities to countries with competitive
exchange rates and productivity-adjusted costs of labour (Razafimahefa and Hamori 2005).
The transaction cost approach to FDI argues that firms’ activity to serve markets is far from
costless (Coase 1937, 1972). A transaction cost occurs, when a product or service “is
transferred across a technologically separable interface” (Teece 1984, p. 99). In order to
avoid market failure, non-fully contingent contracts, asymmetries in information and
8 To put the phenomenon of inward FDI and its associated stock in perspective, FDI inflows in 2005 at US$916 billion represented about 10% of global gross fixed capital formation while inward FDI stock at US$10,130 billion was about 23% of global GDP at 2005 current prices. Furthermore, according to UNCTAD (2006) the total sales of foreign affiliates at US$22,171 billion represents about 50% of global GDP, while the ratio total assets of foreign affiliates to global GDP is US$45,564 billion to US$44,674 billion.
4
knowledge, firms internalise markets (Williamson 1979; Buckley and Casson 1985). The
transaction cost theory is therefore an important antecedent of the internalisation theory
which is founded on imperfect markets in general, and on imperfections in intermediate
product markets in particular (Dunning 2003). An efficiency-seeking firm has incentives to
bypass imperfect markets by incorporating such markets under common ownership, control
and governance. MNEs are generated because of the internalisation of cross-border
(intermediate) markets (Buckley and Casson 1976).
The eclectic paradigm avows that FDI is determined by the dynamics of three interdependent
variables – firm specific ownership advantages (O), location specific advantages (L) and
cross border intermediate product and/or market internalisation advantages (I) (Dunning
2000). The first condition for international production is possession of ownership-specific
advantages superior to indigenous firms (Dunning 1977; Dunning (ed.) 1985). There are two
main types of ownership advantages: property rights and/or intangible assets that form the
knowledge resource structure of the investing firm; and management assets enabling the firm
to organise efficiently—-to co-ordinate value-added, or transformational, activities in
geographically different locations for transaction cost minimisation—and to use accumulated
experience for risk diversification. Consequently, MNEs predominate in high R&D
expenditure industries that manufacture innovative, technically complex and differentiated
products (Markusen 1995; Cantwell and Mudambi 2000).
To complement transportable firm specific advantages, MNEs seek different types of
immobile locational advantages according to combinations of different motives for foreign
production (Dunning 1993). These fall into efficiency-, market- and strategic asset-seeking
categories within the rubric of: cost-based factors; vertical integration; investment climate;
host and regional market factors; ‘push’ (parent country encouragements); and ‘pull’ (host
government inducements) (Dunning 2000). Strategic asset- or resource-seeking MNEs focus
on supply-oriented variables (Castro 2007), and assets for the economic growth of the home
country (Jenkins and Edwards 2006; Ndikumana and Verick 2008)9. Market-seeking MNEs
focus on demand-oriented variables. Efficiency-seeking MNEs wish to reduce transaction
costs and enhance productivity through economies of scale.
9 This is cogent in the light of recent evidence of increasing outward FDI from China and India particularly and Asia in general into SSA (see The New Colonialists: A Special Report on China’s Thirst for Resources, The Economist, Vol. 386, No. 8571, 15 March 2008).
5
Given the differentiated attractions of alternative locations, MNEs take different paths to
leverage core competencies in the most efficient way. FDI is likely if the net benefits of own
foreign production, integrated along global value (and supply) chains, exceed those of inter-
firm agreements (UNIDO 2003[c]).
Once the MNE sees its “wish-list”10 (UNIDO 2003[a], p. 301) well met in a location, and its
OLI advantages are competitive, it may favour FDI as a function of location factors: policy
(Bende-Nabende 2002), infrastructure (Ayanwale 2007) and investment governance (Naudé
and Krugell 2007; Bartels and Alladina 2008/09), in relation to entry mode options within
autonomous and dependent intermediation (Bartels and Pass 2000; Raff, Ryan and Stähler
2007, 2008). The FDI performance and future prospects determine divestment or re-
investment (Marcin 2008). Spatial agglomeration effects (Giroud and Delane 2008) can lead
to rival investors who are forced—in the case of ‘follow the leader’—to invest in the same
location (Knickerbocker 1973; Birkinshaw and Hood 2000).
FDI impinges not only host location factors by crowding-in domestic investment (Ndikumana
and Verick 2008) and real exchange rate appreciation (Lartey 2007), but also changes the
strategic objectives and characteristics of the firm per se through learning, acquiring
competitors or forming joint ventures (Bartels et al. 2002; Mahnke et al. 2005) and executing
a real options strategy (Trigeorgis 1996). Furthermore, relations between investors and non-
market actors are marked by co-operation and conflict between firms and political actors
(incumbent government and insurgents) (Boddewyn and Brewer 1994). Clearly, the
characteristics of locations are crucial to FDI11.
10 Political stability (because capital investments are time framed longer than the incumbency of elected governments or electoral cycle), Economic stability (economic strength through a ‘fabric’ of transactions, intermediation, sub-contracting that is robust), International outlook (global in thinking/behaviour with respect to best practice and policy framework), Government regulations (clarity and consistent interpretation of rules; purpose of regulations), Infrastructure (distribution logistics efficiencies and operabilities; data communications/infrastructure), Labour (profile of skills), Banking/Finance (strong intermediation capabilities and capacities), Government attitude (service orientation), Local business infrastructure (backward and forward linkages) and Quality of life (personal safety/health/education lifestyle). 11 See “Foreign Direct investment and the Locational Competitiveness of Countries”, John Dunning and Feng Zhang, Paper at UNCTAD 2007 Conference in Honour of Sanjaya Lall, for the correlation between competitiveness and share of global FDI, Geneva, 8-9/March/2007.

6
3 FDI trends in Sub-Saharan Africa
Persistently low FDI inflows to Africa and SSA have increased to reach US$35.5 billion in
2006 for Africa (UNCTAD 2007). The gap between worldwide and SSA FDI inflows has
continued to increase excepting in 2001 to 2004 when global FDI inflows decreased.
Figure 1: FDI inflows (in $billion) to SSA (without South Africa) and the world, 1980-2006
0 .8 3
3 .2 5 3 .0 23 .5 5
6 .2 5
7 .6 7
5 .7 3
8 .2 4
9 .6 0
1 3 .9 2
16 .0 9
1 .4 51 .4 80 .2 7
1 2 .1 11 2 .17
4 .5 53 .6 7
3 .2 01 .7 4
1 .4 10 .6 90 .5 6
2 .2 42 .3 81 .6 21 .4 4
0
2
4
6
8
10
12
14
16
18
19801981
19821983
19841985
19861987
19881989
19901991
19921993
19941995
19961997
19981999
20002001
20022003
20042005
2006
S o u r ce: U N C T AD 2008 (F D I D a tab ase )
FDI I
nlow
s to
Sub
-Sah
aran
Afri
ca
(Bill
ions
of U
SD)
0
200
400
600
800
1000
1200
1400
1600
Wor
ld F
DI I
nflo
ws
(Bill
ions
of U
SD)
F D I In flo w s to S u b -S ah ar an Afr ica
W o r ld F D I In flo w s
Africa’s share of global FDI inflows decreased from 3.3% in 2003 to 2.7% in 2006
(UNCTAD 2007). Between 1995 and 1999, the average FDI inflow per capita was
US$11.9—the lowest ratio worldwide—and the annual share of SSA in global FDI inflows
remains very low at an average 1.2% since 1992 (Table 1).

7
Table 1: Regional FDI inflows, 1992-2006, % of world total
1992 1993 1994 1995 1996 1997 1998 1999 2000 2001 2002 2003 2004 2005 2006
Developed Countries 67.8% 63.9% 58.3% 64.8% 61.0% 58.6% 71.8% 78.3% 81.2% 73.2% 71.1% 64.0% 56.4% 62.4% 65.7%South East
Europe & CIS 1.0% 1.5% 1.0% 1.4% 1.6% 2.5% 1.5% 0.9% 0.6% 1.4% 2.2% 4.3% 5.4% 4.4% 5.3%Asia & the
Pacific 19.4% 25.1% 26.9% 23.6% 24.1% 21.7% 13.5% 10.2% 10.5% 13.6% 15.8% 20.4% 23.0% 22.1% 19.9%Latin America
& the Caribbean 9.5% 7.1% 11.4% 8.6% 11.8% 15.0% 11.9% 9.5% 6.9% 9.4% 8.7% 7.9% 12.7% 8.0% 6.4%
Northern & South Africa 0.9% 1.1% 1.0% 0.7% 0.6% 1.3% 0.5% 0.4% 0.3% 1.4% 0.6% 0.8% 0.8% 1.8% 1.5%
Developing Countries
Africa Sub-
Saharan Africa 1.3% 1.3% 1.4% 0.9% 0.9% 0.9% 0.9% 0.7% 0.4% 1.0% 1.5% 2.5% 1.6 % 1.3% 1.2%
Total 100% 100% 100% 100% 100% 100% 100% 100% 100% 100% 100% 100% 100% 100% 100%
Source: UNCTAD 2008 (FDI Database)
FDI flows to SSA are highly asymmetric, asset specific and volatile. The most recipient
countries are Angola, Chad, Ghana, Nigeria, Sudan, Equatorial Guinea, Congo (Democratic
Republic) (UNCTAD 2007). SSA’s share of worldwide FDI stocks, falling from 2.3% in
1980 to 1.1% in 2006, provides further evidence of economic marginalisation. Despite
relatively low growth and productivity as well as poor institutional quality12 (Dollar and
Levin 2005; World Bank 2007) the fact is FDI does flow to SSA. Hence the locational
determinants warrant scrutiny for policy insights.
4 Analyses of FDI location determinants in Sub Saharan Africa
4.1 The data
The data comes from UNIDO’s 2003 survey of MNEs in SSA (UNIDO 2003[b])13. MNEs14
in 11 SSA countries15 completed a questionnaire with variables from the FDI literature. The
data possesses high face and construct validity. More than 90% of respondents are senior
managers16. The 37%17 response rate reflects other MNE surveys (Bartels and Mirza 1999;
12 The World Bank Doing Business map (www.doingbusiness.org/map) shows that most SSA countries have difficult business environments, protect investors the least, and have the longest export delays. 13 The survey was validated in 2001 through pilot testing with 432 respondents in Ethiopia, Nigeria, Tanzania and Uganda. 14 Mining and oil exploration companies were not included. 15 Burkina Faso, Cameroon, Ethiopia, Kenya, Madagascar, Mozambique, Nigeria, Senegal, Tanzania, Uganda and Malawi. 16 Managing Director, Marketing Manager or Financial Controller. 17 2160 questionnaires were dispatched.

8
Kwak and Radler 2002; Harzing 2006). 799 questionnaires were returned of which 718
(33%) were analyzed. The analysis is based on the question asking foreign investors to give
reasons for their investment in the respective host country from a list of 22 location variables
on a Likert scale of “not important”, “important” and “crucial”.
Appendix 1 shows the question. We parametise “not important” as “1”, “important” as “2”
and “crucial” as “3” (Labovitz 1970, 1971). Table 2 depicts the survey response rates. There
is a bias towards (South-) Eastern African countries as they account for 70% of the sample.18
At the country level, respondents from Tanzania, Uganda and Mozambique have a
comparably high share (>12%).
4.2 Methodology
The statistical techniques applied are factor analysis and cluster analysis. Factor analysis is
“a procedure that postulates that the correlations or covariance between a set of observed
variables, x’=[x1, x2,..., xq] arise from the relationship of these variables to a small number of
underlying, unobservable, latent variables, usually known as the common factors” (Everitt
2002, p. 140). There are less factors f’=[ f1, f2,..., fk] than variables (k<q). Our factor
analysis is exploratory as we set no a priori constraints on the data structure. We search for
factors that influence the 22 location variables (Kratzsch 2005). Factor analysis enables
parsimonious reduction of the number of variables without losing the underlying pattern in
the variation of variables (Hair et al. 1998). We use Kaiser’s criterion (Kaiser 1960) to
determine the number of factors to be extracted. Accordingly, a factor is disregarded unless
18 Ethiopia, Kenya, Madagascar, Malawi, Mozambique, Tanzania and Uganda.
Table 2: Survey response rates
Questionnaires returned
Questionnaires returned and with question No. 17 valid Questionnaire with No. 17 valid (%)
Burkina Faso 54 48 6.69 Cameroon 60 54 7.52 Ethiopia 55 48 6.69 Kenya 92 86 11.98 Madagascar 82 77 10.72 Malawi 41 16 2.23 Mozambique 97 89 12.40 Nigeria 85 81 11.28 Senegal 38 32 4.46 Tanzania 100 97 13.51 Uganda 95 90 12.53 Total 799 718 100

9
it can explain the variance of at least a single variable (“Eigenvalue” >1). To achieve
explanatory power, we require our factors to explain at least 50% of the total cumulative
variance in the data. As we do not stipulate factors to be uncorrelated, we apply oblique
rotation (Bryman and Cramer 2001)19 which, in this case, represents the pattern of variables
more accurately than orthogonal rotation (Hair et al. 1998).
Variables with less than 0.55 co-efficient loading (<30.25% of the variance accounted for by
the factor) are suppressed. The criteria for factor loadings cut off remain contentious
(Cudeck and O’Dell 1994; Hair et al. 1998). Heuristics suggest that loadings �0.30 are
salient. Selection between 0.30 and 0.60 are common in factor analysis (Schwartz 1971). In
factor analysis, the most challenging issue is labelling factors concisely to indicate underlying
constructs meaningfully. Generally, variables with higher loadings are more important for
the factor label. To increase analytical rigour in labelling factors, each set of variables
influenced by each factor is subjected to second order factor analysis. Furthermore, we
examine whether results are replicable for smaller sample sizes as congruent results enhance
analytical confidence and substantiate the generalisability of results. We split the sample into
two subsets by hierarchical cluster analysis and extract factors for each subset (Hair et al.
1998).20
4.3 Factor analysis results
We compute a 22x22 matrix of the inter-correlations between the 22 location variables. The
highest correlations, with correlations >0.500 (Table 3) and significant at the 0.01 level, are
between variables that determine political climate, trade and input factors.
19 In SPSS 11.0 � the program used for our statistical analyses � the oblique rotation method “Direct Oblimin” is selected. 20 Due to space limitations sub sample results are not reported but are discussed.
10
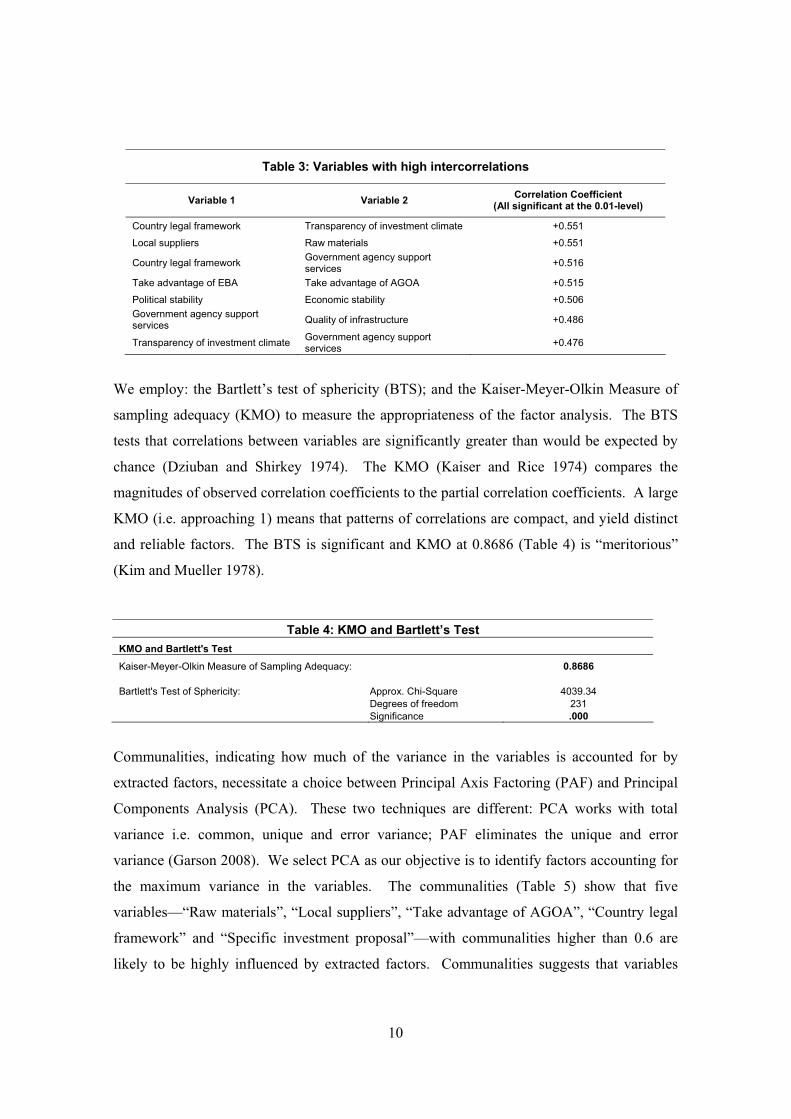
Table 3: Variables with high intercorrelations
Variable 1 Variable 2 Correlation Coefficient (All significant at the 0.01-level)
Country legal framework Transparency of investment climate +0.551
Local suppliers Raw materials +0.551
Country legal framework Government agency support services +0.516
Take advantage of EBA Take advantage of AGOA +0.515
Political stability Economic stability +0.506 Government agency support services Quality of infrastructure +0.486
Transparency of investment climate Government agency support services +0.476
We employ: the Bartlett’s test of sphericity (BTS); and the Kaiser-Meyer-Olkin Measure of
sampling adequacy (KMO) to measure the appropriateness of the factor analysis. The BTS
tests that correlations between variables are significantly greater than would be expected by
chance (Dziuban and Shirkey 1974). The KMO (Kaiser and Rice 1974) compares the
magnitudes of observed correlation coefficients to the partial correlation coefficients. A large
KMO (i.e. approaching 1) means that patterns of correlations are compact, and yield distinct
and reliable factors. The BTS is significant and KMO at 0.8686 (Table 4) is “meritorious”
(Kim and Mueller 1978).
Communalities, indicating how much of the variance in the variables is accounted for by
extracted factors, necessitate a choice between Principal Axis Factoring (PAF) and Principal
Components Analysis (PCA). These two techniques are different: PCA works with total
variance i.e. common, unique and error variance; PAF eliminates the unique and error
variance (Garson 2008). We select PCA as our objective is to identify factors accounting for
the maximum variance in the variables. The communalities (Table 5) show that five
variables—“Raw materials”, “Local suppliers”, “Take advantage of AGOA”, “Country legal
framework” and “Specific investment proposal”—with communalities higher than 0.6 are
likely to be highly influenced by extracted factors. Communalities suggests that variables
Table 4: KMO and Bartlett’s Test KMO and Bartlett's Test
Kaiser-Meyer-Olkin Measure of Sampling Adequacy: 0.8686
Bartlett's Test of Sphericity: Approx. Chi-Square 4039.34 Degrees of freedom 231 Significance .000
11
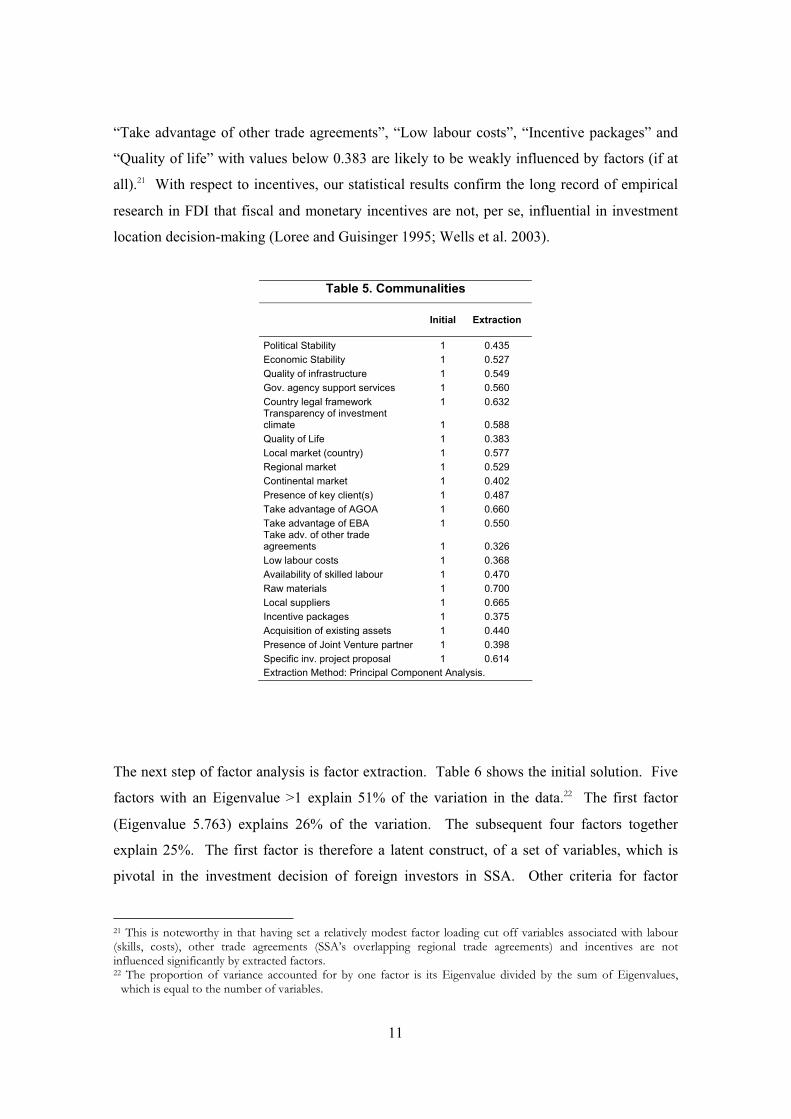
“Take advantage of other trade agreements”, “Low labour costs”, “Incentive packages” and
“Quality of life” with values below 0.383 are likely to be weakly influenced by factors (if at
all).21 With respect to incentives, our statistical results confirm the long record of empirical
research in FDI that fiscal and monetary incentives are not, per se, influential in investment
location decision-making (Loree and Guisinger 1995; Wells et al. 2003).
The next step of factor analysis is factor extraction. Table 6 shows the initial solution. Five
factors with an Eigenvalue >1 explain 51% of the variation in the data.22 The first factor
(Eigenvalue 5.763) explains 26% of the variation. The subsequent four factors together
explain 25%. The first factor is therefore a latent construct, of a set of variables, which is
pivotal in the investment decision of foreign investors in SSA. Other criteria for factor
21 This is noteworthy in that having set a relatively modest factor loading cut off variables associated with labour (skills, costs), other trade agreements (SSA’s overlapping regional trade agreements) and incentives are not influenced significantly by extracted factors. 22 The proportion of variance accounted for by one factor is its Eigenvalue divided by the sum of Eigenvalues,
which is equal to the number of variables.
Table 5. Communalities
Initial Extraction
Political Stability 1 0.435 Economic Stability 1 0.527 Quality of infrastructure 1 0.549 Gov. agency support services 1 0.560 Country legal framework 1 0.632 Transparency of investment climate 1 0.588 Quality of Life 1 0.383 Local market (country) 1 0.577 Regional market 1 0.529 Continental market 1 0.402 Presence of key client(s) 1 0.487 Take advantage of AGOA 1 0.660 Take advantage of EBA 1 0.550 Take adv. of other trade agreements 1 0.326 Low labour costs 1 0.368 Availability of skilled labour 1 0.470 Raw materials 1 0.700 Local suppliers 1 0.665 Incentive packages 1 0.375 Acquisition of existing assets 1 0.440 Presence of Joint Venture partner 1 0.398 Specific inv. project proposal 1 0.614 Extraction Method: Principal Component Analysis.

12
extraction [Cattel´s (1966) Scree Test], could retain more than these five factors. However,
even if we added two or three more factors, the total variation explained would only increase
by another 9% to 13% while risking factor over-extraction (Fava and Velicer 1992). For
parsimony, we retain five factors and proceed with factor rotation using oblique rotation.
Table 6: Total variance explained after factor extraction
The oblique rotation generates the Pattern Matrix (Table 7), which we use to label factors in
preference to the structure matrix which is the factor loading matrix from orthogonal rotation.
We set the cut-off point at 0.55 co-efficient factor loading, as we wish one single factor to
explain at least 30.25% (i.e. 0.552 x 100) of the variance in the respective variable. In the
Pattern Matrix each row represents one of the 22 observed variables and the five columns
represent extracted factors. The Pattern Matrix presents the unique relationship between the
factor and the variable (Tabachnik and Fidell 1996) and differentiates between high and low
loadings more precisely (Rummel 1970).
Initial Eigenvalues Extraction Sums of Squared Loadings Component Total % of Variance Cumulative % Total % of Variance Cumulative %
1 5.763 26.194 26.194 5.763 26.194 26.194 2 1.594 7.245 33.439 1.594 7.245 33.439 3 1.407 6.397 39.836 1.407 6.397 39.836 4 1.301 5.915 45.751 1.301 5.915 45.751 5 1.172 5.325 51.076 1.172 5.325 51.076 6 0.989 4.498 55.573 7 0.967 4.398 59.971 8 0.914 4.157 64.128 9 0.881 4.004 68.131
10 0.839 3.813 71.945 11 0.731 3.321 75.266 12 0.675 3.066 78.332 13 0.596 2.711 81.043 14 0.565 2.568 83.611 15 0.536 2.435 86.046 16 0.514 2.338 88.385 17 0.497 2.258 90.643 18 0.474 2.157 92.799 19 0.441 2.006 94.806 20 0.391 1.776 96.582 21 0.386 1.756 98.338 22 0.366 1.662 100
Extraction Method: Principal Component Analysis.
13
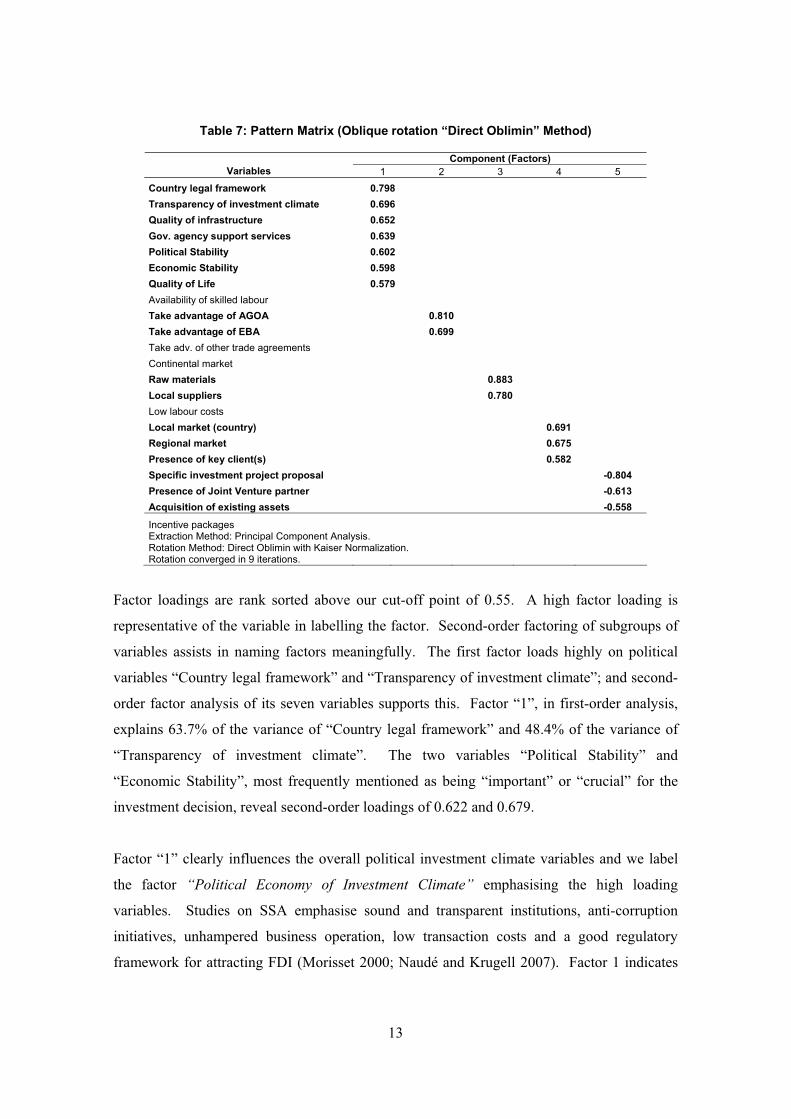
Table 7: Pattern Matrix (Oblique rotation “Direct Oblimin” Method)
Component (Factors) Variables 1 2 3 4 5
Country legal framework 0.798 Transparency of investment climate 0.696 Quality of infrastructure 0.652 Gov. agency support services 0.639 Political Stability 0.602 Economic Stability 0.598 Quality of Life 0.579 Availability of skilled labour Take advantage of AGOA 0.810 Take advantage of EBA 0.699 Take adv. of other trade agreements Continental market Raw materials 0.883 Local suppliers 0.780 Low labour costs Local market (country) 0.691 Regional market 0.675 Presence of key client(s) 0.582 Specific investment project proposal -0.804 Presence of Joint Venture partner -0.613 Acquisition of existing assets -0.558
Incentive packages Extraction Method: Principal Component Analysis. Rotation Method: Direct Oblimin with Kaiser Normalization. Rotation converged in 9 iterations.
Factor loadings are rank sorted above our cut-off point of 0.55. A high factor loading is
representative of the variable in labelling the factor. Second-order factoring of subgroups of
variables assists in naming factors meaningfully. The first factor loads highly on political
variables “Country legal framework” and “Transparency of investment climate”; and second-
order factor analysis of its seven variables supports this. Factor “1”, in first-order analysis,
explains 63.7% of the variance of “Country legal framework” and 48.4% of the variance of
“Transparency of investment climate”. The two variables “Political Stability” and
“Economic Stability”, most frequently mentioned as being “important” or “crucial” for the
investment decision, reveal second-order loadings of 0.622 and 0.679.
Factor “1” clearly influences the overall political investment climate variables and we label
the factor “Political Economy of Investment Climate” emphasising the high loading
variables. Studies on SSA emphasise sound and transparent institutions, anti-corruption
initiatives, unhampered business operation, low transaction costs and a good regulatory
framework for attracting FDI (Morisset 2000; Naudé and Krugell 2007). Factor 1 indicates
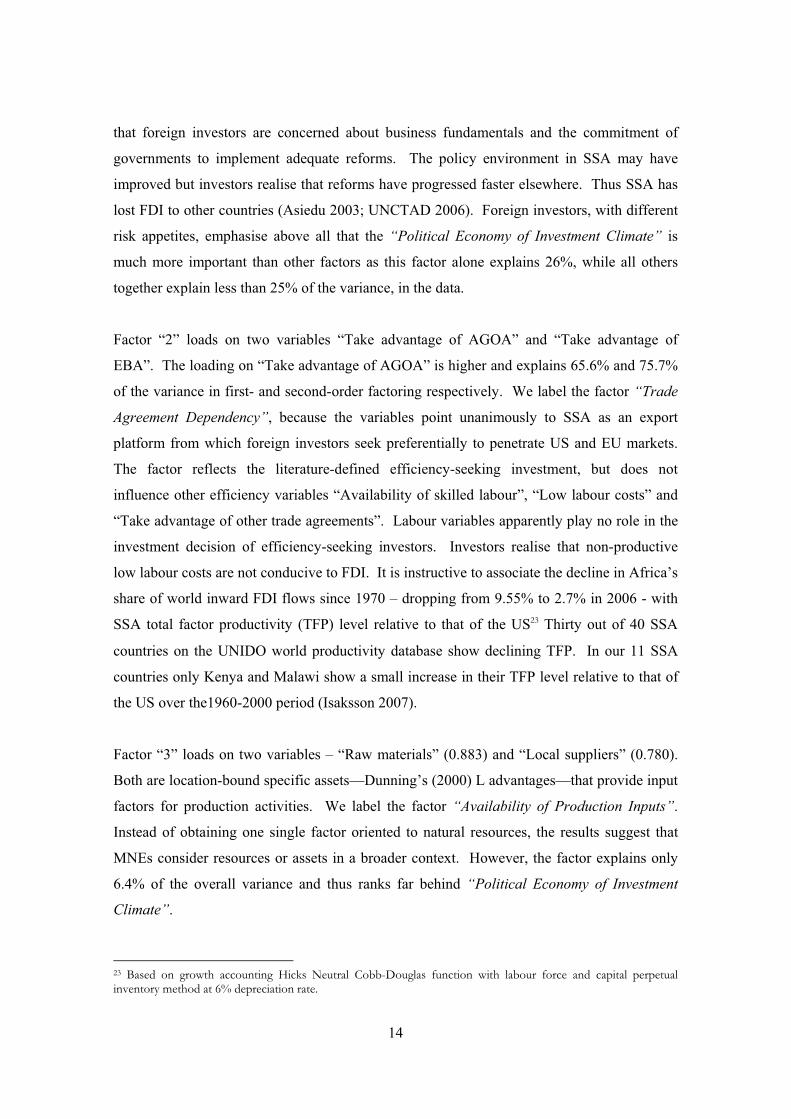
14
that foreign investors are concerned about business fundamentals and the commitment of
governments to implement adequate reforms. The policy environment in SSA may have
improved but investors realise that reforms have progressed faster elsewhere. Thus SSA has
lost FDI to other countries (Asiedu 2003; UNCTAD 2006). Foreign investors, with different
risk appetites, emphasise above all that the “Political Economy of Investment Climate” is
much more important than other factors as this factor alone explains 26%, while all others
together explain less than 25% of the variance, in the data.
Factor “2” loads on two variables “Take advantage of AGOA” and “Take advantage of
EBA”. The loading on “Take advantage of AGOA” is higher and explains 65.6% and 75.7%
of the variance in first- and second-order factoring respectively. We label the factor “Trade
Agreement Dependency”, because the variables point unanimously to SSA as an export
platform from which foreign investors seek preferentially to penetrate US and EU markets.
The factor reflects the literature-defined efficiency-seeking investment, but does not
influence other efficiency variables “Availability of skilled labour”, “Low labour costs” and
“Take advantage of other trade agreements”. Labour variables apparently play no role in the
investment decision of efficiency-seeking investors. Investors realise that non-productive
low labour costs are not conducive to FDI. It is instructive to associate the decline in Africa’s
share of world inward FDI flows since 1970 – dropping from 9.55% to 2.7% in 2006 - with
SSA total factor productivity (TFP) level relative to that of the US23 Thirty out of 40 SSA
countries on the UNIDO world productivity database show declining TFP. In our 11 SSA
countries only Kenya and Malawi show a small increase in their TFP level relative to that of
the US over the1960-2000 period (Isaksson 2007).
Factor “3” loads on two variables – “Raw materials” (0.883) and “Local suppliers” (0.780).
Both are location-bound specific assets—Dunning’s (2000) L advantages—that provide input
factors for production activities. We label the factor “Availability of Production Inputs”.
Instead of obtaining one single factor oriented to natural resources, the results suggest that
MNEs consider resources or assets in a broader context. However, the factor explains only
6.4% of the overall variance and thus ranks far behind “Political Economy of Investment
Climate”.
23 Based on growth accounting Hicks Neutral Cobb-Douglas function with labour force and capital perpetual inventory method at 6% depreciation rate.

15
Factor “4” loads on three variables “Local market”, “Regional market” and “Presence of key
client(s)” and explains between 34% - 48% and 72% - 73% of variances in first- and second-
order factoring respectively. These variables are clearly related to “Local Market Demand”,
which is an appropriate label.
Factor “5” explains 5.3% of the total variance and influences the variables “Specific
investment project proposal”, “Acquisition of existing assets” and “Presence of joint venture
partners”. The second-order factoring indicates that the factor explains most of the variance
of “Presence of joint venture partners” (83.1%) followed by “Specific investment project
proposal” (80.3%). We name this factor “Propensity for Independent Market Entry”. The
factor shows a negative loading on the three variables, which means that it develops
conversely to its variables. It suggests that FDI decisions are also based on the degree of
autarky expected in host countries. Even though MNEs possess superior firm specific
advantages, the presence of potential joint venture partners might act as a deterrent to those
MNEs that do not wish to contest markets. A potential joint venture partner is seen as a
competitor who might threaten the investor’s monopolistic market position. Foreign
investors seem to forego the opportunity to use a joint venture for knowledge about
customers’ preferences, the market environment and marketing strategies. This is somewhat
counter to the literature which points to increasing incidence of joint ventures (Luo 2007). In
other words, MNEs are more likely to service foreign markets via wholly-owned subsidiaries
(local laws permitting) in the presence of low incidence of specific FDI proposals, low
numbers of joint venture potential partners and low levels of strategic assets.
We check whether the scale of the 22 variables is reproducible and reliable i.e. if they “are
free from error and yield consistent results” (Peter 1979, p. 6). Cronbach’s alpha for the
entire scale at 0.8587 is very acceptable (Nunnally 1967; Peterson 1994). We conclude that
the scale measures reliably the locational determinants of FDI to SSA. Since the factor
analysis splits up the entire scale of 22 items into five distinct scales we run separate
reliability analyses for each subset. The results are shown in Table 8.

16
Table 8: Reliability analyses for each factor
No. of items
Sum of item variances
Scale variance Cronbach´s Alpha
Political Economy of Investment Climate (F1) 7 3.0814 10.5387 0.8256
Trade Agreement Dependency (F2) 2 0.433 0.6529 0.6739
Availability of Production Inputs (F3) 2 1.1088 1.7117 0.7106
Local Market Demand (F4) 3 1.5708 2.5575 0.5787
Propensity for Independent Market Entry (F5) 3 1.0842 1.6611 0.5232
The first three factors show sufficiently high values of Cronbach’s alpha whereas the factor
“Propensity for Independent Market Entry” (F5) is relatively low regarding the acceptable
lower limit of a Cronbach’s alpha of 0.5 (Nunnally 1967). We compute a factor correlation
matrix indicating how the variance is shared between the correlated factors. This matrix is
given in Table 9. The low inter-correlations between the factors confirm that we have highly
distinct factors. Table 9: Matrix of Inter-factor correlations
Political Economy of Investment Climate (F1)
Trade Agreement Dependency (F2)
Availability of Production Inputs (F3)
Local Market Demand (F4)
Propensity for Independent Market Entry (F5)
Political Economy of Investment Climate (F1) 1
Trade Agreement Dependency (F2) 0.222 1
Availability of Production Inputs (F3) 0.364 0.184 1
Local Market Demand (F4) 0.264 0.106 0.206 1
Propensity for Independent Market Entry (F5) -0.247 -0.209 -0.267 -0.165 1
5 Discussion of results
The analyses identify the locational determinants of FDI to SSA, from a sample of 718
foreign investors in 11 SSA countries. Two further separate analyses (not tabulated herein)
for sub-samples of 408 foreign investors (seven SSA countries in cluster 1) and 310 foreign
investors (four SSA countries in cluster 2) were performed.
The single most important factors are “Political Economy of Investment Climate” for the
entire sample and cluster 1 and “Legal Environment of Governance” for cluster 2.
Globerman and Shapiro (2002) conceptualise this latter factor. According to Bhattacharya et
al. (1997, p. 5) “experience in other regions has shown that investors choose countries with
stable political and economic environments.” Both factors point to political variables as the
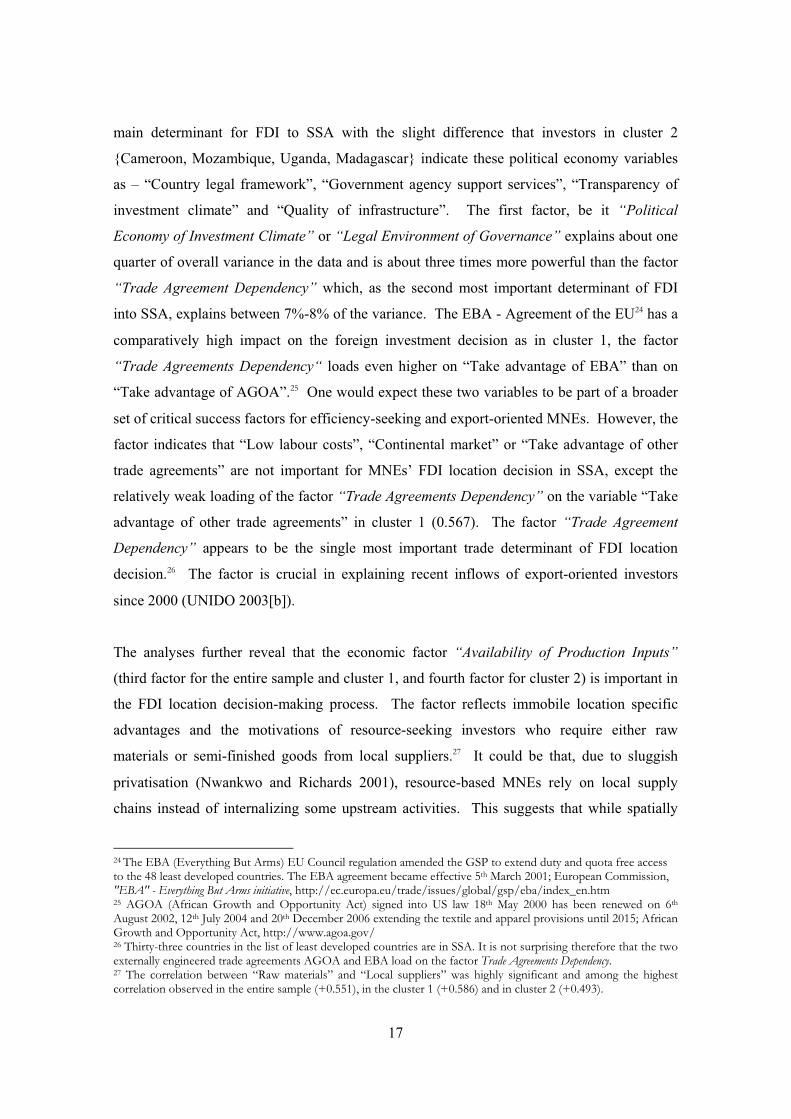
17
main determinant for FDI to SSA with the slight difference that investors in cluster 2
{Cameroon, Mozambique, Uganda, Madagascar} indicate these political economy variables
as – “Country legal framework”, “Government agency support services”, “Transparency of
investment climate” and “Quality of infrastructure”. The first factor, be it “Political
Economy of Investment Climate” or “Legal Environment of Governance” explains about one
quarter of overall variance in the data and is about three times more powerful than the factor
“Trade Agreement Dependency” which, as the second most important determinant of FDI
into SSA, explains between 7%-8% of the variance. The EBA - Agreement of the EU24 has a
comparatively high impact on the foreign investment decision as in cluster 1, the factor
“Trade Agreements Dependency“ loads even higher on “Take advantage of EBA” than on
“Take advantage of AGOA”.25 One would expect these two variables to be part of a broader
set of critical success factors for efficiency-seeking and export-oriented MNEs. However, the
factor indicates that “Low labour costs”, “Continental market” or “Take advantage of other
trade agreements” are not important for MNEs’ FDI location decision in SSA, except the
relatively weak loading of the factor “Trade Agreements Dependency” on the variable “Take
advantage of other trade agreements” in cluster 1 (0.567). The factor “Trade Agreement
Dependency” appears to be the single most important trade determinant of FDI location
decision.26 The factor is crucial in explaining recent inflows of export-oriented investors
since 2000 (UNIDO 2003[b]).
The analyses further reveal that the economic factor “Availability of Production Inputs”
(third factor for the entire sample and cluster 1, and fourth factor for cluster 2) is important in
the FDI location decision-making process. The factor reflects immobile location specific
advantages and the motivations of resource-seeking investors who require either raw
materials or semi-finished goods from local suppliers.27 It could be that, due to sluggish
privatisation (Nwankwo and Richards 2001), resource-based MNEs rely on local supply
chains instead of internalizing some upstream activities. This suggests that while spatially
24 The EBA (Everything But Arms) EU Council regulation amended the GSP to extend duty and quota free access to the 48 least developed countries. The EBA agreement became effective 5th March 2001; European Commission, "EBA" - Everything But Arms initiative, http://ec.europa.eu/trade/issues/global/gsp/eba/index_en.htm 25 AGOA (African Growth and Opportunity Act) signed into US law 18th May 2000 has been renewed on 6th August 2002, 12th July 2004 and 20th December 2006 extending the textile and apparel provisions until 2015; African Growth and Opportunity Act, http://www.agoa.gov/ 26 Thirty-three countries in the list of least developed countries are in SSA. It is not surprising therefore that the two externally engineered trade agreements AGOA and EBA load on the factor Trade Agreements Dependency. 27 The correlation between “Raw materials” and “Local suppliers” was highly significant and among the highest correlation observed in the entire sample (+0.551), in the cluster 1 (+0.586) and in cluster 2 (+0.493).

18
distributed production networks serving global, and regional, markets are predominant in
Southeast Asia (Felker 2003; Giroud 2004), and Central and Eastern Europe and US/Mexico
border respectively, there are indications that SSA is not devoid of such networks albeit at
simple levels of sophistication.
Cluster 2 generated another factor, “Responsiveness to Created Assets”. Further research is
needed to elucidate the emphasis of investors in Cameroon, Madagascar, Mozambique and
Uganda on acquisition opportunities, specific investment proposals and the presence of joint
venture partners. Having said this, it is remarkable that analysis for the entire sample
generated a factor “Propensity for Independent Market Entry” loading negatively on
variables that are related to the country’s created assets and by implication the promotional
efforts to make them available for foreign investors.
“Local Market Demand” forms a distinct factor albeit a less influential one than initially
expected. With the exception of Madagascar, Malawi and Burkina Faso, UNIDO’s survey
(UNIDO 2003[b]) targeted foreign investors in countries with relatively large and fast-
growing local markets. Nonetheless, the factor only explains 5.9% of the variance in the
whole sample and 6.3% in cluster 1. In cluster 2 a factor “Local Market Demand” does not
emerge.
Other variables filtered out by our factor loading coefficient cut-off point deserve attention.
“Incentive packages”, for example, are of minor importance in the interplay with other
location factors (Loree and Guisinger 1995). In none of our three factor analyses did the
variable “Incentive packages” load on any factor. This confirms the consistent empirical
literature regarding the relative unimportance of incentives and hence the generalisability of
this finding for developing countries. Hubert and Pain (2002) note that it is the levels of
fixed investment expenditure relative to that in competing locations which has the significant
positive impact on FDI in comparison to fiscal and financial incentives. Similarly, Zee et al.
(2002) find evidence that the efficacy of fiscal incentives in stimulating FDI is highly
inconclusive. Furthermore, Obazuaye (2000), in a study of FDI in SSA from 1980 to 1995
finds that incentives do not appear among the variables that catalyse FDI. It should be noted
that developing countries in general and SSA in particular lack credibility in their financial
and fiscal incentives (Oman 2000). Furthermore, Bjorvatn and Eckel (2006, p. 1906)
conclude that “with sufficiently large asymmetries between countries, policy competition is
19
less fierce and has less impact on the foreign firm’s location decision.” It is only after the
location decision is concluded that MNEs begin to exploit fiscal and financial incentives
available (Oman 2000).
A similar observation is made for the variables “Availability of skilled labour” and “Low
labour costs” which did not load on any factor. This represents structural deficiencies in
human capital formation and retention. According to Kaba (2004-05), about 10 million
Africans reside externally, mostly in EU and North America, including an estimated 5 million
African entrepreneurs, professionals and 40% of African managers. More African engineers,
scientists and technicians work in the US than in SSA. According to the International
Organization for Migration, Africa lost approximately 60,000 professionals between 1985
and 1990. The OECD indicates “the per cent of persons with tertiary education born in
certain African and Caribbean countries who are living in OECD countries exceeds 50%”
(OECD 2006, p. 39). As a result of macro-economic instability and poor infrastructure, SSA
suffers from high waste and production costs (Bhattacharya et al. 1997; UNCTAD 2006).
Apparently, the typical foreign investor in SSA is more concerned with location factors other
than the skill level of the country’s workforce.
More than 80% of the respondents in our sample run resource-based or low-technology-based
operations (UNIDO 2003[b]). Countries with a relatively higher share of FDI in industrial
chemicals, pharmaceuticals, machinery or standard electronics are Burkina Faso, Ethiopia,
Nigeria and Senegal. As these countries belong to cluster 1, we expected a stronger impact of
“Availability of skilled labour” in this cluster rather than in cluster 2 where resource-based
and low-technology manufacturers dominate. However, in cluster 1 we do not observe any
loading on “Availability of skilled labour”. The relative unimportance of “Availability of
skilled labour” reflects the general absence of skill-intensive FDI activities in SSA.
One might therefore expect “Low labour costs” to be comparably more important. Foreign
investors in the resource-based or low technology sectors should reap the benefits of labour-
abundance. However, the variable “Low labour costs” was not captured by any factor.
Obviously, foreign investors perceive the cost of labour to be disproportionate to its
productivity. Consequently major FDI flows are diverted away from SSA towards “real”
competitively skilled low-wage countries such as China, India or even Bangladesh, in the
sectors in which Africa competes. This is especially worrying as FDI is considered a key
20
channel to improve productivity performance through the circular causality between FDI and
output, and productivity growth with host and industry characteristics moderating the strength
of effects.
Regarding the first factor, SSA governance characteristics and institutional propensities28 lag
behind those of other developing regions (World Bank 2006; Kaufman, Kraay and Mastruzzi
2007)29. According to Marshall and Gurr (2005, p. 4) “instability in African states has
remained a fairly constant and serious problem since the decolonization period began”.
Clearly, from an institutional perspective Africa is a troubled continent and lacks robust
mechanisms for successfully moderating civil strife (Kaplan 1994; Gerhart 1995; Chabal and
Daloz 1999). In our 11 SSA countries, seven30 are in the top 40 of the Failed States Index
2006 and are considered “crisis” states31. This is the reason for the high explanatory power of
the first factor “Political Economy of Investment Climate”.
The “deep” fundamentals of development appear to be institutions (Rodrik et al. 2002),
integration (Frankel and Romer 1999) and geography (Sachs 2001). It is not surprising that
the first factor, accounting for 26% of variance in the data, influences institutional variables.
This factor “Political Economy of Investment Climate” explains 63.7% (0.7982 x 100%) of
the variance in the variable “Country legal framework”, 48.4% (0.6962 x 100%) of
“Transparency of investment climate” and 42.5% (0.6522 x 100%) of “Quality of
infrastructure”. The second factor influences trade variables and accounts for 7% of
variance. The third factor reflects geographic variables and accounts for 6% of variance.
The significance of the first factor is given by the taxonomy of institutional strength, vis-à-vis
the state namely ‘strong’, ‘weak’, ‘failed’ and ‘collapsed’ (Gros 1996; Rotberg 2004, pp. 4-
9). The 11 SSA countries cannot be considered ‘strong’. Cliffe and Luckham (1999) 28 In the sense of the rules by which society makes decisions and with (and within) which the structure of incentives, underlying the modalities for contesting economic and political power, are designed and evolve over time. 29 The World Bank worldwide governance indicators 1996-2006 across the factors: voice and accountability; political stability; government effectiveness; regulatory quality; rule of law; and control of corruption shows regional average rankings as: SSA just above 25th percentile; Latin America approximately 40th percentile with recent gains in voice and accountability and regulatory quality, rule of law, and control of corruption, but near SSA’s 25th percentile for voice and accountability, and political stability. The only region performing worse than SSA is the former Soviet Union. 30 Burkina Faso (33nd); Cameroon (35th); Ethiopia (18th); Kenya (31st); Malawi (29th); Nigeria (17th); Uganda (15th) (The Failed States Index 2007, The Fund for Peace, www.fundforpeae.org) 31 Foreign Policy July/August 2005, May/June 2006, July/August 2007, The Fund for Peace, Failed States Index 2007 with respect to the variables “criminalization and/or delegitimization of the state”, “progressive deterioration of public services.”
21
distinguish institutional dimensions: development policy failures; failures in conflict
management; defects in the democratic process; and systemic failures in state capacity. SSA
countries are particularly prone to these challenges (Ellis 2005). From the perspective of
competitiveness and structural change in the economy, in the 2007 global competitiveness
index, the highest ranked SSA country is Mauritius at 58. Kenya ranks 97 and all other SSA
countries in our sample are below the rank of 100 out of 128 economies (WEF 2007, table 3,
p. 8). According to the Industrial Development Scoreboard (UNIDO 2007[b]), out of 124
countries the highest ranking of our 11 SSA countries is Senegal at 53 all others rank below
Nigeria’s 80.
6 Concluding remarks and policy implications
The analytical results have revealed factors that determine the investment decision of foreign
investors in SSA. The literature review indicated that location-specific advantages are in
constant interplay with FDI motivations related to the knowledge and asset structure of
MNEs as well as transaction cost minimisation in market creation or internalisation. In the
pre-investment phase, the foreign investor identifies location specific advantages that best
accommodate the firm’s objectives, strategy and its specific ownership advantages. This
generates a set of critical success factors called the investor’s “wish-list”. We have identified
the marginal position of SSA regarding FDI inflows and stocks and the relative inability of
SSA countries to craft policies to meet the critical success factors in the foreign investor’s
“wish-list”.
The majority of FDI studies emphasise the role of host economic factors in terms of location
specific advantages in the motivations of investors, and the political or regulatory climate. In
our study, the variables influenced by the factors extracted describe the political economy and
regulatory climate (e.g. “Country legal framework”, “Transparency of investment climate” or
“Political stability”), and location-specific advantages (e.g. “Local market”, “Local suppliers”
or “Raw materials”) or hybrid forms (e.g. “Quality of infrastructure” or “Quality of life”).
According to the International Country Risk Guide (ICRG)-Index, SSA is considered the
most risky investment environment. At the macro-level, great uncertainty emanates from
unstable political systems, in which capital and investment are threatened by war,

22
expropriation and, civil unrest (Collier and Hoeffler 2002) and industrial ‘hold-up’32. At the
micro-level, institutions suffer from red tape, administrative burdens, juridical inefficiencies
and corruption that amplify transaction costs in FDI operations. The analytical results herein
suggest that creating a benign political and investment climate should be a top priority for
policy makers in SSA. Furthermore, a non-transparent and unstable regulatory framework
cannot be outweighed by any amount of fiscal and financial incentives.
Concerning the most important trade determinants of FDI to SSA, we observe that recent
amendments and extensions of the General System of (Tariff) Preferences (GSPs) of the US
government and the European Union have triggered new investment. MNEs, particularly
from the Asian textile and apparel sector, give high importance to trade agreements and duty-
free access to the US and EU markets. AGOA and the EBA-Agreement formed the second
most important factor in all the three analyses, ahead of more traditional factors such as
“Local Market Demand” or “Availability of Production Inputs”. However important AGOA
and EBA are in attracting FDI to SSA, there is an issue about reliance on policies that are the
domain of policy makers outside the country hosting the FDI.
Nevertheless, the factors “Local Market Demand”, “Availability of Production Inputs” play
an important role in the investment decision of MNEs. The factor “Local Market Demand”
can be interpreted in terms of African countries achieving limited success in harmonizing the
many overlapping and contradictory regional trade agreements. Foreign investors will
continue to focus their activities in the primary sector especially since many agricultural
products fall under commodities not dutiable under AGOA or the EBA-Agreement.
Furthermore, the MNEs dependency on raw materials goes hand in hand with the dependency
on local suppliers, which might unleash positive technological spillover effects.
Our results support the empirical evidence in the literature on determinants of FDI. However,
the risk perception of SSA appears to shift the emphasis in FDI motivations towards
considerations of political economy and externally, rather than internally, generated location
advantages related to trade. The commodity structure of SSA economies is confirmed by the
availability of production input factors, and the low explanatory power of local market
demand attests to the fragmented nature of SSA markets. The outstanding policy implication 32 See “Shell shuts oilfield after gun attack”, Financial Times, 20 June 2008, p. 5 for an example of industrial ‘hold-up’ in SSA wherein militants target MNEs.

23
for SSA policy makers is the attention to the business environment and macro-economic
stability. This implication is set within a general view that is not as optimistic as wishful
thinking would allow. Freeman and Lindauer (1999, p. 21) indicate “there is no simple nor
single recipe for achieving economic growth, but there is one way to prevent growth: through
instability and absence of property rights.” Our first factor points strongly to this as a policy
area of critical importance even though it is an age old mantra repeated by many.


25
References
Ak�n, Ç. and Kose, A. (2008). Changing nature of North-South linkages: Stylized facts and
explanations, Journal of Asian Economics, 19, 1-28.
Arrighi, G. (2002). The African Crisis, New Left Review, 15, 5-36.
Asiedu, E. (2003). Policy Reform and Foreign Direct Investment to Africa: Absolute
Progress but Relative Decline, Development Policy Review, 22/1, 41-48.
Ayanwale, A.B. (2007). FDI and Economic Growth: Evidence from Nigeria, African
Economic Research Consortium (AERC), Research Papers No. 12, 165.
Ayittey, G.B.N., (2005) Africa Unchained. London: Palgrave MacMillan.
Bartels, F.L. (2007). Industry in Growth and Development: A Review of Contending
Development Policy Advisory Directions, Research and Statistics Branch, UNIDO,
Staff Working Paper 01/2007.
Bartels, F.L. and Alladina, S. (2008/09). Foreign Direct Investment in Sub-Saharan Africa:
Motivating factors and Policy issues, Journal of African Business, 10/1.
Bartels, F.L., Johnson, J.P. and Ahmed, Z.U. (2002). International Equity Joint Ventures in
Ghana and Côte D´Ivoire: The Experience of British and French Firms, Journal of
African Business, 3/3, 5-30.
Bartels, F.L. and Mirza, H. (1999). Multinational Corporations. Foreign Direct Investment in
Asia’s Emerging Markets, Management International Review, 39/4, 13-26.
Bartels, F.L. and Pass, C. L. (2000) International Business: A Competitiveness Approach.
Singapore: Prentice Hall.
Bende-Nabende, A. (2002). Foreign direct investment determinants in Sub-Saharan Africa: A
co-integration analysis, Economics Bulletin, 6/4, 1-19.

26
Bhattacharya, A. Montiel, P.J. and Sharma, S. (1997). How can Sub-Saharan Africa attract
more private capital inflows?, Finance and Development, 34/2, 3-6.
Birkinshaw, J. and Hood, N. (2000). Characteristics of Foreign Subsidiaries in Industry
Clusters, Journal of International Business Studies, 31/1, 141-154.
Bjorvatn, K. and Eckel, C. (2006). Policy competition for foreign direct investment between
asymmetric countries, European Economic Review, 50/7, 1891-1907.
Boddewyn, J.J. and Brewer, T.L. (1994). International business political behaviour: new
theoretical directions, The Academy of Management Review, 19/1, 119-143.
Bryman, A. and Cramer, D. (2001) Quantitative Data Analysis with SPSS Release 10 for
Windows – A Guide for Social Scientists. East Sussex: Routledge.
Buckley, P.J. (2003) FDI and Growth for Developing Countries: MNEs and the Challenges of
the “New” Economy. In UNIDO (ed.) The Role of Industrial Development in the
Achievement of the Millennium Development Goal. Proceedings of the Industrial
Development Forum and Associated Round Tables, 1-5 December 2003, Vienna:
United Nations Industrial Development Organization, 325-338.
Buckley, P.J. and Casson, M. (1985) The Economic Theory of The Multinational Enterprise.
London: Macmillan Press Ltd.
Buckley, P.J. and Casson, M. (1976) The Future of the Multinational Enterprise. London:
Macmillan Press Ltd.
Buckley, P.J. and Hashai, N. (2004). A Global System View of Firm Boundaries, Journal of
International Business Studies, 35/1, 33-45.
Buckley, P.J. and Ghauri, P.N. (2004). Globalisation, economic geography and the strategy of
multinational enterprises, Journal of International Business Studies, 35/2, 81-98.
27
Cantwell, J. and Mudambi, R. (2000). The Location of MNE R&D Activity: The Role of
Investment Incentives, Management International Review, 40/1, 127-148.
Castro, L. (2007). Infrastructure and the Location of Foreign Direct Investment. A regional
Analysis. MPRA Paper 6736. Retrieved January 14, 2008, from http://mpra.ub.uni-
muenchen.de/6736/
Cattel, R.B. (1966). The Scree Test for the Number of Factors, Multivariate Behavioural
Research, 1, 245-276.
Caves, R.E. (1971). International Corporations: The Industrial Economics of Foreign
Investment, Economica, 38, 1-27.
Chabal, P. and Daloz, J.P (1999) Africa Works: Disorder As Political Instrument.
Bloomington: The International Africa Institute/Indiana University Press.
Chang, H. (2007). Incentives, Capabilities, and Space – The Evolution of World Trading
System and the Future of Developing Countries, Paper at UNCTAD Meeting of
Experts on “FDI, Technology and Competitiveness”, Geneva, March 2007.
Cliffe, L. and Luckham, R. (1999). Complex political emergencies and the state: failure and
the fate of the state, Third World Quarterly, 20/1, 27-50.
Coase, R.H. (1937). The Nature of the Firm, Economica, 4, 386-405.
Coase, R.H. (1972) Industrial Organization: A Proposal for Research. In V.R. Fuchs (ed.),
Policy Issues and Research Opportunities in Industrial Organization, New York:
National Bureau of Economic Research, 59-73.
Collier, P. and Hoeffler, A. (2002). On the incidence of civil war in Africa, Journal of
Conflict Resolution, 46/1, 13-28.
28
Cudeck, R. and O’Dell, L.L. (1994). Applications of Standard Error Estimates in Unrestricted
Factor Analysis: Significance Tests for Factor Loadings and Correlations,
Psychological Bulletin, 115/3, 475-487.
Dollar, D. and Levin, V. (2005). Institutional Quality and Project Outcomes in Developing
Countries, World Bank, Policy Research Working Paper 3524.
Dunning, J.H. (1977) Trade, Location of Economic Activity and the MNE: A Search for an
Eclectic Approach. In B. Ohlin, P.O. Hesselborn and P.M. Wijkman (eds.), The
International Allocation of Economic Activity, London: Macmillan, 395-418.
Dunning, J.H. (1993) Multinational Enterprises and the Global Economy. Wokingham,
Berkshire: Addison Wesley.
Dunning, J.H. (2000). The Eclectic Paradigm as an Envelope for Economic and Business.
Theories of MNE Activity, International Business Review, 9, 163-190.
Dunning, J.H. (2003). Some Antecedents of Internalization Theory, Journal of International
Business Studies, 34/2, 108-115.
Dunning, J.H. (ed.) (1985) Multinational Enterprises, Economic Structure and International
Competitiveness. Chichester et al.: John Wiley & Sons.
Durlauf, S.N. and Quah, D. (1998). The New Empirics of Economic Growth, National
Bureau of Economic Research (NBER), Working Papers 6422.
Dziuban, C.D. and Shirkey, E.C. (1974). When is a Correlation Matrix Appropriate for Factor
Analysis?, Psychological Bulletin, 81, 358-361.
Easterly, W. and Levine, R. (1997). Africa’s Growth Tragedy: Policies and Ethnic Divisions,
The Quarterly Journal of Economics, 112/4, 1203-1250.
Ellis, S. (2005). How to rebuild Africa, Foreign Affairs, 84/5, September-October, 135.

29
Everitt, B.S. (2002) The Cambridge Dictionary of Statistics. 2nd Edition, Cambridge:
Cambridge University Press.
Fava, J.L. and Velicer, W.F. (1992). The Effects of Overextraction on Factor and Component
Analysis, Multivariate Behavioral Research, 27/3, 387-415.
Felker, G.B. (2003). Southeast Asian industrialization and the changing global production
system, Third World Quarterly, 24/2, April, 255-283.
Fosu, A.W, Krishman, P. and Ndikumana, L. (2004). Africa and the World Economy: A
Focus on Capital—An Overview, Journal of African Economies, 13/02, December,
ii1 – 114.
Frankel, J. and Romer, D. (1999). Does trade cause growth?, American Economic Review,
89/6, June, 379-399.
Freeman, R.B. and Lindauer, D.L (1999). Why not Africa?, National Bureau of Economic
Research (NBER), working paper 6942.
Garson, G.D. (2008). Factor Analysis, Standnotes, North Carolina State University. Retrieved
May 25, 2008, from http://www2.chass.ncsu.edu/garson/pa765/factor.htm
Gerhart, G. (1995). Collapsed States: The disintegration and Restoration of Legitimate
Authority, Foreign Affairs, 74/6, 141.
Giroud, A. and Delane, B. (2008). Policies promoting MNEs linkages in host economies: A
comparison between Brazil ad Malaysia, Global Forum on International Investment
VII, Paris 2008, Best Practices in Promoting Investment for Development.
Giroud, A. (2004) Foreign direct investment and the rise of cross-border production networks
in Southeast Asia. In N.J. Freeman and F.L. Bartels, (eds.), The future of foreign
investment in Southeast Asia, London and New York: Routledge Curzon, Taylor &
Francis Group, 104-124.

30
Globerman, S. and Shapiro, D. (2002). Global Foreign Direct Investment Flows: The Role of
Governance Infrastructure, World Development, 30/11, 1899-1919.
Gros, J.G. (1996). Towards a Taxonomy of Failed States in the New World Order: Decaying
Somalia, Liberia, Rwanda and Haiti, Third World Quarterly, 17/3, 455-471.
Hair, F.J., Anderson, R.E., Tatham, R.L. and Black, W.C. (1998) Multivariate Data Analysis.
5th Edition, New Jersey: Prentice Hall.
Harzing, A.-W. (2006). Response Styles in Cross-national Survey Research. A 26-country
study, International Journal of Cross Cultural Management, 6/2, 243-266.
Hubert, F. and Pain, N. (2002). Fiscal incentives, European integration and the location of
foreign direct investment, The Manchester School, 70/3, June, 336-364.
Hymer, S.H. (1976). The International Operations of National Firms: A Study of Direct
Foreign Investment. Original Ph.D. Dissertation written in 1960, published in 1976,
Cambridge: MIT Press.
IMF (1993) Balance of Payments Manual. 5th Edition, Washington D.C.: IMF.
IMF (2007) Regional Economic Outlook. Sub-Saharan Africa, World Economic and
Financial Surveys. Washington D.C.: IMF.
Isaksson, A. (2007). World Productivity Database: A Technical Description, RST Staff
Working Paper 10/2007, Vienna: United Nations Industrial Development
Organization.
Jenkins, R. and Edwards, C. (2006). The economic impacts of China and India on sub-
Saharan Africa: Trends and prospects, Journal of Asian Economics, 17/2, April 2006,
207-225.
31
Jensen, N.M. (2006) Introduction to Nation-States and the Multinational Corporation: A
Political Economy of Foreign Direct Investment, Introductory Chapters. In N.M.
Jensen (ed.), Nation-States and the Multinational Corporation: A Political Economy
of Foreign Direct Investment, Princeton NJ: Princeton University Press.
Kaba, A.J. (2004-05). Africa’s Migration and Terminal Brain Drain, IGCS Binghamton
University Newsletter 5/1, winter/spring.
Kaiser, H.F. (1960). The Application of Electronic Computers to Factor Analysis,
Educational and Psychological Measurement, 20, 141-151.
Kaiser, H.F. and Rice, J. (1974). Little Jiffy, Mark IV, Educational and Psychological
Measurement, 34/1, 111-117.
Kaplan, R.D. (1994). The coming Anarchy, The Atlantic Monthly, 273/2, 44-76.
Kaufman, D., Kraay, A. and Mastruzzi, M. (2007). Governance matters IV: governance
indicators for 1996-2006, World Bank.
Khawar, M. (2005). Foreign Direct Investment and Economic Growth: A Cross-Country
Analysis, Global Economic Journal, 5/1, Article 8, 2005.
Kim, J. and Mueller, C.W. (1978) Factor Analysis: Statistical Methods and Practical Issues.
London: SAGE Publications.
Kindleberger, C.P. (1969) American Business Abroad – Six Lectures on Direct Investment.
New Haven and London: Yale University Press.
Knickerbocker, F.T. (1973) Oligopolistic Reaction and the Multinational Enterprise.
Cambridge (MA): Harvard University Press.
Kratzsch, S. (2005). The Locational Determinants of Foreign Direct Investment Activities –
Implications for Sub-Saharan Africa. Unpublished Diploma Thesis (Diplomarbeit
zum Thema), Technical University of Karlsruhe, Germany.
32
Kwak, N. and Radler, B. (2002). A Comparison Between Mail and Web Surveys: Response
Pattern, Respondent Profile, and Data Quality, Journal of Official Statistics, 18/2,
257-273.
Labovitz, S. (1970). The Assignment of Numbers to Rank Order Categories, American
Sociological Review, 35/3, 515-525.
Labovitz, S. (1971). In Defense of Assigning Numbers to Ranks, American Sociological
Review, 36/4, 521-522.
Lall, S. and Kraemer-Mbula, E. (2005). Is African Industry Competing?, University of
Oxford, QEH Working Paper Series, Working Paper No. 121.
Lartey, E.K. (2007). Capital Flow and the real exchange rate: An empirical study of sub-
Saharan Africa, The Journal of International Trade and Economic Development,
16/3, 2007, 337-357.
Loree, D.W. and Guisinger, S.E. (1995). Policy and Non-Policy Determinants of U.S. Equity
Foreign Direct Investment, Journal of International Business Studies, 26/2, 281-299.
Luo, Y. (2007). A coopetition perspective of global competition, Journal of World Business,
42, 129-144.
Mahnke, V., Pedersen, T. and Venzin, M. (2005). The Impact of Knowledge Management on
MNC Subsidiary Performance: The Role of Absorptive Capacity, Management
International Review, 45/2, 101-119.
Marcin, K. (2008). How does FDI inflow affect productivity of domestic firms? The role of
horizontal and vertical spillovers, absorptive capacity and competition, Journal of
International Trade and Economic Development, Taylor and Francis Journals, 17/1,
155-173.
33
Markusen, J.R. (1995). The Boundaries of Multinational Enterprises and the Theory of
International Trade, Journal of Economic Perspectives, 9/2, 169-189.
Marshall, M.G. and Gurr, T.R. (2005). Peace and Conflict 2005. A Global Survey of Armed
Conflicts, Self-Determination movements, and Democracy, Center for International
Development and Conflict Management (CIDCM), University of Maryland, College
Park.
Morisset, J. (2000). Foreign Direct Investment in Africa: Policies also Matter, Transnational
Corporations, 9/2, 107-125.
Naudé, W.A. and Krugell, W.F. (2007). Investigating geography and institutions as
determinants of foreign direct investment in Africa using panel data, Applied
Economics, 39/10, June 2007, 1223-1233.
Ndikumana, L. and Verick, S. (2008). The Linkages between FDI and Domestic Investment:
Unravelling the Developmental Impact of Foreign Direct Investment in Sub-Saharan
Africa, Institute for the Study of Labour (IZA), Discussion Paper no. 3296.
Nunnally, J.C. (1967) Psychometric Theory. 1st Edition, New York: McGraw-Hill.
Nwankwo, S. and Richards, D.C. (2001). Privatization – the myth of free market orthodoxy
in Sub-Saharan Africa, International Journal of Public Sector Management, 14/2,
165-180.
Obazuaye, S.P. (2000). Foreign direct investment in Sub-Saharan Africa in the era of
globalized economy: a policy-oriented approach, 1980-1995. Dissertation submitted
to the faculty of the Department of Politics, Policy and Economics, Claremont
Graduate University, Claremont, CA.
OECD (1996). Benchmark Definition of Foreign Direct Investment. Retrieved August 31,
2006, from http://www.oecd.org/dataoecd/10/16/2090148.pdf
OECD (2006) International Migration Outlook. Annual Report. Paris: OECD.

34
Oman, C.P. (2000). Policy competition for foreign direct investment: a study of competition
among governments to attract FDI, OECD Development Centre, Paris.
Pattillo, C., Gupta, S. and Carey, K. (2005). Sustaining growth Accelerations and Pro-Poor
Growth in Africa, IMF, African Department, working paper No. 05/195.
Peter, J.P. (1979). Reliability: A Review of Psychometric Basics and Recent Marketing
Practices, Journal of Marketing Research, 16/1, 6-17.
Peterson, R.A. (1994). A Meta-Analysis of Cronbach´s Coefficient Alpha, Journal of
Consumer Research, 21/2, 381-391.
Raff, H., Ryan, M. and Stähler, F. (2007). The Choice of Market Entry Mode: Greenfield
Investment, M&A and Joint Venture, Christian-Albrechts-University of Kiel,
Department of Economics, Working Paper No. 2007/19.
Raff, H., Ryan, M. and Stähler, F. (2008). Firm Productivity and the Foreign-Market Entry
Decision, Christian-Albrechts-University of Kiel, Department of Economics, working
paper No. 2008/02.
Razafimahefa, I. and Hamori, S. (2005). An Empirical Analysis of FDI Competitiveness in
Sub-Saharan Africa and Developing Countries, Economics Bulletin, 6/20, 2005, 1-8.
Rodrik, D. and Subramanian, A. (2003). The Primacy of Institutions, Finance and
Development, 40/2, 31-34.
Rodrik, D., Subramanian, A. and Trebbi, F. (2002). Institutions Rule: The Primacy of
Institutions over Geography and Integration in Economic Development, National
Bureau of Economic Research (NBER), Working Paper No. 9305.
Rotberg, R.I. (2004) The Failure and Collapse of Nation-States. In R.I. Rotberg (ed.), When
States Fail: Causes and Consequences, Princeton: Princeton University Press, 1-49.
35
Roy, A.G. and Van den Berg, H.F. (2006). Foreign Direct Investment and Economic Growth:
A Time Series Approach, Global Economy Journal, 6/1, Article 7, 2006.
Rummel, R.J. (1970) Applied Factor Analysis. Evanston, ILL: Northwestern University
Press.
Sachs, J.D. (2001). Tropical underdevelopment, National Bureau of Economic Research
(NBER), Working Paper No. 8119.
Schiff, M. and Winters, A.L. (2003) Regional Integration and Development. Oxford: Oxford
University Press.
Schwartz, R.D. (1971). Operational Techniques of a Factor Analysis Model, The American
Statistician, 25/4, 38-42.
Tabachnik, B.G. and Fidell, L.S. (1996) Using Multivariate Statistics. 3rd Edition, New York:
HarperCollins.
Teece, D.J. (1984). Economic Analysis and Strategic Management, California Management
Review, 26/3, 84-110.
Trigeorgis, L. (1996) Real Options: Managerial Flexibility and Strategy in Resource
Allocation. Cambridge, MA: MIT Press.
UNCTAD (2006) World Investment Report 2006: FDI from Developing and Transition
Economies: Implications for Development. Geneva: United Nations.
UNCTAD (2007) World Investment Report 2007. Transnational Corporations, Extractive
Industries and Development. New York and Geneva: United Nations.
UNCTAD (2008) Foreign Direct Investment Database. Retrieved May 7, 2008, from http://stats.unctad.org/fdi
UNIDO (2003[a]) Promoting Investment in Developing Countries (with Special Reference to
Africa): Challenges, Opportunities and Experiences. In UNIDO (ed.) The Role of

36
Industrial Development in the Achievement of the Millennium Development Goals,
Proceedings of the Industrial Development Forum and Associated Round Tables, 1-5
December 2003, Vienna: United Nations Industrial Development Organization, 297-
309.
UNIDO (2003[b]) Africa Foreign Investor Survey 2003. Vienna: United Nations Industrial
Development Organization.
UNIDO (2003[c]) Guidelines for Investment Promotion Agencies. Foreign Direct Investment
flows to developing countries. Vienna: United Nations Industrial Development
Organization.
UNIDO (2007[a]) Africa Foreign Investor Survey 2005. Vienna: United Nations Industrial
Development Organization.
UNIDO (2007[b]) Industrial Development Scoreboard—2007 Update. Vienna: United
Nations Industrial Development Organization.
Urata, S. and Kawai, H. (2000) Intrafirm Technology Transfer by Japanese Manufacturing
Firms in Asia. In T. Ito and A.O. Krueger (eds.), The Role of Foreign Direct
Investment in East Asian Economic Development, Chicago and London: The
University of Chicago Press, 49-74.
Vernon, R. (1966). International Investment and International Trade in the Product Cycle,
Quarterly Journal of Economics, 80/2, 190-207.
Vernon, R. (1974) The Location of the Economic Activity. In J.H. Dunning (ed.), Economic
Analysis and the Multinational Enterprise, London: George Allen & Unwin, 89-114.
Wells, L.T., Allen, N.J., Morisset, J. and Pirnia, N. (2003). Using Tax Incentives to Compete
for Foreign Investment - Are they Worth the Costs?, World Bank, Foreign Investment
Advisory Service (FIAS), Occasional Paper 15.
37
Williamson, O.E. (1979). Transaction-Cost Economics: The Governance of Contractual
Relations, Journal of Economic Issues, 22/2, 233-261.
World Bank (2006) Africa Development Indicators 2006. Washington D.C.: World Bank.
World Bank (2007) Doing Business 2007: How to Reform. Washington D.C.: World Bank.
World Economic Forum (WEF) (2007) The Africa competitiveness report.
Yang, Y. and Gupta, S. (2005). Regional Trade Arrangements in Africa: Past Performance
and the Way Forward, IMF Working Paper, WP/05/36.
Zee, H.H. Stotsky, J.G. and Ley, E. (2002). Tax incentives for business investment: a primer
for policy makers in developing countries, World Development, 30/9, 1497-1516
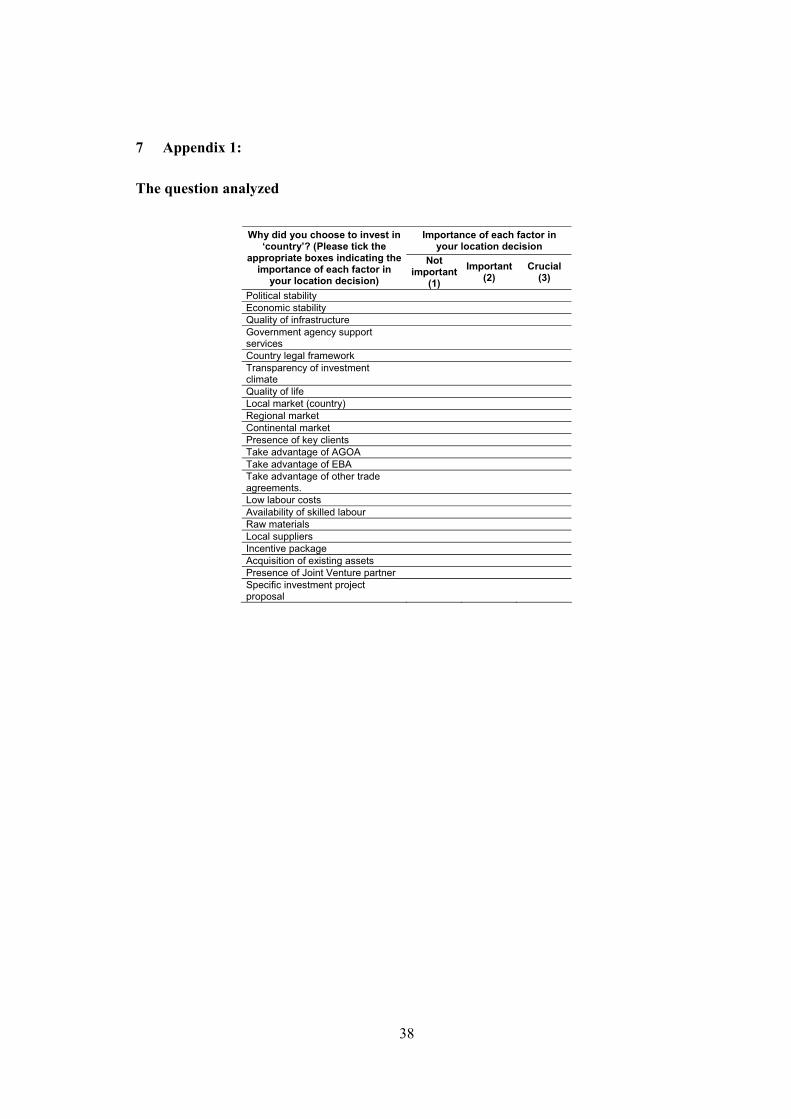
38
7 Appendix 1:
The question analyzed
Importance of each factor in your location decision
Why did you choose to invest in ‘country’? (Please tick the
appropriate boxes indicating the importance of each factor in
your location decision)
Not important
(1)Important
(2) Crucial
(3)
Political stability Economic stability Quality of infrastructure Government agency support services Country legal framework Transparency of investment climate Quality of life Local market (country) Regional market Continental market Presence of key clients Take advantage of AGOA Take advantage of EBA Take advantage of other trade agreements. Low labour costs Availability of skilled labour Raw materials Local suppliers Incentive package Acquisition of existing assets Presence of Joint Venture partner Specific investment project proposal


UNITED NATIONS INDUSTRIAL DEVELOPMENT ORGANIZATIONVienna International Centre, P.O. Box 300, 1400 Vienna, AustriaTelephone: (+43-1) 26026-0, Fax: (+43-1) 26926-69E-mail: [email protected], www.unido.org
Printed in AustriaV.08-58926—January 2009—200