Forecasting Trends in Disability in a Super-Aging Society ... · FORECASTING TRENDS IN DISABILITY...
53
NBER WORKING PAPER SERIES FORECASTING TRENDS IN DISABILITY IN A SUPER-AGING SOCIETY: ADAPTING THE FUTURE ELDERLY MODEL TO JAPAN Brian K. Chen Hawre Jalal Hideki Hashimoto Sze-Chuan Suen Karen Eggleston Michael Hurley Lena Schoemaker Jay Bhattacharya Working Paper 21870 http://www.nber.org/papers/w21870 NATIONAL BUREAU OF ECONOMIC RESEARCH 1050 Massachusetts Avenue Cambridge, MA 02138 January 2016 This study uses data from the Japanese Study on Aging and Retirement (JSTAR), which was conducted by the Research Institute of Economy, Trade, and Industry (RIETI) and Hitotsubashi University in 2007 and 2009. We thank the JSTAR team for providing access to the data. We also thank the Freeman Spogli Institute for International Studies Japan Fund, the Stanford Center on the Demography and Economics of Health and Aging, and the National Institute on Aging (AG017253) for financial support for this research. Dr. Bhattacharya is grateful for support from the National Institute on Aging for his work on this project (P30 AG017253, R37AG036791 and P01AG05842). The views expressed herein are those of the authors and do not necessarily reflect the views of the National Bureau of Economic Research. NBER working papers are circulated for discussion and comment purposes. They have not been peer- reviewed or been subject to the review by the NBER Board of Directors that accompanies official NBER publications. © 2016 by Brian K. Chen, Hawre Jalal, Hideki Hashimoto, Sze-Chuan Suen, Karen Eggleston, Michael Hurley, Lena Schoemaker, and Jay Bhattacharya. All rights reserved. Short sections of text, not to exceed two paragraphs, may be quoted without explicit permission provided that full credit, including © notice, is given to the source.
Transcript of Forecasting Trends in Disability in a Super-Aging Society ... · FORECASTING TRENDS IN DISABILITY...

NBER WORKING PAPER SERIES
FORECASTING TRENDS IN DISABILITY IN A SUPER-AGING SOCIETY:ADAPTING THE FUTURE ELDERLY MODEL TO JAPAN
Brian K. ChenHawre Jalal
Hideki HashimotoSze-Chuan SuenKaren EgglestonMichael Hurley
Lena SchoemakerJay Bhattacharya
Working Paper 21870http://www.nber.org/papers/w21870
NATIONAL BUREAU OF ECONOMIC RESEARCH1050 Massachusetts Avenue
Cambridge, MA 02138January 2016
This study uses data from the Japanese Study on Aging and Retirement (JSTAR), which was conductedby the Research Institute of Economy, Trade, and Industry (RIETI) and Hitotsubashi University in2007 and 2009. We thank the JSTAR team for providing access to the data. We also thank the FreemanSpogli Institute for International Studies Japan Fund, the Stanford Center on the Demography andEconomics of Health and Aging, and the National Institute on Aging (AG017253) for financial supportfor this research. Dr. Bhattacharya is grateful for support from the National Institute on Aging forhis work on this project (P30 AG017253, R37AG036791 and P01AG05842). The views expressedherein are those of the authors and do not necessarily reflect the views of the National Bureau of EconomicResearch.
NBER working papers are circulated for discussion and comment purposes. They have not been peer-reviewed or been subject to the review by the NBER Board of Directors that accompanies officialNBER publications.
© 2016 by Brian K. Chen, Hawre Jalal, Hideki Hashimoto, Sze-Chuan Suen, Karen Eggleston, MichaelHurley, Lena Schoemaker, and Jay Bhattacharya. All rights reserved. Short sections of text, not toexceed two paragraphs, may be quoted without explicit permission provided that full credit, including© notice, is given to the source.
Forecasting Trends in Disability in a Super-Aging Society: Adapting the Future Elderly Modelto JapanBrian K. Chen, Hawre Jalal, Hideki Hashimoto, Sze-Chuan Suen, Karen Eggleston, MichaelHurley, Lena Schoemaker, and Jay BhattacharyaNBER Working Paper No. 21870January 2016JEL No. I1,J1,J11,J14
ABSTRACTJapan has experienced pronounced population aging, and now has the highest proportion of elderlyadults in the world. Yet few projections of Japan’s future demography go beyond estimating populationby age and sex to forecast the complex evolution of the health and functioning of the future elderly.This study adapts to the Japanese population the Future Elderly Model (FEM), a demographic andeconomic state-transition microsimulation model that projects the health conditions and functionalstatus of Japan’s elderly population in order to estimate disability, health, and need for long term care.Our FEM simulation suggests that by 2040, over 27 percent of Japan’s elderly will exhibit 3 or morelimitations in IADLs and social functioning; almost one in 4 will experience difficulties with 3 or moreADLs; and approximately one in 5 will suffer limitations in cognitive or intellectual functioning. Sincethe majority of the increase in disability arises from the aging of the Japanese population, preventionefforts that reduce age-specific disability (or future compression of morbidity among middle-agedJapanese) may have only a limited impact on reducing the overall prevalence of disability among Japaneseelderly.
Brian K. ChenDepartment of Health Services Policy and ManagementArnold School of Public HealthUniversity of South Carolina915 Greene Street #354Columbia, SC [email protected]
Hawre JalalDepartment of Health Policy and ManagementGraduate School of Public HealthUniversity of Pittsburgh130 DeSoto Street Room 703, Pittsburgh, PA [email protected]
Hideki HashimotoUniversity of Tokyo School of Public Health7-3-1, Hongo, Bunkyo-ku, Tokyo, [email protected]
Sze-Chuan Suen117 Encina CommonsStanford Health Policy (CHP/PCOR)Stanford, CA [email protected]
Karen Eggleston Shorenstein Asia-Pacific Research Center Stanford University 616 Serra Street Stanford, CA 94305 and NBER [email protected]
Michael Hurley
Stanford University School of Medicine Stanford, CA [email protected]
Lena Schoemaker 117 Encina Commons Stanford Health Policy (CHP/PCOR) Stanford, CA 94305 [email protected]
Jay Bhattacharya 117 Encina Commons CHP/PCOR Stanford University Stanford, CA 94305-6019 and NBER [email protected]

3
1. Introduction
Population aging is a global phenomenon, with significant implications for
individuals and policymakers alike. Yet across the globe, there are wide differences
both in the rate of aging and the current age structure in society (Kapteyn 2010). For
many years, researchers have attempted to shed light on the potential implications of
global population aging, but for some countries in the world, the impact of a rapidly
aging society can no longer be considered a hypothetical scenario far off in the future
(Schoeni and Ofstedal 2010), Japan, in particular, has experienced pronounced
population aging, with over 26.3% of the population aged 65 and over1, and now has
the highest proportion of elderly adults in the world2. Yet few projections of Japan’s
future elderly health needs go beyond estimating population by age and sex to forecast
the complex evolution of the health and functioning of the future elderly. In the last two
decades, methodological advances in population studies and simulations have made it
possible to estimate the needs of the future elderly, with implications for potential policy
response (Schoeni and Ofstedal 2010). The goal of this study is to develop a model that
projects the health conditions, disability and functional status of Japan’s elderly
population. Such a model can support evidence-based assessments of future demand
for health care, long-term care, public pensions, welfare and other government-
supported programs, as well as labor force participation.
Japan’s super-aging demographic trends present a series of policy challenges for
which a detailed model of competing risks for the future elderly would be useful (Ogawa,
Mason et al. 2007). Long-term care insurance program spending (Miyazawa,
Moudoukoutas et al. 2000) and medical care spending (Dow, Philipson et al. 1999, Lee
and Skinner 1999, Gerdtham, Lundin et al. 2005, Bech, Christiansen et al. 2011) will be
most directly impacted. The flattening of the pyramidal age structure and aging in
general have implications for optimal retirement decisions (Poterba 2014), savings
behavior (Bloom, Canning et al. 2003, Finkelstein and Poterba 2004), the progress of
interest rates (Philipson and Becker 1998, Prettner and Canning 2012), family 1 http://www.stat.go.jp/english/data/jinsui/tsuki/index.htm 2 http://www.soumu.go.jp/johotsusintokei/whitepaper/ja/h25/html/nc123110.html. Japan overtook Italy and Germany to have the highest proportion of elderly adults by 2008.

4
caregiving (Gannon and Davin 2010) and labor participation (Imrohoroğlu and Kitao
2012), as well as intergenerational wealth transfer programs and policies (Behrman and
Parker 2013). Other studies have investigated the relative merits of a pay-as-you-go
versus a funded pension system in light of population aging (Schieber 2010, Venti 2010),
or the impact of aging on disability and qualify of life (Oshio, Shimizutani et al. 2010,
Suzman 2010, Singh 2013). But many facets of social and economic life are also
implicated beyond pension and retirement policies (Manton, Stallard et al. 1998, Aísa,
Pueyo et al. 2012), including issues as seemingly far-removed as fertility (Grant,
Hoorens et al. 2004, Cullinan, Gannon et al. 2013), immigration (Martínez and Marín
2014), and national security (Coleman and Rowthorn 2011).
Population aging is also linked to the broader macroeconomic challenges
confronting Japan (Hoshi and Ito 2014). Japan's net debt-to-GDP ratio in 2012 was
approximately 134% (compared to 87% for the US and 82% for the UK). Japan’s fiscal
situation is not sustainable, partly because as an aging society, Japan’s household
savings rate will likely decline, as will the working-age population, further slowing the
growth of private sector financial assets (the predominant holders of Japan’s
government bonds (Hoshi and Ito 2014)). Japan’s fiscal situation appears not to be
sustainable, due primarily to the combined effects of GDP stagnation and rising social
security expenditures resulting from its aging population. Since 2008, the Japanese
government has called for a broad range of reforms on pension, health care, and other
social security programs, with primary budget balance as the goal. Yet Japan’s
population aging will certainly make this goal a difficult one to achieve. More generally,
population aging has implications for economic growth beyond the raw support ratio,
including possible impacts on the rate of entrepreneurship, innovation, and productivity
growth (Lee 2014).
Our work sheds light on the challenges that Japan faces by projecting the needs
of its future elderly. Most population projections for Japan have not modeled health
status and disability, but simply projected population by age and sex. A few recent
studies have attempted to go further (Fukawa 2007, Ogawa, Retherford et al. 2010,
Shimizutani, Fujii et al. 2014). For example, Shimizutani et al. (2014) recently used the

5
JSTAR data to estimate factors, including health, that affect the retirement decisions of
the middle-aged and elderly in Japan. They develop a simulation model for enrollment
into Japan’s disability program. While these studies represent an encouraging trend,
there is much to gain from a more flexible and powerful simulation model of population
aging in a country of Japan’s global economic importance. Surveys such as the Health
and Retirement Study and the Wisconsin Longitudinal Study have increasingly
combined traditional surveys with biometric measurements, and included measures of
psychological and cognitive ability using adaptive testing techniques (Hauser and Weir
2010). Advances have also occurred in the use of demographic mortality models that
take into account the biological processes of aging and exposure to environmental
factors such as smoking and obesity (Yashin, Akushevich et al. 2013). Such models
that simulate cohort evolution based on mortality selection given the underlying
prevalence and incidence of comorbidities may improve the predictive powers of future
elderly projections, and lend themselves to manipulations of parameters to simulate
alternative scenarios and outcomes (Zheng 2014).
This paper extends the literature by developing a demographic and economic
state-transition micro-simulation model for Japan that enables analysis of the impact of
demographic change, aging, and population health on disability and care receiving. We
estimate the model using the recently released multiple waves of the Japan Study of
Aging and Retirement (JSTAR) survey, the Japanese version of the family of
internationally comparable surveys that include the U.S. Health and Retirement Study
(HRS), the English Longitudinal Survey on Ageing (ELSA), and the Survey on Health,
Aging and Retirement in Europe (SHARE). We choose a Japan-specific dataset in order
to reflect Japan’s specific morbidity and mortality burden, which may differ from that of
the United States due to genetic, dietary, healthcare, lifestyle and other behavioral and
environmental differences between Japan and the United States (See, e.g., Keys,
Menotti et al. 1984). To do so, we first estimate disease transition probabilities for
diseases prevalent among Japanese middle-aged and elderly populations. We then use
the JSTAR and national age-sex-specific mortality data to develop appropriate
estimates of conditional mortality for the relevant diseases among the Japanese elderly.
Third, we construct a state-transition model based on the original FEM. Finally, we

6
estimate how the constellation of medical conditions for each age-sex group affect
functional status of Japan’s future elderly population as measured by Activities of Daily
Living (ADLs), Instrumental Activities of Daily Living (IADLs), and additional measures
of cognition and social functioning.
We find that by 2040, over 27 percent of Japan’s elderly will exhibit 3 or more
limitations in IADLs and social functioning; almost one in 4 will experience difficulties
with 3 or more ADLs; and approximately one in 5 will suffer limitations in cognitive or
intellectual functioning. The majority of the increase in disability arises from the aging of
the Japanese population. Therefore, the economic impact of prevention efforts that
reduce the underlying comorbid conditions associated with disability may be limited.
The remainder of this paper is organized as follows. Section 2 describes Japan’s
demographic and institutional background. Section 3 describes the data and the
methodology for adapting the FEM to Japan. Section 4 presents the empirical results
regarding disability of Japan’s future elderly. The final section discusses policy
implications. A technical appendix describes in greater detail the operationalization of
the future elderly model in the Japanese context.
2. Background
The Japanese populace is well educated, with a nearly 100 percent literacy rate,
mandatory nine-year education, and 34.7% of the population ultimately attaining a
college education.3 The size of Japan’s working population in 2010 was 59.4% of the
total population—roughly 65 million workers, which is similar to the rate in the United
States (Index Mundi 2011). However, as a result of longevity increase and fertility
decline, Japan is experiencing dramatic population aging. Like most high-income
countries, Japan has nearly zero population growth, with a total fertility rate well below
replacement. More than 26.3 of Japan’s population is 65 or older4, and this proportion is
projected to grow dramatically over the next few decades.
3 http://www.e-stat.go.jp/SG1/estat/ListE.do?bid=000001053739&cycode=0 4 http://www.stat.go.jp/english/data/jinsui/tsuki/index.htm
7
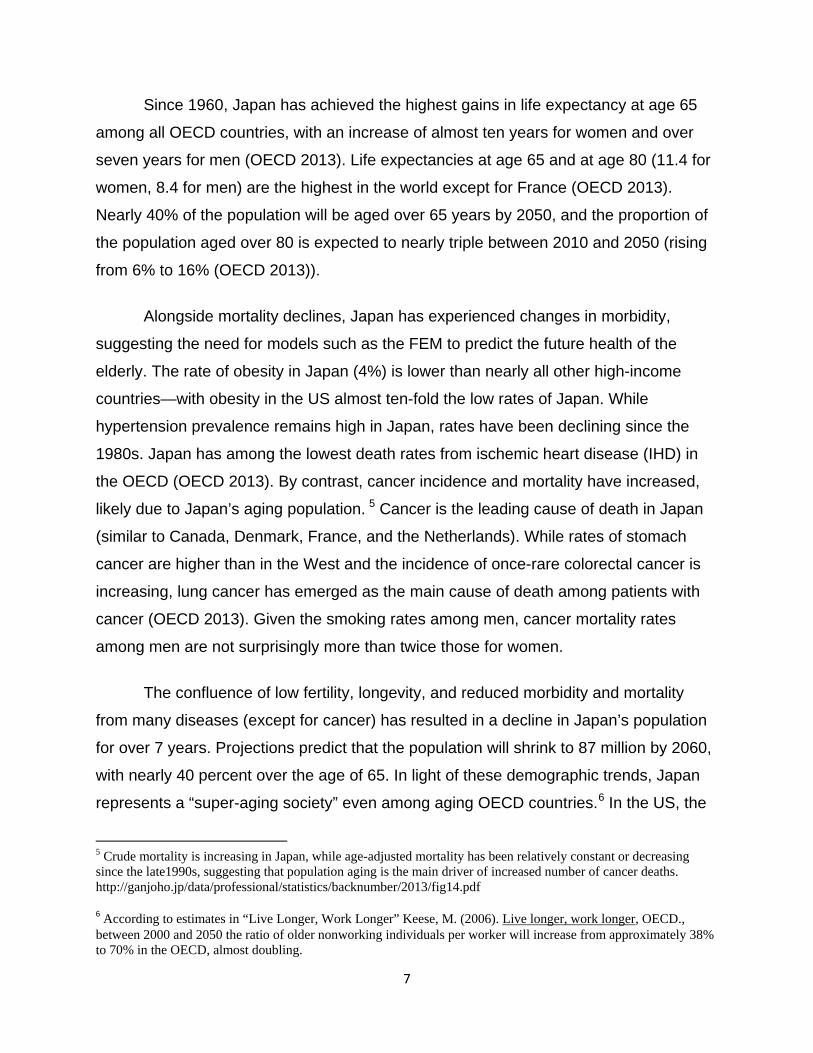
Since 1960, Japan has achieved the highest gains in life expectancy at age 65
among all OECD countries, with an increase of almost ten years for women and over
seven years for men (OECD 2013). Life expectancies at age 65 and at age 80 (11.4 for
women, 8.4 for men) are the highest in the world except for France (OECD 2013).
Nearly 40% of the population will be aged over 65 years by 2050, and the proportion of
the population aged over 80 is expected to nearly triple between 2010 and 2050 (rising
from 6% to 16% (OECD 2013)).
Alongside mortality declines, Japan has experienced changes in morbidity,
suggesting the need for models such as the FEM to predict the future health of the
elderly. The rate of obesity in Japan (4%) is lower than nearly all other high-income
countries—with obesity in the US almost ten-fold the low rates of Japan. While
hypertension prevalence remains high in Japan, rates have been declining since the
1980s. Japan has among the lowest death rates from ischemic heart disease (IHD) in
the OECD (OECD 2013). By contrast, cancer incidence and mortality have increased,
likely due to Japan’s aging population. 5 Cancer is the leading cause of death in Japan
(similar to Canada, Denmark, France, and the Netherlands). While rates of stomach
cancer are higher than in the West and the incidence of once-rare colorectal cancer is
increasing, lung cancer has emerged as the main cause of death among patients with
cancer (OECD 2013). Given the smoking rates among men, cancer mortality rates
among men are not surprisingly more than twice those for women.
The confluence of low fertility, longevity, and reduced morbidity and mortality
from many diseases (except for cancer) has resulted in a decline in Japan’s population
for over 7 years. Projections predict that the population will shrink to 87 million by 2060,
with nearly 40 percent over the age of 65. In light of these demographic trends, Japan
represents a “super-aging society” even among aging OECD countries.6 In the US, the
5 Crude mortality is increasing in Japan, while age-adjusted mortality has been relatively constant or decreasing since the late1990s, suggesting that population aging is the main driver of increased number of cancer deaths. http://ganjoho.jp/data/professional/statistics/backnumber/2013/fig14.pdf 6 According to estimates in “Live Longer, Work Longer” Keese, M. (2006). Live longer, work longer, OECD., between 2000 and 2050 the ratio of older nonworking individuals per worker will increase from approximately 38% to 70% in the OECD, almost doubling.

8
Old Age Dependency Ratio (OADR, ratio of population age 65 and above to age 20 to
64) is projected to rise from 22% in 2010 to 39% in 2050 (Lee 2014). In Japan, the
OADR was already 39% in 2012 and is projected to reach more than 70% by 2050
(OECD 2007).
While the sharp rise in the old age dependency ratio has been offset somewhat
by the high labor force participation among the Japanese elderly compared to many
other OECD countries, it remains questionable whether Japan can escape from a huge
burden of social security and health expenditure (Ichimura, Shimizutani et al. 2009). For
example, the poverty rate—defined as the proportion of individuals with equalized
disposable income less than 50% of the median income—is higher in Japan (21.1%),
and disproportionately among the elderly7, compared to most European countries
(Ichimura, Shimizutani et al. 2009).
The rapid aging of the Japanese population poses a significant challenge to the
government to maintain the financial viability of its health and long-term care system.
Among all OECD countries, Japan allocates the greatest share of hospital expenditure
to people aged 65 and over (64%), associated with the fact that it also has the highest
share of people in that age group (23%; (OECD 2013)). Only in Israel and Japan
(among OECD countries) has health spending growth as a percent of GDP accelerated
rather than declined since the financial crisis of 2009 (OECD 2013), and both a stagnant
GDP and population aging are important reasons.
The changing mortality and morbidity pattern in Japan increasingly strains
Japan’s health and long-term care systems in ways that contrast with many other OECD
countries. For example, Japan and Korea have the longest hospital stays, at more than
double the OECD average of 8.0 days in 2011. A salient reason is that many acute care
hospitals provide a significant share of long-term care services (“social admissions”)
and serve the functions of skilled nursing facilities in a country like the United States.
For example, Japan has the highest expenditure per discharge for cancer among OECD
countries, probably because of its much longer lengths of stay (OECD 2013). Japan
7 http://www.gender.go.jp/kaigi/senmon/kansieikyo/siryo/ka39-2-3-1.pdf

9
also has, by far, the highest number of MRI and CT scanners per capita. Largely
because of a 2010 change in OECD accounting rules that now includes long-term care
expenditures in total health expenditures, Japan’s ratio of health spending to GDP now
exceeds the OECD average, revealing the true extent of Japan’s total financial burden
from its aging population.
To inform future policy decisions such as the sustainability of health spending
and the long-term care insurance program, Japan’s policymakers need a tool to forecast
the health and functioning of the future elderly. This paper takes an initial step toward
that goal.
3. Data
Our data derives from the Japanese Study of Aging and Retirement (JSTAR),
one of Japan’s first longitudinal datasets on middle-aged and elderly Japanese
specifically designed for cross-national scientific investigation of aging and retirement.
Two waves of interviews in 2007 and 2009 surveyed 3,862 respondents between 47
and 77 in five Japanese cities (Adachi, Kanazawa, Shirakawa, Sendai and Takikawa)
on a variety of economic, social, and health conditions. The survey includes over 1,400
questions designed to mirror and ensure comparability with other surveys conducted
internationally, such as the Health and Retirement Survey (HRS) in the United States,
the Survey of Health, Aging and Retirement in Europe (SHARE), and the English
Longitudinal Study of Aging (ELSA) in the United Kingdom. JSTAR is widely considered
to be Japan’s first globally comparable panel data on the elderly (Ichimura, Shimizutani
et al. 2009). Only a subset of these data (90%) is released for researchers’ use. The
response rate in the second wave among the respondents from the first wave is about
80% (i.e., an attrition rate of about 20%), with some variation across municipalities
(Shimizutani, Fujii et al. 2014).
While only focused on a few municipalities and thus not nationally representative,
JSTAR researchers argue that the focus on variations in a large number of individuals in

10
selected municipalities controls for cultural, historical, and policy environment and thus
constitutes “a unique approach to examining a variety of topics on aging and retirement
and contributes to rethinking a way of sampling survey data” (Ichimura, Shimizutani et al.
2009).
In addition to the prevalence of health conditions, JSTAR also includes detailed
self-reported information on physical or mental limitations in performing Activities of
Daily Living (ADLs) and Instrumental Activities of Daily Living (IADLs). Furthermore,
JSTAR also asks respondents detailed questions on measures of social and intellectual
engagement, as well as caregiving and care receiving, both formally at skilled nursing
facilities or informally through friends and family members.
Because JSTAR includes respondents only up to the age of 77, we supplement
our data analysis with data provided by the Nihon University Japanese Longitudinal
Study of Aging (NUJLSOA) dating from 1999 and 2001, with 1,921 respondents over
age 80. NUJLSOA also includes detailed information on ADLs and IADLs, but has only
14 of the 19 health conditions available in JSTAR.
We choose the following sample selection criteria. Individuals must be at least 45
years old. This yields 3,862 respondents with a total of 7,724 interview years. We then
drop observations of individuals with a missing value for any of our health measures of
interest. Following this selection criterion, we arrive at the final estimation sample
consisting of 2,526 individuals for 2007, 2,659 for 2009, and 1,854 individuals and 3,708
interview years for the pooled JSTAR data. For the 80+ cohort in the NUJLSOA data,
the same exclusion criteria led to a total of 1,921 survey respondents and 3,842
respondent-years. Most missing data occur for self-reported health states. The
summary statistics for the JSTAR study sample in 2007 are presented in Appendix
Table 1.
4. Methods
Based on the work by Goldman, Shang, Bhattacharya et al (2005), the Future
Elderly Model (FEM) is a demographic and economic simulation model designed to

11
predict the future health status of the elderly and explore what current trends or future
shifts imply for policy. The FEM is a state-transition microsimulation model that permits
direct modeling of competing mortality risks. It also permits counterfactual analyses of
hypothetical scenarios, such as the implications of a smoke-free or obesity-free
population on health and mortality, by replacing the model parameters with alternative
values. We present an abridged discussion of the FEM below, and include only our
main policy-relevant simulation results from the state-transition model in the main text. A
detailed description of the evaluation and construction of the FEM is provided in the
Technical Appendix.
4.1 Health Transition Model
This section describes the steps taken to estimate individual health transition
models for the Japan FEM. The JSTAR and NUJLSOA data provide self-reported health
status measures. We use logistic regressions to estimate the probability of transitioning
to each of 19 health conditions in 2009 based on not having that health condition in
2007 and controlling for demographic and comorbid conditions in 2007. Because these health states are measured by responses to questions such as
“Have you ever been told by a doctor ....” we treat all health status states as absorbing
states. However, we separately estimated the likelihood of transitioning out of the
disease states but found little evidence of recovery for the listed medical conditions in
our sample. As a result, we only model transitions into these states (without allowing for
cure) in the following form: 𝑙𝑛 � 𝑝𝑖,𝑗,𝑡+2
1−𝑝𝑖,𝑗,𝑡+2� = 𝛽0 + 𝜸 ∙ 𝑿𝒊𝒋𝒕 + 𝜀𝑖𝑗𝑡, where pi,j,t+2 is the
probability of having the j-th condition for individual i at time t+2 (2009 (JSTAR), 2001
(NUJLSOA)) conditional on not having the j-th condition at time t; and Xijt are
demographic characteristics (demeaned age, demeaned age squared, and where
appropriate, an indicator for BMI ≥ 23.5, and an indicator for heavy smoking, defined as >
20 cigarettes per day) and co-morbidities for individual i in time t (2007 (JSTAR) or 1999
(NUJLSOA)) that affect the onset of condition j.
The probabilities of the onset of the various conditions are assumed to be linear
in the covariates. Age, age squared, and male gender enter into all transition models,

12
but the other covariates enter into the regression only if two medical doctors agree that
they are likely causative factors in the onset of the specific disease model in question.
Given the low prevalence of obesity in Japan, we choose a BMI value of 23.5 and
greater to be a proxy for overweight. For smoking, because of the high number of
smokers among Japanese males, we set the indicator variable for smoker if the
respondent answers smoking 20 or more cigarettes per day in 2007.
The unit of observation is the interview-pair. All independent variables are
measured with a two-year lag, and represent the respondent’s characteristics as of
2007 (JSTAR) or 1999 (NUJLSOA). Transition probabilities are estimated only using
individuals who did not suffer from a specific condition at baseline. As a result, the
sample sizes for various health status transition regressions vary. Using data from
JSTAR as an example, consider a respondent who was interviewed in 2007 without
cancer but with a heart condition. In 2009, he is diagnosed with cancer. This person’s
baseline condition included “heart disease,” so he does not contribute to the heart
disease transition model in any way. On the other hand, he contributes one observation
to the cancer transition model. Because JSTAR had only two time points during
construction of the health state-transition matrix, we ignore clustering standard errors at
the individual level because any given person will contribute at most one observation to
a specific disease model.
4.2 Disability Models
Previous Future Elderly Models that simulate the impact of medical treatments on
utilization and costs generally contain proxies of physical health such as functional
limitations or disability, in addition to the presence of chronic diseases. A common
measure of disability consists of a series of questions that are closely linked to activities
that involve social roles, particularly those deemed necessary to meet an individual’s
personal daily living needs, e.g. eating, bathing, and dressing. These are known as
Activities of Daily Living (ADLs). A closely related construct, or Instrumental Activities of
Daily Living (IADLs), includes higher-level activities, such as managing finances and
shopping for groceries.

13
Measures of ADLs in the JSTAR survey data follow closely the standard
definition used in the HRS family of surveys. JSTAR includes questions on whether
respondents are able to dress themselves, walk around in their room, bathe, eat, get in
and out of bed, and use Western-style toilets. We use the number of ADLs performed
with difficulty as the outcome variable of interest, defined as 0, 1, 2, and 3 or more.
Measures of IADLs are captured by seven questions that ask whether respondents are
able to take public transportation alone, shop for daily necessities, prepare daily meals,
pay bills, handle their own banking, make telephone calls and take medications. Again,
we use 0, 1, 2, and 3 or more IADLs performed with difficulty as the outcome variable.
Four additional questions each pertain to the survey respondents’ social
interactions (visiting friends, being called on for advice, visiting sick friends, and
initiating conversations with younger individuals) and intellectual activities (filling out
pension forms, reading the newspaper, reading books or magazines, and taking interest
in the news). For these two measures of societal function as well, we use four
categories for the outcome variable, i.e., having difficulty with 0, 1, 2, or 3+ functions.
Finally, we code as dichotomous variables whether respondents received any type of
help, any help for physical care, and any help for household chores from friends or
family members.
We project future disability status (number of ADLs, IADLs, social/intellectual
tasks performed with difficulty, and the receipt of assistance from friends/family) using
ordered logistic regressions for all specifications with 0, 1, 2, and 3+ as the outcome
variable, and logistic regression for all specifications with dichotomous outcome
variables. The explanatory variables are the full set of covariates as described in the
health transition model, including age, gender, weight, smoking status, and a vector of
the 19 defined health conditions. Because we pool 2007 and 2009 data, each
respondent potentially contributes up to two observations, and we cluster our standard
errors at the individual level. These outcome models were used to predict the
distribution of Japan’s future population with ADLs, IADLs, and receiving assistance
through 2040, based on the FEM model projections of health conditions by age and sex
among survivors.

14
To complete the FEM simulation model, we also need to estimate disease-
specific mortality rates by age and sex for the Japanese population. The next section
describes our methodology for doing so.
4.3 Disease-Specific Mortality Rates
The Japanese vital statistics data provide detailed information on the leading
cause of mortality by age and sex. However, there is no information on the number of
health conditions that the individual had at the time of death. Only the leading cause of
death is reported. Using JSTAR and these mortality data, we developed an algorithm to
compute condition-specific mortality rates for each of the 19 conditions, as described in
more detail in the Technical Appendix. In brief, we used the iterative proportional fitting
(IPF) algorithm to calculate the conditional mortality rates from JSTAR, NUJLSOA, and
the Japanese vital statistics data (Statistics Bureau). To calculate the conditional
mortality rates, we assume conditional independence of the disease-specific mortalities.
In other words, the probability that any given disease is the cause of death does not
depend on the other comorbidities that an individual has. Appendix Table 2 illustrates
the setup for the IPF algorithm.
5. Results
5.1 Model Calibration Results
Since our primary goal is to project Japan’s future elderly health, disability, and
need for care, we report all of our state-transition probability matrices (Appendix Table
3a for JSTAR and 3b for NUJLSOA) and estimated condition-specific mortality rates
(Appendix Figure 2) in the Technical Appendix. Overall, our specifications produced
plausible results, particularly for ages up to 77 (the oldest respondents in the JSTAR
dataset in 2007). For example, our transition matrix predicts that greater age, male
gender, BMI greater than 23.5, as well as having heart disease, hyperlipidemia,

15
cerebrovascular disease, and liver disease in 2007 are all positively associated with the
probability of developing hypertension by 2009. Likewise, having a joint disorder, a
broken hip, mental health issues, or dementia are associated with the greatest
probabilities of having difficulties in both ADLs and IADLs. We supplement our censored
JSTAR data (truncated at 77) using older data (1999-2001) from the NUJLSOA, which
includes respondents aged 80 to 97. The disability transition matrices are presented in
Appendix Table 4.
Our conditional mortality estimates show that cancer is linked to the highest
annual mortality rates for both men and women, followed by cerebrovascular
disease/stroke and heart disease. On the other hand, “other” diseases, osteoporosis,
and eye disease had the lowest annual mortality rates. In addition, the predicted
disease-specific mortality rates closely followed the rates observed in the vital statistics.
We also include in the Technical Appendix predictions of Japan’s future disease
prevalence from our health transition models.
5.2 Population Simulation Model Results
Putting all the pieces together, the Japan FEM can estimate the health status
and functioning of Japan’s 50+ population into the future. Figure 1 shows the simulated
population pyramids for Japanese age 50 and older from 2014 through 2040. We see
significant population aging within the over-50 population, combined with overall
population decline: a pyramid with a large “base” of 50- and 60-year olds in 2014, and
clearly showing the large post-war baby boom, evolves into a more rectangular shape
by 2040, with a smaller base, an echo of the baby boom, and larger proportion of
oldest-old, especially among women. Figure 2 compares the FEM estimated population
to official Japanese governmental projections from the National Institute of Population
and Social Security Research (IPSS 2012). Overall, the model matches the official
projections quite well.

16
Figure 1. Projected population pyramid for Japanese 50+ population, 2014-2040

17
Figure 2. Comparing the FEM Estimated Population to Official Projections, 2010-2040

18
Our projections portend rising disability among the elderly in Japan. Using our 4
measures of disability, we project how the population with 0, 1, 2, 3 or more disabilities
will evolve over the 2014-2040 period. As shown in Figure 3, the predicted prevalence
of no difficulty with activities of daily living decreases sharply with age, and the
prevalence of difficulty with 3 or more ADLs increases sharply with age, with only
moderate changes in the age pattern of disability by simulation year. Similar patterns
arise for IADLs (Figure 4) as well as for cognitive/intellectual disabilities and social
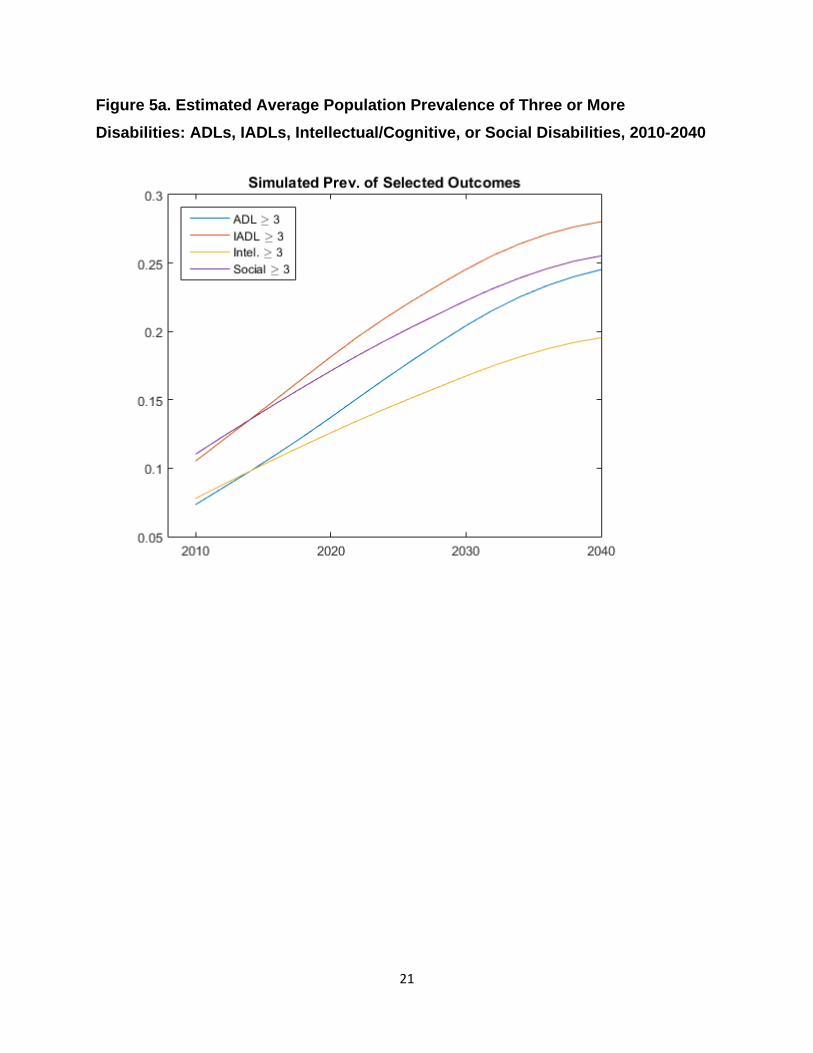
functioning disabilities (not shown). Therefore the prevalence of disabilities among the
future elderly (Figure 5a) is largely driven by the evolution of the age structure among
the 50+ population towards a greater proportion of oldest-old with a larger share of
disability, although holding the age distribution constant at the 2010 age distribution
reveals that a modest future increase in disability at given age (Figure 5b).

19
Figure 3. Predicted Prevalence of 0, 1, 2, 3 or more Difficulties with ADLs by Age, 2014-2040

20
Figure 4. Predicted Prevalence of 0, 1, 2, 3 or more Difficulties with IADLs by Age, 2014-2040
21
Figure 5a. Estimated Average Population Prevalence of Three or More Disabilities: ADLs, IADLs, Intellectual/Cognitive, or Social Disabilities, 2010-2040

22
Figure 5b. Estimated Average Population Prevalence of Three or More Disabilities Purely Due to Changing Cohort Health, Holding the Age Distribution Constant at the 2010 Age Distribution
Additional counterfactual simulations further highlight the effect of aging on
Japan’s future disability burden, and the limited role that primary prevention plays in
reducing this burden. By primary prevention, we mean efforts to reduce the probability
of transitioning into a disease state from one period to the next. This goal may be
achieved, for example, by new medical technology or pharmacological therapeutics that
lower the onset of dementia, or by measures to prevent falls and accidents. In Figures
6a and 6b, we show the impact of primary prevention efforts on the prevalence of
having difficulty in three or more ADLs, respectively unadjusted and adjusted for age
and sex. In Figure 6a, the baseline case represents future disability burden if the
probabilities of transitioning into our 19 mutually exclusive comorbid conditions remain

23
unchanged. The lines other than the base case scenario represent what would happen
to Japan’s future disability burden if we halved the probability of disease transition
respectively for broken hip, mental health disorder, dementia, or all three of the medical
conditions.
Figures 6a and 6b. Simulated Population Prevalence of Having Three or More Disabilities Given Primary Prevention Measures That Halve the Incidence of Hip Fracture, Mental Disorder, Dementia, or All Three Conditions, Unadjusted (6a) and Adjusted (6b) for Age and Sex
Unsurprisingly, halving the transition probabilities of all three disability-associated
comorbid conditions has a greater effect on reducing Japan’s future prevalence of
disability than reducing the incidence any single one of these three medical conditions.
However, if we were to focus on primary prevention on a single medical condition, the
figure shows that halving the onset of dementia would have a greater effect of reducing
disability burden than reducing the probability of either hip fractures or other mental
health disorders alone.
As Figure 6b demonstrates, however, the potential effect on disability of primary
prevention pales in comparison with the effect of aging. In every scenario, simply
holding Japan’s age and sex structure constant at 2010 levels predicts a much lower
future disability burden. The prevalence of having difficulty with three or more ADLs

24
would increase over 5% to approximately 13% by 2040 without any primary prevention
(blue line, Figure 6b) if Japan’s 2040 age and sex structure remains the same as in
2010. By contrast, in the presence of population aging, the prevalence of difficulty with
three or more ADLs would increase over 12% to approximately 20% by 2040 (pale
green line, Figure 6a) even if medical technology or public health measures reduce the
probability of having hip fracture, mental health disorder, and dementia by half.
In Figures 7a and 7b, we present, respectively, the unadjusted and adjusted
simulated future disability burden in Japan if secondary prevention measures reduce the
probability of disability by 50% given the presence of disease. In other words, instead of
preventing the onset of disease, we focus on policies or technologies such as robotic
assistance for the elderly with a fractured hip that weaken the association between
disease and disability. As the figures show, again the effect of aging overwhelms the
potential disability reduction achievable through secondary prevention. In fact, both
primary and secondary measures that respectively reduce by 50% the probability of
disease onset and the probability of disability given a disease yield similar results.
However, secondary prevention reduces the prevalence of disability burden slightly
more than primary prevention. Secondary prevention measures also take immediate
effect (shown by the immediate separation of the lines in Figures 7a and 7b), whereas
primary prevention requires a time lag for a reduction in future disease onset
(demonstrated by the gradual separation of the lines in Figures 6a and 6b).

25
Figures 7a and 7b. Simulated Population Prevalence of Having Three or More Disabilities Given Secondary Prevention Measures That Halve the Probability of Disability in the Presence of Hip Fracture, Mental Disorder, Dementia, or All Three Conditions, Unadjusted (7a) and Adjusted (7b) for Age and Sex
6. Discussion
Our FEM simulation suggests that by 2040, over 27 percent of Japan’s elderly
will exhibit 3 or more limitations in IADLs and social functioning; almost one in 4 will
experience difficulties with 3 or more ADLs; and approximately one in 5 will suffer
limitations in cognitive or intellectual functioning. These projections suggest a
disturbingly high future burden of disability in Japan. Since the majority of the increase
in disability arises from a shift to a more elderly population, prevention efforts that

26
reduce the underlying comorbidities (or future compression of morbidity among middle-
aged Japanese) may have only a limited impact on reducing the overall prevalence of
disability among Japanese elderly.
Our simulations show a modest increase in disability burden in the future even
when we hold Japan’s future population age and sex structure at 2010 levels. This
result contrasts with findings from other FEM models, and particularly the U.S. model,
which predict that disability rates will remain flat after adjusting for age and sex. Our
results are likely driven by an increasing prevalence of disability-associated morbidities
in Japan’s future population, a possible scenario given a trend toward greater survival
with multiple comorbidities.
Caution is warranted in comparing these Japanese projected disability rates to
those for other countries, since measuring disability comparably across countries is
difficult even for international surveys explicitly crafted for comparability like JSTAR,
HRS, SHARE, and ELSA. Differential item response analyses suggest that summary
indexes (counts of ADL and IADL limitations) likely underestimate mean percentage of
population with disability in these international populations (Chan, Kasper et al. 2012).
Nevertheless, comparisons can be useful for framing the policy debates and
understanding the challenges Japan faces as a super-aging society, including the
sustainability of Japan’s social programs supporting the elderly, from disability and
pensions to health insurance and long-term care insurance.
In the first wave of JSTAR, about 1.3% of the sample (aged 47-77) answered
that they were receiving a disability pension at the time of the interview; in the second
wave, that number was 1.2% (aged 52–78 (Shimizutani, Fujii et al. 2014)). As shown by
Coile, Milligan, and Wise (2014), the share of the population receiving disability benefits
at older ages varies substantially across countries (likely due to different eligibility
criteria), and is among the lowest in Japan. Their international collaborative research
project also demonstrates that international comparisons of disability status are feasible,
although Japan’s measures from the JSTAR should be interpreted with caution.
Analysis of a health index developed by Poterba, Venti, and Wise (1996)-- the first
principal component of 25 indicators that are common to the HRS and to all of the

27
SHARE countries, with overlap in the JSTAR – revealed that the weights across
countries were strikingly consistent among all the countries, except for Japan.
Nevertheless, in general, the correlations between Japan and the other countries are
between 0.88 and 0.93 (Coile, Milligan et al. 2014), suggesting comparability if
interpreted with appropriate caution.
According to the National Research Council report “Aging and the
Macroeconomy: Long-Term Implications of an Older Population” (Institute of Medicine
(US) Committee on the Long-Run Macroeconomic Effects of the Aging US Population
2012), compression of morbidity suggests that older individuals will be active longer.
Indeed, self-reported health of 60-year-old men in the 1970s was about the same as for
69-year-olds in the 2000s (NRC 2012:90). The expert committee developed projections
of labor supply through 2050, concluding that there would be “very little change in the
proportion of the population age 20–74 that could hypothetically supply labor between
2010 and 2050. Individual decisions and public policies may lead to a flat age at
retirement in coming decades, but this will not be dictated by health and biology” (Lee
2014) It is far less clear that such a sanguine forecast could be made for Japan, given
the projections of health and disability. For example, (Hashimoto, Kawado et al. 2010)
estimate that between 1995 and 2004, duration of life with a light or moderate disability
increased for both men and women in Japan. Our simulation suggests a substantial
further increase as the proportion of the oldest old continues to increase in Japan.
The development of a Future Elderly Model (FEM) for Japan contributes to the
literature in a variety of ways. First, such a model has never been estimated for Japan,
even though Japan’s population aging is far more significant than for the US and most
other OECD countries. Second, arguably the need for such a model is especially great
for Japan since its health system already features many components—such as
universal coverage with strict payment regulation—that limit the ability to further reduce
spending growth associated with population aging. Thus Japan’s health and long-term
care systems are likely to be even more impacted by health trends among the elderly.
Third, development of a policy simulation tool like the FEM has already proven to have
significance for policy, since in the country of its initial creation – the United States—the
FEM has become a leading tool for informing relevant policy debates. Drs. Dana

28
Goldman and Jay Bhattacharya have collaborated closely to develop and apply the
model. The FEM has been presented to the Congressional Budget Office in the US, and
has informed some of the CBO thinking on the implications of some elements of health
reform (e.g. spending on prevention) on health care expenditures. Drs. Goldman and
Bhattacharya are working with the OECD to extend the model to European settings, and
to aid European governments in health policy planning.
The model provides a foundation for future simulations of policies to improve the
fiscal sustainability of Japan’s health care programs in light of its super-aging population.
The FEM can also generate projections of how a wide range of health policies,
programs, technologies, and services will influence the morbidity, mortality, health
spending, long term care use, retirement, labor supply, and earnings of older
populations.
7. Limitations and Next Steps
The JSTAR data, although pioneering, also has several limitations, including lack
of national representativeness or coverage of the frailest oldest-old population. The
health conditions used to estimate health transition probabilities are all self-reported,
and are simple dichotomous variables assumed to be absorbing states. We also lack
medical expenditures. Medical costs are often conditional on duration of diagnosis, and
tend to be highest in the final year of life. To control for these duration effects, we
require a level of granularity in the data that is currently not available. In a future
iteration of this project, we aim to obtain nationally representative claims records. The
results from this preliminary adaptation of the Future Elderly Model to Japan’s aging
population, however, are based on self-reported health conditions without any
information on the year of disease onset.
We also plan to use the highest security version of the JSTAR data that links
directly to medical and long-term care spending to conduct simulations using the FEM
to inform policy decisions regarding the sustainability of Japan’s healthcare spending
and long-term care insurance program. Such studies would include simulating the fiscal
stability of Japan’s long-term care insurance program; analyzing how population aging

29
will impact future health care spending in Japan; and predicting the consequences of
extended life expectancy for the prevalence of disability among the Japanese elderly
population (i.e., assessing compression of morbidity).

30
Acknowledgements
This study uses data from the Japanese Study on Aging and Retirement (JSTAR), which was conducted by the Research Institute of Economy, Trade, and Industry (RIETI) and Hitotsubashi University in 2007 and 2009. We thank the JSTAR team for providing access to the data. We also thank the Freeman Spogli Institute for International Studies Japan Fund, the Stanford Center on the Demography and Economics of Health and Aging, and the National Institute on Aging (AG017253) for financial support for this research. Dr. Bhattacharya is grateful for support from the National Institute on Aging for his work on this project (P30 AG017253, R37AG036791 and P01AG05842).

31
Technical Appendix
Appendix Figure 1 presents an overview of the structure of the microsimulation.
The simulation starts in 2010 with nearly 12.5 Million hypothetical individuals age 50+
(10% of the population in 2010; (Statistics Bureau 2010)). The simulation model
estimates the risk of developing 19 diseases for each individual. The model updates the
health status and mortality risk for each individual. At the end of each cycle, some of
the individuals die, and the rest age 2 years and are transitioned to the next cycle. In
addition, a new cohort of 50 and 51 year-old individuals are added to the population in
2012 to replenish the youngest cohorts. The same process is repeated for the
subsequent cycles (2014, 2016, …, etc.).
Appendix Figure 1: Overview of the microsimulation model
The microsimulation consists of two main modules: a core module that describes
the health and mortality of the population, and a set of secondary modules that forecast
disability and may be adapted to other outcomes such as healthcare utilization, medical
spending, and long-term care in Japan. The secondary modules are based on the core
module. This technical appendix focuses on the functionality of the core health
transition module. (Jalal, Eggleston et al. 2015)
12,471,386 Individuals - 10% of the population
(age 50+) in 2010
Health & functional status, 2012
New 50 and 51 year-olds in 2012
2010 Outcomes
Deceased
2012 Outcomes
Deceased
Survivors Health & functional status, 2014
New 50 and 51 year-olds in 2014
2014 Outcomes
Deceased
Survivors Survivors etc.

32
The core module describes the health status of each individual. Health status is
defined by 19 conditions based on self-reported health conditions in JSTAR. The survey
asks respondents about a multiplicity of health conditions. Self-reported measures of
health conditions are based on a positive response for current or past treatment for a
medical condition, or from communication by a physician that the respondent has that
specific health condition. We focus our analysis on diseases identified by our medical
panel as the most relevant and costly in a Japanese population. The 19 conditions
selected are presented in Appendix Table 1, along with their prevalence calculated by
using the 2007 data.
Appendix Table 1: Summary Statistics
Variable Obs Mean
heart disease 3,708 0.13 hypertension 3,708 0.44 hyperlipidemia 3,708 0.16 CVD 3,708 0.05 diabetes 3,708 0.15 COPD 3,708 0.02 asthma 3,708 0.04 liver 3,708 0.05 ulcer 3,708 0.09 joint 3,708 0.08 broken hip 3,708 0.01 osteoporosis 3,708 0.06 eye disease 3,708 0.14 bladder 3,708 0.05 mental health 3,708 0.03 dementia 3,708 0.00 skin 3,708 0.04 cancer 3,708 0.04 other 3,708 0.16
The model’s main variables are AGEit, GENDERi, SMOKEit, BMIit, and a set of 19
indicator variables DISEASEit = {DISEASE1it,...,DISEASE19it} that reference the 19
chronic conditions, where 𝑖 indexes the individual and 𝑡 refers to time. In addition, we
create an indicator variable MORTit = 1 if the simulated individual dies during the

33
simulation. The baseline cohort is defined at the initial time period (t=1). This time
period represents the first two years of the simulations (i.e.,2010 and 2011). The
variables AGE, GENDER, SMOKE, BMI and DISEASE are sampled from JSTAR with
replacement. These samples are repeated until the number of individuals in each age
and sex category are equal to the Japanese population distribution in 2010 (Statistics
Bureau 2010),
After establishing the baseline cohort, the microsimulation iterates to the next
time period (t=2) by projecting the values of each variable for the next two years (i.e.,
2012 and 2013). Thus, the variable AGEit=2 = AGEit=1 + 2. Since the 50 and 51 years
individuals age to 52 and 53 years-old, respectively, at t=2, new 50 and 51 year-old
individuals are added to the simulation to replenish the youngest age group. The
characteristics of these new individuals are sampled with replacement from the 50-55
year-old individuals in JSTAR, weighted by the age- and gender-specific projected
population of 50 year-olds based on the official Japanese projections (National Institute
of Popoulation and Social Security Research 2012).
Health transitions
JSTAR provides self-reported health status measures for each individual in 2007
and 2009. We use logistic regressions to estimate the probability of transitioning to one
of the 19 mutually exclusive health states in 2009 based on not having that health
condition in 2007 and controlling for demographic and comorbid conditions in 2007. We
project transitions of self-reported heart disease, hypertension, hyperlipidemia, diabetes,
cancer, and fourteen other categories of disease. The independent variables include
health status and basic demographic characteristics such as age, gender, smoking
status or weight category, as measured at baseline in 2007. The coefficient estimates of
these transitions models predict health status two years into the future (2009). We
model these relationships as 𝐻𝑡 + 2 = 𝑔(𝐻𝑡 ,𝑋𝑡), using multivariate logistic regression.
Because these health states are measured by responses to questions such as “Have
you ever been told by a doctor ....” we treat all health status states as absorbing states.

34
We choose the following sample selection criteria. Individuals must be at least 45
years old. This yields 3,862 respondents with a total of 7,724 interview years. We then
drop observations of individuals with a missing value for any of our health measures of
interest. Following this selection criterion, we arrive at the final estimation sample
consisting of 2,526 individuals for 2007, 2,659 for 2009, and 1,854 individuals and 3,708
interview years for the pooled data. Most missing data occur for self-reported health
states. The health status measures include heart disease, hypertension, hyperlipidemia,
cerebrovascular disease, diabetes, chronic obstructive pulmonary disease, asthma, liver
disease, ulcer, joint disease, bone fractures/broken hip, osteoporosis, eye disease,
bladder disease, mental health disorder, dementia, skin disease, cancer and all other
diseases. Appendix Table 1 provides summary statistics of the baseline 2007 values of
the independent variables used in the estimation, including the prevalence of the
various disease states.
As noted previously, we treat all health conditions in JSTAR as absorbing states.
For the 19 health states, the JSTAR questions are worded as “Have you been newly
diagnosed with, or have you ever been diagnosed with ...” The question wordings define
these conditions as absorbing states. In addition, we separately estimated the likelihood
of transitioning out of the disease states but found little evidence of recovery for the
listed medical conditions in our sample. As a result, we only model transitions into these
states (without allowing for cure) in the following form: 𝑙𝑛 � 𝑝𝑖,𝑗,𝑡+2
1−𝑝𝑖,𝑗,𝑡+2� = 𝛽0 + 𝜸 ∙ 𝑿𝒊𝒋𝒕 + 𝜀𝑖𝑗𝑡,
where pi,j,t+2 is the probability of having the j-th condition for individual i at time t+2
(2009); and Xijt are demographic characteristics (demeaned age, demeaned age square,
and where appropriate, an indicator for BMI ≥ 23.5, and an indicator for heavy smoking,
defined as > 20 cigarettes per day) and co-morbidities for individual i in time t (2007)
that affect the onset of condition j.
The probabilities of the onset of the various conditions are assumed to be linear
in the covariates (except age). Age, age squared, and male gender enter into all
transition models, but the other covariates enter into the regression only if two medical
doctors agree that they are likely causative factors in the onset of the specific disease

35
model in question. Given the low prevalence of obesity in Japan, we choose a BMI
value of 23.5 and greater to be a proxy for overweight. For smoking, because of the
high number of smokers among Japanese males, we set the indicator variable for
smoker if the respondent answers smoking 20 or more cigarettes per day in 2007.
The unit of observation is an interview-pair (for years 2007-2009). All
independent variables are measured with a two-year lag, and represent the
respondent’s characteristics as of 2007. Transition probabilities are estimated only
using individuals who did not suffer from a specific condition at baseline (2007). As a
result, the sample sizes for various health status transition regressions do vary. For
example, consider a respondent who was interviewed in 2007 without cancer but with a
heart condition. In 2009, he is diagnosed with cancer. This person’s baseline condition
included “heart disease,” so he does not contribute to the heart disease transition model
in any way. On the other hand, he contributes one observation to the cancer transition
model. Because JSTAR currently only has two time points, we ignore clustering at the
individual level because any given person will contribute at most once to a specific
disease model.
Since JSTAR lacks data on individuals 80 years and older, we used the health
transition module to age the JSTAR population, and sampled for those older than 80
years. We recognize this as an important limitation of the data since the number and
type of chronic conditions may be different, especially in the later years of life. (The
details of the mortality calculations are described below.)
Mortality
At the end of each cycle, the probability of death for each individual is calculated
as the sum of disease-specific mortality rates for that age and sex category1, such that
𝑚𝑖 = ∑ 𝑟𝑎𝑠𝑗𝑗=1 , where 𝑚𝑖 is the total mortality rate for individual 𝑖 and 𝑟𝑎𝑠𝑗 is the mortality
rate conditional on age, gender and disease.
We used the iterative proportional fitting (IPF) algorithm to calculate the
conditional mortality rates from JSTAR data and the Japanese vital statistics data. The
vital statistics provides aggregated information on the cause of death by age and

36
gender, but no information is provided on other comorbidities at the time of death. To
calculate the conditional mortality rates, we assume conditional independence of the
disease-specific mortalities, such that the probability of any particular disease being the
cause of death is independent on the other comorbidities that an individual has. For
example if 5% of patients who have only HD die from HD, under conditional
independence, 5% of patient with HD+CA are also expected to die from HD. In the
latter group, an additional 4% may die from cancer, for example. More formally, we
assume that p(HD cause of death|HD) = p(HD casue of death|HD,CA,…). Later we test
the effects of this assumption on the mortality rate calculations.
Appendix Table 2 illustrates the setup for the IPF algorithm for a particular age
and sex combination. This table illustrates the distribution of individuals with unique
disease profiles who are alive or dead due to one of the 19 diseases. For example,
𝑚𝐶𝐴|𝑞3 represents the number of individuals who have heart disease and cancer and
are expected to die from cancer. The cells that refer to diseases not in the disease
profiles are set to zero because we assume that all diseases are observed. The column
totals represent the total number of people with each particular disease profile. This
data is known from JSTAR and scaled up to match the number of individuals in the
population using the census data. Furthermore, the row totals represent the number of
individuals who died in 2010 from each condition, and the total number of individuals
alive. Since both the column and row margins are known, the IPF algorithm computes
the number of people who are expected to die due to each condition for all disease
profiles. The IPF converges when the sum of the cells in each row equals the row total
and the sum of the cells on the columns are equal the column margin. The disease
specific mortality rates (𝑟𝑎𝑠𝑗) are then calculated by dividing each column by the column
totals.

37
Appendix Table 2: Setup for the Iterative Proportional Fitting Algorithm
Diseases Profile
Dead due to leading cause Alive Total
HD HTN … CA Other HD 𝑚𝐻𝐷|𝑞1 0 … 0 𝑚𝑜𝑡ℎ𝑒𝑟|𝑞1 𝑎𝑙𝑖𝑣𝑒|𝑞1 𝑞1 HD+HTN 𝑚𝐻𝐷|𝑞2 𝑚𝐻𝑇𝑁|𝑞2 … 0 𝑚𝑜𝑡ℎ𝑒𝑟|𝑞2 𝑎𝑙𝑖𝑣𝑒|𝑞2 𝑞2 HD+CA 𝑚𝐻𝐷|𝑞3 0 … 𝑚𝐶𝐴|𝑞3 𝑚𝑜𝑡ℎ𝑒𝑟|𝑞3 𝑎𝑙𝑖𝑣𝑒|𝑞3 𝑞3 … … … … … … … … Total �𝑚𝐻𝐷|𝑞𝑖
𝑖
�𝑚𝐻𝑇𝑁|𝑞𝑖𝑖
… �𝑚𝐶𝐴|𝑞𝑖𝑖
�𝑚𝑜𝑡ℎ𝑒𝑟|𝑞𝑖𝑖
�𝑎𝑙𝑖𝑣𝑒|𝑞𝑖𝑖
�𝑞𝑖𝑖
Note: The number in the cells represents the number of people who are expected to live or die from a particular constellation of conditions. The rows represent the combinations of the 19 disease categories in JSTAR; the columns represent the total number projected to die of a particular leading cause of death at a given point in time, as well as the total alive; and the final row shows the total number of deaths due to each of the 19 conditions. HD = heart disease, CA = cancer, HTN = hypertension.
Results
Conditional mortality
Appendix Figure 2 consists of a series of box-plots that illustrate the distribution
of age-, sex-, and disease-specific 5-year mortality rates (𝑟𝑎𝑠𝑗) predicted with the IPF
algorithm for all unique disease profiles. Overall, mortality rates increase with age and
are generally higher for males than females except for bladder disease and urinary tract
infections. Mortality rates are highest for cancer, followed by “other,” a residual category
that captures causes of death that are not included in the 18 specific categories and
essentially represents the remaining age- and sex-specific mortality rate. Heart disease
has the third highest mortality rate. Importantly, the mortality rate distributions over the
various disease profiles and comorbidities are narrow, indicating that the conditional
mortality independence is a suitable assumption because the mortality rates for the 19
conditions regardless of the associated comorbidities do not seem to vary significantly.
In addition, we used the mean 𝑟𝑎𝑠𝑗 over all unique disease profiles to compute the
number of people who are expected to die in Japan in 2010.

38
Appendix Figure 2: Age-, gender- and disease-specific mortality rate distributions for all 19 diseases
Note: Blue = male, Red = female. The boxes are the 95% confidence intervals; the central lines are the medians; and the whiskers are the most extreme points.

39
Appendix Figure 3 compares the IPF predicted deaths (solid line) to the observed
data (dashed line). The IPF results are nearly identical to the official observations,
indicating that the IPF is capable of accurately reproducing disease-specific mortality.
Appendix Figure 3: Predicted vs. observed number of deaths by age and gender for 2010
Note: M Obs = observed data for males, F Obs = observed data for females, M Model = IPF prediction for males, F Model = IPF predictions for females.
Population projections
Appendix Figure 4 compares the microsimulation predicted population size (solid
line) to the 2010 census and the official Japanese projections for 2020, 2030 and 2040
(dashed line). The baseline results are identical because we are matching the baseline
cohort to the 2010 census data. The microsimulation projections in future years are
slightly higher than the official projections. The population size is expected to decrease,

40
as shown by the population pyramids (Figure 1), while the relative proportion of the
elderly is expected to increase.
Appendix Figure 4: Population size from the microsimulation (solid lines) compared to official projections (dashed lines) for 2020, 2030 and 2040
Note: The official projections are from National Institute of Population and Social Security Research of
Japan, median variant. M Obs = observed data for males, F Obs = observed data for females, M Model =
IPF prediction for males, F Model = IPF predictions for females. The microsimulation uses the 2010
census population composition. Population Projection for Japan: 2011-2060.
Health transitions
Appendix Tables 3a (JSTAR) and 3b (NUJLSOA) present the results of our
conditional health transition model for all 19 health dimensions. Because we include a

41
quadratic term for age, we demean the age variable so that the coefficient on age
represents the probability of disease onset with increasing age, and the coefficient on
age squared represents whether this rate of change is increasing or decreasing. The
coefficients on age are generally positive, signifying that the probability of onset for
various conditions tends to increase with age. Coefficients that are negative are often
indistinguishable from 0. Likewise for age squared, the coefficients are also generally
positive, or, if negative, extremely small and statistically indistinguishable from 0 (except
for cancer). This pattern generally indicates that the probability of onset increases with
age at an increasing rate. Positive coefficients in Appendix Tables 3a and 3b indicate a
higher disease onset probability and thus poorer health. For example, in Appendix
Table 3a, having hypertension in 2007 increases the probability heart disease onset in
2009. Having a BMI ≥ 23.5 in 2009 increases the probability of having diabetes in 2009.
All explanatory covariates are measured with a two-year lag, i.e., as of the first
interview of the interview-pair in 2007 (or 1999 for NUJLSOA) relative to the second
interview in 2009 (or 2001 for NUJLSOA). Note the very powerful cross-effects of
comorbid health conditions. For example, hypertension, hyperlipidemia, diabetes,
asthma, liver disease, ulcer, osteoporosis, and “other” diseases all increase the risk of
developing heart disease. Heart disease, hyperlipidemia, cerebrovascular disease,
diabetes, and liver disease are all correlated with the onset of hypertension. Men tend to
have higher risks of hypertension, cerebrovascular disease, chronic obstructive
pulmonary disease, asthma, ulcer, bladder disease and cancer than women, and lower
risks of hyperlipidemia, joint disorder, bone fractures/broken hip, osteoporosis, eye
disease, mental health disorders, dementia and skin disease. Being overweight is highly
correlated with the onset of hypertension, hyperlipidemia, cerebrovascular disease,
diabetes, and joint disorder. Smoking more than 20 cigarettes a day increases the risk
of heart disease and diabetes in particular, but does not appear to predict other disease
very well. We do not control for a generic “ever smoked” variable because its effects are
often contradictory. It is possible that the respondents’ answers are particularly
inaccurate for this variable. An alternative explanation may be that very high measures
of smoking behavior are required to show a health effect in the Japanese context.

42
Appendix Table 3a: JSTAR Health Transition Matrix

43
Appendix Table 3a: JSTAR Health Transition Matrix (Continued)

44
Appendix Table 3b: NUJLSOA Health Transition Matrix

45
Appendix Figure 5 compares the age- and sex-specific disease prevalence rates
for the JSTAR and NUJLSOA, for the medical conditions reported in both datasets.
Data on hyperlipidemia, asthma, mental health, skin and “other” health conditions are
not available in the NUJLSOA. For the most prevalent conditions, the age-specific
prevalence rates are reasonably close, with some indication of compression of morbidity
for heart disease, stroke, and ulcers (i.e., for the overlapping age cohorts between 65
and 75, the NUJLSOA shows higher prevalence than the more recent JSTAR cohort).
Some of the discrepancies reflect different wording of the questions (e.g. for eye
disease). These discrepancies should not impact our projections to a large extent
because they are mostly confined to conditions that are not leading causes of death.
Nevertheless, a consistent source of data for both the elderly and oldest-old populations
would improve the ability to make accurate forecasts.
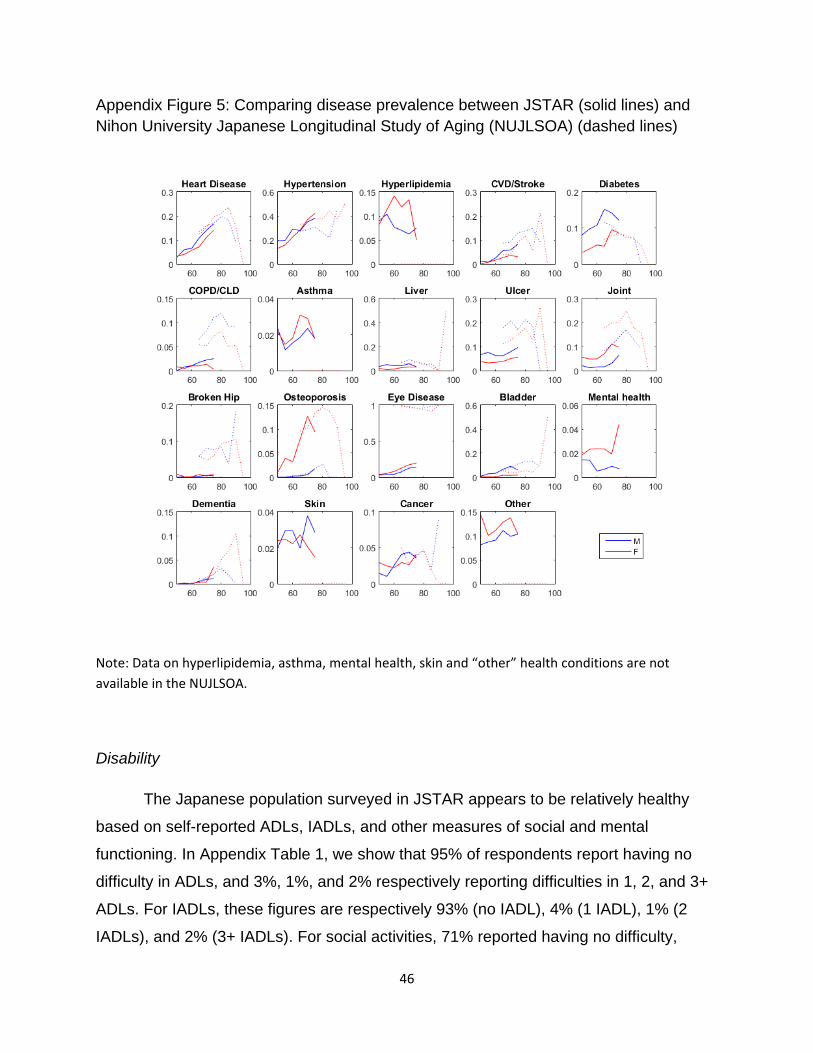
46
Appendix Figure 5: Comparing disease prevalence between JSTAR (solid lines) and Nihon University Japanese Longitudinal Study of Aging (NUJLSOA) (dashed lines)
Note: Data on hyperlipidemia, asthma, mental health, skin and “other” health conditions are not available in the NUJLSOA.
Disability
The Japanese population surveyed in JSTAR appears to be relatively healthy
based on self-reported ADLs, IADLs, and other measures of social and mental
functioning. In Appendix Table 1, we show that 95% of respondents report having no
difficulty in ADLs, and 3%, 1%, and 2% respectively reporting difficulties in 1, 2, and 3+
ADLs. For IADLs, these figures are respectively 93% (no IADL), 4% (1 IADL), 1% (2
IADLs), and 2% (3+ IADLs). For social activities, 71% reported having no difficulty,

47
followed by 17%, 7%, and 5% respectively for 1, 2, and 3+ difficulties. For intellectual
activities, the figures are respectively 78% (no difficulty), 15% (1 difficulty), 5% (2
difficulties), and 3% (3+ difficulties). Finally, of the 6,328 observations with a non-
missing response, 8% reported receiving some sort of help from friends and family,
while 22% of 523 non-missing responses reported having received some type of
physical assistance, and 42% of 520 non-missing responses reported having received
assistance for household chores.
The ordered logistic regressions and logistic regressions show that three chronic
illnesses impose the most consistent burden on physical and mental functioning across
all measures (ADLs, IADLs, social, intellectual functioning, and care receiving). These
illnesses include cerebrovascular disease, diabetes, and dementia; coefficients are
particularly large for these three medical conditions (see Appendix Table 4). Other
chronic illnesses that adversely impact functioning include heart disease, joint disorder,
broken hip, osteoporosis, mental health, and “other” diseases. Joint disorder and broken
hip affect ADLs and IADLs in particular, and mental health problems are positively
associated with having difficulty with ADLs, IADLs, as well as social and intellectual
activities. Older age is also unsurprisingly associated with greater difficulties in physical
and mental functioning.

48
Appendix Table 4: Transition Matrix for Activities of Daily Living (Ordered Logit) / Care Receiving (Logit)

49
Simulated Prevalence of Diseases
Appendix Figures 6 and 7 show the estimated prevalence of disease for Japan’s
future population of older adults. The average number of comorbidities per individual is
projected to more than double by 2040 (from 2 to 4 for males and 2.6 to 5.7 for females;
Appendix Figure 6). Appendix Figure 7 summarizes the average population prevalence
of heart disease, diabetes, and cancer among the Japanese population age 50 and
older. Cancer prevalence remains around 7-9% throughout the 30-year period; diabetes
prevalence increases from 26% to 38% by 2040; and heart disease prevalence
increases from 38% to 48%, indicating that almost half of Japanese aged 50 and older
will have heart disease by 2040.
Appendix Figure 6: Average number of comorbidities per individual age 50+ for males (blue) and females (red)

50
Appendix Figure 7: Projected increase in the prevalence of heart disease, diabetes and cancer among Japan’s population aged 50 and older, 2010 - 2040

51
References
Aísa, R., F. Pueyo and M. Sanso (2012). "Life expectancy and labor supply of the elderly." Journal of Population Economics 25(2): 545-568. Bech, M., T. Christiansen, E. Khoman, J. Lauridsen and M. Weale (2011). "Ageing and health care expenditure in EU-15." The European Journal of Health Economics 12(5): 469-478. Behrman, J. R. and S. W. Parker (2013). "Is Health of the Aging Improved by Conditional Cash Transfer Programs? Evidence From Mexico." Demography 50(4): 1363-1386. Bloom, D. E., D. Canning and B. Graham (2003). "Longevity and Life‐cycle Savings*." The Scandinavian Journal of Economics 105(3): 319-338. Chan, K. S., J. D. Kasper, J. Brandt and L. E. Pezzin (2012). "Measurement equivalence in ADL and IADL difficulty across international surveys of aging: findings from the HRS, SHARE, and ELSA." The Journals of Gerontology Series B: Psychological Sciences and Social Sciences 67(1): 121-132. Coile, C., K. S. Milligan and D. A. Wise (2014). "Social Security Programs and Retirement Around the World: Disability Insurance Programs and Retirement-Introduction and Summary." National Bureau of Economic Research Working Paper 20120. Coleman, D. and R. Rowthorn (2011). "Who's afraid of population decline? A critical examination of its consequences." PoPulation and develoPment review 37(s1): 217-248. Cullinan, J., B. Gannon and E. O’Shea (2013). "The welfare implications of disability for older people in Ireland." The European Journal of Health Economics 14(2): 171-183. Dow, W. H., T. J. Philipson and X. Sala-i-Martin (1999). "Longevity complementarities under competing risks." American Economic Review: 1358-1371. Finkelstein, A. and J. Poterba (2004). "Adverse selection in insurance markets: Policyholder evidence from the UK annuity market." Journal of Political Economy 112(1): 183-208. Foundation for Promotion of Cancer Research (2013). Trends in Age-adjusted in Mortality Rate (1958-2012). 2015. Fukawa, T. (2007). "Health and long-term care expenditures of the elderly in Japan using a micro-simulation model." The Japanese Journal of Social Security Policy 6(2): 199-206. Gannon, B. and B. Davin (2010). "Use of formal and informal care services among older people in Ireland and France." The European Journal of Health Economics 11(5): 499-511. Gender Equality Bureau, Cabinet Office (2008). A special summary of Comprehensive Survey of Living Conditions (Kokumin seikatsu kiso chosa tokubetsu shukei zantei kekka) Gerdtham, U.-G., D. Lundin and M. Sáez-Martí (2005). "The ageing of society, health services provision and taxes." Journal of population economics 18(3): 519-537. Goldman, D. P., B. Shang, J. Bhattacharya, A. M. Garber, M. Hurd, G. F. Joyce, D. N. Lakdawalla, C. Panis and P. G. Shekelle (2005). "Consequences of health trends and medical innovation for the future elderly." Health Affairs 24: W5. Grant, J., S. Hoorens, S. Sivadasan, M. van het Loo and J. DaVanzo (2004). "Low fertility and population ageing: causes consequences and policy options." Hashimoto, S., M. Kawado, R. Seko, Y. Murakami, M. Hayashi, M. Kato, T. Noda, T. Ojima, M. Nagai and I. Tsuji (2010). "Trends in disability-free life expectancy in Japan, 1995-2004." Journal of Epidemiology 20(4): 308-312. Hauser, R. M. and D. Weir (2010). "Recent developments in longitudinal studies of aging in the United States." Demography 47(1): S111-S130. Hoshi, T. and T. Ito (2014). "Defying gravity: can Japanese sovereign debt continue to increase without a crisis?" Economic Policy 29(77): 5-44.

52
Ichimura, H., S. Shimizutani and H. Hashimoto (2009). JSTAR First Results 2009 Report, Research Institute of Economy, Trade and Industry (RIETI). Imrohoroğlu, S. and S. Kitao (2012). "Social security reforms: benefit claiming, labor force participation, and long-run sustainability." American Economic Journal: Macroeconomics 4(3): 96-127. Index Mundi. (2011). "Japan Demographics Profile 2011." Retrieved November 18, 2014, from http://www.indexmundi.com/japan/demographics_profile.html. Institute of Medicine (US) Committee on the Long-Run Macroeconomic Effects of the Aging US Population (2012). "Aging and the Macroeconomy: Long-Term Implications of an Older Population." IPSS (2012). Population Projections for Japan: 2011-2060. National Institute of Population and Social Security Research. Jalal, H., K. Eggleston, B. Chen, H. Hashimoto, L. Schoemaker, S.-C. Suen and J. Bhattacharya (2015). A Microsimulation of the Aging Japanese Population. Kapteyn, A. (2010). "What can we learn from (and about) global aging?" Demography 47(1): S191-S209. Keese, M. (2006). Live longer, work longer, OECD. Keys, A., A. Menotti, C. Aravanis, H. Blackburn, B. S. Djordevič, R. Buzina, A. Dontas, F. Fidanza, M. J. Karvonen and N. Kimura (1984). "The seven countries study: 2,289 deaths in 15 years." Preventive medicine 13(2): 141-154. Lee, R. and J. Skinner (1999). "Will aging baby boomers bust the Federal budget?" The Journal of Economic Perspectives: 117-140. Lee, R. D. (2014). "Macroeconomic Consequences of Population Aging in the United States: Overview of a National Academy Report." The American Economic Review 104(5): 234-239. Manton, K. G., E. Stallard and L. Corder (1998). "Economic effects of reducing disability." American Economic Review: 101-105. Martínez, M. J. S. and R. G. Marín (2014). "Aging and Demographic Weakness in the European Union: The Spanish Model." Population Review 53(2). Ministry of Internal Affairs and Communications (2013). White Paper on the Infornation and Communications in Japan in 2013 (Joho Tsushin Hakusho). Miyazawa, K., P. Moudoukoutas and T. Yagi (2000). "Is public long-term care insurance necessary?" Journal of Risk and Insurance: 249-264. National Institute of Popoulation and Social Security Research (2012). Population Projections for Japan (January 2012): Medium-Variant Fertility and Mortality Projections. OECD (2007). Age-Dependency Ratios. Society at a Glance 2006: OECD Social Indicators, OECD Publishing: 42-43. OECD (2013). Health at a Glance 2013: OECD Indicators, OECD Publishing. Ogawa, N., A. Mason, R. M. Maliki and K. Nemoto (2007). Population aging and health care spending in Japan: Public-and private-sector responses. Population Aging, Intergenerational Transfers and the Macroeconomy. R. L. Clark, N. Ogawa and A. Tason. Northampton, MA, USA, Edward Elgar Publishing Inc.: 192-223. Ogawa, N., R. D. Retherford and Y. Saito (2010). Care of the elderly and women’s labour force participation in Japan. Ageing in Advanced Industrial States, Springer: 223-261. Oshio, T., S. Shimizutani and A. S. Oishi (2010). Does social security induce withdrawal of the old from the labor force and create jobs for the young? The case of Japan. Social Security Programs and Retirement around the World: The Relationship to Youth Employment, University of Chicago Press: 217-241. Philipson, T. J. and G. S. Becker (1998). "Old-age longevity and mortality-contingent claims." Journal of Political Economy 106(3): 551-573. Poterba, J. M. (2014). "Retirement Security in an Aging Population." The American Economic Review 104(5): 1-30.

53
Poterba, J. M., S. F. Venti and D. A. Wise (1996). "How retirement saving programs increase saving." The Journal of Economic Perspectives: 91-112. Prettner, K. and D. Canning (2012). "Increasing life expectancy and optimal retirement: does population aging necessarily undermine economic prosperity?" No.9112. Program on the Global Demography of Aging. Schieber, S. J. (2010). Aging Populations, Pension Operations, Potential Economic Disappointment and Its Allocation. Demography and the Economy, University of Chicago Press: 293-325. Schoeni, R. F. and M. B. Ofstedal (2010). "Key themes in research on the demography of aging." Demography 47(1): S5-S15. Shimizutani, S., M. Fujii and T. Oshio (2014). Option Value of Work, Health Status, and Retirement Decisions in Japan: Evidence from the Japanese Study on Aging and Retirement (JSTAR). Social Security Programs and Retirement Around the World: Disability Insurance Programs and Retirement, University of Chicago Press. Singh, Y. (2013). Population Aging and Health Expenditure in Kerala: An Empirical Analysis. Applied Demography and Public Health, Springer: 61-75. Statistics Bureau, Ministry of Internal Affairs and Communications (2015). Result of the Population Estimates, Monthly Report in August 1, 2014 (Final estimates) , January 1, 2015 (Provisional estimates). Statistics Bureau, Ministry of Internal Affairs and Communications, Death Rates by Causes of Death, available at http://www.stat.go.jp/english/data/nenkan/1431-21.htm (accessed October 12, 2015). Statistics Bureau, Ministry of Internal Affairs and Communications, (2010). 2010 Population Census of Japan. Ministry of Internal Affairs and Communications, available at http://www.stat.go.jp/english/data/kokusei/ (accessed October 12, 2015). Statistics Bureau, Ministry of Internal Affairs and Communications, (2010). Population and Households of Japan (Final Report of the 2010 Population Census). Suzman, R. (2010). "Prologue: Research on the demography and economics of aging." Demography 47: S1-S4. Venti, S. F. (2010). Comment on" Aging Populations, Pension Operations, Potential Economic Disappointment and Its Allocation". Demography and the Economy, University of Chicago Press: 326-331. Yashin, A., I. Akushevich, K. Arbeev, A. Kulminski and S. Ukraintseva (2013). Methodological Aspects of Studying Human Aging, Health, and Mortality. Applied Demography and Public Health, Springer: 337-355. Zheng, H. (2014). "Aging in the context of cohort evolution and mortality selection." Demography 51(4): 1295-1317.