forecasting model for insect pest
63
Forecasting Models for major Insect pests 1
-
Upload
shweta-patel -
Category
Education
-
view
318 -
download
2
Transcript of forecasting model for insect pest
Forecasting Models for major Insect pests
1
2
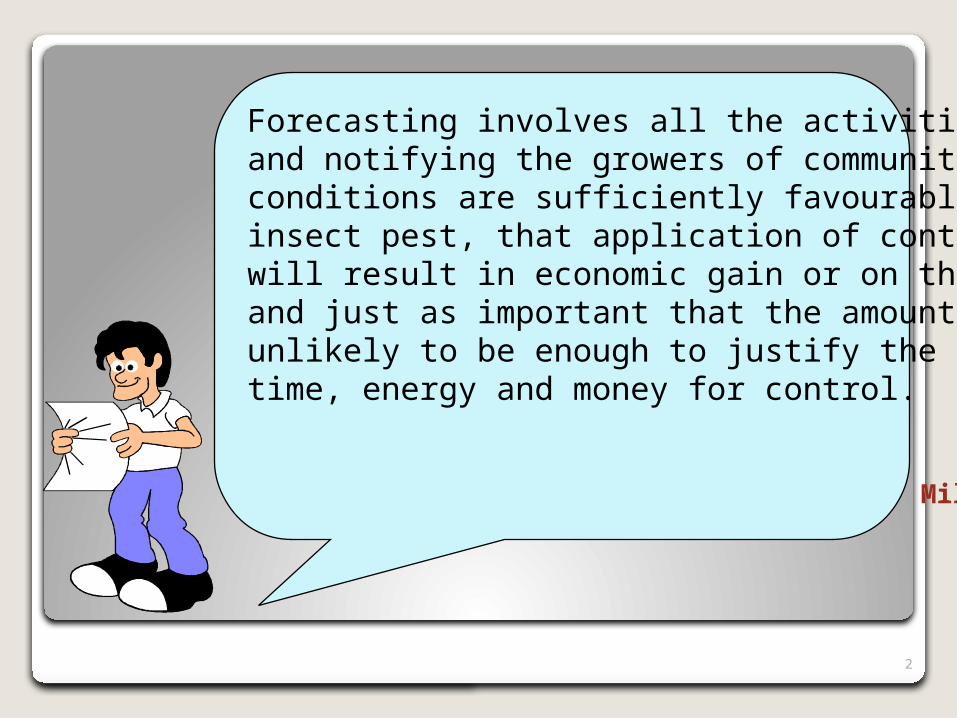
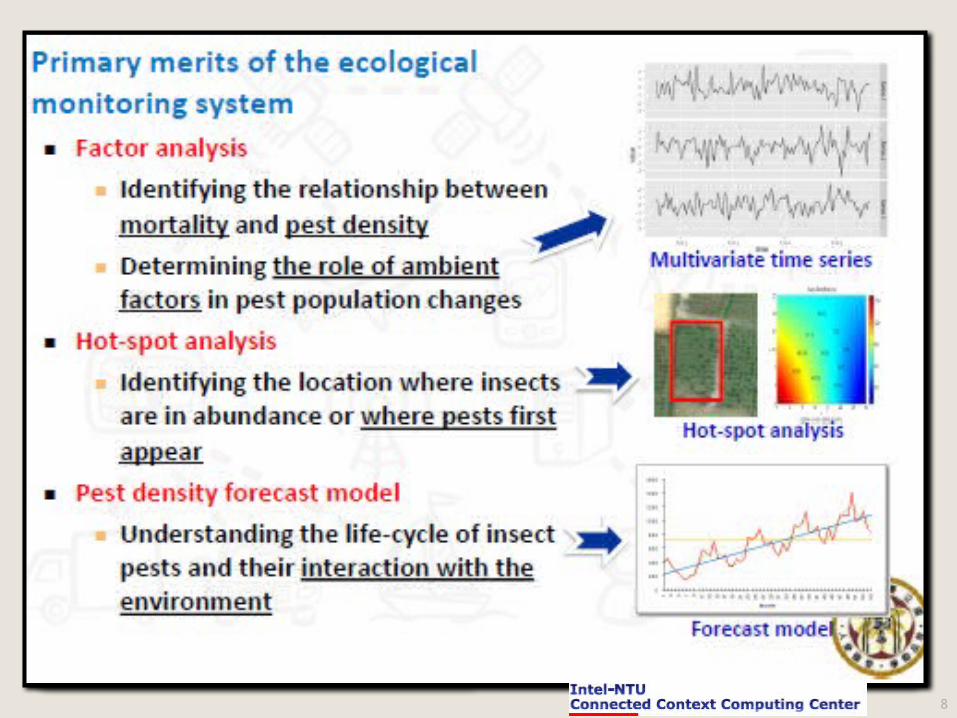
Forecasting involves all the activities in ascertaining and notifying the growers of community that conditions are sufficiently favourable for certain insect pest, that application of control measures will result in economic gain or on the other hand and just as important that the amount expected is unlikely to be enough to justify the expenditure of time, energy and money for control.
Miller and O’Brien (1952)
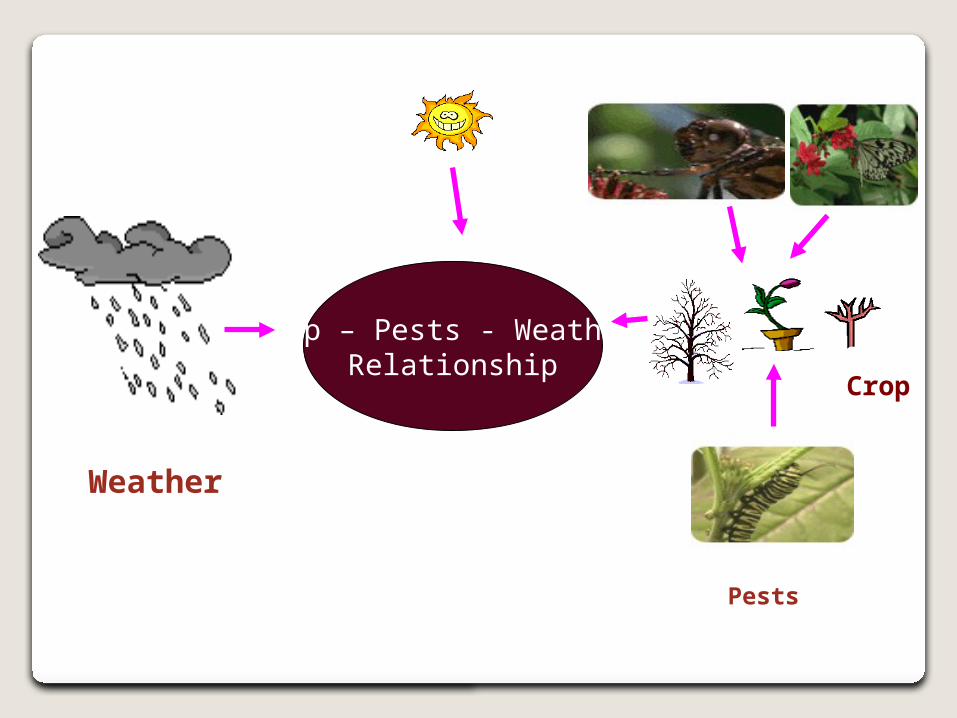
Crop – Pests - Weather Relationship
Weather
Crop
Pests
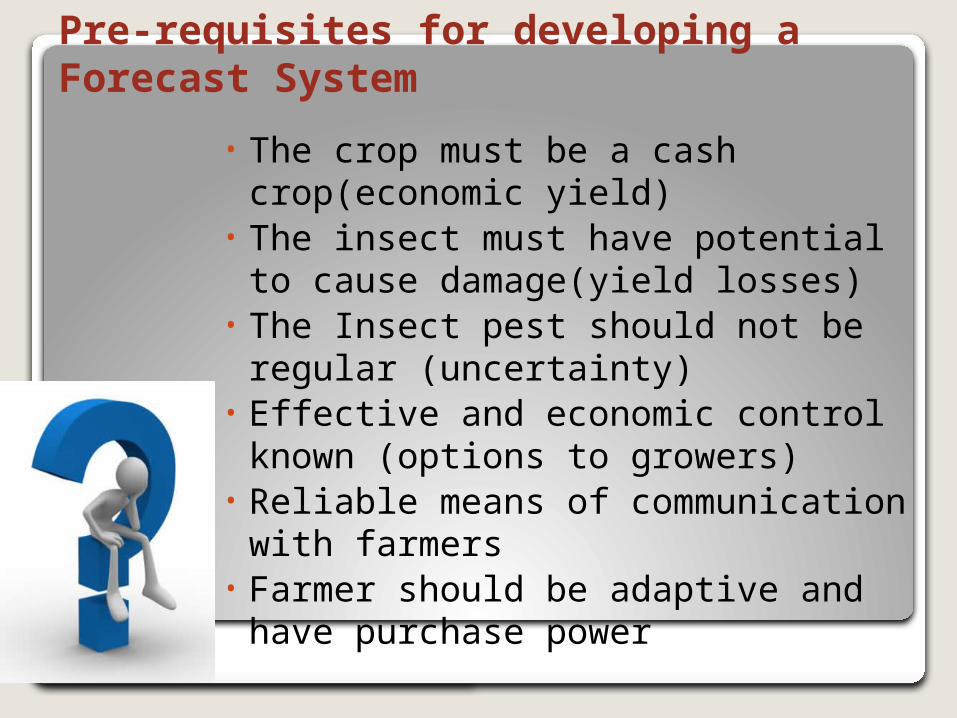
Pre-requisites for developing a Forecast System
• The crop must be a cash crop(economic yield)
• The insect must have potential to cause damage(yield losses)
• The Insect pest should not be regular (uncertainty)
• Effective and economic control known (options to growers)
• Reliable means of communication with farmers
• Farmer should be adaptive and have purchase power
5
National Consultation on a Framework for Climate Services in Belize
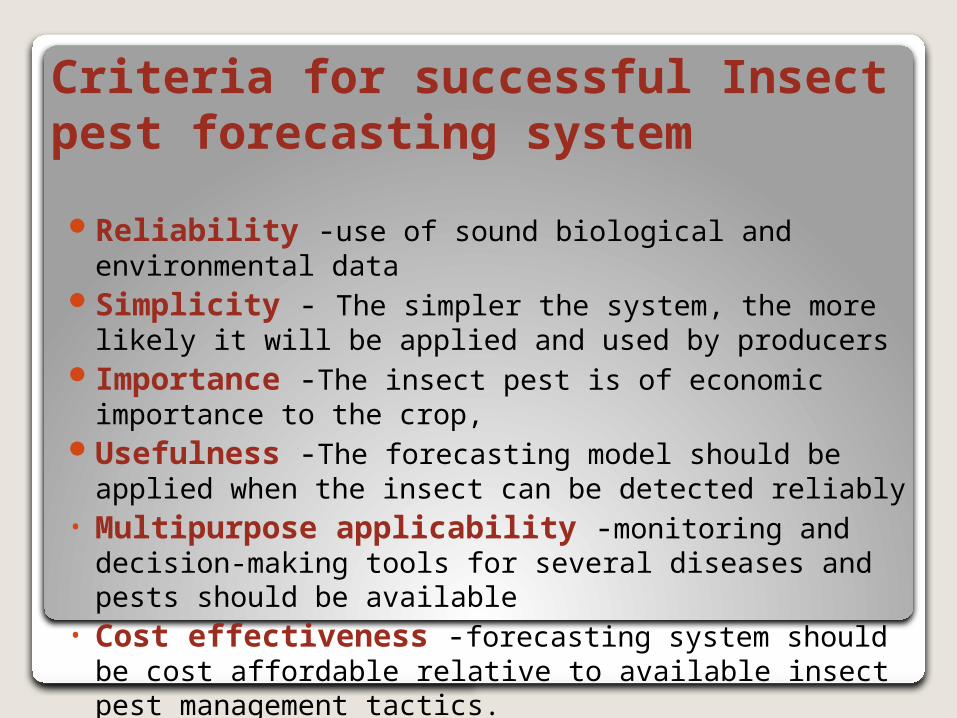
Criteria for successful Insect pest forecasting system
Reliability -use of sound biological and environmental dataSimplicity - The simpler the system, the more likely it will be
applied and used by producersImportance -The insect pest is of economic importance to the crop, Usefulness -The forecasting model should be applied when the
insect can be detected reliably• Multipurpose applicability -monitoring and decision-making
tools for several diseases and pests should be available• Cost effectiveness -forecasting system should be cost affordable
relative to available insect pest management tactics.
7
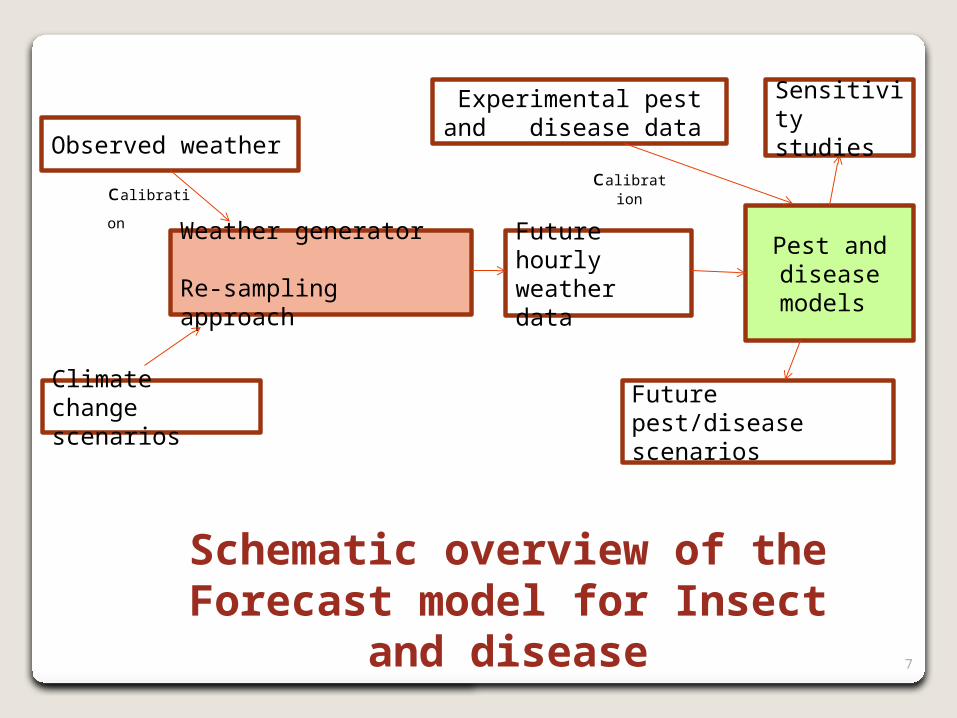
Observed weather
Weather generator
Re-sampling approach
Climate change scenarios
Future hourly weather data
Pest and disease models
Future pest/disease scenarios
Experimental pest and disease data
Sensitivity studies
Schematic overview of the Forecast model for Insect and disease
calibration calibratio
n
8
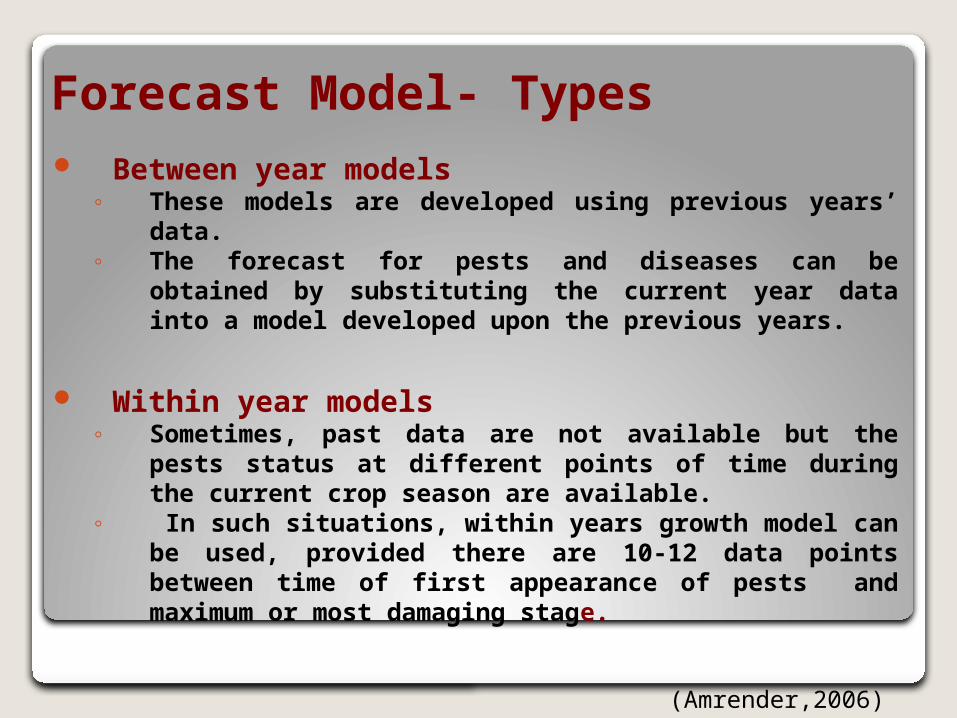
Forecast Model- Types Between year models
◦ These models are developed using previous years’ data. ◦ The forecast for pests and diseases can be obtained by
substituting the current year data into a model developed upon the previous years.
Within year models◦ Sometimes, past data are not available but the pests status at
different points of time during the current crop season are available.
◦ In such situations, within years growth model can be used, provided there are 10-12 data points between time of first appearance of pests and maximum or most damaging stage.
(Amrender,2006)
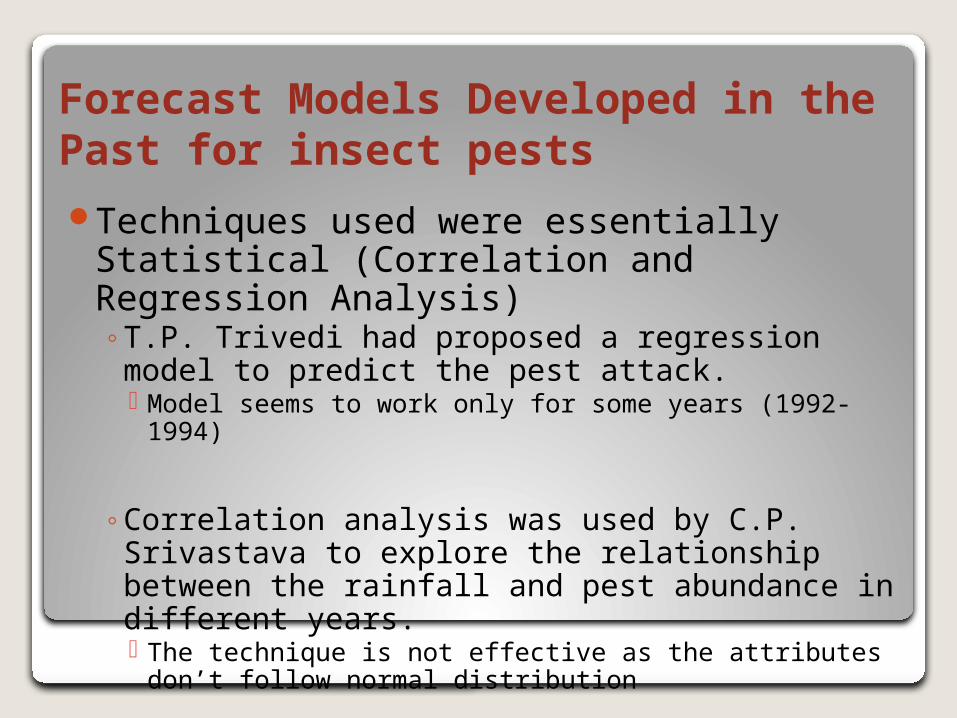
Forecast Models Developed in the Past for insect pests Techniques used were essentially Statistical
(Correlation and Regression Analysis)◦T.P. Trivedi had proposed a regression model to predict the
pest attack. Model seems to work only for some years (1992-1994)
◦Correlation analysis was used by C.P. Srivastava to explore the relationship between the rainfall and pest abundance in different years. The technique is not effective as the attributes don’t follow normal
distribution
11
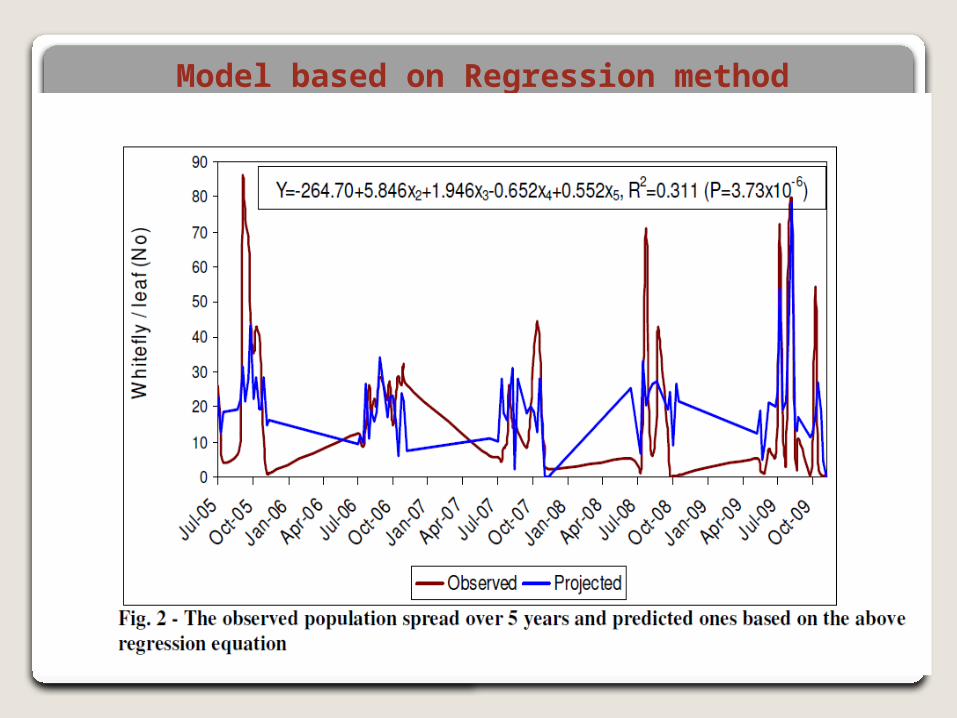
Model based on Regression method
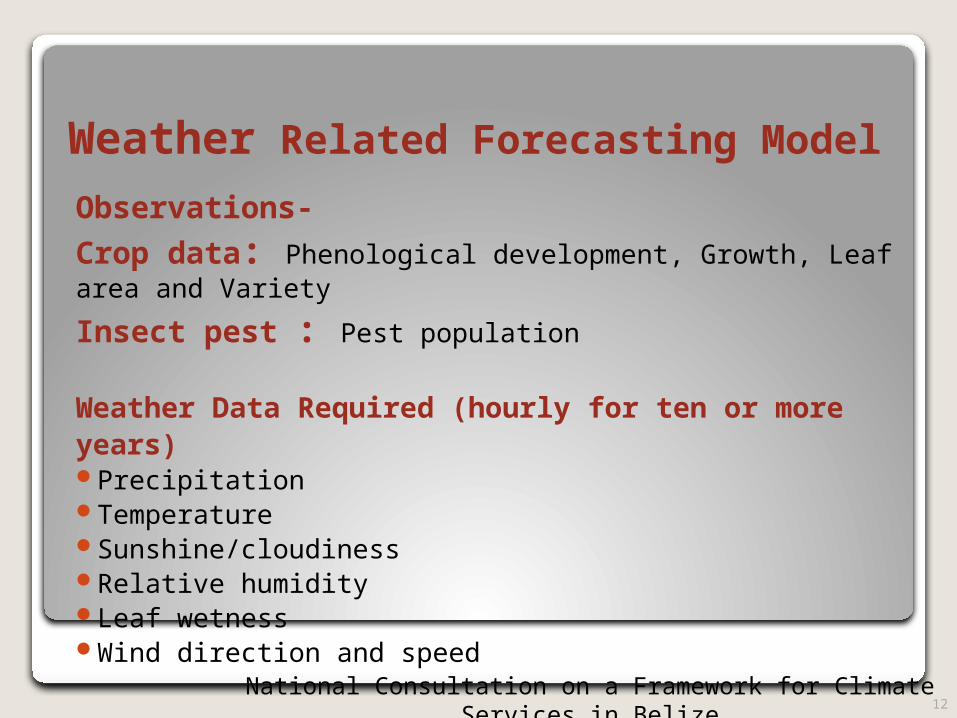
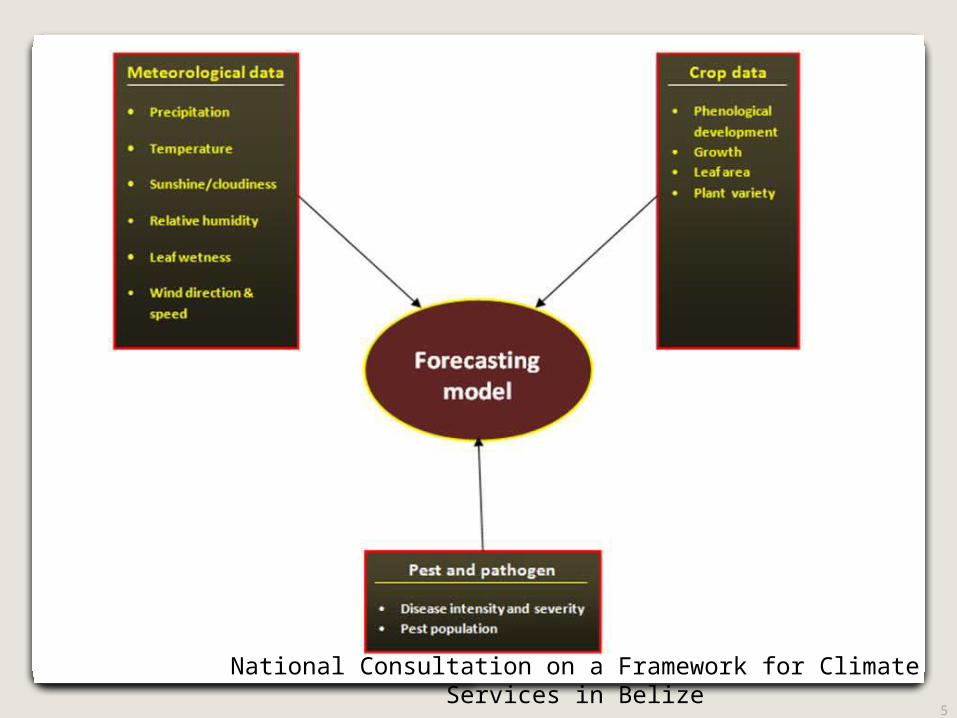
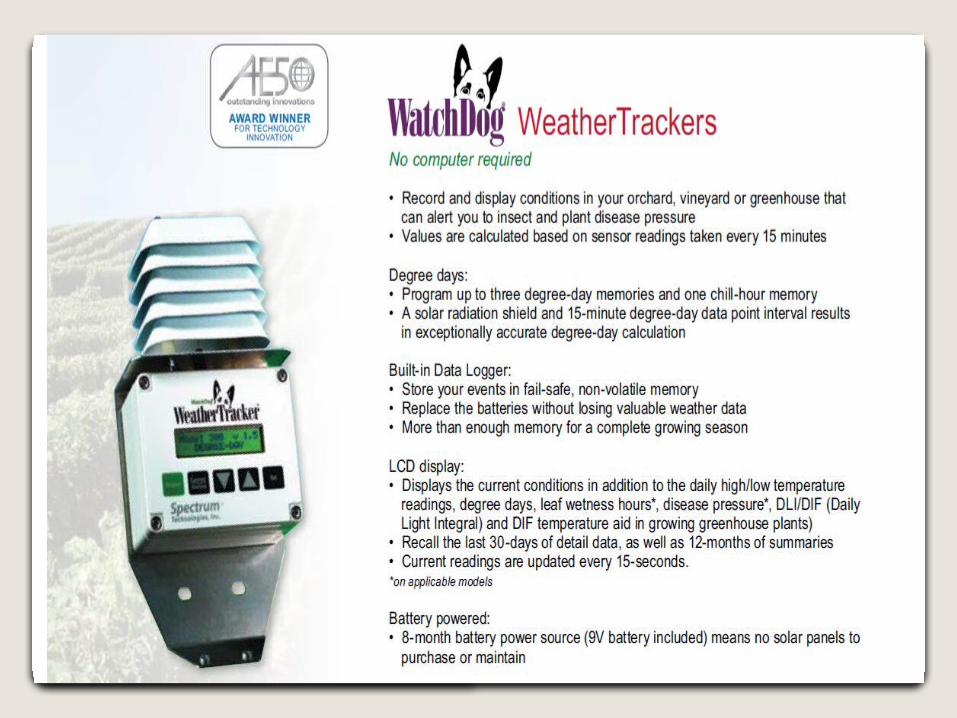
Weather Related Forecasting Model
Observations-
Crop data: Phenological development, Growth, Leaf area and Variety
Insect pest : Pest population
Weather Data Required (hourly for ten or more years)PrecipitationTemperatureSunshine/cloudinessRelative humidityLeaf wetnessWind direction and speed
12National Consultation on a Framework for Climate Services in Belize
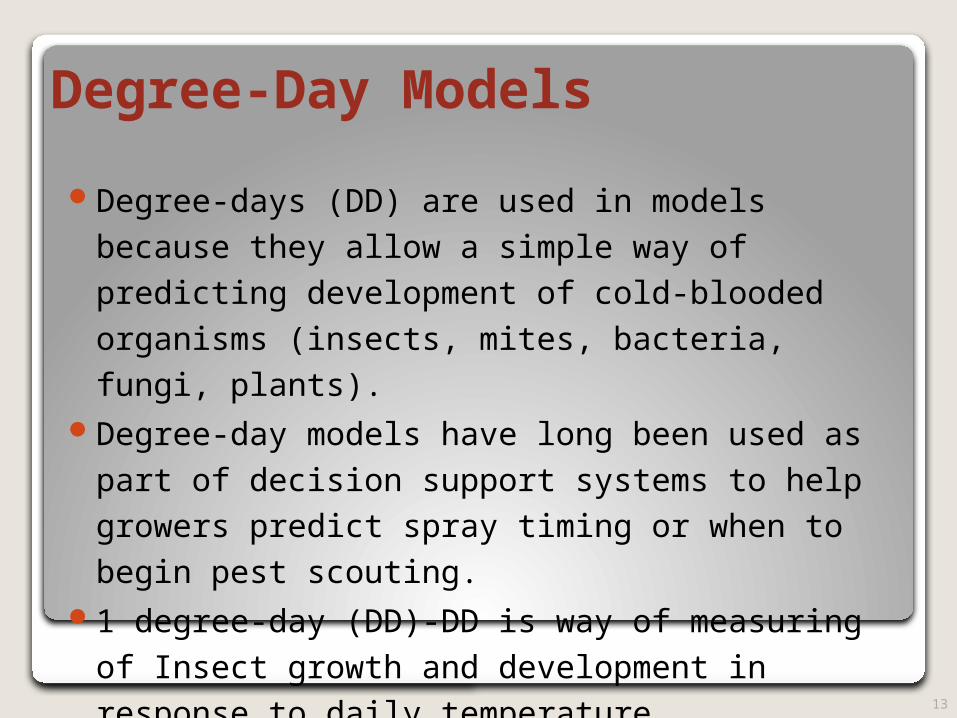
Degree-Day Models
Degree-days (DD) are used in models because they allow a
simple way of predicting development of cold-blooded
organisms (insects, mites, bacteria, fungi, plants). Degree-day models have long been used as part of decision
support systems to help growers predict spray timing or when
to begin pest scouting.1 degree-day (DD)-DD is way of measuring of Insect growth
and development in response to daily temperature
http://www.ipm.ucdavis.edu/MODELS
13
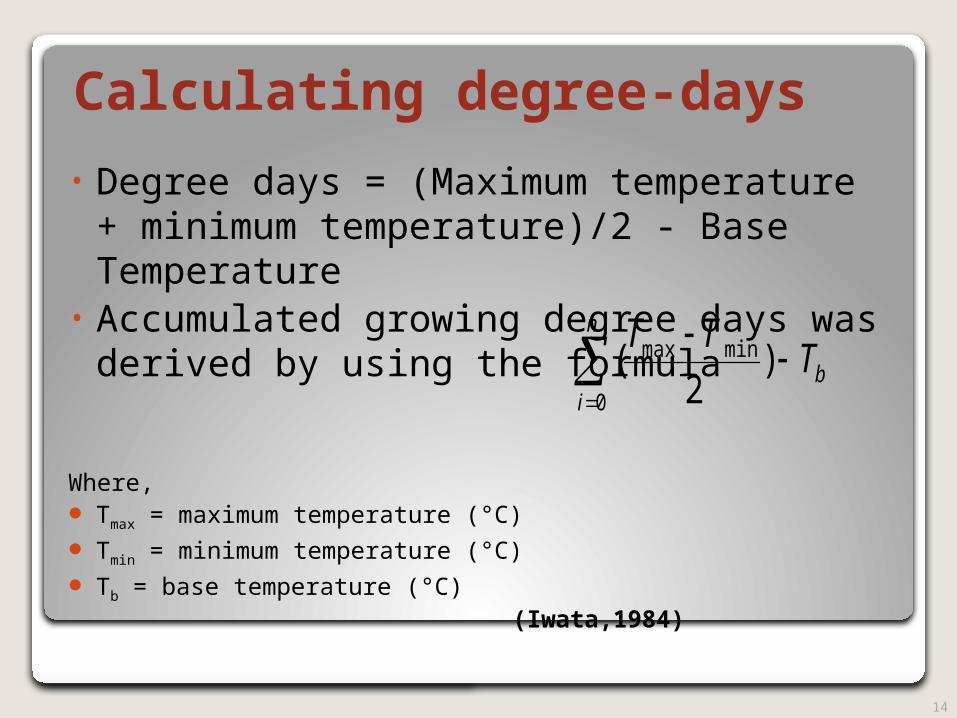
Calculating degree-days
• Degree days = (Maximum temperature + minimum temperature)/2 - Base Temperature
• Accumulated growing degree days was derived by using the formula
Where, Tmax = maximum temperature (°C) Tmin = minimum temperature (°C) Tb = base temperature (°C) (Iwata,1984)
14
n
ibT
TT
0
minmax )2
(
15
Phenology model
Deviation Model
Degree-Days Models types
Simulation model
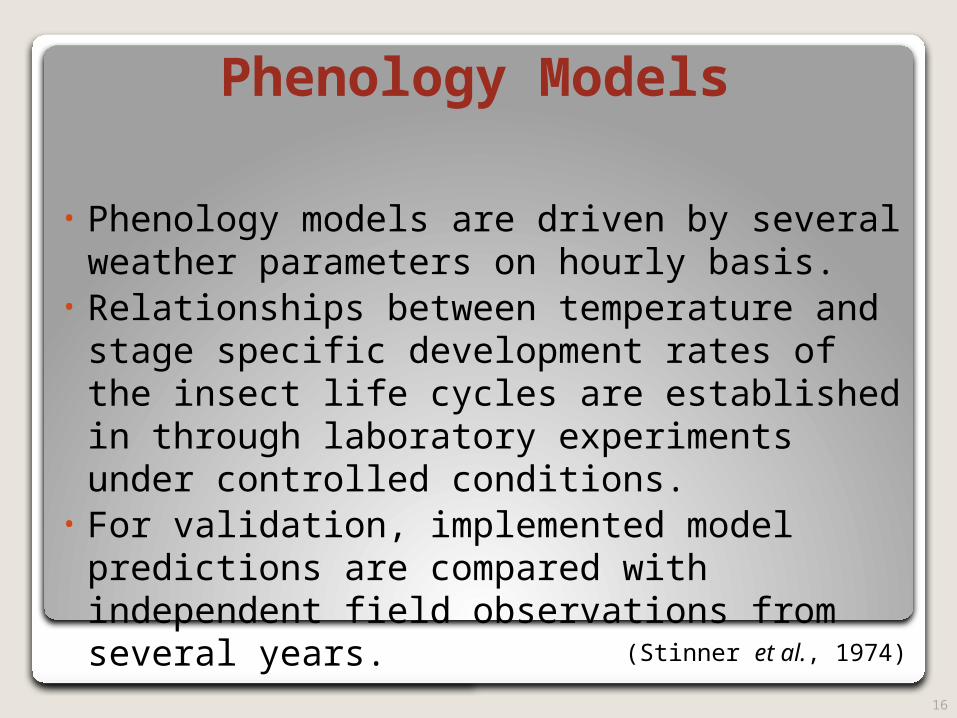
Phenology Models
• Phenology models are driven by several weather parameters on hourly basis.
• Relationships between temperature and stage specific development rates of the insect life cycles are established in through laboratory experiments under controlled conditions.
• For validation, implemented model predictions are compared with independent field observations from several years.
16
(Stinner et al., 1974)
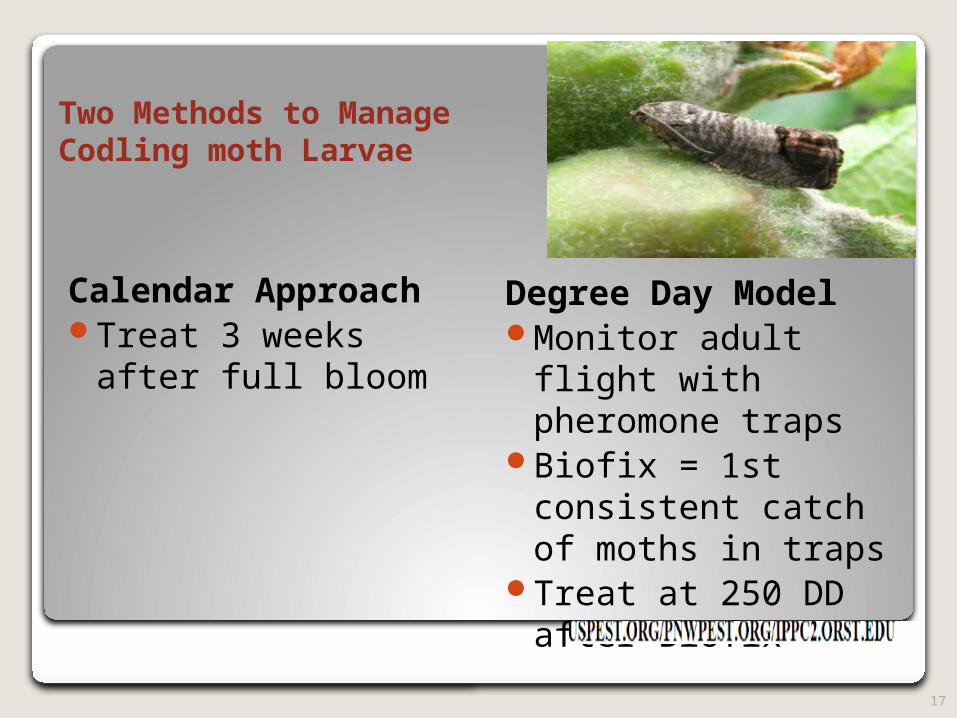
Two Methods to Manage Codling moth Larvae
Calendar Approach Treat 3 weeks after full
bloom
Degree Day Model Monitor adult flight with
pheromone traps Biofix = 1st consistent
catch of moths in traps Treat at 250 DD after
Biofix
17
18
19
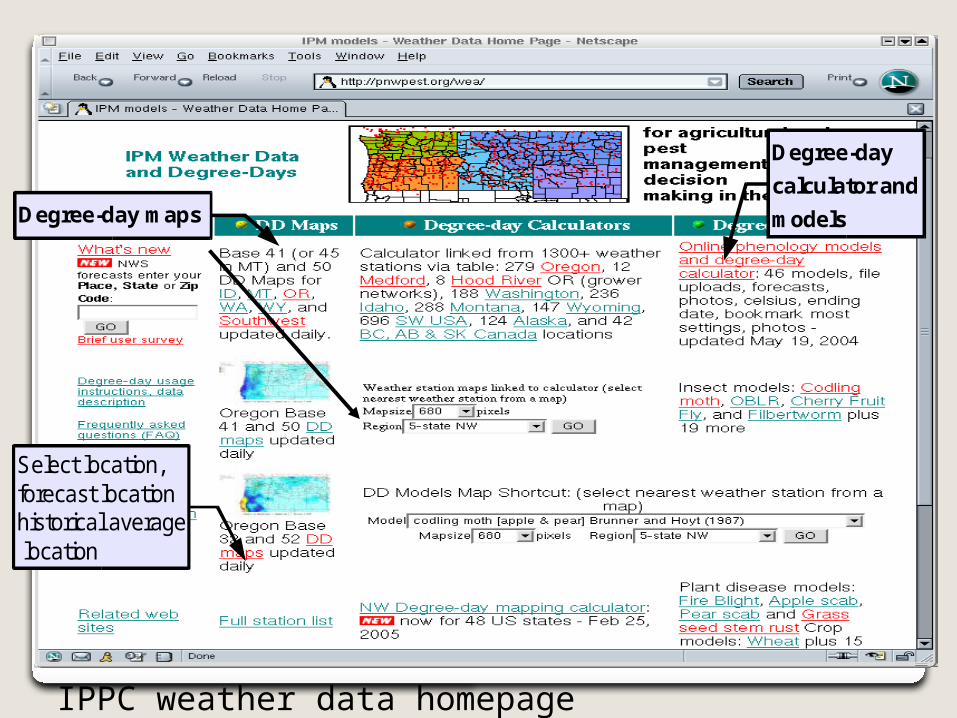
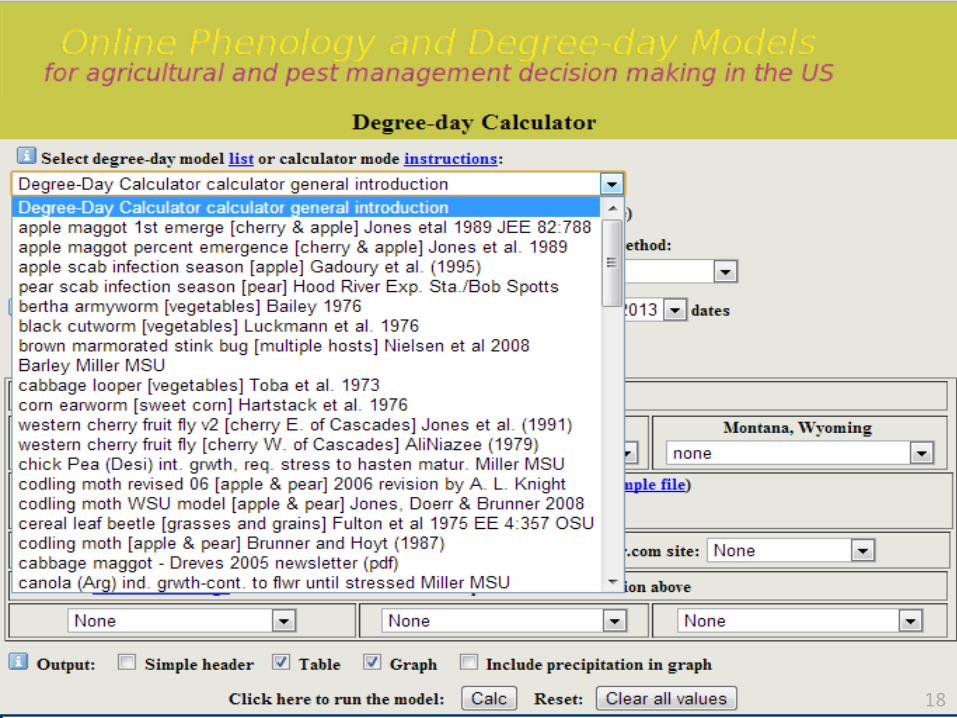
Degree-day maps
Degree-day
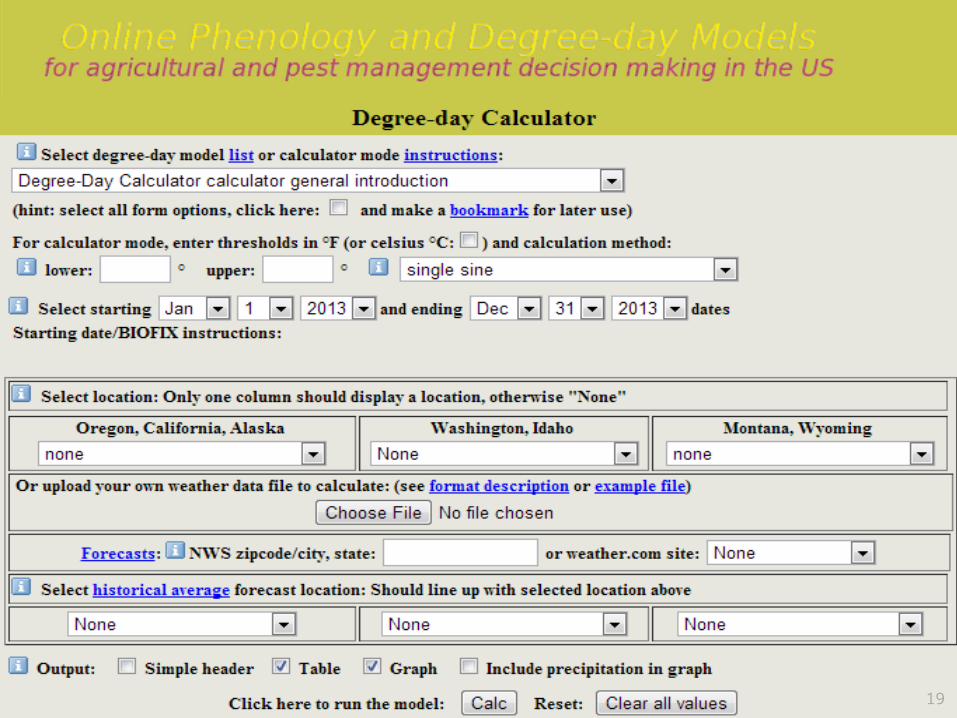
calculator and
models
IPPC weather data homepage (http://pnwpest.org/wea)
Select location,forecast locationhistorical average location
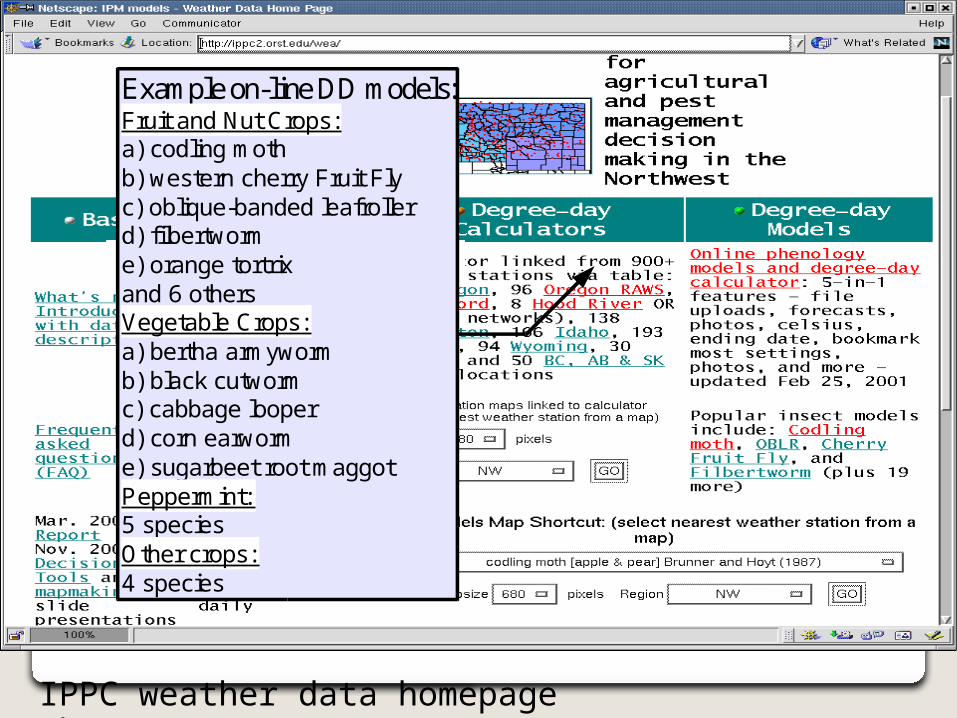
Example on-line DD models:Fruit and Nut Crops:a) codling mothb) western cherry Fruit Flyc) oblique-banded leafrollerd) filbertworme) orange tortrixand 6 othersVegetable Crops:a) bertha armywormb) black cutwormc) cabbage looperd) corn earworme) sugarbeet root maggotPeppermint:5 speciesOther crops:4 species
IPPC weather data homepage (http://pnwpest.org/wea)
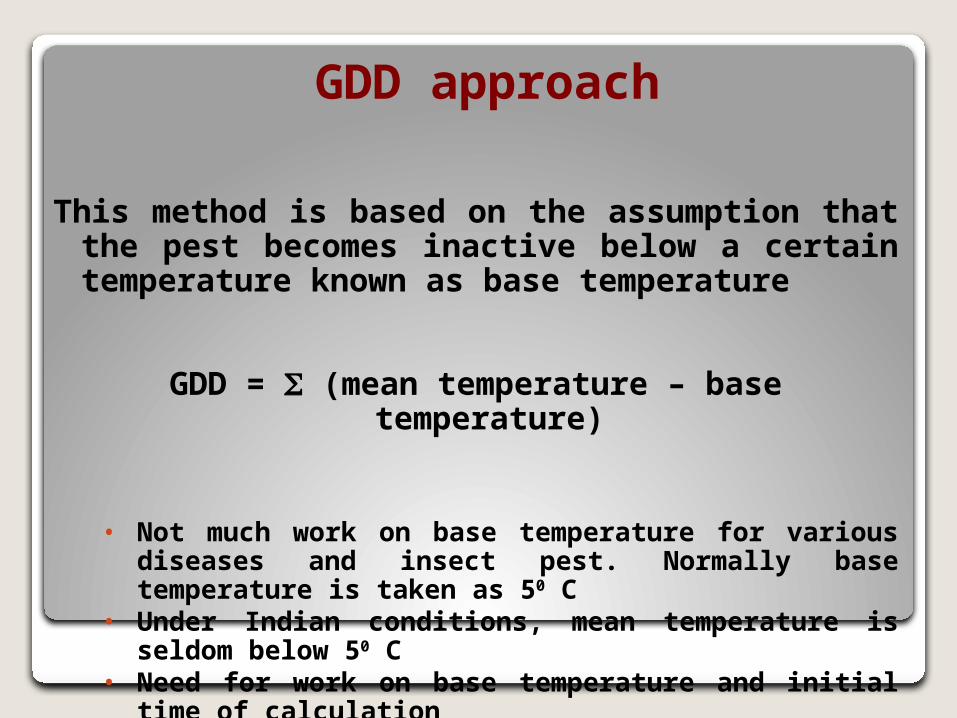
GDD approach
This method is based on the assumption that the pest becomes inactive below a certain temperature known as base temperature
GDD = (mean temperature – base temperature)
• Not much work on base temperature for various diseases and insect pest. Normally base temperature is taken as 50 C
• Under Indian conditions, mean temperature is seldom below 50 C• Need for work on base temperature and initial time of calculation
23
24
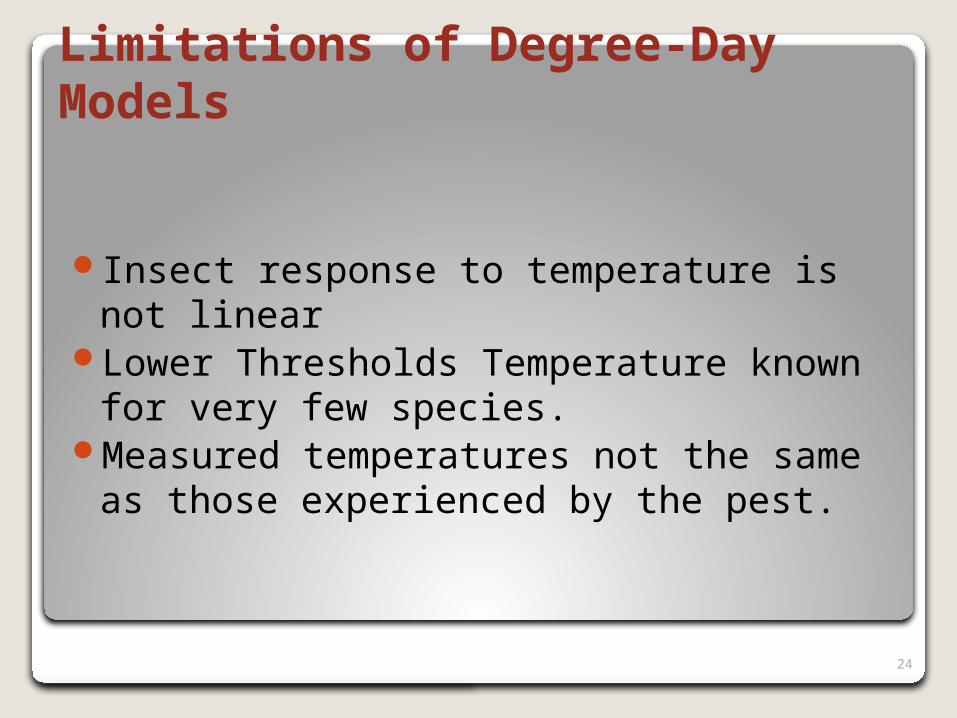
Limitations of Degree-Day Models
Insect response to temperature is not linear Lower Thresholds Temperature known for very few
species. Measured temperatures not the same as those
experienced by the pest.
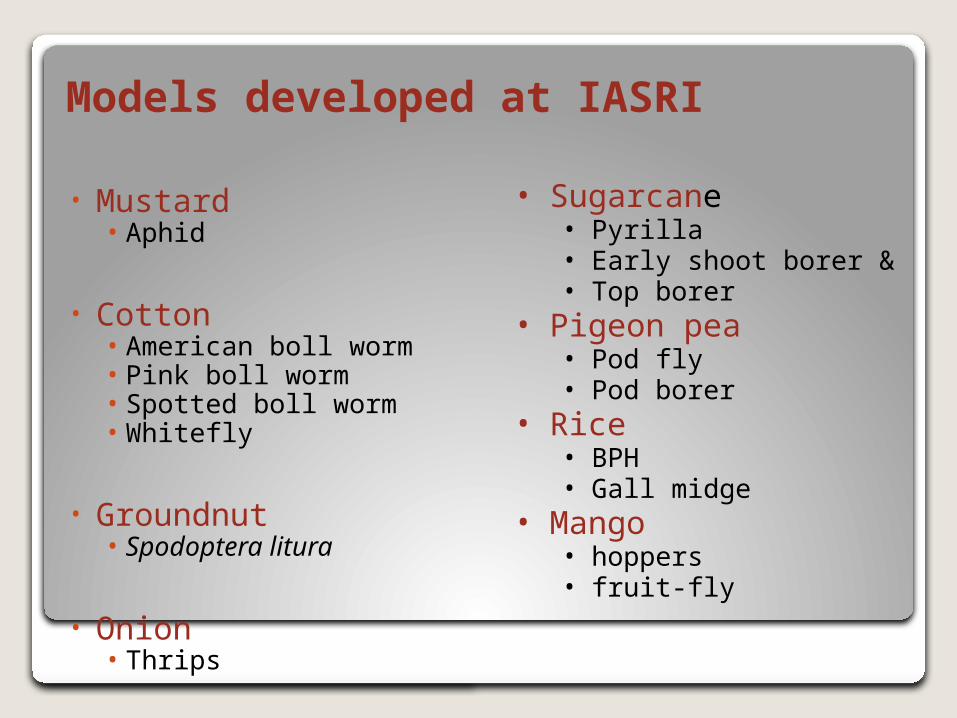
Models developed at IASRI
• Mustard• Aphid
• Cotton• American boll worm• Pink boll worm• Spotted boll worm • Whitefly
• Groundnut• Spodoptera litura
• Onion • Thrips
• Sugarcane• Pyrilla• Early shoot borer & • Top borer
• Pigeon pea• Pod fly• Pod borer
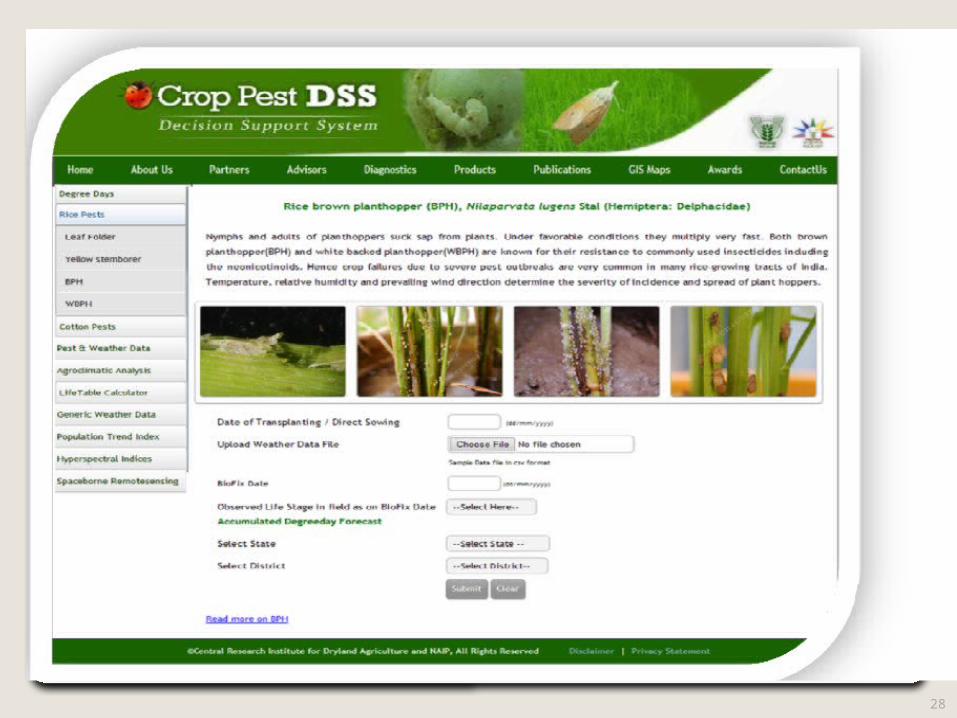
• Rice• BPH• Gall midge
• Mango• hoppers• fruit-fly
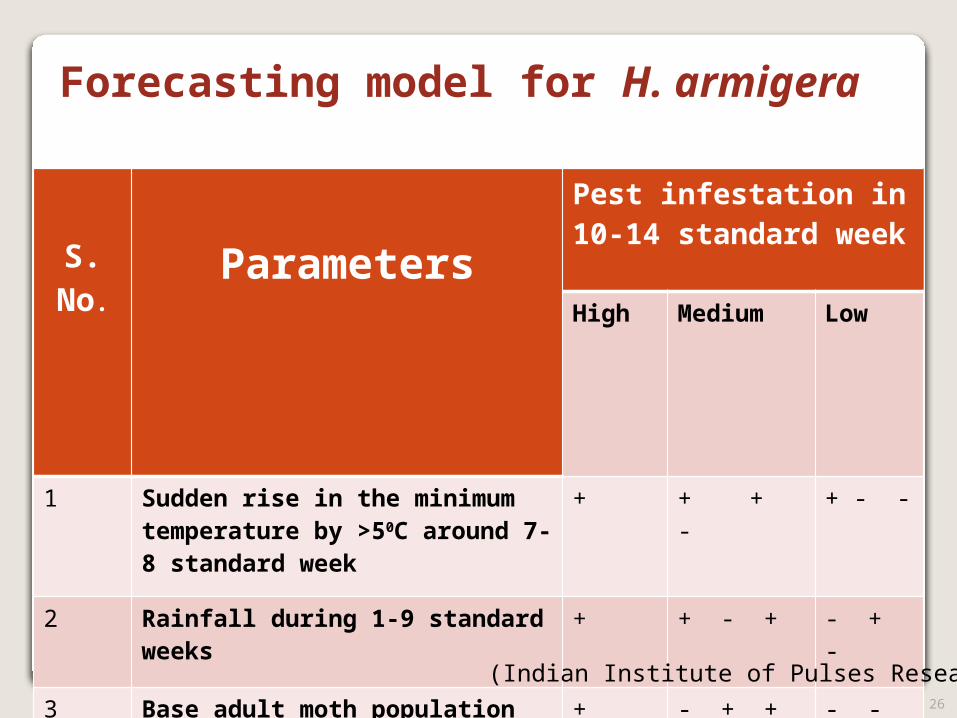
S. No.
Parameters
Pest infestation in 10-14 standard week
High Medium Low
1 Sudden rise in the minimum temperature by >50C around 7-8 standard week
+ + + - + - -
2 Rainfall during 1-9 standard weeks
+ + - + - + -
3 Base adult moth population >15 per week during 5-7 standard week
+ - + + - - +26
Forecasting model for H. armigera
(Indian Institute of Pulses Research)
27
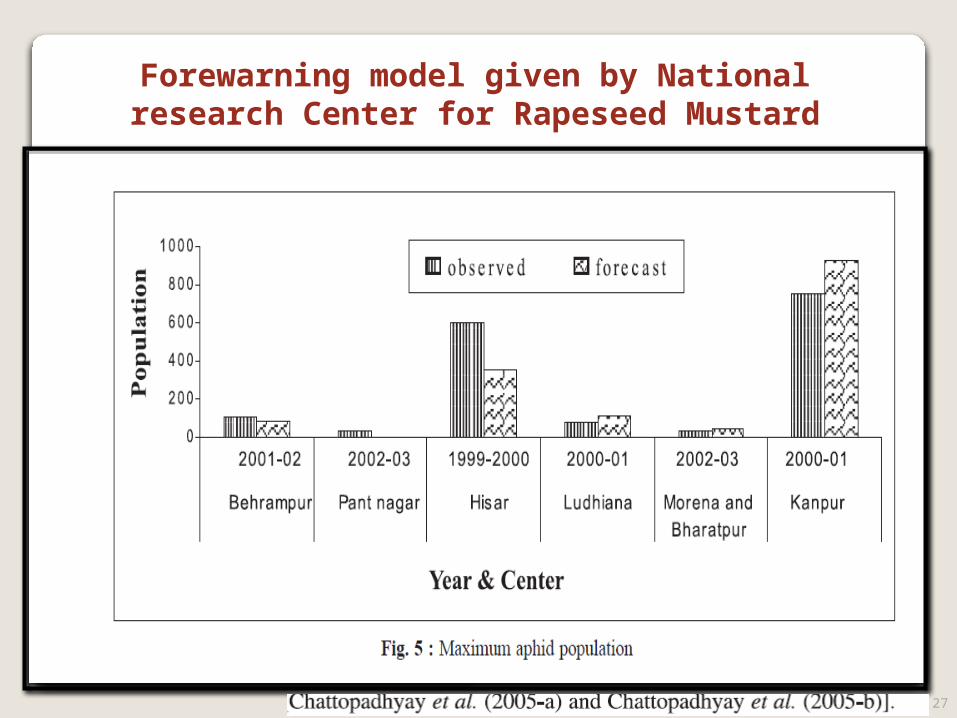
Forewarning model given by National research Center for Rapeseed Mustard
28
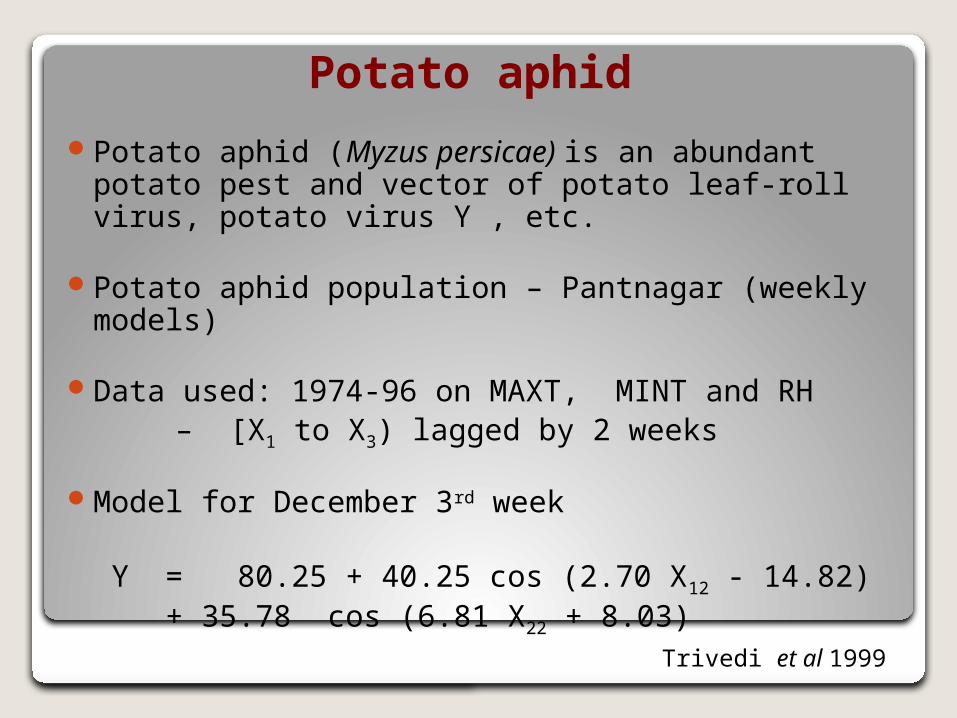
Potato aphid
Potato aphid (Myzus persicae) is an abundant potato pest and vector of potato leaf-roll virus, potato virus Y , etc.
Potato aphid population – Pantnagar (weekly models)
Data used: 1974-96 on MAXT, MINT and RH – [X1 to X3) lagged by 2 weeks
Model for December 3rd week
Y = 80.25 + 40.25 cos (2.70 X12 - 14.82) + 35.78 cos (6.81 X22 + 8.03)
Trivedi et al 1999
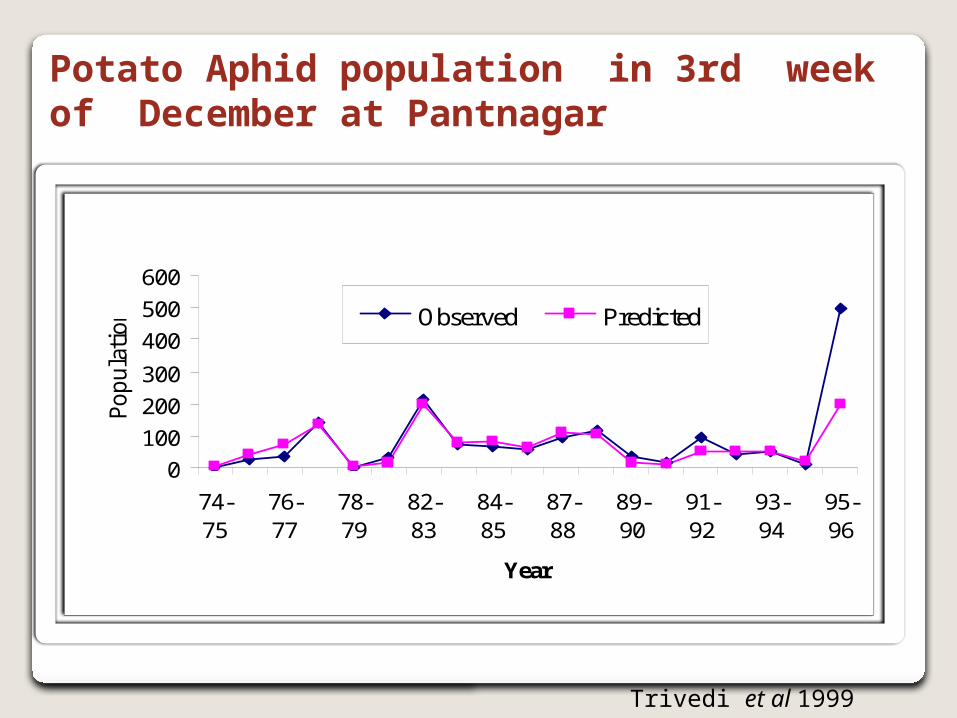
0
100
200
300
400
500
600
74-75
76-77
78-79
82-83
84-85
87-88
89-90
91-92
93-94
95-96
Year
Po
pu
lati
on Observed Predicted
Potato Aphid population in 3rd week of December at Pantnagar
Trivedi et al 1999
31
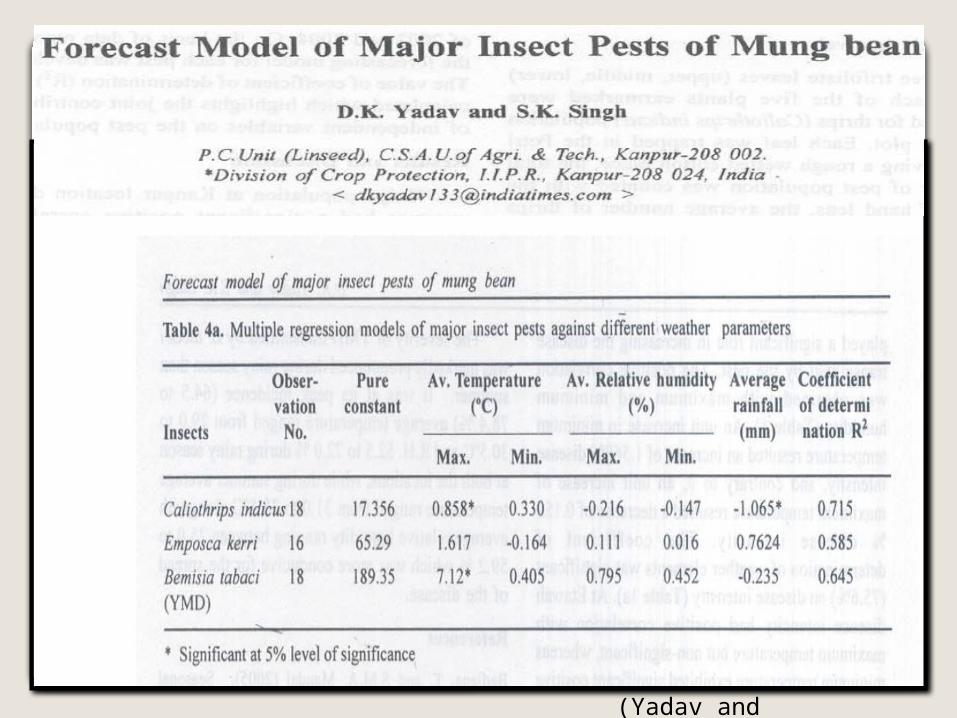
(Yadav and singh,2015)
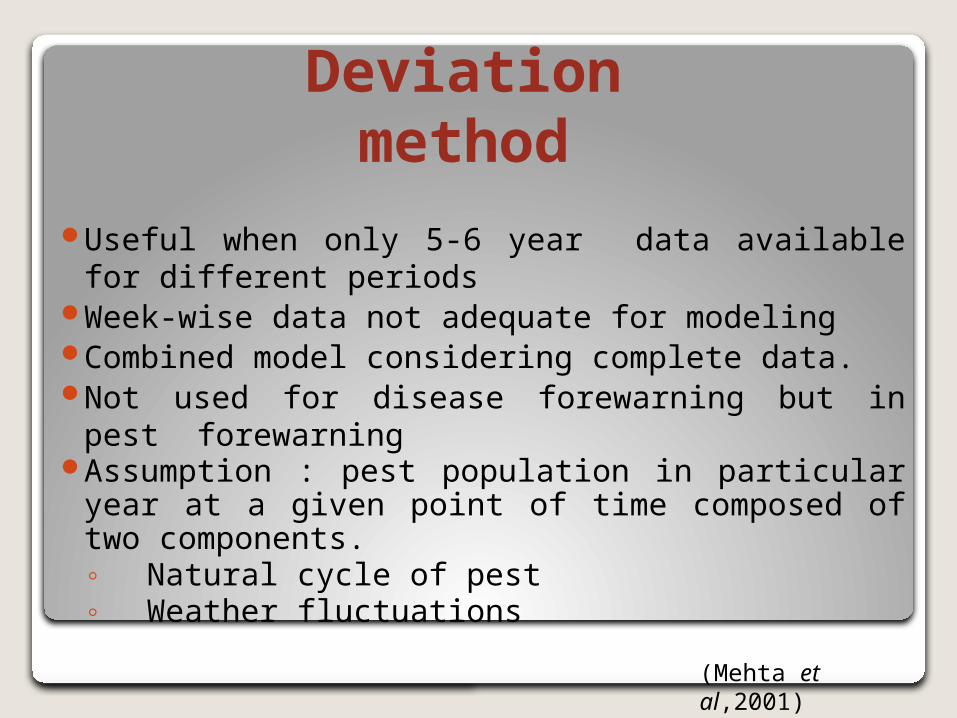
Useful when only 5-6 year data available for different periods
Week-wise data not adequate for modelingCombined model considering complete data.Not used for disease forewarning but in pest forewarningAssumption : pest population in particular year at a given
point of time composed of two components.◦ Natural cycle of pest◦ Weather fluctuations
Deviation method
(Mehta et al,2001)
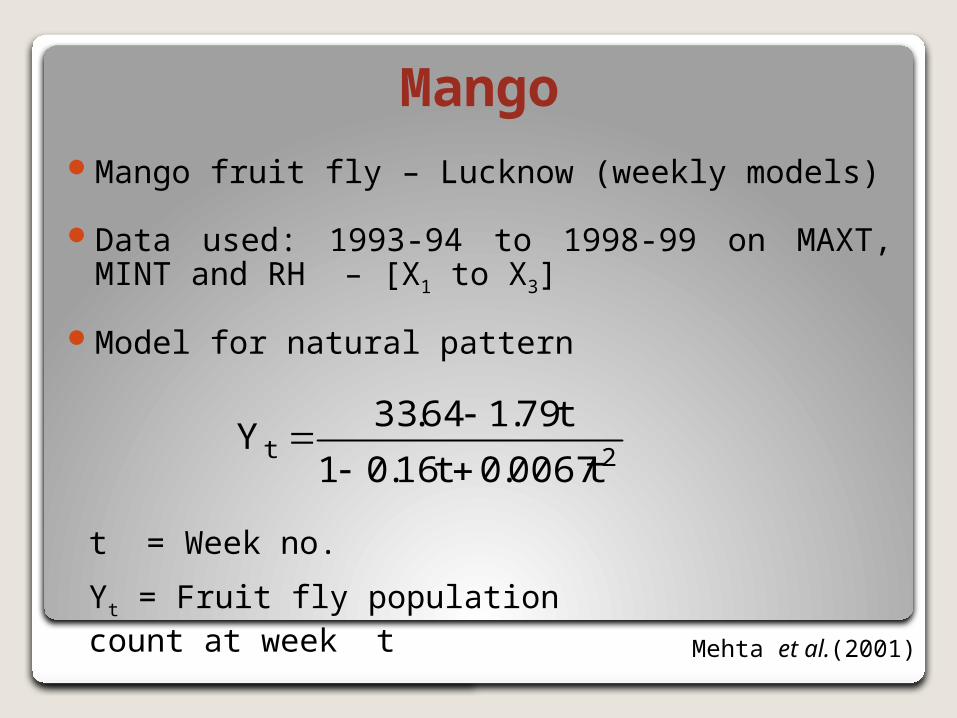
MangoMango fruit fly – Lucknow (weekly models)
Data used: 1993-94 to 1998-99 on MAXT, MINT and RH – [X1 to X3]
Model for natural pattern
2tt0067.0t16.01
t79.164.33Y
t = Week no.
Yt = Fruit fly population count at week t
Mehta et al.(2001)
0
50
100
150
200
250
300
April
I
II
III
IV
May
I
II
III
IV
June
I
II
III
IV
July
I
II
III
IV
Augus
t I
II
III
IV
Week
Pop
ulat
ion
Observed Expected
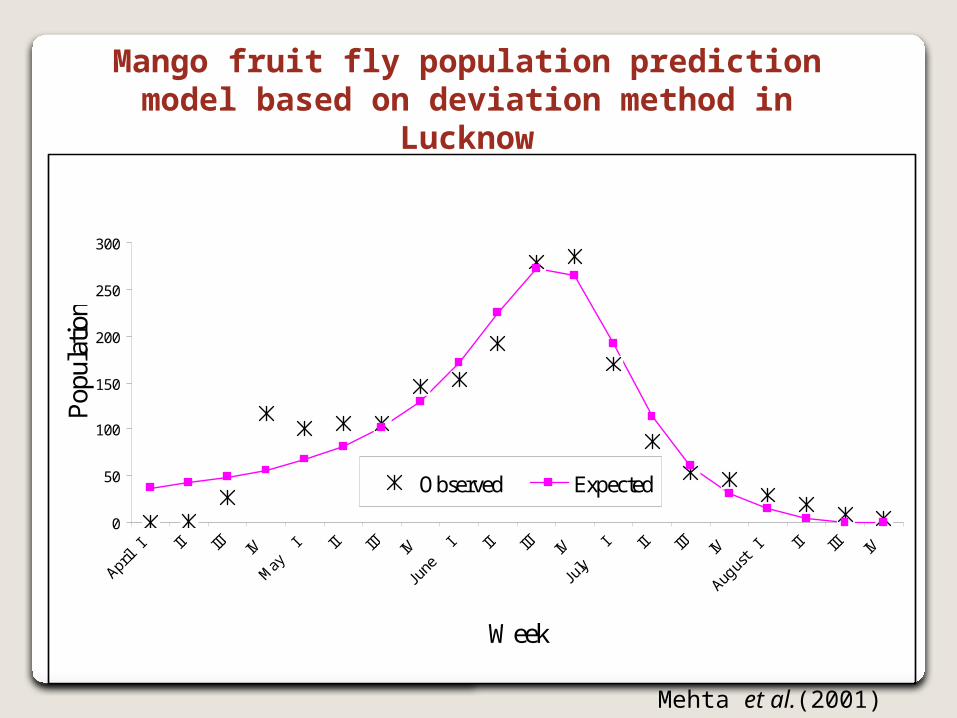
Mango fruit fly population prediction model based on deviation method in Lucknow
Mehta et al.(2001)
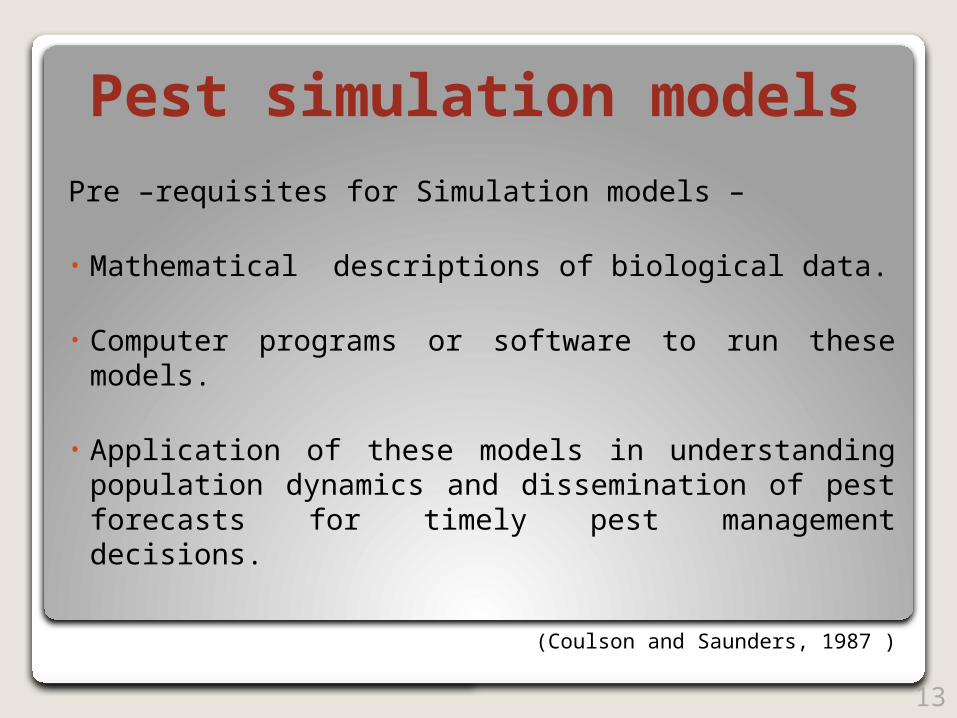
Pest simulation models
Pre –requisites for Simulation models –
• Mathematical descriptions of biological data.
• Computer programs or software to run these models.
• Application of these models in understanding population dynamics and dissemination of pest forecasts for timely pest management decisions.
(Coulson and Saunders, 1987 )13
EPIPRE
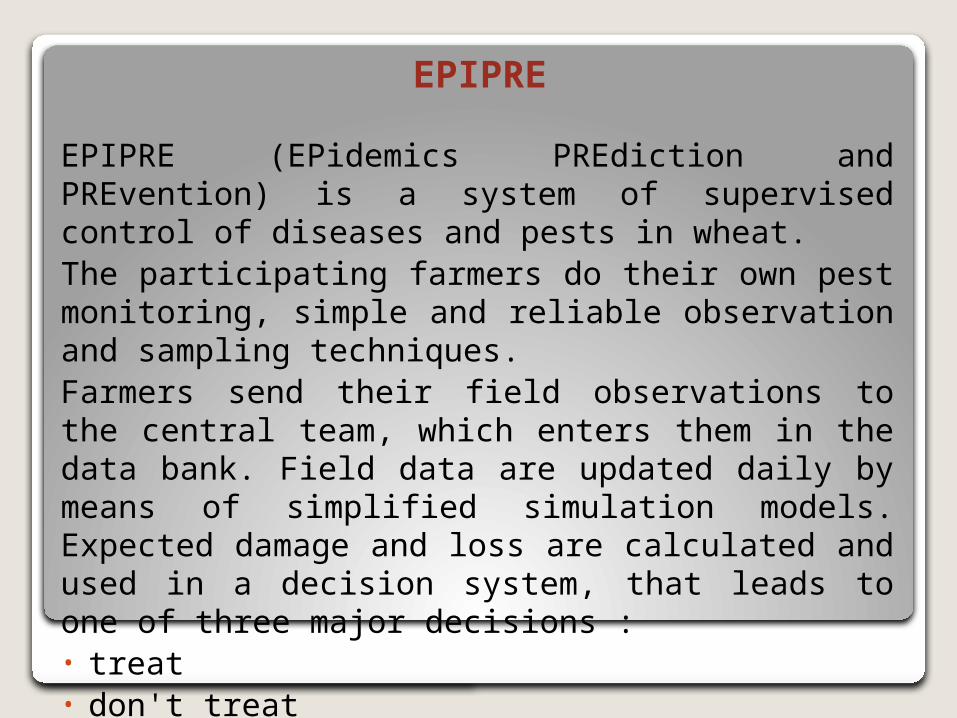
EPIPRE (EPidemics PREdiction and PREvention) is a system of supervised control of diseases and pests in wheat.The participating farmers do their own pest monitoring, simple and reliable observation and sampling techniques.Farmers send their field observations to the central team, which enters them in the data bank. Field data are updated daily by means of simplified simulation models. Expected damage and loss are calculated and used in a decision system, that leads to one of three major decisions :• treat • don't treat • make another field observationEx-Rhopalosiphum padi
37
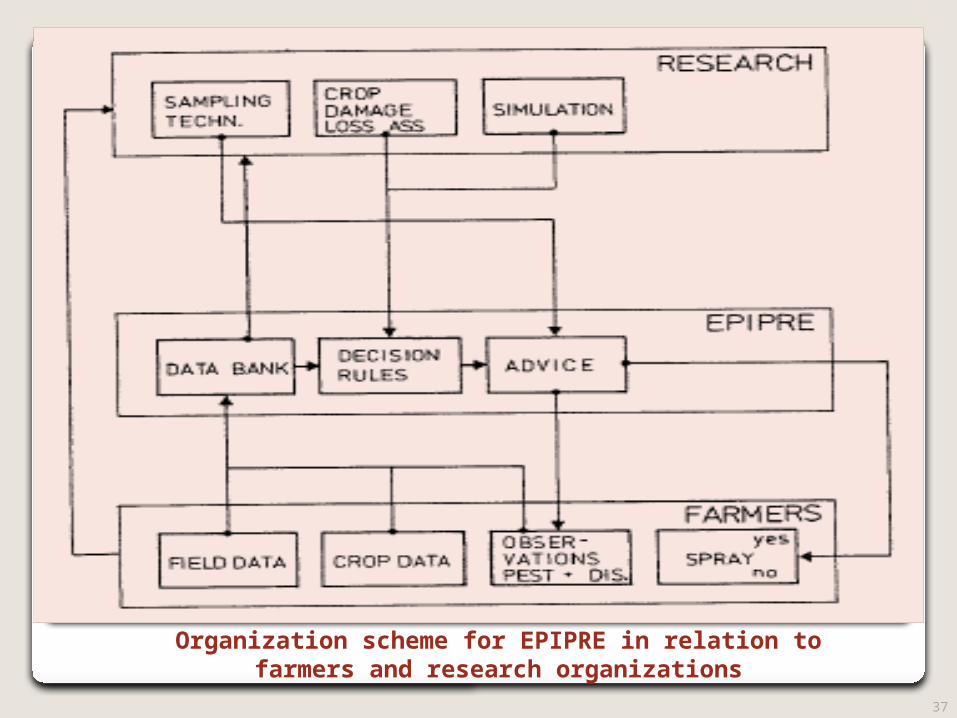
Organization scheme for EPIPRE in relation to farmers and research organizations
38
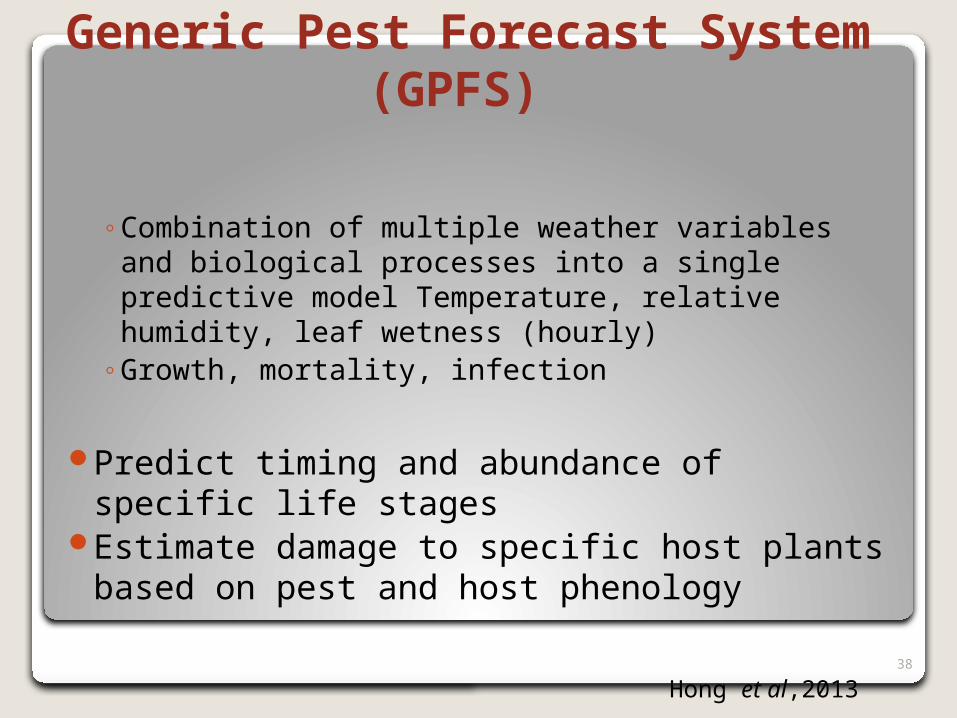
Generic Pest Forecast System (GPFS)
◦Combination of multiple weather variables and biological processes into a single predictive model Temperature, relative humidity, leaf wetness (hourly)
◦Growth, mortality, infection
Predict timing and abundance of specific life stages Estimate damage to specific host plants based on pest
and host phenology
Hong et al,2013
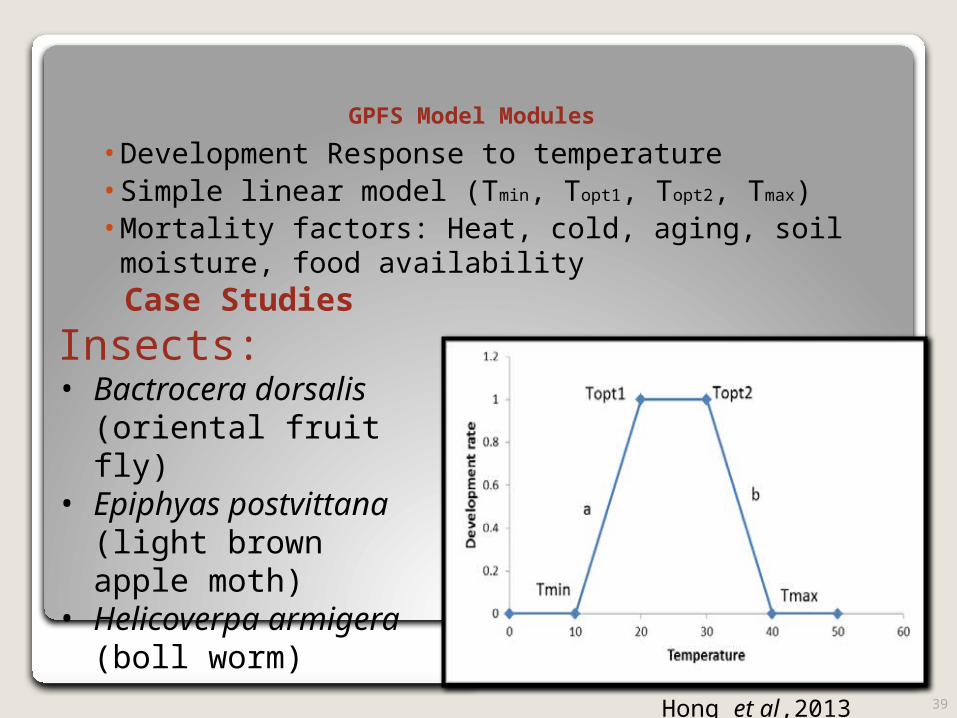
GPFS Model Modules
• Development Response to temperature • Simple linear model (Tmin, Topt1, Topt2, Tmax) • Mortality factors: Heat, cold, aging, soil moisture,
food availability
39
Case Studies
Insects: • Bactrocera dorsalis
(oriental fruit fly) • Epiphyas postvittana
(light brown apple moth) • Helicoverpa armigera
(boll worm)
Hong et al,2013
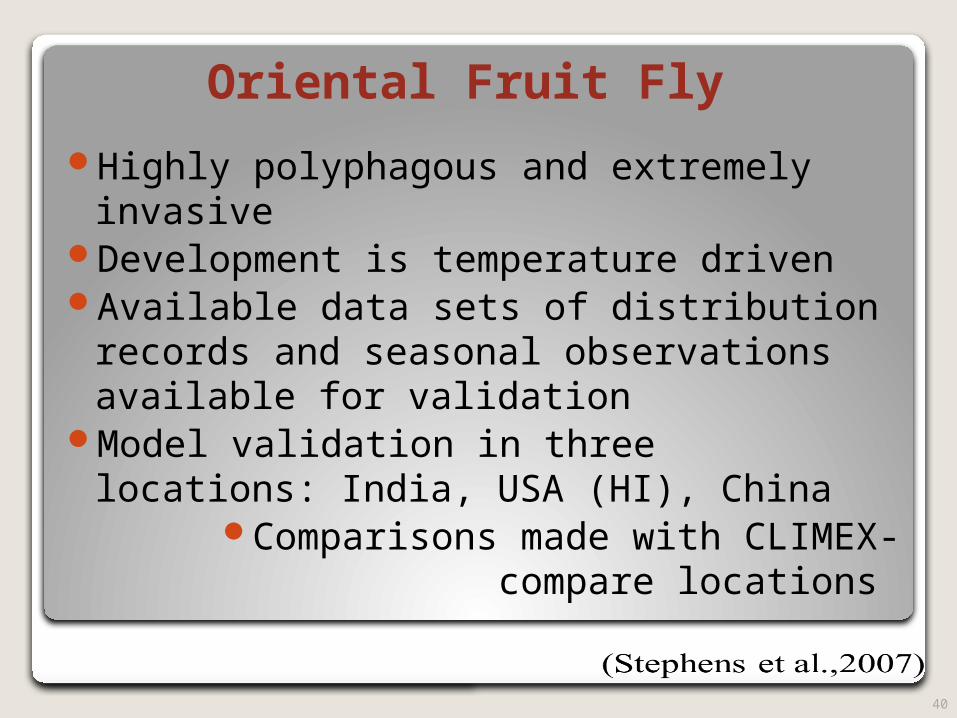
Oriental Fruit Fly
Highly polyphagous and extremely invasive Development is temperature driven Available data sets of distribution records and
seasonal observations available for validation Model validation in three locations: India, USA (HI),
China Comparisons made with CLIMEX-compare locations
40
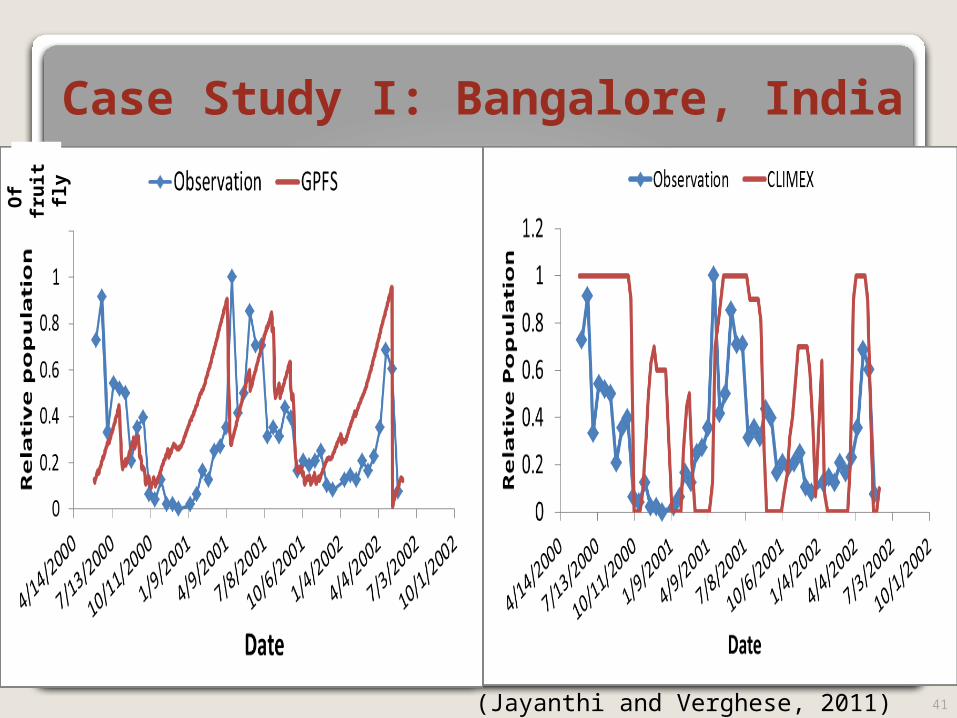
Case Study I: Bangalore, India
41(Jayanthi and Verghese, 2011)
Of
fru
it
fly
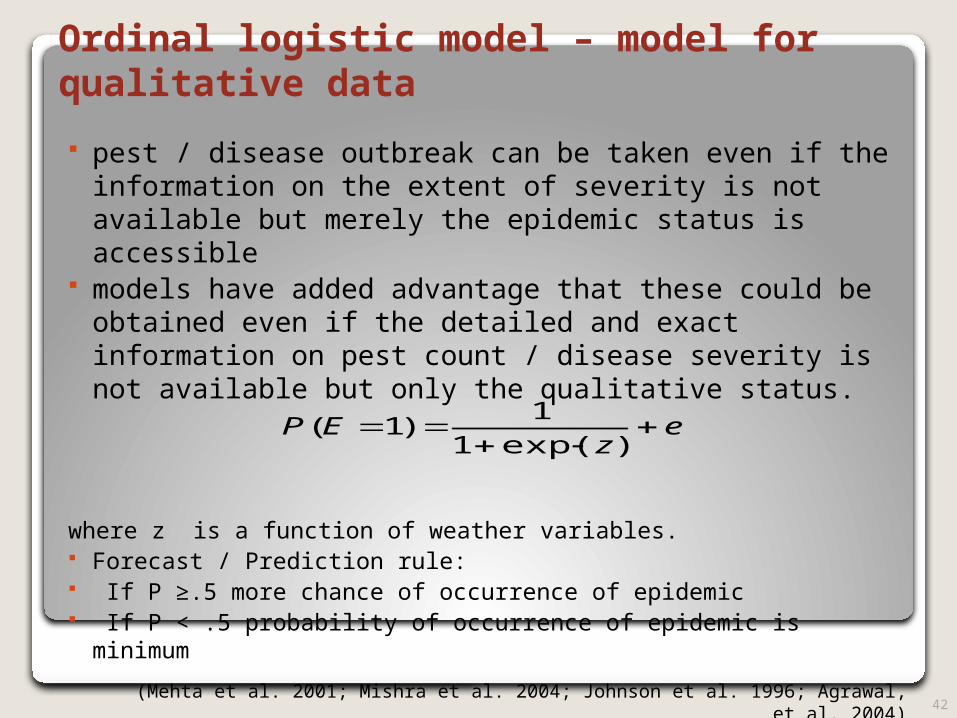
Ordinal logistic model – model for qualitative data
pest / disease outbreak can be taken even if the information on the extent of severity is not available but merely the epidemic status is accessible
models have added advantage that these could be obtained even if the detailed and exact information on pest count / disease severity is not available but only the qualitative status.
where z is a function of weather variables. Forecast / Prediction rule: If P ≥.5 more chance of occurrence of epidemic If P < .5 probability of occurrence of epidemic is minimum
42(Mehta et al. 2001; Mishra et al. 2004; Johnson et al. 1996; Agrawal, et al. 2004)
ez
EP
)exp(1
1)1(
43
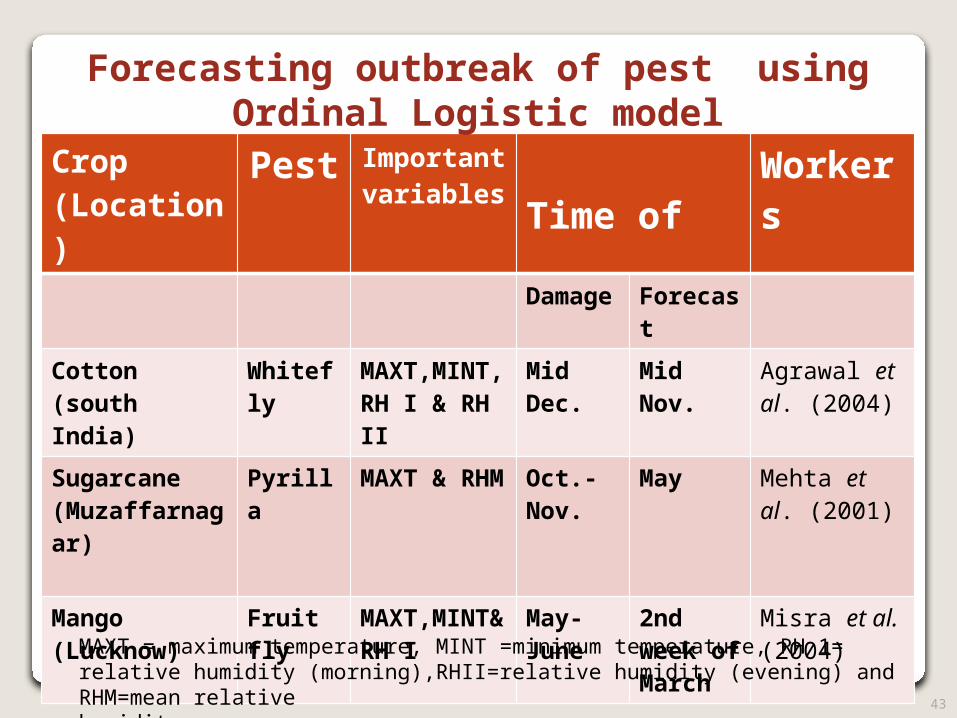
Crop (Location)
Pest Important variables
Time of Workers
Damage Forecast
Cotton(south India)
Whitefly MAXT,MINT,RH I & RH II
Mid Dec. Mid Nov. Agrawal et al. (2004)
Sugarcane (Muzaffarnagar)
Pyrilla MAXT & RHM
Oct.-Nov.
May Mehta et al. (2001)
Mango (Lucknow)
Fruit fly MAXT,MINT& RH I
May-June
2nd week of March
Misra et al. (2004)
Forecasting outbreak of pest using Ordinal Logistic model
MAXT = maximum temperature, MINT =minimum temperature, RH 1= relative humidity (morning),RHII=relative humidity (evening) and RHM=mean relativehumidity
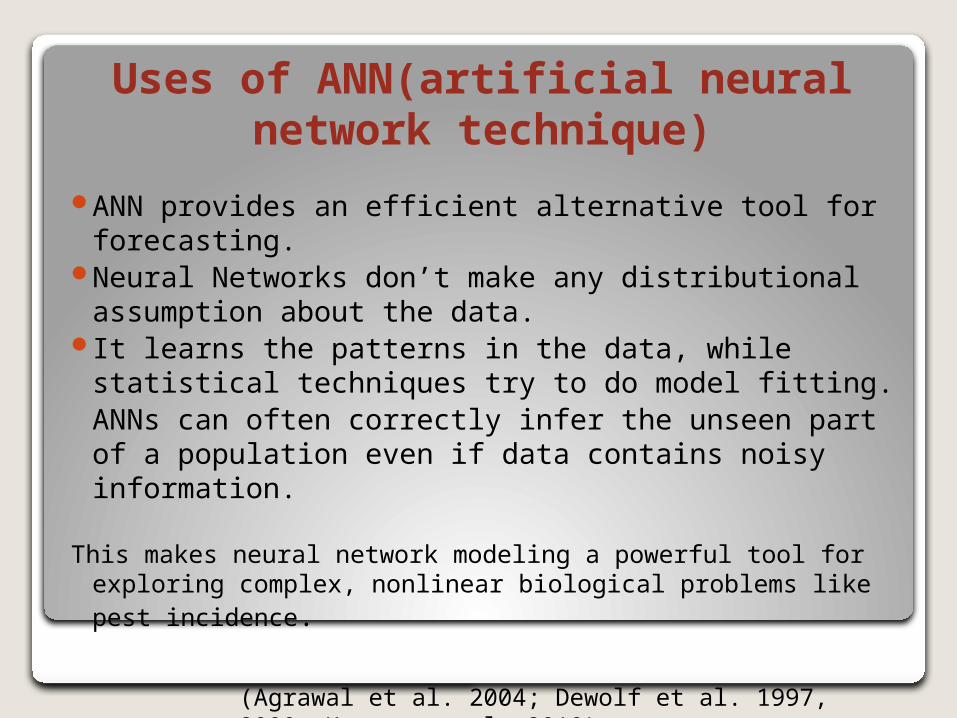
ANN provides an efficient alternative tool for forecasting.
Neural Networks don’t make any distributional assumption about the data.
It learns the patterns in the data, while statistical techniques try to do model fitting.ANNs can often correctly infer the unseen part of a population even if data contains noisy information.
This makes neural network modeling a powerful tool for exploring complex, nonlinear biological problems like pest incidence.
Uses of ANN(artificial neural network technique)
(Agrawal et al. 2004; Dewolf et al. 1997, 2000; Kumar, et al. 2010)
45(Wu et al., 2008)
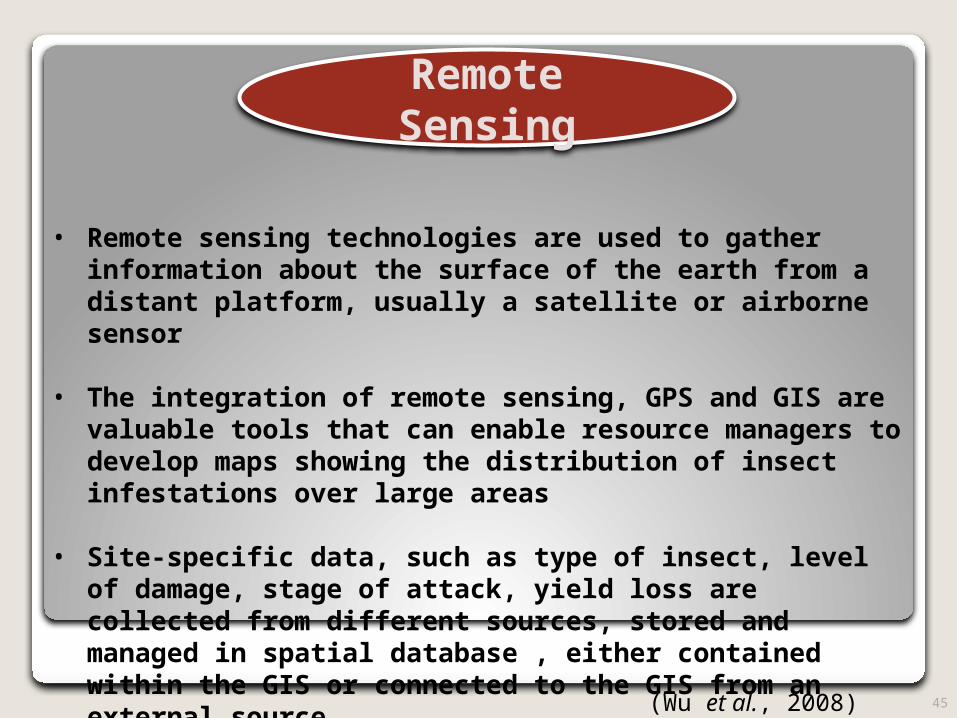
Remote Sensing
• Remote sensing technologies are used to gather information about the surface of the earth from a distant platform, usually a satellite or airborne sensor
• The integration of remote sensing, GPS and GIS are valuable tools that can enable resource managers to develop maps showing the distribution of insect infestations over large areas
• Site-specific data, such as type of insect, level of damage, stage of attack, yield loss are collected from different sources, stored and managed in spatial database , either contained within the GIS or connected to the GIS from an external source.
46
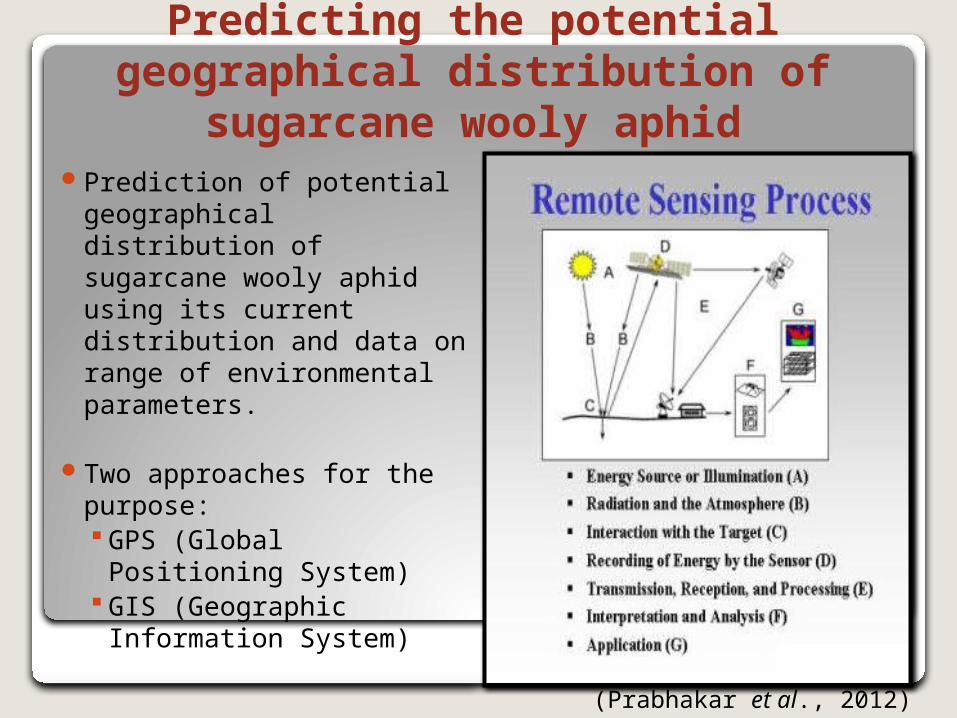
Predicting the potential geographical distribution of sugarcane wooly aphid
Prediction of potential geographical distribution of sugarcane wooly aphid using its current distribution and data on range of environmental parameters.
Two approaches for the purpose: GPS (Global Positioning
System) GIS (Geographic
Information System)(Prabhakar et al., 2012)
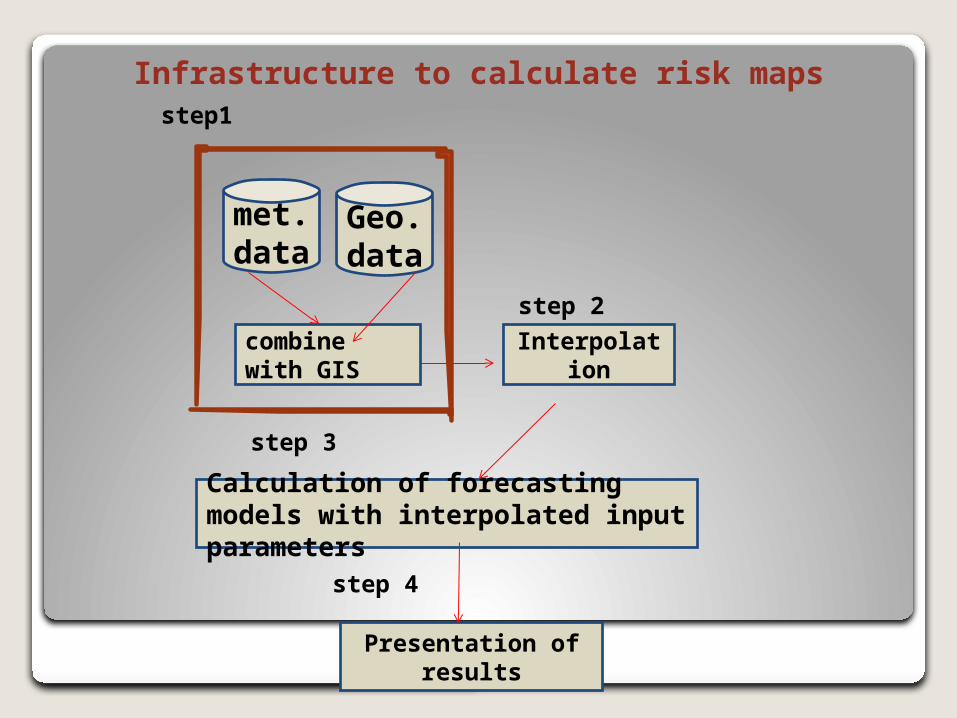
Infrastructure to calculate risk maps
met.data
Geo.data
combine with GIS
Interpolation
Calculation of forecasting models with interpolated input parameters
Presentation of results
step1
step 2
step 3
step 4
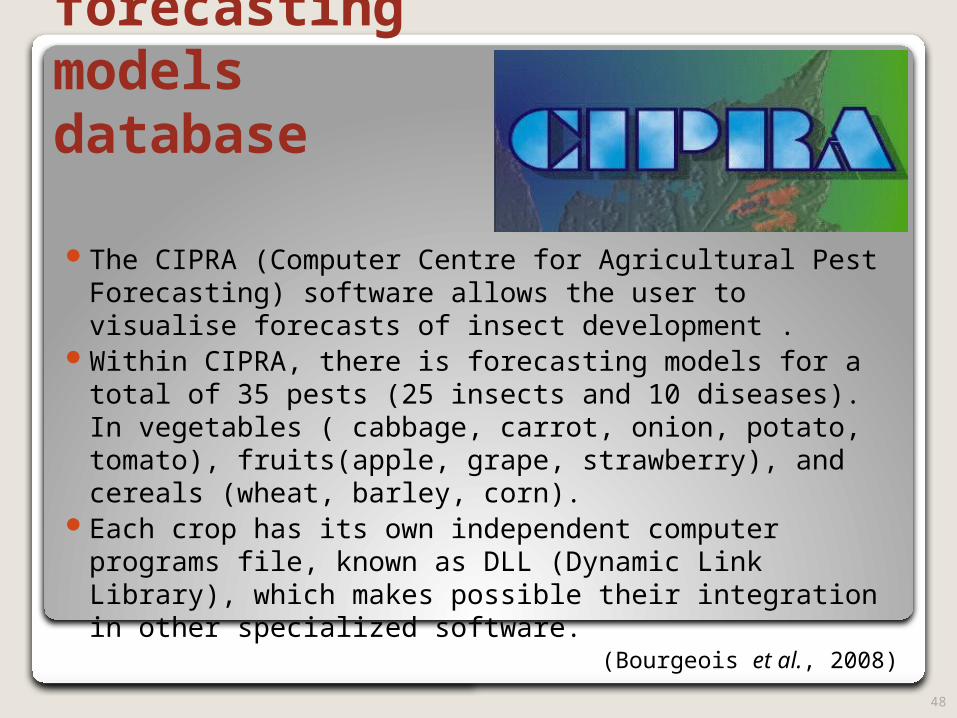
The forecasting models database
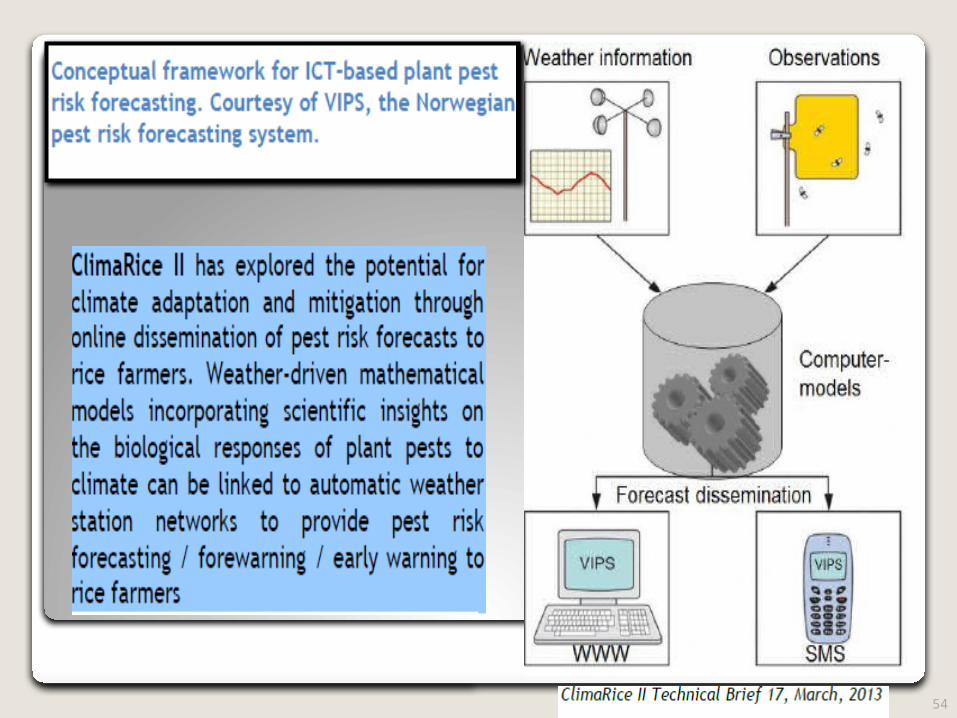
The CIPRA (Computer Centre for Agricultural Pest Forecasting) software allows the user to visualise forecasts of insect development .
Within CIPRA, there is forecasting models for a total of 35 pests (25 insects and 10 diseases). In vegetables ( cabbage, carrot, onion, potato, tomato), fruits(apple, grape, strawberry), and cereals (wheat, barley, corn).
Each crop has its own independent computer programs file, known as DLL (Dynamic Link Library), which makes possible their integration in other specialized software.
(Bourgeois et al., 2008)
48
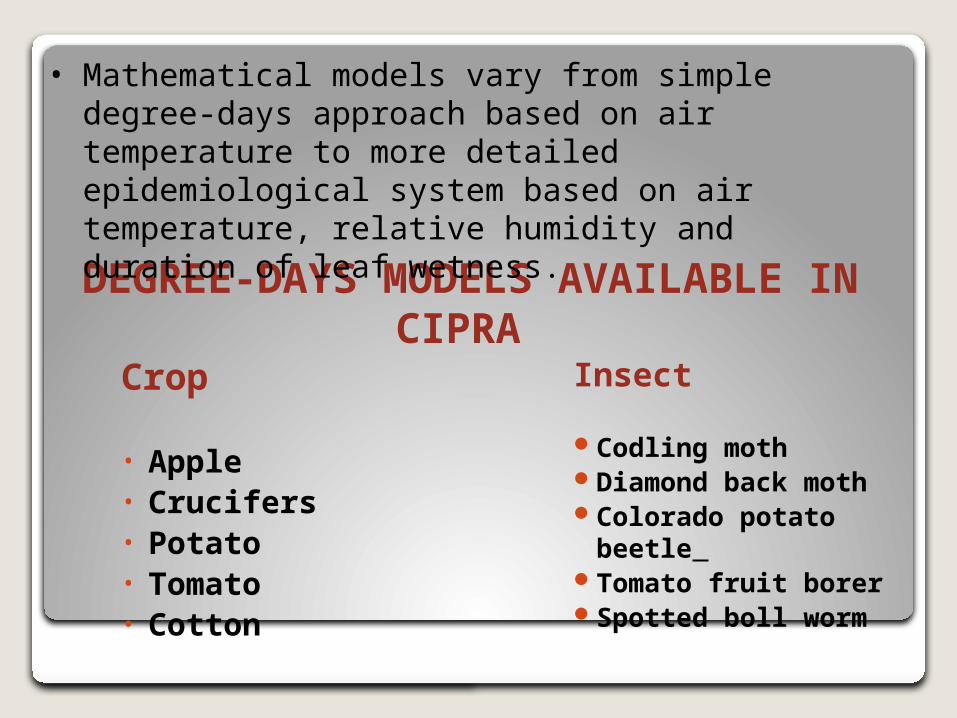
DEGREE-DAYS MODELS AVAILABLE IN CIPRA
Crop
• Apple• Crucifers• Potato• Tomato• Cotton
Insect
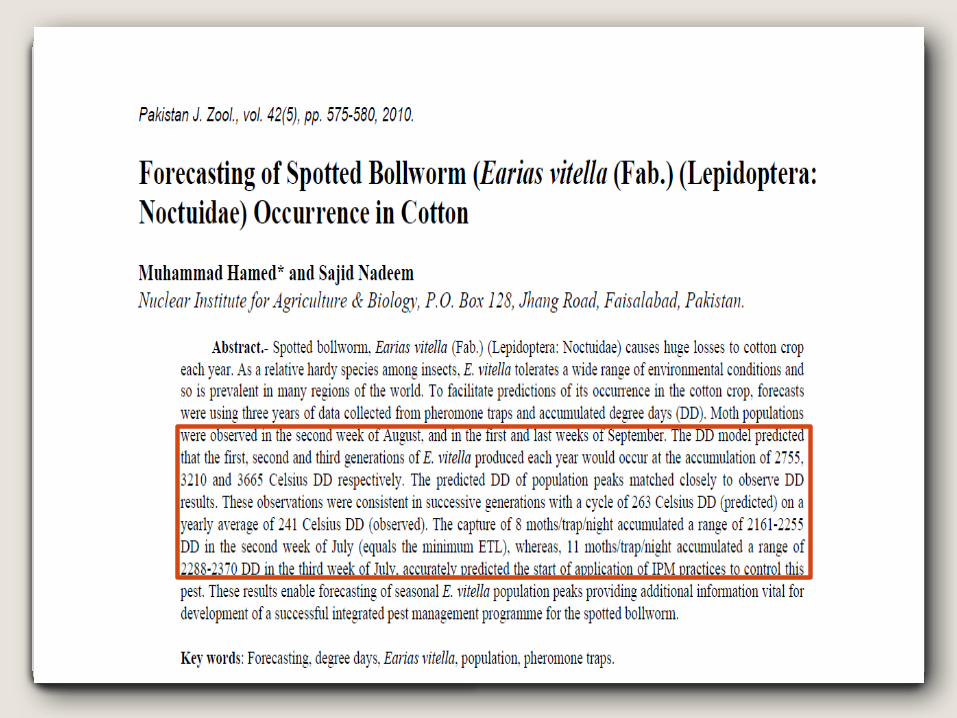
Codling moth Diamond back moth Colorado potato beetle Tomato fruit borer Spotted boll worm
• Mathematical models vary from simple degree-days approach based on air temperature to more detailed epidemiological system based on air temperature, relative humidity and duration of leaf wetness.
50
51
52
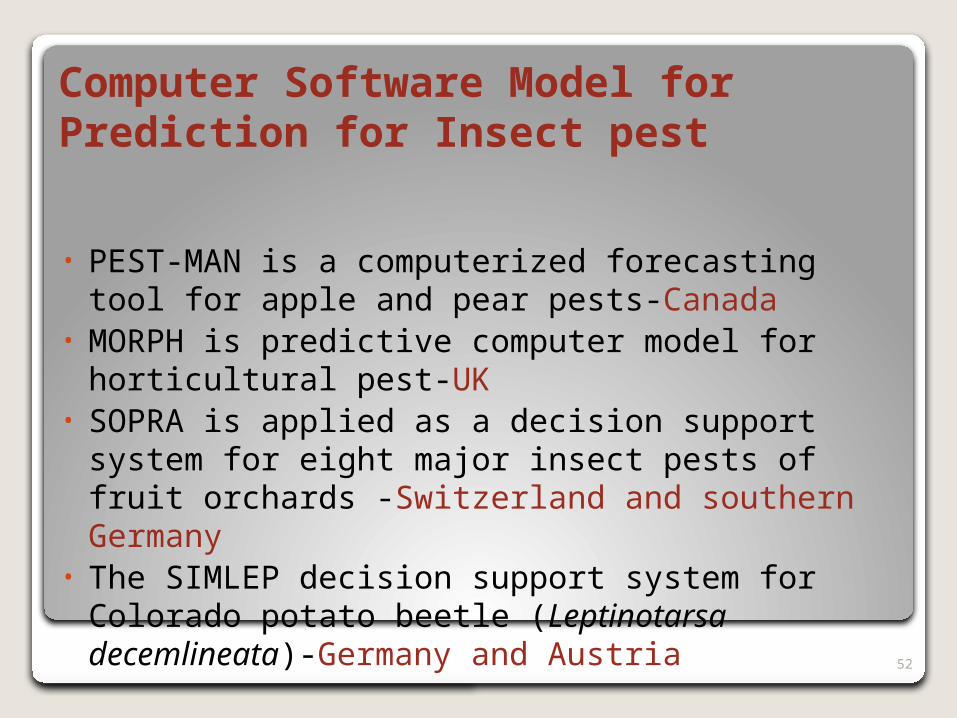
Computer Software Model for Prediction for Insect pest
• PEST-MAN is a computerized forecasting tool for apple and pear pests-Canada
• MORPH is predictive computer model for horticultural pest-UK
• SOPRA is applied as a decision support system for eight major insect pests of fruit orchards -Switzerland and southern Germany
• The SIMLEP decision support system for Colorado potato beetle (Leptinotarsa decemlineata)-Germany and Austria
53
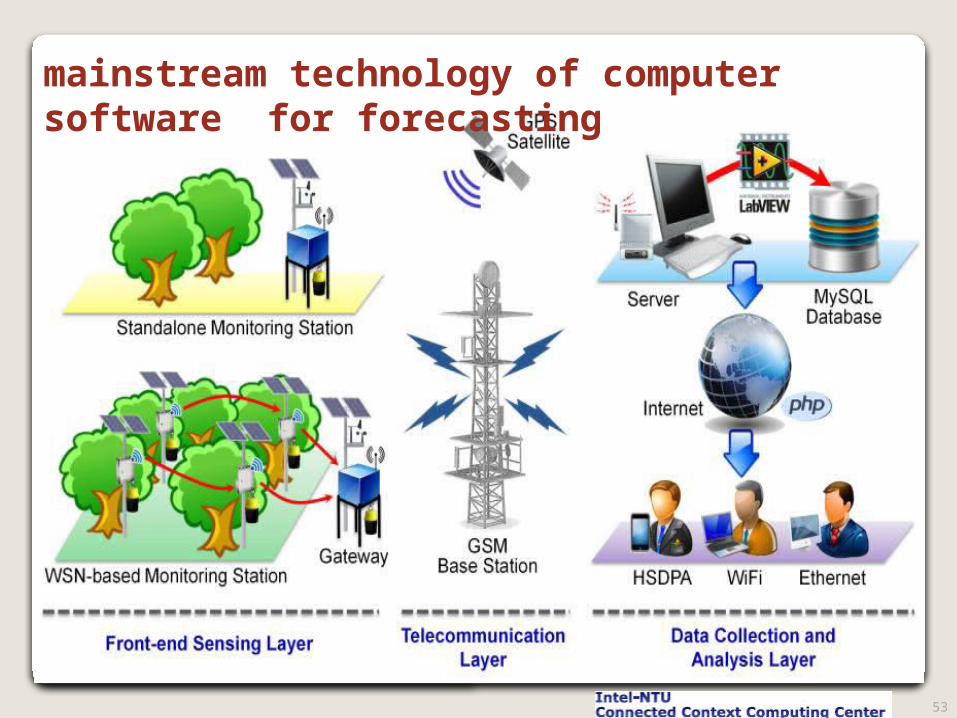
mainstream technology of computer software for forecasting
54
55
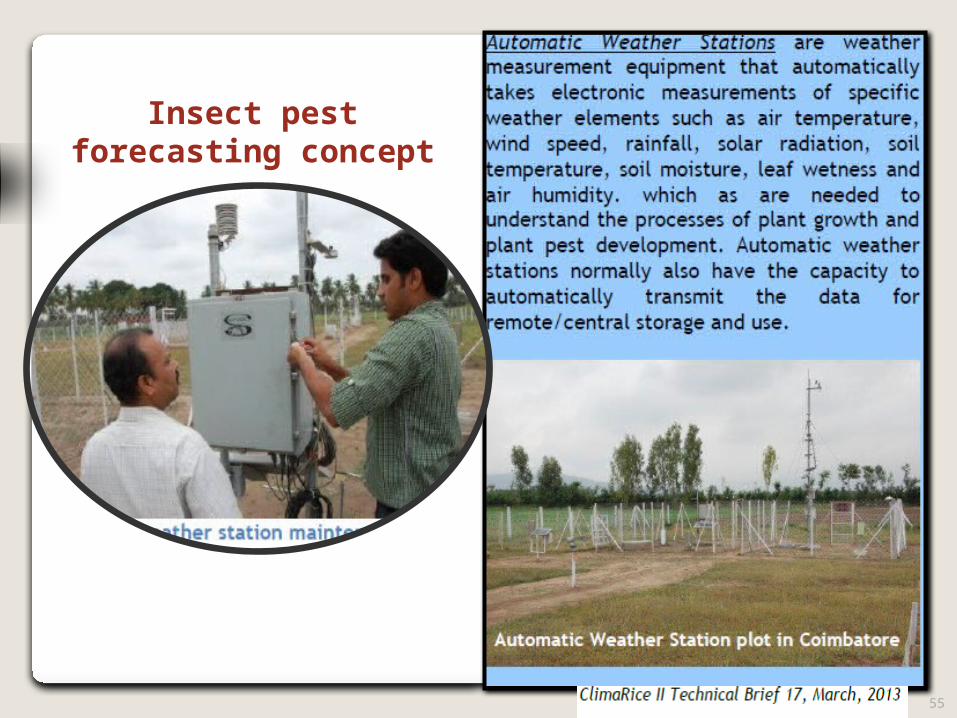
Insect pest forecasting concept
56
57
58
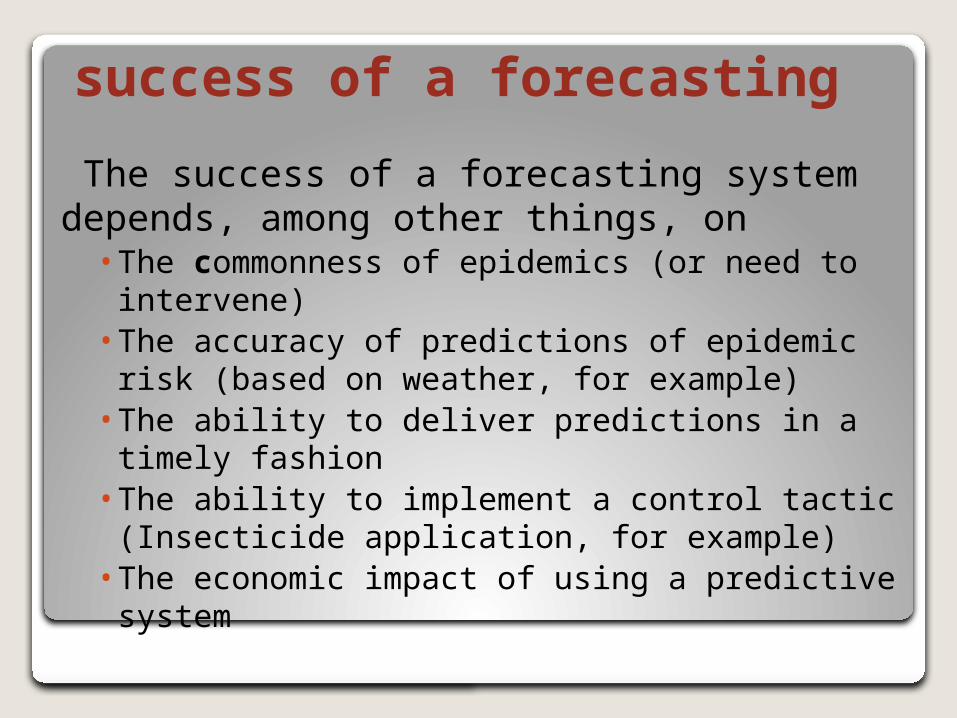
success of a forecasting
The success of a forecasting system depends, among other things, on
• The commonness of epidemics (or need to intervene)• The accuracy of predictions of epidemic risk (based on
weather, for example)• The ability to deliver predictions in a timely fashion• The ability to implement a control tactic (Insecticide
application, for example)• The economic impact of using a predictive system
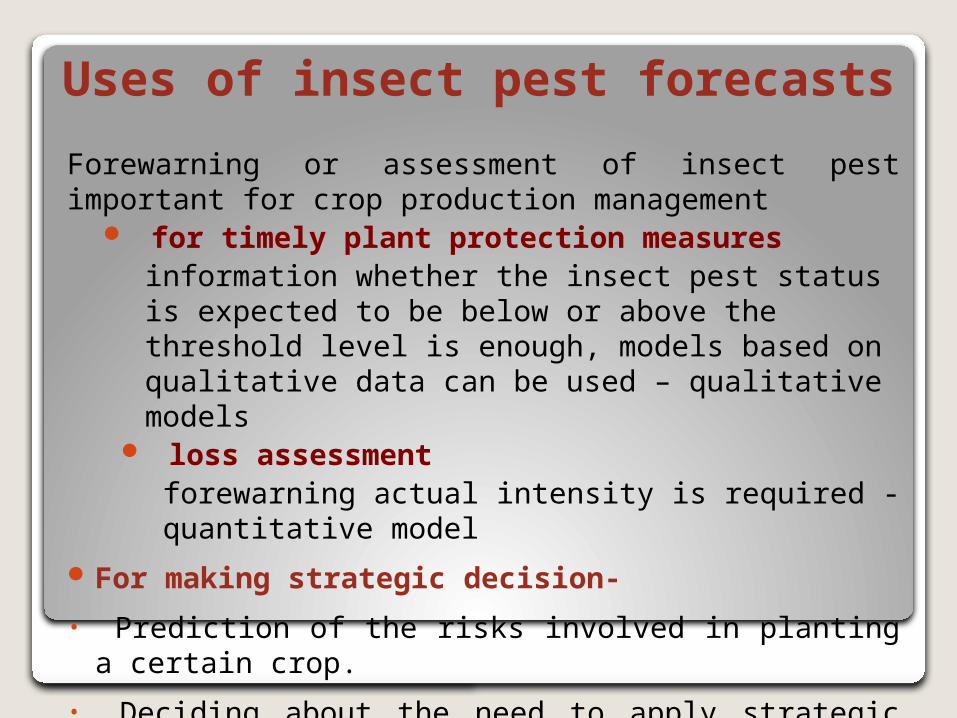
Uses of insect pest forecasts
Forewarning or assessment of insect pest important for crop production management
for timely plant protection measuresinformation whether the insect pest status is expected to be below or above the threshold level is enough, models based on qualitative data can be used – qualitative models
loss assessmentforewarning actual intensity is required - quantitative model
For making strategic decision-
• Prediction of the risks involved in planting a certain crop.
• Deciding about the need to apply strategic control measures (soil treatment, planting a resistant cultivar etc)
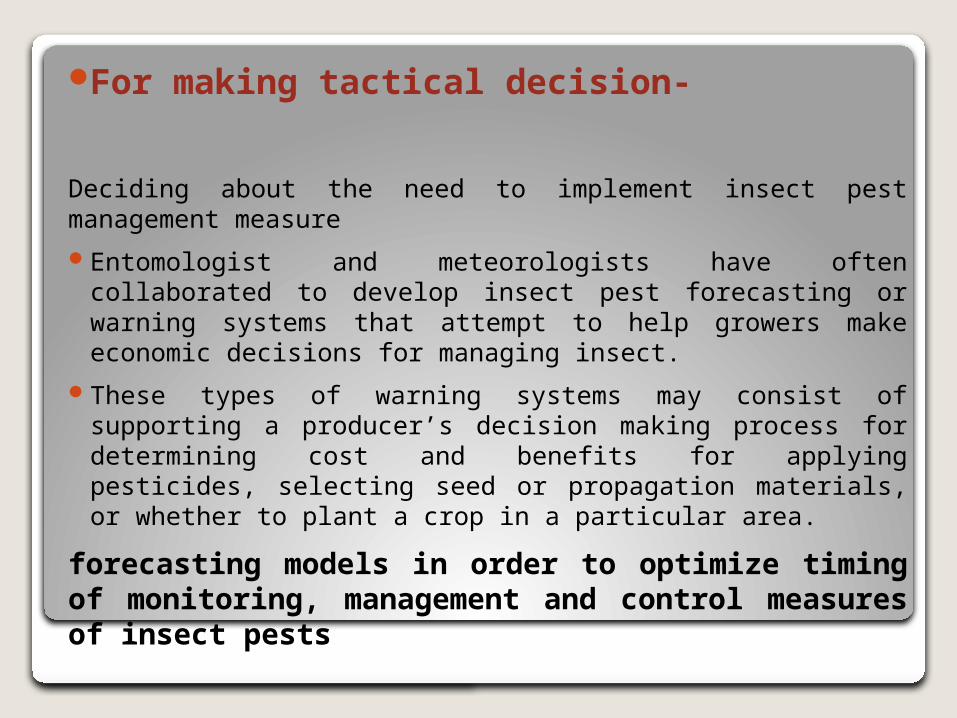
For making tactical decision-
Deciding about the need to implement insect pest management measure
Entomologist and meteorologists have often collaborated to develop insect pest forecasting or warning systems that attempt to help growers make economic decisions for managing insect.
These types of warning systems may consist of supporting a producer’s decision making process for determining cost and benefits for applying pesticides, selecting seed or propagation materials, or whether to plant a crop in a particular area.
forecasting models in order to optimize timing of monitoring, management and control measures of insect pests
62
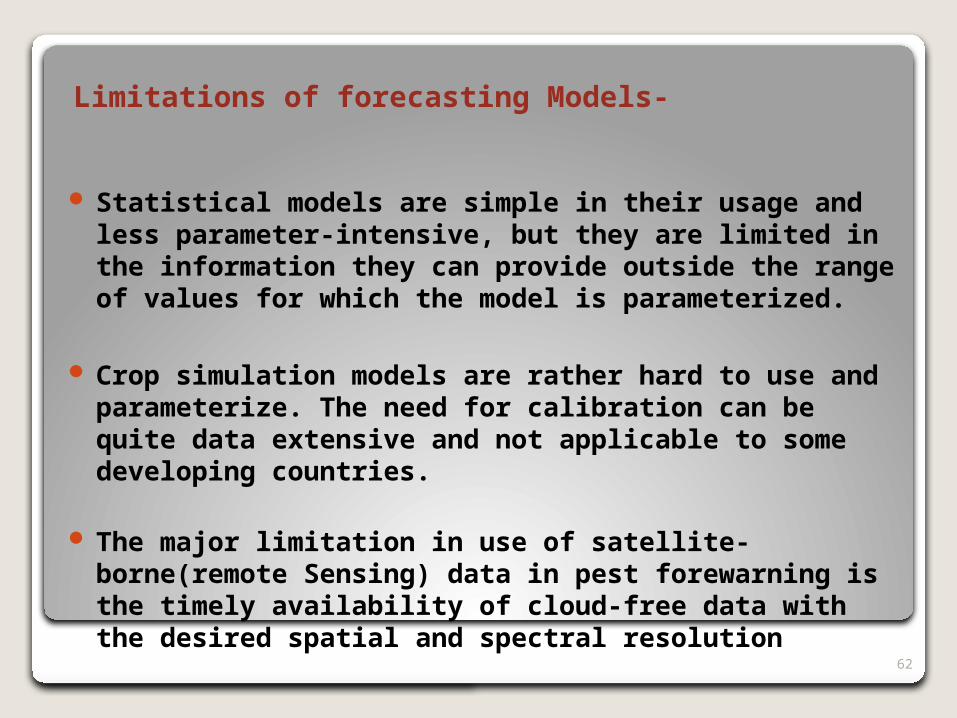
Limitations of forecasting Models-
Statistical models are simple in their usage and less parameter-intensive, but they are limited in the information they can provide outside the range of values for which the model is parameterized.
Crop simulation models are rather hard to use and parameterize. The need for calibration can be quite data extensive and not applicable to some developing countries.
The major limitation in use of satellite-borne(remote Sensing) data in pest forewarning is the timely availability of cloud-free data with the desired spatial and spectral resolution
Thank You