Forecasting Government Revenue and Expenditure in … · Forecasting Government Revenue and...
39
1 Forecasting Government Revenue and Expenditure in the U.S. Using Data on Age-Specific Utilization Ryan D. Edwards * February 15, 2010 Abstract Government finances depend on a vast array of variables, but there is a clear hierarchy among them, and forecasting requires a parsimonious treatment of complicated budget rules and behavior. The number of people paying taxes or receiving benefits and the intensity by which they do so are the most fundamental of these inputs. In this paper, we describe our approach to forecasting federal and state and local government finances using forecasts of the U.S. population by age and sex and measures of our assumptions about the intensity of program utilization by age and sex, or “age profiles” in common usage. * First draft May 5, 2006. Edwards is an Assistant Professor of Economics at Queens College and the Graduate Center, City University of New York, and a Faculty Research Fellow at the National Bureau of Economic Research. [email protected]
Transcript of Forecasting Government Revenue and Expenditure in … · Forecasting Government Revenue and...

1
Forecasting Government Revenue and Expenditure in the U.S. Using Data on Age-Specific Utilization
Ryan D. Edwards*
February 15, 2010
Abstract
Government finances depend on a vast array of variables, but there is a clear hierarchy among them, and forecasting requires a parsimonious treatment of complicated budget rules and behavior. The number of people paying taxes or receiving benefits and the intensity by which they do so are the most fundamental of these inputs. In this paper, we describe our approach to forecasting federal and state and local government finances using forecasts of the U.S. population by age and sex and measures of our assumptions about the intensity of program utilization by age and sex, or “age profiles” in common usage.
* First draft May 5, 2006. Edwards is an Assistant Professor of Economics at Queens College and the Graduate Center, City University of New York, and a Faculty Research Fellow at the National Bureau of Economic Research. [email protected]

2
1. Introduction Budget forecasts are a vital component of fiscal planning for governments, and they are informative of general macroeconomic health. Government agencies such as the Congressional Budget Office, the Office of Management and Budget, and the Social Security Administration all produce fiscal forecasts of various kinds in order to inform policy, and academic researchers have produced their own forecasts to assess the sustainability of fiscal policy (Auerbach, Gokhale, and Kotlikoff, 1994; Lee and Tuljapurkar, 1998). Another use of fiscal projections is to inform microeconomic or individual well-being. Individuals within a political unit receive transfers and pay taxes differently depending on their circumstances, and we would like to know the incidence of spending and taxation. A key goal of fiscal policy is to provide social safety nets through the redistribution of resources from the well-off to the needy. We know that the progressive income tax and means-tested public benefits accomplish this redistribution within cohorts, or within age groups. But another key channel of redistribution is between generations, or across age groups. In industrialized countries especially, the needs of economically vulnerable subpopulations, the very young and the very old, have increasingly been met through public support systems rather than more traditional family support systems. Mason et al. (2009) describe a new and ongoing effort to formally measure these age-specific net transfers in a panel of countries. It is this latter pattern of age-specific utilization of tax and transfer programs that provides the backbone to our budget forecasting techniques. Although there are many other elements that determine government expenditures and revenues, not least among them being the potentially variable legislation governing their incidence, the primary determinants of fiscal flows are the population and its utilization. And though it is not the only determinant of use, need, or ability to pay, age is a key parameter in economic behavior (Modigliani and Brumberg, 1954). While we recognize that age profiles of program utilization will not remain constant over time, as policy, behavior, and lifetime resources all may fluctuate, we believe that a forecasting approach based on age profiles offers meaningful insights into future well-being. In the sections that follow, we discuss our forecasting techniques in greater detail. First, we describe how we measure age-specific utilization using the Current Population Survey, a public dataset of individuals in households who report many types of taxes and transfers. Second, we lay out our parsimonious grouping of federal and state and local tax and spending programs in the U.S. into subsets with similar age-specific incidence. 2. Measuring age-specific utilization Ideally, we would like to have detailed administrative data from all levels of government, such as individual tax returns, Social Security records, Medicare claims, and so on. Since such data do not exist, we elect instead to use a nationally representative data source, the

3
Current Population Survey (CPS), which in its annual March supplement asks a sample of households about their program usage and tax payments during the past year. One member of the CPS household replies to each of these questions, which unfold in the following manner:
During 2004, did anyone in this household receive any SSI payments, that is, Supplemental Security Income? How much did (name/you) receive in Supplemental Security Income payments in 2004?
Answers to the second part of the question form the basis of our age profiles of utilization, which we construct by distributing the nominal dollar amounts among members of the household in the manner appropriate to the particular program. Typically, we split totals equally among household members. To construct age profiles, we then take averages of these totals across individuals in the CPS grouped by sex and by age, typically in 5-year groups. The result is a pair of vectors, one for males and one for females, that express average program usage in dollars by age group. In theory, the product of each of these age profiles with the sex-specific vector of population by age should yield total program usage. The natural difficulty with using self-reports is that individuals may not report the right amounts, of course. We have found that aggregated program totals in the CPS tend to understate significantly the total amounts of government taxes and transfers. Our solution to this problem is to scale our age profiles upward by a fixed proportion at each age, so that the product of the age profile and the population vector equals the total revenues or expenditures associated with that program in administrative data. Our primary source for these administrative control totals at the federal level are the federal budget documents. At the state and local level, we utilize two sources published by the U.S. Census Bureau: the Statistical Abstract of the United States, and the Annual Survey of Government Finances. A second issue that arises is that institutionalized subpopulations, such as nursing home residents, are not covered by the Current Population Survey. Although most Medicaid spending is currently directed toward the noninstitutionalized needy, a significant part is absorbed by nursing home residents. To gauge their utilization, we use the National Nursing Home Survey. 3. Defining and measuring government fiscal activity A key issue we must confront is how broadly to define government fiscal activity, and a related issue is which of sometimes several possible types of accounting schemes to use. This point is most salient in the case of state and local budgets, where fiscal accounting conventions tend not to be standard.

4
The U.S. federal budget documents, while extremely dense, offer a single standard: the unified budget framework. The National Income and Product Accounts (NIPA) measure government activity in a different way than the federal unified budget, because the goal of the NIPA is to measure gross income flows. An advantage of the unified federal budget over the NIPA is its explicit treatment of various trust funds, including Social Security, the various retirement trust funds, the federal highway trust fund, and so on, which are important elements of the government’s intertemporal budget constraint. In the cases of states and localities, which operate similar trust funds for state and local retirees and public utilities, there is considerably less clarity in accounting. Broadly speaking, there are 50 different accounting standards, although the Census Bureau applies a single methodology in its wide-reaching Annual Survey of Government Finances. One approach we have taken (Lee and Edwards, 2001; 2002; Lee, Tuljapurkar, and Edwards, 2010) is to model only a subset of state and local fiscal activities. In theory and in practice, states and localities face different fiscal constraints than the federal government, and we exploit these differences to shrink our projection universe to a more manageable size. Fiscal policy at the state and local level is constrained by two key factors that do not similarly restrict federal policy. First, many states have balanced budget amendments in their state constitutions (Poterba and Rueben, 1999). Second, even if they did not face such statutory constraints on borrowing, states are atomistic players in international credit markets and thus have considerably less leeway to finance deficits at affordable rates. A related characteristic of states and localities is that they are quite numerous and therefore are in direct competition with one another. Since there are 50 states, corporations can avoid tax incidence simply by relocating.1 We have argued that net transfers from corporations to states and localities must be essentially zero. Corporate income taxes and property taxes borne by corporations must be balanced by equal and offsetting transfers, or else corporations would have relocated. The upshot of these observations is that states and localities must prefund their public employees’ retirement plans, must balance budgets in their utilities sectors, and do not collect any net taxes on corporations. We have often chosen to omit these components of state and local budgets from consideration in order to make forecasting more manageable. Another feasible approach is to simply adopt a particular accounting system like the Census Bureau’s or the NIPA, and then fashion a forecast around it. The National Transfers Accounts (NTA) project adopts the NIPA methodology in constructing measures of total age-based transfers, for example. 1 In theory, this argument could also be made about individuals and state income taxes. But in practice, we see vastly different personal income tax rates across states, coupled with a reasonably stable population distribution. This suggests that individuals do not force states to competitively lower their personal income tax take to zero, whether because there is heterogeneity in personal resources and the ability to move, or for some other reason.

5
4. Taxonomies of fiscal activity A. Based on Budget documents and Census Bureau estimates In our published work (Lee and Edwards, 2001; 2002; Lee, Tuljapurkar, and Edwards, 2010), we have used the federal Budget and the Census Bureau’s Survey of Government Finances to define and measure baseline levels of spending and taxes by program. Then we associate those programs with age profiles of usage derived from the CPS. Tables A1 and A2 present our itemization of federal spending and taxes in 1999, while Tables A3 and A4 do the same for state and local governments. In each table, the third column presents the administrative control total for the fiscal category named in the second column, while the fourth column describes the age profile of utilization we have derived to describe the incidence of the tax or receipt of the expenditure in the cross section. Categories that do not have an obvious age profile include spending like debt servicing and public goods like military spending; they are listed at the bottom of the table and have an “NA” in the fourth column. The fifth column describes the age profile or technique we use to forecast temporal change in the category if it is different from the age profile of cross-sectional utilization. For example, Social Security benefits accrue based on prior contributions, so we do not forecast them using a simple age profile of benefit incidence. Medicare spending is based on a need that is more tightly associated with time until death rather than age (Miller, 2001), although an age profile approach with flat incidence past age 65 produces a roughly similar forecast. The system of unemployment insurance is designed to be roughly self-balancing over time, except as may reflect business cycle fluctuations; we therefore model both inflows and outflows as depending on the age profile of unemployment compensation. We model state and local property taxes, which are paid by property owners and renters, as rising over time with the demand for K-12 schooling, for which property taxes are the primary funding source. Tables A5–A8 lists the age profiles of cross-sectional incidence associated with the programs in Tables A1–A4. We have scaled the age profiles so that they produce the control totals in Tables A1–A4 when applied to population counts by age and sex in 1999, which are listed in Table A9. Figure A1 displays the average age profile of spending and taxes in 1999 for both sexes combined, with the sex ratio in each age group as the weight. B. Based on NIPA We have also produced a set of age profiles using the NIPA tables for calendar year 2004, in order to have a set that are comparable to the NTA database. These 2004 age profiles are for both sexes combined in single years of age, and they cover the full array of government programs itemized in the NIPA tables. The age shapes of these profiles should be similar to the 1999 age profiles, but the 2004 profiles were based on NTA data rather than the aging database of various years’ CPS age profiles we used for the 1999 profiles.

6
Mirroring the taxes in Appendix A, Tables B1–B4 itemize federal and state and local spending and taxes by program. Then Tables B5–B8 present the 2004 age profiles. Table B9 lists the 2004 U.S. population by age and sex. As of this writing, we have not used these age profiles in our forecasts. But as a snapshot of age-related incidence of fiscal policy, they may be preferable to our 1999 profiles because they are more up to date, in addition to being compatible with the NIPA accounts. 5. Notable changes to fiscal policy since 1999 that we have not yet implemented
• We have not implemented the federal income tax cuts of 2001 and 2003, which definitely changed the level of taxes and possibly the age structure.
• Medicare Part D, the prescription drug benefit, came into effect in January 2006,
and we have not yet updated our forecasts to include it. • We have modeled none of the cyclical or structural changes to fiscal policy that
have occurred as a result of or in response to the recession of 2008.

7
References Auerbach, Alan J., Jagadeesh Gokhale, and Laurence J. Kotlikoff (1994) “Generational Accounting: A Meaningful Way to Evaluate Fiscal Policy,” Journal of Economic Perspectives 8(1), 73–94. Edwards, Ryan D., Ronald D. Lee, Michael W. Anderson, Shripad Tuljapurkar, and Carl Boe (2003) “Key equations in the Tuljapurkar-Lee model of the Social Security system,” University of Michigan Retirement Research Center Working Paper 2003-044 Lee, Ronald D. and Ryan D. Edwards (2002) “The Fiscal Impact of Population Aging in the US: Assessing the Uncertainties,” in J.M. Poterba, ed., Tax Policy and the Economy, vol. 16, 141–181. Lee, Ronald D. and Ryan D. Edwards (2001) “The Fiscal Impact of Population Change,” in J.S. Little and R.K. Triest, eds., Seismic Shifts: The Economic Impact of Demographic Change, Federal Reserve Bank of Boston Conference Series, No. 46. Lee, Ronald D., Timothy Miller, and Ryan D. Edwards (2003) “The Growth and Aging of California’s Population: Demographic and Fiscal Projections, Characteristics, and Service Needs,” a special report of the California Policy Research Center. Lee, Ronald D. and Error! Contact not defined. (1998) “Uncertain Demographic Futures and Social Security Finances,” American Economic Review 88(2), 237–241. Lee, Ronald D., Shripad Tuljapurkar, and Ryan D. Edwards (2010) “Uncertain Demographic Futures and Government Budgets in the U.S.,” in Shripad Tuljapurkar, Naohiro Ogawa, and Anne H. Gauthier, eds., Riding the Age Waves – Vol. 3: Aging in Advanced Industrial States, New York: Springer, forthcoming. Mason, Andrew, Ronald Lee, An-Chi Tung, Mun Sim Lai, and Tim Miller (2009) “Population Aging and Intergenerational Transfers: Introducing Age into National Income Accounts,” in Developments in the Economics of Aging, David Wise, ed. NBER and University of Chicago Press. Miller, Tim (2001) “Increasing Longevity and Medicare Expenditures,” Demography 38(2), 215–226. Modigliani, Franco, and Richard Brumberg (1954) “Utility Analysis and the Consumption Function: An Interpretation of Cross-Section Data,” in Kenneth K. Kurihara, ed., Post-Keynesian Economics, New Brunswick, NJ: Rutgers University Press. Poterba, James M. and Kim Rueben (1999) Fiscal Rules and State Borrowing Costs: Evidence from California and Other States, San Francisco: Public Policy Institute of California.

8
Appendix A:
Data for 2004 derived from NIPA and NTA databases

9
Table A1. Federal spending by program during 1999 in millions of dollars
Expenditures
1999 total in millions of dollars
Age profile of cross-sectional incidence
Age profile of temporal change, if different
1 OASDI (Social Security) 392,909 CPS receipt of OASDI per individual
Complicated
2 Federal retirement 44,691 CPS receipt of federal retirement per individual
3 Military retirement 32,152 CPS receipt of military retirement per individual
4 Railroad retirement 4,280 CPS receipt of railroad retirement per individual
5 Hospital Insurance (HI, Medicare Part A)
131,501 CPS Medicare enrollment rate per individual
Time until death
6 Supplementary Medical Insurance (SMI, Medicare Part B)
61,190 CPS Medicare enrollment rate per individual
7 Medicaid, institutionalized (nursing home) populations
27,515 NNHS receipt of Medicaid in a nursing home per individual
8 Medicaid, other 82,546 CPS Medicaid enrollment rate per individual
9 Supplemental Security Income (SSI)
28,457 CPS receipt of SSI per individual
10 Unemployment Compensation
23,747 CPS receipt of UC per individual
11 Earned Income Tax Credit (EITC)
25,643 CPS receipt of EITC per individual
12 Public assistance (AFDC/TANF)
32,564 CPS receipt of AFDC / TANF per individual
13 Public housing 4,467 CPS receipt of any public housing (0/1), split equally within household
14 Rent subsidies 22,028 CPS receipt of any rent subsidies (0/1), split equally within household
15 Food stamps 23,663 CPS receipt of food stamps, split equally within household
16 Energy assistance 1,193 CPS receipt of energy assistance, split equally within household
17 College education 1,008 CPS full-time college enrollment per individual

10
18 K-12 education 17,110 CPS K-12 enrollment per individual
19 Direct student aid 11,488 CPS federal direct educational assistance per individual
20 School lunches 8,984 CPS school lunches, split equally among household members under 18
21 Incarceration 3,293 NA 22 Public goods (defense,
etc.) 370,698 NA
23 Congestible goods 146,166 NA 24 Interest payments 227,380 NA Total 1,724,671 Notes: Data are for calendar-year 1999, consisting of weighted averages of the federal fiscal years 1999 and 2000. All data are taken from federal budget documents. Per budget scoring rules, SMI net expenditures are reported; gross expenditures were $82.3 billion, while SMI user fees were about $19 billion. Spending on public goods includes national defense, international affairs, health research, veterans benefits and services, and general science, space, and technology. Congestible goods are a residual category.
11
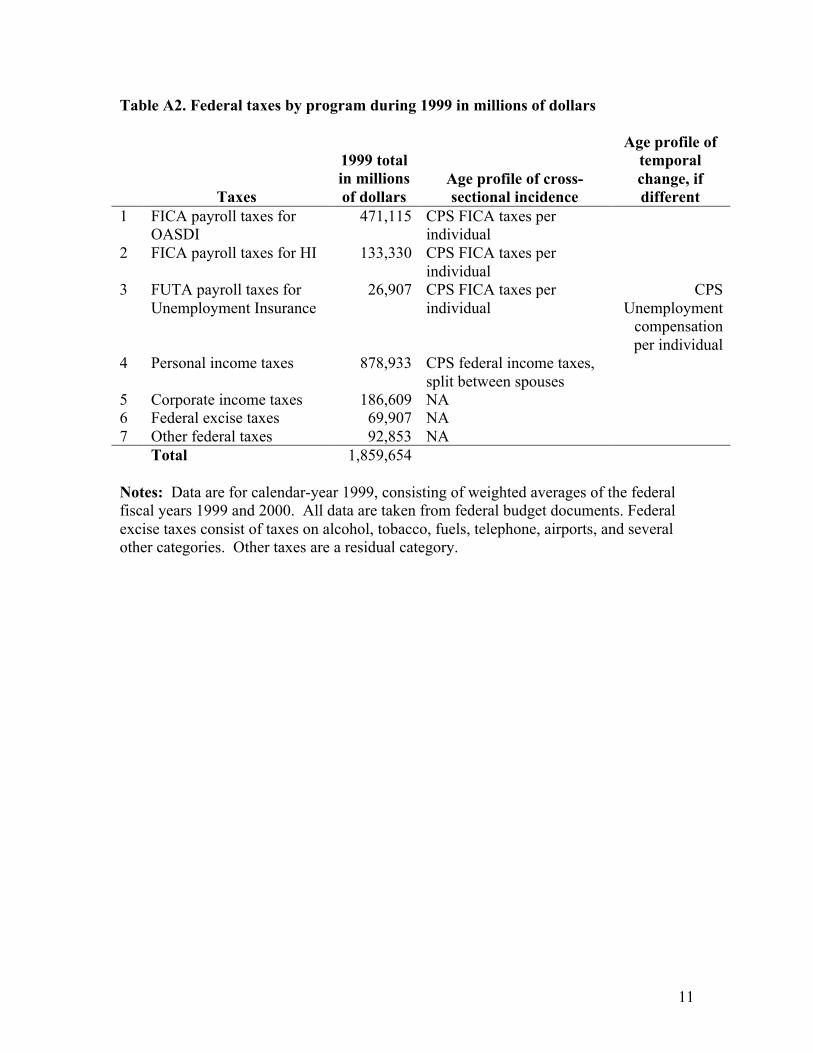
Table A2. Federal taxes by program during 1999 in millions of dollars
Taxes
1999 total in millions of dollars
Age profile of cross-sectional incidence
Age profile of temporal change, if different
1 FICA payroll taxes for OASDI
471,115 CPS FICA taxes per individual
2 FICA payroll taxes for HI 133,330 CPS FICA taxes per individual
3 FUTA payroll taxes for Unemployment Insurance
26,907 CPS FICA taxes per individual
CPS Unemployment
compensation per individual
4 Personal income taxes 878,933 CPS federal income taxes, split between spouses
5 Corporate income taxes 186,609 NA 6 Federal excise taxes 69,907 NA 7 Other federal taxes 92,853 NA Total 1,859,654 Notes: Data are for calendar-year 1999, consisting of weighted averages of the federal fiscal years 1999 and 2000. All data are taken from federal budget documents. Federal excise taxes consist of taxes on alcohol, tobacco, fuels, telephone, airports, and several other categories. Other taxes are a residual category.
12
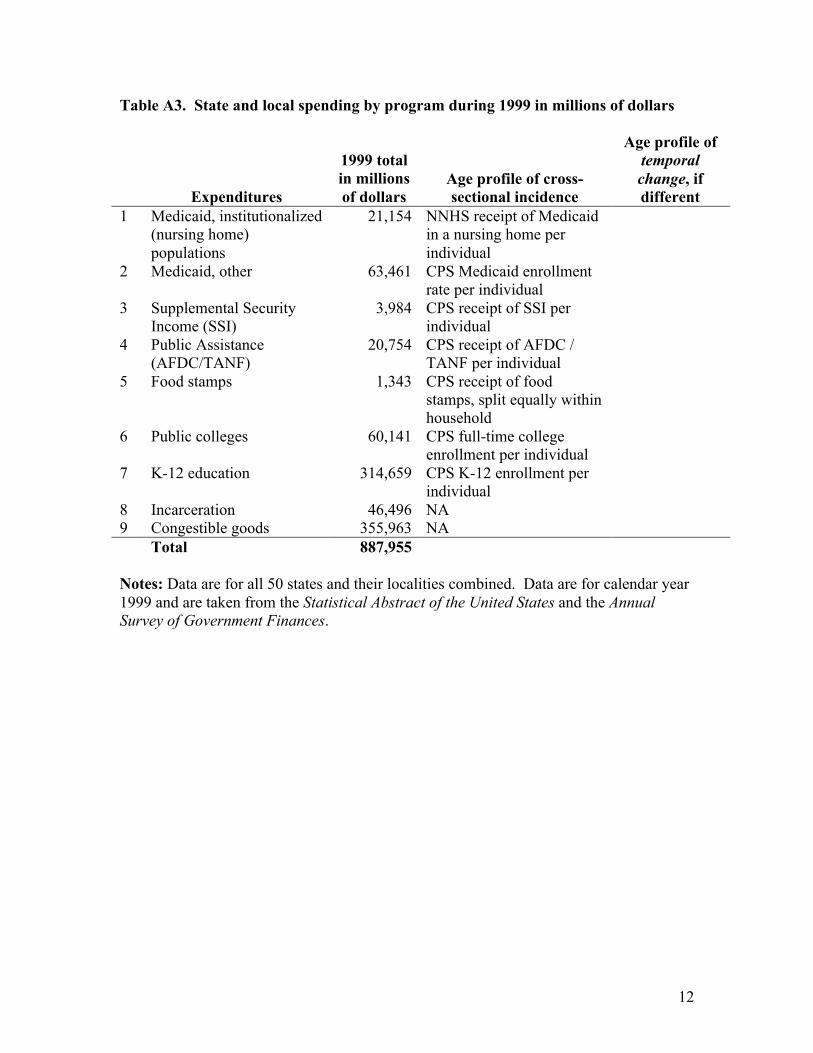
Table A3. State and local spending by program during 1999 in millions of dollars
Expenditures
1999 total in millions of dollars
Age profile of cross-sectional incidence
Age profile of temporal change, if different
1 Medicaid, institutionalized (nursing home) populations
21,154 NNHS receipt of Medicaid in a nursing home per individual
2 Medicaid, other 63,461 CPS Medicaid enrollment rate per individual
3 Supplemental Security Income (SSI)
3,984 CPS receipt of SSI per individual
4 Public Assistance (AFDC/TANF)
20,754 CPS receipt of AFDC / TANF per individual
5 Food stamps 1,343 CPS receipt of food stamps, split equally within household
6 Public colleges 60,141 CPS full-time college enrollment per individual
7 K-12 education 314,659 CPS K-12 enrollment per individual
8 Incarceration 46,496 NA 9 Congestible goods 355,963 NA Total 887,955 Notes: Data are for all 50 states and their localities combined. Data are for calendar year 1999 and are taken from the Statistical Abstract of the United States and the Annual Survey of Government Finances.

13
Table A4. State and local taxes by program during 1999 in millions of dollars
Expenditures
1999 total in millions of dollars
Age profile of cross-sectional incidence
Age profile of temporal change, if different
1 State personal income taxes
180,262 CPS state incomes taxes, split between spouses
2 Property taxes, homeowners
105,120 CPS property taxes, split between spouses
CPS K-12 enrollment per
individual 3 Property taxes, renters 35,415 CPS whether renting (0/1),
split between spouses CPS K-12
enrollment per individual
4 Sales taxes 198,003 CPS household income, split equally within household
5 Other taxes 369,151 NA Total 887,951 Notes: Data are for all 50 states and their localities combined. Data are for calendar year 1999 and are taken from the Statistical Abstract of the United States and the Annual Survey of Government Finances.

14
Table A5. Age profiles of federal spending in 1999 dollars per capita
OASDI Federal retirement Military retirement Age Females Males Females Males Females Males 0–4 0 0 0 0 0 0 5–9 0 0 0 0 0 0
10–14 0 0 0 0 0 0 15–19 242 250 0 0 0 0 20–24 41 37 0 0 0 8 25–29 116 66 0 0 0 0 30–34 180 128 2 1 0 0 35–39 227 219 0 5 2 9 40–44 246 254 2 22 1 146 45–49 254 340 8 65 8 467 50–54 313 455 36 149 0 713 55–59 558 809 101 476 76 943 60–64 2,724 3,435 232 1,239 29 939 65–69 6,910 9,625 347 1,585 0 704 70–74 8,113 10,851 405 2,171 16 651 75–79 8,913 12,401 362 1,948 3 729 80–84 9,065 11,798 265 1,405 89 297 85–89 8,741 10,669 153 868 0 208
90+ 8,197 10,291 181 750 0 1,319
Railroad retire Medicare Part A Medicare Part B Age Females Males Females Males Females Males 0–4 0 0 0 0 0 0 5–9 0 0 0 0 0 0
10–14 0 0 0 0 0 0 15–19 0 0 20 18 9 8 20–24 0 0 32 17 15 8 25–29 0 0 43 32 20 15 30–34 1 0 44 42 20 20 35–39 0 0 36 60 17 28 40–44 1 2 44 56 20 26 45–49 0 0 59 93 28 43 50–54 0 0 100 103 47 48 55–59 9 27 160 176 74 82 60–64 30 89 367 339 171 158 65–69 32 252 3,347 3,218 1,557 1,497 70–74 46 206 3,486 3,445 1,622 1,603 75–79 40 153 3,489 3,482 1,623 1,620 80–84 25 78 3,526 3,509 1,641 1,633 85–89 21 231 3,491 3,545 1,624 1,650
90+ 0 142 3,528 3,482 1,642 1,620
15
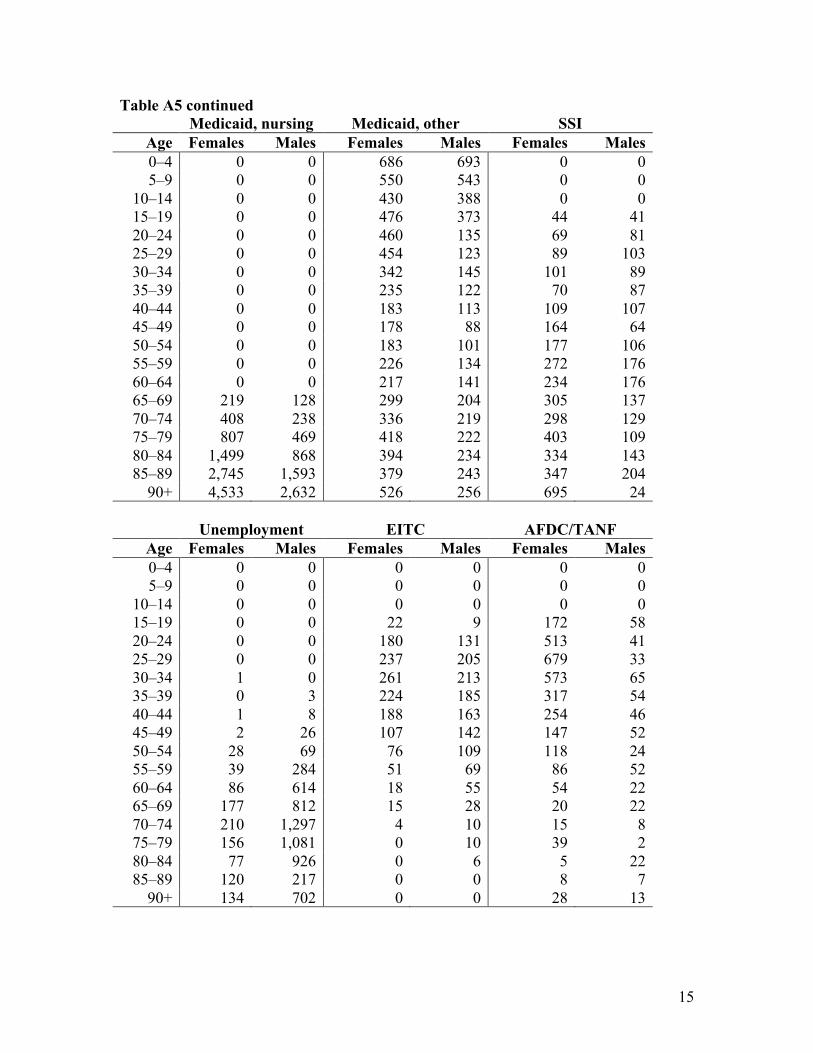
Table A5 continued Medicaid, nursing Medicaid, other SSI Age Females Males Females Males Females Males 0–4 0 0 686 693 0 0 5–9 0 0 550 543 0 0
10–14 0 0 430 388 0 0 15–19 0 0 476 373 44 41 20–24 0 0 460 135 69 81 25–29 0 0 454 123 89 103 30–34 0 0 342 145 101 89 35–39 0 0 235 122 70 87 40–44 0 0 183 113 109 107 45–49 0 0 178 88 164 64 50–54 0 0 183 101 177 106 55–59 0 0 226 134 272 176 60–64 0 0 217 141 234 176 65–69 219 128 299 204 305 137 70–74 408 238 336 219 298 129 75–79 807 469 418 222 403 109 80–84 1,499 868 394 234 334 143 85–89 2,745 1,593 379 243 347 204
90+ 4,533 2,632 526 256 695 24
Unemployment EITC AFDC/TANF Age Females Males Females Males Females Males 0–4 0 0 0 0 0 0 5–9 0 0 0 0 0 0
10–14 0 0 0 0 0 0 15–19 0 0 22 9 172 58 20–24 0 0 180 131 513 41 25–29 0 0 237 205 679 33 30–34 1 0 261 213 573 65 35–39 0 3 224 185 317 54 40–44 1 8 188 163 254 46 45–49 2 26 107 142 147 52 50–54 28 69 76 109 118 24 55–59 39 284 51 69 86 52 60–64 86 614 18 55 54 22 65–69 177 812 15 28 20 22 70–74 210 1,297 4 10 15 8 75–79 156 1,081 0 10 39 2 80–84 77 926 0 6 5 22 85–89 120 217 0 0 8 7
90+ 134 702 0 0 28 13

16
Table A5 continued Public housing Rent subsidies Food stamps Age Females Males Females Males Females Males 0–4 19 22 110 108 198 211 5–9 17 16 101 78 185 177
10–14 14 13 71 62 152 135 15–19 14 11 61 67 128 106 20–24 18 10 107 53 122 57 25–29 18 8 82 44 132 47 30–34 14 9 92 49 111 54 35–39 12 6 56 22 85 39 40–44 6 6 66 38 61 38 45–49 9 3 75 33 62 28 50–54 16 7 55 33 50 34 55–59 23 5 64 38 54 38 60–64 24 11 144 22 49 29 65–69 41 16 202 70 41 22 70–74 53 20 249 67 45 15 75–79 72 20 219 151 38 17 80–84 78 32 370 72 49 23 85–89 69 37 281 80 49 40
90+ 58 41 255 43 36 51
Energy assistance College education K–12 education Age Females Males Females Males Females Males 0–4 6 5 0 0 0 0 5–9 6 5 0 0 346 346
10–14 5 4 0 0 283 283 15–19 5 4 21 17 229 245 20–24 4 2 35 37 2 3 25–29 4 2 0 0 0 0 30–34 4 3 0 0 0 0 35–39 3 2 0 0 0 0 40–44 3 2 0 0 0 0 45–49 5 1 0 0 0 0 50–54 4 2 0 0 0 0 55–59 7 3 0 0 0 0 60–64 6 2 0 0 0 0 65–69 7 5 0 0 0 0 70–74 8 4 0 0 0 0 75–79 16 3 0 0 0 0 80–84 13 4 0 0 0 0 85–89 14 2 0 0 0 0
90+ 17 12 0 0 0 0

17
Table A5 continued Direct student aid School lunches Incarceration Age Females Males Females Males Females Males 0–4 0 0 0 0 12 12 5–9 0 0 167 162 12 12
10–14 0 0 199 201 12 12 15–19 114 108 87 99 12 12 20–24 270 289 0 0 12 12 25–29 94 79 0 0 12 12 30–34 54 38 0 0 12 12 35–39 41 23 0 0 12 12 40–44 35 27 0 0 12 12 45–49 20 8 0 0 12 12 50–54 5 2 0 0 12 12 55–59 4 4 0 0 12 12 60–64 0 0 0 0 12 12 65–69 0 1 0 0 12 12 70–74 0 0 0 0 12 12 75–79 0 0 0 0 12 12 80–84 0 0 0 0 12 12 85–89 0 0 0 0 12 12
90+ 0 0 0 0 12 12
Public goods Congestible goods Interest payments Age Females Males Females Males Females Males 0–4 1,365 1,365 538 538 837 837 5–9 1,365 1,365 538 538 837 837
10–14 1,365 1,365 538 538 837 837 15–19 1,365 1,365 538 538 837 837 20–24 1,365 1,365 538 538 837 837 25–29 1,365 1,365 538 538 837 837 30–34 1,365 1,365 538 538 837 837 35–39 1,365 1,365 538 538 837 837 40–44 1,365 1,365 538 538 837 837 45–49 1,365 1,365 538 538 837 837 50–54 1,365 1,365 538 538 837 837 55–59 1,365 1,365 538 538 837 837 60–64 1,365 1,365 538 538 837 837 65–69 1,365 1,365 538 538 837 837 70–74 1,365 1,365 538 538 837 837 75–79 1,365 1,365 538 538 837 837 80–84 1,365 1,365 538 538 837 837 85–89 1,365 1,365 538 538 837 837
90+ 1,365 1,365 538 538 837 837

18
Notes: Data are per-capita taxes or transfers derived from the Current Population Survey March Demographic Supplement, scaled so that the summed product of the age profiles with the population by age and sex equals the control totals shown in Table A1.

19
Table A6. Age profiles of federal taxes in 1999 dollars per capita OASDI taxes HI taxes Unemployment taxes
Age Females Males Females Males Females Males 0–4 0 0 0 0 0 0 5–9 0 0 0 0 0 0
10–14 0 0 0 0 0 0 15–19 225 273 64 77 0 0 20–24 1,155 1,535 327 434 0 0 25–29 1,909 3,139 540 888 0 0 30–34 2,013 3,980 570 1,126 1 0 35–39 2,188 4,435 619 1,255 0 3 40–44 2,309 4,674 653 1,323 1 9 45–49 2,218 4,899 628 1,387 2 29 50–54 1,959 4,669 554 1,321 31 78 55–59 1,488 3,938 421 1,115 44 322 60–64 894 2,843 253 805 97 695 65–69 305 1,207 86 342 201 920 70–74 148 585 42 166 238 1,470 75–79 97 281 28 80 177 1,225 80–84 56 191 16 54 87 1,049 85–89 5 73 1 21 136 246
90+ 27 280 8 79 152 796
Fed income taxes Corporate income tax Federal excise taxes Age Females Males Females Males Females Males 0–4 0 0 687 687 257 257 5–9 0 0 687 687 257 257
10–14 0 0 687 687 257 257 15–19 177 192 687 687 257 257 20–24 1,405 1,534 687 687 257 257 25–29 3,316 3,667 687 687 257 257 30–34 4,193 4,692 687 687 257 257 35–39 5,237 5,553 687 687 257 257 40–44 6,223 6,748 687 687 257 257 45–49 6,563 7,451 687 687 257 257 50–54 6,088 7,478 687 687 257 257 55–59 5,656 6,960 687 687 257 257 60–64 3,592 5,287 687 687 257 257 65–69 2,052 3,145 687 687 257 257 70–74 1,612 2,559 687 687 257 257 75–79 1,219 2,140 687 687 257 257 80–84 898 1,684 687 687 257 257 85–89 728 1,015 687 687 257 257
90+ 891 2,446 687 687 257 257

20
Table A6 continued Other federal tax Age Females Males 0–4 342 342 5–9 342 342
10–14 342 342 15–19 342 342 20–24 342 342 25–29 342 342 30–34 342 342 35–39 342 342 40–44 342 342 45–49 342 342 50–54 342 342 55–59 342 342 60–64 342 342 65–69 342 342 70–74 342 342 75–79 342 342 80–84 342 342 85–89 342 342
90+ 342 342
21
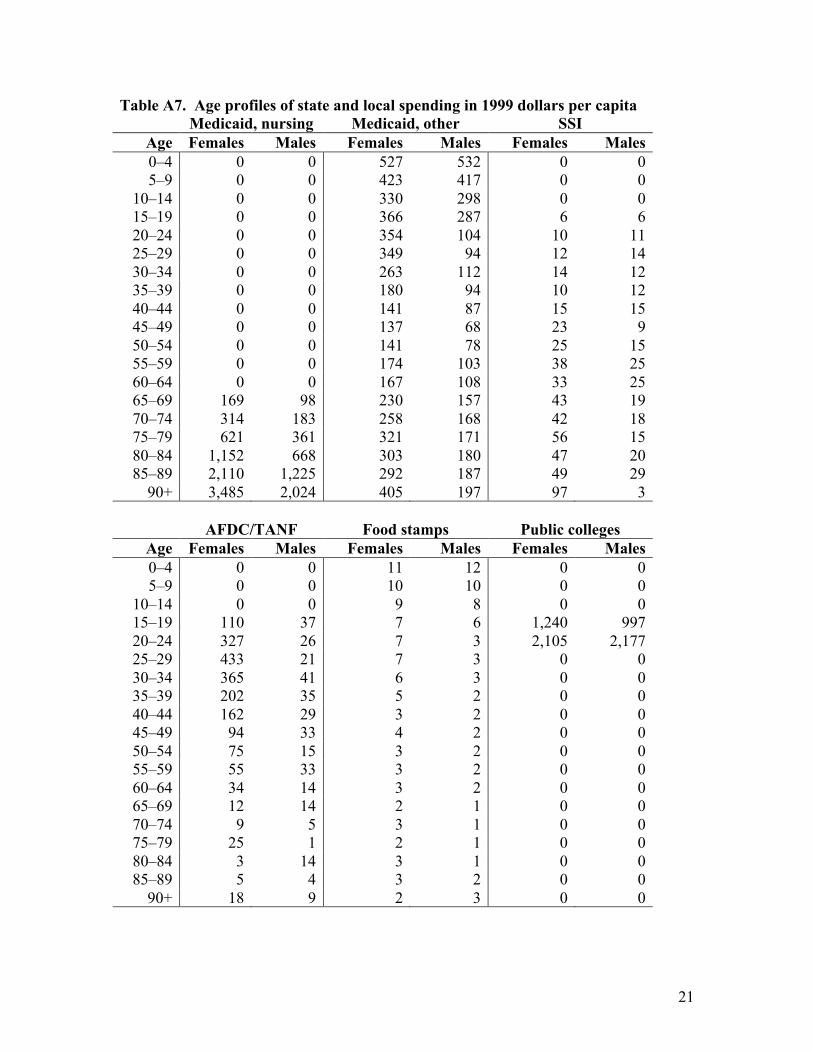
Table A7. Age profiles of state and local spending in 1999 dollars per capita Medicaid, nursing Medicaid, other SSI
Age Females Males Females Males Females Males 0–4 0 0 527 532 0 0 5–9 0 0 423 417 0 0
10–14 0 0 330 298 0 0 15–19 0 0 366 287 6 6 20–24 0 0 354 104 10 11 25–29 0 0 349 94 12 14 30–34 0 0 263 112 14 12 35–39 0 0 180 94 10 12 40–44 0 0 141 87 15 15 45–49 0 0 137 68 23 9 50–54 0 0 141 78 25 15 55–59 0 0 174 103 38 25 60–64 0 0 167 108 33 25 65–69 169 98 230 157 43 19 70–74 314 183 258 168 42 18 75–79 621 361 321 171 56 15 80–84 1,152 668 303 180 47 20 85–89 2,110 1,225 292 187 49 29
90+ 3,485 2,024 405 197 97 3
AFDC/TANF Food stamps Public colleges Age Females Males Females Males Females Males 0–4 0 0 11 12 0 0 5–9 0 0 10 10 0 0
10–14 0 0 9 8 0 0 15–19 110 37 7 6 1,240 997 20–24 327 26 7 3 2,105 2,177 25–29 433 21 7 3 0 0 30–34 365 41 6 3 0 0 35–39 202 35 5 2 0 0 40–44 162 29 3 2 0 0 45–49 94 33 4 2 0 0 50–54 75 15 3 2 0 0 55–59 55 33 3 2 0 0 60–64 34 14 3 2 0 0 65–69 12 14 2 1 0 0 70–74 9 5 3 1 0 0 75–79 25 1 2 1 0 0 80–84 3 14 3 1 0 0 85–89 5 4 3 2 0 0
90+ 18 9 2 3 0 0

22
Table A7 continued K–12 education Incarceration Congestible goods Age Females Males Females Males Females Males 0–4 0 0 171 171 1,311 1,311 5–9 6,364 6,366 171 171 1,311 1,311
10–14 5,212 5,202 171 171 1,311 1,311 15–19 4,206 4,504 171 171 1,311 1,311 20–24 44 60 171 171 1,311 1,311 25–29 0 0 171 171 1,311 1,311 30–34 0 0 171 171 1,311 1,311 35–39 0 0 171 171 1,311 1,311 40–44 0 0 171 171 1,311 1,311 45–49 0 0 171 171 1,311 1,311 50–54 0 0 171 171 1,311 1,311 55–59 0 0 171 171 1,311 1,311 60–64 0 0 171 171 1,311 1,311 65–69 0 0 171 171 1,311 1,311 70–74 0 0 171 171 1,311 1,311 75–79 0 0 171 171 1,311 1,311 80–84 0 0 171 171 1,311 1,311 85–89 0 0 171 171 1,311 1,311
90+ 0 0 171 171 1,311 1,311

23
Table A8. Age profiles of state and local taxes in 1999 dollars per capita State income taxes Property tax home Property tax rent
Age Females Males Females Males Females Males 0–4 0 0 0 0 0 0 5–9 0 0 0 0 0 0
10–14 0 0 0 0 0 0 15–19 28 34 8 5 38 19 20–24 295 314 63 44 258 191 25–29 720 789 249 211 306 277 30–34 915 1,002 415 406 258 229 35–39 1,116 1,174 558 537 210 182 40–44 1,290 1,381 636 621 182 153 45–49 1,360 1,563 752 729 153 134 50–54 1,197 1,520 750 751 134 124 55–59 1,096 1,346 742 729 124 105 60–64 694 1,019 693 701 124 96 65–69 394 574 690 684 134 96 70–74 307 461 665 678 153 86 75–79 237 391 700 688 182 96 80–84 183 331 593 622 229 124 85–89 157 212 555 626 258 143
90+ 186 465 451 599 249 201
Sales taxes Other state taxes Age Females Males Females Males 0–4 862 905 1,360 1,360 5–9 818 860 1,360 1,360
10–14 795 831 1,360 1,360 15–19 739 756 1,360 1,360 20–24 817 783 1,360 1,360 25–29 912 880 1,360 1,360 30–34 1,016 991 1,360 1,360 35–39 956 921 1,360 1,360 40–44 854 817 1,360 1,360 45–49 693 655 1,360 1,360 50–54 563 526 1,360 1,360 55–59 497 460 1,360 1,360 60–64 505 445 1,360 1,360 65–69 497 415 1,360 1,360 70–74 421 332 1,360 1,360 75–79 319 215 1,360 1,360 80–84 216 125 1,360 1,360 85–89 105 52 1,360 1,360
90+ 48 17 1,360 1,360

24
Table A9. The U.S. population by age and sex in 1999
Age Females Males 0–4 9,276,077 9,705,092 5–9 9,745,302 10,213,378
10–14 9,459,206 9,930,103 15–19 9,555,002 10,111,143 20–24 8,758,035 9,082,300 25–29 9,246,197 9,151,103 30–34 10,046,706 9,868,111 35–39 11,346,399 11,235,369 40–44 11,145,546 10,949,704 45–49 9,724,383 9,366,618 50–54 8,272,386 7,833,211 55–59 6,594,295 6,091,236 60–64 5,494,715 4,920,675 65–69 5,143,117 4,357,161 70–74 4,930,484 3,861,296 75–79 4,245,787 3,028,673 80–84 2,988,372 1,792,008 85–89 1,768,727 830,784
90+ 1,089,232 341,367 Total 271,499,300
Notes: Data are from the Human Mortality Database (2006).

25
Appendix B:
Data for 2004 derived from NIPA and NTA databases

26
Table B1. Federal spending by program during 2004 in millions of dollars Federal Expenditures 2004 total in
millions of $ 1 Consumption and Gross investment (primarily national defense) 827.6 2 OASDI 485.9 3 Medicare 303.3 4 Unemployment insurance 36.4 5 Railroad retirement 34.3 6 Workers' compensation 2.5 7 Veterans benefits 32.1 8 Food stamp benefits 25.8 9 Supplemental security income 32.1 10 Earned income credit 41.9 11 Education 36.5 12 Medicaid (total) 177.6 13 Institutionalized (35%) 62.2 14 Other 115.4 15 State Child Health Insurance Program (SCHIP) 4.7 16 Other medical transfers 5.4 17 WIC and CSFP 4.9 18 Child nutrition 11.2 19 Family support and TANF 21.5 20 Home energy assistance 1.9 21 Child care and development block grants, Foster care and
adoption, Child care entitlement 11.2
22 Housing assistance 27.8 23 Other grants-in-aid to states 45.6 24 Transfers to the rest of the world 28.9 25 Interest payments, domestic 131.7 26 Interest payments, rest of the world 89.7 27 Other federal expenditures (including capital transactions) 31.6 TOTAL FEDERAL EXPENDITURES 2,452.1 Addendum: Federal expenditures net of grants-in-aid to state
and local governments 2,103.8
Federal net lending or net borrowing (–) –452.6 Notes: Data are for calendar-year 2004 and derived from NIPA. Italicized data are grants-in-aid to states.

27
Table B2. Federal taxes by program during 2004 in millions of dollars Federal Receipts 2004 total in
millions of $ 1 Personal income taxes 801.8 2 Excise taxes 94.0 3 Corporate income taxes 217.4 4 OASDI payroll taxes 568.5 5 Medicare part A (HI) 151.9 6 Medicare part B (SMI) 31.2 7 Unemployment insurance 40.2 8 Workers' compensation 2.5 9 Taxes from the rest of the world 9.2 10 Other federal taxes 82.7 TOTAL FEDERAL RECEIPTS 1,999.4 Notes: Data are for calendar-year 2004 and derived from NIPA.

28
Table B3. State and local spending by program during 2004 in millions of dollars State and Local Expenditures 2004 total in
millions of $ 1 Consumption and Gross investment (not including education) 812.2 2 Elementary and secondary education 472.2 3 Higher education 103.9 4 Benefits from government social insurance (Workers' comp and
Temporary disability) 15.7
5 Medicaid (total) 289.2 6 Institutionalized (35%) 101.2 7 Other 188.0 8 State Child Health Insurance Program (SCHIP) 2.0 9 Other medical transfers 8.5 10 Family support and TANF 18.5 11 Supplemental security income 5.2 12 Energy assistance 2.2 13 Other family assistance (WIC, foster care, adoption assistance) 14.8 14 Education (scholarships, stipends, etc.) 16.8 15 Interest payments 88.9 16 Other state and local expenditures (including capital
transactions) –115.5
TOTAL STATE AND LOCAL EXPENDITURES 1,734.6 Notes: Data are for calendar-year 2004 and derived from NIPA. Italicized data are grants-in-aid to states.
Table B4. State and local taxes by program during 2004 in millions of dollars State and Local Receipts 2004 total in
millions of $ 1 Personal income taxes 224.0 2 Property taxes 328.7 3 Sales taxes 370.4 4 Corporate income taxes 41.5 5 Contributions for government social insurance (Workers' comp
and Temporary disability) 19.7
6 Income receipts on assets 77.1 7 Federal grants-in-aid 348.3 8 Other receipts 223.9 TOTAL STATE AND LOCAL RECEIPTS 1,633.6 Notes: Data are for calendar-year 2004 and derived from NIPA.

29
Table B5. Age profiles of federal spending in 2004 dollars per capita
Table B6. Age profiles of federal taxes in 2004 dollars per capita
Table B7. Age profiles of state and local spending in 2004 dollars per capita
Table B8. Age profiles of state and local taxes in 2004 dollars per capita

Table B5. Age profiles of federal spending in 2004 dollars per capita
Age
Consumption and Gross investment (primarily national defense) OASDI Medicare
Unemployment insurance
Railroad retirement
Workers' compensation
Veterans benefits
Food stamp benefits
Supplemental security income
0 2,818 0 0 0 0 0 0 216 01 2,818 0 0 0 0 0 0 210 02 2,818 0 0 0 0 0 0 205 03 2,818 0 0 0 0 0 0 200 04 2,818 0 0 0 0 0 0 194 05 2,818 0 0 0 0 0 0 189 06 2,818 0 0 0 0 0 0 181 07 2,818 0 0 0 0 0 0 173 08 2,818 0 0 0 0 0 0 165 09 2,818 0 0 0 0 0 0 157 0
10 2,818 0 0 0 0 0 0 149 011 2,818 46 0 0 0 0 0 143 012 2,818 93 0 0 0 0 0 136 013 2,818 139 0 0 0 0 0 130 014 2,818 186 0 0 0 0 0 124 015 2,818 232 0 0 0 0 5 117 416 2,818 196 0 0 0 0 1 114 1417 2,818 160 0 3 0 0 3 111 4918 2,818 124 0 6 0 0 3 108 719 2,818 88 105 22 0 1 4 105 1620 2,818 52 105 46 0 3 3 102 821 2,818 62 105 68 0 1 6 102 2322 2,818 72 105 108 0 2 5 101 1123 2,818 81 105 126 0 3 11 101 2024 2,818 91 105 149 0 1 13 101 925 2,818 101 105 165 0 4 9 100 1526 2,818 112 105 223 6 8 16 98 427 2,818 124 105 162 0 4 12 95 5128 2,818 136 105 161 0 6 22 93 2929 2,818 148 105 184 3 9 21 90 5430 2,818 159 105 189 2 10 18 88 8731 2,818 175 105 245 2 13 22 84 5332 2,818 190 105 205 0 8 19 81 2533 2,818 205 105 186 4 13 5 78 3234 2,818 220 105 199 0 11 21 75 2435 2,818 236 105 229 1 8 40 72 6036 2,818 245 105 203 5 11 49 69 6937 2,818 253 105 206 7 15 30 66 5038 2,818 262 105 207 3 15 51 64 3939 2,818 271 105 254 0 18 39 61 1440 2,818 280 105 253 2 15 48 59 7941 2,818 289 105 251 4 9 83 57 11642 2,818 299 105 219 5 16 76 55 8043 2,818 308 105 227 8 19 54 54 3044 2,818 317 105 231 22 21 74 52 8245 2,818 327 293 214 2 24 133 50 2846 2,818 352 293 219 10 20 124 50 10247 2,818 377 293 265 12 17 152 50 9048 2,818 401 293 236 21 18 148 50 4149 2,818 426 293 268 25 15 148 50 7050 2,818 451 293 250 50 12 219 50 12051 2,818 501 293 258 69 15 297 50 17152 2,818 551 293 198 120 25 286 50 14053 2,818 600 293 195 126 14 270 50 15154 2,818 650 293 207 181 22 301 50 11455 2,818 700 733 182 262 20 229 50 12156 2,818 1,196 733 176 210 22 351 50 18957 2,818 1,693 733 285 292 20 204 49 17258 2,818 2,189 733 197 417 20 120 49 14459 2,818 2,685 733 158 417 15 248 48 28360 2,818 3,181 733 197 557 15 178 48 20561 2,818 4,244 733 135 618 22 287 45 25462 2,818 5,306 733 322 467 20 169 43 25763 2,818 6,369 733 216 763 18 248 41 25964 2,818 7,431 733 121 735 15 374 38 22065 2,818 8,493 5,457 52 678 11 365 36 27166 2,818 8,679 5,457 40 641 4 420 36 23467 2,818 8,865 5,457 64 696 8 355 36 31168 2,818 9,051 5,457 38 618 6 461 36 36469 2,818 9,237 5,457 53 673 6 316 36 25070 2,818 9,423 5,457 22 726 7 242 37 34671 2,818 9,601 5,457 24 750 4 326 36 42072 2,818 9,779 5,457 51 580 10 243 36 42573 2,818 9,957 5,457 32 455 0 370 35 31574 2,818 10,135 5,457 5 510 4 299 35 40875 2,818 10,313 8,434 21 466 6 434 34 54576 2,818 10,308 8,434 23 486 0 430 35 54777 2,818 10,303 8,434 15 538 3 457 35 65778 2,818 10,297 8,434 5 424 6 453 36 58079 2,818 10,292 8,434 15 434 1 682 37 62780 2,818 10,287 8,434 2 339 3 609 38 44981 2,818 10,225 8,434 38 346 0 468 39 44882 2,818 10,163 8,434 17 280 4 309 40 78483 2,818 10,102 8,434 0 400 0 416 40 82384 2,818 10,040 8,434 5 418 0 425 41 80785 2,818 9,978 9,856 0 282 0 255 42 61486 2,818 9,733 9,856 0 405 0 209 43 66787 2,818 9,487 9,856 14 267 0 207 43 65388 2,818 9,242 9,856 0 226 0 217 43 56589 2,818 8,997 9,856 0 253 0 151 44 28590 2,818 8,751 9,856 0 284 0 122 44 683

Table B5. Age profiles of federal spending in 2004 dollars per capita
AgeEarned income credit Education
Medicaid: Institutionalized (35%)
Medicaid: Other
State Child Health Insurance Program (SCHIP)
Other medical transfers
WIC and CSFP Child nutrition
Family support and TANF
0 154 0 0 272 61 5 19 0 01 156 0 0 272 61 5 22 40 02 170 0 0 272 61 5 23 79 03 162 0 0 272 61 5 23 119 04 168 0 0 272 61 5 22 158 05 172 470 0 272 61 5 23 198 06 186 549 0 272 61 5 26 206 07 206 554 0 272 61 5 27 214 08 206 556 0 272 61 5 27 222 09 201 557 0 272 61 5 28 230 0
10 212 557 0 272 61 5 28 238 011 217 558 0 272 61 5 27 214 1312 215 558 0 272 61 5 28 189 2613 214 557 0 272 61 5 27 165 4014 221 556 0 272 61 5 28 140 5315 222 552 0 272 61 5 26 116 6616 235 539 0 272 61 5 24 93 8817 226 512 0 272 61 5 21 70 11118 217 318 0 272 61 5 21 46 13319 199 246 0 284 0 7 21 23 15620 207 211 0 284 0 7 23 0 17821 210 184 0 284 0 7 22 0 18522 219 148 0 284 0 7 20 0 19223 252 111 0 284 0 7 28 0 19924 245 92 0 284 0 7 27 0 20525 250 76 0 284 0 7 25 0 21226 224 67 0 284 0 7 23 0 20527 231 59 0 284 0 7 24 0 19928 228 54 0 284 0 7 22 0 19229 230 48 0 284 0 7 20 0 18530 224 43 0 284 0 7 20 0 17831 211 40 0 284 0 7 21 0 16932 194 37 0 284 0 7 22 0 16033 204 33 0 284 0 7 20 0 15134 206 32 0 284 0 7 20 0 14235 187 29 0 284 0 7 18 0 13336 177 0 0 284 0 7 16 0 12637 170 0 0 284 0 7 15 0 11938 163 0 0 284 0 7 14 0 11139 169 0 0 284 0 7 16 0 10440 156 0 0 284 0 7 16 0 9741 153 0 0 284 0 7 13 0 8942 133 0 0 284 0 7 14 0 8243 121 0 0 284 0 7 12 0 7444 128 0 0 284 0 7 13 0 6745 118 0 0 281 0 8 11 0 5946 103 0 0 281 0 8 11 0 5647 96 0 0 281 0 8 9 0 5348 85 0 0 281 0 8 11 0 5049 78 0 0 281 0 8 9 0 4750 73 0 0 281 0 8 8 0 4451 69 0 0 281 0 8 9 0 4452 65 0 0 281 0 8 9 0 4353 61 0 0 281 0 8 8 0 4354 56 0 0 281 0 8 9 0 4255 50 0 0 420 0 16 8 0 4256 54 0 0 420 0 16 8 0 3857 47 0 0 420 0 16 7 0 3458 40 0 0 420 0 16 12 0 3059 44 0 0 420 0 16 11 0 2760 38 0 0 420 0 16 13 0 2361 37 0 0 420 0 16 11 0 2062 43 0 0 420 0 16 8 0 1863 37 0 0 420 0 16 9 0 1564 41 0 0 420 0 16 8 0 1365 38 0 286 497 0 67 7 0 1066 30 0 348 497 0 67 11 0 967 27 0 296 497 0 67 6 0 968 24 0 386 497 0 67 7 0 869 23 0 447 497 0 67 7 0 770 21 0 473 497 0 67 5 0 771 24 0 500 497 0 67 6 0 772 23 0 584 497 0 67 7 0 773 19 0 657 497 0 67 7 0 674 16 0 734 497 0 67 6 0 675 12 0 1,053 1,094 0 109 6 0 676 13 0 986 1,094 0 109 7 0 777 18 0 1,068 1,094 0 109 6 0 778 14 0 1,302 1,094 0 109 6 0 779 10 0 1,598 1,094 0 109 5 0 780 15 0 1,594 1,094 0 109 4 0 881 13 0 1,908 1,094 0 109 5 0 782 11 0 2,393 1,094 0 109 4 0 783 6 0 2,778 1,094 0 109 3 0 684 7 0 3,250 1,094 0 109 6 0 685 16 0 3,454 3,314 0 167 8 0 686 16 0 4,082 3,314 0 167 3 0 687 10 0 4,494 3,314 0 167 2 0 688 9 0 5,615 3,314 0 167 2 0 789 13 0 5,889 3,314 0 167 2 0 790 10 0 10,040 3,314 0 167 7 0 8

Table B5. Age profiles of federal spending in 2004 dollars per capita
AgeHome energy assistance
Child care and development block grants, Foster care and adoption, Child care entitlement
Housing assistance
Other grants-in-aid to states
Transfers to the rest of the world
Interest payments, domestic
Other federal expenditures (including capital transactions)
TOTAL FEDERAL EXPENDITURES
Addendum: Federal expenditures net of grants-in-aid to state and local government
0 3 44 75 155 98 0 108 4,028 3,3941 4 50 75 155 98 0 108 4,075 3,3912 3 53 75 155 98 0 108 4,126 3,3993 4 53 75 155 98 0 108 4,153 3,3864 3 51 75 155 98 0 108 4,189 3,3865 4 53 75 155 98 0 108 4,701 3,3856 4 59 75 155 98 0 108 4,803 3,3917 5 61 75 155 98 0 108 4,832 3,4048 6 61 75 155 98 0 108 4,835 3,3969 6 64 75 155 98 0 108 4,835 3,383
10 7 65 75 155 98 0 108 4,849 3,38511 5 62 75 155 98 0 108 4,877 3,43012 6 63 75 155 98 0 108 4,906 3,46913 5 62 75 155 98 0 108 4,931 3,50814 7 64 75 155 98 0 108 4,972 3,55515 6 59 75 155 98 0 108 4,998 3,60516 5 56 82 155 98 0 108 4,966 3,58517 5 48 90 155 98 1 108 4,926 3,57718 4 49 97 155 98 8 108 4,661 3,49819 4 48 105 155 98 8 108 4,621 3,57220 5 53 112 155 98 24 108 4,602 3,57421 8 50 105 155 98 26 108 4,625 3,62722 5 46 97 155 98 49 108 4,649 3,69623 5 63 90 155 98 47 108 4,713 3,77124 7 61 82 155 98 136 108 4,794 3,87425 6 57 75 155 98 118 108 4,786 3,89126 4 53 75 155 98 104 108 4,796 3,92427 5 55 75 155 98 132 108 4,803 3,94128 6 50 75 155 98 183 108 4,830 3,98629 5 45 75 155 98 214 108 4,905 4,08230 7 47 75 155 98 201 108 4,922 4,10731 6 48 75 155 98 235 108 4,972 4,16932 6 50 75 155 98 218 108 4,865 4,07033 7 45 75 155 98 343 108 4,977 4,20034 6 45 75 155 98 287 108 4,939 4,17435 6 42 75 155 98 333 108 5,043 4,29536 5 36 75 155 98 379 108 5,039 4,33737 4 35 75 155 98 417 108 5,038 4,34538 4 32 75 155 98 409 108 5,024 4,34239 5 37 75 155 98 396 108 5,034 4,35140 9 36 75 155 98 475 108 5,173 4,49541 5 31 67 155 98 474 108 5,217 4,56542 6 31 60 155 98 482 108 5,131 4,49443 5 27 52 155 98 558 108 5,125 4,50844 6 30 45 155 98 459 108 5,122 4,51745 5 26 37 155 98 559 108 5,357 4,77346 5 24 37 155 98 620 108 5,495 4,91647 7 21 37 155 98 616 108 5,564 4,99148 4 25 37 155 98 637 108 5,527 4,95549 5 21 37 155 98 584 108 5,547 4,98250 7 18 37 155 98 875 108 5,976 5,41751 4 20 45 155 98 656 108 5,969 5,40252 5 20 52 155 98 839 108 6,164 5,59053 5 18 60 155 98 679 108 6,041 5,46454 5 20 67 155 98 792 108 6,279 5,69055 6 17 75 155 98 995 108 7,104 6,36556 5 17 82 155 98 973 108 7,719 6,97857 6 16 90 155 98 1,066 108 8,328 7,58558 7 28 97 155 98 968 108 8,665 7,90059 9 24 105 155 98 1,208 108 9,631 8,86560 7 30 112 155 98 1,013 108 9,965 9,18961 7 25 119 155 98 858 108 11,031 10,25862 7 18 127 155 98 880 108 12,032 11,26463 9 20 134 155 98 948 108 13,433 12,65564 10 17 142 155 98 879 108 14,392 13,61265 8 16 149 155 98 1,215 108 20,835 19,64066 6 26 157 155 98 1,121 108 20,965 19,68867 9 13 164 155 98 1,317 108 21,375 20,16068 6 15 172 155 98 1,395 108 21,787 20,47569 6 15 179 155 98 1,259 108 21,716 20,33570 11 11 187 155 98 1,242 108 21,958 20,54671 12 14 202 155 98 1,165 108 22,290 20,83272 17 16 217 155 98 1,020 108 22,214 20,64973 16 15 231 155 98 1,246 108 22,559 20,90974 12 13 246 155 98 1,267 108 22,896 21,16075 8 13 261 155 98 1,263 108 27,258 24,55276 7 15 261 155 98 1,247 108 27,190 24,54877 12 13 261 155 98 1,246 108 27,457 24,73078 15 14 261 155 98 1,206 108 27,444 24,48079 17 12 261 155 98 1,227 108 28,041 24,78280 11 10 261 155 98 1,241 108 27,688 24,44181 17 12 276 155 98 1,621 108 28,241 24,65782 15 9 291 155 98 1,465 108 28,608 24,53183 14 6 306 155 98 1,184 108 28,902 24,43084 15 14 321 155 98 1,375 108 29,548 24,57785 11 18 336 155 98 1,154 108 32,691 25,22286 20 7 329 155 98 1,334 108 33,370 25,28687 12 5 321 155 98 1,252 108 33,291 24,81588 19 5 314 155 98 1,649 108 34,431 24,83389 16 5 306 155 98 1,153 108 33,637 23,77590 49 15 299 155 98 1,272 108 38,102 24,048

Table B6. Age profiles of federal taxes in 2004 dollars per capita
AgePersonal income taxes Excise taxes
Corporate income taxes
OASDI payroll taxes
Medicare part A (HI)
Medicare part B (SMI)
Unemployment insurance
Workers' compensation
Taxes from the rest of the world
Other federal taxes
TOTAL FEDERAL RECEIPTS
0 0 88 0 0 0 0 0 0 31 282 4011 0 114 0 0 0 0 0 0 31 282 4272 0 117 0 0 0 0 0 0 31 282 4303 0 119 0 0 0 0 0 0 31 282 4324 0 123 0 0 0 0 0 0 31 282 4365 0 132 0 0 0 0 0 0 31 282 4456 0 143 0 0 0 0 0 0 31 282 4567 0 153 0 0 0 0 0 0 31 282 4668 0 160 0 0 0 0 0 0 31 282 4739 0 174 0 0 0 0 0 0 31 282 487
10 0 176 0 0 0 0 0 0 31 282 48811 0 193 0 0 0 0 19 1 31 282 52612 0 200 0 0 0 0 37 2 31 282 55213 0 215 0 0 0 0 56 3 31 282 58714 0 217 0 0 0 0 74 5 31 282 60915 30 231 86 36 10 2 93 6 31 282 80516 65 249 75 116 31 6 112 7 31 282 97417 105 261 104 216 58 12 132 8 31 282 1,20918 208 264 72 437 117 24 152 9 31 282 1,59519 449 249 67 791 211 43 171 11 31 282 2,30520 641 265 110 1,019 272 56 191 12 31 282 2,87821 805 271 107 1,198 320 66 196 12 31 282 3,28722 935 278 124 1,425 381 78 201 12 31 282 3,74723 1,308 307 127 1,759 470 97 206 13 31 282 4,59824 1,715 320 195 1,977 528 108 211 13 31 282 5,38125 2,177 335 236 2,362 631 130 216 13 31 282 6,41426 2,531 341 201 2,653 709 146 217 14 31 282 7,12327 2,741 363 249 2,780 743 153 218 14 31 282 7,57328 2,954 357 279 2,967 793 163 219 14 31 282 8,05829 3,133 371 289 3,051 815 167 221 14 31 282 8,37430 3,439 376 315 3,125 835 172 222 14 31 282 8,81031 3,609 365 387 3,284 877 180 222 14 31 282 9,25232 4,068 378 380 3,438 919 189 223 14 31 282 9,92133 3,832 370 400 3,312 885 182 223 14 31 282 9,53134 3,636 364 435 3,338 892 183 224 14 31 282 9,39935 4,111 340 560 3,494 934 192 225 14 31 282 10,18336 4,081 353 579 3,392 906 186 225 14 31 282 10,05037 4,236 358 642 3,522 941 193 226 14 31 282 10,44438 4,516 360 652 3,577 956 196 227 14 31 282 10,81139 4,411 349 708 3,527 943 194 228 14 31 282 10,68740 4,584 372 688 3,635 971 199 229 14 31 282 11,00641 4,900 383 674 3,689 986 202 228 14 31 282 11,39042 4,616 357 737 3,694 987 203 228 14 31 282 11,14943 4,961 370 753 3,752 1,002 206 227 14 31 282 11,59844 4,839 363 786 3,707 991 203 226 14 31 282 11,44345 5,024 370 863 3,682 984 202 226 14 31 282 11,67646 5,517 386 1,068 3,781 1,010 208 223 14 31 282 12,52047 5,625 391 1,076 3,763 1,005 207 220 14 31 282 12,61448 5,821 408 959 3,872 1,035 213 218 14 31 282 12,85149 5,631 419 919 3,714 992 204 215 13 31 282 12,42050 6,143 415 1,296 3,758 1,004 206 212 13 31 282 13,36051 6,311 438 1,137 3,856 1,030 212 206 13 31 282 13,51452 6,109 438 1,304 3,723 995 204 200 12 31 282 13,29853 5,751 455 1,165 3,666 979 201 194 12 31 282 12,73654 5,954 429 1,406 3,562 952 195 188 12 31 282 13,01255 5,989 438 1,368 3,371 901 185 182 11 31 282 12,75956 5,890 415 1,595 3,245 867 178 171 11 31 282 12,68457 5,980 421 1,676 3,186 851 175 159 10 31 282 12,77158 4,999 453 1,537 2,821 754 155 147 9 31 282 11,18859 4,945 446 1,807 2,790 745 153 135 8 31 282 11,34260 4,368 390 1,705 2,706 723 149 123 8 31 282 10,48661 4,238 436 1,666 2,462 658 135 111 7 31 282 10,02462 3,853 395 1,589 2,150 575 118 98 6 31 282 9,09663 3,739 380 1,753 1,830 489 100 85 5 31 282 8,69464 3,224 407 1,642 1,500 401 82 72 4 31 282 7,64665 2,911 374 2,174 1,163 311 64 59 4 31 282 7,37166 2,723 410 1,916 990 264 54 54 3 31 282 6,72767 2,955 406 2,285 922 246 51 48 3 31 282 7,23068 2,625 397 2,421 711 190 39 43 3 31 282 6,74269 2,397 407 2,210 633 169 35 38 2 31 282 6,20470 2,281 382 2,226 681 182 37 32 2 31 282 6,13671 1,668 383 2,048 491 131 27 30 2 31 282 5,09472 1,601 385 1,966 437 117 24 27 2 31 282 4,87173 1,852 379 2,081 469 125 26 25 2 31 282 5,27174 1,560 362 2,169 355 95 19 22 1 31 282 4,89675 1,465 357 2,071 311 83 17 20 1 31 282 4,63876 1,422 359 2,041 226 60 12 18 1 31 282 4,45377 1,170 378 2,053 236 63 13 16 1 31 282 4,24378 1,366 345 2,205 210 56 12 15 1 31 282 4,52279 1,335 368 2,035 196 52 11 13 1 31 282 4,32380 1,138 336 2,080 157 42 9 11 1 31 282 4,08681 1,657 362 2,328 209 56 11 10 1 31 282 4,94682 1,357 323 2,503 165 44 9 8 1 31 282 4,72183 1,058 326 1,867 167 45 9 7 0 31 282 3,79284 1,092 463 1,881 147 39 8 6 0 31 282 3,95085 710 328 1,938 63 17 3 4 0 31 282 3,37586 1,251 353 2,215 65 17 4 6 0 31 282 4,22687 752 365 1,874 68 18 4 8 1 31 282 3,40288 1,474 307 2,433 101 27 6 10 1 31 282 4,67189 805 302 1,826 136 36 7 12 1 31 282 3,43990 811 323 1,794 92 25 5 14 1 31 282 3,376

Table B7. Age profiles of state and local spending in 2004 dollars per capita
Age
Consumption and Gross investment (not including education)
Elementary and secondary education
Higher education
Benefits from government social insurance (Workers' comp and Temporary disability)
Medicaid: Institutionalized (35%)
Medicaid: Other
State Child Health Insurance Program (SCHIP)
Other medical transfers
0 2,766 0 0 0 0 443 26 81 2,766 0 0 0 0 443 26 82 2,766 0 0 0 0 443 26 83 2,766 0 0 0 0 443 26 84 2,766 0 0 0 0 443 26 85 2,766 7,334 0 0 0 443 26 86 2,766 8,562 0 0 0 443 26 87 2,766 8,640 0 0 0 443 26 88 2,766 8,662 0 0 0 443 26 89 2,766 8,679 0 0 0 443 26 8
10 2,766 8,691 0 0 0 443 26 811 2,766 8,701 0 0 0 443 26 812 2,766 8,693 0 0 0 443 26 813 2,766 8,686 0 0 0 443 26 814 2,766 8,673 0 0 0 443 26 815 2,766 8,606 0 0 0 443 26 816 2,766 8,402 0 0 0 443 26 817 2,766 7,979 0 1 0 443 26 818 2,766 4,963 0 2 0 443 26 819 2,766 0 4,123 6 0 462 0 1020 2,766 0 3,537 21 0 462 0 1021 2,766 0 3,084 5 0 462 0 1022 2,766 0 2,469 12 0 462 0 1023 2,766 0 1,864 19 0 462 0 1024 2,766 0 1,534 9 0 462 0 1025 2,766 0 1,278 22 0 462 0 1026 2,766 0 1,116 49 0 462 0 1027 2,766 0 989 25 0 462 0 1028 2,766 0 901 35 0 462 0 1029 2,766 0 805 58 0 462 0 1030 2,766 0 720 63 0 462 0 1031 2,766 0 669 79 0 462 0 1032 2,766 0 624 48 0 462 0 1033 2,766 0 560 81 0 462 0 1034 2,766 0 533 71 0 462 0 1035 2,766 0 492 52 0 462 0 1036 2,766 0 0 70 0 462 0 1037 2,766 0 0 97 0 462 0 1038 2,766 0 0 92 0 462 0 1039 2,766 0 0 113 0 462 0 1040 2,766 0 0 96 0 462 0 1041 2,766 0 0 54 0 462 0 1042 2,766 0 0 101 0 462 0 1043 2,766 0 0 122 0 462 0 1044 2,766 0 0 132 0 462 0 1045 2,766 0 0 151 0 458 0 1346 2,766 0 0 123 0 458 0 1347 2,766 0 0 106 0 458 0 1348 2,766 0 0 111 0 458 0 1349 2,766 0 0 97 0 458 0 1350 2,766 0 0 73 0 458 0 1351 2,766 0 0 95 0 458 0 1352 2,766 0 0 154 0 458 0 1353 2,766 0 0 88 0 458 0 1354 2,766 0 0 137 0 458 0 1355 2,766 0 0 124 0 683 0 2556 2,766 0 0 136 0 683 0 2557 2,766 0 0 124 0 683 0 2558 2,766 0 0 126 0 683 0 2559 2,766 0 0 95 0 683 0 2560 2,766 0 0 93 0 683 0 2561 2,766 0 0 137 0 683 0 2562 2,766 0 0 123 0 683 0 2563 2,766 0 0 112 0 683 0 2564 2,766 0 0 96 0 683 0 2565 2,766 0 0 72 466 809 0 10566 2,766 0 0 27 567 809 0 10567 2,766 0 0 49 482 809 0 10568 2,766 0 0 41 629 809 0 10569 2,766 0 0 37 729 809 0 10570 2,766 0 0 45 770 809 0 10571 2,766 0 0 24 815 809 0 10572 2,766 0 0 64 951 809 0 10573 2,766 0 0 2 1,070 809 0 10574 2,766 0 0 27 1,196 809 0 10575 2,766 0 0 38 1,714 1,782 0 17376 2,766 0 0 3 1,606 1,782 0 17377 2,766 0 0 19 1,739 1,782 0 17378 2,766 0 0 36 2,120 1,782 0 17379 2,766 0 0 6 2,601 1,782 0 17380 2,766 0 0 19 2,596 1,782 0 17381 2,766 0 0 2 3,106 1,782 0 17382 2,766 0 0 28 3,896 1,782 0 17383 2,766 0 0 3 4,523 1,782 0 17384 2,766 0 0 2 5,292 1,782 0 17385 2,766 0 0 0 5,624 5,397 0 26486 2,766 0 0 0 6,647 5,397 0 26487 2,766 0 0 0 7,317 5,397 0 26488 2,766 0 0 0 9,143 5,397 0 26489 2,766 0 0 0 9,590 5,397 0 26490 2,766 0 0 3 16,348 5,397 0 264

Table B7. Age profiles of state and local spending in 2004 dollars per capita
Age
Family support and TANF
Supplemental security income
Energy assistance
Other family assistance (WIC, foster care, adoption assistance)
Education (scholarships, stipends, etc.)
Interest payments
Other state and local expenditures (including capital transactions)
TOTAL STATE AND LOCAL EXPENDITURES
0 0 0 4 58 0 0 -393 2,9111 0 0 5 66 0 0 -393 2,9202 0 0 4 70 0 0 -393 2,9233 0 0 4 70 0 0 -393 2,9244 0 0 4 68 0 0 -393 2,9215 0 0 5 70 0 0 -393 10,2586 0 0 5 78 0 0 -393 11,4947 0 0 6 80 0 0 -393 11,5758 0 0 7 81 0 0 -393 11,5999 0 0 7 85 0 0 -393 11,620
10 0 0 8 86 0 0 -393 11,63311 11 0 6 81 0 0 -393 11,65012 23 0 7 83 0 0 -393 11,65513 34 0 6 82 0 0 -393 11,65714 45 0 8 85 0 0 -393 11,66115 57 1 6 78 5 0 -393 11,60216 76 2 6 74 6 0 -393 11,41517 96 8 5 64 12 0 -393 11,01418 115 1 5 64 184 6 -393 8,19019 134 3 5 63 460 5 -393 7,64320 154 1 5 70 408 17 -393 7,05821 159 4 9 66 384 17 -393 6,57322 165 2 6 60 344 33 -393 5,93623 171 3 6 84 289 32 -393 5,31324 177 1 9 81 257 92 -393 5,00525 182 2 6 75 224 80 -393 4,71526 177 1 5 70 180 70 -393 4,51227 171 8 6 73 176 89 -393 4,38128 165 5 7 66 115 124 -393 4,26329 159 9 5 59 131 144 -393 4,21630 153 14 8 62 96 136 -393 4,09731 146 9 7 63 81 159 -393 4,05632 138 4 7 66 69 147 -393 3,94833 130 5 8 60 66 232 -393 3,98734 122 4 7 60 57 194 -393 3,89335 114 10 7 55 33 225 -393 3,83336 108 11 5 47 34 256 -393 3,37737 102 8 5 46 33 282 -393 3,41738 96 6 5 43 33 276 -393 3,39539 90 2 6 49 31 267 -393 3,40240 83 13 10 48 24 321 -393 3,43941 77 19 6 41 31 320 -393 3,39242 70 13 6 41 28 326 -393 3,43043 64 5 6 36 28 377 -393 3,48244 57 13 7 39 23 310 -393 3,42745 51 5 6 34 28 378 -393 3,49746 48 16 6 32 23 418 -393 3,51047 46 15 8 28 21 416 -393 3,48348 43 7 4 33 20 430 -393 3,49349 41 11 6 28 20 394 -393 3,44150 38 19 8 24 11 591 -393 3,60851 38 28 5 27 17 443 -393 3,49552 37 23 6 27 7 567 -393 3,66453 37 24 6 23 10 458 -393 3,49054 36 18 6 26 7 535 -393 3,61055 36 20 7 23 12 671 -393 3,97456 33 31 5 23 9 657 -393 3,97357 29 28 7 20 4 720 -393 4,01458 26 23 8 37 6 653 -393 3,96059 23 46 11 32 4 816 -393 4,10760 20 33 8 39 4 684 -393 3,96161 17 41 8 33 9 579 -393 3,90562 15 42 8 24 3 594 -393 3,88963 13 42 10 27 3 640 -393 3,92764 11 36 12 23 2 593 -393 3,85365 9 44 9 21 1 820 -393 4,72866 8 38 7 35 6 757 -393 4,73067 8 50 10 17 0 889 -393 4,79368 7 59 7 20 2 941 -393 4,99269 6 40 7 20 4 850 -393 4,98070 6 56 13 14 2 838 -393 5,03171 6 68 14 18 4 786 -393 5,02072 6 69 19 21 2 688 -393 5,10673 6 51 18 20 3 841 -393 5,29674 5 66 14 17 6 855 -393 5,47375 5 88 9 17 4 852 -393 7,05576 6 89 8 20 7 842 -393 6,90777 6 106 14 17 0 841 -393 7,06978 6 94 18 18 2 814 -393 7,43479 6 102 20 15 0 828 -393 7,90680 7 73 13 13 0 838 -393 7,88581 6 73 19 15 0 1,094 -393 8,64382 6 127 17 12 0 989 -393 9,40283 6 133 16 8 1 799 -393 9,81584 5 131 18 18 0 928 -393 10,72185 5 99 13 24 0 779 -393 14,57786 5 108 23 10 0 900 -393 15,72787 6 106 14 6 1 845 -393 16,32888 6 92 22 7 0 1,113 -393 18,41589 6 46 18 6 0 778 -393 18,47890 7 111 57 20 0 859 -393 25,437

Table B8. Age profiles of state and local taxes in 2004 dollars per capita
AgePersonal income taxes
Property taxes Sales taxes
Corporate income taxes
Contributions for Workers' comp and Temporary disability
Income receipts on assets Other receipts
TOTAL STATE AND LOCAL RECEIPTS
0 0 0 347 0 0 263 762 1,3721 0 0 449 0 0 263 762 1,4742 0 0 460 0 0 263 762 1,4853 0 0 470 0 0 263 762 1,4954 0 0 486 0 0 263 762 1,5115 0 0 520 0 0 263 762 1,5456 0 0 562 0 0 263 762 1,5877 0 0 605 0 0 263 762 1,6308 0 0 631 0 0 263 762 1,6569 0 0 684 0 0 263 762 1,709
10 0 0 692 0 0 263 762 1,71711 0 0 760 0 9 263 762 1,79412 0 0 787 0 18 263 762 1,83013 0 0 846 0 27 263 762 1,89814 0 0 856 0 36 263 762 1,91715 8 10 908 16 45 263 762 2,01316 18 11 982 14 55 263 762 2,10517 29 21 1,030 20 65 263 762 2,19018 58 47 1,039 14 74 263 762 2,25719 125 48 980 13 84 263 762 2,27520 179 50 1,045 21 94 263 762 2,41321 225 68 1,068 20 96 263 762 2,50222 261 135 1,097 24 98 263 762 2,64023 365 212 1,209 24 101 263 762 2,93724 479 258 1,261 37 103 263 762 3,16425 608 389 1,322 45 106 263 762 3,49626 707 423 1,342 38 106 263 762 3,64227 766 661 1,430 48 107 263 762 4,03728 825 692 1,407 53 108 263 762 4,11029 875 902 1,460 55 108 263 762 4,42630 961 857 1,481 60 109 263 762 4,49231 1,008 1,293 1,438 74 109 263 762 4,94732 1,136 1,272 1,488 73 109 263 762 5,10433 1,070 1,288 1,458 76 109 263 762 5,02734 1,016 1,266 1,433 83 110 263 762 4,93235 1,149 1,302 1,341 107 110 263 762 5,03436 1,140 1,480 1,391 111 110 263 762 5,25737 1,183 1,548 1,409 122 111 263 762 5,39938 1,262 1,620 1,417 124 111 263 762 5,56039 1,232 1,642 1,377 135 112 263 762 5,52240 1,281 1,572 1,464 131 112 263 762 5,58641 1,369 1,837 1,509 129 112 263 762 5,98142 1,290 1,807 1,407 141 112 263 762 5,78143 1,386 1,842 1,458 144 111 263 762 5,96644 1,352 1,832 1,431 150 111 263 762 5,90145 1,403 1,778 1,457 165 111 263 762 5,93946 1,541 1,939 1,523 204 109 263 762 6,34147 1,571 1,965 1,540 205 108 263 762 6,41548 1,626 1,872 1,606 183 107 263 762 6,41949 1,573 1,957 1,652 175 105 263 762 6,48750 1,716 2,134 1,635 247 104 263 762 6,86151 1,763 2,142 1,724 217 101 263 762 6,97252 1,707 2,107 1,724 249 98 263 762 6,91053 1,607 2,155 1,795 222 95 263 762 6,89954 1,663 2,264 1,692 268 92 263 762 7,00555 1,673 2,066 1,726 261 89 263 762 6,84156 1,645 2,125 1,637 304 84 263 762 6,82057 1,671 2,155 1,660 320 78 263 762 6,90858 1,397 2,331 1,786 293 72 263 762 6,90459 1,381 2,106 1,756 345 66 263 762 6,68060 1,220 2,101 1,538 326 61 263 762 6,27161 1,184 2,054 1,718 318 54 263 762 6,35362 1,076 1,783 1,555 303 48 263 762 5,79063 1,045 2,147 1,498 335 42 263 762 6,09164 901 1,973 1,604 313 35 263 762 5,85265 813 1,918 1,472 415 29 263 762 5,67266 761 1,930 1,615 366 26 263 762 5,72367 825 2,049 1,599 436 24 263 762 5,95868 733 2,119 1,563 462 21 263 762 5,92469 670 2,061 1,604 422 18 263 762 5,80070 637 2,320 1,504 425 16 263 762 5,92771 466 2,227 1,510 391 15 263 762 5,63472 447 1,987 1,517 375 13 263 762 5,36573 517 2,150 1,495 397 12 263 762 5,59774 436 1,994 1,425 414 11 263 762 5,30475 409 1,799 1,407 395 10 263 762 5,04576 397 1,876 1,413 390 9 263 762 5,11077 327 1,810 1,490 392 8 263 762 5,05278 382 1,845 1,361 421 7 263 762 5,04079 373 2,043 1,452 388 6 263 762 5,28780 318 1,978 1,323 397 6 263 762 5,04681 463 2,019 1,426 444 5 263 762 5,38282 379 1,856 1,271 478 4 263 762 5,01383 296 1,693 1,286 356 3 263 762 4,65984 305 1,734 1,824 359 3 263 762 5,25085 198 2,202 1,292 370 2 263 762 5,08986 350 1,676 1,392 423 3 263 762 4,86987 210 1,862 1,440 358 4 263 762 4,89988 412 1,921 1,208 464 5 263 762 5,03689 225 1,537 1,191 349 6 263 762 4,33290 226 1,277 1,271 342 7 263 762 4,149

30
Table B9. The U.S. population by age in 2004 Age Resident
population, 7/1/2004
Age Resident population, 7/1/2004
Age Resident population, 7/1/2004
0 4,083,318 30 3,792,038 60 2,733,972 1 4,035,127 31 3,888,369 61 2,823,218 2 3,997,730 32 4,078,623 62 2,487,773 3 4,050,167 33 4,310,942 63 2,305,397 4 3,894,330 34 4,397,248 64 2,238,193 5 3,850,829 35 4,155,429 65 2,122,910 6 3,862,186 36 4,082,063 66 2,076,418 7 3,889,386 37 4,094,867 67 1,950,294 8 3,973,341 38 4,213,411 68 1,907,223 9 4,038,294 39 4,504,421 69 1,902,836 10 4,073,140 40 4,576,779 70 1,735,246 11 4,157,816 41 4,563,587 71 1,728,628 12 4,229,227 42 4,578,550 72 1,699,310 13 4,297,151 43 4,626,268 73 1,671,610 14 4,374,117 44 4,709,676 74 1,683,779 15 4,209,535 45 4,519,021 75 1,575,340 16 4,143,443 46 4,521,617 76 1,553,318 17 4,099,068 47 4,469,244 77 1,494,482 18 4,122,868 48 4,295,763 78 1,416,733 19 4,149,391 49 4,315,327 79 1,382,758 20 4,084,046 50 4,129,561 80 1,291,971 21 4,164,902 51 3,994,298 81 1,189,290 22 4,209,940 52 3,861,840 82 1,121,250 23 4,260,985 53 3,761,452 83 1,026,849 24 4,253,516 54 3,748,677 84 935,342 25 4,051,479 55 3,603,756 85 773,813 26 3,934,075 56 3,569,020 86 714,504 27 3,882,852 57 3,743,146 87 603,608 28 3,786,322 58 2,791,355 88 527,142 29 3,900,021 59 2,780,314 89 463,866 90+ 1,784,505 Notes: Data are from the Human Mortality Database (2006).

31
32