Forecast 1 combustion products in the u.s. - acaa-usa.org · PDF fileAmerican Coal Ash...
48
Forecast 1 production and use of coal Market Forecast Through 2033 prepared by: american road & Transportation builders association prepared for: american coal ash association june 2015 combustion products in the u.s.
Transcript of Forecast 1 combustion products in the u.s. - acaa-usa.org · PDF fileAmerican Coal Ash...

Forecast 1 production and use of coal
Market Forecast Through 2033
prepared by: american road & Transportation builders association
prepared for: american coal ash association
june 2015
combustion products in the u.s.

2 THE U.S. COAL COMBUSTION PRODUCTS MARKET
about artbaEstablished in 1902, the American Road & Transportation Builders Association’s (ARTBA) membership includes over 6,000 private and public sector representatives that are involved in the planning, designing, construction and maintenance of the nation’s roadways, waterways, bridges, ports, airports, rail and transit systems.
about the authorThis research was conducted by a team led by Dr. Alison Premo Black, vice president of policy and chief economist for the American Road & Transportation Builders Association in Washington, D.C. Research support was provided by Darwyyn Deyo.
Dr. Black, who earned her PhD in Economics at The George Washington University in the Nation’s Capital, also holds an M.A. in International Economics and Latin American Studies from the Johns Hopkins School of Advanced International Studies. She graduated magna cum laude from Syracuse University, where she was a member of Phi Beta Kappa and the Golden Key Honors Society, with majors in International Relations, Latin American Studies and Spanish. Since joining ARTBA in 2000, Dr. Black has led teams and authored over 75 studies examining state transportation funding and investment patterns and was responsible for the 2011 report “The Economic Impacts of Prohibiting Coal Fly Ash Use in Transportation Infrastructure Construction.”
acknowledgmentsThis study relied on historical data on coal combustion products (CCPs) compiled by the American Coal Ash Association (ACAA), considered the authoritative source for CCP production and use statistics in the U.S. ACAA conducts a voluntary annual survey of the coal-fueled electric utility industry to track quantities of CCPs produced and beneficially used. The annual CCP Production & Use Survey Report has been used by industry and government agencies including the Environmental Protection Agency and the Department of Energy.
This study relied on energy data related to electric generation, projected coal unit retirements, fuel costs, and CCP disposition from the U.S. Energy Information Administration (EIA). The EIA collects, analyzes and disseminates independent and impartial energy information for policymakers and public understanding. The EIA publishes the Annual Energy Outlook and data collected directly from generators on numerous annual survey forms.
The author wishes to thank Dr. Fred Joutz, Professor of Economics and Co-director of the Research Program on Forecasting at The George Washington University and Dr. Anthony M. Yezer, Director of the Center for Economic Research at The George Washington University for their suggestions and input on the modeling methodology and report.
Dr. Joutz has served as a consultant and technical expert to the Energy Information Administration, including work on EIA’s Short-Term Energy Outlook (STEO), Annual Energy Outlook (AEO and NEMS), and International Energy Outlook (IEO). He is a Senior Fellow of the US Association of Energy Economics.
Dr. Yezer has been a Fellow of the Homer Hoyt School of Advanced Studies in Real Estate and Urban Economics since 1991. He has served as an expert witness for the Federal Trade Commission and testified before Congress on issues related to credit market regulation and subprime mortgage lending.

Forecast 3
table of contentsExecutive SummaryCCP Production Forecast Fly Ash Production FGD Materials Production Bottom Ash Production Boiler Slag Production FBC Ash Production Additional Supplies of CCPs CCP Utilization Forecast Fly Ash Utilization FGD Utilization Bottom Ash Utilization Boiler Slag Utilization FBC Ash UtilizationAlternative Production Scenarios for Fly Ash and FGD MaterialMethodology and Sources
5111617192021222528313537383943

4 THE U.S. COAL COMBUSTION PRODUCTS MARKET

Forecast 5
EXECUTIVE SUMMARYCoal combustion products (CCPs), which are byproducts formed during the combustion of coal to produce electricity, have long been considered valuable materials that have numerous applications, including the construction of dams, bridges and highways; building products; man-ufacturing; mining and agricultural uses. Products containing CCPs can be found in nearly every U.S. home, including gypsum wallboard, foundations, roofing shingles and concrete driveways.
Collectively known as “coal ash,” CCPs are a class of materials that have varied chemical and physical characteristics. The use of CCPs in place of mined or manufactured materials yield economic, sustainability and performance benefits. The two most widely-used types of CCPs are fly ash in concrete and flue gas desulfurization (FGD) material in wallboard, accounting for 45 percent and 25 percent of total CCP utilization, respectively.
The production and availability of CCPs is directly tied to the amount of coal-fueled electricity generation. Although coal once accounted for over 50 percent of electricity generated in the U.S., that percentage has been falling in recent years due to coal unit retirements and competition from natural gas. This report was commissioned to evaluate the availability and utilization of CCPs amidst a changing energy landscape, and draws on data and analysis from a companion document that evaluates historical trends in CCP production and use.
This study draws on four decades of CCP production and utilization data, projections for future coal-fueled electricity generation, and analysis of economic factors to forecast future CCP production and use.
A series of ten individual econometric models were created using Box-Jenkins methods to forecast values for the production and utilization for the different categories of CCPs: fly ash, bottom ash, FGD material, boiler slag and fluidized bed combustor (FBC) ash.
The modeling process included model identification and selection, estimating parameters, forecasting and model validation. Each forecast includes upper and lower bounds based on 95 percent confidence levels, to give the reader an idea of alternative production and utilization scenarios, based on trends in the historical data.
CCP production and use data is from the American Coal Ash Association (ACAA). Additional inputs for the models include electric power and coal consumption projections from the U.S. Energy Information Administration (EIA) in the 2014 baseline case of the Annual Energy Outlook.
This study also considered the impact on CCP production of alternative “low growth” and “high growth” scenarios for coal-fueled electricity generation from the EIA.
6 THE U.S. COAL COMBUSTION PRODUCTS MARKET
0.0
0.2
0.4
0.6
0.8
1.0
1.2
1.4
1.6
1.8
2012
2013
2014
2015
2016
2017
2018
2019
2020
2021
2022
2023
2024
2025
2026
2027
2028
2029
2030
2031
2032
2033
trillion kw
h
Figure E-‐1. Coal-‐fueled electric power expected to remain rela9vely steady through 2033
Coal Petroleum Natural Gas Nuclear Power Renewable Sources
Source: EIA Annual Energy Outlook 2014, Reference Case, does not include pumped storage
1The accelerated retirements scenario is derived from the U.S. EIA Annual Energy Outlook 2014, which assumes an additional 110 gigawatts (GW) of coal-fueled generating capacity is retired compared to the reference case. The reference case includes the impacts of environmental regulations including MATS, ELG and CCR rules.
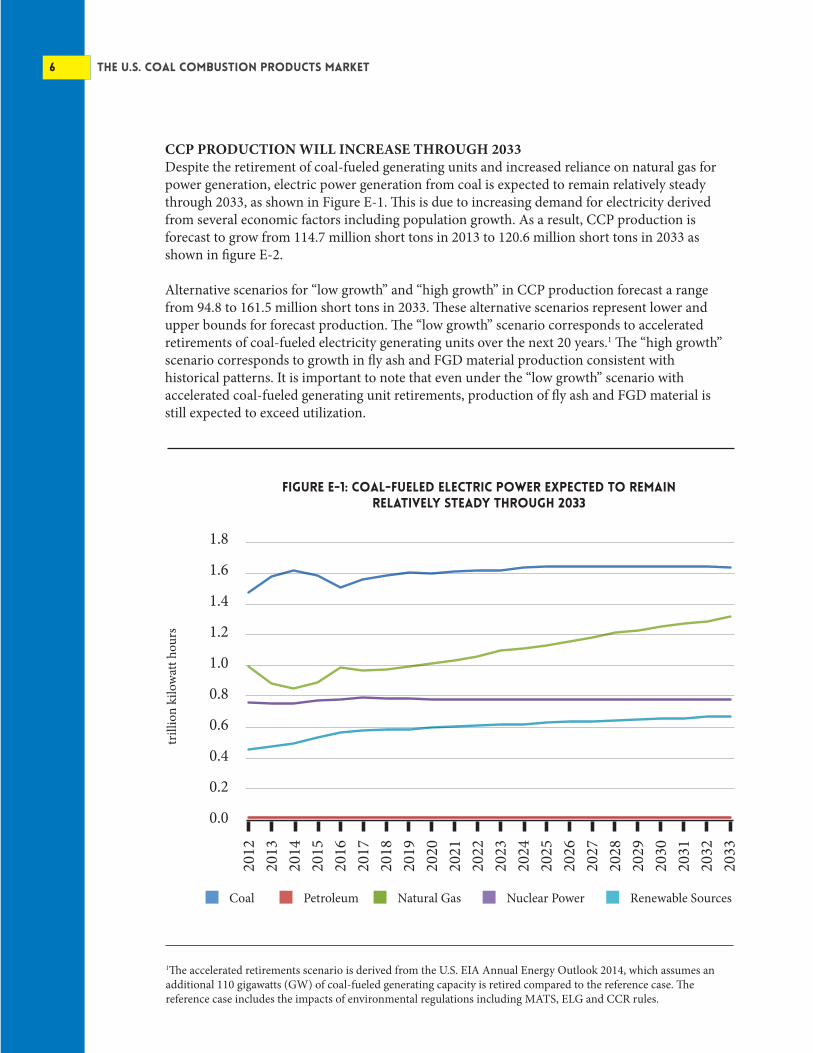
CCP PRODUCTION WILL INCREASE THROUGH 2033Despite the retirement of coal-fueled generating units and increased reliance on natural gas for power generation, electric power generation from coal is expected to remain relatively steady through 2033, as shown in Figure E-1. This is due to increasing demand for electricity derived from several economic factors including population growth. As a result, CCP production is forecast to grow from 114.7 million short tons in 2013 to 120.6 million short tons in 2033 as shown in figure E-2.
Alternative scenarios for “low growth” and “high growth” in CCP production forecast a range from 94.8 to 161.5 million short tons in 2033. These alternative scenarios represent lower and upper bounds for forecast production. The “low growth” scenario corresponds to accelerated retirements of coal-fueled electricity generating units over the next 20 years.1 The “high growth” scenario corresponds to growth in fly ash and FGD material production consistent with historical patterns. It is important to note that even under the “low growth” scenario with accelerated coal-fueled generating unit retirements, production of fly ash and FGD material is still expected to exceed utilization.
Coal Petroleum Natural Gas Nuclear Power Renewable Sources
figure e-1: coal-fueled electric power expected to remain relatively steady through 2033
1.8
1.6
1.4
1.2
1.0
0.8
0.6
0.4
0.2
0.0
2012
2013
2014
2015
2016
2017
2018
2019
2020
2021
2022
2023
2024
2025
2026
2027
2028
2029
2030
2031
2032
2033
trill
ion
kilo
wat
t hou
rs

Forecast 7
Expenditures on emissions control equipment and a shift toward dry CCP handling to comply with environmental regulations, including Mercury and Air Toxics Standards (MATS), Effluent Limitations Guidelines (ELG) and disposal standards for coal combustion residuals (CCR), will likely increase the supply of CCPs.
Fly ash, which represents the largest percentage of CCPs by tonnage, is expected to increase by about two percent over the next 20 years to 54.6 million short tons in 2033. As coal-fueled power plants shift to dry handling of CCPs to comply with regulations, the availability of useable fly ash is expected to increase.
Production of FGD material is expected to increase from 35.2 million short tons in 2013 to 38.8 million short tons in 2033. The exception to forecast growth is boiler slag, which is created in boilers that are typically over 30 years old. As these older vintage units are retired, boiler slag production is forecast to decrease by 43 percent through 2033.
In addition to ongoing production, reclamation of ash from ponds or landfills and beneficiation technologies to mitigate ash quality impacts from emissions control have the potential to provide additional future supply of CCPs.
figure E-2: CCP production is forecasted to grow slightly
160
140
120
100
80
60
40
20
0
Historical Production Forecast 95% Confidence Intervals
mill
ions
of s
hort
tons
1974
1976
1978
1980
1982
1984
1986
1988
1990
1992
1994
1996
1998
2000
2002
2004
2006
2008
2010
2012
2014
2016
2018
2020
2022
2024
2026
2028
2030
2032
150.9
120.6
97.3

8 THE U.S. COAL COMBUSTION PRODUCTS MARKET
200
250
300
350
400
450
500
550
600
2013
2014
2015
2016
2017
2018
2019
2020
2021
2022
2023
2024
2025
2026
2027
2028
2029
2030
2031
2032
2033
mill
ions
of c
ubic
yard
s
Figure E-‐3. Projected demand for ready-‐mixed concrete will help drive CCP u>liza>on
Source: ARTBA projecCon based on historical data from NaConal Ready-‐Mixed Concrete AssociaCon
2The final rule, Disposal of Coal Combustion Residuals from Electric Utilities was published in the Federal Register on April 17, 2015 and uses the terminology coal combustion residuals (CCRs) rather than coal combustion products. The rule does not regulate practices the meet the definition of a beneficial use of CCR. 80 Fed. Reg. 21301.
REGULATORY CERTAINTY AND CONSTRUCTION MARKET DEMAND WILL DRIVE CCP UTILIZATIONNearly two-thirds of CCPs are used in construction-related markets. Projected growth for the U.S. economy, housing starts and rising demand in the ready-mixed concrete market (as shown in Figure E-3) are expected to be major drivers for future CCP utilization. The December 2014 promulgation of a final rule by the U.S. Environmental Protection Agency (EPA) specifically exempting beneficial use of CCPs from regulation has restored regulatory certainty to markets.2
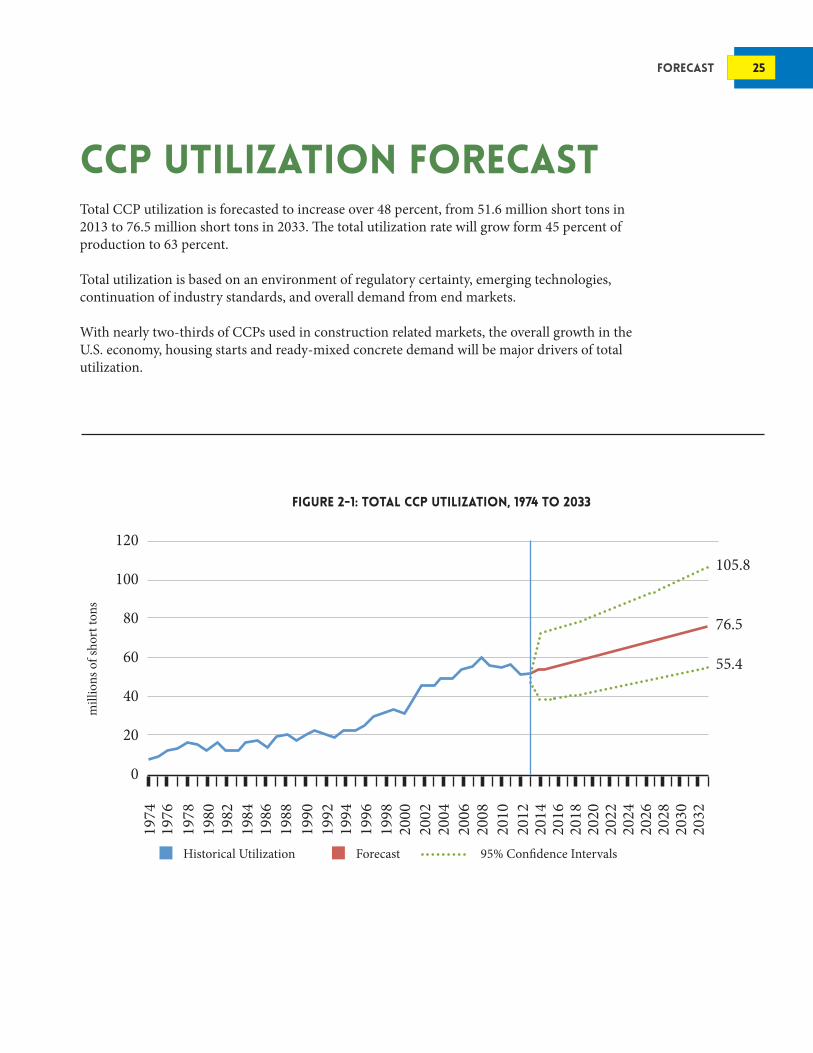
CCP utilization is projected to increase from 51.6 million short tons in 2013 to 76.5 million short tons in 2033, as shown in Figure E-4. The overall utilization rate for CCPs is projected to grow from 45 percent in 2013 to 63 percent in 2033.
figure e-3: projected demand for ready-mixed concrete will help drive ccp utilization
600
550
500
450
400
350
300
250
200
2013
2014
2015
2016
2017
2018
2019
2020
2021
2022
2023
2024
2025
2026
2027
2028
2029
2030
2031
2032
2033
mill
ions
of c
ubic
yar
ds

Forecast 9
Fly ash utilization is forecast to increase 53 percent over the next 20 years, to 35.7 million short tons. Expanding use of fly ash in high volume applications, new concrete mixtures and future growth in the ready-mixed concrete market will drive increased utilization. Projected growth in the wallboard industry due to new housing starts will likely increase the demand for FGD gypsum. In addition, use of FGD material for agriculture to improve soil quality is one of the fastest growing utilization categories. FGD material utilization is projected to increase from 12.9 million short tons in 2013 to 22 million short tons in 2033.
The forecast production and utilization for the different types of CCPs is presented in Table E-1. As can be seen from the table, the projected average annual growth rate in total CCP utilization is two percent. CCP production is forecast to outpace utilization of fly ash, FGD material and bottom ash. Emerging beneficiation technologies, new products and markets can further increase the utiliza-tion of CCPs. As previously noted, even if CCP production were to experience low growth due to accelerated retirements of coal-fueled electricity generating units, production of fly ash and FGD material will still exceed forecast utilization through 2033.
figure E-4: total CCP utilization is expected to increase by 48 percent
120
100
80
60
40
20
0
Historical Utilization Forecast 95% Confidence Intervals
mill
ions
of s
hort
tons
1974
1976
1978
1980
1982
1984
1986
1988
1990
1992
1994
1996
1998
2000
2002
2004
2006
2008
2010
2012
2014
2016
2018
2020
2022
2024
2026
2028
2030
2032
105.8
76.5
55.4

10 THE U.S. COAL COMBUSTION PRODUCTS MARKET
table E-1: Projected production and utilization by ccp category (in millions short tons)
volume 2013 projected volume 2033
projected total growth
projected average annual
growth rate
Production
Fly Ash
FGD Material
Bottom Ash
Boiler Slag
FBC Ash
Total Production
Utilization
Fly Ash
FGD Material
Bottom Ash
Boiler Slag
FBC Ash
Total Utilization
53.4
35.2
14.5
1.4
10.3
114.7
23.3
12.9
5.6
0.9
8.8
51.6
54.6
38.8
14.7
0.8
11.8
120.6
35.7
22.3
7.2
0.8
10.6
76.5
2.2%
10.1%
1.2%
-43.2%
14.5%
5.2%
53.1%
72.9%
28.4%
-16.1%
20.2%
48.3%
0.1%
0.5%
0.1%
-2.8%
0.7%
0.3%
2.2%
2.8%
1.3%
-0.9%
-0.9%
2.0%

Forecast 11
CCP PRODUCTION forecastThe total production of CCPs is expected to be steady over the next 20 years, growing five percent from 114.7 million short tons in 2013 to 120.6 million short tons in 2033, according the baseline forecast model.
Total CCP production is dependent on the volume of coal-fueled electricity generation and envi-ronmental regulatory compliance. The volume of coal-fueled electricity generation is affected by overall economic growth and changes in the energy market.
table E-1: Projected production and utilization by ccp category (in millions short tons)
figure 1-1: total CCP production, 1974 to 2033
160
140
120
100
80
60
40
20
0
Historical Production Forecast 95% Confidence Intervals
mill
ions
of s
hort
tons
1974
1976
1978
1980
1982
1984
1986
1988
1990
1992
1994
1996
1998
2000
2002
2004
2006
2008
2010
2012
2014
2016
2018
2020
2022
2024
2026
2028
2030
2032
150.9
120.6
97.3
12 THE U.S. COAL COMBUSTION PRODUCTS MARKET
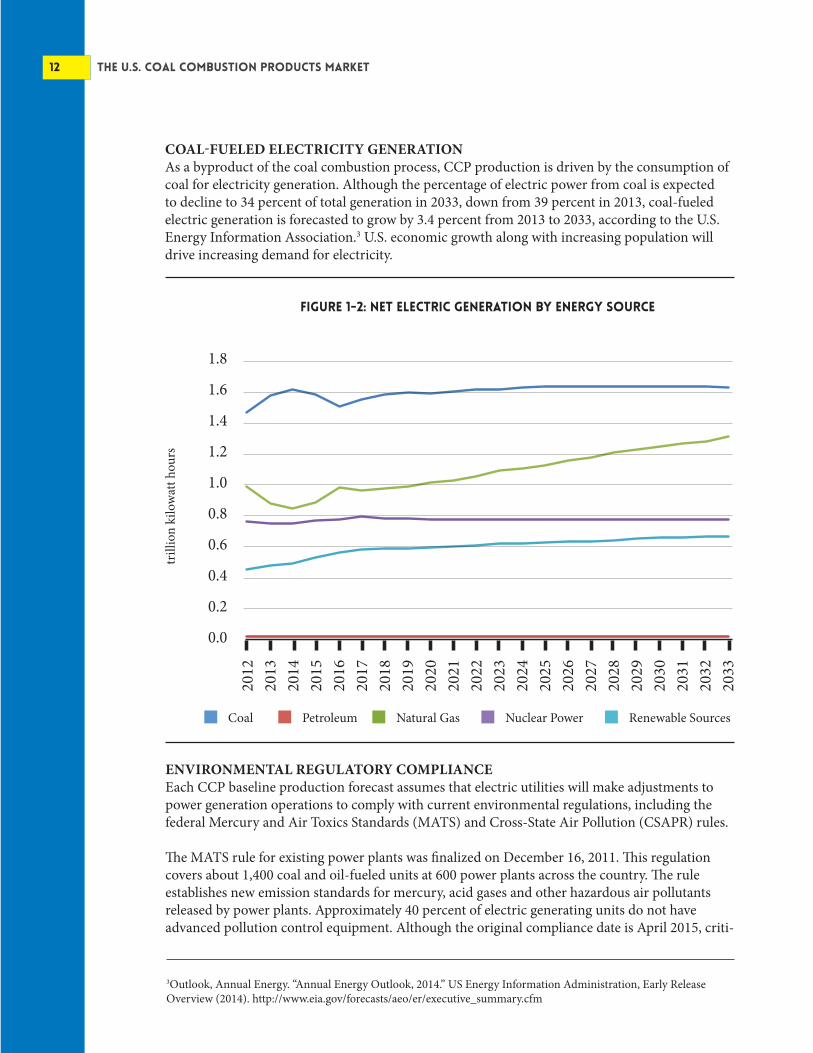
COAL-FUELED ELECTRICITY GENERATIONAs a byproduct of the coal combustion process, CCP production is driven by the consumption of coal for electricity generation. Although the percentage of electric power from coal is expected to decline to 34 percent of total generation in 2033, down from 39 percent in 2013, coal-fueled electric generation is forecasted to grow by 3.4 percent from 2013 to 2033, according to the U.S. Energy Information Association.3 U.S. economic growth along with increasing population will drive increasing demand for electricity.
ENVIRONMENTAL REGULATORY COMPLIANCEEach CCP baseline production forecast assumes that electric utilities will make adjustments to power generation operations to comply with current environmental regulations, including the federal Mercury and Air Toxics Standards (MATS) and Cross-State Air Pollution (CSAPR) rules.
The MATS rule for existing power plants was finalized on December 16, 2011. This regulation covers about 1,400 coal and oil-fueled units at 600 power plants across the country. The rule establishes new emission standards for mercury, acid gases and other hazardous air pollutants released by power plants. Approximately 40 percent of electric generating units do not have advanced pollution control equipment. Although the original compliance date is April 2015, criti-
3Outlook, Annual Energy. “Annual Energy Outlook, 2014.” US Energy Information Administration, Early Release Overview (2014). http://www.eia.gov/forecasts/aeo/er/executive_summary.cfm
0.0
0.2
0.4
0.6
0.8
1.0
1.2
1.4
1.6
1.8
2012
2013
2014
2015
2016
2017
2018
2019
2020
2021
2022
2023
2024
2025
2026
2027
2028
2029
2030
2031
2032
2033
trillion kw
h
Figure E-‐1. Coal-‐fueled electric power expected to remain rela9vely steady through 2033
Coal Petroleum Natural Gas Nuclear Power Renewable Sources
Source: EIA Annual Energy Outlook 2014, Reference Case, does not include pumped storage Coal Petroleum Natural Gas Nuclear Power Renewable Sources
figure 1-2: net electric generation by energy source
1.8
1.6
1.4
1.2
1.0
0.8
0.6
0.4
0.2
0.0
2012
2013
2014
2015
2016
2017
2018
2019
2020
2021
2022
2023
2024
2025
2026
2027
2028
2029
2030
2031
2032
2033
trill
ion
kilo
wat
t hou
rs

Forecast 13
4EPA memorandum, December 16, 2011. http://www.epa.gov/mats/pdfs/EnforcementResponsePolicyforCAA113.pdf 5EPA, Cross-State Air Pollution Rule. http://www.epa.gov/airtransport/CSAPR/ 6U.S. Government Accountability Office. “EPA Regulations and Electricity.” GAO-14-672, (2014). http://www.gao.gov/products/GAO-14-672 7Lalit Batra and Vinay Gupta. “Fuel Economics Will Drive 2015 US Power Markets.” (2015): 24-24. http://www.power-mag.com/fuel-economics-will-drive-2015-u-s-power-markets/ 8ARTBA analysis of EIA Form 860 data. 9Richard J. Campbell. “Increasing the Efficiency of Existing Coal-Fired Power Plants.” Congressional Research Service, 43343 (2013). https://www.fas.org/sgp/crs/misc/R43343.pdf 10Rod Kuckro. “Power Markets: War on coal rhetoric belies robust forecast for coal-fired electricity.” EnergyWire, (January 22, 2015). http://www.eenews.net/stories/1060012054 11Blair Beasley, et al. “Mercury and air toxics standards analysis deconstructed: changing assumptions, changing re-sults.” Resources for the Future Discussion Paper 13-10 (2013). http://www.rff.org/News/Features/Pages/Mercury-and-Air-Toxics-Standards.aspx 12Daniel Epps, “SNL Energy Coal Outlook 2014.” March 6, 2014. http://www.stb.dot.gov/stb/docs/RETAC/2014/Mar/RETAC%20SNL%20%28coal%29%20Mar%206%202014.pdf
cal generating units that are still needed to “address a specific and documented reliability concern” may be issued an administrative order for one additional year to be in compliance. Some of the widely-available control technologies to meet the new standards include utilization of existing electrostatic precipitators or fabric filter baghouses in conjunction with new systems for injection of activated carbon or other sorbents. FGD systems are also utilized in some cases for MATS compliance.4 Phase I of the Cross-State Air Pollution (CSAPR) rule is scheduled to be implemented in 2015. The CSAPR “requires 23 states to reduce annual sulfur dioxide (SO2) and nitrous oxide (NOx) emissions to help downwind areas” attain emissions standards.5 Compliance with these measures is assumed to have occurred in the forecast’s baseline production scenario. Compliance technologies include changes in power plant boiler operations and the use of FGD systems.
Although utilities may decide to retire some coal-fueled generating units rather than install emissions controls to comply with regulatory requirements, these facilities are usually “older, smaller, more polluting and not used extensively.”6 The generating units that are being retired usually lack controls for SO2 and NOx emissions.7
Over half of the 553 generators (for all fuel types) that utilities plan to retire between 2013 and 2022 began operations over 50 years ago.8 Another 36 percent have been in operation for over 30 years. Coal-fueled generating units become less efficient as they age, mainly because of the mechanical wear “on a variety of components resulting in heat losses.”9 Some industry analysts, including ICF International and SNL Energy, project plant retirements in line with EIA’s outlook. Others, such as Peabody Energy Corp., believe that the total volume total coal-fueled generation will actually be higher than what EIA is forecasting.10
Overall, the range of predictions for coal capacity retirements can range from five (5) to 40 giga-watts of capacity, depending on the assumptions made in the studies.11 However, because these facilities are not used as often as more modern plants and are less efficient, the units account for just four percent of the nation’s electric supply.12

14 THE U.S. COAL COMBUSTION PRODUCTS MARKET
Conversely, utilities that invest in additional emissions controls to meet increased environmental regulatory requirements will have a powerful economic incentive to continue operating those power plants, which tend to be newer and larger than the facilities facing retirement.
There are several federal regulations that are in various stages of implementation or that have been proposed where utility compliance with these regulations has an impact on CCP production.
To the extent that new regulations increase the production of FGD materials or other CCPs, the total volume of CCPs will grow. On the other hand, if utilities shut down generating units rather than invest in new emissions controls to comply with regulations, then CCP production from those units would cease. Some key environmental regulations that could impact the total volume of coal generated electricity, and thus CCP production, include:
• June 2, 2014, EPA introduced the Clean Power Plan proposal to set state-level carbon reduction targets that can be met through a variety of measures, including reducing reliance on coal-fueled electric power and deployment of low carbon energy technologies.13
• On December 19, 2014, EPA announced its Final Rule for Disposal of Coal Combustion Residuals from Electric Utilities under the Subtitle D “non-hazardous” section of the Resource Conservation and Recovery Act (RCRA). Under EPA’s final rule, beneficial use of coal ash is specifically exempt from regulation and the Agency once again expressed its support for beneficial use activities, which restores regulatory certainty to the CCP market.14
• Revisions to the Steam Electric Power Generating Effluent Guidelines (ELG), first released in 1974. These rules cover the wastewater discharges from utility power plants. EPA has indicated that it plans to align the Effluent Limitation Guidelines with its just-completed Resource Conservation and Recovery Act Final Rule.15
The CCR and ELG rules will increase the supply of dry CCPs as utilities comply with the phase out of wet disposal. While carbon reduction targets under the Clean Power Plan could mean the retirement or curtailment of additional coal-fueled electric generation, the rule is in the proposal stage and faces an uncertain future due to legal challenges and potential legislative actions.
13https://www.federalregister.gov/articles/2014/06/18/2014-13726/carbon-pollution-emission-guidelines-for-existing-stationary-sources-electric-utility-generating14http://www.gpo.gov/fdsys/pkg/FR-2015-04-17/pdf/2015-00257.pdf15http://www.gpo.gov/fdsys/pkg/FR-2013-06-07/pdf/2013-10191.pdf

Forecast 15
16 THE U.S. COAL COMBUSTION PRODUCTS MARKET
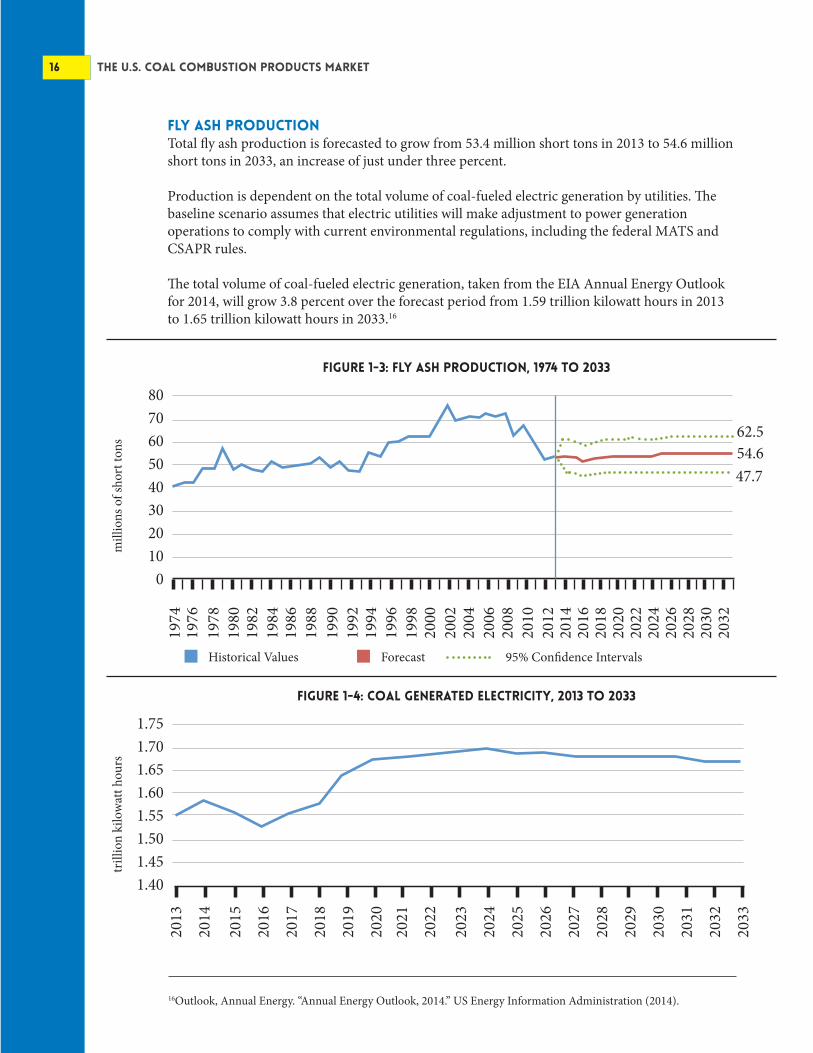
Fly ash productionTotal fly ash production is forecasted to grow from 53.4 million short tons in 2013 to 54.6 million short tons in 2033, an increase of just under three percent.
Production is dependent on the total volume of coal-fueled electric generation by utilities. The baseline scenario assumes that electric utilities will make adjustment to power generation operations to comply with current environmental regulations, including the federal MATS and CSAPR rules.
The total volume of coal-fueled electric generation, taken from the EIA Annual Energy Outlook for 2014, will grow 3.8 percent over the forecast period from 1.59 trillion kilowatt hours in 2013 to 1.65 trillion kilowatt hours in 2033.16
16Outlook, Annual Energy. “Annual Energy Outlook, 2014.” US Energy Information Administration (2014).
figure 1-3: fly ash production, 1974 to 2033
figure 1-4: coal generated electricity, 2013 to 2033
8070605040302010
0
1.751.701.651.601.551.501.451.40
Historical Values Forecast 95% Confidence Intervals
mill
ions
of s
hort
tons
trill
ion
kilo
wat
t hou
rs
1974
1976
1978
1980
1982
1984
1986
1988
1990
1992
1994
1996
1998
2000
2002
2004
2006
2008
2010
2012
2014
2016
2018
2020
2022
2024
2026
2028
2030
2032
62.554.647.7
2013
2014
2015
2016
2017
2018
2019
2020
2021
2022
2023
2024
2025
2026
2027
2028
2029
2030
2031
2032
2033
Forecast 17
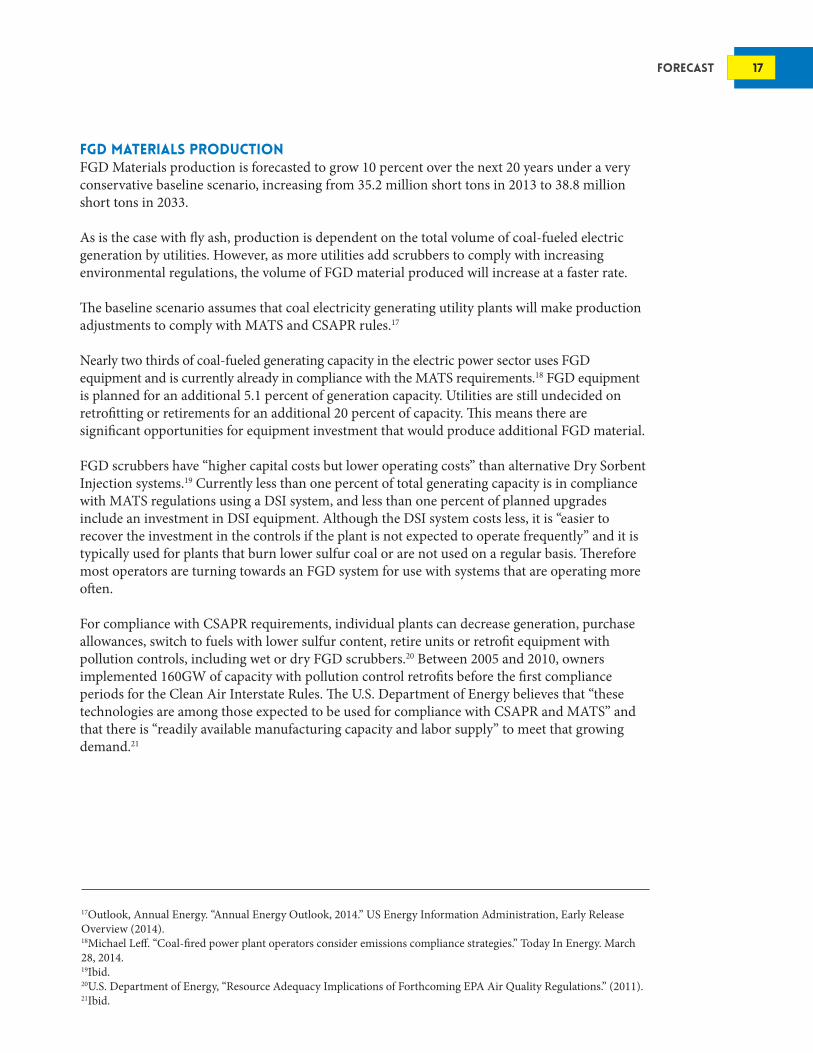
Fgd materials productionFGD Materials production is forecasted to grow 10 percent over the next 20 years under a very conservative baseline scenario, increasing from 35.2 million short tons in 2013 to 38.8 million short tons in 2033.
As is the case with fly ash, production is dependent on the total volume of coal-fueled electric generation by utilities. However, as more utilities add scrubbers to comply with increasing environmental regulations, the volume of FGD material produced will increase at a faster rate.
The baseline scenario assumes that coal electricity generating utility plants will make production adjustments to comply with MATS and CSAPR rules.17 Nearly two thirds of coal-fueled generating capacity in the electric power sector uses FGD equipment and is currently already in compliance with the MATS requirements.18 FGD equipment is planned for an additional 5.1 percent of generation capacity. Utilities are still undecided on retrofitting or retirements for an additional 20 percent of capacity. This means there are significant opportunities for equipment investment that would produce additional FGD material.
FGD scrubbers have “higher capital costs but lower operating costs” than alternative Dry Sorbent Injection systems.19 Currently less than one percent of total generating capacity is in compliance with MATS regulations using a DSI system, and less than one percent of planned upgrades include an investment in DSI equipment. Although the DSI system costs less, it is “easier to recover the investment in the controls if the plant is not expected to operate frequently” and it is typically used for plants that burn lower sulfur coal or are not used on a regular basis. Therefore most operators are turning towards an FGD system for use with systems that are operating more often.
For compliance with CSAPR requirements, individual plants can decrease generation, purchase allowances, switch to fuels with lower sulfur content, retire units or retrofit equipment with pollution controls, including wet or dry FGD scrubbers.20 Between 2005 and 2010, owners implemented 160GW of capacity with pollution control retrofits before the first compliance periods for the Clean Air Interstate Rules. The U.S. Department of Energy believes that “these technologies are among those expected to be used for compliance with CSAPR and MATS” and that there is “readily available manufacturing capacity and labor supply” to meet that growing demand.21
17Outlook, Annual Energy. “Annual Energy Outlook, 2014.” US Energy Information Administration, Early Release Overview (2014).18Michael Leff. “Coal-fired power plant operators consider emissions compliance strategies.” Today In Energy. March 28, 2014. 19Ibid.20U.S. Department of Energy, “Resource Adequacy Implications of Forthcoming EPA Air Quality Regulations.” (2011).21Ibid.
1974
1976
1978
1980
1982
1984
1986
1988
1990
1992
1994
1996
1998
2000
2002
2004
2006
2008
2010
2012
2014
2016
2018
2020
2022
2024
2026
2028
2030
2032

18 THE U.S. COAL COMBUSTION PRODUCTS MARKET
figure 1-5: fgd production, 1987 to 2033
60
50
40
30
20
10
0
Historical Values Forecast 95% Confidence Intervals
mill
ions
of s
hort
tons
1987
1989
1991
1993
1995
1997
1999
2001
2003
2005
2007
2009
2011
2013
2015
2017
2019
2021
2023
2025
2027
2029
2031
2033
56.7
38.8
26.5
figure 1-6: U.S. Emissions of SO2
5,000
4,500
4,000
3,500
3,000
2,500
2,000
1,500
1,000
500
0
2013
2014
2015
2016
2017
2018
2019
2020
2021
2022
2023
2024
2025
2026
2027
2028
2029
2030
2031
2032
2033
thou
sand
s of t
ons
Forecast 19
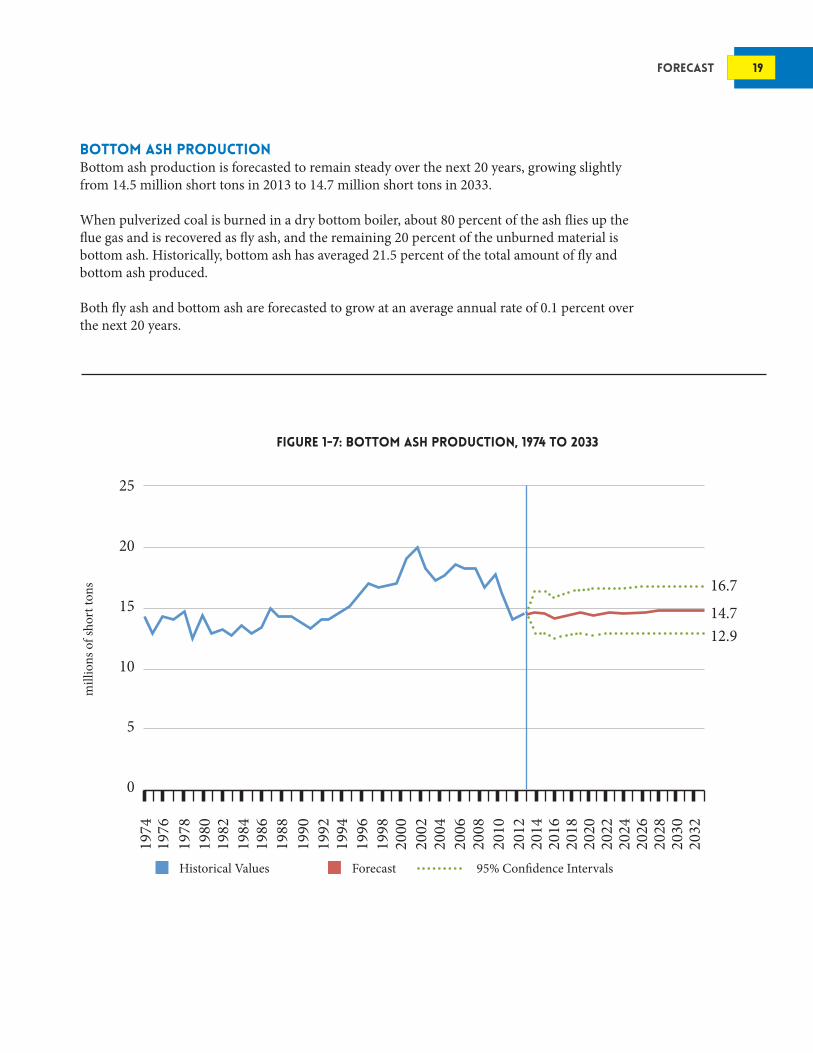
bottom ash productionBottom ash production is forecasted to remain steady over the next 20 years, growing slightly from 14.5 million short tons in 2013 to 14.7 million short tons in 2033.
When pulverized coal is burned in a dry bottom boiler, about 80 percent of the ash flies up the flue gas and is recovered as fly ash, and the remaining 20 percent of the unburned material is bottom ash. Historically, bottom ash has averaged 21.5 percent of the total amount of fly and bottom ash produced.
Both fly ash and bottom ash are forecasted to grow at an average annual rate of 0.1 percent over the next 20 years.
figure 1-7: bottom ash production, 1974 to 2033
25
20
15
10
5
0
Historical Values Forecast 95% Confidence Intervals
mill
ions
of s
hort
tons
1974
1976
1978
1980
1982
1984
1986
1988
1990
1992
1994
1996
1998
2000
2002
2004
2006
2008
2010
2012
2014
2016
2018
2020
2022
2024
2026
2028
2030
2032
16.7
14.712.9
20 THE U.S. COAL COMBUSTION PRODUCTS MARKET
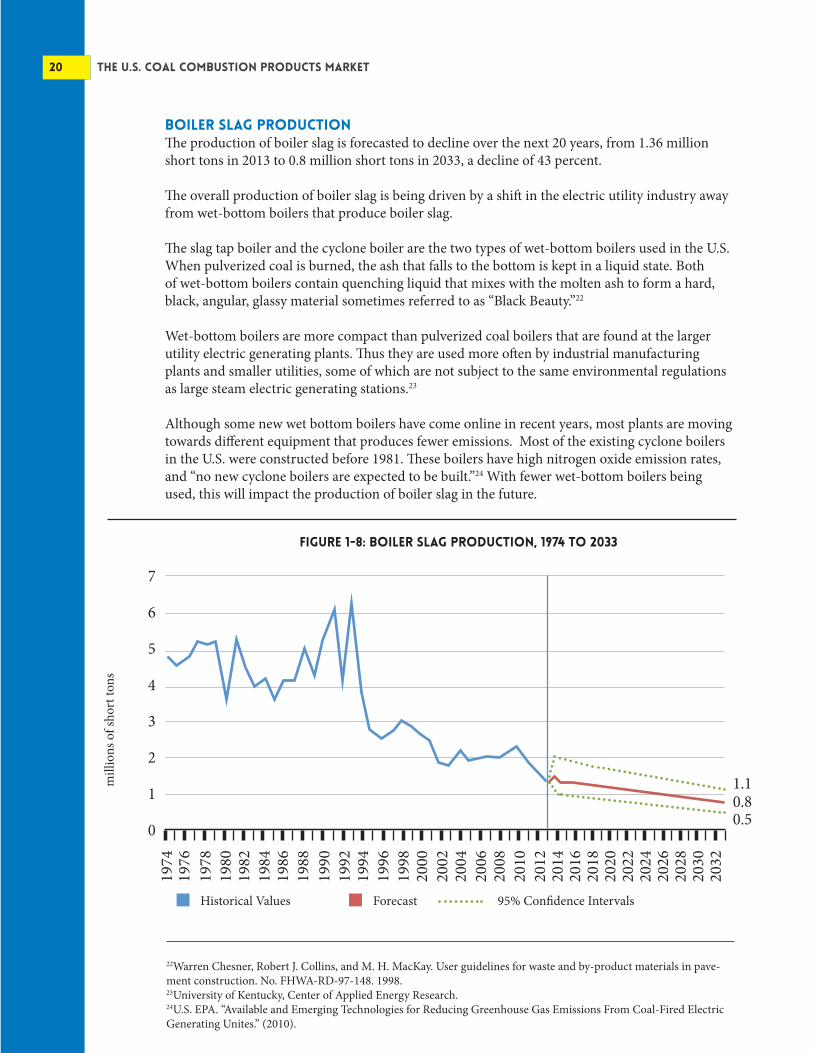
boiler slag production The production of boiler slag is forecasted to decline over the next 20 years, from 1.36 million short tons in 2013 to 0.8 million short tons in 2033, a decline of 43 percent.
The overall production of boiler slag is being driven by a shift in the electric utility industry away from wet-bottom boilers that produce boiler slag.
The slag tap boiler and the cyclone boiler are the two types of wet-bottom boilers used in the U.S. When pulverized coal is burned, the ash that falls to the bottom is kept in a liquid state. Both of wet-bottom boilers contain quenching liquid that mixes with the molten ash to form a hard, black, angular, glassy material sometimes referred to as “Black Beauty.”22
Wet-bottom boilers are more compact than pulverized coal boilers that are found at the larger utility electric generating plants. Thus they are used more often by industrial manufacturing plants and smaller utilities, some of which are not subject to the same environmental regulations as large steam electric generating stations.23
Although some new wet bottom boilers have come online in recent years, most plants are moving towards different equipment that produces fewer emissions. Most of the existing cyclone boilers in the U.S. were constructed before 1981. These boilers have high nitrogen oxide emission rates, and “no new cyclone boilers are expected to be built.”24 With fewer wet-bottom boilers being used, this will impact the production of boiler slag in the future.
22Warren Chesner, Robert J. Collins, and M. H. MacKay. User guidelines for waste and by-product materials in pave-ment construction. No. FHWA-RD-97-148. 1998.23University of Kentucky, Center of Applied Energy Research. 24U.S. EPA. “Available and Emerging Technologies for Reducing Greenhouse Gas Emissions From Coal-Fired Electric Generating Unites.” (2010).
figure 1-8: boiler slag production, 1974 to 2033
7
6
5
4
3
2
1
0
Historical Values Forecast 95% Confidence Intervals
mill
ions
of s
hort
tons
1974
1976
1978
1980
1982
1984
1986
1988
1990
1992
1994
1996
1998
2000
2002
2004
2006
2008
2010
2012
2014
2016
2018
2020
2022
2024
2026
2028
2030
2032
1.10.80.5

Forecast 21
fbc ash productionFBC ash is the fly ash and the bed ash produced by an fluidized bed combustion (FBC) boiler. The FBC fly ash is collected in the flue of the boiler with a baghouse filter or electrostatic precipitator. The bed ash is the residue that is removed from the bottom of the boiler.25 FBC production is forecasted to grow from 10.3 million short tons in 2013 to 11.8 million short tons in 2033, an increase of nearly 15 percent.
As with other CCPs, the production of FBC ash over the next 20 years is highly dependent on the amount of coal consumed for electric generation. In addition, this market will be impacted by technology and equipment upgrades to comply with environmental regulations.
In an effort to meet emissions requirements, some utilities are using FBC technology, which allows operators to burn lower rank coals with a higher moisture and ash content while reducing nitrogen oxide emissions.26
25American Coal Ash Association. “Glossary of terms concerning the management and use of coal combustion prod-ucts (CCPs).” American Coal Ash Association, Inc., Aurora, CO (2003). http://www.acaa-usa.org/Portals/9/Files/PDFs/ACAA_Glossary_of_Terms-Apri_2003.pdf 26Ibid.
figure 1-9: fbc ash production, 2002 to 2033
16
14
12
10
8
6
4
2
0
Historical Values Forecast 95% Confidence Intervals
mill
ions
of s
hort
tons
2002
2003
2004
2005
2006
2007
2008
2009
2010
2011
2012
2013
2014
2015
2016
2017
2018
2019
2020
2021
2022
2023
2024
2025
2026
2027
2028
2029
2030
2031
2032
2033
13.9
11.8
9.7

22 THE U.S. COAL COMBUSTION PRODUCTS MARKET
additional supplies of ccps
In addition to on-going production, there are additional sources of CCPs that could have an impact on the overall supply of materials for beneficial use.
Some of these potential sources include:
reclamation of fly ash in ponds or landfills: Currently there are research and demonstration projects focused on reclaiming fly ash that has been stored in either wet impoundments or dry disposal units. This could have significant impacts on the supply of fly ash. In 2012, there were 228 utility plants that disposed of 24.5 million short tons of fly ash in ponds and landfills.27 Electric utilities have over 1,400 ponds and landfills across the country that could be potential sources of ash.
There are also potential changes to the storage of fly ash and other CCPs over the next decade. The December 19, 2014 Final Rule for Disposal of Coal Combustion Residuals from Electric Utilities under the RCRA will phase out the wet disposal of CCPs over the next decade.28
States are acting to restrict or prohibit the wet disposal of coal ash. Recently North Carolina passed legislation that prohibits any new coal ash ponds after October 1, 2014.29 The measure also bans the wet disposal of ash beginning in 2020. As utilities convert from wet to dry handling of coal ash, beneficial use is facilitated.
technologies to increase ash quality: Historically, a portion of the coal ash that was disposed was not beneficially used because it did not meet various quality standards. A suite of technologies have been demonstrated as commercially viable in improving ash quality— including a variety of systems for reducing the amount of unburned carbon in fly ash. Broader deployment of these technologies can increase the volume of ash suitable for beneficial use.30 Technologies are also currently being deployed to mitigate ash quality impacts of various emissions control technologies.
international fly ash markets: The international market for CCPs includes supply sources from Australia, Canada, China, Israel, Western Europe, Russia, the United Kingdom, and the Middle East, among others. Data from the 2013 World of Coal Ash Conference estimates coal ash production at more than 771 million metric tons, with over 415 million metric tons being utilized.
Although coal ash imports currently represent a negligible portion of U.S. supply, international supplies of CCPs that meet U.S. standards could be used as an input if domestic production cannot keep up with growing utilization over the next 20 years.
27ARTBA analysis of EIA 923 data.28http://www.gpo.gov/fdsys/pkg/FR-2015-04-17/pdf/2015-00257.pdf29Sonal Patel. “Nation’s First Coal Ash Law Takes Effect in North Carolina.” Power Magazine. September 24, 2014. http://www.powermag.com/nations-first-coal-ash-law-takes-effect-in-north-carolina/ 30Hank Keiper, P.E.. “Addressing Coal’s Negative Impact – Beneficial Use of Fly Ash.” The Virginia Engineer. (April 2011). http://vaeng.com/guestarticle/addressing-coal-s-negative-impact-beneficial-use-of-fly-ash

Forecast 23
Utilization rates in the US were about 45% in 2013 and projected to increase to 63% by 2033. In Australia, while production fell 20 percent between 2007 and 2012, utilization has increased 44 percent and the quantity sold increased 23 percent. Almost all of CCP growth comes from growth in the fly ash market.
In Canada, between 2010 and 2012, about 6.4 million tons of CCP were produced, with about 4 million tons of fly ash and 1.8 million tons of bottom ash. Between 2004 and 2012, about 19.6 million tons of CCP were disposed or stored, although the Association of Canadian Industries Recycling Coal Ash (CIRCA) does not distinguish between those categories.
CCP production in China grew 150 percent between 2002 and 2010, as China expanded its usage of coal power. In 2009, over 375 million tons of coal ash was produced, up from 300 million tons in 2006.
Israel has seen explosive growth in the production of CCPs over the last thirty years, with fly ash production increasing 878 percent between 1982 and 2012, and bottom ash production increasing 1,207 percent. Over a shorter time span, between 2000 and 2012, fly production increased 18 percent and bottom ash production increased 51 percent. All told, in 2012, Israel produced 1.2 million tons of fly ash and 183,000 tons of bottom ash. Utilization is primarily directed towards concrete, cement and road fill, with a 98 percent fly ash utilization rate and a 62 percent bottom ash utilization rate.
Production of CCPs in Western Europe is not well documented, but according to the European Coal Combustion Products Association, in 2010 about 48.3 million tons of CCPs were produced. Fly ash comprises 65 percent of CCP production, and FGD gypsum production comprises 21 percent.
Russia has produced about 25 million tons of CCPs every year since 2000. While the ash content of Russian coal has been falling over the past twenty years, ash composes roughly one-quarter to one-fifth of coal in Russia.
country/region ccps production (metric tons)
ccps utilization(metric tons)
utilization rate %
Australia
Canada
China*
Europe (EU 15)
India
Japan
Middle East & Africa
United State of America
Other Asia*
Russian Federation
Totals
13.1
6.8
395
52.6
105
11.1
32.2
118
16.7
26.6
777.1
6
2.3
265
47.8
14.5
10.7
3.4
49.7
11.1
5
415.5
45.8
33.8
67.1
90.9
13.8
96.4
10.6
42.1
66.5
18.8
53.8

24 THE U.S. COAL COMBUSTION PRODUCTS MARKET
Forecast 25
CCP utilization forecastTotal CCP utilization is forecasted to increase over 48 percent, from 51.6 million short tons in 2013 to 76.5 million short tons in 2033. The total utilization rate will grow form 45 percent of production to 63 percent.
Total utilization is based on an environment of regulatory certainty, emerging technologies, continuation of industry standards, and overall demand from end markets.
With nearly two-thirds of CCPs used in construction related markets, the overall growth in the U.S. economy, housing starts and ready-mixed concrete demand will be major drivers of total utilization.
figure 2-1: total CCP utilization, 1974 to 2033
120
100
80
60
40
20
0
Historical Utilization Forecast 95% Confidence Intervals
mill
ions
of s
hort
tons
1974
1976
1978
1980
1982
1984
1986
1988
1990
1992
1994
1996
1998
2000
2002
2004
2006
2008
2010
2012
2014
2016
2018
2020
2022
2024
2026
2028
2030
2032
105.8
76.5
55.4

26 THE U.S. COAL COMBUSTION PRODUCTS MARKET
REGULATORY CERTAINTYThe decision by the EPA to revisit the potential classification of CCPs as a hazardous material after the coal ash spill in Kingston, Tennessee, in 2008 caused significant amounts of market uncertainty that led to a steady downturn in total utilization through 2012.
Some users said that even if EPA allowed the beneficial use of fly ash in concrete uses, there would still be a “negative stigma” if fly ash were classified as a hazardous waste and potential liability would be an issue.31 Given historical patterns, fly ash utilization should have been growing in the years after the 2008 Great Recession as users looked for less expensive inputs.32 With regulatory uncertainty, consumers of fly ash begin to remove their materials from specifications because of potential legal liability, and commercial liability insurance policies are used for products containing fly ash and other CCPs.33
31Texas Department of Transportation. “Where has the Fly Ash Gone?” (April 2012). http://ftp.dot.state.tx.us/pub/txdot-info/cst/tips/fly_ash_0412.pdf32Alison Premo Black. “ The U.S. Coal Combustion Products Market: A Historical Market Analysis.” (2015). 33John N. Ward. “Stigma and regulatory uncertainty: proposed coal ash disposal regulation effects on US beneficial use markets and practices.” 2013 World of Coal Ash Conference. 2013. http://www.flyash.info/2013/033-Ward-2013.pdf
figure 2-2: CCP Utilization rate, 1974 to 2033
80%
70%
60%
50%
40%
30%
20%
10%
0%
Historical Values Forecast 95% Confidence Intervals
% o
f tot
al p
rodu
ctio
n
1974
1976
1978
1980
1982
1984
1986
1988
1990
1992
1994
1996
1998
2000
2002
2004
2006
2008
2010
2012
2014
2016
2018
2020
2022
2024
2026
2028
2030
2032
70%
63%
57%

Forecast 27
Although historically the use of FGD material has not been as affected by the regulatory uncertainty that characterized the CCP market between 2009 and 2013, there is the potential that future developments could have an impact. When EPA was considering regulating CCPs after the 2008 spill in Kingston, Tennessee, FGD gypsum used for wallboard manufacture was characterized as a “product” rather than a “waste or discarded material.”34
Despite this view, FGD material is still a CCP and any overall uncertainty about the regulation of CCPs does have a negative stigma.
On December 19, 2014, EPA announced its Final Rule for Disposal of Coal Combustion Residuals from Electric Utilities under the Subtitle D “non-hazardous” section of the Resource Conservation and Recovery Act. Under EPA’s final rule, beneficial use of coal ash is specifically exempt from regulation and the Agency once again expressed its support for beneficial use activities.35 The resumption of regulatory certainty after a six-year hiatus should provide reassurance to utilization markets.
34U.S. EPA. Proposed Rule, Federal Register, Vol. 75, No. 118, June 21, 2010 http://www.gpo.gov/fdsys/pkg/FR-2010-06-21/pdf/FR-2010-06-21.pdf 35http://www.gpo.gov/fdsys/pkg/FR-2015-04-17/pdf/2015-00257.pdf
1974
1976
1978
1980
1982
1984
1986
1988
1990
1992
1994
1996
1998
2000
2002
2004
2006
2008
2010
2012
2014
2016
2018
2020
2022
2024
2026
2028
2030
2032

28 THE U.S. COAL COMBUSTION PRODUCTS MARKET
fly ash utilizationTotal fly ash utilization is forecasted to increase 53 percent over the next twenty years, from 23.3 million short tons in 2013 to 35.7 million short tons in 2033. The overall utilization would grow from 44 percent of production to 65 percent over that same time period.
With over 63 percent of fly ash being used for concrete, blended cement and related products in 2013, the utilization of fly ash will in part depend on future demand for ready-mixed concrete and the overall health of the U.S. construction market.
figure 2-3: fly ash utilization, 1974 to 2033
figure 2-4: projected demand for ready-mixed concrete will help drive fly ash utilization
60
50
40
30
20
10
0
600550500450400350300250200
Historical Values Forecast 95% Confidence Intervals
mill
ions
of s
hort
tons
mill
ions
of c
ubic
yar
ds
1974
1976
1978
1980
1982
1984
1986
1988
1990
1992
1994
1996
1998
2000
2002
2004
2006
2008
2010
2012
2014
2016
2018
2020
2022
2024
2026
2028
2030
2032
48.5
35.7
26.3
2013
2014
2015
2016
2017
2018
2019
2020
2021
2022
2023
2024
2025
2026
2027
2028
2029
2030
2031
2032
2033
Forecast 29
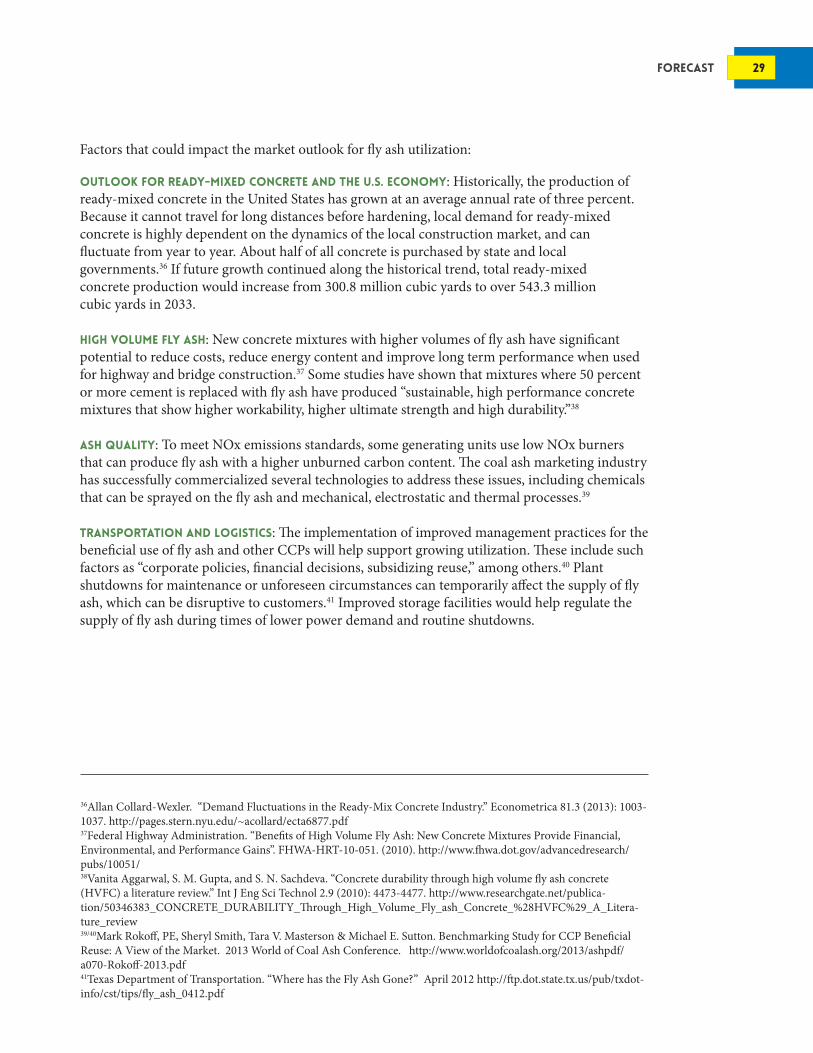
Factors that could impact the market outlook for fly ash utilization:
Outlook for Ready-Mixed Concrete and the U.S. Economy: Historically, the production of ready-mixed concrete in the United States has grown at an average annual rate of three percent. Because it cannot travel for long distances before hardening, local demand for ready-mixed concrete is highly dependent on the dynamics of the local construction market, and can fluctuate from year to year. About half of all concrete is purchased by state and local governments.36 If future growth continued along the historical trend, total ready-mixed concrete production would increase from 300.8 million cubic yards to over 543.3 million cubic yards in 2033.
high volume fly ash: New concrete mixtures with higher volumes of fly ash have significant potential to reduce costs, reduce energy content and improve long term performance when used for highway and bridge construction.37 Some studies have shown that mixtures where 50 percent or more cement is replaced with fly ash have produced “sustainable, high performance concrete mixtures that show higher workability, higher ultimate strength and high durability.”38
ash quality: To meet NOx emissions standards, some generating units use low NOx burners that can produce fly ash with a higher unburned carbon content. The coal ash marketing industry has successfully commercialized several technologies to address these issues, including chemicals that can be sprayed on the fly ash and mechanical, electrostatic and thermal processes.39
transportation and logistics: The implementation of improved management practices for the beneficial use of fly ash and other CCPs will help support growing utilization. These include such factors as “corporate policies, financial decisions, subsidizing reuse,” among others.40 Plant shutdowns for maintenance or unforeseen circumstances can temporarily affect the supply of fly ash, which can be disruptive to customers.41 Improved storage facilities would help regulate the supply of fly ash during times of lower power demand and routine shutdowns.
36Allan Collard-Wexler. “Demand Fluctuations in the Ready‐Mix Concrete Industry.” Econometrica 81.3 (2013): 1003-1037. http://pages.stern.nyu.edu/~acollard/ecta6877.pdf37Federal Highway Administration. “Benefits of High Volume Fly Ash: New Concrete Mixtures Provide Financial, Environmental, and Performance Gains”. FHWA-HRT-10-051. (2010). http://www.fhwa.dot.gov/advancedresearch/pubs/10051/38Vanita Aggarwal, S. M. Gupta, and S. N. Sachdeva. “Concrete durability through high volume fly ash concrete (HVFC) a literature review.” Int J Eng Sci Technol 2.9 (2010): 4473-4477. http://www.researchgate.net/publica-tion/50346383_CONCRETE_DURABILITY_Through_High_Volume_Fly_ash_Concrete_%28HVFC%29_A_Litera-ture_review39/40Mark Rokoff, PE, Sheryl Smith, Tara V. Masterson & Michael E. Sutton. Benchmarking Study for CCP Beneficial Reuse: A View of the Market. 2013 World of Coal Ash Conference. http://www.worldofcoalash.org/2013/ashpdf/a070-Rokoff-2013.pdf 41Texas Department of Transportation. “Where has the Fly Ash Gone?” April 2012 http://ftp.dot.state.tx.us/pub/txdot-info/cst/tips/fly_ash_0412.pdf
1974
1976
1978
1980
1982
1984
1986
1988
1990
1992
1994
1996
1998
2000
2002
2004
2006
2008
2010
2012
2014
2016
2018
2020
2022
2024
2026
2028
2030
2032

30 THE U.S. COAL COMBUSTION PRODUCTS MARKET
42Arumugam, K. and D. James Manohar. “A study on characterization and use of Pond Ash as fine aggregate in Con-crete.” International Journal of Civil & Structural Engineering 2.2 (2011): 466-474. http://www.ipublishing.co.in/jcand-sevol1no12010/voltwo/EIJCSE3038.pdf43Sonawane, Prashant & Dr. Arun Kumar Dwivedi. “Technical Properties of Pond Ash – Clay Fired Bricks – An Ex-perimental Study.” American Journal of Engineering Research, Volume 2, Issue 9, (2013). http://www.ajer.org/papers/v2%289%29/P029110117.pdf44Ed Dodge. “Can Coal Fly Ash Waste Be Put to Good Use?” Breaking Energy. February 18, 2014. http://breakingen-ergy.com/2014/02/18/can-coal-fly-ash-waste-be-put-to-good-use/45Obada Kayali, “High Performance Bricks from Fly Ash” 2005 World of Coal Ash, http://www.flyash.info/2005/5kay.pdf
reclamation of fly ash in ponds or landfills: Currently there are demonstration projects focused on reclaiming fly ash that has been stored in either wet or dry disposal impoundments. This could have significant impacts on the supply and utilization of fly ash. One study examined the use of pond ash as a fine aggregate substitute in cement concrete.42 Work has also been down on using ponded ash for clay-fired bricks.43
new markets and utilization: Changes in technology and new markets for fly ash will create more demand for utilization. In 1990, two Indian inventors created fly ash bricks, which use fly ash, lime and gypsum to create “high quality and strong bricks that do not require kiln firing.”44 The fly ash bricks are about 28 percent lighter than traditional clay bricks and can exceed their load capacity by as much as 25 percent.45 This type of innovation will create significant new markets for fly ash in the coming years.
figure 2-5: fly ash utilization rate, 1974 to 2033
80%
70%
60%
50%
40%
30%
20%
10%
0%
Historical Values Forecast 95% Confidence Intervals
% o
f tot
al p
rodu
ctio
n
1974
1976
1978
1980
1982
1984
1986
1988
1990
1992
1994
1996
1998
2000
2002
2004
2006
2008
2010
2012
2014
2016
2018
2020
2022
2024
2026
2028
2030
2032
78%
65%
55%

Forecast 31
46Bob Bruce, PhD., “Impact of USA Flue Gas Desulfurization Programs on north American Gypsum Supply and De-mand.” (2004). http://www.innogyps.com/synthetic_gypsum_supply_demand.php 47Tera Berland. Review of handling and use of FGD material. Energy & Environmental Research Center, University of North Dakota, (2010). http://library.nd.gov/statedocs/EERC/FGDHandlingRpt-20111227.pdf
fgd utilizationTotal FGD utilization is forecasted to grow at an average annual rate of nearly three percent over the next twenty years, from 12.9 million short tons in 2013 to 22.3 million short tons in 2033. The overall utilization would grow from 37 percent of production to 58 percent over that same time period.
As a substitute for natural gypsum, future demand for FGD material will be related to demand for gypsum wallboard and total U.S. construction activity. In recent years, wallboard manufacturers have recognized the superior properties of FGD material—they have shifted their production process and refitted manufacturing facilities to accommodate more FGD gypsum material.46 Many of the technical challenges of using FGD material in gypsum have been solved, and operating changes necessary have been “relatively well established.”47
figure 2-6: fgd utilization, 1987 to 2033
40
35
30
25
20
15
10
5
0
Historical Values Forecast 95% Confidence Intervals
mill
ions
of s
hort
tons
1987
1989
1991
1993
1995
1997
1999
2001
2003
2005
2007
2009
2011
2013
2015
2017
2019
2021
2023
2025
2027
2029
2031
2033
34.1
22.3
14.6

32 THE U.S. COAL COMBUSTION PRODUCTS MARKET
FGD material is attractive because it can be used as a complete substitute for mined gypsum in wallboard and drywall, since the primary chemical constituent is identical.48 FGD gypsum may even have higher gypsum purity than mined gypsum because of the “greater control over the chemical composition of the final product.”49
FGD material is also used as an input for blended cement and feed for clinker and in both mining and agricultural applications.
Additional factors that could impact the market outlook for FGD material:
Housing starts and construction market activity: The demand for gypsum wallboard is tied to the overall economy, housing starts and U.S. construction market activity. Although gypsum wallboard dates back to the 19th century, “the biggest technological trend in the gypsum wallboard industry in recent years has been the adoption of synthetic gypsum, made from byproducts of energy generation or industrial waste.”50
Analysts expect the wallboard industry will continue to grow, but may have some “bumps” along the way.51 Overall, the forecast for new housing starts is expected to grow from 925,000 units in 2013 to 1.79 million in 2033.52
48EPA., “Coal Combustion Residual Beneficial Use Evaluation: Fly Ash Concrete and FGD Gypsum Wallboard.” (2014). http://www.epa.gov/waste/conserve/imr/ccps/pdfs/ccr_bu_eval.pdf 49Ibid.50Vance Cariaga. “Housing Rebound Boosts gypsum Wallboard Suppliers.” Investor’s Business Daily. April 25, 2014. http://www.nasdaq.com/article/housing-rebound-boosts-gypsum-wallboard-suppliers-cm347621 51Ibid.52Forecast of housing starts through 2024 from “Congressional Budget Office, August 2014 Update to the Budget and Economic Outlook: Fiscal Years 2014 to 2024.” Totals for 2024 to 2033 based on historical growth. https://www.cbo.gov/publication/45653
figure 2-7: outlook for u.s. new housing starts
2,000
1,800
1,600
1,400
1,200
1,000
0
thou
sand
s of n
ew u
nits
2013
2014
2015
2016
2017
2018
2019
2020
2021
2022
2023
2024
2025
2026
2027
2028
2029
2030
2031
2032
2033

Forecast 33
53Tera Berland. Review of handling and use of FGD material. Energy & Environmental Research Center, University of North Dakota, (2010). http://library.nd.gov/statedocs/EERC/FGDHandlingRpt-20111227.pdf 54Ibid.55ARTBA analysis of EIA-923 data. 56Sonal Patel. “Nation’s First Coal Ash Law Takes Effect in North Carolina,” Power Magazine, September 24, 2014 http://www.powermag.com/nations-first-coal-ash-law-takes-effect-in-north-carolina/ 57Dexter B. Watts and Warren A. Dick. “Sustainable Uses of FGD Gypsum in Agricultural Systems: Introduction.” Journal of Environmental Quality, June 23, 2014. http://www.ncbi.nlm.nih.gov/pubmed/25602557 58Ibid.59Dan Zinkand. “CCPs in Agriculture.” Ash at Work, 1, (2012). http://www.acaa-usa.org/Portals/9/Files/PDFs/ASH01-2012.pdf 60Alison Premo Black. “ The U.S. Coal Combustion Products Market: A Historical Market Analysis.” (2015).61Dexter B. Watts and Warren A. Dick. “Sustainable Uses of FGD Gypsum in Agricultural Systems: Introduction.” Journal of Environmental Quality. June 23, 2014. http://www.ncbi.nlm.nih.gov/pubmed/25602557
product transportation, quality and standards: The commitment of gypsum suppliers for product quality, managing supply interruptions and lowering transportation costs are key elements for increasing the utilization of FGD material in the future.53 Many of the technical challenges of “producing commercially viable FGD gypsum have been solved,” but some operating challenges do remain.54 The continued integration of relationships between producer and consumers and operational improvements to lower costs will help further increase utilization.
environmental regulations: Any federal or state regulations on landfills, impoundments or ash ponds would have an impact on the disposal of FGD material and could create new supply opportunities. There were over 11.2 million short tons of FGD material placed in landfills or ponds in 2012.55
One example includes recent legislation in North Carolina that prohibits new coal ash ponds after October 1, 2014 and bans wet disposal beginning in 2020.56 If more states consider similar approaches to managing CCPs, there could be a substantial amount of FGD material that needs to be disposed that could be readily available for beneficial use.
additional markets and technological advances: The use of FGD material in other markets, such as agricultural systems, will provide additional utilization opportunities.
Although gypsum was used for agriculture purposes as early as the 18th century, high extraction and transportation costs meant it was used only for a few crops.57 Much like the wallboard industry, agriculture producers are finding that the availability of FGD gypsum, as well as the smaller and uniform particle sizing mean that the synthetic material is providing “greater soil improvements” than commercially mined gypsum.58
FGD gypsum improves soil quality by reversing the effects of compaction, improving the infiltration of rainfall and providing calcium and sulfur.59 The use of CCPs for agriculture purposes is one of the fastest growing utilization categories, increasing from 14,681short tons in 1995 to over 598,105 short tons in 2013.60 FGD gypsum can be used to manage crops, increase yields “while at the same time safeguarding the environment.”61
34 THE U.S. COAL COMBUSTION PRODUCTS MARKET
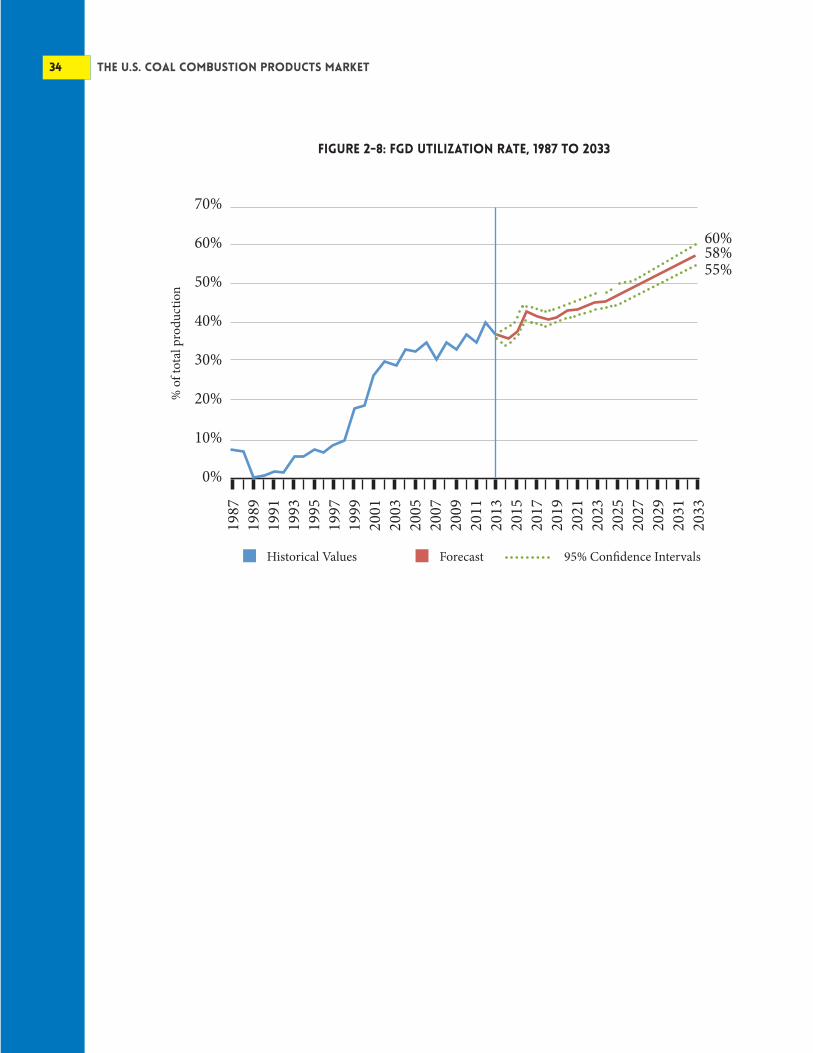
figure 2-8: FGD utilization rate, 1987 to 2033
70%
60%
50%
40%
30%
20%
10%
0%
Historical Values Forecast 95% Confidence Intervals
% o
f tot
al p
rodu
ctio
n
1987
1989
1991
1993
1995
1997
1999
2001
2003
2005
2007
2009
2011
2013
2015
2017
2019
2021
2023
2025
2027
2029
2031
2033
60%58%55%

Forecast 35
bottom ash utilizationBottom ash utilization is forecasted to grow from 5.6 million short tons in 2013 to 7.2 million short tons in 2033, an increase of 28 percent.
Bottom ash is mainly used as an input for blended cement, clinker and concrete products, structural fills and embankments, soil modification and snow and ice control.
Although bottom ash has a chemical composition that is similar to fly ash, the size of the material can range from “fine sand to large gravel,” and thus it does not have any cementitous properties.62
Since bottom ash is not pozzolanic it has more limited applications in the cement and concrete industry than fly ash.63 Bottom ash is typically used as a lightweight aggregate in precast concrete products, including concrete blocks and masonry units.64 The final product is much lighter than when using conventional aggregates, such as sand and gravel, and is just as strong.65
The demand for bottom ash over the next 20 years will be dependent on the end use markets, especially U.S. construction market activity. As new technologies and uses emerge, increasing amounts of bottom ash will continue to be used as an input for various construction materials.
Bottom ash is also being used to replace fine aggregate in hot-mix asphalt, with research being conducted to evaluate the material’s performance, stability and moisture susceptibility.66
Bottom ash is also being studied as a replacement material in self compaction concrete a type of concrete “that will be leveled and compacted under its self-weight,” with promising results.67
62Texas Coal Ash Utilization Group, FAQ., “What are coal combustion products?” http://www.tcaug.org/faq/63R.C. Joshi and R. P. Lohita. Fly ash in concrete: production, properties and uses. No. 2. CRC Press, 1997. https://books.google.com/books/about/Fly_Ash_in_Concrete.html?id=8ITxm7zHul4C 64G.J. Dienhart, B. R. Stewart, and S. S. Tyson. “Coal ash: innovative applications of coal combustion products.” American Coal Ash Association, Alexandria, VA (1998).65University of Kentucky, Center for Applied Energy Research66Boo Hyun Nam. Evaluating the Use of Waste-to-Energy Bottom Ash as Road Construction Materials. Dissertation. University of Central Florida, 2014. http://www.dot.state.fl.us/research-center/Completed_Proj/Summary_SMO/FDOT-BDK78-977-20-rpt.pdf 67Aeslina Binti Abdul Kadir and Mohd Ikhmal Haqeem Hassan. “An Overview of Fly Ash and Bottom Ash Replace-ment in Self-Compaction Concrete.” Key Engineering Materials 594 (2014): 465-470. http://www.scientific.net/KEM.594-595.465

36 THE U.S. COAL COMBUSTION PRODUCTS MARKET
figure 2-9: bottom ash utilization, 1974 to 2033
12
10
8
6
4
2
0
Historical Values Forecast 95% Confidence Intervals
mill
ions
of s
hort
tons
1974
1976
1978
1980
1982
1984
1986
1988
1990
1992
1994
1996
1998
2000
2002
2004
2006
2008
2010
2012
2014
2016
2018
2020
2022
2024
2026
2028
2030
2032
9.8
7.2
5.3
figure 2-10: bottom ash utilization rate, 1974 to 2033
70%
60%
50%
40%
30%
20%
10%
0%
Historical Values Forecast 95% Confidence Intervals
% o
f tot
al p
rodu
ctio
n
1974
1976
1978
1980
1982
1984
1986
1988
1990
1992
1994
1996
1998
2000
2002
2004
2006
2008
2010
2012
2014
2016
2018
2020
2022
2024
2026
2028
2030
2032
59%
49%
41%

Forecast 37
boiler slag utilizationThe utilization of boiler slag is expected to decline as supplies of the CCP are limited, decreasing from 909,000 short tons in 2013 to 755,366 million short tons in 2033.
In 2013, 98 percent of the boiler slag utilized was for roofing granules or blasting grit. Overall levels of boiler slag utilization over the next 20 years will be limited by supply as more wet-bottom boilers are retired in years to come. As a result, the overall utilization rate will remain high in this niche market.
figure 2-11: boiler slag utilization, 1974 to 2033
4.0
3.5
3.0
2.5
2.0
1.5
1.0
0.5
0.0
Historical Values Forecast 95% Confidence Intervals
mill
ions
of s
hort
tons
1974
1976
1978
1980
1982
1984
1986
1988
1990
1992
1994
1996
1998
2000
2002
2004
2006
2008
2010
2012
2014
2016
2018
2020
2022
2024
2026
2028
2030
2032
figure 2-12: boiler slag utilization rate, 1974 to 2033
100%90%80%70%60%50%40%30%20%10%
0%
Historical Values Forecast 95% Confidence Intervals
% o
f tot
al p
rodu
ctio
n
1974
1976
1978
1980
1982
1984
1986
1988
1990
1992
1994
1996
1998
2000
2002
2004
2006
2008
2010
2012
2014
2016
2018
2020
2022
2024
2026
2028
2030
2032
100%
1.0
98%
0.8
92%
0.6
38 THE U.S. COAL COMBUSTION PRODUCTS MARKET
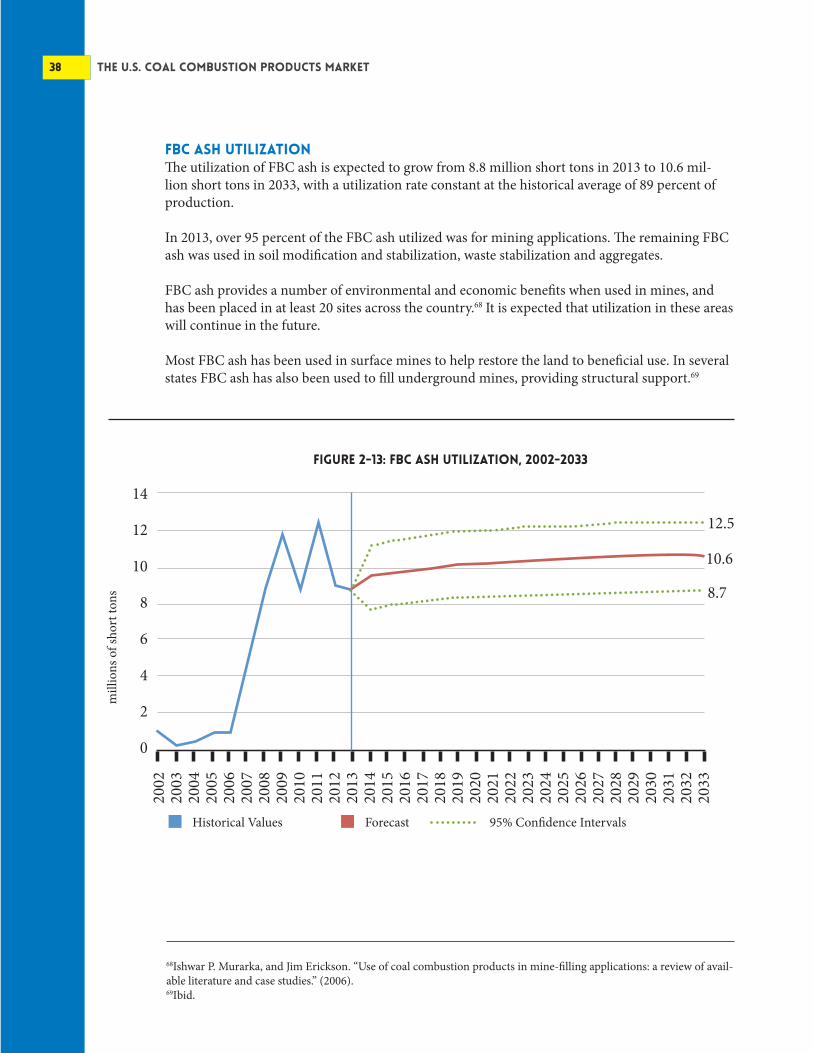
fbc ash utilizationThe utilization of FBC ash is expected to grow from 8.8 million short tons in 2013 to 10.6 mil-lion short tons in 2033, with a utilization rate constant at the historical average of 89 percent of production.
In 2013, over 95 percent of the FBC ash utilized was for mining applications. The remaining FBC ash was used in soil modification and stabilization, waste stabilization and aggregates.
FBC ash provides a number of environmental and economic benefits when used in mines, and has been placed in at least 20 sites across the country.68 It is expected that utilization in these areas will continue in the future.
Most FBC ash has been used in surface mines to help restore the land to beneficial use. In several states FBC ash has also been used to fill underground mines, providing structural support.69
68Ishwar P. Murarka, and Jim Erickson. “Use of coal combustion products in mine-filling applications: a review of avail-able literature and case studies.” (2006).69Ibid.
figure 2-13: FBC Ash utilization, 2002-2033
14
12
10
8
6
4
2
0
Historical Values Forecast 95% Confidence Intervals
mill
ions
of s
hort
tons
2002
2003
2004
2005
2006
2007
2008
2009
2010
2011
2012
2013
2014
2015
2016
2017
2018
2019
2020
2021
2022
2023
2024
2025
2026
2027
2028
2029
2030
2031
2032
2033
12.5
10.6
8.7

Forecast 39
alternative production scenarios for fly ash and fgd materialTwo additional outlooks for CCP production are included to show the potential growth in FGD material and fly ash, based on historical patterns and different modeling techniques.
table 3-1: Alternative scenarios (in millions short tons)
volume 2013 projected volume 2033
projected total growth
projected average annual
growth rate
FGD Material
Baseline Forecast
High Growth Scenario
Low Growth Scenario
Fly Ash
Baseline Forecast
High Growth Scenario
Low Growth Scenario
Total CCP Production
Baseline Forecast
High Growth Scenario
Low Growth Scenario
35.2
35.2
35.2
53.4
53.4
53.4
114.7
114.7
114.7
38.8
69.7
23.0
54.6
64.5
44.5
120.6
161.5
94.8
10.2%
98.0%
-34.7%
2.2%
20.8%
-16.7%
5.1%
40.8%
-17.3%
0.5%
3.5%
-2.1%
0.1%
0.9%
-0.9%
0.3%
1.7%
-0.9%

40 THE U.S. COAL COMBUSTION PRODUCTS MARKET
In the case of FGD material, the model still uses a Box-Jenkins methodology, but allows the fore-cast to put greater weight on the significant historical growth in FGD material production.
For fly ash production the alternative model recognizes a fundamental shift in the market after 1993 that is incorporated into the forecast. Testing shows that there is a break in the fly ash production data at this time—a significant increase in the mean of the series, as explained further in the methodology. Most likely this reflects a fundamental shift in the market after the enactment of the 1990 amendments to the Clean Air Act and the 1993 EPA regulatory determination that fly ash is not a hazardous waste.70 These alternative scenarios provide an additional upper and lower bound to the outlook, beyond the confidence intervals of the original forecast. Total CCP production ranges from 94.8 to 161.5 million short tons in 2033 under the different high and low growth outlooks.
The alternative low growth scenario assumes that the total volume of coal-fueled electric generation declines further over the next 20 years, following the “accelerated retirements” scenario from the EIA Annual Energy Outlook 2014. Coal–fueled electric generation would decline at an average annual rate of 1.4 percent, falling from 1.59 billion megawatt hours in 2013 to 1.19 billion megawatt hours in 2033, a drop of nearly 25 percent.
70http://www.epa.gov/osw/nonhaz/industrial/special/fossil/regs.htm
figure 3-1: high and low growth scenarios for ccp production, 1974 to 2033
250
200
150
100
50
0
mill
ions
of s
hort
tons
202.5
161.6
128.8116.394.877.7
Historical Values Higher Growth Scenario Low Growth Scenario
95% Confidence Intervals, Higher Growth 95% Confidence Intervals, Lower Growth
1974
1976
1978
1980
1982
1984
1986
1988
1990
1992
1994
1996
1998
2000
2002
2004
2006
2008
2010
2012
2014
2016
2018
2020
2022
2024
2026
2028
2030
2032

Forecast 41
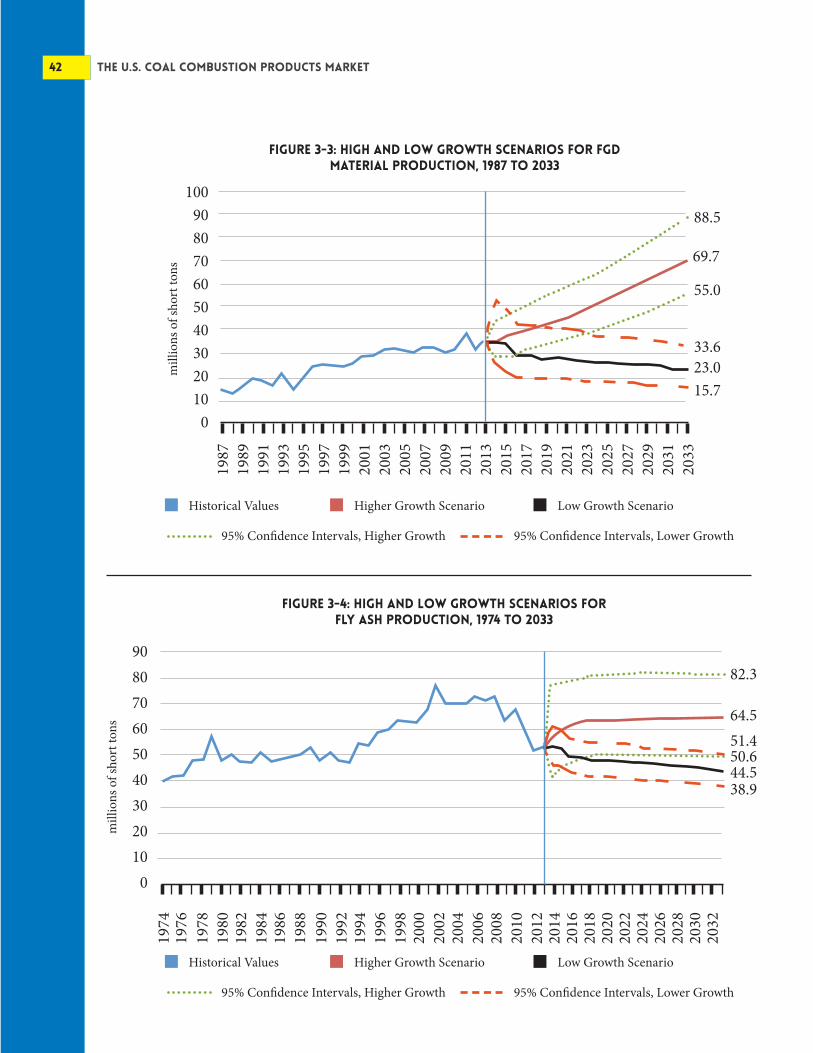
Under an alternative scenario, in which FGD production grows in line with its historical pattern, the model forecasts that production would reach 69.7 million short tons in 2033. This model does not take into account the outlook for coal-fueled electric generation, and represents an upper bound to the forecast.
Under a scenario of low growth and accelerated coal plant retirements and lower levels of coal-fueled electric generation, FGD production is forecast to fall to 23 million short tons. However this low growth scenario, given the importance of environmental regulations to the future of the energy industry, is very unlikely.
An alternative outlook for fly ash production is forecast to reach 64.5 million short tons in 2033. Under this scenario, fly ash production would grow at an average annual rate of one percent, which is just slightly above historical growth levels.
Using forecasted values for accelerated coal plant retirements from EIA, total fly ash production is forecast to fall to 44.5 million short tons in 2033 if total coal generated electricity falls more than expected.
figure 3-2: volume of coal generated electricity
1.80
1.60
1.40
1.20
1.00
0.80
0.60
0.40
0.20
0.00
trill
ion
kilo
wat
t hou
rs
2013
2014
2015
2016
2017
2018
2019
2020
2021
2022
2023
2024
2025
2026
2027
2028
2029
2030
2031
2032
2033
Accelerated Retirements Baseline Scenario
42 THE U.S. COAL COMBUSTION PRODUCTS MARKET
figure 3-3: high and low growth scenarios for FGD Material production, 1987 to 2033
100908070605040302010
0
mill
ions
of s
hort
tons
88.5
69.7
55.0
33.623.015.7
Historical Values Higher Growth Scenario Low Growth Scenario
95% Confidence Intervals, Higher Growth 95% Confidence Intervals, Lower Growth
figure 3-4: high and low growth scenarios for fly ash production, 1974 to 2033
908070605040302010
0
mill
ions
of s
hort
tons
82.3
64.5
50.651.4
44.538.9
Historical Values Higher Growth Scenario Low Growth Scenario
95% Confidence Intervals, Higher Growth 95% Confidence Intervals, Lower Growth
1974
1976
1978
1980
1982
1984
1986
1988
1990
1992
1994
1996
1998
2000
2002
2004
2006
2008
2010
2012
2014
2016
2018
2020
2022
2024
2026
2028
2030
2032
1987
1989
1991
1993
1995
1997
1999
2001
2003
2005
2007
2009
2011
2013
2015
2017
2019
2021
2023
2025
2027
2029
2031
2033
Forecast 43
methodologyA series of ten individual models were created for this study to forecast values for the production and utilization of fly ash, bottom ash, FGD material, boiler slag and FBC ash using Box-Jenkins methods.71 Additional “high growth” and “low growth” scenarios for fly ash and FGD material production are included to reflect different forecasts of the total volume of coal-fueled electricity generation in the U.S. Energy Information Administration 2014 Annual Energy Outlook.
The total utilization and production volumes for the CCP market are the sum of the five individual coal combustion products types.
The steps for the Box-Jenkins models include model identification and selection, estimating parameters, forecasting and model validation. In most cases the type of model selected was an autoregressive integrated moving average (ARIMA) model, or an autoregressive and moving average model with exogenous variables (ARMAX).
ARIMA models are a special type of regression model where an independent variable is forecast based on prior values in the time series and errors made by the previous predications.
The following steps and testing methods were used to determine the appropriate model specification and data transformations for the individual production and utilization models:
• Data Stationarity: The ACAA data on CCP production and use clearly follow an upward trend over time. The data were transformed to log format to create a stationary time series. The mean, variance and autocorrelations of a stationary data series are all constant over time.72
• Autocorrelations and Partial Autocorrelation Plots (ACF and PACF(: The ACF and PACF plots were reviewed to identify evidence of autocorrelation, a correlation between a data point and its previous values. The autocorrelations plot can be useful to determine if moving average specification should be included in an ARIMA model.
• Dickey-Fuller Unit Root Test: Data with a unit root in the series means that there is more than one trend. The Dickey-Fuller test is commonly used to determine if a data series is stationary. Analysis found that there was a unit root in the logged transformed data, and taking the first difference of the log was necessary to have a stationary time series for model estimation.
71Box GEP, Jenkins GM., Time series analysis, forecasting and control. Holden-Day, San Francisco, CA, 1970. 72Walter Enders. Applied Econometric Time Series.

44 THE U.S. COAL COMBUSTION PRODUCTS MARKET
The independent variables were estimated using an ARIMA or ARMAX model. The general ARIMA (p,d,q) model forecasts a time series based on the weighted sum of previous values of the dependent variable (1 …p), known as the autoregressive term, and the weighted sum of the previous forecast errors (1 …q), known as the moving average term. Finally, (d) is the total number of differences applied to the series to achieve stationarity. The basic ARIMA (p,1,q) model for independent X_t may be written compactly as:73
!! = !! + !! + !!!!!!
!
!!!
+ !!!!!!
!
!!!
Where Xt=Xt-Xt-1, the first difference of the independent variable and a0 β1….βp, and ρ1….ρq are parameters to be estimated and the εt-i are error terms. he values for p and q are determined using plots from the ACF and PACF plots. The ARMAX (p,q,b) model includes autoregressive terms (p), moving average terms (q) and a number of exogenous inputs (b) where η are the parameters of the exogenous inputs δ:
!! = !! + !! + !!!!!!
!
!!!
+ !!!!!!
!
!!!
+ !!!!!!!
!!!
A Dickey-Fuller unit root test on the residuals of the model results was implemented to test for cointegration.
73Ibid.

Forecast 45
MODEL SPECIFICATION:
• Fly Ash Production: An ARMAX (0,0,1) model where Xt is equal to the first difference of the log of the total annual volume of fly ash from 1974 to 2013. The exogenous input δ is the log of the total volume of coal generated electricity over the same time period from the U.S. EIA Annual Energy Outlook 2014 reference case scenario. The model is in growth rates and converted to levels.
• FGD Material Production: An ARMAX (1,0,1) model where Xt is equal to the first difference of the log of the total volume of FGD material from 1987 to 2013. The exogenous input δ is the log of the total volume of coal generated electricity over the same time period from the U.S. EIA Annual Energy Outlook 2014 reference case scenario. The model is in growth rates and converted to levels.
• Bottom Ash Production: An ARMAX (1,1,1) model where Xt is equal to the first difference of the log of the total volume of bottom ash from 1974 to 2013. The exogenous input δ is the log of the total volume of coal generated electricity over the same time period from the U.S. EIA Annual Energy Outlook 2014 reference case scenario. The model is in growth rates and converted to levels.
• Boiler Slag Production: An ARIMA (1,1,0) model of the log of the total volume of boiler slag from 1974 to 2013 with a constant. The model is in growth rate and converted to levels.
!! = !! + !!!!!!
!! = !! + !!!!!! + !!!!!!
!! = !! + !!!!!! + !!!!!! + !!!!!!
!! = !! + !! + !!!!!!
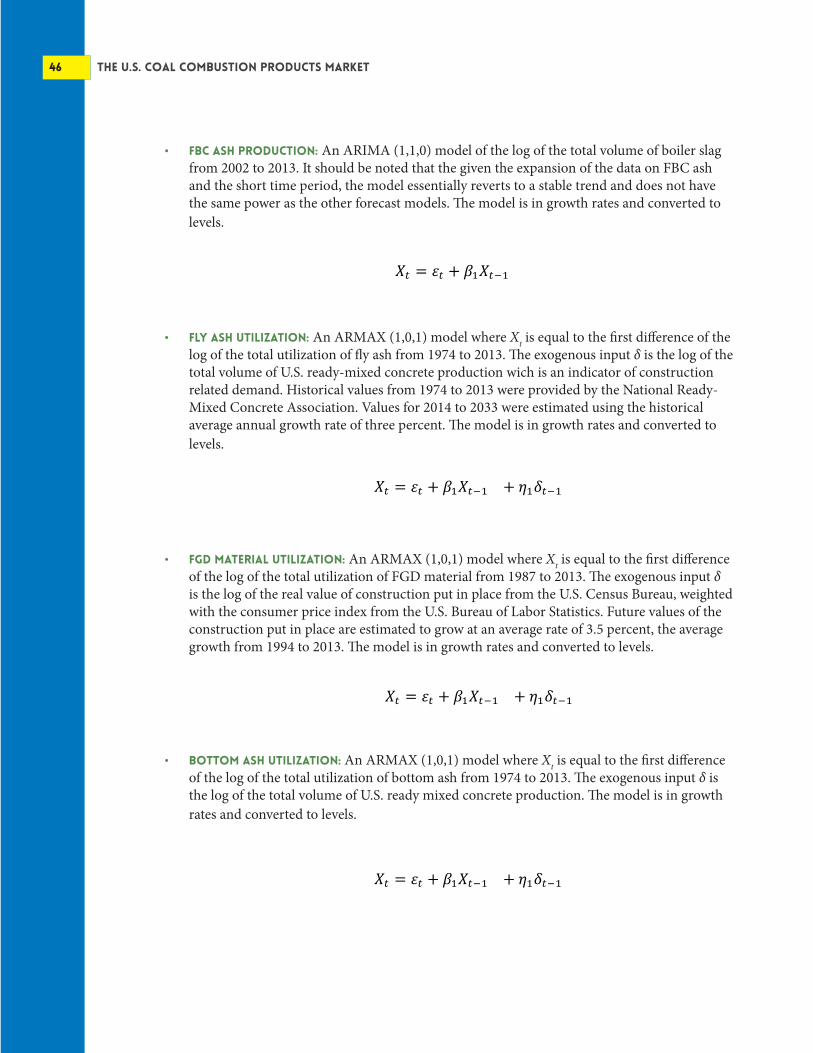
46 THE U.S. COAL COMBUSTION PRODUCTS MARKET
• FBC Ash Production: An ARIMA (1,1,0) model of the log of the total volume of boiler slag from 2002 to 2013. It should be noted that the given the expansion of the data on FBC ash and the short time period, the model essentially reverts to a stable trend and does not have the same power as the other forecast models. The model is in growth rates and converted to levels.
• Fly Ash Utilization: An ARMAX (1,0,1) model where Xt is equal to the first difference of the log of the total utilization of fly ash from 1974 to 2013. The exogenous input δ is the log of the total volume of U.S. ready-mixed concrete production wich is an indicator of construction related demand. Historical values from 1974 to 2013 were provided by the National Ready-Mixed Concrete Association. Values for 2014 to 2033 were estimated using the historical average annual growth rate of three percent. The model is in growth rates and converted to levels.
• FGD Material Utilization: An ARMAX (1,0,1) model where Xt is equal to the first difference of the log of the total utilization of FGD material from 1987 to 2013. The exogenous input δ is the log of the real value of construction put in place from the U.S. Census Bureau, weighted with the consumer price index from the U.S. Bureau of Labor Statistics. Future values of the construction put in place are estimated to grow at an average rate of 3.5 percent, the average growth from 1994 to 2013. The model is in growth rates and converted to levels.
• Bottom Ash Utilization: An ARMAX (1,0,1) model where Xt is equal to the first difference of the log of the total utilization of bottom ash from 1974 to 2013. The exogenous input δ is the log of the total volume of U.S. ready mixed concrete production. The model is in growth rates and converted to levels.
!! = !! + !!!!!!
!! = !! + !!!!!! + !!!!!!
!! = !! + !!!!!! + !!!!!!
!! = !! + !!!!!! + !!!!!!

Forecast 47
• Boiler Slag Utilization: An ARMAX (1,0,2) model where Xt is equal to the first difference of the log of the total utilization of boiler slag from 1974 to 2013. The exogenous input δ1 is the log of total production of boiler slag. The exogenous input δ2 is log of total housing starts. The historical value of housing starts from 1974 to 2013 is from the U.S. Census Bureau. Future values through 2024 are from the U.S. Congressional Budget Office. New Starts from 2025 through 2033 are based on historical growth. The model is in growth rates and converted to levels.
• FBC Ash Utilization: The total volume of FBC ash utilized is assumed to be 89.4 percent of total FBC ash production. This ratio is based on the historical average of FBC ash utilization between 2007 and 2013.
ALTERNATIVE SCENARIOS FOR THE FORECAST:Additional high and low growth scenarios are forecasted for the production and utilization of fly ash and FGD material.
The high growth FGD material production model is an ARIMA (1,1,0) model with a constant term that allows the forecast to take into account the historical growth of production.
The high growth fly ash production model is an ordinary least squares (OLS) model where the dependent variable is the log of fly ash production and the independent variables are the lagged value of the log of production and the log of megawatt hours of coal-fueled electricity generation.
!! = !! + !!!!!! + !!!! + !!!!
!! = !! + !! + !!!!!!
!! = !! + !!!!!! + !!!!
48 THE U.S. COAL COMBUSTION PRODUCTS MARKET
In time series analysis, a structural break in the data may make the results of a Dickey-Fuller test biased towards the nonrejection of a unit root.74 In other words, there may be a one-time change or shock to a time series that would usually be stationary. This shock changes the mean of the series, and the results of the Dickey-Fuller test suggest there may be a unit root, when actually there is a structural break.
A visual examination of the data for the production of fly ash, as well as both a Chow test and Perron test for structural change, indicate there is a structural break in the data series in the year 1994. At this point in time, the total production of fly ash increases significantly, suggesting that the entire market has shifted to a new mean.
The null hypothesis of a Chow test is that all of the errors in the model are independent and identically distributed form a normal distribution. Based on the test statistic, we can reject the null hypothesis and conclude that there is a structural break in the model. To account for this break we can split the data into two sub-samples.
The resulting forecast includes data from the EIA Annual Energy 2014 outlook for low oil and gas resources. In this scenario, more coal-fueled electricity generation is used to meet energy demand.
The low growth FGD material and fly ash models are the same as the baseline models, but the forecast for the total megawatt hours of coal-fueled electricity generation was taken from the EIA Annual Energy Outlook 2014 scenario for accelerated coal plant retirements. Thus the lower amount of coal consumption by power plants would impact total production of FGD material and fly ash.
74Ibid.