For theYearEnded March 31, 2019 - University of Calgary in ... · 4 *Other expenses include:...
12
Management Discussion & Analysis For the Year Ended March 31, 2019
Transcript of For theYearEnded March 31, 2019 - University of Calgary in ... · 4 *Other expenses include:...

Management Discussion & Analysis
For the Year EndedMarch 31, 2019
TABLE OF CONTENTS
MANAGEMENT DISCUSSION AND ANALYSIS OVERVIEW ......................................................................................................1
OPERATING ENVIRONMENT................................................................................................................................................................1
FINANCIAL RESULTS ...............................................................................................................................................................................1
NET ASSETS AND NET FINANCIAL ASSETS..................................................................................................................................7
CAPITAL EXPANSION AND RENEWAL .............................................................................................................................................8
AREAS OF SIGNIFICANT FINANCIAL RISK.....................................................................................................................................10

1
Management Discussion and Analysis Overview
This Management Discussion and Analysis (“MD&A”) should be read in conjunction with the University ofCalgary’s (“the University”) consolidated financial statements and accompanying notes for the year endedMarch 31, 2019. The MD&A and consolidated financial statements are reviewed and approved by theUniversity’s Board of Governors on the recommendation of the University’s Audit Committee. TheUniversity’s consolidated financial statements have been prepared in accordance with Canadian PublicSector Accounting Standards (“PSAS”).
The MD&A is an overview of the University’s financial results for the year ending March 31, 2019 and offersanalysis of the University’s:
1. Operating Environment2. Financial Results3. Net Assets and Net Financial Assets4. Capital Expansion and Renewal5. Areas of Significant Financial Risk
Operating Environment
The University of Calgary is an academic institution on the rise, making significant contributions to the local and provincial economies. The University’s main campus occupies a beautiful setting with a view of the Rocky Mountains, covering more than 200 hectares — an area larger than Calgary’s entire downtown.
The University of Calgary is focused on fulfilling the three foundational commitments of our Eyes High 2017-22 strategy: sharpen focus on research and scholarship; enrich the quality and breadth of learning; and integrate the University with the community.
Our Academic Plan and Research Plan, developed in 2017-18, resulted in three academic and three research priorities that have provided a roadmap for the achievement of our Eyes High vision. The vision and priorities established at the University are designed to show our community the benefits and rewards of integrating teaching, learning, and research in an environment where discovery, creativity, and innovation are central to the mission. Our priorities will continue to guide human, financial, and capital resource allocations for the foreseeable future. This trio of documents (Eyes High Strategy, Academic Plan, Research Plan), produced through broad consultation processes on our campus, has resulted in strong strategic decision-making that has moved the institution forward, while at the same time placed focus on prudent fiscal management.
Financial Results
For the year ended March 31, 2019, the University’s revenues exceeded expenses by $99.4 million. Thisannual operating surplus increased from the $5.0 million surplus in 2018. The primary drivers of this increase were the immediate recognition into revenue of the donation of the W.A Ranches, 19,000-acre cattle ranch, the donation of the Shell building, West Campus development lease revenue and equity pickup with positive variances from operations.
Total net assets have increased by $156.8 million from March 31, 2018 as the result of $99.4 million of annual operating surplus, $12.0 million of endowment donations, $39.0 million of net realized endowment income, and $19.0 million unrealized gains on non-endowment investments, which are partially offset by $12.6 million of unrealized losses on endowment investments.

2
Revenue
Total revenues for the year ended March 31, 2019, were $1,502.1 million, an increase of $99.8 million(7.1%) over the prior year and $102.8 million (7.3%) over budget. Revenue from the Government of Albertarepresented the University’s single largest source of income, at 45.9% of total University revenue, andplayed a key role in the ability to fund University activities. Major components of revenue are as follows:
Government of Alberta grantsGovernment of Alberta grant revenue of $690.1 million was $8.7 million higher than prior year and $13.4million lower than budget. The increase over prior year is primarily the result of $13.0 million of additional funding received from the Government of Alberta related to cost of living adjustments of 2.0% applied to the operating grant to compensate for the provincial tuition freeze. This additional operating funding from the Government of Alberta was offset by drop in funding for the following: $1.0 million Lights on Funding,$1.0 million in carbon tax refunds and $2.3 million from Alberta Innovates, Health Solutions.
Federal and other government grantsGrant revenue from federal and other government sources of $175.5 million was $10.1 million higher than prior year and $17.8 million higher than budget. The increase from the prior year and budget resultedfrom higher than anticipated revenue from research and special purpose and trust activities that occurred during the year.
32.1%
13.8%
11.7%
8.6%
16.1%
13.6%4.1%
Government of Alberta grants
Operating grant
Other provincial grants
Federal and other government grants
Sales of services and products
Student tuition and fees
Donations and other grants
Investment income (includesgovernment business enterprise)
Government ofAlberta grants
Federal and othergovernment grants
Sales of servicesand products
Student tuition andfees
Donations and othergrants
Investment income(includes
governmentbusiness enterprise)
703.5
157.7 124.0
231.8
134.0
48.2
690.1
175.5128.9
242.6 203.7
61.3
681.4
165.4 122.2
229.9
146.2 57.2
Revenue($ millions) Budget
2019
2018

3
Sales of services and productsSales of services and products revenue of $128.9 million was $6.7 million higher than the prior year and $4.9 million higher than budget. The increase from prior year and budget is a result of the change in the meal plan program and an increase in lease revenue received from West Campus Development Trust.
Student tuition and feesStudent tuition and fees of $242.6 million were $12.7 million higher than prior year and $10.8 million higher than budget. While tuition rates were held constant, the increase from prior year was as a result of increased enrolment of approximately 440 full-time equivalent international students.
Donations and other grantsDonations and other grant revenue of $203.7 million was $57.5 million higher than prior year and $69.7million higher than budgeted. The increase from the prior year and budget amounts is as a result of the $34.6 million W.A. Ranches donation, $8.0 million donation of a building, and other grant revenue from research and special purpose activities.
Investment income – Including investment income in government business enterprise
Investment income (including investment income in government business enterprise (“GBE”)) of $61.3
million was $4.1 million higher than prior year and $13.1 million higher than budget. The variance is due to
$2.5 million increase income from University’s investment in its GBE, West Campus Development
Corporation and $1.6 million higher than expected endowment income.
Expense
For the year ended March 31, 2019, the University recorded $1,402.7 million in expenses representing anincrease of $5.4 million (0.4%) over the prior year and $3.4 million (0.2%) higher than budget. Salariesand benefits are the largest expenditure component at the University, representing 57.4% of the University’sexpenses. Compensation expenses continue to be a challenge when making budgeting decisions,especially during times where increases in operating grants do not adequately fund increase in salaries that are often governed by union and faculty agreements.
Academic costs and institutional support represents the single largest function at the University, with thisfunction representing 58.4% of the University’s expenses. This includes instruction, non-research academic and administrative support activities, effectively representing the operating activities of the University.

4
*Other expenses include: Utilities, Maintenance and repairs, and Cost of goods sold.
57.4%21.2%
7.1%
9.5%4.8%
Expense by Object
Salaries andemployeebenefits
Materials,supplies, andservices
Scholarships andbursaries
Amortization oftangible capitalassets
Other*
Salaries andemployeebenefits
Materials,supplies, and
services
Scholarships andbursaries
Amortization oftangible capital
assets
Other
835.7
288.5
86.6 129.8 58.6
804.8
297.8
100.2 132.6 67.3
797.2
314.3
99.2 126.6 60.0
Expense - By Object($ million)
Budget
Mar-19
Mar-18
58.4%27.5%
5.4%5.4% 3.3%
Expense by Function
Academic costsand institutionalsupport
Research
Special purposeand trust
Facilitiesoperations andmaintenance
Ancillary services

5
Salaries and employee benefitsSalaries and employee benefits of $804.8 million have increased by $7.6 million over the prior year and decreased $30.9 million from budgeted amounts. The increase from prior year is primarily due to increased academic and institutional support salaries and benefits resulting from negotiated union agreement increases, new positions, and partially filled vacancies.
Materials, supplies and servicesMaterials, supplies and services of $297.8 million represent the second largest expense component of the University with current year costs $16.5 million lower than the prior year and $9.3 million higher than budget. Materials, supplies and services were lower than prior year due to the $5.0 million one-time early repayment of long term debt in 2017-18, $2.0 million finance interest savings resulting from the early repayment of the debt and $9.5 million reduced spending on externally restricted projects primarily in the faculties Arts,Science, and Kinesiology. Additional costs above budgeted amounts were primarily due to University spending on externally restricted projects relating to research and special purpose activities.
Scholarships and bursariesScholarships and bursaries of $100.2 million were $1.0 million higher than the prior year and $13.6 million above budget. These higher expenses are in line with University goals for attracting and supporting students across various faculties.
Amortization of tangible capital assetsAmortization of tangible capital assets expense of $132.6 million increased by $6.0 million from the prior year and $2.8 million over budget. The increase from prior year is a result of various new assets transferred into service, primarily related to the High Density library expansion, Utility Reduction program, Science A Redevelopment and additional trailing costs related to Schulich School of Engineering expansion.
OtherOther expenses totaling $67.3 million were $7.3 million higher than prior year and $8.7 million higher than budgeted amounts. Increase from prior year and budget were primarily due to $4.5 million higher costs relating to the change in student meal plans, unexpected repairs, and maintenance expenditures primarily in Information technology and the Cumming School of Medicine, and spending on infrastructure maintenance programs across campus.

6
Academic costs and institutional supportAcademic costs and institutional support expense of $818.9 million increased $7.9 million over the prioryear and decreased by $43.4 million compared to budget. The increase from prior year is primarily due to $18.7 million in increased salaries and benefits resulting from negotiated union agreement increases offset by reduced UAPP pension costs. While increased academic and support salary and benefit costs from negotiated union agreement increases were budgeted, the decreased costs versus budget are primarily from vacant positions and reduced UAPP pension costs.
Research and Special purpose and trustResearch costs of $386.4 million were consistent with prior year and $38.7 million higher than budget.This increase is due to the University’s strategic focus on directing resources and activities towards researchinitiatives in support of Eyes High goals for increased research across many faculties of the University.Special purpose and trust costs of $76.3 million was consistent with prior year and $3.7 million higher than budgeted amounts primarily due to increase of materials and supplies related to Postgraduate Medical Education projects.
Facilities operations and maintenanceFacilities operations and maintenance costs of $75.3 million were $2.8 million lower than prior year and $3.5 million higher than budget. The decrease from prior year is primarily due to savings from lower rates and demand on natural gas. The budget variance is a result of operating and maintaining a growing and aging campus infrastructure resulting in higher than budgeted expenditures.
Ancillary servicesAncillary expenditures of $45.8 million were $1.9 million higher than prior year and $0.9 million higher than budget primarily due to higher costs relating to the change in student meal plans offset by reduced salaries and benefit expenditures resulting from vacant employee positions.
Academic costsand institutional
support
Research Special purposeand trust
Facilitiesoperations andmaintenance
Ancillary services
862.3
347.7
72.6 71.8 44.9
818.9
386.4
76.3 75.3 45.8
811.0
387.1
77.2 78.1 43.9
Expense - By Function($ million)
Budget
Mar-19
Mar-18

7
Net Assets and Net Financial Assets
Net Assets
The University’s net asset balance is an important indicator of financial health for the University. Prudentfinancial planning and decision-making combined with increased endowment contributions from donorshave contributed to the University’s $1,826.7 million in net assets. Endowments of $991.1 million continueto represent the largest component of Net Assets. Endowments must be maintained in perpetuity.Investment income earned is used to fund specific research, scholarship, and donor supported initiatives.Of the remaining $835.6 million in net assets, $457.8 million represents funds previously spent as a net investment in capital assets and $360.8 million formally restricted by the University’s Board of Governorsfor spending on strategic initiatives in support of student learning, research, capital projects, andcommunity service. During the year, a $63.1 million net transfer to internally restricted net assets was approved by the Board of Governors to further research and strategic initiatives to drive Eyes High goals forward. In addition, the University used unrestricted net assets to fund $76.3 million of capital constructionand capital purchases and $5.4 million to repay University debt. After amounts spent on capital assets, Board of Governors restrictions, and debt repayment, $17.0 million remains in unrestricted net assets. Netassets at March 31, 2019 are comprised of the following balances and related summarized transactions:
Net Assets($ thousands) Unrestricted
Investmentin Capital
Assets
InternallyRestricted
EndowmentsTotal
Balance at March 31, 2018 $ 1,024 $ 363,565 $ 352,650 $ 952,665 $ 1,669,904
Annual operating surplus 99,410 - - - 99,410
Transfer to internally restricted net ofexpenditures (63,143) - 63,143 - -
Endowment
New contributions - - - 11,996 11,996
Capitalized investment income - - - 38,971 38,971
Tangible capital assets
Acquisition of capital assets (76,267) 131,214 (54,947) - -
Amortization of capital assets 42,399 (42,399) - - -
Debt repayment (5,391) 5,391 - - -
Change in accumulatedremeasurement gains 18,994 - - (12,572) 6,422
Balance at March 31, 2019 $ 17,026 $ 457,771 $ 360,846 $ 991,060 $ 1,826,703
0.9%
25.1%
19.7%
54.3%
Unrestricted
Investment in tangiblecapital assets
Internally restricted
Endowments

8
Net Financial Assets
The University’s liquidity needs are met primarily through operating cash flows, working capital balancesand capital expansion funding received through grants or long-term debt. The Net Financial Asset indicatoris intended to identify the availability of net financial resources of an organization to fund future operationsafter considering liabilities owed to third parties. The University presents the Net Financial Asset indicatorin a manner as directed by the Controller of the Province of Alberta. The presentation includes $991.1million of investments that are restricted for endowments. Portfolio investments – restricted for endowments must be maintained in perpetuity and are therefore not available to pay for University liabilities,nor can the University use the endowment portfolio investments to pay for future operating or capitalpurchases. As a result, net financial assets excluding portfolio investments restricted for endowments is presented on the Consolidated Statement of Financial Position.
At March 31, 2019 Net Financial Assets excluding portfolio investments restricted for endowments is $211.3 million, representing a $29.0 million increase from the prior year figures. This increase is the result of $99.4 in net revenues over expenses less the donation of tangible capital assets.
Capital Expansion and Renewal
On September 9, 2016, the federal government announced the University would receive funding for key campus infrastructure projects totaling $160.0 million from the Post-secondary Institution Strategic Investment Fund (“SIF”). Total funding from the federal government was $78.2 million with the remaining $81.8 million coming from a mix of provincial funding, philanthropy and the University’s own infrastructure dollars. Given the provincial government facilitated the payment for the SIF program, on behalf of the federal government, it was included within the Government of Alberta transactions and balances note within the financial statements.
Continuation of capital expansion and renewal projects remains a critical priority for the University, contributing to not only the student learning experience and the quality of research activity, but also positively to the Calgary economy. In 2019, the University expended $272.6 million (2018 - $196.7 million) on construction and other capital asset acquisitions. This increase in capital activity represents the continuation of the University’s multi-year capital building program through construction of new buildings as well as redevelopment, renovation, and numerous instructional facility upgrade projects.
The following represents progress on the top six major construction projects on campus:
Major Capital Project Costs($ thousands)
2019 Project to Date
Total Budget
Mackimmie Complex and Professional Faculties Building Redevelopment
68,810 83,174 290,000
Utility Reduction Program Year 3 5,492 5,512 6,500
High Density Library Expansion (SIF) 3,752 29,841 30,000
Science A Redevelopment, Phase 2, Early Works (SIF) 2,730 19,928 20,000
Research Facility Code Compliance 2,279 14,354 14,641
Cumming School of Medicine Health Informatics Centre 2,177 2,345 3,120
MacKimmie Complex and Professional Building - The program vision called for a completely renewed and repurposed MacKimmie Complex and targeted renovations to the Professional Faculties Building associated with the relocation of the Faculty of Social Work to the MacKimmie Tower and backfill of the space to accommodate Faculty of Nursing expansion. The redevelopment represents an opportunity to address many challenges as part of one integrated project including making best use of these two existing
9
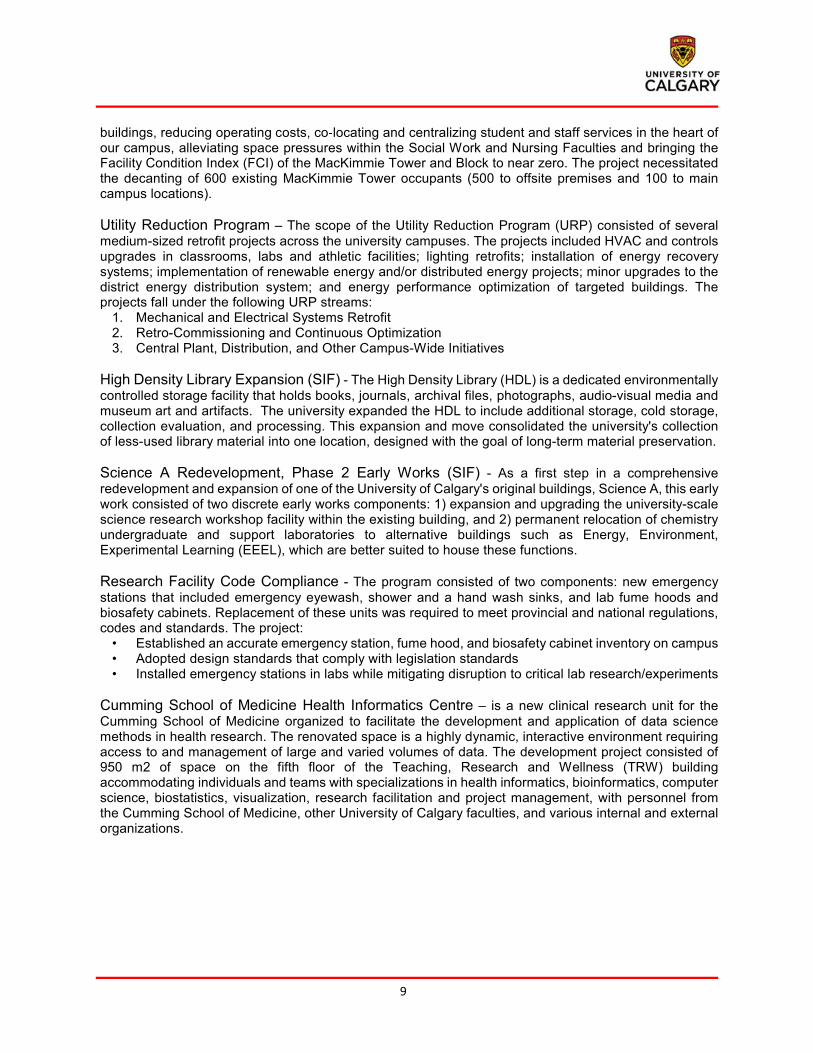
buildings, reducing operating costs, co-locating and centralizing student and staff services in the heart of our campus, alleviating space pressures within the Social Work and Nursing Faculties and bringing the Facility Condition Index (FCI) of the MacKimmie Tower and Block to near zero. The project necessitated the decanting of 600 existing MacKimmie Tower occupants (500 to offsite premises and 100 to main campus locations).
Utility Reduction Program – The scope of the Utility Reduction Program (URP) consisted of several medium-sized retrofit projects across the university campuses. The projects included HVAC and controls upgrades in classrooms, labs and athletic facilities; lighting retrofits; installation of energy recovery systems; implementation of renewable energy and/or distributed energy projects; minor upgrades to the district energy distribution system; and energy performance optimization of targeted buildings. The projects fall under the following URP streams:
1. Mechanical and Electrical Systems Retrofit2. Retro-Commissioning and Continuous Optimization3. Central Plant, Distribution, and Other Campus-Wide Initiatives
High Density Library Expansion (SIF) - The High Density Library (HDL) is a dedicated environmentally controlled storage facility that holds books, journals, archival files, photographs, audio-visual media and museum art and artifacts. The university expanded the HDL to include additional storage, cold storage, collection evaluation, and processing. This expansion and move consolidated the university's collection of less-used library material into one location, designed with the goal of long-term material preservation.
Science A Redevelopment, Phase 2 Early Works (SIF) - As a first step in a comprehensive redevelopment and expansion of one of the University of Calgary's original buildings, Science A, this early work consisted of two discrete early works components: 1) expansion and upgrading the university-scale science research workshop facility within the existing building, and 2) permanent relocation of chemistry undergraduate and support laboratories to alternative buildings such as Energy, Environment, Experimental Learning (EEEL), which are better suited to house these functions.
Research Facility Code Compliance - The program consisted of two components: new emergency stations that included emergency eyewash, shower and a hand wash sinks, and lab fume hoods and biosafety cabinets. Replacement of these units was required to meet provincial and national regulations, codes and standards. The project:
• Established an accurate emergency station, fume hood, and biosafety cabinet inventory on campus• Adopted design standards that comply with legislation standards• Installed emergency stations in labs while mitigating disruption to critical lab research/experiments
Cumming School of Medicine Health Informatics Centre – is a new clinical research unit for the Cumming School of Medicine organized to facilitate the development and application of data science methods in health research. The renovated space is a highly dynamic, interactive environment requiring access to and management of large and varied volumes of data. The development project consisted of 950 m2 of space on the fifth floor of the Teaching, Research and Wellness (TRW) building accommodating individuals and teams with specializations in health informatics, bioinformatics, computer science, biostatistics, visualization, research facilitation and project management, with personnel from the Cumming School of Medicine, other University of Calgary faculties, and various internal and external organizations.

10
Areas of Significant Financial Risk
Deferred MaintenanceThe University directs significant resources to ensure that University buildings are updated with relevant technology, operate efficiently, and meet university and external regulatory standards. The University has an outstanding deferred maintenance balance of $536.0 million (2018 - $512.2 million). Infrastructure Maintenance Program funding from the province increased to $22.5 million (2018 - $22.0 million) as compared to the prior year and was used to address deferred maintenance.
Unfunded Pension LiabilityThe University participates with other Alberta post-secondary institutions in the UAPP to provide pensionsfor participating faculty and staff. The extrapolated actuarial deficiency for the pension plan at March 31, 2019 is $996.5 million (2018 - $446.7 million) of which the University’s portion is $133.9 million (2018 -$37.1 million). This unfunded deficiency in the UAPP is currently being funded by the Government ofAlberta, employee and employer contributions. The deficiency will be eliminated by 2043.
Budgetary PressureAlthough the University has a balanced budget for 2019-20, it is presenting deficit forecasts for 2020-21and 2021-22. The University is facing a number of risk factors, most notably funding uncertainty related toprovincial operating funding. Without increases in provincial funding to offset inflationary costs, andcombined with legislatively mandated ceilings on tuition increases, the University will continue to exploreand implement process efficiencies and revenue generating opportunities. The University will continue towork in partnership with the government, to help bridge the gap between increasing costs and stagnantrevenues. While prudent financial management has resulted in balanced results, budgetary pressuresremain a significant strategic risk for the University of Calgary.

![Scene SCE CAT #: LED . Surface DATE: PROJECT: TYPE€¦ · Scene SCE LED . Surface 538.5 [21.2] 602.1 [23.7] 538.5 [21.2] 241.0 [9.5] 602.1 [23.7] 301.0 [11.9] 569 [22.4] 1142.0 [45.0]](https://static.fdocuments.net/doc/165x107/5f033b387e708231d4082fa3/scene-sce-cat-led-surface-date-project-scene-sce-led-surface-5385-212.jpg)