For the Year Ended March 31, 2005 - MHI
58
ANNUAL REPORT 2005 For the Year Ended March 31, 2005
Transcript of For the Year Ended March 31, 2005 - MHI

ANNUAL REPORT 2005For the Year Ended March 31, 2005
MITS
UB
ISH
I HE
AV
YIN
DU
STR
IES
LTDA
NN
UA
LR
EP
OR
T2005

CONTENTSFinancial Highlights . . . . . . . . . . . . . . . . . . . . . . . . . . . . . . . . . . . . . . . . . . . . . . . . . . . . 1
A Message from the Management . . . . . . . . . . . . . . . . . . . . . . . . . . . . . . . . . . . . . . . . . 2
Operating Environment and Performance
Dividend Reduced
2004 Business Plan Development
Support for the Revitalization of Mitsubishi Motors Corporation
Issues to Be Addressed
MHI at a Glance . . . . . . . . . . . . . . . . . . . . . . . . . . . . . . . . . . . . . . . . . . . . . . . . . . . . . . . 9
Review of Operations
Shipbuilding & Ocean Development . . . . . . . . . . . . . . . . . . . . . . . . . . . . . . . . . . . . 10
Power Systems . . . . . . . . . . . . . . . . . . . . . . . . . . . . . . . . . . . . . . . . . . . . . . . . . . . . 12
Machinery & Steel Structures . . . . . . . . . . . . . . . . . . . . . . . . . . . . . . . . . . . . . . . . . 14
Aerospace . . . . . . . . . . . . . . . . . . . . . . . . . . . . . . . . . . . . . . . . . . . . . . . . . . . . . . . 16
Mass and Medium-Lot Manufactured Machinery . . . . . . . . . . . . . . . . . . . . . . . . . . 18
Topics . . . . . . . . . . . . . . . . . . . . . . . . . . . . . . . . . . . . . . . . . . . . . . . . . . . . . . . . . . . . . . 20
Corporate Social Responsibility . . . . . . . . . . . . . . . . . . . . . . . . . . . . . . . . . . . . . . . . . . . 22
Corporate Governance . . . . . . . . . . . . . . . . . . . . . . . . . . . . . . . . . . . . . . . . . . . . . . . . . 23
Financial Section . . . . . . . . . . . . . . . . . . . . . . . . . . . . . . . . . . . . . . . . . . . . . . . . . . . . . . 26
Corporate Data . . . . . . . . . . . . . . . . . . . . . . . . . . . . . . . . . . . . . . . . . . . . . . . . . . . . . . 54
Board of Directors . . . . . . . . . . . . . . . . . . . . . . . . . . . . . . . . . . . . . . . . . . . . . . . . . . . . 55
OUR VISION:MHI, A PREMIER GLOBAL ORGANIZATION
FORWARD-LOOKING STATEMENTSThis report contains forward-looking statements regarding MHI’s plans, outlook, strategies and results for thefuture that are based on management’s estimates, assumptions and projections at the time of publication.Certain risks and uncertainties could cause MHI’s actual results to differ materially from any projectionspresented in this report. These risks and uncertainties include, but are not limited to, the domestic andinternational economic circumstances surrounding MHI’s businesses, competitive activity, related laws andregulations, product development programs and changes in exchange rates.
■ Live up to the trust of customers with outstanding technology
■ Help people worldwide lead safe and fulfilling lives
■ Aim for sustainable growth

1
ANNUAL REPORT 2005
TOTAL ASSETS(In billions of yen)
NET INCOME (LOSS)(In billions of yen)
NET SALES(In billions of yen)
3,500
1,000
1,500
2,000
2,500
3,000
500
04030201 050
40
-10
0
10
20
30
-20
04030201 05-30
5,000
1,000
2,000
3,000
4,000
04030201 050
FINANCIAL HIGHLIGHTSMitsubishi Heavy Industries, Ltd. and Consolidated SubsidiariesYears ended March 31, 2005 and 2004
In thousands ofU.S. dollars
In millions of yen except per share Percentexcept per share amounts amounts change
2005 2004 2005
Orders received ¥2,722,867 ¥2,662,844 $25,354,940 2.3%
Net sales 2,590,733 2,373,441 24,124,530 9.2
Operating income 14,773 66,631 137,560 (77.8)
Net income 4,050 21,787 37,711 (81.4)
Research and development costs 124,023 99,515 1,154,879 24.6
Capital expenditures 112,296 109,832 1,045,685 2.2
Depreciation and amortization 99,183 99,816 923,582 (0.6)
Per share of common stock:
Net income — basic ¥ 1.20 ¥ 6.46 $ 0.011 (81.4)%
Cash dividends 4.00 6.00 0.037 (33.3)
Total assets ¥3,831,144 ¥3,715,359 $35,675,057 3.1%
Stockholders’ equity 1,309,977 1,324,498 12,198,317 (1.1)
Short-term borrowings and long-term debt 1,172,896 1,101,269 10,921,837 6.5
Notes: 1. U.S. dollar amounts in this annual report are translated from yen, for convenience only, at the rate of ¥107.39 = U.S.$1, the exchange rateprevailing at March 31, 2005.
2. The accompanying consolidated financial statements for the years ended March 31, 2005 and 2004 have been compiled in accordancewith accounting principles and practices generally accepted in Japan.

2
ANNUAL REPORT 2005
Takashi Nishioka, Chairman: Lef tKazuo Tsukuda, President: Right
A MESSAGE FROM THE MANAGEMENT
Operating Environment and Performance
During the fiscal year ended March 31, 2005, the long-term decline in public-sector
spending continued and there were signs of a slowdown in capital investment, which has
supported recovery in the Japanese economy. Furthermore, while exports were generally
healthy, China’s tight monetary policies, higher interest rates in the U.S. and rapidly rising
crude oil prices led to some signs of a slowdown in the global economy. Consequently, in
the second half of the year, export growth slowed somewhat and the economy appeared
to be headed for a downturn.
In this operating environment, Mitsubishi Heavy Industries, Ltd. (MHI) and its consoli-
dated subsidiaries (MHI Group) posted a year-on-year increase in the value of orders
received of approximately 2.3%, to ¥2,722.9 billion (US$25,355 million). This reflected a
sustained high level of orders in the Shipbuilding & Ocean Development division, despite a
decline compared to the previous year when there was a succession of large-scale orders.
Additionally, the Machinery & Steel Structures division,
which won overseas orders for large-scale chemical
plants, and the Mass and Medium-Lot Manufactured
Machinery division, which benefited from strong
exports and overseas production of small and
medium-sized diesel engines and forklifts,
recorded higher year-on-year orders.
Moreover, the Power Systems division
recorded higher orders after signing a
number of contracts for gas turbine
combined cycle power plants, and
the Aerospace division also
reported a slight increase over the
previous fiscal year.

3
ANNUAL REPORT 2005
Net sales grew approximately 9.2% to ¥2,590.7 billion (US$24,125 million), thanks
to significant increases in sales in the Power Systems, Shipbuilding & Ocean Develop-
ment and Mass and Medium-Lot Manufactured Machinery divisions that more than
compensated for lower sales in the Machinery & Steel Structures division, where there
was a decline in sales generated by bridge construction, chemical plants and other
products.
During the year, MHI Group aggressively invested in R&D to develop new products
and businesses, while also working to strengthen the operating structure. This in-
cluded actions to boost production efficiency and upgrade product quality and
reliability, and to improve profitability. Unfortunately, these efforts failed to counter
the rapid rise in materials prices and other factors that squeezed profits, resulting in a
decline in operating income of ¥51.9 billion to ¥14.8 billion (US$138 million), and a
drop in ordinary income of ¥17.2 billion to ¥12.5 billion (US$117 million). After
recording extraordinary expense, including losses related to the application of asset-
impairment accounting for impairment of fixed assets, and extraordinary income from
gains on sales of investment securities and property, plant and equipment, carried out
from the perspective of enhancing asset efficiency, MHI Group recorded income before
income taxes and minority interests of ¥16.4 billion (US$153 million) and net income
of ¥4.1 billion (US$38 million).
Dividend Reduced
MHI decided not to pay an interim dividend during the year under review. In light of recent
operating performance, the decision was also taken to reduce the year-end dividend for
the March 2005 fiscal year by ¥2.0 to ¥4.0 per share.
Although MHI Group worked hard to drive a recovery in earnings this year, in the
Shipbuilding & Ocean Development division, orders received when the yen was weaker
were recorded as sales during the year under review, leading to deterioration in profit-
ability. In other divisions, because the time from order to delivery is often two or three
years, there were many cases where it was difficult for Group to reflect the escalating
cost of materials and resources in the sales price, resulting in lower profitability; an
unexpected rise in both the cost of maintaining the reliability of products already
delivered to customers and outsourcing costs due to efforts to increase output also
impacted on profitability. Group is also making significant investments in R&D to
develop products that will support operations in the future. These and other factors
resulted in a disappointing performance for the year under review. MHI also deeply
regrets that it had to make the decision to reduce the dividend to shareholders this year.

4
ANNUAL REPORT 2005
2004 Business Plan Development
Despite these challenging business conditions, MHI Group continued to implement the
core policy of its 2004 Business Plan (a four-year management plan beginning April 1,
2004)—making our businesses more competitive, supported by efforts to reinforce
business functions, with the goal of boosting orders and realizing a recovery in earnings.
Below are some of the steps we took during the year.
As part of efforts to make our businesses more competitive, the aerospace business
signed a memorandum of agreement with the Boeing Company to participate in the
development and production of Boeing’s next-generation commercial transport aircraft,
the Boeing 787. In a related move, construction began on a manufacturing facility at the
Nagoya Aerospace Systems Works that will be dedicated to the production of wing
sections made of composite material. The use of composite material wings in large
commercial transport aircraft will be a world first. The aerospace business also con-
cluded a contract with Rolls-Royce plc to participate in the joint development of the
TRENT 1000, a new jet engine for the Boeing 787. In another move, the 7th H-IIA
Launch Vehicle achieved a problem-free lift-off in February 2005, marking the first
successful launch for the H-IIA in 15 months and boosting confidence in its reliability.
The power systems business, meanwhile, worked to win new orders, particularly in Asia
and Central and South America, by tapping into strong demand in these regions. The
result was a raft of new orders for gas turbine combined cycle power plants in Thailand,
South Korea, China, Mexico, New Zealand and other countries. The Machinery & Steel
Structures business, leveraging its track record, won a contract for a large-scale fertilizer
plant in Oman. Finally, in order to keep pace with business growth, the Mass and
Medium-lot Manufactured Machinery business began adding manufacturing capacity
for small engines for industrial use and small turbochargers at the general machinery
Improve Profitability by Recovery in Business Volume
* A four-year management plan beginning April 1, 2004
Make Business More Competitive Reinforce Business Functions
2004 Business Plan*
Basic Policy

5
ANNUAL REPORT 2005
and special vehicle headquarters’ main factory in Sagamihara City, Kanagawa.
MHI Group also reinforced its industrial machinery business by setting up three
integrated development, manufacturing, sales and service companies in April 2005 for
food packaging machinery, injection molding machinery and commercial washing
machines. The aim was to create faster decision-making processes and enhance respon-
siveness to market and customer needs to give Group the ability to compete with
specialist manufacturers.
Meanwhile, in April 2004, as part of efforts to reinforce business functions, we
realigned sales companies in the mass and medium-lot manufactured machinery
business along product rather than regional lines, enabling them to respond more
rapidly to customer needs. Additionally, in our overseas business, we established local
companies in Singapore, South Korea, Brazil and India between December 2004 and
March this year in order to create the framework for more regionally focused marketing
activities and reinforce procurement capabilities. These moves to strengthen the MHI
Group’s overseas activities enabled us to sustain the high level of export orders achieved
in the previous fiscal year of close to ¥1,000 billion on a nonconsolidated basis. Further-
more, we established a New Business Development Fund in order to accelerate the
creation of businesses by making strategically targeted investments in new products and
fields. In the fund’s first year, we have decided to focus on medical equipment (3D
radiation treatment systems), semiconductor manufacturing equipment and home-use
robots. MHI is currently exhibiting some of its “wakamaru” home-use robots at the
2005 World Exposition in Aichi as part of aggressive PR activities for these products.
2005 2008(In billions of yen) (Actual) (2004 Business Plan)
Orders Received . . . . . . . . . . . . . . . . . . . . ¥2,722.9 ¥3,100.0
Net Sales . . . . . . . . . . . . . . . . . . . . . . . . . 2,590.7 3,000.0
Operating Income . . . . . . . . . . . . . . . . . . 14.8 160.0
Short-term Borrowings
and Long-term Debt . . . . . . . . . . . . . . . . 1,172.9 1,250.0
Consolidated Performance Targets

6
ANNUAL REPORT 2005
Support for the Revitalization of Mitsubishi Motors Corporation
Next, we would like to report on our support for the revitalization of Mitsubishi Motors
Corporation (MMC). In June 2004, MHI accepted and completed the payment for MMC
stock of ¥40 billion, offered through a private placement. The decision to inject addi-
tional capital into MMC was based on management’s judgment that a robust recovery in
the operations of MMC, through the implementation of its Business Revitalization Plan
announced in May 2004, would support the sustainability and development of MHI’s
own operations. Subsequently, however, MMC was subject to severe public criticism
regarding its past approach to product recall issues. MMC was then faced with an
extremely difficult business situation of weaker sales and declining trust in the company.
Under these circumstances, MMC announced its Mitsubishi Motors Revitalization
Plan in January 2005 incorporating additional measures. MHI accepted and completed
payment for additional MMC stock of ¥50 billion in a subsequent private placement in
March 2005. This decision to increase investment in MMC was based on three key
considerations—that this second plan is both highly rational and feasible; that we can
expect to further develop our own automotive-related businesses by more accurately
reading automaker needs for cars that promise stable global demand; and that by
supporting MMC’s revitalization we are fulfilling our corporate social responsibility.
With MHI Group’s ratio of voting rights in MMC exceeding 15% during the year
ending March 31, 2006, our policy will be to make MMC an equity-method affiliate
once more. In this way, we hope to play our part in winning back public trust in MMC
and further increasing the feasibility of the Mitsubishi Motors Revitalization Plan. We
believe that this will drive forward the development and expansion of our own
automotive-related businesses.
Highly accurate monitoring of information concerning market and technological trends in the automotive industry
Combine with collective strengths of MHI
Expand automotive operations Generate consolidated earnings
Participation in Management of MMC

7
ANNUAL REPORT 2005
Issues to Be Addressed
There are a number of concerns for the Japanese economy in the months ahead,
including high crude oil prices, rising materials prices, weaker growth in corporate
profits and, as a result, softer capital investment. Public-sector capital investment is also
expected to continue falling as a whole. Growth in the global economy, mainly in China
and the rest of Asia, is projected to gradually decline, leading to an expected moderate
decrease in the pace of export growth. Consequently, uncertainty about the direction of
the economy is expected to continue.
In this difficult business environment, the greatest and most urgent challenge for the
MHI Group will be how to boost earnings as quickly as possible. Every MHI Group director
and employee is aware of the seriousness of the situation. We have initiated emergency
activities that cut across the company, led by senior management, to improve profitability.
Our actions include paring back costs and enhancing productivity. Through these activities,
MHI Group will increase the quality and cost-competitiveness of all its product lines, create
and establish new businesses and products, such as the Boeing 787 commercial transport
aircraft, speed up efforts to make individual businesses more competitive and work
company-wide to reinforce business functions.
Specific steps to make MHI Group’s businesses more competitive will focus on the
following: the Shipbuilding & Ocean Development business will seek to secure a stable
supply of steel and actively work to increase productivity in order to minimize the impact
of exchange rate fluctuations and tight supplies and rising prices of steel. The business
will also continue to leverage its superior technologies to increase the tonnage value of
its products. The Power Systems business will continue to strengthen engineering,
procurement and construction (EPC) capabilities and work to procure materials at more
competitive prices in order to boost margins of mainstay gas turbine combined cycle
power plants and other products. This will go hand in hand with steps to use resources
more efficiently at the design and production stages to enhance cost-competitiveness.
The Machinery & Steel Structures business will target large-scale orders for chemical
plants by leveraging its experience and track record in methanol, fertilizer and other
plants, and strive to expand its overseas business by working to secure orders for new
transport systems and other products, particularly in Asia and the U.S. Initiatives such as
shortening production processes and strengthening risk management will also be
implemented in the interests of reducing costs. The aerospace business, meanwhile, will
steadily push forward the development of wings made of composite material for the
Boeing 787 and combustor modules, core components for the TRENT 1000 jet engine,
also for the Boeing 787. These are expected to be an important business going forward.

8
ANNUAL REPORT 2005
Takashi Nishioka, Chairman Kazuo Tsukuda, President
The Mass and Medium-lot Manufactured Machinery business will seek to realize the
benefits of increased production capacity in small and medium-sized diesel engines used
in power generation and other industrial applications, and automotive turbochargers to
meet growing demand for these products in the U.S., Europe and China. In machine
tools, the business will strategically channel resources into the automotive and other
fields where demand is projected to rise steadily, while further strengthening the
development and manufacturing framework for these products.
Enhancing MHI Group’s manufacturing capabilities through company-wide efforts will
be key to reinforcing business functions. Here our approach will be manifold: such as
effectively using the New Business Development Fund to create new products and
businesses, and reinforcing manufacturing capabilities in the wider sense by looking at
areas such as order processing, product development, design, and after-sales services, in
addition to reforming manufacturing itself. This will include boosting quality and reliability
in conjunction with further efforts to strengthen customer satisfaction initatives.
Amid intensifying global competition, MHI must ensure that its business keeps
evolving and that it fulfills its corporate social responsibility to customers, shareholders,
employees and society. To achieve this, MHI must be capable of taking swift and proper
decisions and executive actions, and importantly, ensure internal systems realize sound
management by monitoring the suitability of these decisions and actions. With this in
mind, MHI has decided to reform its corporate governance structure in June 2005 to
increase the soundness and transparency of company management, as well as improve
efficiency and responsiveness. Specifically, we will increase the number of outside
directors, reduce the number of directors on the board and their term of office, and
introduce an executive officer system. These moves will reinforce the oversight function
of the Board of Directors and clearly separate the roles of directors and executive
officers. Following these changes, directors will be responsible for making key manage-
ment decisions and overseeing overall management of MHI, while executive officers will
be responsible for the day-to-day running of the company.
Although the MHI Group is currently facing extremely challenging business conditions, by
steadily implementing the above measures, we believe we can increase MHI Group’s earnings
and take the company forward. Your support, as ever, will be vital to our endeavors.
July 2005

9
ANNUAL REPORT 2005
Note: MHI’s operations also include an Others business division, not shown above.
In the general machinery and special vehicles business, MHI develops andmanufactures products such as engines and forklift trucks for the logistics field.The air-conditioning and refrigeration systems business boasts an extensivelineup of air-conditioning products, while the industrial machinery businessmanufactures extrusion machinery, used in the production of plastic products,beverage filling and packaging machines and other industrial equipment. Thisdivision also includes the paper and printing machinery business, which meets adiverse range of customer needs in Japan and overseas as a specialist player inthe paper-related equipment field. Through its machine tools business, thisdivision also supplies the “mother machines” of industry.
This division uses research and development programs underpinned by state-of-the-art technologies to prepare for the advent of the next Space Age. Inaerospace products, MHI is working to expand its business into new areasthrough participation in projects for Japan’s Defense Agency and thedevelopment of new commercial aircraft. And in space systems, MHI helpsto drive forward Japan’s space program as a systems integrator in launchvehicle development.
In its machinery business, MHI boasts an extensive product range in fields asdiverse as environmental control systems, chemical plants and transportsystems. Through its steel structures business, MHI supplies bridges, stacks,hydraulic gates, transportation equipment, tunneling machinery and otherproducts that support industry and are vital to infrastructure in society today.MHI is also moving into new fields such as cultural, sports and leisure facilities.
Based on independent research efforts that strike a balance between solvingenergy supply issues and protecting the environment, MHI’s Power Systemsdivision develops energy conservation measures, petroleum substitutes andnew forms of energy to help solve some of the common problems faced bymankind today. MHI is also widely involved in the nuclear power field as oneof the world’s leading manufacturers of nuclear power plants.
Through its Shipbuilding & Ocean Development division, MHI plays anextensive role on the world’s oceans with the development and constructionof a wide range of large vessels and ocean structures that satisfy diversecustomer needs. Underpinned by more than a century of tradition and yearsof technological expertise, MHI is actively working to develop new productsthat raise the bar on economy, reliability and safety.
MHI’s businesses are classified below into five business divisions alongoperational lines.
MHI AT A GLANCE
POWER SYSTEMS
MACHINERY &STEEL STRUCTURES
AEROSPACE
MASS AND MEDIUM-LOT MANUFACTUREDMACHINERY
SHIPBUILDING &OCEAN DEVELOPMENT

REVIEW OF OPERATIONS
10
ANNUAL REPORT 2005
400
100
200
300
04030201 050
04030201 050
10
20
30(%)
0
100
200
300
Net Sales Share of Net Sales
04030201 05–20
–10
0
10
20
Crude oil carriers, Container ships, Cruise ships, Car ferries, LPG carriers, LNG carriers and various other ships, Defense vessels,Offshore structures
Products
SHIPBUILDING & OCEAN DEVELOPMENT
Car Ferry ”HAMANASU“
OPERATING INCOME (LOSS)(In billions of yen)
NET SALES (In billions of yen)SHARE OF NET SALES (%)
ORDERS RECEIVED(In billions of yen)

11
ANNUAL REPORT 2005
During the year, new order activity in the marine transport
market was buoyant, as demand for new shipbuilding
remained high. In this environment, the division actively
sought to win new orders, particularly for high-value-
added vessels, a market segment where MHI is strong.
These efforts paid off with orders received for a total of 23
new vessels (all figures in this section exclude vessels of
less than 100 gross tons). By vessel type, MHI secured
contracts for four mega container carriers capable of
carrying 8,100 TEU containers—the first time MHI has
won an order for this kind of vessel—eight LNG carriers,
two LPG carriers, six pure car and truck carriers, one
submarine for the Japan Defense Agency and other
vessels. However, reflecting the lack of large-scale orders
compared to a year earlier, the total value of new orders
declined to ¥299.4 billion (US$2,788 million). As of March
31, 2005, MHI had outstanding orders for 60 vessels
LNG Carrier ”PUTERI FIRUS SATU“ Patrol Vessel ”ASO“
totaling approximately 3.98 million gross tons.
Net sales were higher at ¥271.6 billion (US$2,529
million) on the back of an increase in vessel deliveries to
export customers and other factors.

REVIEW OF OPERATIONS
12
ANNUAL REPORT 2005
04030201 050
200
400
600
800
04030201 050
20
40
60
04030201 05
40
10
20
30
00
250
500
750
1,000(%)
Net Sales Share of Net Sales
Boilers, Steam turbines, Gas turbines, Diesel engines, Water turbines, Wind turbines, Nuclear power equipment, Nuclear fuel,Denitrification equipment, Marine machinery
Products
POWER SYSTEMS
Maizuru No.1 Thermal Power Station of The Kansai Electric Power Co., Inc.
OPERATING INCOME(In billions of yen)
NET SALES (In billions of yen)SHARE OF NET SALES (%)
ORDERS RECEIVED(In billions of yen)

13
ANNUAL REPORT 2005
Active global sales activities, centered on markets in Asia
and Central and South America with strong demand,
helped this division to win new contracts for gas turbine
combined cycle power plants and other power systems in
Thailand, Korea, China, Mexico and New Zealand. Orders
for the upgrade, refurbishment and repair of existing
power plants and for wind turbines to the U.S. also grew.
Other highlights included an order to supply replacement
steam generators for nuclear power plants in the U.S. In
Japan, although orders were weak for the upgrade,
refurbishment and repair of existing power plants, as
electric utilities reduced budgets for facility maintenance,
orders increased due in part to the closure of contracts for
new power plants. As a result, the total value of new
orders in this division increased year on year to ¥691.4
billion (US$6,438 million).
Work to Replace Reactor Core Internals (Reactor No.1, IkataNuclear Power Station, Shikoku Electric Power Co., Inc.)UEC-Eco Marine Diesel Engine
Net sales were higher at ¥629.7 billion (US$5,863
million) owing to an increase in construction orders for
thermal power plants and other factors.

REVIEW OF OPERATIONS
14
ANNUAL REPORT 2005
04030201 050
100
200
300
400
500
04030201 05–10
–5
0
5
10
04030201 050
200
400
600
0
10
20
30(%)
Net Sales Share of Net Sales
Waste treatment equipment, Flue gas desulfurization systems, Flue gas treatment systems and various other environmental controlsystems, Transportation systems and equipment, Petrochemical plants and various other chemical plants, Oil and gas production systems,Chemical machinery, Desalination plants, Iron and steel manufacturing machinery, Blowers, Packing machinery, Bridges, Hydraulic gates,Cranes, Stacks, Parking systems, Tanks, Entertainment facilities, Sports and leisure-related facilities, Various other steel structures
Products
MACHINERY & STEEL STRUCTURES
Electronic Toll Collection in Vehicle UnitContainer Handling Quayside Crane
OPERATING INCOME(In billions of yen)
NET SALES (In billions of yen)SHARE OF NET SALES (%)
ORDERS RECEIVED(In billions of yen)

15
ANNUAL REPORT 2005
In the machinery business, new orders declined in the
domestic market for waste treatment facilities and flue-
gas desulfurization systems, which the division secured
major orders for in the previous year. However, this drop
was more than offset by new contracts for large-scale test
equipment in the automotive industry, where capital
investment is currently strong, and a number of overseas
orders, including a large fertilizer plant in Oman and an
Automated People Mover in Dubai. Consequently, the
value of new orders secured in this business exceeded the
level in the previous fiscal year.
The steel structures business experienced a drop in
orders for crane & material handling systems and tunnel-
ing equipment, which the division had secured major
orders for in the previous fiscal year, in domestic and
overseas markets characterized by sustained and intense
price competition. Despite this, the business increased
Tunnel Excavation Machinery Innovative Transport System ”Crystal Mover“
the value of new orders secured thanks to new large-
scale contracts for bridge construction projects in Japan,
an LNG tank order in Mexico and other overseas orders.
Consequently, the total value of new orders in the
division as a whole increased to ¥455.6 billion
(US$4,242 million).
Net sales were lower at ¥459.4 billion (US$4,278
million), reflecting lower sales from bridge construction
projects, chemical plants and other products.

REVIEW OF OPERATIONS
16
ANNUAL REPORT 2005
04030201 050
100
200
300
400
500
04030201 050
10
20
30
40
50
04030201 05
30
10
20
00
200
400
600(%)
Net Sales Share of Net Sales
Fighters and other aircraft, Helicopters, Aero engines, Missiles, Torpedoes, Fleet engines, Space systems
Products
AEROSPACE
Boeing 777 Transport Aircraft
OPERATING INCOME(In billions of yen)
NET SALES (In billions of yen)SHARE OF NET SALES (%)
ORDERS RECEIVED(In billions of yen)
17
ANNUAL REPORT 2005
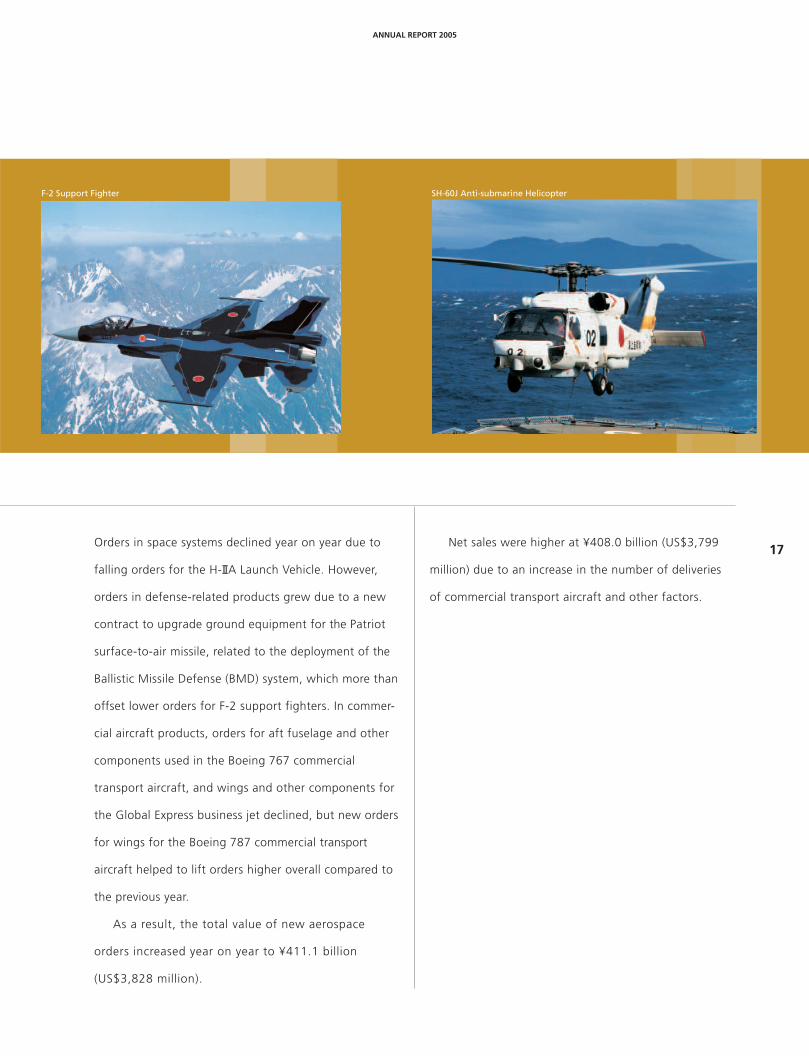
Orders in space systems declined year on year due to
falling orders for the H-IIA Launch Vehicle. However,
orders in defense-related products grew due to a new
contract to upgrade ground equipment for the Patriot
surface-to-air missile, related to the deployment of the
Ballistic Missile Defense (BMD) system, which more than
offset lower orders for F-2 support fighters. In commer-
cial aircraft products, orders for aft fuselage and other
components used in the Boeing 767 commercial
transport aircraft, and wings and other components for
the Global Express business jet declined, but new orders
for wings for the Boeing 787 commercial transport
aircraft helped to lift orders higher overall compared to
the previous year.
As a result, the total value of new aerospace
orders increased year on year to ¥411.1 billion
(US$3,828 million).
F-2 Support Fighter SH-60J Anti-submarine Helicopter
Net sales were higher at ¥408.0 billion (US$3,799
million) due to an increase in the number of deliveries
of commercial transport aircraft and other factors.

REVIEW OF OPERATIONS
18
ANNUAL REPORT 2005
04030201 050
200
400
600
800
04030201 05–10
–5
0
5
10
04030201 05
40
10
20
30
00
200
400
600
800(%)
Net Sales Share of Net Sales
Forklift trucks, Construction machinery, Earthmoving and grading machinery, Medium and small-sized engines, Turbochargers,Special vehicles, Air-conditioners (commercial use, residential), Automotive thermal systems, Chilling systems, Plastic processingmachinery, Food machinery, Industrial robots, Transmissions, Pulp and paper making machinery, Box-making machinery, Printingmachinery, Machine tools
Products
MASS AND MEDIUM-LOTMANUFACTURED MACHINERY
Mitsubishi Forklift Truck ”GRENDIA“Truck and Trailer Refrigeration Unit
OPERATING INCOME (LOSS)(In billions of yen)
NET SALES (In billions of yen)SHARE OF NET SALES (%)
ORDERS RECEIVED(In billions of yen)

19
ANNUAL REPORT 2005
In the general machinery and special vehicles business,
orders for small and medium-sized diesel engines and
forklift trucks were healthy on the back of strong demand
supported by economic recovery in Japan and overseas, and
high-paced growth in Asia, particularly China. Together
with rising orders for turbochargers in Europe, this led to an
increase in both the value of new orders secured and net
sales, to ¥347.4 billion (US$3,235 million) and ¥363.0
billion (US$3,380 million), respectively.
In the air-conditioning and refrigeration systems
business, orders for residential use air-conditioners and
commercial use air-conditioners in Europe rose and higher
orders were recorded for centrifugal liquid chillers in Japan.
However, sales of residential use air-conditioners in Japan
declined, and sales of automotive thermal systems were
weaker both in Japan and overseas. This led to a decline in
the value of new orders secured to ¥180.6 billion
(US$1,682 million), while net sales were on a par with the
Mitsubishi EVOL Box-making Machine Mitsubishi Gear Grinding Machine
previous year at ¥178.7 billion (US$1,664 million).
In the industrial machinery business in Japan, orders
grew for newspaper offset presses, as the division tapped
into new demand driven by capital investment related to
the shift to full-page color printing by newspaper publishing
companies. Also in Japan, the machine tools business,
which launched new products, including gear cutting
machines, saw orders increase, mainly from the automotive
industry, where capital investment is currently strong, while
new large-scale domestic orders for pulp and paper
machinery were also secured. Overseas, although sales of
sheet-fed offset presses were strong, exports of extrusion
machinery and pulp and paper machinery to China de-
clined. As a result, the value of orders secured dipped
slightly year on year to ¥219.9 billion (US$2,048 million).
Net sales rose to ¥216.2 billion (US$2,013 million), reflect-
ing stronger sales of printing machinery, machine tools and
other products in Japan.

20
ANNUAL REPORT 2005
TOPICS
Problem-free Lift-off for the 7th
H-IIA Launch Vehicle
On February 26, 2005 at 18:25 JST, the
domestically built 7th H-IIA Launch
Vehicle successfully lifted off from the
Tanegashima Space Center. MHI is a key
partner in the development and
manufacture of this rocket. The H-IIA
payload, the Multi-functional Transport
Satellite-1 Replacement (MTSAT-1R), was
safely delivered to geostationary orbit.
Standing at 53 meters, equivalent to the
height of a 17-storey building, the
standard H-IIA Launch Vehicle is capable
of carrying satellites weighing up to 6
tons. The H-IIA incorporates a liquid-
propellant rocket engine with a
reignition capability and other unique,
world-class technologies highly rated
overseas. MHI aims to take a more active
role in the launch service business in
2007 by taking orders itself for commer-
cial satellite launches using the H-IIA.
MHI to Help Boeing Develop
the 787
In October 2004, MHI signed a memo-
randum of agreement with Boeing of
the U.S. to take part in the development
and volume production of Boeing’s next-
generation passenger aircraft, the 787.
The aircraft, designed to carry 200–300
passengers, is scheduled to perform its
maiden flight in 2007, and to enter
service the following year.
MHI is responsible for developing the
787’s wing boxes, which will be fabri-
cated using a new, light and strong
composite material made from a
7th H-IIA Launch Vehicle
7th H-IIA Launch Vehicle Schematic
Payload fairing
Second-stage liquid hydrogen fuel tank
Second-stage liquid oxygen fuel tank
Second-stage engine
First-stage liquid oxygen fuel tank
First-stage liquid hydrogen fuel tank
Solid-fuel auxiliary rocket
Solid-fuel rocket booster
First-stage engine
Leng
th: 53m
©RSC
20

21
ANNUAL REPORT 2005
combination of carbon fiber and resin—
a world first for the wing of a commer-
cial aircraft. The wings are naturally one
of the most important parts of any
aircraft, and Boeing’s decision to select
an outside contractor to develop and
manufacture these components is a first
for the company. MHI believes that the
high regard in which its fabrication and
design capabilities are held undoubtedly
led to its participation in the project.
In a related development, in January
2005, MHI began construction of a new
factory dedicated to the production of
these composite main wing sections.
Fabrication is due to start at the end of
the year.
MHI Develops Japan’s First
100% Low-Floor LRV
MHI has developed a 100% low-floor
LRV*, the first made in Japan, in
partnership with The Kinki Sharyo Co.,
Ltd. and Toyo Electric Manufacturing
Co., Ltd. Called the Green Mover max,
the streetcar was delivered to Hiroshima
Electric Railway Co., Ltd. and entered
service in March 2005. Because the
vehicle uses independent wheels that
connect to the bogie without axles, MHI
and its partners have been able to create
a floor that is close to street level and
entirely flat, allowing passengers such as
the elderly and physically challenged to
board, alight and move around more
freely. Thanks to resilient wheels, the
development of a new system that
converts braking energy into electrical
power and other innovations, noise,
vibration and power consumption have
all been reduced, resulting in a vehicle
for public transport that is both eco- and
user-friendly.
* Light Rail Vehicle
Ultra-Low-Floor LRV
Boeing 787
21

22
ANNUAL REPORT 2005
CORPORATE SOCIAL RESPONSIBILITY
CSR: At the Heart of ManagementMHI’s corporate philosophy is to contribute to society
through its business activities. Based on this thinking,
we formulated a new vision for the company in 2003:
MHI, a Premier Global Organization. This vision
expresses our desire to continue driving the develop-
ment of the company by living up to the trust of
customers with outstanding technology, and helping
people worldwide lead safe and fulfilling lives. In
realizing this vision, we are working to achieve our
mission of enhancing MHI’s corporate value for all the
company’s stakeholders—shareholders, customers,
CSR Topics: MHI Takes Part in EXPO 2005Aichi, Japan
As part of its CSR activities, MHI is participating in
the 2005 World Exposition, which is located on a
site east of Nagoya, Aichi Prefecture, and runs from
March 25 to September 25, 2005. Based on the
overarching theme “Nature’s Wisdom,” the EXPO
seeks to bring together different people from
around the world to talk and think about how to
create new cultures, civilizations and a social model
for the 21st century.
As a member of the Mitsubishi Group, MHI has
exhibited in the Mitsubishi Pavilion at every
international exposition held in Japan since the
Osaka World Exposition 1970. The theme of the
Mitsubishi Pavilion at EXPO 2005 Aichi is “The
Wonder of Our Lives on Earth—A Glimpse of the
Miracle,” and gives visitors a view from space of
the remarkable balance between human activity
and the natural environment. The pavilion is
designed to communicate our stance on the
environment and present our point of view on
environmental issues for the 21st century. InMitsubishi Pavilion
parallel, we hope the exhibition will raise aware-
ness of the Mitsubishi Group’s new brand image.
MHI is supporting the exposition through
technical assistance for five pavilions, including the
construction of the main attraction at the
Mitsubishi Pavilion, the IFX Theatre. With this
realistic video space, visitors can experience what
the earth would be like without a moon, or gain an
understanding of how abundant the global
environment is today. The IFX Theatre’s highly
realistic imagery has already attracted tremendous
interest among visitors to the exposition.
employees and society. Based on this vision and
mission, we hope to play a part in building a brighter
future for people around the world.
For more details on our CSR activities, please view the MHI Social
and Environmental Report on our website.
(URL: http://www.mhi.co.jp/ekankyohozen/main.html)
22
ANNUAL REPORT 2005

23
ANNUAL REPORT 2005
CORPORATE GOVERNANCE
1. Fundamental PolicyMHI is taking a number of initiatives to enhance
management efficiency and strengthen compliance,
including reforming the management system to allow
more effective decision-making in response to radical
changes in the economic environment, and promoting
fair and sound management. The Group is also
working to make management more transparent by
disclosing information rapidly and accurately to
shareholders and other external stakeholders.
2. Corporate Governance Initiatives(1) Corporate Governance Framework
The Board of Directors makes important management
decisions and oversees the execution of business
operations. The Board of Auditors monitors the
execution of duties of the members of the Board of
Directors. For some time, MHI has sought to
strengthen management oversight functions through
the appointment of outside directors and corporate
auditors. Currently, of the 17 directors, two are from
outside MHI, while three of the five corporate auditors
are external appointments. Additionally, MHI has
established a Management Committee to provide a
forum for discussing important matters related to
executive actions. This allows for a more collegiate
approach to discussion as part of the operational
execution framework centered on the President, and
consequently leads to more appropriate management
decisions and business execution.
MHI also overhauled its corporate governance
system in June 2005 to improve the soundness and
transparency of management and increase speed and
flexibility in decision-making and policy execution. The
main components of this reform included streamlining
the Board of Directors while increasing the number of
outside directors, shortening the tenure of directors,
and implementing an executive officer system. These
modifications are aimed at enhancing the oversight
functions of the Board of Directors and clearly delineat-
ing the roles and responsibilities of directors, who are
responsible for general oversight of the Company’s
operations and making important business decisions,
and executive officers, who are responsible for the day-
to-day business and affairs of the Company.
(2) Enhancing Internal Control Systems
To ensure that business operations are appropriately and
effectively carried out, MHI has implemented the
following measures under the themes of compliance,
risk management, and monitoring, which are essential
to the establishment of internal control systems.
1. Strengthening and upgrading compliance activities
MHI carries out compliance activities on a broad scale
that encompasses not only all relevant laws and
regulations but also societal norms and business ethics.
Strict compliance activities are carried out throughout
the entire organization. Specific measures included the
establishment of a Compliance Committee, chaired by
the managing director in charge of the General Affairs
Department, in May 2001. Since then, MHI has
established the Mitsubishi Heavy Industries Compliance
Policy, set up a dedicated contact point for accepting
reports from employees and other individuals, and
implemented various programs, including periodic
compliance training. All of these measures are aimed
at increasing employee awareness about the impor-
tance of compliance.
To accurately understand the level of compliance
awareness among employees, MHI carries out a Compli-
ance Awareness Survey and has established other mecha-
nisms for periodically checking the effectiveness of
measures aimed at strengthening compliance.
Based on the results of these surveys and evaluations,
MHI decided to implement additional measures to
promote compliance across the Company. Consequently,
from the year under review, MHI has increased the
frequency of compliance training to two times per year,
and required every manager in the Company from the
section chief grade upward, including directors, to sign
cautionary compliance contracts.
2. Strengthening the risk management system
MHI conducts periodic risk assessments based on the
recognition that processes to accurately manage the
23
ANNUAL REPORT 2005

24
ANNUAL REPORT 2005
various business risks it faces are indispensable to its
survival as a firm. These assessments include the
detection and assessment of risks in each department
responsible for executing business operations, and the
formulation of necessary measures to prevent and
mitigate these risks. Internal auditing is also conducted
to check the appropriateness of these measures. In this
way, underpinned by consistent application of the Plan
Do Check Action (PDCA) cycle, MHI is able to conduct
appropriate risk management.
MHI has also constructed a Crisis Management
Data System to quickly and accurately deal with
emerging risks and to ensure risk information is
passed to senior management as rapidly as possible.
The Group’s risk management system is headed by
the managing director in charge of the General
Affairs Department, who is responsible for company-
wide crisis management, and is supported by indi-
viduals in each business unit responsible for crisis
management in their respective operating fields. MHI
also activates a Countermeasures Headquarters in the
event of an emergency.
3. Monitoring
MHI checks the effectiveness of internal control
systems through internal audits. Specifically, the
heads of each department responsible for business
execution set their own auditing themes and carry
out periodic checks. The Internal Auditing and
Control Department sets essential company-wide
auditing parameters and participates in the audits of
related business units, thereby creating a mechanism
for preserving objectivity. This department also
conducts special audits based on specific themes as
necessary.
Auditors, in addition to monitoring the execution
of internal checks, share information on specific
internal issues with the Internal Auditing and Control
Department. By strengthening cooperation between
auditors and departments in charge of compliance,
the Company’s overall internal auditing system is
enhanced. In order to further reinforce monitoring of
divisions responsible for business execution, MHI
established an Internal Audit Office on July 1, 2005 as
a dedicated internal audit organization.
(3) Auditing System
The Board of Auditors is comprised of five members,
three of whom are outside appointments. In accor-
dance with auditing policy and allocation of duties
determined by the Board of Auditors, auditors attend
other key meetings, including meetings of the manag-
ing directors and the business planning committee, in
addition to meetings of the Board of Directors. This
allows auditors to more effectively monitor the
execution of director duties by accurately assessing the
status of business execution, conducting spot checks
and compliance with relevant laws and regulations,
and monitoring activities involving the operation and
enhancement of internal control systems. To support
the activities of auditors, MHI established a six-person
Auditing Office to ensure that auditing activities are
carried out smoothly.
In addition, corporate auditors periodically ex-
change information with accounting auditors and
cooperate closely in other ways, including the receipt
of audit reports and the support of accounting audits
implemented as needed.
(4) Accounting Audits
MHI’s corporate auditor is Ernst & Young ShinNihon.
The names and years of continual auditing experience
of the firm’s certified public accountants (engagement
partners and management partners) that audit the
Company’s financial statements are listed below.
(Years of continual auditing experience)
Mineo Toyama (24 years)
Kouichi Hirao (1 year)
Masayuki Ueda (6 years)
Katsuhiko Hizawa (3 years)
In addition to the above, the auditing team
includes seven CPAs, three assistant CPAs, and one
other staff member.
24
ANNUAL REPORT 2005

25
ANNUAL REPORT 2005
Indictment Related to Alleged Violations ofAntimonopoly Law in Steel Bridge ConstructionOn June 15, 2005, MHI was indicted for alleged
violations of Japan’s Antimonopoly Law (improper
trading) related to steel bridge construction orders
from the Ministry of Land, Infrastructure and
Transport. MHI regards this situation and the
related ban on participating in government
tenders as extremely serious.
Over the years, MHI has continually empha-
sized the importance of compliance, and in
particular, expressly instructed employees to avoid
actions that could be construed as bid rigging in
relation to Japan’s Antimonopoly Law. However,
to ensure that this kind of incident never occurs
again, we will further strengthen the auditing
functions of the Internal Audit Department and
establish an Order Compliance Committee, which
will draw on the advice of both internal and
external experts to improve checks on order
process and individual projects. Other initiatives to
prevent reoccurrence will include an overhaul of
the personnel structure in sales divisions and
enhanced staff education and training.
3. Conflicts of Interest Between Outside Directorsand Auditors and the Company
None of the external directors or auditors has con-
flicts of interest with MHI. Outside director Mikio
Sasaki is Chairman of the Board of Directors of
Mitsubishi Corporation, which has a business relation-
ship with MHI.
Anchored by the above framework, MHI carries out
all its business activities based on its fundamental
management philosophy of striving to be a good
corporate citizen. This means making a meaningful
contribution to society with safe and advanced
products and services, observing all relevant laws and
social norms, and helping to protect the environment.
4. Director and Auditor RemunerationRemuneration paid to directors and corporate auditors
in the year under review was as follows.
Directors ¥573 million
Corporate auditors ¥ 52 million
Total ¥625 million
Note: In addition to the above, directors with concur-
rent positions as advisors received a total of ¥201
million for these services. In accordance with resolu-
tions passed at the 79th annual general meeting of
shareholders held on June 25, 2004, directors and
corporate auditors were paid bonuses of ¥436 million
and ¥47 million, respectively.
5. Audit FeesFees paid to independent auditors during the year
under review were as follows.
Fees related to audit certification ¥49 million
Note: The above amount represents fees paid to Ernst & Young
ShinNihon for audit certification pursuant to the Law for Special
Exceptions to the Commercial Code Concerning Audit and the
Securities and Exchange Law. The total amount paid to Shin
Nihon & Co. for audit certification by the Company and its
consolidated subsidiaries was ¥147 million.
ANNUAL REPORT 2005
25
26
ANNUAL REPORT 2005
CONTENTSConsolidated Six-year Summary . . . . . . . . . . . . . . . . . . . . . . . . . . . . . . . . . . . . . . . . . 27
Segment Information . . . . . . . . . . . . . . . . . . . . . . . . . . . . . . . . . . . . . . . . . . . . . . . . . 28
Management’s Discussion and Analysis . . . . . . . . . . . . . . . . . . . . . . . . . . . . . . . . . . . 30
Consolidated Balance Sheets . . . . . . . . . . . . . . . . . . . . . . . . . . . . . . . . . . . . . . . . . . . 34
Consolidated Statements of Income . . . . . . . . . . . . . . . . . . . . . . . . . . . . . . . . . . . . . . 36
Consolidated Statements of Stockholders’ Equity . . . . . . . . . . . . . . . . . . . . . . . . . . . 37
Consolidated Statements of Cash Flows . . . . . . . . . . . . . . . . . . . . . . . . . . . . . . . . . . . 38
Notes to Consolidated Financial Statements . . . . . . . . . . . . . . . . . . . . . . . . . . . . . . . 39
Report of Independent Certified Public Accountants . . . . . . . . . . . . . . . . . . . . . . . . 53
FINANCIAL SECTION

27
ANNUAL REPORT 2005
CONSOLIDATED SIX-YEAR SUMMARYMitsubishi Heavy Industries, Ltd. and Consolidated SubsidiariesYears ended March 31 of respective years
In thousands ofU.S. dollars
except per shareIn millions of yen except per share amounts amounts
2005 2004 2003 2002 2001 2000 2005
Net sales . . . . . . . . . . . . . . . . ¥2,590,733 ¥2,373,441 ¥2,593,894 ¥2,863,985 ¥3,045,024 ¥2,875,039 $24,124,530
Operating income (loss) . . . . 14,773 66,631 115,308 78,655 74,889 (23,797) 137,560
Interest expense
– net of interest income . . (5,590) (6,333) (8,394) (9,407) (7,708) (7,607) (52,046)
Income (loss) before income
taxes and minority interests . 16,399 50,124 66,162 48,028 (5,121) (217,672) 152,704
Net income (loss) . . . . . . . . . 4,050 21,787 34,331 26,447 (20,351) (137,006) 37,711
Per share of common stock:
Net income (loss) — basic . . ¥1.20 ¥6.46 ¥10.14 ¥7.84 ¥(6.03) ¥(40.62) $0.011
Net income — diluted . . . . – – – 7.82 – – –
Cash dividends . . . . . . . . . . 4.00 6.00 6.00 4.00 4.00 2.50 0.037
Total assets . . . . . . . . . . . . . . ¥3,831,144 ¥3,715,359 ¥3,666,866 ¥3,915,276 ¥4,236,634 ¥4,636,739 $35,675,057
Stockholders’ equity . . . . . . 1,309,977 1,324,498 1,270,968 1,282,727 1,278,242 1,245,064 12,198,317
Current assets . . . . . . . . . . . . 2,465,645 2,402,987 2,389,358 2,598,526 2,891,271 3,474,015 22,959,728
Current liabilities . . . . . . . . . 1,567,987 1,519,467 1,721,515 1,881,226 1,965,808 2,319,456 14,600,868
Short-term borrowings
and long-term debt . . . . . . 1,172,896 1,101,269 1,122,923 1,049,998 1,090,696 1,205,301 10,921,837
Note: U.S. dollar amounts in this annual report are translated from yen, for convenience only, at the rate of ¥107.39=U.S.$1,the exchange rate prevailing at March 31, 2005.

28
ANNUAL REPORT 2005
SEGMENT INFORMATIONMitsubishi Heavy Industries, Ltd. and Consolidated SubsidiariesYears ended March 31, 2005 and 2004
Net Sales Operating Income (Loss)
In thousands of In thousands ofIn millions of yen U.S. dollars In millions of yen U.S. dollars
INDUSTRY SEGMENT 2005 2004 2005 2005 2004 2005
Shipbuilding & Ocean Development . . . . . . . . ¥ 271,578 ¥ 200,096 $ 2,528,892 ¥(11,735) ¥(14,985) $(109,274)
Power Systems . . . . . . . . . . . . . . . . . . . . . . . . . . 629,665 549,895 5,863,354 16,089 23,476 149,813
Machinery & Steel Structures . . . . . . . . . . . . . . 459,366 471,505 4,277,545 (8,702) 9,668 (81,029)
Aerospace . . . . . . . . . . . . . . . . . . . . . . . . . . . . . . 407,956 392,242 3,798,828 8,751 29,585 81,487
Mass and Medium-Lot Manufactured Machinery . . 757,857 687,627 7,057,056 4,315 9,850 40,181
Others . . . . . . . . . . . . . . . . . . . . . . . . . . . . . . . . . 111,006 115,892 1,033,675 6,055 9,037 56,382
Subtotal . . . . . . . . . . . . . . . . . . . . . . . . . . . . 2,637,428 2,417,257 24,559,350 14,773 66,631 137,560
Eliminations or Corporate . . . . . . . . . . . . . . . . . (46,695) (43,816) (434,820) – – –
Total . . . . . . . . . . . . . . . . . . . . . . . . . . . . . . ¥2,590,733 ¥2,373,441 $24,124,530 ¥ 14,773 ¥ 66,631 $ 137,560
Total Assets Depreciation and Amortization
In thousands of In thousands ofIn millions of yen U.S. dollars In millions of yen U.S. dollars
INDUSTRY SEGMENT 2005 2004 2005 2005 2004 2005
Shipbuilding & Ocean Development . . . . . . . . ¥ 205,424 ¥ 260,480 $ 1,912,875 ¥ 6,220 ¥ 5,912 $ 57,918
Power Systems . . . . . . . . . . . . . . . . . . . . . . . . . . 754,185 750,856 7,022,857 22,220 22,708 206,913
Machinery & Steel Structures . . . . . . . . . . . . . . 584,315 524,870 5,441,053 9,646 9,563 89,824
Aerospace . . . . . . . . . . . . . . . . . . . . . . . . . . . . . . 634,543 626,728 5,908,773 17,485 17,187 162,820
Mass and Medium-Lot Manufactured Machinery . . 754,960 708,680 7,030,079 25,329 25,585 235,858
Others . . . . . . . . . . . . . . . . . . . . . . . . . . . . . . . . . 211,521 253,270 1,969,658 18,283 18,861 170,249
Subtotal . . . . . . . . . . . . . . . . . . . . . . . . . . . . 3,144,948 3,124,884 29,285,295 99,183 99,816 923,582
Eliminations or Corporate . . . . . . . . . . . . . . . . . 686,196 590,475 6,389,762 – – –
Total . . . . . . . . . . . . . . . . . . . . . . . . . . . . . . ¥3,831,144 ¥3,715,359 $35,675,057 ¥99,183 ¥99,816 $923,582
Impairment Losses on Fixed Assets Capital Expenditures
In thousands of In thousands ofIn millions of yen U.S. dollars In millions of yen U.S. dollars
INDUSTRY SEGMENT 2005 2004 2005 2005 2004 2005
Shipbuilding & Ocean Development . . . . . . . . ¥ 39 ¥ – $ 360 ¥ 5,292 ¥ 5,651 $ 49,280
Power Systems . . . . . . . . . . . . . . . . . . . . . . . . . . 113 – 1,054 18,722 20,541 174,339
Machinery & Steel Structures . . . . . . . . . . . . . . 262 – 2,439 8,808 10,192 82,018
Aerospace . . . . . . . . . . . . . . . . . . . . . . . . . . . . . . 72 – 675 25,687 17,905 239,189
Mass and Medium-Lot Manufactured Machinery . . 66 – 613 28,714 30,379 267,379
Others . . . . . . . . . . . . . . . . . . . . . . . . . . . . . . . . . 5,556 – 51,734 25,073 25,164 233,480
Subtotal . . . . . . . . . . . . . . . . . . . . . . . . . . . . 6,108 – 56,875 112,296 109,832 1,045,685
Eliminations or Corporate . . . . . . . . . . . . . . . . . – – – – – –
Total . . . . . . . . . . . . . . . . . . . . . . . . . . . . . . ¥6,108 ¥ – $56,875 ¥112,296 ¥109,832 $1,045,685
In thousands ofIn millions of yen U.S. dollars
Overseas Sales 2005 2004 2005
Overseas Sales . . . . . . . . . . . . . . . . . . . . . . . . . . ¥1,049,368 ¥892,659 $9,771,558
Ratio to Total Net Sales . . . . . . . . . . . . . . . . . . . 40.5% 37.6%
Notes: 1. U.S. dollar amounts in this annual report are translated from yen, for convenience only, at the rate of ¥107.39=US$1, the exchange rateprevailing at March 31, 2005.
2. The accompanying consolidated financial statements for the years ended March 31, 2005 and 2004 have been compiled in accordancewith accounting principles generally accepted in Japan.

29
ANNUAL REPORT 2005
25.3%
14.0%
15.5%
39.7%
0.9%2.7%
1.9%
(in billions of yen)
OPERATING INCOME (LOSS)BY INDUSTRY SEGMENT
■ North America■ Central and South America■ Europe■ Asia■ Oceania■ The Middle East■ Africa
(in billions of yen)
NET SALES BYINDUSTRY SEGMENT
3,500
3,000
500
1,000
1,500
2,000
2,500
04030201 050
150
100
0
50
04030201 05–50
COMPOSITION OF OVERSEASNET SALES BY GEOGRAPHICDISTRIBUTION
■ Others■ Shipbuilding & Ocean
Development■ Power Systems■ Machinery & Steel Structures■ Aerospace■ Mass and Medium-Lot
Manufactured Machinery
■ Others■ Shipbuilding & Ocean
Development■ Power Systems■ Machinery & Steel Structures■ Aerospace■ Mass and Medium-Lot
Manufactured Machinery
Net Sales Operating Income
In thousands of In thousands ofIn millions of yen U.S. dollars In millions of yen U.S. dollars
GEOGRAPHIC DISTRIBUTION 2005 2004 2005 2005 2004 2005
Japan . . . . . . . . . . . . . . . . . . . . . . . . . . . . . . . . . ¥2,416,826 ¥2,221,309 $22,505,129 ¥ 9,148 ¥61,691 $ 85,188
North America . . . . . . . . . . . . . . . . . . . . . . . . . . 166,332 168,895 1,548,856 2,726 1,465 25,385
Asia . . . . . . . . . . . . . . . . . . . . . . . . . . . . . . . . . . . 59,045 50,374 549,820 1,709 1,428 15,908
Europe . . . . . . . . . . . . . . . . . . . . . . . . . . . . . . . . 84,311 72,370 785,091 474 1,298 4,414
Others . . . . . . . . . . . . . . . . . . . . . . . . . . . . . . . . . 7,467 6,208 69,533 716 749 6,665
Subtotal . . . . . . . . . . . . . . . . . . . . . . . . . . . . 2,733,981 2,519,156 25,458,429 14,773 66,631 137,560
Eliminations or Corporate . . . . . . . . . . . . . . . . . (143,248) (145,715) (1,333,899) – – –
Total . . . . . . . . . . . . . . . . . . . . . . . . . . . . . . ¥2,590,733 ¥2,373,441 $24,124,530 ¥14,773 ¥66,631 $137,560
Total Assets
In thousands ofIn millions of yen U.S. dollars
GEOGRAPHIC DISTRIBUTION 2005 2004 2005
Japan . . . . . . . . . . . . . . . . . . . . . . . . . . . . . . . . . ¥2,902,734 ¥2,892,331 $27,029,836
North America . . . . . . . . . . . . . . . . . . . . . . . . . . 131,162 138,887 1,221,364
Asia . . . . . . . . . . . . . . . . . . . . . . . . . . . . . . . . . . . 37,359 31,814 347,883
Europe . . . . . . . . . . . . . . . . . . . . . . . . . . . . . . . . 64,546 54,042 601,039
Others . . . . . . . . . . . . . . . . . . . . . . . . . . . . . . . . . 9,147 7,810 85,173
Subtotal . . . . . . . . . . . . . . . . . . . . . . . . . . . . 3,144,948 3,124,884 29,285,295
Eliminations or Corporate . . . . . . . . . . . . . . . . . 686,196 590,475 6,389,762
Total . . . . . . . . . . . . . . . . . . . . . . . . . . . . . . ¥3,831,144 ¥3,715,359 $35,675,057

30
ANNUAL REPORT 2005
MANAGEMENT’S DISCUSSION AND ANALYSISMitsubishi Heavy Industries, Ltd. and Consolidated SubsidiariesAs of March 31, 2005
Analysis of Operating Results
In the year ended March 31, 2005, consoli-
dated net sales of Mitsubishi Heavy Industries,
Ltd. (MHI) and its consolidated subsidiaries
(MHI Group) increased 9.2%, or ¥217,292
million vis-á-vis the previous year, to
¥2,590,733 million (US$24,124,530 thou-
sand). This was mainly the result of substantial
sales growth in the Power Systems, Shipbuild-
ing & Ocean Development and Mass and
Medium-Lot Manufactured Machinery divi-
sions. Sales were lower in the Machinery &
Steel Structures division, mostly because of a
downturn in bridges, chemical plants and
other products.
Operating income fell ¥51,858 million, or
77.8%, to ¥14,773 million (US$137,560 thou-
sand) despite the increase in sales. Earnings
were held down by high research and develop-
ment expenditures associated with new products
and new businesses, a steep rise in the cost of
materials, an appreciation of the yen against the
U.S. dollar, and other items.
Net non-operating expenses were ¥2,234
million (US$20,799 thousand), ¥34,624 million
less than in the previous year. This was mainly due
to an improvement of ¥19,258 million in foreign
exchange gains and losses, and an increase in
equity in earnings of unconsolidated subsidiaries
and affiliates. Ordinary income was down
¥17,234 million, or 57.9%, to ¥12,539 million
(US$116,761 thousand).
Extraordinary income items were gains of
¥15,745 million (US$146,618 thousand) on
sales of investment securities and ¥10,357
million (US$96,442 thousand) on sales of fixed
assets. Extraordinary expenses were ¥22,242
million (US$207,117 thousand), which were
mainly composed of provision of reserve for
product warranties and losses on impairment
for fixed assets resulting from the adoption of
the new accounting standard.
Income before income taxes and minority
interests decreased ¥33,725 million, or 67.3%,
to ¥16,399 million (US$152,704 thousand), and
net income fell ¥17,737 million, or 81.4%, to
¥4,050 million (US$37,711 thousand).
Key Factors Affecting Operating
Results
Key factors which affect the management of
MHI Group include external factors such as
market trends, foreign exchange rate fluctua-
tions and changes in material costs, and inter-
nal factors such as risks associated with various
overseas business contracts, accidents and
disasters, etc.
Market trends
Recent situation of the market of the power
generation and public works field, which are
MHI Group’s key operating areas, include ongo-
ing curbs on public capital investment and inten-
sifying price-based competition. These have
resulted in a challenging operating environment
characterized by an increasingly shrinking mar-
ket. With few prospects of significant market
growth going forward, MHI Group will continue
to strive to maintain its position in this field as a
vital partner to its customers. This will mean
offering products and services which satisfy
customers’ needs by leveraging MHI Group’s
industry-leading technologies. MHI Group will
also work aggressively to strengthen its overseas

31
ANNUAL REPORT 2005
presence in China, Southeast Asia, Europe and
the U.S., target markets where there is potential
for substantial growth.
Exchange rate fluctuation
Foreign exchange rate fluctuation can signifi-
cantly affect MHI Group’s competitiveness and
operating results. In order to minimize ex-
change rate risk, MHI Group is increasing its
liabilities denominated in foreign currencies by
expanding the procurement of overseas materi-
als, promoting a greater use of yen-denomi-
nated contracts, and hedging risk with timely
forward foreign exchange contracts.
Changes in costs of materials
Rapidly rising prices for materials such as steel
products primarily reflecting the increase in the
demand from China in recent years, are driving
up the cost of steel and other raw materials.
There is also a concern about the increasing
difficulty of securing a steady supply of certain
materials. In response, MHI Group is working
harder to reduce costs by promoting design
standardization, increasing its utilization of com-
mon components, employing standardized parts,
signing comprehensive procurement contracts,
and expanding its overseas production activities.
MHI Group is also passing the price rises of ma-
terials on to customers. In order to secure the
supply of materials, MHI Group is strengthening
relationships with its business partners, promot-
ing an even greater level of information sharing,
and moving even more rapidly to secure the
materials essential to its business activities.
Overseas business contracts
MHI Group is exposed to a number of risks asso-
ciated with the business contracts, which it con-
cludes in overseas markets. These include the
quality and delivery dates of locally procured
materials and the skill levels and specific labor
practices of the local staff, as well as the risks
inherent in its contractual obligations such as
performance guarantees and the payment of
late delivery penalties. In order to mitigate these
risks, all contracts undergo a rigorous internal
assessment process prior to their formal conclu-
sion. In addition to the business headquarters
and the divisions concerned, the Global Strategic
Planning & Operations Headquarters, as well as
the Legal, Corporate Planning, Accounting, and
Finance Departments are all involved in this
process, which includes the verification of local
contractual obligations, the removal of unilateral
conditions, as well as other prudent steps.
Accidents and Disasters
Accidents and disasters can have a significant
impact on the management of MHI Group. In
managing this type of risk, MHI Group is taking
steps to minimize the probability of accidents
and disasters occurring by training employees
on the worksite to become more aware of risks
and by reforming worksite management.
Source of Funds and Liquidity
Cash flow analysis
Operating activities provided net cash of
¥107,066 million (US$996,980 thousand),
¥27,174 million less than in the previous year.
The impact on cash flows of the decline in
income before income taxes and minority

32
ANNUAL REPORT 2005
interests was greater than that of increased
revenue associated with growth in orders and
sales.
Investing activities used net cash of
¥163,322 million (US$1,520,830 thousand),
¥67,943 million more than the previous year. The
increase was mainly due to the payment of
¥90,000 million (US$838,062 thousand) for the
purchase of newly issued shares of Mitsubishi
Motors Corporation.
Financing activities provided net cash of
¥57,933 million (US$539,467 thousand) as debt
was increased to meet requirements for funds.
Primary funding requirements
MHI Group primarily requires funds for working
capital for manufacturing activities (materials,
outsourcing and personnel costs), order prepara-
tion costs and other sales expenses related to win-
ning new orders, and funds for R&D activities that
strengthen the product lineup and enhance the
competitiveness of MHI Group’s proprietary tech-
nologies. In investing activities, funds are required
for capital investment to grow the business and
enhance productivity, and for the purchase of
investment securities related to the execution of
business strategies.
MHI Group foresees growth in working
capital requirements in the coming years because
of expected growth in sales. In addition, MHI
Group is planning on making substantial capital
investment in the following areas: gas turbines
and other power systems; the Boeing 787 and
other commercial aircraft; and small and mid-
size engines for power generation and indus-
trial use. This is expected to result in greater
demand for funds for capital investment.
Breakdown of short-term borrowings and
long-term debt and their uses
Short-term borrowings and long-term debt as of
March 31, 2005 are as follows.
MHI Group is involved in numerous projects
with comparatively long construction schedules.
MHI Group also owns a number of manufactur-
ing facilities, which employ large-scale equip-
ment and machinery. Consequently, MHI Group
must secure a stable level of working capital and
funds for capital investments. Taking into ac-
count these factors and future interest rate pro-
jections, MHI Group’s funding procurements for
the current year resulted in short-term borrow-
In millions of yen In thousands of U.S. dollars
Due within Due after Due within Due afterTotal one year one year Total one year one year
Short-termborrowings . . . . . . ¥298,269 ¥298,269 ¥ – $2,777,436 $2,777,436 $ –
Long-termloans . . . . . . . . . . 600,316 51,672 548,644 5,590,056 481,165 5,108,891
Export loans . . . . . . 27,551 6,742 20,809 256,547 62,778 193,769Bonds . . . . . . . . . . . 246,760 33,426 213,334 2,297,798 311,261 1,986,537

33
ANNUAL REPORT 2005
current year, with a value of ¥3,762 million
(US$35,037 thousand). Repurchases of trea-
sury stock are expected to continue based on
the financial position of MHI Group, the stock
price, as well as recent earnings forecasts and
other factors.
ings and long-term debt of ¥390,109 million
(US$3,632,640 thousand) due within one year,
and of ¥782,787 million (US$7,289,197 thou-
sand) due after one year.
Short-term borrowings and long-term debt
are utilized as working capital and for capital
investment. MHI Group plans to use these
funds mainly in key areas such as gas turbines
and other power systems, the Boeing 787 and
other commercial aircraft, and for investments
to raise productivity of small and medium-
sized engines for power generation, industrial
use and other applications.
Financial Policy
MHI Group, in general, funds its working capital
and capital investments from its operating cash
flows. Any additional requirements can be met
with short-term borrowings and long-term debt.
In appropriately determining the amounts
and methods of procuring long-term funds
through long-term loans, bonds and other
means, MHI Group takes into account the
funding requirements of its business plans on
effect at that time, interest-rate trends and
various other factors as well as the amount of
and repayment schedule for its existing debt.
At the same time, MHI Group is working to
improve asset efficiency by reducing trade
receivables and inventories and by raising the
utilization rate of its property, plant and
equipment. Steps to utilize excess funds
effectively within MHI Group are aimed at
reducing the levels of short-term borrowings
and long-term debt.
MHI repurchased 13,408,000 shares of its
treasury stock on the open market during the

34
ANNUAL REPORT 2005
In thousands ofIn millions of yen U.S. dollars (Note 3)
ASSETS 2005 2004 2005
Current assets:
Cash and deposits (Notes 7 and 15) . . . . . . . . . . . . . . . . . . . . . . . ¥ 211,912 ¥ 209,806 $ 1,973,288
Trade receivables (Note 7):
Notes . . . . . . . . . . . . . . . . . . . . . . . . . . . . . . . . . . . . . . . . . . . . . . 47,857 44,241 445,634
Accounts . . . . . . . . . . . . . . . . . . . . . . . . . . . . . . . . . . . . . . . . . . . 1,001,036 951,065 9,321,503
Allowance for doubtful receivables . . . . . . . . . . . . . . . . . . . . . (6,613) (6,709) (61,575)
Securities (Notes 4 and 7) . . . . . . . . . . . . . . . . . . . . . . . . . . . . . . . 2,572 1,759 23,948
Inventories (Note 5) . . . . . . . . . . . . . . . . . . . . . . . . . . . . . . . . . . . . 958,513 975,977 8,925,534
Advances to suppliers . . . . . . . . . . . . . . . . . . . . . . . . . . . . . . . . . . 56,405 35,832 525,239
Deferred income taxes (Note 6) . . . . . . . . . . . . . . . . . . . . . . . . . . 65,501 59,819 609,936
Prepaid expenses and other current assets (Note 7) . . . . . . . . . . 128,462 131,197 1,196,221
Total current assets . . . . . . . . . . . . . . . . . . . . . . . . . . . . . . . . 2,465,645 2,402,987 22,959,728
Property, plant and equipment (Note 7):
Land . . . . . . . . . . . . . . . . . . . . . . . . . . . . . . . . . . . . . . . . . . . . . . . . 138,290 139,342 1,287,736
Buildings and structures . . . . . . . . . . . . . . . . . . . . . . . . . . . . . . . . 672,250 660,094 6,259,889
Machinery and equipment . . . . . . . . . . . . . . . . . . . . . . . . . . . . . . 1,382,966 1,368,540 12,877,979
Construction in progress . . . . . . . . . . . . . . . . . . . . . . . . . . . . . . . . 25,440 25,421 236,896
2,218,946 2,193,397 20,662,500
Less accumulated depreciation . . . . . . . . . . . . . . . . . . . . . . . . . . . (1,482,446) (1,450,165) (13,804,319)
Net property, plant and equipment . . . . . . . . . . . . . . . . . . . 736,500 743,232 6,858,181
Intangible assets . . . . . . . . . . . . . . . . . . . . . . . . . . . . . . . . . . . . . . . . 33,727 33,728 314,060
Investments and advances:
Investments in unconsolidated subsidiaries and affiliates
accounted for by the equity method . . . . . . . . . . . . . . . . . . . . . 95,591 89,987 890,129
Long-term loans and advances . . . . . . . . . . . . . . . . . . . . . . . . . . . 62,320 81,032 580,314
Investment securities (Note 4) . . . . . . . . . . . . . . . . . . . . . . . . . . . . 444,353 373,748 4,137,746
Deferred income taxes (Note 6) . . . . . . . . . . . . . . . . . . . . . . . . . . 9,745 22,797 90,747
Allowance for doubtful accounts . . . . . . . . . . . . . . . . . . . . . . . . . (51,712) (61,993) (481,535)
Net investments and advances . . . . . . . . . . . . . . . . . . . . . . . 560,297 505,571 5,217,401
Other assets . . . . . . . . . . . . . . . . . . . . . . . . . . . . . . . . . . . . . . . . . . . . 34,975 29,841 325,687
Total assets . . . . . . . . . . . . . . . . . . . . . . . . . . . . . . . . . . . . . . . ¥ 3,831,144 ¥ 3,715,359 $ 35,675,057 The accompanying notes to consolidated financial statements are an integral part of these statements.
CONSOLIDATED BALANCE SHEETSMitsubishi Heavy Industries, Ltd. and Consolidated SubsidiariesAs of March 31, 2005 and 2004

35
ANNUAL REPORT 2005
In thousands ofIn millions of yen U.S. dollars (Note 3)
LIABILITIES AND STOCKHOLDERS’ EQUITY 2005 2004 2005
Current liabilities:
Trade payables:
Notes . . . . . . . . . . . . . . . . . . . . . . . . . . . . . . . . . . . . . . . . . . . . . . ¥ 14,970 ¥ 21,197 $ 139,396
Accounts . . . . . . . . . . . . . . . . . . . . . . . . . . . . . . . . . . . . . . . . . . . 634,174 609,773 5,905,340
Short-term borrowings (Note 7) . . . . . . . . . . . . . . . . . . . . . . . . . . 298,269 300,211 2,777,436
Current portion of long-term debt (Note 7) . . . . . . . . . . . . . . . . 91,840 103,066 855,204
Advance payments received on contracts . . . . . . . . . . . . . . . . . . 363,448 327,301 3,384,373
Accrued expenses . . . . . . . . . . . . . . . . . . . . . . . . . . . . . . . . . . . . . . 65,819 70,163 612,900
Accrued income taxes . . . . . . . . . . . . . . . . . . . . . . . . . . . . . . . . . . 6,023 6,725 56,087
Reserve for product warranties . . . . . . . . . . . . . . . . . . . . . . . . . . . 11,913 – 110,932
Allowance for losses on construction contracts . . . . . . . . . . . . . . 6,401 649 59,605
Other current liabilities (Note 6) . . . . . . . . . . . . . . . . . . . . . . . . . . 75,130 80,382 699,595
Total current liabilities . . . . . . . . . . . . . . . . . . . . . . . . . . . . . . 1,567,987 1,519,467 14,600,868
Long-term liabilities:
Long-term debt (Note 7) . . . . . . . . . . . . . . . . . . . . . . . . . . . . . . . . 782,787 697,992 7,289,197
Deferred income taxes (Note 6) . . . . . . . . . . . . . . . . . . . . . . . . . . 17,465 21,584 162,628
Reserve for retirement allowance (Note 8) . . . . . . . . . . . . . . . . . 109,798 114,610 1,022,423
Other long-term liabilities . . . . . . . . . . . . . . . . . . . . . . . . . . . . . . . 27,919 22,991 259,980
Total long-term liabilities . . . . . . . . . . . . . . . . . . . . . . . . . . . . 937,969 857,177 8,734,228
Total liabilities . . . . . . . . . . . . . . . . . . . . . . . . . . . . . . . . . . . . . 2,505,956 2,376,644 23,335,096
Minority interests . . . . . . . . . . . . . . . . . . . . . . . . . . . . . . . . . . . . . . . 15,211 14,217 141,644
Stockholders’ equity (Notes 13 and 14):
Common stock, without par value:
Authorized—6,000,000,000 shares
Issued:
2005—3,373,647,813 shares . . . . . . . . . . . . . . . . . . . . . . . . . . 265,609 2,473,310
2004—3,373,647,813 shares . . . . . . . . . . . . . . . . . . . . . . . . . . 265,609
Capital surplus . . . . . . . . . . . . . . . . . . . . . . . . . . . . . . . . . . . . . . . . 203,855 203,854 1,898,267
Retained earnings . . . . . . . . . . . . . . . . . . . . . . . . . . . . . . . . . . . . . 741,234 747,872 6,902,268
Net unrealized gains on investment securities . . . . . . . . . . . . . . . 110,460 114,245 1,028,589
Foreign currency translation adjustments . . . . . . . . . . . . . . . . . . (6,007) (5,722) (55,940)
Treasury stock, at cost:
2005–18,481,426 shares . . . . . . . . . . . . . . . . . . . . . . . . . . . . . (5,174) (48,177)
2004–4,917,104 shares . . . . . . . . . . . . . . . . . . . . . . . . . . . . . . (1,360)
Total stockholders’ equity . . . . . . . . . . . . . . . . . . . . . . . . . . . 1,309,977 1,324,498 12,198,317
Total liabilities and stockholders’ equity . . . . . . . . . . . . . . . ¥3,831,144 ¥3,715,359 $35,675,057

36
ANNUAL REPORT 2005
CONSOLIDATED STATEMENTS OF INCOMEMitsubishi Heavy Industries, Ltd. and Consolidated SubsidiariesFor the years ended March 31, 2005 and 2004
In thousands ofIn millions of yen U.S. dollars (Note 3)
2005 2004 2005
Net sales . . . . . . . . . . . . . . . . . . . . . . . . . . . . . . . . . . . . . . . . . . . . . . . ¥2,590,733 ¥2,373,441 $24,124,530
Cost of sales . . . . . . . . . . . . . . . . . . . . . . . . . . . . . . . . . . . . . . . . . . . . 2,300,895 2,041,245 21,425,598
Gross profit . . . . . . . . . . . . . . . . . . . . . . . . . . . . . . . . . . . . . . . . . 289,838 332,196 2,698,932
Selling, general and administrative expenses . . . . . . . . . . . . . . . . . 275,065 265,565 2,561,372
Operating income. . . . . . . . . . . . . . . . . . . . . . . . . . . . . . . . . . . . 14,773 66,631 137,560
Non-operating income (expense):
Interest and dividend income . . . . . . . . . . . . . . . . . . . . . . . . . . . . 9,907 10,461 92,254
Equity in earnings of unconsolidated subsidiaries
and affiliates . . . . . . . . . . . . . . . . . . . . . . . . . . . . . . . . . . . . . . . . . 10,004 6,104 93,155
Foreign exchange gains . . . . . . . . . . . . . . . . . . . . . . . . . . . . . . . . . 1,632 – 15,193
Other income . . . . . . . . . . . . . . . . . . . . . . . . . . . . . . . . . . . . . . . . . 4,229 5,759 39,382
Interest expense . . . . . . . . . . . . . . . . . . . . . . . . . . . . . . . . . . . . . . . (15,497) (16,794) (144,300)
Losses on disposal of fixed assets . . . . . . . . . . . . . . . . . . . . . . . . . (4,933) (7,055) (45,934)
Foreign exchange losses . . . . . . . . . . . . . . . . . . . . . . . . . . . . . . . . – (17,626) –
Other expenses . . . . . . . . . . . . . . . . . . . . . . . . . . . . . . . . . . . . . . . . (7,576) (17,707) (70,549)
(2,234) (36,858) (20,799)
Ordinary income . . . . . . . . . . . . . . . . . . . . . . . . . . . . . . . . . . . . . 12,539 29,773 116,761
Extraordinary income (expense):
Gains on sales of investment securities . . . . . . . . . . . . . . . . . . . . . 15,745 – 146,618
Gains on sales of fixed assets (Note 9) . . . . . . . . . . . . . . . . . . . . . 10,357 5,733 96,442
Prior service cost due to change in defined interest
rate of employee retirement annuity . . . . . . . . . . . . . . . . . . . . . – 35,845 –
Provision of reserve for product warranties (Note 1) . . . . . . . . . (10,889) – (101,397)
Losses on impairment for fixed assets (Note 10) . . . . . . . . . . . . . (6,108) – (56,875)
Losses on damage from natural disasters . . . . . . . . . . . . . . . . . . . (3,466) – (32,281)
Business improvement and restructuring charges (Note 11). . . . (1,779) (20,208) (16,564)
Losses on revaluation of investment securities (Note 12) . . . . . . – (1,019) –
3,860 20,351 35,943
Income before income taxes and minority interests . . . . . . . . 16,399 50,124 152,704
Income taxes (Note 6)
Current . . . . . . . . . . . . . . . . . . . . . . . . . . . . . . . . . . . . . . . . . . . . . . 3,540 6,764 32,964
Deferred . . . . . . . . . . . . . . . . . . . . . . . . . . . . . . . . . . . . . . . . . . . . . 7,927 20,946 73,813
Minority interests . . . . . . . . . . . . . . . . . . . . . . . . . . . . . . . . . . . . . . . 882 627 8,216
Net income . . . . . . . . . . . . . . . . . . . . . . . . . . . . . . . . . . . . . . . . . ¥ 4,050 ¥ 21,787 $ 37,711
In U.S. dollarsIn yen (Note 3)
Per share of common stock: 2005 2004 2005
Net income (Note 1) . . . . . . . . . . . . . . . . . . . . . . . . . . . . . . . . . . . . ¥1.20 ¥6.46 $0.011
Cash dividends . . . . . . . . . . . . . . . . . . . . . . . . . . . . . . . . . . . . . . . . 4.00 6.00 0.037 The accompanying notes to consolidated financial statements are an integral part of these statements.

37
ANNUAL REPORT 2005
CONSOLIDATED STATEMENTS OF STOCKHOLDERS’ EQUITYMitsubishi Heavy Industries, Ltd. and Consolidated SubsidiariesFor the years ended March 31, 2005 and 2004
In thousands ofIn millions of yen U.S. dollars (Note 3)
2005 2004 2005
Common stock:
Balance at beginning of year . . . . . . . . . . . . . . . . . . . . . . . . . . . . ¥ 265,609 ¥ 265,609 $ 2,473,310
Balance at end of year . . . . . . . . . . . . . . . . . . . . . . . . . . . . . . . . . . 265,609 265,609 2,473,310
Capital surplus:
Balance at beginning of year . . . . . . . . . . . . . . . . . . . . . . . . . . . . 203,854 203,853 1,898,262
Gains on sales of treasury stock (Note 13) . . . . . . . . . . . . . . . . . . 1 1 5
Balance at end of year . . . . . . . . . . . . . . . . . . . . . . . . . . . . . . . . . . 203,855 203,854 1,898,267
Retained earnings:
Balance at beginning of year . . . . . . . . . . . . . . . . . . . . . . . . . . . . 747,872 745,288 6,964,077
Net income . . . . . . . . . . . . . . . . . . . . . . . . . . . . . . . . . . . . . . . . . . . 4,050 21,787 37,711
Cash dividends (Note 13) . . . . . . . . . . . . . . . . . . . . . . . . . . . . . . . . (10,107) (20,239) (94,110)
Bonuses to directors and statutory auditors . . . . . . . . . . . . . . . . – (120) –
(Decrease) increase resulting from inclusion of
consolidated subsidiaries and companies accounted
for by the equity method . . . . . . . . . . . . . . . . . . . . . . . . . . . . . . (99) 1,156 (919)
Decrease resulting from exclusion of affiliates accounted
for by the equity method . . . . . . . . . . . . . . . . . . . . . . . . . . . . . . (482) – (4,491)
Balance at end of year . . . . . . . . . . . . . . . . . . . . . . . . . . . . . . . . . . 741,234 747,872 6,902,268
Net unrealized gains on investment securities:
Balance at beginning of year . . . . . . . . . . . . . . . . . . . . . . . . . . . . 114,245 59,984 1,063,836
Change during the year . . . . . . . . . . . . . . . . . . . . . . . . . . . . . . . . . (3,785) 54,261 (35,247)
Balance at end of year (Note 13) . . . . . . . . . . . . . . . . . . . . . . . . . 110,460 114,245 1,028,589
Foreign currency translation adjustments:
Balance at beginning of year . . . . . . . . . . . . . . . . . . . . . . . . . . . . (5,722) (3,621) (53,286)
Change during the year . . . . . . . . . . . . . . . . . . . . . . . . . . . . . . . . . (285) (2,101) (2,654)
Balance at end of year . . . . . . . . . . . . . . . . . . . . . . . . . . . . . . . . . . (6,007) (5,722) (55,940)
Treasury stock:
Balance at beginning of year . . . . . . . . . . . . . . . . . . . . . . . . . . . . (1,360) (145) (12,668)
Change during the year . . . . . . . . . . . . . . . . . . . . . . . . . . . . . . . . . (3,814) (1,215) (35,509)
Balance at end of year . . . . . . . . . . . . . . . . . . . . . . . . . . . . . . . . . . (5,174) (1,360) (48,177)
Total balance at end of year . . . . . . . . . . . . . . . . . . . . . . . . . . . . . . . ¥1,309,977 ¥1,324,498 $12,198,317 The accompanying notes to consolidated financial statements are an integral part of these statements.

38
ANNUAL REPORT 2005
In thousands ofIn millions of yen U.S. dollars (Note 3)
2005 2004 2005
Cash flows from operating activities:Income before income taxes and minority interests . . . . . . . . . . . . . . . . . . . . . . ¥ 16,399 ¥ 50,124 $ 152,704Adjustments to reconcile income before income taxes andminority interests to net cash provided by operating activities:Depreciation and amortization . . . . . . . . . . . . . . . . . . . . . . . . . . . . . . . . . . . . . 99,183 99,816 923,582Losses on impairment for fixed assets . . . . . . . . . . . . . . . . . . . . . . . . . . . . . . . . 6,108 – 56,875Decrease in reserve for retirement allowance . . . . . . . . . . . . . . . . . . . . . . . . . (4,803) (1,684) (44,722)Interest and dividend income . . . . . . . . . . . . . . . . . . . . . . . . . . . . . . . . . . . . . . (9,907) (10,461) (92,254)Interest expense . . . . . . . . . . . . . . . . . . . . . . . . . . . . . . . . . . . . . . . . . . . . . . . . . 15,497 16,794 144,300Equity in earnings of unconsolidated subsidiaries and affiliates . . . . . . . . . . (10,004) (6,104) (93,155)Gains on sales of investment securities . . . . . . . . . . . . . . . . . . . . . . . . . . . . . . . (15,745) – (146,618)Gains on sales of fixed assets . . . . . . . . . . . . . . . . . . . . . . . . . . . . . . . . . . . . . . . (10,357) – (96,442)Prior service cost due to change in defined interestrate of employee retirement annuity . . . . . . . . . . . . . . . . . . . . . . . . . . . . . . . – (35,845) –
Provision of reserve for product warranties . . . . . . . . . . . . . . . . . . . . . . . . . . . 10,889 – 101,397Losses on damage from natural disasters . . . . . . . . . . . . . . . . . . . . . . . . . . . . . 3,466 – 32,281Business improvement and restructuring charges . . . . . . . . . . . . . . . . . . . . . . 1,779 20,208 16,564(Increase) decrease in receivables . . . . . . . . . . . . . . . . . . . . . . . . . . . . . . . . . . . (53,198) 57,200 (495,370)Decrease (increase) in inventories and advances to suppliers . . . . . . . . . . . . . 53,102 (64,495) 494,478Increase in other assets . . . . . . . . . . . . . . . . . . . . . . . . . . . . . . . . . . . . . . . . . . . (41,711) (6,455) (388,406)Increase in payables . . . . . . . . . . . . . . . . . . . . . . . . . . . . . . . . . . . . . . . . . . . . . . 18,759 19,872 174,679Increase in advance payments received on contracts . . . . . . . . . . . . . . . . . . . 36,249 18,011 337,543Increase (decrease) in other liabilities . . . . . . . . . . . . . . . . . . . . . . . . . . . . . . . . 10,917 (6,352) 101,658Others . . . . . . . . . . . . . . . . . . . . . . . . . . . . . . . . . . . . . . . . . . . . . . . . . . . . . . . . . (8,119) (5,963) (75,600)
Subtotal . . . . . . . . . . . . . . . . . . . . . . . . . . . . . . . . . . . . . . . . . . . . . . . . . . . . . . 118,504 144,666 1,103,494Interest and dividend received . . . . . . . . . . . . . . . . . . . . . . . . . . . . . . . . . . . . . 9,690 11,592 90,227Interest paid . . . . . . . . . . . . . . . . . . . . . . . . . . . . . . . . . . . . . . . . . . . . . . . . . . . . (15,670) (16,765) (145,918)Payments for income taxes . . . . . . . . . . . . . . . . . . . . . . . . . . . . . . . . . . . . . . . . (5,458) (5,253) (50,823)
Net cash provided by operating activities . . . . . . . . . . . . . . . . . . . . . . . . . . . 107,066 134,240 996,980Cash flows from investing activities:
Net decrease in time deposits . . . . . . . . . . . . . . . . . . . . . . . . . . . . . . . . . . . . . . 2,984 4,021 27,785Proceeds from sales and redemption of marketablesecurities and investments . . . . . . . . . . . . . . . . . . . . . . . . . . . . . . . . . . . . . . . . 155 40 1,442
Purchases of property, plant, equipment and intangible assets . . . . . . . . . . . (108,234) (114,061) (1,007,855)Proceeds from sales of property, plant,equipment and intangible assets . . . . . . . . . . . . . . . . . . . . . . . . . . . . . . . . . . 11,814 9,081 110,009
Purchases of investment securities . . . . . . . . . . . . . . . . . . . . . . . . . . . . . . . . . . (91,267) (2,587) (849,860)Proceeds from sales and redemption of investment securities . . . . . . . . . . . . 23,362 5,375 217,539Disbursement of long-term loans . . . . . . . . . . . . . . . . . . . . . . . . . . . . . . . . . . . (3,784) (2,637) (35,232)Collection of long-term loans . . . . . . . . . . . . . . . . . . . . . . . . . . . . . . . . . . . . . . 4,071 7,821 37,905Others . . . . . . . . . . . . . . . . . . . . . . . . . . . . . . . . . . . . . . . . . . . . . . . . . . . . . . . . . (2,423) (2,432) (22,563)
Net cash used in investing activities . . . . . . . . . . . . . . . . . . . . . . . . . . . . . . . (163,322) (95,379) (1,520,830)Cash flows from financing activities:
Net decrease in short-term borrowings . . . . . . . . . . . . . . . . . . . . . . . . . . . . . . (2,056) (175,965) (19,142)Proceeds from long-term debt . . . . . . . . . . . . . . . . . . . . . . . . . . . . . . . . . . . . . 181,077 251,541 1,686,165Repayment of long-term debt . . . . . . . . . . . . . . . . . . . . . . . . . . . . . . . . . . . . . . (106,533) (69,535) (992,023)Proceeds from issuance of bonds . . . . . . . . . . . . . . . . . . . . . . . . . . . . . . . . . . . – 72,000 –Payment for redemption of bonds . . . . . . . . . . . . . . . . . . . . . . . . . . . . . . . . . . (300) (100,150) (2,794)Dividends paid to stockholders . . . . . . . . . . . . . . . . . . . . . . . . . . . . . . . . . . . . . (10,110) (20,162) (94,142)Dividends paid to minority stockholders of subsidiaries . . . . . . . . . . . . . . . . . (317) (372) (2,951)Others . . . . . . . . . . . . . . . . . . . . . . . . . . . . . . . . . . . . . . . . . . . . . . . . . . . . . . . . . (3,828) (1,760) (35,646)
Net cash provided by (used in) financing activities . . . . . . . . . . . . . . . . . . . 57,933 (44,403) 539,467Effect of exchange rate changes on cash and cash equivalents . . . . . . . . . . . . . . 2,799 (3,190) 26,061Net increase (decrease) in cash and cash equivalents . . . . . . . . . . . . . . . . . . . . . . 4,476 (8,732) 41,678Cash and cash equivalents at beginning of year . . . . . . . . . . . . . . . . . . . . . . . . . . 184,767 190,456 1,720,522Increase in cash and cash equivalents resulting from inclusion ofconsolidated subsidiaries . . . . . . . . . . . . . . . . . . . . . . . . . . . . . . . . . . . . . . . . . . . . 538 3,043 5,011
Cash and cash equivalents at end of year (Note 15) . . . . . . . . . . . . . . . . . . . . . . . ¥ 189,781 ¥ 184,767 $ 1,767,211The accompanying notes to consolidated financial statements are an integral part of these statements.
CONSOLIDATED STATEMENTS OF CASH FLOWSMitsubishi Heavy Industries, Ltd. and Consolidated SubsidiariesFor the years ended March 31, 2005 and 2004

39
ANNUAL REPORT 2005
NOTES TO CONSOLIDATED FINANCIAL STATEMENTSMitsubishi Heavy Industries, Ltd. and Consolidated SubsidiariesYears ended March 31, 2005 and 2004
a) Basis of presenting consolidated financial statementsThe accompanying consolidated financial statements of Mitsubishi Heavy Industries, Ltd. (“MHI”),together with its consolidated subsidiaries (“Subsidiaries”) have been prepared in accordance withaccounting principles generally accepted in Japan and have been prepared from the consolidatedfinancial statements filed with the Financial Services Agency (“FSA”) in Japan. The accounts ofconsolidated overseas subsidiaries are based on their accounting records maintained in conformitywith generally accepted accounting principles of the respective countries of domicile. Certainitems presented in the consolidated financial statements filed with the FSA have been reclassified,and “Consolidated Statements of Stockholders’ Equity”, which is not required to file with the FSA,has been added to the primary financial statements.
The differences between the accounting principles adopted by MHI and Subsidiaries andthose prescribed by International Accounting Standards (“IAS”) and International Financial Report-ing Standards (“IFRS”) are set forth in Note 2 “Differences with International Financial ReportingStandards”.
b) Principles of consolidationThe accompanying consolidated financial statements for the years ended March 31, 2005 and2004 include the accounts of MHI and Subsidiaries. All significant inter-company transactions andaccounts have been eliminated. Investments in unconsolidated subsidiaries and affiliates, withcertain minor exceptions, are accounted for by the equity method.
c) Foreign currency translationForeign currency monetary assets and liabilities are translated into Japanese yen at the exchangerate in effect at the end of respective fiscal year and the resulting translation gains or losses areincluded in net income.
All assets and liabilities of overseas subsidiaries and affiliates are translated into Japanese yen atthe exchange rate in effect at the end of respective fiscal year, revenues and expenses at the averageexchange rate during the year, and stockholders’ equity at historical rates. The resulting foreigncurrency translation adjustments are accounted for as a separate component of stockholders’ equity.
d) SecuritiesSecurities include held-to-maturity debt securities, investments in unconsolidated subsidiaries andaffiliates, and other securities (available-for-sale securities).
Held-to-maturity debt securities are stated at amortized cost and adjusted for the amortizationof premium or discounts. Investments in unconsolidated subsidiaries and affiliates excluding thoseaccounted for by the equity method are stated at cost determined by the moving average method.Other securities with market value are stated at market value based on market prices and other fairvalue at the balance sheet date. Unrealized holding gains and losses of other securities with marketvalue are accounted for as a separate component of stockholders’ equity, net of tax effect. The costof other securities sold with market value is computed based on the moving average method.Other securities without market value are stated at cost determined by the moving average method.
As to the presentation of the balance sheet, MHI and Subsidiaries have classified securitiesdue within one year as securities in current assets and others as investment securities in Investmentsand advances.
e) InventoriesWork in process is stated at cost determined by the specific identification method.
Finished products, raw materials and supplies are principally stated at cost determined by themoving average method, while some prospective products are stated at the lower of cost or market,the cost being determined by the moving average method.
Some of standardized steel materials for building new ships are stated at cost determined bythe specific identification method.
Inventories held by certain business units are stated at cost determined by the yearlyaverage method.
f) Property, plant and equipment and depreciationProperty, plant and equipment, including significant renewals and additions, are carried at cost.
Depreciation has principally been computed by the straight-line method for buildings exceptfor related equipment, and by the declining-balance method for other assets based on the usefullives of assets, which are substantially the same as those provided for in the Corporation IncomeTax Law.
1. SUMMARY OFSIGNIFICANTACCOUNTING POLICIES

40
ANNUAL REPORT 2005
When an asset is retired or otherwise disposed of, the cost and the related depreciation arerelieved from the respective accounts and the net difference, less any amounts realized on disposal,is reflected in earnings.
g) Intangible assetsAmortization of intangible assets is computed by the straight-line method based on the usefullives of assets, which are substantially the same as those provided for in the Corporation IncomeTax Law.
Goodwill is amortized over expected years of investment recovery, on a case-by-case basis,but not longer than 20 years, using the straight-line method.
h) LeasesNon-cancelable lease transactions of MHI and Subsidiaries are accounted for as operating leases(whether such leases are classified as operating leases or finance leases), except those lease agree-ments which stipulate the transfer of ownership of the leased assets to the lessee are accountedfor as finance leases. However, lease transactions of foreign Subsidiaries are accounted for aseither finance leases or operating leases in conformity with generally accepted accounting prin-ciples in the respective countries of domicile.
i) Allowance for doubtful receivablesThe allowance for doubtful receivables is provided at an amount sufficient to cover possible losseson the collection of receivables. The amount of the allowance is determined based on (1) an esti-mated amount for probable doubtful accounts based on a review of the collectibility of individualreceivables, and (2) a ratio based on MHI’s and Subsidiaries’ historical experience of write-offs ofreceivables other than those covered in Item (1) above.
j) Reserve for product warrantiesReserve for product warranties is provided in order to equip for the expenditures with respect towarranties for products after delivery, which is calculated based on the historical expense withconsideration given to the estimated level of future warranty cost.
It had been recognized by MHI and Subsidiaries that product warranty costs are to be incurredin previous fiscal years. Because of the increase in such costs due to the growing outstandingnumber of certain delivered build-to-order products which have a nature similar to that of mass-produced products, however, as from the year ended March 31, 2005, reserve for productwarranties is provided under a new accounting policy that the future warranty cost for such aproduct should in terms of timing correspond to revenue recognition of the product, therebyenforcing a period matching of revenue-cost and contributing to a better product profitabilitymanagement. The new policy is supported by a study based on recent cases on the relationshipbetween actual warranty costs incurred and operation history of products, which made possiblethe rational estimates of future warranty costs.
¥11,913 million (US$110,932 thousand) was reserved at the end of this fiscal year, and¥10,889 million (US$101,397 thousand) to be reserved at the beginning of April 2004 was pro-vided as reserve for product warranties within extraordinary expense. The effect of this changewas to decrease operating income and ordinary income by ¥1,024 million (US$9,535 thousand)and to decrease income before income taxes and minority interests by ¥11,913 million(US$110,932 thousand).
k) Allowance for losses on construction contractsAn allowance for losses on construction contracts has been provided based on an estimate of the totallosses which can be anticipated for the next fiscal year and beyond in respect of construction projectson which eventual losses are deemed inevitable and amounts thereof can reasonably be estimated.
If the costs of partially completed construction contracts (of the construction contractscovered by the allowance for losses on construction contracts at March 31, 2005 and 2004) exceedtheir respective contract revenues at the end of year, the excess of such costs is recognized as aloss on revaluation of partially completed construction contracts and, accordingly, is not includedin the allowance for losses on construction contracts.
l) Reserve for retirement allowanceA reserve for retirement allowance has been provided to prepare for employees’ retirement based onestimates of the retirement benefit obligation and the pension fund assets including the retirement

41
ANNUAL REPORT 2005
benefit trust at the end of the fiscal year.Prior service costs are expensed as incurred by MHI and most of Subsidiaries. Some Subsidiaries
amortize those over years, which is shorter than the employees’ estimated average remainingservice periods. Actuarial gains and losses are amortized from the following year of occurrence bythe straight-line method over the employees’ estimated average remaining service period.
m) Revenue recognitionA sale of product is in principle recognized upon acceptance by customer. But revenue from a long-term contract, i.e., a contract with period 2 years or longer, and with amount over ¥5,000 million(US$46,559 thousand), is recognized on the basis of the percentage-of-completion method.
Until the year ended March 31, 2004 the percentage-of-completion method had been generallyapplied to a contract with amount over ¥10,000 million (US$93,119 thousand), with the exceptionof contracts won by Aerospace division or those whose works had started before March 31, 2001where such threshold amount being ¥5,000 million (US$46,559 thousand) and ¥15,000 million(US$139,678 thousand), respectively. Under the circumstances where the proportion of long-termcontracts in overall contracts by MHI and Subsidiaries is expected to remain high in the future, and inorder to ensure more properly accounted profit and loss over years, the threshold amount for newlong-term contracts was revised to ¥5,000 million from the year ended March 31, 2005.
The effect of this change was to increase net sales by ¥10,613 million (US$98,825 thousand),and operating income, ordinary income and income before income taxes and minority interests by¥1,373 million (US$12,787 thousand) for the year ended March 31, 2005.
n) Tax-effect accountingDeferred income taxes are accounted for under the asset and liability method. Under this method,deferred tax assets and liabilities are recognized based on temporary differences between the financialstatement and tax basis of assets and liabilities using enacted tax rates expected to apply to taxableincome in the years in which these temporary differences are expected to be recovered or settled.
o) Cash and cash equivalentsFor the purpose of the consolidated statements of cash flows, cash, demand deposits and highlyliquid investments with insignificant risk of changes in value, which have maturities of threemonths or less when purchased, are treated as cash and cash equivalents.
p) Net income per shareThe computation of basic net income per share is based on the average number of shares outstanding.
Fully diluted earnings per share are determined on the assumption that the convertible bondswere converted on the dates of each issue, appropriately adjusted for subsequent redemption.
q) Impairment of fixed assetsEffective April 1, 2004, MHI and Subsidiaries adopted a new accounting standard for impairment offixed assets (“Opinion Concerning Establishment of Accounting Standard for Impairment of FixedAssets” issued by the Business Accounting Deliberation Council on August 9, 2002) and the imple-mentation guidance for the accounting standard for impairment of fixed assets (the Financial Account-ing Standard Implementation Guidance No. 6 issued by the Accounting Standards Board of Japan onOctober 31, 2003) as they have become adoptable from the fiscal year beginning on April 1, 2003.
As the result of this adoption for the year ended March 31, 2005, with impairment loss of¥6,108 million (US$56,875 thousand) being prepared in the extraordinary expense section, in-come before income taxes and minority interests decreased by the same amount from the incomederived otherwise.
Accumulated losses on impairment for fixed assets were deducted directly from the amountof each fixed asset.
The accompanying consolidated financial statements of MHI, together with Subsidiaries, havebeen prepared in accordance with accounting principles generally accepted in Japan.
The differences with International Accounting Standards (“IAS”) and International FinancialReporting Standards (“IFRS”) are summarized as follows:
a) Scope of consolidationUnder IAS No. 27, a parent which issues consolidated financial statements should consolidate allforeign and domestic subsidiaries.
2. DIFFERENCES WITHINTERNATIONALFINANCIAL REPORTINGSTANDARDS

42
ANNUAL REPORT 2005
Certain subsidiaries which give minor effect to the consolidated financial statements havebeen excluded from consolidation in accordance with accounting principles generally accepted inJapan. Even if IAS No. 27 had been applied, the difference would not have been material.
b) InventoriesUnder IAS No. 2, inventories should be measured at the lower of cost and net realizable value.
Inventories are valued as indicated in section e) of Note 1 “Summary of Significant AccountingPolicies”. Regarding work in process which occupies a significant portion of inventories, the costswhich exceed their respective contract revenues have been recognized as loss on revaluation. Evenif IAS No. 2 had been applied, the difference in the aggregate value of inventories would not havebeen material.
c) Reserve for retirement allowanceUnder IAS No. 19, to the extent that the benefits are already vested, an enterprise should recognizeprior service costs immediately.
The accounting procedure for amortization is indicated in Note 8 “Retirement Benefits”. Incertain Subsidiaries, prior service costs are amortized over 10 to 11 years. Even if IAS No. 19 hadbeen applied, the difference would not have been material.
d) LeasesUnder IAS No. 17, lessees should recognize finance leases as assets and liabilities in their balance sheetsand lessors should recognize assets as receivables held under a finance lease in their balance sheets.
In MHI and domestic Subsidiaries, leases, except those which transfer ownership to the lessee,have been treated in the same way as operating leases. However, lease transactions of foreignSubsidiaries are accounted for as either finance leases or operating leases in conformity withgenerally accepted accounting principles in the respective countries of domicile. Even if IAS No. 17had been applied, the difference would not have been material.
e) Revenue recognition and expected losses on construction contractsUnder IAS No. 11, construction contracts should be accounted for by the percentage-of-completionmethod, and expected losses should be recognized as expenses immediately.
Revenue recognition and expected losses on construction contracts are indicated in sectionsm) and k) of Note 1 “Summary of Significant Accounting Policies”, respectively. Even if IAS No. 11had been applied, the difference would not have been material.
f) GoodwillUnder IFRS No. 3, goodwill should not be amortized and the impairment rule should be applied inaccordance with IAS No. 36.
Goodwill, included in intangible assets, has been amortized as indicated in section g) of Note1 “Summary of Significant Accounting Policies”. Even if IFRS No. 3 had been applied, the differ-ence would not have been material.
g) Stock optionsUnder IFRS No. 2, share-based payment transactions should be recognized in the financial statements.
MHI has two stock option plans, but no options are granted at price below the market price onthe day of the grant. Even if IFRS No. 2 had been applied, the difference would not have been material.
h) Discontinuing operationsMHI and Subsidiaries have not had such occurrences as should be accounted for under IFRS No. 5during the years ended March 31, 2005 and 2004.
U.S. dollar amounts are included solely for convenience. These translations should not be con-strued as representations that the Japanese yen actually represent, or have been or could be con-verted into, U.S. dollars.
As the amounts shown in U.S. dollars are for convenience only, the rate of ¥107.39=US$1prevailing at March 31, 2005 has been used for the purpose of the presentation of the U.S. dollaramounts in the accompanying consolidated financial statements.
3. U.S. DOLLAR AMOUNTS

43
ANNUAL REPORT 2005
a) Other securities with market value, which were included in securities (current assets) andinvestment securities (investments and advances) at March 31, 2005 and 2004, consisted ofthe following:
In millions of yen In thousands of U.S. dollars
2005 2005
Acquisition Carrying Unrealized Acquisition Carrying Unrealizedcost amount gain (loss) cost amount gain (loss)
i) Carrying amounts overacquisition costs:
Equity securities . . . . . . ¥170,505 ¥354,503 ¥183,998 $1,587,715 $3,301,078 $1,713,363Government bonds . . . 242 334 92 2,259 3,116 857Others . . . . . . . . . . . . . . 794 842 48 7,395 7,837 442
Subtotal . . . . . . . . . . . ¥171,541 ¥355,679 ¥184,138 $1,597,369 $3,312,031 $1,714,662
ii)Acquisition costs overcarrying amounts:
Equity securities . . . . . . ¥ 1,733 ¥ 1,217 ¥ (516) $ 16,133 $ 11,330 $ (4,803)
Total (i+ii) . . . . . . . . . ¥173,274 ¥356,896 ¥183,622 $1,613,502 $3,323,361 $1,709,859
In millions of yen
2004
Acquisition Carrying Unrealizedcost amount gain (loss)
i) Carrying amounts overacquisition costs:
Equity securities . . . . . . ¥141,572 ¥333,962 ¥192,390Government bonds . . . 242 346 104Others . . . . . . . . . . . . . . 730 767 37
Subtotal . . . . . . . . . . . ¥142,544 ¥335,075 ¥192,531
ii)Acquisition costs overcarrying amounts:
Equity securities . . . . . . ¥ 1,291 ¥ 589 ¥ (702)
Total (i+ ii) . . . . . . . . . ¥143,835 ¥335,664 ¥191,829
Note: MHI and Subsidiaries treated as impaired those securities whose market values showed a substantialdecline and were not judged to recover. The amount reflecting the impairment loss is recorded as theacquisition cost for these securities.
Securities were judged as impaired when their market values had declined 50% or more from theirbook values at the end of respective fiscal years, or had declined between 30% and 50% from their bookvalues both at the interim period and the end of respective fiscal years.
The amount of impairment losses for the years ended March 31, 2005 and 2004 amounted to ¥1,265million (US$11,775 thousand) and ¥66 million, respectively, with respect to other securities with marketvalue.
b) Sales amounts of other securities and related gains and losses for the years ended March 31,2005 and 2004 were as follows:
In thousands ofIn millions of yen U.S. dollars
2005 2004 2005
Sales amounts . . . . . . . . . . . . . . . . . . . . . . . . . . . . . . ¥425,957 ¥4,771 $3,966,453Gains . . . . . . . . . . . . . . . . . . . . . . . . . . . . . . . . . . . . . . 15,666 1,278 145,876Losses . . . . . . . . . . . . . . . . . . . . . . . . . . . . . . . . . . . . . (5) (76) (49)
c) Other securities without market value, which were included in securities (current assets) andinvestment securities (investments and advances) at March 31, 2005 and 2004, mainly consistedof the following:
In thousands ofIn millions of yen U.S. dollars
2005 2004 2005
Equity securities—unlisted . . . . . . . . . . . . . . . . . . . . ¥81,481 ¥31,312 $758,736
Note: MHI and Subsidiaries treated as impaired those securities whose equity values were judged to have declined50% or more from their book values due to financial difficulties of the issuers.
The amount of impairment loss for the year ended March 31, 2005 and 2004 amounted to ¥89 million(US$832 thousand) and ¥726 million, respectively, with respect to other securities without market value.
4. SECURITIES

44
ANNUAL REPORT 2005
d) The contractual maturities of other securities at March 31, 2005 and 2004 were as follows:In millions of yen In thousands of U.S. dollars
2005 2005
Due after one Due after oneDue within year through Due after Due within year through Due afterone year five years five years one year five years five years
Certificate of deposit . . . . . ¥1,384 ¥ – ¥– $12,886 $ – $–Loan trusts . . . . . . . . . . . . . 124 174 – 1,156 1,616 –Bonds:
Government bonds . . . . – 594 0 – 5,535 2Corporate bonds . . . . . . 367 600 – 3,412 5,586 –Foreign bonds . . . . . . . . 697 – – 6,494 – –
Total . . . . . . . . . . . . . . ¥2,572 ¥1,368 ¥0 $23,948 $12,737 $2
In millions of yen
2004
Due after oneDue within year through Due afterone year five years five years
Certificate of deposit . . . . . ¥1,229 ¥ – ¥–Loan trusts . . . . . . . . . . . . . 145 298 –Bonds:
Government bonds . . . . 10 356 –Corporate bonds . . . . . . 375 600 –Foreign bonds . . . . . . . . – 688 –
Total . . . . . . . . . . . . . . ¥1,759 ¥1,942 ¥–
Inventories at March 31, 2005 and 2004 consisted of the following:In thousands of
In millions of yen U.S. dollars
2005 2004 2005
Finished products . . . . . . . . . . . . . . . . . . . . . . . . . . . . ¥127,962 ¥127,471 $1,191,566Work in process . . . . . . . . . . . . . . . . . . . . . . . . . . . . . 767,381 797,132 7,145,742Raw materials . . . . . . . . . . . . . . . . . . . . . . . . . . . . . . 63,170 51,374 588,226
Total . . . . . . . . . . . . . . . . . . . . . . . . . . . . . . . . . . ¥958,513 ¥975,977 $8,925,534
5. INVENTORIES

45
ANNUAL REPORT 2005
MHI and Subsidiaries are subject to corporation income tax, inhabitants’ tax and enterprise tax,based on income, which in the aggregate resulted in the statutory effective tax rate of approximately40.5% for the year ended March 31, 2005 and 42.0% for the year ended March 31, 2004.
a) Significant components of deferred tax assets and liabilities at March 31, 2005 and 2004, whicharose as a result of the recognition of the tax effect mentioned in section n) of Note 1 “Summaryof Significant Accounting Policies”, were as follows:
In thousands ofIn millions of yen U.S. dollars
2005 2004 2005
Deferred tax assets:Reserve for retirement allowance . . . . . . . . . . . . . ¥ 106,727 ¥ 100,610 $ 993,828Tax loss carryforwards . . . . . . . . . . . . . . . . . . . . . . 34,065 38,703 317,208Accrued expenses for product warranty . . . . . . . 24,461 20,331 227,774Allowance for doubtful receivables . . . . . . . . . . . 13,336 16,100 124,187Accrued expenses for construction contracts . . . . 11,650 15,557 108,487Others . . . . . . . . . . . . . . . . . . . . . . . . . . . . . . . . . . . 43,132 32,386 401,636
Subtotal . . . . . . . . . . . . . . . . . . . . . . . . . . . . . . . . 233,371 223,687 2,173,120Valuation allowance . . . . . . . . . . . . . . . . . . . . . . . . . (17,319) (3,936) (161,277)
Total gross deferred tax assets . . . . . . . . . . . . . 216,052 219,751 2,011,843
Deferred tax liabilities:Net unrealized gains on investment securities . . (73,786) (77,281) (687,081)Gains on contribution of investment securities totrust for retirement allowance . . . . . . . . . . . . . . (67,043) (68,560) (624,295)
Reserve for reduction in costs of fixed assets . . . . (10,056) (6,794) (93,644)Reserve for accelerated depreciation . . . . . . . . . . (4,559) (3,021) (42,447)Others . . . . . . . . . . . . . . . . . . . . . . . . . . . . . . . . . . . (2,855) (3,065) (26,586)
Total gross deferred tax liabilities . . . . . . . . . . . (158,299) (158,721) (1,474,053)
Net deferred tax assets . . . . . . . . . . . . . . . . . . . ¥ 57,753 ¥ 61,030 $ 537,790
Note: Net deferred tax assets at March 31, 2005 and 2004 are reflected in the consolidated balance sheets asfollows:
In thousands ofIn millions of yen U.S. dollars
2005 2004 2005
Deferred income taxes in current assets . . . . . . . . . ¥ 65,501 ¥ 59,819 $ 609,936Deferred income taxes in investmentsand advances . . . . . . . . . . . . . . . . . . . . . . . . . . . . . . 9,745 22,797 90,747
Other current liabilities . . . . . . . . . . . . . . . . . . . . . . . (28) (2) (265)Deferred income taxes in long-term liabilities . . . . (17,465) (21,584) (162,628)
b) Reconciliation of the statutory effective income tax rate and the income tax rate as a percentageof income before income taxes and minority interests at March 31, 2005 and 2004 were as follows:
2005 2004
Japanese statutory effective income tax rate . . . . . . . . . . . . . . . . . . . . . 40.5% 42.0%Adjustment:
Equity in earnings of unconsolidated subsidiaries and affiliates . . . . (24.7) (5.1)Items excluded from expenses . . . . . . . . . . . . . . . . . . . . . . . . . . . . . . . 9.9 3.9Items excluded from gross income . . . . . . . . . . . . . . . . . . . . . . . . . . . . (4.5) (0.9)Valuation allowance . . . . . . . . . . . . . . . . . . . . . . . . . . . . . . . . . . . . . . . 46.9 7.8Unrealized profit in excess of taxable income . . . . . . . . . . . . . . . . . . . – 4.2Others . . . . . . . . . . . . . . . . . . . . . . . . . . . . . . . . . . . . . . . . . . . . . . . . . . . 1.8 3.4
Income tax rate as a percentage of income before income taxesand minority interests . . . . . . . . . . . . . . . . . . . . . . . . . . . . . . . . . . . . . . . 69.9% 55.3%
6. INCOME TAXES

46
ANNUAL REPORT 2005
a) Short-term borrowings at March 31, 2005 and 2004 consisted of the following:In thousands of
In millions of yen U.S. dollars
2005 2004 2005
Loans, principally from banks,with weighted-average interest rate of 0.9%at March 31, 2005 and 0.8% at March 31, 2004:Secured . . . . . . . . . . . . . . . . . . . . . . . . . . . . . . . . . . ¥ 7,476 ¥ 8,140 $ 69,615Unsecured . . . . . . . . . . . . . . . . . . . . . . . . . . . . . . . . 290,793 292,071 2,707,821
Total . . . . . . . . . . . . . . . . . . . . . . . . . . . . . . . . . . ¥298,269 ¥300,211 $2,777,436
b) Long-term debt at March 31, 2005 and 2004 consisted of the following:In thousands of
In millions of yen U.S. dollars
2005 2004 2005
Loans, principally from banks and insurance companies,due 2005 to 2022 with weighted-average interestrate of 1.4% at March 31, 2005 and due 2004 to 2022with weighted-average interest rate of1.4% at March 31, 2004:Secured . . . . . . . . . . . . . . . . . . . . . . . . . . . . . . . . . . ¥ 22,387 ¥ 29,714 $ 208,468Unsecured . . . . . . . . . . . . . . . . . . . . . . . . . . . . . . . . 577,929 484,612 5,381,588
Export loans, principally from main contractors,due 2005 to 2018 with weighted-average interestrate of 2.9% at March 31, 2005 and due 2004 to 2018with weighted-average interest rate of3.4% at March 31, 2004:Unsecured . . . . . . . . . . . . . . . . . . . . . . . . . . . . . . . . 27,551 39,526 256,547
Unsecured bonds:2.525% bonds due 2008 . . . . . . . . . . . . . . . . . . . . 50,000 50,000 465,5931.83% bonds due 2005 . . . . . . . . . . . . . . . . . . . . . 30,000 30,000 279,3562.15% bonds due 2008 . . . . . . . . . . . . . . . . . . . . . 40,000 40,000 372,4740.63% bonds due 2010 . . . . . . . . . . . . . . . . . . . . . 20,000 20,000 186,2371.03% bonds due 2013 . . . . . . . . . . . . . . . . . . . . . 30,000 30,000 279,3560.365% bonds due 2010 . . . . . . . . . . . . . . . . . . . . 20,000 20,000 186,2370.70% bonds due 2013 . . . . . . . . . . . . . . . . . . . . . 50,000 50,000 465,593
Unsecured bonds issued by Subsidiaries:0.62% bonds, due 2005 to 2010 in 2005and due 2004 to 2010 in 2004 . . . . . . . . . . . . . . . 1,550 1,850 14,433
8.29% bonds due 2005 . . . . . . . . . . . . . . . . . . . . . 3,126 3,214 29,1118.39% bonds due 2007 . . . . . . . . . . . . . . . . . . . . . 2,084 2,142 19,408
Subtotal . . . . . . . . . . . . . . . . . . . . . . . . . . . . . . . . 874,627 801,058 8,144,401
Less current portion due within one year . . . . . . . . (91,840) (103,066) (855,204)
Total . . . . . . . . . . . . . . . . . . . . . . . . . . . . . . . . . . ¥782,787 ¥ 697,992 $7,289,197
c) A summary of assets pledged as collateral for short-term borrowings and long-term debt atMarch 31, 2005 and 2004 consisted of the following:
In thousands ofIn millions of yen U.S. dollars
2005 2004 2005
Property, plant and equipment . . . . . . . . . . . . . . . . ¥14,960 ¥17,451 $139,308Trade receivables:
Notes . . . . . . . . . . . . . . . . . . . . . . . . . . . . . . . . . . . . 6,406 7,670 59,651Accounts . . . . . . . . . . . . . . . . . . . . . . . . . . . . . . . . . 13,680 16,416 127,384
Short-term loans included in prepaid expensesand other current assets . . . . . . . . . . . . . . . . . . . . . 3,801 4,479 35,399
Securities . . . . . . . . . . . . . . . . . . . . . . . . . . . . . . . . . . 565 585 5,259Cash and deposits . . . . . . . . . . . . . . . . . . . . . . . . . . . 30 30 280
Total . . . . . . . . . . . . . . . . . . . . . . . . . . . . . . . . . . ¥39,442 ¥46,631 $367,281
7. SHORT-TERMBORROWINGS ANDLONG-TERM DEBT

47
ANNUAL REPORT 2005
d) The aggregate annual maturities of long-term debt at March 31, 2005 were as follows:In thousands of
Year ending March 31 In millions of yen U.S. dollars
2006 . . . . . . . . . . . . . . . . . . . . . . . . . . . . . . . . . . . . . . . . . . . . . . . . ¥ 91,840 $ 855,2042007 . . . . . . . . . . . . . . . . . . . . . . . . . . . . . . . . . . . . . . . . . . . . . . . . 99,393 925,5342008 . . . . . . . . . . . . . . . . . . . . . . . . . . . . . . . . . . . . . . . . . . . . . . . . 100,472 935,5782009 . . . . . . . . . . . . . . . . . . . . . . . . . . . . . . . . . . . . . . . . . . . . . . . . 103,634 965,0192010 . . . . . . . . . . . . . . . . . . . . . . . . . . . . . . . . . . . . . . . . . . . . . . . . 98,713 919,205Thereafter . . . . . . . . . . . . . . . . . . . . . . . . . . . . . . . . . . . . . . . . . . . 380,575 3,543,861
Total . . . . . . . . . . . . . . . . . . . . . . . . . . . . . . . . . . . . . . . . . . . . ¥874,627 $8,144,401
MHI and Subsidiaries have several non-contributory defined benefit pension plans and severanceindemnity plans, and there are occasions where employees receive special lump-sum payments atretirement. Contributions to the plans are funded in accordance with the applicable laws andregulations. MHI has established a retirement benefit trust, as mentioned in section l) of Note 1“Summary of Significant Accounting Policies”.
Actuarial gains and losses are amortized over a period shorter than the estimated averageremaining service period of employees from the following year of the occurrence by the straight-linemethod. Prior service costs are incurred and expensed in the current year in MHI and most ofSubsidiaries, and are amortized over 10 to 11 years from the year of the occurrence by thestraight-line method in some Subsidiaries.
a) Benefit obligations and related information at March 31, 2005 and 2004 were as follows:In thousands of
In millions of yen U.S. dollars
2005 2004 2005
Benefit obligations . . . . . . . . . . . . . . . . . . . . . . . . . . ¥(760,148) ¥(758,412) $(7,078,387)Fair value of plan assets . . . . . . . . . . . . . . . . . . . . . . 497,460 494,264 4,632,272
Unfunded benefit obligations . . . . . . . . . . . . . . . . . (262,688) (264,148) (2,446,115)Unrecognized actuarial losses . . . . . . . . . . . . . . . . . . 175,536 172,026 1,634,564Unrecognized prior service costs (benefits) . . . . . . . (155) (225) (1,438)
Net benefit liability recognized on theconsolidated balance sheets . . . . . . . . . . . . . . . . . . (87,307) (92,347) (812,989)
Prepaid pension expense . . . . . . . . . . . . . . . . . . . . . 22,491 22,263 209,434
Reserve for retirement allowance . . . . . . . . . . . . . . ¥(109,798) ¥(114,610) $(1,022,423)
b) Benefit expenses for the years ended March 31, 2005 and 2004 consisted of the following:In thousands of
In millions of yen U.S. dollars
2005 2004 2005
Service cost . . . . . . . . . . . . . . . . . . . . . . . . . . . . . . . . . ¥ 28,942 ¥ 27,557 $ 269,505Interest cost . . . . . . . . . . . . . . . . . . . . . . . . . . . . . . . . 15,205 21,627 141,590Expected return on plan assets . . . . . . . . . . . . . . . . . (13,444) (10,148) (125,194)Amortization of actuarial losses . . . . . . . . . . . . . . . . 16,568 20,923 154,280Amortization of prior service costs (benefits) . . . . . (28) (35,844) (260)
Net benefit expenses . . . . . . . . . . . . . . . . . . . . . . . . . ¥ 47,243 ¥ 24,115 $ 439,921
c) The principal assumptions used in determining the information above at March 31, 2005 and2004 were as follows:
2005 2004
Discount rate . . . . . . . . . . . . . . . . . . . . . . . . . . . . 2.0% 2.0%Expected rate of return on plan assets . . . . . . . 4.0% 4.0%Amortization period for priorservice costs . . . . . . . . . . . . . . . . MHI Expensed as incurred Expensed as incurred
Subsidiaries Expensed as incurred Expensed as incurredor 10 to 11 years or 10 to 11 years
Amortization period for actuarial gains and losses . . . . . . . . . . . . . MHI 13 years 13 years
Subsidiaries 11 to 20 years 11 to 20 years
8. RETIREMENT BENEFITS

48
ANNUAL REPORT 2005
Gains on sales of fixed assets for the year ended March 31, 2005 and 2004 consisted of the following:In thousands of
In millions of yen U.S. dollars
2005 2005
Land . . . . . . . . . . . . . . . . . . . . . . . . . . . . . . . . . . . . . . . . . . . . . . . . ¥10,328 $96,170Others . . . . . . . . . . . . . . . . . . . . . . . . . . . . . . . . . . . . . . . . . . . . . . . 29 272
Total . . . . . . . . . . . . . . . . . . . . . . . . . . . . . . . . . . . . . . . . . . . . ¥10,357 $96,442
In millions of yen
2004
Land . . . . . . . . . . . . . . . . . . . . . . . . . . . . . . . . . . . . . . . . . . . . . . . . ¥5,744Others . . . . . . . . . . . . . . . . . . . . . . . . . . . . . . . . . . . . . . . . . . . . . . . (11)
Total . . . . . . . . . . . . . . . . . . . . . . . . . . . . . . . . . . . . . . . . . . . . ¥5,733
a) The groups of assets for which the MHI and Subsidiaries recognized impairment losses for theyear ended March 31, 2005 are as follows:
Function or status Location Type of assets
Assets for rent Shiba, Minato-ku, Tokyo and others Land and Buildings, etc.
Idle assets Oyama-cho, Shuntou-gun Shizuoka prefecture Land and Buildings, etc.and others
b) The method to group the assetsAssets are grouped mainly by each Works, and each asset for rent or idle asset is treated as oneof groups.
c) The circumstances in that impairment losses was recognizedSome of the assets groups, its market price had came down in price, MHI and Subsidiaries re-duced the book value of such assets group to the recoverable amounts.
d) The method to calculate the recoverable amountsThe recoverable amounts were calculated with the adjustment reasonably, such as the price ofexpert opinion, assessment for fixed asset tax, etc.
e) Impairment lossesThe amounts of impairment losses for the year ended March 31, 2005 was ¥6,108 million(US$56,875 thousand) and consisted of the following:
In thousands ofIn millions of yen U.S. dollars
2005 2005
Land . . . . . . . . . . . . . . . . . . . . . . . . . . . . . . . . . . . . . . . . . . . . . . . . ¥5,769 $53,718Buildings etc. . . . . . . . . . . . . . . . . . . . . . . . . . . . . . . . . . . . . . . . . . 339 3,157
Total . . . . . . . . . . . . . . . . . . . . . . . . . . . . . . . . . . . . . . . . . . . . ¥6,108 $56,875
Business improvement and restructuring charges arising from Mass and Medium-Lot Manufac-tured Machinery business for the year ended March 31, 2005 and 2004 consisted of the following:
In thousands ofIn millions of yen U.S. dollars
2005 2005
Losses on disposal of inventories . . . . . . . . . . . . . . . . . . . . . . . . . ¥ 391 $ 3,639Losses on disposal of fixed assets . . . . . . . . . . . . . . . . . . . . . . . . . 358 3,339Losses on special retirement benefit . . . . . . . . . . . . . . . . . . . . . . 348 3,236Others . . . . . . . . . . . . . . . . . . . . . . . . . . . . . . . . . . . . . . . . . . . . . . . 682 6,350
Total . . . . . . . . . . . . . . . . . . . . . . . . . . . . . . . . . . . . . . . . . . . . ¥1,779 $16,564
9. GAINS ON SALES OFFIXED ASSETS
10. LOSSES ONIMPAIRMENT FORFIXED ASSETS
11. BUSINESSIMPROVEMENT ANDRESTRUCTURINGCHARGES
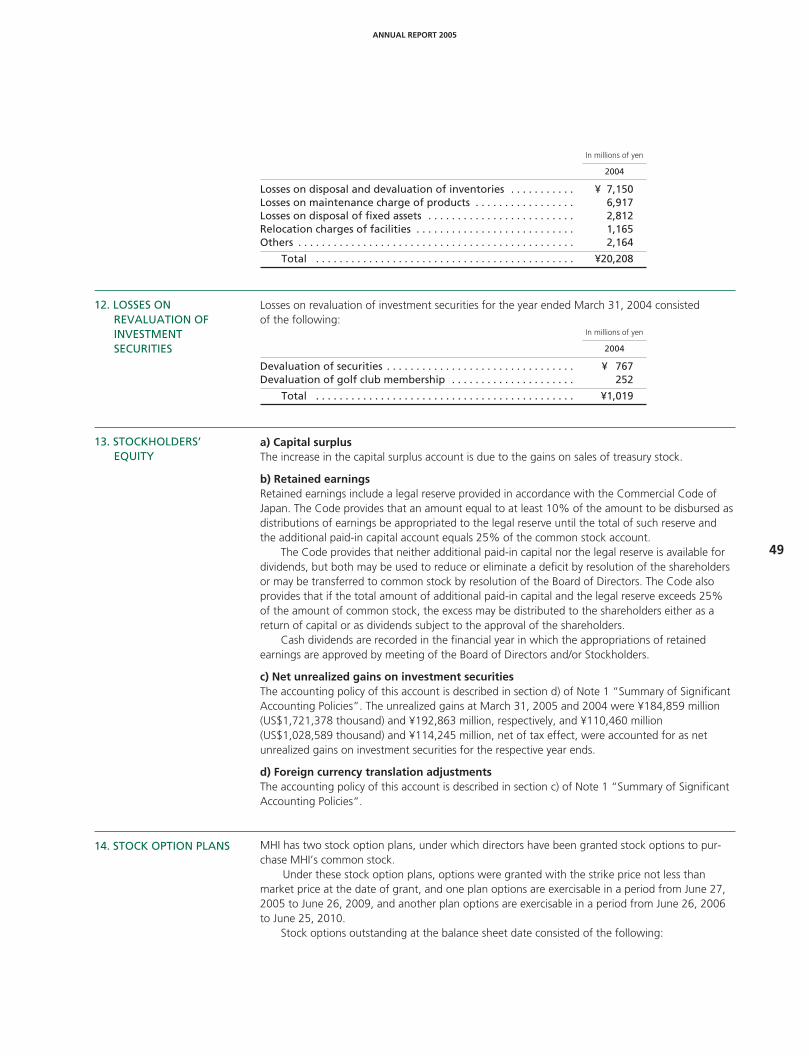
49
ANNUAL REPORT 2005
In millions of yen
2004
Losses on disposal and devaluation of inventories . . . . . . . . . . . ¥ 7,150Losses on maintenance charge of products . . . . . . . . . . . . . . . . . 6,917Losses on disposal of fixed assets . . . . . . . . . . . . . . . . . . . . . . . . . 2,812Relocation charges of facilities . . . . . . . . . . . . . . . . . . . . . . . . . . . 1,165Others . . . . . . . . . . . . . . . . . . . . . . . . . . . . . . . . . . . . . . . . . . . . . . . 2,164
Total . . . . . . . . . . . . . . . . . . . . . . . . . . . . . . . . . . . . . . . . . . . . ¥20,208
Losses on revaluation of investment securities for the year ended March 31, 2004 consistedof the following:
In millions of yen
2004
Devaluation of securities . . . . . . . . . . . . . . . . . . . . . . . . . . . . . . . . ¥ 767Devaluation of golf club membership . . . . . . . . . . . . . . . . . . . . . 252
Total . . . . . . . . . . . . . . . . . . . . . . . . . . . . . . . . . . . . . . . . . . . . ¥1,019
a) Capital surplusThe increase in the capital surplus account is due to the gains on sales of treasury stock.
b) Retained earningsRetained earnings include a legal reserve provided in accordance with the Commercial Code ofJapan. The Code provides that an amount equal to at least 10% of the amount to be disbursed asdistributions of earnings be appropriated to the legal reserve until the total of such reserve andthe additional paid-in capital account equals 25% of the common stock account.
The Code provides that neither additional paid-in capital nor the legal reserve is available fordividends, but both may be used to reduce or eliminate a deficit by resolution of the shareholdersor may be transferred to common stock by resolution of the Board of Directors. The Code alsoprovides that if the total amount of additional paid-in capital and the legal reserve exceeds 25%of the amount of common stock, the excess may be distributed to the shareholders either as areturn of capital or as dividends subject to the approval of the shareholders.
Cash dividends are recorded in the financial year in which the appropriations of retainedearnings are approved by meeting of the Board of Directors and/or Stockholders.
c) Net unrealized gains on investment securitiesThe accounting policy of this account is described in section d) of Note 1 “Summary of SignificantAccounting Policies”. The unrealized gains at March 31, 2005 and 2004 were ¥184,859 million(US$1,721,378 thousand) and ¥192,863 million, respectively, and ¥110,460 million(US$1,028,589 thousand) and ¥114,245 million, net of tax effect, were accounted for as netunrealized gains on investment securities for the respective year ends.
d) Foreign currency translation adjustmentsThe accounting policy of this account is described in section c) of Note 1 “Summary of SignificantAccounting Policies“.
MHI has two stock option plans, under which directors have been granted stock options to pur-chase MHI’s common stock.
Under these stock option plans, options were granted with the strike price not less thanmarket price at the date of grant, and one plan options are exercisable in a period from June 27,2005 to June 26, 2009, and another plan options are exercisable in a period from June 26, 2006to June 25, 2010.
Stock options outstanding at the balance sheet date consisted of the following:
12. LOSSES ONREVALUATION OFINVESTMENTSECURITIES
13. STOCKHOLDERS’EQUITY
14. STOCK OPTION PLANS

50
ANNUAL REPORT 2005
2005 2004 2005
Weighted- Weighted- Weighted-average average average
Stock options exercised price Stock options exercised price exercised price(shares) (yen) (shares) (yen) (U.S. dollars)
Outstanding at beginningof year . . . . . . . . . . . . . . . . . . . . 535,000 ¥315 – ¥ – $2.93
Granted . . . . . . . . . . . . . . . . . . . . 500,000 289 535,000 315 2.69
Outstanding at end of year . . . . 1,035,000 ¥302 535,000 ¥315 $2.81
Cash and cash equivalents at March 31, 2005 and 2004 consisted of the following:In thousands of
In millions of yen U.S. dollars
2005 2004 2005
Cash and deposits . . . . . . . . . . . . . . . . . . . . . . . . . . . ¥211,912 ¥209,806 $1,973,288Time deposits with maturities over three months . . . (23,506) (26,320) (218,883)Short-term investments with maturities withinthree months included in securities . . . . . . . . . . . . . 1,375 1,221 12,806
Short-term investments with maturities withinthree months included in prepaid expensesand other current assets . . . . . . . . . . . . . . . . . . . . . . – 60 –
Total . . . . . . . . . . . . . . . . . . . . . . . . . . . . . . . . . . ¥189,781 ¥184,767 $1,767,211
a) As lesseei) The equivalent of acquisition cost (including interest portion), accumulated depreciation andbalance at the balance sheet date consisted of the following:
In thousands ofIn millions of yen U.S. dollars
2005 2004 2005
Equivalent of acquisition cost:Tools and equipment . . . . . . . . . . . . . . . . . . . . . . . ¥ 8,237 ¥10,690 $ 76,705Others . . . . . . . . . . . . . . . . . . . . . . . . . . . . . . . . . . . 2,565 2,444 23,883
Total . . . . . . . . . . . . . . . . . . . . . . . . . . . . . . . . . . ¥10,802 ¥13,134 $100,588
Equivalent of accumulated depreciation:Tools and equipment . . . . . . . . . . . . . . . . . . . . . . . ¥ 4,806 ¥ 6,097 $ 44,757Others . . . . . . . . . . . . . . . . . . . . . . . . . . . . . . . . . . . 1,676 1,550 15,601
Total . . . . . . . . . . . . . . . . . . . . . . . . . . . . . . . . . . ¥ 6,482 ¥ 7,647 $ 60,358
Equivalent of balance at the balance sheet date:Tools and equipment . . . . . . . . . . . . . . . . . . . . . . . ¥ 3,431 ¥ 4,593 $ 31,948Others . . . . . . . . . . . . . . . . . . . . . . . . . . . . . . . . . . . 889 894 8,282
Total . . . . . . . . . . . . . . . . . . . . . . . . . . . . . . . . . . ¥ 4,320 ¥ 5,487 $ 40,230
ii) The equivalent of undue lease payments (including interest portion) at March 31, 2005 and2004 consisted of the following:
In thousands ofIn millions of yen U.S. dollars
2005 2004 2005
Within one year . . . . . . . . . . . . . . . . . . . . . . . . . . . . . ¥1,762 ¥2,468 $16,411Thereafter . . . . . . . . . . . . . . . . . . . . . . . . . . . . . . . . . 2,558 3,019 23,819
Total . . . . . . . . . . . . . . . . . . . . . . . . . . . . . . . . . . ¥4,320 ¥5,487 $40,230
Note: Impairment losses distributed to leases had not been at March 31, 2005.
iii) Lease payments (the equivalent of depreciation expenses)Lease payments relating to finance lease transactions accounted for as operating leases in theaccompanying consolidated financial statements for the years ended March 31, 2005 and 2004consisted of the following:
15. CASH AND CASHEQUIVALENTS
16. LEASES

51
ANNUAL REPORT 2005
In thousands ofIn millions of yen U.S. dollars
2005 2004 2005
Lease payments . . . . . . . . . . . . . . . . . . . . . . . . . . . . . ¥2,549 ¥3,038 $23,736Impairment losses . . . . . . . . . . . . . . . . . . . . . . . . . . . – – –
iv) Method of computing the equivalent of depreciation expensesThe equivalent of depreciation expenses was computed by the straight-line method by treatingthe lease periods as the useful lives.
b) As lessori) Acquisition cost, accumulated depreciation and balance at the balance sheet date consisted ofthe following:
In thousands ofIn millions of yen U.S. dollars
2005 2004 2005
Acquisition cost:Machinery and equipment . . . . . . . . . . . . . . . . . . ¥58,627 ¥58,563 $545,925Others . . . . . . . . . . . . . . . . . . . . . . . . . . . . . . . . . . . 5,953 5,335 55,436
Total . . . . . . . . . . . . . . . . . . . . . . . . . . . . . . . . . . ¥64,580 ¥63,898 $601,361
Accumulated depreciation:Machinery and equipment . . . . . . . . . . . . . . . . . . ¥26,814 ¥25,136 $249,691Others . . . . . . . . . . . . . . . . . . . . . . . . . . . . . . . . . . . 2,143 2,220 19,950
Total . . . . . . . . . . . . . . . . . . . . . . . . . . . . . . . . . . ¥28,957 ¥27,356 $269,641
Balance at the balance sheet date:Machinery and equipment . . . . . . . . . . . . . . . . . . ¥31,813 ¥33,427 $296,234Others . . . . . . . . . . . . . . . . . . . . . . . . . . . . . . . . . . . 3,810 3,115 35,486
Total . . . . . . . . . . . . . . . . . . . . . . . . . . . . . . . . . . ¥35,623 ¥36,542 $331,720
ii) Undue lease income (including interest portion), at March 31, 2005 and 2004 consistedof the following:
In thousands ofIn millions of yen U.S. dollars
2005 2004 2005
Within one year . . . . . . . . . . . . . . . . . . . . . . . . . . . . . ¥13,622 ¥14,230 $126,847Thereafter . . . . . . . . . . . . . . . . . . . . . . . . . . . . . . . . . 28,866 29,963 268,798
Total . . . . . . . . . . . . . . . . . . . . . . . . . . . . . . . . . . ¥42,488 ¥44,193 $395,645
iii) Lease income and depreciation expensesLease income and depreciation expenses relating to finance lease transactions accounted for asoperating leases in the accompanying consolidated financial statements for the years endedMarch 31, 2005 and 2004 consisted of the following:
In thousands ofIn millions of yen U.S. dollars
2005 2004 2005
Lease income . . . . . . . . . . . . . . . . . . . . . . . . . . . . . . . ¥14,836 ¥15,441 $138,150Depreciation expenses . . . . . . . . . . . . . . . . . . . . . . . 10,257 10,086 95,508
MHI and Subsidiaries utilize derivative financial instruments, which are comprised principally offorward foreign exchange contracts, foreign currency swaps and interest rate swaps. They areutilized for the purpose of reducing the risk of losses resulting from fluctuations in foreignexchange rates and interest rates.
MHI and Subsidiaries believe that market risks are insignificant, because MHI and Subsidiariesutilize such derivative financial instruments solely in order to hedge against certain risks in accordancewith internal control procedures. MHI and Subsidiaries also believe that the risk of nonperfor-mance by counterparties is insignificant because of the high credit ratings of the counterparties.
17. DERIVATIVE FINANCIALINSTRUMENTS

52
ANNUAL REPORT 2005
Summarized below are the notional amounts and the fair values of the derivative positions,except for those applied the hedge accounting, outstanding at March 31, 2005 and 2004:
In millions of yen In thousands of U.S. dollars
2005 2005
Notional Fair Unrealized Notional Fair Unrealizedamount value gain (loss) amount value gain (loss)
Forward foreignexchange contractsSell:
US$ . . . . . . . . . . . . . . . ¥15,800 ¥15,892 ¥ (92) $147,124 $147,979 $ (855)Euro . . . . . . . . . . . . . . . 19,079 19,225 (146) 177,662 179,019 (1,357)Others . . . . . . . . . . . . . 654 646 8 6,092 6,021 71
Buy:US$ . . . . . . . . . . . . . . . 382 366 (16) 3,562 3,408 (154)
Total . . . . . . . . . . . . . ¥(246) $(2,295)
In millions of yen
2004
Notional Fair Unrealizedamount value gain (loss)
Forward foreignexchange contractsSell:
US$ . . . . . . . . . . . . . . . ¥198,382 ¥190,732 ¥7,650Euro . . . . . . . . . . . . . . . 8,505 8,133 372
Buy:US$ . . . . . . . . . . . . . . . 605 587 (18)
Total . . . . . . . . . . . . . ¥8,004
Contingent liabilities for guarantees to loans of others made in the ordinary course of businessamounted to ¥145,017 million (US$1,350,373 thousand) and ¥151,342 million at March 31,2005 and 2004, respectively.
Certain domestic Subsidiaries have revised the terms for the payment of bonuses to employees forthe year ended March 31, 2004, following MHI’s revision made for the year ended March 31, 2003.
According to this revision, no accrual for employees’ bonuses of these domestic Subsidiarieswas provided for the year ended March 31, 2004.
The effect of this revision was to increase operating income, ordinary income and incomebefore income taxes and minority interests by ¥13,538 million for the year ended March 31, 2004,compared with those calculated under the previous terms for the payment of bonuses to employees.
And this revision had no effects on the consolidated financial statements of the year endedMarch 31, 2005.
In thousands ofIn millions of yen U.S. dollars
2005 2004 2005
Depreciation . . . . . . . . . . . . . . . . . . . . . . . . . . . . . . . ¥ 99,183 ¥99,816 $ 923,582Research and development costs(including routine or periodic alterationsto existing products) . . . . . . . . . . . . . . . . . . . . . . . . 124,023 99,515 1,154,879
At an ordinary general meeting of the shareholders of MHI held on June 28, 2005, the followingappropriations of retained earnings were approved:
In thousands ofIn millions of yen U.S. dollars
Cash dividends . . . . . . . . . . . . . . . . . . . . . . . . . . . . . . . . . . . . . . . . ¥13,421 $124,974Reserve for reduction in costs of fixed assets . . . . . . . . . . . . . . . 5,224 48,650Reserve for accelerated depreciation . . . . . . . . . . . . . . . . . . . . . . 3,255 30,307
Total . . . . . . . . . . . . . . . . . . . . . . . . . . . . . . . . . . . . . . . . . . . . ¥21,900 $203,931
18. CONTINGENTLIABILITIES
19. REVISION OF THE TERMFOR THE PAYMENT OFEMPLOYEES’ BONUSES
20. SUPPLEMENTARYINCOME INFORMATION
21. SUBSEQUENT EVENTS

53
ANNUAL REPORT 2005
REPORT OF INDEPENDENT CERTIFIED PUBLIC ACCOUNTANTS

54
ANNUAL REPORT 2005
Head Office16-5, Konan 2-chome, Minato-ku,Tokyo 108-8215, JapanPhone: +81-3-6716-3111Fax: +81-3-6716-5800
Established: January 11, 1950
Paid-in Capital: ¥265.6 billion
Total Number ofShares Authorized: 6,000,000,000
Total Number of Shares Issued: 3,373,647,813
Number of Shareholders: 328,988
Number of Employees: 34,306
Composition of Shareholders
Stock Listings: Tokyo, Osaka, Nagoya, Fukuoka and Sapporo Stock Exchanges
Ticker Code: 7011
Transfer Agent: The Mitsubishi Trust and Banking Corporation 4-5, Marunouchi 1-chome, Chiyoda-ku, Tokyo 100-8212, Japan
Certified PublicAccountants: Ernst & Young ShinNihon
Hibiya Kokusai Bldg., 2-2-3, Uchisaiwai-cho, Chiyoda-ku, Tokyo,Japan 100-0011
Number of shares owned % ofMajor Shareholders by major shareholders total shares
Japan Trustee Services Bank, Ltd. (Holder in Trust) 163,604,000 4.85%
The Master Trust Bank of Japan, Ltd. (Holder in Trust) 137,162,000 4.07
The Master Trust Bank of Japan, Ltd. (Holder in RetirementBenefit Trust for The Bank of Tokyo-Mitsubishi, Ltd.) 125,666,000 3.72
Meiji Yasuda Life Insurance Company 88,000,741 2.37
Tokio Marine & Nichido Fire Insurance Co., Ltd. 63,000,000 1.87
State Street Bank and Trust Company 505103 60,562,425 1.80
The Master Trust Bank of Japan, Ltd. (Holder in RetirementBenefit Trust for The Mitsubishi Trust and Banking Corporation) 45,934,000 1.36
The Bank of New York. Treaty Jasdec Account 33,448,841 0.99
Mitsubishi Heavy Industries Employee Shareholding Association 32,278,579 0.96
BNP Paribas Securities (Japan), Ltd. 31,275,000 0.93
Individualsand Others35.98%
ForeignInstitutionsand Individuals24.41%
FinancialInstitutions31.81%
Other Corporations6.89%
Note: Government and Local Public Entities hold lessthan 0.01 percent of outstanding shares.
MONTHLY STOCK PRICE RANGE & TRADING VOLUME(Tokyo Stock Exchange)
Securities Companies0.91%
Common stock price range (Left scale) Tokyo Price Index close (Right scale)
FY2000 FY2001 FY2002 FY2003 FY2004
FY2000 FY2001 FY2002 FY2003 FY2004(Thousands of shares)
(TOPIX)
0
200
400
100
300
500
600(¥)
0
100,000
200,000
300,000
400,000
500,000
600,000
0
500
1,000
1,500
2,000
2,500
3,000
Trading volume
CORPORATE DATAAs of March 31, 2005
54
ANNUAL REPORT 2005

Takashi Nishioka
CHAIRMANTakashi Nishioka
PRESIDENTKazuo Tsukuda
SENIOR EXECUTIVE VICE PRESIDENTJunichi Maezawa
EXECUTIVE VICE PRESIDENTSKazunori OhtaGeneral Manager, Shipbuilding & OceanDevelopment Headquarters
Shigeharu MatsuuraGeneral Manager, Steel Structures &Construction Headquarters
Ikuro NagataGeneral Manager, Presidential AdministrationOffice
Yoshimi UrataniGeneral Manager,Nuclear EnergySystems Headquarters
Tsutomu TakaokaGeneral Manager, MachineryHeadquarters
Hideo EgawaGeneral Manager,Global Strategic Planning& Operations Headquarters
Ichiro FukueGeneral Manager,Power Systems Headquarters
Nobuo TodaGeneral Manager, AerospaceHeadquarters
Hiroshi KanIn charge of Accounting, Financeand Material
Hideaki OmiyaGeneral Manager, Air-Conditioning &Refrigeration Systems Headquarters
BOARD OF DIRECTORS
DIRECTORSMikio SasakiChairman of Mitsubishi Corporation
Akihiro WadaSenior Adviser, Aisin Seiki Co., Ltd.
Sunao AokiGeneral Manager,Technical Headquarters
Katsuhiko YoshidaGeneral Manager, General Machinery& Special Vehicle Headquarters
STATUTORY AUDITORSSatoru KishiSenior Adviser, The Bank of Tokyo-Mitsubishi, Ltd.
Toyoshi NakanoSenior Adviser, The Mitsubishi Trustand Banking Corporation
Kichisaburo NomuraExecutive Adviser, All NipponAirways Co., Ltd.
Toshinori TomitaToyohiko Inaguma
(As of June 28, 2005)
ANNUAL REPORT 2005
Kazuo Tsukuda Junichi Maezawa
Kazunori Ohta Shigeharu Matsuura Ikuro Nagata
Hideo Egawa Nobuo Toda Hiroshi Kan
Yoshimi Uratani
Ichiro Fukue
Tsutomu Takaoka
Hideaki Omiya
55

MITS
UB
ISH
I HE
AV
Y IN
DU
STR
IES
, L TD. A
NN
UA
L RE
PO
RT 2005
Printed in Japan
To protect the environment, this brochure is printed on 100% recycledpaper with non-VOC inks (containing no Volatile Organic Compounds),by a waterless printing method that generates no harmful wastewater.
K060-ANAL05E1-A-0,(10.0)05-7,R