For the six months ended 30 June 2017 Analysis of ...
41
For the six months ended 30 June 2017 Analysis of financial results Your progress is woven into the fabric of Nigeria
Transcript of For the six months ended 30 June 2017 Analysis of ...

For the six months ended 30 June 2017
Analysis of financial resultsYour progress is woven into the fabric of Nigeria

424446484951
5355576264
727273
7576
2729303539
Analysis of financial results for the six months ended 30 June 2017
Overview of group income
Net interest income and margin analysis
Non-interest revenue
Credit impairment charges
Operating expenses
Taxation
Overview of group consolidated assets
Loans and advances
Loans and advances performance
Deposits and current accounts
Funding and liquidity
Market capitalisation and price-to-book ratioDividend payment historyEquity and range analysis
Financial and other definitions
Contact details
Segmental structure for key business units
Segmental income statement
Personal & Business Banking
Corporate & Investment Banking
Wealth
6970
Return on ordinary equity
Risk weighted assets
Group results in brief 2
Business unit review
41Income statement analysis
Balance sheet analysis
67Capital management
Market & shareholder information
74Other information
26
52
71
347811121314151617181920222425
Performance highlights
Financial results, ratios and statistics
Economic and capital market statistics
Half year performance
Summarised income statement – Group
Statement of comprehensive income – Group
Summarized income statement quarterly analysis – Group
Summarised income statement – Bank
Statement of comprehensive income – Bank
Summarized income statement quarterly analysis – Bank
Statement of financial position – Group
Group financial position quarterly analysis
Statement of financial position – Bank
Statement of changes in equity – Group
Statement of changes in equity – Bank
Statement of cashflows – Group
Statement of cashflows – Bank

Performance higlights
Gross earnings
N97.2 billion36% up
Profit after tax
N24.1 billion113% up
Cost-to-income ratio
47.0% (H1 2016: 57.7%)
Fitch rating
AAA(nga) (2016: AAA(nga))
Liquidity ratio (Bank)
90.4% (statutory minimum: 30%)
Total income
N81.3 billion43% up
Net loans & advances
N368 billion(FY 2016: N353 billion) up 4%
Capital adequacy ratio (Bank)
20.2% (H1 2016: 18.9%)
Annualized Return on average equity
31.3% (H1 2016: 15.0%)
NPL/total loan ratio
7.8% (FY 2016: 5.0%)
Profit before tax
N29.2 billion86% up
Deposit liabilities
N632.8 billion(FY 2016: N561 billion) up 13%
Credit loss ratio
7.3% (H1 2016: 4.3%)
Price to book
2.1 times (2016: 1.1 times)
Total assets
N1.274 trillion (FY 2016: N1,053 trillion) up 21%
Interest based revene
Non-interest based revene
Gross loans and advances
Deposits from customers
Interest based and non-interest based revenueCAGR (2013-2017): Interest based: 17%
Non-interest based: 14%
Gross loans and customer depositsCAGR (2013-2017): Gross loans: (2)%
Customer deposits: 1%10
0H1 2013 H1 2014 H1 2015 H1 2016 H1 2017
10,000
20,000
30,000
40,000
50,000
60,000
Nmillion
40,470
24,127
56,728
32,316
36,713
26,577
41,718
30,382 27,718
33,997
10
0H1 2015 FY 2015 H1 2016 FY 2016 H1 2017
10
200
300
400
500
700
600
Nbillion
632.8601.7
393.7
561.0
375.3
593.6
407.1431.5
493.5
379.4
2 3Group results
in brief
Business
unit review
Balance sheet
analysis
Market & shareholder
information
Income statement
analysis
Capital
management
Other
information
Stanbic IBTC Analysis of financial results for the 6 months ended 30 June 2017
Gro
up
res
ult
s
in b
rief
Title (continued)
Group results
in brief
347811121314151617181920222425
Performance highlightsFinancial results, ratios and statisticsEconomic and capital market statisticsHalf year performanceSummarised income statement – Group Statement of comprehensive income – GroupSummarized income statement quarterly analysis – Group Summarised income statement – Bank Statement of comprehensive income – BankSummarized income statement quarterly analysis – Bank Statement of financial position – GroupGroup financial position quarterly analysisStatement of financial position – BankStatement of changes in equity – GroupStatement of changes in equity – Bank Statement of cashflows – GroupStatement of cashflows – Bank
Group results in brief

Stanbic IBTC Group Change % H1 2017 H1 2016 FY 2016
Business unit contribution to profit before tax
Profit before tax Nmillion 86 29,169 15,682 37,209
Banking business >100 14,324 5,500 14,907
Personal & Business Banking Nmillion (>100) (5,179) 1,371 (1,684)
Corporate & Transactional Banking Nmillion >100 19,503 4,129 16,591
Investment Banking and other subsidiaries Nmillion >100 1,664 (233) 128
Wealth Nmillion 27 13,181 10,415 22,174
Balance sheet
Total assets Nmillion 21 1,273,960 1,174,543 1,053,523
Loans and advances (net of credit impairments) Nmillion 4 367,956 375,636 352,965
Deposits liabilities Nmillion 13 632,751 593,643 560,969
Key performance indicators
Net interest margin % 7.2 4.4 5.9
Non-interest revenue to total income % 49.5 60.0 54.1
Cost-to-income ratio % 47.0 57.7 54.8
Return on average equity % 31.3 15.0 18.9
Return on average assets % 4.3 2.2 2.5
Basic earnings per share kobo >100 230 95 246
Net asset value per share kobo 22 1,595 1,307 1,371
Shareholders' equity Nmillion 159,496 130,669 137,102
Other indicators
Price-to-book (P/B ratio) times 89 2.1 1.2 1.1
Effective tax rate % 17.3 27.8 23.4
Banking activities Change % H1 2017 H1 2016 FY 2016
Balance sheet
Total assets Nmillion 24 1,229,804 1,127,875 993,757
Loans and advances (net of credit impairments) Nmillion 4 367,956 375,636 352,965
Deposits from customers Nmillion 14 647,108 601,198 568,673
Selected returns and ratios
Return on average equity % 23.7 10.8 14.7
Return on average assets % 2.5 1.0 1.6
Loan to deposit ratio % 62.2 68.6 61.7
Net interest margin % 6.8 4.3 5.7
Non-performing loan to total loan % 7.8 6.9 5.0
Non-interest revenue to total income % 36.3 48.8 41.4
Credit impairment charges Nmillion >100 13,953 8,450 19,803
Credit loss ratio % 7.3 4.3 5.2
Cost-to-income ratio % 53.3 66.3 61.9
Tier 1 capital adequacy % 16.1 14.2 16.3
Total capital adequacy % 20.2 18.9 21.0
Effective taxation rate % 4.7 6.3 (0.8)
4 5Group results
in brief
Business
unit review
Balance sheet
analysis
Market & shareholder
information
Income statement
analysis
Capital
management
Other
information
Stanbic IBTC Analysis of financial results for the 6 months ended 30 June 2017
Gro
up
res
ult
s
in b
rief
Financial results, ratios and statistics

Stanbic share price NSE all share index Banking index
Economic and capital market statistics
Change % H1 2017 H1 2016 FY 2016
Economic indicators
Headline inflation % 16.1 16.5 15.7
GDP growth % (0.5) (2.1) (1.3)
External reserves $billion 15 30.3 26.4 25.8
Average official exchange rate N/$ 44 305.0 212.5 264.2
Market Indicators
NSE All Share Index 12 33,117.5 29,597.8 26,874.6
NSE turnover Nbillion 29 375 291.7 549.7
Average daily activity million 6 348.3 329.5 291.2
Aggregate market capitalisation Ntrillion 10 19 17.3 16.2
Equity market capitalisation Ntrillion 13 11.5 10.2 9.2
Stanbic share statistics
Share price
High for the period kobo 86 3,300 1,776 1,776
Low for the period kobo 23 1,500 1,223 1,223
Closing kobo >100 3,300 1,620 1,500
Shares traded
Number of shares thousands 61 300,355 185,988 348,093
Value of shares Nmillion >100 6,480 2,769 5,203
Market capitalisation Nbillon >100 330 162 150
6 7Group results
in brief
Business
unit review
Balance sheet
analysis
Market & shareholder
information
Income statement
analysis
Capital
management
Other
information
Stanbic IBTC Analysis of financial results for the 6 months ended 30 June 2017
Gro
up
res
ult
s
in b
rief
Financial results, ratios and statistics (continued)
In H1 2017, the group experienced:
Globally
• The global economy continued to be characterised by substantial
appetite for risk assets as a result of ample global flows, despite
an increase in political risk globally;
• Global markets remained on edge with respect to substantial increase
in political risk events which included scheduled elections in the
Netherland and France as well as an unscheduled election in the
United Kingdom, coupled with still uncertain policy outlook from
the United States;
• After initially rallying towards USD55 per barrel, oil prices declined
substantially towards the end of H1:2017 as fundamentals remain
unfavorable with global production potentially rising due to
rising output from Nigeria and Libya. The freezes engineered by
OPEC did little to stem the decline in oil prices;
• Going by growth data in H1:2017, an uptick in Africa’s economic
growth seems well underway. This will likely prompt forecasters
like the IMF to upgrade their growth forecasts for 2017 and 2018.
The laggards are likely to be those commodity exporters that are
not allowing their economies to adjust to a low commodity price
environment;
Nigeria
• Anecdotal evidence in H1:2017 suggests that some macroeconomic
rebalancing is underway in the Nigerian economy and should continue
over the next year. A combination of contracting credit demand and
stunted investment spending will allow economic growth recover
slowly in the near term.
• The introduction of the Investors’ and Exporters’ Foreign Exchange
(IEFX) window has signaled yet another step taken by the Central
Bank of Nigeria (CBN) to improve the functioning of the FX market.
• Although the Central Bank left the formal policy rate unchanged
through the course of the first half of the year, it has engineered
tight NGN liquidity conditions which resulted in private sector
credit contracting by an average of 2.0% y/y between January
and April, after taking account of the revaluation of FX loans due
to the depreciation of the NGN.
• The depressed oil price and production meant that government
revenue remained under pressure. As a result, government had to
ramp up its borrowing both domestically and externally with the
issuance of USD1.5billion Eurobond and a USD300million Diaspora
bond.
• The capital market performance returned into positive territory
in H1 2017 as a result of improved economic conditions.
Share price performance: H1 2017 (rebased)
Stanbic’s share price outperformed both the Banking Index (BI) and The NSE ASI. Stanbic’s share price closed at N33.00 representing a 120% increase
from N15.00 at the end of 2016 while the BI and NSE ASI appreciated by 45.1% and 23.2% respectively.
0
0.5
1.0
1.5
2.0
2.5
3-J
an-1
7
16
-Jan
-17
29
-Jan
-17
11
-Feb
-17
24
-Feb
-17
9-M
ar-1
7
22
-Mar
-17
4-A
pr-1
7
17
-Apr
-17
30
-Apr
-17
26
-May
-17
21
-Jun
-17
8-J
un-1
7
%

8 9Group results
in brief
Business
unit review
Balance sheet
analysis
Market & shareholder
information
Income statement
analysis
Capital
management
Other
information
Stanbic IBTC Analysis of financial results for the 6 months ended 30 June 2017
Gro
up
res
ult
s
in b
rief
Half year performance
Operating environmentWith the improved economic activities as a
result of increased foreign exchange liquidity
and rising oil price, we expect the nation to
be on its way out of recession by the end of
this year. The Stanbic IBTC Bank Purchasing
Manager Index and declining inflation rate
are signals to Nigeria’s economic recovery.
Real GDP growth is forecasted to reach 1.0%
year-on-year in 2017 and 2.5% year-on-year
in 2018 according to Standard Bank Research
from a 1.5% contraction in 2016. It is expected
that with oil prices and production levels rising,
banks’ dollar liquidity pressures would gradually
ease. As such, the Nigerian economy contracted
by 0.52% in real terms in the first quarter of
2017, the lowest level of contraction recorded
in the last five quarters reflecting the gradual
recovery of the macro-economic environment.
The nation’s external reserves reached
$30.3 billion in June 2017, increasing by 17.4%
from $25.8 billion recorded in December
2016. The increase in crude oil output and
price accounted for the accretion in external
reserves. According to OPEC, Nigerian crude
production rose to 1.68 million b/d in June,
the highest level in more than one year. This
followed the restart of Forcados loadings for
the first time since October 2016.
Headline inflation which had been on the
rise through out 2016 has begun to inch lower
with five consecutive month decreases to June
2017. From 18.6 per cent in December 2016,
headline inflation rose to 18.7 per cent in
January 2017, but subsided to 17.8 per cent in
February, 17.3 per cent in March, 17.2 per cent
in April, 16.3 per cent in May and decelerated
further, reaching 16.1 per cent in June 2017
thus representing the stabilization of general
prices, although food inflation continues to rise.
Food inflation reached the 19 per cent handle
in June, representing a historical high.
The Nigerian Stock Exchange All Share Index
(“The NSE ASI”) closed in positive territory
at 33,117.5 at the end of June 2017, crossing
the 30,000.0 points mark for the first time in
about a year. The positivity witnessed in the
Non-interest revenue
Non-interest revenue, which comprises revenue
from commissions, fees, trading and other
non-interest bearing revenue, was up by 18% to
N40.3 billion (H1 2016: N34.2 billion).
Net fees and commissions revenue
remained flat to N27.9 billion from previous
year, though we continue to face transaction
fee reduction from various stakeholders.
With the introduction of the IEFX market
and improved foreign exchange liquidity, we
expect investment banking deal pipelines will
be converted and growth in the stock market is
expected to impact revenue of our custody and
stockbroking businesses positively.
Trading revenue increased by 81% to N12
billion (H1 2016: N6.6 billion) on the back of
improved foreign exchange liquidity and high
interest rate on government securities.
Credit impairments
Credit impairment charges increased by 65%
to N13.95 billion (H1 2016: N8.5billion) as
we continued our clean-up of the risk asset
portfolio. With Nigeria falling into recession,
economic activites were impacted significantly
and we witnessed business activities decline. In
line with economic realities, the group had to
increase provisioning on its loan portfolio. The
increase in credit impairment charges led to a
higher cost of risk which increased to 7.3% from
5.2% in FY 2016.
Operating expenses
The group maintained cost discipline with cost
to income ratio declining to 47.0% from 57.7%
in H1 2016 as we continue on cost efficiency
drive. Operating expenses increased by 16% to
N38.2 billion (H1 2016: N32.9 billion). Staff
costs grew by 15% on the back of inflation
adjustment to staff salaries and net movement
in headcount of staff.
Other operating expenses increased by 17%
driven by increase in information technology,
AMCON sinking fund contribution expenses,
premises maintenance related expenses and
deposit insurance.
first half of the year may be attributed to major
interventions in the foreign exchange market
by the Central Bank which has boosted investor
confidence. The major intervention being the
introduction of the Investors’ and Exporters’
Foreign Exchange (“IEFX”) window which led to
significant improvement in the capital market
performance thereby impacting Assets Under
Management (“AUM”) positively.
The Federal Government introduced a
number of reforms aimed at revamping the
economy, one of which includes the publishing
of Economic Recovery and Growth Plan
(“ERGP”), a Medium Term Plan for 2017 –
2020 which was developed for the purpose of
restoring economic growth while leveraging
the ingenuity and resilience of the Nigerian
people. Furthermore, the signing of executive
orders aimed at improving the ease of doing
business in the country is a positive sign. That
said, implementation of reforms outlined in the
ERGP is key to ensuring sustainable growth and
development.
The financial sector has experienced
some regulatory changes since December
2016. The most significant has to do with the
foreign exchange market framework which the
introduction of the IEFX window has improved
dollar liquidity as we witnessed increased inflow
of funds from both foreign portfolio and direct
investors. While the monetary policy rate has
remained unchanged at 14.0%, the central bank
continues to implement a tight monetary policy
environment in order to curb inflation, limit
pressure on the exchange rate and engineer
positive real returns that will be attractive to
investors.
Available data from the CBN as at April 2017
suggests that average Capital Adequacy Ratio
(CAR) of Deposit Money Banks deteriorated to
12.8 per cent from 13.6 per cent in February,
which is below the prudential requirement
of 15.0 per cent for banks with international
authorization. Furthermore, Non-Performing
Loans (NPLs) rose to 15.2 per cent from 13.6
per cent in February 2017, which is above the
prudential guide of 5.0 per cent. The industry
Overall, the group’s profit before tax
increased by 86% to N29.2 billion (H1 2016:
N15.7 billion), while profit after tax also
increased by 113% to N24.1 billion (H1 2016:
N11.3 billion), attributable to increased interest
income and trading revenue.
Balance sheet analysisThe group’s total assets close at N1.27 trillion
at the end of June 2017, growing by 21% over
the N1.05 trillion recorded in FY 2016. The
growth in total assets is majorly from the 13%
growth in deposit from customers which funded
50% of total assets. Our eco-system and work
place banking team have been mining the
available opportunities as much as possible.
Loans and advances
Net loans and advances grew by 4% to N368
billion in the first six months of 2017 (FY 2016:
N353 billion), on the back of our growing
customer relationships. We will continue to
grow our loan book responsibly in line with
economic realities.
Non-performing loans increased by 65% to
N30.9 billion in H1 2017 from N18.7 billion in
FY 2016. The increase is largely on the back of
some newly classified loans in oil & gas sector.
The non-performing loans to total loans ratio
consequently deteriorated to 7.8% from 5.0%
recorded in FY 2016.
Funding and liquidity
Customer deposits closed at N632.8 billion
in H1 2017 increasing by 13% from N561
billion recorded in FY 2016. The increase in
deposit from customers is supported by our
growing customer base, enlarged delivery
channels, digitalization, ecosystem and work
place banking strategy. Customer acquisition
initiatives continued to yield positive results
as current and savings account balances grew
by 19% from FY 2016.
The ratio of current and savings deposits
to total deposits increased from 57% to 60%
at the end of H1 2017.
The group maintained a liquidity position
above minimum requirement throughout the
period ended 30 June 2017. The liquidity ratio
closed at 100.2% (Bank: 90.4%) in H1 2017
higher than the regulatory minimum of 30%.
liquidity ratio also recorded a decline from 46.6
per cent to 44.6 per cent.
We cautiously anticipate some improvement
in asset quality in the latter part of the year as
the economy gradually recovers from recession.
The manufacturing and agricultural sectors
are expected to drive lending in the near term
driven by government’s resolve to increase
domestic production and reduce dependence
on imports. In addition, it is expected that
AUM will continue to rise as higher oil revenues
should result in state and local governments
making good on salary payments to government
workers and the capital markets continue to
outperform.
Our resultsOur performance in the first half of 2017 was
characterised by steady growth in balance
sheet with conscious effort of deposit liability
growth via current and savings account thereby
reducing our interest expense in line with our
strong focus on cost containment to mitigate
the impact of rising cost of funds and credit
impairments on our operating performance.
Income statement analysisThe group’s gross revenue grew by 36% to
N97.2 billion (H1 2016: N71.3 billion) on the
back of a 80% increase in net interest income.
Net interest income
Interest income grew by 55% to N56.7 billion
in H1 2017 from N36.7 billion achieved in H1
2016. This growth is supported by increase
in yields from investment securities. Interest
expense was up 13% much lower than the
income growth rate largely due to growth in less
expensive to total deposit ratio. This resulted
in an 80% increase in net interest income and
consequently a growth in net interest margin to
7.2% (FY 2016: 5.9%).
The central bank’s strategies to mop up
liquidity has continued to keep interest rate and
yield up amidst declining inflation. We expect
interest and inflation rate to converge at some
point.

Summarised income statement – Group
Change
%
H1 2017
Nmillion
H1 2016
Nmillion
FY 2016
Nmillion
Gross earnings 36 97,198 71,320 156,425
Net interest income 80 41,035 22,849 57,859
Interest income 55 56,728 36,713 87,467
Interest expense (13) (15,693) (13,864) (29,608)
Non-interest revenue 18 40,289 34,218 68,194
Net fees and commission revenue 2 27,893 27,406 52,154
Fees and commission revenue 1 28,074 27,795 52,918
Fees and commission expense 53 (181) (389) (764)
Trading revenue 81 11,966 6,607 15,326
Other revenue >100 430 205 714
Total income 43 81,324 57,067 126,053
Credit impairment charges (65) (13,953) (8,450) (19,803)
Income after credit impairment charges 39 67,371 48,617 106,250
Operating expenses (16) (38,202) (32,935) (69,041)
Staff costs (15) (16,492) (14,378) (30,173)
Other operating expenses (17) (21,710) (18,557) (38,868)
Profit before taxation 86 29,169 15,682 37,209
Direct taxation (16) (5,057) (4,365) (8,689)
Profit for the period >100 24,112 11,317 28,520
Profit attributable to:
Non-controlling interests (42) 1,067 1,853 3,878
Equity holders of the parent >100 23,045 9,464 24,642
Profit for the period >100 24,112 11,317 28,520
Group H1 2017
Nmillion
Bank H1 2017
Nmillion
Group FY 2016
Nmillion
Bank FY 2016
Nmillion
Tier I capital 150,421 112,533 129,480 99,144
Tier II capital 28,827 28,070 28,906 28,099
Total qualifying capital 179,248 140,603 158,386 127,243
Credit risk 561,681 534,642 486,430 458,266
Operational risk 207,092 146,986 207,092 146,986
Market risk 15,425 15,425 1,917 1,917
Risk weighted assets 784,198 697,053 695,439 607,169
Capital adequacy
Tier I 19.2% 16.1% 18.6% 16.3%
Tier II 3.7% 4.0% 4.2% 4.6%
Total 22.9% 20.2% 22.8% 21.0%
Capital adequacyThe group’s capital base remained adequate with ratios above the regulatory requirement.
The group currently has no immediate plan to raise additional capital.
10 11Group results
in brief
Business
unit review
Balance sheet
analysis
Market & shareholder
information
Income statement
analysis
Capital
management
Other
information
Stanbic IBTC Analysis of financial results for the 6 months ended 30 June 2017
Gro
up
res
ult
s
in b
rief
Half year performance (continued)

Summarised group income statement quarterly analysisStatement of other comprehensive income – Group
QoQ
Change
%
Q2 2017
Nmillion
Q1 2017
Nmillion
H1 2017
Nmillion
Gross income 7 50,176 47,022 97,198
Net interest income 17 22,155 18,880 41,035
Interest income 11 29,887 26,841 56,728
Interest expense 3 (7,732) (7,961) (15,693)
Non-interest revenue 0.38 20,183 20,106 40,289
Net fee and commission revenue 11 14,699 13,194 27,893
Fee and commission revenue 12 14,805 13,269 28,074
Fee and commission expense (41) (106) (75) (181)
Trading revenue (20) 5,315 6,651 11,966
Other revenue (35) 169 261 430
Total income 9 42,338 38,986 81,324
Credit impairment charges (>100) (10,626) (3,327) (13,953)
Income after credit impairment charges (11) 31,712 35,659 67,371
Operating expenses 24 (21,169) (17,033) (38,202)
Staff costs (28) (9,258) (7,234) (16,492)
Other operating expenses (22) (11,911) (9,799) (21,710)
Profit before taxation (43) 10,543 18,626 29,169
Taxation 2 (2,505) (2,552) (5,057)
Profit for the period (50) 8,038 16,074 24,112
Profit attributable to:
Non-controlling interests (5) 520 547 1,067
Equity holders of the parent (52) 7,518 15,527 23,045
Profit for the period 8,038 16,074 24,112
Key performance indicator
Net interest margin (annualised) 7.8 7.0 7.2
Non-interest revenue to total income 47.7 51.6 49.5
Credit loss ratio (annualised) 11.1 3.6 7.3
Cost-to-income ratio 50.0 43.7 47.0
Return on average equity (annualised) 20.3 42.9 31.3
Return on average assets (annualised) 2.8 5.9 4.3
Non-performing loan to total loan 7.8 10.5 7.8
Cost of funds (annualised) 3.8 4.0 3.9
H1 2017
Nmillion
H1 2016
Nmillion
FY 2016
Nmillion
Profit for the period 24,112 11,317 28,520
Other comprehensive income
Items that will never be reclassified to profit or loss - - -
Items that are or may be reclassified subsequently to profit or loss:
Net change in fair value of available-for-sale financial assets (50) (1,618) (409)
Realised fair value adjustments on available-for-sale financial assets
reclassified to income statement
(86) 96 76
Income tax on other comprehensive income - - -
Other comprehensive income for the period net of tax (136) (1,522) (333)
Total comprehensive income for the period 23,976 9,795 28,187
Total comprehensive income attributable to:
Non-controlling interests 1,061 1,836 3,829
Equity holders of the parent 22,915 7,959 24,358
23,976 9,795 28,187
12 13Group results
in brief
Business
unit review
Balance sheet
analysis
Market & shareholder
information
Income statement
analysis
Capital
management
Other
information
Stanbic IBTC Analysis of financial results for the 6 months ended 30 June 2017
Gro
up
res
ult
s
in b
rief

Statement of other comprehensive income – Bank
YoY
Change
%
H1 2017
Nmillion
H1 2016
Nmillion
FY 2016
Nmillion
Gross earnings 35 75,394 55,697 121,755
Net interest income 82 38,606 21,178 53,340
Interest income 51 53,212 35,150 83,267
Interest expense (5) (14,606) (13,972) (29,927)
Non-interest revenue 9 22,001 20,158 37,724
Net fees and commission revenue (26) 9,901 13,384 22,557
Fees and commission revenue (27) 10,082 13,773 23,321
Fees and commission expense 53 (181) (389) (764)
Trading revenue 78 11,754 6,610 14,504
Other revenue >100 346 164 663
Total income 47 60,607 41,336 91,064
Credit impairment charges (65) (13,953) (8,450) (19,803)
Income after credit impairment charges 42 46,654 32,886 71,261
Operating expenses (18) (32,330) (27,386) (56,354)
Staff costs (13) (12,924) (11,404) (24,104)
Other operating expenses (28) (19,406) (15,982) (32,250)
Profit before taxation >100 14,324 5,500 14,907
Direct taxation (94) (671) (347) 123
Profit for the period >100 13,653 5,153 15,030
Profit attributable to:
Non-controlling interests - - - -
Equity holders of the parent >100 13,653 5,153 15,030
Profit for the period >100 13,653 5,153 15,030
H1 2017
Nmillion
H1 2016
Nmillion
FY 2016
Nmillion
Profit for the period 13,653 5,153 15,030
Other comprehensive income
Items that will never be reclassified to profit or loss - - -
Items that are or may be reclassified subsequently to profit or loss:
Net change in fair value of available-for-sale financial assets (167) (1,642) (474)
Realised fair value adjustments on available-for-sale financial assets
reclassified to income statement
87 96 (162)
Income tax on other comprehensive income - - -
Other comprehensive income for the period net of tax (80) (1,546) (636)
Total comprehensive income for the period 13,573 3,607 14,394
Total comprehensive income attributable to:
Non-controlling interests - - -
Equity holders of the parent 13,573 3,607 14,394
13,573 3,607 14,394
14 15Group results
in brief
Business
unit review
Balance sheet
analysis
Market & shareholder
information
Income statement
analysis
Capital
management
Other
information
Stanbic IBTC Analysis of financial results for the 6 months ended 30 June 2017
Gro
up
res
ult
s
in b
rief
Summarised income statement – Bank
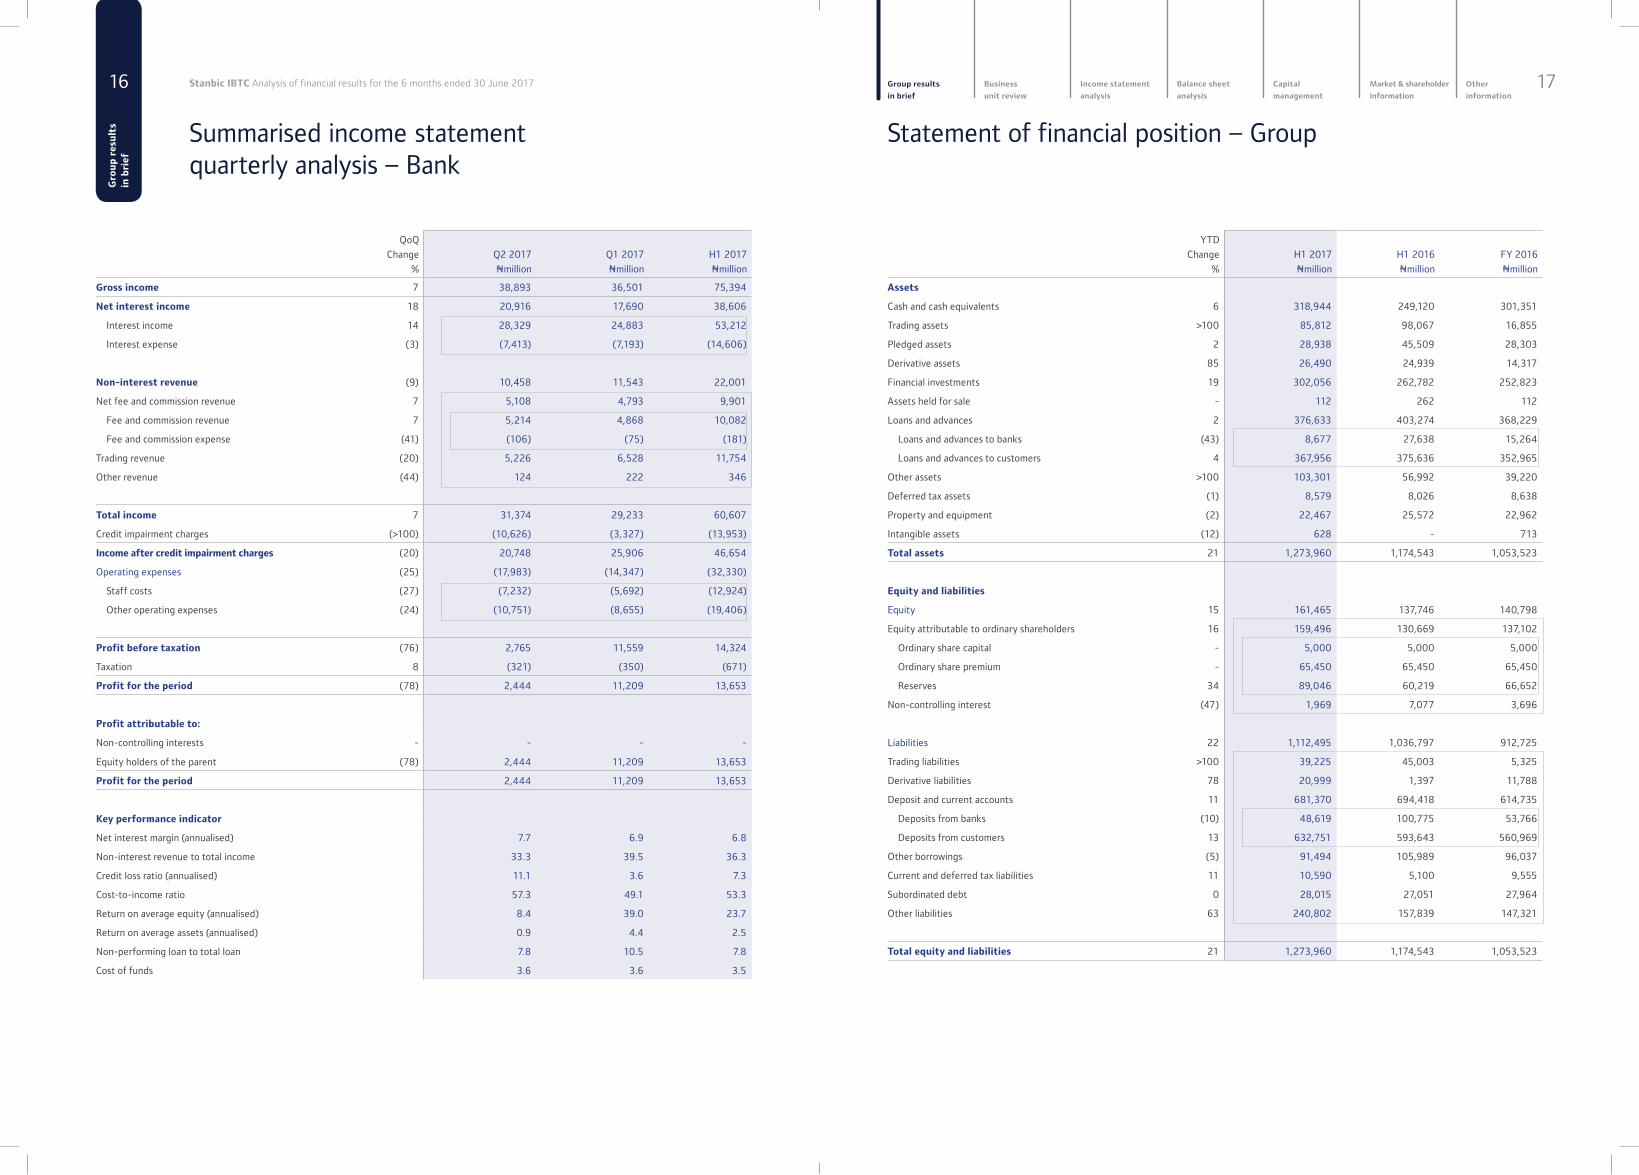
Summarised income statement quarterly analysis – Bank
YTD
Change
%
H1 2017
Nmillion
H1 2016
Nmillion
FY 2016
Nmillion
Assets
Cash and cash equivalents 6 318,944 249,120 301,351
Trading assets >100 85,812 98,067 16,855
Pledged assets 2 28,938 45,509 28,303
Derivative assets 85 26,490 24,939 14,317
Financial investments 19 302,056 262,782 252,823
Assets held for sale - 112 262 112
Loans and advances 2 376,633 403,274 368,229
Loans and advances to banks (43) 8,677 27,638 15,264
Loans and advances to customers 4 367,956 375,636 352,965
Other assets >100 103,301 56,992 39,220
Deferred tax assets (1) 8,579 8,026 8,638
Property and equipment (2) 22,467 25,572 22,962
Intangible assets (12) 628 - 713
Total assets 21 1,273,960 1,174,543 1,053,523
Equity and liabilities
Equity 15 161,465 137,746 140,798
Equity attributable to ordinary shareholders 16 159,496 130,669 137,102
Ordinary share capital - 5,000 5,000 5,000
Ordinary share premium - 65,450 65,450 65,450
Reserves 34 89,046 60,219 66,652
Non-controlling interest (47) 1,969 7,077 3,696
Liabilities 22 1,112,495 1,036,797 912,725
Trading liabilities >100 39,225 45,003 5,325
Derivative liabilities 78 20,999 1,397 11,788
Deposit and current accounts 11 681,370 694,418 614,735
Deposits from banks (10) 48,619 100,775 53,766
Deposits from customers 13 632,751 593,643 560,969
Other borrowings (5) 91,494 105,989 96,037
Current and deferred tax liabilities 11 10,590 5,100 9,555
Subordinated debt 0 28,015 27,051 27,964
Other liabilities 63 240,802 157,839 147,321
Total equity and liabilities 21 1,273,960 1,174,543 1,053,523
QoQ
Change
%
Q2 2017
Nmillion
Q1 2017
Nmillion
H1 2017
Nmillion
Gross income 7 38,893 36,501 75,394
Net interest income 18 20,916 17,690 38,606
Interest income 14 28,329 24,883 53,212
Interest expense (3) (7,413) (7,193) (14,606)
Non-interest revenue (9) 10,458 11,543 22,001
Net fee and commission revenue 7 5,108 4,793 9,901
Fee and commission revenue 7 5,214 4,868 10,082
Fee and commission expense (41) (106) (75) (181)
Trading revenue (20) 5,226 6,528 11,754
Other revenue (44) 124 222 346
Total income 7 31,374 29,233 60,607
Credit impairment charges (>100) (10,626) (3,327) (13,953)
Income after credit impairment charges (20) 20,748 25,906 46,654
Operating expenses (25) (17,983) (14,347) (32,330)
Staff costs (27) (7,232) (5,692) (12,924)
Other operating expenses (24) (10,751) (8,655) (19,406)
Profit before taxation (76) 2,765 11,559 14,324
Taxation 8 (321) (350) (671)
Profit for the period (78) 2,444 11,209 13,653
Profit attributable to:
Non-controlling interests - - - -
Equity holders of the parent (78) 2,444 11,209 13,653
Profit for the period 2,444 11,209 13,653
Key performance indicator
Net interest margin (annualised) 7.7 6.9 6.8
Non-interest revenue to total income 33.3 39.5 36.3
Credit loss ratio (annualised) 11.1 3.6 7.3
Cost-to-income ratio 57.3 49.1 53.3
Return on average equity (annualised) 8.4 39.0 23.7
Return on average assets (annualised) 0.9 4.4 2.5
Non-performing loan to total loan 7.8 10.5 7.8
Cost of funds 3.6 3.6 3.5
16 17Group results
in brief
Business
unit review
Balance sheet
analysis
Market & shareholder
information
Income statement
analysis
Capital
management
Other
information
Stanbic IBTC Analysis of financial results for the 6 months ended 30 June 2017
Gro
up
res
ult
s
in b
rief
Statement of financial position – Group

Group financial position quarterly analysis
QOQ
Change %
2Q 2017
Nmillion
1Q 2017
Nmillion
FY 2016
Nmillion
Assets
Cash and cash equivalents 6 318,944 302,272 301,351
Trading assets (12) 85,812 98,039 16,855
Pledged assets (25) 28,938 38,493 28,303
Derivative assets 2 26,490 25,960 14,317
Financial investments 7 302,056 281,130 252,823
Assets held for sale - 112 112 112
Loans and advances 8 376,633 347,443 368,229
Loans and advances to banks 6 8,677 8,184 15,264
Loans and advances to customers 8 367,956 339,259 352,965
Other assets >100 103,301 40,189 39,220
Deferred tax assets 2 8,579 8,449 8,638
Property and equipment (1) 22,467 22,702 22,962
Intangible assets (2) 628 638 713
Total assets 9 1,273,960 1,165,427 1,053,523
Equity and liabilities
Equity 3 161,465 156,048 140,798
Equity attributable to ordinary shareholders 4 159,496 152,986 137,102
Ordinary share capital - 5,000 5,000 5,000
Ordinary share premium - 65,450 65,450 65,450
Reserves 8 89,046 82,536 66,652
Non-controlling interest (36) 1,970 3,062 3,696
Liabilities 10 1,112,495 1,009,379 912,725
Trading liabilities (15) 39,225 46,003 5,325
Derivative liabilities 17 21,000 17,995 11,788
Deposit and current accounts 0 681,370 678,322 614,735
Deposits from banks (43) 48,619 85,035 53,766
Deposits from customers 7 632,751 593,287 560,969
Other borrowings 10 91,494 83,147 96,037
Current and deferred tax liabilities (10) 10,590 11,797 9,555
Subordinated debt 1 28,015 27,651 27,964
Provisions and other liabilities 67 240,802 144,464 147,321
Total equity and liabilities 9 1,273,960 1,165,427 1,053,523
Statement of financial position – Bank
YTD
Change
%
H1 2017
Nmillion
H1 2016
Nmillion
FY 2016
Nmillion
Assets
Cash and cash equivalents 9 315,092 233,732 289,312
Trading assets >100 84,569 96,786 15,657
Pledged assets 2 28,938 45,509 28,303
Derivative assets 85 26,490 24,939 14,317
Financial investments 26 275,444 243,331 217,917
Assets held for sale - - 262 -
Loans and advances 2 376,633 403,234 368,229
Loans and advances to banks (43) 8,677 27,598 15,264
Loans and advances to customers 4 367,956 375,636 352,965
Other assets >100 94,574 50,581 31,307
Deferred tax assets 0 8,337 7,332 8,334
Property and equipment (3) 19,099 22,169 19,668
Intangible assets (12) 628 - 713
Total assets 24 1,229,804 1,127,875 993,757
Equity and liabilities
Equity 12 122,874 97,472 109,317
Equity attributable to ordinary shareholders 12 122,874 97,472 109,317
Ordinary share capital - 1,875 1,875 1,875
Ordinary share premium - 42,469 42,469 42,469
Reserves 19 78,530 53,128 64,973
Non-controlling interest - - - -
Liabilities 25 1,106,930 1,030,403 884,440
Trading liabilities >100 39,225 45,003 5,325
Derivative liabilities 78 20,999 1,397 11,788
Deposit and current accounts 12 695,727 701,973 622,439
Deposits from banks (10) 48,619 100,775 53,766
Deposits from customers 14 647,108 601,198 568,673
Other borrowings 15 91,494 105,989 79,633
Current tax liabilities 3 1,928 1,338 1,865
Subordinated debt 0 28,015 27,051 27,964
Provisions and other liabilities 69 229,542 147,652 135,426
Total equity and liabilities 24 1,229,804 1,127,875 993,757
18 19Group results
in brief
Business
unit review
Balance sheet
analysis
Market & shareholder
information
Income statement
analysis
Capital
management
Other
information
Stanbic IBTC Analysis of financial results for the 6 months ended 30 June 2017
Gro
up
res
ult
s
in b
rief

Statement of changes in equity – Group
Ordinary
share capital
Nmillion
Share
premium
Nmillion
Merger
reserve
Nmillion
Statutory
credit risk
reserve
Nmillion
Available-for-
sale revaluation
reserve
Nmillion
Share-based
payment reserve
Nmillion
AGSMEIS
reserve
Nmillion
Other
regulatory
reserves
Nmillion
Retained
earnings
Nmillion
Ordinary
shareholders’
equity
Nmillion
Non-controlling
interest
Nmillion
Total
equity
Nmillion
Balance at 1 January 2017 5,000 65,450 (19,123) 1,025 942 36 - 33,615 50,157 137,102 3,696 140,798
Total comprehensive(loss)/income for the period (130) - - 23,045 22,915 1,061 23,976
Profit for the period - - - - - - - 23,045 23,045 1,067 24,112
Other comprehensive (loss)/income after tax for the period (130) - - - - (130) (6) (136)
Net change in fair value on available-for-sale financial assets - - - - (44) - - - (44) (6) (50)
Realised fair value adjustments on available-for-sale financial assets - - - - (86) - - - (86) - (86)
Statutory credit risk reserve - - - - - - - - - - -
Transfer to statutory reserves - - - - - - 749 (749) - - -
Transactions with shareholders, recorded directly in equity - - - - - (21) - - (500) (521) (2,788) (3,309)
Equity-settled share-based payment transactions - - - - - (21) - - - (21) (21)
Dividends paid to equity holders - - - - - - - - (500) (500) (2,788) (3,288)
Balance at 30 June 2017 5,000 65,450 (19,123) 1,025 812 15 749 33,615 71,953 159,496 1,969 161,465
Balance at 1 January 2016 5,000 65,450 (19,123) 6,684 1,226 56 - 26,218 38,215 123,726 5,241 128,967
Total comprehensive income/(loss) for the period - - - - (1,505) - - - 8,407 6,902 1,836 8,738
Profit for the period - - - - - - - - 8,407 8,407 1,853 10,260
Other comprehensive income/(loss) after tax for the period - - - - (1,505) - - - - (1,505) (17) (1,522)
Net change in fair value on available-for-sale financial assets - - - - (1,601) - - - - (1,601) (17) (1,618)
Realised fair value adjustments on available-for-sale financial assets - - - - 96 - - - - 96 - 96
Statutory credit risk reserve - - - - - - - - - - -
Transfer to statutory reserves - - - - - - - - - - -
Transactions with shareholders, recorded directly in equity - - - - 40 - - 40 - 40
Equity-settled share-based payment transactions - - - - 40 - - 40 - 40
Transfer of vested portion of equity settled share based payment to
retained earnings
- - - - - - - - - -
Dividends paid to equity holders - - - - - - - - - -
Balance at 30 June 2016 5,000 65,450 (19,123) 6,684 (279) 96 26,218 46,622 130,668 7,077 137,745
20 21Group results
in brief
Business
unit review
Balance sheet
analysis
Market & shareholder
information
Income statement
analysis
Capital
management
Other
information
Stanbic IBTC Analysis of financial results for the 6 months ended 30 June 2017
Gro
up
res
ult
s
in b
rief

Statement of changes in equity – Bank
Group
Ordinary
share capital
Nmillion
Share
premium
Nmillion
Statutory credit
risk reserve
Nmillion
Available-for-
sale revaluation
reserve
Nmillion
Share-based
payment reserve
Nmillion
SMIEIS
reserves
Nmillion
AGSMIEIS
reserves
Nmillion
Statutory
reserves
Nmillion
Retained
earnings
Nmillion
Ordinary
shareholders’
equity
Nmillion
Balance at 1 January 2017 1,875 42,469 789 184 28 1,039 - 22,153 40,780 109,317
Total comprehensive income for the period - - (80) - - - - 13,653 13,573
Profit for the period - - - - - - - - 13,653 13,653
Other comprehensive income after tax for the year - - - (80) - - - - - (80)
Net change in fair value on available-for-sale financial assets - - - (167) - - - - - (167)
Realised fair value adjustments on available-for-sale financial assets - - - 87 - - - - - 87
Income tax on other comprehensive income - - - - - - - - - -
Statutory credit risk reserve - - - - - - - - - -
Transfer to statutory reserves - - - - - - 749 - (749) -
Transactions with shareholders, recorded directly in equity - - - - (16) - - - - (16)
Equity-settled share-based payment transactions - - - - (16) - - - - (16)
Transfer of vested share options to retained earnings - - - - - - - - - -
Dividends paid to equity holders - - - - - - - - - -
Balance at 30 June 2017 1,875 42,469 789 104 12 1,039 749 22,153 53,684 122,874
Balance at 1 January 2016 1,875 42,469 6,684 820 32 1,039 - 19,907 22,091 94,917
Total comprehensive income for the period - - (1,546) - - 5,153 3,607
Profit for the period - - - - - - - - 5,153 5,153
Other comprehensive income after tax for the period - - (1,546) - - - - (1,546)
Net change in fair value on available-for-sale financial assets - - - (1,642) - - - - - (1,642)
Realised fair value adjustments on available-for-sale financial assets - - - 96 - - - - - 96
Income tax on other comprehensive income - - - - - - - - - -
Statutory credit risk reserve - - - - - - - - - -
Transfer to statutory reserves
Transactions with shareholders, recorded directly in equity - - - - - - - - - -
Equity-settled share-based payment transactions - - - - - - - - - -
Transfer of vested share options to retained earnings - - - - - - - - - -
Dividends paid to equity holders - - - - - - - - - -
Balance at 30 June 2016 1,875 42,469 6,684 (726) 32 1,039 - 19,907 27,244 98,524
22 23Group results
in brief
Business
unit review
Balance sheet
analysis
Market & shareholder
information
Income statement
analysis
Capital
management
Other
information
Stanbic IBTC Analysis of financial results for the 6 months ended 30 June 2017
Gro
up
res
ult
s
in b
rief

Statement of cashflows – Group Statement of cashflows – Bank
H1 2017
Nmillion
H1 2016
Nmillion
Unaudited
Net cash flows from operating activities 56,227 77,659
Cash flows used in operations 20,581 62,165
Profit before tax 29,169 15,682
Adjusted for: (26,597) (9,295)
Credit impairment charges on loans and advances 13,953 8,450
Depreciation of property and equipment 2,010 1,830
Amortisation of intangible asset 23 -
Dividend income (50) (121)
Equity-settled share-based payments (21) 40
Non-cash flow movements in other borrowings (1,546) -
Non-cash flow movements in subordinated debt 51 3,352
Impairment of intangible asset 62
Interest expense 15,693 13,864
Interest income (56,728) (36,713)
Loss/(gain) on sale of property and equipment (44) 3
Increase/(decrease) in income-earning assets (175,449) (126,535)
Increase/(decrease) in deposits and other liabilities 193,458 182,313
Dividends received 45 109
Interest paid (15,541) (13,864)
Interest received 55,145 36,713
Direct taxation paid (4,003) (7,464)
Net cash flows from/(used in) investing activities (50,841) (103,435)
Capital expenditure on:
- property (36) (131)
- equipment, furniture and vehicles (1,499) (1,731)
Proceeds from sale of property, equipment, furniture and vehicles 63 35
(Purchase)/sale of financial investments (49,369) (101,608)
Net cash flows (used in)/from financing activities (6,285) 24,882
Proceeds from addition to other borrowings 24,803 24,882
Repayment of other borrowings (27,800) -
Dividends paid (3,288) -
Net increase/(decrease) in cash and cash equivalents (899) (894)
Effect of exchange rate changes on cash and cash equivalents 451 19,338
Cash and cash equivalents at beginning of the period 191,761 107,398
Cash and cash equivalents at end of the period 191,313 125,842
H1 2017
Nmillion
H1 2016
Nmillion
Unaudited
Net cash flows from operating activities 52,619 79,613
Cash flows used in operations 15,775 60,391
Profit before tax 14,324 5,500
Adjusted for: (24,486) (7,930)
Credit impairment charges on loans and advances 13,953 8,450
Depreciation of property and equipment 1,645 1,566
Amortisation of intangible assets 23 -
Dividend income (50) (121)
Items of intangible assets written off/expensed 62 0
Equity-settled share-based payments (16) 4
Non-cash flow movements in other borrowings (1,492) 0
Non-cash flow movements in subordinated debt 37 3,352
Interest expense 14,606 13,972
Interest income (53,212) (35,150)
Gains on disposal of property and equipment (42) (3)
Increase in loans and other assets (174,710) (123,401)
Increase in deposits and other liabilities 200,647 186,222
Dividends received 45 109
Interest paid (14,343) (13,957)
Interest received 51,748 33,891
Direct taxation paid (606) (821)
Net cash flows from/(used in) investing activities (58,643) (101,133)
Capital expenditure on:
- property (35) (131)
- equipment, furniture and vehicles (1,058) (1,646)
Proceeds from sale of property, equipment, furniture and vehicles 57 36
(Purchase)/sale of financial investments (57,607) (99,392)
Net cash flows (used in)/from financing activities 13,353 24,882
Proceeds from addition to other borrowings 24,803 24,882
Repayment of other borrowings (11,450) -
Proceed from issue of subordinated debt - -
Dividends paid - -
Net increase/(decrease) in cash and cash equivalents 7,329 3,362
Effect of exchange rate changes on cash and cash equivalents 410 19,338
Cash and cash equivalents at beginning of the period 179,722 89,862
Cash and cash equivalents at end of the period 187,461 112,562
24 25Group results
in brief
Business
unit review
Balance sheet
analysis
Market & shareholder
information
Income statement
analysis
Capital
management
Other
information
Stanbic IBTC Analysis of financial results for the 6 months ended 30 June 2017
Gro
up
res
ult
s
in b
rief

Segmental structure for key business units
Stanbic IBTC Group
Personal and Business Banking Banking and other financial services
to individual customers and small-to-
medium-sized enterprises.
What we offer:
Mortgage lending
• Residential accomodation loans to
mainly personal market customers.
Instalmental sale and finance leases
• Finance of vehicles for personal
market customers.
• Finance of vehicles and equipment
in the business market.
Card Products
• Credit card facilities to individuals
and businesses (credit card issuing).
• Merchant transaction acquiring
services (card acquiring).
Transactional products
• Comprehensive suite of transactional,
savings and investment products.
This includes deposit taking activities
and electronic banking facilities.
Lending products
• Lending products offered to both
personal and business markets.
• Business lending offerings constitute
a comprehensive suite of lending
product offerings, structured
working capital finance solutions
and commercial property finance
solutions.
Corporate and Investment Banking Corporate and investment banking
services to government parastatals,
larger corporates, financial institutions
and international counterparties.
What we offer:
Global markets
• Fixed income instruments.
• Money market.
• Equities.
• Foreign exchange.
• Research.
Investment banking
• Equity capital market.
• Debt capital market.
• Financial advisory.
• Real Estate Finance.
• Mining, Energy and Infrastructure.
• Diversified Lending and Leverage.
Transactional products and services
• Investor services (asset custody).
• Transactional banking.
• Trade finance.
Coverage and distribution
• Client facing sales activities within
CIB division covering conglomerate
& diversified industries; consumer,
financial institutions; oil & gas, power &
infrastructure and telecommunications,
media & technology sector.
WealthInvestment management in form
of non-pension asset management,
pension asset management, trusteeship
and estate management.
What we offer:
Pension fund administration
• Retirement savings accounts.
• Gratuity schemes for companies.
Asset management
• Mutual funds.
• Portfolio management for High Net
worth individuals.
Trustee services
• Private trust.
• Corporate trust.
Insurance brokerage
• Life assurance.
• Group life assurance.
• Travel health insurance.
• General insurance.
27Group results
in brief
Business
unit review
Balance sheet
analysis
Market & shareholder
information
Income statement
analysis
Capital
management
Other
information
2729303539
Segmental structure for key business unitsSegmental income statementPersonal & Business BankingCorporate & Investment BankingWealth
Business unit review
Business unit
review

H1 2017 H1 2016
Total income (Nmillion) 22,743 21,487
Total income (% change) 6 47.2
Total income contribution (%) 28.0 37.7
Cost-to-income ratio (%) 85.7 78.0
Credit loss ratio (%) 12.2 4.2
Gross loan growth (%) (8.7) (1.2)
Deposit growth (%) 9.1 14.2
H1 2017 H1 2016
Total income (Nmillion) 40,326 20,719
Total income (% change) 94.6 (1.7)
Total income contribution (%) 49.6 36.3
Cost-to-income ratio (%) 33.8 56.6
Credit loss ratio (%) 4.4 4.2
Gross loan growth (%) 14.2 13.7
Deposit growth (%) 19.1 26.7
H1 2017 H1 2016
Total income (Nmillion) 18,255 14,861
Total income (% change) 23 16.1
Total income contribution (%) 22.4 26
Cost-to-income ratio (%) 27.8 29.9
Assets under management growth (%) 16.4 8.2
Retirement savings accounts growth (%) 3.3 2.7
Personal & Business Banking% of group gross income
Corporate & Investment Banking% of group gross income
Wealth% of group gross income
Segmental income statement
Personal & Business Banking Corporate & Investment Banking Wealth
Change
%
H1 2017
Nmillion
H1 2016
Nmillion
Change
%
H1 2017
Nmillion
H1 2016
Nmillion
Change
%
H1 2017
Nmillion
H1 2016
Nmillion
Gross income 21 29,495 24,432 52 48,172 31,638 30 19,350 14,861
Interest income 40 22,886 16,314 63 30,975 18,989 >100 2,867 1,410
Interest expense >100 (6,752) (2,945) (28) (7,846) (10,919) 0 (1,095) -
Net interest income 21 16,134 13,369 >100 23,129 8,070 26 1,772 1,410
Non-interest revenue (19) 6,609 8,118 36 17,197 12,649 23 16,483 13,451
Net fee and commission revenue (22) 6,285 8,074 (13) 5,145 5,891 22 16,463 13,441
Trading revenue 0 - - 81 11,950 6,607 16 -
Other revenue >100 324 44 (32) 102 151 (60) 4 10
Total income 6 22,743 21,487 95 40,326 20,719 23 18,255 14,861
Credit impairment charges >100 (8,421) (3,362) 9 (5,532) (5,088) 0 - -
Income after credit impairment charges (21) 14,322 18,125 >100 34,794 15,631 23 18,255 14,861
Operating expenses 16 (19,501) (16,754) 16 (13,627) (11,735) 14 (5,074) (4,446)
Staff costs 9 (9,284) (8,481) 28 (4,729) (3,703) 13 (2,479) (2,194)
Other operating expenses 23 (10,217) (8,273) 11 (8,898) (8,032) 15 (2,595) (2,252)
Profit before tax >(100) (5,179) 1,371 >100 21,167 3,896 27 13,181 10,415
Tax (83) (61) (357) 21 (737) (607) 25 (4,259) (3,401)
Profit after tax >(100) (5,240) 1,014 >100 20,430 3,289 27 8,922 7,014
28 29Group results
in brief
Business
unit review
Balance sheet
analysis
Market & shareholder
information
Income statement
analysis
Capital
management
Other
information
Stanbic IBTC Analysis of financial results for the 6 months ended 30 June 2017
Bu
sin
ess
u
nit
rev
iew
Segmental structure for key business units (continued)

Personal & Business Banking (PBB)
Personal and Business Banking (PBB) deals with
the retail arm of group’s business. PBB provides
services to individual customers, high networth
individuals (HNIs) and the commercial and small
and medium scale enterprises (SME) business
segments. Personal and Business Banking
supports everyday banking needs of individuals
and businesses – receiving, saving and making
payments through our network of branches and
self-service digital channels. Overlaying these
horizontals is a strong relationship management
focus to ensure differentiated customer
experience for our customer segments.
The focus of PBB is to provide appropriate,
affordable, convenient and accessible financial
solutions to customers, through passionate and
customer focused employees nationwide. It
offers the following products; vehicle and asset
finance, unsecured and secured personal and
business loans, mortgage loans, a range of trade
finance products and various current, savings
and investment offerings.
PBB is divided into two business lines for
efficient service delivery - Personal Banking
and Business Banking. Personal Banking
focuses on banking services to individuals
through lifecycle management and offering
bespoke services to high networth individuals
by handling their wealth portfolio needs both
locally and abroad. It provides solutions that
meet individual need as these needs change.
Business Banking focuses on two segments
- small and medium scale enterprises and
commercial, providing them business solutions
to support their growing business needs.
Financial performance
PBB’s gross income grew by 21% to N29.5
billion (H1 2016: N24.4 billion), on the back
of 40% growth in interest income.
Interest income grew by 40% to N22.9
billion (H1 2016: N16.3 billion) on the back of
increase in investments and returns. Interest
expense increased by 129% to N6.8 billion
from N2.9 billion in H1 2016. The increase is
as a result of the increased deposits acquired
during the period. Consequently, Net interest
income increased by 21% to N16.1 billion from
N13.4billion.
Non-interest revenue, earned majorly
from fees and commission, declined by 19%
to N6.6 billion (H1 2016: N8.1 billion) on the
back of regulatory induced reduction in fees
and commission and the decline in economic
transactions. Total income however increased
by 6% to N22.7 billion from N21.5 billion in
H1 2016.
Credit impairment charges grew by over
100% to N8.4 billion in H1 2017 (H1 2016:
N3.4 billion) as a result of the challenging macro
environment and attendant second order risks
including the knock on effects of the prolonged
FX scarcity, high inflation levels, salary
arrears, job losses and low purchasing power,
which have reduced clients’ capacity to meet
existing obligations. The declining oil prices
and vandalization of oil pipelines also impacted
businesses negatively. The increase in credit
impairment also resulted in higher credit loss
ratio of 12.2% from 4.2% in H1 2016.
Operating expenses increased by 16% to
N19.5 billion (H1 2016: N16.8 billion). Staff
cost grew by 9% lower than inflation, while
other operating expenses increased by 23%
as a result of branch maintenance expenses,
marketing expenses to increase brand
awareness and insurance cost on securing
customer deposits. PBB’s cost-to-income ratio
deteriorated to 85.7% from 78.0% in H1 2016
due to increased operating expenses.
PBB recorded loss after tax of N5.2 billion
declining by over 100% from profit of N1.0
billion in H1 2016.
PBB’s gross loans declined by 9% to close
at N139 billion (FY 2016: N152 billion).
The slow growth is on the back of tightened
lending conditions and low customer appetite
for loans due to current economic situation.
Non-performing loans in PBB declined by 16%
to N15.7 billion following the write-off of fully
provisioned NPLs.
Customer deposits grew by 9% to N385
billion from N353 billion in FY 2016 on the
back of continued growth in customer numbers
and need to increase our cheap deposit base.
Deposit mix improved to 69% from 63% in FY
2016, as the ratio lower priced deposit to total
deposits.
Performance highlightsChange % H1 2017 H1 2016 FY 2016
Net interest income Nmillion 21 16,134 13,369 29,964
Non-interest revenue Nmillion (19) 6,609 8,118 14,512
Credit impairment charges Nmillion >100 (8,421) (3,362) (9,504)
Operating expenses Nmillion (16) (19,501) (16,754) (36,656)
(Loss)/profit before tax Nmillion >(100) (5,179) 1,371 (1,684)
(Loss)/profit after tax Nmillion >(100) (5,240) 1,014 (1,613)
Gross loans & advances Nmillion (9) 139,092 162,027 152,360
Deposit liabilities Nmillion 9 385,349 289,020 353,189
Cost-to-income % 85.7 78.0 82.4
Non-interest revenue to total income % 29.1 37.8 32.6
Credit loss ratio % 12.2 4.2 6.0
Loan to deposit % 36.1 56.1 43.1
Non-performing loans to total loans & advances % 11.3 11.5 12.3
Other key business statistics
Business infrastructure
Branch network Number 0 178 178 178
ATMs Number (1) 553 543 561
Net interest income
Non-interest revenue
Net interest income and net interest revenue
H1 2013 H1 2014 H1 2015 H1 2016 H1 2017
2,000
0
4,000
6,000
8,000
10,000
18,000
16,000
12,000
14,000
Nmillion
13,369
8,118
16,134
6,609
11,052
3,547
11,045
4,230
8,229
3,338
30 31Group results
in brief
Business
unit review
Balance sheet
analysis
Market & shareholder
information
Income statement
analysis
Capital
management
Other
information
Stanbic IBTC Analysis of financial results for the 6 months ended 30 June 2017
Bu
sin
ess
u
nit
rev
iew

Quarterly analysis of performance
Q2 2017 Q1 2017 H1 2017
Net interest income Nmillion 7,757 8,377 16,134
Non-interest revenue Nmillion 3,240 3,369 6,609
Credit impairment charges Nmillion (6,912) (1,509) (8,421)
Operating expenses Nmillion (10,063) (9,438) (19,501)
Profit/(loss) before tax Nmillion (5,978) 799 (5,179)
Gross loans & advances Nmillion 139,092 147,321 139,092
Deposit liabilities Nmillion 385,349 378,477 385,349
Cost-to-income % 91.5 80.4 85.7
Non-interest revenue to total income % 29.5 28.7 29.1
Credit loss ratio % 19.9 4.1 12.1
Loan to deposit % 36.1 38.9 36.1
Non-performing loans to total loans & advances % 11.3 15.6 11.3
Factors impacting the results
Favourable
• Growth in net interest income is on the back of favourable yield on
assets and impact of current and savings deposits growth.
• Continued growth in customer deposits, supported by growth
in number of customers.
Transactional and lending products
• Decline in overdrafts to small and medium
scale businesses to support their working
capital requirements
• Term loans declined as some customers
paid down on their facilities.
• Impairment charges increased on both
performing and non-performing loans
due to economic realities
Adverse
• Increase in operating expenses as a result of growth in marketing
and advertising expenses, deposit and other insurance expenses and
AMCON sinking fund contribution.
• Reduction in transaction fees as directed by Central Bank of Nigeria.
• Increase in credit impairment charges.
Instalment sale and finance leases
• Asset quality deteriorated as non-
performing loans increased to N2.97
billion and non-performing loans ratio
increased to 17% (FY 2016: 11%). This
is due to classification of loans in haulage
and logistics business. This is linked to the
general economic slowdown evidenced in
the consumer sector.
Mortgage lending
• We witnessed decline in loan book which
can be attributed to the macro-economic
challenges the country is facing.
• Non-performing loans increased by over
12% to close at N325 million due to
increase in interest rate. Consequently, the
mortgage loan book’s non-performing loans
to total loans ratio worsened to 4% from
3% in FY 2016.
Breakdown of loans and advances to customers
Change
%
H1 2017
Nmillion
H1 2016
Nmillion
FY 2016
Nmillion
Gross loans and advances (9) 139,092 162,027 152,360
Mortgage (6) 8,370 8,918 8,924
Instalment sale & finance leases 8 17,418 20,775 16,123
Overdrafts (25) 21,128 21,542 28,086
Term loans (7) 92,176 110,793 99,226
Provisions (15) (12,637) (16,258) (14,839)
Specific credit impairment (19) (9,146) (12,808) (11,329)
Portfolio credit impairment (1) (3,491) (3,449) (3,510)
Net loans and advances (8) 126,455 145,770 137,521
Breakdown of non-performing loans
Overdrafts (24) 3,191 2,462 4,183
Term loans (27) 9,195 11,069 12,537
Instalment sale and finance leases 75 2,970 4,674 1,697
Mortgage loans 26 325 487 258
Total (16) 15,681 18,691 18,675
Loans and advances
32 33Group results
in brief
Business
unit review
Balance sheet
analysis
Market & shareholder
information
Income statement
analysis
Capital
management
Other
information
Stanbic IBTC Analysis of financial results for the 6 months ended 30 June 2017
Bu
sin
ess
u
nit
rev
iew
Personal & Business Banking (continued)

Deposit breakdown
Change
%
H1 2017
Nmillion
H1 2016
Nmillion
FY 2016
Nmillion
Current deposits 17 221,411 143,849 188,877
Savings deposits 12 43,167 34,532 38,630
Call deposits (56) 4,250 2,935 9,687
Term deposits 0 116,521 107,703 115,996
Total deposits and current accounts 9 385,349 289,020 353,189
Deposit liabilities
• Growth in deposit book driven by growth customer numbers and need
to get cheaper funding
• Increase in current and savings accounts on the back of continued
execution of customer acquisition initiatives focused at individuals
and businesses with stable income.
• Lower priced deposits accounted for 69% of total deposits and
cushioned the impact of increased cost of funds due to expensive
term deposits acquired.
Corporate & Investment Banking (CIB)
Corporate and Investment Banking (CIB)
comprises four segment/units: Investment
Banking (IB), Global Markets (GM),
Transactional Products and Services (TPS) and
Client Coverage (CC).
Our Investment Banking team provides,
through Stanbic IBTC Capital Limited,
corporate finance and debt advisory services to
corporate and government entities.
The Global Markets team comprises
traders, sales managers and analysts of varying
specialisation in equities, fixed income, foreign
exchange, and money markets. Within GM,
Stanbic IBTC Stockbrokers Limited provides
world-class stockbroking services to local as
well as foreign investors in the Nigerian capital
markets and is the largest stockbroking house
in Nigeria. Also within GM, our highly respected
team of macroeconomic and equity research
analysts provide insights on the domestic
and international markets of our portfolio
investment clients.
Transactional Product and Services offers
standardised and tailored transactional
products and services including trade
finance solutions, working capital and cash
management solutions.
Our Client Coverage team manages
corporate relationships and is the main point
of contact with our clients. The team members
are skilled at identifying client needs and
requirements, and at aligning these with the
appropriate product houses for execution.
Financial performance
CIB’s total income was up 95% to N40.3billion
in H1 2017 (H1 2016: N20.7 billion), on the
back of a 63% growth in interest income.
Interest income increased by 63% to N31.0
billion (H1 2016:N19.0 billion). Interest income
growth is supported by increase in income from
investment securities due to favourable yields,
increase in income from loans and advances
on the back of loan growth and income from
interbank placement. Interest expense declined
by 28% to N7.8 billion from N10.9 billion
recorded in H1 2016. This is as a result of
high volume of cheap deposits recorded in the
deposit book. This led to an increase of over
100% in net interest income to N23.1 billion
(H1 2016: N8.07 billion).
Non-interest revenue increased by 36% to
N17.2 billion from N12.6 billion recorded in H1
2016. The increase was largely on the back of
trading revenue increase which came on the
back of the introduction of IEFX window. Net
fee and commission closed at N5.1 billion (H1
2016: N5.9 billion) as a result of regulatory
induced reduction in transaction fees and
conversion of deal pipeline in the investment
banking business.
Trading revenue was up 81% to N11.95
billion in H1 2017 (H1 2016: N6.6 billion).
The introduction of the IEFX window has
improved foreign exchange liquidity which in
turn impacted other product markets and the
macro-economy positively.
Credit impairment charge increased by 9%
to N5.5 billion from N5.1 billion in H1 2016.
The increase in credit impairments applied to
both performing and non-performing loans.
The decline in economic activities has resulted
in strain on some sectors of the economy
especially the oil and gas and telecoms. In line
with these economic realities, the group had to
increase its provisioning on loans and advances.
CIB maintained cost discipline in H1 2017
though operating expenses increased by 16%
to N13.6 billion from N11.7 billion in H1 2016.
Staff cost increased by 28% to N4.7 billion
from N3.7 billion in first half of 2017 due to
inflation related salary adjustment, while other
operating expenses increased by 11% to N8.9
billion (H1 2016: N8.0 billion) as a result of
growth in information technology expense to
drive efficient service delivery and increase
deposit insurance expenses. Profit before tax
was up by over a 100% to N21.2 billion, while
profit after tax also increased by over a 100%
to N20.4 billion.
Gross loans and advances grew by 14%
y-o-y to N255 billion in H1 2017 (FY 2016:
N223 billion). The growth was driven by 48%
and 11% growth in overdraft and term loans
to support customer’s working capital. CIB’s
asset quality deteriorated as non-performing
loans increased significantly to N15.2 billion
(FY 2016: Nil). Consequently, non-performing
loans to total loans ratio worsened to 6.0%
from nil position in FY 2016. The decline in
asset quality is primarily due to classification
of a client in the Oil & Gas sector whose
operations had been disrupted by militancy
action resulting in closure of the Trans
Forcados Pipeline.
Deposit liabilities grew to N247 billion,
representing a 19% increase over N207.8
billion achieved in FY 2016. The increase in
deposits is as a result of growing customer
relations.
34 35Group results
in brief
Business
unit review
Balance sheet
analysis
Market & shareholder
information
Income statement
analysis
Capital
management
Other
information
Stanbic IBTC Analysis of financial results for the 6 months ended 30 June 2017
Bu
sin
ess
u
nit
rev
iew
Personal & Business Banking (continued)

10
0
50,000
H1 2015 FY 2015 H1 2016 FY 2016 H1 2017
150,000
100,000
200,000
250,000
400,000
350,000
300,000
Nmillion
0
20
40
60
80
120
100
%
262,640
215,451240,390
207,780222,956
254,597247,402245,060
304,623
80
107 103354,106
90
74
Gross loans & advances Net interest income
Deposit liabilities Non-interest revenue
Loan to deposit ratio
Performance highlightsChange % H1 2017 H1 2016 FY 2016
Net interest income Nmillion >100 23,129 8,070 24,202
Non-interest revenue Nmillion 36 17,197 12,649 25,308
Credit impairment charges Nmillion 9 (5,532) (5,088) (10,299)
Operating expenses Nmillion 16 (13,627) (11,735) (22,492)
Profit before tax Nmillion >100 21,167 3,896 16,719
Gross loans and advances Nmillion 14 254,597 245,060 222,956
Deposit liabilities Nmillion 19 247,402 304,623 207,780
Cost-to-income % 33.8 56.6 45.4
Non-interest revenue to total income % 42.6 61.1 51.1
Credit loss ratio % 4.4 4.2 3.4
Loan to deposit % 102.9 80.4 4.7
Other key business statistics
Investor services
Assets under custody Nbillion 26 3,648 1,916 2,900
Quarterly analysis of performance
Q2 2017 Q1 2017 H1 2017
Net interest income Nmillion 13,505 9,624 23,129
Non-interest revenue Nmillion 8,347 8,850 17,197
Credit impairment charges Nmillion (3,714) (1,818) (5,532)
Operating expenses Nmillion (8,216) (5,411) (13,627)
Profit before tax Nmillion 9,922 11,245 21,167
Gross loans & advances Nmillion 254,597 218,148 254,597
Deposit liabilities Nmillion 247,402 214,810 247,402
Cost-to-income % 37.6 29.3 33.8
Non-interest revenue to total income % 38.2 47.9 42.6
Credit loss ratio % 2.9 1.7 4.4
Loan to deposit % 102.9 101.6 102.9
Other key business statistics
Investor services
Assets under custody Nmillion 3,648 3,049 3,648
Factors impacting the results
Favourable
• Growth in loan book resulting in increase in interest income.
• Favourable yields on investment securities impacting positively on
interest income.
• Increase in rates impacting favourably on interbank placements.
• Decline in interest expense as a result of improved CASA mix.
• Improved FX liquidity has aided capital market activities which has
impacted our custody and capital market business.
Adverse
• Increase in credit impairment charges impacted negatively on profits.
• Strong competition for good quality credits.
• Reduction in transaction fees by Central Bank.
11
0H1 2013 H1 2014 H1 2015 H1 2016 H1 2017
5,000
10,000
15,000
25,000
20,000
Nmillion
17,197
13,497
23,129
12,649
8,070
11,517
9,562
13,551
8,749
10,921
Gross loans and customer deposits
CAGR (H1 2015-H1 2017): Gross loans: (1%)
Customer deposits: (9%)
Net interest income and non-interest revenue
CAGR (H1 2013-H1 2017): Net interest income: 28%
Non-interest revenue: 6%
36 37Group results
in brief
Business
unit review
Balance sheet
analysis
Market & shareholder
information
Income statement
analysis
Capital
management
Other
information
Stanbic IBTC Analysis of financial results for the 6 months ended 30 June 2017
Bu
sin
ess
u
nit
rev
iew
Corporate & Investment Banking (continued)

• Growth in deposits is as a result of growing customer relations.
Breakdown of deposits to customers
Change
%
H1 2017
Nmillion
H1 2016
Nmillion
FY 2016
Nmillion
Current deposits 25 115,653 79,639 92,646
Call deposits 42 46,197 27,990 32,616
Term deposits 4 85,552 196,995 82,517
Total deposits and current accounts 19 247,402 304,623 207,780
Deposit liabilities
• Deposit mix improved significantly as ratio of demand deposit to total
deposits increased to 47% from 45% in FY 2016.
Global markets
• Favourable yields on investment securities
increased interest income.
• Increase in income from foreign exchange
trading as a result of the introduction of the
IEFX window
• Improved capital market performance
resulting from improved foreign exchange
activities.
Investment banking
• Decline in fees and commissions revenue
resulting from slow conversion of deal
pipeline due to slow economic activities.
• Leverage on resources across the Standard
Bank group to execute complex transactions
in most sectors of the Nigerian economy and
this provides an edge over other investment
banking companies.
Transactional products and services
• Regulatory induced reduction in transaction
charges resulted in decline in fees and
commissions revenue
• Growth in overdraft loans to finance working
capital in manufacturing companies and
trading facilities to large trading companies
with resultant fees generated from their
usage of the facilities.
• The Custody business asset under
management increased by 26% to N3.64
trillion (FY 2016: N2.9 trillion) as a result
of improved capital market activities and
foreign exchange liquidity.
• Increase in non-performing loans due to loans in the oil and gas sector.
Breakdown of loans and advances
to customers
Change
%
H1 2017
Nmillion
H1 2016
Nmillion
FY 2016
Nmillion
Gross loans and advances 14 254,597 245,060 222,956
Instalment sale & finance leases 24 1,420 1,531 1,150
Overdrafts 48 28,653 19,748 19,385
Term loans 11 224,523 223,781 202,422
Provisions (72) (13,095) (15,194) (7,592)
Specific credit impairment - (5,080) (7,904) -
Portfolio credit impairment 6 (8,015) (7,290) (7,592)
Net loans and advances 12 241,502 229,866 215,364
Breakdown of non-performing loans
Overdrafts - - 268 -
Term loans >100 15,204 9,133 -
Instalmental sale and finance leases - - - -
Total non-performing loans - 15,204 9,401 -
Loans and advances
Wealth
Wealth group focuses primarily on pension
administration, private non-pension asset
management, trusteeship and estate planning
business and insurance brokerage business
which we recently added. The pension
administration is managed through Stanbic IBTC
Pension Managers Limited, the non-pension
asset management is managed by Stanbic IBTC
Asset Management Limited, trusteeship and
estate management is managed by Stanbic IBTC
Trustees Limited and insurance brokerage by
Stanbic IBTC Insurance Brokerage Limited.
The wealth business model is primarily
focused on assisting clients in investing in a
variety of asset classes, including fixed income
and equities markets to accumulate and
preserve wealth.
Financial performance
Wealth business recorded a gross income of
N19.4 billion, representing a 30% increase from
N14.9 billion in H1 2016. The growth is on
the back of increased income from investment
in money market securities and non-interest
revenue.
Non-interest revenue, resulting from fund
management fees and other income, increased
by 23% to N16.5 billion (H1 2016: N13.5
billion). Continued growth in assets under
management and increase in pension clients
remains the major drivers of the increase in non-
interest revenue. Pension assets grew by 12% to
close at N2.1 trillion from N1.9 trillion recorded
in FY 2016, while the number of Retirement
Savings Accounts (RSAs) grew by 3%.
The non-pension assets under management
increased by 64% to N316.3 billion (FY
2016: N192.8 billion). The increase is driven
by increased subscription from investors and
growth in investment income.
Total income grew by 23% to N18.3 billion
from N14.9 billion recorded in H1 2016.
Operating expenses was up 14% to N5.1
billion from N4.4 billion in H1 2016, driven by
13% growth in staff cost and 15% increase in
other operating expenses. Staff cost grew as a
result of inflation adjustment on staff salaries,
while other operating expenses increased as a
result of growth in marketing and advertising
expenses and increases in premises maintenance
expenses. Despite the growth in operating
expenses, cost-to-income ratio improved to
27.8% from 29.9% recorded in H1 2016. Profit
before tax increased by 27% to N13.2 billion
YoY, while profit after tax also increased by 27%
to N8.9 billion.
Profit before taxCAGR (H1 2013 – H1 2017): 26%
Total operating incomeCAGR (H1 2013 – H1 2017): 22%10
0H1 2013 H1 2014 H1 2015 H1 2016 H1 2017
20,000
18,000
Nmillion
8,000
6,000
4,000
2,000
12,000
10,000
14,000
16,000
8,192 10,747 12,803 14,861 18,255
10
0H1 2013 H1 2014 H1 2015 H1 2016 H1 2017
14,000
Nmillion
4,000
2,000
8,000
6,000
10,000
12,000
5,259 7,290 8,704 10,415 13,181
38 39Group results
in brief
Business
unit review
Balance sheet
analysis
Market & shareholder
information
Income statement
analysis
Capital
management
Other
information
Stanbic IBTC Analysis of financial results for the 6 months ended 30 June 2017
Bu
sin
ess
u
nit
rev
iew
Corporate & Investment Banking (continued)

Performance highlightsChange % H1 2017 H1 2016 FY 2016
Net interest income Nmillion 26 1,772 1,410 3,693
Non-interest revenue Nmillion 23 16,483 13,451 28,374
Operating expenses Nmillion 14 (5,074) (4,446) (9,893)
Profit before tax Nmillion 27 13,181 10,415 22,174
Assets under management Nmillion 16 2,417,210 1,902,582 2,076,423
Retirement savings accounts Number 3 1,557,888 1,467,166 1,508,040
Cost to income ratio % 27.8 29.9 30.9
Quarterly analysis of performanceQ2 2017 Q1 2017 H1 2017
Net interest income Nmillion 893 879 1,772
Non-interest revenue Nmillion 8,596 7,887 16,483
Operating expenses Nmillion (2,890) (2,184) (5,074)
Profit before tax Nmillion 6,599 6,582 13,181
Assets under management Nmillion 2,417,210 2,176,376 2,417,210
Retirement savings accounts Number 1,557,888 1,543,175 1,557,888
Cost to income ratio % 30.5 24.9 27.8
Assets under management (AuM) and Retirement savings accountCAGR (H1 2015-H1 2017): Pension management (AuM): 9%
Asset management (AuM): 22%
Retirement savings accounts: 3%
Factors impacting the results
Favourable
• Increased contribution from existing contributors and continued
growth in pension funds under management as pension clients
continue to increase impacted positively on revenues.
• Favourable yields on investment securities contributed to interest
income growth
• Continued improvement in operational efficiency resulting lower
operating expenses and cost-to-income ratio
Adverse
• Unpaid salaries of government workers impacted negatively on growth
in assets under management
• Increase in staff costs due to regulators directive on non-full time staff
41Group results
in brief
Business
unit review
Balance sheet
analysis
Market & shareholder
information
Income statement
analysis
Capital
management
Other
information40 Stanbic IBTC Analysis of financial results for the 6 months ended 30 June 2017
Bu
sin
ess
u
nit
rev
iew
Wealth (continued)
Income statement
analysis
424446484951
Overview of group incomeNet interest income and margin analysisNon-interest revenueCredit impairment chargesOperating expensesTaxation
Income statement analysis

Overview of group income
Drivers of group income
0
30,000
20,000
10,000
40,000
50,000
60,000
70,000
90,000
80,000
Nmillion
56,728
Interest income
(15,693)
Interestexpense
40,289
Non-interestrevenue
Credit impairment charges
Operatingexpenses
Profit beforetaxation
Taxes Profit aftertaxation
(38,202) 29,169
(5,057)
24,112
(13,953)
Interest based revenue
Non-interest based revenue
10
0H1 2013 H1 2014 H1 2015 H1 2016 H1 2017
120,000
Nmillion
60,000
100,000
80,000
20,000
40,000
54,509 61,715 68,295 71,320 97,198
10
0H1 2013 H1 2014 H1 2015 H1 2016 H1 2017
60,000
Nmillion
20,000
40,000
30,000
10,000
50,000
30,382
24,127 27,718
33,997
26,577
41,718
34,607
36,713 40,470
56,728
Interest based revenue and non-interest based revenueCAGR (H1 2013 – H1 2017): Interest based revenue: 17%
Non-interest based revenue: 14%
Gross revenueCAGR (H1 2013 – H1 2017): 16%
10
0 0H1 2013 H1 2014 H1 2015 H1 2016 H1 2017
90,000
80,000
Nmillion %
20,000
40,000
30,000
10,000
60,000
70,000
50,000
35.0
10.0
20.0
15.0
5.0
25.0
30.0
42,005
10,185 16,184
50,494
9,695
48,481
11,317
24,112
57,067 24.2%
32.1%
20.0%
19.8%
81,324
29.6%
10
(10)H1 2013 H1 2014 H1 2015 H1 2016 H1 2017
50
%
10
0
30
40
20
35
12
(4)
7
18
6
20
10
43
16
Total income Total income growth
Profit after tax Total cost growth
Profit after tax/total income
Total income and profitability Income growth Vs. Cost growth
Total income contribution by business unit
Income statement summary
Change %
YOY
H1 2017 H1 2016 FY 2016
Net interest income Nmillion 80 41,035 22,849 57,859
Non-interest income Nmillion 18 40,289 34,218 68,194
Credit impairment charges Nmillion 65 (13,953) (8,450) (19,803)
Operating expenses Nmillion 16 (38,202) (32,935) (69,041)
Profit before tax Nmillion 86 29,169 15,682 37,209
Profit after tax Nmillion >100 24,112 11,317 28,520
H1 2016
Personal & Business Banking 38%
Corporate & Investment Banking 36%
Wealth 26%
Personal & Business Banking 28%
Corporate & Investment Banking 50%
Wealth 22%
H1 2017
42 43Group results
in brief
Business
unit review
Balance sheet
analysis
Market & shareholder
information
Income statement
analysis
Capital
management
Other
information
Stanbic IBTC Analysis of financial results for the 6 months ended 30 June 2017
Inco
me
stat
emen
t an
alys
is

Net interest income and margin analysis
Breakdown of net interest income Change
%
H1 2017
Nmillion
H1 2016
Nmillion
Interest income on investment securities >100 27,507 9,736
Interest income on advances to banks >100 1,180 494
Interest revenue on loans and advances to customers 6 28,041 26,483
Medium term advances/call loans (6) 21,619 23,117
Overdrafts >100 3,715 356
Home loans (3) 932 965
Instalment sales & finance leases (13) 1,776 2,044
Interest income 55 56,728 36,713
Interest expense 13 15,693 13,864
Term deposits (4) 8,618 8,987
Savings accounts 88 527 281
Current accounts >100 1,189 242
Call deposits 52 573 378
Inter-bank deposits 45 2,354 1,627
Borrowed funds 4 2,432 2,349
Net interest income 80 41,035 22,849
Net interest income by business unitChange
%
H1 2017
Nmillion
H1 2016
Nmillion
Personal & Business Banking 21 16,134 13,369
Corporate & Investment Banking >100 23,129 8,070
Wealth 26 1,772 1,410
Net interest income 80 41,035 22,849
Factors impacting net interest income
Favourable
• Increase in loan pricing in line with market realities especially in the
Personal and Business Banking segment contributed to growth in
interest income
• Interest income benefitted from continued loan growth.
Adverse
• Growth in term deposits acquired to make up for the sterilisation
of deposits increased interest expenses.
0
5,000
10,000
15,000
20,000
30,000
25,000
Nmillion
11,317
Profit after tax – H1 2016
(6,254)17,141
PBB profit after tax growth
CIB profit after tax growth
Wealth profit after tax growth
Profit after tax – H1 2017
24,112
1,908
Contribution to profit after tax
Net interest income Loans and advances
Net interest margin before impairment charges
Net interest margin after impairment charges
Investment securities
Placements
Net interest income and net interest marginCAGR (H1 2013 – H1 2017): 23%
Composition of interest revenue10
0H1 2013 H1 2014 H1 2015 H1 2016 H1 2017
100
%
10
30
20
40
50
70
60
80
90
83% 75% 72% 72%
16%
19% 25% 27%
1% 1%6% 3%
49%
48%
2%
10
0H1 2013 H1 2014 H1 2015 H1 2016 H1 2017
10,000
20,000
30,000
50,000
40,000
17,937 22,997 22,135 22,849 41,035
4.9%
4.2%
5.3%
2.9% 2.8%
4.8%
5.6%
4.5%
4.4%
7.2%
Nmillion
0
1
3
2
4
5
7
6
8
%
44 45Group results
in brief
Business
unit review
Balance sheet
analysis
Market & shareholder
information
Income statement
analysis
Capital
management
Other
information
Stanbic IBTC Analysis of financial results for the 6 months ended 30 June 2017
Inco
me
stat
emen
t an
alys
is

Breakdown of non-interest revenue Change
%
H1 2017
Nmillion
H1 2016
Nmillion
Net fee & commission revenue 2 27,893 27,406
Account transaction fees (62) 2,150 5,594
Card based commission 4 1,630 1,569
Brokerage and financial advisory fees 82 2,549 1,402
Asset management fees 22 15,774 12,977
Custody fees 46 1,019 698
Electronic banking (14) 511 597
Foreign currency service fees (28) 2,942 4,104
Documentation and administration fees >100 1,097 363
Other >100 221 102
Trading revenue 81 11,966 6,607
Foreign exchange >100 5,431 1,445
Fixed income >100 6,405 2,446
Interest rates (95) 129 2,719
Equity >100 1 (3)
Other revenue >100 430 205
Dividend income (59) 50 121
Gains on disposal of property and equipment >100 44 0
Other non-bank revenue 336 84
Total non-interest revenue 18 40,289 34,218
Non-interest revenue (NIR)
Factors impacting non-interest revenue
Favourable
• Growth in asset management fees benefitted from increased assets
under management and customer base within our wealth business.
• Improved foreign exchange liquidity with the introduction of IEFX
window.
Adverse
• Decline in account transaction fees on the back of CBN’s directive
to reduce commission on turnover and other transaction fees.
Non-interest revenue Net fees and commisions income
% of total income Trading revenue
Other revenue
Non-interest revenueCAGR (H1 2013 – H1 2017): 14%
Composition of non-interest revenue10
0H1 2013 H1 2014 H1 2015 H1 2016 H1 2017
15,000
10,000
5,000
20,000
25,000
30,000
35,000
45,000
40,000
24,068 27,517 26,346 34,218 40,289
57%
54% 54%
60%
50%
Nmillion
0
10
30
20
40
50
80
60
100
90
70
%
10
0H1 2013 H1 2014 H1 2015 H1 2016 H1 2017
100
%
10
30
20
40
50
70
60
80
90
62% 68% 71% 80%
37% 30% 27% 19%
1% 2% 2% 1%
69%
30%
1%
Non-interest revenue by business unit Change
%
H1 2017
Nmillion
H1 2016
Nmillion
Corporate & Investment Banking 36 17,197 12,649
Personal & Business Banking (19) 6,609 8,118
Wealth 23 16,483 13,451
Non-interest revenue 18 40,289 34,218
46 47Group results
in brief
Business
unit review
Balance sheet
analysis
Market & shareholder
information
Income statement
analysis
Capital
management
Other
information
Stanbic IBTC Analysis of financial results for the 6 months ended 30 June 2017
Inco
me
stat
emen
t an
alys
is

Credit impairment charges
Movement in credit impairment chargesChange
%
H1 2017
Nmillion
H1 2016
Nmillion
Specific credit impairment charges >100 16,688 5,175
Provision for performing loans >(100) (1,796) 3,515
Total impairment charges 71 14,892 8,690
Recoveries >100 (939) (240)
Credit impairment charges 65 13,953 8,450
Credit impairments by products Specific impairment
raised and (released)
Nmillion
General impairment
raised and (released)
Nmillion
Recoveries
Nmillion
Total
Nmillion
Mortgage lending 52 36 (323) (235)
Instalmental sales and finance leases 708 234 (86) 857
Card 53 (18) (4) 30
Corporate lending 7,308 (1,777) 0 5,532
Other loans and advance 8,567 (272) (526) 7,769
Total impairment charges 16,688 (1,796) (939) 13,953
Credit impairment charges by business unitChange
%
H1 2017
Nmillion
H1 2016
Nmillion
Corporate & Investment Banking 9 5,532 5,088
Personal & Business Banking >100 8,421 3,362
Credit impairment charges 65 13,953 8,450
Factors impacting credit impairment charges
Adverse
• Increase in general and specific provisioning in line with realities of the
economic situation.
• High interest rate environment and slow economic activities impacted
borrower’s ability to repay.
Operating expenses Staff costsCost-to-income ratio Depreciation Other operating cost
Operating expenses and cost-to-income ratio
Breakdown of operating expenses
Composition of operating expenses
Change % H1 2017 Nmillion H1 2016 Nmillion
Staff costs (15) 16,492 14,378
Other operating expenses: (17) 21,710 18,557
Information technology (24) 2,504 2,017
Communication expenses (18) 621 528
Premises and maintenance (15) 2,187 1,895
Depreciation expense (10) 2,010 1,830
Amortisation of intangible assets >(100) 23 0
Deposit insurance premium (9) 1,244 1,142
AMCON expenses (9) 4,926 4,503
Other insurance premium (70) 512 301
Auditors renumeration (14) 172 151
Non-audit service fee (see (ii) below) >(100) 14 3
Professional fees (19) 1,072 899
Administration and membership fees >(100) 1,594 794
Training expenses (27) 363 285
Security expenses (16) 696 599
Travel and entertainment 6 637 678
Stationery and printing (87) 621 332
Marketing and advertising (10) 903 822
Pension administration expense 49 104 202
Loss on sale property and equipment 100 0 3
Penalties and fines >(100) 41 19
Donations >(100) 311 34
Operational losses >100 (21) 30
Directors fees 5 168 176
Provision for legal costs, levies and fines >100 (805) 915
Impairment of other financial assets >100 1,861 (44)
Indirect tax (VAT) >(100) 346 160
Others >100 (394) 283
Total operating expenses 16 38,202 32,935
Operating expenses
10
0
10,000
5,000
15,000
20,000
25,000
30,000
45,000
40,000
35,000
26,512 29,110 31,045 32,935 38,202
63.1%
57.7%64.0%
57.7%
47.0%
Nmillion
0
10
30
20
40
50
70
60
80
90
100
%
H1 2013 H1 2014 H1 2015 H1 2016 H1 2017
10
0H1 2013 H1 2014 H1 2015 H1 2016 H1 2017
100
%
10
30
20
40
50
70
60
80
90
44% 45% 43% 44% 43%
7% 6% 6% 6% 5%
49% 50% 51% 52%51%
Impairment charges and credit loss ratio
H1 2013 H1 2014 H1 2015 H1 2016 H1 2017(5,000)
0
5,000
10,000
20,000
15,000
Nmillion
0.5
4.5
6.5
8.5
2.5
(1.5)
%
0.8%
7.3%
3.7%
0.8%1.0%
5,175
3,515
16,688
(1,796)
5,525
2,374
1,883
(445)
1,875 493
Credit impairment charge on non-performing loans Credit impairment charge on performing loans Credit loss ratio
48 49Group results
in brief
Business
unit review
Balance sheet
analysis
Market & shareholder
information
Income statement
analysis
Capital
management
Other
information
Stanbic IBTC Analysis of financial results for the 6 months ended 30 June 2017
Inco
me
stat
emen
t an
alys
is

Operating expenses by business unitChange
%
H1 2017
Nmillion
H1 2016
Nmillion
Corporate & Investment Banking 10 13,627 11,735
Personal & Business Banking 16 19,501 16,754
Wealth 14 5,074 4,446
Operating expenses 14 38,202 32,935
Factors impacting operating expenses
Staff cost and headcount
• Staff salary increase as a result of inflation adjustment
Other operating expenses
• Increase in deposit insurance expenses as a result of growth
in deposits from customers.
• Increased contribution to AMCON sinking fund due to growth
in total assets and off balance sheet items.
• Growth in premises and maintenance related expenses as we
upgrade branches.
Taxation
Effective tax rate
Taxation charge and effective tax rate
Taxation
Breakdown of taxation Change
%
H1 2017
Nmillion
H1 2016
Nmillion
FY 2016
Nmillion
Direct taxation
Normal taxation 23 5,001 4,053 8,981
Deferred tax (82) 56 312 (292)
Total taxation 16 5,057 4,365 8,689
10
0
H1 2013 H1 2014 H1 2015 H1 2016 H1 2017
4,000
5,000
1,000
(1,000)
3,000
2,000
6,000
0
(5.0)
15.0
20.0
5.0
10.0
30.0
25.0
Nmillion %
(158) 3,762 2,909 4,365 5,057
(1.7%)
18.9%
22.2%
27.8%
17.3%
50 51Group results
in brief
Business
unit review
Balance sheet
analysis
Market & shareholder
information
Income statement
analysis
Capital
management
Other
information
Stanbic IBTC Analysis of financial results for the 6 months ended 30 June 2017
Inco
me
stat
emen
t an
alys
isOperating expenses (continued)

0
400,000
200,000
600,000
800,000
1,000,000
1,400,000
1,200,000
Nmillion
1,273,960
367,956
111,880
327,621
302,056
28,938
23,095
Total assets Cash & loans to bank
Trading & derivative assets
Pledged assets
Financialinvestments
Loans & advances to customers
Otherassets
Intangible assets, property & equipment
112,302
10
0H1 2015 FY 2015 H1 2016 FY 2016 H1 2017
100
%
10
30
20
40
50
70
60
80
90
31 25 2426
710 9
3
134
40 38 32 29
11 17 22 24
5 3 5 8
2
4 3 3 2
30
33
34
24
4
0
3
10
0FY 2016
1,200
1,000
Nbillion
200
400
600
800
H1 2017
327.6
453.8
132.2
35.1
302.1
22.6
316.6
369.8
67.5 23.0
23.1
252.8
Balance sheet
Overview of group consolidated assets
Intangible assets, property & equipment
Intangible assets, property & equipment
Other assets
Loans & advances to customers
Financial investments
Financial investments Other assets
Pledged assets Trading & derivative assets
Trading, derivative & pledged assets
Loans & advances to customers
Cash & loans to banks Cash & loans to banks
Breakdown of total assetsAsset mix
52 53Group results
in brief
Business
unit review
Balance sheet
analysis
Market & shareholder
information
Income statement
analysis
Capital
management
Other
information
Stanbic IBTC Analysis of financial results for the 6 months ended 30 June 2017
Bal
ance
sh
eet
anal
ysis
Title (continued)
Balance sheet
analysis
5355576264
Balance sheetLoans and advancesLoans and advances performanceDeposits and current accountsFunding and liquidity
Balance sheet analysis

0
2.0
1.0
3.0
4.0
5.0
6.0
%
1.9
2.0 2.02.2
2.9
4.3
2.5
3.0
3.8
5.1
H1 2015 FY 2015 H1 2016 FY 2016 H1 2017
Return on assets
The group’s total assets closed at N1.274 trillion in H1 2017 from N1.053 trillion in FY 2016. The growth in total assets is majorly from the 13%
growth in deposit from customers which funded 50% of total assets.
The group’s after tax return on average assets grew to 4.3% from 2.5% achieved in FY 2016, which is a reflection of an increase in profit after tax.
Pre-tax return on average assets
After tax return on average assets
Loans and advances
Gross loans and advancesCAGR (H1 2015-H1 2017): (2%)
Breakdown of loans and advances to customers
Composition of gross loans and advances
Change
%
H1 2017
Nmillion
FY 2016
Nmillion
H1 2016
Nmillion
Gross loans and advances 5 393,688 375,316 407,087
Home loans (6) 8,370 8,924 8,918
Instalmental sales and finance leases (9) 18,838 17,273 22,306
Overdrafts 5 49,781 47,471 41,289
Term loans 5 316,699 301,648 334,574
Provisions 15 (25,732) (22,351) (31,451)
Specific credit impairments (26) (14,226) (11,249) (20,712)
Portfolio credit impairments (4) (11,506) (11,102) (10,739)
Net loans and advances 4 367,956 352,965 375,636
10
0H1 2015 FY 2015 H1 2016 FY 2016 H1 2017
500
450
Nbillion
200
150
100
50
300
250
350
400
431.5 379.4 407.1 375.3 393.7
Mortgage 2%
Overdrafts 13%
Term loans 80%
Instalmental sales and finance leases 5%
54 55Group results
in brief
Business
unit review
Balance sheet
analysis
Market & shareholder
information
Income statement
analysis
Capital
management
Other
information
Stanbic IBTC Analysis of financial results for the 6 months ended 30 June 2017
Bal
ance
sh
eet
anal
ysis
Balance sheet (continued)
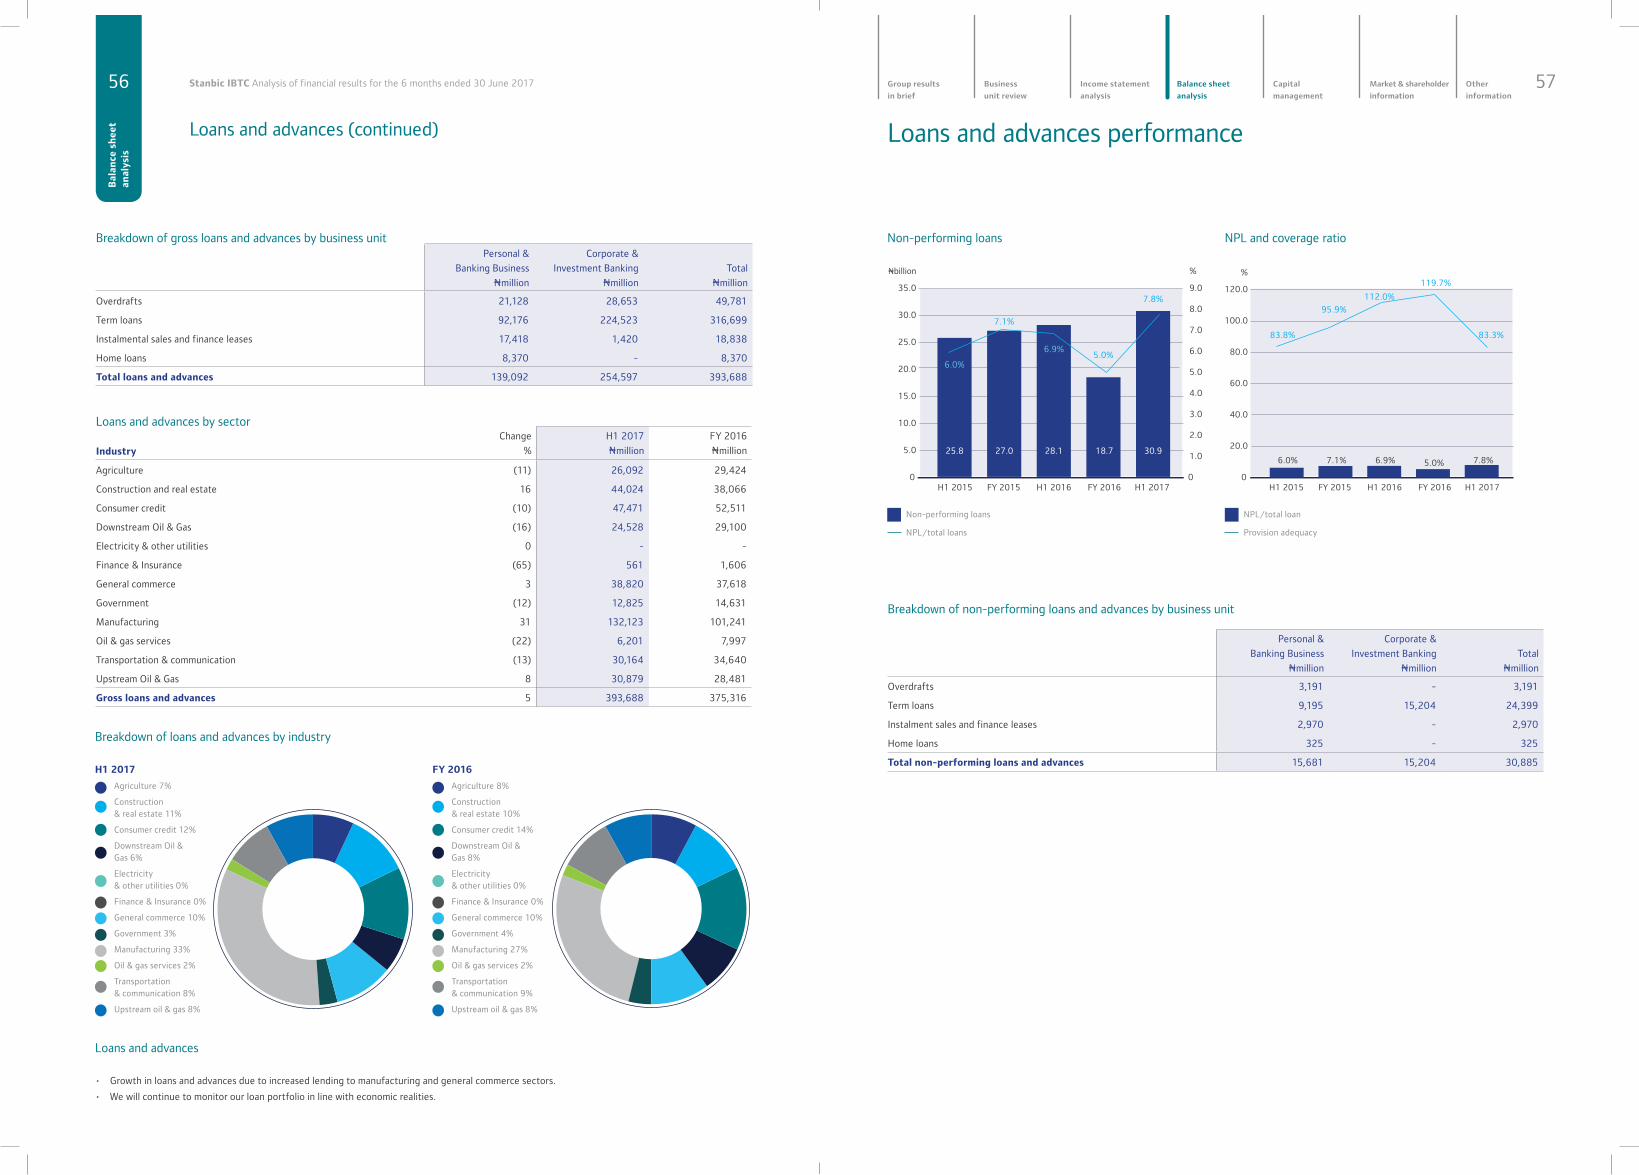
Loans and advances by sector
Industry
Change
%
H1 2017
Nmillion
FY 2016
Nmillion
Agriculture (11) 26,092 29,424
Construction and real estate 16 44,024 38,066
Consumer credit (10) 47,471 52,511
Downstream Oil & Gas (16) 24,528 29,100
Electricity & other utilities 0 - -
Finance & Insurance (65) 561 1,606
General commerce 3 38,820 37,618
Government (12) 12,825 14,631
Manufacturing 31 132,123 101,241
Oil & gas services (22) 6,201 7,997
Transportation & communication (13) 30,164 34,640
Upstream Oil & Gas 8 30,879 28,481
Gross loans and advances 5 393,688 375,316
Loans and advances performance
Non-performing loans NPL/total loan
NPL/total loans Provision adequacy
Non-performing loans NPL and coverage ratio
0H1 2015 FY 2015 H1 2016 FY 2016 H1 2017
10.0
5.0
15.0
20.0
25.0
30.0
35.0
25.8 27.0 28.1 18.7 30.9
6.0%
7.1%
5.0%
Nbillion
0
1.0
3.0
2.0
4.0
5.0
7.0
6.0
8.0
9.0
%
6.9%
7.8%
10
6.0% 7.1% 6.9% 5.0% 7.8%
H1 2015 FY 2015 H1 2016 FY 2016 H1 2017
83.8%
95.9%
112.0%
83.3%
119.7%
0
20.0
40.0
60.0
80.0
100.0
120.0
%
Loans and advances
• Growth in loans and advances due to increased lending to manufacturing and general commerce sectors.
• We will continue to monitor our loan portfolio in line with economic realities.
Breakdown of loans and advances by industry
H1 2017
Agriculture 7%
Construction & real estate 11%
Consumer credit 12%
Downstream Oil & Gas 6%
Electricity & other utilities 0%
Finance & Insurance 0%
General commerce 10%
Government 3%
Manufacturing 33%
Oil & gas services 2%
Transportation & communication 8%
Upstream oil & gas 8%
Agriculture 8%
Construction & real estate 10%
Consumer credit 14%
Downstream Oil & Gas 8%
Electricity & other utilities 0%
Finance & Insurance 0%
General commerce 10%
Government 4%
Manufacturing 27%
Oil & gas services 2%
Transportation & communication 9%
Upstream oil & gas 8%
FY 2016
Breakdown of gross loans and advances by business unitPersonal &
Banking Business
Nmillion
Corporate &
Investment Banking
Nmillion
Total
Nmillion
Overdrafts 21,128 28,653 49,781
Term loans 92,176 224,523 316,699
Instalmental sales and finance leases 17,418 1,420 18,838
Home loans 8,370 - 8,370
Total loans and advances 139,092 254,597 393,688
Breakdown of non-performing loans and advances by business unit
Personal &
Banking Business
Nmillion
Corporate &
Investment Banking
Nmillion
Total
Nmillion
Overdrafts 3,191 - 3,191
Term loans 9,195 15,204 24,399
Instalment sales and finance leases 2,970 - 2,970
Home loans 325 - 325
Total non-performing loans and advances 15,681 15,204 30,885
56 57Group results
in brief
Business
unit review
Balance sheet
analysis
Market & shareholder
information
Income statement
analysis
Capital
management
Other
information
Stanbic IBTC Analysis of financial results for the 6 months ended 30 June 2017
Bal
ance
sh
eet
anal
ysis
Loans and advances (continued)

• Increase in non-performing loans is largely on the back of some newly classified loans in oil and gas sector.
• NPLs to government are loans granted to cooperative societies of Government employees who have been affected by salary delays.
• Increase in NPLs in Upstream oil & gas due to classification of a client in the Oil & Gas sector whose operations had been disrupted by militancy action
resulting in closure of the Trans Forcados Pipeline.
• NPL coverage ratio for H1 2017 is 83.3% (FY 2016: 119.7%). Coverage ratio on performing loans for the period was 3.2%.
• Foreign currency loans accounted for 44% of NPLs, while local currency loans accounted for the balance.
Breakdown of non-performing loans and advances by industry
Change
%
H1 2017
Nmillion
FY 2016
Nmillion
Agriculture (68) 1,005 3,128
Construction and real estate 92 620 322
Consumer credit 10 4,759 4,313
Manufacturing 88 3,236 1,725
Upstream Oil & gas >100 13,456 -
Downstream Oil & Gas >100 2,247 359
Oil & gas services (69) 543 1,755
General commerce (28) 1,751 2,426
Transportation & communication (32) 3,092 4,528
Government 49 176 119
Total non-performing loans 65 30,885 18,675
Non-performing loans by sector
H1 2017
Agriculture 3%
Construction & real estate 2%
Consumer credit 15%
Manufacturing 10%
Downstream Oil & Gas 7%
Oil & gas services 2%
General commerce 6%
Transportation & communication 10%
Government 1%
Oil Upstream 44%
Finance & Insurance 0%
Agriculture 17%
Construction & real estate 2%
Consumer credit 13%
Manufacturing 9%
Downstream Oil & Gas 2%
Oil & gas services 9%
General commerce 13%
Transportation & communication 24%
Government 1%
Oil Upstream 0%
Finance & Insurance 0%
FY 2016
Non-performing loans by productChange % H1 2017 FY 2016
Overdrafts (24) 3,191 4,183
Term loans 95 24,399 12,537
Instalment sales and finance leases 75 2,970 1,697
Home loans 26 325 258
Total non-performing loans and advances 65 30,885 18,675
58 59Group results
in brief
Business
unit review
Balance sheet
analysis
Market & shareholder
information
Income statement
analysis
Capital
management
Other
information
Stanbic IBTC Analysis of financial results for the 6 months ended 30 June 2017
Bal
ance
sh
eet
anal
ysis
Loans and advances performance (continued)

June 2017 Performing loans Non-performing loans
Neither past due nor specifically
impaired
Not specifically
impaired
Specifically impaired loans
Non-performing loans
Note
Total Loans
and advances
to customers
Nmillion
Balance sheet
impairments
for performing
loans
Nmillion
Normal
monitoring
Nmillion
Close
monitoring
Nmillion
Early arrears
Nmillion
Sub-standard
Nmillion
Doubtful
Nmillion
Loss
Nmillion
Total
Nmillion
Securities
and expected
recoveries on
specifically
impaired loans
Nmillion
Net after
securities
and expected
recoveries on
specifically
impaired loans
Nmillion
Balance sheet
impairments
for non-
performing
specifically
impaired loans
Nmillion
Gross
specific
impairment
coverage
%
Total non-
performing
loans
Nmillion
Non-
performing
loans
%
Personal & Business Banking 139,092 3,492 94,968 11,355 17,087 5,932 5,293 4,456 15,681 6,536 9,145 9,145 58 15,681 11.3
Mortgage loans 8,370 89 4,220 1,599 2,294 136 149 39 324 120 204 204 63 324 3.9
Instalment sale and finance leases 14,148 495 6,167 2,387 2,623 1,097 1,385 489 2,971 1,484 1,487 1,487 50 2,971 21.0
Card debtors 1,471 30 926 - 276 61 66 142 269 21 248 248 92 269 18.3
Other loans and advances 115,103 2,878 83,655 7,369 11,894 4,638 3,693 3,786 12,117 4,911 7,206 7,206 59 12,117 10.5
Corporate & Investment Banking 254,596 8,015 204,358 24,651 7,711 1,748 13,456 - 15,204 10,123 5,081 5,081 33 15,204 6.0
Corporate loans 254,596 8,015 204,358 24,651 7,711 1,748 13,456 - 15,204 10,123 5,081 5,081 33 15,204 6.0
Gross loans and advances 393,688 11,507 299,326 36,006 24,798 7,680 18,749 4,456 30,885 16,659 14,226 14,226 46 30,885 7.8
Asset quality (Prudential guidelines)
60 61Group results
in brief
Business
unit review
Balance sheet
analysis
Market & shareholder
information
Income statement
analysis
Capital
management
Other
information
Stanbic IBTC Analysis of financial results for the 6 months ended 30 June 2017
Bal
ance
sh
eet
anal
ysis
Loans and advances performance (continued)

Deposit and current accounts
Deposit liabilities
Deposit liabilitiesCAGR (2015-2017): 1%
Deposit mix
Breakdown of total depositsChange
%
H1 2017
Nmillion
H1 2016
Nmillion
FY 2016
Nmillion
Deposits from banks (10) 48,619 100,775 53,766
Deposits under repurchase agreements - - 14,689 -
Other deposits from banks (10) 48,619 86,086 53,766
Deposits from customers 13 632,751 593,643 560,969
Current accounts 20 337,064 223,488 281,523
Call deposits 19 50,447 30,925 42,303
Savings accounts 12 43,167 34,532 38,630
Term deposits 6 202,073 254,381 191,535
Negotiable certificate of deposit (100) - 50,317 6,978
Total deposits and current accounts 11 681,370 694,418 614,735
Current accounts Call deposits
Term depositsSavings accounts
Negotiable certificate of deposit
10
0H1 2015 FY 2015 H1 2016 FY 2016 H1 2017
200.0
300.0
100.0
400.0
500.0
700.0
600.0
41
50
57 55 57
Nbillion
601.7 493.5 593.6 561.0 632.8
0H1 2015 FY 2015 H1 2016 H12017
100
%
10
30
20
40
50
70
60
80
90
44% 39% 34%
10%
1% 0%0%
4%6%
7%
8%
8%
8%
44% 38%
FY 2016
43%
8%
6%5%
38% 50%
32%
7%
8%
53%
Deposit breakdown by business unit
Change
%
H1 2017
Nmillion
H1 2016
Nmillion
FY 2016
Nmillion
Personal & Business Banking 9 385,349 289,020 353,189
Current deposits 17 221,411 143,849 188,877
Savings deposits 12 43,167 34,532 38,630
Call deposits (56) 4,250 2,935 9,687
Term deposits - 116,521 107,703 115,996
Corporate & Investment Banking 19 247,402 304,623 207,780
Current deposits 25 115,653 79,639 92,646
Call deposits 42 46,197 27,990 32,616
Term deposits 4 85,552 196,995 82,517
Total deposits and current accounts 13 632,751 593,643 560,969
Deposit liabilities
• Increase in deposits by 13% year-to-date, as number of customer continues to grow taking advantage of our expanded delivery channels.
• Customer acquisition initiatives continue to yield positive results as current accounts and savings accounts grow by 17% and 12% respectively.
• Cost of funds impacted negatively by the growth in term deposits.
62 63Group results
in brief
Business
unit review
Balance sheet
analysis
Market & shareholder
information
Income statement
analysis
Capital
management
Other
information
Stanbic IBTC Analysis of financial results for the 6 months ended 30 June 2017
Bal
ance
sh
eet
anal
ysis
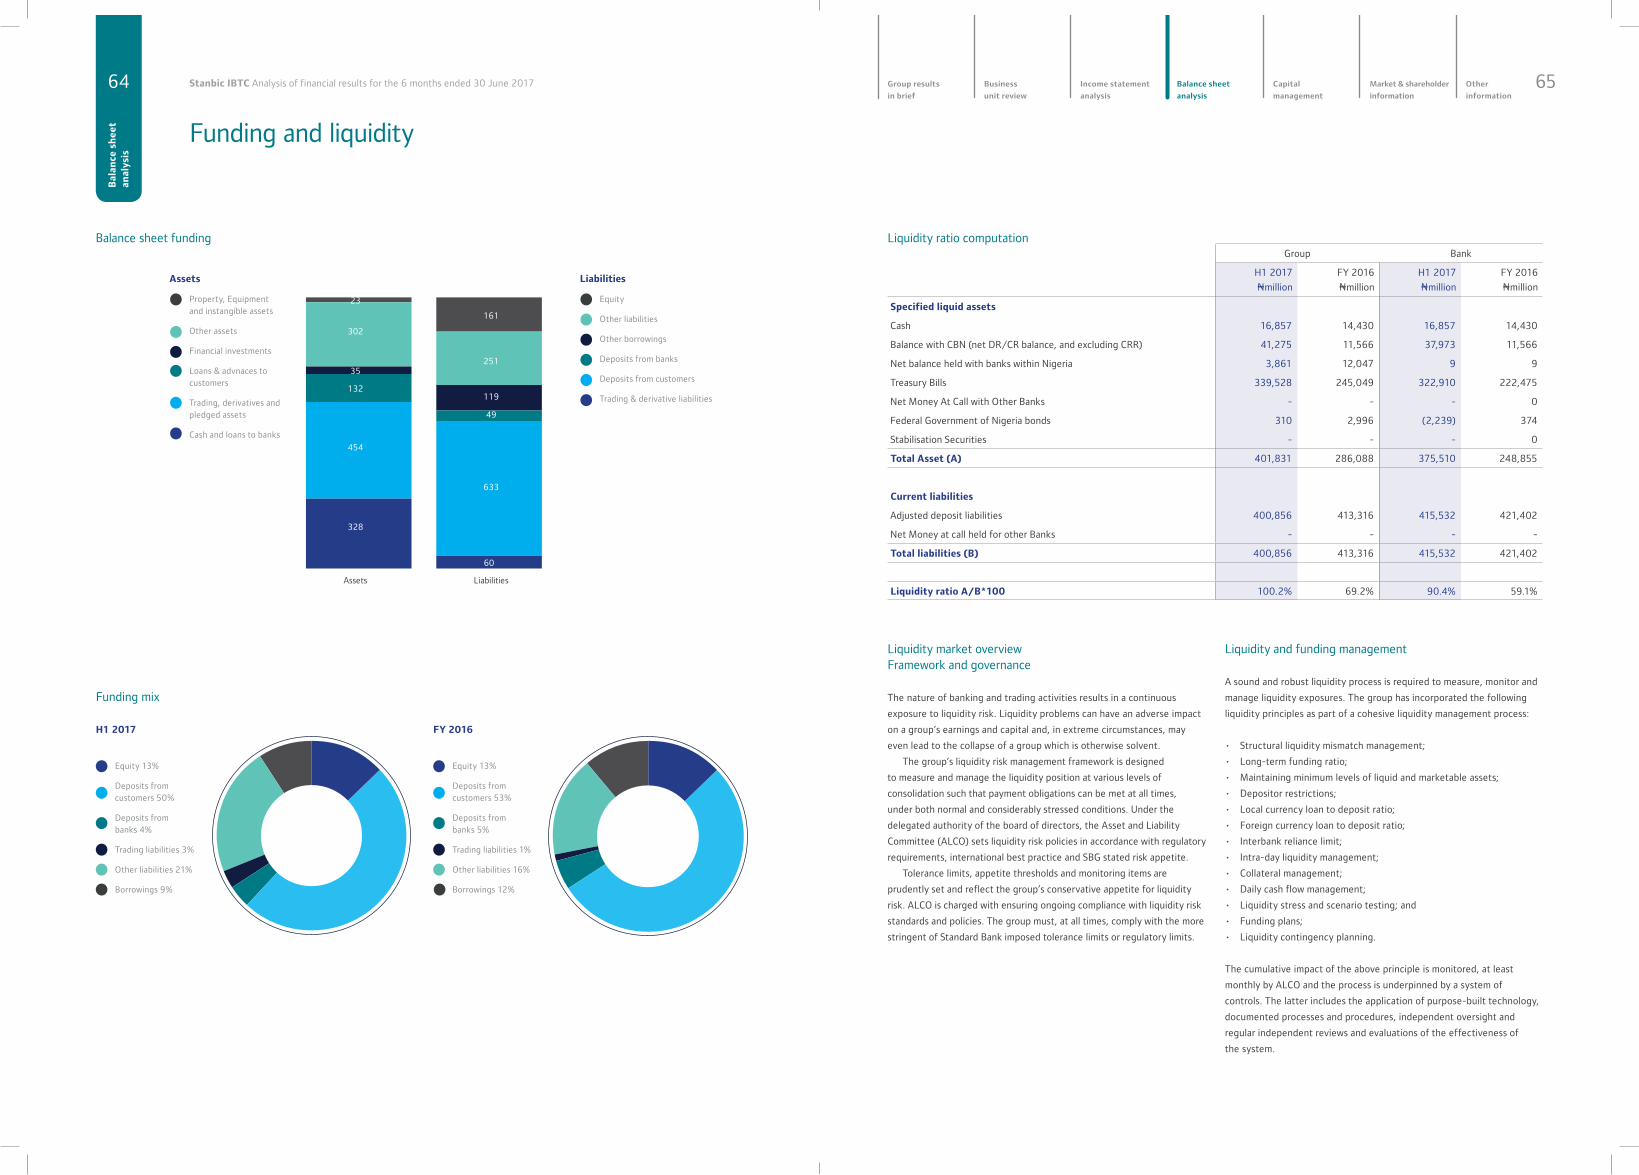
LiabilitiesAssets
328
454
132
35
302
23
633
49
251
161
60
119
Balance sheet funding
Funding mix
H1 2017
Equity 13%
Deposits from customers 50%
Deposits from banks 4%
Trading liabilities 3%
Other liabilities 21%
Borrowings 9%
Equity 13%
Deposits from customers 53%
Deposits from banks 5%
Trading liabilities 1%
Other liabilities 16%
Borrowings 12%
Equity
Other liabilities
Other borrowings
Deposits from banks
Deposits from customers
Trading & derivative liabilities
Property, Equipment and instangible assets
Other assets
Financial investments
Loans & advnaces to customers
Trading, derivatives and pledged assets
Cash and loans to banks
FY 2016
Assets Liabilities
Liquidity market overview Framework and governance
The nature of banking and trading activities results in a continuous
exposure to liquidity risk. Liquidity problems can have an adverse impact
on a group’s earnings and capital and, in extreme circumstances, may
even lead to the collapse of a group which is otherwise solvent.
The group’s liquidity risk management framework is designed
to measure and manage the liquidity position at various levels of
consolidation such that payment obligations can be met at all times,
under both normal and considerably stressed conditions. Under the
delegated authority of the board of directors, the Asset and Liability
Committee (ALCO) sets liquidity risk policies in accordance with regulatory
requirements, international best practice and SBG stated risk appetite.
Tolerance limits, appetite thresholds and monitoring items are
prudently set and reflect the group’s conservative appetite for liquidity
risk. ALCO is charged with ensuring ongoing compliance with liquidity risk
standards and policies. The group must, at all times, comply with the more
stringent of Standard Bank imposed tolerance limits or regulatory limits.
Liquidity and funding management
A sound and robust liquidity process is required to measure, monitor and
manage liquidity exposures. The group has incorporated the following
liquidity principles as part of a cohesive liquidity management process:
• Structural liquidity mismatch management;
• Long-term funding ratio;
• Maintaining minimum levels of liquid and marketable assets;
• Depositor restrictions;
• Local currency loan to deposit ratio;
• Foreign currency loan to deposit ratio;
• Interbank reliance limit;
• Intra-day liquidity management;
• Collateral management;
• Daily cash flow management;
• Liquidity stress and scenario testing; and
• Funding plans;
• Liquidity contingency planning.
The cumulative impact of the above principle is monitored, at least
monthly by ALCO and the process is underpinned by a system of
controls. The latter includes the application of purpose-built technology,
documented processes and procedures, independent oversight and
regular independent reviews and evaluations of the effectiveness of
the system.
Liquidity ratio computationGroup Bank
H1 2017
Nmillion
FY 2016
Nmillion
H1 2017
Nmillion
FY 2016
Nmillion
Specified liquid assets
Cash 16,857 14,430 16,857 14,430
Balance with CBN (net DR/CR balance, and excluding CRR) 41,275 11,566 37,973 11,566
Net balance held with banks within Nigeria 3,861 12,047 9 9
Treasury Bills 339,528 245,049 322,910 222,475
Net Money At Call with Other Banks - - - 0
Federal Government of Nigeria bonds 310 2,996 (2,239) 374
Stabilisation Securities - - - 0
Total Asset (A) 401,831 286,088 375,510 248,855
Current liabilities
Adjusted deposit liabilities 400,856 413,316 415,532 421,402
Net Money at call held for other Banks - - - -
Total liabilities (B) 400,856 413,316 415,532 421,402
Liquidity ratio A/B*100 100.2% 69.2% 90.4% 59.1%
Funding and liquidity
64 65Group results
in brief
Business
unit review
Balance sheet
analysis
Market & shareholder
information
Income statement
analysis
Capital
management
Other
information
Stanbic IBTC Analysis of financial results for the 6 months ended 30 June 2017
Bal
ance
sh
eet
anal
ysis

Group unencumbered surplus liquidityChange
%
H1 2017
Nmillion
FY 2016
Nmillion
Marketable assets 39.0 350,045 251,875
Short-term foreign currency placements - -
Total unencumbered marketable assets 39.0 350,045 251,875
Other readily accessible liquidity >100 206,104 12,500
Total unencumbered surplus liquidity >100 556,149 264,375
Structural liquidity mismatch management
The mismatch approach measures the group’s liquidity by assessing the
mismatch between its inflow and outflow of funds within different time
bands on a maturity ladder. The structural liquidity mismatch is based on
behaviourally-adjusted cash flows which factors a probability of maturity
into the various time bands. As expected cash flows vary significantly
from the contractual position, behavioural profiling is applied to assets,
liabilities and off-balance sheet items with an indeterminable maturity or
drawdown period.
A net mismatch figure is obtained by subtracting liabilities and net
off-balance sheet positions from assets in each time band. The group’s
liquidity position is assessed by means of the net cumulative mismatch
position while its liquidity mismatch performance is an aggregation of
the net liquidity position in each successive time band expressed as a
percentage of total funding related liabilities to the public.
Maintaining minimum levels of liquid and marketable assets
Minimum levels of prudential liquid assets are held in accordance with
all prudential requirements as specified by the regulatory authorities.
The group needs to hold additional unencumbered marketable assets,
in excess of any minimum prudential liquid asset requirement, to cater
for volatile depositor withdrawals, draw-downs under committed
facilities, collateral calls, etc.
The following criteria apply to readily marketable securities:
• Prices must be quoted by a range of counterparties;
• The asset class must be regularly traded;
• The asset may be sold or repurchased in a liquid market, for payment
in cash; and settlement must be according to a prescribed, rather than
a negotiated, timetable.
Funding and liquidity (continued)
The group ensures that the banking entity (Stanbic IBTC Bank PLC) is within the regulatory liquidity ratio of 30% on a daily basis.
The minimum, average and maximum liquidity ratios presented in the table above are derived from daily liquidity ratio computations.
Liquidity ratio Jan-Jun 2017 Jan-Dec 2016
Minimum 59.30% 56.24%
Average 86.68% 78.05%
Maximum 122.41% 101.95%
Depositor concentration
To ensure that the group does not place undue reliance on any single
entity as a funding source, restrictions are imposed on the short dated
(0-3 months term) deposits accepted from any entity. These include:
• The sum of 0-3 month deposits and standby facilities provided by
any single deposit counterparty must not, at any time, exceed 10%
of total funding related liabilities to the public; and
• The aggregate of 0-3 month deposits and standby facilities from the
10 largest single deposit counterparties must not, at any time, exceed
20% of total funding related liabilities to the public.
Concentration risk limits are used to ensure that funding diversification is
maintained across products, sectors, and counterparties. Primary sources
of funding are in the form of deposits across a spectrum of retail and
wholesale clients. As mitigants, the group maintains marketable securities
in excess of regulatory requirements in order to condone occasional
breaches of concentration limits.
Loan to deposit limit
A limit is put in place, restricting the local currency loan to deposit ratio
to a maximum specified level, which is reviewed periodically. Similarly, in
order to restrict the extent of foreign currency lending from the foreign
currency deposit base, a foreign currency loan to deposit limit, which
is also referred to as own resource lending, is observed. As mitigants,
the group maintains high levels of unencumbered marketable and liquid
assets in excess of regulatory benchmark.
Intra-day liquidity management
The group manages its exposures in respect of payment and settlement
systems. Counterparties may view the failure to settle payments when
expected as a sign of financial weakness and in turn delay payments
to the group. This can also disrupt the functioning of payment and
settlement systems. At a minimum, the following operational elements
are included in the group’s intra-day liquidity management:
• Capacity to measure expected daily gross liquidity inflows and
outflows, including anticipated timing where possible;
• Capacity to monitor its intraday liquidity positions, including available
credit and collateral;
• Sufficient intraday funding to meet its objectives;
• Ability to manage and mobilise collateral as required;
• Robust capacity to manage the timing of its intraday outflows; and
• Readiness to deal with unexpected disruptions to its intraday liquidity
flows.
Daily cash flow management
The group generates a daily report to monitor significant cash flows.
Maturities and withdrawals are forecast at least 3-months in advance
and management is alerted to large outflows. The report, which is made
available to the funding team, ALM and market risk also summarises
material daily new deposit as well as the interbank and top depositor
reliance (by value and product).
The daily cash flow management report forms an integral part of the
ongoing liquidity management process and is a crucial tool to proactively
anticipate and plan for large cash outflows.
Interbank reliance
Interbank funding traditionally is seen as the most volatile and least
stable source of funding, easily influenced by market sentiment and
prone to flight under stress situations. Consequently, to ensure prudent
liquidity management is enforced, the group restricts the local currency
interbank funding as a proportion of the local currency funding base to a
maximum of 15% of the total currency funding base.
Liquidity stress testing and scenario testing
Anticipated on- and off-balance sheet cash flows are subjected to a
variety of the group specific and systemic stress scenarios in order to
evaluate the impact of unlikely but plausible events on liquidity positions.
Scenarios are based on both historical events, such as past emerging
markets crises, past local financial markets crisis and hypothetical events,
such as an entity specific crisis. The results obtained from stress testing
provide meaningful input when defining target liquidity risk positions.
67Group results
in brief
Business
unit review
Balance sheet
analysis
Market & shareholder
information
Income statement
analysis
Capital
management
Other
information66 Stanbic IBTC Analysis of financial results for the 6 months ended 30 June 2017
Bal
ance
sh
eet
anal
ysis

Capital
management
6970
Return on ordinary equityRisk weighted assets
Capital management
69Group results
in brief
Business
unit review
Balance sheet
analysis
Market & shareholder
information
Income statement
analysis
Capital
management
Other
information
Return on ordinary equity
Breakdown of return on average equity by business unit
Average equity
H1 2017
Nmillion
Pre tax ROaE
H1 2017
%
Post tax ROaE
H1 2017
%
Average equity
FY 2016
Nmillion
Pre tax ROaE
FY 2016
%
Post tax ROaE
FY 2016
%
Personal & Business Banking 43,487 (24.0) (24.3) 28,580 (5.9) (5.6)
Corporate & Investment Banking 73,744 57.9 55.9 59,911 27.9 24.9
Wealth 31,068 85.6 57.9 41,989 52.8 36.2
Stanbic IBTC Group 148,299 38.2 31.3 130,481 28.5 18.9
Shareholders’ equity grew by 16% to close at N159.5 billion in H1 2017 from N137.1 billion achieved in FY 2016. The return on average equity
improved to 31.3% from 18.9% achieved in FY 2016. The improvement in return on equity is as a result of a 113% growth in profit after tax.
Shareholders’ fund (average)
ROaE
Shareholders’ equity Average shareholders’ fund and return on equity10
0
180
160
140
Nbillion
40
20
80
60
100
120
118.8 123.7 130.7 137.1 159.5
H1 2015 FY 2015 H1 2016 FY 2016 H1 2017
10
0
20,000
40,000
60,000
80,000
100,000
160,000
120,000
140,000
Nmillion
0
15.0
5.0
35.0
30.0
25.0
10.0
20.0
%
H1 2015 FY 2015 H1 2016 FY 2016 H1 2017
117,392 119,874 127,198 130,414 148,299
18.9%
31.3%
15.0%12.9%13.8%

71Group results
in brief
Business
unit review
Balance sheet
analysis
Market & shareholder
information
Income statement
analysis
Capital
management
Other
information70 Stanbic IBTC Analysis of financial results for the 6 months ended 30 June 2017
Cap
ital
m
anag
emen
t Risk – weighted assets
Tier I capital adequacy
Total capital adequacy
Statutory minimum
Total assets and risk weighted assets Capital adequacy ratio
H1 2015 FY 2015 H1 2016 FY 2016 H1 2017
Total assets 1,033,430 937,564 1,174,543 1,053,523 1,273,960
Risk weighted assets
667,177 646,343 528,098 695,439 784,198
% of risk weighted assets to total assets
64.6% 68.9% 45.0% 66.0% 61.6%
The group maintained adequate capital to support its business in H1 2017 and are well above the regulatory requirement.
The group’s total capital adequacy ratio closed the period at 22.9% (Bank 20.2%), while the tier 1 capital adequacy ratio stood at 19.2% (Bank 16.1%).
These ratios are well above the 10% minimum statutory requirement.
Capital adequacy computationBasel II Basel II
Group
H1 2017
Nmillion
Bank
H1 2017
Nmillion
Group
FY 2016
Nmillion
Bank
FY 2016
Nmillion
Tier I capital 150,421 112,533 129,480 99,144
Tier II capital 28,827 28,070 28,906 28,099
Total qualifying capital 179,248 140,603 158,386 127,243
Credit risk 561,681 534,642 486,430 458,266
Operational risk 207,092 146,986 207,092 146,986
Market risk 15,425 15,425 1,917 1,917
Risk weighted assets 784,198 697,053 695,439 607,169
Capital adequacy
Tier I 19.2% 16.1% 18.6% 16.3%
Tier II 3.7% 4.0% 4.2% 4.6%
Total 22.9% 20.2% 22.8% 21.0%
10
0
200,000
400,000
600,000
800,000
1,400,000
1,200,000
1,000,000
Nmillion
0
60.0
20.0
80.0
70.0
50.0
40.0
10.0
30.0
%
10
0
5.0
15.0
10.0
20.0
25.0
%
16.1
21.3
17.4
10.6
13.9
20.6
18.6
22.8
19.2
22.9
H1 2015 FY 2015 H1 2016 FY 2016 H1 2017
Market & shareholder
information
727273
Market capitalisation and price-to-book ratioDividend payment historyEquity and range analysis
Market & shareholder information

The shareholding pattern of the Group as at 30 June 2017
Share range No of share-holders % share-holders No of holding % holding
1 - 1,000 38,926 40.88 20,965,307 0.21
1001 - 5,000 36,586 38.43 75,756,982 0.76
5,001 - 10,000 9,518 10.00 59,217,256 0.59
10,001 - 50,000 7,907 8.30 149,241,302 1.49
50,001 - 100,000 1,159 1.22 73,349,795 0.73
100,001 - 500,000 834 0.88 155,686,481 1.56
500,001 - 1,000,000 122 0.13 76,874,551 0.77
1,000,001 - 5,000,000 82 0.09 177,538,068 1.78
5,000,001 - 10,000,000 14 0.01 98,882,505 0.99
10,000,001 - 50,000,000 39 0.04 861,637,326 8.62
50,000,001 - 100,000,000 13 0.01 867,574,042 8.68
100,000,001 - 10,000,000,000 11 0.01 7,383,276,385 73.83
Grand Total 95,211 100 10,000,000,000 100
Significant shareholding of 5% and above
Shareholder
No of
shares held
30 June 2017
Percentage
shareholding
30 June 2017
No of
shares held
31 Dec 2016
Percentage
shareholding
31 Dec 2016
Stanbic Africa Holdings Ltd 5,318,957,354 53.2 5,318,957,354 53.2
First Century International 747,089,076 7.5 747,089,076 7.5
72 73Group results
in brief
Business
unit review
Balance sheet
analysis
Market & shareholder
information
Income statement
analysis
Capital
management
Other
information
Stanbic IBTC Analysis of financial results for the 6 months ended 30 June 2017
Mar
ket
& s
har
ehol
der
info
rmat
ion
Net asset value per share
Price-to-book
Market capitalisation Net asset value per share and price-to-book
Market capitalisation and price-to-book ratio
10
0
350
300
Nbillion
50
150
100
200
250
270.0 165.3 162.0 150.0 330.0
H1 2015 FY 2015 H1 2016 FY 2016 H1 20170
H1 2015 FY 2015 H1 2016 FY 2016 H1 2017
400
200
600
800
1,000
1,400
1,800
1,200
1,600
kobo
0
0.5
1.5
1.0
2.0
2.5
Times
1,188 1,237 1,307 1,371 1,595
2.3
1.31.2
1.1
2.1
Change % H1 2017 FY 2016
Number of shares at the end of the period thousands 0 10,000,000 10,000,000
Net asset value Nmillion 16 159,496 137,102
Net asset value per share kobo 16 1,595 1,371
Share price at the end of the period kobo >100 3,300 1,500
Market capitalisation at end of the period Nbillion >100 330.0 150.0
Price-to-book at end of the period times >100 2.1 1.1
Stanbic’s share price outperformed both the Banking Index (BI) and The NSE ASI. Stanbic’s share price appreciated by over 100%, while the BI and
NSE ASI appreciated by 45.1% and 23.2% respectively. The group’s market capitalisation also grew to N330.0 billion in H1 2017, and ranked 6th most
capitalised stock amongst the 173 listed equities on the Nigerian Stock Exchange in H1 2017.
Dividend payment history
Period ended
Total amount paid
Nmillion
Dividend paid per share
Kobo
December 31 2015
Interim: 9,000 90
Final 500 5
December 31 2014
Interim: 11,000 110
Final: 1,500 15
December 31 2013
Interim: 7,000 70
Final: 1,000 10
December 31 2012
Final: 1,000 10
Equity and range analysis

Other
information
7576
Financial and other definitionsContact details
Other information
75Group results
in brief
Business
unit review
Balance sheet
analysis
Market & shareholder
information
Income statement
analysis
Capital
management
Other
information
Financial and other definitions
After tax return on average equity (ROaE) (%) Profit after tax as a percentage of annual average ordinary shareholders’ funds.
Basic earnings per ordinary share (EPS) (kobo) Earnings attributable to ordinary shareholders divided by the ordinary shares in issue.
CAGR (%) Compound annual growth rate.
Cost-to-income ratio (%) Operating expenses as a percentage of total income.
Credit loss ratio (%) Total impairment charges on loans and advances per the income statement as a percentage of gross
loans and advances.
Dividend cover (times) Earnings per share divided by dividend per share.
Dividend per share (kobo) Total dividends to ordinary shareholders including dividends and scrip distributions declared per
share in respect of the period.
Gross impairment coverage (%) Non-performing loan impairments as a percentage of gross non-performing loans.
Net asset value (Nmillion) Equity attributable to ordinary shareholders.
Net asset value per share (kobo) Net asset value divided by the number of ordinary shares in issue at the end of the period.
Net interest margin (%) Net interest income as a percentage of average of total assets less derivative assets.
Non-interest revenue to total income (%) Non-interest revenue as a percentage of total income.
Non-performing loans ratio (%) Total non-performing loans as a percentage of gross loans and advances.
Price-to-book ratio (times) Market capitalisation divided by net asset value.
Profit attributable to ordinary shareholders Profit for the period attributable to ordinary shareholders, calculated as profit for the period less
minority interests.
Profit for the period (Nmillion) Income statement profit attributable to ordinary shareholders and minorities shareholders for the period.
Provisions for non-performing loans (Nmillion). Provisions for specific identified credit losses.
Provision of performing loans (Nmillion) Provisions for incurred credit losses inherent in the performing loan book.
Shares in issue (number) Number of ordinary shares in issue as listed on the floor of the Nigerian Stock Exchange (NSE).
Total capital adequacy ratio (%) Regulatory capital divided by risk-weighted assets.
Turnover in shares traded (%) Number of shares traded during the period as a percentage of the weighted average number of shares.
Weighted average number of share (number) The weighted average number of ordinary shares in issue during the period as recorded on the NSE.

76 Stanbic IBTC Analysis of financial results for the 6 months ended 30 June 2017
Oth
er
info
rmat
ion Contact details
77Group results
in brief
Business
unit review
Balance sheet
analysis
Market & shareholder
information
Income statement
analysis
Capital
management
Other
information
Idris Toriola
Head, investor relations T: +234 1 4228501
Registered address
IBTC Place
Walter Carrington Crescent
P.O. Box 71707
Victoria Island, Lagos
Nigeria
Disclaimer
If you received this document in error, please immediately return
the document and other related documents to Standard Bank Group/
Stanbic IBTC Holdings PLC.
On receipt of this document, you agree to be bound and are deemed
to understand that:
This presentation is provided to you for information purposes only
on the understanding that such information is strictly confidential. This
presentation must not be delivered or its contents disclosed to anyone
other than the entity (including its employees) to which it is provided and
must not be used or reproduced, in whole or part, for any purpose other
than for information.
This presentation is intended to be a commercial communication
and is not to be construed as a recommendation or the constitution or
solicitation of an offer for the sale and purchase of any financial product,
service, investment or security. The information, investments and/
or strategies discussed in this presentation may not be suitable for all
investors and where you have any concerns you should approach an
investment advisor.
We do not accept liability for any loss (direct or consequential) arising
from use of this presentation. You must not rely on any communication
Victor Yeboah-Manu
Chief financial officer
T: +234 1 4228746
Chidi Okezie
Company secretary
T: +234 1 4228695
(written or oral) from us as investment advice, a recommendation to enter
into a transaction (which includes the information and explanations related
to the terms and conditions of a transaction) or deem it to be an assurance
or guarantee as to the expected results of a transaction. Investments
discussed in this presentation may fluctuate in price or value over time
and past performance is not indicative of future results. While we have
taken care in preparing this presentation, we give no representation,
warranty or undertaking and accept no responsibility or liability as to the
accuracy or completeness of the information set out in this presentation.
This presentation does not represent an offer of funding and any facility
to be granted in terms of this presentation is subject to us obtaining the
requisite internal and external approvals.
Our duties and responsibilities do not include tax advisory, legal,
regulatory accounting or other specialist or technical advice or services.
You must procure and rely on independent assessments and investigations
into all matters contemplated in this presentation.
© 2017 Standard Bank Group / Stanbic IBTC Holding PLC.
All rights reserved.

Stanbic IBTC Holdings PLC RC1018051
www.stanbicibtc.comDesigned and produced by Creative Interpartners, LondonEmail: [email protected]
Photography: Centaur Photographers
www.stanbicibtc.comDesigned and produced by Creative Interpartners, LondonEmail: [email protected]
Photography: Centaur Photographers