
Ontario's Labour Market Future Rick Miner, Ph.D. People Without Jobs, Jobs Without People:

FOR THE PEOPLE, WITHOUT THE PEOPLE
DECENTRALIZATION AND GOVERNANCE IN BOGOTÁ, COLOMBIA
by
María Victoria Whittingham Munevar
B.S. Psychology, Universidad de los Andes, Bogotá 1995
Specialization in Human Resources Management, Universidad de los Andes, Bogotá 1996
Certificate in Latin American Studies, University of Pittsburgh, 2003
Submitted to the Graduate Faculty of
Graduate School of Public and International Affairs in partial fulfillment
of the requirements for the degree of
PhD in Public and International Affairs
University of Pittsburgh
2006
ii
UNIVERSITY OF PITTSBURGH
GRADUATE SCHOOL OF PUBLIC AND INTERNATIONAL AFFAIRS
This dissertation was presented
by
María Victoria Whittingham Munevar
It was defended on
February 9, 2006
and approved by
Burkart Holzner, PhD, Distinguished Service Professor of International Studies, Emeritus Professor of Sociology and Public and International Affairs
David Y. Miller, PhD, Associate Dean and Professor Public and Urban Affairs, Graduate School of Public and International Affairs
Dissertation Directors: Guy B. Peters, PhD, Maurice Falk Professor of American Government, Department of Political
Science, and Professor of the Graduate School of Public and International Affairs
Louis A. Picard, PhD, Professor International Development, Graduate School of Public and International Affairs

iii
Copyright © by María Victoria Whittingham Munevar
2006

iv
Para Bogotá y ciudades semejantes

v
ABSTRACT
FOR THE PEOPLE, WITHOUT THE PEOPLE
DECENTRALIZATION AND GOVERNANCE IN BOGOTÁ, COLOMBIA
María Victoria Whittingham Munevar
University of Pittsburgh, 2006
Cities are the distinctive space for humanity. At the end of the twenty first century, more people will live in urban areas of the developing world than are alive on the planet today. By the year 2020, more than 80 percent of Latin America’s population will be living in cities, adding significant pressure to already very unstable systems. The tensions resulting from the contradictions between the values of modernity and the practice of exclusion prevailing in the region have been identified as major threats to its political stability and economic development. In order to contribute to the search for appropriate solutions to the aforementioned problems, this dissertation addresses the relationship between decentralization and governance. A comparative political analysis of the process and impacts of implementing a decentralization reform in Bogotá, the capital of Colombia is presented. Three critical variables of good governance are assessed: participation, equity, and efficiency. Decentralizing reforms marked the political life of the region in the latest years of the twentieth century and the awakening of the new millennium; it was a policy championed by all sides of the political spectrum as the appropriate strategy for enhancing democracy and inclusion, and ultimately in good governance. Good governance refers to the capacity of a social and political system to create the minimum consensus required to organize and act based on a collective will. Evidence provided by this study shows puzzling results. There has been definite improvement in democratic governance, which cannot necessarily be attributed to decentralization, as decentralization in Bogota was not a systematic process of public policy implementation and presented many contradictions and inconsistencies. Nevertheless, this case also indicates that, despite limitations and contradictions, change may occur in an unsystematic manner; but also that increasing the constituents’ aspirations without providing the means to fulfill them may widen the gap between the citizens and the government. Previous and new forms of governance coexist in tension and the success or failure of the reform in the future depends, fundamentally, on how the system incorporates them. This study is a contribution to the literature on both decentralization and governance.

vi
TABLE OF CONTENTS
ABSTRACT.................................................................................................................................. V
ACRONYMS AND ABBREVIATIONS................................................................................... IX
PART I ........................................................................................................................................... 1
EXPLORING THE TERRAIN ................................................................................................... 1
1.0 INTRODUCTION CITIES AND GOVERNANCE IN THE URBAN MILLENIUM..... 2
2.0 THE REGIONAL CONTEXT: LATIN AMERICA........................................................... 9 2.1 URBANIZATION ................................................................................................................ 9 2.2 POVERTY AND INEQUALITY....................................................................................... 14
2.2.1 Poverty ......................................................................................................................... 15 2.2.2 Inequality ..................................................................................................................... 18
2.3 NEVER ENDING REFORMS ........................................................................................... 23
3.0 NATIONAL CONTEXT, COLOMBIA: A CONTINENTAL PUZZLE ........................ 28 3.1 VIOLENCE: A NATION ON THE RUN .......................................................................... 30 3.2 URBANIZATION: VERY LATE INTO THE PRIMACY PATTERN............................. 36 3.3 A SUCCESS STORY OF ECONOMIC PERFORMANCE: POVERTY AND INEQUALITY .......................................................................................................................... 39
3.3.1 Poverty ......................................................................................................................... 42 3.3.2 Inequality ..................................................................................................................... 45
3.3.2.1 Employment, unemployment & informality (quasi-employment) ....................... 48 3.4 REFORMS: MARKET DEVELOPMENT AND DEMOCRACY; OR, CAIN VS. ABEL?................................................................................................................................................... 53
3.4.1 New Liberalism: the market will create wealth for all ................................................ 54 3.4.2 The New Constitution: Let us reinvent the country ..................................................... 61
4.0 BOGOTÁ: IS A CITY CLOSE TO THE STARS, OR JUST FAR FROM HELL?...... 69 4.1 A NOTE ON VIOLENCE: HELL HAS SEVEN RINGS.................................................. 72 4.2 URBANIZATION: FROM RIVALING TO RULING ...................................................... 74
4.2.1 Running to the highlands: desplazados y marginales.................................................. 76 4.3 ECONOMIC PERFORMANCE......................................................................................... 78 FROM THE LAZY DUCK TO THE PRODUCTIVE SWAN ................................................ 78
4.3.1 Employment, Unemployment, Quasi-employment ....................................................... 80 4.3.2 Poverty and Inequality................................................................................................. 84
4.4 REFORMS: A PRIVILEGED CINDERELLA .................................................................. 88
PART II........................................................................................................................................ 91
CONCEPTUALIZING THE TERRAIN.................................................................................. 91
5.0: LITERATURE AND RESEARCH REVIEW .................................................................. 92
5.1 DECENTRALIZATION..................................................................................................... 93

vii
5.2 GOVERNANCE................................................................................................................. 96 5.2.1 Good Governance ........................................................................................................ 99 5.2.2 Urban Governance..................................................................................................... 104
5.3 DECENTRALIZATION AND GOVERNANCE: A CAUSAL OR CASUAL RELATIONSHIP? .................................................................................................................. 107
5.3.1 A note on research ..................................................................................................... 110
6.0 RESEARCH DESIGN AND METHODOLOGY ............................................................ 112 6.1 A COMPARATIVE STUDY: COMPARING RESULTS, UNDERSTANDING PROCESSES........................................................................................................................... 114
6.1.1 Questions and Hypothesis.......................................................................................... 116 6.1.2 Variables and Indicators: assessing changes in governance .................................... 118 6.1.3 Boundaries, Limitations, and Possibilities ................................................................ 123
6.2 THEORY AND PRACTICE: FROM THE LIBRARY TO THE FIELD AND BACK.... 124 6.2.1 Phases ........................................................................................................................ 124
6.2.1.1 Exploratory I ....................................................................................................... 124 6.2.1.2. Exploratory II:.................................................................................................... 125 6.2.1.3 Analysis I ............................................................................................................ 126 6.2.1.4. Fieldwork: .......................................................................................................... 126 6.2.1.5 Analysis II........................................................................................................... 127 6.2.1.6 Analysis III.......................................................................................................... 128 6.2.1.7 Dissemination: .................................................................................................... 128
PART III .................................................................................................................................... 129
DECENTRALIZATION AND GOVERNANCE IN BOGOTÁ........................................... 129
7.0 THE PROCESS OF DECENTRALIZATION THROUGH THEVOICE OF THE PEOPLE..................................................................................................................................... 130
7.1 ANTECEDENTS .............................................................................................................. 131 7.2 THE BEGINNING............................................................................................................ 135
7.2.1 The New Constitution and the City ............................................................................ 135 7.2.2 The City and the New Constitution ............................................................................ 138 7.2.3 The First Local Elections........................................................................................... 139
7.3 THE TRANSITION: LEARNING BY DOING............................................................... 143 7.3.1 Setting priorities: to decentralize or to govern?........................................................ 144 7.3.2 Decree 1421 of July 21, 1993-El Estatuto Orgánico................................................. 148
7.4 DECENTRALIZING UNDER THE 1421 ........................................................................ 153 7.4.1 The second generation of Ediles ................................................................................ 154 7.4.2 Politics of anti-politics: electing a mayor in 1994..................................................... 157 7.4.3 Stick and Carrots to “educate” ................................................................................. 158
7.5 POLITICS OF ADAPTATION, 1997-2000..................................................................... 171 7.5.1 The third generation of Ediles. A La Tercera va la Vencida ..................................... 173 7.5.2 Electing a mayor in 1997, further into politics of adaptation ................................... 175 7.5.3 The “urbanization” of the city................................................................................... 177
7.6 THE PROCESS OF DECENTRALIZATION. SUCCESS, FAILURE, OR BOTH?........ 189 7.7 POLICY ANALYSIS........................................................................................................ 204
viii
8.0 COMPARING RESULTS OR, TODO TIEMPO PASADO FUE PEOR ..................... 209
8.1 INTRODUCTION ............................................................................................................ 209 8.2 PARTICIPATION ............................................................................................................ 210
8.2.1 Participation: letter and practice .............................................................................. 212 8.2.2 Participatory Planning .............................................................................................. 218 8.2.3 Elections as Participation.......................................................................................... 220
8.2.3.1 Mayoral elections in Bogotá ............................................................................... 221 8.2.3.2 Council elections................................................................................................. 224 8.2.3.2 JAL elections ...................................................................................................... 230
8.2.4 Final remarks on participation.................................................................................. 236 8.3 EQUITY............................................................................................................................ 238
8.3.1 Poverty and Inequality............................................................................................... 239 8.3.2 Employment, unemployment and “el rebusque” ....................................................... 246 8.3.3 Social Investment ....................................................................................................... 251 8.3.4 Housing ...................................................................................................................... 260 8.3.5 Gender and Vulnerable populations.......................................................................... 265
8.3.5.1 Los Desplazados (IDPs)...................................................................................... 268 8.4 EFFICIENCY.................................................................................................................... 272
8.4.1 Economic growth ....................................................................................................... 272 8.4.2 Public finances........................................................................................................... 276
8.4.2.1 Income................................................................................................................. 277 8.4.2.2 Expenditure ......................................................................................................... 283 8.4.2.3 Public Debt.......................................................................................................... 286 8.4.2.4 Investment risk rates ........................................................................................... 288
9.0 FOR THE PEOPLE, WITHOUT THE PEOPLE DISCUSSION AND RECOMMENDATIONS.......................................................................................................... 290
9.1 LESSONS FROM THE STORY OF DECENTRALIZATION ........................................ 290 9.2 LESSONS ABOUT GOVERNANCE .............................................................................. 295 9.3 CONCLUSIONS............................................................................................................... 298 APPENDIX A: COLOMBIA, DISPLACEMENT ZONES ................................................... 301 APPENDIX B: EMPLOYMENT BY ACTIVITY.................................................................. 302 APPENDIX C: BOGOTA’S POPULATION GROWTH BY GENDER................................ 303 APPENDIX D: INTERNATIONAL AGENCIES DEFINITIONS ........................................ 304 APPENDIX E: INSTITUTIONS PROMOTING GOOD GOVERNANCE PROJECTS ...... 305 APPENDIX F: GOVERNANCE RESEARCH PROJECTS.................................................. 306 APPENDIX G: LIST OF ORGANIZATIONS ....................................................................... 306 APPENDIX H: LIST OF INTERVIEWEES........................................................................... 310 BIBLIOGRAPHY................................................................................................................... 312

ix
Acronyms and Abbreviations
AD-M19 Alianza Democratica- Movimiento 19 de Abril (Democratic Allegiance - Movement April 19th)
CELADE Centro Latinoamericano de Demografia (Latin American and Caribbean Demographic Centre)
CEPAL Comisión Económica para América Latina y el Caribe CLAD Latin America Center of Management for Development public administration
CODHES Consultoría para los Derechos Humanos y el Desplazamiento (Consult Office for Human Rights and Displacement), Colombia.
CORPOSUR Corporación Servicios Urbanos de Desarrollo
CPDIA Consulta Permanente para los Desplazados Internos en las Américas (Open Forum for internally displaced in the Americas)
D.C Distrito Capital (Capital District) D.E. Distrito Especial (Especial District)
DABS Departamento Administrativo de Bienestar Social (Social and Services Welfare Department)
DAMA Departamento Administrativo del Medio Ambiente (environemntal department)
DANE Departamento Administrativo Nacional de Estadistica (statistics authority, Colombia)
DAPD Departamento Administrativo de Planeacion Distrital (Bogota's Planning Deparment)
EAAB Empresa de Acueducto y Alcantarillado de Bogota Bogota's water and sewage public Company)
EAP Economic Active Population ECLAC Economic Commission for Latin America and the Caribbean ENH Encuesta Nacional de Hogares (Colombian National Census)
FARC Fuerzas Armadas Revolucionarias de Colombia (Colombian Revolutionary Army)
GDP Growth Domestic Produc GNP Gross National Product HABITAT United Nations Centre for Human Settlements HDI Human Development Index IADB Inter-American Development Bank IDP Internal Displaced Population
IDRD Instituto Distrital de Recreación y Deporte (Bogotá’s recreation and sports institute)
ILCG Instituto Luís Carlos Galán para el Desarrollo de la Democracia ILO International Labor Organization

x
ILPES Instituto Latinoamericano y del Caribe de Planificacion Economica y Social (Latin American and Caribbean Institute of Social and Economic Planning)
IOM International Organization for Migration JAL Junta Administrativa Local (Local Administrative Board) LI Indigence Line LP Linea de Pobreza (Poverty Line) NDP National Department of Planning, Colombia NBI- Necesidades Básicas Insatisfechas OECD Organization for Economic Co-operation and Development OHCHR Office of the United Nations High Commissioner on Human Rights OIT Organización Internacional del Trabajo PIB Producto Interno Bruto (Growth Domestic Product) PL Poverty Line
PNUMA Programa de Naciones Unidas para Medio ambiente (Union Nations Enviroment Programme)
PUJ Pontificia Universidad Javeriana SELA Sistema Economico Latinoamericano (Latin American Economic System) SDS Secreatría de Salud del Distrito (City’s Health Secreatriat) SHD Secretaria de Hacienda del Distrito SIPRI Stockholm International Peace Research Institute SISDEO National Department of Planning Social Indicators System
SISBEN Sistema de Selección de Beneficiarios para Programas Sociales (Social programs beneficiaries selection system)
SISDES Sistema de Información de Hogares Desplazados por Violencia ( Information system on displaced households)
TD Desempleo total (Total Unemployment) TGP Total Global Participation rate TO Total de Ocupados(Total Employment) UBN Unsatisfied Basic Needs UN United Nations UNCHR United Nations High Commissioner for Refugees UNCHS United Nations Center for Human Settlements UNDP United Nations Development Programme UN-ESCAP UN- Economic and Social Commission for Asian and the Pacific UNESCO United Nations Educational, Scientific and Cultural Organization USCR The U.S Committee for Refugees WAP Working Age Population

xi
LIST OF TABLES
Table 1: Latin America: natural population growth and foreign migration 1950-2005 ............... 11 Table 2: Rural-urban migration trends by gender, in six Latin American countries .................... 12 Table 3: Latin America: Urban/Rural Population, estimated and projected................................. 13 Table 4: Latin America poverty and indigence, 1980-2002 ......................................................... 15 Table 5: Urbanization of Poverty in Latin America, 1970-1999 .................................................. 16 Table 6: Median GINI Coefficients by Region and Decade......................................................... 18 Table 7: Income distribution gap in nine Latin American countries ............................................ 20 Table 8: Income polarization in Latin America............................................................................ 21 Table 9: Latin American Urban Employment, informal and formal sectors (%) ......................... 22 Table 10: Military Expenditure in Colombia 1988-2000 ............................................................. 32 Table 11: Colombia displaced population between 1985 and 2000 ............................................. 34 Table 12: Displaced and received population by Departamento.................................................. 35 Table 13: Colombia, percentages of urban and rural populations 1970-2000.............................. 36 Table 14: Percentage of the total population living in main cities (1950-2000) .......................... 38 Table 15: Colombia Evolution and Incidence of Poverty, 1972-1995 ......................................... 43 Table 16: Colombia: Population and Incidence of poverty in rural and urban areas ................... 44 Table 17: Colombia: Human Development Index adjusted by Income........................................ 47 Table 18: Inequality in Colombia: GINI Coefficient.................................................................... 47 Table 19: Employment and Unemployment Rates in seven Metropolitan Areas (1990s) ........... 50 Table 20: Informality rate in seven metropolitan areas ................................................................ 51 Table 21: Goods covered by Colombia’s Tariffs and Surcharges 1990 and 1992 ....................... 55 Table 22: Unemployment by Age- Total seven Metropolitan Areas 1991-2000 (September)..... 58 Table 23: Unemployment by level of education and gender, 2000 .............................................. 58 Table 24: Population natural growth and migration net rates 1970-2000 by quinquennia........... 75 Table 25: Bogotá’s share of the national population, 1973-2000................................................. 75 Table 26: Colombia: index of urban primacy 1950-1990............................................................. 76 Table 27: Bogotá: Displaced Population Increase ........................................................................ 77 Table 28: Participation of Bogotá in the National GDP by Sector, 1985-2000 (quinquennia) .... 79 Table 29: Bogotá’s total population and WAP growth rates ........................................................ 81 Table 30: EAP growth and participation by gender, 1976-1999 .................................................. 82 Table 31: Bogotá, Percentage below Poverty line and Indigence line, 1991-2000 ...................... 85 Table 32: Bogotá, population by strata, 1997-2000...................................................................... 86 Table 33: Governance main and secondary variables and indicators ......................................... 102 Table 34: Period covered and Administrations included in the study ........................................ 118 Table 35: Variables and Indicators ............................................................................................. 122 Table 36: Lists by Political Affiliation, JAL 1992 ..................................................................... 141 Table 37: Effectiveness in Local Elections, 1992....................................................................... 142 Table 38: Number of electoral lists by Political Affiliation, JAL 1992-1994 ............................ 155 Table 39: Effectiveness in Local Elections, 1994....................................................................... 156 Table 40: Participation in Local Planning, 1995 ........................................................................ 163

xii
Table 41: Number of electoral lists by Political Affiliation, JAL 1992 to 1997 ........................ 173 Table 42: Effectiveness in Local Elections, 1997....................................................................... 174 Table 43: People participating, number of projects and relative number of projects, 1998 ....... 183 Table 44: Laws promoting participation in Bogotá .................................................................... 212 Table 45: Formal organizations for local participation............................................................... 213 Table 46: Informal organizations for participation..................................................................... 214 Table 47: Participation in Local Planning .................................................................................. 219 Table 48: Taxonomy of elections for major in Bogotá 1988 – 2000.......................................... 222 Table 49: Participation in Council Elections 1988-2000............................................................ 225 Table 50: Political composition of the Council, 1988-2000....................................................... 226 Table 51: Number of electoral lists by political affiliation, Council 1988-2000........................ 228 Table 52: Electoral Efficiency of Political Parties and Movements, 1988-2000........................ 229 Table 53: Number of men and women in the Council, 1988-2000 ............................................ 230 Table 54: Number of list participating in local elections: 1992, 1994, and 1997....................... 231 Table 55: Level of abstention in Bogotá..................................................................................... 232 Table 56: Electoral participation in the localities ....................................................................... 233 Table 57: Electoral efficiency JAL elections.............................................................................. 233 Table 58: Political efficiency by political force in local elections.............................................. 234 Table 59: JAL composition by political affiliation..................................................................... 234 Table 60: Poverty in Bogotá, 1985-2000.................................................................................... 242 Table 61: GINI index, Bogotá and Colombia, 1988-2000.......................................................... 243 Table 62: Distribution of Income by Quintile in Bogotá, 1985-2000......................................... 244 Table 63: Working age population growth in Bogotá, 1980-1999 ............................................. 246 Table 64: Bogotá’s labor force structure, 1986-2000 ................................................................. 249 Table 65: Budget allocated to public social expenditures in Bogotá, 1980-1994 ...................... 252 Table 66: Life expectancy differential men and women, Bogotá 1990-2000............................. 256 Table 67: Mortality rate by age (per 10 thousand), Bogotá 1999............................................... 257 Table 68: Rate of repeating students by grade, Bogotá 1995-1999............................................ 259 Table 69: Housing deficit in Bogotá, Bogotá 1951-2001 ........................................................... 261 Table 70: Housing developers in Bogotá, 1981-1999 ................................................................ 262 Table 71: Housing price in Bogotá, 1981-1995.......................................................................... 263 Table 72: Settlements legalization program, 1997-2000 ............................................................ 264 Table 73: Families served by the UIAD in 1999 and 2000 ........................................................ 270 Table 74: Displaced families by locality, between 1999 and 2000 ............................................ 271 Table 75: Foreign Direct Investment, Bogotá 1975-1991 .......................................................... 275 Table 76: Risk Investment rates, Bogotá 1996-2000.................................................................. 289 Table 77: Bogotá’s population growth by gender....................................................................... 303 Table 78: Good governance, definitions..................................................................................... 304 Table 79: Research projects on Governance............................................................................... 306

xiii
LIST OF FIGURES
Figure 1: Rate of urbanization in the World’s regions ................................................................. 10 Figure 2: Latin America’s Youth migration ................................................................................. 12 Figure 3: Percentage of households in state of poverty ................................................................ 16 Figure 4: GINI index/per capita income in 13 Latin American countries, 1986-1998................. 19 Figure 5: GINI index in 15 countries in Latin America, late 1990s-early 2000s ......................... 19 Figure 6: Income distribution gap between professionals and informal workers, ........................ 23 Figure 7: Homicides in Colombia by quinquenium 1970-2000, plus 2001 and 2002.................. 31 Figure 8: Colombia’s displacement trend 1985-2000................................................................... 34 Figure 9: Population growth, national, urban and rural ................................................................ 37 Figure 10: Average GDP growth rate for Latin America and Colombia, 1980-1990 .................. 40 Figure 11: Average GDP growth rate for Latin America and Colombia, 1991-2000 .................. 40 Figure 12: Colombia: GDP per capita percentage growth and number of poor, 1980-2000........ 41 Figure 13: Colombia, GDP growth and number of poor, 1991-1996........................................... 42 Figure 14: Colombia’s Income Distribution gap, 1980-1999....................................................... 46 Figure 15: Unemployment rate by Income Deciles, 1996-2000................................................... 48 Figure 16: Unemployment rates by Head of Household and gender, 1976, 1984, 2003.............. 50 Figure 17: Percentage of EAP in the informal economy by gender ............................................. 52 Figure 18: Percentage of EAP in the informal economy by age................................................... 52 Figure 19: Colombia’s account balance 1986-2001 ..................................................................... 55 Figure 20: Colombia’s external debt, 1986-2001 ......................................................................... 56 Figure 21: Colombia’s sub-employment and unemployment rates 1991-2000............................ 57 Figure 22: Income by years of school 1986-2000 ........................................................................ 59 Figure 23: Colombia’s GDP growth rate and unemployment rate, 1986-2000............................ 60 Figure 24: Map of Bogotá and population in its 20 localidades.................................................. 70 Figure 25: Population growth rate by localidad ........................................................................... 70 Figure 26: Bogotá, homicides and vehicle accidents 1992-2002 ................................................. 73 Figure 27: Bogotá: incoming IDPs, 1994-2000............................................................................ 77 Figure 28: Bogotá’s GDP growth and Employment growth rates, 1986-2000 ............................ 80 Figure 29: Job market participation by gender ............................................................................. 82 Figure 30: Bogotá’s unemployment rate, 1986-2000 ................................................................... 83 Figure 31: Unemployment rate by gender, 1976-1999................................................................. 83 Figure 32: Colombia and Bogotá, people under poverty line PL ................................................. 85 Figure 33: GINI index for Colombia and Bogotá (not adjusted).................................................. 87 Figure 34: Research Design ........................................................................................................ 118 Figure 36: Civic Organizations per locality in Bogotá, 1998-2000............................................ 215 Figure 37: Average protests per year, before and after the reform............................................. 216 Figure 38: Protests in Bogotá, 1991-1999 .................................................................................. 217 Figure 39: Percentage participation in the City Council by political affiliation......................... 226 Figure 40: The relationship between bipartisanism and other parties, 1988-2000 ..................... 227 Figure 41: Number of electoral list by political affiliation, Council 1988-2000 ........................ 228 Figure 42: Gender participation in the City Council, 1988-2000 (percent)................................ 230 Figure 43: Political composition JAL......................................................................................... 235 Figure 44: Bipartisanism vs. other political forces at the JAL ................................................... 235 Figure 45: Trend of poverty by UBN in Bogotá, 1985-2000 ..................................................... 240

xiv
Figure 46: Trend in poverty by PL and UPL, 1991-2000........................................................... 241 Figure 47: Trend in poverty by HDI, 1991-2000........................................................................ 242 Figure 48: Quintile income distribution in Bogotá, 1985-2000.................................................. 244 Figure 49: Relationship between GDP and poverty in Bogotá, 1985-2000 ............................... 245 Figure 50: GPR by gender, 1976-1999 ....................................................................................... 247 Figure 51: EAP, participation by years of school, 1976-1999.................................................... 248 Figure 52: Employment and GDP growth, 1986-2000............................................................... 248 Figure 53: Unemployment and participation in the informal sector, 1988-2000 ....................... 250 Figure 54: Bogotá, informal sector 1988, 1992-2000................................................................. 251 Figure 55: TPE and PSE percentage of the GDP, Bogotá 1980-1994........................................ 253 Figure 56: (Left) PSE from 1985-1994, millions 1992; (Rigth) PSE from 1995-2000,............. 254 Figure 57: PSE by sector, 1980-1995 ......................................................................................... 254 Figure 58: Share of sector in PSE, Bogotá 1991-2000 ............................................................... 255 Figure 59: Life expectancy in Bogotá 1985-2000 ...................................................................... 256 Figure 60: Number of members of the Health Subsidized system, Bogotá 1995-2002 ............. 257 Figure 61: Education coverage, Bogotá 1985-1997 ................................................................... 258 Figure 62: Attrition rate by grade, Bogotá 1995-1999 ............................................................... 259 Figure 63: Quantitative relative deficit in Bogotá 1951-2001 .................................................... 262 Figure 64: Credits and units of Low Income Housing*.............................................................. 263 Figure 65: Water and sanitation service coverage in Bogotá, 1993-2000 .................................. 265 Figure 66: Bogotá: incoming IDPs, 1994-2000.......................................................................... 269 Figure 67: GDP percentage growth rate, Colombia and Bogotá 1991-2000............................. 273 Figure 68: Bogotá GDP participation in the national GDP, 1990-2000 ..................................... 273 Figure 69: Real GDP and annual percentage growth rate, Bogotá 1985-2000........................... 274 Figure 70: GDP composition of Bogotá, 1999 ........................................................................... 274 Figure 71: FDI in Bogotá, 1995-2000......................................................................................... 275 Figure 72: Export activity US$, Bogotá 1985-2000 ................................................................... 276 Figure 73: Central administration balance, Bogotá 1988-2000 .................................................. 278 Figure 74: Public income participation in GDP, Bogotá 1988-2000.......................................... 279 Figure 75: Transfer, taxes and capital participation in GDP, Bogotá 1988-2000....................... 280 Figure 76: Tax revenue in Bogotá 1986-2000 ............................................................................ 281 Figure 77: Tax revenue participation in total income, Bogotá 1988-2000 ................................. 282 Figure 78: Degree of dependency, Bogotá 1988-2000 ............................................................... 282 Figure 79: Investment participation in total expenditure, Bogotá 1988-2000 ............................ 283 Figure 80: Participation of functioning costs in total expenditure, Bogotá 1988-2000.............. 284 Figure 81: Debt service growth rate, 1988-2000 ........................................................................ 285 Figure 82: Expenditures allocated to debt service, Bogotá 1988 to 2000 .................................. 285 Figure 83: Total debt as part of the GDP, Bogotá 1986-2000 .................................................... 286 Figure 84: Capital flow, Bogotá 1986-2000 ............................................................................... 287 Figure 85: Debt service as a percent of fiscal revenue, Bogotá 1988-2000 ............................... 288 Figure 85: Colombia IDP zones.................................................................................................. 301 Figure 86: Colombia: employment by activity, 1985-2000........................................................ 302

PART I
EXPLORING THE TERRAIN ______________________________________________________________________________

2
1.0 INTRODUCTION
CITIES AND GOVERNANCE IN THE URBAN MILLENIUM
“The cities, with million of inhabitants, are unique to the current age and the most complex products of collective human creativity.” Gilbert et al. (1996, p.13)
Bogotá, the capital of Colombia, is the chosen locus for this study. It is a fragmented city,
spatially and in its representation. Modern spaces resembling suburban areas of industrialized
metropolis coexist with pre-modern rural areas lacking minimum conditions of health, housing
and sanitation (Rojas 2002). This dissertation addresses the relation between decentralization and
governance, two topics that have marked the political life of the region in the latest years of the
twentieth century and the awakening of the new millennium. The aim is to contribute to the quest
for good governance and democracy.
Cities are the distinctive space for humanity in the twenty first century. Looking ahead to the
end of the century, more people will be crowded into the urban areas of the developing world
than are alive on the planet today. Undoubtedly, this is meant to be the urban millennium
(HABITAT 2001). Nowhere is this statement more noticeable than in Latin America, which has
experienced the fastest urbanization of the developing areas in the world.
Between 1950 and 1990, Latin America went from being predominantly rural to
predominantly urban. By 2001, Latin America’s population was 75 percent urban and most of
the world’s 100 largest cities were housed there. By the year 2020, 81 percent of Latin America’s
projected 665 million people (539 million) will live in cities (UN-HABITAT 1996; HABITAT
2001a).
Latin America’s urbanization has been characterized by poorly ordered cities in which
economic growth has not ensured an equitable increase in the quality of life of their populations.
Data from the United Nations Economic Council for Latin America and the World Bank shows
that the absolute number of urban poor in the region increased from 44 to 126 million in the last

3
20 years (Morley 2001; World Bank 2000). Moreover, Latin America has the highest level of
inequality in the world (HABITAT 1997; HABITAT 2001). Many of the region’s prevalent
problems are reflected by Latin America’s administrative systems: persistent dependence, the
perpetuation of rigid and particularistic social structures, chronic economic vulnerability, weak
and unstable growth, social marginalization, low institutionalization and acute social polarization
(Peters and Pierre 2003, pp.531-532)
The contradictions between the values of modernity, prevalent in the region’s political
discourse, particularly in cities, and the practice of exclusion, create profound tensions that have
been identified as major threats to the region’s political stability, and its social and economic
development (Carrillo-Flórez and Binetti 2004; O'Donnell 1996; Ippolito-O'Donnell and
Markovitz 1996). In Latin America, the quest for good governance must include the
enhancement of democracy. Creating a discourse that is consistent with actions will ultimately
create inclusive environments.
Recognizing the central, and increasingly complex, role that cities play in development in
response to the increasing number of urban poor, the United Nations Human Settlements
Program, UN-HABITAT, launched the Global Campaign on Urban Governance in 1999. The
campaign aggregates and supports worldwide initiatives aimed at improving governance as a
means to achieve sustainable development. A previous UN-HABITAT report stated:
Making full use of the potential that cities have to offer requires good governance (UN-HABITAT 1996, p.240).
The campaign summarizes many initiatives that are based on the assumption that good
governance will bring necessary economic and social gains to cities, particularly of the
developing world (Satterthwaite 1999). Because it is at the local level that citizens are closer to
government, improving local systems of governance should strengthen and enhance democracy
(Restrepo Botero 1992).
The relationship between democracy and good governance is somewhat circular. It is
claimed that good governance improves democracy, and likewise, that principles of democracy
build good governance1. The relationship between good governance and decentralization is a
1 To the extent that the concept of good governance is used, in literature and in practice, as interchangeable with the concept of democratic governance(see for example, Jewson and MacGregor 1997, Institute on Governance 1998, 1999, 2000; Fukasaku and Hausmann 1998; Rodríguez and Winchester 1997; Domínguez and Lowenthal 1996).

4
derivation of the previous argument. As it is commonly argued that decentralization is key to
democracy, it must also enhance good governance.
Decentralization reforms marked the last three decades of the twentieth century for countries
in the east and the west, the north and the south. Arguments for decentralization came from a
diverse range of constituents (Manor 1999; Stren 2001). Neo-liberals viewed decentralization as
a means of reducing the state’s intervention on private business (Udehn 1996; Buchanan and
Tollison 1984; Buchanan, Rowley, and Tollison 1987; Buchanan and Musgrave 1999; Buchanan
1988, 1986; Angell, Lowden, and Thorp 2001). Those in search for equity, and disappointed by
the performance of the state in securing a fair distribution of wealth, saw decentralization as a
possibility for re-distributing power (López-Murphy 1995; Litvack, Ahmad, and Bird 1998).
Many condemned the centralized government for impotence and waste, and identified
corruption, clientelism and political alienation as natural by-products of a distant bureaucracy. This
line of reason also advocated the decentralization of political authority and public resources to sub-
national levels of government as a general cure for these ills (Faguet 1997, p.2). Finally, many
international organizations claimed that decentralization was the solution for filling the gap and
finally achieving both growth and development (Reilly 1995; Escobar and Alvarez 1992;
Cochrane 1983). By the early 1990s, most countries were engaged in decentralization reforms
(Stren 2001; Freire and Stren 2001).
Decentralization entailed the emergence of new mechanisms of organizing and representing
various interests. In consequence, a new set of definitions of what is public and what emerged to
encompass these new arrangemnets (UNESCO-MOST 2002). Undoubtedly, decentralization has
greatly impacted the systems of governance, which include governments and state agencies on
the one hand, and communities and social groups on the other (Stren and Bell 1994).
What is not so clear is the significance of these impacts and the reasons underlying the
differences and similarities of in the outcomes of the reform. Despite the fact that many studies
have been conducted to evaluate the results of decentralization reforms, not necessarily regarding
governance, the debate is very much alive (CEPAL and PNUMA 2001). For once, many claim
that there is not enough empirical evidence to show that decentralization enhances democratic
governance. On the other hand, important questions regarding the positive impact of
decentralization on good governance have been raised (CLAD 2000, 1998; Dethier 2000).

5
The literature and research review reveal that further exploration of three elements might be
critical for understanding impacts and limitations of the decentralization reforms in regards to
(good) governance:
1. Pre-existing conditions of governance and how they affect the implementation of
decentralization; for example it is not the same to implement a decentralization
reform in a newly democracy than in a consolidated federal republic.
2. The level of governance in which decentralization is implemented; for example, it is
different to decentralize from the national to the regional or local level, that within a
local unit of governance.
3. The process of implementation itself; each context demands accommodations and
flexibility from the original recipe in order to succeed. By analyzing the
implementation process, it is possible to understand and learn from differences in
impacts and results of the reform in every different context.
This study aims to contribute to this debate by presenting a comparative political analysis of the
process and impacts of implementing a decentralization reform in Bogotá, the capital of
Colombia. By examinining the process of implementation, we can unveil the complex dynamics
of change, for it is in the field that prescriptions and theories are refined and corrected. The study
also compares the structure and performance of the system of governance before and after the
decentralization reform, in regards to three key variables: participation, equity and efficiency.
Of all the Latin American countries, Colombia is one of the most intriguing for outsiders as
well as insiders. Its politics, economy and cultural characteristics are somehow difficult to fit in
known categories. David Bushnell, an American historian, claims that Colombia’s political
history is very attractive, as it deviates from the models used in discussions of Latin America
(Bushnell 1993, p. viii). Harvey Kline, an American political scientist, has written on the
contradiction between the country’s apparent political stability and the prevalence of political
violence (Kline 1999, 1995, 1994). John Williamson, a researcher from the Institute for
International Economics, concluded that Colombia was the most atypical of all the countries
analyzed in a 13 countries comparative study (Williamson 1994).

6
Estanilao Zuleta, a Colombian philosopher, psychologist, and political thinker, mentioned
that if one thinks of the permanent violence that the country has endured for more than fifty
years, as well as in its political and economic performance, one might conclude that the country
represents an unsolvable puzzle (Zuleta 1991). Maybe the most important political milestone of
the late twentieth century was the endorsement of a New Constitution in 1991, after a quite
interesting political process. The New Constitution aimed at heartening a more democratic and
inclusive nation.
The new constitutional charter had particular provisions for Bogotá, including major goals
regarding decentralization. In 1993, following the constitutional mandate, a new statute for the
city was approved and a new tier of governance was introduced, the Juntas Administradoras
Locales-JAL (Local Administrative Boards). This accompanied major changes in the political
and programmatic roles of the alcaldes locales (local mayors).
Bogotá may well be a puzzle within a puzzle; many believe that Bogotá is the most
successful example of decentralization in the country (see, Rojas 2002, p.28; DNP 2002, p.39).
Many say it is the only one, and others that the process did not start at all (Jiménez Benítez 2001;
Moreno Ospina 1997)2. What is certain is that Bogotá was the first case of decentralization
within a city, and that, as mentioned by Pedro Santana, a Colombian researcher, the city is a
microcosm of the political and administrative challenges affecting all of Colombia’s cities
(Santana R. 1997). An additional characteristic of Bogotá is that it has not been affected by the
country’s violence to the same extent than any other city; therefore, violence is not a determinant
factor in this study, which could treathen its generalizability.
The case of Bogotá is an interesting story of political and structural change that provides
empirical evidence for literature concerning (good) governance and decentralization. Overall,
Bogotá is a city of the twentieth-first century that illustrates the complex challenges faced by
most cities, particularly in the developing world.
The main questions for this study are:
What is the story of the process of implementing decentralization and what are the
lessons to be learned from it?
2 This argument was also mentioned in the interviews conducted for this study, and in public debates regarding decentralization. For more on the debates visit: www.univerciudad.net

7
What is the impact of decentralization on the governance of the city:
→ Is it more participative?
→ Is it more inclusive?
→ Is it more efficient?
Has decentralization enhanced the city’s institutions?
What has changed, and why or why not?
In order to answer these questions, a combination of qualitative and quantitative research
strategies were used. A compilation of existing documents regarding the process and the data
required was conducted. Thirty one interviews with key informants were recorded. The study
also includes a time series analyses of the last two decades that examines five indicators for each
of the three variables: participation, equity, and efficiency.
The main findings are:
Decentralization has not been a systematic and consistent process of public policy
implementation; it is difficult to precisely conclude whether these changes could
be attributed to it.
Previous and new forms of governance coexist in tension, and the success or
failure of the reform has a lot to do with how the system incorporates pieces of
both.
Pre-existing social and political conditions were often ignored, which deeply
influenced the results of the reform. For the same reason, the social capital
accumulated in pre-existing forms of organization and participation could be lost
if unrecognized.
This case provides evidence supporting the claim that the level and size of the
political space in which decentralization’s policies are implemented is an
important element to consider. Cities might be use and studies as laboratories fro
democracy.
There are significant and interesting adjustments in Bogotá’s system of
governance, though their sustainability is unclear. It is unclear whether pre-

8
existent political institutions will absorb the adjustments, or if the system will
remain open to new players and new rules.
Citizens perceived decentralization as a positive element toward democratization
and inclusion, regardless of how this is contrary to empirical evidence. The
promises of a government more accessible, closer to its constituencies, and a more
equitable distribution of power were able to convince the citizens of
decentralization’s virtues, at least for now.
Citizens are more politically active than before, and surveys show that they trust
more in the government. Nevertheless, their activism has not yet produced real
changes in the political arena.
This study is presented in three parts. Part one defines the practical terrain in which this study
took place, including a general introduction exploring the regional context in chapter 2.0 Latin
America, and the national context in chapter 3.0 Colombia. This introduction aims helping the
reader to understand the problems motivating this study and its design. Chapter 4.0 presents a
general introduction to Bogotá, the chosen arena for the field work.
Part two presents the conceptual boundaries of the study. Chapter 5.0 reviews relevant
literature and research on the main concepts of this study: the relationships between
decentralization and governance. Chapter 6.0 presents the research design and methodology.
Part three presents the results of the study. Chapter 7.0 tells the story of the process of
implementing decentralization and its complexity. Chapter 8.0 presents the comparison of the
system of governance before and after the decentralization reform based on three variables,
participation, equity and efficiency. Finally, chapter 9.0 presents the conclusions, any
unanswered or raised questions, and some recommendations for Bogotá, and ideally any other
city in the developing world, to possibly use for enhancing good governance.
This study is a contribution to both the literatures on decentralization and governance. The
dream beneath is a Latin America free of poverty and inequality.

9
2.0 THE REGIONAL CONTEXT: LATIN AMERICA
“The administrative reform may be a world trend, yet its circumstances, outcomes and effects are region and country specific and are conditioned by the current pattern, as well as legacy, of state society relations.”
J. Nef (1995)
Bogotá is a complex and interesting case for illustrating the pressures and challenges faced by all
cities in Latin America and possibly in the third world. But, it also illustrates the relevance of the
particular context in which any new policy is introduced. To understand how the particular case
of Bogotá relates to the regional trends, and how it contributes to the understanding of common
problems, one must review and understand the major challenges that have affected Latin
America in the late twentieth century.
Three interconnected elements explain, to some extent, those challenges, and lie underneath
the promotion of decentralization and the quest for good governance in the region:
1. The characteristics and causes of the process of urbanization;
2. The regional level of poverty and inequality; and
3. The political and economic changes that occurred, or began, during these decades.
2.1 URBANIZATION
The region’s pattern of urbanization has been characterized by pronounced urban primacy3:
urban primacy is a situation in which one city, usually the capital, houses a large percentage of
the national population, has by far the best services infrastructure, serves as the financial,
3 Urban primacy is usually measured by the primacy index, which is the ratio of the population of the largest city to the total urban population of the country Mohan, 1994:38.

10
industrial and commercial center, and dwarfs the nation’s next largest urban place (Greenfield
1994, p. xv). According to Greenfield, despite the fact that contemporary Latin American cities
have a more powerful and organized working class and an expanding middle class, they remain
the site of massive inequality and jarring contrasts between rich and poor (Greenfield 1994, p.
xvi).
The concentration of power during colonial times in a main city, the amazing distance
between rural and urban development, and achievements in demographic indicators explain to a
certain extent the level of urbanization in the region. Of all the regions in the world, Latin
America experienced the fastest process of urbanization in world history; it went from being
predominantly rural to predominantly urban between 1950 and 1990.
By 1965, eight out of sixteen countries had already crossed the urban threshold (50% of the
total population in cities): Argentina, Brazil, Chile, Colombia, Mexico, Peru, Uruguay and
Venezuela. At the end of the 1980s, all but Costa Rica, El Salvador, Guatemala and Honduras
had crossed the rural-urban divide. By 1990, most countries with more than a million inhabitants
had more than half their population living in urban areas.
By 2001, Latin America’s population was 75 percent urban, and was home to most of the
world’s 100 largest cities. By the year 2020, 81 percent of its projected total population (539
million of 665 million) will live in cities (UN-HABITAT 1996; HABITAT 2001). Figure 1
compares the urbanization rates of Latin America, Europe, and the world.
R a te o f u rb a n iz a t io n
1990
1990 19
90
2 00 0
2 00 0
2 00 0
0
2 0
4 0
6 0
8 0
1 0 0
W o rld L a t in A m e ric a E u ro p e
Source: regional fact sheet from the World Development Indicators 2005.
Figure 1: Rate of urbanization in the World’s regions

11
Natural growth and internal migrations are central elements for understanding the pace of Latin
America’s urbanization, while foreign migration accounts as a major element only for few
countries in the region. From the first wave of foreign migrants, mostly Europeans, that occurred
between 1870 and 1913, Argentina was the country that received the biggest share, followed by
Uruguay, Cuba, Mexico and Chile. The second wave of immigrants started around 1950.
Argentina again received the most immigrants. Since 1970 there has not been a significant
foreign migration to Latin America (Solimano 2003).
Regarding natural growth, the region’s life expectancy improved from 52 to 70 years in the
second half of the twentieth century (Chackiel 2000, p.12). Additionally, between 1950 and
2005, the average population natural growth rate in Latin America has grown an estimated 23.1
percent per year. It is projected that the urban population will grow 77 million in the first decade
of the twentieth first century (Jordán F and Simioni 1998, p.40).
Table 1 presents total population growth, including natural increase and foreign migration,
from 1950 to 2005 (projected).
Table 1: Latin America: natural population growth and foreign migration
1950-2005
Quinquennia 1950-2005 1950- 1955- 1960- 1965- 1970- 1975- 1980- 1985- 1990- 1995- 2000-
Demographic indicators 1955 1960 1965 1970 1975 1980 1985 1990 1995 2000 2005Natural increase Annual increase (in thousands) 4,542 5,446 6,469 7,006 7,558 8,163 8,346 8,455 8,390 8,274 8,107Natural growth rate (per thousand) 26.4 27.6 28.6 27.0 25.7 24.6 22.5 20.6 18.7 16.9 15.4Foreign migration Annual migration (in thousands) 98 -60 -172 -231 -244 -364 -554 -587 -553 -465 -430Migration rate (per thousand) 0.6 -0.3 -0.8 -0.9 -0.8 -1.1 -1.5 -1.4 -1.2 -1.0 -0.8Total increase Annual increase (in thousands) 4,640 5,386 6,297 6,775 7,314 7,799 7,791 7,868 7,837 7,809 7,677Total growth rate (per thousand) 27.0 27.3 27.8 26.2 24.9 23.5 21.0 19.2 17.4 16.0 14.6Table built with 2003 data from the ECLAC-CELADE website: http://www.cepal.org/estadisticas/
The flow of population moving from rural to urban areas was, and still is, a major cause of
the reduction of the population in rural areas. It is estimated that in the last 15 years of the
twentieth century, 15.5 million rural youths (aged 15 to 29) enlarged the population of Latin

12
America’s cities by 16.5%, while the young rural population has got smaller by nearly one third
during the same period (Bárcena 2000, p.18). Table 2 and Figure 2 illustrate this regional trend.
Table 2: Rural-urban migration trends by gender, in six Latin American countries
Percentage of urban population growth accounted for by migration or reclassification, by sex Country and reference period Female Male Brazil, 1980-1990 42.7 % 41.2 % Brazil, 1990-1995 34.5 % 33.1 % Chile, 1982-1992 10.7 % 7.6 % Guatemala, 1984-1994 44.3 % 43.0 % Mexico, 1980-1990 33.9 % 33.9 % Mexico, 1990-1995 24.4 % 24.0 % Nicaragua, 1985-1995 31.4 % 28.0 % Uruguay 1986-1996 32.1 % 36.4 % Source: ECLAC, on the basis of official census data, as presented by Bárcena (2000, p.17).
As presented by Bárcena, (2000, p.18)
Figure 2: Latin America’s Youth migration
13
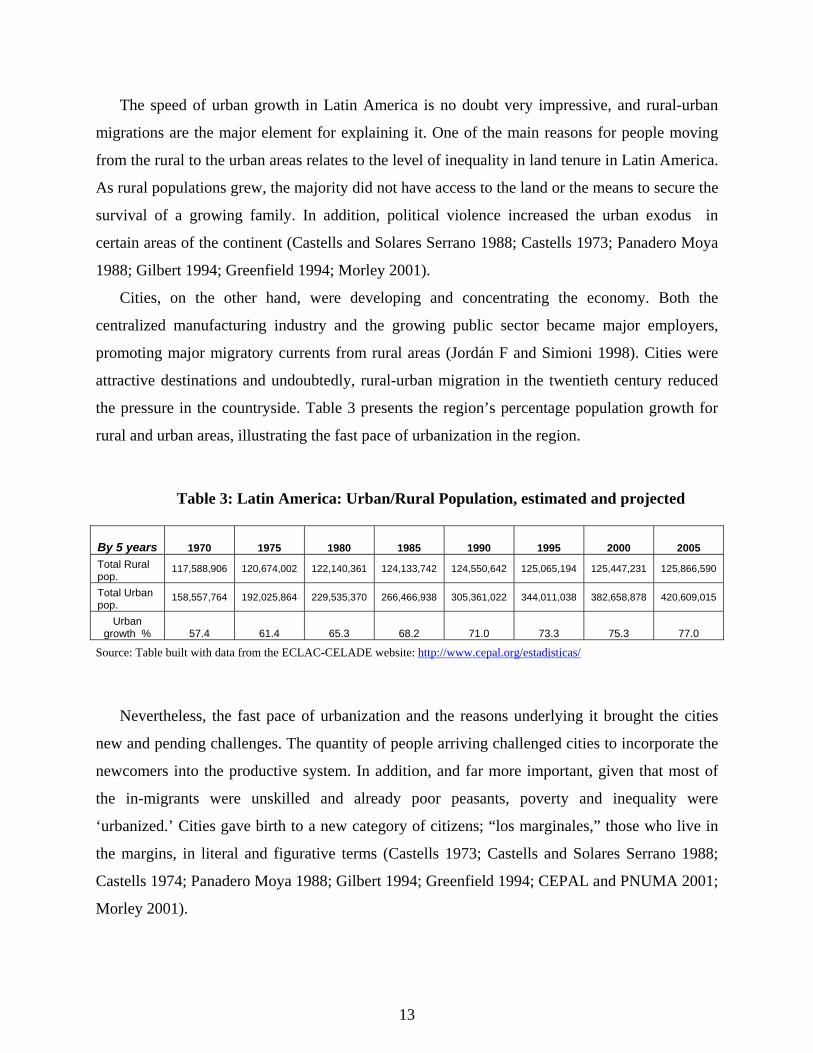
The speed of urban growth in Latin America is no doubt very impressive, and rural-urban
migrations are the major element for explaining it. One of the main reasons for people moving
from the rural to the urban areas relates to the level of inequality in land tenure in Latin America.
As rural populations grew, the majority did not have access to the land or the means to secure the
survival of a growing family. In addition, political violence increased the urban exodus in
certain areas of the continent (Castells and Solares Serrano 1988; Castells 1973; Panadero Moya
1988; Gilbert 1994; Greenfield 1994; Morley 2001).
Cities, on the other hand, were developing and concentrating the economy. Both the
centralized manufacturing industry and the growing public sector became major employers,
promoting major migratory currents from rural areas (Jordán F and Simioni 1998). Cities were
attractive destinations and undoubtedly, rural-urban migration in the twentieth century reduced
the pressure in the countryside. Table 3 presents the region’s percentage population growth for
rural and urban areas, illustrating the fast pace of urbanization in the region.
Table 3: Latin America: Urban/Rural Population, estimated and projected
By 5 years 1970 1975 1980 1985 1990 1995 2000 2005 Total Rural pop.
117,588,906 120,674,002 122,140,361 124,133,742 124,550,642 125,065,194 125,447,231 125,866,590
Total Urban pop.
158,557,764 192,025,864 229,535,370 266,466,938 305,361,022 344,011,038 382,658,878 420,609,015
Urban growth % 57.4 61.4 65.3 68.2 71.0 73.3 75.3 77.0
Source: Table built with data from the ECLAC-CELADE website: http://www.cepal.org/estadisticas/
Nevertheless, the fast pace of urbanization and the reasons underlying it brought the cities
new and pending challenges. The quantity of people arriving challenged cities to incorporate the
newcomers into the productive system. In addition, and far more important, given that most of
the in-migrants were unskilled and already poor peasants, poverty and inequality were
‘urbanized.’ Cities gave birth to a new category of citizens; “los marginales,” those who live in
the margins, in literal and figurative terms (Castells 1973; Castells and Solares Serrano 1988;
Castells 1974; Panadero Moya 1988; Gilbert 1994; Greenfield 1994; CEPAL and PNUMA 2001;
Morley 2001).

14
2.2 POVERTY AND INEQUALITY
Poverty in Latin America is a structural phenomenon that affects close to 250 million people and
is aggravated by the high level of inequality in the region, as wellas by the fact that poverty is not
a direct result of the lack of economic growth (Carrillo-Flórez and Binetti 2004; HABITAT
2001). This last phenomenon is what puzzles observers. Poverty has not been reduced although
Latin America has had significant economic growth for most of the twentieth century.
Between 1950 and 1980, Latin America had considerable economic accomplishments. Per
capita income grew at an average of 2.7 percent per year, and the accumulation of capital
averaged over 6 percent per year (Ippolito-O'Donnell and Markovitz 1996, p.1). Later, the
economic recession of the 1980s, known as the oil crisis in the north and as the debt crisis in the
south, deeply affected the region further increasing inequality, and, even more, poverty (Ippolito-
O'Donnell and Markovitz 1996). During the 1990s, Latin America experienced a new surge of
growth. GDP grew at a higher rate than it had during the previous decade; 3.2% per year
between 1990 and 2000, compared with 1% during the 1980s (Bárcena 2000, p.35).
Despite changes in economic performance, inequality has been a stable phenomenon in Latin
America in times of prosperity and in times of crisis. Before the debt crisis, the region already
had the most inequitable income distribution and the highest level of poverty relative to its
income of any area in the world (Morley 1995:vii). It appears that the issue is not necessarily the
availability of resources, but the unequal distribution of them. As established by several studies,
the prevalence of poverty is related more with exclusion than with the absence of resources
(Lustig and Deutsch 1998; Cárdenas S. and Lustig 1999; Burki, Aiyer, and Hommes 1998;
United States 1991; United States 1996, 1999; Deininger and Squire 2002).
In 1995, Lopez-Murphy stated that, due to the persistence of inequality, had Latin America
reached the levels of macroeconomic stability achieved by industrial economies, roughly 25
percent of poor people in the region would have been lifted out of poverty (López-Murphy
1995). In 1998, Lustig and Deutsch established that the value of transfers needed to eradicate
extreme poverty immediately would be, for the majority of countries, between 0.5% and 1% of
GDP. They concluded that what was actually needed in the region was not economic resources
but the political will to overcome poverty (Lustig and Deutsch 1998). In the year 2000, Attanasio

15
and Szekely established that if there were a more equitable distribution of income, poverty would
not be so prevalent in Latin America (Attanasio and Székely 2000).
2.2.1 Poverty
The region has had an endemic presence of poverty for most of the twentieth century; in the
1990s, its levels of poverty were higher than in the early 1970s or during the debt crisis of the
1980s4. In 1969, a World Bank study estimated that 11 percent of Latin America’s population
lived under the poverty line of $50 dollars income per year (Morley 1995, p.4). In 1980, 35% of
households were in a state of poverty. In other words, 35 of every 100 households in the region
lacked the resources to meet their basic needs, while 14 could not even afford a basic food basket
(ECLAC 2002; United Nations 2002). That proportion rose to 41% in 1990, and in 1994 the
figure was still as high as 39% (Ocampo 1998, p.1). By 1999, the number of people living in
poverty increased to more than 211 million; and, according to ECLAC, it is estimated that by the
year 2002, they were 224 million poor in Latin America (Ocampo and Martin 2003, p.231).
Table 4 and figure 3 illustrate this trend.
Table 4: Latin America poverty and indigence, 1980-2002
Percentage of Population
Poor (PL) 5 Indigent (bellow PL) Years National Urban Rural National Urban Rural 1980 40.5 29.8 59.9 18.6 10.6 32.7 1986 43.3 35.5 59.9 20.7 13.5 36.0 1990 48.3 41.4 65.4 22.5 15.3 40.4 1994 45.7 38.7 65.1 20.8 13.6 40.8 1997 43.5 36.5 63.0 19.0 12.3 37.6 1999 43.8 37.1 63.7 18.5 11.9 38.3 2000 42.5 35.9 62.5 18.1 11.7 37.8 2001 43.2 37.0 62.3 18.5 12.2 38.0 2002 44.0 38.4 61.8 19.4 13.5 37.9
Source: ECLAC- Statistical and Economic Division.
4 Although the available data shows inconsistencies, the differences are not significant to question this statement. 5 According to ECLAC, poverty lines represent the minimum income required for members of a household to meet their basic needs; they are estimated from the cost of a basic food basket plus the estimated amount of resources required by households to meet their basic non–food needs. The indigence line represents the cost of the food basket; people who are indigent (or extremely poor) are those who live in households whose incomes are so low that even if they spent all their money on food, they would not be able to meet the nutritional needs of all their members (ECLAC 2002).

16
Source: José Antonio Ocampo (1998, p.2)
Figure 3: Percentage of households in state of poverty
The distribution of Latin America’s poor population changed proportionally to urbanization,
as more people moved to cities, the number of poor raised as well, a phenomenon referred to as
the urbanization of poverty. According to data from ECLAC, the number of urban poor
increased from 44 to 134 million between 1970 and 1999. By the end of the 1990s, six out of ten
poor lived in urban areas (ECLAC-HABITAT 2000; Bárcena 2000). Table 5 presents data that
illustrate the urbanization of poverty in the region from 1970 to 1999.
Table 5: Urbanization of Poverty in Latin America, 1970-1999
Poor Population
1970 1980 1986 1990 1994 1997 1999
Total 119,800 135,900 170,200 200,200 201,500 204,000 211,400 Urban 44,200 62,900 94,400 121,700 125,900 125,800 134,200 Rural 75,600 73,000 75,800 78,500 75,600 78,200 77,200
Urbanization of poverty 36.9% 46.3% 55.5% 60.8% 62.5% 61.7% 63.5%
Source: CEPAL2000c, and ECLAC-CELADE website: http://www.cepal.org/estadisticas/
During this period, socio-spatial segmentation became extremely pronounced in Latin
American cities. As high-income groups moved into exclusive residential areas, the poor were
driven out of some of the best urban areas. This socio-spatial segmentation has weakened the

17
traditional integration mechanisms —public education, public health systems, central areas for
recreation and culture— that used to exist in Latin America’s cities (Bárcena 2000).
Additionally, tensions created by inequality grew deeper in cities as more people were exposed
to the ideals of progress and modernization that prevail in the urban discourse (ECLAC-
HABITAT 2000; Bajraj, Villa, and Rodríguez 2000; Arriagada 2000).
Children and women are the most vulnerable among the poor. Children under 17 endure the
most poverty; almost 44 percent of all children, compared to 27.7 percent of adults and 28.6
percent of the elderly, live in poor households. Low educational level and insufficient income of
parents, especially mothers, are major determinants of child poverty and provide decisive links in
its transmission across generations (Bouillon and Buvinic 2003, p.2).
Children and young people belonging to poor households often have deficient educational
environments, begin working at an early age or, in many cases, neither study nor work (United
Nations 2002; ECLAC-HABITAT 2000). In the case of women, all the economic indicators,
including employment, unemployment, income, property ownership and job positions, show that
they are discriminated against. In Latin America, women’s incomes are 50% lower than men’s
(Gálvez 2000). Particularly concerning is the situation of single mothers; in urban settings,
poverty is higher among female heads of household (30.4 percent) than among their male
counterparts (25 percent) (Bouillon and Buvinic 2003, p.2).
According ECLAC, most of the poor in Latin America:
- do not have access to drinking water;
- live in crowded dwellings where there are more than three persons per room;
- belong to households with a high degree of demographic dependency6 and low
density of employment;
- have a head of household who has completed less than three years of schooling and
is often unemployed or underemployed;
- aren children and women (United Nations 2002).
Poverty, as illustrated by this description, is not only about income, it is about differences in
resources, access to services, vulnerability, power and social status. It is about inequality.
6 Refers to the number of dependants per houseld.

18
2.2.2 Inequality Adding to the depth of the poverty problem, inequality is one of the region’s salient and most
steady characteristics; the fruits of economic growth in the region have usually gone to those
who already have, and too little has trickled down to those in need (Morley 2001). Latin
America’s unequal income distribution, access to services and power, make it the most unequal
region in the world, as measured by the GINI index7. In Europe and North America the GINI
index is 29 and 36.1 respectively, while in Latin America it averages 51 (De Ferranti 2004).
Additionally, a World Bank study showed Latin America to be nearly 10 points more unequal
than Asia (Wodon and Ayres 2000).
Table 6 presents a comparison of the Gini index by regions in the world, for four decades, to
illustrate the persistence of inequality in the region.
Table 6: Median GINI Coefficients by Region and Decade
Decade Region 1960s 1970s 1980s 1990s
Eastern Europe 25.1 24.6 25 28.9 South Asia 36.2 33.9 35 31.9 OECD and high income countries 35 34.8 33.2 33.7 Middle East and North Africa 41.4 41.9 40.5 38 East Asia and Pacific 37.4 39.9 38.7 38.1 Sub-Saharan Africa 49.9 48.2 43.5 46.9 Latin America 53.2 49.1 49.7 49.3
Source: Klaus Deininger and Lyn Squire (2002)
Although the deterioration of income during the 1980s could be attributed to the debt crisis,
recent studies estimated that inequality continued throughout the 1990s, despite the region’s
economic recovery (Cárdenas S. and Lustig 1999; Burki, Aiyer, and Hommes 1998; Deininger
and Squire 2002; Londoño and Székely 1997; De Ferranti 2004).
7 The GINI index, measures the extent to which the distribution of income (or, in some cases, consumption expenditure) among individuals or households within an economy deviates from a perfectly equal distribution. The scale goes from zero representing perfect equality to 100 representing perfect inequality (World Development Report, 2000:276).

19
Figure 4 illustrates the average GINI index for thirteen Latin American countries, from 1989
to 1998, which when adjusted by population is over the estimated average of 51 points.
Source: (De Ferranti 2004, ch.2)
Figure 4: GINI index/per capita income in 13 Latin American countries, 1986-1998
The GINI index deteriorated during the last twenty years of the twentieth century. Figure 5
illustrates the situation for fifteen countries at the end the 1990’s. The consensus is that income
distribution stayed about the same, or even worsened after 1990.
Source: De Ferranti, chapter 2:10
Figure 5: GINI index in 15 countries in Latin America, late 1990s-early 2000s

20
According to a recent publication of the World Bank, the richest 10 percent of individuals
receive between 40 and 47 percent of the total income in most Latin American societies, while
the poorest 20 percent receive only between 2 and 4 percent. Furthermore, it mentions that the
most distinctive attribute of Latin American income inequality is the extraordinarily large
concentration of income at the very top of the distribution (De Ferranti 2004, p.2). Table 7
illustrates the income distribution of nine countries.
Table 7: Income distribution gap in nine Latin American countries
Year GINI Index
Share of highest 10% in
total income
Share of lowest 20% in total income
Ratio of incomes of 10th to 1st.
Decile Brazil 2001 59.0 47.2% 2.6% 54.4%
Guatemala 2000 58.3 46.8% 2.4% 63.3% Chile 2000 57.1 47.0% 3.4% 40.6%
Mexico 2000 54.6 43.1% 3.1% 45.0% Argentina 2000 52.2 38.9% 3.1% 39.1% Jamaica 1999 52.0 40.1% 3.4% 36.5%
Dominican Republic 1997 49.7 38.6% 4.0% 28.4%
Costa Rica 2000 46.5 34.8% 4.2% 25.1% Uruguay 2000 44.6 33.5% 4.8% 18.9%
Source: data from table 1 in “Inequality in Latin America: breaking with history?” (UNDP 2003)
To provide a better idea about the extent to which income is polarized in Latin America, in a
study for the World Bank, Londoño and Székely estimated the average income of the poorest and
richest 1% of the population. According to the authors, in 1970, the top percentile earned 363
times more than the lowest percentile. The gap was reduced somewhat during the 1970s, but in
the 1980s, the income of the poorest 1% remained stable, while the income of the richest 1%
increased by almost 50%. During the 1990s, the gap expanded to such an extent that by 1995 the
richest 1% registered an average income 417 times more than the poorest 1% (Londoño and
Székely 1997, p.11).
Table 8 presents the income gap from the 1970s to the 1990s.

21
Table 8: Income polarization in Latin America
Year Subgroup 1970 1975 1980 1985 1990 1995
Poorest 1% $112 $170 $184 $193 $180 $159 Richest 1% $40,711 $46,556 $43,685 $54,929 $64,948 $66,363
Income Ratio 363 274 237 285 361 417 Source: Londoño and Székely (1997, p.12)
Nevertheless, it is certain that the debt crisis of the 1980s aggravated the problem of poverty
and exclusion in the region, as economic changes greatly affected the labor market.
Between 1980 and 1989, the overall gross national product declined by 8.3 percent, and the
external debt climbed from $60,000 million (USD) in 1970 to $410,000 million in 1987 (Bueno
Sánchez, Farah H, and Nápoli 1994; Morley 1995; Halebsky and Harris 1995). 8 As a result,
during the 1980s many industries went out of business, the central government was reduced, and
the ability of the formal sectors to generate productive employment declined, worsening the
labor market problems (Weller 2000).
The impact was largest in the cities, which had a significant increase in the number of people
unemployed, and the consequently enlargement of the so-called informal sector (Panadero Moya
1988; Campbell 2003; Gilbert 1994; Stallings and Peres 2000; United Nations 1989; Halebsky
and Harris 1995).9 Data from the International Labor Organization show that the numbers
employed in the informal sector- self-employed workers, unpaid family workers and workers
employed in microenterprises and domestic service, increased from 25.6 per cent in 1980 to 30.8
percent in 1990.
Regrettably enough, the recovery of the economy did not have a positive impact on the labor
market, and informality continued growing during the 1990’s. Between 1990 and 1998, the
informal sector generated six out of every 10 new jobs. At the end of the 1990s, 48 of every 100
urban workers were ‘informal’, and only 1 out of 3 were employed in microenterprises that are
the better paid segment of the informal sector (OIT 1999, 1998, 1997). Most new youth
8 Interestingly enough, the region paid $739.000 million in debt service between 1982 and 1996, that is to say, more than its total accumulated debt (Tegucigalpa Declaration, http://www.wcc-coe.org/wcc/what/jpc/tegu-e.html). 9 A process of income-generation characterized by one central feature: it is unregulated by the institutions of society, in a legal and social environment in which similar activities are regulated, Castells & Portes, 1989, p.12. According to El mundo de la Informalidad, it refers to independent workers with low income and people working in small business size 5-10 employees, with low productivity (Bueno Sánchez, Farah H, and Nápoli 1994).

22
employment in the 1990s was created in the informal sector (ILO 2000). Table 9 presents the
levels of formal and informal sector employment during the 1990s.
Table 9: Latin American Urban Employment, informal and formal sectors (%)
Informal sector Formal sector Years
Total Independent a.
House keeping
Microenterprises b. Total Public
Sector Big
Companies1990 51.6 24.7 6.7 20.2 48.4 15.3 33 1991 52.4 25 6.7 20.7 47.6 15.2 32.5 1992 53 25.6 6.7 20.8 47 14.6 32.3 1993 53.9 25.3 7.1 21.6 46.1 13.7 32.4 1994 54.9 25.8 7 22.1 45.1 13.3 31.8 1995 56.1 26.5 7.1 22.5 43.9 13.2 30.8 1996 57.4 27.2 7.1 23.1 42.6 13 29.6
Source: Data from ILO (2000, p.59) a. self-employed or free lance. b. Those working in organizations with maximum 10 employees
Another significant impact of the 1980s economic crisis was the increase in women’s
participation on the labor market. Women often seek out paid work in order to compliment
household income and enter the market in very unequal conditions that remained unchanged
after the crisis (CELADE 1999). Between 1990 and 1998, the percentage of women working in
the informal sector in urban areas rose from 49.2% to 52.0%, while for men the proportions were
41.1% and 45.0% (OIT 1999, p.58). Women’s incomes are in fact 50% lower than men’s
(Gálvez 2001).
Informal workers do not have access to health insurance or pensions, and most of them are
located in an unclear area of the labor market defined as underemployment (Bouillon and
Buvinic 2003). At the end of the decade, the wages of workers in the informal sector were 44%
lower than those in the formal sector, 5 percent points lower than the gap recorded in the early
1990s (ILO 2000, p.22).
Figure 6 illustrates the increased wage gap between formal and informal workers in ten Latin
American countries.

23
Source: ECLAC, 1997, as presented by Ocampo (1998, p.4)
Figure 6: Income distribution gap between professionals and informal workers,
Poverty, inequality and informality were the salient characteristics of the region at the end of the
twentieth century. Pointing to the great pressures and challenges faced by the systems of
governance, at any level, in Latin America. Yet, these circumstances are not isolated from the
deep structural changes that Latin America went through in the late 1980s and early 1990s. To
some extent, these circumstances are both causes and effects of the second and third wave of
reforms that traveled throughout the region.
2.3 NEVER ENDING REFORMS
The 1980s and 1990s were years of endless reforms in Latin America. During the last two
decades of the twentieth century, social, economic, and political circumstances were redefined,
reviewed, and redefined again (Finot P. 2001; Montero and Samuels 2004; Ottenberger-Rivera
1997; Campbell 2003; Smith 1985; Rivera Araya 1996; Peterson 1997). The economic and
political reforms were parallel; reforming the economy was the leading theme in the 1980s’ and
reforming the institutions was central to the 1990s.
The neo-liberal reforms were very controversial, but the debate was ignored until the first
results raised some questions about its suitability. A similar process occurred in regard to the
political reforms. On December of 2003, Professor Douglas North, in a conference on Promoting
Institutional Reforms in Latin America organized by the Center for International Private

24
Enterprise, in collaboration with The Ronald Coase Institute and the University of Sao Paulo,
mentioned:
In order to adapt to a dynamic world of continuous change, Latin American countries need to improve institutional and economical performance. But, before confronting these important challenges and undergoing a fundamental transformation, leaders in the region must understand the existing structure of the economy and the transaction costs. They ought to review the history and background of their countries and how institutions work, so that they can identify possible limitations to change. Once they are aware of these structural issues, they will then be ready to improve the way the game is played.
By the year 2003, all countries in the region had already underwent deep processes of
structural reforms, both economically and political. Many criticisms of the neo-liberal
reforms were very pertinent, and the costs for not considering them are often mentioned
when evaluating the results of the reforms.
Promoters of the economic reform claimed that they would raise economic growth rates,
and reduced poverty and inequality10. Neo-liberal policies spread into the region in the
1980s, aimed at promoting a free-market economy and reducing the role of the government
in directing the allocation of resources and production. External players were key promoters
of these reforms (Burki and Perry 1998).
The return of many countries to democratic regimes during the 1980s, and the crisis that many
established democracies faced concerning the legitimacy and efficiency of their regimes, provided
the opportunity for an open debate about how to enhance or promote real democracy. The 1990
reforms focused on institutional adjustments, as they recognized the central role that institutions
had in the economic and social development of the region. The emphasis was on the redefinition
of the public- private realms and the promotion of new forms of governance.
Two main arguments reflect two different positions on the political reform. The first argues
that the poor results of the 1980s reform occurred, in part, due to the lack of institutional reform
supporting the new economic model. The second argument, from a more critical perspective, was
that the economic model needed to be adjusted for the region in order to achieve development
and equality. Both arguments concluded that institutions needed to be strengthened, and by doing
so, good governance would be promoted as well (Campbell 2003; Nickson 1995).
10 Which were very diverse and not homogenous, as it may appear.

25
Democratization and decentralization were central themes in the political reform. The main
goal set for the reform was enhancing democracy, and decentralization was considered a central
policy for achieving this goal. It was claimed that democratization needed decentralization. Local
players were the key promoters for this reform (Montero and Samuels 2004; Ottenberger-Rivera
1997). Decentralization was a policy well received by promoters of both the economic and the
political reforms.
For those advocating the economic reform, decentralization seemed as a natural means to
weaken central governments, which constrained and intervened in the market’s development
(Sader 2001; Stallings and Peres 2000; Burki, Aiyer, and Hommes 1998; IBD 2002). This group
intersected with those promoting decentralization as a political reform in search of efficiency,
who condemn the impotence and waste of the centralized government and seek to invigorate it
and focus its efforts. By the reducing of the government to more manageable dimensions, it
would be more efficient, responsive and accountable to the governed. (Faguet, 1997).
Those advocating decentralization as a political reform for enhancing democracy argued that
it was the appropriate policy to bring constituencies closer, to often distant, and frequently seen
as illegitimate, central governments. Decentralization would offer participation to those excluded
under imperfect democracies (Ottenberger-Rivera 1997; Montero and Samuels 2004).
Decentralization was also championed as a means to improve governance (Agüero and Stark
1998; Fukasaku and Hausmann 1998; Lustig and Deutsch 1998).
The need for new ways to organize and represent various interests, a new form of
governance, was very clear in Latin America. Descentralization was seen by many as the
response to the political confrontations and social mobilizations in the 1980s and 1990s.
As stated by HABITAT:
As democratization in Latin America proceeds, the role of local governments in addressing local political issues and enabling civil participation to develop will take on greater significance. This includes not only the holding of elections at the local level, but also the ability of municipal governments to provide effective solutions to urban problems” (UN-HABITAT 1996, p.169)
Evaluations of both the economic and political reform are generally critical and point out that
the results were far from what was expected. The evaluation of the economic reform, as
presented by Burki & Perry (2000), Stallings & Peres (2001), Ocampo and Martin (2003),
(Stiglitz 2003) and Sader (1999; 1998; 1997), could be summarized as follows:

26
- The reform encouraged the fortification of the private sector, but gave very little
importance to the improvement of the public sector.
- The macroeconomic reforms were not balanced; they assigned too much importance to
fight inflation and did not take care of fighting unemployment and promoting growth
- The region had around 3% more economic growth in the 1990s than in the 1980s, though
it has never reached the levels of economic growth that it had in the period 1950-1980,
before the reforms.
- The reform increased the exposure of countries to economic risk, without increasing their
capacity to face it.
- Exports grew significantly, but imports grew faster and bigger, increasing the trade
deficit.
- The level of employment creation is less than expected and the quality of it is
questionable. Data from ILO shows that informal employment accounts for 85 percet of
the total new employment.
- Despite the small economic recovery in the 1990s, inequality has worsened, and the wage
differentials between skilled and non-skilled labor has widened.
Evaluations of the political reform, carried out by different authors, showed that:
- Democratic political norms and procedures are increasingly common, but effective
democratic governance is far from consolidated (Domínguez and Lowenthal 1996; Ai
Camp 1996; Peterson 1997).
- The role and significance of mayors and municipalities changed in the 1980s; elected
capital-city mayors became the countries’ second most important political executive after
the president (Myers and Dietz 2002).
- The number of IADB borrowing member states with democratically elected governments
increased from 13 in the mid- 1980s to 26 in the 1990s (IDB 2002).
- From 1980 to 1995, the number of countries with direct election of mayors increased
from three to seventeen (Finot P. 2001).

27
- Decentralization has a mixed record in terms of its efficiency effects and has often
created fiscal disequilibria (Stein 1998; Finot P. 2001; Burki, Aiyer, and Hommes 1998;
UNDP; World Bank; IADB 1999).
- The transfer of responsibilities from national to local levels has been carried out without
an adequate transfer of resources (Finot P. 2001; IADB 2002).
- Surveys of elected local officers, from several countries, revealed that the ratio of
professionals to total staff increased from 10 percent in the 1980s to more than 40 percent
in the 1990s (Campbell 2003).
- New forms of governance are emerging from the decentralization process (Reilly 1995;
Campbell 2003; Campbell and Fuhr 2004; Manor 1999).
The uneven results of the reforms poses an interesting puzzle for academics and practitioners. It
is legitimate to ask, for example, if decentralization is in fact the appropriate strategy for
enhancing democratic governance, in Latin America or elsewhere. Moreover, it is appropriate to
search for the many lessons grounded in the region’ experience.
Latin America’s recent history and the unsettled challenges faced by this region are the
reasons for focusing this study on the relation between decentralization and governance, and for
choosing participation, equity, and efficiency as the three variables for assessing the impact of
decentralization on (good) governance. Bogotá is the case chosen to learn from; the city shares
most of the regional trends, adding intriguing and interesting particularities to them. The next
chapter presents an overview of Colombia, the national context in which Bogotá’s case is
inscribed, which is crucial for understanding the relevance of this case and its possible
contributions to the overall understanding of governance and Latin American politics.

28
3.0 NATIONAL CONTEXT, COLOMBIA: A CONTINENTAL PUZZLE
“Few moments in Colombia’s history have created more yearnings than the National Constituent Assembly of 1991. […] Although, as one might have expected, the leap from paper to life encountered uncountable obstacles and developments.”
Velázquez C. and González R. (2003, p.13) 11
Colombia is located in the northwest corner of South America, bordering the Caribbean Sea,
between Panama and Venezuela, and bordering the North Pacific Ocean, between Ecuador and
Panama. It is a tropical country along the coast and eastern plains, with a cooler climate in the
highlands. It is the fourth largest Latin American nation, and the third most populous with a
population of 43,700,000, of which 38 percent are under age 18 (Colombia's War on Children
2004, p.1). It is the fifth country in gross production, but it occupies the first place as an exporter
of such disparate commodities as emeralds, books, processed cocaine, and cut flowers (Bushnell
1993, pp.vii-viii).
Colombia is divided into 32 departments, or politico-administrative units, and 1 capital
district, Bogotá. Its bicameral Congress or Congreso consists of the Senate or Senado (102 seats;
members are elected by popular vote to serve four-year terms), and the House of Representatives
or Cámara de Representantes (166 seats; members are elected by popular vote to serve four-year
terms). It has four coequal, supreme judicial organs; Supreme Court of Justice (Corte Suprema
de Justicia); Council of State (Concejo de Estado); Constitutional Court (Corte Constitucional);
and Higher Council of Justice (Concejo Superior de Justicia).
For most, Colombia is unknown territory, a land of myths and threat, full of gangsters, drug
dealers, extreme poverty and wealth. It is so to outsiders as it is for many locals. The general
agreement from those who have visited Colombia, is that it is a beautiful country with puzzling
11 Translation by the author.

29
contradictions and great challenges, due to an almost endemic internal conflict (Kline 1995,
1996; Bushnell 1993).
The country is significantly different from the regional trends on four major levels: its level
of violence, its economic performance, its pattern of urbanization, and its recent political reform
(Solimano et al. 1999). According to Estanislao Zuleta, a Colombian scholar, Colombia’s
democracy is possessed by fear; coexisting with democratic practices, one found one of the most
violent political conflicts in the world (Zuleta 1991). Interestingly enough, Colombia has been
considered the most stable democracy in the region (Hoskin 1998); apart from a four-year period
of a very “civilized” military rule12 in the 1950s, only two parties, the Liberals and the
Conservatives have ruled Colombia, since mid nineteen century (Kline 1996).
The second puzzling fact about Colombia is its economic performance. It was the only
country in Latin America having economic growth during the crisis of the 1980s; while the GDP
per capita in Latin America fell 6.6 percent between 1981 and 1988, in Colombia it showed an
11 percent growth (Miranda 2002; Gilbert 1994; García García and Jayasuriya 1997).
Nevertheless, Colombia shares with Brazil the fact of being the most unequal countries in the
region (Cárdenas S. and Lustig 1999; Garay Salamanca 2002).
The third issue in which Colombia deviates from the region is its process of urbanization.
Before the 1990s, Colombia was one of the few exceptions to the primacy trend in the continent,
as three other cities competed with Bogotá as core of the country’s development. The absence of
primacy has been changing since the 1990s, due to the economic crisis affecting the other major
cities, and the increase in population seeking refuge in the highlands of Bogotá. Los desplazados
(the displaced), as they are known, are a new factor that is changing the city and the country.
Finally, in parallel to the reforms occurring in the region, Colombia underwent an additional
major political reform, which deeply influenced the country’s recent history. On May 27, 1990,
the day of the presidential election, Colombia’s citizens voted yes or no on this question:
In order to fortify participatory democracy, do you vote for the convocation of a constituent assembly with representation of social, political, and regional forces, popularly and democratically integrated, to reform the Constitution of Colombia?13
12 The dictatorship of Gustavo Rojas Pinilla came about as a pause in the midst of a bloody partisan war between liberals and conservatives. 13 Translated by the author from Neoliberalismo y Constitución Política de 1991, p.42.
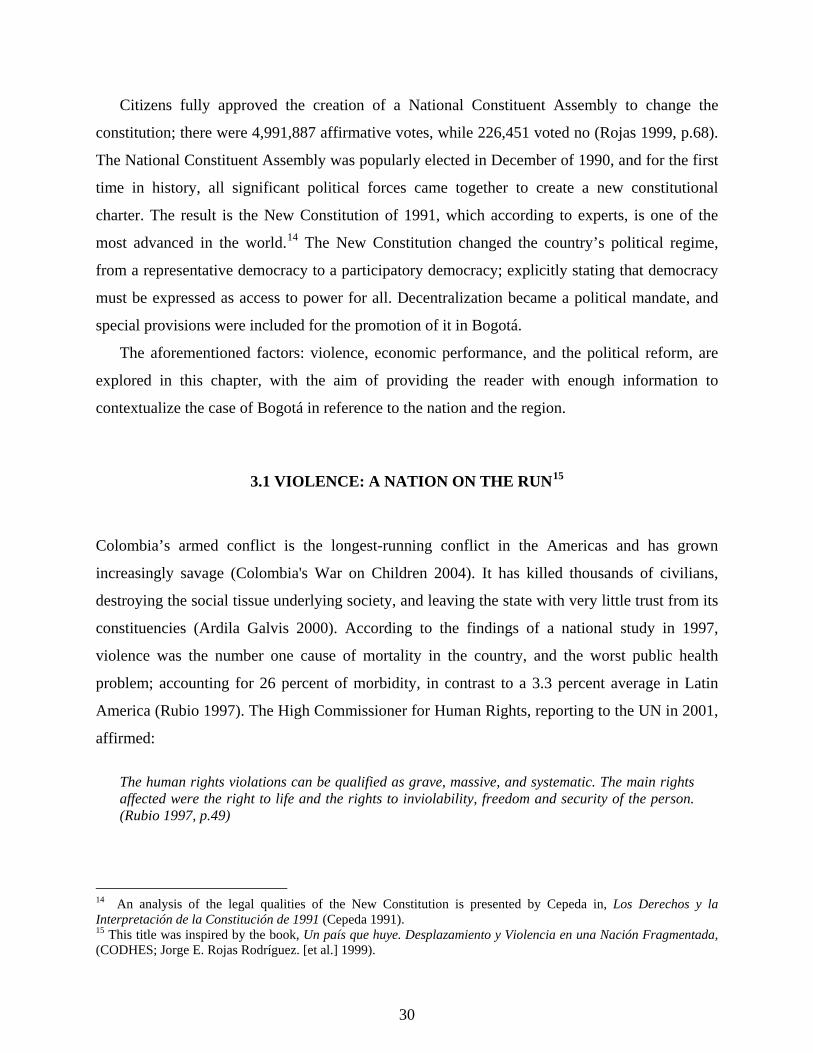
30
Citizens fully approved the creation of a National Constituent Assembly to change the
constitution; there were 4,991,887 affirmative votes, while 226,451 voted no (Rojas 1999, p.68).
The National Constituent Assembly was popularly elected in December of 1990, and for the first
time in history, all significant political forces came together to create a new constitutional
charter. The result is the New Constitution of 1991, which according to experts, is one of the
most advanced in the world.14 The New Constitution changed the country’s political regime,
from a representative democracy to a participatory democracy; explicitly stating that democracy
must be expressed as access to power for all. Decentralization became a political mandate, and
special provisions were included for the promotion of it in Bogotá.
The aforementioned factors: violence, economic performance, and the political reform, are
explored in this chapter, with the aim of providing the reader with enough information to
contextualize the case of Bogotá in reference to the nation and the region.
3.1 VIOLENCE: A NATION ON THE RUN15
Colombia’s armed conflict is the longest-running conflict in the Americas and has grown
increasingly savage (Colombia's War on Children 2004). It has killed thousands of civilians,
destroying the social tissue underlying society, and leaving the state with very little trust from its
constituencies (Ardila Galvis 2000). According to the findings of a national study in 1997,
violence was the number one cause of mortality in the country, and the worst public health
problem; accounting for 26 percent of morbidity, in contrast to a 3.3 percent average in Latin
America (Rubio 1997). The High Commissioner for Human Rights, reporting to the UN in 2001,
affirmed:
The human rights violations can be qualified as grave, massive, and systematic. The main rights affected were the right to life and the rights to inviolability, freedom and security of the person. (Rubio 1997, p.49)
14 An analysis of the legal qualities of the New Constitution is presented by Cepeda in, Los Derechos y la Interpretación de la Constitución de 1991 (Cepeda 1991). 15 This title was inspired by the book, Un país que huye. Desplazamiento y Violencia en una Nación Fragmentada, (CODHES; Jorge E. Rojas Rodríguez. [et al.] 1999).

31
It has been proven that any accomplishments achieved in neo-natal risk control, improving
nutrition, and fighting infectious diseases were annulled by the increase in violence. Colombia
has the highest homicide’s rate in the hemisphere (Rodríguez and Winchester 1997) and the
highest rate on kidnapping in the world (DABS; PUJ 2003). Since 1985, the average annual
homicides rate has been about 25,000. Consequently, by 1994, Colombia had the highest
homicide rate in the world (Carrión 1994). Figure 7 illustrates the homicide rate from 1970 to
2002.
43385823
8565
12199
2851625398 25505 26313
28228
0
5000
10000
15000
20000
25000
30000
35000
1970 1975 1980 1985 1990 1995 2000 2001 2002
Hom
icid
es
Homicides Linear (Homicides)
Source: Data from Codhes and Unicef Colombia (1999), Museo Nacional (2001), and on-line consultation to: www.codhes.org.co/
Figure 7: Homicides in Colombia by quinquenium 1970-2000, plus 2001 and 2002
Despite the existence of democratic rules and practices for political competition, political
violence has been constantly present in the country’s history. Recently, more than 1,000
members of the Union Patriótica, a leftist coalition party, were killed, representing one of the few
cases in modern history of political genocide (the annihilation of a political party by
assassinating its affiliates) (Uribe et al. 1995; Zuleta 1991). In a similar situation, more than
1,550 union leaders were killed during the 1990s (DABS; PUJ 2003).
The long lasting political conflict was aggravated with the emergence of drug lords as key
players in the conflict and the economy of the country. The drug economy increased the level of

32
violence and promoted its professionalization, creating training programs for professional
assassins. The country’s already weak system of governance was further disrupted by the
emergence of two new wars; the war among drug cartels, and the war against drug cartels
(Domínguez and Lowenthal 1996; Museo Nacional de Colombia 2001).
With the drug economy came the paramilitary, mainly, though not exclusively, private
armies aiming to protect each cartel and its economic interests. Although paramilitary groups
were not new in the country (for decades landowners had used private self-defense armies to
protect themselves and their resources) (Museo Nacional de Colombia 2001, p.5), drug money
funded the spread of these private armies and created a strong market for them.
The endemic nature of violence in Colombia has proven that a military solution is not viable
or desirable, and that what is needed is a political solution in accordance with international
human rights law (CODHES; Jorge E. Rojas Rodríguez. [et al.] 1999; Rojas 1999). Nevertheless,
talks of peace are usually coexistent with practices of war. The cost of war for the country may
be as high as 13 percent of the GDP (HABITAT 2001, p.226).
The National Department of Planning (NDP), calculated that, between 1991 and 1996, the
net cost from violence was raised to 12.5 billion pesos (1995 current), meaning 18.5 percent of
the GDP. Additionally, military expenditure accounts for 30 percent. Military expenditure data
presented in table 10 provides an easily identifiable measure of the scale of resources absorbed
just by military activities.
Table 10: Military Expenditure in Colombia 1988-2000
Military expenditure in local currency (b. pesos ), at current prices
1988 1989 1990 1991 1992 1993 1994 1995 1996 1997 1998 1999 2000
234 329 437 532 805 1315 1745 2228 2786 3537 4356 5372 5935
Military expenditure in constant US dollars (constant 2000 prices and exchange rates)
1988 1989 1990 1991 1992 1993 1994 1995 1996 1997 1998 1999 2000
1134 1267 1303 1217 1449 1931 2069 2184 2271 2434 2526 2810 2843
Military expenditure as percentage of gross domestic product (GDP)
1988 1989 1990 1991 1992 1993 1994 1995 1996 1997 1998 1999 2000
2 2.2 2.2 2 2.4 3 2.6 2.6 2.8 2.9 3.1 3.5 3.4
b. Billions, m. millions Source: The SIPRI military expenditure database, consulted Jan 17, 2004. http://first.sipri.org

33
But, maybe the most dramatic consequence of violence is its impact on the country’s
demography; life expectancy for men has been reduced by four years, and fertility rates dropped
as women became widows very early (Rubio 1997). Displacement has been identified as ‘the
war behind the war.’ According to the International Organization for Migration (IOM) the level
of displacement in Colombia is a consequence of its use as a war strategy, more than an actual
consequence of the war (Beltrand, CODHES, and IOM 2003).
The U.S. Committee for Refugees (USCR) and other international organizations, estimated
that, by the year 2000, Colombia had the highest internally displaced population in the world
(Giugale, Lafourcade, and Luff 2003, p.831). In addition, according to the Population Data Unit
of the Office of the United Nations High Commissioner for Refugees (UNCHR), the number of
Colombian asylum-seekers increased from just over 2,000 in the late 1990s to more than 20,000
per year since 2001 (Giugale, Lafourcade, and Luff 2003). The majority of Colombians living
outside the country reported that they were forced to leave. By the year 2000, more than 10
percent of the country’s total population lived somewhere else (Museo Nacional de Colombia
2001, pp.263-276).
The phenomenon of people forced to move by violence has been constantly present in
Colombia’s history. The fight over land ownership, the search for a better and safer life, and
political prosecution were main factors of internal migrations before 1980. Nevertheless,
displacement has escalated to an epidemic level since the mid 1980s (CODHES; Jorge E. Rojas
Rodríguez. [et al.] 1999; Domínguez and Lowenthal 1996; Murad Rivera 2003).
According to data from the Consultoría para los Derechos Humanos y el Desplazamiento16
(CODHES), between 1985 and 2000, more than 2,000,000 Colombians were violently displaced,
representing around 5 percent of the total country’s population. As of 1997 it was estimated that
six families were displaced every hour (CODHES; Jorge E. Rojas Rodríguez. [et al.] 1999).
Aggravating the problem, it has been estimated that 56 percent of the displaced are women, and
55 percent are less than 18 years old (Museo Nacional de Colombia 2001, p.70).
Table 11 presents the displaced population between 1985 and 2000; figure 8 illustrate the
severity of the displacement trend, and table 12 presents the proportion of displaced and received
women and people under 18, by departamento (state), from January 2000 to June 2001.
16 Consulting group for Human Rights and Displacement, an independent organization created in 1992 by a group of scholars and researchers worried by the lack of recognition of the displacement problem.

34
Table 11: Colombia displaced population between 1985 and 2000
Year New
Displaced Total % Increase
1985 27,000 27,000 1986 36,000 63,000 1987 59,000 122,000 1988 105,000 227,000 1989 119,000 346,000 1990 77,000 423,000 1991 110,000 533,000 1992 64,000 597,000 1993 45,000 642,000 1994 78,000 720,000 * 1995 89,000 809,000 12.4 1996 181,000 990,000 22.4 1997 257,000 1,247,000 26.0 1998 308,000 1,555,000 24.7 1999 288,000 1,843,000 18.5 2000 317,000 2,160,000 17.2
Source: Data from Sisdhes, on line at: http://www.codhes.org.co/ * Data before this date are not reliable enough to display the percentage increase.
Displacement Trend
0
500,000
1,000,000
1,500,000
2,000,000
2,500,000
1985
1986
1987
1988
1989
1990
1991
1992
1993
1994
1995
1996
1997
1998
1999
2000
Years
Peop
le d
ispl
aced
Displaced Population Linear (Displaced Population)
Source: CODHES, www.codhes.org.co/ on-line consultation Dec.20, 2004
Figure 8: Colombia’s displacement trend 1985-2000

35
Table 12: Displaced and received population by Departamento
Accumulated from January 2000 to June 2001
Received Departamento
(state) Displaced
Total Women % Under 18 %
Antioquia 56,843 47,661 52.19 48.24 Bogotá 0 22,140 50.51 47.82 Bolívar 26,400 19,691 47.24 39.11
Magdalena 19,199 18,687 47.04 52.08 Putumayo 8,353 10,707 49.47 45.92
Cesar 4,843 10,379 51.64 55.68 Meta 6,036 9,201 50.00 54.34
Chocó 23,052 9,166 46.21 47.79 Atlántico 100 7,933 48.86 39.68
Valle del Cauca 14,436 6,906 50.72 48.72 Sucre 5,628 6,876 50.03 55.95
Santander 5,146 6,628 48.32 48.28 Caquetá 4,432 4,952 58.97 54.03
Cundinamarca 537 4,940 55.71 51.36 Cauca 12,354 4,779 46.90 46.04 Tolima 5,541 3,792 42.77 44.74 Huila 483 3,282 44.69 58.49
Risaralda 2,764 3,138 55.03 55.81 La Guajira 1,042 2,879 50.86 39.20
Nariño 656 2,347 50.17 46.01 Norte de Santander 2,125 2,089 50.57 56.23
Quindío 29 1,200 49.02 38.13 Boyacá 360 990 49.70 51.47 Caldas 224 967 41.63 45.28
Casanare 443 737 50.60 47.74 Guaviare 738 577 42.55 44.74 Vichada 1,230 429 34.12 48.63 Arauca 302 421 38.17 52.21
Córdoba 3,967 329 46.33 40.65 Amazonas 0 23 50.00 50.00
Guainía 0 8 50.00 40.00 Vaupés 245 1 100.00 0.00 Total 207,508 213,855 50.00 48.53
Source: (Murad Rivera 2003)
Displacement affects the socio-spatial distribution of the Colombian population and it is a
critical and distinctive element for understanding the latest drive in Colombia’s urbanization; for
a map of the displacement by regions, please see Appendix A.

36
.A survey conducted by the information system on displacement (SISDES) found that around
87 percent of the internally displaced population (IDP) moved to urban areas; Bogotá is the city
that receives the biggest share of “desplazados” 17 (Museo Nacional de Colombia 2001). People
displaced from their homes move to the cities in search of refuge because the incidence of the
war is less noticeable there and their arrival is changing Colombia’s pattern of urbanization. The
next section presents the characteristics of the country’s urbanization and an explanation of how
it deviates from the regional patterns and why.
3.2 URBANIZATION: VERY LATE INTO THE PRIMACY PATTERN Colombia, as most Latin American countries, went from being predominantly rural to
predominantly urban in the second half of the twentieth century. However its pattern of
urbanization was exceptional in Latin American, as the country did not present clear primacy of
its capital, Bogotá (Gilbert 1994; Flórez Nieto and Méndez 2000; Greenfield 1994).
Between World War II and 1970, many cities added more population than they did in the
three preceding centuries, leading to a relatively balanced net of cities (Greenfield 1994, p.141).
Table 13 illustrates the pace of urbanization in the country from 1950 to 2000.
Table 13: Colombia, percentages of urban and rural populations 1970-2000
Area 1970 1975 1980 1985 1990 1995 2000 Urban 57.7 61.8 64.4 67 69.4 71.7 75 Rural 42.5 38.4 35.7 33.1 30.7 27.9 25
Source: Population Division, Department of Economic and Social Affairs, United Nations, 2001 and CELADE- Population and Demography Latin American Center, Bulletin No.63.
Figure 9 illustrates the dominance of urban population growth from 1960 to 1995.
17 Desplazados became a common nickname in Colombia, when people from different regions and cultures made a new and unique category of Colombians.

37
0
5000
10000
15000
20000
25000
30000
35000Po
pula
tion
(thou
sand
s)
1970 1975 1980 1985
Years
NationalUrbanRural
Source: CELADE, Demographic Bulletins No. 63: Latin America, mortality tables 1950-2025; and No.67: Latin America: Urban and Rural populations projections 1970-2025.
Figure 9: Population growth, national, urban and rural
Two distinct Colombian factors explain this pace of urbanization; first, the incidence of
political violence in the country’s history, which affected by and large rural areas; second,
Colombia’s more even pattern of urbanization, which offered at least four legitimate urban poles
of attraction: Cali, Medellín, Barranquilla, and Bogotá.
Colombia has been burdened by a long history of sociopolitical violence, and the
displacement of civilians has been an endemic feature of the country's close to 50 year conflict
(Norwegian Refugee Council 2004). During a period known as La Violencia, the internal conflict
reached a peak that brought many rural dwellers seeking protection to the cities. La Violencia
officially ended in 1957 when the two dominant political parties signed an agreement to share
power. Yet in response to the power monopoly established by the Liberal and Conservative
parties, armed guerrilla movements emerged in the 1960s (Jaramillo Uribe 1992; Melo 1991).
Between 1951 and 1964, the percent of the population in urban areas rose from 39% to 52% of
the nation’s population (Flórez Nieto and Méndez 2000, p.65).
The 1980s witnessed the surfacing of paramilitaries and powerful drug cartels, and the
internal conflict reached levels of violence unknown before. Displacement is but the most
palpable manifestation of the internal war and it is, as presented in the previous section, deeply
affecting the demography of the cities and the country’s prevailing pattern of urbanization.

38
For most of the twentieth century, Colombia’s pattern of urbanization was known as
cuadricephalic, in contrast with the prevailing monocephalic pattern in Latin America (Flórez
Nieto and Méndez 2000). In Colombia, each main region developed its own central city, its
capital. The north coast has Barranquilla, the most important Caribbean port; the northeast has
Medellín, the most important industrial center, at least for a long time; the southeast has Cali, the
gate to the Pacific and the most modern agro industrial center; and, the central plains have
Bogotá, the country’s capital (Greenfield 1994; Gilbert 1994; Flórez Nieto and Méndez 2000).
By 1973, these four cities contained 25 percent of the national population; additionally, by
the 1980s Colombia had developed multiple medium size cities. By 1988 five cities besides the
fourth mentioned, had more than 500,000 inhabitants; twenty-six had between 100,000 and
500,000 inhabitants; and thirty-nine had between 50,000 and 100,000 (Nickson 1995, p.145).
Despite the emergence of several competing urban conglomerations, the country’s
pluricephalic pattern slowly changed. From the mid 1970s on, Bogotá began a faster pace of
growth, and by the 1990s, the tendency to its primacy was clear. By 1993, around 15 percent of
the country’s population lived in Bogotá, while the other three cities accounted for another 15
percent (Flórez Nieto and Méndez 2000, pp.75-76).
Primacy, as known in most Latin American countries, was just beginning to be noticeable in
the 1990s. In the period 1985-1993, Bogotá’s population grew 5.1 percent a year, while the other
three major cities had an average population growth rate between 2.0 and 2.8 percent a year
(UN-HABITAT 1996, p.51). Table 14 illustrates the emergence of primacy in the country.
Table 14: Percentage of the total population living in main cities (1950-2000)
Qinquennium 1950 1955 1960 1965 1970 1975 1980 1985 1990 1995 2000Barranquilla 2.3 2.5 2.7 2.9 3.1 3.3 3.4 3.6 3.6 3.6 4Bogotá 5.4 6.5 7.7 9.2 10.6 12.1 12.9 13.8 14.2 14.8 16.1Cali 1.8 2.3 2.8 3.4 3.8 4.2 4.3 4.5 4.5 4.7 5.3Medellín 3 3.6 4.3 5.1 5.6 6.1 6.1 6.2 6.1 6.2 6.8Total 12.5 14.9 17.5 20.6 23.1 25.7 26.7 28.1 28.4 29.3 32.2Source: Population Division, Department of Economic and Social Affairs, United Nations, 2001
The urban population growth since 1985, and the emergence of Bogotá’s primacy, coincided
with a new wave of violence. According to data from the Norwegian Refugee Council, the total
number of people internally displaced from 1985 to 2003 was 3,090,000, accounting for 7

39
percent of the country’s total population. Of the 1100 municipalities in the country, 904 were
affected by forced displacements in 2003 (Norwegian Refugee Council 2004).
According to CEPAL, as a consequence of the arrival of displaced populations, poverty in
urban areas has increased, as the displaced tend to be concentrated in slums and shanty towns,
where they find themselves among the poorest of the urban poor (CEPAL and PNUMA 2001).\
The displaced population significantly enlarged the informal sector and the number of poor
in the cities. Official sources estimate that at the end of the year 2000, the country’s per capita
income had fallen to US $100 less than in 1994 (High Commissioner for Human Rights 2001,
p.17). Displacement had important impacts on the economy of the country.
The next section examines three particularities of Colombia’s economy: its performance, the
level of inequality, and the role of the informal sector within the economy.
3.3 A SUCCESS STORY OF ECONOMIC PERFORMANCE:
POVERTY AND INEQUALITY
Colombia held for many years the title of the most successful country in Latin America in
regards to its economic performance. As a matter of fact, between 1970 and 1997 the Colombian
economy grew every year but one (Londoño de la Cuesta 1995). Noticeably, while the region’s
economy went into an economic downspiral during the debt crisis of the 1980s, Colombia
experienced continued economic growth, was the only country in Latin America to pay back its
debt on schedule, and kept its inflation under relative control (Edwards 2001).
According to a comparative study, during the 1980s, Colombia exhibited the strongest
performance of any Latin American country (Edwards 2001, p. 33). Figure 10 presents the
regional and national GDP growth rate trend from 1980 to 1990 and illustrates Colombian’s
outstanding performance.

40
-4.5-3.5-2.5-1.5-0.50.51.52.53.54.55.56.57.5
1980
1981
1982
1983
1984
1985
1986
1987
1988
1989
1990%
GD
P gr
owth
Colombia Latin AmericaLinear (Colombia) Linear (Latin America)
Source: World Bank, World Development Indicators database on-line.
Figure 10: Average GDP growth rate for Latin America and Colombia, 1980-1990
During the 1990s, Colombia’s performance deteriorated in relation to the region (Calderón
and Reyes 2000). Between 1996 and 1998, the average growth rate was 1.7 percent; and in 1999,
for the first time in the century, the economy exhibited negative growth, -1.9 percent. Figure 11
illustrates the reversal of the regional and national trends of the 1990s.
-4.5-3.5-2.5-1.5-0.50.51.52.53.54.55.56.5
1991
1992
1993
1994
1995
1996
1997
1998
1999
2000%
GDP
gro
wth
Colombia Latin AmericaLinear (Colombia) Linear (Latin America)
Source: World Bank, World Development Indicators database on-line.
Figure 11: Average GDP growth rate for Latin America and Colombia, 1991-2000

41
The change in the country’s economic performance continues to be a source of discussion.
Undoubtedly, it is the result of a combination of internal and external factors, and to explain it is
beyond the scope of this study. Nevertheless, it is common to find arguments associating the
economic crisis with the implementation of an economic reform known as La Apertura18, which
will be explored further in next subsection. What is clear is that the effect of the country’s
economic performance had little impact on its poverty and inequality levels. Poverty grew side
by side with wealth. From 1980 to 1998, the average GNP19 per capita grew constantly; during
the same period the number of poor increased as well (Corredor Martínez 1998, V.1 p.74).
Figure 12 illustrates these trends.
-2.5
-1.5
-0.5
0.5
1.5
2.5
3.5
4.5
1980
1981
1982
1983
1984
1985
1986
1987
1988
1989
1990
1991
1992
1993
1994
1995
1996
1997
1998
1999
2000G
DP
per c
apita
%gr
owth
0
5,000
10,000
15,000
20,000
25,000
30,000
Poor
pop
ulat
ion
(thou
sand
s)
Colombian GDP per capita growth number of poorLinear (Colombian GDP per capita growth) Linear (number of poor)
Source: calculations using World Bank and DNP data.
Figure 12: Colombia: GDP per capita percentage growth and number of poor, 1980-2000
Between 1991 and 1996, the economy grew at an average rate of 4.4 percent. Puzzlingly, the
number of poor increased by 3.3 million during the same period (Corredor Martínez 1998, V.II,
p.133); as illustrated by figure 13.
18 It means the opening and that was the main goal of the reform to open the economy. 19 Gross National Product

42
00.5
11.5
22.5
33.5
44.5
55.5
66.5
7
1991 1992 1993 1994 1995 1996
GD
P %
grow
th
15,000
16,000
17,000
18,000
19,000
20,000
21,000
Num
ber o
f poo
r (th
ousa
nds)
National GDP growth Number of poor (thousands)Linear (Number of poor (thousands)) Linear (National GDP growth)
Source: calculations using World Bank and DNP data.
Figure 13: Colombia, GDP growth and number of poor, 1991-1996
What the previous graphics illustrate is the vulnerability of the poor to changes in the
economic pattern. When the economy is in good shape, poverty improves very little and very
slowly; when the economy is in crisis, the poor are the first in receiving the impact, and poverty
grows fast. The next subsections are dedicated to further explore poverty and inequality in the
country, for the period covered in this study.
3.3.1 Poverty Poverty has been a rather stable phenomenon in Colombia, with brief periods of slight
improvement. Between 1978 and 1995, the share of the population below the poverty line was
slightly reduced from 58.1 percent in 1978 to 53.2 percent in 1994 (DNP-UNDP 1998). Poverty
increased by over 14 percent between 1997 and 1999. Those living in poverty numbered 19.7
million in 1997, rising in 1999 to 22.7 million (of an estimated population of 36 million) or 63
percent of the country’s population (High Commissioner for Human Rights 2001, p.17).
According to the latest World Bank’s report on Colombia, 64 percent of the population was in
poverty in 1999, and 23 percent were in extreme poverty. As of 1999, the country had the same

43
level of poverty as in 1988 (Vélez et al. 2002, p.11). Twenty seven million people live in
poverty, and one of four poor lives in extreme poverty.20
In 1995, for every 100 people below the poverty line living in cities there were 167 in rural
areas. This is despite the fact that only three out of ten Colombians lived in areas officially
classified as rural. According to the country’s Human Development Report for 1998, rural areas
has a life expectancy 10 years below urban areas, and the illiteracy rate is 3.5 times higher
(DNP-UNDP 1998, p.xiv). It has been estimated that, as a consequence of its level of poverty,
rural areas stay two decades behind the level of social development accomplish in the cities
(Fresneda B., Sarmiento Anzola, and Muñoz 1991, p.236).
Table 15 presents the evolution and incidence of poverty in the country according to the
Poverty Line index (PL)21 in rural and urban areas, from 1972 to 1995.
Table 15: Colombia Evolution and Incidence of Poverty, 1972-1995
National Urban Rural
Year Population (thousands)
Under PL (thousands) Incidence
Population (thousands)
Under PL (thousands) Incidence
Population (thousands)
Unbder PL (thousands) Incidence
1972 22,008 13,215 60.0% 13,053 6,696 51.3% 8,955 6,519 72.8%
1975 23,757 13,915 58.6% 14,284 7,142 50.4% 9,472 6,773 71.5%
1978 25,440 14,335 56.3% 16,125 7,829 48.6% 9,315 6,507 69.9%
1986 30,024 15,614 52.0% 20,138 8,901 44.2% 9,887 6,913 67.9%
1988 31,141 16,659 53.5% 21,332 10,047 47.1% 9,810 6,612 67.4%
1991 32,841 17,041 51.0% 22,660 10,424 46.0% 10,181 6,617 65.0%
1992 33,392 17,881 53.5% 23,127 10,742 46.4% 10,265 7,139 69.5%
1993 33,952 17,384 51.2% 23,596 10,052 42.6% 10,356 7,332 70.8%
1995 35,098 18,391 52.4% 24,569 10,810 44.0% 10,529 7,581 72.0%Source: Sarmiento-Anzola, L. quoted in Seminario "Pobreza y Política Social en Colombia", 1998:35
Although the incidence of poverty is higher in rural areas, in absolute numbers poverty it is
higher in urban areas, as illustrated by table 15. This is consistent with the regional trend known
as the urbanization of poverty. The more urbanized the country, the more urban poverty, as
20 Using the less than $2 dollars daily income for the poverty line and less than $1 for extreme poverty. 21 The poverty line is the minimum income level needed to give rise to a minimum calorific intake, together with minimum consumption rates of different food groups. This is weighted by the proportion of total expenditure on food by the poorest 25 per cent of the population.

44
income earned becomes the only source of survival and is very unequally distributed (Fresneda
B., Sarmiento Anzola, and Muñoz 1991, p.238).
Measurement of poverty may differ depending on which indicator is used to evaluate it. For
example, as measured by the Unsatisfied Basic Needs index-UBN22, there have been significant
improvements in the country. According to this indicator, the incidence of poverty was reduced
from 55.4 percent in 1980 to 22.99 percent in 2000, with rural areas benefiting the most.
However, it seems more plausible that what this trend illustrates is the urbanization of the
country. By 1990 two-thirds of rural dwellers were poor (5,981,700) and a quarter of urban
dwellers (5,978,700) (Fresneda B., Sarmiento Anzola, and Muñoz 1991, p.236).
Table 17 presents the level of poverty for rural and urban areas, as measured by the UBN
index.
Table 16: Colombia: Population and Incidence of poverty in rural and urban areas
(UBN index), 1972-2000
National Urban % Rural % Year Thousands % Thousands % Thousands % 1972 17,064.4 72.5 8,564.1 61.1 8,500.2 89.2 1980 14,905.8 55.4 7,741.2 43.4 7,164.6 79 1985 14,617.5 45 nd. 32.3 nd. 71.8 1986 13,075.4 42.9 6,588.5 30.8 6,486.6 71.3 1988 12,606.1 39.4 6,319.1 27.7 6,287.0 68.7 1990 11,960.5 36.3 5,978.7 25 5,981.7 66 1993 14,011.3 37.2 6,927.6 26.8 7,384.6 62.5 1996 10,201.4 25.97 4,617.5 16.85 5,769.1 48.57 1997 10,360.9 25.89 4,986.6 17.77 5,563.6 46.53 1998 10,605.1 26.01 5,000.1 17.41 5,762.7 47.81 1999 10,343.2 24.9 5,142.0 17.5 5,312.2 43.7 2000 9,724.6 22.99 4,940.0 16.44 4,897.8 39.98
Source: calculations with data from DNP, Socio-demographic indicators, Social Indicators System and from Fresneda, Sarmiento and Muñoz (1991, p.236).
Recent studies (Garay Salamanca 2002; High Commissioner for Human Rights 2001),
showed that the country’s poverty situation could be summarized as follows.
22 The Unsatisfied Basic Needs Index measures material well-being in its multiple dimensions, such as nutritional and health status, life expectancy, education and housing conditions.

45
- More that 60 percent of the total population is poor, and there are more than 11 million
Colombians under the line of extreme poverty.23
- From the country’s economically active population (EAP), 60 percent “work” in the
informal sector, not having access to security, stability or labor rights.
- More than 3 million of children under fifteen do not have access to education.
- The gap between rural and urban areas, and the large increase in inequality in the urban
sector due to the deterioration of income distribution, worsen the level of inequality in the
country (Bourguignon, Ferreira, and Lustig 2004).
As mentioned, inequality is as important a factor in the regional trends as it is in the national
context. The next section presents the country’s trends regarding inequality.
3.3.2 Inequality Colombia and Brazil share first place for inequality in the region, which, in the case of
Colombia, clearly deteriorated during the 1990s (Cárdenas S. and Lustig 1999; Garay Salamanca
2002). At the end of 1990s, Colombia had moved backward ten years in its development level;
all achievements made in life expectancy, health and education from 1985 to 1993, were lost
due to the increase in inequality after 1993 (DNP-UNDP 1998, p.122).
In October of 1998, in the midst of one of the many peace processes the country has
embarked on, a number of academics and representatives from NGOs, who believed that closing
the inequality gap was a condition for the success of the process,24 conducted a national seminar
on poverty and social policy. The aim was the promotion of an open debate regarding poverty
and inequality. According to the seminar memoirs, Colombia’s level of concentration is higher
than most Latin American counties, and higher than expected in regards to its GDP annual
growth. As a matter of fact, in 1998 the country ranked below countries with lower GDP and
GNP, such as Perú, Nigeria, or Zambia (Corredor Martínez 1998, pp.124-125).
Wealth and income disparities were acknowledged notorious characteristics of the
Colombian economic model, in fact.
23 Extreme poverty is defined as having an income of less than $1 dollar per day. 24 This one was lead by President Andrés Pastrana and was under discussion by the time of the seminar.

46
- Five financial groups controlled over 92 percent of the financial sector;
- 48 percent of the land is owned by 1.3 per cent of the landowners;
- Four main economic groups own 80 percent of the media;
- the richest 20 percent of household have 60 percent of the total income (Corredor
Martínez 1998 Vol.I, p. 87).
The level of poverty associated with income distribution is higher that the region’s average
(Fresneda B., Sarmiento Anzola, and Muñoz 1991; Urzúa and Palma R. 1997);. By 1988, the
richest 20 percent received thirty-five times the income received by the poorest 20 percent.
Figure 14 illustrates the gap between the richest and the poorest for the 1980s and 1990s.
0
10
20
30
40
50
60
70
1980 1986 1990 1991 1992 1994 1997 1999Year
Perc
enta
ge o
ver t
otal
Inco
me
Quintil1 (poorest)
Quintil2
Quintil3
Quintil4
Quintil5 (richest)
Source: data from BADEINSO, Base de Estadísticas e Indicadores Sociales, CEPAL
Figure 14: Colombia’s Income Distribution gap, 1980-1999
The markedly unequal income distribution reduces Colombia’s overall human development
rating. In fact, the country’s Human Development Index (HDI) dropped 11 points between 2000
and 2001, placing Colombia 68th among the 174 countries covered by the index (High
Commissioner for Human Rights 2001, p.17). Table 17 shows Colombia’s HDI before and after
adjusting for income distribution, for most of the 1990’s.

47
Table 17: Colombia: Human Development Index adjusted by Income
Year IDH IDH adjusted by /Income 1994 0.63 0.555 1995 0.65 0.5675 1996 0.65 0.5675 1997 0.66 0.57375 1998 0.65 0.5675 1999 0.65 0.5675
Source: data from DNP, Socio-demographic indicators, Social Indicators System.
As measured by the GINI index25, Colombia also presents a higher level of income disparity
than most countries in the region, rising above 50 points. Table 18 presents Colombia’s GINI
index for the 1990s, as reported by different sources.
Table 18: Inequality in Colombia: GINI Coefficient
Year/source DNP a. World Bank b. Roa-Mejía c. HDR2000 d. DANE e.
1988 0.554 0.512 1990 0.460 1991 0.554 0.473 0.550 1992 0.564 0.485 0.564 1993 0.584 0.478 0.560 1994 0.569 0.493 0.570 0.569 1995 0.556 0.485 0.560 0.556 1996 0.484 0.530 0.54 1997 0.510 0.560 0.56 1998 0.580 0.532 0.563 0.563 1999 0.532 0.560 0.560 2000 0.560
Sources: a. Misión Social del DNP, 1998; b. World Bank country report, Poverty in Colombia, 1994 and on-line database consulted 2004; c. Alfredo Roa Mejía in de Miranda-Parrondo (comp.), 2002; d. Human development report 2000; e. DNP-UDS-DIOGS, based in DANE.
As early as in 1977, a study from Yale University revealed that more than two-thirds of
overall inequality in Colombia was attributable to labor income (Fields 1977). This trend
25 Remainder: the GINI index, measures the extent to which the distribution of income (or, in some cases, consumption expenditure) among individuals or households within an economy deviates from a perfectly equal distribution. The scale goes from zero representing perfect equality to 100 representing perfect inequality (World Development Report, 2000:276).

48
continued and deepened with urbanization as more people’s total income depended on the work
they do.
Inequality in Colombia has a lot to do with the labor market structure and performance; in
fact, access to employment might deepen the inequality gap. Figure 15 illustrates this last
argument; it is possible to see that while unemployment has affected all levels of income, the
most affected are those at the lowest levels.
Source: data from DNP, social indicators system: SISDEO.
Figure 15: Unemployment rate by Income Deciles, 1996-2000
The next sub-section further explores the national trends in employment, unemployment and
participation in the informal sector. 3.3.2.1 Employment, unemployment & informality (quasi-employment) Understanding that the main income source for most Colombians is what they do, their work, it
is possible to comprehend the deep impact that the structure and performance of the labor market
has in the social, political, and economic life of the country. In Colombia, employment, or its
underdeveloped version, underemployment, has been concentrated in urban areas, attracting
continuous migration from the countryside in search of means of subsistence and safety.
0
5
10
15
20
25
30
1996 1997 1998 1999 2000
Une
mpl
oym
ent r
ate
Decil 1(poorest) Decil 2 Decil 3 Decil 4 Decil 5 Decil 6 Decil 7 Decil 8 Decil 9 Decil 10 (richest)

49
In 1984, 67.3 percent of the national employment was generated in cities, while only 32.7 in
rural areas, of total urban employment, 82 percent was located in the private sector and 18
percent in the public sector. More than two-thirds of the urban employment was located in
services and only 5.3 percent in manufacturing and 4.3 percent in construction. By that time, the
informal sector already provided 21 percent of the urban employment (Ocampo and Ramírez
1987, Vol.1,pp.62-65).
The Cherney report, conducted in 1986, recommended enhancing the national industry in
order to provide quality employment, and regulate and control the labor market. According to the
report, the country had two parallel economies, the formal and the informal, which had strong
and unregulated ties. The report warned the policy makers of the need to incorporate the informal
economy and its labor into the formal economic system of the country (Ocampo and Ramírez
1987, Vol.2). As it will be seen, the recommendations of the report were quite pertinent. For a
distribution of the labor market by activity please see Appendix B.
In the 1980s, the Colombian unemployment rate rose steadily from 8.4 percent in 1981 to
14.9 percent by June 1986. This trend continued during the 1990s, reaching the highest level ever
recorded (15.9 percent for the last quarter of 1998 and 19.8 percent for the second quarter of
1999). Those most affected were women and young people (Montenegro and Peña 1999).
By 1985, the size of the economically active population reached 11.3 million people, or 38
percent of the population. This represented an average annual growth rate of 3.9 percent from
1973 to 1985, with women and youths accounting for most of the increase. One-third of the
labor force consisted of women, many of whom were housewives who had recently entered the
job market. The rise in the number of young workers constituted the other significant
demographic development. Because of the influx of relatively uneducated and unskilled young
workers into the labor market, many youths found it impossible to gain employment.
Unemployment grew much faster than employment.
Figure 16 illustrates unemployment rates by head of household and gender. Table 19 presents
the occupation and unemployment rates in seven Colombian metropolitan areas by gender, from
1991 to 2000.

50
Source: DANE, Departamento Administrativo Nacional de Estadística (Department of Statisticts, Colombia)
Figure 16: Unemployment rates by Head of Household and gender, 1976, 1984, 2003
Table 19: Employment and Unemployment Rates in seven Metropolitan Areas (1990s)
Bogotá, Medellín, Cali, Barranquilla, Bucaramanga, Manizales, and Pasto
Men Women
Year Employed Unemployed Employed Unemployed 1991 69.0% 7.4% 40.6% 13.1% 1992 69.4% 6.5% 41.4% 12.6% 1993 70.7% 5.3% 42.7% 11.0% 1994 70.3% 4.9% 41.2% 11.2% 1995 69.1% 6.8% 41.8% 11.3% 1996 66.1% 9.6% 40.0% 15.1% 1997 65.5% 9.8% 41.6% 15.1% 1998 63.9% 12.5% 41.6% 18.0% 1999 61.1% 17.2% 41.7% 23.3% 2000 61.4% 16.9% 43.1% 24.5%
Source: Fedesarrollo, 2001, “Indicadores de Empleo”, Coyuntura Social, [http://www.fedesarrollo.org.co], and Maruri (2001).
81.7 80.269.7
18.3 19.830.3
1976 1984 2003
Men Women

51
As the formal labor market deteriorates, the informal sector26 becomes a fundamental
survival strategy for poor households, and in many cases for the middle class. In the case of
Colombia, one source of informal employment that has been understudied is the economy of
drugs;27 although, it has been estimated that returns from the drug market account for about 2.0
to 2.5 percent of the national GDP per year (The Economist Intelligence Unit 2003).
The unemployment problem is “resolved” on the ground through informal employment. To
show the severity of the labor market deterioration, it has been estimated that at the end of the
twentieth century, more than 60 percent of the nation’s economically active population (EAP)
“worked” in the informal economy, and more than two thirds of that percentage were located
within the subsistence margins (Morley 2001; CODHES; Jorge E. Rojas Rodríguez. [et al.] 1999;
Flórez Nieto 2002; Velásquez C. and González R. 2003; López Castaño 1996, 1993).
Although there are differences in the estimates of the informal sector’s evolution and size due
to the difficulty of collecting data, and to differences in the definition of the sector itself, its
dramatic increase is recognized by all. Depending on the source, by 1984, the size of the
informal sector was estimated to be between 47 to 55 percent of the total economy. By 1996,
between 38 to 54 percent; and by 2000, between 47 to 61 percent (Flórez Nieto 2002, p.15).
Table 20 presents the percentage of informal workers in seven metropolitan areas from 1986 to
2000.
Table 20: Informality rate in seven metropolitan areas
Source: Fedesarrollo, 2001, “Indicadores de Empleo”, Coyuntura Social, [http://www.fedesarrollo.org.co], Maruri, E. (2001); López Castaño (1996).
26 The term informal economy covers a set of heterogeneous activities, from unpaid labor to any number of unregulated salaried jobs In most cases, it includes all small enterprises with 10 employees or less, self-employees, domestic servants and familiar employees without remuneration (CODHES; Jorge E. Rojas Rodríguez. [et al.] 1999). 27 The author is not aware of any study that evaluates the drug market as a source of “employment” as of the date of publication.
City 1986 1992 1996 2000 Bogotá 52.1% 50.40% 49.10% 57.80%Medellin 51.9% 51.80% 49.240% 55.70%Cali 58.0 53.20% 56.10% 63.10%Barranquilla 62.2 61.70% 58.80% 68.20%Bucaramanga 66.3 65.20% 62.40% 68.70%Manizales 53.7 52.10% 50.10% 60.90%Pasto 70.8 70.10% 67.90% 70.60%

52
Between 1996 and 1998, informal sector participation grew 2.8 percentage points and 3.2
million people were employed in the informal sector (Henao V., Rojas D., and Parra R. 1999,
p.10). A study conducted by CODHES in 1999 established that the displaced populations mostly
enlarged the already large informal sector, adding another ring to the circles of poverty in the
cities (CODHES; Jorge E. Rojas Rodríguez. [et al.] 1999). Figure 17 illustrates the percentage of
working-age population employed in the informal sector from by gender. Figure 18 illustrates the
percentage of the population in the informal sector by age.
46
48
50
52
54
56
58
60
62
1992 1994 1996 1998 2000
perc
enta
ge
Total Men Women
Source: data from Dane, ENH, e. 76 to 108
Figure 17: Percentage of EAP in the informal economy by gender
0 20 40 60 80 100
1992
1994
1996
1998
2000
Year
% informal of overall EAP
80+
60-69
50-59
40-49
30-39
20-29
15-19
12-14 years old
Source: data from Dane, ENH, e. 76 to 108
Figure 18: Percentage of EAP in the informal economy by age

53
There are many factors that cause the deterioration of the labor market, though it is clear that
economic and social conditions are clearly intertwined in the Colombian case. First, there is a
clear connection between the increase in unemployment and the deterioration of the economy’s
growth, caused by macroeconomic and political factors. Second, there is a clear connection
between the increase of poverty and inequality in the cities caused by the increase in violence
and the polarization of the long lasting conflict in the country (García Rojas 1990; Montenegro
and Peña 1999; Harasty and Schmidt 2003).
Two additional elements must be considered in order to fully understand Colombia’s
complex situation; the Neoliberal reform that deeply affected the country’s economy, and the
political reform expressed in the New Constitution of 1991. The next section reviews both.
3.4 REFORMS: MARKET DEVELOPMENT AND DEMOCRACY;
OR, CAIN VS. ABEL?
The need for institutional reforms in Colombia is self-evident. The social contract continues to
be threatened by growing social unrest, and several failed trials to endorse peace agreements
have proven that without deep changes in the country’s political structure, peace and
development will not be possible (Alesina 2000). The New Constitution of 1991 was for many
the needed change; after a very interesting process lead by the civil society, the Assembly agreed
to change the country’s constitution to enhance democracy and inclusion (Angell, Lowden, and
Thorp 2001). It was a time of hope in the midst of an extenuating hidden war. Decentralization
was among the important changes promoted by the new constitution.
Likewise, in the early 1990s the government promoted a wide and profound economic
reform. The “Apertura”, as it came to be known, aimed at enhancing the role of the market in the
country’s development, and at clearly limiting the state’s intervention in private affairs.
Following neo-liberal prescriptions, the reform liberalized trade, introduced profound changes to
the health and pension systems, and lessened labor market regulations (Montenegro and Peña
1999; Angell, Lowden, and Thorp 2001).
There were important continuous tensions between the two processes of economic and
political reform. The conflict has to do with what is thought to be the priority for the country and

54
with those involved in the promotion of one or the other. Neoliberal and democratic policies are
not necessarily divergent, but their basic principles are different enough to increase confusion
and uncertainty in an already troubled polity, as it is in the case of Colombia.
3.4.1 New Liberalism: the market will create wealth for all
Commenting on Colombia’s economic reforms, and more particularly on the Apertura, S.
Edwards pointed out:
The dramatic opening up of international trade is, perhaps, the most impressive aspect of the Colombian reforms [and] what was supposed to be a slow gradual trade liberalization experiment, became, overnight, one of the most abrupt openings of international trade in the Western Hemisphere (Edwards 2001, p.47-48).
As already mentioned, whilst for most countries in Latin America the 1980s were the lost
decade, for Colombia it was a time of prosperity. Its economic model was definitively working
better than those of its neighbors were (Montenegro and Peña 1999; Angell, Lowden, and Thorp
2001; Berry and Tenjo 1999; Williamson 1994). Even so, a wide and profound economic reform
was promoted by the government in the early 1990s. Some claime that the Apertura was the
result of a political trend promoted by major lender agencies, by which the old protectionist
model was called to an end, rather than the result of an economic crisis (Edwards 2001).
In any case, following New Liberal principles, the role (and the size) of the state in economic
matters was reduced, as the market must be the leading force for development. According to neo-
liberal promoters, by improving the market’s efficiency, wealth will be achieve, and as a result
the entire society will be better off (Múnera Ruíz 2003)28. Equity is not a main concern within
this model (Woller 1994; Gestures against reform 1996). Trade liberalization, abolition of
exchange controls, financial, labor and state reforms, are central measures of the Neoliberal
model and all of these were applied in Colombia (Corredor Martínez 2003; Edwards 2001;
Montenegro and Peña 1999; Angell, Lowden, and Thorp 2001; Berry and Tenjo 1999)
28 For more on this argument please see, Hayek (Hayek 1985), Friedman (Friedman 1981), and the Chicago school.

55
Maybe the most visible symbol of the Apertura was the drastic reduction in tariff and non-
tariff barriers to international trade. In order to open the market, import’ tariffs and surcharges
were drastically reduced; by 1991, less than 3 percent of all imports were subject to import
licenses (Matías Camargo 2001; Callahan and Gunter 1999). Table 21 presents the changes in
tariffs and surcharges that occurred between 1990 and 1992.
Table 21: Goods covered by Colombia’s Tariffs and Surcharges 1990 and 1992
Type of Goods 1990 1992 Consumption goods 53.2% 17.4% Intermediate inputs 35.7% 9.9%
Capital goods 34.3% 10.3% Total 38.6% 11.7%
Source: Hommes, Montenegro and Roda (1994).
Trade liberalization and financial reform attracted a flow of external capital that, with the
enlargement of the State expenditure, increased significantly the demand for particularly
commodities. This was often supplied by imported or smuggled international goods. The country
moved from surplus to deficit in its trade balance, accumulating more than $16 billion dollars of
trade deficit by 1998. Imports were promoted and exports reduced, consequently internal
production was reduced. Many industries moved into commercialization of imported goods and
many others closed (Bonilla González 2003, p.209-210). Figure 19 illustrates changes in the
trade balance during the 1980s and 1990s as percentage of GDP.
Source: data from the IMF, Statistics Yearbook, the World Bank, and OECD.
Figure 19: Colombia’s account balance 1986-2001
Current account balance (% of GDP)
-6 -4
-2 0
2 4 6
8
1986 1987 1988 1989 1990 1991 1992 1993 1994 1995 1996 1997 1998 1999 2000 2001
Percentage

56
Lastly, another factor that aggravated the trade balance in the country was the increase in
government expenditures. Although one of the Neoliberal premises is the reduction of the state,
in size and costs, government expenditure in Colombia grew from 24 percent of the GDP in
1990, to 35 percent in 2000 (Bonilla González 2003, p.211). Between 1991 and 1997, the public
sector went from a surplus of 0.45 percent to a deficit of 3.5 percent. In order to cover this
deficit, the state had to borrow money, which was scarce in the country as the private sector was
also struggling to survive.
The draining of internal resources increased the external debt, particularly for the private
sector, further complicating the trade balance. Figure 20 illustrates the public, private and total
debt from 1986 to 2001.
0
5000
10000
15000
20000
25000
30000
35000
40000
1986
1987
1988
1989
1990
1991
1992
1993
1994
1995
1996
1997
1998
1999
2000
2001
Mill
ion
US$
External debt total Private debt Public debt
Source: Built upon World Development Indicators database, consulted Jan.2005
Figure 20: Colombia’s external debt, 1986-2001
A plausible explanation for the increase in state expenditures is the demand created by the
constitutional reform in regards to social investment. Traditionally, social investment was not a
significant part of the state’s investment. In fact, until 1990, the GDP share of social investment
was lower than the regional average of 9 percent. Between 1977 and 1995, social investment
always grew slower than the total public investment growth. The New Constitution of 1991

57
changed this trend, because by promoting decentralization they changed the amount of transfers
from the central state to the regional and local levels (DNP-UNDP 1998, pp.92-95).
Another important piece of the Apertura’s agenda was the promotion of labor reform, as the
rigidities of the labor market were regarded as a major obstacle for the internationalization of the
economy (Montenegro and Peña 1999; Edwards 2001). According to an evaluation of the labor
reform, one impact was that it reduced the cost of dismissal of an employee with ten years of
service by 56 percent (Hommes, Montenegro, and Roda 1994).
Regarding stability and labor rights, it is said that the flexibility introduced by the labor
reform led to a generalized process of massive layoffs and the substitution of wage-earner
employees for other unprotected and cheaper types of labor. It increased the proportion of
temporary jobs, and deteriorated the economic conditions of workers, reaching levels of
informalization in 2000 higher than those of 1984 (Bonilla González 2003; Flórez Nieto 2002),
as illustrated by figure 21.
0
5
10
15
20
25
30
35
40
1991 1992 1993 1994 1995 1996 1997 1998 1999 2000
Rate
Subemployment rate Unemployment rate
Source: DANE and DNP, Colombia
Figure 21: Colombia’s sub-employment and unemployment rates 1991-2000
As the overall market standards change, the labor market does the same. Highly educated,
experienced, and/or specialized labor is preferred over low skilled labor; the result is the
exclusion of a big proportion of people looking for jobs, due to their level of education or age.

58
Women and youth are the most affected, as women have had less access to education and youth
lack experience (Bonilla González 2003; Robbins 1999). By the year 2000, people under 25,
independently of their level of education, represented 44 percent of national unemployment.
Table 22 presents the national unemployment rate by age, from 1991 to 2000.
Table 22: Unemployment by Age- Total seven Metropolitan Areas 1991-2000 (September)
Age Groups 1991 1992 1993 1994 1995 1996 1997 1998 1999 2000
From 12 to 17 23.8 20.7 18.4 19.1 21 31.8 29.1 33.3 42.2 44.7
From 18 to 24 18.4 18 15.7 14.5 16.6 22 23.7 29.2 36.3 34.8
From 25 to 55 7 6.6 5.4 5.5 6.3 8.8 8.9 11.1 15.4 16
From 56 on 3.9 3.5 3 2.7 4 4.6 5.9 9.2 10.4 14.1
Total 9.8 9.2 7.8 7.6 8.7 12 12.1 15 20.1 20.5 Source: DANE, ENH. www.dane.gov.co (accessed on Jan 2003)
By 1999, unemployment rates among less skilled workers were close to 36 percent. By 2000,
of an estimated 1.4 million unemployed youth, only 49.3 percent finished high school (Báez R.
2001; Bonilla González 2003). Table 23 presents the level of unemployment by level of
education and gender.
Table 23: Unemployment by level of education and gender, 2000
Education Unemployed Men % Women%
none 80,417 46.1 53.9 Preliminary partial 344,103 45 55
Preliminary complete 431,388 43.6 56.4 Middle/High School partial 879,497 42.3 57.7
High School complete 951,918 40 60 College partial 287,267 40.9 59.1
College complete 190,509 46.2 53.8 No answer 5,266 63.9 36.1
Total 3,170,365 1,341,006 1,829,359 Source: Bonilla González (2003, p.225)
Income for those with more than 10 years of schooling grew significantly, while it
deteriorated for those with less education, increasing the income distribution gap, as illustrated
by Figure 22.

59
Source: data from DANE, ENH (households national survey)
Figure 22: Income by years of school 1986-2000
0
200,
000
400,
000
600,
000
800,
000
1,00
0,00
0
1,20
0,00
0
1,40
0,00
0
1,60
0,00
0
1986
1987
1988
1989
1990
1991
1992
1993
1994
1995
1996
1997
1998
1999
2000
Income
0 ye
ars
1-5
year
s
6-10
yea
rs
11 y
ears
12-1
5 ye
ars
16+
year
s

60
Finally, it is also interesting to notice that in Colombia, the relation between economic
growth and growth in employment is not directly proportional. While in times of crisis
employment growth decreased, as expected; in times of economic growth, employment increased
proportionally or sometimes not at all, as illustrated by Figure 23.
-10.00
-5.00
0.00
5.00
10.00
15.00
20.00
25.00
1986 1987 1988 1989 1990 1991 1992 1993 1994 1995 1996 1997 1998 1999 2000
Per
cent
age
GDP growth rate Unemployment rate
Source: data from World Bank national accounts, OECD National Accounts data files and DANE, ENH. www.dane.gov.co (accessed on Jan 2003).
Figure 23: Colombia’s GDP growth rate and unemployment rate, 1986-2000
There are important differences in the evaluations of the economic reform, yet what appears
very clear is that after 15 years of continuous reform, the economy is in worse conditions than in
the beginning. It may be because it has not been properly implemented, as argued by Biglaiser
and Derouen Jr. (2004), or because it was not the priority change needed, as argued by Woller
(1994), or because it was the wrong economic model to follow, as argued by Restrepo et al.
(2003).
Independent of the righteousness or inadequacy of the model, the neo-liberal reform added a
lot of pressure and uncertainty to an already troubled environment; it came at a time of political
unrest and negotiations, and in parallel to the New Constitution of 1991, which created great
expectations regarding political, social and economic participation and the state’s role.

61
3.4.2 The New Constitution: Let us reinvent the country
The New Constitution of 1991 is another source of debate in the country; it is criticized and
praised from people located in all positions within the political spectrum. What everyone agrees
on is that La Nueva Constitución, as it is called, has had great impacts on the political and
economic life of the country. In order to understand its significance, it is essential to review
Colombia’s recent political history.
Violence may be the most salient characteristic of Colombia’s political history, from ancient
times to the present. Nevertheless, there was a period in the country’s recent history so violent
that it came to be known as La Violencia.29 It was a violent confrontation between members of
the liberal and conservative parties, who were convinced that the enemy was anyone representing
the opposite political party (Melo 1991; Guzmán, Fals Borda, and Umaña Luna 1962).
It began with the increasingly emotional campaigns of the two political parties, liberals and
conservatives, which exacerbated the unhealed wounds from previous wars. The tension grew
and the few mechanisms that did regulate political differences where destroyed and replaced by
an armed conflict that affected mostly rural communities (Guzmán, Fals Borda, and Umaña Luna
1962). The beginning of La Violencia was aggravated by the assassination of Jorge Eliecer
Gaitán, a popular liberal leader that symbolized the hope for social and political change,
particularly for the working class.
Gaitán was assassinated in Bogotá on April 9 of 1948, and the city went through a terrible
journey known as El Bogotazo. The assassination of the political leader of the emerging urban
middle class provoked a terrible response from his followers, who expressed their anger by
attacking churches, as they blamed the conservatives for his death. After that, the church put all
its institutional weight on the side of the conservative government; liberals were denied the
sacraments and one bishop even threatened to excommunicate those who voted liberal (Sánchez
G. and Peñaranda 1986).
The country was all suddenly in the midst of an unrecognized civil war, which neither the
government nor leaders of the political parties assumed responsibility for. The Conservative
party in power did not openly support the increasing violence against liberals, nor did it openly
29 Sadly enough, there is at the present time a higher level of violence than during La Violencia; it is still to know what name would the historians choose for naming what is happening today in Colombia.
62
oppose it. In fact, conservative peasants could seize the land of liberals with impunity, and no
liberal was guaranteed their basic rights (Kline 1995, p.44; Melo 1991, p.391). Consequently, as
mentioned by Melo, it was a war without rules (Melo 1991, p.390).
The absence of any regulation of the conflict caused the emergence of unexpected forms of
governance, such as the creation of an alternative government. On June 18, 1953, a guerrilla
assembly approved an unofficial constitution for guiding the government of the Orinoco plains,
and declared itself liberated from the conservative government. The liberals who were suffering
prosecution because of their political affiliation celebrated the gesture.
A hierarchy of governmental bodies was created, and for many years after the end of La
Violencia, the district councils created by the liberal guerrilla assembly were the main
government for communities living in the zone. People looked to them to solve communal
concerns, from services delivery to the administration of law (Melo 1991; Dix 1987; Arocha and
Sánchez G. 1987). This is an important antecedent for understanding the complexity of the
system of governance in the country. As of today, there is a piece of the country that remains
“liberated,” the República de Marquetalia, governed by the FARC-Fuerzas Armadas
Revolucionarias de Colombia.30
It is estimated that during La Violencia, which historians often locate between 1945 and
1958, more than 200,000 Colombians, mostly peasants, were killed (Arocha and Sánchez G.
1987; Kline 1996; Melo 1991). La Violencia officially ended in 1958 with the creation of the
Frente Nacional (National Front) by the two existing parties, after a brief period of Colombia’s
only military dictatorship of the twentieth century. 31
The National Front was essentially an agreement to divide all national power equally
between the two parties and to exclude any other political force. Only the traditional parties had
authorization to represent political interests (Vázquez Carrizosa 1986; Bushnell 1993; Kline
1995). The agreement included the alternation of the four-year presidential term, and the division
of ministerial jobs and Congressional seats between the two parties (Kline 1995, 1996).
As mentioned by Bushnell (1993, p.224), for some outside observers and some Colombians,
the National Front rules represented, by nature, the very opposite of democratic principles.
30 Colombian Revolutionary Army 31 By General Gustavo Rojas Pinilla, 1953-1958.

63
Nevertheless, this is how “democracy” was guaranteed from 1958 to 1974. This type of
arrangement is known as consociational democracy (Kline 1996).
Consequently, the political duopoly institutionalized by the National Front was enforced by
repressing any other political expression in the country. The state of siege became almost
permanent, decisions were overcentralized, and public security became a permanent function of
the military. Violence continued to be a common “political” practice (Arocha and Sánchez G.
1987, p.45). Additionally, due to this institutional framework, political competition became
factions’ competition and factionalism flourished as never before, as did clienteles (Arocha and
Sánchez G. 1987; Melo 1991).
At the end, this exclusive arrangement led to a gradual decline of the political legitimacy of
the elites, as manifested in the electoral apathy and the rise of marginal resistance to the political
system (Melo 1991). The percentage of voters who participated in congressional elections fell
from 60 percent in 1958 to 31 in 1968, and the participation in presidential elections fell from 50
percent in 1958 to 34 in 1966 (Lozada L. 1980). The credibility of elections, if reflected by
number of voters, had never recovered.
Finally, the gap between the state and civil society was expressed by the occurrence of over
340 paros cívicos (civic strikes) between 1971 and 1990 (García V. 1990; Giraldo, Camargo, and
Naranjo 1985; Nickson 1995). Rural and urban communities articulated their common unrest
through the paros, and they became events in which social strata and cultures were mixed.
Finally, the whole paro experience became a new and very needed political space. There were
paros promoted by the church, civic boards, students, peasants, native Colombians, and other
groups (Giraldo, Camargo, and Naranjo 1985).
The 1980s were also a time of profound violence. The death rates during this decade were
higher than those during La Violencia (Kline 1996, p.22). Yet they were also a time of a very
active civil society. In 1983, a national assembly of civic movements and popular organizations
called for measures that enabled real participation at the local level, based on the assumption that
political involvement was likely to be easier at the sub-national level (Nickson 1995).
In response to the civil society’s increasing pressure, and in order to recover some
legitimacy, modernizing factions within the political parties promoted important political
reforms. In 1983, the regional tax system was restructured and popular elections for mayors were
established by legislative Act 1 of 1986 (Correa and Steiner 1999). Decentralization was a

64
central point in the peace discussion between the government and the FARC;32finally, in March
of 1988 the first direct elections of mayors in over a century took place (Nickson 1995, p.146).
The direct election of mayors represented two important political changes for the country.
First, the mayors were no longer agents of the governors, who were agents of the president. This
became a real opportunity to modify the political culture of the National Front (Urzúa and Palma
R. 1997). Additionally, as people gained access to even few resources, and had the ability to
elect local authorities, the social forces that were marginalized from the political arena gained
strength. This started a campaign to reform the constitution to ensure a more inclusive
democracy (Velásquez C. and González R. 2003), or maybe just a democracy.
In 1988, the constitutional reform was submitted for the consideration of the two houses of
Congress, who dismissed it after two debate sessions. Civil society responded against Congress.
A new student movement, which came to be known as the séptima papeleta movement, 33
promoted a campaign for electing a National Constituent Assembly with the authority to rewrite
the constitution. The students called upon voters to include an extra ballot when they voted in the
March 1990 Congressional elections. This signified that they supported the creation of a National
Constituent Assembly; close to two million of “extra” ballots were submited (Angell, Lowden,
and Thorp 2001).
The political elites had no other choice than to include a formal ballot for a plebiscite in
regards to the creation of a National Constituent Assembly empowered to change the
constitution. On May 27, 1990, the day of the presidential election, 4,991,887 Colombians voted
yes on the following question (Kline 1995, p.68):
In order to fortify participatory democracy, do you vote for the convocation of a constituent assembly with representation of social, political, and regional forces, integrated democratically and popularly, to reform the Constitution of Colombia? 34
The elections for the National Constituent Assembly were held in December 9 of 1990, and
the results were reflective of the socio-political moment at which they took place, as mentioned
by Angell, Loweden and Thorp (2001, p.27). The 74 seats of the assembly were distributed as
32 As mentioned by Jaime Castro who was the Minister of Government at that time. Interviewed on Nov. 10, 2003. 33 Alluding to the extra ballot that was added to the ballot box addressing the citizens’ will to reform the constitution. 34 Translation by the author from Matía Camargo 2001, p.42.
65
follows: the Liberal party was granted 25 seats; the Alianza Democrática M-19 (a reinstated
urban guerrilla movement) was given 19; the Movimiento de Salvación Nacional
(Conservatives) were given 11; the Partido Conservador (Conservatives) were given 5; the
Independent Conservatives were given 4; and 10 were reserved for small and minority groups.
The assembly had three joint presidents, which were: liberal leader Horacio Serpa, AD M-19
(a former guerrilla movement) leader Antonio Navarro, and Conservative leader Alvaro Gómez
(Angell, Lowden, and Thorp 2001, p.28). It is agreed among academics, members of the
assembly, and politicians that the formulations of the New Constitution reflected a complicated
bargaining process among disparate factions (see for example, Zalamea 1991; Matías Camargo
2001; Angell, Lowden, and Thorp 2001; Revéiz 1997). The New Constitution was promulgated
in July of 1991 Kline gives the following description of the event:
On July 4, 1991, there was a rush of euphoria as the Constituent Assembly presented the New Constitution. After the signing, as the national orchestra played Handel’s ‘Hallelujah Chorus,’ television viewers saw members of the assembly —men and women, former guerrillas and kidnapping victims, indigenes and members of the oligarquía, Roman Catholics and representatives of the evangelical movement— embracing each other (Kline 1995, p.137).
The New Constitution’s most important concerns were enhancing democracy, decentralization
and participation; its article first states:
Colombia is a legally organized social state under the form of a unitary, decentralized Republic with autonomous regional entities, democratic, participative and pluralist, founded on the respect of the human dignity, in the work and the solidarity of the people who integrate it and in the prevalence of the general interest (Constitución Política de Colombia 1991). 35
The Colombian nation was defined as decentralized and several articles granted a new degree of
political and financial autonomy to local governments. It established popular elections for
governors and promoted the creation of new territorial entities, such as regions (groups of
Departments), Provinces (groups of municipalities), Special Districts, Metropolitan Areas and
Indigenous territories, among others. A new territorial law would define the new political and
administrative structure, which sougth to promote autonomy and democracy close to its
constituencies (Correa and Steiner 1999). The New Constitution formally decentralized the State,
as mentioned by Campbell (2003).
35 Translated by the author.

66
In order to further enhance democracy, the New Constitution called for the development of
what are called ‘Human Rights of third generation.36 Additionally, it strengthened the
administration of justice with the provision of a new accusatory system, similar to the American,
for replacing the previous Napoleonic model. It created the Fiscalía General de la Nación,
similar to the U.S. Attorney General, to coordinate all law enforcement in the country; and also
the Defensor del Pueblo, similar to the U.S. Ombudsman (Kline 1996; Angell, Lowden, and
Thorp 2001). The New Constitution introduced new mechanisms for citizens to participate, such
as local referendums, consultation and open town meetings, the right to remove mayors and
governors from office, public watch boards, and a place in the municipal planning council
(Velásquez C. 1994).
The New Constitution included special provisions for Bogotá, with the aim of closing the gap
between the city’s growth and its institutional development. The status of the city was changed
from D.E. Distrito Especial (Special District) to D.C. or Distrito Capital (Capital District) to
grant the city’s political, administrative, and economic autonomy. Decentralization was
considered key for the new city (Zubiría Samper 1994; Castro C. 1991). Transitory article No. 41
of the New Constitution mandated the Congress to legislate the new regimen by June of 1993.
As the Congress did not accomplish this goal, a presidential decree promulgated the Régimen
Especial para Santafé de Bogotá (the city’s new special regimen) on July 21 of 1993.
The New Constitution brought great expectations in all corners of the country, particularly
regarding the opening of the political system and the search for a more balanced representation
of interests. The results of the New Constitution, and the Constitution itself, are a source of
debate in the country; in general, there is disappointment about what has been achieved.37
Many contradictory arguments exist that try to explain the level of achievement, illustrate the
debate, and present the many questions that remained unanswered:
° The process of legislating the constitutional ruling has been captured by those
interested in keeping the power concentrated (Velásquez C. 1994, p.34);
36 Human rights of the third generation are more systemic, Vasak mentioned five related rights—the right to development, the right to peace, the right to environment, the right to the ownership of the common heritage of humankind, and the right to communication (Vasak and Alston 1982). 37 For a serious evaluation of the New Constitution’s positive and negative effects see Alberto Alesina Reformas Institucionales en Colombia (Alesina 2001).

67
° The legislation has been inconsistent, regarding the distribution of functions and
resources and policy guidelines (Correa and Steiner 1999, p.240);
° The New Constitution created an economic structure inconsistent with an efficient
and impersonal modern economy (Edwards 2001, pp.54-55);
° For some, the persistence of the institutional crisis, even after reforming the
institutions, proves that what needs to be changed is the Colombian political class
(Revéiz 1997, p.83);
° The fiscal deterioration faced by the country in the 1990s is a consequence of changes
in the amount of transfers from the central government to the regions and
municipalities mandated by the New Constitution (Alesina, Carrasquilla, and
Echavarría 2000);
° The fiscal deterioration has been caused by the excess of centralism and the resistance
to cede power. The central state bureaucracy has grown from representing 28 percent
of the national current income in 1987 to 35 percent in 1995 (Castro, Jaramillo, and
Cabrera Galvis 2001; Jaramillo Pérez 2001);
° There is a vacuum of accurate information regarding the results of the process, and
there is not enough systematic research regarding it (Maldonado 2000).
It is likely that the process is just beginning, as mentioned by Velázquez (1997); or perhaps, as
mentioned by Angell, Lowden and Thorp (2001, p.39), the intensity of the national debate shows
that, in fact, the political reform is beginning to make a difference. In any case, a good summary
of the current feelings, after all the expectations created by the political reform, is presented by
Edwards:
What is clear, however, is that the reformist enthusiasm and euphoria of the early 1990s are no longer there and that, as a consequence of a combination of factors, Colombia has seen its political, economic and social circumstances greatly deteriorate. (Edwards 2001, p.89).
Bogotá appears to be eluding this description as there is a certain shared perception of success in
regards to the city (see for example, Echevarría S., Rentería, and Steiner 2002; Jones 2002; Rojas
2002). Some examples of its achievements are, it was the first city in Latin America in signing a
credit with the World in 1996. In June of 2000, it was awarded the Stockholm Challenge Prize

68
for Environment. In October 2002, the World Health Organization recognized its efforts in the
reduction of violence; and in 2003, it was awarded a prize as model city from the UN.
How could this be? Does this reflect a successful process of decentralization? How has the
city’s system of governance changed? Has it changed? What are the lessons that the city has to
offer? Undoubtedly, within the regional and national contexts, Bogotá is as an interesting case
for learning about institutional and political change. The next chapter presents a general
introduction to Bogotá, as Part 3 is dedicated to describing and analyzing what has happened in
the city regarding the process of implementing a decentralization policy, and its impacts on the
system of governance.

69
4.0 BOGOTÁ: IS A CITY CLOSE TO THE STARS, OR JUST FAR FROM HELL?
“A beautiful landscape that could be the envy of the world’s best cities, a chain of mountains that frames the city, an ideal weather, superb sunsets, rivers and streams crossing the city and the land, an awe-inspiring vegetation with a great variety of flowers…What else could one ask for? Is this perhaps the paradise? It could be, but no, it is almost hell.”
Cepeda Ulloa (1995).38
Located on the highest plateau in the Colombian Andes, nearly 2,700 meters (8,660 feet) above
the sea level, Bogotá D.C., Colombia’s capital, was founded by Gonzalo Jiménez de Quesada on
August 6, 1538. It occupies an area of 173,000 hectares in one of the most fertile soils on earth.
By the year 2000, it had a population of 6.5 million inhabitants, which represented around 17.5
percent of the country’s population. The city is divided in 20 localidades (administrative and
political units), each one headed by an alcalde local (local mayor). In 2002 the most populated
locality was Kennedy with 951,330 inhabitants; the least, La Candelaria had 27,450 inhabitants
(Fundación Corona 2003, p.34).
The City Council and the Mayor head the government and are responsible for the
administration of the city. The Council, with 40 members, 1 councilor for every 150,000
inhabitants, is the legislative branch of the local government and is in charge of the vigilance and
control of local authorities. The Mayor is the head of the executive branch, directly elected for a
four-year term.39 The alcaldes locales (local mayors) are indirectly elected. It is the
responsibility of each Juntas Administradora Local or JAL (local administrative assembly) to
present three candidates to the city’s Mayor, from which he chooses the local mayor.
The size and growth rate of the city’s population, and its diversity, are critical elements for
understanding its complexity. Figure 24 presents a map of the city’s population by localidad and
38 A free translation from the author. 39 Bogotá's mayor used to be appointed by the national president until March of 1988; the length of the mayor’s term was change from three to four years in 2000.

70
figure 25 shows the population growth rate by localidad in 2000. Bogotá’s map is traditionally
presented with the north on the left, as a chain of mountains on the east serves as the main point
of reference for the city’s life.40
Source: DANE 2004
Figure 24: Map of Bogotá and population in its 20 localidades
Source: Bogotá Cómo Vamos 2000
Figure 25: Population growth rate by localidad
40 For more maps and more info on the city please visit: http://www.segobdis.gov.co/localidades_inf.htm

71
The city’s amazing mixture of poverty and prosperity, Maseratis and mules, makes it one of
the world's most chaotic, fascinating and aggressive metropolises.41 Bogotá is a multicultural
setting, with high levels of migration, big social differences, and modern ideas that coexist with
not old-fashioned power structures. While Bogotá has most of the general characteristics of other
cities in Latin America, it presents interesting deviations from the region’s pattern, making it a
rather interesting case to examine, as mentioned by Gilbert and Dávila (2002, p.52).
First, Bogotá entered very late into the regional pattern of the capital’s primacy. It is only
until the second half of the twentieth century, that it became the prime city in the country. Its
growth, demographic and economic, granted it predominance over other major regional cities.
According to data from regional accounts, from 1980 to 1995 the country moved to a period of
urban primacy in which Bogotá established as the country’s main economic center (DAPD 1999,
p.138). Nevertheless, Bogotá still has to compete with a number of regional rivals that control
important political power in the Congress. Thus, Bogotá shares “prime” characteristics with
cities like Buenos Aires or Mexico D.C., but it also shares some with secondary cities as
Guayaquil.
Second, Bogotá’s steady pace of population growth is bigger than most any other large Latin
American cities. Bogotá quadrupled its population between 1951 and 1973. Its annual population
growth rate was 7 percent between 1951 and 1964, and 6 percent between 1964 and 1973
(Dureau et al. 2002, p.336). Between 1985 and 1990, the city registered a demographic growth
rate of 3.0 percent per year, while the country’s population growth was only 2 percent (Puyo
Vasco 1992, p.245). Bogotá is as dense as New York City with more than 100 people per hectare
(Mohan 1994, p.40).
Third, regarding the city’s management, it is claimed that Bogotá has had the advantage of
having strong economic interests groups that have not allowed the political parties and factions
to obstruct the city’s development, at least in terms of its infrastructure. According to Gilbert and
Dávila, Bogotá’s economic interests have been protected by an undemocratic and technical
bureaucracy that was effective in improving the city’s services (Gilbert and Dávila 2002, pp. 52-
57). The city has had a very centralized government with a history of functional decentralization.
Fourth, regarding the city’s finances, Bogotá has had access to enough resources to finance
major development projects. It has had the option of borrowing money from abroad since the
41 A comment on the city from: http://www.bogota-dc.com/history/bog-his.htm

72
early 1970s. Between 1971 and 1976, credits financed about 60 to 90 percent of investments.
The availability of resources has been a critical element for preventing or at least maintaining
control over the political and social struggles. From 1986 to 1995, the public debt of the city
grew 687.4 percent (Contraloría Distrital 1996, p.13).42
Nevertheless, as mentioned, Bogotá was the first Latin American city in signing a credit with
the World Bank, and it has received several awards that indicate the contradictory visions that
the city generates. A first look into the city’s process of urbanization, its economic performance,
and its path to reforms may provide some clues for understanding its complexity and
contradictions and serve as an introduction to the research findings. However first it is important
to review the first distinctive element for the country and the city, violence.
4.1 A NOTE ON VIOLENCE: HELL HAS SEVEN RINGS
Historically people have climbed the mountains to come to Bogotá in search of protection, and,
in relative terms, the city has been safer than any of the other main cities, particularly in the last
two decades of the twentieth century (Gutiérrez, Guzmán, and Jiménez 2000). Nevertheless, in
regards to safety, the city presents another interesting contradiction, as mentioned by Gilbert and
Dávila, high rates of crime and violence are among the most prominent problems in the city
(2002, pp.29-30).
Criminality grew and average of 5 percent from 1985 to 1994, although the city’s homicide
rate presents significant improvements when compared with the country average. In 1993,
Bogotá had 4,452 homicides, less than 2,000 in 2001, and 1,902 in 2002. Bogotá ranks far better
than other major cities in the country, in particular Medellín and Cali, but worst than most Latin
American cities (DABS; PUJ 2003, p.37).
Figure 26 illustrates the reduction in homicides and vehicle accidents in Bogotá from 1992 to
2002.
42 My emphasis.

73
3352
4452
3885
3363 3303
28142482 2477
22381993 1902
1284 1260 1341 1387 1301931 914 878 834 745 697
0
1000
2000
3000
4000
5000
1992 1993 1994 1995 1996 1997 1998 1999 2000 2001 2002
Hom
icid
es
Homicides Vehicle accidents
Source: DABS, (2003, p.37).
Figure 26: Bogotá, homicides and vehicle accidents 1992-2002
The last wave of migrants, the desplazados, added many pressures to the city. They created a
significant increase in the demand for services, that the city may not have been prepared to fulfill
The worsening conditions of the country’s public order brought Bogotá closer than ever to the
country’s problems, from which it appeared to have been safe and isolated (Gutiérrez, Guzmán,
and Jiménez 2000).
New and already existing aggravating factors, that undermine the minimum identity required
to constitute a polity, appeared or became visible in the city: the decline of civic organizations,
capable of canalizing social conflicts and demands; the profound socio-economic divisions
deepening; and the growth of poverty despite the city’s economic performance (Segovia Mora
1994).
The city has invisible frontiers: the north where the rich live generally wealthy and safe. The
south is generally poor and the south east is particularly poor. El centro, downtown, is the
government’s base during the day, and the marginales’ land in the night.43 The welfare of the
city changes as one goes from north to south (Salazar J., Useche A., and López l. 1998; DAPD
1996; Campos and Ortiz 1998).
43 As a reminder, marginales, are those that live in the margins, and there are many types of margins.

74
4.2 URBANIZATION: FROM RIVALING TO RULING
In order to understand the process by which Bogotá became a primary city, in a country known
as cuadricephalic for most of the twentieth century, one must look at its demographics as well as
its economic performance, two elements that are deeply intertwined. Bogotá’s pace of
urbanization has been greatly impacted by its demographics. It has, as of today, one of the
highest rates of annual population growth in Latin America and historically, has had the highest
rates of migration in the country.
It has been estimated that by 1980, close to 50 percent of the city’s population were
immigrants; 1,950,000 inhabitants, which represented more than a third of the total migrant
population in the country (Gouëset 1998, p.65). The first wave of rural immigrants (from 1964 to
1973), accounts for more of the duplication of the city’s total population, which amounted to 3
million inhabitants in 1973 (Dureau et al. 2002; Rincón Mesa 1999).
An important change occurred in the second wave on immigrants, as most of them were
coming from other urban areas. From 1980 to 1985, 53 percent of the newcomers were coming
from regional capitals (Dureau et al. 2002, p.338). The variation in the migrant’s place of origin
represented great variation in the ways that people were integrated into the city’s systems and the
impact that different waves of immigrants had on them.
In conforming with regional trends, the majority of immigrants, despite their origin, were and
still are, young and women (Dureau et al. 2002). According to reports from HABITAT, social
change and widespread rural poverty meant a disproportionate number of young women seeking
employment in large cities. In Colombia, violence exacerbated this trend, increasing the number
of female migrants. By 1993, there were 93 males for each 100 females living in Bogotá (Dureau
et al. 2002, p.44).
To see the increase in women immigration, please see Appendix C, which presents the city’s
total population growth by gender from 1964 to 2000. Table 24 illustrates growth and migration
rates for Bogotá between 1970 and 2000.

75
Table 24: Population natural growth and migration net rates 1970-2000 by quinquennia
Quinquennia Average anual growth rate (%)
Natural growth (thousands)
Net migration rate (thousands)
1970-1975 4.3 21.79 20.92 1975-1980 3.39 22 17.05 1980-1985 3.36 21.5 12.28 1985-1990* 2.53 18.82 6.48 1990-1995 2.09 16.36 4.53 1995-2000 1.72 14 3.23
Source: Estimated by DANE, as presented by (1978)
Bogotá’s share of the country’s urban population grew from 4.1 percent in 1938 to 22 percent
in 1990, making it one of the densest cities in the world. With more than 100 people per hectare,
at the beginnings of the 1980s, it was denser than New York (Dureau et al. 2002; Hataya et al.
1994; Mohan 1994). Table 25 presents Bogotá’s share of the total and urban national population.
Table 25: Bogotá’s share of the national population, 1973-2000
Year 1973 1985 1990 1995 1997 1998 1999 2000
Colombia 22,915,229 30,062,200 32,299,788 36,181,862 40,020,856 40,772,868 41,539,011 42,299,301
Bogotá 2,861,913 4,236,490 4,716,801 5,627,748 6,010,247 6,164,494 6,322,701 6,484,967
% of total pop. 12.50 14.10 14.60 15.60 15.02 15.12 15.22 15.33
% of urban pop. 21.1 21.6 22.0 nd* nd nd nd nd
Source: DAPD, with data from DANE .* no data available
The beginning of Bogotá’s primacy is dated by Gouëset to be 1964; that is, when its
population growth started to be clearly faster than the other three main cities, Medellín,
Barranquilla, and Cali. Since then, this trend has increased (Gouëset 1998, p.152).
Table 26 illustrates the emergence and consolidation of Bogotá’s primacy.

76
Table 26: Colombia: index of urban primacy44 1950-1990
Index and populations
1950
Index and populations
1960
Index and populations
1970
Index and populations
1980
Index and populations
1990 (Bogotá) 0.7 0.8 0.9 0.9 1.2 Bogotá 647,429 1,682,667 2,892,668 4,122,978 4,851,000 Medellín 397,738 948,025 1,475,740 1,963,873 1,585,000
Barranquilla 305,296 543,440 789,430 1,122,735 1,019,000 Cali 245,568 633,485 1,002,169 1,367,452 1,555,000
Source: National population censuses.
Bogotá’s population growth is obviously a central factor in the city’s increasing primacy;
nevertheless, it is a factor that needs to be contextualized. Traditionally, people have come to
Bogotá in search of a better life; maybe because they were misinformed of the real conditions
offered by the city as mentioned by Cardona Gutiérrez and Simmons (1978), but often
encouraged by a family member who has already migrated. The latest wave of newcomers, los
desplazados (the displaced) deserves particular attention, as this population has arrived
massively to the city in search of refuge from the increasing violence in the country.
4.2.1 Running to the highlands: desplazados y marginales The latest wave of people running from violence and poverty, los desplazados (IDP) have been
particularly notorious due to the intensity of the problem and the fact that international agencies
have acknowledged the problem within the global context. It is very likely that that those that
came before were also desplazados, but they were not politically recognized as such
(Arquidiócesis de Bogotá and CODHES 1997).
Bogotá is the area that receives the most desplazados (IDP) in the country. It is estimated that
more than 37 displaced families arrive in the city every day, and that the city has received some
480,000 desplazados since 1985, giving it the highest concentration of desplazados (23 percent
of the country’s total displaced population) (Norwegian Refugee Council 2004, p.4).
44 The primacy index was calculated by dividing the biggest city’s population by the other three aggregated as presented by Flórez Nieto and Méndez 2000, p.76.

77
Table 27 presents the number of desplazados that arrived in Bogotá between 1994 and 2000;
figure27 illustrates the trend.
Table 27: Bogotá: Displaced Population Increase
Year Pop. Increase Cummulative % of Total Families (5 people per unit)
1985 to 1994 117,000* 117,000 16.7 19,500 1995 26,455 143,455 29.7 5,201 1996 50,680 194,135 28 10,136 1997 78,850 272,985 30.7 15,750 1998 54,570 327,555 17.7 13,642 1999 33,143 343,155 6.9 3,120 2000 43,780 386,935 18 nd.
Source: Database from CODHES www.codhes.org.co/
0
100,000
200,000
300,000
400,000
500,000
1994
1995
1996
1997
1998
1999
2000
Displaced Population
Figure 27: Bogotá: incoming IDPs, 1994-2000
An examination of the profile of the IDPs reveals that they are mostly women and children,
unskilled and unprepared to face the harsh conditions imposed by a marginal urban life. The
majority are from rural backgrounds and between 40 to 50 percent end up in cities, with no real
prospects for returning to their homes (Arquidiócesis de Bogotá and CODHES 1997). In Bogotá,
65 percent are women and 70 percent are under 19 years old (Arquidiócesis de Bogotá and
CODHES 1997; Museo Nacional de Colombia 2001). Additionally, results of a survey

78
conducted by CODHES showed that 38 percent of the displaced families had a woman as head
of household (Arquidiócesis de Bogotá and CODHES 1997, p.51).
As mentioned, los desplazados find themselves among the poorest of the urban poor;
enlarging the pool of unemployed and the so-called informal sector (UNCHR 2003; Murad
Rivera 2003; Museo Nacional de Colombia 2001).
When they first came to Bogotá,45 they settled on main avenues, hoping that someone would
understand the breadth of the problem and do something. Later, they moved to the city’s margins
and remained there as desplazados, a new citizens’ category. The city started tracking their
arrival in 1994 (Arquidiócesis de Bogotá and CODHES 1997). They came to Bogotá in search of
safety and employment. Bogotá has the lowest homicide rate in the country, the steadiest
economy, and the largest job market. Though it may be too close to hell for Cepeda Ulloa
(1995), it is far enough away for the desplazados.
4.3 ECONOMIC PERFORMANCE
FROM THE LAZY DUCK TO THE PRODUCTIVE SWAN
Bogotá’s relative isolation, due to its high location and physical inaccessibility, in addition to the
country’s strong regionalism, provided the city with certain autonomy, but kept it far from the
country’s main economic activities for the first half of the twentieth century. Its main role in the
economy was determined by its status as the capital and the base of the central government. It
was only after the economic crisis of the 1980s that Bogotá clearly became the economic core of
the country.
As the country’s economy moved into the third sector (finances, commerce, and services),
Bogotá’s economic role became dominant. At the beginning of the twentieth century, the
Colombian economy was basically rural; in 1929, agriculture represented 53 percent of the GDP.
By mid century it became agro-industrial; in 1945, agriculture represented 47 percent of the
GDP, while industry represented 16.5 percent. In 1970, agriculture represented 25.1 percent of
the GDP, industry 20.7 percent, with an emergent and growing third sector concentrated in
Bogotá (Gouëset 1998, pp.211-212). By 1985, Bogotá was home to 35 percent of industry and
45 I remember.

79
more than 50 percent of the financial market; its economic activity accounted for 21 percent of
the total GDP (Secretaría de Hacienda Distrital 2003a., pp.9-10).
Bogotá is the sixth largest market in Latin America; it generates a quarter of Colombia’s
GDP, and employs a quarter of the national labor market (Cámara de Comercio de Bogotá 2003).
Table 28 presents Bogotá’s contribution to the national GDP by sector from 1985 to 2000
(quinquennia).
Table 28: Participation of Bogotá in the National GDP by Sector, 1985-2000
(quinquennia)
Year Manufacturing
Industry %
Electricity and Water
%
Construction %
Commerce %
Banks Insurance Services
%
Transportation storage
communication %
Total GDP
%
1985 23.3 17.6 16.0 20.0 33.5 25.7 20.8 1990 24.3 17.0 24.5 19.9 41.6 24.5 21.0 1995 27.2 22.4 35.4 25.4 47.4 26.4 23.7 1998 26.4 23.1 28.7 25.8 46.9 26.5 23.1 1999 26.4 22.7 30.4 26.8 49.1 27.5 22.7 2000 25.0 20.8 36.3 25.5 50.1 27.9 22.8
Source: Data from DAPD(2000).
It is claimed that an additional factor in the consolidation of Bogotá as the primary city in the
country was the impact that the Apertura and the neo-liberal model had in the traditionally
industrial cities, such as Medellín and Cali. Bogotá had several advantages in dealing with the
challenges caused by economic reform; it depended more on the goods and services market, it
had a more diversified industry, it had the biggest internal market, and it had a strong net of
small and medium enterprises (Gouëset 1998). Additionally, its core has not experienced the
regional dispersal of manufacturing industries; indeed, there has been a trend for manufacturing
employment to concentrate no further than 50 km from Bogotá (UN-HABITAT 1996, p.52).
The economic primacy of Bogotá was substantiated by the economic census of 1990; its data
showed that the city produced 49 percent of the national industrial income, more than 50 percent
of the financial market transactions, 28 percent of the wholesale commerce market, and 23
percent of the retail market. Bogotá also dominated the higher education market. It had more
than 40 percent of the country’s college and university students, and more than 65 percent of the
graduate students, from which 79 percent attend private schools and 21 percent public schools.

80
Finally, most of the research centers are also concentrated in Bogotá (Gouëset 1998, pp. 285-
291).
The economy of Bogotá is no doubt a growing economy, though not necessarily a strong one.
Its dependence on the internal market makes it very susceptible to changes in the country’s
economy, and its reliance on the third sector makes it unstable (Cámara de Comercio de Bogotá
1999). It has been also claimed that this rate of economic growth will collapse the city’s
infrastructure, and that the concentration of the country’s economy in just one “Tibetan” place,
entails a lot of risk for both the country and the city (DAPD 1999, p.142). Finally, although the
city is known today as the country’s major financial, cultural, and industrial center, this status is
not quite consistent with its level of unemployment, and employment in the informal sector.
4.3.1 Employment, Unemployment, Quasi-employment Bogotá’s status as the economic center of the country is cause and effect of a dramatic increase
in the demand for employment in the city. It is sound to expect that as the economy grows, so
should employment opportunities, since the tendency is to associate production with labor.
Although when looking at economic and employment growth rates in Bogotá, what becomes
apparent is that economic growth does not necessarily entails more jobs, as illustrated by figure
28; it is particularly interesting to draw attention to the disagreement to the situation in 2000,
where there is a negative relationship between economic growth and employment.
-10.00
-5.00
0.00
5.00
10.00
15.00
1986
1987
1988
1989
1990
1991
1992
1993
1994
1995
1996
1997
1998
1999
2000
PIB growth Employment Growth
Source: data from DANE and SDH (2003; 2003a.)
Figure 28: Bogotá’s GDP growth and Employment growth rates, 1986-2000

81
Additionally, labor productivity, which refers to the relation between GDP and the number of
people employed, increased notoriously in the 1990s. At the beginning of the 1980s, the value
added by workers, in constant 1999 currency, was 160 million per year. By 1985, labor
productivity reached 229 million. During the 1990s the growth was steady, from 248 million in
1991 to 276 million in 1995 and to 352 million in 2000 (Secretaría de Hacienda Distrital 2003a.,
p.28).
Several factors explain the increase in labor productivity. For example, less labor can
produce more if there is a clear change in technology and/or human capacity; this is not the case
of Bogotá. In agreement with Latin America’s trends, the city increased its labor productivity by
lowering salaries and reducing labor-associated costs. Temporary employment also showed a
dramatic increase, raising from 7,000 to 19,000 (a 172 percent increase) from 1991 to 2000
(SELA 1998; Secretaría de Hacienda Distrital 2003a.). While the workforce grew, the labor
conditions deteriorated, affecting the size and quality of the job market.
The proportion of the working-age population (WAP)46 increased from 73.1 percent of the
total population in 1976 to 77.7 percent in 1999. From 1980 to 1986, the WAP grew 0.6 percent
points more than the total population, and between 1991 and 1996, 0.7 percent points more. In
general the working-age population has been growing faster than the total population in the city
(Gutiérrez, Mejía, and Díaz 2000, pp.5-6). Table 30 shows the total population and WAP growth
rates for the 1980s and 1990s.
Table 29: Bogotá’s total population and WAP growth rates
1980 1986 1991 1996 1999Total Population (percentage growth) 3.2 2.1 2.2 4.1 2.3
Working Age Population (percentage growth) 3.2 3.7 2.1 4.9 2.2 Source: Oficina de Estudios Económicos, SHD (2000)
In this period, the average age of the economically active population (EAP) changed from
32.7 years in 1976 to 35.2 years in 1999. This change is more drastic in the feminine EAP, which
46 According to DANE, the working age population in the urban areas consists of those 12 years old or over; although the International Labor Organization established the minimum working age at 15.
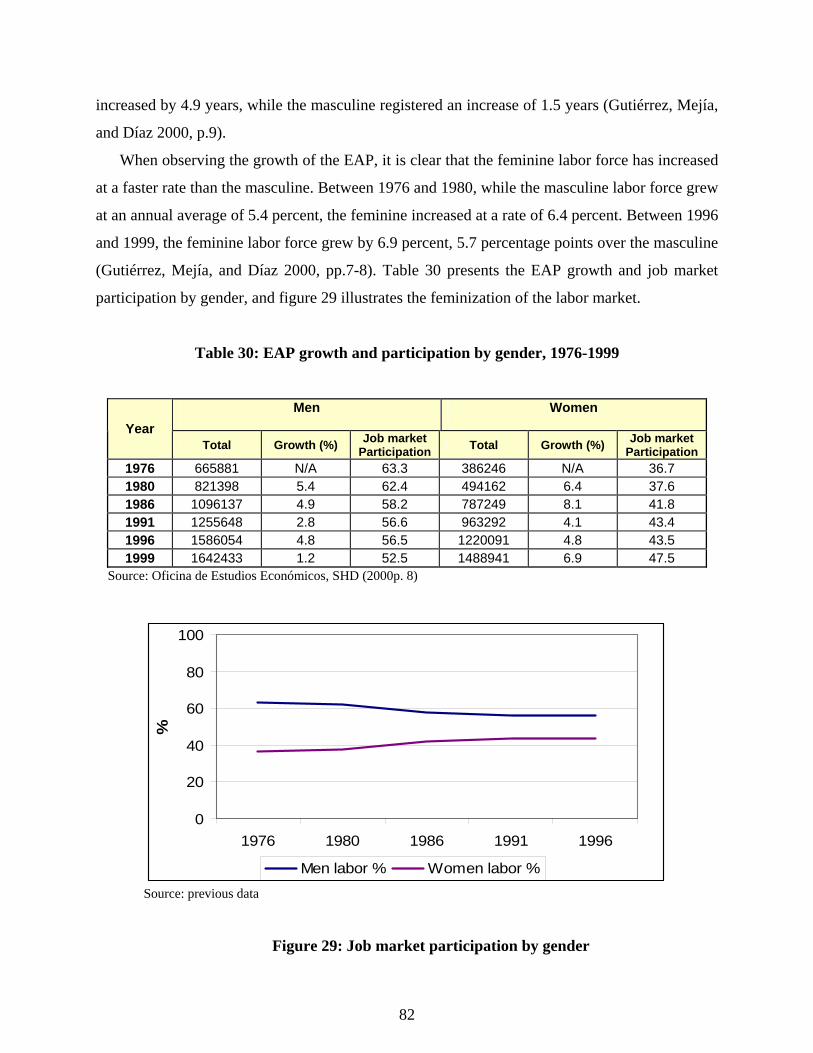
82
increased by 4.9 years, while the masculine registered an increase of 1.5 years (Gutiérrez, Mejía,
and Díaz 2000, p.9).
When observing the growth of the EAP, it is clear that the feminine labor force has increased
at a faster rate than the masculine. Between 1976 and 1980, while the masculine labor force grew
at an annual average of 5.4 percent, the feminine increased at a rate of 6.4 percent. Between 1996
and 1999, the feminine labor force grew by 6.9 percent, 5.7 percentage points over the masculine
(Gutiérrez, Mejía, and Díaz 2000, pp.7-8). Table 30 presents the EAP growth and job market
participation by gender, and figure 29 illustrates the feminization of the labor market.
Table 30: EAP growth and participation by gender, 1976-1999
Men
Women Year
Total Growth (%) Job market Participation Total Growth (%) Job market
Participation 1976 665881 N/A 63.3 386246 N/A 36.7 1980 821398 5.4 62.4 494162 6.4 37.6 1986 1096137 4.9 58.2 787249 8.1 41.8 1991 1255648 2.8 56.6 963292 4.1 43.4 1996 1586054 4.8 56.5 1220091 4.8 43.5 1999 1642433 1.2 52.5 1488941 6.9 47.5
Source: Oficina de Estudios Económicos, SHD (2000p. 8)
0
20
40
60
80
100
1976 1980 1986 1991 1996
%
Men labor % Women labor %
Source: previous data
Figure 29: Job market participation by gender

83
The level of unemployment has also steadily risen. By the year 2000, the unemployment rate
was 20.3 percent. Women’s unemployment rate has always been higher than men’s have;
between 1995 and 1999, it was 13.9 percent for women, compared to 9.5 percent for men. The
most educated have traditionally had the lowest rates of unemployment. Nevertheless, between
1986 and 2000, the biggest increase of unemployed was among those having 11 or 12 to 15 years
of education as more professionals joined the unemployed pool (Gutiérrez, Mejía, and Díaz
2000, pp.9-12). Figures 30 and 31 illustrate the total unemployment rate, and unemployment
growth rate by gender, respectively.
0.0
5.0
10.0
15.0
20.0
25.0
1986
1987
1988
1989
1990
1991
1992
1993
1994
1995
1996
1997
1998
1999
2000
(%)
UnemploymentRate (%)
Figure 30: Bogotá’s unemployment rate, 1986-2000
Source: DANE, ENH
Figure 31: Unemployment rate by gender, 1976-1999
Men Women

84
How do people find a way of living when the formal economy does not provide employment
opportunities? They join the so-called “informal sector,” that, as mentioned, refers to a form of
income generation that “is unregulated by the institutions of society, in a legal and social
environment in which similar activities are regulated” (Portes, Castells, and Benton 1989, p.12,
emphasis in the original).
One of the main indicators of the inclusive city promoted by the UN’s campaign in urban
governance is the creation and promotion of laws and programs aiming at incorporating the
informal sector. In Bogotá, this has been a long-lasting subject of conflict, which reached
confrontation during Enrique Peñalosa’s administration. When a forceful mobilization of a
deeply depressed zone in the core of Bogotá’s downtown El Cartucho was performed, involving
the military, the city’s firefighters and the police in confrontation with those living there.
When asked about provisions of his government for incorporating the informal sector, he
claimed that,
Informality creates insecurity and deterioration of the public space that affects the poorest, as no one from strata 4, 5, or 6 walks in downtown; it is the poor who have to catch a bus and deal with insecurity. Informality, in the form of street vendors, is like a cancer that promotes insecurity and disorder; they are structured in very violent mafias. No one will come or invest in a city invaded by disorder. There is a clear correlation between disorder and criminality47.
The rising level of unemployment and informality, and the problems associated with the
desplazados arriving in the city, has had multiple consequences, including an increase number of
poor, deterioration of the income distribution, and new pressures on the city’s government. The
next section briefly reviews the level of poverty and inequality in the city. Further exploration
and analysis of these factors is presented in Chapter 8.0, as they are selected indicators for
assessing equity in the city for this study.
4.3.2 Poverty and Inequality Bogotá’s quality of life does not reflect its status as the economic core of the country. Bogotá is
today one of the most unequal cities in the country; 80 percent of the employed population earns
47 Interview conducted on Nov. 4 of 2003

85
less than double the minimum wage, and the wage gap has increased. The unemployment rate
has steadily risen and the informal economy is the main source of new employment.
The economic crisis noticeable in particular at the end of the 1990s, and the consequent rise
in unemployment, increased the number of poor. Between 1998 and 2000, the population
catalogued under the Poverty Line (PL) and Indigence Line (IL) grew considerably. It has been
estimated that the city has around 4 million people living in poverty (Cámara de Comercio de
Bogotá 2003, p.12). Table 31 presents the number of poor and indigent in Bogotá from 1991 to
2001; figure 32 presents a comparison between Bogotá and Colombia by the number of people
under poverty line.
Table 31: Bogotá, Percentage below Poverty line and Indigence line, 1991-2000
Year Poverty line Indigence line 1991 37.40% n.d. 1992 46.50% 10.90% 1993 42.40% 7.70% 1994 40.50% 7.40% 1995 40.00% 7.60% 1996 37.83% 7.54% 1997 32.40% 6.10% 1998 36.60% 7.80% 1999 46.26% 13.18% 2000 49.60% 14.90%
Source: SHD (2003, p.15)
0.00
10.0020.00
30.00
40.00
50.0060.00
70.00
1996 1997 1998 1999 2000
% p
eopl
e un
der P
L
Bogotá PL Colombia PL
Source: data from SHD (2003, p.18)
Figure 32: Colombia and Bogotá, people under poverty line PL

86
Bogotá has a system for classifying the population accordingly to its socio-economic status
that enables for planning and directing the city’s investments. There are six strata, starting at one
for those with fewer resources and going to six for those with more; Bogotá’s population strata
distribution, from 1997 to 2000, is presented in Table 32.
Table 32: Bogotá, population by strata, 1997-2000
1997 1998 1999 2000 Strata % Population % Population % Population % Population
Without stratum 1.05 63,039 1.05 64,656 1 66,316 1 68,018
1 6.52 391,810 6.52 401,865 7 412,179 7 422,757 2 35.73 2,147,701 35.73 2,202,819 36 2,259,353 36 2,317,337 3 44.01 2,644,836 44.01 2,712,713 44 2,782,333 44 2,853,739 4 7.53 452,460 7.53 464,072 8 475,982 8 488,198 5 2.99 179,497 2.99 184,104 3 188,829 3 193,675 6 2.18 130,905 2.18 134,264 2 137,710 2 141,244
Total 6,010,247 6,164,494 6,322,701 6,484,967 Source: DAPD, based on data from EAAB.
Traditionally, stratum 2 and 3 corresponded to the middle and lower-middle class and had
most of the city’s population. As of the year 2000, 49.6 percent of the city’s population was poor
and 14.9 percent lived under the poverty line48. In absolute numbers 3,190,170 people were poor,
and 959,238 lived under the poverty line. In summary, the city had more than 4 million poor
which illustrates the deterioration of the middle class standard of living (Fundación Corona 2003,
p.8).
In conforming with regional and national trends, poverty in Bogotá is associated with an
unfair distribution of wealth and income. By the year 2000, the GINI index in the city was 0.564;
the income share for the the poorest quintile’s was 2.3 percent, while the richest quintile was
63.5 percent (DAPD 1999, p.146). Gilbert and Dávila called the level of equality in Bogotá
obscene, which seems a quite accurate term when one considers that besides the gap in income
48 Reminder: according to ECLAC, poverty lines represent the minimum income required for members of a household to meet their basic needs; they are estimated from the cost of a basic food basket plus the estimated amount of resources required by households to meet their basic non–food needs. The indigence line, or under the poverty line, represents the cost of the food basket; people who are indigent (or extremely poor) are those who live in households whose incomes are so low that even if they spent all their money on food, they would not be able to meet the nutritional needs of all their members (ECLAC 2002).

87
distribution, there are even more violent forms of exclusion that are manifested in the notable
disparities of power and social recognition among citizens (Gilbert 1996, p.56).
Figure 33 illustrates the deterioration of income distribution in Bogotá, which occurred side
by side with its consolidation as the economic core of the country.
Source: DANE, ENH and DIOGS (DNP) y DAPD
Figure 33: GINI index for Colombia and Bogotá (not adjusted)
Inequality is so notorious in Bogotá that by having contact with two Bogotanos one might
believe that they belong to two complete different cities, from their accents, to their attires,
habits, and experiences with the city. And, to some extent there is more than one Bogotá; in
north Bogotá, European restaurants and American malls are cultural landmarks and in south
Bogotá, unregulated settlements proliferate49 and people go to el centro (downtown) on the
weekends and rarely go north.
The New Constitution of 1991 aimed at enhancing democracy at all levels. In an effort to
recognize Bogotá’s complex problems and institutional needs, special provisions for the city
were included in the new chart; decentralization was mandated for the city. The next section
presents a brief introduction to the reform, as chapters 7 and 8 are dedicated to review and
analyze the process of implementing the reform and its impacts on the city’s governance.
49 The most notorious of which is Ciudad Bolivar, which in 1991 had 1,280,000 inhabitants, a quarter of the city’s population, dwelling in more than 180 barrios (neighborhoods) from which 75 percent were informal settlements (Puyo Vasco 1992).

88
4.4 REFORMS: A PRIVILEGED CINDERELLA Capital cities in Latin America commonly have a different status than any other city in the
country; this difference is meant to reflect that the capital houses the national government, hosts
the core of diplomatic representations, and is usually the main receptor of immigrants (Myers
and Dietz 2002). In the case of Bogotá, its status has been changed several times, not so much in
search of the best politico-administrative structure for the city, but, as argued by Pedro Santana, a
Colombian researcher, as an outcome of the struggle between the two dominant parties for
controlling the city’s electoral districts and funds (Santana R. 1988, p.152-153).
The city was granted a special status for the first time by Law 17 of 1905, which declared the
city as Capital District, gave it independence from the departmento (state) where it is located,
Cundinamarca, and established its direct dependence from the national government. The
department opposed and contested this decision for two reasons; Bogotá was its main source of
income and was also the core of liberal activism in the middle of a conservative department and
country. In consequence, the status of the city was changed again by Law 65 of 1909, when the
Congress returned Bogotá to Cundinamarca’s jurisdiction.
During the constitutional reform of 1945, the status of the capital was discussed again, and,
apparently, the main discussion was once more to separate or not to separate Bogotá from
Cundinamarca. They decided to grant the status of Special District (D.E.) to Bogotá; it was no
longer subject to the municipal regime, and was allowed to annex six surrounding municipalities.
However, a series of political incidents and struggles hindered the ruling of the constitutional
mandate.
In 1954, General Rojas Pinilla, through presidential decree No. 3640, officially sanctioned
Bogotá’s new status as Special District (D.E.). According to the decree, the mayor and half of the
city’s council members were to be appointed by the president, giving to the head of the national
government great control over the city, but also granting the city independence from
Cundinamarca. The independence that was questionable, however, as Bogotá remained the
capital of Cundinamarca, both economically and politically.
89
Decree 3640 of 1954 permitted to implement the annexation of the six surrounding
municipalities granted by the constitutional reform of 1945.50 With the aim of facilitating their
incorporation into the city, and to protect their identities, the figure of alcaldes menores (minor
mayors) was created. It is common knowledge that no real power was attributed to the alcaldes
menores, and the city’s government stayed highly centralized until the 1990s, when the New
Constitution promoted decentralization in Bogotá. The annexation of these municipalities serves
in illustrating the origins of the city’s complexity and contradictions; its main source of growth
has been the incorporation of individuals or communities with their own unique identities,
resulting in the lack of a common identity and difficulties reaching the minimum consensus for a
polity to survive.
In 1968, a new constitutional reform modified the fiscal relationship between Bogotá and
Cundinamarca, mainly by giving the president control over public expenditure at all levels,
national, departmental, and local. This reform reinforced the already strong presidentialism in the
country (Santana R. 1988, p.154). Additionally, this reform restructured the city’s
administration, which remained mostly the same until 1991. Decree 3133 of 1968 ratified Bogotá
as Special District and the capital of the country and Cundinamarca, divided the city into twenty
alcaldías menores, ruled that the city council was to be elected by the people, and organized the
administrative structure of the city by secretariats, administrative departments and three control
boards (Gouëset 1998, pp.185-186).
In 1987, the city council voted positively on an administrative reform51 presented by Julio
César Sanchez, the last appointed mayor. The aim of this reform was to open the administrative
structure of the city, to promote participation, efficiency, and welfare. In order to do so two
major changes were proposed: first, the enhancement and democratization of the sub-local units
of government, alcaldías menores; second, the strengthening of the city’s fiscal and financial
management.
This reform promoted the institution of alcaldes zonales (zonal mayors), an enhanced figure
of the alcaldes menores (minor mayors). It created zonal funds, which provided certain capacity
of investment and autonomy for the sub-local administrative units, and it also created the Juntas
Administradoras Zonales (zonal administrative boards), whose members ought to be popularly
50 The annexed municipalities were Fontibón, Usme, Bosa, Suba, Usaquén and Engativá. 51 City council Agreement 08 of 1987.

90
elected, and would be in charge of creating the zonal development plan and linking it to the city
planning.
On March 17 of 1988, the Administrative Board of Cundinamarca, as Bogotá was still its
capital, voted to suspend the reform, on the argument that, as the city depended directly on the
national government, only the national Congress had the right to legislate the reform and not to
the city council (Santana R. 1988, pp.173-175)
Finally, transitory article No. 41 of the New Constitution mandated that Congress legislate a
new regime for the city by June of 1993. Because Congress did not accomplish this goal on time,
César Gaviria, by presidential decree, promulgated the Régimen Especial para Santafé de Bogotá
(the city’s new statute), on July 21 of 1993 (Mockus S. et al. 1997). Many of the elements
introduced by the New Constitution and sanctioned by the city’s new statute were proposed in
1988; the 1991 reform was important because this time the reform was promoted within the
framework of a major political change in the country. The New Constitution was the beginning,
at least in theory, of a process of deepening democracy in the country; decentralization was the
main strategy, and Bogotá was set to be an example.
The key and distinctive elements of this reform are the explicit promotion of decentralization
and democratization within the city; a preferred strategy for accomplishing these goals was to
create tools and mechanisms for citizen’s participation (Gouëset 1998). To explore and learn
from the process of decentralization in Bogotá, as well as to describe and evaluate the impacts of
it on the city’s system of governance, are the main objectives of this study. In order to do so, Part
2 aims to define the conceptual framework for this study. Chapter 5.0 presents the literature and
research review on the central concepts for this study: decentralization and good governance, and
chapter 6.0 presents the research design and methodology.

PART II
CONCEPTUALIZING THE TERRAIN

92
5.0: LITERATURE AND RESEARCH REVIEW
“Decentralization has quietly become a fashion of our time. (…) It is being attempted where civil society is strong, and where it is weak. It appeals to people of the left, the center and the right, and to groups which disagree with each other on a number of other issues.”
James Manor, 1999.
Decentralization and good governance are public policy concepts; they are intended as
“prescriptions” for identified problems regarding governing. Decentralization is the policy
trigger. Good governance is supposedly an ideal outcome or indicator of the success of particular
policies, such as democratization or decentralization. Assuming a normative approach, the
problem that this study deals with is how to promote good governance? The underlying practical
problem is the adequacy of decentralization as the policy to do so. The focus of the study is the
relation between decentralization and good governance.
Differences in the definition of the problem for which a decentralization policy is intended,
but even more importantly, differences in the basic assumptions underlying the policy design,
explain the variation of definitions and arguments that surround this relationship. Likewise, when
referring to governance, differences among theorists and practitioners are mainly based on two
issues, the role attributed to the state and the discipline’s perspective.
Regarding the relationship between decentralization and governance, many arguments
support the implementation of decentralization policies and, directly or indirectly, support the
belief that it enhances or creates good governance. Yet, there are also arguments questioning the
validity of decentralization as a recipe for all, and in particular developing countries, in regards
to the enhancement of governance. In order to contribute to this debate, this study analyzes the
process and impacts of the decentralization reform of the system of governance of Bogotá, with
the aim of presenting evidence regarding the limits and possibilities of this policy for enhancing
good governance.

93
This chapter presents a review of the literature and research regarding decentralization and
(good) governance, and on the relation between these concepts. The questions this chapter aims
to answer are:
What is decentralization?
What is good governance?
What are the main arguments on the relationship between decentralization and
good governance?
What evidence from research supports or refutes those arguments?
What is the practical importance of this debate?
5.1 DECENTRALIZATION
Decentralization is a process of state reform that entails changes in the structure, functions, and
mechanisms of decision-making regarding public issues (Ottenberger-Rivera 1997). . Depending
on the arguments supporting the reform, and the underlying assumptions, different strategies and
emphases would be adopted (Bennett 1990). By reviewing the literature on decentralization, it is
possible to identify three main lines of argumentation, for supporting or questioning the
implementation of this reform; the first is political, the second is managerial, and the third is
economical.
In general, those advocating one preferred argument acknowledge the existence and
importance of the other two. However, their goals and strategies for policy implementation
would differ, as they differ in their basic assumptions behind promoting the reform, therefore
differing in their definition of the problem itself.
- From the Political argument: Decentralization is considered a central policy for
democratization, as it brings the state closer to its constituencies, promotes a more horizontal
structure of power, by opening new spaces for participation, and increases accountability and
transparency. For those advocating decentralization as a political reform, in Latin America, it is
the means to democratize distant, and frequently seen as illegitimate, central governments, and

94
to offer participation to those excluded under imperfect democracies (Finot P. 2001; Smith
1985; Velásquez C. 1994; Peterson 1997; Campbell 2003; Carrión 2003; Manor 1999)
- The managerial argument: Decentralization is considered a tool for improving the state’s
performance and efficiency, two central goals of the overarching state modernization reforms
implemented from the mid 1980s on. In theory, decentralization improves the capacity of the
system because it includes more actors in the identification of public concerns and in the
design and implementation of solutions; it promotes transparency and accountability in the
administration, and makes the system more responsive and responsible (Reilly 1995; Escobar
and Alvarez 1992; Cochrane 1983; ILPES 1995).
- The economic argument: In regards to the developing countries, the argument that
decentralization is a central reform for economic development was added to the debate. The
state must concentrate on its own matters and let the market do its job of creating wealth;
naturally, the market is more efficient in the creation of capital, as this is its reason for existence.
Decentralization will contribute to the economy by weakening constrains that the central
government imposes on the market. Additionally, the cost of market intervention is inefficiency
and fiscal deficit. Neo-liberal theories and policies are the main promoters of using
decentralization to reduce the state’s intervention in the market (Udehn 1996; Buchanan and
Tollison 1984; Buchanan, Rowley, and Tollison 1987; Buchanan and Musgrave 1999;
Buchanan 1988, 1986; Angell, Lowden, and Thorp 2001)
Although it is clear that these arguments intersect with each other and usually coexist, the fact is
that they convey deep theoretical and ideological differences. Depending on which of them is at
the base of the reform, the model of implementation will completely differ as well as its
outcomes and impacts.
Decentralization is not a coherent and uniform proposal; in practice, it takes different shapes,
and different strategies are preferred for its promotion. Three distinct models of implementing
decentralization emergened as dominant from reviewing Haldenwang (1990), Cheema and
Rondinelli (1983), Montero and Samuels (2004), Bennet (1990; Bennett 1994) and others.

95
The models that vary according to their underlying assumptions are:
1. Economic decentralization
Purpose: to limit the state’s regulatory and distributive functions, releasing the fiscal
budget and giving freedom to the market
Forms:
a) Privatization – the transfer of power and responsibilities to private groups or
companies;
b) Deregulation- the transfer of decision competences to the market
2. Administrative Decentralization:
Purpose: to improve efficiency, particularly regarding the allocation and
appropriation of resources
Forms:
a) General deconcentration- the transfer of competences to lower levels of
government
b) Functional deconcentration- the transfer of functions to local branches of national
institutions
c) Delegation- the transfer of certain powers to para-state agencies of the central state
3. Political Decentralization:
Purpose: the creation and promotion of new forms of participation at the local and/or
regional levels
Forms:
a) Political delegation- the transfer of specific functions to para-state institutions
where the political parties and/or interest groups have influence
b) General devolution: the transfer of competences to autonomous and legitimately
elected sub-national political units
c) Functional devolution- the transfer of decision-making power to local institutions

96
It is clear that decentralization is a complex concept that refers to a multidimensional process,
which is presented in a variety of combinations, and its application is very much open to
discussion. The definition adopted for this study, based in Montero and Samuels (2004), Bennet
(1990), Morris and Lowder (1992) and my own experience is:
Decentralization is a multidimensional, and not necessarily consistent, process of
political and administrative change which has a variety of combinations that may or may
not occur simultaneously, and is promoted for pursuing a range of, not always
compatible, goals.
As presented in Chapter 2.0, decentralization was a central policy for the promotion of
democracy and state modernization, the two more important changes affecting Latin America in
the 1980s and 1990s. It was also a central policy promoted by the New Constitution of 1991 in
Colombia, and the main goal set for Bogotá (see chapters 3.0 and 4.0).
5.2 GOVERNANCE
This study focuses on the concept of democratic or good governance, a concept that refers to
both government responsibility and civic engagement; it is informed by the premise that the way
in which interactions among stakeholders and their interests are managed expresses the quality of
a political regime. From a normative approach, the challenge is to create systemic relationships
that improve the quality of life of the many actors involved and ensure social sustainability; to
promote good governance.
Although academics and practitioners trace the roots of this term, in English, back to the
seventeenth or eighteenth century, the term governance has progressed from obscurity to
widespread usage since the late 1980s. It is now used in nearly every setting, from corporate to
global (Polèse and Stren 2000; Plumptre and Graham 1999; Balbis and Sánchez León 2000;
Mayntz 1998; Feiock 2004; Pierre and Peters 2000). For a long time governance and governing
were used as synonyms; as the state was the unique player in regards to public issues.
Accordingly, a widely accepted definition of governance is the art of steering societies and

97
organizations (Pierre 2000). For some this is still a valid and contemporary definition; for others,
this definition does not fit the socio-political patterns that have emerged from globalization and
democratization anymore.
Two “new” meanings have emerged for the concept of governance, in response to new
definitions of what is public and what is private, and how the interactions among stakeholders
should work. The first new definition refers to a nonhierarchical mode of governing, where non-
state actors participate in the formulation and implementation of public policy (Rhodes 1997)
The second refers to forms of organization that are not necessarily non-hierarchical, but that may
or may not include the state, i.e. governance without government. James Rosenau distinguishes
government 'activities backed by formal authority' from governance, or 'activities backed by
shared goals' (Rosenau and Czempiel 1992).
A new definition of governance that intends to encompass all of the above is, “the process by
which human beings regulate their interdependencies in the context of shared environments.
Each environment is a source of values shared by the members of a community” (Feiock 2004,
p.19). The interactions within any community define a system of governance that could be based
on coercion, competition or cooperation, depending on the commonly accepted values. Clearly,
the level of consensus within the community will influence the stability and inclusiveness of the
system. Today governance refers to multiple stakeholders with shared and conflicting interests.
The normative nature of this concept keeps its meaning very dynamic and diverse bodies of
knowledge have tried to use their basic assumptions to define it. Differences among theorists and
practitioners in the public realm appear to be based mainly in two issues, the discipline’s
perspective and theoretical body supporting it, and the role attributed to the state. The literature,
as well as the research carried out on governance, present a diverse combination of these
elements, resulting in a spectrum of meanings for the term. As mentioned by Peters and Pierre,
“There are perhaps as many different views of governance as there are scholars interested in the
subject” (Pierre and Peters 2000, p.28).
In general, it is possible to identify two clear positions, with interesting variations within: the
first, is a state-centered position that attributes the central and critical role in the system of
governance to the state. Variations of this position may or may not acknowledge the existence of
other actors in the system and the role attributed to them. Under this perspective, governance is
98
the art of public leadership, and the leader is the state; it is the job of the state to provide
direction and guidance to society. Consequently, the political regime and the government’s
capacity are central elements of (good) governance (Pierre and Peters 2000; Domínguez and
Lowenthal 1996; Peters and Savoie 1995b). Most political scientist believe in the state-centered
perspective; Guy Peters, a prestigious representative of this position, asserts that governance
implies employing mechanisms for providing coherent direction to society, and that this is a
state’s function, even with the changes that decentralization and globalization have produced in
the structures of government. Peters and others argue that nation-states and their governments
should play a major and dominant role in the system of governance (Pierre and Peters 2000;
Peters 2001).
The second is a polycentric position that attributes the central role in the system of
governance to different actors from the civil society to the market, depending to a great extent on
the discipline’s perspective. The state may or may not be a player (March and Olsen 1989, 1995;
Rosenau and Czempiel 1992; Crenson 1978). Polycentrism describes a pattern of governance
that emerges from the interactions of multiple independent centers of authority (Feiock 2004,
p.21). The polycentric perspective is more multidisciplinary; academics and practitioners from a
variety of disciplines, such as sociology, anthropology, political sciences, and social psychology,
discuss how governance should be and who should be the leading actor. Nevertheless, there are
important differences in the attribution of roles. As mentioned, for some, the civil society should
play the central role, such as for the theorists of social capital, who consider a strong civil society
a guarantee for good governance (Putnam, Leonardi, and Nanetti 1993; Crenson 1978). For
others, governance is more of a game of power, where competition, conflict and negotiation are
basic elements, as in the case of Neo-Marxists and rational choice theorists. Finally,
globalization theorists assert that supranational institutions play a central role in governance, as
they are the guarantors of universal values and are in charge of balancing national differences
and interests (Cable 1999; Keohane 1995; 2002; Held and McGrew 2000; Held 1999).
The changes in the role and functions of the central state, introduced by the state reforms that
were promoted in developing countries during the last two decades of the twentieth century, have
a lot to do with the dynamic nature of this concept. This is especially noticeable in Latin
America, where the structural reforms of the state deeply changed its functions and those of

99
every other social and political actor. In general, governance, and even more accurately good
governance, describes new forms of institutions which have emerged in developing countries,
which have included many stakeholders in public decisions acknowledge the fact that the public
is no longer a synonym of state or government (ILPES 1995; Cunill 1991, 1995). A polycentric
approach appears more adequate for describing the systems of governance in Latin America.
Despite differences, there is consensus among academicians and practitioners that there is a
need for promoting good governance in developing countries as a way for dealing with
complexity and promoting development. Consequently, many efforts have been undertaken,
particularly by main international agencies, for achieving this goal. However, what does good
governance mean?
5.2.1 Good Governance
The term good governance is a normative interpretation of the term governance52 that was
introduced primarily by the international development agencies with the aim of indicating what
is “good” or “better” and “what should be done” to achieve it (Polèse and Stren 2000; Dixon,
Goodwin, and Wing 2003; 1999). A basic statement underlying this prescriptive perspective is
that good governance requires democracy to exist; as a result, the term good governance is used,
in literature and in practice, as synonymous with democratic governance (see for example,
Jewson and MacGregor 1997, Institute on Governance 1998, 1999, 2000; Fukasaku and
Hausmann 1998; Rodríguez and Winchester 1997; Domínguez and Lowenthal 1996).
It is not easy to trace the conceptual boundaries of the term good governance due to its
relatively recent appearance and its intersection with three other key concepts: social capital,
governability, and government. Lets us explore these concepts in order to better differentiate
between them:
52 Although the term governance carries also a normative stance.

100
- Social capital is a term that refers to civil society, as differentiated from the state and the
market (Putnam, Leonardi, and Nanetti 1993). The World Bank states that Social Capital is
not just the sum of the institutions that underpin a society, but the glue that holds them
together; the more a community or group can act as a coherent and cohesive system, the
better partner they will be in governance relationships. Social Capital is a concept that refers
to potential, while governance refers to action.
- Governability originally referred to the government’s capability for performing its
functions, including exercising authority over the actions of the members of a polity,
directing the affairs of the state, the maintenance of public order, and the promotion of the
common welfare. An efficient government will facilitate and promote good governance.
Likewise good governance will call for higher governability. Nevertheless, governability is
also understood as the capacity of a society to be governed; if the civil society is, or may be,
a central actor for governance, how governable a society is will also define the quality of the
system as a whole.
- Government, as mentioned by Peters and Pierre, should not be taken to mean the same as
governance (Pierre and Peters 2000, p.29). A cross-national study conducted at the Institute
on Governance by Plumptre and Graham, found that a common tendency was to use
governance as a synonym of government. The authors suggested some of the unfortunate
consequences of this confusion; while government refers to the current authorities in power,
and usually, the structures through which they execute their functions, good governance
involves interactions between formal governmental institutions and those of civil society
(Plumptre and Graham 1999) 53. Governance is a more inclusive concept that refers to socio-
political dynamics, and that requires acknowledging the existence of other legitimate actors.
Finally, the government may or may not be a part of the system of governance.
Defining good governance may be easier than defining governance, as this concept entails the
application or achievement of certain goals considered being “good”. Even so, once more the
“how to” and “who is in charge” are the source of important differences in the prescription.
Appendix D presents a table summarizing definitions of governance and good governance used
53 For more about its projects or to find the document referenced please visit www.iog.ca
101
by international development agencies. The following definitions, from the United Nations and
the World Bank, help to illustrate the dominant positions in defining and using this concept.
For the United Nations Development Program, good governance is among other things
participatory, transparent and accountable. It is also effective and equitable and it promotes the
rule of law. It assures that priorities are based on broad consensus in society and that the voices
of the poorest and the most vulnerable are heard in decision–making over the allocation of
development resources.54 The state is not mentioned, corresponding to a polycentric perspective.
For the World Bank, good governance is epitomized by predictable, open, and enlightened
policy-making, a bureaucracy imbued with professional ethos acting in furtherance of the public
good, the rule of law, transparent processes, and a strong civil society participating in public
affairs. Good governance refers to the government's ability to: 1) ensure political transparency
and voice for all citizens, 2) provide efficient and effective public services, 3) promote the health
and well-being of its citizens, and 4) create a favorable climate for stable economic growth
(World Bank 1992) . This is another type of prescription, in which the state is at the center.
The literature review showed that the concept of good, or democratic, governance is very
much under construction, and that its definition is very often circular, as the concept is defined
by its characteristics, which in summary are: openness, inclusiveness, deliberation, effectiveness,
accountability, and legitimacy (Potter and OECD 2001; Kaufmann, Kraay, and Zoido-Lobatón
1999; Plumptre and Graham 1999; World Bank 2000). As most parties began to consider these
characteristics universally valuable, finding the path to enhance or create good governance
became a priority. In consequence, main international development organizations carried out or
funded research and projects aimed at the promotion of good governance; Appendix E presents a
list of these organizations.
By reviewing a number of these projects, it was possible to identify two dominant themes in
the quest for good governance. First, what valid and reliable indicators could assess good
governance; and second, how to use them to asses or promote good governance (Kaufmann,
Kraay, and Zoido-Lobatón 1999; Plumptre and Graham 1999). Table 33 summarizes the
variables found through the reviewed projects. Main variables were common to all projects,
54 Definition from the International Conference on Governance for Sustainable Growth and Equity (Magnet-UN 1997).

102
secondary variables, to those used only in some projects; undoubtedly, important variables were
left out. For a list of the projects reviewed, please see Appendix F.
Table 33: Governance main and secondary variables and indicators
Main Variables
Participation Freedom and existence of local media; percentage of people voting by gender and social groups; process of public discussion on key issues
Equity Inclusion of excluded groups in the consultation process; resource allocation to serve vulnerable populations; access to basic services; women’s representation; rate of unemployment
Accountability
Regularity in fiscal transactions and faithful compliance/ adherence to legal requirements and administrative policies; public access to information on projects, processes and resources; goals communicated to the constituents; degree of delegation of authority; extent to which grievances and complaints are entertained by the administration
Efficiency Economical use of funds; mechanisms for evaluating economic performance; reduction of the population living below the poverty line; measurement and improvement of satisfaction of the populations served
Secondary variables
Responsiveness
Mechanisms to determine people’s needs and wants, to allow citizens participation in planning and implementation of plans, programs and projects, to monitor that goals and ends of programs/projects are attained and delivered to targeted beneficiaries; fair and rapid action on suggestions and grievances by the public; use of public feedback on how the local government responds to demands articulated by the constituents
Management Innovation
Improvement of structures and procedures to conform to service standards such as efficiency, effectiveness and economy; presence of measurement; adoption of innovative concepts and practices; application of new management techniques
Public-Private partnerships
Policies and incentives to encourage the private sector participation in development; presence of business sector initiatives to improve efficiency of local government e.g. technology improvement, training etc; joint involvement of public and private sector in planning, funding and implementation of programs/projects
Local Government-Citizens interactions
Presence and extent of cooperative efforts among local governments, non-governmental organizations, and the community; mechanisms that allow consultation between the local government and constituents on local concerns
Decentralized Management
Presence of clear-cut guidelines on delegation; monitoring systems that provide feedback on the implementation of delegated task; the existence and extent of decisions made by officials to which tasks are delegated; consistency between the organizational hierarchical structure and actual delegation of task
Networking Extent and size of inter-government networks, regional (intra- local) networks, and international networks; scope of resource’s complementation in the networks; extent of technology interchange/collaboration
Human Resources Development
Presence and scope of policies to improve human resources management; existence of an adequate and sustained merit and fitness-based recruitment and selection program; presence of training programs to improve the capabilities of local government personnel; classification and pay plan based on the principle of equal pay for comparatively equal work
Source: projects reviewed by the author cited in Appendix F.

103
It is very interesting to notice that, despite the proliferation of statements about new
arrangements among stakeholders and the need to recognized non-governmental actors, the
research and practice on good governance continues to be focused on the state. The projects
reviewed showed that most variables and indicators concentrated on the state’s performance, the
quality of its institutions and human resources. None of the indicators recognized or looked for
the existence of non-state projects and programs as either sources or indicators of good
governance.
The projects reviewed also reflect two central issues for this study. The first is the fact that
many indicators require or assume that decentralization is in progress. The second is the
increasing concern about governance at the local level, and in particular in urban areas, as
authors began to focus on good governance as a development issue and examine cities as critical
arenas for development (Reilly 1995; HABITAT 2001; World Bank 2000; UN-HABITAT 2000;
Yusuf, Wu, and Evenett 2000).
Stren and Polèse (2000) attribute the emergence of local governance as a key issue to four
factors:
a. The implementation of decentralization by formerly centralized countries;
b. The democratization of one-party states and states formerly governed by military groups;
c. The increased importance of urban social movements and their relation with global
activists;
d. And the emergence of ‘policy communities’ as networks of representatives from the state
and the civil society, that address local public problems.
These four factors were central to Latin America’s political life during the last two decades of
the twentieth century (Rodríguez and Winchester 1997; García Delgado and Borja 1989), as
mentioned in Chapter 2.0 . Decentralization and governance appeared clearly linked in the search
for democratization and modernization; decentralization was key to democratizing policy and
good governance was both a condition and a consequence of the decentralization process. Cities
were particularly eager to find openness in the system in order to cope with their increasing
complexity. At this point, it is worthy to review what is urban governance, as a city is the focus
of this study.

104
5.2.2 Urban Governance The emergence of local governance as a leading topic for social scientists and practitioners has a
lot to do with the need to recover the principles of democracy and manage complexity. Cities are
the most complex products of collective human creativity (Gilbert et al. 1996), and as such they
have a lot of potential. Cities have proven to be the areas where it is possible to best provide
services, alleviate poverty, improve life expectancy, and more wisely manage our planet’s
population growth. Moreover, cities are multicultural realities, whose bearers of different
practices and ideas are enriched and changed through interaction (Claval 2003). Nevertheless, it
is equally true that the segmentation and urban poverty have been increasingly noticeable trends
during the last decades; clearly, the benefits that cities offer are not equally shared (Alfonso,
Hataya, and Jaramillo 1997).
Segmentation is a phenomenon in modern cities. New forms of governance are not always
connected with the system as a whole, and that demands a search for appropriate tools for
integration and consensus building in order to reach a minimum level of gobernability. Weak
governments that are very often perceived as illegitimate have given space to the emergence of
para-authorities, which threaten the very foundation of the concept of citizenship. It is clear that,
for better or worst, the development of contemporary societies will depend largely on
understanding and managing the growth of cities (HABITAT 2001a, p.10); and one may add,
building good governance.
According to the United Nation Center for Human Settlements-HABITAT, by the year 2000
almost 50 percent of the world’s total population lived in urban areas. Additionally, for the first
time in history, urban dwellers will soon outnumber those in rural areas. This is possible due to
the fast pace of urbanization in developing countries; the present decade’s average population
increase in cities of developing countries is estimated to be 175,000 persons per day (HABITAT
2001).
This pace of growth generates great challenges for the cities’ systems of governance, which
are aggravated by the fact that as cities grew, poverty and inequality have grown with them, not
only in Latin America but all over the world. It is estimated that between 1/4 and 1/3 of all urban

105
households in the world live in absolute poverty.55 About 220 million city dwellers, 13 percent
of the world’s total urban population, do not have access to safe drinking water, and about twice
this number lack even the simplest of latrines (HABITAT 2001, p.14).
The challenge of promoting inclusive cities is particularly important for Latin America,
which, as stated in Chapter 2.0, it is the fastest urbanizing region in the world and presents the
highest level of inequality (HABITAT 2001, p.14-17). The contradictions between the
modernization discourse and the level of exclusion in Latin American cities has had the effect of
deeply segmenting society. Para-authorities emerged and private groups occupied the place of
the state; the marginal became easy pray for an illegal market of services, raging from personal
protection to housing.
This is not only a Latin American phenomenon. A study on Turkish urbanization found that
the social, economic and political factors characterizing segmented cities tend to nourish the
growth of extremist or fundamentalist movements in society. The study concludes that, in order
to stabilize their socio-political structures, cities must find ways of incorporating and aggregating
the values, interest and expectations of the citizens, in particular of those in the margins. “[…]
the periphery in the center must be integrated with the whole of society by concerted economic
and social action with appropriate instruments (Keles 2003, pp.215-216).”
Metropolitan areas have been associated with the emergence of governance structures that
draw heavily on civil society (Feiock 2004, p.41). In a 1978 study, Crenson found that urban
governance can be carried out by local neighborhood networks without interference from
governmental agencies. He concluded that overall, urban governance and aggregation seemed
safer in local hands than in the hands of of political bodies (Crenson 1978).
It is clear that the problem of building good urban governance is more complex that one may
have thought. The literature and research review indicates the existence of several systems of
governance running in parallel, which undoubtedly represents potential for the enhancement of
social capital and collective action, but also for segmentation (Keles 2003). What is the relation
between these parallel systems and the system as a whole? If any, how could we ensure that there
is a minimum consensus about what is the public good?
55 Defined by the United Nations as a threshold of income or consumption below which and individual or household cannot obtain the minimum diet plus an amount of other basic needs, including shelter. In many cities this is estimated even below 1 dollar per day.

106
Mayntz offers a partial answer to these questions when she refers to the preconditions,
institutional and structural, needed for the emergence of effective modern governance; the first
condition she mentions is that political authorities must be powerful, but not omnipotent. They
must be democratically legitimate in such a way that they reflect the interests of all major socio-
economic, ethnic or religious groups in society; only in this case can an elected legislature be
assumed to act in the interest of all, rather than in the interest of a dominant class or political
party. Political authorities must be generally acceptable as guardians of public welfare. The
second essential condition is the existence of a strong, functionally differentiated, and well-
organized civil society. A minimal sense of identification with, and responsibility for, the greater
whole, in short, a common identity, must exist among the different social groups and
organizations (Maynzt 2003).
Decentralization is claimed to be the appropriate policy for inclusion and the creation of good
governance, as, by bringing the state closer to the civil society it promotes a dialogue among the
different interests groups and creates new arenas for reaching a minimum consensus about what
is the common good. The relationship between decentralization and good governance requires
further study and analysis in particular contexts, thus we can learn how to adapt the prescription
to the existing conditions. The next section reviews the main arguments regarding this relation.
Although, before exploring the arguments on the relationship between decentralization and
good governance, it is important to conclude this section by stating the definition of (good)
governance proposed and assumed in this study:
Governance refers to the complex interactions between actors with different priorities by
which decisions in regards to public concerns are made; as such, it is a power game, where
competition and cooperation may coexist. It includes formal institutions, regimes
empowered to enforce compliance, as well as informal arrangements that people and
institutions either, have agreed to, or perceive to be in their interest. The core players are
the government the private sector and civil society56
56 Civil society includes individuals and groups, organized and unorganized, who interact in the social political and economic domains and who are regulated by formal and informal rules and laws (Governance for sustainable human development: a UNDP policy document 1997).

107
5.3 DECENTRALIZATION AND GOVERNANCE:
A CAUSAL OR CASUAL RELATIONSHIP?
The relation between decentralization and governance appears to be implicitly clear; core
characteristics of good governance, even from very different perspectives are all claimed to be
promoted, directly or indirectly, by decentralization. If decentralization has the potential to open
the public space and grant an opportunity to be included to those that have been excluded, it is a
key strategy for promoting participation and equity. If decentralization is the appropriate policy
for applying the principle of subsidiarity57, it will enhance the state’s capacity and performance;
it will promote efficiency. Finally, if decentralization is the appropriate strategy for reducing the
state’s interventionism and enhancing the market, decentralization will promote efficiency and
development; and indirectly it will reduce poverty.
The variation in the arguments about the relation between decentralization and governance is
determined by variations in the definition of these concepts (see Chapter 5.0), and by the values
that determine the social and political priorities for societies. The literature and research review
revealed three lines of argument explaining the relationship between decentralization and good
governance: political, managerial, and economical. These three themes coincide with the
different parties who support the decentralization reforms. It is most common to find these
arguments simultaneously, with varying emphasis given to one theme over the others.
The major arguments regarding the relationship between decentralization and governance,
whether explicit or not, are:
a. The political relationship: this argument is derived from the claim that the principles of
democracy are the most appropriate for building good governance; democracy is the ideal
type of political system and the one in which good governance can flourish (Fukasaku
and Hausmann 1998; Montero and Samuels 2004). As decentralization enhances
democracy, it necessarily does the same to good governance. Participation, a common
indicator of both good governance and democracy, is an expected outcome of political
decentralization. This was and still is an important argument for the promotion of
57 Subsidiarity means that decision-making should be made at the lowest possible level, and that services should be provided at the lowest level in which cost/benefit is most effective (Hall and Pfeiffer 2000).

108
decentralization in Latin America (García Delgado and Borja 1989; Lovan, Murray, and
Shaffer 2004; Cunill 1990). In Latin America, as mentioned before, it was argued that the
high concentration and centralization of power was an obstacle for democratization; as
central governments were traditionally disconnected from the local authorities and from
the people. Decentralization was seen as the perfect strategy for promoting real
participation and real democracy (Nohlen 1991; Borja 1989; Nickson 1995; Morris and
Lowder 1992).
b. The Managerial relationship: decentralization was originally suggested as a reform
within the state, with the central goal of promoting coordination and efficiency through a
balanced distribution of functions between the center and local governments. This
argument developed into a claim stating that decentralization will enhance good
governance for two reasons; first, it promotes synergies among three key actors in the
public sphere: the state, the civil society, and the private sector; second, it promotes
efficiency by dividing functions among levels of government, based on the principle of
subsidiarity. Efficiency must improve through administrative decentralization, and
efficiency is an indicator of good governance (Botero Restrepo 1987; Bresser Pereira and
Spink 1999). Decentralization positively impacts good governance as it enhances the
state’s capacity and efficiency.
c. The economic relationship: this argument promotes the limitation of the state’s
responsibilities and promotes privatization as a form of decentralization. According to
this argument, as decentralization redefines the functions of the state and limits its
intervention in the market, it promotes economic growth. The market is considered the
most efficient motor of economic growth and a requirement and guarantee for
development (Bennett 1990; Offe 1984). Good governance will be promoted as citizens
benefit from private expertise and management. Additionally, although the market may
not be redistributor of wealth, because it creates wealth there will be less poverty in the
overall system.

109
Decentralization in Latin America was a main part of the state’s modernization strategies of the
1980’s and 1990’s. Reformers sought to reduce the size of the state, particularly the central state,
and to limit its reach. However, the social and political conditions in which the reform was
implemented created a lot of additional outcomes. Decentralization was the “recipe” that
appeared to work for all (Nickson 1995); it was a policy championed by promoters of the
economic, administrative, and political reforms in the region (Cunill 1990; Rivera Araya 1992;
Morris and Lowder 1992; Boisier 1992).
For the political elite, decentralization represented a way to reconnect their regimes to social
groups from which they have become increasingly distant (Manor 1999). For the economic elite,
decentralization offered a legitimate framework for promoting privatization and deregulation of
the labor market. For the civil society, in particular grassroots advocates, decentralization
appeared as an opportunity to be part of the governing process and, hopefully, balance power
(Peterson 1997); decentralization was claimed to be a condition or for equity (Boisier 1992).
Due to its apparently capacity for fitting even contradictory expectations, decentralization was
initially embraced without much questioning. Nevertheless, some academics and practitioners
worried about potential negative impacts that decentralization could have on the systems of
governance and raised questions regarding its suitability. For example, a report from the Latin
American Center for Administration for Development (CLAD), dated 1990, warned,
Every decentralization process is legitimate and commendable, only if it helps in alleviating the consequences of the structural reforms under implementation; otherwise it will be only another strategy for debilitating the state (Cunill 1990, p.44). 58
Little attention was given to these warnings and existing conditions were rarely mentioned or
evaluated. Once the trend was set in motion, the implementation of the decentralization reforms
moved much faster than the debate.
Good governance and decentralization in Latin America were implicitly linked from the very
beginning. The implementation of decentralization was central to the promotion of important
changes in the structure, functions, and mechanisms for decision-making regarding public issues.
Consequently, new meanings of what is private and what is public emerged from decentralizing,
and important changes in the roles of those involved in public issues (Ottenberger-Rivera 1997).
58Original in Spanish, translated by the author; my emphasis.

110
Decentralization is considered central to the emergence of new forms of organization and interest
representation (new forms of governance).
The first evaluations of the decentralization reforms began to specifically examine the
underlying relationship between decentralization and good governance. What is clear and
commonly accepted is that decentralization played a central role in the emergence of new forms
of governance, despite the fact that it was promoted without explicit goals regarding its impacts
on the systems of governance (Cochrane 1983; Botero Restrepo 1987). What is unclear is the
quality and quantity of these impacts; certainly the results of the decentralization reforms in
Latin America are inconsistent and contradictory enough to remain an open debate in the region
(Tulchin and Selee 2004).
Two recognized impacts are particularly important in the context of this study:
- Decentralization is central to the emergence of new forms of organization and interest
representation (new forms of governance);
- Decentralization reforms caused of redefinition and re-delimitation of the private-public
realms.
The case study presented in this study, which showcases the impact of the decentralization
reform in the system of governance of Bogotá, aims at gathering and analyzing evidence to
support, deny, and/or reframe the aforesaid impacts. It is widely accepted that more evidence
from the field is required for understanding the relationship between decentralization and
governance, the next subsection presents a brief note on that particular body of research.
5.3.1 A note on research It was difficult to find research studies that refer to the relationship between decentralization and
governance explicitly. Nevertheless, many research studies aiming at evaluating the results of the
decentralization reform, in Latin America or elsewhere, used indicators of good governance for
assessing it. Thus, from reviewing research on decentralization and on governance it is possible
to infere some arguments about the relationship between decentralization and governance.

111
Interestingly enough, in the year 2004, the Latin American Program of the Woodrow Wilson
International Center for Scholars released a book focused on evaluating the impacts of
decentralization on democratic governance in Latin America. More specifically, as stated in the
book, “we examine the impact of decentralization on civil society and how civil society and the
state interact in decentralized democratic governance” (Tulchin and Selee 2004, p.1).
This research study focused on two issues; first, the impact of decentralization within the
state, how much decentralization has redistributed power within the state; and second, changes
in the relationship between the state and the citizens, how much has decentralization
redistributed power between the state and citizens? Although the study looks at both the state
and the civil society, its approach is fairly state centered, as they are interesting in answering
these questions to evaluate the impact of decentralization in creating a more responsive and
accountable state (Tulchin and Selee 2004, p.4).
This is an important study for the region as it looks specifically at the relationship between
decentralization and good governance; moreover, the study assumes a normative approach and a
causal relationship between these concepts. Decentralization has important impacts on
democratic governance, which may be positive or negative, depending on the historical context
and previous conditions of the socio-political system in which it is implemented. The Woodrow
Wilson research project provides empirical evidence for some of the basic assumptions orienting
this study and for the research design and methodology chosen.
The next chapter presents both, research design and methodology, as well as the main
questions that I aim to answer.

112
6.0 RESEARCH DESIGN AND METHODOLOGY
“To be effective in developing theory and in being able to make statements about structures larger than an individual or the small group, social sciences must be comparative"
Peters, 1998
Social and political realities diverge in many ways, even when they start with the same question.
For example, different governments may start with the question of how to manage and balance
the interests of their constituents and finish with different answers. Different organizations with
the same goal, to improve the welfare of the most vulnerable citizens within a country, may
choose different strategies to the same end. By comparing, we can learn and understand diverse
problems and solutions.
Methodologically, the study is based on a comparative political analysis that reviews 5
periods of government in Bogotá, two before the decentralization reform was implemented and
three after, covering 12 years of the city’s life. In order to validate the point of inflection in time,
not only the formal introduction of the reform was considered, but also this was a question
included in the interviews; if you had to draw a line between before and after, what would be
your choice? The answers confirmed the relevance of the period chosen for this study.
The comparison takes two forms that are complementary; a process and policy analysis, and
a cross time comparison. Studying the impacts of a policy without considering the structures and
dynamics where it is implemented has little value to policy makers (Mead 1997). Likewise,
understanding the complexity and dynamics of political change is not enough; measurable
outcomes of the process itself need to be assessed, as public policies are prescriptive solutions to
identified problems.
In the case of Latin America, it is very important to conduct empirical studies in order to
evaluate and understand impacts and results of the reforms implemented in the 1980s and 1990s.
Not only because of the incredible amount of resources, both economic and human, invested in

113
the reforms, but even more importantly, because failure of the political compromises created
during the reform, will deeply comprise the stability of the region. It is particularly important to
further explore the relationship between reforms and the capacity to govern at the city level, as
cities in Latin America hold most of its populations and are central political arenas.
Many studies compare the outcomes of decentralization reforms across countries without
specifically addressing good governance, with the exception of the Woodrow Wilson Center’s
previously mentioned study; not many have compared sub-national political units (López-
Murphy 1995). This study aims to contribute in filling this gap.
The objectives are:
- Describe and understand the process of implementing a decentralization reform (policy
implementation) in Bogotá, and;
- Identify the impacts of decentralization on the system of governance in the city.
As mentions by Peters, the comparison of a number of instances of a process or an institution
greatly contributes to illuminating the process or the institution (or both). In this case, the process
under review is decentralization, and the institution is the system of governance. In addition,
Peters mentions, the comparative analysis of policy implementation helps in understanding how
the process unfolds in different settings (Peters 1998, p.13).
The process and institutional analysis of the implementation of decentralization as a public
policy in Bogotá, seeks to unveil and understand the complexity and dynamics of political
change from the perspective of main players in the political arena, and to observe whether or not
there are new players and new rules in the system of governance. Additionally, by analyzing the
process, it is possible to identify those elements that impeded or facilitated the consolidation of
the reform. As policy analysis is an applied social science discipline that attempts to produce
useful information for policy decision making in political contexts (Dunn 1994, p.4); the final
aim is to produce useful information for other cities that that are in the process of implementing
decentralization policies.
The cross-time comparison aims to identify the impacts of the decentralization reform on the
system of governance of the city in regards to three core variables: participation, equity, and
efficiency. These variables were central in the arguments that supported decentralization in the
region, the country and the city. It aims to verify if the expected results of decentralization on the

114
improvement of the system of governance have occurred. Additionally cross-time analysis brings
evidence to the debate regarding whether or not decentralization is the appropriate policy for
enhancing democracy and efficiency in Latin American cities.
To understand the process of implementing a decentralization reform, we use a case study of
Bogotá, which provides evidence from a local perspective. An analysis is critical in light of the
increasing importance that sub-national political units are gaining; for some regions, urbanization
is as equally an important trend as globalization (e.g. OECD 2001). Finally, decentralization is a
political intervention, which costs of failing could be irreparable.
6.1 A COMPARATIVE STUDY:
COMPARING RESULTS, UNDERSTANDING PROCESSES
A comparison seems to be the most appropriate method for understanding varied and diverse
realities and for evaluating change. In a sense, all analysis is comparative since every attempt to
identify causal processes or relations involves comparing situations, objects, subjects, and other
factors (Pickvance and Préteceille 1991; Peters 1998). In the case of this study conducting a
comparative analysis appeared to be the most appropriate methodology, due to the nature of the
problem explored (a political reform and its results).
Most of research studies using this methodology have been focused on cross-national
analysis; though, as mentioned by Peters, comparative analysis across sub-national units within a
single nation-state has the advantage of holding constant, or at least minimizing, a number of
factors that may add great variation to results (Peters 1998). In addition, time could be included
in the comparison, and the same political unit could be compared across time, adding even more
control over cultural and social factors that otherwise may add great variance. The cross-time
method looks at relationships among variables within individual units across time. Finally, the
widespread promotion of decentralization as a key element of democratization and
modernization, that prevailed for, at least the last twenty years, has increased the interest in
conducting comparative studies at the sub-national level (Hall and Pfeiffer 2000).
Snyder argues, in his article "Scaling down: the Sub national Comparative Method" that sub-
national comparisons better equip researchers to handle the spatially uneven nature of major

115
processes of political and economic transformations (Snyder 2001). An early example of such
studies is “Democracy, Decentralization, and Decisions in Sub-national Politics” by Ashford
(1976), a recent study is “Cities for Citizens. Improving Metropolitan Governance”, an OECD
study that examines the roles of different levels of government intervening in metropolitan areas,
and the changing relationship of the public sector with the private sector and civil society
(OECD 2001, p.4). Sub-local units have emerged as interesting and important objects of study in
regards to public policy, particularly in light of the increasing complexity and significance of
cities.
Sub-local units within a municipality may be geographical, administrative, or political
divisions; Humes, (1991, p.193), by comparing the structure of cities from the north and the
south, classified them into four groups. The first group includes cities with subdivisions that are
political and administrative in nature, and in which these sub-local urban units have more
inhabitants and more resources than most of the other municipalities in their country; an example
of this type is Paris. The second group includes large cities in which the subdivisions are mostly
administrative, and in which sub-local offices are mostly branches of the central government; an
example of this group is New York. The third group includes cities that have incorporated,
formally or informally, close municipalities into their system; examples of this cities are Tokyo
and Sao Paulo. The fourth group includes cities that have a close relationship with rural sub-
municipalities that still have some autonomy; an example of this is the English parishes. Formal
and informal levels of organization could coexist and, as mentioned by Humes, there is not
always a clear division.
Certainly, Bogotá is a good example of this last statement; it could be included in any of the
previous groups. In theory, its sub-local units of governments have both political and
administrative functions and that makes it a city of the first group; in practice, it seems to be
located more in the second group, as the central government manages the sub-local units of
government as extensions of its authority. Bogotá may also be classified in the third group of
cities, as it has incorporated surrounding municipalities. Finally, the city has strong relations with
surrounding rural municipalities, which are somewhat autonomous and therefore could belong to
the fourth group as well.

116
As presented in Chapter 4.0, decentralization was a political change that the New
Constitution of 1991 mandated for Bogotá, with the normative aim of promoting and enhancing
good governance; it was expected to improve the programmatic and political capacity of the
system. This process created an important controversy concerning the city numerous studies are
focused on the years after decentralization. Additionally, although it is widely accepted that the
city works and was improved by the reforms, there is no empirical evidence to support this
claim. Thus, as it is important to acknowledge the value of citizens’ perceptions, it is equally
important to support or question those perceptions with facts.
To ensure the quality of this study and its results, measures for maximizing experimental
variance, minimizing error variance, and controlling extraneous variance were included. To
maximize experimental variance, this study covered 12 years of Bogotá’s history, analyzed each
administration as unique, and examined the periods before and after as part of the respective
period. To minimize error variance, primary and secondary sources were consulted, qualitative
and quantitative data collected, and diverse methods were used in the collection of data,
including on-site document revision, identification and collection of existing reliable databases,
panel discussions, in depth interviewing and focus group. Triangulation was used to control for
any additional error; finally, to control for extraneous variance, the ideal type of good
governance was defined and associated indicators were identified.
As expected, the main threat to this project, in particular regarding error variance, was the
quality and quantity of available data, a common problem in the developing world, and
potentially anywhere else. Data from and about Bogotá is scarce, uneven, and early data is
almost impossible to find; maybe “Colombians do not have a memory” as Gabriel García
Marquez, the Colombian Nobel prize argues.
6.1.1 Questions and Hypothesis
The New Constitution of 1991 in Colombia promoted decentralization as the central policy for
enhancing democracy in the country; the new political charter paid particular attention to Bogotá,
the capital of the country and its most important city. The main goals of the reform were to
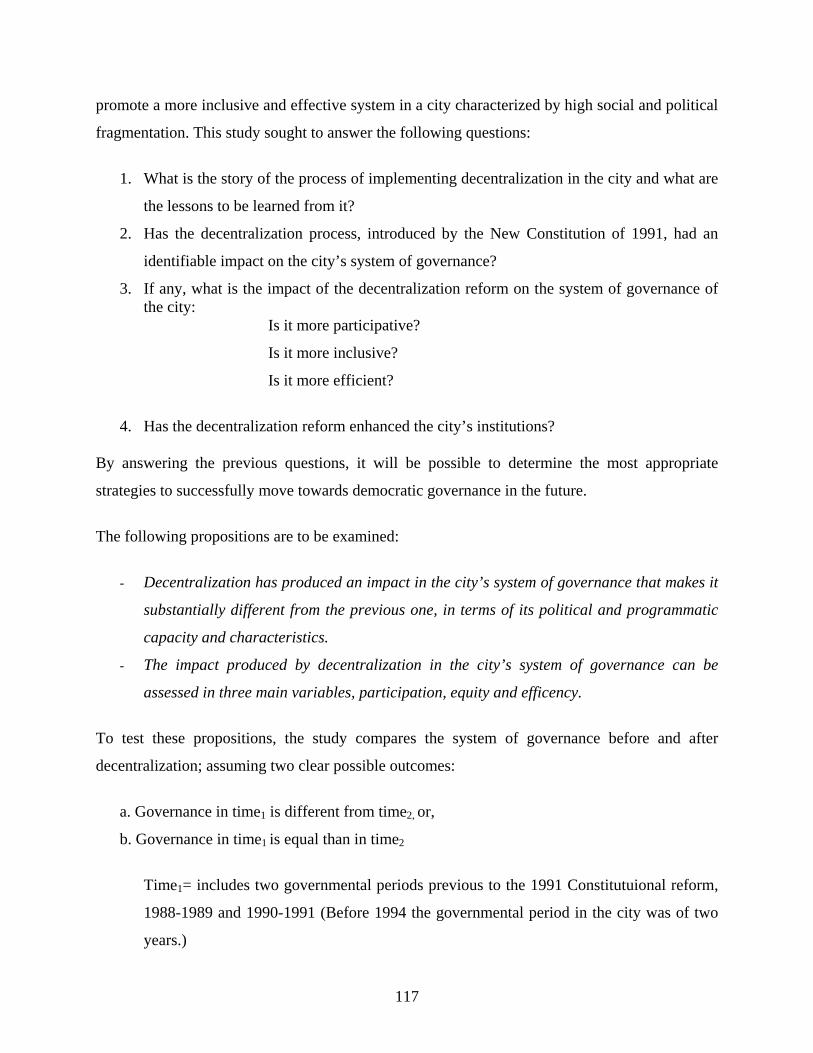
117
promote a more inclusive and effective system in a city characterized by high social and political
fragmentation. This study sought to answer the following questions:
1. What is the story of the process of implementing decentralization in the city and what are
the lessons to be learned from it?
2. Has the decentralization process, introduced by the New Constitution of 1991, had an
identifiable impact on the city’s system of governance?
3. If any, what is the impact of the decentralization reform on the system of governance of the city:
Is it more participative?
Is it more inclusive?
Is it more efficient?
4. Has the decentralization reform enhanced the city’s institutions?
By answering the previous questions, it will be possible to determine the most appropriate
strategies to successfully move towards democratic governance in the future.
The following propositions are to be examined:
- Decentralization has produced an impact in the city’s system of governance that makes it
substantially different from the previous one, in terms of its political and programmatic
capacity and characteristics.
- The impact produced by decentralization in the city’s system of governance can be
assessed in three main variables, participation, equity and efficency.
To test these propositions, the study compares the system of governance before and after
decentralization; assuming two clear possible outcomes:
a. Governance in time1 is different from time2, or,
b. Governance in time1 is equal than in time2
Time1= includes two governmental periods previous to the 1991 Constitutuional reform,
1988-1989 and 1990-1991 (Before 1994 the governmental period in the city was of two
years.)

118
Time2= includes three governmental periods after the 1991 Constitutuional reform, 1992-
1993, 1994-1996, and 1997-2000 (This period covers three administrations, to better
trace the process, but also because the first period was mainly transitional.)
Figure 34 summarizes the research design and Table 34 presents the periods and administrations
that were included.
1991
1993 Decentralization N
ew C
onstitution
T2 Good Governance (s ocio-political)
Outputs /Capacity a)Programatic b) Political Outputs /Capacity a)Program atic
b) Political
T1 Governance Statecentric
Change
Figure 34: Research Design
Table 34: Period covered and Administrations included in the study
Time Frame Term Mayor elected Government period
1 Andres Pastrana Camargo June 1988 to May 1990 Before
2 Juan Martin Caicedo Ferrer Sonia Durán de Infante * June 1990 to May 1992
3 Jaime Castro** June 1992 to Dic. 1994
4 Antanas Mockus Sivickas- Paul Bromberg Zilberstain*** Jan. 1995 to April 1997 After
5 Enrique Peñalosa Londoño Jan. 1998 to Dic. 2000
* She replaced mayor Caicedo for the last two months ** Transition *** He replaced mayor Mockus for the last nine months 6.1.2 Variables and Indicators: assessing changes in governance

119
The independent variable is decentralization, introduced as a goal for the country by the New
Constitution of 1991, adopted by Bogotá since the elections of 1992 and legislated for the city in
1993. The basic changes introduced were the creation of a new layer of government at the sub-
local level (the JAL or Juntas Administradoras Locales), and the redefinition of functions and
attributions of all sub-local authorities. The goals were to promote democratic participation, in
alignment with the New Constitution, and to improve the city’s effectiveness and efficiency in
providing services and governing.
Four variants of decentralization policies have been identified, as presented by Rondinelli and
Cheema (2003) those are:
a. Deconcentration: the transfer of functions but not power
b. Delegation: the transfer of certain powers to parastatal agencies of the central state
c. Devolution: power and functions are actually transferred to sub-national political units,
considered by some the ‘real decentralization’
d. Privatization: The transfer of power and responsibilities to private groups or companies
(This is the most controversial, for some this is not recognized as a form of
decentralization.)
It is unclear which of these variants were chosen for Bogotá and it seems that, in practice, a
combination of them have been pursued.
The dependant variable is governance; the definition used, as presented in Chapter 5.0, is:
Governance is the enacting of political relationships expressed in the process of making,
implementing and evaluating decisions about public concerns. It is a power game, where
competition and cooperation may coexist. It includes formal institutions, regimes
empowered to enforce compliance, as well as informal arrangements that people, and
institutions, either have agreed to, or perceive to be in their interest.

120
This study assumed the following premises:
- Governance is not only the responsibility of government; it encompasses
relationships among different actors in the public and private sectors, as well as
civil society. These actors have interests that may be conflicting, reinforcing, or
complementary;
- The process of balancing private and public concerns expresses the quality of the
system of governance.
The aim is to determine if there have been any changes in the system of governance, in regards
to its programmatic and political capacity. By programmatic, we refer to the system’s capacity to
perform its functions and close the gap between the citizens’ aspirations and its
accomplishments; by political we refer to the system’s capacity to solve conflicts, to manage
different interests, and to include the different voices that live in the city.
Three variables that appeared critical for the political, social, and political sustainability of
the region, the country, and the city, were selected for evaluating changes in the city’s system of
governance: participation, equity, and efficiency (Carrillo-Flórez and Binetti 2004).
1. Participation refers to the possibility for men and women to have a voice in decision-
making, either directly or through legitimate intermediate institutions that represent their
interests. Participation is built on freedom of association and speech, as well as capacities
to participate constructively (UN-HABITAT 2000). Participation has gained status in
political and economical discourse, as it is considered a central element for economic and
social development, and an indicator of the quality of a political system (Sachs 1992,
pp.116-131). It is also very important to examine the quality and scope of participation,
to determine whether its level indicates or not real changes in the structure of power
(Rondinelli and Cheema 2003).
2. Equity refers to the equal access to opportunities for maintaining and improving well-
being in a society, but especially for those most vulnerable; it is assumes that a society’s
well being depends on ensuring that all its members feel that they have a stake in it and
do not feel excluded from the mainstream of society (UN-HABITAT 2000).

121
3. Efficiency refers to the accomplishment of results that meet the needs of the stakeholders
and to maximization of resources (UN-HABITAT 2000).
A basic assumption of this study is that these variables are complementary and not contradictory.
The UN Development Report of 1993, dedicated to participation, established that participation is
no longer a vague ideology, but an imperative, a condition for survival for human kind (Human
development report 1993). More inclusive and participatory relationships among political actors
will be reflected in a more efficient administration and allocation of resources; it will also create
more efficient ways of achieving public goals and solving public problems. Amartya Sen is one
of the leading economist in advocating for understanding the close relation between economic and
social development (Sen 1999, 1987). In the same line of reasoning, and based on case studies,
the Interamerican Development Bank (IADB) argues that equity and efficiency are integrally
connected and that detailed analysis is required to discover these connections (Carrillo-Flórez
and Binetti 2004; Kliksberg 2003).
As mentioned by Deborah Stone, efficiency and effectiveness are concepts that has been used
mainly to refer to “getting the most out of a given input” or “achieving an objective for the
lowest cost”. But, as she emphasizes, they reflect how society chooses to spend its money or
allocate its resources in order to get the most value; they directly reflect the society’s values
(Stone 1997). Participation, equity, and efficiency are predicated values in the democratic
discourse; they are accepted goals for both statecentric and polycentric perspective of
governance; more importantly they are critical goals for the Millennium Development campaign.
Table 35 presents the three variables for assessing changes in good governance: participation,
equity and efficiency, and their indicators. Some changes from the original design were
introduced in order to optimize the use of available data.

122
Table 35: Variables and Indicators
Main
Concept Variables Indicators Number of voters and participation in relative elections
Increase in the number of parties participating in elections
Increase or existence of public meetings for discussing planning and budget
Increase or creation of mechanisms for accessing available information Increase or creation of programs promoted by community groups and
organizations Incorporation of excluded groups in the consultation process
Participation
Legislation on participation Existence of information on differential situations and the needs of women
and men (gender perspective)59 % and/or total increase in women’s representation in government and boards
% reduction in the population living below the poverty line
Income distribution
Amount of money directed towards social investment
Explicit or implicit utilization of equity as a criteria for prioritizing or investing
Improvement in access to employment/reduction of informality
Laws and programs supporting the informal sector
Budget amounts and programs for the displaced
% reduction in the number of street children and homeless
% increase in service coverage
Reduction in the gap of income distribution
Equity
% increase in the homeowner population or access to housing programs
Debt management and sustainability
Improvement in credit rating
Income/expenditure of government per capita
Increase in economic growth/GDP
Continuity in programs and projects Establishment of new and cooperative relations with external organizations
and institutions
Governance
Efficiency
Improvement in the revenue collection
59 A single mention of gender or gender issues would be counted here, as gender policies are underdeveloped in most city’s of the institutions.
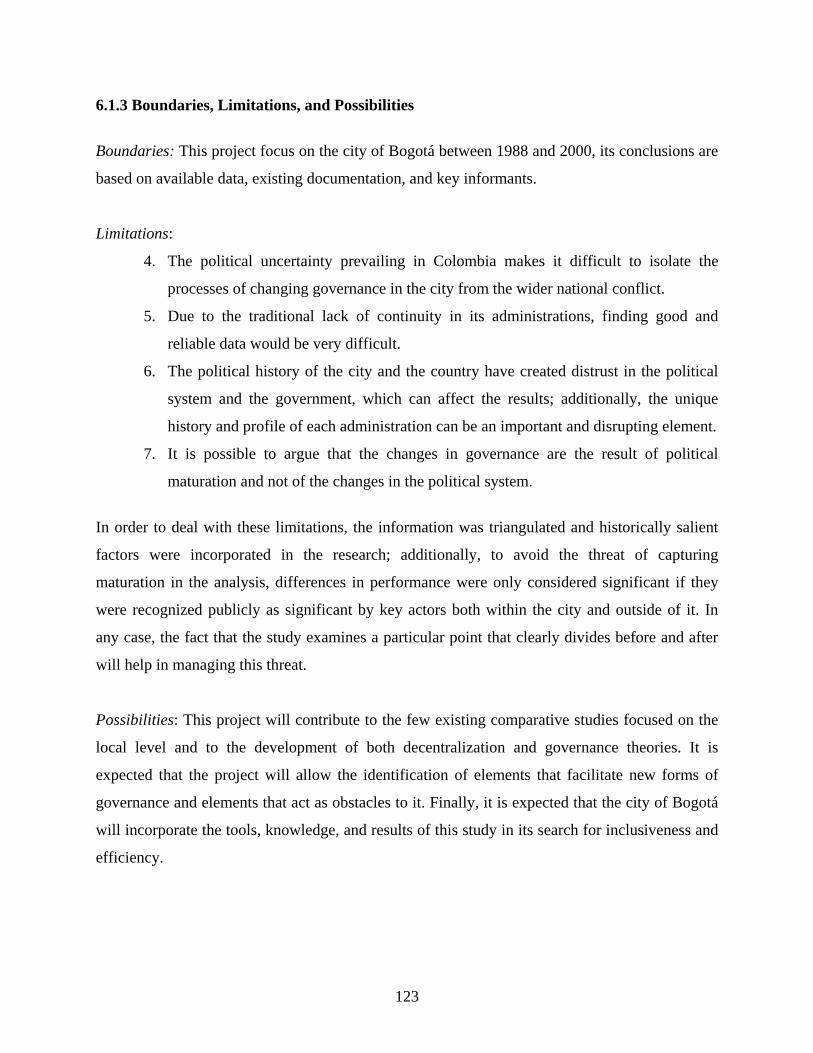
123
6.1.3 Boundaries, Limitations, and Possibilities
Boundaries: This project focus on the city of Bogotá between 1988 and 2000, its conclusions are
based on available data, existing documentation, and key informants.
Limitations:
4. The political uncertainty prevailing in Colombia makes it difficult to isolate the
processes of changing governance in the city from the wider national conflict.
5. Due to the traditional lack of continuity in its administrations, finding good and
reliable data would be very difficult.
6. The political history of the city and the country have created distrust in the political
system and the government, which can affect the results; additionally, the unique
history and profile of each administration can be an important and disrupting element.
7. It is possible to argue that the changes in governance are the result of political
maturation and not of the changes in the political system.
In order to deal with these limitations, the information was triangulated and historically salient
factors were incorporated in the research; additionally, to avoid the threat of capturing
maturation in the analysis, differences in performance were only considered significant if they
were recognized publicly as significant by key actors both within the city and outside of it. In
any case, the fact that the study examines a particular point that clearly divides before and after
will help in managing this threat.
Possibilities: This project will contribute to the few existing comparative studies focused on the
local level and to the development of both decentralization and governance theories. It is
expected that the project will allow the identification of elements that facilitate new forms of
governance and elements that act as obstacles to it. Finally, it is expected that the city of Bogotá
will incorporate the tools, knowledge, and results of this study in its search for inclusiveness and
efficiency.

124
6.2 THEORY AND PRACTICE:
FROM THE LIBRARY TO THE FIELD AND BACK
In November of 2003, one week after the city elected a new mayor and new council, I visited
Bogotá in order to collect data, compile documents, and conduct interviews. This was the
appropriate time to do field work as everyone was still engage in the political debate provoked
by the city’s elections, and decentralization had been, for the first time a key issue in the new
mayor’s campaign.
Two months prior to the trip, and with the help of two students from the Universidad de los
Andes, we found and selected primary and secondary sources. Simultaneously, I carried out a
literature and research review on decentralization in Bogotá. A deeper review of primary and
secondary sources was conducted for selecting the most appropriate and accessible to visit and
interview in Bogotá. The following products supported the visit to Bogotá: a list of institutions
and organizations to visit, a list of key informants to interview, a list of documentation to review
and collect, and the schedule of visits and interviews.
Close to 32 organizations were visited with the purposes of reviewing and collecting
documentation, and 31 interviews were conducted, most of them recorded. Appendix G presents
a list of organizations visited, and Appendix H a list of people interviewed. The process of
conducting the fieldwork and the lessons learned at each phase are presented below.
6.2.1 Phases
6.2.1.1 Exploratory I: During this phase, a first literature and research review was conducted
on the concept of governance. Later, as the relationship between decentralization and governance
emerged as a very interesting puzzle, a literature review regarding decentralization was
conducted as well. Finally, the literature on the relationship betweem the two concepts was
explored. From the literature reviews, the research design was outlined, including the main
hypotheses and methodology.

125
The next step in this phase consisted of defining the variables to examine and their
determining relative indicators. I selected the core indicators for assessing good governance by
comparing several studies conducted by main international organizations, particularly in urban
setting and in the third world. I developed an initial list of indicators and a plan for conducting
the study. In order to test out the design, I first needed to determine the project’s feasibility and
suitability in the field. The second phase of the project sought to accomplish this.
Accomplishments:
- Familiarity with the concepts (theory and practice)
- First research design
- Definition of variables and indicators
- Planning the study calendar
6.2.1.2. Exploratory II: During this phase, I approached the field from a distance; I contacted
key informants in Bogotá that I knew from my work with the city, including the director of the
Public Management Division at the Universidad de los Andes. Through e-mail and phone, I did a
first evaluation of the availability of data and the amount of resources needed to collect it. In
consequence, I selected two undergraduate students at Universidad de los Andes to help me
identify primary and secondary sources and plan the agenda for the second phase of fieldwork.
We meet online once a week to compare notes, discuss problems and plan the next week.
After the first month, I developed an initial list of organizations and individuals to contact.
Another month of work was required to contact organizations and individuals, and I a
“snowball” technique. I contacted each organization and individual, shared the goals of the
dissertation, and asked each one to recommend people, organizations, books or documents that
would inform the study. I conducted three informal interviews over the phone. After the second
month and a half, I had established an agenda for my visit to the field, and defined a sample of
organizations, key informants and documents to collect.
Accomplishments:
- Evaluation of available data,
- Evaluation of resources and capacity for gathering data;

126
- Definition of a sample of key informants (with the criteria of including interests groups,
new socio-political actors, and those publicly recognized as knowledgeable about the
city: academics, policy makers, and community leaders)
- Planning the second phase of fieldwork: gathering data
6.2.1.3 Analysis I: During this phase, I contrasted the original design with what I learned from
my research. Although I initially planned on comparing the sub-local units of government, I
decoded to compare only the city as a system, because of the non-existence of comparable data
from the twenty localities, and because of the unevenness of the process in each unit. The city
proved to be a better subject for the dissertation’s goals. I redefined the research design,
determined the period to cover, and review variables and indicators.
Accomplishments:
- Final research design and redefinition of the study plan
- Familiarity with the field’s characteristics
6.2.1.4. Fieldwork: I visited Bogotá during a very interesting time, because the city had just
elected a new mayor and city council; everyone in the city wanted to talk about the government.
The outgoing administration was very helpful and the Secretary of Government assigned
someone as my liaison to the mayor’s office. My project was also welcomed by academics and
researchers, although everyone mentioned the difficulty of building time series, which proved to
be true as the project moved forward. The National Census did not disaggregate data about
Bogotá until the mids 1990s.
With a very tight agenda, I visited close to 60 organizations and conducted 28 interviews in
three weeks; three complementary interviews were conducted after the trip. I reviewed and
collected documentation on each site visit and in the most important libraries in Bogotá. I met
with groups of professors working on public issues from five universities. I shared the same
conclusion of Maria Fernanda Sanchez, head of the project Bogota Como Vamos “It is very
unlikely to find information from before the first Mockus’ government, and even after, there has
not been a systematic evaluation of the results and impacts of the city’s administration” .60
60 María Fernanda Sánchez is the head of the Bogotá Cómo Vamos. Interviewed on November 18, 2003.

127
To emphasize this “lack of memory” shared by Colombia during the period, it is worthy to
mention that during the collection of documentation regarding the city, I found a book of
research studies published in the year 1989 (Santana and Suárez 1989). In order to consult some
of the studies on the list, I visited the organizations that conducted them; interestingly enough,
they were unaware of these studies and documents.
My visit to the city’s new Archive, which was inaugurated on August of 2003, was
particularly interesting. I interviewed the director and met with the person in charge of
collections. It is a wonderful building and an important project for the city; it is expected that the
archive will eventually consolidate all of the documentation that currently exists in each section
of the city’s government. Nevertheless, by November of 2003, it was still an empty shell, as
mentioned by its own director.61
Due to the difficulty in finding the exact data I was looking for, I decided to collect all
possible data, planning to organize and sort it later. I knew it would be more difficult to collect
the data after my departure, as it proved to be.
Accomplishments:
- Collection of data
- Conduction of interviews and focus groups
- Identification of limitations and possibilities on the field
- Learning from experts, politicians, and new and old political actors
6.2.1.5 Analysis II: Sorting and contrasting the information collected on the field and
beforehand was an almost archeological task; it took six months to find the gaps to fill and
another six months to try to fill them. Data that I expected to be sent in two or three months
arrived 10 or 12 months later. I organized the data for the time series to the extent I could, and
adjusted the indicators to the available data. I had to make decisions regarding which data to use
because of the lack of continuity in the collection or processing methods. Once evaluated and
organized, I used the available data to build descriptive statistics and time series, when possible.
The interviews were analyzed in search of themes and categories, and I conducted an analysis of
the focus groups and organized them by contents, such as contradictions, recurrent themes, and
interactions.
61 Interview with Luis Fernando Sánchez, Bogotá’s Archive director, Nov.27, 2003.

128
Accomplishments:
- Sorting and organizing data
- Identification of gaps
- Construction of descriptive statistics and first time series
- First analysis of interviews
6.2.1.6 Analysis III: During this phase, I contrasted my expected results with the findings in the
first draft of the report. New questions and doubts emerged in regards to the organization of
chapters and to the method for reporting the process of implementing decentralization in Bogotá.
Additional questions regarding the relationship between decentralization and governance arose
as I analyzed the interviews, and realized that decentralization was more an ideal than a practice.
Time series were completed and the indicators for each variable consolidated. Four more
interviews were conducted and new data collected to complement and refine the existing data.
Accomplishments:
- Second statistical analysis
- Production of categories, comparison and consolidation of qualitative and quantitative
data
- Production of recommendations
6.2.1.7 Dissemination: An executive report will be presented to the city’s government and it is
expected to conduct several presentations at the city’s universities. The possibility of publishing
a book will be explored. Participation on the X Congress of the Latin American Center of
Management for Development and Public Administration (CLAD), with a paper presenting the
results on participation of this research study.
The next section presents the results from this research study. Chapter 7.0 tells the story of the
process of implementing decentralization in Bogotá, based on the documentation collected, the
existing books, and the voices of those involved in the process. Chapter 8.0 presents time series
for each indicator of the three variables selected for assessing the system of governance. Finally,
Chapter 9.0 presents conclusions and emerging questions.

PART III
DECENTRALIZATION AND GOVERNANCE IN BOGOTÁ

130
7.0 THE PROCESS OF DECENTRALIZATION
THROUGH THEVOICE OF THE PEOPLE
“Decentralization schemes are more likely to be time-buying exercises in which the cards are shuffled to make it harder for the player to appreciate the strength of individual hands”
Estella Lowder (1986)
Change in any dimension is always a challenge; it is resisted because of fear and ignorance, but
also due to wisdom and prudence. Every change has costs and benefits that must be carefully
evaluated in order to decide if it is appropriate or not. However, this analysis often never takes
place, particularly in Latin American politicies. Change involves so many forces and interests
that one might perceive it as a chaotic, uncontrolled process that, once started, is impossible to
stop. What is impossible to deny is that there is a great deal to learn from each process of change.
Decentralization is one of the most important processes of political change that marked the
late twentieth century in almost every country around the world. In the case of Latin America, as
mentioned before, it brought diverse, sometimes even contradictory, expectations for
democratization and modernization. The case of Bogotá serves in illustrates the complexity of
social and political change, as decentralization entails not only restructuring institutions and the
existing political culture, but also questioning the model of governing that has prevailed.
The process officially started when the New Constitution of 1991 mandated the
decentralization of Bogotá in order to address the gap between the city’s size and rate of growth
and its institutions. In this chapter, central players of the process of implementing
decentralization in Bogotá share their visions, experiences and interpretations of the reform.
Their voices are quoted,62 and their arguments contrasted and supported with additional sources
of information such as documents, books, and newspapers. For more information on the
interviewees’ profiles, see Appendix H. 62 All quotes are translations by the author.

131
The chapter presents the antecedents of decentralization in Bogotá; the reasons used to
promote it; how it was, or was not, promoted by the city’s administrations and why; the main
players; the rules, and how the different parties evaluate the results. Finally, some lessons that
one may infer from hearing different sides and versions of apparently the same story, are
presented.
7.1 ANTECEDENTS
Although this study examines the latest process of decentralization, it is important to review any
antecedents regarding decentralization in Bogotá because they are a part of the city’s history and,
one way or the other, part of its missing memory. Also, because they are critical in understanding
the expectations and limitations resulting from the latest decentralization reform promoted by the
New Constitution of 1991.
Even before the country gained its independence from Spain, some type of authority existed
to represent the central government in the local neighborhoods of Santafé63 (Zambrano P. and
Vargas Lesmes 1988). According to Fabio Zambrano64, one of the city’s historians, the first
effort to decentralize the city’s administration could be traced to an ordinance from 1774, which
promoted, for the first time, a civil administrative division in the city. As professor Zambrano
stated, “It is the one time in which it was thought that the city was inhabited, not by people that
have souls, but by citizens; people with the capacity to decide.”
The city changed from being divided into three parishes, an administrative division
associated with the church, to being divided into four administrative quarters, based on the police
presence in the city, and eight neighborhoods. Each quarter had a mayor and each neighborhood
a neighborhood mayor. The town council, Cabildo, which was constituted by regents, regidores,
appointed the mayors. The reason for this change was the recognition that the city’s mayor could
not manage a city of 20,000 inhabitants.
The nineteenth century represents a transitional period from the colonial regime to
modernity, in which many contradictions are found in the city. The city had both parishes and
63 Santafé was the name given to Bogotá by its founder, Gonzalo Jiménez de Quesada, on August 6, 1538. 64 Fabio Zambrano is a city’s historian and professor at the History Department in the Unversidad de los Andes; interviewed on Nov.12, 2003.

132
neighborhoods, which, according to Zambrano are contradictory in nature, “It is to parishes to
manage souls and to neighborhoods to manage citizens.” This blurred territoriality persisted
until the end of the nineteen century. Side to side with a political system that incorporated
elements of modernity, such as the appointment of the city’s Mayor by a civil authority and the
election of the city councilors, one found an administrative division based in traditional parishes.
In regards to the city’s political culture, Zambrano remarked that the city tended to remain
isolated from the country and looked to keep its imperial status, “The city was conservative, class
segmented, racist, and praised Spaniard values.” This political culture was reflected in its
administration.
The twentieth century was, according to Zambrano, “A century of modernization without
modernity.” The development of public transportation changed the city’s reach and shape. The
construction of the airport and the extension of the railroad connected the city more than ever to
the country; isolation was no longer possible. The city’s population increased significantly, from
100,000 inhabitants in 1905, to 235,421 in 1928. Moreover, between 1918 and 1928, the city
grew 5 percent annually. In 1951, the city had 715,250 inhabitants, representing an increase of
6.1 percent annually.
The scale of the city has changed importantly; it changed from a municipality to a capital,
and for the first time it had enough political leverage, equal to the number of voters, to pressure
for its independence from Cundinamarca, its hosting departamento (state). Bogotá was
subordinate to Cundinamarca until the mid 20th century; its governor appointed the city’s mayor
and the city did not have the autonomy to manage its own income from taxes and rent
(Zambrano P. and Vargas Lesmes 1988; Velásquez Gavilanes 2003).
It was under Colombia’s only dictatorship of the twentieth century that the city’s autonomy
from Cundianmarca was granted. In 1954, General Gustavo Rojas Pinilla, through presidential
decree No. 3640, officially sanctioned Bogotá’s new status as Distrito Especial-D.E., special
district. In Zambrano’s view, the most important impact of the reform was the fact that it gave
the city control over the land and its use; according to him, “The best business that ever existed
in Bogotá is the sale of lots without public utilities, and, who were the property owners? The
city’s elite.”
In same year, 1954, the Assembly of Cundinamarca through ordinance 7 of 1954, decreed
the annexation of six surrounding municipalities to Bogotá. Additionally, the national
133
government, by decree 3640, authorized the city’s mayor to create alcaldes menores, “minor”
mayors, where needed. This figure, “minor” mayor, was intended to reduce severe political
tensions beneath the annexation of these six municipalities. Nevertheless, the minor mayors were
mere subalterns of the city mayor and did not have any political or administrative autonomy; in
addition, there was not any provision for citizen’s participation (Velásquez Gavilanes 2003,
p.28).
Three reforms introduced in the second half of the 20th century aimed at enhancing the local
governments in Bogotá. In 1972, Mayor Carlos Albán Holguín, a conservative, formed a
commission for designing a decentralization program; two goals were stipulated, to close the gap
between government and citizens, and to promote participation. The outcome was Agreement 26
of 1972, which allocated funds to the city’s 16 zones for use in local development.
A coordination board consisting of the Mayor, the city’s general secretary, four councilors,
and the sixteen minor mayors, was created. A special office for local affairs was created in the
Government’s Secretariat, and a local consultant board supporting the minor mayor was created
in each of the 16 zones. The District Planning Department was in charge of implementing this
reform, by defining the structure, procedures and human resources needed, as well as the local
investment plan (Velásquez Gavilanes 2003; Santana R 1988).
In 1977, Mayor Bernando Gaitán Mahecha, a liberal, introduced a new reform approved by
Agreement 8 of 1977. The reform aimed to improve the local planning and to reduce the amount
and length of procedures. The local administrative board was eliminated, and the structure of the
local consultant board was changed. A member of the city’s planning department would now sit
on the zonal boards to help the minor mayor in the creation of a zonal plan to be presented to the
Mayor, who would be in charge of including it in the city planning. Two new zones were
created, La Canelaria y Rafael Uribe, to total 18 zones in the city (Velásquez Gavilanes 2003,
p.29).
In 1982, Mayor Augusto Ramírez Ocampo, a conservative, named a commission to propose
another administrative and political reform. The Mayor, by Decree 2621 of 1982 introduced a
partial reform, while the commission finished the proposal to be presented and discussed by the
City Council. The mayoral decree focused on defining and enhancing the zonal government. It
changed the name from alcaldes menores (minor mayors) to alcaldes zonales (zonal mayors),
and created several mechanisms for promoting participation; additionally, by Agreement 14 of

134
1983 Mayor Ocampo created Bogotá’s 19th zone, Ciudad Bolivar (Alcaldía Mayor de Bogotá
2005).
On January 15 of 1986 the National Congress legislated Law 11, which, as stated in its first
article, intended to equip the municipalities with an administrative and fiscal statute that would
allow them, within an autonomous regime, to accomplish their functions. It ordered local
authorities to promote effective community participation in the handling of local public issues, as
well as to propitiate regional integration65. This law stemmed from a constitutional amendment
of 1968, which created a new layer of government for big municipalities such as Bogotá. It took
eighteen years to approve it as part of the decentralization program promoted by president
Betancur.
The central arguments for this amendment was that cities such as Bogotá are so large, that in
real terms there are cities within the city, and the governing of these sectors requires political
institutions capable of reacting to their specific problems and needs. Additionally, it emphasized
the importance of bringing the administration closer to citizens; law 11 provided for the election
of the Juntas Administradoras Locales (JAL), local administrative boards, by the citizens of each
zone (Presidencia de la República 1969).
In 1987, supported by Law 11, Mayor Julio César Sánchez, in collaboration with Bogotá’s
Chamber of Commerce and other institutions, promoted a serious discussion regarding the city’s
administrative structure, and presented a reform proposal to the council66. The City Council
approved Agreement 8 of 1987, by which, local administrative boards were to be freely elected
in the now twenty localidades and a zonal independent budget was to be provided for local
projects. Despite Congress’s earlier ruling and the city’s commitment to this reform, it was never
implemented. The Administrative Tribunal of Cundinamarca first suspended and later declared
null agreement 8 of 1987.
It is unclear why none of these reforms was fully implemented. Changes in the structures and
functions of local authorities were discussed for the promotion of autonomy and legitimacy.
Nevertheless, the autonomy and leverage of the local mayors remained unchanged, and local
administrative and political structures remained very weak. The local mayors were, and for many
65 For reviewing all laws and legal documents about Bogotá visit: http://calsegen01.alcaldiabogota.gov.co:7772/sisjur//normas/Norma1.jsp?i=9130 66 Read the complete analysis in (Alcaldía Mayor and Cámara de Comercio de Bogotá 1987).
135
still are,67 second-class civil servants hired by the city to represent the Mayor’s political interests
locally.
In 1991, Mayor Juán Martín Caicedo Ferrer, a liberal, and the last appointed mayor in the
city, presented another proposal for the creation of local administrative boards. Nevertheless, as
his proposal overlapped with the expedition of the New Constitution, which would cause deep
political change for the country and the city, it became irrelevant.
7.2 THE BEGINNING The official process of decentralization began at the territorial commission of the National
Constitutional Assembly, in which Jaime Castro68 proposed including Bogotá as a topic for the
commission. After members of the commission approved a list of themes, sub-commissions were
created for studying particular topics. The only member in Bogotá’s sub-commission was Jaime
Castro; in his words, “I was told, ‘as you proposed it, you take it,’ even though I was not an
expert in decentralization, and my experience came from working with municipalities in the
department of Cundinamarca” (see also Mockus S. et al. 1997, p.9).
Jaime Castro presented the reform proposal for Bogotá to the Assembly’s plenary session; he
was convinced that the only way to modernize the city’s political and administrative structures
was through a constitutional mandate. “I knew that a traditional centralized government would
not share power voluntarily; this is why the decentralization reform in Bogotá could only be
mandated by the constitution. No one transfers responsibilities and resources voluntarily”.
When presenting the proposal to the Constitutional Assembly, Jaime Castro argued two reasons
for supporting the proposed reform; decentralization would improve both efficiency and
democracy in the city (Presidencia de la República 1991). As Jaime Castro claimed, “In cities as
big as Bogotá, it is impossible to govern and administer them from a unique center of power; one
must create several centers of local power within the city”.
7.2.1 The New Constitution and the City 67 As expressed by several interviewees, including Paul Bromberg and Alberto Maldonado. 68 Jaime Castro was Minister of Government in 1986, an advocate of the New Municipal Regime that established direct elections for mayors in the country, and of Laws 11 and 12 of 1986, which promote administrative and fiscal decentralization. He was Mayor of Bogotá, from 1992 to 1994; interviewed on November 10, 2003.

136
The National Constitutional Assembly approved a new political and administrative reform for
Bogotá, aimed at enhancing the city’s autonomy and management, and promoting
decentralization. The status of the city was changed, once more, from Distrito Especial (Special
District) to Distrito Capital (Capital District). Bogotá became a separate electoral district,
sending its own representatives to the National Congress, which gave the city certain political
bargaining capacity in an arena where it was previously at a disadvantage. The city also obtained
administrative autonomy from the Department of Cundinamarca; and finally, it obtained more
control over its budget (Gilbert and Dávila 2002, p.32). The city apparently experienced a deep
political change.
Regarding the city’s political structure, the new charter included important guidelines for
implementing decentralization in Bogotá, including the election of representatives for sub-local
units of government. The New Constitution assigned the responsibility for the legislation of
specific rules orienting the decentralization reform to the Congress, the City Council, and the
Mayor (Velásquez Gavilanes 2003, p.36). The main guidelines for promoting decentralization in
Bogotá were presented in four articles (three permanent and one transitory) of the New
Constitution as follows:
- Art. 322. The Council, under the Mayor’s initiative, is to divide the city’s territory into
Localidades, according to social, cultural and economical criteria. It is to the central
authority to guarantee the integral development of the city, and to localities, the
management of its territory. Functions ought to be clearly defined.
- Art. 323. Each locality will have a local administrative board, Junta Administradora
Local (JAL), consisting of at least seven members, ediles, directly elected for an
administrative period of three years. The city’s Mayor will elect the local mayors from
three candidates presented by local councils.
- Art. 324. The local administrative boards (JAL) will manage the distribution and
appropriation of the money allocated to their territory in the city’s annual budget,
considering the unsatisfied basic needs of their populations.
- Transitory article 41 The Congress will legislate the new city statute by June of 1993.
The congress wanted to promote the establishment of local authorities within the city as soon as
possible. For that reason, it decided to postpone the discussion of the city’s general statute and

137
concentrate first in the ruling regarding localities and their authorities, which was a requirement
for running the first local elections in the city. As a result, the first law the Congress sanctioned
after the New Constitution pertained to Bogotá. On January 28 of 1992, the Congress sanctioned
the 1st. Law, which defined administrative, political and fiscal principles for orienting the new
administrative and political structure of Bogotá (Avance Jurídico 2005). 69
Regarding the territorial division, this law established a minimum number of inhabitants per
locality, and mandated the consideration of cultural and social characteristics when creating
localities. In regards to the distribution of functions between central and local authorities, the law
established that it should promote efficiency, participation, and harmony between central and
local plans and actions. It defined rules for elections, candidates, and governmental periods for
the local political system.
Finally, regarding fiscal decentralization, it defined a percentage of the city’s budget that
would be allocated to the localities; no less than 10 percent of the central government income
had to be transferred to localities, increasing 2 percent annually until it reached 20 percent in
1998. The local budget would be allocated by the JAL; once a local development plan was
approved by the same institution, the Fondo de Desarrollo Local, local development fund, would
be in charge of managing these resources (Segovia Mora 1994; Velásquez Gavilanes 2003).
The provision of local budgets, by ordering the allocation of a portion of the city’s budget to
the localities is, according to Jaime Castro, the most important contribution of the New
Constitution to the city’s decentralization. As it is discussed later, the allocation and management
of local resources has not occurred as expected; and it has since been a source of conflict
between the central government and the localities (Zamudio Castañeda, García Velandia, and
Katz García 1997).
According to Raúl Velásquez, “The Congress rushed the legislation regarding Bogotá
because it was in the interest of congresspersons to capitalize the incoming elections of March of
1992”.
Mauricio Gracia70, an expert on the city’s legislation, mentioned,
69 Article 180 of Decree 1421 of 1993, Organic Statute for Bogotá, abolished this law. 70 Mauricio Gracia held the office of Relator, the functionary in charge of the city’s legislative memory, in Bogotá. Interviewed on Nov. 20, 2003.

138
One of the sins of the Congress’ legislation concerning Bogotá is that they ruled for the city as if it were but another municipality in the country. The legislation concentrated most functions in the office of the Mayor, which is very rational for a small municipality; nevertheless, the level of centralization that this entails is not suitable for Bogotá.
As a result, the law had important flaws that affected decentralization in the city from the very
beginning. For example, the Congress ruled that some issues, according to the New Constitution,
were exclusive to the Mayor and the City Council, and very importantly, it did not take the time
to discuss the specific decentralization policy model to be implemented (Zamudio Castañeda,
García Velandia, and Katz García 1997; Velásquez Gavilanes 2003).
For others, the need to open the political arena to new players, and to create conditions for
improving the city’s management were enough reasons to support the Congress’ decision
(Segovia Mora 1994, p.13). What is certain is that a pragmatic approach prevailed, and not much
thought was given to the analysis and design of a decentralization policy model, or to the
expected consequences of the reform.
7.2.2 The City and the New Constitution The city councilors were also very interested in capitalizing on the first local elections in the city,
which is why, according to Raúl Velásquez, they approved Agreement 2 on January 29 of 1992,
only one day after Law 1st was sanctioned by the Congress (Velásquez Gavilanes 2003, pp.50-
51). By Agreement 2, the name of the city’s administrative divisions was changed, from zones to
localities, the number of local board council representatives, ediles, was defined, and the
functions of local authorities, established by Law 1st, ratified. Once more, due to the incoming
elections, there was no time for determining the best policy model to implement.
As mentioned by Jaime Silva and others, “The city’s division had real problems in terms of
quality and quantity”, two criteria that the constitution mandated to take into consideration when
planning and implementing decentralization.
Alberto Maldonado mentioned that,
As a result of the lack of deliberation, not only on the model to follow but on the reasons to do so, there are significant faults in the design; including the definition of what is a locality and why is

139
it important. The localities do not have real identity and many people do not even know what locality they live in.
Bogotá has localities that are very homogenous, culturally and socially, while it also has
localities so diverse that the aggregation of interests might be almost impossible. The city has
localities with more than half million inhabitants and localities with less than 50 thousand
inhabitants; this creates a relationship between citizens and representatives that is obviously
different. Neither the Council, nor the Mayor discussed any of these problems enough.
As mentioned before, in 1991, Mayor Juán Martín Caicedo Ferrer presented another proposal
for the creation of local administrative boards, but, as the New Constitution was recently been
adopted and the rules pertaining the city changed, he had to adapt his proposal to the new legal
framework. On February 19 of 1992, he presented a proposal pertaining the city’s political and
administrative division that was approved by the City Council after the first local elections took
place on March 8 of 1992.
7.2.3 The First Local Elections On March 8, 1992, less than a year after the New Constitution was proclaimed, the city held the
first elections of local board members, ediles. This was undoubtedly an important event for the
city’s political life. For the first time, citizens were electing or being elected in a new layer of
government, and governance was much closer to them than before; traditional and new political
players contested in a new political arena. Although the interpretations of the results are very
diverse, no one contests the importance of this electoral process (Instituto para el Desarrollo de la
Democracia Luis Carlos Galán 2001).
The 1992 elections had important characteristics that are worth mentioning. It was the first
time, in a municipal election, that an electoral leaflet was used, which included the option of a
blank vote; the leaflet added transparency to the process and give a political option to those that
did not feel represented by the candidates’ lists. Yet, it was also the last election in a long series
of electoral processes; between 1990 and 1992, 12 elections and 3 public consultations occurred.
The electorate was fatigued, and participation in the local boards and mayoral elections was
lower than expected (Gaitán and Moreno Ospina 1992).

140
In addition, three important events that occurred between 1990 and 1992 affected the city’s
electoral results. First, increasing levels of political violence, not experienced since the violent
period between 1946 and the mid-1950s called La Violencia, second, the process leading to the
constitutional reform, and the values conveyed by the New Constitution of 1991; and third, the
fact that for the first time in modern history, bipartisanism was defeated in a national electoral
process.
In the 1990 presidential campaign, three candidates were murdered, two of them from the
left, additionally the systematic prosecution of the Union Patriótica, a leftist coalition party,
illustrated the reality of the war in the midst of peace conversations. In fact, it was a time in
which the paramilitary groups became increasingly active. It is difficult to judge if it was because
of these facts, or despite them, that the civil society was able to push forward a constitutional
reform.
It was in the elections for the Constitutional Assembly at the end of the year 1990, that the
M-19,71 a guerrilla movement recently reintegrated to the civil society, obtained the majority of
votes. For the first time in history, it defeated the traditional bipartisanism, represented by the
Liberal and Conservative parties (Instituto para el Desarrollo de la Democracia Luis Carlos
Galán 2001b, pp.53-54).
Bogotá, as the capital of the country, directly experieced the impacts of these developments.
The lack of credibility of the traditional parties was aggravated by the increased level of political
prosecution. Many decided to vote “blank” to protest against antidemocratic and exclusionary
practices, and many decided to support alternative movements and candidates to express their
solidarity. In fact, the candidacies of the political and social movements differed from the two
traditional parties, and promoted significant participation of organizations and individuals in the
first local elections.
For the first time, in 1992, Bogotá elected the central authority, the Mayor, side to side with
local board representatives, ediles; undoubtedly new forms of governance, pre-existing or not,
emerged from the new political structure. Those who were politically active in the localities,
71 The Movement April 19 was founded after the presidential elections on April 19 of 1970; its founders claimed that their candidate, Gen. Gustavo Rojas Pinilla, won the elections, but was defrauded by the conservative party. A faction of Gen. Rojas Pinilla supporters, considering that the political elites would not let any other political force to participate, in fair conditions, decided to create a nationalist army movement.

141
which were traditionally ignored, or represented by a small political clientele, found their own
political arena; for the elections of 1992, 1,319 local electoral lists were registered for electing
184 ediles.
Table 36 presents the number of electoral lists registered by political affiliation to illustrate
the diversity of the first local elections.
Table 36: Lists by Political Affiliation, JAL 1992
Political Affiliation Number of Electoral Lists
Liberales 452 Conservadores 203
Otros 267 Cívicos 230
Izquierda 66 Cristianos 77
Anapo 0 Coaliciones 4 Indigenas 3
Metapoliticos 17 Total 1319
Source: data from ILCG (2001b, pp.53-54)
It is said that due to the fast pace of the first local elections, only the traditional parties had
the time and experience to capitalize on this opportunity; 58 percent of the available seats were
obtained by the traditional bipartisanism (Segovia Mora 1994, p.27). Nevertheless, and
significantly enough, communitarian, religious and other independent organizations were able to
elect 56 ediles, representing 40 percent of the available seats; bipartisan votes held 37.5 percent
and non-bipartisan 34.5 percent of the total. In subsequent elections, as it will be presented,
bipartisanism recovered its supremacy.
The significance and level of participation in the first local elections became relative when
considering that it has been estimated that 85 percent of the registered electoral lists did not elect
any candidate. This level of dispersion was used as an argument for questioning the role of local
elections in enhancing democracy. The more lists the least effective, when measuring
effectiveness by dividing the number of seats obtained by the number of lists registered by each
party or political group (Instituto para el Desarrollo de la Democracia Luis Carlos Galán 2001b,

142
pp.142-145 v.2)72. Table 37, illustrates the level of effectiveness by political force in the 1992
local elections
Table 37: Effectiveness in Local Elections, 1992
Party Lists Seats Effectiveness
Liberals 452 71 15.71 Conservatives 203 35 17.24
Others 267 24 8.99 Civic Movements 230 26 11.30
Left 66 15 22.73 Christians 77 6 7.79
Anapo 0 0 0.00 Coalitions 4 4 100.00 Indigenous 3 0 0.00
Meta-politics 17 3 17.65 TOTAL 1319 184
Source: ILCG, V.2, pp.146-147
Certainly, the traditional parties endorsed as many candidates as they could and it is not clear
how many of them entered the electoral contest under the label “others”. Nevertheless, the fact
that non-bipartisan forces were able to elect a significant number of candidates illustrates the
great significance of the local elections in regards to changing the system of governance in the
city and setting an example for the country. It is not so much a matter of quantity as it is of
quality; before these elections, the liberals and conservative dominated the city’s political life
and had the power to exclude any other political forces. In 1992, leftist parties, indigenous’
groups, women’s movements, christian organizations, environmentalists groups, and a variety of
civic groups participated in the local elections and elected a significant number of
representatives. While the level of political effectiveness of these groups may be questioned,
their existence is a reality.
The result of these elections was the establishment of the first JAL in the city, which would
be in charge of constituting and presenting the trio of local mayor’s candidates to the city’s
mayor, discussing and approving local projects, budgets and contracts, and representing local
interests to the central government. The local mayors, once elected would be in charge of
managing the local funds and implementing local projects. The City Council still needed to
72 A deeper quantitative analysis is conducted in the next chapter when reviewing political participation.

143
discuss and approve regulations for this new layer of government, and governance, to begin
functioning.
On April 28 of 1992, the City Council approved Agreement 6 of 1992, as a development of
the proposal presented by mayor Juán Martín Caicedo on February 19 of the same year.
Agreement 6 outlined the functions and procedures of local authorities, defined the structure of
Local Development Funds, and authorized the mayor to continue defining and implementing the
future model of decentralization. This decree gave the city’s mayor a timeframe, until June 30 of
1992, for defining and improving the structure of local governments, and their relationship with
the central government, and for providing the physical and economic resources for the
functioning of the first local boards in the second half of 1992.
By the time Decree 6 was approved, Juan Martín Caicedo was in jail for having approved
certain money transfers that the New Constitution banned. What prevailed in the discussion at
the City Council was a pragmatic approach, we will learn decentralization by doing it
(Velásquez Gavilanes 2003, pp.52-57). In the midst of a much-debated absence of the Mayor,
and a new electoral process in the city, not much happened in the following months. These were
supposed to be the months for defining this new level of government. Sonia Durán de Infante,
the mayor in charge while Juán Martín Caicedo was in jail, was the only female mayor that the
city has ever had. She did not have more than a month in office, and soon, in June of 1992, the
new elected mayor, Jaime Castro, was ready to take office.
7.3 THE TRANSITION: LEARNING BY DOING
On March 8 of 1992, with the addition of 184 local board members, ediles, the city elected a new
mayor, Jaime Castro. He was recognized as a believer in decentralization, as he was central to
the political reform of 1986, which created elections for mayors in the country, and presented the
proposal for the decentralization of Bogotá as a member of the Constitutional Assembly. He was
also the official and unique candidate of the liberal party in the mayoral election.
Castro’s administration was in charge of implementing the decentralization reform,
governing with a new political and legal framework, and bridging the past and the future. Jaime

144
Castro was a recognized liberal figure in a liberal city known. He, like most of the city’s
previous mayors, appointed or elected, had held important political posts; he was minister under
the Pastrana and Lopez Michelsen presidencies, and minister of government under Betancur and
Barco (Gilbert and Dávila 2002, pp.38-39). He was part of the political networks of both the
country and the city, and was familiar with the prevailing political culture. He did not have major
problems dealing with the council or selecting local majors, at least at the beginning.
Despite Castro’s prestige, his party’s support, and the participation of 16 additional
candidates (13 men and 3 women), only 26.25 percent of the potential voters participated in this
election. As mentioned before, the main reason could have been that the electorate was fatigued,
and that the attention was divided between central and local elections. The new Mayor obtained
54.16 percent of the total votes; the conservative candidate 18.56 percent, and the blank votes
ranked third with 11.65 percent of the total votes (Instituto para el Desarrollo de la Democracia
Luis Carlos Galán 2001b, pp.59-61).
7.3.1 Setting priorities: to decentralize or to govern? Jaime Castro began his administration on June 1 of 1992, inheriting important unfinished goals
regarding initiating the new decentralized structure. The definition of procedures for the new
local authorities, the creation of mechanisms for coordinating the central and local governments,
and the appointment of personnel to work at the localities were all still pending. Castro was
required by the Council to fulfill the terms established by Agreement 6 whithin the month, he
had to finish the aforementioned goals and the transfer of resources to the localities by June 30 of
1992, so that the local boards could start “governing” on the 1st of July.
The central administration located sites for hosting the local governments, transferred the
resources for local development, dictated the procedures for administering the local funds, and
gave authority over certain organizations to the local authorities, all in less than a month. The
process of creating a decentralization policy in the city was rushed from the very beginning.
The local elected boards started “governing”, as projected, on July 1 of 1992. One of their
first tasks was to arrange trios of candidates for local mayors to present to the city’s mayor. The
lists of candidates were evidence of the influence of city council members in the selection of
candidates; the council was interested in capitalizing on this new political arena. Nevertheless,
145
the council would have to compete with local offers from community and civic candidates, given
the opening of the new political arenas to both old and new players (García Sánchez 2001).
The local elected boards were also forced to “learn while doing”; they had to govern without
a clear framework and were accustomed to a political culture in which particularism prevailed
over the common good. They were expected to approve local budgets by the end of July; within
a timeframe of two months, they had to identify and discuss local projects, create a local
development plan, and define the use of local budgets. It is difficult to imagine that even
experienced managers could have accomplished such goals in such a short time; expectedly, all
these tasks were delayed. Most localities did not approve the 1992 budget until the end of that
year; consequently, most of them began the year 1993 using the previous year’s budget.
In addition to the lack of clarity, coordination, and organizational capacity at the local level,
and the lack of attention from the central government, the continued use of traditional political
practices at all levels of government, discredited the first steps of the decentralization reform.
Denouncements of corruption, clientelism, and bad administration were filed against many local
mayors and ediles.
Raúl Velásquez believes there are several causes for the performance of local authorities,
including “Lack of clarity and inadequacy of the legal framework regulating local authorities,
the unanticipated complexity of governing at the local level, and, the attitude towards the reform
from the Mayor, the ediles, and the local mayors” (also at Velásquez Gavilanes 2003, p.71).
One of the major problems originated in the fact that the members of the local boards were
both judges who were to receive resources, and administrators of the projects. Another legal
principle that in practice represented a problem was the fact that local mayors could not be
dismissed by the city’s mayor, although they were, and are, city employees. Jaime Castro was a
passionate defender of this legal principle, despite what ex-mayors of the city recommended.
The legislation also established, as part of the administrative decentralization, the allocation
of human resources for supporting the local boards, thus, part of personnel working in central
agencies were to be transferred to localities, in order to transfer their expertise. Nevertheless, the
central agencies were not restructured, nor even informed of the new distribution of functions.
As a result, only employees that were considered “unessential” were “lent” to the localities, and
they remained employed by the central agencies and subject to their hierarchies, often creating a
conflict of interests and loyalties.

146
A third element of the decentralization policy design that was as inadequate was the
mechanism for selecting local mayors. First, it was very time consuming for the local boards to
select the three candidates to be presented to the mayor. Even more importantly, the probability
that these candidates represented the populace was very low, given that the dominant group
within the board might impose three of its candidates on the other members. Alternatively, pre-
negotiated budget allocations in exchange for including candidates of non-dominant groups.
Once the local boards presented their trios, the mayor had to interview all 60 candidates in order
to nominate local mayors; this was another time consuming part of the process. Because of that,
some localities still did not have a local mayor by September of 1992 (Velásquez Gavilanes
2003, p.74).
Each piece of the local government started working at a different time, which not only made
the coordination and attribution of responsibilities very difficult, but also contributed to
duplication and waste of resources. The lack of expertise added to the unclear division of
functions, and the mainstream political culture promoted the creation of local development plans
with very diverse scopes. Some plans aimed to meet all the locality’s needs, including health,
education, utilities coverage, which they could not do; others wanted to invest all their resources
into infrastructure, following the traditional practice of inaugurating buildings and parks
(Zamudio Castañeda, García Velandia, and Katz García 1997). Further complicating the
implementation of the decentralization reform were the complexities and conflicts created by the
addition of, at minimum, 20 new political actors to the city’s system of governance. The central
government now needed to coordinate and collaborate with these new players directly, and their
networks indirectly.
Partially due to the complexity of implementing the decentralization reform, but mostly,
according to Mayor Castro because “the city was in bankruptcy and its finances in disarray, what
was urgent was to heal the city’s finances,” Castro’s administration prioritized deep
administrative and financial reform. According to Castro, during the 1980s, Bogotá's spending
soared but its tax revenues did not; the government relied on credit to balance the budget and
took out new loans to alleviate its debt payments (Castro 1994).
Castro’s main contribution to the city, as mentioned by the experts, was to put the city’s
finances in order and strengthen the city’s financial capacity. It was based on this sound financial
ground that later administrations managed to modernize Bogotá (Pizano 2003). Castro’s tributary

147
reform increased the city’s tax income by 66 percent in 1993 (Cámara de Comercio de Bogotá
and Federación Nacional de Comerciantes 2001). Many concurred with Raúl Velasquez’s
commentary, “Castro was an institution builder, then came Mockus and planned and then
Peñalosa and spent the money.”
Therefore, although Jaime Castro’s development plan, “Prioridad Social”, listed
decentralization as one of its six strategic areas (Cámara de Comercio de Bogotá 1990, p.35),
decentralization was not a priority in practice. He did not support the idea of providing human
resources to the localities and instead he assigned functionaries from the central government; his
aim was to save in personnel costs, which he probably did. He did not create a technically
capable unit at the central government to coordinate the new system, nor did he promote
participatory planning (Velásquez Gavilanes 2003). Additionally, and probably because of his
concentration on the city’s finances, the expected transfers of resources to the localities were
delayed, underpaid, or sometimes nonexistent (Zamudio Castañeda, García Velandia, and Katz
García 1997, pp.42-54).
It was expected that Castro’s development plan would include, for the first time, the twenty
local development plans; nevertheless, the government’s plan was elaborated without consulting
the local authorities and disregarding their recommendations (Zamudio Castañeda, García
Velandia, and Katz García 1997, p.111). Local leaders and organizations were aware that the
new institutional framework entitled them to participate and created local development plans,
expecting that the new local authorities and accordingly the central government would recognize
this effort. That was not the case, neither the local authorities or the central government
incorporated the people on the local plans into the new system (Cifuentes Noyes 1994, p.143).
An additional element that added to the complexity of the local systems was the presence of a
number of organizations with overlapping goals. From those coming from outside the
communities, such as the central government, the national government, international agencies,
national NGOs, the church, and others, to those from within the communities, including local
NGO, civic and religious organizations, and diverse interest groups.
In the end, people had their own ways of participating and resorted to well known
mechanisms. During the first year of Castro’s administration, there were 70 social protests, well
above the average in the previous decade (Pedraza 2001, p. 34). A number of protests were

148
directed against local authorities, but most of them were directed towards the central
administration (Zamudio Castañeda, García Velandia, and Katz García 1997, p.113).
After a year of implementing the decentralization reform, the local authorities were pretty
much discredited; some even questioned their own validity73. An evaluation of the local
authorities, published in the largest newspaper in the country, El Tiempo, mentioned that
inefficiency, corruption, clientelism, and bad administration were the salient issues in their
performance (El Tiempo 1993). It is important to notice that, as mentioned by Lariza Pizano74,
“The media had traditionally discredited the City Council, and because of the close association
of ediles with councilors, they were distrusted and closely watched by the media.”
With the many questions arising after the first year of implementing the decentralization
reform, it was expected that the promulgation by the Congress of a new city’s statute in June of
1993 would bring much-needed clarifications. Nevertheless, Congress did not accomplish this
goal on time. Consequently, on July 21 of 1993, César Gaviria promulgated the new statute
Régimen Especial para el Distrito Capital de Santafé de Bogota using the special powers
conferred to him by transitory article 411 of the New Constitution, by presidential decree 1421.
7.3.2 Decree 1421 of July 21, 1993-El Estatuto Orgánico Decree 1421 of July 21, 1993, known as the Estatuto Orgánico, hereafter refered to as EOB, was
the new normative framework intended for enacting the new constitutional mandates in Bogotá;
it promoted political, social, and economic changes in line with those mandates (Bolivar and
Reveiz 1998). The New Constitution’s mandates, the new law established the principles for the
city’s administrative, political and financial reform, by:
Redistributing functions and competencies between institutions
Introducing and promoting fiscal and internal control
Establishing mechanisms for ‘healing’ the financial system
73 A member of the city Council, Carlos Lemos, mentioned that Jaime Castro was suffering from his own invention, the Juntas Administradoras Locales ("El profeta Lemos" 1993). 74 Lariza Pizano became city councilor when she replaced Juán Carlos Florez, who was elected in representation of the movement Nueva Nación. Later she was one of the founders of the movement Por la Bogotá que Queremos, a movement headed by Enrique Peñalosa for participating in the local elections.

149
Redefining the administrative structure and strengthening the sub-local layer of
governance
There is no unanimity of opinions regarding the EOB; one finds as many strong arguments
defending it as criticizing it, in both documentation and interviews. Certainly, the EOB did
change the organization of the city; it divided the city’s administration into three levels, and
defined functions and jurisdiction for each level, central, decentralized, and local (Bolivar and
Reveiz 1998, p.10). Another element of the EOB recognized as positive was the redefinition of
the division of powers between the city council and the mayor. The council’s functions were
defined as legislating and overseeing the actions of the executive; the mayor’s function was to
administer the city (Gilbert and Dávila 2002; Jiménez Benítez 2001). In practice, the change
seems to have given more powers to the mayor and less to the council.
As mentioned by Jaime Castro, before the EOB, “The Mayor had to co-administer with the
Council, or even worst, to please it”. Jorge Bustamante75, head of the City Planning Department
under Juan Martín Caicedo, mentioned,
Because four city councilors sat on the board of directors of each public company, decisions had to be negotiated with them each time, which made the council in fact a co-administrator with the Mayor. This is the reason why it took so long to liquidate companies that were losing money and draining the city’s resources.
To Juán Martín Caicedo,76 “The EOB divided the history of the city in two in regards to the role
of the executive”. In appearance, the councilors were the losers; nevertheless, Hipólito Moreno77,
city councilor, agreed with ex-mayor Caicedo and added,
The EOB introduced fundamental changes in the city’s administrative culture, which for more than fifty years lacked a clear definition of functions. The EOB redefined the role of councilors and created institutions for controlling and watching the management of public afairs (…) In any case, every change brings certain amount of crisis.
Tania Guzmán,78 director of Consejo Cómo Vamos, a private-public partnership aimed at
supporting and qualifying the City Council’s performance, stated that the EOB introduced two
75 Interviewed on November 26, 2003 76 Juán Martín Caicedo was mayor of Bogotá from 1990 to 1992, interviewed on November 26, 2003. 77 Interviewed on November 19, 2003 78 Tania Guzmán Pardo is the director of ¿Concejo cómo vamos? (City Council, how are we doing?). Interview conducted on November 20, 2003.

150
significant changes in regards to the Council.
First, it established that the councilors would have an honorarium, which professionalized their activities, but also created a different commitment to the citizens and the central administration. Second, it abolished the participation of councilors in the boards of directors of the city’s decentralized public companies, and other boards involved in administering the city’s budget and contracts; this change aimed to eliminate the councilors as intermediaries between public resources and their clienteles, and at adding transparency to the city’s administration.
Indeed, the relationship between the mayor and the Council in Bogotá has always been different
from most other Latin American cities, as the mayor has never been an appointee of the council
or a member of it (Ward 1996). With the exception of Andrés Pastrana, who was elected
councilor in 1982 and 1984, mayor in 1986, and President in 1988. The mayorship of Bogotá is
regarded as a high political position, for some only second to the president; in general, those
aspiring to the city’s mayorship have been national figures, while the City Council has been the
preferred, and almost personal political arena for local politicians.
Besides defining new boundaries for the city’s councilors, the EOB created the Veeduría, a
supervisory body to promote social and internal control in public organizations, and introduced
important mechanisms for enhancing the city’s finances. It increased the sums likely to be
generated by the general valorization tax, improved the procedure for assessing property values,
and allowed the mayor to apply a toll on the price of gasoline (Castro 1994).79
Despite the enhancements caused by the EOB in the city’s finances, Councilor Jorge Durán
Silva strongly criticized the statute for not having increased the amount of money that the city
receives from the national government. He stressed that although Bogotá generates a large share
of the country's tax revenues, it receives a relatively small proportion of the money in
transferences from the national government (Durán Silva 2003).
The EOB defined new policies regarding decentralization; some were favorable for
enhancing the sub-local governments, some were regressive. The EOB entitled the City Council
to create new and smaller localities, which would provide better representation and control to
citizens. It granted permission to local authorities to use a portion of the local budget to rent an
office and purchasing office equipment to enhance their performance. The EOB also established
remuneration and benefits for the ediles, in order to ensure their dedication to serving local
constituencies.
79 Which was defeated later.

151
The EOB also included important changes in the city’s administrative policies, which clearly
promoted deconcentration and delegation, although not so clearly decentralization. In fact, some
suggest that the EOB promoted the recentralization of most of the attributions granted to sub-
local governments (Zamudio Castañeda, García Velandia, and Katz García 1997; Jiménez
Benítez 2001; Zubiría Samper 1994; Ossa Escobar 1995).
The EOB established that the central Mayor may dismiss the local mayors, which
before were nominated for a fixed period of government;
The administration of all local funds was given to the central Mayor, and taken
away from the local mayors; although the Mayor could delegate this function;
The ediles were forbidden from participating in the executive boards of the Local
Development Funds;
The framework legislating transfers from the central governments to the localities
was changed; according to Law 1 of 1992, the central government had to transfer
10 percent of the city’s current income to the localities, rising this percentage by 2
percent until it reached 20 percent in 1998. The EOB established that the transfers
amount should range between 10 and 20 percent, removing the mandate to
increase it periodically;
The EOB also established that local budgets had to be reviewed and approved by
the city’s new Political, Fiscal and Political Council (CONFIS), before being
approved by the JAL, and that any changes introduced by the local board had to
be reviewed and approved again by the CONFIS.
The EOB was supposed to recognize and incorporate the lessons learned in the first year of
implementing decentralization (Velásquez Gavilanes 2003, p.86). The EOB reduced the
autonomy of local mayors and the JAL in the management of local resources in response to
denouncements of corruption and inefficiency. It established a minimum amount of inversion for
local projects in reponse to the fragmentation of local investment. It also allowed the central
Mayor to remove local mayors, in response to the existence of corruption and/or inefficientcy.
Although the problems mentioned above were undoubtedly present in the first year of
implementation, what is questionable is whether the measures offered are solutions to them.
Other critics to the EOB refer to the fact that, although there was an opportunity to redefine the

152
city’s administrative and political divisions, the EOB maintained the existing jurisdictions,
ignoring important demographic, economic and social changes and leaving the city’s territorial
reorganization in hands of the City Council (Jiménez Benítez 2001, p.227).
In any case, as mentioned before, the EOB is a source of debate but also the main point of
reference for subsequent developments of the process of decentralization. Raúl Lazala, local
mayor of Kennedy in the first Mockus’ administration, declared
I have no doubts that the EOB enhanced the local level of governance. Before the EOB, the minor mayors, as they were called, were mostly in charge of approving local permits of diverse order. They became a kind of costume office where those who wanted to expedite the process of acquiring a license had to pay a toll. After the 1421, the local mayors became in charge of certain local problems improving their capacity to focus and impact local development.
María del Rosario Bonilla80 claimed that, “As recently as 1993, through the new organic statute
it is possible to find clear delimitations of authority and functions in the city” (see also García
Sánchez 2003, p.61). Others disagree with her and claim that functions and limits are still
unclear, and that this is one of the reasons why the decentralization process has been so uneven
(Mockus S. et al. 1997, P.18).
Lariza Pizano mentioned that, “The EOB did not define the distribution of powers enough;
the Council was named the maximum authority in the city and they believe so, and because of
that the government of the city is still shared between the mayor and the Council”. It is claimed
that the lack of clear definitions in the EOB also applies to the localities and their authorities.
Carlos Carreño,81 a local edil, mentioned,
The EOB is not clear about the role of the JAL and local mayors, and that affects the relations between them and their capacity to work together. It is common to find members of the JAL claiming that this is the top authority in the locality and local mayors claiming that they are the top authority. The EOB needs further development to clearly establish if the local boards are administrative, as stated in its name, or if their main function is legislative.
During his second year in government, and after the EOB was promulgated, Jaime Castro
supported the local government far beyond expected; many claim that his administration was
under a lot of pressure, as the decentralization reform was central in his political campaign. He
80 María del Rosario Bonilla directed Bogotá’s unit within the Nation School of Public Administration, ESAP, and has been a consultant for the city for over twenty years; she also teaches at several universities. Interviewed on November 19, 2003. 81 Edil of the locality of Santafé under Peñalosa’s administration, interviewed Jan 24 of 2005.

153
decided to concentrate on enhancing the local authorities’ performance; he delegated the
administration of local funds to the local mayors, now public servants of the central
administration82 and increased local investment from 11.6 percent in September of 1993 to 87
percent in December of the same year. Despite these efforst, at the end of his government, the
evaluation of the local administrations was negative; inefficiency and corruption were said to
dominate the local system of governance.83
It is important to mention that despite limitations and weaknesses in the beginnings of the
decentralization reform, no one doubts its historical significance. As Fabio Velasquez84
mentioned,
Before 1992, the city’s governability was in crisis, its legal framework was obsolete and its taxation structure was out of date. The New Constitution finally freed the city from the judicial limbo it was in for close to fifty-years with Decree 1421 of 1993, a kind of city constitution. It promoted the creation of a new legal framework for the city, the updating of the city’s institutions, the enhancement of decentralization, the improvement of its financial structure, in particular in regards to tax collection. Castro was an institutions builder, he was a member of the constitutional assembly, he was the first mayor after the New Constitution, and he was a central figure in the expedition of decree 1421.
It would be left to the next mayor to govern under the new rules and to continue implementing
the decentralization reform.
7.4 DECENTRALIZING UNDER THE 1421 The 1994 elections were very significant because it was the first time in which the new electoral
rules, mandated by the New Constitution of 1991, were applied; among them the extension of the
mayors’ administrative period from two to three years. In addition, the 1994 elections are
remembered for the level of violence that accompanied the campaigns.
Between August and September of 1994, 34 political assassinations occurred; also during
82 Local mayors have been always functionaries of the central government, what changed was the fact the central mayor could dismiss them if unsatisfied with their performance. 83 Reports from the Contraloría de Santafé de Bogotá, the public finances watch organization, present an evaluation of local governments, see for example Gestión de las Localidades del Distrito Capital 1992-1994 (Contraloría de Santafé de Bogotá 1995). 84 F. Velasquez is professor in Political Science at the Universidad Javeriana in Bogotá, his doctoral dissertation at Oxford University focused on public policies towards localities in Bogotá after the decentralization reform. First interview conducted on September of 2003, second interview on November 18 of 2003.

154
that year, 23 mayors were killed; a high toll even for Colombia, a country in which pre-electoral
years have always been times for increased violence (Hoskin, Masías Núñez, and García
Sánchez 2003; García and Hoskin 2003). Despite the peak of pre-electoral violence, on October
30 of 1994, new Mayors, municipal councilors, departmental assemblies’ deputies, and
governors were elected in the country.
In the 1994 elections, for the first time in Bogotá’s history, the two traditional parties, Liberal
and Conservative, were defeated (Instituto para el Desarrollo de la Democracia Luis Carlos
Galán 2001b, V.2 p.69). Furthermore, it was the first time that a candidate without political
affiliation mobilized voters from all positions in the political spectrum and became Mayor of
Bogotá. Due to the political significance that the city has, the 1994 elections became a milestone
in the history of the country as well.
The City Council, on the other hand, remained dominated by the two traditional parties, a
fact that complicated an already difficult relationship between the Mayor and the Council.
Liberals obtained 18 seats, representing 53 percent of the total; and Conservatives obtained 11
seats, representing 32 percent of the total (Instituto para el Desarrollo de la Democracia Luis
Carlos Galán 2001, p.156)85. Finally, in 1994 Bogotanos also elected the second generation of
local board representatives or ediles.
7.4.1 The second generation of Ediles Regarding the second generation of local board representatives, it is asserted that the 1994
electoral process consolidated this new layer of government and governance; as it will be shown,
participation increased, though effectiveness decreased. For the localities’ second electoral
process, in order to reduce dispersion and enhance representation, a new rule was introduced,
any candidate would had to be supported by a political party or movement, and independent
candidates had to be supported by a minimum number of citizens and pay a registration fee.
Interestingly enough the rule did not have any effect; indeed, the dispersion actually
increased. The number of electoral lists registered in 1994 was 1579, compared with 319 in
85 The percentage of seats obtained by the two traditional parties, as presented by different sources, varies because in 1994 a special seat was created as part of the peace process and given to a representative of the guerrilla. Thus, in 1994, the total number of seats was 35, yet the seats for which the traditional parties competed were 34.

155
1992. What the new rule promoted, probably not deliberately, was the fortification of the two
traditional parties, as they were able to register more lists than in 1992 and obtained 106 of the
184 seats available. A noticeable and important exception was the indigenous movement Alianza
Social Indígena (Indigenous Social Alliance), which won two seats in 1994. Table 38 presents
the number of lists by political affiliation in 1992 and 199486.
Table 38: Number of electoral lists by Political Affiliation, JAL 1992-1994
Year Political Affiliation 1992 1994
Liberales (liberals) 452 932 Conservadores (conservatives) 203 363
Otros (others) 267 89 Cívicos (cibic) 230 47 Izquierda (left) 66 48
Cristianos (Christians) 77 40 Anapo 0 20
Coaliciones (coalitions) 4 0 Indigenas (indigenous) 3 26
Metapoliticos (meta-politics) 17 14 Total 1319 1579
Source: data from ILCG (2001, p.156) Red: reduction Blue: increase
Additionally, the second generation of ediles was not as new as one might think, 70 ediles were
reelected, which represented 33.15 percent of the available seats. For someone not familiar with
Colombia’s political practices, this might appear as a sign of support from the constituents to
their representatives; unfortunately, several denouncements of clientelism and electoral fraud left
a shadow of doubt on the transparency of the second sub-local elections.87 Finally,
effectiveness88 also decreased as obtaining a seat now required a higher effort, in terms of
average number of electoral lists registered.
86 As mentioned before, a detailed analysis of the electoral results is presented in Chapter 8.0, in the analysis of participation. 87 The use of irregular practices in elections is a common practice in Colombia and Latin America; for more about Bogotá, see Leal and Dávila (Leal Buitrago and Davila L 1990). 88 Refers to the number of seats obtained by dividing the number of lists registered by each party or political group The more lists the least effective (Instituto para el Desarrollo de la Democracia Luis Carlos Galán 2001b, pp.142-145 v.2).

156
Table 39 presents the level of effectiveness in the 1994 elections.
Table 39: Effectiveness in Local Elections, 1994
Party Lists Seats Effectiveness Liberals 932 101 10.84
Conservatives 363 43 11.85 Others 89 19 21.35
Civic Movements 47 8 17.02 Left 48 8 16.67
Christians 40 1 2.50 Anapo 20 1 5.00
Coalitions 0 0 0.00 Indigenous 26 3 11.54 Metapolitics 14 0 0.00
Total 1579 184 Source: ILCG, V.2, pp.146-147
Red: Reduction Blue: Increment
What the data does not show is that many candidates that registered themselves under the
label “others” or “civic movements” were actually supported by traditional parties. There was a
trend to appear as politically independent or “apolitical” due to the lack of credibility and
legitimacy of traditional political elites. Thus, actual independent candidates had to compete with
candidates from traditional parties “disguised” as independent (Velásquez Gavilanes 2003,
p.100).
Finally, these elections clearly proved that the size of localities in Bogotá represented a real
problem for representation; they were ediles elected with as low as 530 votes, representing
localities with more than 500 thousands inhabitants (Zamudio Castañeda, García Velandia, and
Katz García 1997, pp.92-95). As mentioned in several interviews, “In reality, and edil could be
elected by his or her family.”89 It is also claimed that the smaller a locality is, the more its
citizens know about the candidates and the more they are willing to participate (Velásquez
Gavilanes 2003, p.98).90
Nevertheless, there were improvements in the second elections. For one, the level of
participation was higher than before, 34.4 percent, compared with 30.2 percent in 1992, and also
89 As mentioned by Jaime Silva B. 90 Enrique Peñalosa also mentioned this argument when interviewed; he claims than the localities should not have more than 100,000 inhabitants.

157
higher than the turnout for electing the City Councilors (Instituto para el Desarrollo de la
Democracia Luis Carlos Galán 2001).
Despite the increase in participation and the reduction of blank votes (from 22 percent to 13
percent), the numbers are still so low that the question of credibility is unavoidable; does
decentralization enhance democracy? To this question, all interviewees replied an emphatic yes.
The second generation of ediles had to govern within the legal framework of the EOB,
which, as mentioned before, in practice reduced their autonomy. They would also have to govern
with the first independent Mayor of Bogotá, Antanas Mockus, the philosopher-mayor. The
characteristics of Antanas’ campaign and program, and even his personality, made the 1994
Mayoral election an important piece of Bogotá’s political puzzle.
7.4.2 Politics of anti-politics: electing a mayor in 1994 The 1994 Mayoral elections were special in many ways. Only three candidates ran for one of the
most politically valuable post in the country: Enrique Peñalosa, a liberal, Carlos Moreno de
Caro, running as conservative, and Antanas Mockus, running as independent and breaking all the
rules of the political game. Antanas Mockus, a mathematician and philosopher, well known in
Bogotá for his unorthodox behavior while heading the Universidad Nacional de Colombia (one
of the most important public universities in the country) ran a campaign full of rituals and
symbols, that was regarded by some as an alternative and valuable hermeneutic, while others
regarded it as a riddle without sense (Sanín 1995).
Although Gustavo Petro, a Congressperson representing the M-19, promoted the
participation of Antanas Mockus in the 1994 elections, he chose to run a campaign without any
political affiliation (Peña 1995, p.67). In fact, he chose to use his lack of ties to a political group
as part of his appeal; in consequence, he ran his campaign as an anti-politician, a term very
debatable for describing someone participating in an electoral process. In any case, the division,
real or not, between “the politicians,” who were seen as corrupt, inefficient, authoritarian, and
selfish, and the anti-politician, who was seen as free of these flaws, was central to Antanas’
victory (Sanín 1995; Peña 1995).
For once, the city was tired of its politicians, burned by the recent scandal of money transfers
to the ediles, with a mayor still in jail, Caicedo Ferrer, and another that did not govern as

158
expected, Jaime Castro (Sanín 1995, p.5). In addition, the media, fascinated with Antanas’
strategies, gave his campaign extensive coverage free of charge; the candidate disguised as a
super hero, distributing pins at intersections of important avenues, or promoting his campaign
with children’s games, was presented in local and national newspapers, radio and TV stations.91
These facts, gave Antanas Mockus an easy victory over Enrique Peñalosa, a well-known and
respected liberal, and an even clearer victory over Carlos Moreno de Caro, supported by the
Conservative party and well known for his “traditional” political practices (Bustamante 1995;
Instituto para el Desarrollo de la Democracia Luis Carlos Galán 2001b). Antanas Mockus
obtained 62.5 percent of the total votes; Enrique Peñalosa 29.2 percent, and Moreno de Caro 2.6
percent. Nevertheless, only 29.7 percent of the potential electorate participated in the elections
(Instituto para el Desarrollo de la Democracia Luis Carlos Galán 2001b, pp.73-74).
Antanas Mockus’ victory was very significant because an independent candidate now
controlled the Mayorship of Bogotá, the second most important political position in the country
after the presidency. Its vistory proved that citizens were ready to welcome alternative political
options (Bustamante 1995, p.84). Mayor Mockus is a political figure who promotes interesting
debates, including those concerning his role in the development of decentralization (Bustamante
1995; Zamudio Castañeda, García Velandia, and Katz García 1997; Velásquez Gavilanes 2003).
7.4.3 Stick and Carrots to “educate” Antanas Mockus began his administration on January 1 of 1995. He was the first mayor that,
according to the new laws, had to present a development plan for the city was consistent with the
government plan supporting his campaign, and be submitted for evalution of the City Council,
the Territorial Planning Council, and the citizens.92
Antanas’ development plan, Formar Ciudad, aimed at balancing individual and social
development and progress, enhancing the city’s competitiveness, and promoting equity
91 Antanas Mockus spent 26 million pesos in his campaign; an amount insignificant for running a campaign in Bogotá (El Tiempo 1995). 92 Law 131 of 1994 ruled that governors and Mayors should govern according to their government plan, otherwise, citizens have the right to remove them from office. Law 152 and agreement 12 of 1994 established that the city’s development plan must be publicly discuss and evaluated.

159
(Zamudio Castañeda, García Velandia, and Katz García 1997, p.118); to do so six priorities were
proposed:
Cultura Ciudadana (civic culture) - the backbone of Antanas’ development plan,
to promote habits and behaviors adequate for social living, and civic auto-
regulation (the allocation to this priority from the total budget was 3 percent)
Medio Ambiente (environment) - to prevent and mitigate the deterioration of the
environment (9 percent of budget)
Espacio Público (public space) - to recover those spaces considered as public (10
percent of budget)
Progreso Social (social progress) - to promote human development and living
together (28 percent of budget)
Productividad Urbana (urban productivity) - to improve the city’s infrastructure
and enhance the city’s human capital (32 percent of budget)
Legitimidad Institucional (institutional legitimacy) - to improve the city’s
administration as a mean to promote credibility of the institutions (18 percent of
budget)
On February 28, the Territorial Planning Council opened public debate regarding the plan, which
lasted for 30 days. According to Pedro Santana, president of the Council, more than 4,000
leaders participated in the debate, in addition to eleven meetings of experts to discuss and
evaluate the plan (Bustamante 1995, p.266). The plan provoked contradictory reactions,
particularly regarding the aim of educating the citizens.
The Territorial Planning Council submitted a document with comments and
recommendations to be included in the final version of the plan. One of their most important
remarks was the need to articulate the civic culture proposal with concrete policies regarding
structural problems in the city, such as inequality, poverty and unemployment (Consejo
Territorial de Planeación de Bogotá 1995).
On April 30 of 1995, the mayor presented his development plan, Formar Ciudad 1995-1997,
to the City Council for final discussion and evaluation. The Council, which remained controlled
by the two traditional parties, debated the mayor’s plan and requested, in line with previous
critics, that the mayor more specifically define the goals and timeframe to implement Cultura

160
Ciudadana, the central strategy of the plan. The Council suggested some other changes; Mayor
Mockus, in response, incorporated some of the recommendations, but rejected others that he
considered unacceptable. On May 31, one day late in regards to the closing date stipulated, the
Council approved Mayor’s Mockus development plan. Nevertheless, Antanas Mockus decided to
adopt the plan by executive decree 295, on June 1 of 1995, without concerting with the Council
and claiming that the Council did not fulfill the stipulated deadline (Zamudio Castañeda, García
Velandia, and Katz García 1997, p.121).
On May 30 of 1995, Mayor Mockus sent a letter to the Council’s president, Enrique Vargas
Lleras, mentioning which changes, introduced by the Council, he considered to be unacceptable;
this was the first open confrontation between the Mayor and the Council. The Mayor declared to
the media that the Council introduced changes to the plan for which his approval was required,
and remarked that the “old political class” was not interested in change (El Tiempo 1995). The
president of the Council declared, “Mockus is chasing unnecessary fights” (El Tiempo 1995).
The press, in general, celebrated what they called the Antanazo, as a demonstration of the
Mayor’s courage and determination and predicted that, considering the bad reputation of the
Council and high support for the Mayor in the city, the Council would have to cede to the
Mayor’s proposals (Pombo 1995). The Council contested the legality of the Mayor’s decree and
asked for its suspension under Cundinamarca’s tribunal; on August 4, the tribunal denied the
Council’s request.
The troublesome relations between Mayor Mockus and the Council persisted for most of his
government. This may have happened due to the independent political status of the Mayor, or to
inherent features of the new arrangements that did not function. In any case, as mentioned by
Gilbert and Dávila, the new division of responsibilities between the executive and the Council
established by the new EOB, does not seem to have helped the conflict (2002, p.44).
Regarding decentralization, on April 15 of 1995, Mayor Mockus requested that the City
Council extend the special faculties granted to Mayor Castro to him, in order to produce the
guidelines for elaborating the local development plans. The Council denied his petition, arguing
that this ruling was strictly a Council matter. By that time, the twenty presidents of the local
administrative boards declared an emergency; as they had worked on their development plans
but were waiting for the required legislation to get approval and resources, they demanded the
Council to expedite the ruling.

161
On May of 1995, the Council started discussing a decree for regulating the local development
planning, which was approved in June. On July 5, the Mayor objected to the Council’s
agreement, alleging it was based on a faulty assumption of considering the localidades as
autonomic entities, when they actually were part of a bigger system, the city. Mockus was not
committed to decentralization and it was not a priority in his government plan; besides, he was
right in objecting to the Council’s proposal, because it copied the national legislation regarding
municipalities, which could not be applied to the city (Velásquez Gavilanes 2003).
On August 3 of 1995, Mayor Mockus issued Decree 425,93 which provided regulations for
creating local development plans through participatory planning; the main central authority in
charge, as mentioned in the decree, was the City’s Planning Department,94 not the local
administrative boards, nor the local mayors. Mayor Mockus declared that that this was a
definitive test for the JAL and for decentralization; if they succeed in producing local plans, they
would have proven that they were capable of governing (Zamudio Castañeda, García Velandia,
and Katz García 1997, p.124), although their role in the process was minimum.
Decree 425, conceived by the Mayor as a pedagogic strategy, invited citizens and
organizations to be part of the local planning process by participating in public meetings, in
which any citizen or organization could present a project to be discussed. The aim was to
increase participation and accountability, and avoid the common practice of clientelism, not to
promote decentralization.
Nevertheless, it was undoubtedly a very interesting process, as for the first time it was
mandatory that citizens were involved in planning their own development, and taking part in
deciding where to invest local funds.95
Mayor Mockus convened public meetings in each locality to present the following
methodology to local authorities and communities (Ardila Gómez 1997, p.60):
1. Citizens and organization present investment projects;
93 This decree was changed in the administration of Enrique Peñalosa (1998-2000) by Decree 739 of 1998. 94 To read Decree 425, visit: http://calsegen01.alcaldiabogota.gov.co:7772/sisjur//normas/Norma1.jsp?i=1884 95 This was the first time that citizen’s participation was formally required and supported by the law; nevertheless, there were previous experiences in which the central government invited citizens to be part of a planning exercise, or in which citizens took the initiative of participating in local planning. For more, see Corte and González, 1989 (Corte and González 1989).

162
2. The Local Technical Committee96 studies the projects, selecting those aligned
with the priorities of the central government plan, and local citizens’ preferences.
3. Proponents of projects selected by the committee participate in public meetings to
discuss their proposals;
4. The Local Technical committee ranks and reviews the projects and makes a final
selection;
5. The local mayor elaborates the local development plan;
6. The JAL reviews and approves the plan.
The time-frame explicitly stated by Decree 425 was: 15 days to present projects, 2 days to
discuss and pre-select them, 1 day for publishing the selection, 6 days for hearing proponents, 2
days to select the final projects, and 2 days for the local mayor to elaborate the local
development plan and present it to the JAL (Velásquez Gavilanes 2003).
Between August and October of 1995, the twenty localities engaged in the process of
producing their local development plans; in the first stage of the process, individuals and
organizations presented 13,174 projects to the technical committee.
Table 40 presents the number of inhabitants, the number of projects presented, and the
number of projects per 1,000 inhabitants, by locality.
96 The local mayor, the ediles, the members of the planning commission of each local board, and an expert from the city’s Planning Department constituted the Local Technical Committee.

163
Table 40: Participation in Local Planning, 1995
Locality Population 1993 # of projects # Projects/1,000 Inhab.
1 Usaquén 208,467 467 2.24
2 Chapinero 354,557 447 1.26
3 Santafé 116,053 300 2.59
4 San Cristóbal 103,039 736 7.14
5 Usme 417,417 795 1.90
6 Tunjuelito 199,461 912 4.57
7 Bosa 211,866 397 1.87
8 Kennedy 681,139 1.023 1.50
9 Fontibón 588,914 1.143 1.94
10 Engativa 184,491 482 2.61
11 Suba 132,474 405 3.06
12 B.Unidos 95,801 257 2.68
13 Teusaquillo 101,502 311 3.06
14 Martires 298,257 442 1.48
15 Antonio Nariño 24,627 269 10.92
16 Pte.Aranda 390,506 689 1.76
17 Candelaria 218,38 795 3.64
18 Rafael U.U. 389,661 1.444 3.71
19 Ciudad Bolívar 767,633 1.635 2.13
20 Sumapaz 16,751 225 13.43
Total 5,500,996 13,174 3.68 Source: Diez Años de Participación en Bogotá, (Pedraza 2001, p.8)
Evaluations of this initial participatory planning recognize important advances promoted by
this process, yet, they also point to important failures. Some positive results promoted by the
process of participatory planning are that it:
- Brought closer the central government to the citizens;
- Summoned a level of citizen’s participation unknown in the city;
- Improved the quality of the local plans, compared with those produced in 1992
(Ossa Escobar 1995);
- Increase the acceptance and legitimacy of local plans as citizens were included in
their creation (Ardila Gómez 1997);

164
- Provided the central government with a unique opportunity to learn about local
problems and local leaders;
- Provided a unique opportunity for local players to learn about norms and
institutions governing the city;
- Provided local players with a new identity and a closer arena for negotiating their
interests (Diaz Uribe 1994);
- Improved coordination among central organizations and institutions;
- Improved transparency, accountability, and legitimacy in the city by involving
citizens in the process of planning and allocating resources (Pedraza 2001;
Velásquez Gavilanes 2003; Bonilla, Pulido, and CEAD 2002).
Some failures and limitations of the process are that:
- The lack of expertise of local players and the level of technicality required for
presenting a proposal excluded many people from participating;
- Discussions regarding how to prioritize the proposals where not well-informed,
due to the lack of accurate and up-to-date information regarding unsatisfied basic
needs in each locality (Contraloría de Santafé de Bogotá 1995);
- The process of participatory planning did not improve the quality of participation
because:
• It ignored the differences in capacity, education, and expertise among
those presenting proposals ;
• It did not allow enough time for preparing and discussing proposals, and
therefore the number of proposals prevailed over the appropriateness of
proposals;
• The lack of power for affecting final decisions kept those participating in a
passive role; people were expecting to approve projects and assign
resources at the meetings;
• The process generated great expectations that were not fulfilled due to the
lack of resources; at the end most participants were disappointed (García
V. 1997);

165
• By receiving proposals from individuals or local organizations, the
administration did not recognize the capacity of local organizations to
aggregate interests, and their value as legitimate political players at the
local level (Pedraza 2001; García V. 1997).
- More than an opportunity for aggregating interests, this first process was a contest
among very specific projects; most of the decisions were adopted by a majority of
votes due to the impossibility of reaching an agreement (Bonilla, Pulido, and
CEAD 2002; Pedraza 2001);
- The diversity of proponents and proposals produced a 40 percent of dispersion in
the local investment (Pedraza 2001, p.27; Zamudio Castañeda 1997). Most
projects were too small and specific, lacking a broad view of the locality (García
V. 1997); it has been mentioned that some local plans looked like shopping lists
(Ardila Gómez 1997, p.69).
The process also has been criticized concerning the level of participation (quantity). Despite the
fact that a large number of citizens participated, when considering the potential for participation,
it was very low. In Ciudad Bolivar, only 50 percent of 283 neighborhoods participated in the
process (Mosquera et al. 1997, p.262); according to a study from CORPOSUR,97 17 out of the 20
Local Technical Committees considered the level of participation to be low (Corposur 1996,
p.18).
On November of 1995 the twenty development plans were completed; 6,000 projects out of
13,174 were approved for a total local investment budget of $224,511 million pesos (Fundación
Corona and Procomún 1997, p.21). Between March and April of 1996, the Mockus
administration held new participatory meetings, Concejos Locales de Gobierno, to present the
final local plans and to promote the idea of citizens watching the implementation of the local
plans. After a year of implementation, at the end of 1996, an evaluation conducted by
CORPOSUR revealed that the lack of comunication between central and local authorities and
organizations produced duplication of projects, conflicting programs and ineffective use of
resources (Corposur 1997).
97 Corporación Servicios Urbanos de Desarrollo, a NGO supporting decentralization in Bogotá.

166
In 1997, a new program aimed at improving the coordination between central and local
authorities, and the impact of the local investments,98 was introduced by the administration,
Aprender a sumar (learning to aggregate). Each locality had to define a local axis project that
required the articulation of resources from the central administration, in order to do so, the
proposal had to be presented to the appropriate central authorities, which had to identify projects
that coincided with theirs in order to commit available resources. Later, in public meetings called
Consejos de Gobierno Local (local government councils), local and central institutions had to
state which actions they were in charge of, and the amount of resources committed, finally, a
manager for the project had to be elected (Velásquez Gavilanes 2003; Ardila Gómez 1997).
The program improved coordination among local and central authorities; an average of 10
central institutions participated in each local axis project and about $6,490 million pesos were
invested in each project. Thirteen out of twenty localities were able to present aggregative
projects; some of them integrated more than one locality, such as the project “Río Fucha, un
sendero de Vida” (River Fucha, a Paht to Life), which integrated three localities, Puente Aranda,
Antonio Nariño, and Kennedy and ten central institutions (Velásquez Gavilanes 2003; Ardila
Gómez 1997; Rojas 2002).
The process of aggregating local and central authorities also helped central institutions, used
to thinking and planning the city’s administration as an entirety, acknowledged the existence and
importance of the sub-localities. Likewise, communities and local authorities had to fit their
proposals into the city development plan of the Mockus’ administration, learning to work
together and to combine their local visions with the macro vision.
Regarding failures of the process, it is claimed that most projects reflecting local priorities
were sacrificed in the aim of promoting macro projects. In addition, local authorities and leaders
claimed that their counterparts in central institutions were not easy to access; that changes in the
availability of resources resulted in cuts in local projects; and that instability in the heads of
central institutions affected the implementation of both macro and micro projects at the local
level (Velásquez Gavilanes 2003; Pedraza 2001).
In 1997, a second round of “Consejos de Gobierno” was planned for the local and central
authorities to present their progress to the citizens. In these meetings, a complementary tool was
98 The central administration considered that the dispersion of local resources in small projects limited their possible impact; therefore, it aimed at promoting macro projects instead.

167
used, the “two way telegrams”, in which communities could ask questions to the central and
local representatives. Undoubtedly providing direct access to public information was important
and helped in reinforcing the government’s legitimacy; nevertheless, in real terms did not
provide any course of action for the questions raise by the communities. Finally, the level of
participation was less than expected, the average number of people was 451 per locality; among
civic organizations, the Juntas de Acción Comunal (JAC), with 30 percent of participation, were
the most participatory (Pedraza 2001, p.18).
What the process of participatory planning and follow-up did not do, was to recognize and
honor the local authorities, ediles, and local mayors. First, because, as mentioned before, Mayor
Mockus was unclear about the importance of local authorities, and second, because he
considered the ediles as part of the politicians that he was trying to avoid. Mayor Mockus
dismissal of anything that resembles what he perceived as old politicians not only complicated
his relations with the JAL and the local Mayors, but also affected the relations within the JAL
and among local authorities.
Susana Schuster,99 a local edil elected under Antanas Mockus’ movement with the guarantee
of the MIC,100 illustrated the aforementioned statement,
Some of the other ediles mistreated me because I was part of Antana’ Mockus movement, and we were intervening the political life of Bogotá without belonging to the traditional parties. This made my experience as edil very difficult at the beginning; I had no previous political experience and I did not know nor understand the rules of the game. I was forced into the opposition as the majority formed a coalition in which I was not included. Yet, I regard this experience as very valuable, I learned a lot and I felt that my perspective added value to the political practice of the JAL.
In regards to the local mayors, the attitude of Mayor Mockus was not really confrontational but
distant, during the interview Paul Bromberg101, who replaced Mayor Mockus in the last months
of his administration mentioned.“On the day of my possession in lieu of Antanas Mockus, a local
mayor approached me and said, let me salute the local Mayor for the first time in this
administration.”
99 Susana Shulster is an anthropologist that has been edil of Teusaquillo during three administrations. 100 Movimiento Indígena Colombiano (Colombian indigenous movement). 101 Mayor of Bogotá in lieu of Antanas Mockus in 1997, edil of Teusaquillo, university professor and researcher, he promoted the creation of univerciudad.

168
Raul Lazala, local mayor of Kennedy for two years under the Mockus administration said,
Local mayors had to prepare and host the local meetings in which Mayor Mockus and his central cabinet presented the administration’s advancements and heard the citizens. Certainly, the local administration had to present its results too, yet the hierarchy was clear and ratified in the management of these meetings. People wanted to be there because the Mayor or someone from his government was to be there, not to talk with the local mayor or the ediles.
Decentralization was not a priority for this government; in fact, until 1997, the office of
decentralization was located in the office of the undersecretary of health,102 in the government’s
secretariat. The office’s main function was to support the process of deconcentration of health
services, an initiative started by Juan Martín Caicedo, when he was mayor of the city. The local
mayors were functionaries reporting to that office. The relation between the Mayor and the local
mayors was but a reflection of the role attributed to the latter; according to Raúl Lazala, the
relation between local mayors and Mayor Mockus was practically inexistent; it was more of a
relationhip with the government’s secretariat.
The restructuring of the Government’s Secretariat was the most important institutional
change promoted by this administration in regards to decentralization. It was the result of the
acknowledgment from the Mockus’ Administration of the increasing importance of localities as
political arenas, and the need to enhance this level of governance. Results from a study done by
the city in 1995, to the Interdisciplinary Center of Regional Studies-CIDER, at the Andes
University, supported the restructuring; the consultants recommended, among other things, the
concentration of local affairs under the secretary of government. The Fundación Corona,103 also
contributed to the discussion by presenting the results of an analytical study of local government
structure and functionality, which included recommendations to the central government aligned
with the findings from the CIDER (see, Asesoría y Gestión 1997).
The restructuring of the general secretariat included the creation of a new post, the
undersecretary for local affairs, the centralization of all personnel working at the localities in the
secretariat, the addition of more personnel to support the localities; and the redesign of the local
government structure. In regards to the local structure of government, four units were created to
support the local mayor: the unit for projects implementation and control, the unit of
102 Mayor Mockus included the creation of this office in Decree 812 of December 30 of 1996. 103 A private foundation that supports development in the country; it started working on public policy at the local level in the 1990s; visit: http://www.fundacioncorona.org.co

169
administrative and technical support, the unit of planning and information, and the unit of police
and local justice. In addition, an office for receiving complaints and promoting participation was
created.
Decree 1173 of December 15 of 1997 established the Direction of Local Affairs, dependent
on the undersecretary of government; nevertheless, the main function of the new direction
continued to be supporting the process of deconcentration of health services in the city.104 After
defining the new structure, manuals defining each post’s functions and organizational procedures
were produced, and 337 new post were created in order to enhance the local government
capacity, which had to be filled through public competition (Velásquez Gavilanes 2003; Ardila
Gómez 1997). However, the reform was never implemented. By the time it was written and
ready to go, internal conflicts delayed needed decisions, and a new set of elections caught the
attention of citizens and functionaries, including the mayor.
On March 2 of 1997, Mayor Mockus announced his resignation in order to run in the 1998
presidential elections. For a substitute, he presented three candidates to the consideration of
President Samper, who chose Mockus’ preferred candidate, Paul Bromberg, a physicist and head
of Cultura Ciudadana, the star program of the administration.
On April of 1997, Mayor Mockus left office and Paul Bromberg became the mayor. The
change in the head of government affected the internal balance of the administration; conflicts
with consultants and between units arose, deeply affecting the efficiency of the last months of
this administration (Florez 1997). On the other had, citizens expressed great disappointment for
the “abandonment” of Mayor Mockus. In fact, in order to increase his chances of winning, when
he ran in the mayoral elections of 2001, he had to ask for public forgiveness by joining the many
Bogotanos that climb Moserrate, a mountain with a church at the top, in repentance for their sins
and/or in search of a miracle.
More than the Mockus-Bromberg administration, Mayor Mockus is remembered as a
promoter of change and has been internationally recognized as an innovator; the UN
Development Program (UNDP) and US Agency for International Development (USAID) are
using his Cultura Ciudadana, or culture of citizenship, as a model to fight crime in a few
countries around the region. Undoubtedly, the city, overall, had important improvements during
104 Decree 1173 of December 15 of 1997, was signed by Mayor Paul Bromberg, who became mayor on April of 1997 after Mockus resigned to run in the presidential elections of 1998.

170
this administration; it is common to hear that, Bogota has been transformed by Mockus’s
combination of street-level politics--he has expanded the city’s public parks, launched a modern
bus system, and built schools in the city’s poorest districts—and symbolic acts (Schapiro 2001).
Nevertheless, when evaluating the impact of this administration in the political life of the city, a
critique that, from my point of view, deserves more attention, is the pedagogic approach of
Mayor Mockus. The question posed is how good this approach is for governing a city, as
opposed to a university. It has been claimed that the analogy of the city as a school creates an
asymmetry between those playing as educators and those being educated; there is someone that
knows what is best for the city and its citizens (Gutiérrez Sanín 1998, pp.50-54). In addition, this
approach permitted the introduction of the state in a space previously considered as private;
Cultura Ciudadana assumed the need of educating citizens about citizenship and regulating their
behavior (Pedraza 2001, p.6). For F. Zambrano, this approach produced a backward movement
in the political life of the city, as people were seen in need of being taught what to do, how and
when.
Finally, although this administration was clearly committed to the promotion of participation,
it was not open to dialogue when people used other traditional forms of political participation.
One hundred seventy-eight protests of different type, such as strikes, marches, and occupations,
occurred during this administration; 43 in 1995, 73 in 1996 and 62 in 1997. Mayor Mockus
stated early that he would not confer under pressure (Pedraza 2001, pp.34-35).
On October 26 of 1997, a new mayor was elected, Enrique Peñalosa. One of his first
suggestions to Mayor Bromberg was not to push forward the local reform. As the reform lacked
internal consensus, the process of hiring the very much-needed personnel for the localities was
stopped. At the end of the Mockus-Bromberg administration, local governments were still
without the minimum conditions for functioning appropriately, including a lack of personnel,
technical capacity, and coordination with the central government. Nevertheless, compared with
1995, it is certain that local governments did improve their organization and performance, yet not
enough to support a consistent process of decentralization (Velásquez Gavilanes 2003; Florez
1997; Ardila Gómez 1997).

171
7.5 POLITICS OF ADAPTATION, 1997-2000
The third and last administration under review governed the city from 1998 to 2000. This was a
quite interesting time for the country and the city, it was the closing of the millennium and
uncertainty plagued the country. The economy was in crisis, the internal conflict had worsened,
and political life was in turmoil due to the very unstable presidency of Ernesto Samper, who was
accused of financing his 1994 presidential campaign with money from drug cartels. The low
credibility of the political parties worsened a lot during Samper’s government, causing great
polarization inside the political classes and the country (Bejarano and Dávila L. 1998).
On the other hand, in Bogotá, after the debated but mostly respected administration of
Antanas Mockus, his renouncement of the mayor’s office to run in the 1998 presidential
campaign, affected the credibility of emerging political forces. All these facts affected the local
electoral process on October 26 of 1997, when Bogotanos elected a new City Council, a new
Mayor, and the third generation of JALs.
Traditional parties were discredited enough to create a void in the contest and the result was a
proliferation of non-party electoral lists, which does not necessarily mean the emergence or
consolidation of new political forces. In fact, what marked these elections was adaptation.
Candidates and movements affiliated with traditional parties, particularly the liberal party, opted
for participating under generic names or acronyms; creating a proliferation of electoral lists
representing all kind of interests (Boudon 2000).
Interestingly enough, the 1997 election of local authorities in the country and in Bogotá was
the most participatory of the 1990s. There are several reasons that help to understand this
apparent contradiction; maybe the most important that the 1997 elections included a vote for
peace. The “papeleta verde” (green vote) increased participation in these elections; more than 10
million people voted YES for peace and expressed their rejection of the increasingly bloody
internal conflict. In addition, the registrars’ office offered diverse incentives to promote
participation, such as discounts in school fees, and preferred access to credit.
On 1997, the number of seats in the city council increased to 40 in accordance with Article
9th of the EOB, which established that there would be a councilor for each 150,000 inhabitants or
fraction over 75,000. This is probably the main cause for the rise in the number of electoral lists

172
registered for the City Council in Bogotá. The number of parties rose from 152 in 1994 to 260 in
1997, representing an increase of close to 200 percent, and illustrating the fragmentation of
interests.
From the 1,274,831 votes deposited, only 45 percent elected a City Council representative,
which means that more than 60 percent of citizens were not be represented on the new council
(Instituto para el Desarrollo de la Democracia Luis Carlos Galán 2001, pp.200-208). In fact, the
electoral quotient105 established by the registrars office was met only by one candidate, the
remaining 39 councilors were elected by residual, ranging from 24,737 to 7,416 votes (Botero
Restrepo 1998, p.150). The Liberal party obtained 19 seats, the Conservative 12, others and
Christians 3, coalitions 2, and the left 1. The emerging political forces that appeared to be more
effective were the Christians, which elected half of the electoral lists they registered, and the
coalitions (Instituto para el Desarrollo de la Democracia Luis Carlos Galán 2001, pp.200-208).
Once more non-political players seemed to gain territory, although, as mentioned before, the
label coalitions could be use to disguise old contenders as new (Instituto para el Desarrollo de la
Democracia Luis Carlos Galán 2001, p.229).
Bipartisanism continued to dominate the council, but it continued to lose relative power in
the city, from 70.61 percent in 1994 to 60.75 in 1997. In fact, non-bipartisan candidates occupied
25 percent of the seats, and the three candidates with the most votes106 were independents.
Nevertheless, the Council Representative elected with more votes did not get the presidency,
which was always the case; the presidency was obtained by a conservative candidate with a
liberal vice-president (Bejarano and Dávila L. 1998, p.152). In addition, the political movement
of the newly elected mayor did not succeed in guarantying the majority in the council, which, as
will be shown later, influenced the relationship between the Mayor and the Council and the
capacity of the central government to fulfill its goals. One may say that, once more, the desire for
change was reflected in the elections; and the resistance to it, in the reorganization of power
within the council. The third election of local boards (JALs), which is the subject of next
subsection, exhibited a similar pattern.
105 Electoral quotient: results of dividing the number of votes for the available seats; ideally the same number of voters should elect each member. 106 Patricia Cárdenas, Bruno Díaz, and Hipólito Moreno.

173
7.5.1 The third generation of Ediles. A La Tercera va la Vencida The third election of ediles, on October 26 of 1997, was important as they represented a test of
the consolidation of the local political arena. Significantly, for the first time the votes for ediles
surmounted the votes for the City Council; it is also the first time that coalitions between City
Council’s candidates and candidates for the JAL were created. These coalitions provided
evidence for the emergence of local political networks capable of electing their candidates in
both the council and the JAL. The tendency to dispersion, represented by the number of electoral
lists and parties, continued growing in 1997.
The linkage of the local offer to the council’s candidates, and the increment in the number of
electoral lists for JAL, are the most likely reasons for explaining the increase in the level of
participation in the 1997 local elections; 50.26 percent, which represents an incrase of 73.09
percent in relation to 1994 (García Sánchez 2003, p.72). For the first time, the level of
abstentions, 49.66 percent, was lower than the level of participation. In the 1997 local election,
the tendency for all parties was to increase the numbers of electoral list, with the exception of the
ANAPO; the two traditional parties registered almost triple the number of electoral lists than all
other parties. Table 41 presents the number of electoral lists by political affiliation for 1997
compared with 1992 and 1994.
Table 41: Number of electoral lists by Political Affiliation, JAL 1992 to 1997
Year Political Affiliation 1992 1994 1997
Liberales 452 932 1336 Conservadores 203 363 430
Otros 267 89 254 Cívicos 230 47 125
Izquierda 66 48 52 Cristianos 77 40 82
Anapo 0 20 14 Coaliciones 4 0 32 Indigenas 3 26 50
Metapoliticos 17 14 18 Total 1319 1579 2393
Source: data from ILCG (García Sánchez 2003, p.72)

174
This third generation of ediles included many ediles of the second generation, as 72 of them
were reelected, 11 more than in the 1994 elections, representing 39.13 percent of the available
seats (Instituto para el Desarrollo de la Democracia Luis Carlos Galán 2001b, p.148). In
addition, due to the number of electoral lists, none of the ediles reached the electoral quotient,
and all of them were elected by residuals, which illustrates the level of dispersion of the votes
and lack of effectiveness. In fact, the level of effectiveness decreased for all parties, except the
Christians and the Coalitions, which, as mentioned before, were important players in these
elections, as presented by table 42.
Table 42: Effectiveness in Local Elections, 1997
Party Lists Seats EffectivenessLiberals 1336 85 6.36
Conservatives 430 40 9.30Others 254 35 13.78
Civic Movements 125 12 9.60Left 52 5 9.62
Christians 82 5 6.10Anapo 14 0 0.00
Coalitions 32 2 6.25Indigenous 50 0 0.00Metapolitics 18 0 0.00
Total 2393 184 Source: ILCG, V.2, pp.146-147 Red: Reduction Blue: Increment Black: steadiness
The increase in effectiveness of the coalitions, as mentioned before, has a lot to do with the
emergence and consolidation of locally oriented political forces. An example of this trend is the
Partido Popular Colombiano-PPC, a new party constituted of small local networks, which
participated for the first time in the Council and JAL elections in 1997. The motto of the party
was “we are small, but together we are big;” the PPC obtained 16,538 votes in the Council,
representing the third largest political force, and 24,776 votes in the JAL, electing two ediles. It
is too early to know the future of Coalitions but they are an interesting political phenomenon, as
they may be key to aggregating local interests.

175
There are two lines of argumentation about what happened in the election of the third
generation of JALs. One asserts that these elections confirmed the increasing fragmentation of
the political parties (see, Gutiérrez Sanín 2001; Boudon 2000). Only 7.68 percent from the total
electoral lists registered elected an edil in 1997, which means that around 85 percent of the
ballots were pointless (Instituto para el Desarrollo de la Democracia Luis Carlos Galán 2001b,
p.142). The other asserts that the number of electoral list registered reflected the increasing
importance of the JALs as political players at the local level, and the increasing interest in
becoming an edil (see, García Sánchez 2003).
Certainly, this generation of ediles was hoping to have more control over the management of
the localities. The local budget for this administration was the largest so far, and they had certain
accumulation of knowledge regarding how to design and negotiate local projects and how to deal
with the central government. Nevertheless, the new mayor, Enrique Peñalosa, was determined to
change the rules of the game in order to put order in Bogotá.
7.5.2 Electing a mayor in 1997, further into politics of adaptation The 1997 Mayoral election is interpreted either as the point in which the crisis of the political
parties reached the bottom, or as the point in which important changes in the political system
reached equilibrium. Despite the rule that those candidates without certain minimum amount of
votes had to return the money received in support of their campaign, 15 candidatures were
registered this year, the highest number since the introduction of popular elections in 1986. The
increase in the number of candidates reflects to a great extent the effect that the 1994 elections
had on the city. The fact that an independent candidate had mobilized enough educated voters to
win the mayorship, which had “always” been liberal or conservative, attracted a lot of
“independents” to the 1997 contest. Independency meaning not tied to either the two traditional
parties or discredited new parties. Eleven out of 15 candidates opted for labeling themselves as
independent.
The Liberal party, in deep crisis due in part to the presidency of Ernesto Samper, was unable
to reach an agreement for supporting a single candidate; therefore, seven liberal candidates took
part in the elections, six of them under wide political denominations, and one as the official
candidate of the party. Some were backed up by existing political forces, others created their

176
own “independent” movements. The Conservative party represented by a weak candidate within
and outside the party had no choice of winning or even having a significant participation.
Of the “independent” candidates, Carlos Moreno de Caro, who participated in the 1994
elections as the Conservative party candidate, ran under his own movement, Defensa Ciudadana
(Citizens’ Defense). Defensa Ciudadana was far from the conservative thesis and closer to
populism, and soon became a favorite. To do so, he took advantage of the liberal divide and the
conservative weakness and used his long lasting local networks. In a survey from August 4 of
1997, conducted by the magazine Semana, he led the list of candidates.
The liberal press, particularly El Tiempo and Semana, deeply concerned about the
advancement of Moreno de Caro, started supporting the candidacy of Enrique Peñalosa, who was
the liberal candidate for the 1992 and 1994 elections, and was running again in 1997 under his
own “independent” movement, Por la Bogotá que Queremos (For the Bogotá We Want). For the
liberal press, he was the only candidate capable of stopping Moreno de Caro, which they
considered non reliable (Botero Restrepo 1998, p.145).
Soon, the contest between these candidates appeared as a class struggle between the rich and
the poor, Peñalosa being the candidate of the elites, and Moreno de Caro the candidate of the
poor (Botero Restrepo 1998; Instituto para el Desarrollo de la Democracia Luis Carlos Galán
2001b). Despite the veracity of this claim, it split the electorate, who practically disregarded any
other candidate, as illustrated by the electoral results of October 26, 1997.
On October 26 of 1997, the citizens, motivated by the polarization between Peñalosa and
Moreno de Caro, the variety of candidates, and the incentives offered for voting, vastly
responded; 1,318,661 votes were deposited, representing 42.73 percent of potential voters. In the
localities, the participation was higher, 52.14 percent. Enrique Peñalosa won the elections with
619,086 votes, which made him the most widely voted mayor in Bogotá in the twentieth century.
Moreno de Caro was second with 397,147 votes, a higher number of votes than those with which
both Andrés Pastrana and Jaime Castro were elected (Instituto para el Desarrollo de la
Democracia Luis Carlos Galán 2001b, pp.85-89).
For the first time, the local arena was highly significant for the electoral results; in fact,
Enrique Peñalosa was the first elected mayor to lose in six localities out of 19.107 When
examining localities by social strata it is clear that Peñalosa was elected by the middle class,
107 In 1997, the elections in the locality of Sumapaz were cancelled due to security reasons.

177
strata 3 and 4, and preferred by the upper class, strata 5 and 6; as for Moreno de Caro, he was
preferred by the lower class, strata 1 and 2 (Instituto para el Desarrollo de la Democracia Luis
Carlos Galán 2001b, pp.90-91).
This election confirmed the lack of political capacity of the two traditional parties and the
importance, as in the council’s elections, of the localities as political arenas. However, it is
unclear if there is a real political alternative to the traditional parties, or if, as mentioned by
Boudon regarding the country, every other party or movement is only the expression of personal
ambitions (2000, p.51); if so, politics in Bogotá, as in the country, have became more
personalized than ever.
7.5.3 The “urbanization” of the city Enrique Peñalosa assumed the mayorship of Bogotá on January 1 of 1998; his managerial style,
his ideas about urban development, and his political background marked his administration
performance; he accomplished most of his goals, with minimum negotiation. He ambitioned to
change the shape of the city, to urbanize it, to create some order;108 and, he knew that in order to
do so, he would have to, whether he like it or not, amicably deal with the Council; and so he did.
The City Council approved his development plan by agreement 6 on May 30 of 1998.
Peñalosa was convinced that, in order to flourish, civic culture required a physical
infrastructure, a space in which citizens felt equal, and, so he emphasized habitat, understood as
the the physical space, over civitas, understood as the social and political space. Nevertheless, it
is clear that the recovery and transformation of the public space was, and is, a political
practice.109
Consistently, his development plan, Por la Bogotá que queremos, established a relation
between the spatial reorganization of the city and the formation of a new citizen. The main
objective of the plan was to generate a profound change in the way of life of citizens, returning
the Bogotanos’ confidence in their capacity to build a better future and to uphold economic,
108 A very emphatic statement in his interview for this study, on November 4 of 2003. 109 For more about the process of recovering public space in Bogotá, see Michael G. Donovan, “Space Wars in Bogotá: The Recovery of Public Space and its Impact on Street Vendors”, MIT (Donovan 2002).

178
cultural and economic progress. It is to project and make viable a Bogotá for the new era,
working to better the quality of life of present and future generations (Peñalosa Londoño 1998).
Based on this aim, the following seven priorities were defined:
- Desmarginalización (demarginalization): to improve the quality of life in Bogotá’s
neighborhoods by improving infrastructure and service provision; the strategy for this
priority included the involvement of the sate, the private sector and the community
- Interacción Social (social interaction): to better the coverage, quality and quantity, of
social services
- Ciudad a Escala Humana (a city in human scale): to increase the quality and quantity
of public space
- Movilidad (mobility): to establish an efficient and proper transportation system in the
city, reducing commute time and providing comfort to the users
- Urbanismo y Servicios (urbanism and services): to organize the city’s growth,
providing dignified housing solutions in friendly environments
- Seguridad y Convivencia (safety and living together): to prevent and sanction
unsociable behaviors; promoting behaviors that enhance peace, solidarity, respect,
and community life
- Eficiencia Institucional (institutional efficiency): to establish public management
committed to promote efficient actions and respect to citizens
From these priorities, five mega-projects were to be implemented: building an integrated massive
transportation system; building and maintenance of streets and roads; creation of the land bank;
creation of the district parks system; and creation of the district libraries system.
After a very traditional negotiation with the City Council, it is said that he adjudicated his
public post in exchange for votes supporting his main projects (Velásquez Gavilanes 2003,
p.220), his development plan was approved by agreement 6 of May 30 of 1998. This may be not
significant for a politician that was willing to concede certain things if they granted his main
goals; during his administration denouncements were made regarding favoritism in adjudicating
public contracts.
Despite the veracity of the aforementioned claims, what is undisputed is that Mayor Pañalosa
successfully implemented all his mega-projects. He created a successful Urban Land Reform

179
institution; a successful bus-based transit system, Transmilenio; he lead the creation of a large
park, Tercer Milenio; and he built a network of three large new libraries and several smaller
ones. He also built hundreds of kilometers of sidewalks, more than 300 kilometers of bicycle
paths, pedestrian streets, and more than 1,200 parks were built or reconstructed. In addition, he
promoted the adoption of a car free day, for which Bogotá received the Stockholm Challenge
Award.
Due to his success in transforming the public space, at least physically, and in other areas of
his administration, he is recognized as a skilled manager, but also remembered as a vertical and
inaccessible mayor (Pizano 2003, p.57). Often he has been called “The Pharaoh”, not only
because of the dimensions of his public works but also for the method by which they were
built.110 Peñalosa’s vertical approach to management is clearly reflected in his approach to
decentralization and his relationship with local authorities.
On January 8 of 1998, a week after assuming office, he presented Decree 22, by which he
suspended the capacity to contract previously conferred to the local mayors. He claimed that
regulations regarding local contracts needed to be modified in order to fight corruption and
clientelism; two ills affecting local practices. On February 10 of 1998, he introduced Decree 176,
by which he transferred almost all responsibilities for establishing contracts with money from the
local development funds to central authorities, under his direct supervision.
In addition, he created the Unidades de Ejecución Local-UEL, local investment units, within
central organizations, for supporting the selection and implementation of local contracts. The
central organizations supported by UEL were the health, education, and government secretariats;
the communal action, environment, and social welfare departments; the urban development,
culture and tourism, and sports and recreation institutes; and the water and sewage company
(Bonilla, Pulido, and CEAD 2002, p.53).
Peñalosa’s arguments for creating the UEL were that,
Local boards lacked the required technical knowledge for making the right decisions in investment, and were using their investment capacity to grow their own clienteles and pockets. Inefficiency and corruption were very high and resources were wasted. The creation of the UEL aimed at providing the technical expertise needed to be efficient and
110 Several interviewees, among them, F. Zambrano and Hernán Suaréz, mentioned this fact. All coincided with City Councilor Jaime Durán Silva, which named Peñalosa’s city works pharaonic. See also this Liberal party note, http://www.ipliberal.org/modules.php?name=News&file=article&sid=685

180
to prevent the private use of public resources. In addition, he argued that the local mayors were using too much time in processing contracts; by creating the UEL, local mayors would be freed to concentrate on their more important functions.111
Raúl Lazala, local mayor of Kennedy under the Mockus administration, mentioned that,
The UEL improved the technical component of the local investment, as it improved the quality of the projects; yet it has two negative impacts, they made the approval and implementation of local projects more bureaucratic and complicated, and they recentralized important local decisions, debilitating the autonomy of the localities. It limited the access of local groups to local resources.
In regards to the impact of creating the UEL on the process of decentralization, and in rebuttal of
Peñalosa’s arguments, Angela María Robledo mentioned,
If people in the locality are called to participate in the whole process as adults, why are they not treated as such when the time come for signing contracts. The lack of trust spoils the whole ideal of participation.
Maria del Rosario Bonilla112 considers the creation of the local investment units as regressive in
terms of participation, “because it took the power with which local authorities were invested
back to the center and by dong so their credibility as valid representatives of the government.”
All the ediles interviewed concurred that, even though it was true that they were problems of
corruption, we do not believe that recentralizing the management of the investment was a
solution. The UEL created delays, problems in transparency, and increased the costs of contracts.
It would be better to create local UELs independent from the local mayors.
Evaluations regarding the UEL’s impact showed that the quality of local projects improved;
the coordination between central and local authorities, and the inclusion of other key players,
such as the private sector, also improved. In addition, the opportunities for corruption at the local
level, as the JAL and the local mayor did not participate in the adjudication of local contracts,
were reduced. On the other hand, the UEL’s implementation had also negative impacts.
For one, the process of adjudication got more complicated and thus required more time from
local mayors, producing the opposite of the desired impact. Local mayors were in charge of
selecting projects, gathering all technical and legal information required for signing the contract,
sending the projects to the UEL for its review, then, if needed, amending and returning them to
111 Interviewed on Nov.4, 2003. 112 Consultant for local development and ex-director of the Bogotá unit at the Escuela Superior de Administración Pública- ESAP, the public management graduate school in the country.

181
the UEL, to start the process of adjudicating the contract. The implementation of the UEL also
created a delay in the allocation of local budgets and therefore in the implementation of local
projects; in 1998 only 18 percent of the budget was allocated on time (Velásquez Gavilanes
2003, pp.207-209).
In regards to corruption, evaluations conducted by the Contraloría Distrital, the fiscal watch
authority in the city, documented cases of administrative malpractice from the UEL, such as the
adjudication of a contract for maintaining a non-existent road, the payment for contracts that
were not executed, or the adjudication of contracts for values well above market price. The
political and fiscal watch authorities also claimed that to control and watch the use of resources
and the implementation of projects became more complicated, as they had to request and follow
up on information from both the local and the central level (see, Contraloría de Santafé de
Bogotá 2000, 2000a, 2000b).
The creation of the UEL certainly improved the technical aspects of local projects but
undoubtedly undermined the embryonic local political arena and the process of decentralization.
Local authorities were dispossessed of their value as intermediaries between their constituencies
and the central government. In consequence, the communities’ interest in participating in local
affairs declined.
Consistent with his perception of the role and value of local authorities, Mayor Peñalosa had
a very distant relation with them. Carlos Carreño, edil from the locality of Santafé, mentioned,
We were able to meet with the mayor only on two occasions during the three years of his government; the first one was a meeting promoted by the administration, the second a forced meeting promoted by the ediles. It was not a good relationship, because the government’s declarations undermined the reputation of the ediles, and because the government was not open to dialogue. The central government claimed that ediles should not have a salary, that, they should meet less frequently, and so on. Mayor Peñalosa had a model of the city to implement and he was not open to discus it.
Due to the position assumed by the Major, the 184 ediles in Bogotá conducted a sit-in in the
Palacio Liévano, the mayoral headquarters, forcing the Mayor to speak with them. Although
Peñalosa met with them, according to Carlos Carreño, his posture never changed. The Mayor
never trusted us, the Ediles, and the relation was of confrontation throughout his administration.
The characteristics of the relation between the center and the localities deeply affected the
second participatory planning process.

182
Mayor Penãlosa introduced two decrees for regulating the second process of participatory
planning, Decree 739 on August 28 of 1998, and Decree 518 on August 5 of 1999. Decree 739
attributed the creation of local development plans to local mayors, excluding the JAL from it. It
also established the Encuentros Ciudadanos, public meetings to discuss and rate local projects,
and to discuss local matters; and, this time, the communities were called to participating in
evaluating the projects’ implementation and results (Flórez 2003).
Decree 518 was introduced a year after, aimed at improving and expediting the process of
local planning. In order to do so, the participation of local authorities in the projects’ approval
was reduced, attributing the whole responsibility to the UEL, which were to present alternative
projects when those presented by the local authorities were judged as unfeasible. This decree
also reduced the capacity of local communities to participate in the final selection of local
projects and budget allocation (see decree 518, 1999).
Between June and December of 1998, for the second time, localities engaged in creating their
local development plans, and continued preparing the local investment projects until October of
1999. In 1998, the local mayor prepared a draft of the development plan that included a vision of
the locality and presented it to the citizens in pre-encounter meetings.
Once all the projects were registered in the local project’s bank, they were selected and
ranked in the Encuentros Ciudadanos. On this occasion, Ediles, and citizens participated under
the same conditions; they could present and discuss projects to be included in the local
development plan. The contradictions in the legislation regulating local affairs complicated the
process of local planning, and produced confrontations between the communities and local
organizations. Mayor Peñalosa, arguing the need for avoiding traditional political practices and
not trusting the ediles, by Decree 739 of 1998, excluded them from deciding budget allocations,
although they were entitled to do so by the Constitution and the EOB.
In addition, the level of work required for presenting a project was higher and because of
that, the expectations were higher too; those participating were discouraged when they learned
that the UELs were in charge of the final decisions, and that they could present alternative
projects to those presented by local players (Flórez 2003). Even more so, Decree 518 terminated
the local commissions that were created in 1998 to include the communities in the reviewing of
the projects. It is important to recognize that the local commissions were not working as

183
expected and that their responsibilities were increasingly assumed by the local mayor in order to
fulfill the established deadlines.
As presented by table 43, there is a significant change in the number of people participating
and in the number of projects presented between the first and the second process of participatory
planning.
Table 43: People participating, number of projects and relative number of projects, 1998
Enrique Peñalosa
Locality Population 1997 # of projects # Projects/1000 people
1 Usaquén 341,909 85 0.25 2 Chapinero 402,542 33 0.08 3 Santafé 162,122 114 0.70
4 San Cristóbal 135,708 107 0.79
5 Usme 377,639 151 0.40 6 Tunjuelito 208,483 45 0.22 7 Bosa 199,156 59 0.30 8 Kennedy 792,31 100 0.13 9 Fontibón 538,77 87 0.16 10 Engativa 220,606 108 0.49 11 Suba 152,985 59 0.39 12 B.Unidos 119,24 39 0.33 13 Teusaquillo 149,296 48 0.32 14 Martires 356,043 264 0.74
15 Antonio Nariño 26,929 50 1.86
16 Pte.Aranda 303,266 63 0.21 17 Candelaria 249,909 179 0.72 18 Rafael U.U. 406,82 204 0.50
19 Ciudad Bolívar 622,24 134 0.22
20 Sumapaz 92 Totales 5,765,973 2.021 0.46
Source: Diez años de Participación en Bogotá (Pedraza 2001, p.8). Finally, it is interesting to notice that, in concurrence with Mayor Peñalosa’s preferences, 61
percent of the local projects presented in 1998 were of material infrastructure, such as building
and remodeling parks, communal rooms, sports facilities, local streets and roads, libraries,

184
community centers, and women’s centers. Many of these projects, after being elaborated by the
communities, were rejected by the UEL because they were not the responsibility of the localities
(Pedraza 2001).
An evaluation of the second participatory planning process conducted by PARCOMUN, a
Colombian NGO specialized in communitarian participation, showed that on this occasion the
technical requisites, above all, limited the participation of more people in the process. The
relevance given to improving the technical quality of the projects diminished the importance of
the social and political aspects of it.
According to the report, because of the way this process was conducted, the particular
expertise and knowledge of the people and organizations participating were not recognized;
instead, it aims to replace them with public administrators with deep knowledge of the public
maze, public lawyers, engineers, architects, urban designers, sociologists, project designers, or
economists, as needed (PARCOMUN 1999, p.18). In addition, those participating had to have
enough time and resources to spare as the process demanded a long time commitment, which in
fact was one of the main obstacles to participation.
Other evaluations of this process113 suggested that the following factors added difficultyto it:
- The high number of projects that had to be formulated hindered the aggregation of
interests, and undermined the creation of a collective and comprehensive vision of the
locality. In fact, other levels of planning prevailed, such as the neighborhood, street,
or square;
- The lack of a clear definition of responsibilities among the main authorities involved,
including the central government, central agencies, the UEL, and local authorities;
- The lack of inter-institutional coordination, due in part to the fact that the UEL and
central agencies did not recognize local authorities as equal in the process; in
consequence, the role assumed by the UEL and central agencies was of supervision
rather than members of the same team;
- The lack of appropriate and well-timed information from the part of local authorities,
which resulted in problems in the formulation and adequacy of projects; 113 See the research study conducted by PARCOMUN on participation, which reviewed and compared the first two processes of participatory planning (Pedraza 2001); or, the research conducted by Fabio Velásquez for the city of Bogotá on citizens’ participation (Velásquez C. 2003); or the researcher study conducted by Raúl Velásquez G. on local policies and decentralization (Velásquez Gavilanes 2003).

185
- The lack of consistency between the formulation of the project and the qualification
of its feasibility due to budgetary reasons; which resulted in the reformulation of most
projects;
- The lack of capacity from the local office of planning for supporting the process, due
to inexistence or high rotation of the local planning coordinators and lack of adequate
resources, such as mandatory formats and photocopiers;
- The difference in budget allocations, 90 percent destined to central planning, while
only 10 percent to local planning114 deepened the social and political divides between
local and central governments;
- Finally, it is said that the tension between civic participation and political
representation deepened during this process. The “social power”, represented by the
local planning councils, conflicted with the “political power”, represented by local
mayor and ediles (Velásquez C. 2003, p.327).
Mayor Peñalosa sought to have a permanent participation of citizens in dealing with local public
issues. In order to do so, he promoted periodic citizens’ encounters, Encuentros Ciudadanos;
nevertheless, the demand on time and resources from those interested in participating created a
filter, only those with enough time and resources would be able to participate. Moreover, even
those participating more often, soon realized that their participation was appreciated but not
significant enough to change the balance of power. The citizens’ encounters became more of a
space for the UEL to justify their decisions (Pedraza 2001, pp.18-20).
On 1997, following the constitutional mandate to promote decentralization, Congress issued
Law 388, which created territorial plans aimed at balancing economic development and the
utilization and distribution of the land and natural resources. Thus, during Peñalosa’s
administration, Bogotanos were called to participate in an additional collective project, the
creation of the new territorial development plan (POT), which had to define the city’s urban
development path for the next ten years, at a minimum. Article 24 of Law 388 mandated the
inclusion of economic groups, professional associations, and citizens in the process of discussing
and defining the POT; although the responsibility for consulting the constituents and creating a
collective vision of the future city was on the Mayor. 114 It has been claimed that during Peñalosa’s administration, even this 10 percent was manipulated by the central government (Velásquez Gavilanes 2003).

186
In Bogotá, between 1998 and 1999, more than 305 meetings were conducted for discussing
the POT. According to Decree 619 of 2000, by which the POT was sanctioned, 889 private and
public institutions participated, three teleconferences were held, 44 press bulletins produced; the
mayor city’s newspapers published over 30 open invitations, three international seminars on
urban territoriality were organized; pamphlets and itinerant expositions were created; and 500
surveys applied and interpreted (see Peñalosa 2000, p.2). It is said that it was the most costly
planning project in the city’s history, the city’s planning office- DAPD, invested more than 3
million dollars in the preparation of the POT (Noriega 2000, p.125).
At the local level, Local Commissions of Planning were created to discuss and promote the
POT. In the first phase, meetings were conducted for contributing to the creation of a diagnosis
of the city; later, the proposed prescription were presented and discussed in the 20 localities. The
concerns, opinions, and reactions of local citizens to the POT were collected in twenty-one
documents that the DAPD reviewed and submitted to the city’s Territorial Council.
An evaluation of the process concerning local participation conducted by the Veeduría
Distrital, an advisory agency of the city that handles the citizen’s participation in municipal
affairs, showed that the following factors limited the impact of the level of participation:
- The information presented at the local meetings was too technical for the audiences;
- The participants reported that their suggestions were heard but not incorporated in the
POT;
- Subjects that were important for the communities were avoided or excluded, which
lead the participants to conclude that this was mostly a rhetorical exercise;
- The discussion was limited to the territorial future of the city, as if it were possible to
think about the future without referring to social and political problems;
- There was no of mechanism for aggregating the results of the many meetings;
- An important contribution of the POT to the enhancement of the local level was the
creation of Unidades de Planeación Zonal- UPZ, zonal planning units, aiming at
creating units of planning bigger than the neighborhood and smaller that the locality,
average, 60,000 inhabitants per UPZ (Escallón and Sudarsky 2001, p.143).
The discussion of the POT created a lot of political tension, as the particular vision of the city
was tied to projects for as long as twenty years. As a result, the period for discussing and

187
approving the document in the city council expired, and the Mayor approved the POT by Decree
619 of July 28 of 2000.
In regards the enhancement of the local system of governance, is claimed that as mayor
Peñalosa distrusted local governments (Rojas 2002, p.17); he did not strive to accomplish two
goals that were included in the government plan for which he was elected,115 Bogotá 2,600
meters closer to the stars. He did not created smaller localities, which he said he would, nor
clearly redistributed functions between local and central authorities (Velásquez Gavilanes 2003;
Pedraza 2001). Finally, a study concluded that localities were paid more attention in previous
governments from the central administration, the media, and the academia (Velásquez Gavilanes
2003, pp. 214-219).
The people of Bogotá carried out 97 social protests during the first two years of Peñalosa’s
administration, most of them in the form of civic strikes organized by gremial organizations. The
three primary causes for protesting were: deterioration of income (unemployment and
employment stability), lack of communication and responsiveness from the city’s government,
and deterioration of basic needs (housing, health, education). It is mentioned that the
government’s priorities lacked the social and political consensus required to be legitimate
(Pedraza 2001, pp.39-40).
On June of 2000, a new norm for regulating civic participation in the localities was
introduced by the City Council, which used the faculties given to it by the New Constitution of
1991 to issue Agreement 134 of 2000. The aim was to institutionalize the local planning
councils, to empower local citizens, and, once more, to establish a clear definition of functions;
its appropriateness was debated because of certain conflicts with existing legislation and
because it was “imposed” on the new mayor, who did not participate in the debate (Lizarazo
Ortega 2001).
On September of 2000, the program Bogotá Cómo Vamos116 and the Universidad de los
Andes coordinated a forum for evaluating the achievements of Enrique Peñalosa’s
administration, and for identifying pending challenges for the incoming administration;
115 See, E. Peñalosa, Programa de gobierno para la elección de alcalde mayor de Bogotá, 1998-2000, Bogotá, Agosto de 1999, pp.23-24. 116 A private initiative launched in 1998 aiming at promoting a more effective and transparent government, and better-informed, responsive and participative citizens. The main parties in this initiative are, Fundación Corona, a foundation from one of the main economic groups, El Tiempo, the most important newspaper in Colombia, and the Cámara de Comercio de Bogotá, Bogotá’s merchant association.

188
decentralization was not one of the central themes. The evaluation showed that 66.46 percent of
the goals stated by Peñalosa’s administration were fulfuilled, and recognized the advancements
in education, health and security. It also showed that the areas lagging behind were
decentralization and the reorganization of the central government (González G. 2000, pp.11-12).
Interestingly enough, when asked about the most important change in regards to
decentralization, Enrique Peñalosa117 responded, the most important change that happened was
the introduction of elections for mayors in the country; and in Bogotá, the exclusion of the City
Councilors from the directive boards of the city’s public companies. If I had heeded to be
appointed by the president, I would have never been mayor of Bogotá.
In regards to the decentralization reform within the city, Peñalosa claimed that,
The creation of localities is a calamity promoted by the EOB; one cannot assert that decentralization within the city brings the state close to the citizen, when there are localities with more than one million inhabitants. I do believe that Bogotá should have localities with a maximum of 100,000 inhabitants; unfortunately, this is unfeasible because the ediles are paid and the city would not be able to afford the costs. Smaller localities with unpaid ediles might be useful. (…) I do not believe that decentralization has been significant within the city; 95 percent of citizens do not know the name of an edil. I believe it would be a disaster to elect the local mayors; that demagogy about democracy only works in words, in practice it would be a disaster.
For Mayor Peñalosa the most important contribution of his administration was to produce a total
change in the city, a change in the level of discussion, in the shared vision of the city, in self-
esteem; the people went from hating their city to be proud of it, to loving it. The perception of
Bogotanos, as reported in a study conducted on citizens’ perception of Bogotá in the 1990s, was
not aligned with Mayor Peñalosa’s perception. The participants in the study perceived the
material changes in the city as positive, despite their social repercussions, yet they also perceived
deterioration in the social and economic conditions of the city. They expressed concern over the
increase in violence, poverty, and unemployment (Pizano 2003, p.180).
In addition, his actions aimed at recovering the public space were deeply questioned, as
mentioned by Frídole Bayén,118 “The creation of big commercial malls, promoted by the Fondo
de Ventas Populares, for relocating the street vendors has not been successful. Not everyone has
access to funding or relocation.” In addition, Carlos Carreño, edil of Santafé under Peñalosa,
117 Interviewed on Nov. 4, 2003. 118 Frídole Bayén is an economist with a master in public administration who was in charge of the unit for especial projects at the mayor’s office; interviewed on Nov 18, 2003.

189
mentioned, “Mayor Peñalosa conducted the recovery of public space mostly through repressive
measures and not by negotiations. Many of these actions were very aggressive”.
On October 29 of 2000, the Bogotanos elected the first mayor of the New Millennium,
Antanas Mockus, this time under the label Partido Visionario, visionary party, was re-elected
with 681,017,000 votes, representing 43.72 percent of the total (Otálora Castañeda 2002, p.32).
As mentioned before, Antanas Mockus climbed to the Basílica de Monserrate,119 as any other
pilgrim, asking Bogotanos to forgive him for departing the mayor’s office before the end of his
term in 1998. The city he will govern again came into the new millennium with 6,484,967
inhabitants of which 3,190,170 were poor, and 959,238 indigent (Fundación Corona 2003, p.8).
In addition, at the end of the year 2000 there were 343,155 desplazados living in Bogotá.
How did people involved in the process of decentralization perceive it? How do they evaluate
the first three administrations in charge of implementing it? Is the process considered a success
or not, and why? Answering these questions is the subject of the next section.
7.6 THE PROCESS OF DECENTRALIZATION. SUCCESS, FAILURE, OR BOTH? When asked about decentralization, practically all interviewees agreed on the relevance and
pertinence of decentralization in Bogotá. Although there are important disagreements on the
evaluation of the process, what prevails is the perception that decentralization is a frustrated
project that still needs to be implemented. This perception appears to be the result of
contradictions between the arguments used to promote decentralization and the expectations
created by them, and the process and results of the implementation.
The following statement by G. Segovia Mora120 illustrates the great expectations associated
with decentralization in Bogotá.
The process of decentralization and administrative and territorial reorganization of the capital, vigorously promoted by the New Constitution of 1991 and the New Organic Statute of the city, is undoubtedly the best instrument for bringing the administration close to the people, for
119 A church at the top of Monserrate, a mountain considered an icon of Bogotá by visitors and locals. 120 G. Segovia Mora is a lawyer and political scientist that has focused his work on studying violence in Bogotá.He was advisor on justice, human rights and community living, for the Consejería para Asuntos Sociales y Participación Comunitaria, an advisory unit for the mayor of Bogotá, from 1992 to 1994.

190
enhancing participation, for opening new spaces for deliberation and reaching consensus. It will progressively, thanks to funds transfers to the localities, improve the conditions and quality of life of the citizens and communities (Segovia Mora 1994, p.372)121.
Yet the New Constitution’s aims needed to be turned into explicit laws and policies in order to
be implemented. In the case of Bogotá, many believe the decentralization reform promoted by
the New Constitution had important flaws in the original design which impeded its realization.
Margareth Florez,122 director of Communitarian and Local Affairs at the Fundación Corona,
mentioned that, “Bogotá has been implementing decentralization without being aware of it. It
appears as if the daily demands of governing did not lend any time to think or design a public
policy regarding decentralization in the city”. In a document from the end of the first Mockus’
administration, she already advised,
The process of decentralization has privileged means, instruments and structure over defining and understanding the strategic aim of this policy. If we do not accomplish this superior goal that is needed for orienting, articulating and organizing the process, the results will be unpredictable, and the impacts would be at most marginal; and what is worst, the city will have missed a crucial opportunity for change and the improvement of its social, economic and political conditions (Florez 1997, p.7).123
The lack of a political design for decentralization inluded, according to Raúl Velásquez, the lack
of a model of local governments and because of that, the local political development has been so
inconsistent, more subject to solving emerging problems than to implementing a public policy. In
addition, the non-existence of a clear policy resulted in a disorganized and inconsistent process
of implementation; Raúl Lazala, based on his experience as local mayor, said,
The city does not have clear understanding of what model of decentralization it wants, and because of that, the process has been mostly chaotic. It is a common practice that every time a high-level functionary of the central government is changed, he or she introduces changes to the existing practices. For example, during the time that I was local mayor, local health was managed first by the head of the first level hospital in the locality, then the new city’s Secretary of Health, created the lo local directions of health; and then, when the Secretary of Health was changed, the new one dismantled the local directions of healththat had been recently created. Another example is the Departamento Administrativo de Acción Comunal-DAAC, Department of Communitarian Actions which in the last ten years has promoted seven different approaches to the localities.
121 Translation by the author. 122 Interviewed on November 18, 2003. 123 Translation by the author
191
Moreover, it is argued that because the New Constitution promoted the reform, it lacks not only
the definition of its goals and means, but also the required trust and support from the authorities
and citizens of the city. Alberto Maldonado,124 researcher and consultant on decentralization in
Bogotá mentioned,
There is not an integral design of a decentralization policy and more importantly, there has not been a real debate in the city about decentralization. In my opinion, this has to do with the lack of a political force backing the discussion. Jordi Borja, the Spanish researcher, found in his studies on European cities that a requisite for the success of the decentralization reform is the existence of social and political forces pressuring its implementation. In Colombia, the debate was about decentralizing at the national level; in Bogotá, the process has been an exercise of systematized common sense.
A research study conducted by the Centro de Investigación y Educación Popular (CINEP),
evaluating decentralization in Bogotá, supports Maldonado’s argument in regards to the people’s
commitment to the reform. According to the study, the lack of credibility and trust in the political
system, in the country and the city, weakened the support given to the reform by the people
(Zamudio Castañeda, García Velandia, and Katz García 1997, p. 279)
In addition to the traditional distrust of people in exclusive political systems, the lack of trust
on the city’s administrations and the local authorities deepened the contradictions between the
discourse and the process of implementing decentralization, which in turn added conflict and
confusion in regards to the decentralization policy (Velásquez Gavilanes 2003). Maybe the
easiest, not necessarily the best, answer to these problems is what Jaime Silva mentioned when
interviewed, it is not the originality of the decentralization’s proposal, as much as the need to
clearly define its objectives in order to eliminate the many misunderstandings125. Yet this goal
requires a minimum consensus on the appropriateness of the reform. As mentioned by Margareth
Florez, “We are still far from understanding decentralization, the theme has not yet permeated
neither the academic community nor the central administration; in fact, the central functionaries
do not see the city as decentralized.”
In regards to the first enounced purpose of the decentralization reform, to bring the
administration closer to the people, regardless of the strategies promoted by the central
administrations to accomplish it, their caution and distrust towards the local authorities might
have even produced the opposite effect. The central administration also discredited the localities 124 Interviewed on November 11, 2003 125 Interviewed November 11, 2003.

192
based on their lack of institutional capacity, their lack of technical expertise, and the prevalence
of a political culture characterized by clientelism and corruption (Zamudio Castañeda, García
Velandia, and Katz García 1997, p.280).
Ex-mayor Peñalosa mentioned, “The City Councilors celebrated having the possibility of
reproducing their clienteles and practices in the localities. Lots of denouncements of corruption
were filed; in fact, it was because of the high level of corruption that the creation of the UELs was
necessary”. In response to these arguments, the ediles and local mayors interviewed recognized
the need to improve and develop the local political culture; nevertheless they do not believe that
recentralization is the answer.
Carlos Carreño, edil from the locality of Santafé, elected by a communitarian list under
Enirque Peñalosa, and the second Mockus’ administrations, mentioned,
I found that vices of other public institutions as the Senate or the City Council were present in the local boards; some members were there to manage and increase their own clienteles, to push forward their own projects for growing their electorate. Nevertheless, we were able to work through coalitions that were not as stable as desirable. The first year I was part of a five members’ coalition126, but during the second year, we were divided in three groups with no majority. Certainly, when it is time to approve the allocation of the local budget is when conflict appears, personal interests conflicted with the common good. Nevertheless, recentralizing or discrediting the local level not only would not be a solution but a mistake; the city requires decentralization for solving the deep social and political problems it has. The localities are different and have different problems and different needs, and they need autonomy to decide what needs to be done. So far, the local developments plans are but copies of the central development plan.
In response to the accusations of corruption, Carreño mentioned that this has been a traditional
feature in the politics both in the country and the city, and not particularly worrisome at the local
level.
What is certain is that only 1 percent of the city’s total income is transferred to the localities, yet, this is the portion of the budget that is most carefully watched. It is true that increased involvement of the citizens in the management of public resources is needed, but they should not only control 1 percent of the budget but the whole city’s investment. For example, the city discovered after the end of Peñalosa’s administration, that the quality of many of his public works was questionable; the Transmilenium pavement, which was very expensive, needs repair far before expected, and the cycle-routes have light poles in the middle. Thus, the need to develop better mechanisms for controlling and scrutinizing the investment of public resources is undoubtedly important for the city at all levels.
126 From seven members that is the total amount of ediles in the local board of Santafé.

193
Interestingly enough, the perception of unreliability is common on both sides, as central
administrations have distrusted the capacity and responsibility of local authorities, local
authorities and communities have distrusted the central administration’s commitment to
decentralization. For once, the historical political exclusion created indifference and distrust in
any proposal from the government; and, many claimed that the same tradition of exclusion made
the central governments so cautious in implementing decentralization, as it entails sharing power,
and they have not been ready to do so. F. Zambrano affirmed,
The arguments for undermining the local authorities are consistent with the political culture that has prevailed in the country and the city, a culture of exclusion. We never stop being enlightened despots127; this is the philosophy underneath the country and the city’s political modernity, all for the people, but without the people. The verticality of the system and the concentration of power have not changed and are important obstacles for decentralizing,, despite all the resources and strategies set in place. This is why although local authorities are vital players for the implementation of decentralization, decisions about local life have not been transfered to them.
A. Maldonado mentioned, “The problem with decentralization is about power. Bogotá is a
city of a size like Honduras or Guatemala, managed by a center made up of about 25 people.”
In regards to the second expected outcome of decentralizing, the enhancement of participation,
there are several arguments questioning its success. Raúl Velázquez mentioned that the boost of
formal institutions for promoting participation might have produced the opposite effect. “There
were so many new “participatory” formal arenas and mechanisms, that, to a certain extent, they
ended up competing for the people’s attention, and because of that they might have become an
obstacle for participation.” 128
A research study on participation in Bogotá supports this argument. According to the study,
the lack of coordination between the many institutions promoting participation confused people
and made it difficult to participate. In addition, the study reported on the existing conflict
between social participation and political representation; the relationship between the local
planning committee (CPL), representing the social power, and the JAL and local mayors,
representing the political power, illustrated this conflict at the local level (Velásquez C. 2003,
pp.327-337).
127 F. Zambrano refers to the philosophic movement from the 18th century known as "The Enlightenment." 128 He mentioned among others, the local cultural committees, the planning local committees, and the local development funds.

194
In addition, it appears that the lack of commitment from the central government to
decentralization has also affected the quality of participation. Margareth Florez, from her
experience in evaluating the process of participatory planning, mentioned, “The lack of clarity
on the decentralization policy and institutional weaknesses of the localities greatly impacted the
evaluation of the process of participation. At the bottom lies the question, what decentralization,
and for what? Nevertheless, not one of the mayors engaged in a serious debate, nor did they
strengthen the local governments”
It was said that the because of the lack of commitment to decentralization, the participation
promoted was more formal than effective. F. Zambrano declared that from his experience, “Most
actions from the central government for promoting participation have been merely placebos. The
mayor decides everything and there is a clear attitude of avoiding direct participation, and the
people know that.” Angela María Robledo expressed a similar perception, “Everyone talks about
participation, but it is, I participate, you participate, we participate, and they decide. I believe
that the communities have advanced more than us.”129
A thorough research study, conducted by PARCOMUN,130 on the participatory planning
exercises, supports the aforementioned arguments. According to the study, people reported that,
on both occasions, the exercise was controlled and directed by central public officials that did not
recognize the potential, nor the limitations, of local participants; they were considered passive
receptors instead of active participants. The result was a great level of frustration among most of
those who participated (Pedraza 2001pp.25-30).
Antantas Mockus, based on his experience as mayor in two occasions, made the following
argument in regards to participation,
There are citizens that like to be informed and to be part of deciding. There are also citizens however, which can be named modern, that appreciate the division of work in the city, trust the government, and do not need or want to know details; finally there are also citizens that are organized and do not need direct participation.
Certainly, the political culture that has prevailed, in the country and the city, defined different
types of citizens, as mentioned by Luis Alberto Restrepo, “In a society like ours, deeply unequal
and exclusive, participation tends to assume the air of social protest, and not of co-
129 She referred to the government, as she was part of it; the emphasis corresponded to the interview. 130 Fundación para la Participación Comunitaria (Foundation for Communty Participation).

195
responsibility” (Restrepo 1997). Citizens choose how to participate in accordance to their
previous experiences.
The third expected outcome of the decentralization reform was the development of localities
into new, and better, democratic arenas for deliberation and consensus building. Three
obstacles for reaching this goal were commonly mentioned in the interviews:
- First, the opening of the citizens’ encounters to individual participation resulted in a
conflict between individual and common interests, complicating the possibilities of
reaching consensus and aggregating interests.
The study conducted by F. Velásquez on participation supports this first argument. The report
suggests that the design of the citizens’ encounters promoted an individualization of the
relationship between the city’s central government and the citizens. Two out of five participants
did not represent any collective interest. As a result, local identity has not been advanced; on the
contrary smaller identities have been fortified, such as the neighborhood, the block or the parish
(Velásquez C. 2003, pp.327-328).
In addition, the social and political capital represented by organizations with trajectories at
the local level who could have been able to promote certain level of aggregation of interest was
disregarded, as they were not consulted in the promotion of decentralization (Zamudio
Castañeda, García Velandia, and Katz García 1997; Pedraza 2001). In regards to this argument,
Antanas Mockus mentioned,
Paul Bromberg considers that the whole system of intermediation that existed at the local level, in which the local needs were canalized by the JAC131 (communal action boards) via the Council, was undermined because it attributed the same range to other organizations as the JAL and local development funds.
This tendency was furthered by the amount of money available; local individuals and
organizations competed for scarce resources, while the central government tried to optimize the
allocation of resources by approving as many small projects as possible (Jiménez Benítez 2001,
p.237).
131 Juntas de Acción Comunal

196
- Second, local communities do not know who their local representatives are, or trust
them; local authorities are not knowledgeable about the localities, and that
denouncements were made against local mayors that did not even live in the locality.
As Enrique Peñalosa mentioned, “No one knows who their local authorities are.” A study that
evaluated the knowledge of the citizens in regards to the local governments supports this claim.
According to the study, citizens have a very low level of knowledge on local matters,
significantly lower that their knowledge in regards to the central administration; only 7 percent
had an acceptable level of knowledge about local legislation compared with 62 percent with an
acceptable level on the city’s legislation (Pizano 2001, p.50).132 Yet, the general conclusions of
the study mention a lack of knowledge from Bogotanos in regards to political authorities at all
levels (Pizano 2001, p.70).
Another study aimed at evaluating the level of knowledge of citizens in regards to local
institutions and authorities found that only 35.5 percent of participants knew what a JAL was.
According to the report, this percentage is very positive if one considers that only 38.2 percent of
participants knew what the City’s Council was; when the Council has been present in the city’s
political life for much longer than the JAL and has had much more diffusion (García Sánchez
2003, pp. 106-107).133
Certainly, local communities are not acquainted enough with their institutions and authorities
yet, which is not a surprising finding, considering that they are relatively new and that they
arrived into a political system that lacked trust and credibility. On the other hand, are the local
authorities acquainted enough with their communities? It has been said that due to the small
number of votes required for electing an edil, they do not need to know the locality, or represent
local interests. Jaime Silva mentioned, “An edil may be elected by family and friends.”
An analysis on the 1995 elections showed that some ediles were elected with less than one
thousand votes in localities with populations over 500,000 (Donovan 2002, p.52), which supports
Silva’s claim. In regards to this claim, Raúl Lazala mentioned that,
It is important to understand that Bogotá is part of Colombia and that problems of representation and low quality of its political leaders are common to all political bodies in the country. We must
132 Pizano based her study on a survey conducted by the city’s cultural institution in 1996. 133 García-Sánchez based his study on a survey conducted for the SHD in 2000 as part of a consultancy on the institutional reform (Dávila Ladrón de Guevara and García Sánchez 2000).
197
not forget the low quality of Colombia’s political parties. In addition, the level of political fragmentation resulting from the opening of new political spaces in the localities is only a manifestation of Colombia’s social fragmentation. The same problems that afflict the JAL are present in the Congress.
A study on decentralization provided evidence supporting Lazala’s argument. According to the
study, the electoral system in Colombia privileges the conformation of political micro-
enterprises, due to the minimum support required to win the elections (Jiménez Benítez 2001,
p.240). The local politician responds to particular demands and not to identified collective
problems of the locality (García Sánchez 2001). The ediles had their own compromises with
their electorate, which should not be surprising; what is worrisome is the size of the electorate
and in consequence, the capacity of the ediles to represent collective interests.
Paul Bromberg goes further in his critique of the ediles. He mentioned,
The policy design for the creation of the JAL was completely wrong; the claim that the JAL improved democracy is not necessarily true. The fact is that you now have 184 new paid posts in the city that attract into the political system local leaders that lose their independence. Even worst, Agreement 12, the ediles became completely useless; this agreement was an action from the Council against the ediles, in order to recover their control of the local arenas. Before, they were the priviledged intermediaries between the localities and the central government.
Paul Bromberg’s comments reflect the lack of clearly defined functions among local and
central authorities, but also the prevailing lack of trust, even from those that are governing, in the
capacity of the system.
The other key figure in the local system is the local mayor, a somewhat obscure figure that
existed before the decentralization reform, and whose role has not significantly changed. Several
interviewees mentioned that the position was irrelevant both before the reform and after it. In
fact, almost none of the studies reviewed mentioned the local mayors, and none of the surveys
referenced included questions about them.
The local mayor’s role is complicated as they are located between the local representatives
and the city’s Mayor, who in fact is his or her boss. In fact, the local mayor is but an employee of
the city’s Mayor, which he can dismiss at any time. This position is also often a protégée of the
ediles. As mentioned by Susana Schuster,
Because the local mayor is a member of the trio of candidates prepared by the JAL, the candidate that the Mayor elects usually has compromises with the ediles that postulated him or her. Actually, I learned that this is the reason behind the coalitions, to present a trio in which, to a

198
certain extent, it is possible to predict who would be the selected mayor. What the ediles look for is to commit the local mayor to perform certain actions that guaranteed their political reproduction.
Another problem, mentioned in the interviews, in regards to the local mayors was their lack of
competencies for the post and lack of knowledge of the locality. Carlos Carreño mentioned that
he witnessed “protests against local mayors that did not even live in the locality”. He argued
that the recent improvement of the process of selection of local mayors, both in the configuration
of the trios by the JAL, and in the criteria used by the Mayor to choose them might solve this
problem. Two governments after this study introduced changes for improving the selection of
local mayors. In his second administration (2001-2003), Mockus introduced a battery of
psychological test to improve the selection of local mayors. Luis Eduardo Garzón (2004-2007),
due to the amount of complains against local mayors in his government, introduced a much-
debated process of selection that ended up with twenty new local mayors, all women.
Despite these improvements, the local mayors remain, as mentioned by Susana Schuster, “as
delegates of the Mayor in the localities that are instructed at the central level about which are
the priorities.” The local mayors remain employees of the Mayor and are not included in the
government of the city as a whole, but in a little piece of it. As mentioned by Raúl Lazala,
The more important administrative and political authority for the localities is still the central government, in particular the Mayor. The Mayor and the central government make the more important decisions for the localities; in consequence, the delegates of the central government in the localities are far more important than the local mayors or the ediles.134
The third obstacle mentioned in the interviews referred to the impact of new and smaller polities in the city.
- Third, the opening of new and smaller spaces for practicing politics has fragmented even
more the political spectrum in the city, resulting in higher deficiencies in representation.
Antanas Mockus mentioned,
At the end of the 1990s, the political agents operated in a very fragmented market, in which everyone competed for their own future; there were no stimuli for collective action, it is a war of all against all. The internal fragmentation of the traditional parties became transparent, and with the addition of new political forces without political affiliation, what emerged was a market of electoral micro-enterprises. To the extreme that for 42 seats at the Council there were several hundreds of lists and only two or three of them were elected by a majority, while all the others by
134 In fact, the delegates of central institutions such as DABS, IDCT or the Education Secretariat are more powerful than the local mayor, and do not need to consult or even inform him of their actions.

199
a residual number. Most votes are wasted and few people got representation. What prevailed was fragmentation over representation.
A study on political representation in the localities of Bogotá supports Mockus’ claim. The study
calculated the index of proportional representation (DP) for the JAL and found that from 1992 to
2000 it averaged 66.44 percent. The DP index measures how well a proportional electoral system
proportionally reflects the preferences of voters; the acceptable values range between 10 and 15
percent (García Sánchez 2003, pp.77-80). Hence, the level of fragmentation in the localities,
measured by the DP, is well above acceptable.
A previous study conducted by the same researcher found similar results in regards to the
City Council, the DP’s index average was 44.6 percent from 1992 to 2000; with an annual
increase of over 7 percent. However, García Sánchez also recognizes that the localities have
created a political space closer to the people and less elitist; the structures of intermediation
became more horizontal, but less stable (García Sánchez 2001, pp.196-201).
There are those that consider that fragmentation is only a strategy of the traditional parties to
recover their political space. In fact, the Operación Avispa (operation wasp) is an electoral
strategy promoted by the traditional parties in order to increase the number of seats obtained by
candidates with residual numbers of votes. F. Zambrano mentioned, “Few years after the reform,
the system regained its capacity to neutralize the emergence of new political players or
movements closer to the people. This is just what happened at the local elections; the liberal
party swept away the JAL’s elections.”135
Despite the apparent recovery of the two traditional parties, there is evidence showing an
important increase in the number of civic organizations in the city. According to the study
funded by Fundación Corona, around 49 percent of the city’s civic organizations were created in
the last ten years (Corporación Raices 2002). Although there is no information on the quality of
their participation or their political significance, these organizations certainly represent a source
of a political capital with potential to develop.
Finally, Raúl Lazala mentioned an appealing argument for to the value added to the city’s
political life by the creation of the JAL,
I do believe the JAL have been very important in the enhancement of democracy and public administration. They reanimated the debate and interest in public issues, and validated the
135 F. Zambrano refers to the local elections held on November of 2003.

200
political options and actions of thousands of local leaders. It may be true that there are two types of democracy in the city, what I would call the democracy of public opinion, that finds expression in the election of the city’s mayor, and the plebeian democracy, that is expressesed in the elections of JAL and the City Council, and that is closer to the old clientelism and political practices. Nevertheless, despite the existing tensions, the process contributed to improving the city’s government and provided important lessons for the city’s life.
A critical requisite for fulfilling the aforementioned expectations was the timely and
appropriate transfer of funds for local development. A common complaint from the ediles
interviewed was that the central administrations often did not generate the transfers and allow the
localities to administer them. As mentioned by Carlos Carreño,
None of the administrations followed the mandate establishing that the resources allocated to the localities would increased gradually until reaching 20 percent of the city’s current income. They all stayed at the minimum 10 percent, undermining the strengthen of the localities and the reform.
A number of analyses of the process of decentralization support this claim. Law 1 of 1992
provided that the central administration will allocate a minimum 10 percent of its current income
to the localities, and that this amount would be incremented annually and accumulatively by 2
percent, until reaching 20 percent by 1998; seven years later, in the year 2000, the initial 10
percent remained unchanged (Jiménez Benítez 2001, p.223).
In 1993, the EOB made these funds even less certain as it left the allocation of funds and the
definition of the priorities to the discretion of the Mayor. An evaluation of the amounts allocated
showed that, in 1992 it was 0.8 percent of the total investment went to local development funds;
in 1993, the number was 1.3 percent, and in 1994 it was 1.7 percent (Zamudio Castañeda 1997,
p.40).
An evaluation on decentralization conducted by reseqarches from CINEP (Zamudio
Castañeda, García Velandia, and Katz García 1997), mentions:
- The transfers of funds has been limited to 10 percent of the ordinary budget of the central
administration;
- The control over local funds remains centralized and the transfer of funds depend on the
availability of resources and the priorities of the Mayor. The local development funds are
but an extra account in the financial secretariat of the central government, SHD;
201
- The amount of local investments managed by the JAL was very low, due to delays in the
transfer of funds from the central government;
- Changes and inconsistencies in the legislation that regulate the local investment have
complicated its management;
- The creation of the Consejo Distrital de Política Económica y Fiscal-CONFIS (the city’s
council of economic and fiscal policy) limited the autonomy of the local investment, as
this new institution became an additional party that must approve the local development
plans.
The achievement of the goals associated with decentralization had the final aim of bettering the
quality of life of local residents. The most common criticisms in regards to this aim referred to:
the lack of commitment from the central administrations to decentralization, the management of
the localities as isolated units, and the change of perspectives and strategies from one mayor to
the other. However, most interviewees recognized the fact that the city is a reflection of
Colombia’s problems and because of that, even the best policy could not completely solve its
problems.
Alberto Maldonado mentioned,
Poverty has grown due to the deterioration of employment and increase in unemployment. This just shows that a mayor can improve the city’s infrastructure and because of that report improvements in the quality of life of its citizens, while at the same time people could be starving. Nevertheless, even the best mayor cannot control the many external factors that influence the city.
In adding to Maldonado’s argument, Raúl Lazala mentioned,
Despite of the many efforts made by the city for improving the quality of life of its citizens, there are today more people living under the poverty line than ever, also the quality of employment in the city has decreased. These problems are, as mentioned before, the manifestation of the country’s situation in the city. Bogotá can not be isolated from it; even more, Bogotá should not be considered an island.
The evaluation of decentralization conducted by CINEP included a section on the impacts of
decentralization in the quality of life of local citizens (Zamudio Castañeda, García Velandia, and
Katz García 1997, pp.33-34), which revealed that:
- The management of social investment in the localities has been dominated by clientelism;
- The demand exceeds the offer, which in turn creates a lot of frustration

202
- The lack of a concept for local development hindered the impacts of local investments;
- The lack of articulation between the city and the local development planning affects the
capacity to learn and optimize resources;
- Despite all limitations, the JAL directed local investments to areas previously ignored by
the central administrations, directly impacting the quality of life in their localities.
Fabio Zambrano mentioned that,
The emphasis on habitat over civitas, the understanding of the public space as the material space and not the political space, was clear in the case of Mockus and Peñalosa, without denying that Mockus directed more resources to the localities and to improve equity in the city. The priority for those governments was the public space in its physical dimension, to embellish, clean and develop the city’s infrastructure. However, even beauty is unequally distributed in Bogotá, besides the fact that beauty is a very subjective concept. It has been estimated that close to 70 percent of the city’s settlements are informal; it is different to visit Santa Ana136, than to visit Tunjuelito137. Anyway, it would be unfair to say that it has not been investment in embellishing the poorest neighborhoods; important public works were developed for the people, without the people.
In regards to Zambrano’s claim, councilor Jorge Durán Silva, in a public communication
directed to the city Council and the citizens, mentioned, “The result is a city with an enormous
debt, great uncertainty regarding the sustainability of projects built under these administrations
and the deterioration of the quality of life of its habitants (Durán Silva 2003).”138
A research study on the perceptions of Bogotanos about the city, covering the three
administrations presented in this chapter, reported that all participants concurred over the
deterioration of the economic and social conditions in the city, which has resulted in increased
poverty, unemployment and lack of security in the city. The Bogotanos in the study also
commented that these problems were the consequence of the internal war, the displacement of
people to Bogotá, and the recession of the mid-1990s (Pizano 2003, pp.118-119).
Regardless of the mismatches between the expectations created by the reform and its actual
results, interestingly enough, all the interviewees, in spite of their differences, agreed that
decentralization has contributed to the enhancement of the city’s political life. A. Mockus from
his experience as mayor of the city mentioned,
136 A rich northern neighborhood. 137 A poor southern neighborhood..

203
Even if we did not define clear goals for decentralization, it is my perception that the Bogotanos are today more prepared for acting collectively. The communities learned how to prepare projects and even more importantly how to prioritize them. The government learned to plan and invest considering the localities, before the decentralization reform deep problems that existed in the localities were overlooked; decentralization has promoted a focusing of resources and therefore equity. However, what I value most is the potential for horizontal innovation and learning; for example, the local mayor of Antonio Nariño developed his own interpretation of the concept of productivity; in association with local producers, he promoted the project School Shop, and was able to significantly reduce the cost of school supplies, while developing the local economy.
As attested by Angela María Robledo,139
Another important change that could be attributed to decentralization is the shift, still to be consolidated, from assistentialism140 to the definition of social policies for the city. These policies need to be strengthened and there is still much to do, but the localities began to be the focus for the design and implementation of social policies. There have been important advances in education and health, to the extent that Bogotá has today the best coverage in the country.
Independent of the level of commitment from the administration to decentralization, the
localities attracted a lot of attention during this time; particularly important is the emergence of
new voices into the discussion regarding decentralization. Certainly, there are more people
talking and thinking about Bogotá than before; in the city, the country, and overseas, as proven
by the number of debates, documents, and international recognitions about Bogotá in the last
decade of the 1990s.
Margareth Florez declared, “Before Jaime Castro, few were concern with the city as a social
and political entity, today there are many new voices involved; certainly we need to learn much
but the city is more inclusive as it is a subject of concern to more”.
The emergence of the city as a public concern might have influenced how Bogotanos judged
their governors. According to the study on their perceptions, the Mayors before Antanas Mockus
or Jaime Castro are perceived as inefficient, populist, cheap politicians and open to corruption
(Pizano 2003, p.181).
Decentralization permitted a scrutiny of the citizens into their governments and the inclusion
of new voices into the public realm. Raul Lazala, local mayor mentioned,
139 Interviewed November 140 A charity-like strategy in which people or groups are considered the object of intervention, to one in which they become protagonists of their own development (Archbishop Celestino Migliore 2004).
204
What is important about the decentralization reform is not as much its administrative suitability as its ethic contribution. Decentralization means a redefinition of the model for governing; it is a bet on a closer relationship between the state and the citizens.
Certainly, these last statements reaffirm the relation between decentralization and governance;
what is not clear is how the quality and outcomes of the process affects the credibility of the
decentralization proposal and its future developments, or on the other hand, how the
characteristics of the process affected the system of governance.
7.7 POLICY ANALYSIS
The process, as told above, is full of contradictions, inconsistencies, successes and failures, but
more importantly is full of lessons, not only for the city, but also for those involved in public
policy, in theory or practice. The final goal is to understand the tensions and interactions
underneath this process, its achievements and limitations, and to learn from them.
According to public policy theory, the first step in designing a new policy is a careful
analysis of a difficult situation in order to define a policy problem; meaning a problem that may
be solved by institutional action. If the problems that the decentralization policy aimed at solving
are unclear, the process becomes unpredictable and subject to the interpretation of whomever is
in charge of deciding how to orient it. Another consequence of an unclear identification of the
policy problem is the likelihood of investing scarce public funds, to implement the wrong
solution (Dunn 1994).
The first salient element in the review of the process of decentralization in Bogotá is the lack
of a clear definition of a policy model, or even more importantly, the lack of a precise definition
of the problems to solve by decentralizing. This element is the expression the tension between
the constitutional mandate and its application in the city. Despite the fact that the New
Constitution was the expression of a very much-needed new social contract, its mandate to
decentralize Bogotá lacked the required political and social consensus for succeeding; it was a
top-down reform. The reform required a change of culture; no doubt a more inclusive and less
hurried discussion could lead to a better understanding and to less resistance. It started as a very
wide and undefined mandate and became a practice; decentralization became an end instead of a
means, it was never a policy, at least as defined by theory.

205
In addition, the city’s governments applied the mandate without the required debate to define
why, how, and for what. The lack of discussion within the city increased the verticality of the
approach of policy implementation. Once more, the process was very limited and managed at the
top. Neither the problems nor the policy model was discussed with the appropriate stakeholders.
As presented by Guess and Farnham, failure to include all reasonable constituencies and
options in defining policy problems and solutions is a major political mistake—that is, failure to
deal with all dimensions of the problem permits underlying social conflicts to become
aggravated. For this reason, policy development should include safeguards for public notice and
comment, active participation, and a transparent appeal process (Guess and Farnham 2000, p.31).
The lack of definition of a policy model has other consequences; the implementation of the
reform was subject to different interpretations and because of that, it did not have coherence or
continuity. In fact, two different models emerged trough the process; one is a clear commitment
to deconcentration from the central government, while the other is a timid devolution of political
and administrative power to the localities.
Another consequence of not having a policy model was the inability to foresee possible
impacts of the policy implementation and its institutional rearrangements. For example, the
creation of the JAL implied serious additional costs for the city, the running of elections in
twenty localities, and the payment of 184 ediles, which in practice are underused. The city does
not need local representatives to promote deconcentration that has been the privileged model in
practice, as illustrated by the process.
Policy analysis theory mentions that before deciding what alternatives are the most
appropriate to pursue, it is necessary to evaluate the structures already functioning to avoid
duplication of efforts, power conflicts, and overlap of functions. This is another step that was
lacking in the decentralization process; only when facing unavoidable conflicts between
organizations or institutions was it considered. The conflict among parallel organizations relates
to the existence of parallel and conflicting implicit models of decentralization.
It is possible to conclude that what happened with the process of decentralization in Bogotá
has a lot to do with the tendency to believe that producing norms has the magic effect of
substituting for the social, political, cultural and economic processes required for a change to
take effect (Moreno Ospina 1997). In Bogotá, many people believe that decentralization has not
closed the gap between letter and practice, that it is a “paper” reform.

206
Another lesson from public policy discourse asserts that the appropriate strategy for
promoting a new policy depends on the level of credibility of the government, the quality and
quantity of the alliances supporting the decisions, and the organizational capacity to assure the
successful implementation of a policy. The lack of credibility of the political system, in
Colombia and Bogotá, caused problems in the initial promotion of decentralization; aggravated
in turn by the lack of credibility in the reform from the city’s government. The central
government did not established alliances with local political players and ignored the capacity of
local organizations to support the process. The administrations reviewed believed that they knew
what was best for the city, and to some extent that is why people elected them; nevertheless,
even the best government has to be ready to negotiate.
It is important to notice that new alliances emerged in the city, promoted by other sectors in
society than the state, and motivated, according to their leaders, by the decentralization reform.
They created Bogotá Cómo Vamos, a public-private initiative to evaluate the governments’
performance, and Concejo Cómo Vamos, a similar initiative concentrated in improving and
watching the City Council’s performance. The Division of Local Affairs of the Fundacion
Corona, aimed at enhancing communitarian organizations at the local level and strengthening
local governments; and Univerciudad, a program dedicated to study the city, informed the
citizens and promoted debates on public affairs.
The aforementioned institutions assumed an active role in the process of defining and
implementing decentralization in the city. They performed most of the monitoring of the process,
which is, according to public policy theory, another important element in a successful
implementation. Monitoring helps to assess degrees of compliance, discover unintended
consequences of policies and programs, identify obstacles and constraints, and locate sources of
responsibility for departures from policies in order to help the implementation process (Dunn
1994, p.19)
A last consequence of not having a clear policy design is the difficulty of evaluating not only
the process, but also its results and impacts. Evaluation yields policy-relevant knowledge about
discrepancies between expected and actual policy performance; monitoring not only gives results
about the extent to which problems have been alleviated but also contributes to the clarification
and critique of the values driving a policy, the adjustment or reformulation of policies, and even
for reformulation of the problem (Dunn 1994, p.19).

207
The implementation of decentralization with all the expectations associated with it, required
deep changes in the prevalent political culture or cultures in the city. The review of the process
showed the existence of at least two conflicting political cultures; the politics of notables and the
politics of plebeian (García Sánchez 2001, p.186). It seems that the tradition of exclusion
impeded the recognition of the value added that each might bring to the process of creating a
new city.
The conceptualization of the localities as individualized entities, disconnected from the
center, impeded the articulation of a common vision of the city and the creation of a system of
governance in which the whole is more than the sum of its parts. The disconnect between local
and central planning and the gap in the allocation of funds deepened the social and political
divides; in general, 90 percent of the budget goes to the central planning, and only 10 percent to
local planning. It has been a centralized decentralization.
Nevertheless, it is necessary to recognize that along with the central government’s resistance
to decentralizing, the process also lacked the presence of an organized civil society committed to
the democratization of the city. How did citizens do?
- They respond within expected values to the local elections
- They participated in mass in the first and second participatory planning exercises
- They continue using informal strategies of political participation such as strikes, marches,
and others
- They lost interest in the process as they began to feel that they were passive guests
- They did not have a comprehensive view and understanding of the local problems and
needs
- They are still thinking in terms of individual gains, independent of the major problems
affecting the locality
- They are, in general, unaware of the power of citizenship.
It is important to recognize that even the best policy has limitations, if the decentralization
reform in Bogotá had not had any failures; the city would have nonetheless many problems.
Decentralization is not a panacea for all the problems affecting the city. Many problems require
further changes in the country, and many depend on global trends. Nevertheless, the process is

208
irreversible, regardless of its inconsistencies and failures, decentralization is out there in the
streets of Bogotá, and it just can be improved or destroyed.

209
8.0 COMPARING RESULTS OR, TODO TIEMPO PASADO FUE PEOR
“Urban governance can be carried out by local neighborhood networks without interference from governmental agencies. (…) Overall, urban governance and aggregation seems safer in local hands than in those of political bodies”
Mathew A. Crenson (1978).
8.1 INTRODUCTION
It is well known that public policy is a political and technical exercise, what is often forgotten is
that it is also an exercise of hope. A policy is a deliberate intervention to solve a problem that
affects the life of people; as such, it necessarily creates expectations and hopes, particularly
among those most affected by the problem. Moreover, due to the systemic nature of society, a
change in one part affects the system as a whole. Thus, how policies are planed and implemented
depends largely on the power interactions within the system and the capacity of its constituents
to negotiate and pursue the common good. This is why governance became such a relevant
concept; it seeks to understand, and explain interactions in complex socio-political systems.
More specifically, governance refers to the complex interactions between actors with
different priorities by which decisions in regards to public concerns are made. It includes formal
institutions, regimes empowered to enforce compliance, as well as informal arrangements that
people, and institutions either, have agreed to, or perceive to be in their interest.
Good governance aims to promote a system of interactions, in which those involved
understand that the health of the system depends on the health of each and all of its constituents.
Among other promotes important characteristics, a good governance system must be
participatory, equitable and efficient. It is my interpretation that participation is an indicator of
political efficiency, equity indicates social efficiency, and efficiency itself indicates economic
performance.

210
Decentralization was promoted as the most appropriate strategy for the promotion of these
characteristics and values of (good) governance, based on the assumption that its implementation
necessarily implies the redistribution of power, within the state and between the state and the
citizens; resulting in more democratic systems.
The system of governance in Bogotá had a mayor change when the New Constitution of
1991 promoted a decentralization reform. The reform required the redistribution of power within
the state; a new layer of governance was added to the system. The localities, which were before
mere administrative divisions, became new political arenas with new representatives and new
rights.
The reform also implied the redistribution of power between the sate and the citizens;
According to the New Constitution, participation was the main feature of Colombia’s democratic
system; it would give a voice to the excluded as well as enhancing the state’s accountability and
performance. Has the decentralization reform in Bogotá produced the expected results, and to
what extent? In order to answer these questions, this chapter presents a comparison of the system
of governance in Bogotá, before and after the decentralization reform, with a focus on three
critical variables of (good) governance: participation, equity, and efficiency.
8.2 PARTICIPATION
The New Constitution of 1991 included important provisions for the promotion of participation
at all levels, as a mean for enhancing democracy and redefining the country’s political system.
The new charter changed Colombia’s political regimen from a representative to a participatory
democracy. In order to support this change, new mechanisms for direct participation, as well as
new forms of political representation, were instituted.
During the 1990s, in response to the constitutional mandates, Congress discussed and
approved a series of laws for the promotion of participation and inclusion in the country. The
laws supported two constitutional aims: to close the prevalent social and political gap in the
country, and to return some legitimacy to the political elite and credibility to the political system.

211
Bogotá was no exception to the social and political unrest that prevailed in Colombia in the
late twentieth century. The relationship between the state and civic organizations was
confrontational and citizens were very skeptical about the city’s political institutions. In fact,
between 1975 and 2000, Bogotá was only second to Medellín in the number of social protests of
all kind, including strikes, marches, blockages and others. Undoubtedly, many of the social
protests conducted in Bogotá were motivated by national problems; nevertheless, the
neighborhoods of Bogotá showed high levels of organization for supporting and leading the
protests (Mauricio Archila N. [et al.] 2002, p.247; Alfonso, Hataya, and Jaramillo 1997; Pedraza
2001).
Thus, the complexity of the city’s system of non-formal participation is an important element
to consider when evaluating the results of the decentralization reform. This section reviews and
compares political and social participation mechanisms and behaviors, from before and after the
decentralization reform. Eight indicators of participation were assessed:
1. Increase or creation of mechanisms for participation (formal and informal)
2. Increase or creation of programs promoted by community groups and organizations
3. Legislation on participation
4. Incorporation of excluded groups in the consultation process
5. Increase or existence of public meetings for discussing planning and budgets
6. Number of voters and relative participation in elections
7. Increase in the number of parties participating in elections
8. Emergence of new political players
Subsection 8.2.1 presents the first four indicators, old and new mechanisms for participation,
including the promoters and the targeted populations, as well as the legislation concerning it.
Subsection 8.2.2 summarizes the information available about participatory planning. Subsection
8.2.3 presents results of the electoral processes in the city, covering indicators 6, 7, and 8.
Subsection 8.2.4 presents some comments regarding participation and its indicators, and a brief
analysis of the findings.
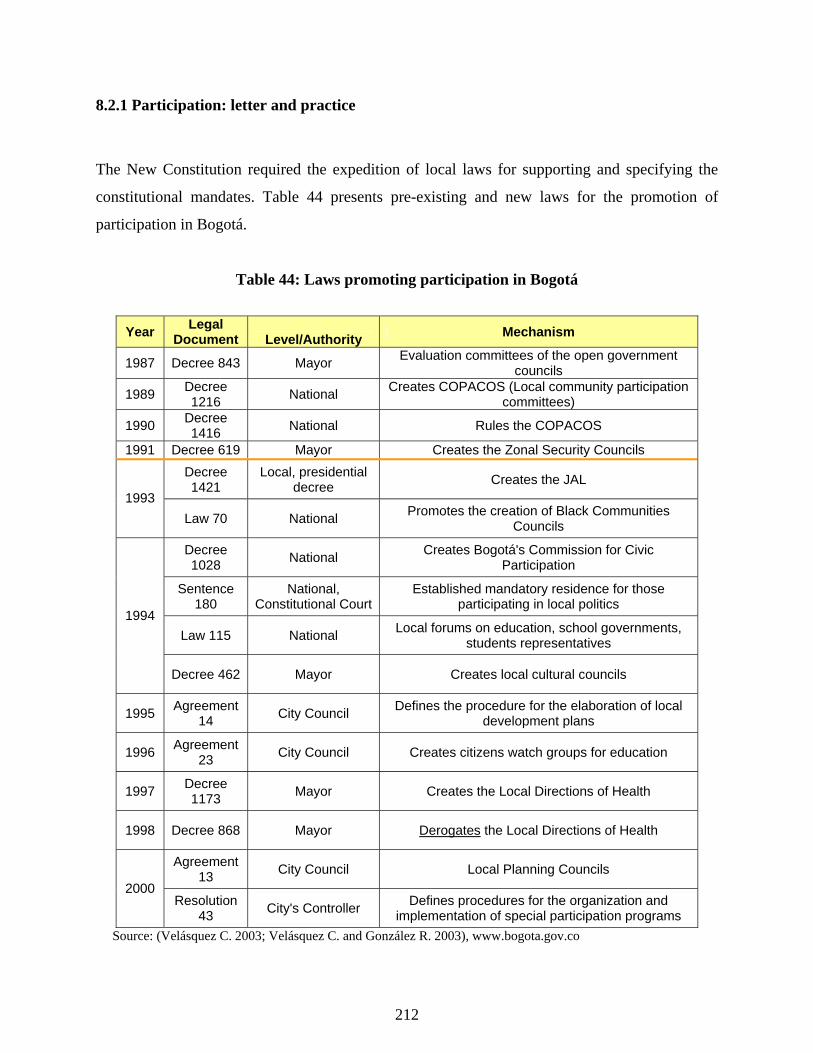
212
8.2.1 Participation: letter and practice
The New Constitution required the expedition of local laws for supporting and specifying the
constitutional mandates. Table 44 presents pre-existing and new laws for the promotion of
participation in Bogotá.
Table 44: Laws promoting participation in Bogotá
Year Legal Document Level/Authority Mechanism
1987 Decree 843 Mayor Evaluation committees of the open government councils
1989 Decree 1216 National Creates COPACOS (Local community participation
committees)
1990 Decree 1416 National Rules the COPACOS
1991 Decree 619 Mayor Creates the Zonal Security Councils Decree 1421
Local, presidential decree Creates the JAL
1993 Law 70 National Promotes the creation of Black Communities
Councils
Decree 1028 National Creates Bogotá's Commission for Civic
Participation
Sentence 180
National, Constitutional Court
Established mandatory residence for those participating in local politics
Law 115 National Local forums on education, school governments, students representatives
1994
Decree 462 Mayor Creates local cultural councils
1995 Agreement 14 City Council Defines the procedure for the elaboration of local
development plans
1996 Agreement 23 City Council Creates citizens watch groups for education
1997 Decree 1173 Mayor Creates the Local Directions of Health
1998 Decree 868 Mayor Derogates the Local Directions of Health
Agreement 13 City Council Local Planning Councils
2000 Resolution
43 City's Controller Defines procedures for the organization and implementation of special participation programs
Source: (Velásquez C. 2003; Velásquez C. and González R. 2003), www.bogota.gov.co

213
In addition to the changes introduced in the legal framework, the city’s infrastructure for
participation was reinforced by creating spaces of dialogue where the new social contract could
be ratified. Table 45 presents pre-existing and new formal organizations for the promotion of
participation at the local level.
Table 45: Formal organizations for local participation
Local Councils Laws and decrees
Civic watch committees on prices Decree 620 of 1973
Consultant committees to the minor mayorship Decree 851 of 1973
Communities participation in local management (regulates) Decree 2621 of 1982
Government Councils Decree 843 of 1987 Mayor
Zonal Security Committees Decree 619 of 1991, Mayor; modified by Decree 115 de 1992
Local Cultural Councils Decree 462 of 1994 Mayor
Local Councils for abused and sexual exploited children Agreement 12, 1998 City Council
Local Planning Councils Agreement 13, 2000 City Council
Source: (Velásquez C. 2003; Velásquez C. and González R. 2003) and Bogotá’s website.
After 2000, which is the limit set for this study, some other organizations for the promotion
of participation were instituted. The City Council created Youth Local Councils in 2001
(established by National Law 375 of 1997). The Controller’s office promoted the creation of
Local Committees for Social Control in 2003, and, the administration of Luis Eduardo Garzón
(2004-2007) created the Local Councils for Social Policy and the Local Councils for victims of
intra-family violence and sexual exploitation.
Finally, a hybrid form of institutions have appeared in Bogotá, not promoted exclusively by
the central government, which indicate a redistribution of power between the state and the civil
society, as well as the restoration of their relationship. It is in this type of organizations that
many traditionally excluded groups are finally being included in the state’s action.

214
The DABS (Departamento Administrativo de Bienestar Social) created discussion tables in
recognition of the existence of organizations that were already working at the localities with
specific populations, such as communitarian associations to help children and youth, senior
citizens groups, and NGOs promoting women’s health. In addition, it is possible to identify
emerging organizations in which the civil society, the private sector and the state concur in
search of the common good, indicating the emergence of new forms of governance. Table 46
presents new informal organizations promoting participation, which involve both the state and
the citizens.
Table 46: Informal organizations for participation
Organization Promoter Members
Monitoring Committee for the SISBEN SDS and communities
Government and social representatives
Local Committees of the Solidarity Network DABS, IDRD and communities
Government and low income representatives
Local and District youth tables Youth organizations and government functionaries
Youth involved in the City's Youth Council
Social Policies by target population discussion and design tables DABS
Citizens and NGOs working with specific populations (youth, seniors, women, children, disabled, and others.)
Thematic Committees (culture, ecology, communications)
Central administration
Central administration and sectors representatives
Groups for the enhancement of living together Government Secretariat
Citizens interested in enhancing living together
Bogotá Cómo Vamos (Monitoring and evaluation of city's central government performance)
NGOs, media, CCB (private initiative)
Representatives from the founding organizations
Consejo Cómo Vamos (Monitoring and evaluation of City's Council performance)
NGOs, media, CCB (private initiative)
Representatives from the founding organizations
Univerciudad: on-line magazine
Hacer público lo público: focused on decentralization and local themes Bogotá en los medios: media coverage on the city
Red Bogotá
Bogotá en datos: Bogotá’s data
Program of the National University of Colombia for promoting access to information and debate about Bogotá
Coordinated by a professor from the National University and open to any participant
Source: Based on (Velásquez C. 2003), the interviews and documents collected.

215
In addition to new institutions created for participation, it was expected that the recognition
of localities as political arenas would promote their organizational capacity. The emergence of
numerous civic organizations at the local level provides evidence supporting the aforementioned
expectation; due that 49 percent of the city’s civic organizations were created between 1991 and
2001 (Corporación Raices 2002). Figure 35 illustrates the number of civic organizations per
locality in the year 2001.
648
310
272
254
253
248
243
181
180
154
150
131
100
100
87
81
80
71
63
33
0 100 200 300 400 500 600 700
Ciudad Bolívar (19)
Suba (11)
Bosa (7)
Kennedy (8)
Chapinero (3)
San Cristobal (4)
Engativa (10)
Usme (5)
Barrios Unidos (12)
Santa Fe (3)
Usaquen (1)
Rafael Uribe (18)
Tunjuelito (6)
Fontibon (9)
Puente Aranda (16)
Teusaquillo (13)
Candelaria (17)
Los Mártires (14)
Antonio Nariño (15)
Sumapaz (20)
Source: Data from (Corporación Raices 2002)
Figure 35: Civic Organizations per locality in Bogotá, 1998-2000

216
It is plausible to affirm that the availability of resources for participation is a causal element
in increasing the number of local organizations in Bogotá. Nevertheless, the city has a long
lasting tradition of civic organizations, which managed to participate and create their own
political spaces. Protesting was a deep-rooted form of political participation in the
neighborhoods of Bogotá; it prevailed in the past, but it is also noticeably important in the
present.
The Bogotanos have protested mainly against an over-centralized government closely tied to
regional and national political networks. The increment in paros, strikes, blockages, and other
forms of social protest from the 1970s on, illustrates the increasing unrest provoked by the
prevalence of exclusion that led to renegotiating the country’s social contract in 1991. From
1971 to 1977, the average number of strikes per year was 12, from 1978 to1988 it increased to
22, and from 1991 to 1999, it increased to 51 protests per year (Pedraza 2001, p.34), as
illustrated by Figure 36.
12
22
51
0
10
20
30
40
50
60
1971-1977 1978-1988 1991-1999
Ave
rage
yea
rly p
rote
sts
Source: data from (Pedraza 2001) and (Mauricio Archila N. [et al.] 2002)
Figure 36: Average protests per year, before and after the reform
My contention is that the increase in the number of protests, particularly after 1991, shows an
important increase in participation, through well-known mechanisms; it also reveals the tensions
created by the top-down approach that the decentralization reform has taken in the city. All the

217
administrations reviewed had an extremely formal proposal for the Bogotanos; they all wanted
citizens to learn how to participate according to their standards. In this approach, according to
Kliksberg, “Order, hierarchy, command, the formalization of processes, and a vertical
perception to organization are the keys of efficiency. […] order, that is a means, tend to
become an end” (Kliksberg, p.21). Figure 37 illustrates the number of protests that occurred
during the three administrations in charge of implementing the decentralization reform.
3
70
75
43
74
62
50
44
37
0 10 20 30 40 50 60 70 80
1991
1992
1993
1994
1995
1996
1997
1998
1999
Adm
inis
tratio
ns
Source: Pedraza 2001, p.34
Figure 37: Protests in Bogotá, 1991-1999
Social protest has its own validity in comparison to formal mechanisms of participation; it
shows that the citizens are unhappy with the available mechanisms for participation, as well as
with their relationship with the state or other players in the city. A protest usually expresses the
impossibility of a dialogue between the parties; an example is the case of the relocation of a
factory that pollutes the environment without consulting the affected communities. Social protest
is a flexible and inclusive strategy yet ephemeral; as such, it must be articulated with other forms
of participation.
Finally it would be presumptuous to expect that people would change their well-known
mechanisms of participation for new ones, without proof that these are more effective. In fact, in
Bogotá there have always been formal spaces for participation; nevertheless, the characteristics
of the state-citizen relationship gave preference to informal mechanisms, which proved quite
PeñalosaCastro Mockus

218
successful in gaining attention from the central government and forcing it into dialogue and
negotiations. The dismissal of social protest as a legitimate form of participation reflects the
contradiction between the participatory discourse and its practice.
8.2.2 Participatory Planning Before the New Constitution forced the decentralization reform onto the city, some political
leaders tried to promote a more democratic regime for Bogotá; nevertheless, they failed, due to
the resistance of those interested in keeping Bogotá under the control of the president and his
regional allies, as mentioned in Chapter 7.0. The government of Bogotá, with the support of the
United Nations, tried a first experiment with participatory planning in 1987.
The districts of Ciudad Bolívar, Usaquén, Suba, Usme, Engativa, Bosa and Kennedy were
chosen to be part of the Gobiernos Abiertos (open governments). The methodology was to
conduct open discussions in which, based on the information presented by delegates from the
government secretariats, the communities had to decide investments’ priorities. The designated
Mayor, Julio César Sánchez, a liberal, created the Consejos de Gobierno (government
committee) at the alcaldías menores (minor mayorship) for monitoring the advancement of the
projects by Decree 847 of 1997. The local councils of government would not exist until the year
2002 when Decree 098 instituted them again.
As the aforementioned reform is the only antecedent of participatory planning before the
decentralization reform, it does not lend itself to a systematic comparison. After the
decentralization reform, the inclusion of the communities in their own local planning was
mandatory; in consequence, the 20 localidades of Bogotá were summoned to participate in
planning their development on two occasions, under Antanas Mockus in 1995, and under
Enrique Peñalosa in 1998. It is worthy to summarize the results from these processes, as they are
a significant strategy for changing the relation of power between the state and the citizens.
Undoubtedly, the process of participatory planning brought citizens and government closer,
but the benefits of this interchange were unequally distributed. The government learned about the
city and its local territorial and political units, and this knowledge allowed them to enhance
coordination among different central units of government. Nevertheless, both participatory

219
planning exercises were controlled and directed by public officials, had a predetermined format,
and did not recognize neither the potential, nor the limitations, of the local subjects.
Table 47 presents a comparison in the number of projects presented, and number of projects
per 1,000 inhabitants, by locality, between 1995 and 1998.
Table 47: Participation in Local Planning
Antanas Mockus 1995 Enrique Peñalosa 1998
Locality Population
1993 # of
projects Projects/1000
people Population
1997 # of
projects Projects/1000
people
1 Usaquén 208,467 467 2.24 341,909 85 0.25
2 Chapinero 354,557 447 1.26 402,542 33 0.08
3 Santafé 116,053 300 2.59 162,122 114 0.7
4 San
Cristóbal 103,039 736 7.14 135,708 107 0.79
5 Usme 417,417 795 1.90 377,639 151 0.4
6 Tunjuelito 199,461 912 4.57 208,483 45 0.22
7 Bosa 211,866 397 1.87 199,156 59 0.3
8 Kennedy 681,139 1,023 1.50 792.31 100 0.13
9 Fontibón 588,914 1,143 1.94 538.77 87 0.16
10 Engativa 184,491 482 2.61 220,606 108 0.49
11 Suba 132,474 405 3.06 152,985 59 0.39
12 B.Unidos 95,801 257 2.68 119.24 39 0.33
13 Teusaquillo 101,502 311 3.06 149,296 48 0.32
14 Mártires 298,257 442 1.48 356,043 264 0.74
15 Antonio Nariño 24,627 269 10.92 26,929 50 1.86
16 Pte.Aranda 390,506 689 1.76 303,266 63 0.21
17 Candelaria 218.38 795 3.64 249,909 179 0.72
18 Rafael U.U. 389,661 1,444 3.71 406.82 204 0.5
19 Ciudad Bolívar 767,633 1,635 2.13 622.24 134 0.22
20 Sumapaz 16,751 225 13.43 92
Totales 5,500,996 13,174 3.68 5,765,973 2,021 0.46 Source: Diez años de Participación en Bogotá (Pedraza 2001, p.8).
The difference between the first and second participatory planning exercise is significant,
particularly in the number of people participating (inferred by the number of projects per 1,000
inhabitants). A small decrease in the number of projects was expected, because the first time
220
“everyone” wanted to participate and that excitement tends to subside eventually, however, the
decrease was much higher than expected.
Some causes of the decline in participation from the first to the second participatory process
are:
- The level of technical expertise required for presenting a project was increasingly
complicated in the second occasion
- The time commitment for the whole process was triple in the second occasion
- The introduction of the UEL (Unidades Ejecutivas Locales) in the administration of
Enrique Peñalosa
The data available is not consistent enough to compare the two processes. However, data for the
number of people participating during Peñalosa’s administration, from the Government
Secretariat, shows that people appeared to be loosing interest; 46,818 people participated in
1998, 35,833 in 1999, and 31,716 in 2000 (Velásquez C. 2003, p.326). Despite all limitations,
the introduction of participatory planning in the localities brought significant changes.
- Localidades now had a local budget that in itself opened the system of governance, and
despite of its amount, localities had certain resources that did not exist before.
- The process brought attention into the local life and increased the dialogue within the
communities and between them and the central administration.
- The process attracted the involvement of the private sector into the political life of the
city
- Finally, it instituted a formal local space for participation
8.2.3 Elections as Participation This study examines the period that began with the institution of mayoral elections in 1986, to
the end of the twentieth century in the year 2000, and its breaking point is the decentralization
reform promoted by the New Constitution of 1991, by which a new layer of government was
introduced in the city. Between 1988 and 2000, the city elected 5 mayors, and 143 city

221
councilors; from 1991 to 2000, it elected 552 ediles. This section reviews these elections in
regards to the impact of the decentralization reform.141
8.2.3.1 Mayoral elections in Bogotá The re-establishment of direct elections for Mayor in 1986
is for many the most important political event for the country in the twentieth century; the
Bogotanos elected their first Mayor in 1988. Before 1988, the president appointed the city’s
Mayor, which was subject to national and regional political bargaining; the Mayor had to be
loyal to the presidential interests, which were not always compatible with the city’s interests.
Consequently, one of the main constraints, was the short time that Mayors stayed in office;
“between 1931 and 1954, the average stay was nine months; and only three Mayors survived for
more than two years” (Gilbert and Dávila 2002, p.37).
In addition, the turnover of Mayors was usually accompanied with the replacement of most
directors of the city’s public offices, which deeply deteriorated the continuity of policies and
programs, and their efficiency. The election of the Mayor undoubtedly improved the city’s
political life; citizens ought to choose their political leader and the elected Mayor was now
committed to his or her electorate. However, it is argued that the expectations created by the
election of the Mayor were not fulfilled; the traditional parties managed to retain their political
control in the city, and the preferred form of public management, clientelism, remained
unchanged (Otálora Castañeda 2002; Instituto para el Desarrollo de la Democracia Luis Carlos
Galán 2001). The analysis of the electoral behavior of the Bogotanos helps in examining this
argument.
Andrés Pastrana, a conservative in a liberal city, who belongs to one of the most traditional
conservative families in the country, won the first Mayoral elections in 1988. He was a well-
known TV broadcaster on his family’s news program, who was kidnapped just before the
elections; it is unknown how much “that was a vote of sympathy,” as mentioned by Gilbert and
Dávila (2002, p.38). In addition, the division of the liberal party made it easy for the conservative
to win the 1988 elections; seven candidates claimed the representation of the party.
In 1990, showing that it had learned its lesson from the 1988 elections, the liberal party
presented a unique candidate to the electorate, Juan Martín Caicedo, who easily won the
141Most of this section draws from a research study on electoral behavior in Bogotá, conducted by the Instituto Luis Carlos Galán (2001; 2001b).
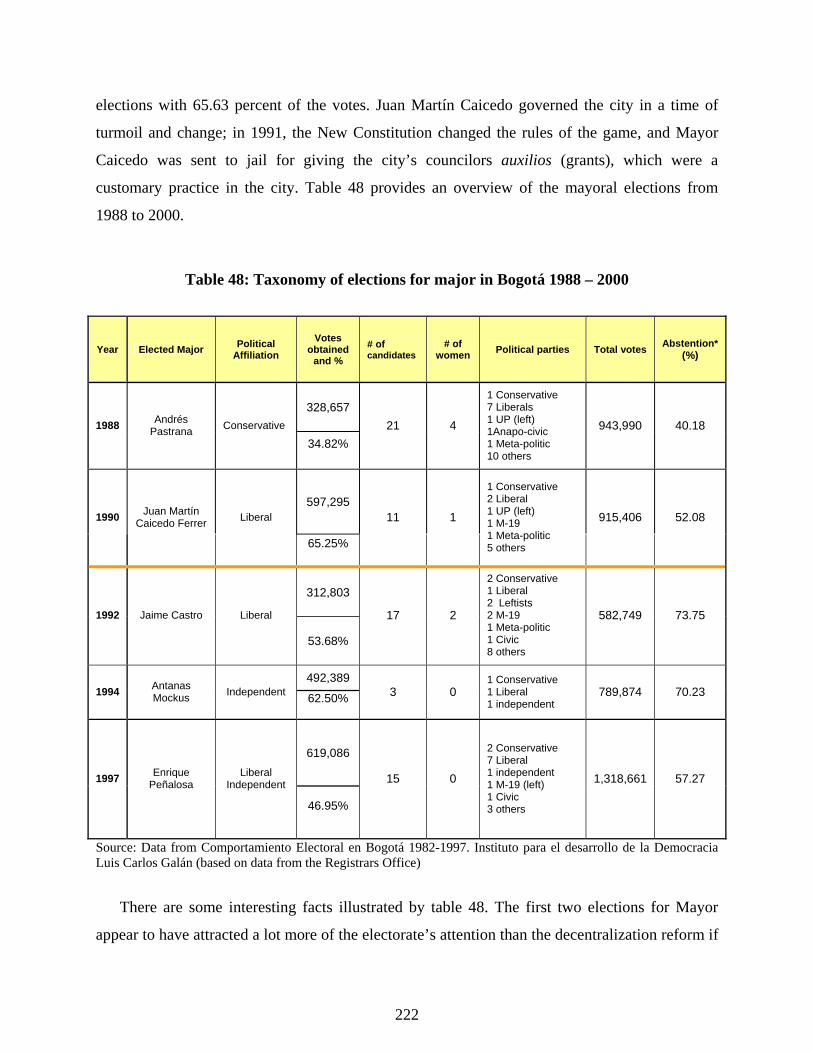
222
elections with 65.63 percent of the votes. Juan Martín Caicedo governed the city in a time of
turmoil and change; in 1991, the New Constitution changed the rules of the game, and Mayor
Caicedo was sent to jail for giving the city’s councilors auxilios (grants), which were a
customary practice in the city. Table 48 provides an overview of the mayoral elections from
1988 to 2000.
Table 48: Taxonomy of elections for major in Bogotá 1988 – 2000
Year Elected Major Political Affiliation
Votes obtained
and % # of candidates
# of women Political parties Total votes Abstention*
(%)
328,657 1988 Andrés
Pastrana Conservative
34.82%
21 4
1 Conservative 7 Liberals 1 UP (left) 1Anapo-civic 1 Meta-politic 10 others
943,990 40.18
597,295 1990 Juan Martín
Caicedo Ferrer Liberal
65.25%
11 1
1 Conservative 2 Liberal 1 UP (left) 1 M-19 1 Meta-politic 5 others
915,406 52.08
312,803
1992 Jaime Castro Liberal
53.68%
17 2
2 Conservative 1 Liberal 2 Leftists 2 M-19 1 Meta-politic 1 Civic 8 others
582,749 73.75
492,389 1994 Antanas
Mockus Independent 62.50%
3 0 1 Conservative 1 Liberal 1 independent
789,874 70.23
619,086
1997 Enrique Peñalosa
Liberal Independent
46.95%
15 0
2 Conservative 7 Liberal 1 independent 1 M-19 (left) 1 Civic 3 others
1,318,661 57.27
Source: Data from Comportamiento Electoral en Bogotá 1982-1997. Instituto para el desarrollo de la Democracia Luis Carlos Galán (based on data from the Registrars Office)
There are some interesting facts illustrated by table 48. The first two elections for Mayor
appear to have attracted a lot more of the electorate’s attention than the decentralization reform if

223
one considers the level of abstention. It is not until 1997 that the electoral participation returned
to the same level as before the reform. Nevertheless, the percentage by which a candidate is
elected Mayor of Bogotá appears to have stabilized, with one significant variation in 1994, when
Antanas Mockus was elected with the highest percentage ever.
After the New Constitution, many political players that stayed out of the formal institutions,
due to their exclusive practices, entered the mayoral contest. In 1992, they were 17 candidates,
everyone wanted to participate, yet, only three were affiliated to the conservative or liberal
parties; two women participated in the contest. Jaime Castro the elected in 1992 was the first
Mayor governing for three years, as the New Constitution extended the mayorship from two to
three years.
In 1994, they were three candidates, 1 conservative, 1 liberal and 1 independent. In 1997, the
amount of candidates increases to 15, 7 of which were liberal and 2 conservative; the winner,
Enrique Peñalosa, participated as an independent. In both years there were no women candidates.
It is possible to confirm that the two traditional parties, liberals and conservatives, have lost
their hegemony in the mayorship of Bogotá; particularly if one considers that Antanas Mockus
was reelected in 2000, and that a leftist candidate, Luis Eduardo Garzón was elected in 2003.
The three mayoral elections following the New Constitution illustrated the consolidation of
movements and candidates without an explicit political affiliation.
It appears that the best strategy to win, at least for a while, was to participate in the elections
as a candidate who despises politics, as if the candidate for mayor were not part of a political
process and a political structure. The lack of legitimacy of traditional parties gave legitimacy to
those that claimed not to belong to any; the “old politics” were so discredited that being a
politician or being in politics was equivalent to being corrupted, inefficient, and inappropriate
(Peña 1995). Obviously, the traditional parties decided to sell themselves under new labels,
though not necessarily new ideas; many decided to present themselves as independent.
From 1994 on, the conservative party lost any chances of electing a mayor in Bogotá; it has
consistently attracted less than 5 percent of the voters, and did not have a pool of candidates from
which to choose. In fact, the conservative party supported independent candidates in the 1994
and 2000 elections. In any case, it has been calculated that despite the number of candidates for
mayorship of Bogotá, only two or three are real competitors; the number of Effective Electoral

224
Parties in Bogotá (EEP), according to calculations from García Sánchez is 2.9 (García Sánchez
2001, p.211).
Finally, the Mayor of Bogotá has always been a man, and the women that have participated
in the elections did not have any chances of wining. Sonia Durán de Infante substituted for
Mayor Juan Martín Caicedo for few months, when no one wanted to be associated with that
administration. She was placed in jail and later proven innocent.
8.2.3.2 Council elections Until 1970, the City Council was part of the political bargain
established between the liberal and conservatives in the 1958 National Front. In consequence, the
16 “elected” councilors and their substitutes had to be evenly distributed between the two parties
(PROPÚBLICOS 1984). The main changes since 1972 have been the increase in the number of
councilors, in line with the city’s growing population, the introduction of free elections in 1974
(Gilbert and Dávila 2002, p.33), the redefinition of functions introduced by the EOB in 1993,
and the extension of the councilors’ period in office from two to three years in 1994.
The New Constitution established that the number of councilors in the city had to be
proportionate to the city’s population. Article 9 of the EOB established the election of one
council member for each 150,000 inhabitants or fractions higher than 75,000. Consequently, the
city increased its number of councilors from 20 in 1991, to 28 in 1992, 35 in 1994, and 40 in
1997 (Pizarro Leongómez, Villarraga S., and Gutiérrez Sanín 1996; Instituto para el Desarrollo
de la Democracia Luis Carlos Galán 2001, V.1).
A study, intended at evaluating the impact of the institutional reform in the city, concluded
that before 1991, Bogotá’s Council was tied to regional and national political networks; while
after 1992, it has increasingly relied on smaller networks, closer to the localities in the city.
According to the author the decentralization reform, it changed the profile of the city’s politics
from the “politics of notables” to the “politics of plebeian” (García Sánchez 2001). The author
refers to the fact that before 1992, those heading the electoral lists in Bogotá were notables that
lent their name to give some prestige to lesser known politicians; the New Constitution banned
the heading of several electoral lists by the same person, forcing the notables to choose were they
wanted to put their name.
In addition to becoming more localized, it is said that the EOB favored the executive over the
legislative when redefining functions in the city. The result is a Council with a reduced capacity

225
to access public resources, and therefore to maintain its clienteles. One might expect that these
assertions would be reflected in the electoral behavior of the Bogotanos. Table 49 presents a
summary of the Council elections from 1988 to 2000.
Table 49: Participation in Council Elections 1988-2000
Participation Abstention
Year Number of seats Total votes (%) (%)
1988-1990 20 907494 57.6 42.4
1990-1992 20 847290 44.4 55.6
1992-1994 28 584732 26.3 73.66
1995-1997 35 741073 28.8 71.21
1998-2000 40 1274831 41.3 58.68
Source: Data from ILCG (2001) The increase in abstention appears to confirm that the Bogotanos were not as interested in the
Council after 1992 as before; nevertheless, this phenomenon went beyond the city council. As
illustrated by Table 55 the level of abstention is very similar to the mayoral elections. It is useful
to remember though that during the years after the New Constitution, there was a significant
increase in political violence.
The lack of interest in the elections is interpreted by many as a confirmation of the low
credibility of the political system. For years, people participated in regional and national
elections without having real choices due to the National Front. Some suggest that this is the
reason why the institutional reform have had no effect on the political composition of the
Council, and that what had happened is that the traditional bipartisanism only reshaped itself in
order to regain control (García Sánchez 2001; Pizarro Leongómez 2001).
In order to asses this argument, table 50 presents the distribution of seats and political
participation percentage in the Council from 1988 to 2000.

226
Table 50: Political composition of the Council, 1988-2000
Legislature
1988-1989 1990-1991 1992-993 1995-1997 1998-2000 Political Affiliation Seats % seats % seats % seats % seats %
Liberal 9 45 11 55 16 57.1 18 51.4 19 47.5
Conservative 10 50 7 35 7 25 11 31.4 12 30
Others 0 0 0 0 0 0 1 2.86 3 7.5
Civic 0 0 0 0 0 0 0 0 0 0
Left 1 5 2 10 1 3.57 1 2.86 1 2.5
Christians 0 0 0 0 2 7.14 0 0 3 7.5
Anapo142 0 0 0 0 0 0 1 2.86 0 0
Coalitions 0 0 0 0 0 0 1 2.86 2 5
Indigenous 0 0 0 0 1 3.57 1 2.86 0 0
Meta-politic 0 0 0 0 1 3.57 1 2.86 0 0 Sources: Data from ILCG (2001) and Registrars Office.
The Liberal party retained control in the Council and the Conservative party continued its
decreasing trend, although it is still the second political force; overall, the Council continued to
be bipartisan. Nevertheless, it is important to notice the appearance of new and significant
political forces in the Council, if not in quantity of representation, certainly in quality.
In 1992, the indigenous movement obtained one seat; the Christians obtained two seats in
1992 and three in 1998, showing more promise than any other emerging force. Figure 38
illustrates the emergence of new forces in the Council.
0
10
20
30
40
50
60
1988-90 1990-92 1992-94 1995-97 1998-00
% p
artic
ipat
ion
in C
ounc
il
Liberal Conservative Others Cívic Left
Christians Anapo Coalitions Indigenous Metapolitic Sourrce: data from Data from ILCG (2001) and Registrars Office
Figure 38: Percentage participation in the City Council by political affiliation
142 Alianza Nacional Popular, a party affiliated with the inheritance of General Gustavo Rojas Pinilla.

227
It is too early to determine if the emerging political forces will survive or even grow; what is
indeed undeniable is the changes in the pattern from before and after the reform. Between the
1990 and the 1992 elections, the number of representatives from political forces other that the
two traditional parties almost doubled, rising from 10 percent to 17.86 percent, as illustrated by
Figure 39.
0.00
20.00
40.00
60.00
80.00
100.00
1988-90 1990-92 1992-94 1995-97 1998-00
(%)
Liberal and Conservative parties (%) Other Parties (%)
Source: Data from ILCG (2001) and Registrars Office
Figure 39: The relationship between bipartisanism and other parties, 1988-2000
A third argument concerning the impact of the reform on electoral behavior is that the
loosening of the requirements for registering a party, and handling endorsements, introduced by
the New Constitution, multiplied the number of lists competing for a seat at the Council, deeply
deteriorating their capacity for representation (Pizarro Leongómez 2002, 2001).
An alternative interpretation states that the increase in the number of lists also proves that,
despite the prevalence of bipartisanism, there are emerging political forces that are in fact
reshaping the traditional political practices; the two traditional parties have had to learn and
accommodate to these new forces (Gutiérrez 1998). In summary, some interpret the
fragmentation of the traditional parties as their strategy for survival, while others see it as a
deliberate strategy.
Table 51 presents the number of lists competing at the City Council elections by political
affiliation, figure 40 illustrates the distribution.

228
Table 51: Number of electoral lists by political affiliation, Council 1988-2000
Political Affiliation 1988-1990 1990-1992 1992-1994 1995-1997 1998-2000 totalLiberal 22 37 60 77 143 339Conservative 19 21 20 25 40 125Others 15 12 37 4 36 104Civic 0 2 6 4 18 30Left 2 2 9 4 6 23Christians 0 2 5 5 6 18Anapo 0 1 0 2 1 4Coalitions 0 1 0 1 5 7Indigenous 0 0 3 2 4 9Meta-politic 1 1 1 1 1 5
Total 59 79 141 125 260 664
0
20
40
60
80
100
120
140
160
1988-90 1990-92 1992-94 1995-97 1998-00Liberal Conservative Others Civic LeftChristians Anapo Coalitions Indigenous Metapolitic
Source: Data from ILCG (2001) and Registrars Office.
Figure 40: Number of electoral list by political affiliation, Council 1988-2000
The Liberal party presents the highest increase in the number of lists at each election between
1988 and 2000, while the other forces are not so consistent. The data provides evidence that
supports any of the aforementioned arguments, which in fact are not mutually exclusive. There is
more fragmentation, and each councilor represents fewer constituents than before; yet, the
presence of new forces necessarily introduces changes in the system. In addition, the emerging
forces represent underrepresented groups, which add significance to their participation, despite
their limited quantity.

229
Another problem, attributed to the increase number of lists participating in the elections, is
that a high number of voters that do not vote; the electorate fluctuates among the many offers of
what Pizarro called “electoral micro enterprises” (Pizarro Leongómez 2001, p.360). The
emergence of many new entrepreneurs deepened the already troublesome fragmentation of the
political parties (see, Gutiérrez Sanín 2001; Boudon 2000); in addition, the sustainability of the
new political forces is very low. Therefore, many say that the efficiency of the electoral process,
in terms of pairing the electorate’s preferences with representative Councilors is less than before
(García Sánchez 2001, p.190). The efficiency of the electoral process, evaluated by the relation
between the seats won and the number of lists registered, is presented in table 52.
Table 52: Electoral Efficiency of Political Parties and Movements, 1988-2000
1988-90 1990-1992 1992-1994 1995-1997 1997-2000
Political party or movement
Seats /lists Effic.%
Seats /lists Effic.%
Seats /lists Effic.%
Seats /lists Effic.%
Seats /lists Effic.%
Liberal 9/22 0.41 11/37 0.30 16/60 0.27 18/77 0.23 19/143 0.13
Conservative 10/19 0.53 7/21 0.33 7/20 0.35 11/25 0.44 12/40 0.30
Others 0/15 0.00 0/12 0.00 0/37 0.00 1/4 0.25 3/36 0.08
Civic nl 0/2 0.00 0/6 0.00 0/4 0.00 0/18 0.00
Left 1/2 0.50 2/2 1.00 1/9 0.11 1/4 0.25 1/6 0.17
Christians nl 0/2 0.00 2/5 0.40 0/5 0.00 3/6 0.50
Anapo nl 0/1 0.00 Nl 1/2 0.50 0/1 0.00
Coalitions nl 0/1 0.00 Nl 1/1 1.00 2/5 0.40
Indigenous nl nl 1/3 0.33 1/2 0.50 0/4 0.00
Metapolitic 0/1 0.00 0/1 0.00 1/1 1.00 1/1 1.00 0/1 0.00
Source: Data from ILCG (2001) and Registrars Office nl: not registered any list
Table 52 suggests that the number of lists registered is not necessarily directed related to an
increase in the number of seats obtained. That is the case of the Leftist party, which increased its
efficiency by decreasing the number of lists; the Meta-politic movement, which has always
participated with only one list, also increased its relative efficiency. On the other hand, although
the Liberal party maintains its majority in the City Council, it has been steadily loosing
efficiency. An important observation is the inscription of three lists from the indigenous in 1994;
before, there is no official political representation of the indigenous population living in Bogotá.
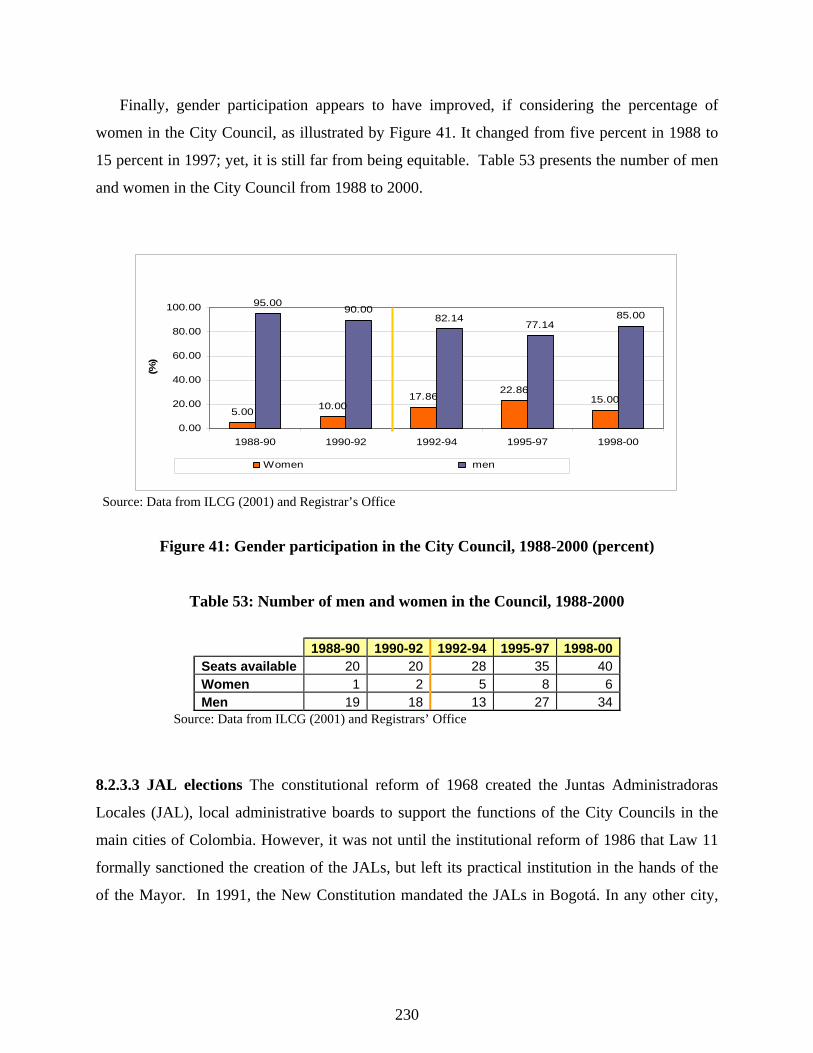
230
Finally, gender participation appears to have improved, if considering the percentage of
women in the City Council, as illustrated by Figure 41. It changed from five percent in 1988 to
15 percent in 1997; yet, it is still far from being equitable. Table 53 presents the number of men
and women in the City Council from 1988 to 2000.
5.00 10.0017.86
22.8615.00
95.0090.00
82.1477.14
85.00
0.00
20.00
40.00
60.00
80.00
100.00
1988-90 1990-92 1992-94 1995-97 1998-00
(%)
Women men
Source: Data from ILCG (2001) and Registrar’s Office
Figure 41: Gender participation in the City Council, 1988-2000 (percent)
Table 53: Number of men and women in the Council, 1988-2000
1988-90 1990-92 1992-94 1995-97 1998-00 Seats available 20 20 28 35 40 Women 1 2 5 8 6 Men 19 18 13 27 34
Source: Data from ILCG (2001) and Registrars’ Office
8.2.3.3 JAL elections The constitutional reform of 1968 created the Juntas Administradoras
Locales (JAL), local administrative boards to support the functions of the City Councils in the
main cities of Colombia. However, it was not until the institutional reform of 1986 that Law 11
formally sanctioned the creation of the JALs, but left its practical institution in the hands of the
of the Mayor. In 1991, the New Constitution mandated the JALs in Bogotá. In any other city,

231
this creation of the JAL was left to the discretion of the City Council (García Sánchez 2003,
p.62).
The JAL is the most important formal institution created for promoting political
decentralization; it was created as a layer of representation between the central government and
the neighborhood, in order to enhance the political capacity of the localities and their relationship
with the city as a whole. Therefore, the creation of the JALs was a strategy for both
decentralization and democratization. Many claim that the JALs significantly enhanced the
system of governance in the city, creating a clear shift after the reform. The examining of the
local elections gives some evidence for testing this claim.
During the period covered by this study, Bogotá held three local elections, in 1992, 1994, and
1997; in each occasion, the Bogotanos elected 182 ediles. The first and most salient aspect of the
local elections is the level of dispersion among the interests represented, from lists representing
traditional parties, to those representing neighborhoods, age groups, religious groups, and many
others. The result was a very high number of electoral lists, representing a wide political
spectrum; Table 54 presents the number of list registered in each election by political party or
affiliation.
Table 54: Number of list participating in local elections: 1992, 1994, and 1997
Political party or affiliation 1992 1994 1997
Liberal 452 932 1336 Conservative 203 363 430 Others 267 89 254 Civic 230 47 125 Left 66 48 52 Christian 77 40 82 Anapo 0 20 14 Coaliciones 4 0 32 Indigenous 3 26 50 Meta-politic 17 14 18 TOTAL 1319 1579 2393 Source: Data from ILCG (2001) and Registrars’ Office
The number of lists has two main interpretations; first, the opening of this new political space
attracted diverse political forces, whether they presented themselves as political or not, and
therefore increased the inclusiveness of the system. Alternatively, the indiscriminate

232
participation reflects the existence of a “mercenary” political culture, which supports any
candidate in search of capitalizing on this new space.
It is my contention that these interpretations are not mutually exclusive. There are interest
groups that found representation for the first time in the local elections, and there are certainly
those that tried to enter this political space to advance traditional political agendas. The existence
of divergent interests is not the problem; the problem is a lack of capacity of the system to
provide mechanisms for debating and building consensus on the public good.
How did the electorate respond? The level of participation in the local elections presents a
very similar pattern to the elections for both Mayor and Council; however, it is concerning is the
extremely high level of abstention. Interestingly enough, the increase in participation in local
elections is higher than the increase in the other two.
The JAL appear to have enough legitimacy if evaluated by the electorate response. The
review of participation by locality illustrates the increased interest in the JAL, which grew at a
higher rate than the mayoral and councilor elections.
To illustrate this tendency, tables 55 presents a comparison of the level of abstention in the
elections for Mayor, City Council and JALs in 1992, 1994 and 1997. Table 56 presents the level
of participation and abstentions by locality.
Table 55: Level of abstention in Bogotá
Elections 1992 1994 1997 Mayoral 73.75% 70.23% 57.27% Council 73.66% 72.00% 58.90% JAL 71.11% 67.38% 49.66% Electoral potential 1,917,673 2,182,574 2,449,104
Source: Data from ILCG (2001) and Registrars’ Office

233
Table 56: Electoral participation in the localities
1992 1994 1997
Locality Participation (%)
Abstention (%)
Participation (%)
Abstention (%)
Participation (%)
Abstention (%)
Antonio Nariño 30.46 69.54 37.11 62.89 45.60 54.40 Barrios Unidos 31.05 68.95 33.58 66.42 50.85 49.15 Bosa 23.05 76.95 28.99 71.01 46.72 53.28 Chapinero 36.12 63.88 34.32 65.68 51.72 48.28 Ciudad Bolívar 29.30 70.70 31.87 68.13 50.68 49.32 Engativá 27.12 72.88 31.71 68.29 51.67 48.33 Fontibón 26.34 73.66 32.63 67.37 50.39 49.61 Kennedy 28.55 71.45 32.54 67.46 51.29 48.71 La Candelaria 27.90 72.10 32.76 67.24 55.06 44.94 Los Mártires 30.48 69.52 37.93 62.07 48.62 51.38 Puente Aranda 28.94 71.06 34.50 65.50 52.51 47.49 Rafael Uribe 27.88 72.12 28.72 71.28 48.55 51.45 San Cristobal 28.24 71.76 33.99 66.01 48.43 51.57 Santafé 27.53 72.47 32.49 67.51 43.55 56.45 Suba 29.38 70.62 33.09 66.91 52.92 47.08 Sumapaz 55.93 44.07 63.04 36.96 69.36 30.64 Teusaquillo 32.88 67.12 34.96 65.04 50.26 49.74 Tunjuelito 23.42 76.58 28.16 71.84 43.51 56.49 Usaquén 31.30 68.70 30.53 69.47 52.01 47.99 Usme 27.58 72.42 34.93 65.07 42.51 57.49 Total 30.17 69.83 34.39 65.61 50.31 49.69
Source: Data from ILCG (2001) and Registrar’s Office
The efficiency of the political forces participating in the local elections, calculated by the
number of candidates that are elected in relation to the number of lists registered, deteriorated.
Of the 5,291 lists registered in the three elections, only 552 were elected, representing only 10.43
percent. In other words, 76.28 percent of the votes were useless. Table 57 presents the level of
efficiency.
Table 57: Electoral efficiency JAL elections
Year Number of lists Number of seats Efficiency (%)
1992 1,319 184 13.95
1994 1,579 184 11.65
1997 2,393 184 7.69
Source: Data from ILCG (2001) and Registrars’ Office

234
The level of fragmentation affects not only the traditional parties but also the emerging
forces, which indicates that this feature of the Colombian political culture is mirrored at the local
level. Table 58 presents the level of efficiency by political party.
Table 58: Political efficiency by political force in local elections
1992 1994 1997 Political Affiliation List Seats Efficiency Lists Seats Efficciency Lists Seats Efficiency
Liberal 452 71 15.71% 932 101 10.84% 1336 85 6.36%
Conservative 203 35 17.24% 363 43 11.85% 430 40 9.30%
Others 267 24 8.99% 89 19 21.35% 254 35 13.78%
Civic 230 26 11.30% 47 8 17.02% 125 12 9.60%
Left 66 15 22.73% 48 8 16.67% 52 5 9.62%
Christian 77 6 7.79% 40 1 2.50% 82 5 6.10%
Anapo 0 0 20 1 5.00% 14 0 0.00%
Coalitions 4 4 100.00% 0 0 32 2
Indigenous 3 0 0.00% 26 3 11.54% 50 0 0.00%
Meta-politic 17 3 17.65% 14 0 0.00% 18 0 0.00%Source: Data from ILCG (2001) and Registrar’s Office
The lack of aggregation represents an advantage, at least initially, for the two traditional
parties, as they have the expertise for reaching the electorate. Table 59 presents the composition
of the JALs by political affiliation.
Table 59: JAL composition by political affiliation Politicl Affiliation 1992 1994 1997
Liberal 38.59 54.89 46.20 Conservative 19.02 23.37 21.74
Others 13.04 10.33 19.02 Civic 14.13 4.35 6.52 Left 8.15 4.35 2.72
Christian 3.26 0.54 2.72 Anapo 0.00 0.54 0.00
Coalitions 2.17 0.00 1.09 Indigenous 0.00 1.63 0.00 Meta-politic 1.63 0.00 0.00
Source: Data from ILCG (2001) and Registrars Office

235
Evidence points to the fact that traditional parties were able to canalize the sub-local
electorate. Figure42 illustrates the political composition of the JAL.
0
20
40
60
1992 1994 1997
(%)
Liberales Conservadores Otros CívicosIzquierda Cristianos Anapo CoalicionesIndigenas Metapoliticos
Source: Data from ILCG (2001) and Registrar’s Office
Figure 42: Political composition JAL
A study conducted on the 1997 elections, showed there is not yet enough power on the side
of new movements to overcome the control mechanisms that were in place before the reform;
even though there is freedom of vote there is no freedom of election (Medellín 1998). Because of
that, bipartisanism is also the political dominant force at the local level. Figure 43 illustrates this
trend.
0
20
40
60
80
1992 1994 1997
(%)
Bipartisanism Others
Source: Data from ILCG (2001) and Registrars Office
Figure 43: Bipartisanism vs. other political forces at the JAL

236
The dominance of the bipartisan forces is not surprising, and it is too early to predict if
bipartisanism will gain complete control at the local level and regain control over the City
Council, or if the city will start developing a multi-partisan system. Another possibility is that the
internal differences within the traditional parties might produce, as it did in the past, the
emergence of qualitatively different dissident groups.
Finally, the introduction of local elections have enlivened local politics. People participate
more using both new and old mechanisms of participation. The local level is also more
important than before because now it is the base for building clienteles that will be mobilized not
only for the local, but also for regional and national elections. As mentioned by Gutiérrez Sanín,
clientelism is but an intermediation system in place that has functionalities (Gutiérrez Sanín
1998, 2001, 2001). Despite its well-known faults, clientelism it has also been a strategy for the
redistribution of political power.
8.2.4 Final remarks on participation Bogotá has, as a result of the decentralization reform promoted by the New Constitution of 1991,
more laws and mechanisms promoting participation than before. There are also embryonic
alliances between the State, the private sector and the third sector, that fit into the emerging
patterns described by the new governance paradigm. Traditionally excluded groups such as
religious, minorities’, gender groups have begun to appear on the city’s political scene.
Nevertheless, what one might question is the quality of participation. Are the new laws,
mechanisms, alliances, and interests groups having a real impact on the system of governance in
the city; is the distribution of power within the system changing?
In addition, the more people who participate, the greater their expectations and demands for
closing the gap between their aspirations and their achievements. Because of that, unless people
perceive that the investment of trust and time in the system produced identifiable results,
participation would only be another shell without content, and the result, in the political life of
the city, would be the opposite as desired.
In Bogotá, it appears that participation was creating a positive response among its citizens. A
research study on the impact of participation found that Bogotá was the only municipality in the

237
country in which people perceived that participation has had a positive impact in the reduction of
corruption and clientelism (Velásquez C. and González R. 2003, 347.)
In addition, it is expected that participation improved the city’s political capacity, understood
as the capacity to negotiate and build consensus about complex, conflicting and sometimes
divergent interests and issues. According to the same study, there is evidence of the advancement
of collective over personal interests (Velásquez C. and González R. 2003, p.343).
Certainly, there is more to say about the city after 1991, there have been two processes of
participatory planning, three elections of local representatives, the emergence of new political
forces in every instance of local government, and there is more knowledge about public issues
than before. Citizens recognize the institutional effort but doubt its consistency; the city’s
administrations have supported participation but it has not been a priority for any of them. A
study on participation in the city found that 59.2 percent of the Bogotanos perceived that the
support from the central administration for participation was irregular (Velásquez C. 2003,
p.331).
The final balance, according to the same study, is an uneasy combination of satisfaction and
disenchantment. The satisfaction is for all that has been accomplished, gaining consciousness
about collective issues, better knowledge of the city, and interactions with diverse groups and
people. The disenchantment is for what has not been accomplished, for the unevenness of the
process, for the gap between the offer of participation and the actual results achieved by doing
so, and for the lack of capacity of all players for building consensus (Velásquez C. 2003, pp.335-
336).
Participation increased significantly in the city; nevertheless, it was designed and proposed
through a top-down approach, which corresponds to a more technical than empowerment-
oriented conceptualization of participation (Guijt and Shah 1998). The proposal was not
discussed with the citizens, and did not search for, recognize, or celebrate forms and structures of
organization and participation that already existed in the localities. In addition, the expectations
of those promoting the reform often blinded them from recognizing the needs, values, ideals, and
potential of the people. The political capital accumulated through years of participation was not
recognized, nor invested.
238
8.3 EQUITY
“Distributions-whether of goods and services, wealth and income, health and illness, or
opportunity and disadvantage- are at the heart of public policy controversies” (Stone 1997,
p.39), and one may add at the heart of public policy practices. How a society manages
distributions determines not only its level of equity, but also its political and social sustainability.
Theoretically, in a democracy, the sharing of power leads to equity in the access to and use of
resources.
Equity is one of the basic principles of the Global Campaign on Urban Governance, which
aims to eradicate poverty through improved urban governance (UN-HABITAT 2000a, p.13).
“Through good governance, citizens are provided with the platform which will allow them to use
their talents to the fullest to improve their social and economic conditions” (HABITAT 2000,
p.13). The campaign is based on the assumption that a society’s well-being depends on ensuring
that all its members feel that they have a stake in it and do not feel excluded from mainstream
society. Equitable cities should provide everyone with equal access to decision-making processes
and the basic necessities of urban life - nutrition, education, employment, and shelter (UN-
HABITAT 2000; Hall and Pfeiffer 2000). Accordingly, equity is a key variable of good
governance, and decentralization a key strategy in the promotion of equity (UN-HABITAT
2000a, p.5-15).
This section reviews a series of indicators that measure the level of equity, in order to
evaluate the impact of the decentralization reform in Bogotá. The definition for equity adopted
for this study is that equity refers to the equal access to opportunities for improving and
maintaining well-being in a society, but especially for those most vulnerable.
The indicators are:
- Percent reduction in the population living below the poverty line
- Reduction in income distribution
- Improvement in access to employment/reduced participation in the informal sector
- Amount of money directed towards social investment
- Percent increase in service coverage
- Percent increase in the homeowner population or access to housing programs
- Percent reduction in the number of street children and homeless

239
- Budget and programs for the displaced - Existence (or not) of information on differential situation and needs of women and men;
gender perspective143
- Percent and/or total increase in women’s representation in government and boards
- Explicit or implicit utilization of equity as a criteria for prioritizing or investing
8.3.1 Poverty and Inequality In 1985, based on the UBN index, Bogotá had the lowest percentage of poor in the country, 23.5
percent; yet, it had the highest absolute number of poor, 928,414 people living with unsatisfied
basic needs (UBN) (Yepes A. et al. 1989, p.19). By the year 2000, 804,136 people lived with
UBN, representing 12.4 percent of the city’s population (SHD 2003a, p.15). Poverty in the city,
if measured by the UBN index, shows a steady improvement; nevertheless, other indexes of
poverty show a different result. That is the reason why, in order to evaluate the changes in
poverty in Bogotá, and considering the limitations of the information available, three different
methods of measuring poverty were reviewed: the unsatisfied basic needs method (UBN), the
poverty line method (PL), and the human development index method (HDI).
The UBN method measures material well-being in its multiple dimensions, such as
nutritional and health status, life expectancy, education and housing conditions; those who have
two or more UBN are considered to be in condition of misery (Fundación Corona 2003, p.5).
The PL method is based on the minimum per capita income required to afford the canasta
familiar, family basket; people who are below the poverty line are considered to be at risk of not
surviving (Fresneda B., Sarmiento Anzola, and Muñoz 1991, p.21). As a reference, in 1985, the
calculated income for the PL was $ 3,006.3 Colombian pesos, in the year 2001 it was $217,327
Colombian pesos (Fresneda B., Sarmiento Anzola, and Muñoz 1991, p.278). For the year 2001,
those having an income of $75,065 Colombian pesos (around 40 US dollars) or less were
considered to be under the poverty line, (SHD 2003a, p.15).
Finally, the human development Index (HDI) is a composite index of poverty that measures
adult literacy, education, life expectancy, and other factors, which has been used since 1993 by
143 Just the fact of including a mention to gender was considered an indication of improvement, as gender policies are very underdeveloped in most institutions in Bogotá.

240
the United Nations Development Programme. In 1989, the UNDP, in collaboration with
UNICEF, the DNP, and the mayorship of Bogotá, published a study on poverty in Bogotá, which
used the UBN index144 and the census data from 1985. According to the study, in 1985, 23.5
percent of Bogotá’s population, or 928,414 people, lived with unsatisfied basic needs (UBN),
and 6.2 percent of Bogotá’s population, 245,315 people, lived in “misery” conditions. Misery
was defined as living in overcrowded units, with more than 3 people per room, and having high
economic dependence, more than three dependants per employed person (Yepes A. et al. 1989,
p.20).
In 1993, 17.2 percent of Bogotá’s population lived with UBN. This number decreased to
14.5 percent in 1999 and 12.4 percent in 2000, but had increased to 13.4 percent by 2001 (SHD
2003a, p.15). A study by Bogotá Como Vamos, showed that there are important differences in
the level of UBN within the city; six localities presented a higher index than the city’s average,
Ciudad Bolivar, Usme, San Cristobal, Bosa, Santa Fé, and Rafael Uribe Uribe (Fundación
Corona 2003). Figure 44, presents the trend in poverty in Bogotá according to the UBN index.
0
5
10
15
20
25
1985
1988
1991
1992
1993
1994
1995
1996
1997
1998
1999
2000
year
% p
opul
atio
n
UBN 1985- 2000
Source: data from (Yepes A. et al. 1989; Fundación Corona 2003; SHD 2003)
Figure 44: Trend of poverty by UBN in Bogotá, 1985-2000
144 Five necessities were assessed in this study: quality of housing, access to water and sanitation, number of people living in a housing unit, economic dependency, and school-age children attending school. The data on Bogotá’s population was provided by the census of 1985 (Yepes A. et al. 1989).

241
Poverty in Bogotá measured by the number of people living in or under the poverty line (PL),
increased significantly in the 1990s. The first reference available is dated in 1991, when Bogotá
had 37.4 percent of its population living in the poverty line; in 1993, it increased to 42.4 percent
and in the same year, 7.7 percent of the population lived under the poverty line. In 2000, 49.6
percent of Bogotá’s population lived in the poverty line and 14.9 percent under the poverty line
(SHD 2003a, p.15). Figure 45 illustrates the percentage of people living in poverty, and bellow
the poverty line, from 1991 to 2000.
37.40
46.5042.40 40.50 40.00 37.83
32.4036.60
46.2649.60
10.907.70 7.40 7.60 7.54 6.10 7.80
11.30 13.18 14.90
0
10
20
30
40
50
60
1991
1992
1993
1994
1995
1996
1997
1998
1999
2000
(%)
Poverty Line Below Poverty LineLinear (Poverty Line) Linear (Below Poverty Line)
Source: data from (Yepes A. et al. 1989; Fundación Corona 2003; SHD 2003)
Figure 45: Trend in poverty by PL and UPL, 1991-2000
This trend shows the opposite direction that is evident when poverty is measured by the UBN
index. The inexistence of data from before does not permit us to examine historical trends, but
the increase in poverty (as measured by income) supports the conclusions from measuring other
indicators such as inequality and employment.
Finally, in regards to poverty measured by the HDI, between 1991 and 1996, Bogotá
presented a steady improvement, from 0.784 to 0.836; between 1996 and 1999, it deteriorated,
from 0.836 to 0.811, and it had a small recovery in 2000, when it rose to 0.813 (Fundación
Corona 2003, p.7; SHD 2003a, p.15). Because the HDI was developed in 1991, there is no data
available from before this year.

242
Figure 46 illustrates the poverty trend according to the HDI.
HDI 1991-2000
0.740
0.760
0.780
0.800
0.820
0.840
1991
1992
1993
1994
1995
1996
1997
1998
1999
2000
year
Source: data from (Yepes A. et al. 1989; Fundación Corona 2003; SHD 2003)
Figure 46: Trend in poverty by HDI, 1991-2000
All poverty indexes except the actual poverty line (PL) showed an improvement in the equity
of the city, which is consistent with evidence from examining the process of decentralization.
The city has improved its infrastructure and offers better services coverage; Table 60summarizes
the indexes reviewed.
Table 60: Poverty in Bogotá, 1985-2000
% Population Poverty Line % Population UPL HDI UBN
1985 23.45 1988 1991 37.40 10.90 0.784 19.51 1992 46.50 7.70 0.789 1993 42.40 7.40 0.798 17.30 1994 40.50 7.60 0.817 1995 40.00 7.54 0.820 1996 37.83 6.10 0.836 12.17 1997 32.40 7.80 0.830 12.96 1998 36.60 11.30 0.826 12.54 1999 46.26 13.18 0.811 12.44 2000 49.60 14.90 0.813 12.40
Source: (Fundación Corona 2003; SHD 2003; Fresneda B., Sarmiento Anzola, and Muñoz 1991) DANE: ENH.

243
An important caveat for understanding the relevance of the income-related indexes is that
most of the city’s population depends on earnings from a job; any deterioration in income
directly reflects changes in the labor market and/or in the distribution system in the city. The
security and quality of income has greatly deteriorated, which has been aggravated by the
increase in the income distribution gap. When measured by income distribution, Bogotá is the
most unequal city in Colombia; a report from 2003 stated that 80 percent of the employed
population earned less than two minimum wages, and the wage gap has continued to increase
(Cámara de Comercio de Bogotá 2003, p.12).
A common measure of income distribution is the GINI coefficient, which calculates the
equality income by dividing the total income in the city among the working population. The
GINI’s scale goes from zero (0) for a prefect distribution to one (1), meaning the total
concentration of income in just one person. Bogotá shows an increasing level of concentration of
income, which means that less people are getting access to goods and services. Table 61 shows
the GINI index for the city and the country from 1988 to 2000
Table 61: GINI index, Bogotá and Colombia, 1988-2000
GINI Index Year
Bogotá Colombia 1988 0.435 0.55 1991 0.453 0.55 1992 0.432 0.56 1993 0.484 0.56 1994 0.416 0.56 1995 0.510 0.55 1996 0.508 0.54 1997 0.519 0.56 1998 0.559 0.563 1999 0.564 0.56 2000 0.561 0.56
Source: Cuadernos de Ciudad, Serie Equidad y Bienestar No.2 (SHD 2003a)
The increasingly disproportionate distribution of income is confirmed by examining the
city’s quintiles distribution. By 1985, the city’s poorest quintile earned 3.0 percent of the city’s
income, while 51.4 percent was earned by the richest quintile; by 2000, the poorest quintile’s
share was reduced to 2.3 percent, while the richest quintile’s increased to 63.5 percent. What the

244
quintile distribution shows is that those earning the highest income get approximately 64 times
what is paid to those with the lowest income (Fundación Corona 2003). Table 62 and Figure 47
illustrate the deterioration in the distribution of income from 1985 to 2000.
Table 62: Distribution of Income by Quintile in Bogotá, 1985-2000
Q1 (20% lower) Q2 Q3 Q4 Q5
(20% higher)
1985 3.0 6.7 11.4 20.9 51.4 1986 3.6 7.6 12.5 22.2 51.5 1987 3.4 7.2 12.2 22.0 52.0 1988 3.5 7.2 11.8 21.3 50.7 1989 3.4 7.0 11.4 20.3 49.0 1990 3.6 7.4 12.1 21.5 51.3 1991 3.0 6.4 10.9 19.9 49.8 1992 3.4 7.1 11.8 21.3 51.4 1993 3.1 6.5 10.9 19.1 45.3 1994 n.d n.d n.d n.d n.d 1995 n.d n.d n.d n.d n.d 1996 n.d n.d n.d n.d n.d 1997 3.7 7.5 11.7 19.1 58.1 1998 n.d n.d n.d n.d n.d 1999 2.6 6.1 10.4 18.8 62.2 2000 2.3 5.8 10.1 18.3 63.5
Source: data from DAPD. n.d. = non data available
0
10
20
30
40
50
60
70
1985
1986
1987
1988
1989
1990
1991
1992
1993
1997
1999
2000
(%)
Q1 (20% lowest) Q2 Q3 Q4 Q5 (20% highest)
Source: data from DAPD
Figure 47: Quintile income distribution in Bogotá, 1985-2000

245
The data indicate a deterioration in the income of the 3rd. and 4th quintiles, corresponding to
the segment of population that earns around 2 and 5 minimum salaries, which is a signal of the
pauperization of the city’s middle class (SHD 2003, p.10). Several analysts attribute the increase
in poverty, measured by PL, to the economic recession of 1998 and 1999 (Fainboim and Angulo
2003, p.2); nevertheless, when observing the data, this statement is not confirmed, as illustrated
by Figure 48.
02,000,0004,000,0006,000,0008,000,000
10,000,00012,000,00014,000,00016,000,00018,000,00020,000,000
19851986
19871988
19891990
19911992
19931994
19951996
19971998
19992000
GD
P (m
illio
n pe
sos
1994
)
0
10
20
30
40
50
60
% P
opul
atio
n
Real GDP Colombian Pesos 1994
% PL Population
% UPL Population % UBN population Source: Cuadernos de Ciudad, Serie Equidad y Bienestar No.2 (SHD 2003a), DANE. Cálculos SHD.
Figure 48: Relationship between GDP and poverty in Bogotá, 1985-2000
As illustrated by Figure 48, the relationship between economic growth and poverty is directly
proportional only when poverty is measured by the UBN index; if measured by the PL index, it
is not consistent. From 1997 on, the GDP shows a slow but steady increase and so do the
percentage population in PL and UPL; it would be necessary to trace the trend from 2000 to
2005 to see how it has evolved. Finally, as poverty and inequality in Bogotá are closely related to
the level and quality of the available employment opportunities; it is necessary to review what
has happened in the labor market from the 1980s to 2000.

246
8.3.2 Employment, unemployment and “el rebusque”145
One of the key determinants of the level of poverty in Bogotá, as mentioned before, is the
increase in the level of unemployment and the deterioration in the quality of the available
employment. Several factors influenced the increase in the population seeking employment.
First, the age composition of the city’s population changed as more people reached the legal
working age. Other factors include the increase of women participation in the labor market, the
need to have more family members in the labor market to cope with the cost of living, and
finally, the increase in the number of IDPs, desplazados, arriving in the city.
The working-age population (WAP) 146, has steadily risen from representing 73.1 percent of
the total population in 1976 to 77.7 percent in 1999. Table 63 presents the increase in the WAP
from 1980 to 1999.
Table 63: Working age population growth in Bogotá, 1980-1999
Year Total Population (TP) WAP WAP% of TP Growth Rate TP WAP
1980 3,545,909 2,589,223 73 3.2 3.2 1986 4,275,799 3,230,800 75.6 3.1 3.7 1991 4,775,281 3,588,749 75.2 2.2 2.1 1996 5,867,697 4,574,940 78 4.1 4.9 1999 6,294,072 4,891,183 77.7 2.3 2.2 Source: (Gutiérrez, Mejía, and Díaz 2000)
The increase in the working age population has been aggravated by the arrival into the city of
immigrants and desplazados (IDP). As mentioned before, it is estimated that between 1985 and
2002, 480,000 IDP arrived in Bogotá, which represents 23 percent of the total displaced
population in Colombia. Finally, the expansion of Bogotá’s labor force has also been a
145 Rebusque in Bogotá refers to any informal and usually temporary activity that provides an income. It is derived from the verb BUSCAR (to search) and refers to a desperate indiscriminate search for money. 146 Working Age Population (WAP): Persons twelve years or older Economically Active Population: Persons who are in the population in age of working who are working or looking for work Economically Inactive Population: Those that do not participate in the production of goods and services because they do not need to, they cannot work or are not interested in having a salaried activity. Unemployed: Persons who have looked for work in the last calendar year and are still interested in working, or, and persons who are looking for work for the first time.

247
consequence of the increase in women’s rate of participation in the labor market. Between 1976
and 1999, women’s share of the economically active population (EAP) increased from 37
percent to 48 percent (Maruri 2001, p.27). In addition, women’s global participation rate
(GPR)147 in the employment market grew from 31.3 percent in 1976 to 55.4 percent in 1999;
compared with a GPR for men of 63.5 and 73.7 percent, respectively (Gutiérrez, Mejía, and
Díaz 2000, p.14). Figure 49 illustrates the GPR for men and women from 1976 to 1999.
Source: El mercado laboral de Santa Fe de Bogotá 1976 – 1999 (Gutiérrez, Mejía, and Díaz 2000, p.8)
Figure 49: GPR by gender, 1976-1999
Regarding the participation in the labor market by years of education, the city presents a
similar trend with the country. The economy has changed to favor those more educated. This
could mean that the city has had a change in its productive structure, that more educated people
are willing to take less qualified jobs, or that they city has improved access to education.
Considering Bogotá’s economic profile, the second reason appears most likely. Nevertheless,
Bogotá offers a more balanced access to the job market by years of education than the country,
as illustrated by Figure 50.
147 Global Participation Rate indicates the percentage of a particular segment of the population in the labor market available to those in working age (WAP).
Men Women

248
0102030405060
1976 1980 1986 1991 1996 1999
parti
cipa
tion
%
0-5 years of education 6-10 11 12-15 16 or more
Source: data from SHD, (Gutiérrez, Mejía, and Díaz 2000, p.9)
Figure 50: EAP, participation by years of school, 1976-1999
Employment and economic growth do not show a positive relation as illustrated by figure 51.
-15
-10
-5
0
5
10
15
1986
1987
1988
1989
1990
1991
1992
1993
1994
1995
1996
1997
1998
1999
2000
Employment growth GDP growth
Source: data from SHD, (Gutiérrez, Mejía, and Díaz 2000, p.9)
Figure 51: Employment and GDP growth, 1986-2000
The unemployment rate rose to 20.3 percent in 2000, while the number of individuals
working in the informal sector, rose from 49 percent in 1996 to 57.8 percent in 2000 (Maruri
2001, p.29). Table 64 presents as summary of the labor market behavior in Bogotá from 1986 to
2000

249
Table 64: Bogotá’s labor force structure, 1986-2000
Year Total
Population ( September each year)
Unemployed population
UnemploymentRate (%)
Economic Active
Population
Employed population
EAP - Crude Participation
Rate* (%)
Informal sector
1986 4,191,421 233,923 12.4 1,883,584 1,649,661 44.94
1987 4,248,884 199,377 10.2 1,962,729 1,763,352 46.19
1988 4,292,514 190,935 9.3 2,054,321 1,863,386 47.86 54.90
1989 4,338,729 153,712 7.4 2,075,876 1,922,164 47.85
1990 4,385,363 184,784 8.8 2,091,013 1,906,229 47.68 48
1991 5,045,108 180,072 8.1 2,211,034 2,030,962 43.83
1992 5,203,325 166,472 7.3 2,279,943 2,113,471 43.82 50.60
1993 5,355,980 164,343 7.0 2,342,120 2,177,777 43.73
1994 5,517,421 128,031 4.9 2,602,965 2,474,934 47.18 50.20
1995 5,678,342 170,135 7.6 2,721,053 2,550,918 47.92
1996 5,815,508 290,298 9.1 2,810,212 2,519,914 48.32 48.90
1997 5,956,993 289,331 10.6 2,926,862 2,637,531 49.13
1998 6,112,194 388,753 15.3 2,926,236 2,537,483 47.88 49.70
1999 6,276,428 589,293 16.9 3,104,809 2,515,516 49.47
2000 6,437,842 20.3 57.30
Source: DANE, ENH; La Pobreza en Bogotá - Proyecto Bogotá Como Vamos Unemployment defined as Unemployed population/ EAP
The rate of informal employment in Bogotá grew from 49 percent in 1996 to 57.8 percent in
2000; most of the new jobs in the city, as in the rest of Latin America, were created in the
informal sector. It is estimated that between 1984 and 1988, 62.9 percent of the new
“employment” was provided by the informal sector Figure 52 illustrates unemployment and
participation in the informal sector from 1988 to 2000.

250
54.90
48.0050.60 50.20 48.90 49.70
57.30
12.410.2 9.3 7.4 8.8 8.1 7.3 7.0 4.9
7.6 9.1 10.615.3 16.9
20.3
0
10
20
30
40
50
60
70
1986
1987
1988
1989
1990
1991
1992
1993
1994
1995
1996
1997
1998
1999
2000
(%)
Informal sector UnemploymentRate (%)
Source: data from DANE and La pobreza en Bogotá (Fundación Corona 2003)
Figure 52: Unemployment and participation in the informal sector, 1988-2000
Informality in Bogotá is associated with marginal and quasi-illegal activities, although it has
proven difficult to trace boundaries between illegal and legal activities and therefore between the
formal and informal economy. In Colombia, informality conveys a social status worse than not
being employed, to the extent that there is a word, el rebusque;, which refers to someone that
would do almost anything to get some income (Henao V., Rojas D., and Parra R. 1999;
Secretaría de Hacienda Distrital 2003).
Those working in the informal sector do not have access to the benefits associated with
formal employment. It has been calculated that more than 73 percent of them have no health
insurance, or any other benefit usually accessible to formal employees; and that more than 60
percent of them earn less double the minimum wage (Maldonado and Hurtado 1997, p.136). The
level of informality, from 1988 to 2000, remained relatively steady (Maruri 2001, p.29), as
illustrated by Figure 53.

251
0.00
20.00
40.00
60.00
80.00
100.00%
Informal sector 54.90 48.00 50.60 50.20 48.90 49.70 57.30
1988 1990 1992 1994 1996 1998 2000
Source: Data from DANE, ENH
Figure 53: Bogotá, informal sector 1988, 1992-2000
8.3.3 Social Investment
The well-being of the citizens of Bogotá, as all other people, is influenced by many intervening
variables that do not depend directly on the government of Bogotá, including the money
exchange rate, the global market changes, the decision made by the president, and many others.
Nevertheless, there are other variables that depend directly on the city’s government and that
also have an impact in the quality of life of the citizens; these are what the UNDP named
mezovariables, referring to the government’s choices in regards to social investment (Human
development report 1992), also known as social expenditure.
The amount of public social expenditure (PSE) depends not only on the availability of
resources, but also on the priorities set by a government, which are related to the model of
development it has adopted. In Bogotá, overall public expenditure (TPE) rose by 60 percent,
increasing its share of GDP from 27 to 43 percent, between 1990 and 1997. A number of factors
contributed to the increase in public expenditure, but undoubtedly, the most important of these
was the New Constitution of 1991. The 1991 Constitution mandated substantial increases in
social spending, particularly in the areas of human capital. The new Constitution also sought to

252
promote decentralization both by increasing fiscal transfers from central to local government as
well as by enhancing alternative sources of financing for local government expenditures.
Under the development model promoted by the New Constitution, the increase in the
government’s total expenditure should come with an increase in social expenditure. Between
1980 and 1994, the PSE grew from 12.24 percent of the TPE to16.61 percent (Londoño de la
Cuesta 1993). According to the DPAD, from 1995 to 1998 this percentage grew to 41.7 percent
(Departamento Administrativo de Planeación Distrital 1995). Table 65, presents the absolute
values of the TPE and the PSE in constant 1992 pesos, and the percentage participation of the
PSE (Public Social Expenditure) in the TPE (Total Public Expenditure).
Table 65: Budget allocated to public social expenditures in Bogotá, 1980-1994
TPE (pesos 1992) PSE (pesos1992) %of TPE
1980 420,384.7 51,475.3 12.24 1981 536,429.9 61,821.6 11.52 1982 564,223.8 66,451.7 11.78 1983 639,702.0 62,859.3 9.83 1984 686,397.6 71,794.4 10.46 1985 734,658.7 78,055.3 10.62 1986 811,721.3 87,974.7 10.84 1987 961,340.8 133,479.3 13.88 1988 1,017,608.1 122,061.0 11.99 1989 1,225,604.9 145,492.6 11.87 1990 1,243,539.8 148,411.0 11.93 1991 1,495,740.8 154,147.1 10.31 1992 1,371,420.9 175,142.6 12.77 1993 1,462,836.8 240,456.1 16.44 1994 1,561,440.0 259,383.5 16.61
1995-1998 41.7 Source: Desarrollo Humano y Progreso Social en Santa Fe de Bogotá, D.C. (Segura Ortíz 1996, p.93).
The data shows an important increase starting in 1991, which is consistent with the new
constitutional mandate. The New Constitution established that the provision of public utilities
was responsibility of the state, as it has a great impact in the quality of life of the people; it also
focused on the increase in social investment as on of the key priorities.
Therefore, in order to evaluate the real significance of the social expenditure, two additional
factors must be considered, first, the amount of the GDP allocated to Public Social Expenditure

253
(PSE) in the GDP, and second, the destination of the investment. According to the UNDP, the
ratio between PSE and GDP shows the level of the government mezzo-policies; a ratio equal of
small than 6 percent is considered low, a ratio between 6 and 10 percent moderate, and a ratio of
10 percent or more high (Segura Ortíz 1996, p.92). Between 1980 and 1994, the PSE grew from
1.11 percent of the GDP to 3.36 in 1994. Despite this increase, it is very low compared with the
national level, which was 9 percent in 1993 (Segura Ortíz 1996, p.94). Figure54 illustrates the
amount of the GDP and TPE allocated to PSE from 1980 to 1994.
0
5
10
15
20
25
% o
f GD
P
% SPE 1.11 1.27 1.34 1.25 1.39 1.5 1.61 2.28 1.99 2.33 2.23 2.44 2.56 3.32 3.36
% TPE 9.08 11 11.37 12.74 13.27 14.12 14.88 16.44 16.62 19.65 18.95 23.63 20.04 20.22 20.22
1980 1981 1982 1983 1984 1985 1986 1987 1988 1989 1990 1991 1992 1993 1994
Source : data from Desarrollo Humano y Progreso Social en Santa Fe de Bogotá, D.C. (Segura Ortíz 1996, p.93)
Figure 54: TPE and PSE percentage of the GDP, Bogotá 1980-1994
The level of PSE in Bogotá remains low, according to the UNDP standards, despite its increase.
Nevertheless, the amount located to social expenditure increased steadily from 1985 to 1994, and
thereafter. In fact, by 2003, the government subsidized education for 500,000 children, offered
nutritional programs to 180,000 students, and school transportation to more than 24,000. The
subsidized health system covered 1,800.000 people that did not have access to social security
(Cámara de Comercio de Bogotá 2003, p.12). Unfortunately, the lack of historic data makes
building a systematic comparison impossible. In order to illustrate this trend, Figure 55 shows
the amount in PSE from 1985 to1994 (in 1992 millions) and the PSE from 1995 to 2000 (in 1994
millions).

254
0.0
50,000.0
100,000.0
150,000.0
200,000.0
250,000.0
300,000.0
1985
1987
1989
1991
1993
Mill
ions
(pes
os 1
992)
PSE (pesos1992)
0.0200,000.0400,000.0600,000.0800,000.0
1,000,000.01,200,000.01,400,000.01,600,000.0
1995 1996 1997 1998 1999 2000
Mill
ions
(pes
os 1
994)
PSE(Pesos 1994)Linear (PSE(Pesos 1994))
Sources: Desarrollo Humano y Progreso Social en Santa Fe de Bogotá; Cuadernos de la Ciudad, Serie Equidad y Bienestar No.2
Figure 55: (Left) PSE from 1985-1994, millions 1992; (Rigth) PSE from 1995-2000,
(millions pesos 1994)
The second element to consider is the choices that the government makes in regards to what
social problems to address through PSE. There are important differences in what governments
determine are social expenditures, which represent a serious obstacle for conducting research. In
Bogotá, between 1980 and 1995, the sector with more investment was health, followed by
education; Figure 56 illustrates Public Social Expenditure by sector.
0%10%20%30%40%50%60%70%80%90%
100%
1980 1985 1990 1995
Culture
SocialassistanceHousing
Education
Health
Sources: Desarrollo Humano y Progreso Social en Santa Fe de Bogotá; Cuadernos de la Ciudad, Serie Equidad y Bienestar No.2
Figure 56: PSE by sector, 1980-1995

255
In the first Mockus administration (1994-1997), there was a shift towards education, quite
consistent with his government plan. During Peñalosa’s administration, education continued as
the first choice followed by an important increased in health; it is important to notice that this
administration also made major investments in infrastructure, the third priority after education
and health. Figure 57 illustrates the PSE from 1991 to 2000 by sector.
0.060.10
14.07
8.91
7.35
7.806.13
6.26 5.20
0%
20%
40%
60%
80%
100%
1991 1992 1993 1994 1995 1997 1998 1999 2000
% G
DP
Education Public Health Social WelfareCity Safety Local Development Housing and Urban DevelopmentEnvironment Recreation, Culture and Sports Public Services
Source: SHD, Dirección Distrital de Presupuesto
Figure 57: Share of sector in PSE, Bogotá 1991-2000
It is important to note the increase in investment in local development in 1993, the year in
which the EOB was instituted, and the subsequent decrease in the years thereafter. Public Health
and education are the preferred destinations for social investment.
Health constitutes one of the key indicators in the HDI, and is a critical variable for the
development of any community. In Bogotá, Agreement 16 of 1991 established the Sistema
Distrital de Salud, the city’s health system; in 1996, Decree 812 restructured the Health
Secretariat in order to accommodate the decentralization demands. The aim of the institutional

256
changes was to extend access to health services and to improve the focus of the central
government’s investments. Between 1985 and 2000 life expectancy showed a steady increase, it
went from 69.7 to 72.4 years. There is a slight differential between men and women, as presented
in Table 66; Figure 58 illustrates the improvement in life expectancy in Bogotá from 1985 to
2000.
Table 66: Life expectancy differential men and women, Bogotá 1990-2000
Life expectancy Men Women1990 – 1995 74 66.9
1995 – 2000 75.2 68.5
68
69
70
71
72
73
Life expectancy
Life expectancy 69.7 69.9 70.1 70.3 70.4 70.6 70.8 71 71.1 71.3 71.4 71.9 72.1 72.4
1985 1986 1987 1988 1989 1990 1991 1992 1993 1994 1995 1997 1998 1999
Source: Desarrollo Humano y Progreso Social en Bogotá, Familias, Bienestar y Políticas Sociales en Bogotá, D.C.
Figure 58: Life expectancy in Bogotá 1985-2000
Between 1970 and 1990, the infant mortality rate, that is the rate at which babies less than
one year of age die, steadily declined, from 50 percent in 1970 to 31.5 in 1985 and to 22 percent
in the 1990’s (Segura Ortíz 1996, p.72). Table 67 presents the mortality rate by age in 1999.

257
Table 67: Mortality rate by age (per 10 thousand), Bogotá 1999
Age range Mortality rate
Less than a year 203.5
De 1 a 4 8.7 De 5 –14 4.28 De 15-44 18.79 De 45-59 50.75
De 60 y más 375.88 Source: Familias, Bienestar y Políticas Sociales en Bogotá, D.C.
In regards to access to health services, a recognized improvement in coverage is represented
by the introduction of a subsidized health system for those registered in the Sistema de
Información para la Identificación y Clasificación de los Potenciales Beneficiarios de los
Programas Sociales, SISBEN, a system created for focusing social policies in the city in 1995.
The system represents a big improvement and fills and increasingly important need considering
the deterioration of the labor market and the health benefits associated with it. From 1995 to
2000 the number of people affiliated to the subsidized health system increased from 553,566 to
1,292,259 (Fundación Corona 2003), as illustrated by Figure 59.
553,566 577,729
910,474 915,502994,546 1,043,968
0
200000
400000
600000
800000
1000000
1200000
1995 1996 1997 1998 1999 2000
Num
ber o
f Affi
liate
d
Source: La Pobreza en Bogotá
Figure 59: Number of members of the Health Subsidized system, Bogotá 1995-2002
Critics of the SISBEN claim that people have to make too many procedures for registering
and that the requirements are not possible to meet for the poorest. Participants must have an

258
official ID and a permanent residence and the homeless and IDP would not met these criteria
(Strauch, Niño, and Pacheco 2003, p.46). According to a study conducted by the Health
Secretariat in 1999, the health system needs to improve its coverage of stratum 1 and 2 in the
city. The localities where the health system should concentrate are Ciudad Bolivar, Usme,
Usaquén San Cristobal, Bosa, Santa Fé, Rafael Uribe and Kennedy (Fundación Corona 2003,
p.19).
Education According to a study evaluating the education system in Bogotá, during the 1990s the
system increased its coverage, improved its quality, and enhanced the organizational capacity of
its authorities. The study also pointed out that the system still has to overcome the same
problems, though to a lesser extent, that existed before the decentralization reform. Not enough
public education to cover the demand, big differences in the quality of education offered
according to the purchase power, and not enough investment to guarantee both access and
quality (Pérez Martínez, 2003).
According to the education secretariat, the city’s education system has the capacity to attend
to all the school-age population, if it were not for the rate of students repeating148 or dropping
out. The net coverage of the system for 2000 was 88.4 for preliminary school and 90.8 for
intermediate school. Figure 60 illustrates the gross enrollment ratio149 from 1985 to 1997.
106.6 107.0 107.6 109.3
86.1 89.9 94.5104.5
0.020.040.060.080.0
100.0120.0
1985 1989 1993 1997
(%)
Primary Secondary
Source: DNP, SISD and Colombia Boletín No. 19: La educación en cifras.
Figure 60: Education coverage, Bogotá 1985-1997
148 Referring to pupils who are enrolled in the same grade as in a previous year, expressed as a percentage of the total enrollment to the specified grade 149 Ratio of total enrollment, regardless of age, to the population of the age group that officially corresponds to that level of education

259
Table 68 presents the percentage of students repeating each grade from 1st. to 11, to illustrate
particularly the difficulty to pass from preliminary to middle school, because of the reduction of
the quota available in middle schools; Figure 61 illustrates the dropout rate for the period 1995-
1999.
Table 68: Rate of repeating students by grade, Bogotá 1995-1999
Grade 1 2 3 4 5 6 7 8 9 10 11 Percentage that repeat 5.2 3 2.5 3.2 2.7 8.7 3.1 3.4 6.5 4.4 2.1
Source: DNP, SISD Boletín No. 28: Eficiencia del sistema educativo: perfiles departamentales 1995 - 1999
-12-8-4048
1216
1 2 3 4 5 6 7 8 9 10 11
Grade
(%)
Source: DNP, SISD Boletín No. 28: Eficiencia del sistema educativo: perfiles departamentales 1995 - 1999
Figure 61: Attrition rate by grade, Bogotá 1995-1999
It is difficult to compare the educational policies of the city’s administrations, as there is not
much information from before 1992. Jaime Castro’s administration is recognized for its effort in
improving public preschools, which was about 85 percent private before; 24,000 new seats were
created, mostly in low-income areas of the city. The Mockus administration promoted
improvements in coverage and quality; in addition, it restructured the system, promoting its
decentralization, in consistency with Law 60 of 1993 and Law 115 of 1994. This administration
consolidated the Centros Administrativos de Desarrollo Educativo Local (CADEL), local
administrative units of the education secretariat. This administration designed and initiated the
city’s educational network, a project to connect all public schools via internet.

260
The Peñalosa administration maintained most of the educational policies that were in place; it
consolidated the reorganization of the education secretariat, and set in motion the civic
participation network (REDP), which gave access to internet to more than 700 public schools.
Three public libraries were built in low-income areas. This administration created a partnership
with the private sector for the management of public schools, Educación por Concesión; the
results of this model transcend the boundaries of this study, but it is a source of debate in Bogotá.
8.3.4 Housing The process of urbanization in Bogotá occurred in a much-unregulated context, which resulted in
different styles of land use and occupation; the city looks like a combination of two or three
separate cities, each corresponding to a different social group. Approximately 23 percent of the
urban area (6,000 ha) is occupied by squatter settlements which are home to some 26 percent of
the population (over 1.5 million inhabitants); only middle to higher-income areas have managed
to grow and develop under a well-regulated and modern market (IADB, pp.7-8).
Despite the chaotic development of the housing market, Bogotá has managed to cope with
the problem thanks to the existence of illegal sub-divisions where purchasers obtain formal title
some years later (Mohan 1994). Typical shantytowns exist and keep emerging in the city, which
are transformed gradually by the people into more or less standardized suburbs. Most settlements
over 10 years of age are well-serviced in a city where 98% of homes have water piped to the
home (Gilbert 2000).
Before 1987, the national government, through the Instituto de Crédito Territorial (ICT),
controlled most of the housing policy. In 1987, as part of the promotion of decentralization in the
country, decree 78 of 1987 promoted the creation of land banks managed by municipal
authorities, with the aim of increasing low-income housing (Rico de Alonso et al. 2003, p.110).
In 1990, in consistency with the neo-liberal paradigm, the public housing system was reformed,
the deregulation of the interest rates for low-income housing attracted private builders into this
market. Law 3 of 1991, assigned to the state the regulation of low-income housing built by
private and public organizations, in addition it formally instituted subsidies to help low-income
residents access the formal housing market (Gilbert 1997; Rico de Alonso et al. 2003).

261
In 1997, as part of the decentralization process of the New Constitution, the municipalities
had to elaborate their territorial development plan (POT), which according to the law, had to
include land reserves for low-income housing (Rico de Alonso et al. 2003). The final aim of the
housing policies was to provide quality housing to all; Table 69 presents that evolution of the
absolute quantitative deficit150 in Bogotá from 1951 to 2001.
Table 69: Housing deficit in Bogotá, Bogotá 1951-2001
Criteria 1951 1964 1973 1985 1993 1997 2000 2001
Households 121,474 313,702 435,118 911,535 1'732,126
Annual growth rate 7.57 3.7 6.36 4.01*
Average annual % growth 14,786 13,49 39,701 51,286
Housing units 75,559 207,055 296,856 664,135 1'170,985
Annual growth rate 8.06 4.08 6.94 3.54*
Average annual % growth n.d. 10.115 9.978 30.606 36.05 33.63 30.49 31.678
Absolute deficit (Household-
house) 45,915 106,647 138,262 247,4 500,033 527,27
9 527,279 562,861
Annual average deficit 4.671 3.512 9.095 19.608
Household by house ratio 1.61 1.52 1.47 1.37 1.56 1.51 1.44 1.48**
Source: Familias, Bienestar y Políticas Sociales en Bogotá, D.C. (2003)
Despite the fact that the offer in housing has tripled, the deficit accumulated is higher than
500,000 housing units; from which 92 percent correspond to low-income strata (Rico de Alonso
et al. 2003). Figure 62 illustrates the relative lack of housing.151
150 The relation between household and housing available 151 Quantitative relative deficit= quantitative absolute deficit/household

262
ndnd
32.50
19.8622.85
27.1431.78
34.0037.80
0.00%5.00%
10.00%15.00%20.00%25.00%30.00%35.00%40.00%
1951 1964 1973 1985 1991 1995 1997 2000 2001
Relative quantitative deficit
Source: data from Familias, Bienestar y Políticas Sociales en Bogotá, D.C. (2003), and Desarrollo Humano y Progreso Social de Santa Fé de Bogotá.
Figure 62: Quantitative relative deficit in Bogotá 1951-2001
In Bogotá, private developers, whether piratas152or not, have controlled the market, from 70
percent in 1981 to 75 percent in 1999. Additionally, in the 1990s, NGOs promoted programs for
self-construction (Dureau et al. 2002, p.343). Table 70 presents the participation in housing
programs developed by the state and the private sector.
Table 70: Housing developers in Bogotá, 1981-1999
Builder 1981 % 1986 % 1989 % 1999 %
State 5,336 27.7 3,426 7.8 8,171 28.1 7,066 25.4
Private 13,893 72.3 40,239 92.2 20,893 71.9 20,709 74.6
Source: Familias, Bienestar y Políticas Sociales en Bogotá, D.C.(2003)
The illegal developers were the ones “helping” the low-income population acquire a home. In
order to attract the legal developers, in 1984, the national government promoted the “no money
down” program, which in fact produced a significant increase in the production of low-price
housing. Between 1984 and 1988, more than 190,000 new homes were built, many targeting
152 The term refers to housing developers that lack planning permission, yet they are not land invasions.

263
low-income population (Gilbert 2000, p.174). Table 71presents the house units available by price
from 1981 to 1999.
Table 71: Housing price in Bogotá, 1981-1995 Price in UPAC153 1981 % 1986 % 1989 % 1999 % Up to 1,500 2 0.1 4,171 17.6 216 1.3 1,500-3,000 1,126 13.2 8,743 37.0 3,453 22 6,109 30.93,000-5,000 2,600 30.5 5,846 24.8 3,764 24 5,306 26.95,000-10,000 3,185 37.4 4,238 17.9 6,134 38 5,412 27.4More than 10,000 1,602 18.8 643 2.7 2,434 15 2,922 14.8
Total 8,515 100 23,641 100.0 16,001 100 19,749 100.0 Source: Familias, Bienestar y Políticas Sociales en Bogotá, D.C.(2003)
The access to the housing market is determined by the price of the housing units, but also to
great degree on the financial market, meaning the interest rate and the availability of credit. After
1998, the possibilities of gaining access to housing finance became more difficult, due, among
other causes, to the economic crisis and the instability of the job market. Between 1997 and
1998, the credits to buy for pre-owned homes were reduced in 30 percent, and in 20 percent for
new homes (Rico de Alonso et al. 2003). Figure 63 illustrates credits available for low income
housing.
0
10000
20000
30000
40000
50000
1986
1987
1988
1989
1990
1991
1992
1993
1994
1995
1996
1997
1998
1999
Value of Credits No.Units
Source: DAPD, Estadísticas Históricas Santa Fe de Bogotá D.C. 1950-1999
Figure 63: Credits and units of Low Income Housing*
153 Units of Constant Purchasing Power (Unidades de Poder Adquisitivo Constante—UPAC), a system by which an investment not only accrued interest but also was adjusted for inflation; the UPAC system aimed at encouraging low-income housing building from recognized developers.

264
The reduction in money allocated to the housing market, in the form of credits, affected
particularly low-income housing production; the number of units decreased from 10,266 in 1992,
to 8,194 in 1995, and to 5,600 in 1999. The pirate developers capitalized on the low-income
demand. During the same period, the number of illegal quarters grew from 300 which housed 10
percent of Bogotá’s population, to 1,528 illegal quarters with around 1,400,000 inhabitants (Rico
de Alonso et al. 2003). By mid 1999, some 800,000 borrowers were behind with their
repayments. The government was forced to modify the UPAC system and to contribute to a fund
with which to bail out lenders (Gilbert 2000).
To balance the factors affecting low-income housing, the administration of Enrique Peñalosa
created Metrovivienda, an institution in charge of promoting low-income housing developments
and extinguishing pirate developments (Fundación Corona 2003, p.20). The Peñalosa’s
administration led a considerable effort to legalize irregular settlements in Bogotá. Table 72
presents the settlements legalization program promoted by this administration.
Table 72: Settlements legalization program, 1997-2000
Locality Number of legalized settlements Extension (ha)
7 Bosa 241 722.9 11 Suba 157 763.7 5 Usme 150 697.35 19 Ciudad Bolivar 147 1,149.90 8 Kennedy 111 707.4 4 San Cristobal 104 696.5 1 Usaquen 81 327.7 18 Rafael Uribe 75 313.2 10 Engativa 74 502.8 9 Fontibón 44 158.7 3 Santa Fe 24 153.9 2 Chapinero 9 30.6 16 Puente Aranda 6 16.8 6 Tunjuelito 5 147.5 15 Antonio Nariño 4 18.4 13 Teusaquillo 3 0.4 12 Barrios Unidos 2 2.1 14 Los Martires 1 0.1
TOTAL 1,238 6,410.22 Source: DAPD, Subdirección de Gestión Urbanística, Area de Legalización, Bogotá, D.C., 2.000

265
The number of illegal settlements in Bogotá is a result, as mentioned before, of a permissive
housing development regulation and the fact that Bogotá has always had good public utilities
coverage. Figure 64 presents the water and sanitation coverage from 1993 to 2000.
0
20
40
60
80
100
1993 1994 1995 1996 1997 1998 1999 2000
Drinkable water Sewerage
Source: Bogota como vamos and www.univerciudad.net
Figure 64: Water and sanitation service coverage in Bogotá, 1993-2000
8.3.5 Gender and Vulnerable populations
In Bogotá, women did not formally exist as a population with specific needs to be considered
when designing public policy until 2001. Before that time, it was very difficult to find studies on
gender, or data and information disaggregated by gender. In a study conducted in 1994 for the
presidential office for women, youth and families, the researcher that wrote the chapter on
women declared,
The first difficulty when trying to asses the situation of women in Bogotá is the inexistence of information disaggregated by gender. Additionally there is no one authority within the district’s administration in charge of collecting and analyzing information with gender perspective (Cano 1994).
It is only during the second administration of Antanas Mockus (2001-2003) that the city’s
development plan included a gender perspective for the first time. It is also during this

266
administration that for the first time a thorough research study on the state of women in Bogotá
was conducted; the result was a book published in 2003, Estado del Arte Sobre la Situación de
las Mujeres entre 1990-2002 (García Suárez et al. 2003). This section uses that study as its main
reference154; the fieldwork confirmed the prevalent difficulty for finding information and data
discriminated by gender, and the resistance that the concept produces. This section reviews the
development plans of the five administrations covered by this study in regards to gender and
vulnerable populations and the legislation in the same topics.
Andrés Pastrana’s administration (1988-1990) - the development plan of this administration
included a program targeting vulnerable populations, and one of it priorities was the promotion
of access to health services for the poor. During this administration a program of basic social
services, supported by UNICEF, was implemented by the DABS in collaboration with the
Universidad Nacional de Colombia. There was no specific program for or mention of gender
during this administration. The cabinet of Andrés Pastrana, which consisted of nine positions,
had two women; the treasurer and the head of the DABS, the social and welfare department.
Juan Martín Caicedo and Sonia Duran’s administration (1991-1992) – this administration
introduced the concept of social policy; his development plan included the creation of the city’s
Office of Social Development, for coordinating all central institutions promoting or
implementing social programs. The development plan of this administration also included as
priorities the improvement of health coverage, and the design of a comprehensive housing
policy. There is no explicit allusion to gender in this administration. Nevertheless, as mentioned
before, it is during this administration that the city had the only female mayor, Sonia Durán de
Infante, who governed the city for two months. Three women were members of this cabinet,
which consisted of thirteen positions, the head of the SHD, the city’s financial secretariat, the
director of DABS, and the head of the Departamento Administrativo del Servicio Civil (DASC),
the civic service department.
154 Angela María Robledo, director of DABS, was in charge of overseeing the study that was conducted by the Universidad Central; she facilitated to the author access to all the information collected in regards to gender.

267
Jaime Castro’s administration (1992-1994) - his development plan155, Prioridad Social,
included three programs for vulnerable populations and women. The first one, Protección a la
infancia, established mandatory health care for children less than one year old; including pre and
postnatal care. The second was a program in health; it included sexual education, screening for
cervical cancer, free vaccination for pregnant women and children, and health services for people
infected with the HIV virus. Decree 5 of 1993 mandated free attention to pregnant women in
need. The third program, Bienestar Social, provided nutrition supplements to seniors, children
and pregnant and lactating women. An important advance for social policy was the creation of
the Consejería para Asuntos Sociales y la Participación Comunitaria, the city’s consultant office
for participation and social affairs. The development plan of this administration did not have any
specific policy for women. Three women were members of this cabinet, which consisted of
fourteen positions, the director of the Departamento Administrativo del Medio Ambiente
(DAMA), the city’s environmental department, the director of DABS, and the head of the
transport secretariat. During the administration of Jaime Castro, there were several changes in
the cabinet, totaling 27 functionaries for 14 posts.
Antanas Mockus and Paul Bromberg’s administration (1995-1997) – one of the priorities of this
administration's development plan, Formar Ciudad, was to promote social progress. Formar
Ciudad sought to promote inclusion through social investment and the coordinated action of
families, communities and the government. This administration gave continuation to the
programs supporting pregnant and lactating women established in the previous administration.
There was no specific mention of gender in the development plan of this administration. Nine
women were members of this cabinet, which consisted of fourteen positions. During this
administration there were several changes, totaling 24 functionaries for 14 posts.
Enrique Peñalosa’s administration (1998-2000) – his development plan, Por la Bogotá que
queremos, included within its priorities, several programs targeting women and vulnerable
populations. Among them, the creation of a center for fertility control, the reduction of the
mortality rate, and the inclusion of pregnant women in the social security system. In addition, the
155 Before Jaime Castro, the development plans were presented to the Council by the Mayor, after the New Constitution the development plan had to be consistent with the plan of government that each candidate offered to the citizens.

268
development plan of this administration included for the first time a reference to gender
discrimination; nevertheless, it did not have programs or policies targeting women, and it did not
have gender perspective. Eight women were members of this cabinet, which consisted of
fourteen positions, this administration did not change as much as the previous, 18 functionaries
for 14 posts.
In general, the development plans reviewed included women in its social policies as mothers
or family members, but not as individuals with specific needs; there is still a lot of resistance to
the inclusion of gender as a valid concept into the policy discourse in the city, as was clear
trough the fieldwork. A similar situation affects other vulnerable populations that have been
mostly ignored in the policies of the city. This is the case of the homeless and street children, and
the desplazados or IDP.
Bogotá has no reliable data on the number of homeless and street children, an estimate in
1994 reported that there were between 10 and 12 thousand adults living in the streets of Bogotá,
25 percent of them had a mental illness, and 10 percent were older than 50 years. There are no
policies directed towards this population (Pitto Bonilla 1994, pp.328-330). It is also estimated
that there are about 5 thousand children living in the streets of Bogotá; the city’s administration
has several programs for responding to this problem (Fundación Corona 2003, p.12).
8.3.5.1 Los Desplazados (IDPs) The desplazados are an important piece of Colombia’s history;
forced immigration has existed as long as people have been forced to abandon their homes. It is
possible that because they were not counted, not quantitatively nor qualitatively, they did not
exist as subjects of public policy. It is just recently that they gained attention, for two main
reasons, the sheer amount of people involved in the movement and the attention given to them by
international NGOs.156 It has been calculated that since 1985, the internal conflict has displaced
over three million people and the number continues to rise. However, the government only
recognizes 1.6 million as displaced due to the fact that displaced persons could only start
registering for IDP status in 1994 (Refugees International).
Bogotá has been the preferred refuge for the displaced; it is estimated that more than 37
displaced families arrive in the city every day, and that the city has received some 480,000
156 For example, the Norwegian Refugee Council, one of the most involved, Amnesty International, the Peace Brigades, Refugees International and ACNUR, the UN office for refugees.

269
desplazados since 1985, giving it the highest concentration of desplazados, approximately 23
percent of the country’s total displaced population (Norwegian Refugee Council 2004, p.4).
Figure 65 illustrates the steady increase in the number of IDPs arriving in Bogotá from 1994 to
2000.
0
100,000
200,000
300,000
400,000
500,000
1994
1995
1996
1997
1998
1999
2000
Displaced Population Linear (Displaced Population)
Source: CODHES and (ACNUR and Bogotá Cómo Vamos 2003).
Figure 65: Bogotá: incoming IDPs, 1994-2000
According to the minutes of a forum on IDPs in Bogotá, organized by the UN Office for
Refugees in Colombia in 2002, of the displaced families living in Bogotá, 55 percent would like
to settle permanently in the city. Of the total of IDPs, 77 percent came from rural areas and the
main cause for abandoning their homes was a threat against their life. About 83.5 percent are not
affiliated with the social security system, and only 26.8 percent have access to education. Only
0.8 percent of all the families own a home, and 64.5 percent of the heads of household are
unemployed.
The average family size is 4.66, which means that a significant part of this population, 66
percent, is under 18 years; 30.9 percent are between 0 and 7 years of age, 34.6 between 8 and 17,
and 14.9 between 18 and 26; only 3 percent are seniors. Women represent between 43 and 55

270
percent of the total population; even more importantly, about 45 percent of the families have
women as head of the household, which are between 20 to 24 years old (ACNUR and Bogotá
Cómo Vamos 2003, pp.57-68).
Ethnic communities, predominantly indigenous and afro-Colombian groups, are a large part
of the displaced, a roughly estimation points to 6.1 percent afro-Colombians and 1.6 percent
indigenous from different communities such as Pijaos, Kogui, Yupka, Kankuamo, Arwakos,
Sikuani, and others (ACNUR and Bogotá Cómo Vamos 2003, p.13-24).
It was not until 1998, under Mayor Peñalosa, that the government of the city, following the
mandate of Law 387 of 1997, and in recognition of the dimension of the population and the
demands it created, began to create an institutional response. Agreement 2 of 1998 established
the Consejo Distrital para la Atención Integral de la Población Desplazada por la Violencia a
Santa Fe de Bogotá, the city council for IDPs; Decree 624 of 1998 ruled the functions for the
council (ACNUR and Bogotá Cómo Vamos 2003; Secretaría General 2005).
The city’s council for IDPs established in 1999 the Unidad de Atención Integral a la
Población Desplazada (UIAD), a permanent unit for coordinating actions between the many
organizations working with IDPs in Bogotá. This unit offers services to the IDPs living in the
city and to those arriving daily; in addition, it collects relevant information about the IDP
population. Between 1999 and 2000, the UIAD served 2,754 IDP families, offering a coverage of
42.7 percent (ACNUR and Bogotá Cómo Vamos 2003, pp.41-42). Table 73 presents the number
of families serviced by the UIAD in 1999 and 2000.
Table 73: Families served by the UIAD in 1999 and 2000
Year Number of families Percentage1999 896 14.3 2000 1858 29.2 Total 2754 43.5
Source: (ACNUR and Bogotá Cómo Vamos 2003)
The number and characteristics of this population created a lot of pressure in the social policy
system of the city. Most of their children had to be included in extra-age school groups. The
UIAD reports that close to 14,000 children have been incorporated into the education system
(ACNUR and Bogotá Cómo Vamos 2003, p.43).

271
One of the main problems faced by the desplazados is how they are seen by the Bogotanos;
the city’s population does not have a common understanding on the displacement crisis and they
do not see the situation of the IDPs in Bogotá as a public problem. It is not surprising that the
localities with the highest proportion of poor are the ones with higher concentration of IDPs.
Table 74 presents the number of displaced families living in each locality.
Table 74: Displaced families by locality, between 1999 and 2000
Locality Number of families Percentage
Ciudad Bolívar 2,190 26.2 Kennedy 958 11.5
Bosa 863 10.3 Usme, 704 8.4
Rafael Uribe Uribe 452 5.4 San Cristobal 447 5.3
Without specific location 440 5.3 Suba 384 4.6
Engativá 384 4.6 Tunjuelito 281 3.4 Santa Fé 276 3.3 Fontibón 181 2.2
Puente Aranda 150 1.8 Usaquén 138 1.7
Chapinero 109 1.3 Antonio Nariño 82 1.2 Los Martires 75 1.0
Barrios Unidos 57 0.9 Teusaquillo 53 0.7
La Candelaria 38 0.6 Sumapaz 3 0.5
Total 8,265 Source: UIAD quoted by Bogotá Como Vamos, p.13
The displacement trend is not likely to change as the internal war has increased; in the words
of the UNHCR Representative in Colombia, Roberto Meier, quoted by William Splinder, a
member of the UNHRC office in Colombia, “it would appear that the conflict is following its
victims” (Spindler 2004).

272
8.4 EFFICIENCY
Efficiency, specifically economic efficiency, is a means to guarantee that there will be enough
resources to fulfill the basic needs of all citizens. If a government uses its resources efficiently,
they will support policies that enhance the wellbeing of society; governments at all levels are in
charge of generating resources, and responsible for their appropriate management. Economic
resources are necessary for providing public services, which are subject to conflict and
negotiation, and for guaranteeing their sustainability. A government’s level of efficiency is
reflected in the “health” of not only its public finances but even more so in the health of society;
therefore, equity and efficiency are interdependent. Efficiency, the definition adopted for this
study, refers to the accomplishment of results that meet the needs of the stakeholders, and to the
maximization of resources (UN-HABITAT 2000).
This section reviews the “health” of Bogotá’s economy and public finances from 1988 to
2000. This is not intended to be a comprehensive economic study on the city, but rather a broad
evaluation of the key changes in the management of the city’s economy and finances that the
decentralization reform may have caused.
8.4.1 Economic growth
Bogotá could be considered a highly productive city; it generates about a quarter of the national
GDP and transfers more resources to the nation than it receives in return. Bogotá redistributes
wealth to Colombia at a rate of 3 to 1; for each 3 pesos that Bogotá contributes to the country, it
receives 1 from the national government. In addition, if considered separately, Bogotá has had a
higher growth rate than the country; figure 66 shows the annual percentage growth rate for
Colombia and Bogotá.

273
-10.00
-5.00
0.00
5.00
10.00
15.00
1991 1992 1993 1994 1995 1996 1997 1998 1999 2000
GD
P an
nual
% g
rwot
h
Colombia Bogotá
Figure 66: GDP percentage growth rate, Colombia and Bogotá 1991-2000
Bogotá was responsible for approximately 20% of Colombia’s GDP between 1980 and 2000.
In 1995, this number decreased due to the deceleration of the city’s economy (SHD 2000, p.2).
Figure 67 illustrates Bogotá’s contribution to Colombia’s GDP from 1990 to 2000.
21
22
23
24
25
1990 1991 1992 1993 1994 1995 1996 1997 1998 1999 2000
(%)
GDP Bogota/GDPnational Linear (GDP Bogota/GDPnational) Source: Database from the SHD, calculated by MVW
Figure 67: Bogotá GDP participation in the national GDP, 1990-2000 Between 1985 and 2000 the city’s GDP had an average growth rate of 3.42 percent; however,
the city’s percentage growth rate has been irregular, and not always consistent with country
trends (SHD 2001, p.25). Figure 68 presents Bogotá’s GDP real growth and its annual
percentage growth rate, from 1985 to 2000.

274
0.002,000,000.004,000,000.006,000,000.008,000,000.00
10,000,000.0012,000,000.0014,000,000.0016,000,000.0018,000,000.0020,000,000.00
1985
1986
1987
1988
1989
1990
1991
1992
1993
1994
1995
1996
1997
1998
1999
2000
-10.00
-5.00
0.00
5.00
10.00
15.00
Real GDP constant currency (Colombian Pesos 1994)Growth %
Source: Database from the SHD, calculated by MVW
Figure 68: Real GDP and annual percentage growth rate, Bogotá 1985-2000
Unfortunately, the productivity of the city does not have a solid base; its dependence on the
internal market makes it very susceptible to changes in the country’s economy, and its reliance
on the third sector makes it unstable (Cámara de Comercio de Bogotá 1999). The composition of
Bogotá’s economy by 1999 was: services sector (32%), financial and real estate (23.5%),
industry (15.19%), financial intermediation (10.54%), trade (10.10%) and transport and
communications (9.48%) (SHD 2000, p.4). Figure 69 illustrates the composition of the economy
by sector.
Transport, Communications, 9%
Commerce, 10%
Fiinacial and real
state, 24%
Manufacturing, 15%
Others, 5%
Services, 32%
Utilities, 4%
Source: Database from the Secretaría de Hacienda Distrital (SHD, calculated by author
Figure 69: GDP composition of Bogotá, 1999

275
Many have suggested that this rate of economic growth is unsustainable and will collapse the
city’s infrastructure, and that the concentration of the country’s economy in just one “Tibetan”
place entails a lot of risk for both the country and the city (DAPD 1999, p.142). In addition,
Bogotá has the highest rate of unemployment among Colombia’s major cities; participation in
the informal economy climbed to 65 percent in 2000, and its GDP growth started to decline in
1996 (rising to negative 5.7 percent in 1999 (Vargas). Finally, although Bogotá has traditionally
attracted most of the Country’s foreign direct investment, as presented in table 75, it has also
begun to decline, as shown by figure 70.
Table 75: Foreign Direct Investment, Bogotá 1975-1991
1975-1979 1980-1984 1985-1991
312,479 1,712,895 1,100,837 Source: Bogotá: Nacimiento de una Metrópoli (Gouëset 1998)
1,018
1,4231,827
4,002
3,258
3,718
0
500
1,000
1,500
2,000
2,500
3,000
3,500
4,000
4,500
1995 1996 1997 1998 1999 2000
Mill
ions
US$
FDI US$ Source: Plataforma Internacional del Distrito Capital. Análisis sobre comercio exterior e inversión extranjera en Santa Fé de Bogotá (Pulido 2000)
Figure 70: FDI in Bogotá, 1995-2000
In 1996, foreign direct investment began to be a significant part of the city’s GDP, increasing
from 5 percent in 1996 to 15.42 percent in 1999 and fall to 14.15 percent in 2000. In 1998, the
investment rose to US$9.463 million, representing approximately 40% of the GDP. Finally, the

276
export activity in Bogotá has also been loosing its significance as a key driver of growth. Export
totals decreased from US$174.8 million in 1985, to US$94.2 million in 2000 (Gouëset 1998,
p.199; CCB 2001). Figure 71 illustrates export activity from 1985-2000.
0.0
50.0
100.0
150.0
200.0
250.0
300.0
350.0
1985
1986
1987
1988
1989
1990
1991
1992
1993
1994
1995
1996
1997
1998
1999
2000
Expo
rts
Mill
ion
US$
Source: data from Estadísticas históricas de Santa Fe de Bogotá (DAPD 2000)
Figure 71: Export activity US$, Bogotá 1985-2000
Between 1991 and 1997 Colombia’s national exports grew approximately 75 percent, while
Bogotá reduced its exports by 6.3 percent (Pulido 2000, p.5). In 1999, Bogotá’s contribution to
Colombia’s exports was only 0.9 percent, in 2000 that number increased to 1.3 percent (SHD
2001, p.101).
8.4.2 Public finances
Governments have been delegated, among other duties, the duty to manage public resources in
order to address public problems; this entails using the best managerial strategies to decide what
the priorities are and why, how to approach them, and with what resources. As stated by Peters
and Pierre, “Legislatures and political executives may pass all the laws they wish, but unless
those laws are administered effectively by the public bureaucracy, little or nothing will actually
happen” (Peters and Pierre 2003, p.1).
Public management is a very demanding field in which the stakeholders demand much more
than efficiency; they demand effective policy implementation. “Efficiency may be the least

277
important value for the public sector, especially in the eyes of the public. They may care much
more that services are delivered, and that they are delivered in an accountable and humane
manner, than they care about the cost per unit of service delivered” (Peters and Pierre 2003, p.8).
However, costs matter so public managers have to be efficient in managing whatever resources
they have in order to serve the most people at the least cost possible; without sacrificing
accountability or humanity.
Decentralization was also a strategy that ws supposed to improve efficiency, accountability
and improve the relationship between state to the citizens. It definitely entailed a redefinition of
the public financial system. Fiscal decentralization became one of the most important reforms
from the mid 1980s on, and occurred at the regional, national, and local level. In the early 1980s,
when decentralization was first begun, a Commission on Intergovernmental Finances in
Colombia recommended increasing the use of local resources for local purposes, which resulted
in a new legislative framework for decentralizing functions and finances (DNP 2002). The New
Constitution of 1991 definitively consolidated decentralization in Colombia and Bogotá; it
redefined the responsibilities, competences, and resources of the local governments and their
relationship with the nation.
Bogotá underwent a major change in its financial system; the next subsection compares the
financial performance of the government before and after the reform, examining three important
indicators: income, expenditures and debt, with the aim of identifying the impact of
decentralization on efficiency.
8.4.2.1 Income Between 1988 and 1990, under Mayor Pastrana, the fiscal deficit went from -
5,053.4 to a surplus of 21,606.5 million pesos. In order accomplished its investment plan, the
city had to ask for new loans, increasing the city’s debt from 616,915.3 millions in 1986 to
1,152,776.40 in 1990 (Cámara de Comercio de Bogotá 1991). In addition, the garbage collector
company own by the city was a main source of deficit; mayor Pastrana began to dismantled it,
yet he did not accomplished this goal and in consequence at the end of his administration the city
had three private companies under contract for collecting the garbage, and the public company
still functioning (Caicedo Ferrer 2003, p.94).
Between 1990 and 1992, under Mayor Caicedo Ferrer, the fiscal deficit increased by 60
percent, and the debt grew by 39 percent. Determined to control the deficit, Mayor Ferrer

278
liquidated the city’s transportation company, another source of deficit. He improved the tax
collection and by doing so, the city’s income grew 109 percent from 1990 to 1992. Figure 72
illustrates the fiscal deficit from 1988 to 2000.
-300,000-250,000-200,000-150,000
-100,000-50,000
050,000
100,000150,000
200,000250,000300,000
1988 1990 1992 1994 1996 1998 2000
Years
Mill
ion
of p
esos
(199
4)
Source: data from Estadísticas históricas de Santa Fe de Bogotá (DAPD 2000)
Figure 72: Central administration balance, Bogotá 1988-2000
In 1992, the city’s finances were in crisis; its capacity for generating income was very low
and its level of indebtedness very high. The establishment of the new statute for the city (EOB),
by Decree-law 1421of 1993, provided Mayor Castro with the legal support to promote an
unprecedented fiscal reform (Rojas 2002). In 1993, he introduced a city improvement tax,
impuesto de valorización general, in 1994, he introduced the property self-valuation system and
changed the tax base for industry and commerce (Rojas Lopera and Gutiérrez 2002). Mayor
Castro partially refinanced the internal debt and issued domestic bonds for the internal market. In
addition, he concluded the liquidation of the city’s garbage collection company. He initiated the
negotiation of an important loan from the World Bank to improve the city’s infrastructure, which
was granted in the first administration of Antanas Mockus, and executed in the administration of
E. Peñalosa (Cámara de Comercio de Bogotá 2000, p.22). Between 1992 and 1994 the city’s
income increased by 34.8.5 percent. Figure73 illustrates the government income as apercent of
Bogotá’s GDP.

279
0.0
2.0
4.0
6.0
8.0
10.0
12.0
14.0
1985
1986
1987
1988
1989
1990
1991
1992
1993
1994
1995
1996
1997
1998
1999
2000
PI/GDP
Source: data from Estadísticas históricas de Santa Fe de Bogotá (DAPD 2000)
Figure 73: Public income participation in GDP, Bogotá 1988-2000
In 1995, the new mayor, Antanas Mockus continued the process of strengthening the city’s
tax base. He consolidated the budget reform, simplified the industry and commerce tax (ICA),
established a surcharge of 14 percent on the price of gas. The gas tax, one of the most dynamic
taxes, accounted for 0.3 percent of total revenue in 1995, 7.1 percent in 1996 and 9.6 percent in
1998 (Rojas 2002, p.19). In addition, Mockus began the capitalization of the city’s electric
company; Mayor Mockus aim was to increase investment and improving efficiency. In 1995, the
city received total responsibility over public education and health. In order to support the city’s
new responsibilities, the nation increased the amount of transfers to Bogotá. The increase in
transfers from the nation added to the already increasing income. Figure74 shows the amount of
the city’s GDP attributed to national transfers, capital, and taxes.

280
0.00
2.00
4.00
6.00
8.00
10.00
12.00
1988 1989 1990 1991 1992 1993 1994 1995 1996 1997 1998 1999 2000
% o
f GD
P
Tax revenue Tranfers (nat ion) Capital
Source: data from Estadísticas históricas de Santa Fe de Bogotá (DAPD 2000)
Figure 74: Transfer, taxes and capital participation in GDP, Bogotá 1988-2000
In 1998, the new mayor, E. Peñalosa, raised the surcharge on the price of gas to 20 percent,
concluded the capitalization of the city’s electric company, which represented an income of 970
billion pesos, which generated an increase in capital resources of 144 percent (Guzmán and
Gutiérrez 2000, p.14). This inflow of capital is illustrated in figure 74.
What also is indicated by figure 74 is the steady contribution that taxes represent for the
city’s income. As mentioned by Campbell, “In cities all across the region, taxpayers generally
agreed to new tax burdens when elected officials could demonstrate through concrete
improvements that tax revenues were at work in visible and verifiable ways”(Campbell 2003,
p.7).
Income from tax collection is a good indicator of efficiency, as the government must
persuade the citizens to contribute, by showing a direct relation between tax payment and
successful policies. The income from tax collection in the city significantly improved after the
introduction of the new city’s statute (EOB) in 1993, which gave the city the autonomy to
modify the tax collection system. Figure 75 presents the tax collection change from 1986 to
2000.

281
0.00
100000.00
200000.00
300000.00
400000.00
500000.00
600000.00
700000.00
1986 1987 1988 1989 1990 1991 1992 1993 1994 1995 1996 1997 1998 1999 2000
Tax revenue Constant Colombian Pesos 1994 (Million )
EOB
Source: data from Estadísticas históricas de Santa Fe de Bogotá (DAPD 2000)
Figure 75: Tax revenue in Bogotá 1986-2000
The more an administration is able to ensure an efficient collection of taxes, the less it is
dependent on other sources of income. The proportion of taxes in the GDP of the city shows the
amount of contribution in taxes. In the administration of Andrés Pastrana, the percentage of tax
income in the GDP of the city was 0.38 percent; in 1989, it was 0.52 percent. During the
administration of Juan Martin Caicedo, taxes increased to .61% of the GDPin 1990 and to 0.82
percent in 1991. From 1992 on, tax collection showed a systematic improvement as the
administration reduced evasion by introducing incentives and penalties to promote tax payment
(CCB 2001).
In 1992, taxes accounted for 2.65 percent of the city’s GDP, and represented 67.72 percent of
Bogotá’s total income. In 1994, the taxes still accounted for 2.65 of GDP, but represented 66.23
percent of the total income. In 1997, taxes increased to 5.23 percent of the city’s GDP to 5.23
percent, but only 46.87 percent of the total income. In 2000, the income from taxes was 7.53
percent of the city’s GDP, accounting for 39.42 percent of the city’s total income.

282
Tax Revenue participation in the Total revenue
0.000
1000000.000
2000000.000
3000000.000
4000000.000
5000000.000
1988
1989
1990
1991
1992
1993
1994
1995
1996
1997
1998
1999
2000
Years
Mill
ion
of P
esos
Total revenue
Tax revenue
Source: data from Estadísticas históricas de Santa Fe de Bogotá (DAPD 2000)
Figure 76: Tax revenue participation in total income, Bogotá 1988-2000
The evidence indicates that the administrative reform of the central government in Bogotá
strengthened the capability of the city to collect taxes. Nevertheless, expenditures outpace the
income produced by tax collection, and the city had to search for additional resources mostly by
contracting debt. Figure77 illustrates the city’s degree of dependency measure by the relation
between tax revenue per capita and per capita expenditure.
0.0000
0.0500
0.1000
0.1500
0.2000
0.2500
0.3000
1986 1987 1988 1989 1990 1991 1992 1993 1994 1995 1996 1997 1998 1999 2000
Tax Revenue/capita Total Expenditure / capita
EOB
Source: data from Estadísticas históricas de Santa Fe de Bogotá (DAPD 2000)
Figure 77: Degree of dependency, Bogotá 1988-2000
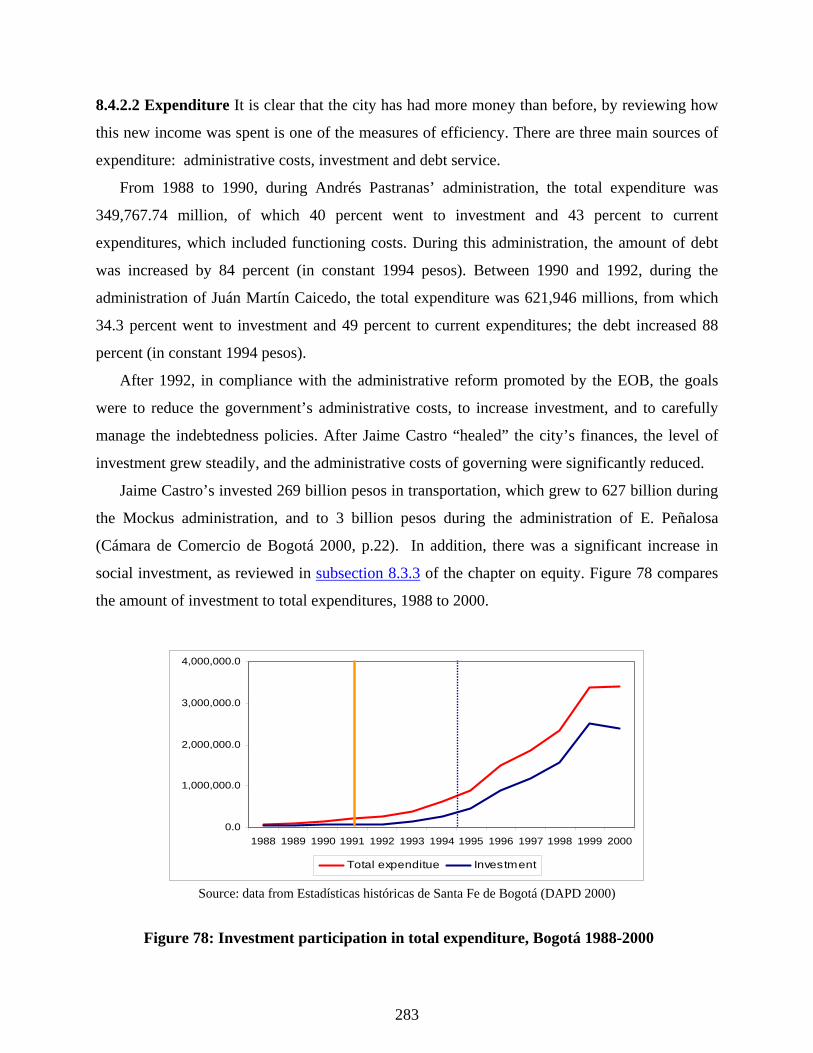
283
8.4.2.2 Expenditure It is clear that the city has had more money than before, by reviewing how
this new income was spent is one of the measures of efficiency. There are three main sources of
expenditure: administrative costs, investment and debt service.
From 1988 to 1990, during Andrés Pastranas’ administration, the total expenditure was
349,767.74 million, of which 40 percent went to investment and 43 percent to current
expenditures, which included functioning costs. During this administration, the amount of debt
was increased by 84 percent (in constant 1994 pesos). Between 1990 and 1992, during the
administration of Juán Martín Caicedo, the total expenditure was 621,946 millions, from which
34.3 percent went to investment and 49 percent to current expenditures; the debt increased 88
percent (in constant 1994 pesos).
After 1992, in compliance with the administrative reform promoted by the EOB, the goals
were to reduce the government’s administrative costs, to increase investment, and to carefully
manage the indebtedness policies. After Jaime Castro “healed” the city’s finances, the level of
investment grew steadily, and the administrative costs of governing were significantly reduced.
Jaime Castro’s invested 269 billion pesos in transportation, which grew to 627 billion during
the Mockus administration, and to 3 billion pesos during the administration of E. Peñalosa
(Cámara de Comercio de Bogotá 2000, p.22). In addition, there was a significant increase in
social investment, as reviewed in subsection 8.3.3 of the chapter on equity. Figure 78 compares
the amount of investment to total expenditures, 1988 to 2000.
0.0
1,000,000.0
2,000,000.0
3,000,000.0
4,000,000.0
1988 1989 1990 1991 1992 1993 1994 1995 1996 1997 1998 1999 2000
Total expenditue Investment
Source: data from Estadísticas históricas de Santa Fe de Bogotá (DAPD 2000)
Figure 78: Investment participation in total expenditure, Bogotá 1988-2000

284
In order to improve efficiency, the technical capacity of the central government needed to be
improved, corruption reduced, and accountability needed to be enhanced. Resources were
directed to increase institutional capacity and reduce administrative costs. A common policy of
the Castro and Mockus administrations was reducing the numbers of personnel in public
institutions. Administrative costs, which accounted for 45 percent of the total expenditure in
1990, were reduced to 26 percent during the Mockus’ administration, and to 20 percent during
the Peñalosa administration (Guzmán and Gutiérrez 2000, p.14). Figure 79 compares
administrative costs with total expenditure.
0.0
1,000,000.0
2,000,000.0
3,000,000.0
4,000,000.0
1988 1989 1990 1991 1992 1993 1994 1995 1996 1997 1998 1999 2000
Total expenditue Functioning
Source: data from Estadísticas históricas de Santa Fe de Bogotá (DAPD 2000)
Figure 79: Participation of functioning costs in total expenditure, Bogotá 1988-2000
The third source to consider for evaluating expenditure is the debt service; which depends on
the terms of the lending agreement; any change in the terms of the contract greatly affect the debt
service. According to a study from the city controller’s office, from 1986 to 1995, the debt
service increased faster than the debt itself. Bogotá paid for debt services 3 billion pesos , while
the total amount of the debt was 2.6 billion pesos (Contraloría Distrital 1996, p.15).
Figure 80 illustrates the debt-service growth rate from 1988 to 1999.

285
-20.00%
0.00%
20.00%
40.00%
60.00%
80.00%
1988 1989 1990 1991 1992 1993 1994 1995 1996 1997 1998 1999 2000
Debt service increment
Source: data from Estadísticas históricas de Santa Fe de Bogotá (DAPD 2000)
Figure 80: Debt service growth rate, 1988-2000
In order to decrease the debt burden, Castro refinanced the public enterprises debt, Mockus
refinanced the central administration’s debt, and Enrique Peñalosa used part of the income from
the capitalization of the EEB in a prepayment for decreasing the amount of debt services.
According to data from the city’s Treasury, after the period between1992 to 1994 in which the
debt service was reduced, the total expenditure on debt service increasedd by 3 percent in 1995.
From 1996 to 1999, the proportion of the total expenditures allocated to servicing the debt,
decreased from 12.6 percent to 5.4; in 2000, the proportion of the total expenditures allocated to
servicing teh debt increased to 8.4 percent. Figure 81 illustrates the proportion of the total
expenditures allocated to servicing the debt.
0.00%
5.00%
10.00%
15.00%
20.00%
25.00%
1988 1989 1990 1991 1992 1993 1994 1995 1996 1997 1998 1999 2000
Debt service/GDP Debt service/Total expenditure
Source: data from Estadísticas históricas de Santa Fe de Bogotá (DAPD 2000)
Figure 81: Expenditures allocated to debt service, Bogotá 1988 to 2000

286
An additional factor affecting the debt service as well as the debt itself is the currency
exchange rate between dollars and pesos, which was not stable for most of the timeframe of this
study; in 1985, it was 172.2 pesos per dollar, in 1990, it increased to 568.73 pesos per dollar and
to 2,300 pesos per dollars in 2005.
8.4.2.3 Public debt157 represents an important indicator of how healthy public finances are; it
implies differed costs that run across time, affecting more than one administration. The objective
of borrowing money is to optimize investment into the city and enhance its capacity to generate
its own resources, thus it is to invest in the productivity of the city. No doubt, this is an
oversimplification, but that is certainly the goal of public administrators, to consider all the
intervening variables and options, and decide what is best.
A good indicator for evaluating the management of the debt is the stock index, which
measures debt as a portion of the city’s GDP. The stock index increased from 20.20 percent in
1988 to 22.61 in 1990, but decreased to 19.48 percent in 1992. From 1993 on, it has a decreasing
trend, ending at 3.49 percent of GDP in 2000. Figure 82 illustrates the participation of the central
government’s debt in the city’s GDP from 1986 to 2000.
0
5
10
15
20
25
1986 1987 1988 1989 1990 1991 1992 1993 1994 1995 1996 1997 1998 1999 2000
% T
otal
deb
t/GD
P
Debt/GDP
Source: data from Estadísticas históricas de Santa Fe de Bogotá (DAPD 2000)
Figure 82: Total debt as part of the GDP, Bogotá 1986-2000
157 Jorge Armando Rodríguez, professor in the Department of economics at the Universidad Nacional de Colombia, generously provided advice for this subsection.

287
Another indicator for evaluating debt management is the amount of debt compared to the
current income of the city. According to a research conducted by the city’s treasury, the the
amount of debt compared to the current income has decreased since 1993, and remained stable at
a value of 47.5 between 1997 and 2000 (Guzmán and Gutiérrez 2000, p.19). Finally, one another
important way to assess the management of the public debt is to examine its sustainability,
meaning whether the long term obligation represented by the interests rates and the cost of
administration will be higher that the contribution of the credit itself.
Debt Sustainability The first indicator chosen to measure debt sustainability158 is capital
flow, which refers to the relationship between the debt service and capital resources. According
to a study from the city’s controller office, between 1986 and 1995 the city’s capital flow was
negative, which means that the amount paid for servicing the debt was higher than the amount
the city received from the actual loan. The same study attributes the deterioration of
sustainability to an increase in interest rates and the devaluation of the Colombian peso (Guzmán
and Gutiérrez 2000, pp.16-17). Figure 83 illustrates the city’s capital flow from 1986 to 1995.
-750000
-500000
-250000
0
250000
500000
750000
1000000
1986 1987 1988 1989 1990 1991 1992 1993 1994 1995Mill
ion
peso
s
Total Credit Resources Total debt service Capital Flow
Source: Evolución de la deuda pública Distrito Capital, 1986-1995
Figure 83: Capital flow, Bogotá 1986-2000
158 Due that, there are several indicators for evaluating debt sustainability, which may affect the results, two indicators were chosen; debt sustainability measurement is a current source of debate among economist.

288
According to this indicator, the sustainability of the debt has been deteriorating. Certainly the
city paid more debt services from 1992 on, which is consistent with the policy of refinancing the
debt and finding alternative sources of funding. During the Mockus administration, in June of
1996, the city signed a loan for US$65 million for investment; this was the first loan ever signed
between a municipality and the World Bank.
The relationship between fiscal revenue and debt service is the second indicator for
evaluating sustainability, which is suggested by the IMF for low-income countries (IMF 2003);
According to this indicator, the debt sustainability in the city has improved steadily from 1991
on. Figure 84 illustrates the relationship between fiscal revenue it from 1988 to 2000.
0.0%
10.0%
20.0%
30.0%
40.0%
1988 1989 1990 1991 1992 1993 1994 1995 1996 1997 1998 1999 2000
Service/f iscal revenue
EOB
Source: data from Estadísticas históricas de Santa Fe de Bogotá (DAPD 2000)
Figure 84: Debt service as a percent of fiscal revenue, Bogotá 1988-2000
8.4.2.4 Investment risk rates159 Bogotá has the best international risk rate in the country,
reflecting the good performance of local finances. According to the risk investment rate, Bogotá
is a good place to invest, because of its payment capacity, solidity and credibility. In 1996, the
city issued a series of domestic bonds; on that occasion the city’s solvency was evaluated by
Standard & Poor’s, and the agency granted the city a risk investment grade of BBB- (Guzmán
and Gutiérrez 2000, p.22). Table 76 presents the risk rates assigned to Bogotá from 1996 to
2000.
159 The risk investment rates are presented in Annex XX.

289
Table 76: Risk Investment rates, Bogotá 1996-2000
Duff & Phelps (Hoy Fitch) Standard & Poor’s
Year Foreign National Foreign National
1996 BBB- BBB- 1997 BBB A BBB- BBB- 1998 BBB A- 1999 BBB- BBB- BBB- BBB- 2000 BB BBB- BB BBB-
Source: Evolución y estado de las finanzas públicas de Bogotá en la década de los noventa y perspectivas
Bogotá was the first municipality in Latin America to receive an investment grade rating
according to international standards; furthermore, only three countries in Latin America, Chile,
Colombia and Uruguay, have been rated by international agencies (Cámara de Comercio de
Bogotá 2003, p.22). The city’s credit rating facilitates its direct relationship with international
financial organizations.

290
9.0 FOR THE PEOPLE, WITHOUT THE PEOPLE DISCUSSION AND RECOMMENDATIONS
“An inclusive city is a place where everyone, regardless of their economic means, gender, ethnicity or religion, is enabled and empowered to fully participate in the social, economic and political opportunities that cities have to offer”
The Global Campaign on Urban Governance, 2000
The study aims to contribute to the quest for good governance in cities around the world; it
assumes that cities are critical arenas for development, not only for economic development but
more importantly for political development. Cities have been the privileged setting for
modernity, the link between the agora and the commune, the public space. It is cities where
anonymity became possible and where diversity became identity. Citizens belong to the city,
which in turn belongs to them; it is a space of freedom, or at least it should be. Yet, cities also
possess the most contradictions; in cities, the ideals of modernity combine with all the limitations
and potentials of humanity.
This chapter presents a summary of the lessons learned from conducting a thorough study on
the process of decentralization in Bogotá, and the effects of it on the system of governance, as
measured by three key variables of good governance: participation, equity, and efficiency.
9.1 LESSONS FROM THE STORY OF DECENTRALIZATION
Lesson one: history counts. The review of the process of decentralization in Bogotá confirms
the critical influence that preexisting social and political conditions have had on the outcomes of
the process. This coincides with the findings of a study from the Woodrow Wilson Center on
decentralization and governance in Latin America; according to the study, the level of success of

291
decentralization can not be viewed outside the historical and political context in which it is
implemented (Tulchin and Selee 2004, p.5).
By recognizing the past, policy makers can incorporate its lessons into the present; even
more importantly, it helps us value the social and political capital accumulated through time. In
Bogotá, the lack of consideration of the political culture and structures that were in place before
the reform impeded the recognition of the limitations and strengths embedded in the system,
particularly in the local systems. Preexisting organizations and forms of participation were
disregarded and left out of the public policy process; the result is the overlapping of new and old
structures, new and old institutions, which unless brought together, often results in much
fragmentation and conflict. The top-down approach of the reform and lack of flexibility of the
central government impeded the recognition and incorporation of the social and political capital
accumulated in preexisting forms of organization and participation.
An overall lack of continuity has historically characterized the political culture in Colombia,
and was clearly present in the implementation of the decentralization reform. Many changes
were made to the legal framework, the procedures, and the formal and informal framework
regulating the relationship between the central government, the local authorities, and the local
communities. Institutions were created and eliminated, with high costs to the city, such as the
case with the local directions of health, which were implemented by one administration only to
be dismantled by the next.
Another pervasive problem of the Colombian political culture that has affected the local
electoral contest is factionalism. As mentioned by Kline, factionalism is the political heritage of
the National Front (Kline 1995, p.49). Given the level of factionalism, the difficulty of
aggregating and personalizing interests should not be surprising; it is a longstanding tradition in
Colombian politics.
Lesson two: level and size matters. Findings from this study confirm the fact that the level and
size of the political arena is a critical variable for understanding how politics work in order to
promote democracy. Decentralization was intended to enhance governance by bringing the state
close to the citizens; in practice, it means to change the government’s scale, to make it smaller
and more horizontal.

292
An empirical study conducted by Olliver looked at the relationship between size and political
participation. According to his findings, “smaller municipalities make participation easier, make
citizens feel more empowered and interested in their communities, and bring neighbors
together” (Oliver 2001). Moreover, according to Oakerson, decentralization also strengthens
political representation, “Higher levels of citizen participation in metropolitan areas coexist with
what I would term ‘strong representation’ […] Strong representation has two principal
dimensions: (1) it is community-based, and (2) it features low ratios of citizens to elected
officials.” He concludes, “The typical metropolitan-suburban pattern amounts to an
extraordinary investment in representation” (Oakerson 2004, pp.34-35).
Findings from this study confirm the previous arguments. In Bogotá, the formalization of
localities as political arenas attracted a lot of participation, around both community issues and
elections. Despite limitations and problems in the quality of participation, certainly, the new
local governance represented a more appropriate scale for Bogotá, due to the size of the city and
the level of social fragmentation. Localities were a new space for political players to compete, in
which local competitors have proven capable of competing with the traditional political forces,
despite the inequality in resources and experience. Recent local elections have attracted the same
level of participation than the elections for Mayor and city councilors, and the level of
participation continues to increase at a higher rate.
A new level of analysis, the local level, was added to the city; problems that were ignored
before were recognized and local representatives have been able to attend to local demands that
were before unknown. Finally, the difference in size of the city’s localities is central to the
current debate on decentralization in Bogotá, as it necessarily affects the quality of participation
and representation. While the district of La Candelaria has one representative per 3,944
inhabitants, the locality of Kennedy only has one representative per The differences in rate of
representative per inhabitants differ as much as from 83,783 inhabitants.
Lesson three: public policy needs planning, consistency, and flexibility. The decentralization
reform in Bogotá was not an initiative that came from the city, but a constitutional mandate.
Because its implementation was not a choice for the city leaders, the much needed discussion
that should have occurred before implementing such an important public policy was never
carried out. There was never a minimum consensus regarding the model of decentralization, the

293
strategies to implement it, or even the problems that decentralization would solve. In
consequence, different and contradictory interpretations and expectations about decentralization
continue to coexist in the city. The mayors implemented the reform according to their own
interpretation, which resulted in many discrepancies in the policy approach. The lack of
consistency and continuation created confusion and disappointment particularly in local players.
In practice, two different formats of decentralization have prevailed, one has been
deconcentration, the central government located its representatives in the localities, while the
control stayed centralized; the service is brought closer to the citizens. The other, more in line
with the new constitution’s aims, resembles devolution of power; local representatives are
elected and they have access to an “independent” budget. Neither the differences between the
two approaches, nor their implications have been recognized, in consequence the two models
coexist in conflict; the result is a duplication of efforts and the emergence of local conflicts
between local authorities and local representatives of the central government.
The overlapping interpretations has also impeded a clear distribution of responsibilities
between central and local authorities. In addition, the lack of flexibility to incorporate local
political players into the decentralization proposal weakened the likelihood of the reform to
succeed.
Finally, unplanned decentralization adds difficulties for coordinating actions and ensuring
efficiency, which is critical for equity. In fact, many efforts intended to enhance the capacity of
the government to deliver services efficiently were hindered by the lack of coherence and
coordination among central and local authorities.
Lesson four: it is about people. As mentioned by Hall and Pfeiffer, “Decentralization must not
be seen as the result of a generous central government giving away powers it owns.
Decentralization is an optimization of power and responsibility which belong to the people; the
people have to decide how best it suits them to express and organize their political will” (Hall
and Pfeiffer 2000, p.169).
In Bogotá, the prevailing model has been paternalistic; people have been invited to
participate, instead of being recognized as critical actors in the city’s political life, with its
limitations and potentials. The central government created a wide set of participatory
294
mechanisms for the people, though it never recognized the value or potential of preexisting
organizations and forms of participation, such as social protests.
Due to the lack of inclusion of the people in the discussion and implementation of the
decentralization reform, citizens never identified with the process, but rather saw it as a proposal
from a not-so-generous central government. They have neither supported nor resisted the reform,
but have continued to watch the central government govern.
The people of Bogotá know very little about decentralization or politics. A survey conducted
in Bogotá on knowledge about the local authorities and their functions showed that the
Bogotanos know little about the political life in the city, the country and their localities (Pizano
2001, p.70). This finding is consistent with the report from the World Bank on successful
decentralization reforms; according to the report, one of the errors that ought to be avoided is
“not preparing and disseminating reliable and exact information about all aspects of
decentralization” (Giugale and Webb 2000).
Lesson five: it is about power. Participation and representation are complementary; they are
different strategies of political involvement, from which people can choose. Nevertheless, in
Bogotá due to the lack of clarity in the distribution of power among central and local authorities,
and a lack of trust by the central government toward local elected officials, a conflict has
emerged between the recently created elected officials and local communities. People were
called to participate in the process of making decisions about local development, and to elect
their local representatives; nevertheless, the central government did not recognized the tier of
government represented by the ediles or local mayors. People learned that the balance of power
continued to favor the center and therefore it was with the center that one had to interact.
Lesson six: public policy is a complex and contradictory process of hope. Gutierrez Sanín,
referring to the hopes and expectations created by decentralization, mentioned that what
happened in Bogotá was a transition from hope to perplexity. “The Bogotanos witnessed that,
despite the creation of a radically new legal and institutional framework, the city’s political life
resembles the past a lot, which they expected to change because of the new arrangements”
(Gutiérrez Sanín 1996, p.36).

295
Public policy implementation always creates new aspirations in the people, in particular in
those that would benefit more from it. In Bogotá, citizens have contradictory perceptions about
decentralization. Initially, the promise of a more accessible government and a more equitable
distribution of power was enough to convince them of decentralization’s virtues, at least initially.
They still perceive it as a positive step toward democratization and inclusion, regardless of
whether this is supported by empirical evidence. Nevertheless, they also perceive that that the
readjustment required for making decentralization real has not taken place yet. The sustainability
of the process is difficult to predict, not because anyone would dare to propose a return to
centralization, but because the ideals of decentralization increase the gap between the aspirations
and achievements of the people of Bogotá.
Finally, because public policy is also about hope, this process could be seen as a process of
incremental learning in the city. Bogotá has become an example for the country; it has shown an
alternative view to politics; it has resisted the temptation of war and remains the chosen refuge
for those in search of a future. While Bogota’s decentralization process illustrates the dynamics
and difficulties of social and political change, it also illustrates the great potentials of democracy.
9.2 LESSONS ABOUT GOVERNANCE
In order to change the system of governance, the civil society, the market and the State must
have a minimum agreement that the change would be advantageous. In order to manage this
level of competition between the different sectors, a government must have a certain level of
maturity. In the case of Bogotá, one may think that with a decentralization reform with so many
difficulties it would be somewhat ingenuous to look for impacts in the system of governance in
Bogotá creditable to the reform. Yet, this is the nature of politics, it is about different interests,
different meanings, and different views, it involves people with different identities; it is supposed
to be difficult. The evidence shows that there above all, decentralization has caused an explicit
change in the governance agreement.

296
Lesson one: it is about conflicting institutional and structural conditions. According to
Mayntz, there are certain institutional and structural preconditions that need to be in place for the
emergence of good governance. She affirmed,
“Effective modern governance can only emerge in societies that meet certain institutional and structural preconditions, both on the side of the political regime and on the side of civil society. Political authorities must be powerful, but not omnipotent. They must be democratically legitimated […] Political authorities must, in other words, be in a general way acceptable as guardians of public welfare. The second essential precondition is the existence of a strong, functionally differentiated, and well organized civil society. To make negotiation with opposite interests and with state authorities both necessary and meaningful, interest organizations must be sufficiently autonomous and resourceful. Finally, there must exist among the different social groups and organizations at least a minimal sense of identification with, and responsibility for, the greater whole, in short, a common identity” (Mayntz 1998).
What the case of Bogotá illustrates is that change may occur in the midst of conflicting and
contradictory institutional and structural conditions. It may not be a systematic and controlled
change, and it will come with significant difficulties and unbalances, yet it is change.
Due to the manipulation of power, the practices of political exclusion and the level of social
fragmentation, the level of legitimacy of local authorities was traditionally very low, even when
their actions appeared to promote public welfare. Yet Bogotá has also a history of public
administrators that, despite their failures, were capable of keeping together a very diverse and
fractured society. There is certain level of legitimacy in the city that most of the country does not
have.
Bogotá does not have a strong, functionally differentiated and well-organized civil society.
Yet, the city has been a leader in coordinating urban protests around the country, and survived
two terrible violent events, the death of Jorge Eliecer Gaitán and the burning of the palace of
justice with the supreme judges of justice on it. Important and recognizable changes have
occurred in the city as result of the decentralization reform, whether intended or not. However,
they are still insufficient in terms of fulfilling the aspirations of the people.
Lesson two: it is about power. Inclusiveness means that more people should be included in the
system and given access to resources; it is about sharing power. As mentioned by Peters and
Pierre, “The broader issue for any self-governing jurisdiction is distributing power among lawful
organizations and institutions so as to establish a governance regime that ensures a satisfactory
balance among competing interest and values (Peters and Pierre 2003, p.21). The distribution

297
function of governing requires a government committed to the common good rather that to
interest groups.
In the case of Bogotá, although there are new players in the system, they are not strong
enough yet to produce a change in the rules of the game. The reorganization of the system of
governance requires a tangible redistribution of power; otherwise, the legitimacy of the
institutions and its structures could deteriorate to a level in which the governability of the city
may be threatened. As mentioned by Peters, “Involvement without the capacity to make the
system perform to implement the decisions made in an open manner may be alienating, and may
be one of the emerging problems of contemporary democratic systems” (Peters 2003).
It is better to avoid political compromises unless there is the willingness to fulfill them. One
must be very careful in promising changes that are not likely to occur, as greater expectations
bring greater frustrations and greater discontent.
Lesson three: it is about using differences for the better good. Good governance requires that,
despite differences, all players in the system assume their share of responsibility for the common
good. In Bogotá there have been important advances in the participation of the private sector in
public business. As mentioned by Torres Melo, the presence of the private sector in urban
development is not new, but its role in the city politics surely is (Torres Melo 2003). The
participation of the private sector has nevertheless serious limitations, as it depends on the good
will of those cooperating; there are not new institutional arrangements or incentives to promote a
long-term commitment.
The lack of flexibility from the central government in accepting and recognizing preexisting
institutions has impeded more participation. There are informal institutions that have unable to
utilize the new formal channels for participation; in Bogotá, not many people have the time or
the resources to be part of formal organizations, yet they are capable of creating contingent
organizations and solving common problems when needed.

298
9.3 CONCLUSIONS
Has the decentralization reform had an impact on the city’s system of governance that makes it
substantially different from the previous system, in terms of its political and programmatic
capacity and characteristics?
This was the main question triggering this study; the answer does not appear to be as straight
forward as desired. All of the indicators reviewed confirmed that the political reform put in
motion by the New Constitution has promoted significant changes in Bogotá. The interviews
reflect a clear recognition that there was a specific point in 1991 (which could be extended until
1993 when the city’s new statute [EOB] was issued) where decentralization occurred.
Interviews, historical documents, and statistical data all recognize a specific “before and after” in
regards to decentralization.
Participation increased significantly in the city; nevertheless, it was designed and proposed
through a top-down approach, which corresponds to a more technical than empowerment-
oriented conceptualization of participation (Torres Melo 2003). The proposal was not discussed
with the citizens, and did not search for, recognize, or celebrate forms and structures of
organization and participation that already existed in the localities. In addition, the expectations
of those promoting the reform often blinded them from recognizing the needs, values, ideals, and
potential of the people. The political capital accumulated through years of participation was not
recognized, nor invested.
Equity was not a priority for any of the administrations reviewed and has not improved beyond
service coverage. The deterioration of employment and increase of the informal sector enlarged
the gap in income distribution and deteriorated the level of well-being of more people than ever
in the city. Positively though the cities began to move from an asistentialistic approach to
designing or at least thinking about public policies instead.
Efficiency, in terms of the management of the city, clearly improved, and the city has been
recognized internationally for its administrative and financial achievements; unfortunately, the

299
better management is not reflected in a more efficient government capable of fulfilling its
mission of granting security and welfare to the citizens.
Certainly there is more participation, both institutionalized and non-institutionalized, than before;
enough to create confusion and disappointment. Social investment has increased significantly,
and from assistentialism the city move to promoting social policies. The city’s investment in
infrastructure has increased service coverage significantly. The poor have some access to internet
and gender appears very timidly in the political discourse of the city. The city’s management is
admired and recognized by international organizations, creditors, and other cities; its
improvement appears unquestionable. Yet, there is more poverty and inequality has either
remained constant or worsened; these problems can’t necessarily be attributed to internal factors
but were definitely not a priority for any of the governments. People were given a voice but no
power; people have always had a voice, those in power that simply not heard.
It is a cleaner city, better organized, with a modern system of transportation, computers in
beautiful libraries where poor kids can read. Yet it is the same city, with the south and the north,
the poor and the rich, the corrupt and the clean; the same very fractured city where governing is
almost impossible.
This study draws important implications for public policy theory and practice
First, the appropriateness of using the relation between expectations/aspirations and
achievements to foresee policy outcomes; public policy aims at closing the gap between the
aspirations and achievements of citizens, but, very importantly this relation changes when a new
policy is introduced.
Second, policy implementation success or failure is highly contextual; therefore the context must
be analyzed and understood in order to increase the possibilities for success and to introduce the
appropriate adjustments during the process.
Third, the need to “translate” traveling concepts; which does not means changing the concept but
translating it into the social and political culture where it is going to be implemented, or they get
lost in translation.

300
Fourth, public policy should rely more on empirical studies than models, due to its practical
nature; in the tradition of grounded theory, it is important to visit the field to learn from it not to
prove the rightness of our models.
Fifth, more empirical studies are needed to close the gap between theory and practice in the
relation between decentralization and (good) governance. Evidence from this case as from others
is not conclusive but shows that the positive relation is not accurate.
Finally, it is important to acknowledge that one of the costs of a political reform is that people
change their expectations; the cost of the promise of decentralization added pressure on the
system of governance, and increased the distance between aspirations and achievement. If there
were no local representatives, people would not expect to be represented; if there were no local
planning meetings, people would not expect to make decisions about the city’s investment; if
there was no money to be allocated, people would not expect to receive it.
It is my believe that there is a better system of governance in place, which could be tested by each one of the indicators reviewed; nevertheless, I do believe that the majority of those that are part of the system have more aspirations than before and may be more disappointed than before. While most people do recognize that positive changes have occurred, the changes have fallen short of what was expected. No one wants to go back but no one thinks we are quite there, yet.
María Victoria Whittingham, Pittsburgh, February 2006

301
APPENDIX A: COLOMBIA, DISPLACEMENT ZONES
Source: UN Humanitarian Situation Room, Colombian Report, Jan. 2004
Figure 85: Colombia IDP zones
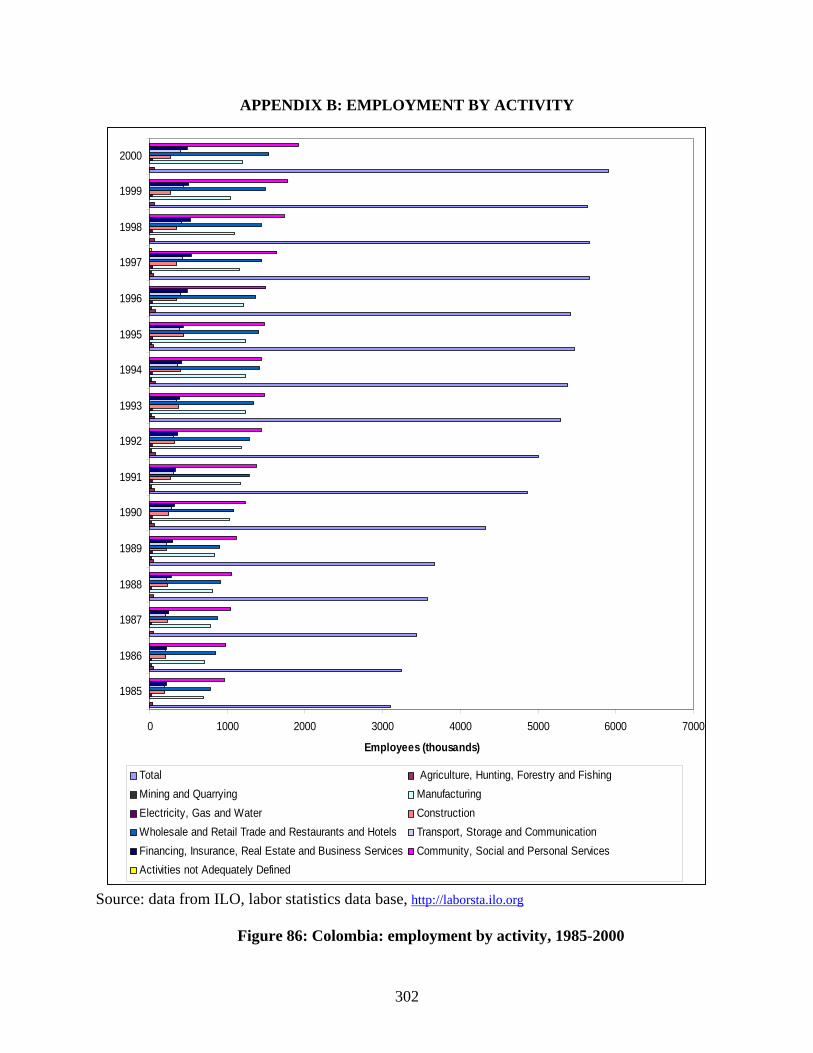
302
APPENDIX B: EMPLOYMENT BY ACTIVITY
0 1000 2000 3000 4000 5000 6000 7000
1985
1986
1987
1988
1989
1990
1991
1992
1993
1994
1995
1996
1997
1998
1999
2000
Employees (thousands)
Total Agriculture, Hunting, Forestry and FishingMining and Quarrying ManufacturingElectricity, Gas and Water ConstructionWholesale and Retail Trade and Restaurants and Hotels Transport, Storage and CommunicationFinancing, Insurance, Real Estate and Business Services Community, Social and Personal ServicesActivities not Adequately Defined
Source: data from ILO, labor statistics data base, http://laborsta.ilo.org
Figure 86: Colombia: employment by activity, 1985-2000

303
APPENDIX C: BOGOTA’S POPULATION GROWTH BY GENDER
Table 77: Bogotá’s population growth by gender
Year Men Women Total 1964 791,946 905,365 1,697,311 1965 840,379 982,789 1,823,168 1966 891,774 1,061,081 1,952,855 1967 946,313 1,140,186 2,086,499 1968 1,004,186 1,220,024 2,224,210 1969 1,065,600 1,300,516 2,366,116 1970 1,130,769 1,381,531 2,512,300 1971 1,199,923 1,463,077 2,663,000 1972 1,273,307 1,484,054 2,757,361 1973 1,351,179 1,503,886 2,855,065 1974 1,419,053 1,592,100 3,011,152 1975 1,490,336 1,685,437 3,175,773 1976 1,574,624 1,814,298 3,388,922 1977 1,698,488 1,893,988 3,592,476 1978 1,775,267 2,026,566 3,801,833 1979 1,888,715 2,137,112 4,025,827 1980 1,975,966 2,238,416 4,214,382 1981 2,009,484 2,249,368 4,258,851 1982 2,043,570 2,260,220 4,303,790 1983 2,078,234 2,270,968 4,349,202 1984 2,113,486 2,281,608 4,395,094 1985 2,029,427 2,273,516 4,302,943 1986 2,083,197 2,325,691 4,408,888 1987 2,142,098 2,384,970 4,527,068 1988 2,204,964 2,449,528 4,654,492 1989 2,271,366 2,518,302 4,789,668 1990 2,337,919 2,587,156 4,925,075 1991 2,406,263 2,655,742 5,062,005 1992 2,475,710 2,727,615 5,203,325 1993 2,550,100 2,805,880 5,355,980 1994 2,628,515 2,888,906 5,517,421 1995 2,706,584 2,971,758 5,678,342 1996 2,774,746 3,040,762 5,815,508 1997 2,844,556 3,112,437 5,956,993 1998 2,920,583 3,191,611 6,112,194 1999 3,000,751 3,275,677 6,276,428 2000 3,037,094 3,400,748 6,437,842
Source: DAPD, historical statistics 1950-1999 (CD).

304
APPENDIX D: INTERNATIONAL AGENCIES DEFINITIONS
Table 78: Good governance, definitions
Agency Governance Good Governance
UNDP (Internet Conference Forum on “Public Private Interface in Urban Environment Management”)
Governance comprises the complex mechanisms, processes, and institutions through which citizens and groups articulate their interest, mediate their differences, and exercises their legal rights and obligations
Is among other things participatory, transparent and accountable. It is also effective and equitable and it promotes the rule of law. It assures that priorities are based on broad consensus in society and that the voices of the poorest and the most vulnerable are heard in decision –making over the allocation of development resources.
UN-ESCAP
The process of decisions – making and the process by which decision are implemented (or not implemented). Governance can be used in several contexts such as corporate governance, international governance, national governance and local governance.
The Commission on Global Governance
Governance is the sum of the many ways individuals and institution, public and private, manage their common affairs. It is a continuing process through which conflicting or diverse operative action may be accommodated and cooperative action may be taken. It includes formations and regimens empowered to enforce compliance as well as informal arrangements that people and institutions have agreed or perceive to be in their interest.
Novartis Foundation for Sustainable Development
Governance is the art of public leadership. There are three distinct dimensions of governance:
1. The form of political regime; 2. The process by which authority is
exercised in the management of a country’s economic and social resources; and
3. The capacity of governments to design, formulate and implement policies and discharge functions
The governance Working Group of International Institute of Administrative Sciences
Governance refers to the process whereby elements in society wield power and authority, and influence and enact policies and decisions concerning public life, and economic and social development. Governance is a broader notion than government. Governance involves interaction between these formal institutions and those of civil society
World Bank
Good governance is epitomized by predictable, open enlightened policy –making, a bureaucracy imbued with a professional ethos acting in furtherance of the public good, the rule of law, transparent processes, and a strong civil society participating in public affairs.
305
APPENDIX E: INSTITUTIONS PROMOTING GOOD GOVERNANCE PROJECTS
- The Institute on Governance: a Canadian non-profit organization created in 1990 to promote
effective governance. It concentrates in four themes: citizen participation, aboriginal governance,
building policy capacity, and accountability and performance measurement.
- The Canadian Centre for Management Development: an agency of the Canadian government
with a research agenda that focuses on modernizing governance around four sub-themes: citizens
and citizenship, changes affecting representative democracy, the future role of government, and
future public services reforms. Visit www.ccmd-ccg.gc.ca
- The World Bank: that has funded several research projects on urban governance through its
urban development section. The projects concentrate on promoting greater state responsiveness
and accountability, and evaluating the relationship between governance and economic
performance. Visit www.worldbank.org/
- The Inter-American Dialogue: an independent center for policy analysis on U.S.-Latin
American economic and political relations. Its research agenda focuses on four themes:
democratic governance, inter-American cooperation, economic integration, and social equity.
Visit http://www.thedialogue.org/
- The United Nations: in particular the United Nations Development Program (UNDP) and the
Center for Human Settlements (HABITAT). Two projects are particularly important, The Urban
Governance Initiative-TUGI, a project developed and funded by UNDP, visit
http://www.tugi.org/; and the Global Campaign on Urban Governance, a project lead by
HABITAT, that aims to contribute to the eradication of poverty through improved urban
governance, visit www.unhabitat.org/governance

306
APPENDIX F: GOVERNANCE RESEARCH PROJECTS
Table 79: Research projects on Governance

307

308
∗ These are projects selected from 64 research projects listed in the World Bank web page under governance.

309
APPENDIX G: LIST OF ORGANIZATIONS
Organization Web Alcaldia Mayor de Bogota (City Major Office) www.alcaldiabogota.gov.co
Alcaldia Menor de Teusaquillo http://www.segobdis.gov.co/teusaquillo/Inicio.html Archivo Distrital (Archive City) www.alcaldiabogota.gov.co/ archivo
Bogotá Cómo Vamos (Bogota, How are we going?) http://www.fundacioncorona.org.co/gestion_local/proyecto_bcv.htm
Camara de Comercio de Bogota (Bogota's Chamber of Commerce) http://camara.ccb.org.co/
Centro de Investigación y Educación Popular CINEP (Popular Education and Research Center) www.cinep.org.co
Departamento Administrativo de Planeacion Distrital (City's Planning Office) www.dapd.gov.co/
Concejo Como Vamos (City Council How is it doing?)
http://www.fundacioncorona.org.co/gestion_local/proyecto_bcv.htm
Concejo de Bogota (City Council) www.concejobogota.gov.co Departamento Administrativo de Acción Comunal
(Comunal Action Administrative Deparment) www.accioncomunal.gov.co
Departamento Administrativo de Bienestar Social (Social Services and Welfare Dpt.) www.bienestarbogota.gov.co
Departamento Nacional de Planeacion (National Planning Deparment) www.dnp.gov.co
Departemento Administrativo Nacional de Estadisticas DANE (Statistics National Deparment) www.dane.gov.co
Fundación Corona www.fundacioncorona.org.co Fundacion Foro Nacional por Colombia www.foro.org.co
Observatorio de Cultura Urbana (City's Urban Observatory)
http://www.culturayturismo.gov.co/investigacion/observatorio_de_cultura_urbana/?disp4=tab
Oficina de convivencia y seguridad ciudadana (Security and Coexistence city's government office)
Planeación Distrital (City Planning Office) http://www.dapd.gov.co/ Programa de Desarrollo De Naciones Unidas PNUD
(Union Nations Development Programme) www.undp.org
Red Bogotá www.redbogota.com Secretaria de Gobierno del Distrito (City's
government secretaria) www.segobdis.gov.co
Secretaria de Hacienda Distrital (City's Treasurer) www.shd.gov.co U.Jorge Tadeo Lozano www.utadeo.edu.co/
Univerciudad www.unal.edu.co Universidad de los Andes www.unal.edu.co
Universidad Externado de Colombia www.uexternado.edu.co Universidad Javeriana www.javeriana.edu.co

310
APPENDIX H: LIST OF INTERVIEWEES
Name Profession Position Date
Alberto Maldonado Economist Researcher and Consultant-City's government secreatry
Tuesday, November 11,
2003
Alex-Smith Araque Economist Econometrist DAPD -City's Planning Office
Angela Maria Robledo Psichologist
Director -Departamento Administrativo de Bienestar Social (Social Services and Welfare Dpt.)
Thursday, November 27,
2003
Antana Mockus Mathematician, philosopher
City's Major, 1998 and 2000 - City Major Office
Saturday, November 15,
2003
Carlos Carreño Edil Santafé (local board member) Thursday,
January 27, 2005
Efraín Sánchez Director, Observatory of Urban Culture
Enrique Peñalosa Economist City's Major, 2000 and 2004 - City Major Office
Tuesday, November 04,
2003
Fabio Zambrano Historian Professor - Universidad de los Andes Wednesday,
November 12, 2003
Fridole Ballén Economist Economist-Security/ city's government office
Gerardo Burgos Lawyer and Local relations secretary and manager of the political culture program under Antanas I
Hipólito Moreno City Council representative - City Council
Jaime Castro
Layer, MA in Public manager,Senator and Vice-Minester
Mayor, 1992 -City Major Office
Monday, November 10,
2003
Jaime Silva Industrial Engineer Consultant
Tuesday, November 11,
2003Jhon Wilson Buitrago Professional - Camara de Comercio
Jorge Bustamante Head of Planning in Juán Martin's gov.
Juan Martín Caicedo Mayor, 1990 - consultor/empresario Wednesday,
November 26, 2003
Lariza Pizano
Master in Political Science, university professor
City Council representative
Friday, November 14,
2003
Luis Fernando Molina Director Archivo Distrital
Thursday, November 27,
2003
Luis Ignacio Betancur
City's Treasure, Juán Martín Caicedo

311
Margareth Flórez Subdirectora equipo técnico- Fundación Corona
Tuesday, November 18,
2003
María del Rosario Bonilla Consultora Localidades
Wednesday, November 19,
2003
María Fda. Sanchez Directora - Bogotá Cómo Vamos Tuesday,
November 18, 2003
Martha Cecilia García
Researcher specialized in the city
CINEP
Mauricio Gracia Relatoria juridica - General secretariat office of the Major
Thursday, November 20,
2003
Paola Tovar
Researcher -2000 - City Major Office
Paul Bromberg Physicist , university professor
Mayor in 1998, edil of Teusauillo, researcher, u. professor, and founder of Univerciudad
Tuesday, January 25,
2005
Raúl Lazala Local mayor Saturday,
January 29, 2005
Raúl Velasquez Attorney, researcher and Professor - Universidad Javeriana
Susana Shuster Local board member - Localidad de Teusaquillo
Wednesday, January 26,
2005
Tania Guzman Sociologist Researcher, Director - Concejo Como Vamos
Thierry Lulle Urbanist, university professor
French Researcher - Universidad Externado de Colombia
Tuesday, November 18,
2003Hernán Suárez Journalist
Martha Martín Economist, Master in Political Science
Director COL-Ciudad Bolivar, DABS (Social Services and Welfare Dpt.)

312
BIBLIOGRAPHY ACNUR, and Bogotá Cómo Vamos. 2003. La Población Desplazada en Bogotá, una
responsabilidad de todos. Edited by M. C. Ramos, Foro sobre la Población Desplazada en Bogotá. Bogotá: Casa Editorial El Tiempo.
Agüero, Felipe, and Jeffrey Stark. 1998. Fault lines of democracy in post-transition Latin America. Coral Gables, Fla. North-South Center Press/University of Miami: Boulder CO.
Ai Camp, Roderic, ed. 1996. Democracy in Latin America: patterns and cycles, Jaguar books on Latin America; no. 10. Wilmington, Del.: SR Books.
Alcaldía Mayor, and Cámara de Comercio de Bogotá. 1987. Bogotá para todos: plan de desarrollo social y económico, 1987-1990. 2a versión, para comentarios. ed. Vol. II. Bogotá: La Alcaldía, La Cámara.
Alcaldía Mayor de Bogotá, Secretaría General. 2005. Regímen Legal de Bogotá; compilación de Normatividad, Doctrina y Jurisprudencia.
Alesina, Alberto. 2000. Institutional Reforms in Colombia. In Working Papers-Documentos de Trabajo No.21. Bogotá: Fedesarrollo.
———. 2001. Reformas institucionales en Colombia. 1. ed, Libros de cambio. Bogotâa: FEDESARROLLO: Alfaomega.
Alesina, Alberto, Alberto Carrasquilla, and Juan José Echavarría. 2000. Decentralization in Colombia. In Working Papers Series- Documentos de Trabajo No.15. Bogotá: Fedesarrollo.
Alfonso, Oscar, Noriko Hataya, and Samuel Jaramillo. 1997. Organización popular y desarrollo urbano en Bogotá. 1. ed. Santafé de Bogotá: Universidad Externado de Colombia Facultad de Economía.
Angell, Alan, Pamela Lowden, and Rosemary Thorp. 2001. Decentralizing development: the political economy of institutional change in Chile and Colombia, Variation: Queen Elizabeth House series in development studies. Oxford: Oxford University Press.
Archbishop Celestino Migliore. 2004. New York, 5 October. Ardila Galvis, Constanza. 2000. The heart of the war in Colombia. London: Latin American
Bureau. Ardila Gómez, Arturo. 1997. Gestión Local y Descentralización. Santa Fe de Bogotá 1995-1997:
Alcaldía Mayor de Santa Fe de Bogotá,Secretaría de Gobierno, Subsecretaría de Asuntos Locales.
Arocha, Jaime, and Gonzal Sánchez G., [et al.]. 1987. Colombia, violencia y democracia: informe presentado al Ministerio de Gobierno. Bogotá: Centro Editorial, Universidad Nacional de Colombia.
Arquidiócesis de Bogotá, and CODHES. 1997. Desplazados por violencia y conflicto social en Bogotá. Bogotá: Arquidiócesis de Bogotá: CODHES.
Arriagada, Camilo. 2000. Pobreza en América Latina: nuevos escenarios y desafíos de políticas para el hábitat urbano, Medio ambiente y desarrollo; 27. Santiago de Chile: Naciones Unidas CEPAL División de Medio Ambiente y Asentamientos Humanos.
Asesoría y Gestión. 1997. Mejoramiento de la Gestión Alcaldía Local de San Cristobal: Informe de Diagnóstico. Bogotá: Fundación Corona.
Ashford, Douglas Elliott. 1976. Democracy, decentralization, and decisions in subnational politics, Sage professional papers in comparative politics; ser. no. 01-059. Beverly Hills, Calif.: Sage Publications.

313
Attanasio, O, and M. Székely. 2004. Household saving in developing countries: inequality, demographics and all that. How different are Latin America and South East Asia [IADB website] 2000 [cited March 15 2004].
Avance Jurídico. 2005. Leyes desde 1992 - Vigencia Expresa y Sentencias de Constitucionalidad. Bogotá: Avance Jurídico Casa Editorial Ltda.
Báez R., Javier Eduardo. 2001. Inequidades en el empleo en los noventa: ¿quiénes son más vulnerables y por qué? Coyuntura Social (25):149-179.
Bajraj, Reynaldo F., Miguel Villa, and Jorge Rodríguez. 2000. Población y desarrollo en América Latina y el Caribe: un desafío para las políticas públicas, Serie Población y desarrollo; 7. Santiago de Chile: Naciones Unidas CEPAL Centro Latinoamericano y Caribe ño de Demografía (CELADE) División de Población.
Balbis, Jorge, and Abelardo Sánchez León, eds. 2000. Elecciones y cambios políticos en América Latina. Lima: Desco.
Bárcena, Alicia, ed. 2000. From rapid urbanization to the consolidation of human settlements in Latin America and the Caribbean: a territorial perspective. Santiago, Chile: United Nations Economic Commission for Latin America and the Caribbean-ECLAC.
Bejarano, Ana María, and Andrés Dávila L., eds. 1998. Elecciones y democracia en Colombia, 1997-1998. 1. ed. Santafé de Bogotá: Universidad de los Andes, Departamento de Ciencia Política: Fundación Social: Veeduría Ciudadana a la Elección Presidencial.
Beltrand, Diego, CODHES, and IOM. 2003. Destierros y desarraigos. Memorias del II Seminario Internacional Desplazamiento: implicaciones y retos para la gobernabilidad, la democracia y los derechos humanos. Bogotá, Colombia: Consultoría para los Derechos Humanos y el Desplazamiento: Organización Internacional para las Migraciones.
Bennett, R. J. 1990. Decentralization, local governments, and markets: towards a post-welfare agenda. Oxford Clarendon Press: New York.
———. 1994. Local government and market decentralization: experiences in industrialized, developing, and former Eastern bloc countries. Tokyo: New York.
Berry, Albert, and Jaime G. Tenjo. 1999. Income Distribution Effects of Trade Liberalization and labor Reform in Colombia. In Colombia: An Open Economy? edited by C. M. Callahan and F. R. Gunter. Stamford: JAI Press Inc.
Biglaiser, Glen, and Karl Derouen Jr. 2004. The Expansion of Neoliberal Economic Reforms in Latin America. International Studies Quarterly No.48:561-578.
Boisier, Sergio [et al.]. 1992. La Descentralización: el eslabon perdido de la cadena transformación productiva con equidad y sustentabilidad, Cuadernos del ILPES; 36. Santiago de Chile: CEPAL-ILPES Naciones Unidas.
Bolivar, Ingrid, and Edgar Reveiz. 1998. Estatuto Orgánico: Un Instrumento para la Gobernabilidad en el Distrito Capital. Bogotá: Fundación Corona, PROCOMUN.
Bonilla González, Ricardo. 2003. Empleo y Política Sectorial. In La Falacia Neoliberal: Crítica y Alternativas, edited by D. I. Restrepo Botero. Bogotá: Universidad Nacional de Colombia, Vicerrectoría Académica y Sede Bogotá.
Bonilla, Maria del Rosario, Orlando Pulido, and CEAD. 2002. Gestión Pública y Administración Distrital. In Cartillas. Bogotá: Departamento Administrativo de Bienestar Social.
Bonilla, Rosario, Orlando Pulido, and CEAD. 2002. Gestión Pública y Administración Distrital. In Cartillas. Bogotá: Departamento Adminsitrativo de Bienestar Social.

314
Borja, Jordi, ed. 1989. Estado, descentralizaciâon y democracia. 1a ed, Colecciâon Ciudad y democracia. Bogotâa: Foro Nacional por Colombia.
Botero Restrepo, Camila. 1998. Elecciones en Bogotá, 1997. In Elecciones y democracia en Colombia, 1997-1998, edited by A. M. Bejarano and A. Dávila L. Santafé de Bogotá: Universidad de los Andes, Departamento de Ciencia Política: Fundación Social: Veeduría Ciudadana a la Elección Presidencial.
———, ed. 1987. Función pública y descentralización. 1a ed. Bogotá: Centro Interdisciplinario de Estudios Regionales de la Universidad de los Andes.
Boudon, Lawerence. 2000. Party System Deinstitutionalization: The 1997-98 Colombian Elections in Historical Perspective. Journal of Interamerican Studies and World Affairs 42 (No. 3):33-57.
Bouillon, Cesar P., and Mayra Buvinic. 2003. Inequality, Exclusion and Poverty in Latin America and the Caribbean: Implications for Development. In SOCIAL COHESION IN LATIN AMERICA AND THE CARIBBEAN. Brussels: IADB.
Bourguignon, François, Francisco H. G. Ferreira, and Nora Lustig. 2004. The microeconomics of income distribution dynamics in East Asia and Latin America. Washington, DC: World Bank: [New York].
Bresser Pereira, Luiz Carlos, and Peter Spink. 1999. Reforming the state: managerial public administration in Latin America. Boulder: Lynne Rienner Publishers.
Buchanan, James M. 1986. Liberty, market, and state: political economy in the 1980s. Brighton, Sussex: Wheatsheaf Books: Distributed by Harvester Press.
———. 1988. The political economy of the welfare state. Stockholm: The Industrial Institute for Economic and Social Research: Distribution Almqvist & Wiksell.
Buchanan, James M., and Richard Abel Musgrave. 1999. Public finance and public choice: two contrasting visions of the State. Cambridge, Mass.: MIT Press.
Buchanan, James M., Charles Kershaw Rowley, and Robert D. Tollison. 1987. Deficits. Oxford, OX, UK; New York, NY: Basil Blackwell.
Buchanan, James M., and Robert D. Tollison. 1984. The Theory of public choice--II. Ann Arbor: University of Michigan Press.
Bueno Sánchez, Eramis, Ivonne Farah H, and Beatriz Nápoli. 1994. El mundo de la informalidad: una nueva incursión, Serie Estudios. Población y empleo; 1. La Paz: Instituto de Investigaciones Sociológicas U.M.S.A.
Burki, Shahid Javed, Sri-Ram Aiyer, and Rudolf Hommes, eds. 1998. Annual World Bank Conference on Development in Latin America and the Caribbean, 1996: poverty and inequality, proceedings of a conference held in Bogotá, Colombia, World Bank Latin American and Caribbean studies. Washington, D.C.: World Bank.
Burki, Shahid Javed, and Guillermo Perry. 1998. Beyond the Washington consensus: institutions matter, World Bank Latin American and Caribbean studies.; Viewpoints. Washington, D.C.: World Bank.
Bushnell, David. 1993. The making of modern Colombia: a nation in spite of itself. Berkeley: Univ. of California Press.
Bustamante, Darío, ed. 1995. Antanas-- del mito al rito. Bogotá, Colombia: s.n. Cable, Vincent. 1999. Globalization and global governance, Chatham House papers; Variation:
Chatham House papers (Unnumbered). London Royal Institute of International Affairs: London New York.

315
Caicedo Ferrer, Juán Martín. 2003. "Hay que tumbar al alcalde" El juego de la política en Colombia. Bogotá: Círculo de Lectores.
Calderón, Valentina, and José Daniel Reyes. 2000. Posición económica general y competitividad: Colombia en el contexto latinoamericano. 1. ed. Santa Fe de Bogotá: Unidad de Análisis Macroeconómico Departamento Nacional de Planeación.
Callahan, Colleen M., and Frank R. Gunter, eds. 1999. Colombia: an opening economy? Vol. v. 84, Contemporary studies in economic and financial analysis. Stamford, Conn.: JAI Press.
Cámara de Comercio de Bogotá. 1991. Bogotá en la década de los 80: indicadores para la toma de decisiones en la década del noventa, Serie Biblioteca Cámara de Comercio de Bogotá; no. 40. Santa Fé de Bogotá, D.C.: Cámara de Comercio de Bogotá.
———. 1999. El mercado de trabajo bogotano, 1990-1998. 1a ed. Santa Fe de Bogotá: Cámara de Comercio de Bogotá.
———. 2000. Decisiones estratégicas para Bogotá de las tres últimas administraciones. Bogotá: Cámara de Comercio de Bogotá.
———. 2003. Si yo fuera Alcalde. Propuesta de la Cámara de Comercio de Bogotá a los candidatos a la Alcaldía Mayor. Bogotá: Cámara de Comercio de Bogotá.
———, ed. 1990. Bogotá: prioridad social. Plan de desarrollo económico y social, 1990-1994. 2 vols. Bogotá: Cámara de Comercio de Bogotá.
Cámara de Comercio de Bogotá, and Federación Nacional de Comerciantes. 2001. Tributación, Crecimiento y Actividad Empresarial. Elementos de Análisis al caso Bogotano. Bogotá: Cámara de Comercio de Bogotá y Federación Nacional de Comerciantes.
Campbell, Tim. 2003. The quiet revolution: decentralization and the rise of political participation in Latin American cities, Pitt Latin American series. Pittsburgh, Pa.: University of Pittsburgh Press.
Campbell, Tim, and Harald Fuhr. 2004. Leadership and innovation in subnational government: case studies from Latin America, WBI development studies. Washington, D.C.: World Bank.
Campos, Yezid, and Ismael Ortiz, eds. 1998. La ciudad observada: violencia, cultura y política. 1. ed, Ciudades y ciudadanía. Santafé de Bogotá: Observatorio de Cultura Urbana, TM Editores.
Cano, Elvia. 1994. La situación de la mujer. In Bogotá hoy: democracia, convivencia y poblaciones vulnerables, edited by G. Segovia Mora. Bogotá: Consejería para Asuntos Sociales-Alcaldía Mayor de Santafé de Bogotá, Consejería Presidencial para la Juventud la Mujer y la Familia.
Cárdenas S., Mauricio, and Nora Lustig, eds. 1999. Pobreza y desigualdad en América Latina. 1. ed. Santafé de Bogotá: Tercer Mundo, Fedesarrollo.
Cardona Gutiérrez, Ramiro, and Alan B. Simmons. 1978. Destino la metrópoli: un modelo general de las migraciones internas en América Latina. Bogotá: Corporación Centro Regional de Población.
Carrillo-Flórez, Fernando, and Carlo Binetti, eds. 2004. ¿Democracia con Desigualdad? Una mirada de Europa hacia América Latina. París: Banco Interamericano de Desarrollo; Comisión Europea.
Carrión, Fernando. 1994. Ciudad y violencias en América Latina, Serie Gestión urbana; vol. 2. Quito: Programa de Gestión Urbana.

316
———. 2003. Procesos de descentralización en la Comunidad Andina. 1. ed, Foro; Variation: Foro (FLACSO (Organization). Sede Ecuador). Quito, Ecuador: FLACSO Sede Organización de Estados Americanos.
Castells, Manuel. 1973. Imperialismo y urbanización en América Latina, Colección Ciencia urbanística; 12. Barcelona: G. Gili.
Castells, Manuel comp. 1974. Estructura de clases y política urbana en América Latina. [1. ed: Buenos Aires] Ediciones SIAP.
Castells, Manuel, and Humberto Solares Serrano. 1988. Crisis urbana, estado y participación popular: (seminario dictado por el Dr. M. Castells, Cochabamba, 31 julio al 3 agosto 1985). 1. ed. Cochabamba, Bolivia: Colegio de Arquitectos de Cochabamba.
Castro C., Jaime. 1991. Informe-Ponencia para Primer Debate en plenaria del Ordenamiento Territorial. Gaceta Constitucional (No.80):p.6.
Castro, Jaime. 1994. Reflexiones acerca del estatuto orgánico de Santafé de Bogotá, Serie Biblioteca Cámara de Comercio de Bogotá; no. 59. Santafé de Bogotá: Cámara de Comercio de Bogotá.
Castro, Jaime, Iván Jaramillo, and Mauricio Cabrera Galvis. 2001. Transferencia = déficit fiscal? regiones o departamentos? 1. ed. Bogotá: FESCOL: VIVA: FENACON: Fundación Foro Nacional por Colombia.
CCB, Federación Nacional de Comerciantes. 2001. Tributación, crecimiento y actividad empresarial: elementos de análisis al caso Bogotano. Bogotá: Cámara de Comercio de Bogotá.
CELADE. 1999. América Latina: proyecciones de población urbana y rural 1970-2025. In Boletín demográfico. Vol. 32, No. 63 (Jan. 1999). Santiago de Chile: Latin American demographic center.
CEPAL, and PNUMA. 2001. La Sostenibilidad del desarrollo en América Latina y el Caribe: desafíos y oportunidades. Santiago: CEPAl, PNUMA.
Cepeda, Manuel José. 1991. Los Derechos y la Interpretación de la Constitución de 1991. Ciencia Política (25):3-9.
Cepeda Ulloa, Fernando. 1995. La Aventura de Sobrevivir en Bogotá. In Antanas-- del mito al rito, edited by D. Bustamante. Bogotá: s.n.
Chackiel, Juan. 2000. La dinámica demográfica en America Latina, Serie Población y desarrollo; 52. Santiago de Chile: Naciones Unidas, Comisión Económica para América Latina y el Caribe: Centro Latinoamericano y Caribeño de Demografía, División de Población.
Cheema, G. Shabbir, and Dennis A. Rondinelli, eds. 1983. Decentralization and development: policy implementation in developing countries. Beverly Hills: Sage.
Cifuentes Noyes, Ariel, ed. 1994. Diez años de descentralización: resultados y perspectivas. 1a ed. Bogotá, Colombia: FESCOL.
CLAD, Consejo Científico. 1998. Una nueva gestión pública para América Latina: Uma nova gestão pública para América Latina = A new public management for Latin America, Documento del CLAD; Documento do CLAD; CLAD's document. Caracas, Venezuela: Centro Latinoamericano de Administración para el Desarrollo (CLAD).
———. 2000. La responsabilización en la nueva gestión pública latinoamericana. 1a. ed. Buenos Aires, Argentina: Editorial Universitaria de Buenos Aires.
Claval, Paul. 2003. City and culture. Ekistics, Oikistike; the problems and science of human settlements 70 (418/419):36-41.

317
Cochrane, Glynn. 1983. Policies for strenghthening local government in developing countries, World Bank staff working papers; no. 582. Management and development series; no. 9. Washington, D.C., U.S.A.: World Bank.
CODHES; Jorge E. Rojas Rodríguez. [et al.]. 1999. Pais que huye: desplazamiento y violencia en una nación fragmentada. Santa Fe de Bogotá: CODHES, UNICEF-Colombia.
Colombia's War on Children. 2004. New York: Watchlist on Children and Armed Conflict Project.
Consejo Territorial de Planeación de Bogotá. 1995. Concepto sobre el Proyecto de Plan de Desarrollo "Formar Ciudad"1995-1997: Consejo Territorial de Planeación de Bogotá.
Constitución Política de Colombia. 1991. Presidencia de la República, Consejería para la Modernización del Estado.
Contraloría de Santafé de Bogotá. 1995. Gestión de las Localidades del Distrito Capital 1992-1994.
———. 2000. Informe anual de la evaluación de la gestión enero-diciembre de 1999 de la UEL-IDU: Contraloría de Santafé de Bogotá.
———. 2000a. Informe de control fiscal: evaluación de la gestión global de la UEL del DAMA: Contraloría de Santafé de Bogotá.
———. 2000b. Informe de Control Fiscal UEL de la Secretaría de Gobierno: Contraloría de Santafé de Bogotá.
Contraloría Distrital. 1996. Evolución de la deuda pública, Distrito Capital, 1986-1995. Santafé de Bogotá, D.C.: Contraloría de Santafé de Bogotá.
Corporación Raices. 2002. Centro de Gestión Comunitaria para Bogotá (C.G.C.), Estudio de Factibilidad. Bogotá: Fundación Corona.
Corposur. 1996. Sistematización y evaluación del proceso del proceso adelantado en las 20 localidades de Bogotá con la aplicación del Decreto 425/95: Corporación Sur.
———. 1997. Proceso de planeación local en Bogotá, Análisis de complementariedad. Bogotá: Alcaldía Mayor.
Correa, Patricia, and Roberto Steiner. 1999. Decentralization in Colombia: recent changes and main challenges. In Colombia: an Open Economy? edited by C. M. Callahan and F. R. Gunter. Stamford, Conn.: JAI Press.
Corredor Martínez, Consuelo. 2003. El Problema del Desarrollo. In La Falacia Neoliberal: Crítica y Alternativas, edited by D. I. Restrepo Botero. Bogotá: Universidad Nacional de Colombia, Vicerrectoría Académica y Sede Bogotá.
Corredor Martínez, Consuelo.[et al.]. 1998. Equidad y política social en Colombia. 2 vols. Bogotá, Colombia: Universidad Nacional de Colombia, Facultad de Derecho Ciencias Políticas y Sociales, Facultad de Ciencias Económicas.
Corte, Beltrina, and Camilo González. 1989. Planeación urbana y participación popular en Bogotá. Bogotá: Centro de Investigación y Educación Popular.
Crenson, Matthew A. 1978. Social Networks and Political Processes in urban Neighborhoods. Journal of Political Science 22 (3):578-594.
Cunill, Nuria. 1991. Participación Ciudadana. Dilemas y Perspectivas para la Democratización de los Estados Latinoamericanos. Caracas: Centro Latinoamericano de Administración para el Desarrollo-CLAD.
———. 1995. La rearticulación de las Relaciones Estado-Sociedad: En Búsqueda de Nuevos Sentidos. Reforma y Democracia, Julio, 1995, 28-58.

318
Cunill, Nuria, ed. 1990. Descentralización político-administrativa: bases para su fortalecimiento, Serie Temas de coyuntura en gestión pública; 3. Caracas: Centro Latinoamericano de Administración para el Desarrollo, Centro de Documentación.
DABS; PUJ. 2003. Inclusión social y nuevas ciudadanías: condiciones para la convivencia y seguridad democráticas. 1a. ed, Seminario Internacional. Bogotá, Colombia: Departamento Administrativo de Bienestar Social; Pontificia Universidad Javeriana Facultad de Ciencias Políticas y Relaciones Internacionales.
DAPD. 2000. Estadísticas Históricas Santafé de Bogotá D.C. 1950-1999. Bogotá: Alcaldía Mayor de Santa Fe de Bogotá D.C.: Departamento Administrativo de Planeación Distrital, Subdirección Económica de Competitividad e Innovación. CD.
DAPD, SECI. 1999. Observatorio de Dinámica Urbana. Bogotá: Departamento Administrativo De Planeación Distrital, Subdirección Económica, de Competitividad e Innovación.
DAPD, Subdirección de Planeamiento Económico y Social. 1996. Desarrollo Humano y Progreso Social en Santa Fe de Bogotá, D.C. Balance y Perspectivas. In Formar Ciudad. Bogotá: Alcaldía Mayor, DAPD.
Dávila Ladrón de Guevara, Andrés, and Miguel García Sánchez. 2000. Control Político y Control Ciudadano en Bogotá. In Misión de Reforma Institucional de Bogotá. Servicio civil y mecanismos de control, edited by I. Fainboim, G. Miguel; and M. C. Uribe. Bogotá: Alcaldía Mayor de Bogotá, Secreatría de Hacienda Distrital.
De Ferranti, David M. 2004. Inequality in Latin America: breaking with history? World Bank Latin American and Caribbean studies.; Viewpoints. Washington, DC: The World Bank.
Deininger, Klaus W., and Lyn Squire. 2002. Revisiting inequality: new data, new results, Distinguished lecture series; 18. Cairo, Egypt: The Center.
Departamento Administrativo de Planeación Distrital. 1995. Formar Ciudad: relación de proyectos incluídos en el Plan de Desarrollo Económico y social y de Obras Públicas para Santa Fe de Bogotá, D.C., 1995-1997. In Formar Ciudad, Documento No.3. Bogotá: DAPD-SPES.
Dethier, Jean-Jacques. 2000. Governance, decentralization, and reform in China, India, and Russia. Boston: Kluwer Academic Publishers.
Diaz Uribe, Eduardo. 1994. El Desafío de la Participación. In Bogotá hoy: democracia, convivencia y poblaciones vulnerables, edited by G. Segovia Mora. Bogotá: Consejería para Asuntos Sociales-Alcaldía Mayor de Santafé de Bogotá, Consejería Presidencial para la Juventud la Mujer y la Familia.
Dix, Robert H. 1987. The politics of Colombia, Politics in Latin America. New York: Praeger. Dixon, John E., David Goodwin, and Jack Wing. 2003. Responses to governance: governing
corporations, societies, and the world. Westport, Conn.: Praeger. DNP-UNDP. 1998. Informe de desarrollo humano para Colombia. Bogota, Colombia:
Departamento Nacional de Planeación, Misión Social; Programa de Desarrollo de las Naciones Unidas; TM Editores.
DNP. 2002. Evaluación de la Descentralización Municipal en Colombia: Balance de una década. Bogotá: Departamento Nacional de Planeación, Dirección de Desarrollo Territorial.
Domínguez, Jorge I., and Abraham F. Lowenthal. 1996. Constructing democratic governance: Latin America and the Caribbean in the 1990s, An Inter-American Dialogue book. Baltimore, MD: Johns Hopkins University Press.

319
Donovan, Michael G. 2002. Space Wars in Bogotá: The Recovery of Public Space and its Impact on Street Vendors, Urban Studies and Planning, Massachusetts Institute of Technology, Boston.
Dunn, William N. 1994. Public policy analysis: an introduction. 2nd ed. Englewood Cliffs, N.J.: Prentice Hall.
Durán Silva, Jorge. 2003. Descentralización contra Centralismo. Bogotá, March 3. Dureau, Françoise, Véronique Dupont, Éva Lelièvre, Jean Pierre Lévy, and Thierry Lulle. 2002.
Metrópolis en movimiento: una comparación internacional. Bogotá, D.C., Colombia: Alfaomega: IRD.
Echevarría S., Juán José, Carolina Rentería, and Roberto Steiner. 2002. Decentralization and Bailouts in Colombia. In Latin American Research Network Working Paper #R-442. Washington: Inter-American Development Bamk.
ECLAC-HABITAT. 2000. De la urbanización acelerada a la consolidación de los asentamientos humanos en América Latina y el Caribe: el espacio regional. New York: United Nations, Economic and Social Commission for Latin America and the Caribbean; United Nations Centre for Human Settlements.
ECLAC. 2002. Social panorama of Latin America: 2000-2001. New York: United Nations. Economic Commission for Latin America and the Caribbean.
Edwards, Sebastian. 2001. The economics and politics of transition to an open market economy: Colombia, Development Centre studies. Paris: Development Centre of the Organisation for Economic Co-operation and Development.
"El profeta Lemos". 1993. El Tiempo, April 28, 2C. El Tiempo, 1E. 1995. El Alcalde expidió ayer el Plan de Desarrollo por decreto. El Tiempo, June
3, 1 E. ———. 1995. Mockus está cazando peleas innecesarias. El Tiempo, June 3, 1 E. El Tiempo. 1993. Un año con más pena que gloria. July 1, 2D. ———. 1995. $26 millones gastó Mockus. El Tiempo, January 28, 7A. Escallón, Clemencia, and John Sudarsky. 2001. La Formulación de los Planes de Desarrollo
Local por medio de los Encuentros Ciudadanos en Bogotá. In Memorias del Foro: Participación Ciudadana en la PLaneación del Desarrollo Municipal, Distrital y Nacional, edited by J. Álvarez. Bogotá: Alcaldía Mayor de Bogotá, Veeduría Distrital, Comité Interinstitucional de Apoyo a la Planeación Local, Observatorio sobre Participación Ciudadana y Control Social, Corporación Plural.
Escobar, Arturo, and Sonia E. Alvarez. 1992. The Making of social movements in Latin America: identity, strategy, and democracy, Series in political economy and economic development in Latin America. Boulder, Colo.: Westview Press.
Faguet, Jean Paul. 1997. Decentralization and local government performance. Rome: Food and Agricultural Organization of the United Nations.
Fainboim, Israel, and Maria Victoria Angulo. 2003. La Pobreza en Bogotá y los Resultados de las Políticas Distritales para Combatirla. Bogotá: Alcaldía Mayor.
Feiock, Richard C. 2004. Metropolitan governance: conflict, competition, and cooperation, American governance and public policy. Washington, D.C.: Georgetown University Press.
Fields, Gary S. 1977. Income inequality in urban Colombia: a decomposition analysis, Center discussion paper; no. 267. New Haven: Economic Growth Center, Yale University.

320
Finot P., Iván. 2001. Descentralización en América Latina: teoría y práctica, Serie Gestión pública; 12. Santiago de Chile: Naciones Unidas CEPAL, Instituto Latinoamericano y del Caribe de Planificación Económica y Social-ILPES.
Florez, Margareth. 1997. Bogotá 1995-1997: Balance de una gestión. Bogotá: Fundación Corona.
Flórez, Margareth, ed. 2003. La Apuesta de los Ciudadanos. Tercer Ejercicio de Planeación Participativa en Bogotá, 2001. Bogotá D.C.: Fundación Corona.
Flórez Nieto, Carmen Elisa. 2002. The function of the urban informal sector in employment: evidence from Colombia 1984-2000. Bogotá, D.C., Colombia: Centro de Estudios sobre Desarrollo Económico, Universidad de los Andes.
Flórez Nieto, Carmen Elisa, and Regina Méndez. 2000. Las transformaciones sociodemográficas en Colombia durante el siglo XX. 1. ed, Economía del siglo XX. Santafé de Bogotá: Banco de la República Tercer Mundo Editores.
Freire, Mila, and Richard E. Stren, eds. 2001. The challenge of urban government: policies and practices, WBI development studies. Washington, D.C.: World Bank.
Fresneda B., Oscar, Libardo Sarmiento Anzola, and Manuel Muñoz. 1991. Pobreza, violencia y desigualdad: retos para la nueva Colombia, Pobreza en América y el Caribe; 4. Santafé de Bogotá, D.E., Colombia: Proyecto Regional para la Superación de la Pobreza PNUD.
Friedman, Milton. 1981. Market mechanisms and central economic planning, The G. Warren Nutter lectures in political economy. Washington, D.C.: American Enterprise Institute for Public Policy Research, Thomas Jefferson Center Foundation.
Fukasaku, Kiichiro, and Ricardo Hausmann, eds. 1998. Democracy, decentralisation, and deficits in Latin America. Paris, France: Inter-American Development Bank, Development Centre of the Organisation for Economic Co-operation and Development.
Fundación Corona, and Procomún. 1997. Hacia una Agenda para Santafé de Bogotá. Logros de la Administración Mockus-Bromberg y Retos Futuros. In Ambitos de Reflexión. Bogotá: Fundación Corona.
Fundación Corona, El Tiempo, Cámara de Comercio de Bogotá. 2003. La Pobreza en Bogotá. In Bogotá cómo vamos. Bogotá D.C.: Casa Editorial El Tiempo, Fundación Corona, Cámara de Comercio de Bogotá.
Gaitán, Pilar, and Carlos Moreno Ospina. 1992. Poder local: realidad y utopía de la descentralización en Colombia. 1. ed, Sociología y política. Bogotá, Colombia: Instituto de Estudios Políticos y Relaciones Internacionales: Tercer Mundo Editores.
Gálvez, Thelma. 2000. Aspectos económicos de la equidad de género. In Women in Latin America and the Caribbean. Lima, Perú: Economic Commission for Latin America and the Caribbean (ECLAC).
———. 2001. Aspectos económicos de la equidad de género, Serie Mujer y desarrollo; 35. Santiago de Chile: Naciones Unidas, CEPAL, Unidad Mujer y Desarrollo.
Garay Salamanca, Luis Jorge, ed. 2002. Colombia: entre la exclusión y el desarrollo. Propuestas para la transición al estado social de derecho. 1. ed. Bogotá: Contraloría General de la Republica: Alfaomega Colombiana.
García Delgado, Daniel R., and Jordi Borja, eds. 1989. Descentralización y democracia: gobiernos locales en América Latina, Colección Estudios urbanos. Buenos Aires, Argentina: CLACSO, Santiago de Chile.

321
García García, Jorge, and S. K. Jayasuriya. 1997. Courting turmoil and deferring prosperity: Colombia between 1960 and 1990, World Bank comparative macroeconomic studies. Washington, D.C.: World Bank.
García, Miguel, and Gary Hoskin. 2003. Political participation and war in Colombia: an analysis of the 2002 elections, Crisis States Programme working papers series; no. 38. London: Crisis States Programme.
García Rojas, Nelson, ed. 1990. Memorias Seminario Educación, trabajo y transformaciones tecnológicas en Colombia. Cali, Colombia: UNESCO, Oficina Regional de Educación para América Latina y Caribe: Convenio Servicio Nacional de Aprendizaje-- Ministerio de Educación Nacional: Universidad del Valle Vicerrectoría Académica.
García Sánchez, Miguel. 2001. La política bogotana, un espacio en recomposición. In Degradación o cambio: evolución del sistema político colombiano, edited by F. Gutiérrez Sanín. Bogotá: Grupo Editorial Norma.
———. 2003. ¿Ciudadanía avergonzada? democracia local y construcción de ciudadanía en Bogotá. 1. ed, Colección Maestrías. Bogotá: Universidad de Los Andes, CESO: Universidad Nacional de Colombia, IEPRI.
García Suárez, Carlos Iván, Margarita Bernal Vélez, Diógenes Carvajal Llamas, Ana Lucía Gutiérrez Pérez, Yolanda López Correal, and Íngrid Parada Infante. 2003. Estado del Arte Sobre la Situación de las Mujeres entre 1990-2002. Edited by P. Quijano Samper. 5 vols. Vol. 3, Colección Estados del Arte, Bogotá. Bogotá: Universidad Central; DABS, Alcaldía Mayor de Bogotá.
García V., Martha Cecilia. 1990. Las cifras de las luchas cívicas: cuatrienio Barco, 1986-1990. Bogotá, Colombia: Centro de Investigación y Educación Popular.
———. 1997. Descentralización y movilización popular en Bogotá. In Descentralización en Bogotá bajo la lupa (1992-1996), edited by J. V. Zamudio Castañeda, M. C. García Velandia and M. Katz García. Santafé de Bogotá: Cinep.
Gestures against reform. 1996. The Economist (US) v341 (n7994):p19 (3). Gilbert, Alan. 2000. Financing Self-help Housing: Evidence from Bogotá, Colombia.
International Planning Studies 5 (4):165-190. ———, ed. 1996. The mega-city in Latin America. Tokyo; New York: United Nations
University Press, 1996. Gilbert, Alan Corp Author Latin America Bureau. 1994. The Latin American city. London Latin
America Bureau: New York NY. Gilbert, Alan G. 1997. Colombian housing policy during the 1990s. In Colombia:The Politics of
Reforming the State, edited by E. Posada-Carbó. London: Institute of Latin American Studies, Macmillan.
Gilbert, Alan G., and Julio D. Dávila. 2002. Bogotá: Progress Within a Hostile Environment. In Capital city politics in Latin America: democratization and empowerment, edited by D. J. Myers and H. A. Dietz. Boulder, Colo.: Lynne Rienner.
Gilbert, Richard, Herbert Girardet, Don Stevenson, and Richard E. Stren. 1996. Making cities work: the role of local authorities in the urban environment. London: Earthscan.
Giraldo, Javier, Santiago Camargo, and Gilberto Naranjo. 1985. Paros y movimientos cívicos en Colombia. Bogotá, D.E., Colombia: Centro de Investigación y Educación Popular.
Giugale, Marcelo, O. Lafourcade, and Connie Luff. 2003. Colombia: the economic foundation of peace. Washington, DC: World Bank.
322
Giugale, Marcelo, and Steven Benjamin Webb. 2000. Achievements and challenges of fiscal decentralization: lessons from Mexico. Washington, D.C.: World Bank.
González G., Bernardo, ed. 2000. Cambios en la Calidad de Vida de la Ciudad, 1998-2000, Bogotá Cómo Vamos. Bogotá: El tiempo, Fundación Corona, Cámara de Comercio de Bogotá, Institute FES de Liderazgo.
Gouëset, Vincent. 1998. Bogotá, nacimiento de una metrópoli: la originalidad del proceso de concentración urbana en Colombia en el siglo XX. 1. ed. Santafé de Bogotá: Observatorio de Cultura Urbana, CENAC, Fedevivienda, IFEA, TM editores.
Governance for sustainable human development: a UNDP policy document. 1997. New York: United Nations Development Programme.
Greenfield, Gerald Michael. 1994. Latin American urbanization: historical profiles of major cities. Westport, Conn.: Greenwood Press.
Guess, George M., and Paul G. Farnham. 2000. Cases in public policy analysis. 2nd. ed. Washington D.C.: Georgetown University Press.
Guijt, Irene, and Meera Kaul Shah. 1998. The myth of community: gender issues in participatory development. London: Intermediate Technology Publications.
Gutiérrez, Francisco. 1998. Rescate de un elefante: Congreso, sistema y reforma política. In Elecciones y democracia en Colombia, 1997-1998, edited by A. M. Bejarano and A. Dávila L. Santafé de Bogotá: Universidad de los Andes, Departamento de Ciencia Política: Fundación Social: Veeduría Ciudadana a la Elección Presidencial.
Gutiérrez, Javier Alberto, Carolina Guzmán, and Ulpiano José Jiménez. 2000. Algunas consideraciones socioeconómicas en torno a las migraciones en Bogotá. In Estudios de Economía y Ciudad No.16. Bogotá: Secretaría de Hacienda Distrital, Oficina de Estudios Económicos.
Gutiérrez, Javier Alberto, Nubia Cristina Mejía, and Yadira Díaz. 2000. El mercado laboral de Santa Fe de Bogotá 1976 - 1999. In Estudios de Economía y Ciudad No.11. Bogotá: Secretaría de Hacienda Distrital, Oficina de Estudios Económicos.
Gutiérrez Sanín, Francisco. 1996. Dilemas y Paradojas de la Transición Participativa. El caso Colombiano 1991-1996. Análisis Político No.29.
———. 1998. La ciudad representada: política y conflicto en Bogotá. 1. ed. Santafé de Bogotá: TM Editores.
———. 2001. Agregando votos en un sistema altamente desistitucionalizado, Archivos de economía; documento 157. [Bogotá, Colombia]: República de Colombia, Departamento Nacional de Planeación, Dirección de Estudios Económicos.
———, ed. 2001. Degradación o cambio: evolución del sistema político colombiano. 1. ed, Colección Vitral. Bogotá: Grupo Editorial Norma.
Guzmán, Carolina, and Javier Alberto Gutiérrez. 2000. Evolución y estado de las finanzas públicas de Bogotá en la década de los noventa y perspectivas. In Estudios de Economía y Ciudad. Bogotá: Oficina de Estudios Económicos, Secretaría de Hacienda Distrital.
Guzmán, German, Orlando Fals Borda, and Eduardo Umaña Luna. 1962. La Violencia en Colombia, Monografías Sociológicas. Bogotá: Tercer Mundo Editores.
HABITAT. 2000. Good urban governance: a normative framework. HABITAT, United Nations Centre for Human Settlements. 2001. Cities in a globalizing world:
global report on human settlements 2001: Earthscan Publications. ———. 2001a. The state of the world's cities, 2001. Nairobi, Kenya: UNCHS (Habitat).

323
HABITAT, United Nations Centre for Human Settlements; International Forum on Urban Poverty. 1997. Proceedings from the International Conference on Urban Poverty, 9-13 November, at Florence, Italy.
Haldenwang, Christian von. 1990. Hacia un concepto politológio de la descentralización del Estado en América Latina. EURE, Santiago-Chile, 61-77.
Halebsky, Sandor, and Richard L. Harris. 1995. Capital, power, and inequality in Latin America, Latin American perspectives series; no. 16. Boulder: Westview Press.
Hall, Peter Geoffrey, and Ulrich Pfeiffer. 2000. Urban future 21: a global agenda for twenty-first century cities. London; New York: E & FN Spon.
Harasty, Claire, and Dorothea Schmidt, eds. 2003. Global employment trends. Geneva: International Labour Office.
Hataya, Noriko, Kenkyujo Ajia Keizai, Oscar Alonso R., Carlos Caicedo C., and Luis Mauricio Cuervo G. 1994. Barrio a barrio se construye una ciudad: descentralización y servicios urbanos en Bogotá, Documentos ocasionales; 70. Santafé de Bogotá, D.C., Colombia, Tokyo Japón: Centro de Investigación y Educación Popular.
Hayek, Friedrich A. von. 1985. New studies in philosophy, politics, economics and the history of ideas. paperback ed. Chicago: University of Chicago Press.
Held, David, and Anthony G. McGrew. 2000. The global transformations reader: an introduction to the globalization debate. Malden, Mass.: Polity Press.
Held, David; [et al.]. 1999. Global transformations: politics, economics and culture. Stanford, Calif.: Stanford University Press.
Henao V., Marta Luz, Norberto Rojas D., and Aura Yaneth Parra R. 1999. El Mercado Laboral Urbano y la Informalidad en Colombia: Evolución Reciente. In Documentos de Trabajo No.5. Bogotá: Departamento Nacional de Planeación, Dirección de Desarrollo Social- División de Empleo e Ingresos.
High Commissioner for Human Rights. 2001. Report of the United Nations High Commissioner for Human Rights on the human rights situation in Colombia. Geneva: United Nation, Economic and Social Council, Comission on Human Rights.
Hommes, Rudolf, Armando Montenegro, and Pablo Roda, eds. 1994. Una apertura hacia el futuro. 1. ed. Colombia: Ministerio de Hacienda y Crédito Público Departamento Nacional de Planeación Fondo Nacional de Desarrollo Económico (FONADE).
Hoskin, Gary. 1998. Urban Electoral Behavior in Colombia. In Urban Elections in Democratic Latin America, edited by D. J. Myers and G. Shidlo. Wilmington, DE: Scholarly Resources Inc.
Hoskin, Gary, Rodolfo Masías Núñez, and Miguel García Sánchez. 2003. Colombia 2002: elecciones, comportamiento electoral y democracia. 1. ed. Bogotá: Universidad de los Andes, Facultad de Ciencias Sociales, Departamento de Ciencia Política, Centro de Estudios Socioculturales e Internacionales--CESO.
Human development report 1992. 1992. New York: [Oxford University Press] for the United Nations Development Programme (UNDP).
Human development report 1993. 1993. New York: Oxford University Press for the United Nations Development Programme (UNDP).
Humes, Samuel. 1991. Local governance and national power: a worldwide comparison of tradition and change in local government. New York: Harvester Wheatsheaf and the International Union of Local Authorities (IULA).
IADB. Institutional strengthening of the District of Bogotá: Inter-American Development Bank.

324
———. 2002. Making decentralization work in Latin America and the Caribbean: a background paper for the subnational development strategy., Sustainable Development Department Technical papers series; SOC-119. Washington, DC: Inter-American Development Bank Sustainable Development Dept.
IBD. 2002. Making decentralization work in Latin America and the Caribbean: a background paper for the subnational development strategy., Sustainable Development Department Technical papers series; SOC-119. Washington, DC: Inter-American Development Bank Sustainable Development Dept.
IDB. 2002. Making decentralization work in Latin America and the Caribbean: a background paper for the subnational development strategy., Sustainable Development Department Technical papers series; SOC-119. Washington, DC: Inter-American Development Bank Sustainable Development Dept.
ILO. 2000. 2000 Labour Overview: Latin America and the Caribbean. Geneva, Switzerland: International Labour Office.
ILPES, ed. 1995. Reforma y Modernización del Estado. Santiago de Chile: Instituto Latinoamericano y del Caribe de Planeación Económica y Social-ILPES, Comisión Económica para America Latina y el Caribe-CEPAL.
IMF. 2003. Report on Workshops on Debt Sustainability in Low-Income Countries in Paris, Berlin, and Accra in May/June, 2003. Washington: Policy Development and Review
Department, International Monetary Fund. Instituto para el Desarrollo de la Democracia Luis Carlos Galán. 2001. Comportamiento
electoral en Bogotá, 1982-1997. 2 vols. Vol. 1. Bogotá, Colombia: Alcaldía Mayor de Bogotá Instituto para el Desarrollo de la Democracia Luis Carlos Galán.
———. 2001b. Comportamiento electoral en Bogotá, 1982-1997. 2 vols. Vol. 2. Bogotá, Colombia: Alcaldía Mayor de Bogotá Instituto para el Desarrollo de la Democracia Luis Carlos Galán.
Ippolito-O'Donnell, Gabriela, and Brenda Ann Markovitz. 1996. Poverty in Latin America: issues and new responses: a rapporteurs' report. In Working paper; no. 219. Notre Dame, Ind.: Helen Kellogg Institute for International Studies.
Jaramillo Pérez, Iván. 2001. Evaluación de la descentralización municipal en Colombia: evaluación de la descentralización en salud en Colombia: documento elaborado por la Dirección de Desarrollo Territorial del DNP, Archivos de economía; documento 170. Bogotá, Colombia: República de Colombia Departamento Nacional de Planeación Dirección de Estudios Económicos.
Jaramillo Uribe, Jaime. 1992. Manual de historia de Colombia. 4. ed. 3 vols, Historia. Bogotá, Colombia: Procultura, Tercer Mundo Editores.
Jewson, Nick, and Susanne MacGregor. 1997. Transforming cities: contested governance and new spatial divisions. London: New York.
Jiménez Benítez, William W. 2001. Democracia local y autonomía: falsas expectativas y promesas incumplidas de la descentralización. 1. ed. Bogotá, D.C.: Escuela Superior de Administración Pública.
Jones, Lisa. A Tale of Two Mayors. The imporbable story of how Bogota, Colombia, became somewhere you might actually want to live (April 04) [online magazine] 2002 [cited. Available from http://www.grist.org/news/maindish/2002/04/04/of/.
Jordán F, Ricardo, and Daniela Simioni, eds. 1998. Ciudades intermedias de América Latina y el Caribe: propuestas para la gestión urbana. Santiago: CEPAL.

325
Kaufmann, Daniel, Aart Kraay, and Pablo Zoido-Lobatón. 1999. Governance Matters: The World Bank.
Keles, Rusen. 2003. The periphery in the center: Some political features of Turkish urbanization. Ekistics; the problems and science of human settlements 70 (420/421):211-217.
Keohane, R.O. 1995. 'Hobbes' dilemma and institutional change in world politics: sovereignity in international society. In Whose world order? uneven globalization and the end of the Cold War. Boulder: Westview Press.
Keohane, Robert O. 2002. Power and governance in a partially globalized world. London: New York.
Kliksberg, Bernardo. 2003. Seis tésis no convencionales sobre Participación. Washington: INDES- Banco Interamericano de Desarrollo.
Kliksberg, Bernardo. Seis Tesis no convencionales sobre Participación. Washington: Instituto Interamericano para el Desarrollo Social, Banco Interamericano del Desarrollo.
Kline, Harvey F. 1994. Resolving conflict with the rich and powerful: the Colombian attempts to end drug terrorism through negotiations. S.l.: s.n.
———. 1995. Colombia: democracy under assault. 2nd ed, Nations of the modern world. Latin America. Boulder: Westview.
———. 1995. Colombia: democracy under assault. 2nd ed, Nations of the modern world. Latin America. Boulder: Westview.
———. 1996. Colombia: Building Democracy in the Midst of Violence and Drugs. In Constructing Democratic Governance. Latin America and the Caribbean in the 1990s, edited by J. I. Domínguez and A. F. Lowenthal. Baltimore, London: The Johns Hopkins University Press.
———. 1999. State building and conflict resolution in Colombia, 1986-1994. Tuscaloosa: University of Alabama Press.
Leal Buitrago, Francisco, and Andrés Davila L. 1990. Clientelismo: el sistema político y su expresión regional. 1. ed, Sociología y política. Bogotá, Colombia: Instituto de Estudios Políticos y Relaciones Internacionales: Tercer Mundo Editores.
Litvack, Jennie I., Junaid Ahmad, and Richard Miller Bird. 1998. Rethinking decentralization in developing countries, Sector studies series. Washington, D.C.: World Bank.
Lizarazo Ortega, Jesus Humberto. 2001. Análisis de la Metodología de los Encuentros Ciudadanos para la formulación de los Planes de Desarrollo Local 2001-2004. In Memorias del Foro: Participación Ciudadana en la PLaneación del Desarrollo Municipal, Distrital y Nacional, edited by J. Álvarez. Bogotá: Alcaldía Mayor de Bogotá, Veeduría Distrital, Comité Interinstitucional de Apoyo a la Planeación Local, Observatorio sobre Participación Ciudadana y Control Social, Corporación Plural.
Londoño de la Cuesta, Juan Luis. 1993. Problemas, instituciones y finanzas para el desarrollo de Bogotá: algunos interrogantes. In Bogotá Problemas y soluciones. Bogotá: Departamento Nacional de Planeación.
———. 1995. Distribución del ingreso y desarrollo económico: Colombia en el siglo XX. 1. ed. Bogotá: TM Editores: Fedesarrollo: Banco de la República.
Londoño, Juan Luis, and Miguel Székely. 1997. Persistent Poverty and Excess Inequality: Latin America, 1970-1995, OCE Working Paper Series, No. 357. Washington, D.C.: Inter-American Development Bank (IADB).

326
López-Murphy, Ricardo, ed. 1995. Fiscal decentralization in Latin America. Washington, DC: Published by the Inter-American Development Bank; Distributed by The Johns Hopkins University Press.
López Castaño, Hugo. 1993. Contexto macroeconómico colombiano, mercado laboral y urbano y retos para una política de empleo. Santafé de Bogotá: Fundación Friedrich Ebert de Colombia.
———. 1996. Ensayos sobre economía laboral colombiana. 1. ed. Bogotá: FONADE/Carlos Valencia Editores.
Lovan, W. Robert, Michael Murray, and Ron Shaffer. 2004. Participatory governance: planning, conflict mediation and public decision-making in civil society. Aldershot, Hants, England: Burlington VT.
Lowder, Stella. 1986. Inside Third World cities. London: Croom Helm. Lozada L., Rodrigo. 1980. Electoral Participation. In Politics of compromise: coalition
government in Colombia, edited by R. A. Berry, R. G. Hellman and M. Solaún. New Brunswick, N.J.: Transaction Books.
Lustig, Nora, and Ruthanne Deutsch. 1998. The Inter-American Development Bank and poverty reduction: an overview. Rev. ed, Inter-American Development Bank. Poverty and Inequality Advisory Unit101-R. Washington, D.C.: Inter-American Development Bank, Sustainable Development Dept.
Magnet-UN. 1997. International Conference on Governance for Sustainable Growth and Equity. New York: United Nations.
Maldonado, Alberto. 2000. Resultados del proceso de descentraliación territorial: muchos indicios y poca evidencia. Territorios, Enero 2000, 83-103.
Maldonado, Carlos, and Montserrat Hurtado, eds. 1997. El sector informal en Bogota: una perspectiva interdisciplinaria. Ginebra: Oficina Internacional del Trabajo.
Manor, James. 1999. The political economy of democratic decentralization, Directions in development; Variation: Directions in development (Washington, D.C.). Washington, D.C.: World Bank.
March, James G., and Johan P. Olsen. 1989. Rediscovering institutions: the organizational basis of politics. New York, London: Free Press; Collier Macmillan Publishers.
———. 1995. Democratic governance. New York: Free Press. Maruri, Enrique. 2001. Marginality and the Informal Sector: The Bogotá's Case. Master in
Sciences Dissertation, MSc Urban Development Planning, University College, London. Matías Camargo, Sergio Roberto, ed. 2001. Neoliberalismo y constitución política de 1991.
Bogotá: Universidad Libre Facultad de Derecho y Ciencias Políticas Centro de Investigaciones Socio Jurídicas.
Mauricio Archila N. [et al.]. 2002. 25 años de luchas sociales en Colombia 1975-2000. Bogotá: Cinep.
Mayntz, Renate. 1998. New challenges to governance theory, Jean Monnet chair papers; no. 50. San Domenico, Italy: European University Institute, Robert Schuman Centre.
Maynzt, Renate. 2003. From government to governance: Political steering in modern societies. In Summer Academy on IPP. Wuerzburg.
Mead, Lawrence M. 1997. Optimizing JOBS: Evaluation versus Administration. Public Administration Review 57 (2):113-123.
Medellín, Pedro. 1998. Análisis Electoral: ¿qué pasó en Bogotá? Lecciones y evidencias de las elecciones de octubre de 1997. Bogotá: CIDER, Universidad de los Andes.

327
Melo, Jorge Orlando. 1991. Consideraciones generales sobre el impacto de la violencia en la historia reciente del país. In Pobreza, violencia y desigualdad: retos para la nueva Colombia. Santafé de Bogotá, D.E., Colombia: Proyecto Regional para la Superación de la Pobreza PNUD.
Miranda, Mauricio, ed. 2002. Alternativas de política económica y social en América Latina y el Caribe: cuatro casos de estudio, Colombia, Costa Rica, Cuba y México. 1. ed, Colección Biblioteca del profesional. Bogotá, D.C.: Centro Editorial Javeriano.
Mockus S., Antanas, Jaime Castro C., Jaime Ruíz Ll., Jaime Silva B., and Nelsón Córdoba G. 1997. Descentralización y Modernización en Santafé de Bogotá. Bogotá: Fedesarrollo, Fundación Corona, Tercer Mundo Editores.
Mohan, Rakesh. 1994. Understanding the developing metropolis: lessons from the city study of Bogotá and Cali, Colombia. Oxford: New York.
Montenegro, Santiago, and Ximena Peña. 1999. Labor reforms, macroeconomic imbalances and unemployment in Colombia. Santafé de Bogotá: Centro de Estudios sobre Desarrollo Económico, Universidad de los Andes.
Montero, Alfred P., and David Samuels, eds. 2004. Decentralization and democracy in Latin America. Notre Dame, Ind.: University of Notre Dame Press.
Moreno Ospina, Carlos, ed. 1997. Procesos y tendencias de la descentralización en Colombia. 1. ed. Santafé de Bogotá, D.C., Colombia: Fundación Universidad Central Departamento de Investigaciones.
Morley, Samuel A. 1995. Poverty and inequality in Latin America: the impact of adjustment and recovery in the 1980s. Baltimore: Johns Hopkins University Press.
Morley, Samuel A. 2001. The income distribution problem in Latin America and the Caribbean, Libros CEPAL; 65. Santiago, Chile: ECLAC (United Nations Economic Commission for Latin America and the Caribbean).
Morris, Arthur, and Stella Lowder, eds. 1992. Decentralization in Latin America: an Evaluation. New York, Westport, London: Praeger.
Mosquera, Martha, Alfredo Burbano, Pedro Pablo Colorado, and Carlos A. Torres. 1997. Evaluación del proceso de Descentralización en la Localidad de Ciudad Bolivar. In Descentralización en Bogotá bajo la lupa (1992-1996), edited by J. V. Zamudio Castañeda, M. C. García Velandia and M. Katz García. Santafé de Bogotá: Cinep.
Múnera Ruíz, Leopoldo. 2003. Estado, Política y democracia en el Neoliberalismo. In La falacia neoliberal: crítica y alternativas, edited by D. I. Restrepo Botero. Bogotá: Universidad Nacional de Colombia, Vicerrectoría Académica y Sede Bogotá.
Murad Rivera, Rocío, ed. 2003. Estudio sobre la distribución espacial de la población en Colombia, SERIE Población y desarrollo No.48: CEPAL.
Museo Nacional de Colombia, ed. 2001. Exodo, patrimonio e identidad: memorias 2000, V Cátedra Anual de Historia Ernesto Restrepo Tirado. 1. ed, Cátedra Anual de Historia Ernesto Restrepo Tirado. Bogotá: Museo Nacional de Colombia, Ministerio de Cultura.
Myers, David J., and Henry A. Dietz, eds. 2002. Capital city politics in Latin America: democratization and empowerment. Boulder, Colo.: Lynne Rienner.
Nef, Jorge. 1995. Gobernabilidad, capacidad de gobierno y seguridad humana: un marco de referencia para el estudio comparativo de las políticas de ajuste estructural en América Latina, Texto para debate; no. 7. Guatemala: Asociación para el Avance de las Ciencias Sociales en Guatemala.
Nickson, R. Andrew. 1995. Local government in Latin America. Boulder: L. Rienner Publishers.
328
Nohlen, Dieter. 1991. Descentralización política y consolidación democrática: Europa-América del Sur. 1. ed. Madrid Síntesis: Caracas Venezuela.
Noriega, Mario. 2000. Cómo vamos en Crecimiento Ordenado y Espacio Público. In Cambios en la Calidad de Vida de la Ciudad, 1998-2000, edited by B. González G. Bogotá: El tiempo, Fundación Corona, Cámara de Comercio de Bogotá, Institute FES de Liderazgo.
Norwegian Refugee Council. 2004. Colombia: "Democratic security" policy fails to improve protection of IDPs. Geneva: Norwegian Refugee Council, Global IDP Project.
O'Donnell, Guillermo A. 1996. Poverty and inequality in Latin America: some political reflections. In Working paper; #225. Notre Dame, Ind.: Helen Kellogg Institute for International Studies, University of Notre Dame.
Oakerson, Ronal J. 2004. The study of metropolitan governance. In Metropolitan governance: conflict, competition, and cooperation, edited by R. C. Feiock. Washington, D.C.: Georgetown University Press.
Ocampo, José Antonio. 1998. Income distribution, poverty and social expenditure in Latin America. CEPAL review (No. 65):p. 7-14.
Ocampo, José Antonio, and Juan Martin, eds. 2003. A decade of light and shadow: Latin America and the Caribbean in the 1990s, Libros de la CEPAL; 76. Santiago, Chile: Economic Commission for Latin America and the Caribbean.
Ocampo, José Antonio, and Manuel Ramírez, eds. 1987. El Problema laboral colombiano: informes especiales de la Misión de Empleo. 1a ed. 2 vols. Bogotá: Servicio Nacional de Aprendizaje: Departamento Nacional de Planeación: Contraloría General de la República.
OECD. 2001. Cities for citizens: improving metropolitan governance, Governance. Paris, France: Organisation for Economic Co-operation and Development-OECD.
Offe, Claus. 1984. Contradictions of the Welfare State. London: John Hutchinson. OIT. 1997. Panorama laboral de América latina y el Caribe: Lima: Organización Internacional
del Trabajo. ———. 1998. Panorama Laboral de América Latina y el Caribe 1998: Lima: Organización
Internacional del Trabajo. ———. 1999. Panorama Laboral de América Latina y el Caribe 1999: Lima: Organización
Internacional del Trabajo. Oliver, J. Eric. 2001. Democracy in suburbia. Princeton, N.J.: Princeton University Press. Ossa Escobar, Carlos. 1995. Mockus y la Descentralización: más de lo mismo. In Antanas-- del
mito al rito, edited by D. Bustamante. Bogotá, Colombia: s.n. Otálora Castañeda, Carlos. 2002. Elecciones y Prácticas Políticas en Bogotá-Un objeto de
Estudio en Construcción-. Univerciudad (12). Ottenberger-Rivera, Anny. 1997. Descentralización y Reorganización de la Esfera Política
Liberal Contemporanea. Satiago-Chile: Instituto Latinoamericano y del Caribe de Planeación Económica y Social-CEPAL.
Panadero Moya, Miguel, ed. 1988. Urbanización, subdesarrollo y crisis en América Latina. Edited by S. d. Geografía. 2. ed. Albacete: Diputación Provincial y Fundación Universidad-Empresa de Castilla-La Mancha.
PARCOMUN. 1999. Tercer Informe de Avance - Proyecto de Fortalecimiento de la Capacidad de las Comisiones de Planeación Local y de las Coordinaciones Locales de Planación para formular proyectos en el Distrito Capital. Santafé de Bogotá: Fundación para la Participación Comunitaria-PARCOMUN.

329
Pedraza, Betty. 2001. Diez Años de Participación en Santafé de Bogotá. Bogotá: Fundación para la Participación Comunitaria-PARCOMUN.
Peña, Sonia Lucia. 1995. Rito y Símbolo en la Campaña Electoral pra la Alcaldía de Bogotá. In Antanas-- del mito al rito, edited by D. Bustamante. Bogotá, Colombia: s.n.
Peñalosa, Enrique (Alcalde Mayor). 1999. Decreto 518: Alcaldía Mayor de Bogotá. ———. 2000. Decreto 619: Alcaldía Mayor de Bogotá. Peñalosa Londoño, Enrique. 1998. Plan de Desarrollo Económico, Social y de Obras Públicas
para Santa Fe de Bogotá, D.C., 1998-2001-Por la Bogotá que Queremos, edited by A. M. d. Bogotá: Alcaldía Mayor de Bogotá.
Pérez Martínez, Angel. 2003. Educación en Bogotá periodo 1992 – 2002: Universidad Nacional, Departamento de Ciencia Política.
———. undated. Educación en Bogotá periodo 1992 – 2002: Universidad Nacional, Departamento de Ciencia Política.
Peters, B. Guy. 1998. Comparative politics: theory and methods. New York: New York University Press.
———. 2001. The future of governing. 2nd ed, Studies in government and public policy. Lawrence: University Press of Kansas.
———. 2003. The capacity to Govern: Moving Back to the Center? Paper read at VIII Congreso del CLAD sobre al reforma del Estado y de la Administración Pública, 28-31 October, at Panamá.
Peters, B. Guy, and Jon Pierre, eds. 2003. Handbook of public administration. London: Thousand Oaks Calif.
Peters, B. Guy, and Donald J. Savoie. 1995b. Governance in a changing environment. Montreal; Buffalo: McGill-Queen's University Press.
Peterson, George E. 1997. Decentralization in Latin America: learning through experience, World Bank Latin American and Caribbean studies.; Viewpoints. Washington, D.C.: World Bank.
Pickvance, C. G., and Edmond Préteceille, eds. 1991. State restructuring and local power: a comparative perspective. London: International Sociological Association.
Pierre, Jon. 2000. Debating governance. Oxford: New York. Pierre, Jon, and B. Guy Peters. 2000. Governance, politics, and the state, Political analysis. New
York: St. Martin's Press. Pitto Bonilla, Lenny Zeneida. 1994. Pobladores de y en la calle. In Bogotá hoy: democracia,
convivencia y poblaciones vulnerables, edited by G. Segovia Mora. Bogotá: Consejería para Asuntos Sociales-Alcaldía Mayor de Santafé de Bogotá, Consejería Presidencial para la Juventud la Mujer y la Familia.
Pizano, Lariza. 2001. Aproximación a la cultura política en Bogotá, Documentos CESO; documento no. 4. Bogotá, Colombia: Centro de Estudios Socioculturales e Internacionales CESO: Facultad de Ciencias Sociales, Universidad de los Andes.
———. 2003. Bogotá y el cambio: percepciones sobre la ciudad y la ciudadanía. 1. ed, Colección Maestrías. Bogotá: Univerisdad de los Andes, CESO: Universidad Nacional de Colombia, IEPRI.
———. 2003. Bogotá y el camino: percepciones sobre la ciudad y la ciudadanía. 1. ed, Colección Maestrías. Bogotá: Universidad de Los Andes, Centro de Estudios Socioculturales e Internacionales: Universidad Nacional de Colombia, Instituto de Estudios Políticos y Relaciones Internacionales.

330
Pizarro Leongómez, Eduardo. 2001. La atomización partidista en Colombia: el fenómeno de las microempresas electorales. In Degradación o cambio: evolución del sistema político colombiano, edited by F. Gutiérrez Sanín. Bogotá: Grupo Editorial Norma.
———. 2002. La atomización partidista en Colombia: el fenómeno de las micro-empresas electorales, Working paper; no. 292. Notre Dame, Ind.: The Helen Kellogg Institute for International Studies.
Pizarro Leongómez, Eduardo, Alvaro Villarraga S., and Francisco Gutiérrez Sanín. 1996. La oposición política en Colombia. 1a. ed, Debate político. Bogotá: IEPRI: FESCOL.
Plumptre, Tim, and John Graham. 2000. Governance and Good Governance: International and Aboriginal Perspectives. Institute on Governance 1999 [cited 2000]. Available from http://www.iog.ca/.
Polèse, Mario, and Richard E. Stren. 2000. The social sustainability of cities: diversity and the management of change. Toronto: University of Toronto Press.
Pombo, Roberto. 1995. Primer Antanazo. Revista Semana, June 13-20. Portes, Alejandro, Manuel Castells, and Lauren A. Benton. 1989. The Informal economy: studies
in advanced and less developed countries. Baltimore, Md.: Johns Hopkins University Press.
Potter, Jonathan, and OECD, eds. 2001. Devolution and globalisation: implications for local decision-makers, Governance. Paris, France: OECD.
Presidencia de la República. 1969. Historia de la Reforma Constitucional de 1968: Secretaría Jurídica.
———. 1991. Gaceta Constitucional No.40, Abril 8. PROPÚBLICOS, (Centro de Investigaciones Pro-Defensa de Intereses Públicos). 1984. ¿Sirve el
Concejo de Bogotá? In Serie Realidad nacional; 3. Bogotá, Colombia: Contraloría General de la República, FESCOL, con el apoyo de Friedrich-Ebert-Stiftung in Kolumbien.
Pulido, Liliana. 2000. Plataforma Internacional del Distrito Capital. Análisis sobre comercio exterior e inversión extranjera en Santa Fé de Bogotá: Subdirección Económica de Competitividad e Innovación, Departamento Administrativo De Planeación Distrital.
Putnam, Robert D., Robert Leonardi, and Raffaella Nanetti. 1993. Making democracy work: civic traditions in modern Italy. Princeton, N.J.: Princeton University Press.
Puyo Vasco, Fabio. 1992. Bogotá, Colecciones MAPFRE 1492. Madrid: Editorial MAPFRE. Refugees International. 2004-2005. Humanitarian Situation in Colombia, July 2005 [cited 2004-
2005]. Available from http://www.refugeesinternational.org/content/country/detail/2934. Reilly, Charles A. 1995. New paths to democratic development in Latin America: the rise of
NGO-municipal collaboration. Reilly, Charles A.: Rienner. Restrepo Botero, Dario Indalecio. 1992. Descentralización y neoliberalismo: balance de un
proceso. 1. ed. Santafé de Bogotá, Colombia: Fondo Editorial, CEIR-Realidad Municipal. Restrepo Botero, Darío Indalecio, ed. 2003. La falacia neoliberal: crítica y alternativas. Bogotá,
Colombia: Universidad Nacional de Colombia, Vicerrectoría Académica y Sede Bogotá. Restrepo, Luis Alberto. 1997. La participación ciudadana: participación tutelada o participación
abierta? In Sociedad civil: control social y democracia participativa, edited by J. F. Londoño. Bogotá: Fescol.
Revéiz, Edgar. 1997. El Estado como mercado: la gobernabilidad económica y política en Colombia antes y después de 1991. 1. ed. Bogotá: Fonade/C. Valencia Editores.

331
Rhodes, R. A. W. 1997. Understanding governance: policy networks, governance, reflexivity, and accountability, Public policy and management. Buckingham: Philadelphia.
Rico de Alonso, Ana, Adriana Delgado, Juan Carlos Alonso, Sonia Castillo, Abelardo Carrillo, Catalina Niño, and Lorena Vargas. 2003. Familias, Bienestar y Políticas Sociales en Bogotá, D.C. Edited by P. Quijano Samper. 5 vols. Vol. 5, Colección Estados del Arte, Bogotá. Bogotá: Facultad de Ciencia Política y Relaiones Internacionales, Pontificia Universidad Javeriana; DABS, Alcaldía Mayor de Bogotá.
Rincón Mesa, Manuel, ed. 1999. Santafé de Bogotá: proyecciones de población por sexo y edad, 1985-2016, Estudios censales; 11. Santafé de Bogotá: Departamento Administrativo Nacional de Estadística-DANE.
Rivera Araya, Roy. 1992. Política local y descentralización. 1a. ed, Cuadernos de ciencias sociales; 55. San José, Costa Rica: Secretaría General Facultad Latinoamericana de Ciencias Sociales.
Rivera Araya, Roy Corp Author Flacso. 1996. Descentralización y gestión local en América Latina. 1a ed. San José, Costa Rica: FLACSO.
Robbins, Donald J. 1999. Wage Dispersion and Trade in Colombia: an Analysis of Greater Bogota, 1976-1989. In Colombia: an opening economy? edited by C. M. Callahan and F. R. Gunter. Stamford, Conn.: JAI Press.
Rodríguez, Alfredo, and Lucy Winchester. 1997. Ciudades y gobernabilidad en América Latina, Colección Estudios urbanos. Santiago, Chile: Ediciones Sur.
Rojas, Cristina. 2002. Forging Civic Culture in Bogota City. In Citizen Participation In the Context of Fiscal Decentralization: Best Practices in Municipal Administration in Latin America and Asia. Tokyo and Kobe: Asian Development Bank (ADB).
Rojas, Jorge E. Rojas [et al.]. 1999. Pais que huye: desplazamiento y violencia en una nación fragmentada. Santa Fe de Bogotá: CODHES, UNICEF-Colombia.
Rojas Lopera, Alexandra, and Javier Alberto Gutiérrez. 2002. Descentralización fiscal y financiamiento de la inversión en Santa Fe de Bogotá D. C. 1990 – 2001. In Seminarios y conferencias. Bogotá: CEPAL.
Rondinelli, Dennis A., and G. Shabbir Cheema, eds. 2003. Reinventing government for the twenty-first century: state capacity in a globalizing society: Kumarian Press.
Rosenau, James N., and Ernst Otto Czempiel. 1992. Governance without Government: Order and Change in World Politics, Variation: Cambridge Studies in International Relations Series; v. 20.: Camb.U.P.
Rubio, Mauricio. 1997. Los costos de la violencia en Colombia. Santafé de Bogotá, D.C., Colombia: Centro de Estudios sobre Desarrollo Económico: Programa de Estudios sobre Seguridad Justicia y Violencia, Universidad de los Andes.
Sachs, Wolfgang, ed. 1992. The Development dictionary: a guide to knowledge as power. London: Atlantic Highlands N.J.
Sader, Emir, ed. 2001. El ajuste estructural en América Latina: costos sociales y alternativas. 1ra ed, Colección Grupos de trabajo de CLACSO. Buenos Aires, Argentina: Consejo Latinoamericano de Ciencias Sociales (CLASO).
Salazar J., Alonso, Oscar Useche A., and Nestor López l. 1998. Una mirada a la Juventud de Bogotá. In La ciudad observada: violencia, cultura y política, edited by Y. Campos and I. Ortiz. Santa Fe de Bogotá: Observatorio de Cultura Urbana, TM Editores.

332
Sánchez G., Gonzalo, and Ricardo Peñaranda. 1986. Pasado y presente de la violencia en Colombia. 1a ed, Serie Historia contemporánea; no. 5. Bogotá, Colombia: Fondo Editorial CEREC.
Sanín, Javier. 1995. La Política Antipolítica. In Antanas-- del mito al rito, edited by D. Bustamante. Bogotá, Colombia: s.n.
Santana, Pedro, and Hernan Suárez, eds. 1989. Bogotá en Documentos, Bibliografía, Colección Ciudad y Democracía. Bogotá: Foro Nacional por Colombia. Instituto Frances de Estudios Andinos (IFEA).
Santana R, Pedro. 1988. Bogotá hoy: la crísis política y administrativa de la ciudad. In Bogotá, 450 años: retos y realidades. Bogotá: Foro Nacional por Colombia, Instituto Francés de Estudios Andinos.
Santana R., Pedro, ed. 1997. Crisis política, impunidad y pobreza en Colombia. Edited by C. V. l. Ciudadanía. 1ra ed. Colombia: Ediciones Foro Nacional por Colombia.
Santana R., Pedro. [et al.]. 1988. Bogotá, 450 años: retos y realidades. 1a ed, Colección Ciudad y democracia; Tomo 36 de la Colección Travaux de l'IFEA. Bogotá: Foro Nacional por Colombia, Instituto Francés de Estudios Andinos.
Satterthwaite, David, ed. 1999. The Earthscan reader in sustainable cities. London: Sterlins VA. Schapiro, Mark. 2001. All the city’s a stage: an eccentric mayor. The Atlantic Monthly, 28-30. Secretaría de Hacienda Distrital. 2003. El Comportamiento de la Productividad en la Economía
Bogotana. In Cuadernos de Ciudad. Serie Productividad y Competitividad No.1. Bogotá: Secretaría de Hacienda Distrital.
———. 2003a. Cambio tecnológico, productividad y crecimiento de la industria en Bogotá. In Cuadernos de Ciudad. Serie Productividad y Competitividad No.2. Bogotá: Secretaría de Hacienda Distrital.
Secretaría General. 2005. Régimen Legal de Bogotá D.C.: Alcaldía Mayor de Bogotá. Segovia Mora, Guillermo, ed. 1994. Bogotá hoy: democracia, convivencia y poblaciones
vulnerables. Bogotá: Consejería para Asuntos Sociales-Alcaldía Mayor de Santafé de Bogotá, Consejería Presidencial para la Juventud la Mujer y la Familia.
Segura Ortíz, J.C. 1996. Desarrollo Humano y Progreso Social en Santa Fe de Bogotá, D.C. Balance y Perspectivas. In Formar Ciudad. Bogotá: Alcaldía Mayor, DAPD, Subdirección de Planeamiento Económico y Social.
SELA, UN-ECLAC; CLAD. 2005. Employment Policies in Latin America and the Caribbean 1998 [cited January 5 2005]. Available from http://lanic.utexas.edu/project/sela/eng_docs/rdtcti98dt.html.
Sen, Amartya Kumar. 1987. On ethics and economics, The Royer lectures. Oxford, UK: New York, NY, USA.
———. 1999. Development as freedom. 1st. ed. New York: Knopf. SHD. 2000. Coyuntura Económica de Bogotá D.C. Bogotá: Oficina de Estudios Económicos,
Secretaría de Hacienda Distrital. ———. 2003. La Pobreza en Bogotá y los Resultados de las Políticas Distritales para
Combatirla. Bogotá: Secretaria de Hacienda Distrital, Alcaldía Mayor de Bogotá. ———. 2003a. Impacto de la Inversión Social Distrital y de los Subsidios en las tarifas de los
Servicios Públicos sobre la distribución del Ingreso en Bogotá. In Cuadernos de Ciudad. Serie Equidad y Bienestar No.2. Bogotá: Secretaría de Hacienda Distrital.
SHD, Dirección de Estudios Económicos. 2001. Actualidad Económica de Bogotá. Bogotá: Secretaría de Hacienda Distrital.

333
Smith, Brian C. 1985. Decentralization: the territorial dimension of the state. London: Boston. Snyder, R. 2001. Scaling down: the subnational comparative method. Studies in Comparative
International development Vol. 36 (No.1):pp.93-110. Solimano, Andrés. 2003. Globalización y migración internacional: la experiencia
latinoamericana. Revista de la Comisión Económica para América Latina y el Caribe (No.80):55-72.
Solimano, Andrés, Felipe Sáez, Caroline O. N. Moser, and Cecilia López. 1999. Ensayos sobre paz y desarrollo: el caso de Colombia y la experiencia internacional. 1. ed. Washington, D.C.: World Bank.
Spindler, William. 2004. Colombia's Congress calls attention to "grave human rights situation" of Bogota's displaced population: UNHCR News Stories.
Stallings, Barbara, and Wilson Peres. 2000. Crecimiento, empleo y equidad: el impacto de las reformas económicas en América Latina y el Caribe. 1. ed, Sección de obras de economía contemporánea. Santiago, Chile: Fondo de Cultura Económica CEPAL.
———. 2000. Growth, employment, and equity: the impact of the economic reforms in Latin America and the Caribbean. Santiago, Chile: Brookings Institution Press, CLACSO.
Stein, Ernesto. 1998. Fiscal decentralization and government size in Latin America, Working paper series; 368. Washington, D.C.: Inter-American Development Bank, Office of the Chief Economist.
Stiglitz, Joseph E. 2003. El rumbo de las reformas.Hacia una nueva agenda para América Latina. Revista de la Comisión Económica para América Latina y el Caribe (No.80):7-40.
Stone, Deborah A. 1997. Policy paradox: the art of political decision making. New York: W.W. Norton.
Strauch, Ernesto Durán, Gloria Amparo Acero Niño, and Maria Cristina Torrado Pacheco. 2003. Niñez Bogotana: Situación y Políticas Públicas 1990-2000. Edited by P. Quijano Samper. 5 vols. Vol. 1, Colección Estados del Arte, Bogotá. Bogotá: Observatorio sobre Infancia. Universidad Nacional; DABS, Alcaldía Mayor de Bogotá.
Stren, Richard E. 2001. Thinking about Urban Inclusiveness. Washington D.C.: Woodrow Wilson Center.
Stren, Richard E., and Judith Kjellberg Bell, eds. 1994. Urban research in the developing world. 4 vols. Toronto: Centre for Urban & Community Studies University of Toronto.
The Economist Intelligence Unit. 2005. Country Briefings: Colombia. The Economist 2003 [cited Jan. 5 2005]. Available from http://www.economist.com/countries/Colombia/.
Torres Melo, Jaime. 2003. Urban governance and political entrepreneurs: the experience of Bogotá’s politics 1980-2000. In Summer School in Local Government. University College Cork - Cork, Ireland.
Tulchin, Joseph S., and Andrew Selee, eds. 2004. Decentralization and Democratic Governance in Latin America. Washington D.C.: Woodrow Wilson International Center for Scholars, Latin American Program.
Tulchin, Joseph S., and Andrew Selee, eds. 2004. Decentralization and Democratic Governance in Latin America. Washington D.C.: Woodrow Wilson Center fro Scholars.
Udehn, Lars. 1996. The limits of public choice: a sociological critique of the economic theory of politics. London; New York: Routledge.
UN-HABITAT. 1996. An urbanizing world: global report on human settlements, 1996. New York: Oxford University Press.

334
———. 2000. The Global Campaign on Urban Governance: Nairobi, Kenya: United Nations Human Settlements Programme, UN-HABITAT.
———. 2000a. The Global Campaign on Urban Governance: Nairobi, Kenya: United Nations Human Settlements Programme, UN-HABITAT.
UNCHR. 2003. Colombia, UNHCR's Protection and Assistance Programme for IDPs and Refugees 2003. Geneva: United Nations, Office of the United Nations High Commissioner for Refugees.
UNDP. 2003. Human development report 2003: Millennium development goals: a compact among nations to end human poverty. New York, N.Y.: Oxford.
UNDP; World Bank; IADB. 1999. La descentralización: un diálogo para el desarrollo. 2. ed. Caracas, Venezuela: Editorial Nueva Sociedad.
UNESCO-MOST. 2002. Les divisions de la ville: Préparé dans le cadre du programme de l'UNESCO gestion des transformations sociales, MOST. Management of social transformations = Gestion des transformations sociales, Les mots de la ville; 2. Paris: UNESCO.
United Nations, Economic Commission for Latin America and the Caribbean-. 1989. La dinámica del deterioro social en América Latina y el Caribe en los años ochenta. Edited by S. D. Division. Santiago, Chile: Naciones Unidas Comisión Económica para América Latina y el Caribe-CEPAL.
United Nations, Economic Commission for Latin America and the Caribbean. 2002. Social panorama of Latin America: 2000-2001. New York: UN.
United States, Agency for International Development. 1991. Latin America and the Caribbean: selected economic and social data. Washington, DC: Agency for International Development.
United States, Agency for International Development. 1996. Latin America and the Caribbean: selected economic and social data. Washington, DC: Agency for International Development.
———. 1999. Latin America and the Caribbean: selected economic and social data. Washington, D.C.: Bureau for Latin America and the Caribbean, United States Agency for International Development.
Uribe, María Victoria, Teófilo Vásquez, Comité Permanente por la Defensa de los Derechos Humanos (Colombia), and Fundación Terres des Hommes. 1995. Enterrar y callar: las masacres en Colombia, 1980-1993. 1. ed. Santafé de Bogotá: Comité Permanente por la Defensa de los Derechos Humanos: Fundación Terres des Hommes.
Urzúa, Raúl, and Diego Palma R., eds. 1997. Pobreza urbana y descentralización en América Latina: estudios de casos. Santiago, Chile: Centro de Análisis de Políticas Públicas Universidad de Chile.
Vargas, María Victoria. Reforma Tributaria y Productividad en Bogotá. In Reforma Tributaria en Bogotá de la administración Distrital y Productividad. Bogotá.
Vasak, Karel, and Philip Alston, eds. 1982. The International dimensions of human rights. Westport, Conn. Paris, France: Greenwood Press; Unesco.
Vázquez Carrizosa, Alfredo. 1986. Betancur y la crisis nacional. 1a ed. Bogota, Colombia? Ediciones Aurora.
Velásquez C., Fabio. 1994. Municipalidades y descentralización: presente y futuro. 1. ed. Lima, Perú: Universidad del Pacífico Centro de Investigación.
335
———. 2003. La participación ciudadana en Bogotá: mirando el presente, pensando el futuro. 1. ed, Colección Cultura democrática. Santafé de Bogotá: Alcadía Mayor de Bogotá D.C. Instituto Distrital de Cultura y Turismo Departamento Administrativo Acción Comunal.
Velásquez C., Fabio E. 1997. Descentralización Política y Participación Ciudadana en Colombia: balance de una década. In Procesos y tendencias de la descentralización en Colombia, edited by C. Moreno Ospina. Santafé de Bogotá, D.C., Colombia: Fundación Universidad Central Departamento de Investigaciones.
Velásquez C., Fabio, and Esperanza González R. 2003. ¿Qué ha pasado con la participación ciudadana en Colombia? Bogotá, Colombia: Fundación Corona.
Velásquez Gavilanes, Raúl. 2003. Bogotá: políticas públicas de gobierno local. 1. ed, Colección Biblioteca del profesional; Variation: Biblioteca del profesional. Bogotá: CEJA.
Vélez, Carlos Eduardo, Vivien Foster, Mauricio Santamaría, Natalia Millán, Bénédicte de la Brière, Giota Panopoulus, and Alejandro Gaviria. 2002. Colombia Poverty Report. Washington D.C.: Worl Bank, Colombia Country Management Unit, Latin America and the Caribbean Region.
Ward, Peter M. 1996. Contemporary issues in the government and administration of Latin American mega-cities. In The mega-city in Latin America, edited by A. Gilbert. Tokyo; New York: United Nations University Press, 1996.
Weller, Jürgen. 2000. Employment trends in Latin America and the Caribbean during the 1990s. CEPAL review (No. 72):p. 31-51: graphs, tables.
Williamson, John. 1994. The Political economy of policy reform. Washington, DC: Institute for International Economics.
Wodon, Quentin, and Robert L. Ayres. 2000. Poverty and policy in Latin America and the Caribbean, World Bank technical paper; no. 467. Washington, DC: World Bank.
Woller, Gary M. 1994. Economic reform in Latin America and the prospects for distributive justice: the market, neoliberal theory, and the state. The Journal of Socio-Economics v23 n4 (Winter):p383(21).
World Bank. 1992. Governance and Development. Washington, DC: World Bank. ———. 2000. Entering the 21st century World development report, 1999/2000. New York, N.Y:
Oxford University Press. Yepes A., Diego, Juan Ramos V., Francisco Lasso V., Oscar Fresneda B., Diego Salazar, and
María Elvira Naranjo. 1989. La pobreza en Bogotá--1985: descripción cuantitativa. Bogotá: República de Colombia Departamento Administrativo Nacional de Estadística Proyecto--Sistema de Indicadores Sociales para el Seguimiento de la Pobreza en Colombia.
Yusuf, Shahid, Weiping Wu, and Simon J. Evenett, eds. 2000. Local dynamics in an era of globalization: 21st century catalysts for development. New York, N.Y.: Oxford University Press.
Zalamea, Alberto. 1991. Diario de un constituyente. Bogotá: Temis: Zalamea Fajardo Editores. Zambrano P., Fabio, and Julián Vargas Lesmes. 1988. Santa Fe y Bogotá: Evolución histórica y
servicios Públicos. In Bogotá, 450 años: retos y realidades, edited by P. Santana R. Bogotá: Foro Nacional por Colombia, Instituto Francés de Estudios Andinos.
Zamudio Castañeda, José Vicente. 1997. Experiencia fiscal de la descentralización en Santa Fe de Bogotá (1992-1995). In Descentralización en Bogotá bajo la lupa (1992-1996), edited by J. V. Zamudio Castañeda, M. C. García Velandia and M. Katz García. Santafé de Bogotá: Cinep.

336
———. 1997. Experiencia Fiscal de la descentralización en Santa Fe de Bogotá (1992-1995). In Descentralización en Bogotá bajo la lupa (1992-1996), edited by J. V. Zamudio Castañeda, M. C. García Velandia and M. Katz García. Santafé de Bogotá: Cinep.
Zamudio Castañeda, José Vicente, Martha Cecilia García Velandia, and Mauricio Katz García, eds. 1997. Descentralización en Bogotá bajo la lupa (1992-1996). Santafé de Bogotá: Cinep.
Zubiría Samper, Andrés de. 1994. Constitución y descentralización territorial, Documentos ESAP. Santafé de Bogotá: Escuela Superior de Administración Pública.
Zuleta, Estanislao. 1991. Colombia: violencia, democracia y derechos humanos, Ensayo. Bogotá, Colombia: Altamir Ediciones.