FOR THE HALF YEAR ENDED December 31, 2020
36
2020 FOR THE HALF YEAR ENDED December 31, 2020
Transcript of FOR THE HALF YEAR ENDED December 31, 2020
2020FOR THEHALF YEAR ENDEDDecember 31, 2020
Half Year Ended Dec 31, 2020
Information
09101213141516
Independent Auditor's Review Report
030406
1

Half Year Ended Dec 31, 2020
2

Company Information
Board of Directors Sh. Naseem Ahmad Non-Executive Director/ChairmanMr. Rehman Naseem Executive DirectorMr. Amir Naseem Sheikh Executive DirectorMr. Muhammad Mukhtar Sheikh Executive DirectorMr. Faisal Ahmed Non-Executive DirectorMr. Fahd Mukhtar Non-Executive DirectorMr. Babar Ali Independent DirectorMr. Masood Karim Shaikh Independent DirectorMs. Parveen Akhter Malik
Independent Director
Chief Executive
Mr. Rehman Naseem
Audit Committee
Mr. Babar Ali
(Independent Director)
ChairmanMr. Sheikh Naseem Ahmed
MemberMr. Fahd Mukhtar
MemberMs. Parveen Akhter Malik
(Independent Director)
MemberHuman Resource and
Remuneration Committee
Mr. Babar Ali
(Independent Director)
ChairmanMr. Faisal Ahmed
MemberMr. Fahd Mukhtar
Member
Company Secretary
Mr. Asad Mustafa
Chief Financial Officer
Mr. Muhammad Azam
Head of Internal Audit
Mr. Saboor Sadiq Rana
Auditors
KPMG TaseerHadi & Co., Chartered Accountants
Bankers
Allied Bank Limited
Faysal Bank Limited
National Bank of Pakistan Askari Bank Limited MCB Bank Limited The Bank of Punjab Meezan Bank Limited
The Bank of Khyber
United Bank Limited
Pak Brunei Investment Company Limited
Standard Chartered Bank (Pakistan) Limited
Pak Oman Investment Company LimitedHabib Bank Limited
Summit Bank Limited
Soneri Bank Limited
Dubai Islamic Bank Pakistan Limited
Bank Alfalah Limited
JS Bank Limited
Bank Al Habib Limited
Bank Islami Pakistan Limited
Saudi Pak Industrial & Agricultural Investment Company Limited
Pak Libya Holding Company (Pvt.) Ltd.
Habib Metropolitan Bank Limited
Pak Kuwait Investment Company (Private) Limited
Industrial & Commercial Bank of China Limited
Legal Advisor
Mian
Muhammad Haneef
Head Office &Shares Department:
59/3, Abdali Road, Multan.
Phone: (92) 61-4579001-7, 4781637 Fax: (92) 61-4541832E-mail: [email protected]; [email protected]
Web Reference
www.fazalcloth.com
Shares Registrar: Vision Consulting Ltd.3-C, LDA Flats, Lawrence Road, Lahore. [email protected]: (92) 42-36283096, 36283097 Fax: (92) 42-36374839
Registered Office: 69/7, AbidMajeed Road, Survey No. 248/7, Lahore Cantt, Lahore.Phone: (92) 42-36684909
Mills: i) Fazal Nagar, Jhang Road, Muzaffargarh – PakistanPh. (92) 66-2422216, 18 Fax: (92) 66-2422217
ii) Qadirpur Rawan Bypass, Khanewal Road, Multan – PakistanPh. (92) 61-6740041-43, Fax: (92) 61-6740052
Half Year Ended Dec 31, 2020
3

Half Year Ended Dec 31, 2020
DIRECTORS' REVIEW
Dear Shareholders!
Assalam-o-Alaikum
Your Directors are pleased to present before you un-audited financial information of Fazal Cloth Mills Limited, for the six months ended December 31, 2020.
Sales were recorded at Rs. 25,556.19 million during the six months of the current financial year compared to Rs. 20,234.46 million during the corresponding period last year, registering an increase of 26.30%. Your Company earned after tax profit of Rs. 1,823.49 million (pre-tax profit of Rs. 2,296.24 million) as compared to Rs. 120.86 million (pre-tax profit of Rs. 375.82 million) for the corresponding period last year after charging depreciation of Rs. 617.66 million (December 31, 2019: Rs. 604.80 million). EBITDA of Rs. 3,769.81 million (December 31, 2019: Rs. 2,441.53 million) was generated.
Earnings per Share of the Company for the six months ended December 31, 2020 were Rs. 60.78 as compared to Rs. 4.03 for corresponding period in previous year.
Fazal Weaving Mills Ltd, a wholly owned subsidiary of the Company, has been merged with the Company. Accordingly, consolidated financial statements are no longer required.
Financial highlights of the half year are as under:
Corporate Governance
Composition of Board is as follows
a) Total number of Directors:
1) Male 8
2) Female 1
b) Composition
1) Independent Director 3
2) Non-executive Directors 3
3) Executive Directors 3
4

Half Year Ended Dec 31, 2020
These are two Committees of the Board:
a) Audit Committee of the Board:
Director's Remuneration
The Board of Directors has approved Director's Remuneration policy. The main features of the policy are as follows:
a) The Company shall not pay remuneration to its non-executive directors including independent
directors except for meeting fee for attending Board and its Committees meetings.
b) The company will reimburse or incur expenses of traveling and accommodation of directors in
relation to attending of Board and its Committees meetings.
c) The Director's Remuneration policy will be reviewed and approved by the Board of Directors from
time to time.
Future Outlook
Demand for textile products remains strong with retailers worldwide restocking ahead of expected reopening of countries in the summer post vaccination. Your Company has a full order book for the next few months. Your Company has also covered its raw material requirements for the next 6 to 9 months. In view of this, your management expects good profitability during the remaining period of the current financial year.
Your Company continues to invest in horizontal expansion and BMR of its mills. LCs have been opened for 9 additional Vortex Spinning machines and 19,344 Spindles with back process and winding. The equipment is expected to be installed and commissioned by September 2021.
Management and Labor Relations
The relations between the workers and management remained cordial throughout the period. Your Directors wish to thank all workers and staff members for their hard work.
b) Human Resource and Remuneration Committee:
Dated: March 01, 2021
CHIEF EXECUTIVE / DIRECTORDIRECTOR(AMIR NASEEM SHEIKH)
5

Half Year Ended Dec 31, 2020
4
120.863,769.81
2,441.53
2019
6

Half Year Ended Dec 31, 2020
2021 ,01
7

Half Year Ended Dec 31, 2020
Fazal Cloth Mills LimitedCondensed Interim Financial Statements (Un-audited)
For the Half Year Ended 31 December 2020
8

Half Year Ended Dec 31, 2020
INDEPENDENT AUDITOR'S REVIEW REPORT
To the members of Fazal Cloth Mills Limited
Report on review of Interim Financial Statements�
Introduction
We have reviewed the accompanying condensed interim statement of financial position of Fazal Cloth Mills Limited as at 31 December 2020 and the related condensed interim statement of profit or loss and condensed interim statement of comprehensive income, condensed interim statement of changes in equity, and condensed interim statement of cash flows, and notes to the financial statements for the six-month period then ended (here-in-after referred to as the “interim financial statements”). Management is responsible for the preparation and presentation of this interim financial statements in accordance with accounting and reporting standards as applicable in Pakistan for interim financial reporting. Our responsibility is to express a conclusion on these financial statements based on our review
Scope of Review
We conducted our review in accordance with International Standard on Review Engagements 2410, “Review of Interim Financial Information Performed by the Independent Auditor of the Entity”. A review of interim financial statements consists of making inquiries, primarily of persons responsible for financial and accounting matters, and applying analytical and other review procedures. A review is substantially less in scope than an audit conducted in accordance with International Standards on Auditing and consequently does not enable us to obtain assurance that we would become aware of all significant matters that might be identified in an audit. Accordingly, we do not express an audit opinion.
Conclusion
Based on our review, nothing has come to our attention that causes us to believe that the accompanying interim financial statements is not prepared, in all material respects, in accordance with the accounting and reporting standards as applicable in Pakistan for interim financial reporting.
Emphasis of Matter
We draw attention to note 1.2 to the interim financial statements, which describes that during the period the Lahore High Court has approved the scheme of Amalgamation between the Company & Fazal Weaving Mills Limited, a wholly owned subsidiary, effective from 01 July 2018. Consequently, the comparative information has been restated to incorporate the financial adjustments due to merger. Our conclusion is not modified in respect of these matters.
Other Matter
The comparative figures for the statement of financial position as at 30 June 2020, and the condensed interim statements of profit or loss and other comprehensive income, changes in equity and cash flows for the half year ended 31 December 2019 and the figures for the condensed interim statements of profit or loss and other comprehensive income for the quarters ended 31 December 2020 and 31 December 2019, have not been reviewed by us and accordingly, we do not express a conclusion on them.
The engagement partner on the engagement resulting in this independent auditor's report is Bilal Ali.
March 01, 2021
9

Half Year Ended Dec 31, 2020
CHIEF EXECUTIVE OFFICER DIRECTOR
Condensed Interim Statement of Financial Position
EQUITY AND LIABILITIES
Share capital and reserves
Authorized share capital
Issued, subscribed and paid-up capital
Capital reserves
- Others capital reserves
- Revaluation surplus on property, plant and equipment
Unappropriated profits - revenue reserve
Non-current liabilities
Long term financing - secured
Long term musharika - secured
Lease liability
Long term payable
Deferred liabilities:
- Staff retirement benefit
- Deferred taxation
- Deferred grant
Current liabilities
Current portion of non-current liabilities
Trade and other payables
Income tax payable
Unclaimed dividend
Short term borrowings - secured
Accrued mark-up
Contingencies and commitments
The annexed notes from 1 to 25 form an integral part of these financial statements.
(Un-audited) (Un-audited)
31 December 30 June
2020 2020
Note Rupees Rupees
Restated
700,000,000
700,000,000
300,000,000
300,000,000
1,329,274,699
1,179,978,846
9,007,590,147
9,243,287,786
11,792,261,035
9,831,099,492
22,429,125,881
20,554,366,124
5 11,393,170,500 11,632,970,065 6 2,236,455,978 2,627,600,636 7 72,007,495
71,173,118
375,696,152
-
287,394,794
291,766,604
3,346,287,014
3,125,765,394
18,659,540
19,534,423
17,729,671,473
17,768,810,240
8 3,102,802,910
1,010,564,898
9 5,295,929,771
3,668,520,905
74,571,719
-
13,748,423
13,748,423
10,211,413,841
11,537,224,217
297,654,613 517,191,250
18,996,121,277 16,747,249,693
10
59,154,918,631 55,070,426,057
10

ASSETS
Non-current assets
Property, plant and equipment
Long term investments
Long term advances
Long term mark-up accrued
Long term deposits
Current assets
Stores, spares and loose tools
Stock-in-trade
Trade debts
Loans and advances
Deposits, prepayments and
other receivables
Mark-up accrued
Short term investment
Tax refunds due from the Government - net
Cash and bank balances
(Un-audited) (Un-audited)
31 December 30 June
2020 2020
Note Rupees Rupees
Restated
11 28,041,592,012
28,196,702,854
12 2,762,187,636
2,291,587,743
13 3,344,833,138
2,733,701,707
14 77,729,017
-
24,128,493
24,128,493
34,250,470,296
33,246,120,797
785,790,730 699,438,449
18,182,372,157 14,503,842,642
15 4,774,062,824
5,145,580,847
150,270,106
204,530,174
364,830,394
465,434,760
33,755,774
29,338,656
16 178,092,000
163,587,600
212,425,657
313,703,112
17 222,848,693
298,849,020
24,904,448,335
21,824,305,260
59,154,918,631 55,070,426,057
Half Year Ended Dec 31, 2020
As at 31 December 2020
11

Half Year Ended Dec 31, 2020
DIRECTORCHIEF EXECUTIVE OFFICER
Condensed Interim Statement of Profit or Loss (Un-Audited)For the half year and quarter ended 31 December 2020
31 December 31 December 31 December 31 December
2020 2019 2020 2019
Note Rupees Rupees Rupees Rupees
Restated Restated
Revenue - net 18 25,556,191,687
20,234,458,243
12,301,333,820
10,664,909,051
Cost of sales 19 (22,514,553,325)
(17,481,352,817)
(10,473,588,946)
(9,469,801,699)
Gross profit 3,041,638,362
2,753,105,426
1,827,744,874
1,195,107,352
Selling and distribution expenses (198,884,209)
(221,319,834)
(97,110,108)
(119,992,440)
Administrative expenses (192,344,180)
(187,666,864)
(105,342,056)
(103,060,599)
Other expenses (132,943,665)
(189,337,550)
(78,992,675)
(18,469,117)
(524,172,054) (598,324,248) (281,444,839) (241,522,156)
Other income 677,978,828
162,098,827
408,269,428
107,373,733
Profit from operations 3,195,445,136
2,316,880,005
1,954,569,463
1,060,958,929
Share of loss from associates (43,293,867)
(480,148,673)
(23,428,727)
(464,075,868)
Finance cost (855,915,158)
(1,460,910,344)
(423,242,330)
(719,678,771)
Profit / (loss) before taxation 2,296,236,111
375,820,988
1,507,898,406
(122,795,710)
Taxation (472,744,624)
(254,964,391)
(203,956,924)
(142,536,744)
Profit / (loss) after taxation 1,823,491,487
120,856,597
1,303,941,482
(265,332,454)
Earnings / (loss) per share
- basic and diluted 60.78
4.03
43.46
(8.84)
The annexed notes from 1 to 25 form an integral part of these financial statements.
Half year ended Quarter ended
12

Half Year Ended Dec 31, 2020
DIRECTORCHIEF EXECUTIVE OFFICER
Condensed Interim Statement of Comprehensive Income (Un-Audited)For the half year and quarter ended 31 December 2020
31 December 31 December 31 December 31 December
2020 2019 2020 2019
Rupees Rupees Rupees Rupees
Restated Restated
Profit after taxation 1,823,491,487
120,856,597
1,303,941,482
(265,332,454)
Other comprehensive income / (loss) - net of tax
Items that will never be reclassified to
statement of profit or loss:
Net change in fair value of
financial assets at FVOCI 149,295,853
(205,360,541)
(36,536,538)
(47,245,524)
Total comprehensive income / (loss) for the period 1,972,787,340 (84,503,944) 1,267,404,944 (312,577,978)
The annexed notes from 1 to 25 form an integral part of these financial statements.
Half year ended Quarter ended
13

Half Year Ended Dec 31, 2020
DIRECTORCHIEF EXECUTIVE OFFICER
Condensed Interim Statement of Changes in Equity (Un-Audited)For the half year and quarter ended 31 December 2020
Revenue reserve
Balance as at 30 June 2019 300,000,000 77,616,000 175,000,000 1,120,927,815 9,558,609,807 10,476,717,528 21,708,871,150
Total comprehensive income for the period:
Profit for six months ended
31 December 2019 - restated - - - - - 120,856,597 120,856,597
Other comprehensive loss
for six months ended 31 December 2019 - - - (205,360,541) - - (205,360,541)
- - - (205,360,541) - 120,856,597 (84,503,944)
Effect on deferred tax due
to change in tax rate and proration rate - - - - 38,611,906 - 38,611,906
Surplus transferred to un-appropriated profit on
account of incremental depreciation charged
during the period - net of tax - - - - (148,306,966) 148,306,966 -
Transfer from surplus on revaluation of fixed assets
on disposal - net of tax - -
-
-
(5,280,888)
5,280,888 -
Transactions with the owners of the Company :
Cash dividend @ Rs. 10.50 per ordinary
share for the year ended 30 June 2019 - -
-
-
-
(315,000,000) (315,000,000)
Balance as at 31 December 2019 300,000,000 77,616,000
175,000,000
915,567,274
9,443,633,859
10,436,161,979 21,347,979,112
Total comprehensive loss for the period:
Loss for six months ended
30 June 2020 - restated - -
-
-
-
(785,651,556) (785,651,556)
Other comprehensive income
for six months ended 30 June 2020 - -
-
11,795,572
-
25,354,285 37,149,857
- -
-
11,795,572
-
(760,297,271) (748,501,699)
Effect on deferred tax due to change in
proration rate - -
-
-
(45,111,289)
- (45,111,289)
Surplus transferred to un-appropriated profit on
account of incremental depreciation charged
during the year - net of tax - -
-
-
(155,187,935)
155,187,935 -
Transfer from surplus on revaluation of fixed assets
on disposal - net of tax - - - - (46,849) 46,849 -
Balance as at 30 June 2020 300,000,000 77,616,000 175,000,000 927,362,846 9,243,287,786 9,831,099,492 20,554,366,124
Balance as at 30 June 2020 300,000,000 77,616,000 175,000,000 927,362,846 9,243,287,786 9,831,099,492 20,554,366,124
Total comprehensive income for the period :
Profit for six months ended 31 December 2020 - - - - - 1,823,491,487 1,823,491,487
Other comprehensive income
for six months ended 31 December 2020 - - - 149,295,853 - - 149,295,853
- - - 149,295,853 - 1,823,491,487 1,972,787,340
Effect on deferred tax due to change in
proration rate - - - - (98,027,583) - (98,027,583)
Surplus transferred to un-appropriated profit on
account of incremental depreciation charged
during the period - net of tax - - - - (137,670,056) 137,670,056 -
Balance as at 31 December 2020 300,000,000 77,616,000 175,000,000 1,076,658,699 9,007,590,147 11,792,261,035 22,429,125,881
The annexed notes from 1 to 25 form an integral part of these financial statements.
- - - - - - - - - - - - - - - - - - - - - - - - - - - - - - - - - - - - - - - - - - - Restated - - - - - - - - - - - - - - - - - - - - - - - - - - - - - - - - - - - - - - - - - - - -
Un-appropriated
profits
- - - - - - - - - - - - - - - - - - - - - - - - - - - - - - - - - - - - - - - - - - - Rupees - - - - - - - - - - - - - - - - - - - - - - - - - - - - - - - - - - - - - - - - - - - - -
Share capital
Capital reserves
TotalShare
premium
Capital
redemption
reserve
Fair value
reserve
Revaluation
surplus on
property, plant
and equipment
14

Half Year Ended Dec 31, 2020
DIRECTORCHIEF EXECUTIVE OFFICER
Condensed Interim Statement of Cash Flows (Un-Audited)For the half year ended 31 December 2020
Cash flows from operating activities
Profit before taxation
Adjustments for:
Depreciation on property, plant and equipment
Unrealized (gain) / loss on re-measurement of short term investment
Provision for doubtful debts
Fair value gain on long term investment
Provision for gratuity
Provision for infrastructure cess
Provision for workers' profit participation fund
Provision for workers' welfare fund
(Gain) / loss on disposal of property, plant and equipment
Share of loss from associates
Finance income
Finance cost
Cash generated from operations before working capital changes
Effect on cash flows due to working capital changes
(Increase) / decrease in current assets:
Stores, spares and loose tools
Stock-in-trade
Trade debts
Loans and advances
Deposits, prepayments and other receivables
Increase in current liabilities:
Trade and other payables
Cash generated from operations
Gratuity paid
Taxes paid - net
Net cash generated from operating activities
Cash flows from investing activities
Fixed capital expenditure
Proceeds from sale of property, plant and equipment
Long term loan and advances to associates
Long term deposits
Net cash used in investing activities
Cash flows from financing activities
Long term financing obtained
Long term financing repaid
Long term musharika obtained
Long term musharika repaid
Short term borrowings - net
Lease rentals paid
Finance cost paid - net
Dividend paid
Net cash (used in) / generated from financing activities
Net (decrease) / increase in cash and cash equivalents
Cash and cash equivalents at beginning of the period
Cash and cash equivalents at end of the period
The annexed notes from 1 to 25 form an integral part of these financial statements.
31 December 31 December
2020 2019
Rupees Rupees
Restated
2,296,236,111 375,820,988
617,657,230 604,798,839
(14,504,400) 19,951,200
- 12,309,534
(345,866,354) -
70,189,047 80,494,356
48,601,477 89,173,735
97,861,481 45,956,725
29,449,491 6,865,213
(1,371,132) 11,115,997
43,293,867 480,148,673
(138,535,120) (155,079,169)
855,915,158 1,460,910,344
3,558,926,856 3,032,466,435
(86,352,281) 12,361,546
(3,678,529,515) (5,734,159,895)
371,518,023 1,681,179,454
54,260,068 (90,610,966)
100,604,366 3,122,110
(3,238,499,339) (4,128,107,751)
1,827,192,569 1,689,767,019
2,147,620,086 594,125,703
(74,560,857) (59,111,551)
(174,401,411) 330,124,642
(248,962,268) 271,013,091
1,898,657,818 865,138,794
(464,087,912) (1,516,064,500)
2,912,655 3,100,700
(573,474,000) (540,765,448)
- (57,000)
(1,034,649,257) (2,053,786,248)
1,539,814,680 1,780,821,372
(79,395,774) (1,029,866,449)
- 1,000,000,000
- (160,311,325)
(1,325,810,376) 1,355,452,770
(4,392,300) (4,392,300)
(1,070,225,118) (1,384,928,350)
- (313,137,017)
(940,008,888) 1,243,638,701
(76,000,327) 54,991,247
298,849,020 199,476,038
222,848,693 254,467,285
15
Half Year Ended Dec 31, 2020
Notes to the Condensed Interim Financial Statements (Un-audited)For the half year ended 31 December 2020
1 Legal status and nature of business
1.1
1.2
As stated above, after the merger the consolidated financial statements are no longer required
and status of these financial statements has changed from separate to individual financial
statements of the Company. The comparative figures in these financial statements have been
restated to reflect adjustments due to merger with effect from 01 July 2018.
Fazal Cloth Mills Limited ("the Company") was incorporated in Pakistan in 1966 as a Public
Limited Company under the Companies Act, 1913 (now the Companies Act, 2017). The
shares of the Company are quoted on Pakistan Stock Exchange ('PSX'). The registered office
of the Company is situated at 69/7, Abid Majeed Road, Survey No. 248/7, Lahore Cantt,
Lahore. The Company is principally engaged in manufacture and sale of yarn and fabric. The
manufacturing facilities and ware houses are located at Fazal Nagar, Jhang Road,
Muzaffargarh and Qadirpur Rawan Bypass, Khanewal Road, Multan in the province of
Punjab.
The Board of Directors (“the Board”) of the Company in their meeting held on 30 October
2018 considered and approved in principle to merge Fazal Weaving Mills Limited (FWML),
a wholly owned subsidiary, into the Company in accordance with the scheme of arrangement
(“the Scheme”) prepared under the provisions of Section 279 to 283 and 285(8) of the
Companies Act, 2017. Accordingly, the Company filed a petition before Lahore High Court
(“the Court”) for sanction of the scheme and the Court vide order dated 30 January 2019
directed the both companies to hold Extra-ordinary General meetings (“EOGM”) of the
shareholders to ascertain the wishes of members with reference to the Scheme. The said
EOGMs was held on 09 March 2019 and shareholders of the Companies in principle
considered and approved the merger. The Court after considering all the facts and
circumstances had reserved judgement on hearing held on 21 October 2020 and the
sanctioned order effective from 01 July 2018 (effective date) was released on 13 February
2021 (completion date). Pursuant to this sanction, the entire business of FWML including its
properties, assets, liabilities and rights and obligations have vested into the Company, with
effect from effective date.
The scheme of amalgamation / merger is a business combination of entities or business under
common control and thereof scoped out of IFRS 3 'Business Combination'. Accordingly, the
assets acquired and liabilities assumed / assets and liabilities vested are recognized under the
book value basis (predecessor method) of accounting. As FWML was wholly owned
subsidiary of the Company acquired on 29 January 2013, the values incorporated in the
standalone financial statements of the FWML are considered for the purpose of applying
book value / predecessor method. As FWML is the wholly-owned subsidiary of the
Company the paid-up share capital appearing in the books of FWML was set-off against the
respective investments appearing in the books of the Company. Each of the assets and
liabilities of FWML as per the accounts as on the effective date, formed the assets and / or
liabilities of corresponding nature in the books of the Company. Likewise, the
unappropriated profits / losses of FWML as on the effective date shall constitute as reserves
of a corresponding nature of the Company. As the shares of FWML will be set off against the
investments of the Company, therefore all share certificates of FWML shall stand cancelled.
The merger does not involve any cash consideration or equity issuance, resultantly no
adjustment has been made to net assets or in statement of changes in equity.
16

Half Year Ended Dec 31, 2020
1.3 Impact of COVID-19 on the interim financial statements
2 Basis of preparation
2.1 Statement of Compliance
-
-
-
Comparative statement of financial position numbers represent the assets and liabilities of
FWML merged into the Company as at 30 June 2020, whereas comparative condensed
interim consolidated statement of profit or loss, condensed interim consolidated statement of
comprehensive income, consolidated statement of cash flows and consolidated statement of
changes in equity represents the results of FWML merged with the Company's results for the
six months period ended 31 December 2019. Further, adjustment have been made to
eliminate intra-group assets, liabilities, equity, income, expenses, cashflows and unrealized
gain or losses resulting from intra-group transactions where applicable. Further, as explained
in note 12.5, investment in associates which were previously carried at cost has now been
recognized using equity method of accounting. The comparative figures as at 30 June 2020
and for the six months ended 31 December 2019 are un-audited or have not been subject to
limited scope review.
Where the provisions of and directives issued under the Companies Act, 2017 differ with the
requirements of IAS 34 or IFAS, the provisions of and directives issued under the Companies
Act, 2017 have been followed.
On 11 March 2020, COVID-19 was declared a pandemic by the World Health Organization,
impacting countries globally. Measures taken to contain the spread of the virus, including
travel bans, quarantines, social distancing, and closures of non-essential services and
factories have triggered significant disruptions to businesses worldwide, resulting in an
economic slowdown. The potential impacts from COVID-19 remain uncertain, including,
among other things, on economic conditions, businesses and consumers. However, the impact
varies from industry to industry in different jurisdictions. As per relaxation given by the
authorities to export oriented entities, the Company continued its operations uninterrupted
during the period with all precautionary measures to prevent the pandemic spread. There is
no material financial impact of COVID-19 on the carrying amounts of assets and liabilities or
items of income and expenses.
Based on management’s assessment, considering demand from its customers, availability of
raw material and measures taken by Government to support the industry, COVID-19 does not
have a significant impact on the Company.
These condensed interim financial statements have been prepared in accordance with the
accounting and reporting standards as applicable in Pakistan for interim financial reporting.
The accounting and reporting standards as applicable in Pakistan for interim financial
reporting comprise of:
International Accounting Standard (IAS) 34, Interim Financial Reporting, issued by the
International Accounting Standards Board (IASB) as notified under the Companies Act,
However, pursuant to relaxation announced by the State Bank of Pakistan in view of this
pandemic, the Company has availed deferments of principal repayments of certain long term
loans and availed financing facility for payment of salaries and loans as explained in note 5.1
to the interim financial statements.
Islamic Financial Accounting Standards (IFAS) issued by the Institute of Chartered
Accountants of Pakistan as notified under the Companies Act, 2017; and
Provisions of and directives issued under the Companies Act, 2017.
17

Half Year Ended Dec 31, 2020
2.2 Basis of Accounting
2.2.1
2.2.2
3
3.1
3.2
4 Statement of consistency in accounting policies
4.1
4.1.1
Amendments and interpretations of approved accounting standards
- 01 June 2021
- 01 January 2022
- 01 January 2022
- 01 January 2022
- 01 January 2022
- 01 January 2022
There were certain other new amendments to the approved accounting standards which
became effective during the period but are considered not to be relevant or have any
significant effect on the Company's operations and are, therefore, not disclosed.
The following amendments and interpretations of approved accounting standards will be
effective for accounting periods as detailed below:
The accounting policies and the methods of computation adopted in the preparation of these
condensed interim financial statement are same as those applied in the preparation of the
annual financial statements for the year ended 30 June 2020.
These condensed interim financial statements do not include all of the information required
for full annual financial statements and should be read in conjunction with the annual
financial statements for the year ended 30 June 2020.
Estimates and judgments
The preparation of condensed interim financial statements requires management to make
judgments, estimates and assumptions that affect the application of accounting policies and
the reported amounts of assets and liabilities, income and expense. Actual results may differ
from these estimates.
Estimates and judgments made by the management in the preparation of this condensed
interim financial statements are the same as those that were applied to the annual financial
statements of the Company for the year ended 30 June 2020.
Annual Improvements to IFRS standards 2018-
2020 (IFRS 9, IFRS 16 and IAS 41)
This condensed interim financial statements comprises the condensed interim statement of
financial position of the Company as at 31 December 2020 and the related condensed interim
statement of profit or loss, statement of comprehensive income, statement of cash flows and
statement of changes in equity together with the notes forming part thereof.
COVID-19 Related Rent Concessions
(Amendment to IFRS 16)
Onerous Contracts – Cost of Fulfilling a
Contract (Amendments to IAS 37)
Property, Plant and Equipment: Proceeds before
Intended Use (Amendments to IAS 16)
Classification of liabilities as current or non-
current (Amendments to IAS 1)
Sale or Contribution of Assets between an
Investor and its Associate or Joint Venture
(Amendments to IFRS 10 and IAS 28)
18
Half Year Ended Dec 31, 2020
(U
n-a
ud
ited
)
31 D
ecem
ber
(U
n-a
udit
ed)
30 J
une
2020
2020
Note
Ru
pees
Rupees
Rest
ate
d
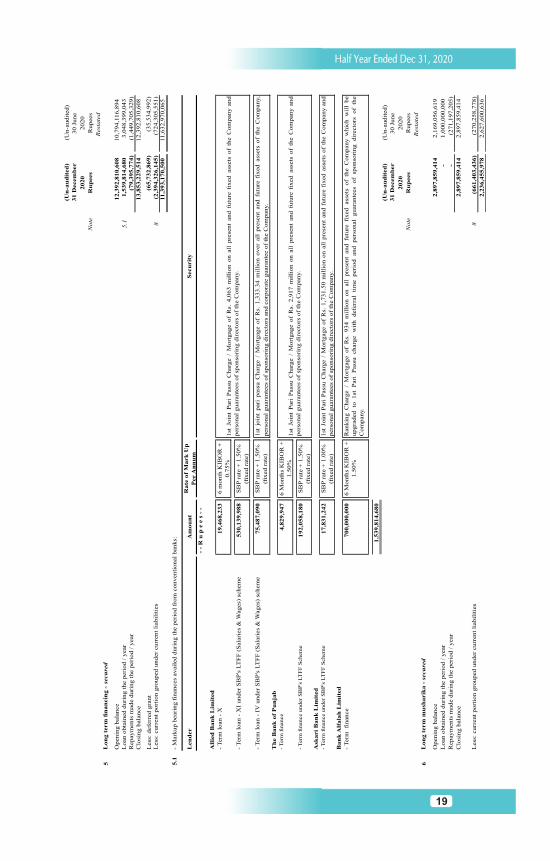
5L
on
g t
erm
fin
an
cin
g -
secu
red
Openin
g b
ala
nce
12,3
92,8
10,6
08
10,7
94,1
16,8
94
Loan o
bta
ined d
uri
ng t
he p
eri
od /
year
5.1
1,5
39,8
14,6
80
3,0
48,3
99,0
43
Repaym
ents
made d
uri
ng t
he p
eri
od /
year
(79,3
95,7
74)
(1,4
49,7
05,3
29)
Clo
sing b
ala
nce
13,8
53,2
29,5
14
12,3
92,8
10,6
08
Less
: defe
rred g
rant
(65,7
32,8
69)
(35,5
34,9
92)
Less
: curr
ent
port
ion g
rouped u
nder
curr
ent
liabil
itie
s8
(2,3
94,3
26,1
45)
(724,3
05,5
51)
11,3
93,1
70,5
00
11,6
32,9
70,0
65
5.1
- M
ark
up b
eari
ng fi
nances
avail
ed d
uri
ng t
he p
eri
od f
rom
conventi
onal
banks:
Len
der
Am
ou
nt
Rate
of
Mark
Up
Per
An
nu
m-
- R
u p
e e
s -
-
All
ied
Ban
k L
imit
ed
- T
erm
loan -
X19,4
68,2
33
6 m
onth
KIB
OR
+
0.7
5%
- T
erm
loan -
XI
under
SB
P's
LT
FF
(S
ala
ries
& W
ages)
schem
e530,1
39,9
88
SB
P r
ate
+ 1
.50%
(fixed r
ate
)
- T
erm
loan -
IV
under
SB
P's
LT
FF
(S
ala
ries
& W
ages)
schem
e75,4
87,0
90
SB
P r
ate
+ 1
.50%
(fixed r
ate
)
Th
e B
an
k o
f P
un
jab
- T
erm
finance
4,8
29,9
47
6 M
onth
s K
IBO
R +
1.5
0%
- T
erm
finance u
nder
SB
P's
LT
FF
Schem
e192,0
58,1
80
SB
P r
ate
+ 1
.50%
(fixed r
ate
)
Ask
ari
Ban
k L
imit
ed
- T
erm
finance u
nder
SB
P's
LT
FF
Schem
e17,8
31,2
42
SB
P r
ate
+ 1
.00%
(fixed r
ate
)
Ban
k A
lfala
h L
imit
ed
- T
erm
fi
nance
700,0
00,0
00
6 M
onth
s K
IBO
R +
1.5
0%
1,5
39,8
14,6
80
(U
n-a
ud
ited
)
31 D
ecem
ber
(U
n-a
udit
ed)
30 J
une
2020
2020
Note
Ru
pees
Rupees
Rest
ate
d
6L
on
g t
erm
mu
sharik
a -
secu
red
Openin
g b
ala
nce
2,8
97,8
59,4
14
2,1
69,0
56,6
19
Loan o
bta
ined d
uri
ng t
he p
eri
od /
year
-1,0
00,0
00,0
00
Repaym
ents
made d
uri
ng t
he p
eri
od /
year
-(2
71,1
97,2
05)
Clo
sing b
ala
nce
2,8
97,8
59,4
14
2,8
97,8
59,4
14
Less
: curr
ent
port
ion g
rouped u
nder
curr
ent
liabil
itie
s8
(661,4
03,4
36)
(270,2
58,7
78)
2,2
36,4
55,9
78
2,6
27,6
00,6
36
Secu
rit
y
1st
Join
tP
ari
Pass
uC
harg
e/
Mort
gage
of
Rs.
4,0
63
mil
lion
on
all
pre
sent
and
futu
refi
xed
ass
ets
of
the
Com
pany
and
pers
onal
guara
nte
es
of
sponso
ring d
irecto
rs o
f th
e C
om
pany.
1st
join
tpari
pass
uC
harg
e/
Mort
gage
of
Rs.
1,3
33.3
4m
illi
on
over
all
pre
sent
and
futu
refi
xed
ass
ets
of
the
Com
pany,
pers
onal
guara
nte
es
of
sponso
ring d
irecto
rs a
nd c
orp
ora
te g
uara
nte
e o
f th
e C
om
pany.
1st
Join
tP
ari
Pass
uC
harg
e/
Mort
gage
of
Rs.
2,9
17
mil
lion
on
all
pre
sent
and
futu
refi
xed
ass
ets
of
the
Com
pany
and
pers
onal
guara
nte
es
of
sponso
ring d
irecto
rs o
f th
e C
om
pany.
1st
Join
tP
ari
Pass
uC
harg
e/
Mort
gage
of
Rs.
1,7
31.5
0m
illi
on
on
all
pre
sent
and
futu
refi
xed
ass
ets
of
the
Com
pany
and
pers
onal
guara
nte
es
of
sponso
ring d
irecto
rs o
f th
e C
om
pany.
Rankin
gC
harg
e/
Mort
gage
of
Rs.
934
mil
lion
on
all
pre
sent
and
futu
refi
xed
ass
ets
of
the
Com
pany
whic
hw
ill
be
upgra
ded
to1st
Pari
Pass
ucharg
ew
ith
defe
rral
tim
eperi
od
and
pers
onal
guara
nte
es
of
sponso
ring
dir
ecto
rsof
the
Com
pany.
19
Half Year Ended Dec 31, 2020
(Un-audited)
31 December(Un-audited)
30 June
2020 2020
Note Rupees Rupees
Restated
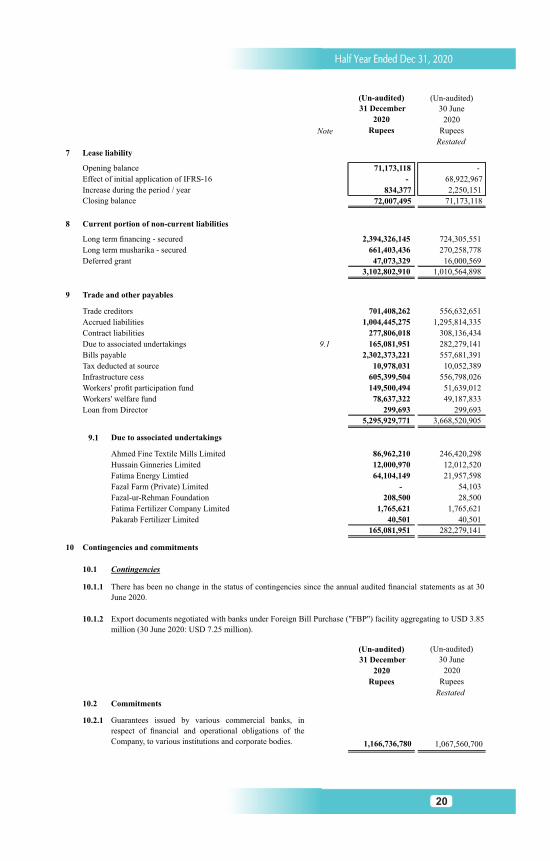
7 Lease liability
Opening balance 71,173,118 -
Effect of initial application of IFRS-16 - 68,922,967
Increase during the period / year 834,377 2,250,151
Closing balance 72,007,495 71,173,118
8 Current portion of non-current liabilities
Long term financing - secured 2,394,326,145 724,305,551
Long term musharika - secured 661,403,436 270,258,778
Deferred grant 47,073,329 16,000,569
3,102,802,910 1,010,564,898
9 Trade and other payables
Trade creditors 701,408,262 556,632,651
Accrued liabilities 1,004,445,275 1,295,814,335
Contract liabilities 277,806,018 308,136,434
Due to associated undertakings 9.1 165,081,951 282,279,141
Bills payable 2,302,373,221 557,681,391
Tax deducted at source 10,978,031 10,052,389
Infrastructure cess 605,399,504 556,798,026
Workers' profit participation fund 149,500,494 51,639,012
Workers' welfare fund 78,637,322 49,187,833
Loan from Director 299,693 299,693
5,295,929,771 3,668,520,905
9.1 Due to associated undertakings
Ahmed Fine Textile Mills Limited 86,962,210 246,420,298
Hussain Ginneries Limited 12,000,970 12,012,520
Fatima Energy Limtied 64,104,149 21,957,598
Fazal Farm (Private) Limited -
54,103
Fazal-ur-Rehman Foundation 208,500
28,500
Fatima Fertilizer Company Limited 1,765,621
1,765,621
Pakarab Fertilizer Limited 40,501
40,501
165,081,951
282,279,141
10 Contingencies and commitments
10.1 Contingencies
10.1.1
10.1.2
(Un-audited)
31 December
(Un-audited)
30 June
2020 2020
Rupees Rupees
Restated
10.2 Commitments
10.2.1
1,166,736,780 1,067,560,700
Guarantees issued by various commercial banks, in
respect of financial and operational obligations of the
Company, to various institutions and corporate bodies.
There has been no change in the status of contingencies since the annual audited financial statements as at 30
June 2020.
Export documents negotiated with banks under Foreign Bill Purchase ("FBP") facility aggregating to USD 3.85
million (30 June 2020: USD 7.25 million).
20

Half Year Ended Dec 31, 2020
(Un-audited)
31 December
(Un-audited)
30 June
2020 2020
Note Rupees Rupees
Restated
10.2.2 Commitments against irrevocable
letters of credit:
- capital expenditure 2,530,931,933 324,053,382
- raw material and stores and spares 5,266,954,474 1,545,003,301
7,797,886,407 1,869,056,683
10.2.3 Commitments in respect of foreign exchange
forward contracts: 80,400,000
1,096,875,000
11 Property, plant and equipment
Operating fixed assets 11.1 27,502,999,360
27,828,545,057
Right of use asset - building 11.2 60,307,597
63,179,387
Capital work-in-progress - at cost 11.3 478,285,055 304,978,410
28,041,592,012 28,196,702,854
11.1 Operating fixed assets
Opening net book value 27,828,545,057
26,743,990,836
Additions during the period / year:
Freehold land 2,665,000
-
Factory building on free hold land 38,425,699
254,780,498
Non-factory building on free hold land 4,277,295
72,172,629
Plant and machinery 217,918,598
1,869,401,897
Electric fittings and installations 1,271,071
96,862,491
Sui gas installations 257,343
359,550
Tools, laboratory equipment and arms -
2,409,322
Fire extinguishing equipment and scales 631,922
4,675,470
Office equipment 5,309,217
12,262,637
Furniture and fixtures 446,465
1,155,937
Vehicles 19,578,656
18,588,672
290,781,266
2,332,669,103
Carrying value of assets disposed off during the period / year (1,541,523) (14,506,394)
Depreciation charge for the period / year (614,785,440) (1,233,608,488)
Closing net book value 27,502,999,360 27,828,545,057
11.2 Right of use asset
Opening net book value 63,179,387 -
Effect of initial application of IFRS-16 - 68,922,967
Depreciation charge for the period / year (2,871,790) (5,743,580)
Closing net book value 60,307,597 63,179,387
21

Half Year Ended Dec 31, 2020
(Un-audited)
31 December (Un-audited)
30 June
2020 2020
Note Rupees Rupees
Restated
11.3 Capital work in progress - at cost
Factory building on free hold land
Material and expenses 36,728,217
22,477,370
Advance payments 26,695,853
14,617,445
63,424,070
37,094,815
Non-factory building on free hold land
Material and expenses 47,612,329
37,342,262
Advance payments 4,845,471
5,560,912
52,457,800
42,903,174
Plant and machinery
Cost and expenses 104,851,353 7,813,168
Advance payments 31,741,509 38,634,615
Letters of credit 180,933,325 171,883,925
317,526,187 218,331,708
Electric fittings and Installations - Cost and advance payments 33,335,464 1,700,061
Tools, laboratory equipment and arms - Cost and expenses 385,600 385,600
Fire Fighting Equipment & Weigh Scales - Cost
and advance payments 269,812 -
Office equipment - Cost and expenses 5,779,906 798,778
Furniture and fixtures - Cost and expenses 38,740 128,287
Vehicles - Cost and advance payments 5,067,476 3,635,987
478,285,055 304,978,410
12 Long term investments
Investments in related parties:
At fair value through OCI
Fatima Fertilizer Company Limited - quoted 12.1 1,833,126,302 1,683,830,449
Fatima Energy Limited - unquoted 12.2 869,649,000 -
Multan Real Estate (Private) Limited 12.3 33,358,054 33,358,054
2,736,133,356 1,717,188,503
Associated companies - at equity method
Fatima Energy Limited - unquoted 12.2.1 - 548,329,962
Fatima Transmission Company Limited - unquoted 12.4 26,038,175 26,050,673
Fatima Electric Company Limited - unquoted 12.4 16,105 18,605
12.4 26,054,280 574,399,240
2,762,187,636 2,291,587,743
22

Half Year Ended Dec 31, 2020
12.1
12.1
.1
12.2
12.2
.1
Sh
ares
Per
cen
tage
of
hol
din
g
31
Dec
emb
er
202
0
30 J
une
2020
31 D
ecem
ber
2020
30 J
une
2020
31 D
ecem
ber
2020
30 J
une
2020
31 D
ecem
ber
2020
30 J
une
2020
Not
e
Fat
ima
Fer
tili
zer
Com
pan
y L
imit
ed -
qu
ote
d1
2.1
.16
2,9
94,
031
62,9
94,0
31
1,83
3,12
6,30
2
1,68
3,83
0,44
9 29
.10
26.7
33.
00%
3.00
%
Sh
ares
Per
cen
tage
of
hol
din
g
31
Dec
emb
er
202
0
30
June
2020
31
Dec
emb
er
2020
30
June
2020
31
Dec
emb
er
2020
30 J
une
2020
31 D
ecem
ber
2020
30 J
une
2020
Fat
ima
Ene
rgy
Lim
ited
- r
ela
ted
part
y
Fat
ima
Ene
rgy
Lim
ited
- u
nq
uote
d1
2.2
.11
08,
300
,000
108,
300,
000
869,
649,
000
-
5
05,0
51,0
93
-
19.0
0%0.
00%
Impa
ct o
f di
scou
ntin
g1
3.1
.1-
-
-
-
18
,731
,553
-
1
08
,30
0,00
0
10
8,30
0,00
0
86
9,64
9,00
0
-
523
,782
,646
-
31
Dec
emb
er
2020
30
June
2020
Fat
ima
En
ergy
Lim
ited
Res
tate
d
Ope
ning
car
ryin
g am
oun
t54
8,32
9,96
21,
195,
501,
266
Impa
ct o
f di
scou
ntin
g18
,731
,553
415,
201,
774
Sha
re o
f lo
ss
(4
3,27
8,86
9)
(8
31,8
59,2
41)
Car
ryin
g am
ount
of
equi
ty i
nstr
um
ent
disp
osed
off
-
(2
30,5
13,8
37)
523,
782,
646
54
8,32
9,96
2
Fai
r va
lue
adju
stm
ent
on t
ran
siti
on
fro
m e
qui
ty a
cco
unt
ing
to F
VO
CI
reco
gniz
ed i
n pr
ofit
or l
oss
(Oth
er I
ncom
e)
34
5,86
6,35
4
-
869,
649,
000
54
8,32
9,96
2
The
Com
pany
'sin
ves
tmen
tin
Fat
ima
Ene
rgy
Lim
ited
('F
EL
')w
asle
ssth
an20
%bu
tw
asco
nsid
ered
anas
soci
ate
aspe
rre
quir
emen
tof
IAS
28be
caus
eof
sign
ifica
ntin
flue
nce
exer
cise
dth
roug
hre
pres
enta
tion
bytw
om
embe
rson
the
Bo
ard.
Eff
ecti
ve
20
Sep
tem
ber
202
0,th
esi
gnifi
cant
infl
uenc
eof
the
Com
pany
nom
ore
exis
tsas
Com
pany
'sre
pres
enta
tive
son
the
Boa
rdof
FE
Lha
vere
sign
ed.
Acc
ordi
ngly
,th
e
Com
pany
disc
onti
nued
equi
tyac
cou
ntin
go
nit
sin
ves
tmen
tin
FE
Lfr
om
20S
epte
mbe
r20
20an
dre
cogn
ized
aga
inof
Rs.
345.
87m
illi
onin
stat
emen
tof
profi
tor
loss
calc
ulat
edas
the
diff
eren
cebe
twee
nth
e
carr
ying
amou
ntan
dfa
irm
ark
etv
alue
ofth
ere
tain
edin
vest
men
ton
the
afor
emen
tion
edda
te.
The
inve
stm
ents
inF
atim
aE
nerg
yL
imit
ed(F
EL
)ha
sno
wbe
ende
sign
ated
asfa
irva
lue
thro
ugh
OC
Iun
der
IFR
S
9. T
he
fair
val
ue h
as b
een
det
erm
ined
by
an
ind
epen
den
t v
alue
r an
d h
as b
een
desi
gnat
ed a
t L
evel
3 a
s m
enti
oned
in
note
20.
Rec
onci
liat
ion
of c
arry
ing
valu
e /
fair
val
ue:
Mar
ket
val
ue
Mar
ket
val
ue
per
sh
are
----
----
----
----
--N
um
ber
----
----
----
----
-----
----
----
----
---R
up
ees-
----
----
----
----
---
----
----
----
----
Ru
pee
s---
----
----
----
---
The
inve
stm
ents
inF
atim
aF
erti
lize
rC
om
pany
Lim
ited
'(F
FC
L)'
has
bee
nde
sign
ated
asfa
irva
lue
thro
ugh
OC
Iun
der
IFR
S9.
FF
CL
isan
asso
ciat
edun
dert
akin
gof
the
Com
pany
aspe
rth
eC
ompa
nies
Act
2017
, how
ever
, fo
r th
e p
urp
ose
of m
easu
rem
ent
it h
as b
een
clas
sifi
ed a
s in
vest
men
t at
fai
r va
lue
thro
ugh
OC
I. T
he C
ompa
ny d
oes
not
have
sig
nifi
cant
infl
uenc
e on
FF
CL
.
Fai
r va
lue
Car
ryin
g va
lue
----
----
----
----
--N
um
ber
----
----
----
----
-----
----
----
----
---R
up
ees-
----
----
----
----
---
----
----
----
----
Ru
pee
s---
----
----
----
---
23

Half Year Ended Dec 31, 2020
12.3
12.4
12.4
.1
12.4
.2
Shar
esP
erce
ntag
e of
hol
ding
31 D
ecem
ber
2020
30
June
2020
31
Dec
embe
r
2020
30 J
une
2020
31 D
ecem
ber
2020
30 J
une
2020
Not
e
Res
tate
d
Ass
ocia
ted
com
pani
es w
ith
sign
ifica
nt in
fluen
ce -
at e
quit
y m
etho
d
Fatim
a E
nerg
y L
imite
d - u
nquo
ted
-
108,
300,
000
-
133,
128,
188
0.00
%19
.00%
Impa
ct o
f dis
coun
ting
13.1
.1-
-
-
41
5,20
1,77
4
-
10
8,30
0,00
0
-
54
8,32
9,96
2
Fatim
a Tr
ansm
issi
on C
ompa
ny L
imite
d -
unqu
oted
12.4
.15,
520,
000
5,52
0,00
0
26
,038
,175
26,
050,
673
24.0
0%24
.00%
Fatim
a E
lect
ric
Com
pany
Lim
ited
- un
quot
ed12
.4.2
7,00
0
7,00
0
1
6,10
5
18
,605
20
.00%
20.0
0%
5
,527
,000
11
3,82
7,00
0
26,0
54,2
80
57
4,39
9,24
0
Fatim
aTr
ansm
issi
onC
ompa
nyL
imite
d(F
TC
L),
was
inco
rpor
ated
inPa
kist
anon
Dec
embe
r26
,20
14as
apu
blic
limite
dco
mpa
nyun
der
the
Com
pani
esA
ct,2
017.
The
prin
cipa
lac
tivity
ofFT
CL
incl
udes
oper
atio
n an
d m
aint
enan
ce o
f tra
nsm
issi
on li
nes,
ele
ctri
cal t
rans
mis
sion
faci
litie
s, e
lect
rica
l cir
cuits
, tra
nsfo
rmer
s an
d su
b-st
atio
ns a
nd th
e m
ovem
ent &
del
iver
y of
ele
ctri
c po
wer
.
Fatim
aE
lect
ric
Com
pany
Lim
ited
(FE
CL
)w
asin
corp
orat
edin
Paki
stan
onFe
brua
ry29
,201
6as
apu
blic
limite
dco
mpa
nyun
der
the
Com
pani
esA
ct,
2017
.The
prin
cipa
lac
tivity
ofFE
CL
isto
carr
yon
supp
lyin
g, g
ener
atin
g, d
istr
ibut
ing
and
deal
ing
in e
lect
rici
ty a
nd a
ll fo
rms
of e
nerg
y an
d po
wer
gen
erat
ed b
y an
y so
urce
.
Thi
s re
pres
ents
9.9
6% o
rdin
ary
shar
es o
f Mul
tan
Rea
l Est
ate
(Pri
vate
) Lim
ited
(MR
EPL
), w
hich
is a
dor
man
t ent
ity. T
he la
test
val
uatio
n w
as b
ased
on
pres
ent m
arke
t val
ue o
f pro
pert
y of
MR
EPL
.
Car
ryin
g va
lue
----
----
----
----
--N
umbe
r---
----
----
----
---
----
----
----
----
--R
upee
s---
----
----
----
---
24

Half Year Ended Dec 31, 2020
(Un-audited)
31 December (Un-audited)
30 June
2020 2020
Note Rupees Rupees
Restated
13 Long term advances
Fatima Energy Limited - related party 13.1 3,227,609,945 2,635,370,514
Fatima Transmission Company Limited - associate 91,319,033 72,427,033
Pak Arab Energy Limited - associate 25,904,160 25,904,160
13.2 3,344,833,138 2,733,701,707
13.1 Fatima Energy Limited
Long term advance 3,189,952,514 2,497,908,522
Mark-up accrued (interest free) - 552,663,766
Less: impact of discounting 13.1.1 - (415,201,774)
Unwinding of discount 37,657,431 -
Balance as at 3,227,609,945 2,635,370,514
13.1.1
13.2
(Un-audited)
31 December
(Un-audited)
30 June
2020 2020
Note Rupees Rupees
Restated
14 Long term mark-up accrued
-
Fatima Energy Limited - related party 124,503,045
-
Less: Impact of discounting 13.1.1 (46,774,028)
-
-
77,729,017
-
Pursuant to restructuring of FEL’s borrowings with financial institutions along with related
subordination of borrowings from sponsors, the Company has entered into a restructuring
agreement with FEL for rescheduling the repayment of principal and related markup as
approved by the Board of Directors of both the companies. As per the revised agreement,
principal and markup accrued are subordinated and are now repayable from financial year
2026. Accordingly, markup accrued from FEL has been classified as non-current. The loan
and related markup (interest free) uptil 30 June 2020 were measured at fair value by
discounting the cash flows at the rate of average borrowing cost of the Company 8.94% and
the resulting adjustment was included in the cost of investment.
These represents loans disbursed to meet the working capital requirements, operational/
capital nature needs of the associated companies. These loans carries markup at the rate of
average borrowing cost of the Company. Effective markup rate charged by the Company
during the year ranges from 8.82% to 8.94% per annum (30 June 2020: 9.86% to 15.31% per
annum). As per the agreements, these loans are repayable within 10 years from the date of
disbursement starting from financial year 2022.
25

Half Year Ended Dec 31, 2020
(Un-audited)
31 December
(Un-audited)
30 June
2020 2020
Note Rupees Rupees
15 Trade debts Restated
Export debtors - secured against letters of credit:
Considered good 1,158,853,183
1,820,507,561
Local debtors - unsecured
Related Parties - considered good 15.1 65,792,390
293,998,651
Others - considered good 3,549,417,251
3,031,074,635
Others - considered doubtful 40,074,769
40,337,838
3,655,284,410
3,365,411,124
Provision for doubtful balances (40,074,769)
(40,337,838)
3,615,209,641
3,325,073,286
4,774,062,824
5,145,580,847
15.1
(Un-audited)
31 December
(Un-audited)
30 June
2020 2020
Rupees Rupees
Restated
Reliance Weaving Mills Limited 448,351
19,158,901
Fazal Rehman Fabrics Limited 65,344,039
274,839,750
65,792,390
293,998,651
16 Short term investment
At fair value through statement of profit or loss
Investment in related party:
Fatima Fertilizer Company Limited - quoted
163,587,600 182,682,000
Unrealized fair value gain / (loss) on re-measurement of investment 14,504,400 (19,094,400)
178,092,000 163,587,600
17 Cash and bank balances
Cash in hand 23,936,247 17,990,118
Cash at banks
- Current accounts 197,839,373 280,808,769
- Saving accounts 1,073,073 50,133
198,912,446 280,858,902
222,848,693 298,849,020
6,120,000 (30 June 2020 : 6,120,000) fully paid
ordinary shares of Rs. 10 each having market
value of Rs. 29.10 per share (30 June 2020 : Rs.
26.73 per share)
These include due from following associated undertakings on account of trading activities.
26

Half Year Ended Dec 31, 2020
(Un-audited)
31 December
(Un-audited)
31 December
(Un-audited)
31 December
(Un-audited)
31 December
2020 2019 2020 2019
Note Rupees Rupees Rupees Rupees
Restated Restated
18
Gross sales
Local 22,358,822,310 12,816,830,892 10,622,761,519 6,958,537,138
Direct export 5,474,582,645 6,130,751,069 2,893,903,810 3,612,033,765
Indirect export 18.1 1,178,450,795 3,715,692,543 484,341,735 1,639,466,289
29,011,855,750 22,663,274,504 14,001,007,064 12,210,037,192
Sales tax
Local sales (3,357,921,163) (1,911,126,687) (1,601,930,344) (1,288,994,274)
Indirect export - (418,978,143) - (176,216,582)
(3,357,921,163) (2,330,104,830) (1,601,930,344) (1,465,210,856)
Sales return (97,742,900) (98,711,431) (97,742,900) (79,917,285)
25,556,191,687 20,234,458,243 12,301,333,820 10,664,909,051
18.1
(Un-audited)
31 December (Un-audited)
31 December (Un-audited)
31 December
(Un-audited)
31 December 2020 2019 2020 2019
Rupees Rupees Rupees Rupees
Restated Restated
19 Cost of sales
Raw material consumed 14,562,293,167
13,801,702,372
7,389,288,658
7,076,291,674
Packing material consumed 262,950,938
243,856,755
134,901,794
124,133,001
Salaries, wages and benefits 1,266,020,016
1,233,721,265
631,531,440
619,069,844
Travelling and conveyance 10,844,703
7,621,354
8,138,768
4,160,548
Vehicle running and maintenance 10,380,945
9,824,020
3,802,552
3,749,032
Power and fuel 1,783,360,969
1,711,065,427
923,308,030
851,240,528
Stores and spares consumed 450,549,100
497,541,755
219,525,322
252,856,672
Processing charges 183,091,585
1,607,818
103,583,904
1,607,818
Freight charges-outward 182,955,784
140,219,613
95,168,348
77,830,118
Repair and maintenance 19,007,862
25,198,742
10,382,021
10,605,811
Insurance 45,547,792
39,742,106
23,222,924
18,823,305
Depreciation 595,796,718
586,140,428
298,464,456
299,863,646
Others 1,771,554
1,319,498
805,437
786,572
19,374,571,133
18,299,561,153
9,842,123,654
9,341,018,569
Work-in-process :
Opening balance 439,889,015 410,363,326 436,454,488 410,462,331
Closing balance (448,757,889) (451,315,852) (448,757,889) (451,315,852)
(8,868,874) (40,952,526) (12,303,401) (40,853,521)
Cost of goods manufactured 19,365,702,259 18,258,608,627 9,829,820,253 9,300,165,048
Finished goods :
Opening balance 4,620,290,075 1,844,002,220 2,736,293,241 3,441,732,936
Finished goods purchased 879,069,103 1,312,925,264 401,657,377 667,419,383
Closing balance (2,529,991,032) (3,962,688,555) (2,529,991,032) (3,962,688,555)
2,969,368,146 (805,761,071) 607,959,586 146,463,764
Cost of goods sold 22,335,070,405 17,452,847,556 10,437,779,839 9,446,628,812
Cost of raw material sold 179,482,920 28,505,261 35,809,107 23,172,887
22,514,553,325 17,481,352,817 10,473,588,946 9,469,801,699
It includes sales made to direct exporters against Standard Purchase Order (SPOs) amounting to Rs. Nil (31 December
2019: Rs 2,883.56 million) and Duty and Tax Remission for Exports ("DTRE") to a related party under S.R.O 185(I)/
2001 dated 21 March 2001, amounting to Rs. 1,178.45 million (31 December 2019: Rs. 832.14 million).
Half year ended Quarter ended
Revenue - net
Half year ended Quarter ended
27

28
Half Year Ended Dec 31, 2020
20
Fa
ir v
alu
e m
easu
rem
ent
of
fin
an
cia
l in
stru
men
ts
Fai
r v
alu
e is
th
e p
rice
th
at w
ou
ld b
e re
ceiv
ed t
o s
ell
an a
sset
or
pai
d t
o t
ran
sfer
a l
iabil
ity
in
an
ord
erly
tra
nsa
ctio
n b
etw
een
mar
ket
par
tici
pan
ts a
t th
e m
easu
rem
ent
dat
e.
Lev
el 1
- Q
uo
ted
pri
ces
(un
adju
sted
) in
act
ive
mar
ket
s fo
r id
enti
cal
asse
ts o
r li
abil
itie
s.
Lev
el 2
- In
pu
ts o
ther
th
an q
uo
ted
pri
ces
incl
ud
ed w
ith
in l
evel
1 t
hat
are
ob
serv
able
fo
r th
e as
set
or
liab
ilit
y, e
ith
er d
irec
tly
(i.
e. a
s p
rice
s) o
r in
dir
ectl
y (
i.e.
der
ived
fro
m p
rice
s).
Lev
el 3
- In
pu
ts f
or
the
asse
t o
r li
abil
ity
th
at a
re n
ot
bas
ed o
n o
bse
rvab
le m
ark
et d
ata
(i.e
. u
no
bse
rvab
le)
inp
uts
.
Tra
nsf
er b
etw
een l
evel
s o
f th
e fa
ir v
alu
e h
iera
rch
y a
re r
eco
gn
ised
at
the
end
of
the
rep
ort
ing
per
iod
du
rin
g w
hic
h t
he
chan
ges
hav
e o
ccu
rred
.
Fin
an
cia
l a
sset
s
at
am
ort
ised
co
st
Fa
ir v
alu
e
thro
ug
h P
rofi
t
or
loss
Fa
ir v
alu
e
thro
ug
h O
CI
Oth
er fi
na
nci
al
lia
bil
itie
sT
ota
lL
evel
1L
evel
2L
evel
3T
ota
l
As
at
31
Dec
emb
er 2
02
0N
ote
Fin
an
cial
ass
ets
- m
easu
red
at
fair
va
lue
Sh
ort
ter
m i
nv
estm
ent
-
17
8,0
92
,00
0
-
-
1
78
,09
2,0
00
17
8,0
92
,00
0
-
-1
78
,09
2,0
00
Lo
ng
ter
m i
nv
estm
ents
-
-
2,7
36
,13
3,3
56
-
2,7
36
,13
3,3
56
1,8
33
,12
6,3
02
-9
03
,00
7,0
54
2,7
36
,13
3,3
56
Fin
an
cial
ass
ets
- n
ot
mea
sure
d a
t fa
ir v
alu
e
Tra
de
deb
ts4
,77
4,0
62
,82
4
-
-
-
4,7
74
,06
2,8
24
-
--
-
Cas
h a
nd
ban
k b
alan
ces
22
2,8
48
,69
3
-
-
-
22
2,8
48
,69
3
-
--
-
Lo
ng
ter
m d
epo
sits
24
,12
8,4
93
-
-
-
24
,12
8,4
93
-
--
-
Oth
er r
ecei
vab
les
27
,00
6,6
41
-
-
-
27
,00
6,6
41
-
--
-
Mar
k-u
p a
ccru
ed3
3,7
55
,77
4
-
-
-
33
,75
5,7
74
-
--
-
Lo
ng
ter
m m
ark
-up
acc
rued
77
,72
9,0
17
-
-
-
77
,72
9,0
17
-
--
-
Lo
ng
ter
m a
dv
ance
s to
ass
oci
ates
3,3
44
,83
3,1
38
--
-3
,34
4,8
33
,13
8-
--
-
20
.18
,50
4,3
64
,58
01
78
,09
2,0
00
2,7
36
,13
3,3
56
-11
,41
8,5
89
,93
62
,011
,21
8,3
02
-9
03
,00
7,0
54
2,9
14
,22
5,3
56
Fin
an
cial
lia
bil
itie
s -
no
t m
easu
red
at
fair
va
lue
Lo
ng
ter
m fi
nan
cin
g -
sec
ure
d-
--
13
,85
3,2
29
,51
41
3,8
53
,22
9,5
14
--
--
Lo
ng
ter
m m
ush
arik
a -
secu
red
--
-2
,89
7,8
59
,41
42
,89
7,8
59
,41
4-
--
-
Tra
de
and
oth
er p
ayab
les
--
-4
,17
3,6
08
,40
24
,17
3,6
08
,40
2-
--
-
Lea
se l
iab
ilit
y -
un
secu
red
--
-7
2,0
07
,49
57
2,0
07
,49
5-
--
-
Un
clai
med
div
iden
d-
--
13
,74
8,4
23
13
,74
8,4
23
--
Sh
ort
ter
m b
orr
ow
ing
s -
secu
red
--
-1
0,2
11,4
13
,84
11
0,2
11,4
13
,84
1-
--
-
Acc
rued
mar
k-u
p-
--
29
7,6
54
,61
32
97
,65
4,6
13
--
--
20
.1-
--
31
,51
9,5
21
,70
23
1,5
19
,52
1,7
02
--
--
Un
der
lyin
g t
he
defi
nit
ion
of
fair
val
ue
is t
he
pre
sum
pti
on
th
at t
he
Co
mp
any
is
a g
oin
g c
on
cern
an
d t
her
e is
no
in
ten
tio
n o
r re
qu
irem
ent
to c
urt
ail
mat
eria
lly
th
e sc
ale
of
its
op
erat
ion
s o
r to
un
der
tak
e a
tran
sact
ion
on
ad
ver
se t
erm
s.
A fi
nan
cial
in
stru
men
t is
reg
ard
ed a
s q
uo
ted
in
an
act
ive
mar
ket
if
qu
ote
d p
rice
is
read
ily
an
d r
egu
larl
y a
vai
lab
le f
rom
an
ex
chan
ge
dea
ler,
bro
ker
, in
du
stry
gro
up
, p
rici
ng
ser
vic
e, o
r re
gu
lato
ry a
gen
cy,
and
th
at p
rice
rep
rese
nts
act
ual
and
reg
ula
rly
occ
urr
ing
mar
ket
tra
nsa
ctio
ns
on
an
arm
's l
eng
th b
asis
.
IFR
S13
'Fai
rV
alu
eM
easu
rem
ent'
req
uir
esth
eC
om
pan
yto
clas
sify
fair
val
ue
mea
sure
men
tsan
dfa
irv
alu
eh
iera
rch
yth
atre
flec
tsth
esi
gn
ifica
nce
of
the
inp
uts
use
din
mak
ing
the
mea
sure
men
tso
ffa
irv
alu
eh
iera
rch
yh
asth
e
foll
ow
ing
lev
els:
Th
efo
llo
win
gta
ble
sho
ws
the
carr
yin
gam
ou
nts
and
fair
val
ues
of
fin
anci
alas
sets
and
fin
anci
alli
abil
itie
s,in
clu
din
gth
eir
lev
els
inth
efa
irv
alu
eh
iera
rch
y.It
do
esn
ot
incl
ud
efa
irv
alu
ein
form
atio
nfo
rfi
nan
cial
asse
tsan
dfi
nan
cial
liab
ilit
ies
no
t m
easu
red
at
fair
val
ue
if t
he
carr
yin
g a
mo
un
t is
a r
easo
nab
le a
pp
rox
imat
ion
of
fair
val
ue.
Ca
rry
ing
am
ou
nt
Fa
ir v
alu
e
- -
- -
- -
- -
- -
- -
- -
- -
- -
- -
- -
- -
- -
- -
- -
- -
- -
- -
- -
- -
- -
- -
- -
- -
- -
- -
- -
- R
up
ees
- -
- -
- -
- -
- -
- -
- -
- -
- -
- -
- -
- -
- -
- -
- -
- -
- -
- -
- -
- -
- -
- -
- -
-
28

Half Year Ended Dec 31, 2020
Fina
ncia
l ass
ets
at
amor
tised
cos
t
Fair
valu
e
thro
ugh
Profi
t or
loss
Fair
valu
e th
roug
h
OC
I
Oth
er fi
nanc
ial
liabi
litie
sTo
tal
Leve
l 1Le
vel 2
Leve
l 3To
tal
As
at 3
0 Ju
ne 2
020
Fin
anci
al a
sset
s - m
easu
red
at fa
ir v
alue
Shor
t ter
m in
vest
men
t-
163,
587,
600
--
163,
587,
600
163,
587,
600
--
163,
587,
600
Long
term
inve
stm
ents
--
1,71
7,18
8,50
3-
1,71
7,18
8,50
31,
683,
830,
449
-33
,358
,054
1,71
7,18
8,50
3
Fin
anci
al a
sset
s - n
ot m
easu
red
at fa
ir v
alue
Trad
e de
bts
5,14
5,58
0,84
7
-
-
-
5,14
5,58
0,84
7
-
--
-
Cas
h an
d ba
nk b
alan
ces
298,
849,
020
-
-
-
298,
849,
020
-
--
-
Long
term
dep
osits
24,1
28,4
93
-
-
-
24,1
28,4
93
-
--
-
Oth
er re
ceiv
able
s18
9,67
3,45
9
-
-
-
18
9,67
3,45
9
-
--
-
Mar
k-up
acc
rued
- as
soci
ated
com
pani
es29
,338
,656
-
-
-
29,3
38,6
56
-
--
-
Long
term
adv
ance
s to
ass
ocia
tes
2,73
3,70
1,70
7
-
-
-
2,73
3,70
1,70
7
-
--
-20
.18,
421,
272,
182
163,
587,
600
1,71
7,18
8,50
3
-
10,3
02,0
48,2
85
1,84
7,41
8,04
9
-33
,358
,054
1,88
0,77
6,10
3
Fin
anci
al li
abili
ties
- not
mea
sure
d at
fair
val
ue
Long
term
fina
ncin
g - s
ecur
ed-
-
-
12
,392
,810
,608
12,3
92,8
10,6
08
-
--
-
Long
term
mus
harik
a - s
ecur
ed-
--
2,89
7,85
9,41
42,
897,
859,
414
--
--
Trad
e an
d ot
her p
ayab
les
--
-2,
692,
707,
211
2,69
2,70
7,21
1-
--
-
Leas
e lia
bilit
y - u
nsec
ured
--
-71
,173
,118
71,1
73,1
18-
--
-
Unc
laim
ed d
ivid
end
--
-13
,748
,423
13,7
48,4
23-
-
Shor
t ter
m b
orro
win
gs -
secu
red
--
-11
,537
,224
,217
11,5
37,2
24,2
17-
--
-
Acc
rued
mar
k-up
--
-51
7,19
1,25
051
7,19
1,25
0-
--
-20
.1-
--
30,1
22,7
14,2
4130
,122
,714
,241
--
--
20.1
Car
ryin
g am
ount
- Re
stat
ed
Fair
valu
e - R
esta
ted
- - -
- - -
- - -
- - -
- - -
- - -
- - -
- - -
- - -
- - -
- - -
- - -
- - -
- - -
- - -
- - -
- - -
- Rup
ees
- - -
- - -
- - -
- - -
- - -
- - -
- - -
- - -
- - -
- - -
- - -
- - -
- - -
- - -
- - -
- -
The
Com
pany
has
not
dis
clos
ed th
e fa
ir va
lues
of t
hese
fina
ncia
l ass
ets
and
liabi
litie
s as
thes
e ar
e fo
r sho
rt te
rm o
r rep
rice
over
sho
rt te
rm. T
here
fore
, the
ir ca
rryi
ng a
mou
nts
are
reas
onab
le a
ppro
xim
atio
n of
fair
valu
e.
29
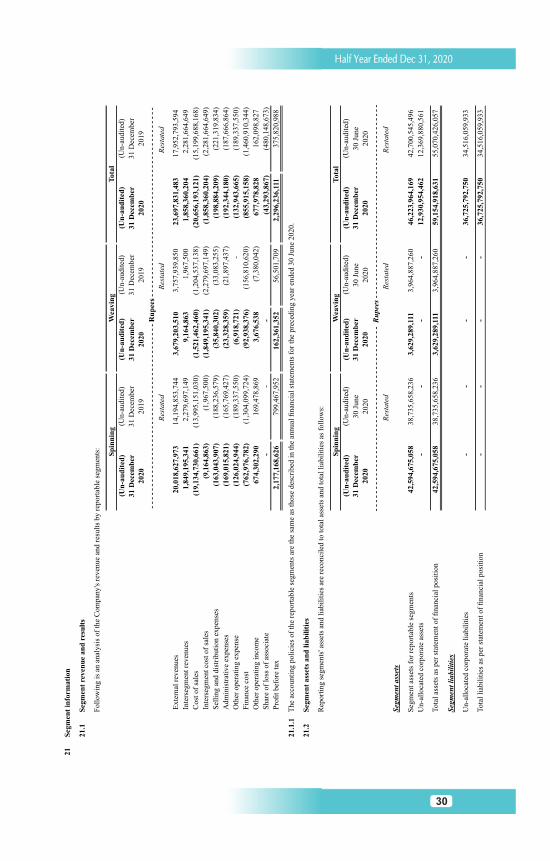
Half Year Ended Dec 31, 2020
21S
egm
ent
info
rmat
ion
21.1
Seg
men
t re
ven
ue
and
res
ult
s
Fol
low
ing
is a
n an
alys
is o
f th
e C
ompa
ny's
rev
enue
and
res
ults
by
repo
rtab
le s
egm
ents
:
(Un
-au
dit
ed)
(Un-
audi
ted)
(Un
-au
dit
ed)
(Un-a
udit
ed)
(Un
-au
dit
ed)
(Un-a
udit
ed)
31 D
ecem
ber
2020
31 D
ecem
ber
2019
31 D
ecem
ber
2020
31 D
ecem
ber
2019
31 D
ecem
ber
2020
31 D
ecem
ber
2019
Res
tate
d R
esta
ted
Res
tate
d
Ext
erna
l re
venu
es20
,018
,627
,973
14,1
94,8
53,7
44
3,67
9,2
03,5
10
3,7
57,9
39,8
50
23,6
97,8
31,4
83
17,9
52,7
93,5
94
Inte
rseg
men
t re
venu
es1,
849,
195,
341
2,27
9,69
7,14
9
9,1
64,8
63
1,9
67,5
00
1,8
58,3
60,2
04
2,2
81,6
64,6
49
Cos
t of
sal
es(1
9,13
4,73
0,66
1)
(13,
995,
151,
030)
(1,5
21,4
62,4
60)
(1,2
04,5
37,1
38)
(20,6
56,1
93,1
21)
(15,1
99,6
88,1
68)
Inte
rseg
men
t co
st o
f sa
les
(9,1
64,8
63)
(1,9
67,5
00)
(1,8
49,1
95,3
41)
(2,2
79,6
97,1
49)
(1,8
58,3
60,2
04)
(2,2
81,6
64,6
49)
Sel
ling
and
dis
trib
utio
n ex
pens
es(1
63,0
43,9
07)
(188
,236
,579
)
(35,8
40,3
02)
(33,0
83,2
55)
(198,8
84,2
09)
(221,3
19,8
34)
Adm
inis
trat
ive
expe
nses
(169
,015
,821
)
(165
,769
,427
)
(23,3
28,3
59)
(21,8
97,4
37)
(192,3
44,1
80)
(187,6
66,8
64)
Oth
er o
pera
ting
exp
ense
(126
,024
,944
)
(189
,337
,550
)
(6,9
18,7
21)
-
(132,9
43,6
65)
(189,3
37,5
50)
Fin
ance
cos
t(7
62,9
76,7
82)
(1,3
04,0
99,7
24)
(92,9
38,3
76)
(156,8
10,6
20)
(855,9
15,1
58)
(1,4
60,9
10,3
44)
Oth
er o
pera
ting
inc
ome
674,
302,
290
16
9,47
8,86
9
3,6
76,5
38
(7
,380,0
42)
677,9
78,8
28
162,0
98,8
27
Sha
re o
f lo
ss o
f as
soci
ate
-
-
-
(4
3,2
93,8
67)
(480,1
48,6
73)
Pro
fit
befo
re t
ax
2,17
7,16
8,62
6
79
9,46
7,95
2
16
2,3
61,3
52
56,5
01,7
09
2,2
96,2
36,1
11375,8
20,9
88
21.1
.1
21.2
Seg
men
t as
sets
an
d l
iab
ilit
ies
Rep
orti
ng s
egm
ents
' ass
ets
and
liab
ilit
ies
are
reco
ncil
ed t
o to
tal
asse
ts a
nd t
otal
lia
bili
ties
as
foll
ows:
(Un
-au
dit
ed)
(Un-
audi
ted)
(Un
-au
dit
ed)
(Un-a
udit
ed)
(Un
-au
dit
ed)
(Un-a
udit
ed)
31 D
ecem
ber
2020
30 J
une
2020
31 D
ecem
ber
2020
30 J
une
2020
31 D
ecem
ber
2020
30 J
une
2020
Res
tate
d R
esta
ted
Res
tate
d
Seg
men
t as
sets
Seg
men
t as
sets
for
rep
orta
ble
segm
ents
42,5
94,6
75,0
5838
,735
,658
,236
3,62
9,2
89,1
113,9
64,8
87,2
60
46,2
23,9
64,1
69
42,7
00,5
45,4
96
Un-
allo
cate
d co
rpor
ate
asse
ts-
--
-12,9
30,9
54,4
62
12,3
69,8
80,5
61
Tot
al a
sset
s as
per
sta
tem
ent
of fi
nanc
ial
posi
tion
42,5
94,6
75,0
5838
,735
,658
,236
3,62
9,2
89,1
113,9
64,8
87,2
60
59,1
54,9
18,6
31
55,0
70,4
26,0
57
Seg
men
t li
abil
itie
s
Un-
allo
cate
d co
rpor
ate
liab
ilit
ies
--
--
36,7
25,7
92,7
50
34,5
16,0
59,9
33
Tot
al l
iabi
liti
es a
s pe
r st
atem
ent
of fi
nanc
ial
posi
tion
--
--
36,7
25,7
92,7
50
34,5
16,0
59,9
33
- -
- -
- -
- -
- -
- -
- -
- -
- -
- -
- -
- -
- -
- -
- -
- -
- -
- -
- -
- -
- -
R
upee
s -
- -
- -
- -
- -
- -
- -
- -
- -
- -
- -
- -
- -
- -
- -
- -
- -
- -
- -
- -
- -
- -
-
Sp
inn
ing
Wea
vin
gT
ota
l
- -
- -
- -
- -
- -
- -
- -
- -
- -
- -
- -
- -
- -
- -
- -
- -
- -
- -
- -
- -
- -
Ru
pee
s -
- -
- -
- -
- -
- -
- -
- -
- -
- -
- -
- -
- -
- -
- -
- -
- -
- -
- -
- -
- -
- -
The
acc
ount
ing
poli
cies
of
the
repo
rtab
le s
egm
ents
are
the
sam
e as
tho
se d
escr
ibed
in
the
annu
al fi
nanc
ial
stat
emen
ts f
or t
he
pre
cedin
g y
ear
ended
30 J
une
2020.
Sp
inn
ing
Wea
vin
gT
ota
l
30

Half Year Ended Dec 31, 2020
22R
econ
cili
atio
n o
f m
ove
men
t of
liab
ilit
ies
to c
ash
flow
s ari
sin
g fr
om fi
nan
cin
g ac
tivi
ties
Div
iden
d p
ayab
leL
ong
term
fin
anci
ng
Lea
se l
iab
ilit
yL
ong
term
mu
shar
ika
Sh
ort
term
bor
row
ing
Acc
rued
mar
ku
pT
ota
l
As
at 3
0 Ju
ne
2020
13,7
48,4
2312
,392
,810
,608
71,1
73,1
182,
897,
859,
414
11,5
37,2
24,2
1751
7,19
1,25
027,4
30,0
07,0
30
Ch
ange
s fr
om fi
nan
cin
g c
ash
flow
s
Sho
rt t
erm
finan
ces
obt
ained
- n
et-
--
-(1
,325
,810
,376
)-
(1,3
25,8
10,3
76)
Fin
anci
al c
harg
es p
aid -
net
-
-
-
-
-(1
,070
,225
,118
)(1
,070,2
25,1
18)
Lea
se r
enta
ls p
aid
-
-
(4,3
92,3
00)
-
--
(4,3
92,3
00)
Lon
g te
rm fi
nan
ces
repai
d-
(79,
395,
774)
-
-
--
(79,3
95,7
74)
Pro
ceed
s fr
om
long
ter
m fi
nan
cing
-
1,53
9,81
4,68
0
-
-
--
1,5
39,8
14,6
80
Tot
al c
han
ges
from
fin
anci
ng
cash
flow
s-
1,46
0,41
8,90
6
(4,3
92,3
00)
-
(1,3
25,8
10,3
76)
(1,0
70,2
25,1
18)
(940,0
08,8
88)
Oth
er c
han
ges
Inte
rest
exp
ense
- n
et-
-
5,22
6,67
7
-
-85
0,68
8,48
1855,9
15,1
58
Tot
al l
iab
ilit
y r
elat
ed o
ther
ch
an
ges
-
-
5,22
6,67
7
-
-85
0,68
8,48
1855,9
15,1
58
As
at 3
1 D
ecem
ber
2020
13,7
48,4
23
13,8
53,2
29,5
14
72,0
07,4
95
2,89
7,85
9,41
4
10,2
11,4
13,8
4129
7,65
4,61
327,3
45,9
13,3
00
Div
iden
d pa
yabl
eL
ong
term
fina
ncin
gL
ease
lia
bili
tyL
ong
term
mus
hari
ka
Sho
rt t
erm
borr
owin
g A
ccru
ed m
arku
pT
ota
l
As
at 3
0 Ju
ne 2
019
12,3
40,0
81
10,7
94,1
16,8
95
-
2,16
9,05
6,61
9
12,2
99,9
01,3
6848
1,25
5,95
725,7
56,6
70,9
20
Cha
nges
fro
m fi
nanci
ng
cash
flow
s
Div
iden
d pa
id(3
13,1
37,0
17)
-
-
-
--
(313,1
37,0
17)
Sho
rt t
erm
finan
ces
obt
ained
- n
et-
-
-
1,35
5,45
2,77
0-
1,3
55,4
52,7
70
Fin
anci
al c
harg
es p
aid -
net
-
-
-
-
-(1
,384
,928
,350
)(1
,384,9
28,3
50)
Lea
se r
enta
ls p
aid
--
(4,3
92,3
00)
--
-(4
,392,3
00)
Lon
g te
rm fi
nan
ces
repai
d(1
,029
,866
,449
)-
(160
,311
,325
)-
-(1
,190,1
77,7
74)
Pro
ceed
s fr
om
long
ter
m fi
nan
cing
-1,
780,
821,
372
-1,
000,
000,
000
--
2,7
80,8
21,3
72
Tot
al c
hang
es f
rom
fina
nci
ng
cash
flow
s(3
13,1
37,0
17)
750,
954,
923
(4,3
92,3
00)
839,
688,
675
1,35
5,45
2,77
0(1
,384
,928
,350
)1,2
43,6
38,7
01
Oth
er c
hang
es
Fin
al c
ash
divi
dend
315,
000,
000
--
--
-315,0
00,0
00
Rec
ogni
zed
duri
ng
the
peri
od
--
68,9
22,9
67-
--
68,9
22,9
67
Fin
ance
cos
t-
-9,
468,
678
--
1,46
0,91
0,34
41,4
70,3
79,0
22
Tot
al l
iabi
lity
rel
ated
oth
er c
hange
s 31
5,00
0,00
0-
78,3
91,6
45-
-1,
460,
910,
344
1,8
54,3
01,9
89
As
at 3
1 D
ecem
ber
2019
14,2
03,0
6411
,545
,071
,818
73,9
99,3
453,
008,
745,
294
13,6
55,3
54,1
3855
7,23
7,95
128,8
54,6
11,6
10
31 D
ecem
ber
202
0
- -
- -
- -
- -
- -
- -
- -
- -
- -
- -
- -
- -
- -
- -
- -
-- -
- -
- -
(R
up
ees)
- -
- -
- -
- -
- -
- -
- -
- -
- -
- -
- -
- -
- -
- -
- -
- -
- -
31 D
ecem
ber
2019
- R
esta
ted
- -
- -
- -
- -
- -
- -
- -
- -
- -
- -
- -
- -
- -
- -
- -
-- -
- -
- -
(R
upee
s) -
- -
- -
- -
- -
- -
- -
- -
- -
- -
- -
- -
- -
- -
- -
- -
- -
-
31
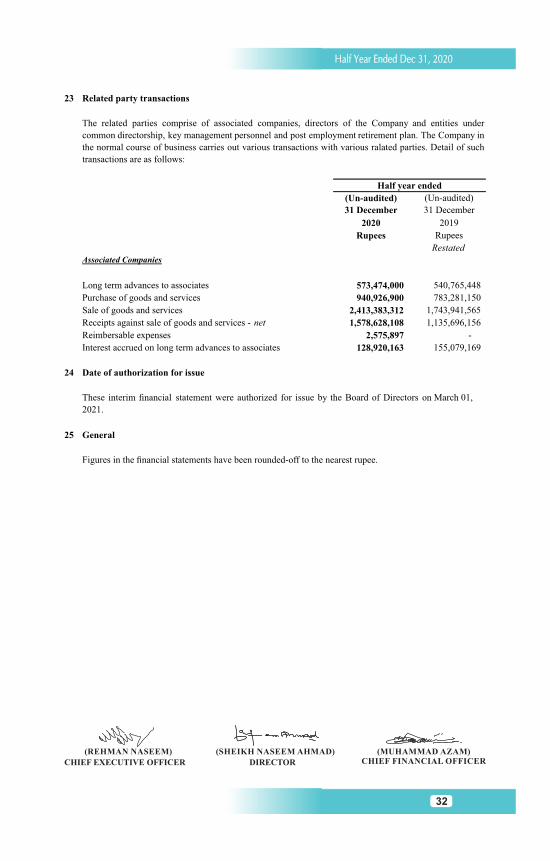
Half Year Ended Dec 31, 2020
DIRECTORCHIEF EXECUTIVE OFFICER
23 Related party transactions
(Un-audited)
31 December
(Un-audited)
31 December
2020 2019
Rupees Rupees
Restated Associated Companies
Long term advances to associates 573,474,000 540,765,448
Purchase of goods and services 940,926,900
783,281,150
Sale of goods and services 2,413,383,312
1,743,941,565
Receipts against sale of goods and services - net 1,578,628,108
1,135,696,156
Reimbersable expenses 2,575,897
-
Interest accrued on long term advances to associates 128,920,163
155,079,169
24
25
Figures in the financial statements have been rounded-off to the nearest rupee.
The related parties comprise of associated companies, directors of the Company and entities under
common directorship, key management personnel and post employment retirement plan. The Company in
the normal course of business carries out various transactions with various ralated parties. Detail of such
transactions are as follows:
Half year ended
Date of authorization for issue
These interim financial statement were authorized for issue by the Board of Directors on March 01,
2021.
General
32

Investors’ Education
In Compliance with the Securities and Exchange Commission of Pakistan’s SRO 924 (1) / 2015 dated September 09, 2015, Investors’ attention is invited
to the following information message
www.jamapunji.pk
jamapunji.pk jamapunji_pk
Half Year Ended Dec 31, 2020
33

Investors’ Education
In Compliance with the Securities and Exchange Commission of Pakistan’s SRO 924 (1) / 2015 dated September 09, 2015, Investors’ attention is invited
to the following information message
Half Year Ended Dec 31, 2020
34