for the biennium ended 31 December 2005 and Report … · Disbursements and obligations totalled...
137
A/61/5/Add.2 United Nations United Nations Children’s Fund Financial report and audited financial statements for the biennium ended 31 December 2005 and Report of the Board of Auditors General Assembly Official Records Sixty-first Session Supplement No. 5B (A/61/5/Add.2)
Transcript of for the biennium ended 31 December 2005 and Report … · Disbursements and obligations totalled...

A/61/5/Add.2
United Nations
United Nations Children’s Fund
Financial report and audited financial statements
for the biennium ended 31 December 2005 and
Report of the Board of Auditors
General Assembly Official Records Sixty-first Session Supplement No. 5B (A/61/5/Add.2)

United Nations Children’s Fund
Financial report and audited financial statements
for the biennium ended 31 December 2005 and
Report of the Board of Auditors
General Assembly Official Records Sixty-first Session Supplement No. 5B (A/61/5/Add.2)
United Nations • New York, 2006

A/61/5/A
dd.2

Note
Symbols of United Nations documents are composed of capital letters combined with figures. Mention of such a symbol indicates a reference to a United Nations document.
ISSN 0251-8317

iii
Contents Chapter Page
Letters of transmittal . . . . . . . . . . . . . . . . . . . . . . . . . . . . . . . . . . . . . . . . . . . . . . . . . . . . . . . . . . . . v
I. Financial report for the biennium ended 31 December 2005 . . . . . . . . . . . . . . . . . . . . . . . . . . . . 1
II. Report of the Board of Auditors . . . . . . . . . . . . . . . . . . . . . . . . . . . . . . . . . . . . . . . . . . . . . . . . . . . 3
Executive summary . . . . . . . . . . . . . . . . . . . . . . . . . . . . . . . . . . . . . . . . . . . . . . . . . . . . . . . . . . . . . 3
A. Introduction . . . . . . . . . . . . . . . . . . . . . . . . . . . . . . . . . . . . . . . . . . . . . . . . . . . . . . . . . . . . . . . 8
1. Previous recommendations not fully implemented . . . . . . . . . . . . . . . . . . . . . . . . . . . 9
2. Main recommendations . . . . . . . . . . . . . . . . . . . . . . . . . . . . . . . . . . . . . . . . . . . . . . . . . 10
B. Coordination among oversight bodies . . . . . . . . . . . . . . . . . . . . . . . . . . . . . . . . . . . . . . . . . . 11
C. Detailed findings and recommendations . . . . . . . . . . . . . . . . . . . . . . . . . . . . . . . . . . . . . . . . 11
1. Financial overview . . . . . . . . . . . . . . . . . . . . . . . . . . . . . . . . . . . . . . . . . . . . . . . . . . . . . 11
2. United Nations System Accounting Standards . . . . . . . . . . . . . . . . . . . . . . . . . . . . . . . 14
3. Presentation and disclosure of financial statements. . . . . . . . . . . . . . . . . . . . . . . . . . . 14
4. Liabilities for annual leave and end-of-service and post-retirement benefits . . . . . . 18
5. Non-expendable property . . . . . . . . . . . . . . . . . . . . . . . . . . . . . . . . . . . . . . . . . . . . . . . . 18
6. Accounts receivable and accounts payable . . . . . . . . . . . . . . . . . . . . . . . . . . . . . . . . . . 19
7. Updating the UNICEF finance and accounting manuals . . . . . . . . . . . . . . . . . . . . . . . 20
8. Write-off of losses of cash, receivables and property . . . . . . . . . . . . . . . . . . . . . . . . . 20
9. Ex gratia payments . . . . . . . . . . . . . . . . . . . . . . . . . . . . . . . . . . . . . . . . . . . . . . . . . . . . . 21
10. Management of the Private Sector Division . . . . . . . . . . . . . . . . . . . . . . . . . . . . . . . . . 21
11. Office of Emergency Programmes . . . . . . . . . . . . . . . . . . . . . . . . . . . . . . . . . . . . . . . . 26
12. Supply Division . . . . . . . . . . . . . . . . . . . . . . . . . . . . . . . . . . . . . . . . . . . . . . . . . . . . . . . 29
13. The Indian Ocean tsunami . . . . . . . . . . . . . . . . . . . . . . . . . . . . . . . . . . . . . . . . . . . . . . . 34
14. Inter-agency coordination . . . . . . . . . . . . . . . . . . . . . . . . . . . . . . . . . . . . . . . . . . . . . . . 44
15. Office of Internal Audit . . . . . . . . . . . . . . . . . . . . . . . . . . . . . . . . . . . . . . . . . . . . . . . . . 58
16. Executive offices . . . . . . . . . . . . . . . . . . . . . . . . . . . . . . . . . . . . . . . . . . . . . . . . . . . . . . 61
17. Information technology . . . . . . . . . . . . . . . . . . . . . . . . . . . . . . . . . . . . . . . . . . . . . . . . . 66
18. Country audits . . . . . . . . . . . . . . . . . . . . . . . . . . . . . . . . . . . . . . . . . . . . . . . . . . . . . . . . . 71
19. Fraud and presumptive fraud . . . . . . . . . . . . . . . . . . . . . . . . . . . . . . . . . . . . . . . . . . . . . 72

iv
D. Acknowledgement. . . . . . . . . . . . . . . . . . . . . . . . . . . . . . . . . . . . . . . . . . . . . . . . . . . . . . . . . . 73
Annex Summary of status of implementation of recommendations of the Board of Auditors in its report for the biennium ended 31 December 2003 . . . . . . . . . . . . . . . . . . . . . . . . . . . . . . . . . . . . 74
III. Audit opinion . . . . . . . . . . . . . . . . . . . . . . . . . . . . . . . . . . . . . . . . . . . . . . . . . . . . . . . . . . . . . . . . . . 75
IV. Financial statements for the biennium ended 31 December 2005 . . . . . . . . . . . . . . . . . . . . . . . . 76
A. Financial statements . . . . . . . . . . . . . . . . . . . . . . . . . . . . . . . . . . . . . . . . . . . . . . . . . . . . . . . . 77
Statement I. Income and expenditures and changes in reserves and fund balances for the biennium ended 31 December 2005 . . . . . . . . . . . . . . . . . . . . . . . . . . . . . . . . . . . . . . . . 77
Statement II. Assets, liabilities, reserves and fund balances as at 31 December 2005 . . . 78
Statement III. Cash flows for the biennium ended 31 December 2005. . . . . . . . . . . . . . . . 79
Statement IV. Statement of appropriations for the 2004-2005 biennium as at 31 December 2005 . . . . . . . . . . . . . . . . . . . . . . . . . . . . . . . . . . . . . . . . . . . . . . . . . . . . . . . . . 80
Statement V. All financial resources for the biennium ended 31 December 2005 . . . . . . . 81
Statement VI. Status of funding for approved regular resources, supplementary funds and emergency relief and rehabilitation as at 31 December 2005 . . . . . . . . . . . . . . . . . . . . 82
Statement VII. Programme cooperation: statement of approved programmes, expenditures and unspent balances for regular resources, supplementary funds and emergency relief and rehabilitation for the biennium ended 31 December 2005. . . . . . . . 83
Statement VII-1. Programme cooperation: statement of approved programmes, expenditures and unspent balances for regular resources for the biennium ended 31 December 2005 . . . . . . . . . . . . . . . . . . . . . . . . . . . . . . . . . . . . . . . . . . . . . . . . . . . . . . . . . 88
Statement VII-2. Programme cooperation: statement of approved programmes, expenditures and unspent balances for supplementary funds for the biennium ended 31 December 2005 . . . . . . . . . . . . . . . . . . . . . . . . . . . . . . . . . . . . . . . . . . . . . . . . . . . . . . . . . 93
Statement VII-3. Programme cooperation: statement of approved programmes, expenditures and unspent balances for emergency relief and rehabilitation for the biennium ended 31 December 2005 . . . . . . . . . . . . . . . . . . . . . . . . . . . . . . . . . . . . . . . . . . . 98
B. Notes to the financial statements . . . . . . . . . . . . . . . . . . . . . . . . . . . . . . . . . . . . . . . . . . . . . . 102
C. Schedules to the financial statements . . . . . . . . . . . . . . . . . . . . . . . . . . . . . . . . . . . . . . . . . . 115
Schedule 1. Contributions received or pledged for the biennium ended 31 December 2005 . . . . . . . . . . . . . . . . . . . . . . . . . . . . . . . . . . . . . . . . . . . . . . . . . . . . . . . . . 115
Schedule 2. Contributions receivable for regular resources, supplementary funds and emergency relief and rehabilitation as at 31 December 2005 . . . . . . . . . . . . . . . . . . . . . . . 121
Schedule 3. Trust funds for the biennium ended 31 December 2005 . . . . . . . . . . . . . . . . . 124
Annexes
I. Income and expenditures and changes in reserves and fund balances for the years ended 31 December 2004 and 31 December 2005 . . . . . . . . . . . . . . . . . . . . . . . . . . . . . . . . . . . . . . . . . . 125
II. Glossary of selected UNICEF terminology . . . . . . . . . . . . . . . . . . . . . . . . . . . . . . . . . . . . . . . . . . 126

v
Letters of transmittal
8 June 2006
Pursuant to UNICEF financial regulation 13.3, enclosed are the financial report and statements for the biennium 2004-2005. These statements have been prepared and signed by the Comptroller.
Copies of these financial statements are also being transmitted to the Advisory Committee on Administrative and Budgetary Questions.
(Signed) Ann. M. Veneman Executive Director
The Chairman of the United Nations Board of Auditors United Nations New York

vi
28 July 2006
I have the honour to transmit to you the report of the Board of Auditors on the financial statements of the United Nations Children’s Fund for the biennium ended 31 December 2005.
(Signed) Guillermo Carague Chairman
Philippine Commission on Audit and Chairman
United Nations Board of Auditors
The President of the General Assembly of the United Nations New York

A/61/5/Add.2
1 06-42517
Chapter I Financial report for the biennium ended 31 December 2005
Introduction
1. The Executive Director of the United Nations Children’s Fund (UNICEF) submits herewith the financial report of UNICEF, accompanied by 10 statements and supported by 3 schedules. Of these, statements I, II, III and IV are presented in line with the formats agreed upon by the United Nations System Chief Executives Board for Coordination (CEB) as a step towards harmonizing the accounts of agencies in the United Nations system. The financial report provides the financial results of UNICEF activities in 2004 and 2005. Highlights are summarized in the following paragraphs.
Income
2. UNICEF income in the biennium 2004-2005 totalled $4,715 million. Virtually all Governments of industrialized and developing countries contributed to UNICEF in the period 2004-2005. Income comprised $1,579 million for regular resources, $1,616 million for other resources (regular) and $1,520 million in other resources (emergency). The breakdown of UNICEF income by source is as follows: 58 per cent ($2,733 million) from Governments; 36 per cent ($1,720 million) from fund-raising campaigns, the sale of greeting cards and individual donations; and 3 per cent ($116 million) from miscellaneous sources, including interest and exchange rate revaluation of assets and liabilities. A total of $146 million (3 per cent) was contributed under inter-organizational arrangements.
Expenditures
3. UNICEF expenditures in the biennium 2004-2005 were $3,791 million. This amount consisted of $1,185 million for programme cooperation from regular resources, $1,401 million for programme cooperation from other resources (regular), and $1,025 million for other resources (emergency). The remaining expenditures of $180 million were for management and administration.
Supported deliveries
4. UNICEF handled supported deliveries on behalf of third parties valued at $305 million during the biennium 2004-2005. These deliveries are not reflected in the financial accounts of UNICEF, although they are handled through the administrative structures of the organization.
Trust funds
5. Trust funds not related to programmes approved by the UNICEF Executive Board are not entered in the financial accounts of UNICEF as income and expenditures. These funds are used mainly to cover the cost of goods and services purchased and delivered on a reimbursable basis by UNICEF on behalf of Governments, other agencies in the United Nations system and non-governmental organizations (NGOs). In the biennium 2004-2005, UNICEF received cash of $1,357 million for these trust funds. Disbursements and obligations totalled $1,294 million.

A/61/5/Add.2
06-42517 2
Cash holdings
6. UNICEF has total cash of $2,195 million, which includes the unspent balances from trust funds in the amount of $337 million. An amount of $2,194 million is held in first-class banks, comprising $2,125 million in interest-bearing term deposit accounts and $69 million in current bank accounts. Cash on hand amounts to $1 million.
Approved programmes
7. During the biennium 2004-2005, the Executive Board approved the amount of $4,153 million for new programmes for children in countries with which UNICEF cooperates, as well as for regional and interregional projects. This total includes $886 million in programmes to be funded from UNICEF regular resources and $1,767 million for projects that the Board approved as worthy of support and that were financed by pledges of supplementary funds made in 2004-2005. The total also includes $1,500 million for projects financed by pledges for emergency relief and rehabilitation.
(Signed) Ann M. Veneman Executive Director
United Nations Children’s Fund

A/61/5/Add.2
3 06-42517
Chapter II Report of the Board of Auditors
Executive summary The Board of Auditors has reviewed the operations of the United Nations Children’s Fund (UNICEF) at its Headquarters in New York, Supply Division in Copenhagen (Denmark) and Private Sector Division in Geneva (Switzerland) as well as in 11 country offices.
In addition to the audit of the accounts and financial statements for the biennium ended 31 December 2005, the Board also carried out reviews of UNICEF’s operations under United Nations financial regulation 7.5.
The Board issued an unqualified audit opinion on the financial statements for the United Nations Children’s Fund operations for the biennium ended 31 December 2005, as reflected in chapter III.
Implementation of previous recommendations
In accordance with General Assembly resolution 48/216 B of 23 December 1993 and A/60/234 dated 23 December 2005, the Board reviewed the measures taken by the Administration to implement the recommendations made in its report for the biennium ended 31 December 2003. Out of a total of 56 recommendations, 37 (66.1 per cent) were implemented, 18 (32.1 per cent) were under implementation and 1 (1.8 per cent) was not implemented. Of the 19 recommendations not yet implemented, 17 (89.5 per cent) related to the 2002-2003 biennium and 2 (10.5 per cent) to the 2000-2001 biennium.
Coordination among oversight bodies
The Board continually coordinates with the other oversight bodies and experts in the planning of its audits in order to avoid duplication of efforts. This includes the consideration of the work planned and/or performed by the other oversight bodies, to determine the extent of reliance that could be placed on the work done by those bodies. For the biennium under review, this determination was further informed by the review of the UNICEF Office of Internal Audit carried out by the Board.
Financial overview for the biennium ended 31 December 2005
Total income amounted to $4.7 billion, while total expenditure reached $3.8 billion. Between 31 December 2003 and 31 December 2005, year-end unexpended funds increased from $1 billion to $1.9 billion, while cash and term deposits more than doubled, from $1 billion to $2.2 billion. In light of these developments, the Board noted that the sustainability of the increase in UNICEF’s portfolio of supplementary-funded projects needed to be reviewed.
Management of the Private Sector Division
Private Sector Division net income reached $1.6 billion during the biennium. The Board noted that:

A/61/5/Add.2
06-42517 4
(a) Agreements with UNICEF National Committees lacked annexes on financial reporting and transfer of funds;
(b) The accounting treatment of income was not harmonized for regular and supplementary resources;
(c) UNICEF did not adequately disclose its overall support costs for both income generation and programme assistance; and
(d) There were further opportunities for the development of private sector income generation in emerging economies.
Management of the Office of Emergency Programmes
UNICEF emergency and rehabilitation supplementary funding more than tripled, from $0.4 billion in 2000-2001 to $1.5 billion in 2004-2005. The Office of Emergency Programmes had a $13.1 million budget. It was in charge of strengthening the UNICEF capacity to respond to emergencies and providing support to field offices dealing with emergency situations. The Board noted that:
(a) The accountability arrangements of headquarters divisions were not sufficiently clear for the implementation of the Core Commitments for Children in Emergencies;
(b) The Internal Audit Committee included directors of UNICEF divisions that were liable to be audited by the Office of Internal Audit; the Committee met infrequently and had a narrow remit;
(c) The quality and coverage of emergency preparedness and response plans were uneven.
Management of the Supply Division
The Supply Division handled $1.5 billion of supplies during the biennium, of which $116 million (7.9 per cent) were emergency supplies. The Board noted that:
(a) The supply and logistics components of the emergency preparedness and response plans were not always detailed enough;
(b) The proportion of field offices using the UNICEF automated supply planning module was insufficient;
(c) The Division did not fully comply with rules on segregation of duties for the certification of invoices; and
(d) The development of electronic scales in partnership with a private enterprise had been carried out since 1992 without sufficient precautions, which resulted in $3.5 million of write-offs.
The Indian Ocean tsunami
UNICEF requested $362.2 million as part of the Indian Ocean flash appeal. By May 2006, it had received $672.3 million within and outside the appeal, of which $200.7 million were spent in 2005. The Board commended UNICEF for the compliance of its response with the Core Commitments for Children in Emergencies, despite a very challenging environment. It also noted that:

A/61/5/Add.2
5 06-42517
(a) National Committees continued to provide donations for the tsunami after UNICEF had indicated that its needs had been fully met;
(b) The Indonesia and Maldives offices received funds for three to five years without having developed multi-year budgets and workplans;
(c) UNICEF assistance was extended thematically and geographically to communities that were not directly tsunami-affected without always first obtaining explicit donor approval;
(d) Although the quality and quantity of staff recruited was adequate overall, there were delays in the recruitment of some temporary fixed-term staff;
(e) Basic procurement financial controls were complied with, but weak supply and distribution planning led to wasteful purchases;
(f) The financial and administrative capacity of counterparts had not been satisfactorily assessed and enhanced before they were provided with cash assistance;
(g) The financial procedures used by the United Nations Office for Project Services (UNOPS) in the direct implementation of UNICEF construction projects were not satisfactory; and
(h) UNICEF’s contribution to sectoral inter-agency coordination was uneven and not effective in water and sanitation.
Inter-agency coordination
The Board reviewed the involvement of UNICEF in inter-agency coordination in five selected field offices (Brazil, China, the Democratic Republic of the Congo, India, Serbia and Montenegro). It also reviewed the UNICEF contribution to inter-agency coordination in procurement and information technology (enterprise resource planning). The Board noted that:
(a) The involvement of UNICEF representatives and staff in field coordination meetings was uneven, both geographically and over time;
(b) None of the UNICEF offices reviewed were located in joint United Nations premises, and they had few incentives to advocate for such premises;
(c) Despite numerous diagnostic exercises pointing to the benefits of a joint approach, common services were extremely limited in the countries reviewed;
(d) The relevance of common country assessments/United Nations Development Assistance Frameworks was uneven for UNICEF country offices;
(e) UNICEF had not provided any cross-district inputs for the joint implementation at the district level of the coordinated HIV/AIDS response through capacity-building and awareness project in India;
(f) Despite some successes in joint advocacy for HIV/AIDS in China, the HIV/AIDS projects of United Nations agencies in the country partly overlapped;
(g) UNICEF had not concluded a framework agreement on pharmaceutical procurement with WHO;

A/61/5/Add.2
06-42517 6
(h) Although UNHCR non-food items were stored in UNICEF warehouses, the organizations did not combine their orders for identical or similar items; and
(i) UNICEF had satisfactorily reached out to other international funds, programmes and agencies in the context of the implementation of its enterprise-resource planning payroll migration.
Office of Internal Audit
The Board reviewed the control environment of UNICEF, as well as the operations of the Office of Internal Audit and noted that:
(a) UNICEF did not have a consolidated overview of the hierarchy of risks it faced;
(b) The Internal Audit Committee included directors of UNICEF divisions that were liable to be audited by the Office of Internal Audit; the Committee met infrequently and had a narrow remit;
(c) As the Office of Internal Audit deployed most of its resources to the field, it did not provide sufficient coverage of headquarters operations, especially information technology;
(d) The Office of Internal Audit planned and performed its assignments with due professional care.
Executive offices
The three executive offices reviewed by the Board had combined expenditures of $14.4 million and 37 staff members. The Board noted that:
(a) The performance of the Assistant Secretaries-General in the Office of the Executive Director was not formally assessed;
(b) There were no ethics guidelines for gifts received by senior UNICEF executives; and
(c) There were delays and omissions in the provision of talking points prepared for the Secretary-General of the United Nations by the Office of United Nations Affairs and External Relations.
Information technology
The Board commended UNICEF for developing a comprehensive information technology security policy. The Board also noted that:
(a) UNICEF automated alerts to detect the abuse of information technology resources;
(b) Existing logical security and remote access controls needed further strengthening;
(c) UNICEF had not fully complied with regulations when selecting a supplier for the migration of its payroll to an enterprise-resource planning system; and
(d) The Board commended UNICEF for conducting its payroll migration on schedule and within budget.
A/61/5/Add.2
7 06-42517
Fraud and presumptive fraud
During the biennium 2004-2005, UNICEF reported 42 cases of fraud or presumptive fraud to the Board (as against 37 in 2002-2003). UNICEF had not yet determined the financial loss in one case, but estimated a total loss of $482,979 in the other 41. Those cases related to, among other things, theft of cash, counterfeit cheques, theft of vehicles, poor management of inventory, misappropriation of funds, and other financial irregularities. UNICEF recovered $210,883 of the total loss. Remedial action against the staff members involved in those cases included 7 summary dismissals, 5 non-renewals of contracts, 1 termination of secondment, 25 written reprimands and 3 other measures. Three staff members resigned following the discovery of the cases.

A/61/5/Add.2
06-42517 8
A. Introduction
1. The Board of Auditors has audited the financial statements and reviewed the operations of the United Nations Children’s Fund (UNICEF) for the period from 1 January 2004 to 31 December 2005, in accordance with General Assembly resolution 74 (I) of 7 December 1946. The audit was conducted in conformity with article VII of the Financial Regulations and Rules of the United Nations and the annex thereto, the common auditing standards of the Panel of External Auditors of the United Nations, the specialized agencies and the International Atomic Energy Agency and the International Standards on Auditing. Those standards require that the Board plan and perform the audit to obtain reasonable assurance as to whether the financial statements are free of material misstatement.
2. The audit was primarily conducted to enable the Board to form an opinion as to whether the expenditure recorded in the financial statements for the biennium ended 31 December 2005 had been incurred for the purposes approved by the Executive Board of UNICEF, whether income and expenditure had been properly classified and recorded in accordance with the Financial Regulations and Rules and whether the financial statements of UNICEF presented fairly the financial position as at 31 December 2005 and the results of operations for the biennium then ended in accordance with the United Nations System Accounting Standards. The audit included a general review of financial systems and internal controls and a test examination of accounting records and other supporting evidence to the extent that the Board considered necessary to form an opinion on the financial statements.
3. In addition to the audit of the accounts and financial transactions, the Board carried out reviews under United Nations financial regulation 7.5. The reviews primarily focused on the efficiency of financial procedures, the financial controls and, in general, the administration and management of UNICEF.
4. The audits were carried out at UNICEF headquarters offices in New York, Copenhagen and Geneva and at the field offices in Brazil, China, the Democratic Republic of the Congo, Eritrea, Ethiopia, Guatemala, India, Indonesia, Serbia and Montenegro, Sri Lanka and Thailand.
5. The Board continued its practice of reporting the results of specific audits through management letters containing detailed observations and recommendations to the Administration. That practice allowed an ongoing dialogue with the Administration.
6. The present report covers matters that, in the opinion of the Board, should be brought to the attention of the General Assembly. The Board’s observations and conclusions were discussed with the Administration, whose views have been appropriately reflected in the report.
7. A summary of the Board’s main recommendations is contained in paragraph 14 below. The detailed findings and recommendations are reported in paragraphs 17 to 391.

A/61/5/Add.2
9 06-42517
1. Previous recommendations not fully implemented
Biennium ended 31 December 2001
8. In accordance with section A, paragraph 7, of General Assembly resolution 51/225 of 3 April 1997, the Board has reviewed the action taken by UNICEF to implement the recommendations made in its report for the biennium ended 31 December 2001 and confirms that there are no outstanding matters except for those addressed in the present report.
Biennium ended 31 December 2003
9. In accordance with General Assembly resolutions 48/216 B of 23 December 1993 and 60/234 of 23 December 2005, the Board also reviewed the measures taken by the Administration to implement the recommendations made in its report for the biennium ended 31 December 2003. Details of the action taken and the comments of the Board are included in the report and have been summarized in the annex to the present chapter. Out of a total of 56 recommendations, 37 (66.1 per cent) were implemented, 18 (32.1 per cent) were under implementation and 1 (1.8 per cent) was not implemented.
Ageing of previous recommendations
10. The Board evaluated the ageing of its previous recommendations that had not yet been fully implemented, as requested by the Advisory Committee on Administrative and Budgetary Questions (A/59/736, para. 8). The biennium in which such recommendations were first made is indicated in the annex.
11. Of the 19 recommendations not yet implemented, 17 (89.5 per cent) related to the 2002-2003 biennium and 2 (10.5 per cent) to the 2000-2001 biennium. The Board has reiterated, in paragraphs 41, 46 and 61 of the present report, previous recommendations not yet implemented.
Request from the Advisory Committee on Administrative and Budgetary Questions
12. The Advisory Committee on Administrative and Budgetary Questions requested the Board (A/60/387, para. 27) to report on the implementation of its recommendation contained in paragraph 173 of A/59/5/Add.2. UNICEF informed the Board that it applied operational flexibility based on recommendations formalized by a human resources network of United Nations agencies, which reports to the High-level Committee on Management. It also reiterated its view that “the application and administration of staff entitlements are within the broad framework of the Staff Regulations and Rules, taking into account the operational flexibility required to meet the overall goals and objectives of the Organization” (ibid.).
13. The Board maintains that UNICEF’s practices deviated from United Nations staff rule 112.2 and posed the risk of fostering a costly competition among agencies to attract and retain relevant skills. These practices may be to the advantage of UNICEF and its staff, but could be detrimental to the United Nations system as a whole. The Board considers that its recommendation in paragraph 173 of A/59/5/Add.2 was not implemented.

A/61/5/Add.2
06-42517 10
2. Main recommendations
14. The Board’s main recommendations are that UNICEF:
(a) Consider reviewing whether it has the capacity to sustain the increase in its portfolio of supplementary funded projects (para. 29);
(b) Calculate, monitor and make available to National Committees the overall support costs of income and expenditure (para. 81);
(c) Expedite the development of its emergency “talent pool” (para. 104);
(d) Set and enforce quality standards for the supply and logistics components of emergency preparedness and response plans (para. 118);
(e) Systematically submit contracts involving significant financial commitments to the Senior Adviser (Legal) for clearance (para. 144);
(f) Review its relationships with National Committees in the light of the experience of the tsunami fund-raising (para. 157);
(g) Produce comprehensive multi-year budgets and workplans for utilizing funds received in excess of initial requirements (para. 176);
(h) Systematically seek explicit donor approval to extend or modify the geographic or thematic reach of funds with which it is entrusted (para. 183);
(i) Review the means necessary to fully discharge its sectoral lead responsibilities for the relevant cluster in the Inter-Agency Standing Committee framework (para. 207);
(j) Systematically advocate for joint premises to be considered when new or expanded premises are required in the context of a humanitarian crisis (para. 227);
(k) Include the active involvement of field offices in the development of common services as a criterion to assess the performance of country representatives and liaise with the United Nations Development Group Office to determine the options available to increase the proportion of common services in field offices (para. 237);
(l) Liaise with the Department of Peacekeeping Operations to clarify the respective mandates of UNICEF field offices and integrated peacekeeping missions in the area of child protection (para. 247);
(m) Initiate negotiations at the appropriate level to conclude a framework agreement on pharmaceutical procurement services with other relevant United Nations organizations (para. 270);
(n) Jointly purchase items of common interest with UNHCR (for example, tents, tarpaulins, blankets, collapsible jerry cans, mosquito bed nets), whenever it would result in cost or efficiency gains for the United Nations as a whole (para. 282);
(o) Implement a comprehensive risk-management framework to enhance its governance and management control processes (para. 294);
(p) Support the rapid expansion of the Office of Internal Audit audit coverage of all headquarters areas, including information technology (para. 306);

A/61/5/Add.2
11 06-42517
(q) Review the management of talking points and reports prepared by the Office of United Nations Affairs and External Relations (para. 340); and
(r) Adopt and implement a methodology to determine the total costs, including staff costs, of its major information technology projects (para. 379).
15. The Board’s other recommendations are shown in paragraphs 20, 21, 29, 36, 42, 47, 54, 58, 62, 66, 72, 78, 86, 91, 99, 104, 106, 108, 110, 113, 115, 121, 124, 128, 130, 133, 135, 141, 149, 159, 163, 165, 168, 170, 179, 186, 188, 193, 195, 197, 199, 203, 217, 218, 225, 243, 252, 258, 260, 262, 272, 277, 279, 300, 307, 310, 313, 317, 321, 323, 325, 328, 331, 332, 334, 342, 344, 347, 349, 353, 357, 359, 361, 363, 368, 370, 385, 387 and 389.
B. Coordination among oversight bodies
16. The Board continually coordinates with the other oversight bodies and experts, such as the UNICEF Office of Internal Audit and the Joint Inspection Unit, in the planning of its audits in order to avoid duplication of efforts. That includes consideration of the work planned and/or performed by the other oversight bodies, to determine the extent of reliance that could be placed on the work done by those bodies.
C. Detailed findings and recommendations
1. Financial overview
17. Since biennium 2002-2003 UNICEF’s income has increased by 50.8 per cent, from $3.126 billion to $4.715 billion. The surge in emergency relief and rehabilitation resources accounted for over half of that increase ($837 million out of $1.589 billion, or 53 per cent of the overall rise in income), whereas the rise in supplementary resources represented more than a third of it ($598 million or 37.6 per cent). A limited rise in regular resources accounted for the balance ($154 million, or 9.7 per cent). The proportion of regular resources fell from nearly two thirds of UNICEF income in 1996-1997 (59.5 per cent) to only one third (33.5 per cent) in 2004-2005.
Table II.1 Composition of UNICEF income (1996-2005) (Millions of United States dollars)
Type of income 1996-1997 1998-1999 2000-2001 2002-2003 2004-2005
Regular resources 1 098 (59.5%) 1 160 (55.7%) 1 099 (46.8%) 1 425 (45.6%) 1 579 (33.5%)
Supplementary funds 530 (28.7%) 611 (29.3%) 816 (34.7%) 1 018 (32.6%) 1 616 (34.3%)
Emergency relief and rehabilitation 218 (11.8%) 313 (15.0%) 434 (18.5%) 683 (21.8%) 1 520 (32.2%)
Total 1 846 2 084 2 349 3 126 4 715

A/61/5/Add.2
06-42517 12
18. One consequence of the reduction in the proportion of regular resources was that the funds available for UNICEF to finance the programme priorities approved by its Executive Board (medium-term strategic plan, in line with the Millennium Development Goals), but for which donors had not provided supplementary funds, went from $571.9 million or 42.3 per cent of programme expenditure in 1996-1997 to $884.0 million or 28.1 per cent in 2004-2005. That reduced UNICEF’s ability to deliver the outcomes it had committed itself to, as the flow of supplementary funds from government donors did not exactly match the Executive Board approved priorities. Therefore, UNICEF’s fund-raising strategy needed to address the challenge of increasing regular resources in proportion to total income.
19. For instance, the medium-term strategic plan projected that expenditure on HIV-AIDS projects would rise from 3 per cent of overall programme expenditure in 2000 to 14 per cent in 2005. That proportion reached only 8 per cent in 2005 ($157.3 million), even though 44.4 per cent of the expenditure ($69.2 million) was funded by non-earmarked, regular resources. Conversely, while UNICEF had planned to reduce its spending on integrated early childhood development from 33 per cent in 2000 to 27 per cent in 2005, that proportion increased to 38 per cent in 2005 ($747.1 million). That was an area that was financed mainly by supplementary funding (70.7 per cent of the total, or $528.2 million).
20. The Board recommends that UNICEF review its allocation of resources within countries in the light of the disparity between UNICEF Board-approved strategic priorities and the allocation of supplementary funding.
21. The Board further recommends that the UNICEF fund-raising strategy identify ways of increasing the proportion of regular resources in relation to total income.
22. Programme assistance expenditure (excluding recovery to the support budget from supplementary funds programme assistance) grew by 43.2 per cent, from $2.20 billion to $3.15 billion since the last biennium, a significantly slower rate than income growth. As a result, the ratio of expenditure to income has decreased from 87.5 per cent in 2002-2003 to 80.4 per cent in 2004-2005. That was due to the decline in emergency and rehabilitation funded projects, which fell from 88.7 per cent in 2002-2003 to 67.4 per cent in 2004-2005.
23. The reduction in the rate of consumption of allotments also led to a significant increase in total year-end unexpended funds, which nearly tripled, from $677 million in 2001 to $1.90 billion in 2005.
Table II.2 Year-end unexpended funds (Millions of United States dollars)
2000 2001 2002 2003 2004 2005
Regular resources 250 184 313 369 483 547
Supplementary funds 316 349 410 439 648 652
Emergency relief and rehabilitation 138 144 128 213 243 704
Total 704 677 851 1 021 1 374 1 903

A/61/5/Add.2
13 06-42517
24. UNICEF explained that the $547 million unexpended funds for regular resources included $455 million in cash assets, of which $384 million was available for use, as UNICEF is required to meet funded and unfunded liabilities from regular resources (funded reserves amounted to $71 million as at 31 December 2005). A total of $200 million out of the $384 million was set up as precautionary cash reserve, leaving $184 million to be disbursed in 2006-2007. With regard to supplementary funds, UNICEF pointed to the time frame for implementation of funded rehabilitation and recovery activities. It also highlighted its increasing portfolio of supplementary funded projects, for which funding must be received in advance of implementation, in accordance with financial regulation 8.3.
25. The Board noted that the rise in unexpended year-end balances resulted mainly from an increase in UNICEF’s portfolio of supplementary funded projects. Although that was a positive indication of UNICEF’s ability to attract funding, it could also prove unsustainable if the organization did not deploy sufficient capacity to expend those new resources in a timely and efficient fashion.
26. As a result of the rise in unexpended balances, UNICEF has further built up significant cash and term deposits which reached $2.194 billion, more than double the figure as at 31 December 2003 ($961 million). On the basis of average 2005 disbursements, cash and term deposits represented 10.6 months of activity, up from 7.3 months in 2003 and 4.6 months in 2001.
Table II.3 Key financial indicators
Description of ratio 2000-2001 2002-2003 2004-2005
Accounts receivable/total assetsa 0.42 0.38 0.19
Cash/liabilityb 1.36 1.81 2.82
a A low indicator depicts a healthy financial position. b Reflects the extent of cash available to settle debts.
27. UNICEF financial regulation 9.3 requires that expenditure for programme support and management and administration of the organization be financed from regular resources. However, the Executive Board has agreed that UNICEF should transfer a portion of its income from supplementary and emergency relief and rehabilitation funds to meet the indirect variable costs, the incremental increase in support and administration costs linked to the projects funded by those sources of income.1 The recovery from programme assistance represented $162 million in 2004-2005, or 6.7 per cent of supplementary funded programme assistance expenditure. By contrast, programme support, management and administration expenditure, which carry the fixed costs incurred to run the organization, represented 54.4 per cent of programme assistance funded by regular resources. Therefore, any increase in the proportion of supplementary income and expenditure would automatically reduce the ratio of overheads to programme expenditure.
__________________
1 UNICEF recovery policy (E/ICEF/2003/AB/L.5).

A/61/5/Add.2
06-42517 14
Table II.4 UNICEF support costs, including recovery from programme assistance (1996-2005) (Millions of United States dollars)
1996-1997 1998-1999 2000-2001 2002-2003 2004-2005
Programme expenditure 1 351 (73.6%) 1 431 (74.3%) 1 844 (79.0%) 2 198 (80.3%) 3 148 (83.0%)
Support, management and administrationa 485 (26.4%) 496 (25.7%) 491 (21.0%) 539 (19.7%) 643 (17.0%)
a Cost recovery from programme assistance is included in support, management and administration.
28. Although that trend is positive, it may prejudice UNICEF’s ability to use the funds it was entrusted with. The organization’s capacity to deliver programmes and to implement projects was constrained by the finite size of its support, management and administration budgets, 74.8 per cent of which was funded by regular resources. The rise in unexpended balances at year-end is an indication that the limits of UNICEF’s absorptive capacity might have been reached. UNICEF needs to find ways to adapt to the pace of growth of its supplementary funded programmes in the context of financial responsibility and accountability.
29. UNICEF agreed with the Board’s recommendation that it consider reviewing whether it has the capacity to sustain the increase in its portfolio of supplementary funded projects.
2. United Nations System Accounting Standards
30. The Board assessed the extent to which the financial statements of UNICEF for the financial period ended 31 December 2005 conformed to the United Nations System Accounting Standards. The financial statements were consistent with the standards.
3. Presentation and disclosure of financial statements
31. The Board noted that UNICEF continued to improve the presentation of the statements. In particular, following the Board’s review, UNICEF modified the presentation of its financial statements in relation to the disclosure of cost recovery from programme assistance (statements I and IV), the disclosure of income (schedule 1), the method of valuation of building assets (note 2) and the scope of income tax reimbursement (note 3).
United Nations Joint Staff Pension Fund
32. The Board recommended in paragraph 36 of its report that UNICEF assess more accurately the amount of the accounts payable to the Pension Fund, in coordination with the Fund. The UNICEF financial statements as at 31 December 2005 included $1.1 million as an account payable to the Pension Fund. UNICEF indicated that it had been working on a priority basis in close consultation with the Pension Fund office to have contribution payables reconciled and assessed more accurately. However, a difference of $1.9 million was yet to be reconciled by both organizations at the end of the biennium. A difference of $5.4 million had been identified at the

A/61/5/Add.2
15 06-42517
end of the previous biennium, of which $3.4 million had been reconciled during the biennium.
Unliquidated obligations
33. In paragraph 54 of its report for 2000-2001,2 the Board recommended that UNICEF review more thoroughly its unliquidated obligations at year’s end, in compliance with the Financial Regulations. For the biennium 2002-2003, UNICEF disclosed unliquidated obligations of $127.9 million. In 2004-2005, $22.6 million (17.7 per cent) was cancelled. The reasons for cancellations included exchange rate variations, defaults of suppliers and revisions of supply orders. Of that total, $4.8 million was reverted to the original funding source while $17.8 million was transformed into income to regular resources because the original funding source had expired. The percentage of obligations cancelled in 2004-2005 supported the concept that the continuous review of the validity of unliquidated obligations deserves attention.
34. The Board reviewed a total of $66.67 million of unliquidated obligations as at 31 December 2005 (23.5 per cent of the total of $283.73 million). Out of that sample, $1.25 million was identified as invalid (0.4 per cent of unliquidated obligations), including $0.8 million for which purchase orders had been raised but never issued to suppliers.
35. The United Nation System Accounting Standards, paragraph 41, states that “obligations unliquidated at the end of a financial period which continue to represent a charge against the resources of the organization should be maintained if the relevant regulations or rules so permit, and shown as a liability in the accounts. Any other remaining unliquidated obligations should be cancelled”. No contract is perfected between UNICEF and its suppliers unless either (a) the purchase order is acknowledged or (b) the goods are delivered under the terms of the purchase order. No legal obligation existed otherwise, and hence there could be no corresponding unliquidated obligations. Purchase orders should be raised early enough for acknowledgements or deliveries to be received by the end of the financial period. The Board also found that a $60,800 outstanding obligation for freight was invalid owing to a double recording. UNICEF decided not to reverse those overstatements of liabilities and expenditure in the 2004-2005 accounts and financial statements in view of their immateriality.
36. UNICEF agreed with the Board’s recommendation that it review its procedure for raising and verifying programme supplies unliquidated obligations to ensure that only valid obligations are recognized at the end of the biennium.
Medical insurance plan
37. The United Nations common system medical insurance plan funds health services for locally recruited field General Service staff members and national Professional Officers. Other staff members are covered by the United Nations Staff Mutual Insurance Society against Sickness and Accident, whose operations are
__________________
2 Official Records of the General Assembly, Fifty-seventh Session, Supplement No. 5B and corrigendum (A/57/5/Add.2 and Corr.1).

A/61/5/Add.2
06-42517 16
reflected in statement X of the United Nations financial statements,3 and to which administrative costs are charged.
38. The balance of the medical insurance plan has increased by $37.43 million since 1989 (from $2.14 million to $39.57 million in 2005). The 1987 percentage rates were still applicable in 2005. UNICEF indicated that the United Nations Secretariat, in collaboration with the participating organizations, had been leading a comprehensive review of the medical insurance plan. The review has not yet been completed.
39. Between 1987 and 2005 the plan’s transactions were managed by UNICEF in the field offices. UNICEF did not compute the administrative cost, and no administrative cost was charged to the insurance plan. Since January 2006 UNICEF has outsourced the administration of the medical insurance plan to an outside firm.
40. Since the biennium 1996-1997, the medical insurance plan balance has been presented in the financial statements as a liability. UNICEF explained that the presentation is in line with the practice of the United Nations system. Such is not the practice, however, of the United Nations Development Programme (UNDP), which discloses the cash held for the insurance plan in its assets, or of the Office of the United Nations High Commissioner for Refugees (UNHCR), which reflects the insurance plan operations in the financial statements as a separate fund.
41. In paragraph 44 of its previous report (A59/5/Add.2), the Board recommended that UNICEF, in cooperation with other United Nations organizations, finalize its review of the funding of the plan and the way income and expenditure of the plan are disclosed. At the time of the audit, the inter-agency review had not been completed.
42. The Board reiterates its recommendation that UNICEF, in cooperation with the other United Nations organizations, advocate the expeditious review of the medical insurance plan.
Support costs disclosed as programme assistance
43. The Board indicated, in paragraph 45 of its previous report (A/59/5/Add.2), that expenditure for programme assistance disclosed in UNICEF’s financial statements included the cost of the recovery of support and management costs charged to supplementary and emergency funds. That figure, included in the programme assistance line in statement I ($3.3 billion), increased to $162.4 million in 2004-2005, from $72.5 million in 2002-2003. Although the net effect on total expenditures is zero, UNICEF overstated programme assistance by $162.4 million and understated its support costs by the same amount (Programme support, management and administration).
44. UNICEF financial regulation 1.1 defines programme activities as those directly associated with the preparation, implementation and monitoring and evaluation of UNICEF cooperation. Programme support activities will typically include units that provide backstopping of programmes on a technical thematic, geographic, logistical or administrative basis, while management and administration activities will include units that carry out the functions of executive direction, organizational policy and evaluation, external relations, information and
__________________
3 Ibid., Fifty-ninth Session, Supplement No. 1 (A/59/5), vol. I.

A/61/5/Add.2
17 06-42517
administration. To comply with those definitions, the recovery of support and management costs charged to supplementary and emergency funds should be disclosed within programme support expenditure — instead of within programme assistance — because they are representative of costs incurred for the provision of UNICEF administration of programme activities.
45. In its biennial support budget for 2004-2005 (E/ICEF/2003/AB/L.14) and for 2006-2007 (E/ICEF/2006/AB/L.1), UNICEF followed the correct convention by disclosing the cost recovery from supplementary funds within the support budget expenditures. Additionally, the support budget includes both regular resources and other resources programmes (E/ICEF/2006/AB/L.1, paras. 1-3). That presentation is in line with the harmonized United Nations Development Group approach and consistent with current definitions of programme support expenditure. UNICEF did not follow that approach in its financial statements and, instead, continued to include the recovery from supplementary funds in the programme assistance line.
46. At the Board’s request, UNICEF agreed to cross-reference the programme assistance line in statement I to statement IV, where the full breakdown of the cost recovery from supplementary funded programmes has been included, and its link with programme assistance has been clarified. That allows readers to compare the support expenditures featuring in E/ICEF/2003/AB/L.14 with their actual implementation, per type of funding. UNICEF has also indicated that a broad review of its Financial Regulations and Rules was under way, which would address the issue of cost recovery. In the event that the review does not result in a revision of the Financial Regulations and Rules, UNICEF management has undertaken to submit a new definition of “programme support” to its Executive Board, no later than September 2007.
47. UNICEF agreed with the Board’s reiterated recommendation that it amend the presentation of its financial statements for cost recovery in statements I and IV or submit a redefinition of programme support expenditure to its Executive Board.
Accounting for contributions in kind
48. The Board pointed out, in its last three biennial reports4 that the UNICEF policy on contributions in kind was under review. The policy was approved on 7 July 2004. UNICEF welcomes in kind assistance from the private sector in principle, and distinguished between contributions in kind while setting up a procedure to ensure that no offer would be accepted unless it met a set of minimal technical requirements (only new supplies or equipment will be accepted, no unfair commercial advantage should be granted to the supplier, all direct costs must be met by the donor). The Directors of the Supply Division and the Division of Human Resources are in charge of verifying compliance before approving offers. The Comptroller is in charge of determining the accounting treatment and valuation of the offers.
49. The Board reviewed 20 contributions in kind (a sub-category of in kind assistance that encompasses offers specifically requested by UNICEF) out of 66
__________________
4 Ibid., Fifty-fifth Session, Supplement No. 5B (A/55/5/Add.2); ibid., Fifty-seventh Session, Supplement No. 5B and corrigendum (A/57/5/Add.2 and Corr.1); and Fifty-ninth Session, Supplement No. 5B (A/59/5/Add.2).

A/61/5/Add.2
06-42517 18
received in 2005 representing $15.3 million, or 47.6 per cent of all contributions received in kind ($32.12 million). The valuation was generally fair and the recording was accurate. However, in one case, a shortfall in the quantity of goods delivered was not recorded, which resulted in the overstatement of income by $268,382. Conversely, UNICEF did not record as contribution in kind the pro bono assistance provided by a consulting firm as part of the tsunami operation. On the basis of the estimate provided by the UNICEF Office of Internal Audit, the total value of the donation was $135,450. Overall, the net misstatements on the value of in kind assistance in the financial statements was $132,932 (income overstated). UNICEF did not correct that amount in the financial statements, as it was deemed immaterial at 0.4 per cent of contributions received in kind.
50. Despite immaterial misstatements, which may be attributed to the introduction of a new policy, UNICEF has made some significant progress in the treatment and accounting of in kind assistance. The Board commends UNICEF for the implementation of a comprehensive policy on in kind assistance and invites UNICEF to share its experience with the United Nations Secretariat and other organizations.
4. Liabilities for annual leave, end-of-service and post-retirement benefits
51. As at 31 December 2005, the UNICEF accrued liability for after-service health insurance (note 20 to the financial statements) amounted to $292.4 million. As recommended by the Board in paragraph 23 of its report on 2000-2001,5 UNICEF established in 2003 a reserve for after-service health insurance, with an initial contribution of $30 million. The reserve stood at $60 million as at 31 December 2005, or 20.5 per cent of the accrued liability. The net contingent liability for other staff benefits is estimated at $75.8 million for accumulated leave and repatriation grants. There was no provision for those benefits, the expenditure being charged against the budget appropriations of the periods when actual payments are made.
Table II.5 Annual leave and end-of-service and post-retirement benefits (Millions of United States dollars)
2000-2001 2002-2003 2004-2005
After-service health insurance net accrued liability 196.4 182.5 292.4
Accumulated leave 35.8 33.0 38.9
Repatriation grants 20.7 33.9 36.9
Total 252.9 249.4 368.2
5. Non-expendable property
52. Note 22 to the financial statements disclosed a total of $128.3 million for the cost of non-expendable property owned by UNICEF (paid from the support budget) or in its custody (paid from the programme budget). However, the reports that supported that figure were not produced through its main accounting system
__________________
5 Ibid., Fifty-seventh Session, Supplement 5B (A/57/5/Add.2).

A/61/5/Add.2
19 06-42517
(SAP/FLS) but through a manual compilation based on the summary reports sent by the country offices.
53. Although some inaccuracies were identified in the samples ($30.7 million, representing 23.9 per cent of $128.3 million), most of them were corrected by UNICEF. Out of 157, only 3 locations comprising $2.1 million of non-expendable property (Geneva Regional Office, Madagascar Country Office, and Nigeria-Abuja Sub-Office) were unable to confirm that their records did not erroneously include items with a value below $1,500. Weaknesses were also found in the inventory of non-expendable property in 4 of the 11 country offices visited during the biennium (irregular updating of property records, physical inventories carried out at more than annual intervals, incomplete tagging of equipment, incomplete property records).
54. UNICEF agreed with the Board’s recommendation that it review and improve the procedure on the disclosure of the value of its non-expendable property.
6. Accounts receivable and accounts payable
National Committee receivables
55. Amounts due from National Committees and other Private Sector Division partners amounted to $309.7 million in 2005, a decrease of 0.9 per cent since the last biennium, as reflected in the table II.6. That slight decrease was in line with a parallel trend in total net income (-0.3 per cent). The allowance for doubtful accounts ($7.3 million) had decreased by 6.4 per cent since 2003.
Table II.6 Private Sector Division accounts receivable (Thousands of United States dollars)
2003 2004 2005 Variance
(percentage)
Accounts receivable 312 504 305 011 309 692 -0.9
Allowance for exchange rate fluctuation 19 155 9 578 0
Allowance for doubtful accounts 9 086 6 387 7 265
Net accounts receivable 284 263 289 046 302 427 +6.4
Contributions receivable
56. UNICEF records contributions as income in its financial statements during the year they are pledged. The amount of contributions receivable has decreased by 30.5 per cent compared with the previous biennium, from $269.1 million to $187.0 million. The ratio of contributions receivable to contributions received has also decreased from 8.7 to 3.9. The decrease of accounts receivable was partly due to UNICEF’s recovery policy, which encouraged third parties to pay in advance to reduce the cost recovery charged to programmes. UNICEF has also made some progress on the monitoring and recovery of receivables, which resulted in the clearing of the 55 per cent of $240.9 million supplementary resources receivables reported in July 2005.

A/61/5/Add.2
06-42517 20
57. The Board reviewed a sample of four contributions receivable from 2005, amounting to $21.198 million (13 per cent of 2005 contributions receivables) and found that the recording and follow-up of recent contributions were in order. The Board also tested five long-outstanding contributions receivable amounting to $0.641 million (11.5 per cent of contributions receivables pre-dating 2003). In the first case ($0.016 million), no action had been taken since the end of 2002. In the second case ($0.208 million), no action had been performed until 2005 on the receivable dating from 1989. For the third case ($0.025 million), UNICEF was uncertain whether the amount had been paid. In the fourth case ($0.194 million, dating from 2003), as it was a locally negotiated contribution, UNICEF headquarters had no feedback concerning the implementation of the project. Finally, for the fifth case ($0.197 million) a write-off of that receivable outstanding since 2002 was requested following the Board’s testing.
58. UNICEF agreed with the Board’s recommendation that it conduct a comprehensive analysis of long-outstanding contributions receivables and take appropriate action.
7. Updating the UNICEF finance and accounting manuals
59. UNICEF had no consolidated and updated accounting manual. Book M, volume 1, Headquarters Accounts Manual had not been updated since the new information technology system was implemented in 1999. There was a risk that accounting staff would rely on the systems controls without sufficient awareness of the principles, regulations and rules that led to its design.
60. The Private Sector Division finance manual had not been updated since 1995, considering that the fiscal period changed in 1997 and the financial data processing system in 1999. The manual had yet to be updated by March 2006, although UNICEF had indicated in March 2005 that the task would be completed by the last quarter of 2005.
61. Similarly, UNICEF had yet to update the financial regulations and rules of the Private Sector Division (still entitled “Greeting Card Operation special supplement”). UNICEF had indicated in March 2005 that updates and required changes for the Private Sector Division supplement to regulations and rules were currently being identified by a Private Sector Division team along the evolved and updated Private Sector Division accountabilities and business processes, and that they would be duly discussed and reviewed with the Division of Finance, Administration and Management. However, that revision was still pending as at March 2006.
62. UNICEF agreed with the Board’s reiterated recommendation that it revise its manuals and the special supplement to its Financial Regulations and Rules.
8. Write-off of losses of cash, receivables and property
63. UNICEF wrote off $12.5 million in cash, accounts receivable and other assets, a decrease of 24 per cent from the amount of $16.4 million for the previous biennium. It comprised $9.8 million in contributions and other receivables, $2.5 million in stock write-off and $0.1 million in other assets.
64. An amount of $5.4 million in obsolete inventory and in prior years’ accounts receivable was written off against Private Sector Division income over the

A/61/5/Add.2
21 06-42517
biennium. UNICEF sets aside an amount of $5 million as a provision for the write-off of National Committee accounts receivable that has already been decided. That represented a 3.8 per cent decrease over the previous biennium.
65. Every biennium the Private Sector Division sets a provision for uncollectible accounts for all outstanding receivables at a rate of 3 per cent. As at 31 December 2005, the Division had written off all outstanding receivables dating back to 2001 and 2002, of which there were few collection prospects. Nevertheless, those receivables have not been subtracted from the amounts of receivables provisioned at 3 per cent. As a result, some receivables have been both written off and provisioned at 3 per cent. That leads to an overstatement of the allowance for doubtful accounts of $29,981. Conversely, despite slim prospects of collection, accounts receivable for 2003 and 2004 ($0.52 million and $0.75 million at 31 December 2005) were provisioned only at 3 per cent. A more prudent provision of 75 per cent for 2003 amounts and 50 per cent of 2004 amounts should have been made ($0.765 million). The net effect was to understate provisions for uncollectible receivables by $0.735 million.
66. UNICEF agreed with the Board’s recommendation that its Private Sector Division review its policy on the determination of the provision for uncollectible accounts receivable and ensure that it excludes written-off receivables from provisions for uncollectible receivables.
9. Ex gratia payments
67. In line with UNICEF financial rule 113.9, the Administration informed the Board that there were no ex gratia payments during the biennium.
10. Management of the Private Sector Division
Follow-up of previous recommendations
68. In its report for 2002-2003,3 the Board noted that the net income of the Private Sector Division had increased by 38 per cent between 2000-2001 and 2002-2003, to $462 million in 2003, as reflected in table II.7. That more than doubled to $1.05 billion in 2005 (a 127 per cent increase). Although regular resources stagnated, there was a sharp increase in other resources collected by the Division, in particular emergency other resources (Indian Ocean tsunami and South-East Asia earthquake).
69. The Private Sector Division’s statement of income and expenditure reflected only (a) the sales of greeting cards and other products by the 36 National Committees, in charge of the sale of UNICEF products, and by a few field offices; and (b) the share of the private sector fund-raising activities income coming from National Committees and allocated to regular resources. It did not include the share of the National Committees’ income provided to other UNICEF resources, which is reflected in statement I.

A/61/5/Add.2
06-42517 22
Table II.7 Private Sector Division income and expenditure (Thousands of United States dollars)
2003 2004 2005
2003 to 2005 variance
(percentage)
1. Gross proceeds from cards and products 151 469 161 518 145 645 (3.8)
2. Operating charges (109 902) (114 374) (98 481) (10.4)
3. Other income 5 511 8 799 16 440 198.3
4. Net operating income for products 47 078 55 943 63 604 35.1
5. Fund-raising net operating income 249 517 250 671 255 677 2.5
6. Other charges (7 179) (15 489) (30 716) 327.9
7. Net income (in financial statements) 289 416 291 125 288 565 (0.3)
8. Income, including other resources, not included in Private Sector Division financial statements 461 600 509 925 1 048 765 127.2
70. The task of negotiating and signing updated cooperation agreements with National Committees had been completed. However, as that process had been time- consuming (from 2002 to 2006 for 36 agreements to be signed with National Committees), the agreements were partly out of date. The agreements referred to the Joint Planning Process as “the primary mechanism to enable them to work bilaterally to increase revenues for UNICEF programmes and promote UNICEF’s goals”, even though the Joint Planning Process had been replaced by the Joint Strategic Planning, which used different monitoring tools. As at March 2006, only 9 National Committees out of 37 (including 2 of the 5 biggest) were covered by a signed Joint Strategic Planning agreement.
71. Provision 16 of the updated agreements mentions that all funds due to UNICEF shall be transferred in accordance with the time frame on financial reporting specified in a separate annex on financial reporting. No such annex was attached to the 8 agreements the Board reviewed (out of 36, 22 per cent). Similarly, provision 17 mentions that the National Committees’ auditors will be requested to certify national committees financial compliance with the agreements, which refer to their reporting of income and expenditure and net income transferable to the Private Sector Division. That provision was not complied with by most National Committees despite requests from the Private Sector Division, the revenue and expenditure reports of three National Committees only were certified by the National Committee auditors regarding the year 2003; for the 2004 campaign (reported in 2005), seven such reports have been certified by auditors.
72. UNICEF agreed with the Board’s recommendation that it attach an annex on financial reporting and transfers of funds to its agreements with National Committees.
Recording of income
73. In paragraph 114 of its previous report (A/59/5/Add.2), the Board recommended that UNICEF harmonize the accounting methods of the National

A/61/5/Add.2
23 06-42517
Committee’s fund-raising income. No decision had been taken on the issue by March 2006. The fund-raising income for regular resources was recorded as receivables by the Geneva office, on the basis of provisional and then final revenue and expenditure reports, while payments were received by the New York Treasury, in line with paragraph 29 of the notes to the UNICEF financial statements. The Division of Financial and Administrative Management in New York recorded the fund-raising income for other resources as income in the UNICEF financial statements when it received the actual cash payments.
74. A footnote to the Private Sector Division financial statements for 2005 indicated that the net fund-raising income excluded $760.2 million recognized as other resources, compared with $218.8 million in 2004, and stated that it is shown in the UNICEF financial statements. The Division of Financial and Administrative Management provided the amount in the footnote to the Private Sector Division, which could not be reconciled with the amount in the revenue and expenditure report.
75. The Private Sector Division operations manual (section 9) states that income from private sector fund-raising activities is recorded on a cash basis of accounting, for example, the actual amount of cash received by partners from donors during the campaign period. The exchange rate used is that of the day of the transaction. This was not the case for funds allocated to regular resources, which were accounted for on an accrual basis, at the prevailing rate of exchange on 31 December of the year of recording.
76. The Private Sector Division acknowledged that, owing to that difference, “the amount recorded by UNICEF for other resources will always be different from the amounts reported for other resources by National Committees in the annual Revenue and Expenditure Reports. As formal and consistent monitoring procedures do not exist for reported other resources there, indeed, is a gap in procedures”.
77. In May 2005, the Private Sector Division proposed to the Division of Financial and Administrative Management that it recognize all income on an accrual basis whatever its nature or source. The alternative, the recording of all private sector fund-raising income on a cash basis, would make it harder to ensure full payment for private sector fund-raising regular resources in the absence of accounts receivables. As at March 2006, no decision had been taken on that major and long-standing issue. Although the current practice was consistent with United Nations System Accounting Standards and UNICEF’s financial reporting framework, it was not conducive to a comprehensive monitoring of all sources of income.
78. UNICEF agreed with the Board’s recommendation that it harmonize the accounting treatment of private sector fund-raising proceeds.
Contribution reporting and fund-raising activities
79. The retention rate is the portion of gross proceeds kept by National Committees for their own expenditure. The contribution rate is the portion that is received by UNICEF. The total contribution rate from National Committees for sales and fund-raising has increased steadily recently, from 69.3 per cent in 2003 to 73.5 per cent in 2004 and 80.1 per cent in 2005 (provisional figures). That improvement was due partly to the surge in other resources from National

A/61/5/Add.2
06-42517 24
Committees for the tsunami and Pakistan emergencies, which raised the private sector fund-raising contribution rate from 74.6 per cent in 2004 to 81.3 in 2005.
80. Over the biennium 2004-2005, the fund-raising, greeting cards and product sales support costs represented $656.8 million, or 16.3 per cent of UNICEF’s income. Those “upstream” support costs have to be added to the support costs incurred to administer the UNICEF programme expenditure (see para. 27 above). Thus, in aggregate, 65.7 per cent of UNICEF and National Committees’ gross income is used for UNICEF programme expenditure, while support costs represent 34.3 per cent of the total. UNICEF does not usually publicize that figure, as it considers that National Committees are legally separate entities that are responsible for their own retention rates. However, the only way to satisfy the donor’s request to know what proportion of the funds that they give to UNICEF is spent on programmes is to calculate that figure and disclose it.
81. The Board recommends that UNICEF calculate, monitor and make available to National Committees the overall support costs of income and expenditure to ensure that they are appropriately explained and disclosed.
82. The total net proceeds from private sector fund-raising for 2004-2005 were $529.4 million (in accordance with note 10 to the Private Sector Division financial report for 2005) a 5.1 per cent increase over the previous biennium. After deduction of Private Sector Division fund-raising operating expenses, the net operating income amounted to $506.4 million. The increase was obtained despite a negative effect of the value of the United States dollar on the proceeds in 2005 (-2.4 per cent), which more than offset the positive effect of the fall of the dollar in 2004 (+1.4 per cent).
83. Fund-raising is a geographically concentrated resource, as table II.7 shows. Five National Committees accounted for 72 per cent of the total net proceeds.
Table II.8 Net fund-raising proceeds 2004-2005 (Thousands of United States dollars)
National Committee 2004-2005 Percentage of total
Japan 169 823 31.6
France 75 405 14.0
Netherlands 66 926 12.4
Italy 45 996 8.6
Germany 31 988 5.9
Subtotal 390 137 72.5
Others 147 779 27.5
Total 537 916 100
Nota bene: this table excludes $8.5 million of negative adjustments between provisional and final revenue and expenditure reports from National Committees for the 2003 and 2004 campaigns.

A/61/5/Add.2
25 06-42517
84. The Executive Director indicated that the effort to increase regular resources is UNICEF’s most critical fund-raising challenge. The Administration had set a target of 80 per cent of National Committee fund-raising proceeds transferred to UNICEF to be allocated to regular resources, and 20 per cent of other resources. This target excluded emergency other resources from the calculation. This proportion was only 64.3 per cent in 2002-2003, and did not increase in 2004-2005; it reached 63.7 per cent by the end of 2005.
85. The traditional distinction between private sector fund-raising regular resources and other resources had been called into question by the expansion of thematic contributions ($187.4 million for 2004 and prior years and $591.8 million for 2005). While allotted to private sector fund-raising other resources, thematic contributions shared a number of characteristics with regular resources. The projects towards which thematic contributions were raised (integrated childhood development, girls’ education, immunization plus, fighting HIV/AIDS, child protection and humanitarian response) and were defined in broad terms compliant with the goals of the medium-term strategic plan. Thematic contributions aim at providing UNICEF with the kind of flexibility that was traditionally provided by regular resources.
86. The Board recommends that UNICEF set and monitor a target for the proportion of thematic contributions within other resources, as part of its global fund-raising strategy.
Country office sales and fund-raising in emerging economies
87. National Committees currently account for 95 per cent of all UNICEF funds raised from the private sector. However, local fund-raising by country offices in countries in transition audited by the Board during the biennium showed significant growth potential. In China, UNICEF had raised over $1 million since the first experience of direct-mail fund-raising in 2001, with some signs of acceleration in 2005. In Thailand, the funds that were raised locally amounted to $1.8 million in 2002, $2.1 million in 2003, $2.3 million in 2004 and $3.9 million in 2005. During 2005, the results of the tsunami appeals far exceeded the expectations of the country office. In Thailand, approximately two thirds of the budget for the country regular programme was usually funded by its private sector fund-raising activities.
88. UNICEF agreed with the Board’s recommendation that it set and monitor targets for local private-sector fund-raising in potential high-growth country offices.
89. In Brazil, the sale of UNICEF products was decreasing continually from 2001-2004. The prices for the products sold in Brazil were set by the Private Sector Division Geneva, on a United States dollar basis. Therefore, the Brazil country office suffered from the fluctuations in the exchange rate of the local currency to the United States dollar. Texts and illustrations for the catalogue sometimes included items no longer on sale. As orders were made only once a year, the country office could not guarantee the availability for sale of successful items. That practice could result in unnecessary inventory and stock management difficulties.
90. It would technically be possible to print greeting cards locally, which may reduce manufacturing costs, avoid exchange rate variation risks and would provide more flexibility on the size of the orders. Although that could create difficulties

A/61/5/Add.2
06-42517 26
(quality-control, organization and skills in the Brazil country office, complexity of worldwide management by Private Sector Division Geneva), it deserved to be studied by the Private Sector Division.
91. UNICEF agreed with the Board’s recommendation that it review its supply-chain management to consider the cost-effectiveness of locally manufacturing part of its products.
11. Office of Emergency Programmes
Background
92. Over the last three bienniums, UNICEF’s emergency relief and rehabilitation income has more than tripled, from $434 million in 2000-2001 to $1.52 billion in 2004-2005, at the same time as the number and severity of humanitarian crises has increased. In 2003, UNICEF adopted a list of Core Commitments for Children in Emergencies.
93. In the first six to eight weeks following the outbreak of a crisis, UNICEF is committed to “assess, monitor, advocate for, report and communicate on the situation of women and children”, as well as conduct activities in its five priority areas (health and nutrition, education, water and sanitation, child protection and HIV/AIDS). UNICEF has also taken operational commitments that pertain to the safety and security of its staff and assets in emergencies, communication and fund-raising, human resources mobilization, telecommunications, supplies, finance and administration.
94. The Office of Emergency Programmes is in charge of strengthening “UNICEF’s capacity to effectively advocate for and assist children in emergency situations and to provide policy, technical and operations support to field offices dealing with complex emergency situations” (E/ICEF/Organization/Rev.3, 27 April 1998). In 2004-2005, its budget included $8.8 million in regular resources and $4.3 million in supplementary resources. The Office had 31 international Professional, 13 General Service and four Junior Professional Officers authorized posts.
The role of headquarter divisions in emergencies
95. The Office of Emergency Programmes has effectively contributed to strengthening the UNICEF emergency response, within the framework of a capacity building programme funded by the United Kingdom Department for International Development, from 1999, and by the European Community Humanitarian Office from 2004. UNICEF has defined a strategy to improve the speed, reliability and effectiveness of its emergency response and is in the process of implementing it. The Office of Emergency Programmes drives the implementation.
96. Although the Office of Emergency Programmes is supposed to be a catalyst for the implementation of the Core Commitments for Children in Emergencies, its specific accountabilities in that respect are not sufficiently clear. As UNICEF is highly decentralized, country offices typically provide the first response to emergency situations. Regional offices emergency officers play a back-up role to support country offices for larger-scale emergencies. For the most significant disasters, all headquarter divisions tend to be involved.

A/61/5/Add.2
27 06-42517
97. Out of 82 outputs or actions in the workplan designed to implement the Core Commitments for Children in Emergencies, only 10 (12 per cent) were assigned to the Office of Emergency Programmes on its own and 14 (17 per cent) to the Office of Emergency Programmes in conjunction with another division or office. In that latter case, no written operational procedure explained how those responsibilities were shared between divisions or described the workflows involving them. For nearly 9 outputs or actions out of 10, the Office of Emergency Programmes could rely on no specific procedure to hold other units accountable for their emergency response.
98. UNICEF stated that the headquarters emergency preparedness and response plans should take these issues into account. Those emergency preparedness and response plans had been updated by May 2006. Beyond that step, the respective accountabilities of each headquarters division in relation to emergencies were not spelled out in the strategic level document on the organization of UNICEF (E/ICEF/Organization/Rev.3), which had not been updated since 1998 and did not take the Core Commitments for Children in Emergencies into account. During the audit (November 2004), the Office of Emergency Programmes indicated that that document would be updated and submitted to the Executive Board for approval at its July 2005 session. By March 2005, the target date for approval had been moved to January 2006 and by February 2006, it had slipped further, to June 2006.
99. UNICEF agreed with the Board’s recommendation that it revise E/ICEF/Organization/Rev.3 to adapt the accountabilities of each unit to the Core Commitments for Children in Emergencies.
100. In practice, the involvement of UNICEF divisions in emergency response has been uneven. Although the Water, Environment and Sanitation Section of Programme Division was invited to meetings on emergency capacity-building projects, it was not fully involved in those projects. Since there are no water, environment and sanitation officers at the regional level, support to country offices must be directly provided by headquarters. That would be difficult if support were to be requested simultaneously by numerous country offices, as evidenced in the case of the Indian Ocean tsunami (see paras. 150 to 210 below).
101. A May 2003 review of humanitarian response capacity disclosed that, within programme expenditure on emergency and rehabilitation, figures show a notably lower level of spending on Core Commitments for Children in Emergencies in nutrition (ranging between 2 per cent in 1998 and 0.1 per cent in 2002) and water, environment and sanitation (ranging between 8 per cent in 1998 and 2 per cent in 2002). By comparison, 40 per cent was devoted to child protection and 32 per cent going to area-based programmes in 2002. UNICEF acknowledged that its emergency response was not always up to the Core Commitments for Children in Emergencies in the area of nutrition, as illustrated by the situation in Chad, the Sudan (Darfur) and Uganda.
102. Similarly, the deployment of extra international professionals to support the UNICEF presence in the Sudan did not immediately follow the identification of the needs. The crisis started during the summer of 2003 and was highlighted as a humanitarian priority at the 2 December 2003 meeting of the Executive Committee on humanitarian affairs. Yet no extra staff was deployed until one Professional had been sent to the area in March and another in April 2004. That was followed by a request for 15 extra staff received on 19 April 2004. On 27 May 2004, the Deputy

A/61/5/Add.2
06-42517 28
Executive Director declared Darfur a corporate priority in an initiated document. Only then were 33 extra Professionals sent to the Sudan.
103. Although the difficult political and security situation in Darfur posed a real challenge to deploy staff earlier, other factors also came into play. The UNICEF human resources information system is not geared towards easily identifying staff qualified and willing to take part in emergency operations. The reliability of the global web roster, which should have been used by the field to recruit staff in emergency situations, was questioned by operational managers. According to a UNICEF survey, only between 0 and 30 per cent of staff recruited in emergency situations had been identified through that roster. At the headquarters level, the Human Resources Information System did not support the type of multi-criteria searches that would have been needed to identify staff for emergencies. UNICEF indicated that it was working on the merger of the Global web roster and the Human Resources Information System to create under the SAP environment a database of staff with relevant skills, with a target date of the second quarter of 2006. By June 2006, the target had been moved to the second quarter of 2007.
104. UNICEF agreed with the Board’s recommendation that it expedite the development of its emergency “talent pool”.
105. When a humanitarian crisis erupts, UNICEF may compete with other United Nations agencies (such as OCHA, UNHCR or WFP) to identify experienced humanitarian officers for deployment. It also benefits from an average of 34 secondments per year from standby agreements with humanitarian organizations that also have agreements with other United Nations agencies. The United Nations system would benefit from a more coordinated approach to the identification of human resources for emergencies. The Inter-Agency Standing Committee would be the appropriate framework for such a topic.
106. The Board recommends that UNICEF bring the identification and recruitment of human resources for emergencies to the attention of the Inter-Agency Standing Committee.
Emergency preparedness
107. Between 2000 and 2004, UNICEF had completed 120 emergency preparedness and response plans, a 76 per cent coverage rate. By June 2006, 90 country offices had drafted new emergency preparedness and response plans, to enhance their state of readiness. As the UNICEF quantitative objectives are being reached, it may now concentrate on the timeliness of updates and the relevance of the plans. Feedback from the field underlined the fact that emergency preparedness and response plans were not systematically used in the management of emergency situations. Although the process of drafting such a plan raised awareness and helped build capacity in the field, the existing plans were not sufficiently operational as crisis management tools, whether in the area of human resources mobilization, supply and logistics or financial management. UNICEF needed to ensure that all of its emergency preparedness and response plans met a set of minimum quality standards in those areas.
108. The Board recommends that UNICEF establish and monitor the implementation of quality standards for emergency preparedness and response plans.

A/61/5/Add.2
29 06-42517
The operations centre
109. UNICEF had been operating an operations centre, open 7 days a week, 24 hours a day, since the Kosovo refugee crisis in 1999. The UNICEF operations centre employed 10 staff members and cost $1.2 million to run in 2005. At the time of audit, the only other centre that operated 24 hours a day within the United Nations system was that of the Department of Peacekeeping Operations, although the Department of Safety and Security also intended to create its own centre. The UNHCR and WFP situation rooms did not operate on a continuous basis, and OCHA used its Geneva and New York offices to cover a wide range of time zones but did not maintain a centre that is open 24 hours a day. UNICEF reported that work was under way to develop the exchange of information among United Nations agencies, to reduce duplication and increase effectiveness through more focused analysis and output. However, the option of sharing a single operations centre with other United Nations entities had not been considered.
110. UNICEF agreed with the Board’s recommendation that it consider sharing its 24-hour operations centre with other United Nations agencies.
12. Supply Division
111. Procurement expenditure increased by 55 per cent over the previous biennium, to $1.936 billion, excluding the Global Alliance for Vaccines and Immunization. The part handled by the Supply Division amounted to $1.472 billion (76 per cent). The Division, based mainly in Copenhagen, oversees procurement for UNICEF and operates a large central warehouse. It also manages procurement on behalf of United Nations agencies, Governments and non-governmental organizations.
Emergency procurement
Background
112. Offshore emergency procurement increased from $12.7 million in 2000 to $44.6 million in 2004 and $72.0 million in 2005. Emergency local procurement (as opposed to international, or “offshore” procurement) went up from $12.2 million in 2003 to $20.8 million in 2004. Figures for 2005 were not available. In 2003-2004, 47.9 per cent of the emergency local orders were created after the target arrival date of the items. Furthermore, 10.4 per cent of those orders were issued after the actual delivery of the goods. The Supply Manual states (Book G, 7.6.8) that, in principle, that should not occur. Notes for the record should document exceptional purchase orders issued after the event. Such a practice poses a significant risk of non-compliance with regulations and rules.
113. UNICEF agreed with the Board’s recommendation to monitor more closely the target arrival date of emergency local orders and the date of their issuance.
Emergency organization and procedures
114. The UNICEF Supply Division emergency preparedness and response plan, prepared in 2003 and updated in March 2004, aims to maintain the ability to send emergency supplies within 24 to 48 hours and to maintain a sufficient contingency stock. The number of beneficiaries or of days of stock to be kept has not been

A/61/5/Add.2
06-42517 30
specified in that plan. The emergency preparedness and response plan identifies the emergency actions of each Supply Division unit as well as the goals they should integrate into their working plans. However, the role of the Emergency Coordination Unit has not been defined. As at audit date, staff members in charge and implementation dates were not specified.
115. UNICEF agreed with the Board recommendation that it update the Supply Division’s emergency preparedness and response plan.
Emergency supply planning
116. Emergencies may have an unexpected impact on the demand for supplies; some degree of anticipation can be achieved for ongoing emergencies, recurrent natural disasters or dual-use items (also used in non-emergency situations). Two processes should have helped the Supply Division to adapt its response to anticipate demand for emergency or dual usage items. However, neither of the two processes was entirely effective.
117. Following a 1998 set of recommendations to improve its response to children in unstable situations, UNICEF initiated an internal capacity-building process supported by the United Kingdom Department for International Development. Each field office was encouraged to produce an emergency preparedness and response plan. In practice, the passages devoted to supply and logistics issues in emergency preparedness and response plans were not always detailed enough for those documents to be operational for the Supply Division in an emergency situation. The Emergency Coordination Unit and the Customer Services Centre had no access to those plans but did not consider them operational.
118. UNICEF agreed with the Board’s recommendation that it set and enforce quality standards for the supply and logistics components of emergency preparedness and response plans.
119. The Supply Division has a supply-planning module in ProMS, the integrated information system used by field offices. In 2002-2003, it made an effort to increase the quality and quantity of supply plans, by involving both supply and programme staff under the supervision of the country representative. Guidelines and tools were issued to assist country offices in using supply inputs for planning (for instance Executive Directive dated 12 March 2003). The Supply Division created an environment in ProMS that integrated supply planning into the annual project planning. The Supply Manual (Book G) was updated accordingly. As of February 2006, the module was used to anticipate some announced peaks in demand for dual-use items.
120. However, the proportion of field offices using the module (around 50 per cent according to UNICEF) was still too low to consistently provide reliable forecasts. Of the 11 country offices visited by the Board during the biennium, 4 did not prepare adequate annual supply plans in a timely fashion.
121. UNICEF agreed with the Board’s recommendation that it increase the proportion of field offices using the supply-planning module by further awareness-raising and training efforts.

A/61/5/Add.2
31 06-42517
UNICEF emergency stocks
122. A study of UNICEF emergency warehousing and logistics needs carried out in 2002 identified four locations best suited as potential regional hubs: Sharjah, Panama City, Bangkok and Johannesburg. At a 2003 consultation on the UNICEF humanitarian response, UNICEF decided to outsource those warehousing functions to the private sector or, in Panama, to the International Federation of the Red Cross and Red Crescent Society.
123. The Johannesburg hub was opened in October 2003, followed by the Sharjah hub in June 2004 and the Panama hub in 2005. Overall, this policy should allow UNICEF to cater for the needs of 320,000 people within one or several emergencies. The list of “approved emergency items” on the basis of which these stocks were accumulated was defined in 2002. Some items are warehoused, while others are available at short notice from suppliers. The list was compiled mainly by considering the nine preceding years, the cost and the shelf life of the items. It has not been revised since then. Neither the overall population coverage targets nor the procedure used to define the optimal stock levels are featured in the Supply Division emergency preparedness and response plan.
124. UNICEF agreed with the Board’s recommendation that it update the list of approved emergency items.
125. UNICEF Financial Regulations and Rules require competitive bidding for all purchases. However, under financial rule 112.29, point C, competitive tendering can be waived under circumstances such as emergency situations that do not permit the delay attendant upon the issuance of invitations to bid on requests for proposals of the reissue thereof in cases where such solicitation has failed to achieve satisfactory results. The Supply Division reported that it had not used that clause since 2003.
126. The screening of product specifications and potential sources follows the same procedures as for standard procurement. The Supply Division uses by order of preference, suppliers with long-term arrangements with UNICEF or other United Nations organizations, qualified sources in its Vendor Master or any suitable company identified through a quick market survey, including unsolicited offers.
127. A list of “Approved Emergency Items” covers offshore procurement, with 102 items, 94 per cent of them through long-term arrangements at the time of audit. Out of over 1,700 items in the Supply Division catalogue, 1,157 are available through long-term arrangements or about 68 per cent. Long-term arrangements were created to speed up procurement. They guaranteed UNICEF a ceiling price, without committing the organization to a specific supplier or volume of purchases. The Board’s tests found that long-term arrangements effectively protected UNICEF from the price increases that typically occur at the time of major emergencies. Long-term arrangements were tailored to fit the needs identified in the list of “approved emergency items” dating back to 2002, and may therefore also be outdated.
128. UNICEF agreed with the Board’s recommendation that it revise long-term arrangements with suppliers after updating its approved emergency items list.
Assessment of the timeliness of emergency deliveries
129. The Quality Assurance Centre issues a monthly report with indicators generated by the Warehouse and Logistics Centre such as the percentage of supplies

A/61/5/Add.2
06-42517 32
delivered at port of entry within the requested target arrival date, or of emergency response supplies delivered within 48 hours. The Supply Division stated that “95 per cent of the deliveries” were “on target”. Yet the Warehouse and Logistics Centre indicated upon request from the Board that the 48-hour key performance indicator for emergency response was a subjective assessment by its staff, and that there was no method to measure its actual performance for rapid response. While UNICEF had committed itself to delivering within 48 hours of major, acute emergency requests, it did not monitor the implementation of that target.
130. UNICEF agreed with the Board’s recommendation that it assess the reliability and accuracy of the Supply Division’s key performance indicators, such as delivery within 48 hours for acute emergencies.
Financial controls and information systems
Segregation of duties
131. Under United Nations financial rule 105.4, “all commitments, obligations and expenditures must first be signed (“certified”) by a duly designated certifying officer. Following certification, duly designated approving officers must then sign to approve the establishment of obligations and the recording of expenditures in the accounts and the processing of payments”. Financial rule 105.6 and financial circular number 34 state that “the certifying officer should not be the same person as either the authorizing or approving officer”.
132. For invoices of a monetary value of $50,000 or more, the accounting officer in charge of certifying a payment was also the one who approved it. That practice was not compliant with financial circular 34 or rule 105.6. The Board examined a sample of 36 purchase orders totalling $67 million, or 7.8 per cent, of 2005 purchase orders placed by the Supply Division. The sample was unsatisfactory: 84 per cent of payments (in value) were non-compliant as approved by the certifying officer. In many cases, the approving officer no longer signed, as he had already signed as certifying officer.
133. UNICEF agreed with the Board’s recommendation that it comply with rules regarding the segregation of duties between certifying and approving officer.
Implementation of the enterprise-resource planning
134. The user profile in SAP did not support an appropriate segregation of duties. For example, the Vendor Creation Unit was composed of two officers, whereas 18 users had a vendor creation authorization in the system. There was a centralized unit (one officer) of material master creation in the UNICEF Supply Division, whereas 52 users had the material master creation authorization in SAP. Four users had access to purchase order creation, goods receipt and invoice creation simultaneously. That pattern of authorization was not compliant with basic segregation of duties. This situation created serious IT security risks and urgently had to be corrected. However, the Board has verified that of a sample of 12,403 purchase orders issued in 2005, no single user created purchase orders, received the goods and created the relevant invoice.

A/61/5/Add.2
33 06-42517
135. UNICEF agreed with the Board’s recommendation that it regularly review all user profiles in SAP to ensure an adequate segregation of duties.
Development of electronic scales in partnership with a private enterprise
136. A contract was signed in 1992 between UNICEF and a supplier for the development and manufacture of a scale for use in primary health-care programmes. The scale was supposed to make the weighing of children and women easy because small children would be weighed while being held in their mothers’ arms. The inventor of the technology had licensed the product to UNICEF in 1990. A Member State had paid the licensing fee on behalf of UNICEF. At the time, UNICEF had no guidelines on investments in research and development.
137. Under the contract, UNICEF was required to make advance payments, which amounted to a total of about $2 million. The advance payments were to meet the costs of re-equipping the plant used to produce the scales; they constituted part of the purchase price of the scales but could also be characterized as UNICEF’s investment in the production of the scales. The contract provided for the delivery of 400,000 scales, at a rate of 50,000 a year for eight years, with an option for an additional 100,000.
138. The introduction of the scale in the programme activities was difficult, owing to problems of corrosion of the batteries because of contact with humid atmospheres. In 1997, the total delivery was reduced to 200,000 scales, at a rate of 25,000 per year for the remaining quantity. In 1998, an agreement was reached to improve the performance of the electronic module with a newer “Class-S-Scale”. The Supply Division shipped only “Class-S” scales to the field, starting in 1999.
139. The earlier model scales, still in quarantine in the UNICEF Copenhagen warehouse in February 2005, totalled 27,321 units, valued at $2.27 million. Discussions with the supplier failed to find a solution. The write-off of these scales was decided at the 24 July 2001 Property Survey Board meeting, and should have been included in the 2000-2001 financial statements; it eventually occurred in 2002-2003 ($1.10 million) and 2004 ($1.18 million).
140. In addition, UNICEF gradually found that neither the original forecast of 50,000 units per year nor the revised one of 25,000 units per year were proper targets. Deliveries to the warehouse were only 18,750 in 2001 and 11,542 in 2002. At the end of the programme, the total advance from UNICEF still pending recovery on the delivery of scales amounted to $1.12 million, which was also written off.
141. UNICEF agreed with the Board’s recommendation that it issue a guideline on investments in research and development to avoid the recurrence of advance payments for untested or faulty items, and to improve demand forecasting.
142. The contract with the supplier had been drafted in terms that did not sufficiently safeguard the interests of UNICEF and had not been submitted for review to the Senior Adviser (Legal). In the contract, by exercising in 1997 the option to decrease the initial purchase and delivery obligations, UNICEF had forfeited its right to recover or claim repayments of the amounts outstanding on the advance payment, even though 27,321 units were faulty and quarantined.
143. The contract contained a paragraph that stated that the supplier had to repair or replace any faulty scale reported by UNICEF. Yet agreement was reached that it

A/61/5/Add.2
06-42517 34
would replace every three faulty scales by two S-class scales. That unfavourable outcome was the result of the poor drafting of the contract and the lack of legal review.
144. The Board recommends that UNICEF adopt and implement a policy that would require contracts involving significant financial commitments to be submitted to the Senior Adviser (Legal) for clearance.
145. Thirteen years after the inception of the scale project, the final cost has therefore been $3.48 million in write-off of assets over the years.
China country office supply section
146. The China country office supply section has processed $16.9 million of procurement in 2005, as against $8 million in 2004. Owing to the changes that China has experienced, the nature of activities undertaken by UNICEF has also progressively changed, away from direct implementation and supply assistance, towards more technical assistance for policy developments. Therefore, the volume of procurement carried out for the China country programme has decreased from $4.3 million in 2003 and $3.1 million in 2004 to $2.4 million in 2005. During the same period, because of the progressive improvement of the local supply market, the Office has been called upon increasingly to process procurement for other UNICEF field offices. In 2004, 92.5 per cent of the $8 million of procurement processed by the China country office (of which $4.9 million or 61.2 per cent was shipped to other countries) was locally sourced.
147. In 2003, 36.7 per cent of the $4.7 million in supplies was for 12 consignees in the region and the field. The total purchases increased to $4.9 million in 2004 and $14.5 million in 2005, including $1.4 million for the Democratic People’s Republic of Korea, and $13.1 million for tsunami-affected countries. The largest purchase consisted of clothes and hygiene kits sent to Sri Lanka and Thailand, following a post-tsunami request on 4 January 2005.
148. As the nature of the China country programme has evolved, the country office’s supply section has also been increasingly working for Supply Division headquarters, on the local sourcing of vaccines, anti-malarial drugs, school-in-a-box kits and long-lasting insecticide treated nets. That situation might prove unsustainable in the long run, as no service charge or cost recovery is levied on the UNICEF offices that use those services provided, at a cost for itself, by UNICEF China. Conversely, the decline in the needs for supplies of the China country programme might be such that the section’s new activities could be absorbed within existing resources.
149. The Board recommends that UNICEF review the sustainability of the increase in procurement activity of the China country office on behalf of other country offices.
13. The Indian Ocean tsunami
Background
150. On 26 December 2004, a 9.0 magnitude undersea earthquake occurred off the west coast of the northern Indonesian island of Sumatra. The quake initiated a series of massive tsunamis, up to 10 metres in height, which subsequently devastated

A/61/5/Add.2
35 06-42517
coastal towns and villages across South and South-east Asia. According to official estimates, over 227,000 people were reported dead or missing, 1.8 million people were displaced and losses amounted to an estimated $9.9 billion.6
151. The Board visited UNICEF country offices in India, Indonesia, Sri Lanka and Thailand, as well as the UNICEF Supply Division to review their responses to the tsunami. The Board relied on the Office of Internal Audit’s assessment of the UNICEF response in the Maldives, Indonesia and Sri Lanka (internal audit visits in the latter two country offices took place four to five months prior to the Board’s visits), as well as the two regional offices and seven headquarters divisions that had been involved in it. The Board did not review the tsunami operations in Malaysia, Myanmar and Somalia, which received $19.4 million or 2.9 per cent of funds.
Income
152. UNICEF requested $144 million for six months as part of the 6 January 2005 Indian Ocean flash appeal. That amount was increased to $152 million in April 2005 (midterm review), and to $326.2 million a month later, to cover operations for one year. UNICEF also indicated that it needed funds to cover its rehabilitation and reconstruction programmes in addition to flash appeal amounts, although estimates of these needs varied over time. By 24 January 2005, total project implementation needs were estimated at $300 million through the end of 2007, whereas projections of funds to be received totalled $345 million. The Executive Director requested that no new initiatives be undertaken to raise funds for the tsunami-affected region, although events already planned could go ahead. Governments would no longer be approached by UNICEF for the tsunami.
153. By 14 March 2006, projected receipts reached $550 million ($517 million programmable). UNICEF wrote to National Committees that the latest expenditure projections are based on similar figures, and have been confirmed by field offices. That implies that UNICEF has the capacity to implement that amount and that it is the maximum amount needed for that emergency, as foreseen at that point. UNICEF requested National Committees to refuse conditional donations and to ensure that any contributions received are “allocated in the most flexible manner, e.g., thematic humanitarian funding (i.e., funds free to use for any tsunami-related purpose and in any tsunami-affected country of our choice).
154. On 27 April 2005, projected receipts amounted to $653 million. UNICEF then wrote to National Committees that “while the assessments of rehabilitation and reconstruction needs are not fully completed, we have a thorough enough understanding of the likely roles that UNICEF will play in these activities to confirm that with the amounts on hand we have sufficient monies to finance our foreseeable work in the aftermath of the disaster”. Therefore, “NOW we need to STOP accepting all funds which are earmarked for the tsunami”.
155. UNICEF requested that, if possible, the funds be reallocated to other emergencies. In most cases, that was not possible as the funds were received for the specific tsunami appeals launched by the National Committees. Some National Committees continued to appeal for tsunami funds after April in spite of the request to the contrary. UNICEF was not successful in convincing them of the need to stop tsunami fund-raising, and decided not to widely communicate its decision to stop
__________________
6 TEC, USAID, AFP, IRIN, UNICEF Office of Evaluation.

A/61/5/Add.2
06-42517 36
new fund-raising initiatives from January 2005 and accepting further donations from April 2005.
156. Overall, as at 24 May 2006, the funds received totalled $672.3 million, three quarters of which came from UNICEF National Committees and 22.3 per cent from Governments (the balance came from the United Nations, field-office private-sector fund-raising and international non-governmental organizations). At the same time, during 2005, a number of UNICEF emergency appeals were less than 50 per cent funded, such as the appeals for the Sudan ($328.3 million requested, only 34.7 per cent funded), Côte d’Ivoire ($15.9 million requested, 22.6 per cent funded) and Eritrea ($13.1 million requested, 34.6 per cent funded). The contrast between the tsunami operation and these other emergency operations should be an incentive for UNICEF to review its relationships with National Committees. The risks would be for them to continue providing a disproportionate amount of funds for causes that spontaneously attract donor sympathy while not focusing sufficiently on providing funds for less well-received emergencies.
157. UNICEF agreed with the Board’s recommendation that it review its relationships with National Committees in the light of the experience of the tsunami fund-raising.
Expenditure
158. Field offices that have taken part in the tsunami response have not recorded emergency programmes in a consistent and harmonized way in the ProMS software. As a result, reporting on allocations and expenditure for the flash appeal or other tsunami-related projects requires a time-consuming and potentially error-prone manual processing. The Board thus identified a number of discrepancies between headquarters and field office figures with regard to the breakdown of expenditure per flash appeal sector (the overall amount did, however, match). UNICEF undertook to reconcile those discrepancies and had yet to report to the Board on the results of that exercise.
159. UNICEF agreed with the Board’s recommendation that it provide guidance to field offices on the appropriate method to structure emergency programmes for reporting purposes.
160. The level of expenditure seems particularly low for Indonesia compared with the allocations, as reflected in the table II.9. That results from the fact that, initially, all the contributions earmarked for Indonesia were allocated to that country office for expenditure during 2005, whereas its tsunami programme had to be spread out over a number of years. Other offices did not receive the totality of their allocation for future years in 2005.

A/61/5/Add.2
37 06-42517
Table II.9 Expenditure on tsunami projects in 2005 (Millions of United States dollars)
Allocation (1) Expenditure (2)(2)/(1)
(percentage)
Indonesia 241.3 84.8 35.1
Sri Lanka 65.6 56.3 85.8
Maldives 31.7 22.4 70.7
Thailand 8.2 7.0 85.4
India 17.4 14.5 83.3
Other countries 19.4 7.1 36.6
Regional offices 4.8 4.2 87.5
Headquarters 4.5 4.4 97.8
Total 392.9 200.7 51.1
Source: Country offices, Office of Internal Audit reports, Cognos management information reports. The total is not equal to overall tsunami income as $40.1 million have been set aside for support costs as part of the cost recovery process, including $14.6 million in 2005. Resources have also been allocated for future years. “Other countries” include Malaysia, Myanmar and Somalia.
Emergency preparedness
161. Up-to-date, reliable and concrete emergency preparedness and response plans would have greatly assisted the affected country offices. According to the UNICEF programme, policy and procedure manual, all offices are requested to develop such a plan and keep it updated. Although all the offices involved in the response had drafted an emergency preparedness and response plan, none was fully satisfactory. They lacked three key elements to be truly operational: a clear human resources mobilization plan, lists of essential supplies and an emergency in-country logistics plan.
162. Knowledge of existing plans was also variable. For instance, in Indonesia, some staff were not aware of the existence of the emergency preparedness and response plan, while in Thailand the staff was not sufficiently trained in the details of the plan. In practice, the offices placed little reliance on the existing plans and addressed problems for the most part on an ad hoc basis.
163. UNICEF agreed with the Board’s recommendation that it review its guidance on emergency preparedness and response planning to ensure that critical areas such as human resources and supply are covered in sufficient detail.
164. Although regional offices had provided assistance to the affected countries in 2004, they had not ensured that the emergency preparedness and response plans were sufficiently concrete to be of real assistance.
165. UNICEF agreed with the Board’s recommendation that regional offices regularly monitor the status and quality of country office emergency preparedness and response plans.

A/61/5/Add.2
06-42517 38
Assessment of needs, its links with requests and allocation of funds
166. The rapid assessment of the situation of women and children affected by the tsunami represented a massive challenge that had to be carried out in difficult circumstances. UNICEF staff performed well in the initial stages of the disaster, providing useful data that was fed into situation reports produced within hours of the disaster. However, the Office of Internal Audit found that UNICEF lacked standard assessment tools and guidance to support a consistent approach to rapid assessments and ensure comprehensive coverage and quality of assessment data. Only the Sri Lankan country office developed standard assessment templates to ensure data comparability. However, they were not systematically used in the field.
167. Since the tsunami, UNICEF had issued an updated emergency field handbook (July 2005), which addresses the conduct of initial assessments. It also developed a draft manual for rapid assessment, which could be beneficial to other United Nations agencies engaged in humanitarian activities, as they have yet to agree on a common rapid assessment methodology.
168. UNICEF agreed with the Board’s recommendation that it finalize the development of its “rapid assessment manual” and share it with members of the Inter-Agency Standing Committee to form the basis of a common methodology.
169. The core commitments to children in emergencies required country offices to produce expanded assessments within the first six to eight weeks following the disaster. They were not produced in India, Sri Lanka or the Maldives. As the Sri Lankan office chose to rely on the numerous assessments already available from other sources to avoid duplication, its coverage of the issues within the UNICEF mandate was not comprehensive (lack of gender-disaggregated data) and the various sources of data used could not be reliably consolidated.
170. UNICEF agreed with the Board’s recommendation that it assist country offices to ensure that they produce an extended assessment in compliance with the core commitments to children in emergencies.
171. The process that led to the allocation of funds to field offices resulted from the combination of the assessment of needs and the availability of funds. UNICEF decided that any funds received for the tsunami above and beyond the flash appeal amounts would be spent in a time-span of two to five years. However, that was not consistently based on a multi-year planning process. Whereas Sri Lanka developed an overall three-year plan in April 2005, neither Indonesia nor Maldives drafted similar plans.
172. The combination of flash appeal amounts and rehabilitation and recovery funds far exceeded initial assessments of needs. In Sri Lanka, the final draft of the UNICEF contribution to the flash appeal, dated 2 January 2005, requested $24 million. The next day, the figure had been doubled, to $47.8 million. The eventual allocation was $170.4 million as at 24 May 2006, 7 times the initial assessment and 3.6 times the initial flash appeal amount. Similarly, the allocation to Indonesia ($284.6 million) represents 5.6 times the amount of the initial flash appeal ($50.4 million). The equivalent ratio is 2.5 for India (the February 2005 funding proposal was $11.5 million), and 2.4 for Maldives.

A/61/5/Add.2
39 06-42517
173. Admittedly, the generosity of the public has been exceptional and, as such, difficult to accurately predict. UNICEF indicated that it had worked in the tsunami-affected countries prior to the disaster and “will continue to work in these countries after the initial emergency phase is over. It is therefore understood that UNICEF would need funding beyond the emergency phase to cover its rehabilitation and reconstruction programmes”.
174. It also highlighted that the majority of the tsunami funding (about 55 per cent) took the form of thematic humanitarian funding, which allowed it to be spent during a three-to-five-year period following the disaster. The willingness of donors to direct their funds towards that more flexible type of funding reflected effective advocacy by UNICEF.
175. By accepting funds earmarked for the tsunami that far exceeded initial and revised requests from the field without benefiting from comprehensive multi-year budgets based on fully developed workplans, UNICEF took some risks. They included the risk that actions would need to be targeted to indirectly affected or unaffected communities. There was also a risk that the UNICEF absorptive capacity (as well as that of local contractors and suppliers) would not be equal to the challenge of effectively and expeditiously managing recovery programmes on such a scale. Both risks could have an indirect impact on the reputation of UNICEF with donors and beneficiaries, whose expectations were commensurate with the exceptional level of funds accepted.
176. UNICEF agreed with the Board’s recommendation that it produce comprehensive multi-year budgets and workplans for utilizing funds received in excess of initial requirements.
Contributions management and donor reporting
177. UNICEF allocated $26.9 million of funds to affected field offices and kept a detailed record of each allocation decision. The first funds were sent to Sri Lanka and Maldives on 29 December 2004 and to Indonesia the next day. Donor conditions were accurately recorded and passed on to field offices.
178. Beyond the initial phase, decisions taken for the allocation of thematic humanitarian funding earmarked for the tsunami were made on the basis of the degree of funding of the flash appeal for that country, information contained in situation reports and other sources and projections on likely available funding per country. The flash appeal targets were used as guides for the allocation of funds to the affected countries with no formal or explicit assessment of the relative needs of the country offices, beyond the initial rapid assessment made to support the flash appeal. That guide was used to allocate funding above and beyond initial flash appeal amounts.
179. UNICEF agreed with the Board’s recommendation that it allocate emergency funding to field offices in the context of appeals or other validated plans.
180. UNICEF decided to extend its assistance not only over time, but also geographically and thematically, to include indirectly affected communities, in order to avoid creating tension between beneficiaries and neighbouring communities. That approach also resulted in a higher implementation rate of the funds received, in a

A/61/5/Add.2
06-42517 40
context in which a great number of humanitarian organizations were present in the field.
181. In Sri Lanka, that district-wide approach represented between 9.5 and 17.8 per cent of expenditures, depending on the sector, between May and December 2005 (earlier data was not available). Some projects excluded from the district-wide approach were not directly tsunami-related either. For instance, a $23.4 million water scheme programme included a $5.3 million project whose objective was to “augment water supply” — although it was located in an affected district, the water network itself had not suffered damage from the tsunami. The project had been added to the programme in July 2005, even though it did not feature in a February water and sanitation assessment of needs and workplan. UNICEF also agreed to provide $1.2 million to a non-governmental organization over a two-year period to look after unaccompanied minors, separated children and children who had lost one parent as a result of the tsunami. The implementing partner was unable to indicate the exact number of tsunami-affected children who were taking part in its programmes and had in fact lost track of most of them.
182. The Board reviewed a sample of six donation files for Sri Lanka, representing $36 million that were used at least partly to fund the district-wide approach, to determine whether donor conditions were compatible with that approach. One file contained an explicit indication that the donor left it to UNICEF to determine where funds were most needed. None of the other files contained any indication that the donor had approved the use of funds for projects that were not directly tsunami-related. In one case, a report sent to the donor made it clear that the remaining balances would be used for the district-wide approach, but the donor’s consent to that effect was not documented in the file.
183. UNICEF agreed with the Board’s recommendation that it systematically seek explicit donor approval to extend or modify the geographic or thematic reach of funds with which it is entrusted.
Human resources mobilization
184. Given the size of the human resources challenge created by the tsunami, UNICEF performed adequately in terms of quantity and quality of staff recruited. By September 2005, 450 persons had been deployed at least for some period to the tsunami-affected areas, some of them taken from a pool of 700 spontaneous applications received as a result of the tsunami.
185. However, there was excessive turnover of staff deployed on surge support missions to fill key positions. For instance, in the first half of 2005, six staff members acted as the main resource for human resources issues in Sri Lanka, while five people dealt successively with supply and logistics in the Maldives. The impact of the turnover was compounded by inconsistent procedures to identify the skills and experience of short-term staff before clearance, and poor handover procedures. The forthcoming review of human resources should address that issue.
186. UNICEF agreed with the Board’s recommendation that it include the management of emergency surge capacity in its strategic review of human resources.
187. UNICEF field offices also recruited a significant number of fixed-term and temporary fixed-term staff as part of the tsunami response. For instance, 98 posts

A/61/5/Add.2
41 06-42517
were created for Indonesia, 78 for Sri Lanka, 14 for Thailand and Maldives. The time frame for that recruitment was not quite satisfactory. In Indonesia and Sri Lanka, the majority of arrivals occurred between four and nine months after the tsunami. In Thailand, all the temporary fixed-term staff was recruited over nine months after the disaster. The temporary fixed-term recruitment procedure proved particularly cumbersome in an emergency context, characterized by strong competition between agencies for qualified candidates.
188. UNICEF agreed with the Board’s recommendation that it include the recruitment process of temporary fixed-term staff for emergencies in its strategic review of human resources.
Procurement and supplies management
189. The affected offices’ flow of supplies increased on average tenfold in the aftermath of tsunami. That created significant risks in terms of effectiveness (timeliness and adequacy of supplies), safeguarding of UNICEF’s financial interests and compliance with regulations and rules.
190. The Board reviewed all the offshore emergency deliveries to India, Indonesia, Maldives and Sri Lanka (there were none to Thailand) made during the initial phase of the operation, between 26 December 2004 and 11 February 2005. The deliveries amounted to $4 million and complied with regulations and rules. However, 70 per cent of the items (per value) were delivered at least one day after the target arrival date, 20 per cent more than 10 days after and 12 per cent later than 26 days after. Deliveries behind schedule were largely proportionate to the total shipped by country, except for Sri Lanka’s deliveries, which were more delayed. The Board noted in its field visits that the target arrival dates set by the offices were often unrealistic. Local processing time of purchase orders was satisfactory in Indonesia, Maldives and India, whereas it was delayed in Thailand and, especially, in Sri Lanka, where an average of 22 days was recorded between authorized supply requisition and signed purchase orders.
191. Although basic financial controls have been complied with for local procurement, the Board noted weak supply and distribution planning, as well as market searches in most of the affected countries (the UNICEF Chennai office did produce an emergency supply plan). That resulted in a number of wasteful purchases. In Indonesia, $745,000 worth of collapsible tanks were ordered in error. A total of 463 tents valued at $520,000 were also bought in excess of needs. A total of 10,000 rubber boots and 2,477 squatting plates were purchased even though they were not suited to local needs and customs, and had been left idle in the Banda Aceh warehouse for at least five months at the time of the audit in January 2006.
192. In Sri Lanka, children’s clothes, exercise books and cooking sets worth about $1 million were not used because they did not meet local needs or quality standards (the children’s clothes were in synthetic fabric and contained too many small sizes). In Thailand, the lack of a comprehensive distribution plan led to gaps and delays in the distribution of sports items and books to 100 schools, a situation that was mirrored for office supplies in Maldives.
193. UNICEF agreed with the Board’s recommendation that it improve the quality of its supply and distribution planning in emergencies in the context of avoiding wastage.

A/61/5/Add.2
06-42517 42
Management of cash assistance
194. Cash assistance represented 40 per cent of 2005 tsunami expenditures. UNICEF was therefore largely dependent on strong counterparts with adequate capacity to successfully implement its programmes while minimizing the risk of financial mismanagement. However, in Indonesia, the Office of Internal Audit identified a number of cases where counterparts lacked capacity to effectively manage funds. In Maldives, the capacity of one of the office’s main partners had not been assessed and its staff was unaware of a number of its obligations. The UNICEF Office of Internal Audit reported that UNICEF staff were often not aware of weaknesses in counterpart systems, such as poor internal financial reporting or low financial management expertise.
195. UNICEF agreed with the Board’s recommendation that it identify ways of quickly assessing and raising financial and administrative capacity of implementing partners during emergencies.
196. Standard rates had not been set for allowances for training sessions, workshops and participation in programme activities in Indonesia and Thailand. That created inequality and inefficiencies. For instance, in Indonesia, the amount paid for volunteers in child centres varied over time between $50 and $900 per month. A different rate was set for local and non-local workers, although it was not always consistently applied. That put UNICEF staff in the difficult position of having to increase payments to ensure participation.
197. UNICEF agreed with the Board’s recommendation that it use standard rates of allowances for training sessions, workshops and other activities funded by cash assistance.
198. The variation in rates also complicated the liquidation process. The Board found multiple instances of poor documentation of amendments, inaccuracies in the liquidation process and lack of sufficient oversight of implementing partners in Indonesia. In Sri Lanka, the documentation of amendments to cash assistance projects was also unsatisfactory. Advances had been paid to partners for over three months of activity, which was not compliant with Financial Circular 15, revision 2, paragraph 10. For instance, one implementing partner held $297,934 from UNICEF on its bank account as at the end of December 2005, even though it had only spent $38,841 during the first six months of the project.
199. UNICEF agreed with the Board’s recommendation that it improve compliance of its cash assistance in Indonesia and Sri Lanka with the requirements of Financial Circular 15, revision 3.
Management of construction projects
200. UNICEF is supporting construction projects for schools, health centres, and water and sanitation networks in Indonesia, Sri Lanka and the Maldives that represent an aggregate budget of $152.1 million. The three country offices had little experience, if any, overseeing major construction works. They entered into contracts with UNOPS (for the permanent structures) and the International Organization for Migration (IOM) (for temporary schools in Indonesia) without clearing their clauses with the UNICEF Senior Adviser (Legal) resulting in the interests of UNICEF not adequately safeguarded. For instance, the Indonesian school construction contract with UNOPS ($90 million) committed UNICEF to a set unit cost per building, over

A/61/5/Add.2
43 06-42517
a three-year period, with no clause covering a rise in prices. In both the Indonesian and the Sri Lankan construction contracts with UNOPS, no clause allowed penalties to be imposed on UNOPS for delays in the completion of the buildings.
201. UNICEF had supported Governments in setting up 600 temporary learning centres in Indonesia, Sri Lanka and Maldives. In Indonesia alone, the UNICEF and IOM achievement in the temporary schools construction project was considerable, as 124 units had been built in a year, despite difficult circumstances. Yet that achievement was overshadowed by two factors. Expectations had been excessively raised by the agencies, which aimed to complete 200 temporary schools in 70 days. The delays in the permanent schools project also affected UNICEF’s local reputation. UNICEF and UNOPS initially planned to complete 17 reconstructions and 4 refurbishments in 2005. Yet, at the end of January 2006, no permanent school had been completed. Two showcase schools built under special “fast-track” procedures at a cost of $438,000 for the one-year anniversary of the tsunami were not completed by 26 December 2005.
202. Initial time frames were unrealistic as UNICEF failed to set up a consistent mechanism to follow up the implementation of the projects, monitor the work of contractors and manage the relationship with UNOPS. In Sri Lanka, UNICEF agreed to let UNOPS implement directly a number of construction projects, to make up for the lack of reliable contractors. However, the procedures established for the processing of construction expenditures, and in particular for worker’s wages, were far from satisfactory. It essentially relied on trust and may expose UNICEF’s financial interest.
203. UNICEF agreed with the Board’s recommendation that it liaise with UNOPS to ensure that financial procedures for direct construction adequately safeguard UNICEF’s interests.
Contribution of UNICEF to the coordination of the response
204. UNICEF participated fully in existing coordination arrangements in the affected countries. It took part in a significant number of joint assessments and shared some of its facilities with other agencies (for instance, in the Chennai state office). It took sectoral leads in water and sanitation, education, and child protection and assisted WHO in leading the health sector. UNICEF made consistent efforts to achieve some degree of coordination in those three sectors, but met with varying degrees of success.
205. Coordination was the most effective in the child protection sector, whereas water and sanitation proved least effective and education was intermediate. According to the UNICEF Evaluation Office, the factors that proved successful in the case of child protection included timely joint assessments, common databases of information, early issuance of common standards and principles, action-oriented coordination initiatives and joint advocacy.
206. The efforts of UNICEF in the water and sanitation sector were hampered by a lack of consistent leadership in the months following the emergency, as staff turned over or there were gaps in posts being filled. It did not place sufficient emphasis on the need for a strong degree of integration with programmes carried out in the temporary and permanent shelter sectors. In Banda Aceh and Sri Lanka, numerous temporary or permanent shelter sites were selected without due consideration to

A/61/5/Add.2
06-42517 44
issues of drainage, water or sanitation. Some were provided to beneficiaries by other agencies without adequate sanitary conditions. Although UNICEF cannot be held accountable for other organizations’ failures, it did not discharge its duties as sector leader with sufficient consistency, authority or leadership. It paid the price for the absence of large water and sanitation programmes in the affected countries, and the absence of regional water and sanitation advisers in both of the affected regions.
207. UNICEF agreed with the Board’s recommendation that it review the means necessary to fully discharge its sectoral lead responsibilities for the relevant cluster in the Inter-Agency Standing Committee framework.
Meeting UNICEF programme commitments
208. The evidence reviewed by the Board showed that the UNICEF response to the tsunami in the first six to eight weeks was consistent with the programme commitments it made, both in terms of focus and breadth of coverage. That was the case both regarding the implementation of programmes in the field and the support provided by headquarters, in particular the Office of Emergency Programmes. Given the scale of the devastation and the challenges of access to the affected areas, the UNICEF staff who took part in the operation deserve credit for their very effective action.
209. The Board commends UNICEF for the compliance of its initial response to the disaster to the programme core commitments to children in emergencies despite a very challenging environment.
210. The UNICEF response was devoted to education (one third of expenditure as at 31 December 2005), health (22 per cent), water and sanitation (21 per cent) and child protection (10 per cent). Although it was too early to assess the outcome of the actions taken in the recovery period, the Board noted that UNICEF has produced outputs that were consistent with the programme core commitments to children.
14. Inter-agency coordination
UNICEF involvement in inter-agency coordination in the field
211. The importance of increased coordination between United Nations agencies was reaffirmed by the report of the Secretary-General to the General Assembly at its fifty-ninth session that “at every stage of United Nations activities, the senior United Nations official present in any given country — special representative, resident coordinator or humanitarian coordinator — should have the authority and resources necessary to manage an integrated United Nations mission or country presence so that the United Nations can truly function as one integrated entity”. The Board has reviewed UNICEF involvement in inter-agency coordination as part of its field audits in five country offices: Brazil, China, the Democratic Republic of the Congo, India and Serbia and Montenegro.
UNICEF involvement in the country coordination framework
212. The United Nations country team is in charge of strategic coordination. Pursuant to General Assembly resolutions 47/199 and 50/120, the country team was designed mainly to focus on joint programming (“review substantive activities — including draft country programmes, sectoral programmes and projects ... and ...

A/61/5/Add.2
45 06-42517
exchange experience acquired”). The Operations Management Team (OMT), which is convened at the level of senior operations officer, is the main administrative coordination body in the field. The common country assessment (CCA) and United Nations Development Assistance Framework (UNDAF) are the main tools around which inter-agency coordination should revolve in the field.
213. In Serbia and Montenegro, the Democratic Republic of the Congo and China, UNICEF regularly took part in inter-agency coordination meetings. In India, however, where UNICEF is the biggest single agency and accounts for about 40 per cent of yearly United Nations expenditure in the country (a total of about $200 million in 2004), UNICEF attended only two of the five Operations Management Team meetings that took place between January 2003 and May 2005. The very limited achievements of the Operations Management Team in terms of common services and premises may have been a contributing factor as well as a consequence of the low level of involvement of UNICEF.
214. In Brazil, the UNICEF representative (or officer-in-charge) attended only 8 of the 17 United Nations country team meetings held between September 2003 and May 2005. The minutes for the 17 meetings reflected grave concerns with regard to the poor quality of inter-agency coordination. At the 29 September 2004 United Nations country team meeting, the United Nations Resident Coordinator noted that “Brazil was still far from meeting United Nations reform targets in United Nations system coordination”. One representative emphasized “the limited knowledge agencies have of one another”. Another commented that “the UN structure in Brazil as a system has never existed and does not exist. Discussions to strengthen United Nations system coordination will not succeed if there is continued competition for cost-sharing resources”. He quoted two main institutions that competed for resources, UNESCO and UNDP, stressed that each agency had a common identity and asked how to work on overlapping areas, such as UNESCO and UNICEF. He also pointed out that so far the United Nations country team had discussed only “marginal issues and has not focused on the central themes of mandates”.
215. In October 2004, a working group on institutional diagnosis addressed issues such as overlapping mandates, United Nations image (“enhanced competition and relationship problems among United Nations system organizations have led to the deterioration of the United Nations image before national partners and the public at large”) and common services. It highlighted a controversy over exclusive mandates. A March 2005 letter from the Director of the United Nations Development Group (UNDG) pointed out that a lead agency does not mean that that agency takes the sole responsibility for the actions in that programming area. The conclusions of the working group were not officially approved, but the United Nations country team agreed to move forward with the recommendations of the working group and the CCA/UNDAF.
216. UNICEF claimed that the situation in Brazil had recently improved. A 2005 letter from the Latin American Regional Directors team gave a positive appraisal to the United Nations Resident Coordinator and the United Nations country team for its 2004 report.
217. UNICEF agreed with the Board’s recommendation that it monitor the involvement of its senior field management teams in inter-agency coordination forums.

A/61/5/Add.2
06-42517 46
218. UNICEF agreed with the Board’s recommendation that it systematically bring unsatisfactory levels of inter-agency coordination to the attention of regional directors, of the United Nations Development Group and, where appropriate, of the High-Level Committee on Management.
Common premises
219. In its resolution 44/211 of 22 December 1989, the General Assembly requested “all organs, organizations and bodies of the United Nations system to make, without delay, the necessary arrangements, in co-operation with host Governments and without additional cost to developing countries, to establish common premises at the country level, and to request the Director-General for Development and International Economic Cooperation to include in his annual reports on operational activities information on progress made in that area”.
220. None of the UNICEF country offices was located in joint United Nations premises in the countries reviewed. Although that issue had been considered in all locations, the main obstacles to its implementation were the fact that only some United Nations agencies benefited from free or preferential accommodation in accordance with their Basic Cooperation Agreement.
221. In Kinshasa, a United Nations Common House approach had so far been unsuccessful. Until 1997, UNHCR, UNDP, WFP, FAO, UNFPA, UNESCO, WHO and ILO, but not UNICEF, had shared a United Nations House. At the time of the Board’s visit (June 2005), only five agencies shared common premises (UNDP, WFP, OHCHR, OCHA and ILO). A common approach was under consideration by the United Nations country team. Similarly, the creation of a United Nations House was contemplated in Belgrade and Podgorica (Serbia and Montenegro) at the time of the audit (December 2004).
222. In New Delhi, the 18 United Nations agencies were based in 13 different locations. UNICEF and six United Nations agencies were housed free of charge in one compound. The other United Nations agencies rented their premises. Given the rent-free nature of the UNICEF premises, the creation of a single United Nations House in Delhi would probably generate additional costs. However, the consolidation of the 12 other sites into one location would certainly prove beneficial, especially if it is accompanied by more common services and combined programming. A similar situation occurred in Brasilia, where UNICEF benefited from free accommodation and had few incentives to promote a United Nations House.
223. In Beijing, the 18 United Nations agencies and their 600 staff members were housed in eight locations, including one United Nations compound which houses four agencies (UNDP, WFP, UNEP and UNIFEM) and the UNICEF premises. Although the China United Nations country team workplan for 2005-2006 included the objective of moving towards the establishment of a United Nations House in China through the consolidation and restructuring/expansion of United Nations agency locations, the United Nations country team has in fact explored less ambitious options, aiming to reduce the number of locations to six, then to three (the UNDP compound, the UNICEF compound and a third location). The Resident Coordinator indicated the view of the country team that, although a “one-building” approach was “not feasible”, the concept of United Nations House remains an objective, even if it means a United Nations compound with three locations”.

A/61/5/Add.2
47 06-42517
224. The last documented survey about the cost of leasing office space in Beijing for United Nations agencies dated from 2002. Rates ranged from $6 per square metre (UNESCO) to $16 (UNHCR). The Board conducted a survey in June 2005 for five agencies (UNICEF, WHO, UNDP, UNHCR, UNAIDS). Rates ranged from $7.80 per square metre (UNICEF) to $17.70 (WHO). UNDP, at $11, was close to the average. If the four other agencies obtained UNICEF’s conditions for the same surfaces as they are currently occupying, the yearly saving would be $181,488 dollars. The savings could be greater were a single rent-free building to be obtained for the whole United Nations family, especially if ancillary services were also shared on favourable terms. Beyond cost-savings, joint premises would also encourage informal interactions between staff members, which could lead to future joint programming.
225. The Board recommends that UNICEF, in consultation with the United Nations country team, advocate for an extension of the preferential conditions it benefits from for its accommodation in China, to other United Nations agencies.
226. UNICEF had also taken part in some attempts at sharing premises for its sub-offices. For instance, an arrangement has been found with UNDP for joint sub-offices in Sao Paulo and Manaus (Brazil). UNICEF had also been sharing its Chennai zone office with ILO since 2002. However, in that city, it has not moved to the joint premises chosen by the Resident Coordinator to house the non-governmental organization resources centre and the United Nations recovery team, following the tsunami. By contrast, in the aftermath of the 1999 Orissa cyclone, the UNICEF sub-office in Bhubaneshwar (India) had been converted into a United Nations house. Within the framework of UNDGO, UNICEF could negotiate stand-by agreements with other United Nations humanitarian agencies to ensure that, when emergencies require the setting-up of new premises or the upgrade of existing ones, joint premises would be systematically considered.
227. The Board recommends that UNICEF systematically advocate for joint premises to be considered by United Nations country teams when new or expanded premises are required in the context of a humanitarian crisis.
Common services
228. Overall, despite numerous time-consuming diagnostic exercises pointing to the potential benefits of a joint approach, the range of common services was extremely limited in the countries reviewed. In India, the Democratic Republic of the Congo and China, common services were implemented in the area of security. United Nations agencies also shared travel services in China, courier services in India, as well as a dispensary and a petrol station in the Democratic Republic of the Congo. Some bulk purchases for satellite phones and paper were initiated in Brazil, although UNICEF did not take part in the initiative as it already benefited from equivalent conditions.
229. The succession of failed attempts at establishing other common services in India was illustrative. Following a 1998 joint assessment of travel requirements and offers by UNICEF, UNDP and WHO, recommendations were issued by two working groups, in favour of one supplier. While UNICEF awarded its contract to that supplier, UNDP and WHO did not. Given the amounts involved (about $500,000 per year for the whole of the United Nations agencies based in India), this was a

A/61/5/Add.2
06-42517 48
significant lost opportunity. Conversely, in 1999/2000, following a joint assessment by UNICEF, UNDP, UNHCR, WHO, WFP, and UNFPA, the joint assessment team recommendations were issued in favour of one bank. UNICEF renewed its contract with another bank, while UNHCR contracted with a third one and other United Nations agencies selected the bank that had been recommended by the joint assessment.
230. Other initiatives were not followed up. A questionnaire circulated in March 2003 to eight agencies showed that while most of them were contracting with the same mobile phone company, only UNICEF benefited from advantageous conditions. However, there was no follow-up on this issue. In May 2003, the resident coordinator circulated a model lease agreement to ensure that United Nations agencies did not include misuse charges clauses in their leases, but that did not lead to any tangible results at the time.
231. The benefits of a greater range of common services were obvious in all the countries reviewed. In the Democratic Republic of the Congo, the banking infrastructure and the level of services could warrant a more proactive exploring of the possibility of joint banking agreements, currently non-existent. UNICEF had not obtained the same level of service as the United Nations Organization Mission in the Democratic Republic of the Congo (MONUC), the United Nations peacekeeping operation in the Democratic Republic of the Congo, which was usually given preference over other United Nations agencies for obtaining liquidities. Similarly, even though in-country cash transfers were necessary for programme implementation in areas where United Nations agencies had no offices and where there were no banking facilities, each agency had been negotiating terms and conditions independently. Operating costs and risks for both the United Nations agencies and the banks may therefore be higher than necessary; their reduction could ease liquidity constraints and promote safer and timelier cash transfers to implementing partners.
232. In China, a survey on five agencies and programmes (UNICEF, WHO, UNDP, UNHCR and UNAIDS) showed that the monthly cost of mobile phone services varied from $12 to $46, whereas annual Internet access costs ranged from $7.80 to $17.70 per person. Potential yearly savings on those two items were estimated at $18,000, on the basis of the extension of best conditions to the other four agencies. Similarly, the costs of 500 sheets of paper went from $2.78 to $4.25 (the volume of usage was not known). In all cases, the smaller agencies’ conditions were less favourable than bigger agencies, even though there were also differences within that category, as UNICEF had consistently obtained the cheapest conditions.
233. In China, at the time of the audit (July 2005), negotiations with the Government on the terms and conditions of direct recruitment of local United Nations staff were monopolizing a large proportion of the resident coordinator’s time and resources in the area of common services. The complexity of the situation had been compounded by the uncoordinated approach of UNDP to the issue. Following negotiations started in 1997, it agreed in 2001 to pay a recurrent “management fee” to the Government per local United Nations staff per month. That was a condition for the Government to allow UNDP to convert the status of government officials seconded to the United Nations into directly hired local United Nations staff. UNICEF, which had nearly 50 seconded staff members, was of the view that the fee was not compliant with the Convention on privileges and

A/61/5/Add.2
49 06-42517
immunities (article V, 18 b). Nevertheless, the UNDP agreement had set a precedent that affected most of the other United Nations agencies, including UNICEF. Since 2001, a more coordinated approach has been taken on the issue by the resident coordinator, and it was his intention, following the conclusion of the negotiations, to resume the development of other common services.
234. Recent attempts had also been made to increase the range of common services in other countries. In the Brazil 2004 annual report, the UNICEF country office noted that common services establishment was still at the very early stage. A workshop took place in May 2005 in which the way forward for further progress on common services was to be identified. A similar workshop was to take place in June 2005 in India. In the Democratic Republic of the Congo, UNICEF indicated that, following the Board’s audit, the Operations Management Team had worked on joint banking arrangements and cash transfer modalities.
235. There were two major obstacles to further progress. Small agencies stand to benefit proportionately more from the economies of scales brought about by common services than larger agencies. That reduces the incentives for large agencies to get involved in the process. Nevertheless, if they did not take part, the benefits would be substantially reduced and the United Nations system as a whole would lose out. Regional directors could be tasked with the assessment of the reality and effectiveness of the involvement of country offices, taking into account the nature of initiatives taken by resident coordinators.
236. The other major obstacle was the difficulty of achieving consensus among 20 different agencies on actions to be taken following the joint assessments. One way to overcome the difficulty was to reduce the number of players. That was the route taken by the India operations management team when it decided to restrict its membership from 15 to 7 agencies in March 2005. Another option would be for agencies to commit themselves in advance to abide by the recommendations of the joint assessment. That could be done only on the basis of guarantees on the procedure that would be followed by the assessment team to take the constraints of each agency into account to the full extent reasonable.
237. UNICEF agreed with the Board’s recommendation that it include the active involvement of field offices in the development of common services in the criteria used to assess the performance of country representatives and liaise with the United Nations Development Group Office to determine the options available to increase the proportion of common services in field offices.
UNICEF involvement in inter-agency coordination on programmes
238. Within the context of common country assessments (CCA) and UNDAF, the objective of joint programmes was to ensure a streamlined and mutually reinforcing approach of the United Nations system in favour of the achievement of Millennium Development Goals. UNDG guidelines required that the CCA and UNDAF be completed by the end of the penultimate year of the United Nations harmonized programming cycle, or at least one year before the start of a new cycle, so as to provide the basis for the agency country programmes.
239. In the case of China, whereas the CCA was produced on time (in 2004), the UNDAF was produced only in March 2005, the final year of the programming cycle. As most agencies had to produce their country programmes at about the same

A/61/5/Add.2
06-42517 50
time for the June 2005 Executive Board meetings, there was little opportunity for them, including UNICEF, to use the UNDAF as the basis for the country programmes.
240. In India, the CCA and UNDAF were initially drafted in 1999-2000. By 2004, the UNICEF office indicated that the CCA was not used as the latest resource at that time, as it was based on 1991 census data and 1998 statistics. The CCA was not replaced in 2005, with the concurrence of UNDGO, owing to the wealth of data readily available on India. Although the UNDAF was supposed to have been launched by May 2005 (after the end of the Board’s audit visit), it had not taken place by May 2006. Eight inter-agency working groups were set up following the adoption of the UNDAF (on gender, decentralization, population, primary education, rural development, water and sanitation, child labour and database), but they progressively lost momentum. They were eventually abolished in 2004, although no formal assessment of their successes and failures was made. They were replaced by a knowledge management partnership initiative, renamed “solution exchange” in 2005.
241. In Brazil, the 2002-2006 CCA and UNDAF, which had been prepared by an external consultant, were not regularly monitored by UNICEF. In its 2004 annual report, the UNICEF country office described the CCA and UNDAF as “totally useless so far”. The process leading to the preparation of the 2007-2011 CCA and UNDAF was more participatory, although the document had not yet been issued by May 2006.
242. In the Democratic Republic of the Congo, the UNICEF country programme could not be based on the country programme either. The preparation of the CCA and UNDAF was one of the objectives assigned to the United Nations country team for 2004, in accordance with its coordinated workplan. However, at the time of the Board’s visit (June 2005), the CCA had yet to be finalized while the preparation and drafting of the UNDAF was at a very early stage. Both documents were expected to be finalized by December 2005 at the earliest, which would not allow for proper harmonization with the 2006 strategic plans of individual organizations, including UNICEF.
243. UNICEF agreed with the Board’s recommendation that it liaise with the United Nations Development Group Office to identify ways of improving the timeliness and relevance of the common country assessments/United Nations Development Assistance Framework process.
244. In the Democratic Republic of the Congo, the UNICEF country office needed to find an arrangement with MONUC to ensure that the latter’s child protection activities were fully consistent with UNICEF policies.
245. The Mission’s role was not to directly implement programmes for children but to work with UNICEF, authorities and operational partners such as non-governmental organizations in the area of child protection. However, in practice, the MONUC Child Protection Section, which had 20 staff members and 30 posts, undertook a wide range of activities which would normally have fallen within the UNICEF mandate. In the few months before June 2005, it had:
• Documented serious abuses against children committed by police, armed forces and groups

A/61/5/Add.2
51 06-42517
• Referred victims to medical and legal support services
• Helped build capacity of support to non-governmental organizations
• Monitored cases before the courts
• Visited police stations and prisons to document the presence of children, liaised with non-governmental organizations with similar activities
• Gathered information about the presence of children in Congolese armed forces or groups
• Facilitated the repatriation of children associated with foreign armed groups
• Monitored how laws were applied and advocated for better child protection legislation
• Raised awareness of the risks of exploitation of children in the electoral process
246. There was a need for clarity on the respective mandates of MONUC and UNICEF within the “integrated mission” framework.
247. UNICEF agreed with the Board’s recommendation that it liaise with the Department of Peacekeeping Operations to clarify the respective mandates of UNICEF field offices and integrated peacekeeping missions in the area of child protection.
248. The Board reviewed UNICEF involvement in inter-agency coordination on HIV/AIDS in China and India. In India, the expanded thematic group on HIV/AIDS was co-chaired by the Director General of the national AIDS control organization and the United Nations Resident Coordinator. Although UNICEF did not chair the group, it regularly attended its meetings.
249. The Board reviewed UNICEF involvement in the CHARCA project (Coordinated HIV/AIDS Response through Capacity-building and Awareness), a partnership between the Government, non-governmental organizations and nine United Nations agencies (UNICEF, ILO, UNDP, UNESCO, UNFPA, UNIFEM, UNODC, WHO and UNAIDS). The project, which aims to reduce young women’s vulnerability to HIV/AIDS, has operated with a $5.6 million budget since 2004 in six districts. UNICEF is the lead agency for two districts. The Resident Coordinator stated that one of the most significant outcomes of the initiative in 2005 had been “the visibility and dialogue it has created on women’s vulnerability to HIV/AIDS at every level”.
250. However, the project’s 2004 annual report acknowledged delays in implementation, owing to general elections and to lengthy discussions on multisectoral partnerships. The cumbersome financial implementation modalities also contributed to slowing down the process. Funds were not pooled, so that cash requests had to be submitted by the country offices of each agency to their respective headquarters, for submission to the donor. Once approved, funds would be sent to the headquarters of each agency, transferred to its country office for implementation by the agency or payment of inter-agency activities. Similarly, each agency reported separately on the implementation to its headquarters, which, in turn, reported to the donors. In 2004, inter-agency activities represented only 16 per cent of overall expenditures ($.150 million out of $.955 million), and were related

A/61/5/Add.2
06-42517 52
mainly to monitoring and evaluation, advocacy and the CHARCA project secretariat. There was little joint implementation at the district level, and UNICEF did not provide any cross-district inputs to this end, unlike UNIFEM, ILO, UNESCO and WHO.
251. In early 2006, United Nations agencies were supposed to start implementing a new joint project, the United Nations HIV Northeast project, which was meant to learn from the CHARCA project experience and address some of its shortcomings, in particular with regard to the design of joint financial implementation and reporting modalities. However, the Board has not reviewed its implementation, which had not started at audit time.
252. The Board recommends that UNICEF draw lessons learned from its lack of provision of inputs for joint district-level implementation of the CHARCA (Coordinated HIV/AIDS Response through Capacity-building and Awareness) project to implement corrective action for the joint United Nations HIV Northeast project.
253. In China, sustained coordination efforts have been undertaken by the United Nations country team since at least 2002. Despite some successes during the initial advocacy phase, coordination remains a challenge and few joint initiatives have been implemented, even though the Board found no evidence of a lack of willingness to cooperate on the part of agencies.
254. UNICEF chaired the United Nations extended thematic group on HIV/AIDS that regularly met and was well attended. Its main achievement had been a successful advocacy towards the Government of China. Whereas the issue was not on the political agenda in 2002, the issuance of a joint assessment of the epidemic, co-signed between the Ministry of Health and the United Nations country team in December 2003 raised its profile. It reported that if the epidemic was left unchecked, the number of people living with HIV and AIDS could reach 10 million by 2010. The Prime Minister met with HIV/AIDS patients in 2003. That was followed by the issuance of a comprehensive HIV-AIDS policy.
255. Although both the CCA and UNDAF included a chapter on HIV/AIDS, no consolidated action plan had been drafted at the time of the audit (July 2005). Agencies had focused their efforts on the same 10 to 15 most affected provinces. The Board has also identified substantial thematic overlaps between UNICEF, UNESCO, WHO and UNODC. For instance, UNICEF, WHO and UNESCO all aimed to reduce vulnerability and risk behaviour among target groups most at risk: “children and adolescents at risk for HIV infection” for UNICEF, “migrants, young people and other vulnerable groups” for UNESCO, and “sex workers and their clients, men having sex with men, drug users and other groups at risk” for WHO. Similarly, UNICEF, UNESCO and UNAIDS share the objective of increasing awareness of HIV/AIDS, reducing stigma and discrimination.
256. In theory, UNICEF focused on discrimination against children and adolescents affected by or infected with HIV/AIDS, whereas UNESCO puts an emphasis on migrant populations. In practice, UNICEF HIV-AIDS projects cannot always draw boundaries between target groups according to their age or gender, and focus on the groups most at risk (e.g., sex workers, migrant workers, prisons and other collective institutions).

A/61/5/Add.2
53 06-42517
257. The “baby theme group on youth and HIV/AIDS” itself has identified areas of overlap and potential cooperation: life skills education projects (UNICEF, UNESCO and UNFPA have projects in this field), work with university students (UNICEF, UNESCO, UNFPA) and out-of-school youth (UNICEF, ILO, UNDP, UNFPA, WHO). However, although those areas had been identified, the United Nations country team had not coordinated or streamlined their workplans to ensure a unified approach.
258. UNICEF agreed with the Board’s recommendation that it invite the China United Nations country team to draft and approve an integrated HIV/AIDS master plan of operation that focuses on reducing programme duplication and maximizing effectiveness.
259. While the United Nations country team has no integrated plan, it has endeavoured to obtain $8 million from the Canadian International Development Agency for a joint programme starting in 2006. However, there would be no joint implementation of a single project, but only the pooling of funds for projects separately implemented by each participating agency, at a risk of less cost-effectiveness.
260. UNICEF agreed with the Board’s recommendation that it invite the China United Nations country team to develop projects involving joint implementation.
261. While the Board is not in a position to review the medical scope of the UNICEF China HIV/AIDS programme, it noted that some of the objectives pursued, for instance with regard to advocacy and the fight against stigma or discrimination, were wide enough in their target groups to create the risk of overlaps with agencies whose mandates cover the whole population, such as UNDP or WHO. The risk materialized when UNICEF programmes were not closely focused on children and women. By contrast, the Office did not have any reliable national data on the number of children orphaned by HIV/AIDS, their geographic spread or their conditions of life, even though that issue clearly falls within the specific mandate of UNICEF.
262. The Board recommends that UNICEF review whether its approach to the HIV/AIDS epidemic is sufficiently closely aligned to its mandate, in order to limit overlaps with other agencies.
UNICEF involvement in inter-agency collaborative purchasing
Background
263. Efforts towards collaborative purchasing between United Nations agencies have been initiated for decades. The Chairman of the first, 1976 meeting of the Inter-Agency Procurement Working Group (IAPWG) referred to the UNDP strong desire of the Governing Council to ascertain on the basis of careful inter-agency studies whether some form of cooperative procurement among the executive agencies would result in cost savings, speedier deliveries, better maintenance, and various other improvements in current procurement activities. UNICEF did not take part in that first meeting (which included the United Nations Secretariat, FAO, ILO, UNDP, UNESCO, and WHO).

A/61/5/Add.2
06-42517 54
264. It participated in the second one, which in 1977 agreed to consider as common-user items vehicles and office equipment and also to give thought to choosing some additional items for study by lead agencies, i.e., those in the United Nations system currently procuring the major part of purchases of a particular item and having the expertise required to ensure optimal procurement performance. Since then, 29 annual meetings have taken place.
265. Early in 2005, the group had yet to agree on the actual list of lead agencies or the exact nature of the responsibilities the task involved. The item was on the agenda of the May 2005 meeting of the IAPWG, towards a mutual recognition of pre-qualification procedures for suppliers.
UNICEF involvement in collaborative purchasing
266. UNICEF ranked as the third purchaser, in 2004 dollar value, among the United Nations agencies, funds and programmes, with about 13 per cent of total purchases (with $798.4 million, behind WFP and the United Nations Secretariat).
267. Overall, purchases through long-term arrangements shared with at least one other United Nations agency was $55.6 million in 2004, which represented 8.7 per cent of UNICEF’s offshore procurement ($637.4 million), 7 per cent of its overall procurement, and less than 1 per cent of the above-indicated total United Nations system procurement. UNICEF had taken an active part in the IAPWG process since its inception, and the Director of the Supply Division was the Chairman of the IAPWG in 2003-2004. However, instances of collaborative purchasing have remained the exception rather than the rule. Between 2000 and 2004, the inter-agency direct procurement by UNICEF amounted to an average $1.97 million a year, not including the joint long-term arrangements mentioned later. That represents 2.1 per cent of the UNICEF Procurement Services overall expenditure over the same period. Over three quarters of the total had to do with HIV-related drugs, such as antiretroviral drugs, bought by UNICEF on behalf of WHO ($1.68 million in 2003) and UNDP ($6.37 million in 2004).
268. UNICEF may not engage in such transactions in the absence of a memorandum of understanding. At the time of the audit, such agreements had been signed with UNDP and UNFPA, but not with WHO. As the head of Procurement Services wrote in 2003, “WHO gives no sign of recognizing UNICEF as a lead agency other than in vaccine procurement. It also consistently ignores our requirement for some form of an agreement.” As a result, WHO was informed that the UNICEF Procurement Services would no longer provide them with quotations for antiretroviral kits.
269. UNICEF also realized that a number of other procurement agencies from the United Nations were in fact competing with each other, which reduced its willingness to cooperate. Thus, the UNICEF Supply Division noted that “sister agencies such as WHO, UNOPS and UNDP/IAPSO have established or strengthened procurement capacity for pharmaceuticals, an area which has been referred to UNICEF for lead procurement”. That type of competition between United Nations agencies cannot ensure that the United Nations as a whole gets the best possible deal from suppliers.
270. UNICEF agreed with the Board’s recommendation that it initiate negotiations at the appropriate level to conclude a framework agreement on

A/61/5/Add.2
55 06-42517
pharmaceutical procurement services with other relevant United Nations organizations.
271. Conditions offered by UNICEF Procurement Services — or, for that matter, by any procurement agency — may not always be perceived by potential customers as competitive, be it in terms of lead-time for delivery, amount of the handling fee or payment conditions. For instance, UNHCR indicated to the Board of Auditors in 2005 that UNICEF treated it as any customer, imposed advance payment, indicated delivery time after the payment of the advance and charged a 7 per cent administrative fee. Those conditions were not conducive to the use of UNICEF Procurement Services according to UNHCR.
272. UNICEF agreed with the Board’s recommendation that its Procurement Services benchmark with United Nations and other public procurement services, considering each organization’s specificities, to determine whether the level of its handling charge for cost recovery is appropriate.
273. Similarly, the proportion of supplies purchased by UNICEF through other United Nations agencies has remained very limited. In 2000-2004, UNICEF purchased $6.94 million worth of supplies from other United Nations agencies, an average of $1.4 million a year, i.e. 0.22 per cent of overall purchases and 0.32 per cent of all offshore purchases (purchases made from Copenhagen or New York) over the period 2000-2005.
274. Those figures did not include purchases under long-term arrangements negotiated with suppliers with or by other United Nations agencies. The IAPWG secretariat has compiled a list that contains the long-term arrangements of seven United Nations agencies (United Nations, IAPSO, IFAD, UNICEF, UNOPS, UNRWA, WFP); but no consolidated data existed on the prices involved or the use of those long-term arrangements by other United Nations agencies. The data discussed below was collated for the purposes of the audit.
275. The most significant cooperation relates to two freight-forwarding long-term arrangements, shared with other United Nations agencies ($36.7 million in 2004). The expenditure of other Copenhagen-based United Nations procurement units (IAPSO, UNOPS, UNFPA) within the same framework was not known. For vehicles ($13.5 million in 2004), UNICEF has its own long-term arrangements based on the IAPSO agreement, at the same price. However, because of the production lead times in the IAPSO agreement (based on direct orders to the automotive industry), vehicles were not usually available from stock for immediate delivery. UNICEF has therefore negotiated two other long-term arrangements with car dealers delivering immediately from stocks, at a premium of approximately 20 per cent, and sources from them when normal factory delivery times were not acceptable.
276. Similarly, UNICEF purchased HIV test kits and contraceptives via long-term arrangements shared respectively with WHO and UNFPA, for a total of $5.4 million in 2004, as well as various medical devices and safety gear (helmets, etc.) for about $0.5 million. In 2005, UNICEF claimed that its procurement done “with inter-agency collaboration” reached $759 million, or 67 per cent of overall purchases of offshore purchases ($846 million) — however that figure included instances where another agency had given technical advice on the purchase, but did not use UNICEF to procure that type of product (e.g., WHO for some vaccines).

A/61/5/Add.2
06-42517 56
277. UNICEF agreed with the Board’s recommendation that it monitor the proportion of its purchases that take place within a collaborative United Nations framework.
278. Other United Nations agencies have used UNICEF long-term arrangements. For instance, UNHCR has used the long-term arrangement on mosquito bed nets to purchase some 150,000 nets at a price of $3.80 per unit, instead of $4.70 (price quoted by supplier to UNHCR), saving $0.135 million. The very high volume of UNICEF mosquito bed net orders compared to UNHCR’s explained the price difference. UNICEF claimed to be the largest buyer of mosquito nets in the world, procuring nearly 14.6 million nets in 2005 for a total of $69 million. However, that type of “piggy-backing” could not be systematic, owing to the absence of a centrally available source of up-to-date information on the long-term arrangements of the major purchasing United Nations agencies, including the ceiling prices and availability for other partners.
279. UNICEF agreed with the Board’s recommendation that it take further steps to encourage other United Nations agencies to use its procurement services and long-term arrangements.
280. UNHCR used space in the Copenhagen and Dubai UNICEF warehouses, where both agencies stock some identical items: for instance 110,000 blankets and 69,750 collapsible jerry cans for UNHCR in Copenhagen in early February 2005; and 167 blankets for UNICEF (11,100 were ordered for delivery on 23 March 2005) and 15,783 collapsible jerry cans. Similarly, UNHCR and UNICEF acquired tents from the same suppliers. The need for tarpaulins was also similar in both agencies.
281. However, UNICEF and UNHCR did not combine their orders to get bulk discounts from suppliers, and sometimes compete for production capacity within the same suppliers. Their stocks were managed separately in the above-mentioned shared premises. There had been no joint management, which could result either in a lowering of the overall amount of stock or in economies of scale. When UNICEF runs out of stock, it cannot call upon UNHCR’s stock to help meet its needs.
282. UNICEF agreed with the Board’s recommendation that it endeavour to jointly purchase items of common interest with UNHCR (for example, tents, tarpaulins, blankets, collapsible jerry cans, mosquito bed nets), whenever it would result in cost or efficiency gains for the United Nations as a whole.
UNICEF involvement in information technology coordination: the human resources enterprise-resource planning module
283. UNICEF took significant steps to ensure that other United Nations system agencies and Bretton Woods institutions benefited from the investments ICT had made in the SAP Human Resources project. In 2001, senior UNICEF and UNDP executives had already met to discuss the UNICEF ICT strategy. Following that discussion, the UNDP Chief Information Officer wrote to the UNICEF Chief Information Officer on 25 June 2001 that the Director of the Bureau of Management was “quite enthused” about the idea of UNDP collaborating with UNICEF on the SAP Human Resources project.
284. UNICEF proposed that UNDP participate fully in the project, with a view to influencing its scope and functionality from its inception. The cost-sharing fee that UNDP would have had to pay was estimated, at this preliminary stage of the

A/61/5/Add.2
57 06-42517
discussions, at $2 million. On 16 January 2002, UNICEF wrote to UNDP to share the functional requirements in the area of human resources with them. However, on 6 May 2002, UNDP announced to UNICEF that ICT had decided not to pursue that avenue and that ICT would instead conclude an agreement with a SAP competitor.
285. UNICEF also repeatedly communicated with other United Nations system organizations on the project, its rationale, advantages and mode of operation. It did so both in the formal setting of the three SAP-SIG meetings held in 2004 and 2005 and in the informal context of responses to queries from ICAO, IMO, IOM, ITU, UNESCO and WFP.
286. The main advantage of the project, from the point of view of other United Nations agencies, was that, following UNICEF’s initial investment, the Human Resources module became the SAP industry standard software for not-for-profit organizations. That meant that it became commercially available to United Nations agencies that ran SAP, for a price limited to the license and maintenance fees (in the case of UNICEF, it amounted to $0.61 million for 2005). Each agency would have to meet a number of custom implementation costs (hardware, training, interfaces, and upgrades) on top of that price to actually use the software.
287. UNICEF also negotiated two provisions in its agreement with SAP that could be particularly beneficial both to itself and to other United Nations organizations. The price of the maintenance of any new features of the SAP Human Resources module charged by SAP was made to depend on the number of United Nations organizations using this software. The Board calculated that, on the basis of the current support base for the maintenance, UNICEF would save $0.248 million in new features maintenance costs over five years if at least three other United Nations organizations purchased the licence for the Human Resources product. At the time of the audit, UNICEF informed the Board that that condition was likely to be met (ICC, ITU and OECD).
288. The contract also included a commitment by SAP to accommodate, free of charge, changes in the personnel rules brought about by the United Nations or the International Civil Service Commission: “if technically feasible and commercially reasonable in SAP’s reasonable, good faith, professional opinion, SAP shall, at no additional charge, provide changes to the new features incorporated into the SAP standard software … to accommodate mandates that may be promulgated from time to time, and in the manner required by the United Nations and/or the International Civil Service Commission”.
289. Overall, UNICEF coordination with other United Nations agencies was compliant with the Board’s recommendation contained in its previous report (A/59/5/Add.2, para. 224) to continue “to establish and maintain information and communication technology standards and operational practices in line with best practices, and share them, wherever feasible, with other United Nations organizations, with a view to reducing risks and costs”.
290. The Board commends UNICEF for reaching out to other international funds, programmes and agencies in the context of the implementation of its enterprise resource planning payroll migration.

A/61/5/Add.2
06-42517 58
15. Office of Internal Audit
UNICEF governance and control environment
291. The Board reviewed the strategies, objectives, management plans, progress reports and other relevant UNICEF documents in the light of results-based management and governance issues in the Board’s previous report (A/59/5/Add.2, paras. 29-33), and General Assembly resolution 57/278 of 20 December 2002. They reflected a good exposition of organizational strategies, plans, desired results, and assigned accountabilities and constitute an appropriate basis on which the Office of Internal Audit can construct a comprehensive audit risk universe.
292. UNICEF did not, however, have a single consolidated overview of the hierarchy of risks it faces, classified into risk categories (e.g., reputation, strategies, funding, programme and process effectiveness, technology, management information, transactions, and policy/procedure compliance) and measured in consistent terms. Risks were not organized into units, such as those representing prime responsibilities for programmes, authorities for direction or oversight of specified activities or defined types of significant decisions, broken down to the lowest accountable management level.
293. There was no evidence of a common perception and understanding of risk in the terms described above, for example, either of the specific accountabilities or an adequate level of acceptance of “ownership” of risks and the related management controls — among the several levels of UNICEF management. In addition to its organizational benefits, a risk identification and evaluation exercise would also help to achieve such understanding and “ownership”. A primary purpose of the framework described above (compiling, evaluating and implementing a comprehensive governance/risk management framework) would be to facilitate review of management performance and accountability in terms of measurable responsibilities and results. A secondary purpose would be to optimize the work of independent quality assurance, process improvement, audit, and evaluation functions within UNICEF, along with that of the external auditors.
294. UNICEF agreed with the Board’s recommendation that it implement a comprehensive risk-management framework to enhance its governance and management control processes.
Internal Audit Committee
295. The Internal Audit Committee is composed of 11 members, and has only one external member (the Director of the UNDP Office of Audit and Performance Review). While the latter was useful from both external review and benchmarking perspectives, a single outsider did not provide a high degree of independent oversight. The external member was not provided copies of all internal audit reports.
296. The Internal Audit Committee is therefore not an independent body, but rather a management forum. That matter was raised in a quality assessment of the Office of Internal Audit (OIA) by the Institute of Internal Audit in 2001, which led to some changes to the advisory and support activities of the Committee, but without full implementation of the recommendations.
297. It provides input and guidance to the Office of Internal Audit, facilitating its work, and driving implementation of audit recommendations. However, several

A/61/5/Add.2
59 06-42517
features of the composition and functions of the Internal Audit Committee raise both independence and long-term effectiveness issues. The Internal Audit Committee “charter” excluded most responsibilities and functions of the audit committees prescribed in other sectors. The Internal Audit Committee did not review financial statements, did not consider external audit, policy guidance and review of risk management and internal control structures and policies, and had no general oversight duty regarding the systems for monitoring compliance.
298. Internal Audit Committee membership includes division directors, who are to be audited by the Office of Internal Audit, more frequently so as the Office of Internal Audit increases its coverage of headquarters units. There could be at least the perception that those division directors could unduly influence where audit resources are deployed, scope of work, or reporting of results. The Internal Audit Committee meets infrequently (only twice during a period of 17 months). Its agenda are narrowly focused on internal audit plans and on the status of implementation of audit recommendations. It is an internal management committee rather than an independent audit committee.
299. In paragraph 164 (b) of its resolution 60/1, the General Assembly requested a comprehensive review of governance and oversight within the United Nations funds, programmes and specialized agencies. UNICEF should take the results of that review into account when considering the changes it needs to implement in the terms of reference, composition and methods of the Internal Audit Committee.
300. UNICEF agreed with the Board’s recommendation that it review the terms of reference of its audit committee in line with the United Nations governance review.
Scope of the work of the Office of Internal Audit
301. The deployment of most Office of Internal Audit resources to the field has led to limitations of its coverage of the 18 headquarters offices and divisions. From 1999 to 2005, the Office of Internal Audit conducted between one and four headquarters audits a year, excluding summary reports (between three and six including these reports). Some divisions or offices such as Evaluation or the Innocenti Research Centre were never audited by the Office of Internal Audit during the period.
302. In a number of cases, the areas reviewed did not pertain to the core activity of the relevant division. The limits of the thrust areas covered are also clear with regard to information technology (IT). Except for a review of the Financial Logistics System security and authorization carried out in 2001, there had been no audit of data centres, systems, applications, networks, security, data integrity, data interface, change control, and new development. The Office of Internal Audit has not had any IT expert within its staff since 2003. Overall, significant audit risks were not being dealt with adequately by internal audit. Members of senior management stated that they would like to see more coverage of headquarters areas, as well as assistance in process improvement and problem-solving.
303. The Internal Audit Committee, at its meeting on 7 December 2004, noted that the Office of Internal Audit was requested to consider undertaking more headquarters and systems audits to be considered in the development of the OIA 2006-2007 Office Management Plan. At that meeting, the Internal Audit Committee

A/61/5/Add.2
06-42517 60
mentioned that that increase in headquarters and systems audits should be achieved while maintaining the level of country office coverage. The 2005 audit plan did not totally cover the defined country office coverage (audits at least every five years), as 5 of the 129 field offices contained in the risk model will not be audited for a period exceeding five years.
304. An indicator of possible Office of Internal Audit understaffing is that UNICEF income has increased by 56.7 percent, and reserves and fund balances have doubled between 2000 and 2004, while the OIA’s headcount has been reduced by one unit to 22 posts (including one temporary post). During the same period, the number of country offices, sub-offices, and programme activities has expanded significantly: new offices were opened in the former Soviet Union and Office of Internal Audit resources have been drawn by the increase in the numbers of complex emergencies dealt with, including Iraq, Afghanistan, the Sudan and the tsunami.
305. Improved planning and staff management processes, training and other measures have permitted the Office of Internal Audit to cope to some degree with that expansion of its field audit universe, but that has also been at the expense of headquarters audit coverage. The internal audit coverage that is required has not been expanded as much as it could be by a combination of three types of resources: achieving efficiency gains from field audits; using other UNICEF staff to leverage audit resources; and providing additional staff to the Office of Internal Audit.
306. UNICEF agreed with the Board’s recommendation that it support the rapid expansion of the Office of Internal Audit audit coverage of all headquarters areas, including information technology. Since the Board’s audit, UNICEF indicated that it had secured resources for IT audit.
307. UNICEF agreed with the Board’s recommendation that it give high priority to a review of the adequacy of the Office of Internal Audit resources in the light of the expanded coverage required and of the various options available to meet that requirement.
Investigations
308. In 2004, the Office of Internal Audit reviewed investigation issues reported by 11 country offices. It conducted three investigations itself and provided technical advice for the implementation of locally managed investigations of minor issues in six offices. OIA capacity for undertaking investigations was strengthened in late 2004 with the recruitment of a professional investigator with experience in the anti-corruption unit of a regional development bank.
309. However, UNICEF had not implemented the Board’s recommendation to review its overall anti-fraud policies and tools (see A/59/5/Add.2, para. 263). The Office of Internal Audit did not have a clear framework in which to conduct investigations. Draft Procedures for Reporting and Addressing Complaints and Allegations of Fraud, Corruption and Other Misconduct Involving UNICEF Staff was prepared in February 2005, but had not been finalized or cleared by March 2006.
310. UNICEF agreed with the Board’s recommendation that it expedite the approval of its updated anti-fraud procedures.

A/61/5/Add.2
61 06-42517
Quality assurance and timeliness of reports
311. One of the common themes in the customer survey, as well as the Board’s discussions with UNICEF and Office of Internal Audit executives was the lengthy period from completion of audit field work to issuance of the final report. Those who mentioned that issue acknowledged that the delay in final report issuance seemed excessive. In the 1999 report (A/55/5/Add.2, paras. 59 to 62) the Board noted that delays between the completion of the audit and the issuance of the report had decreased from 22 weeks in 1998 to 15.8 weeks in 1999. A new benchmark had been set at eight weeks in 2000 and 10 weeks in 2004. That year, the average lead time was 12 weeks (15 in 2003).
312. Draft reports were, in a very large proportion, issued during the field work of the assignment itself, which provided some scope for reducing the time of issuance of the final report.
313. UNICEF agreed with the Board’s recommendation that it review its internal audit procedures and work with the Audit Committee to ensure it significantly improves its report-issuance lead time.
314. The Office of Internal Audit has implemented many of the quality assurance processes required by Institute of Internal Audit standards or recommended in its Practice Advisories. However, the Office of Internal Audit could benefit from further improvements, such as the institution of peer file reviews and the tasking of one staff member with the research of emerging best practices.
315. The Board reviewed 16 of the 33 working papers included in the Office of Internal Audit 2004 audit database (48.5 per cent) and had a general overview of the completion tables. In paragraph 53 of its 1999 report (A/55/5/Add.2), the Board recommended that the UNICEF Office of Internal Audit formulate policy guidelines on the preparation of working papers in compliance with accepted auditing standards. Working papers were now generally compliant with the standards.
316. The Board had also recommended that evidence of a supervisory review confirm on all working papers that they have been subjected to a proper review. Although the working papers sampled had been reviewed, it had not always been reviewed by an auditor who had not taken part in the assignment.
317. The Board recommends that the UNICEF Office of Internal Audit take steps to improve its internal quality assurance processes. Following the audit, the Office of Internal Audit indicated that it had implemented all the recommendations pertaining to quality assurance.
318. Overall, evidence from the Board’s review indicated that Office of Internal Audit planned and performed its assignments with due professional care.
16. Executive offices
Office of the Executive Director
319. The Office of the Executive Director is responsible for the general direction of UNICEF operations under policy directives of the Executive Board, the Economic and Social Council and the General Assembly (E/ICEF/Organization/Rev.3, 24 April 1998). The Office had 20 staff members, including the Executive Director and three Deputy Executive Directors, plus two drivers. Its initial budget was $7.1 million for

A/61/5/Add.2
06-42517 62
the biennium 2004-2005 and it spent $9.3 million during the biennium; the allotment for the biennium 2006-2007 would be $10.7 million.
320. UNICEF rules (Human Resources Manual 02, appendix 2.A) indicate that the incumbent of the post is provided a copy of the job description once finalized, approved and classified for work planning and periodic evaluation report purposes. The job descriptions for the Deputy Executive Directors had not been updated since 1986 or 1994, depending on the post. They did not record the current task-sharing among the three Deputy Executive Directors. Similarly, the job descriptions of a special adviser and of an Executive Officer were missing. The job description of the legal adviser, appointed in 1998, had not been updated since 1996.
321. UNICEF agreed with the Board’s recommendation that it update the job descriptions of its senior staff.
322. UNICEF indicated that the performance of the three deputy directors (Assistant Secretaries-General) was not intended to be assessed, owing to a custom in place at UNICEF as well as in other parts of the United Nations. Yet, United Nations staff rule 101.3 (c) indicates that: “Performance reports shall be prepared regularly for all staff members, including at the assistant secretary-general level and above”.
323. UNICEF agreed with the Board’s recommendation that it file performance reports for all staff members, including at the Assistant Secretary-General level and above, in compliance with United Nations staff rule 101.3 (c).
324. The Office had no guidelines for received gifts, despite the specific position of its members in that regard. Small gifts may be received by the Executive Director and the Deputy Executive Directors. Depending of their nature, the gifts were kept in the Office of the Executive Director, given to the UNICEF library or to the Staff Association. But there was no record allowing to check if all received gifts had actually been handed over. The Office of the Executive Director had not considered the procedure drafted by the Supply Division to define guidelines adapted to its activities. Small gifts such as UNICEF scarves or ties were given to outside officials. There was no guideline or comprehensive record accounting for the expenditure.
325. UNICEF agreed with the Board’s recommendation that it define guidelines on gifts received and given, record them, and consider introducing a single, UNICEF-wide instruction to that effect.
326. The objectives described in the Office Management Plan for 2004-2005 were very general and applicable to UNICEF as a whole, without specific Office of the Executive Director tasks: for the biennium 2004-2005, the Office of the Executive Director will keep working in that direction, further enhancing the agenda for children in all forums. The Office Management Plan for 2006-2007 lists some priorities: review by the Executive Director of the organization’s strategic directions, policies and structures may be expected to lead to changes; the new configuration (two new Deputy Executive Directors) may also yield changes in direction and structures; the call for UNICEF to take a leadership role in selected areas; positioning UNICEF at the centre of the United Nations reform process; high level of engagement of the Executive Director and the Deputies will be required for the sixtieth anniversary year of UNICEF.

A/61/5/Add.2
63 06-42517
327. None of those general objectives had been translated into detailed, measurable and achievable indicators. The Office has not applied the results-based management framework that it requires other UNICEF divisions and field offices to follow in their management plans and annual reports.
328. UNICEF agreed with the Board’s recommendation that it monitor detailed, measurable and achievable indicators for all its entities.
329. Due to numerous overseas travels, only two of the four most senior officers were usually present at the same time at New York headquarters. On average, the three Deputy Executive Directors each travelled between 8.3 and 12 days per month in 2004 and 2005. Yet, travel planning was based mainly on individual decisions, without a strategy taking into account clear priorities and travels already done or planned. There had been, at least until 1994, a rolling record of travel during the last five years by the most senior Office of the Executive Director officers, but it was discontinued.
330. There was no formal provision for a Deputy Executive Director present at New York headquarters to act as a substitute for an absent Deputy Executive Director, regarding the Divisions reporting to the latter. Such a provision could improve the planning of travels and other foreseen tasks, and foster more interchangeability among the Deputy Executive Directors, in particular regarding the oversight of Divisions. The Office of the Executive Director agreed that the interchangeability among Deputy Executive Directors needs to be maintained to the extent possible, but noted the importance of establishing a clear set of accountabilities for each Deputy Executive Director.
331. UNICEF agreed with the Board’s recommendation that it establish a travel plan for staff members of the Office of the Executive Director.
332. UNICEF agreed with the Board’s recommendation that it achieve greater interchangeability among Deputy Executive Directors, in particular regarding the oversight of Divisions.
333. The Board reviewed at random 10 briefing notes (out of about 100 per month) issued by Divisions for meetings between the Executive Director and external senior officials, to check their compliance with the guidelines issued by the Chief of Staff on 8 August 2005. Four briefing notes out of 10 did not provide the Executive Director with talking points. Only two included biographies or biographical data of the external participants. For two, there was no heading with information on the meeting and for one, the date was erroneous. Most of them were sent to the Office of the Executive Director only one day before the meeting, two of them the same day. The lack of compliance with the 8 August 2005 guidelines risked weakening UNICEF advocacy capacity.
334. UNICEF agreed with the Board’s recommendation that it ensure that briefing notes for the Executive Director abide by the deadlines and comply with the harmonized format.
Office of United Nations Affairs and External Relations
335. The objective of the Office of United Nations Affairs and External Relations is mainly to “further the range of UNICEF activities through active involvement within the United Nations system and with external partners”

A/61/5/Add.2
06-42517 64
(E/ICEF/Organization/Rev.3). The Office has eight staff members. Its budget was $2.1 million for the biennium 2004-2005, all of which was spent during the biennium. The allotment for the biennium 2006-2007 was $2.3 million.
336. The Office had prepared 54 talking points for the Secretary-General of the United Nations during the period between January 2004 and November 2005, mostly for travel and the Secretary-General’s bilateral meetings. The Office had not always complied with the deadlines set by the Executive Office of the Secretary-General, owing to organizational issues, or to difficulties in gathering material from country or regional offices.
337. For instance, the Executive Office of the Secretary-General had forwarded a request for a briefing to the Office of United Nations Affairs and External Relations on 2 September 2004. The UNICEF staff member tasked with the reply was informed only on 7 September 2004 with a deadline of 1 p.m. on 8 September. The Office sent 32 talking points after the deadline, between 13 and 17 September 2004. For one of the Secretary-General’s trips to Africa, an inter-office memorandum was issued on 20 October 2004, requesting talking points by 4 November. Only 3 of 12 country offices answered on time.
338. There was a decline in the number of talking points provided to the Secretary-General (6 in 2005, against 48 in 2004, 32 in 2003 and 116 in 2002), owing, at least in one 2005 occurrence, to miscommunication from United Nations Headquarters, the Office was omitted from the mailing list of a memorandum sent on 12 August 2005 to request talking points for the Secretary-General at the sixtieth session of the General Assembly. When UNICEF realized the error, it was able to provide only five talking points to the Executive Office of the Secretary-General, whereas it had produced about 50 for the previous session. That posed a risk of impairing the effectiveness of UNICEF’s advocacy.
339. The Office of United Nations Affairs and External Relations had also faced delays in the preparation of annual reports. According to statistics maintained by the Office of the Secretariat of the Executive Board, the only document submitted late to the Executive Board’s first regular session, in 2004 and 2005, was the annual report of the Executive Director to the Economic and Social Council, prepared by the Office of United Nations Affairs and External Relations.
340. UNICEF agreed with the Board’s recommendation that it review the management of talking points and reports prepared by the Office of United Nations Affairs and External Relations.
341. While the recruitment process unfolded for a vacant General Service post, a total of $15,585 was paid to an outside service provider for a temporary assistant (May to September 2005). That was within the framework of an institutional contract signed on 21 April 2005 between the Division of Human Resources and the service provider for hiring of temporary assistance for headquarters divisions in accordance with requests until 31 December 2005. The Human Resources Manual, chapter 6, section 2, stated that temporary assistance contracts could be of three types: temporary fixed-term, consultant or individual contractors, institutional/ corporate contracts. With regard to the latter, separate guidelines would be issued by the Supply Division on the use of those contracts. No guidelines were issued.

A/61/5/Add.2
65 06-42517
342. UNICEF agreed with the Board’s recommendation that it draft the guidelines requested by the Human Resources Manual, chapter 6, section 2, on temporary assistance.
343. The contract was awarded to a service provider without competitive bidding, based on an informal selection among interim agencies performed four years earlier, and without signing a contract at that time. The 2005 contract stated that a total fee of some $50,000 would be charged to various headquarters divisions. The overall payments in 2004 ($84,773) and in 2005 ($92,221) exceeded the above figure. UNICEF Financial Circular 19, Rev.2, point 7, stated that the advice of a Contracts Review Committee is required for all financial commitments “where the amount to be committed in the framework of the contract/purchase order will be equal to or above the following $70,000: New York”. The contract proposal was not submitted to a Contracts Review Committee. While the contract was signed in April 2005, New York headquarters had been using the services of the vendor since 2003, without a legal basis, contrary to Regulations and Rules.
344. UNICEF agreed with the Board’s recommendation that it identify the reasons for the breakdown in financial controls that led to paying for temporary assistance in the absence of the required contract, and address them.
Office of the Secretariat of the Executive Board
345. The Office of the Secretary of the Executive Board, in supporting the Executive Board in carrying out its mandate as the governing body of UNICEF “is responsible for promoting a mutually effective relationship between the Executive Board and the UNICEF secretariat and between members of the United Nations system and UNICEF on matters relating to the Board’s deliberations and actions” (E/ICEF/Organization/Rev.3). The Office has nine staff members. The initial budget was $2.6 million for 2004-2005 while expenditures were $3.0 million; the allotment for the 2006-2007 biennium was $2.8 million.
346. The Executive Board holds an annual session, usually in June, as well as two regular sessions, generally in January and September. According to guidelines issued by the Department for General Assembly and Conference Management (DGACM), documents were to be submitted to the Department eight weeks prior to each session, and to be issued in all languages at least four weeks before the session. There were 16 late submissions in 2004, but none in 2005, except for the report of the Executive Director to the Economic and Social Council.
347. UNICEF agreed with the Board’s recommendation that it provide senior managers with statistics regarding the timely submission of documents by their Offices and Divisions.
348. The total expenditure for Executive Board members’ field trips increased from $71,250 in 2002 to $100,375 in 2005. Since 2003, there had been three Board members’ field visits per year. Formal guidelines on the modalities of those visits were adopted by the Board in 2004 (E/ICEF/2004/19). They included the provision for a yearly, joint field visit by members of the Executive Board of UNDP/UNFPA, UNICEF and WFP. In addition, there were six visits by the President of the Executive Board, the general modalities of which are not defined.

A/61/5/Add.2
06-42517 66
349. UNICEF agreed with the Board’s recommendation that it propose to the Executive Board to extend the scope of the guidelines for field visits to the President’s travel.
350. Two representatives of Member States who were part of the UNICEF Executive Board were subsequently recruited by UNICEF to become staff members. One of the individuals recruited had been a Chairperson of the Board. Even though no wrongdoing was identified, that situation presents the risk of conflict of interest or perception thereof, between the oversight duties of those representatives and their desire to gain future employment.
351. UNICEF commented that there is no provision in the Charter of the United Nations or the Staff Regulations and Rules that forbids the appointment of former Board members. In fact, “in recent resolutions on human resources, the General Assembly requested the United Nations to widely circulate its vacancy announcements among the delegations of the Member States. To our knowledge, there is only one subsidiary organ of the General Assembly, namely the International Civil Service Commission (ICSC) that in its Statute prohibits its members from seeking employment during the member’s term of office and three years thereafter with any of the organizations. The ICSC is responsible for the regulation and coordination of the conditions of service of the United Nations common system. It should be pointed out that the members of the ICSC are appointed in their personal capacity to the Commission”. UNICEF Board members are delegated by Member States, which may delegate anyone to represent them. That differed from the ICSC members, who are individuals elected in their personal capacity.
352. That issue could not be dealt with within UNICEF in isolation from the rest of the United Nations, especially in the context of the comprehensive review of governance arrangements undertaken as a follow-up to the September 2005 World Summit (A/60/568 and Corr.1 and 2).
353. UNICEF agreed with the Board’s recommendation that it consult United Nations Headquarters on best practices regarding the recruitment as staff members of former representatives to its Executive Board.
17. Information technology
Information and communication technology fraud prevention and management
Monitoring misuse of computers facilities
354. UNICEF has developed a comprehensive policy package, including a code of conduct for the use of IT facilities, an IT fraud prevention policy, IT change management policies and IT security best practices. Procedures for reporting and addressing complaints and allegations of fraud, corruption and other misconduct involving UNICEF staff are currently being drafted. Furthermore, UNICEF has recently improved the logical security on password management and developed end-user communication on good practices.
355. The Board commends UNICEF for developing a comprehensive IT security policy and improving it progressively.
356. Nevertheless, UNICEF did not systematically monitor the misuse of computer facilities. It had no automated alerts, or statistics which could detect the fraud or

A/61/5/Add.2
67 06-42517
misuse of IT resources. Therefore, most of the few reported misuse cases of systems such as the Financial and Logistics System were identified by managers rather than by automated controls. UNICEF did not implement automatic filters on Internet content or automatic statistics on Internet activities, but did periodically inspect and monitor Internet logs. That control did not sufficiently cover the risk of misuse of Internet access. For 2004, UNICEF headquarters has reported only one case of inappropriate Internet activities. Only five other cases were reported worldwide. Overall, there is a significant risk that the very low number of reported cases may be due to the lack of automated controls rather than to near-perfect compliance.
357. UNICEF agreed with the Board’s recommendation that it implement automated alerts and statistics on the use of information and communication technology resources.
358. UNICEF firewall’s implementation, which is the first line of protection from unauthorized Internet access, had not been tested since an April 2000 outsourced vulnerability assessment. That review was no longer relevant as the infrastructure had changed. UNICEF was finalizing the qualification of a firewall project at the time of the audit, and had planned to outsource a security assessment. Leaving a five-year interval between two external assessments of firewall security created a risk that new technological developments would render the previous assessment obsolete. That would not be fully compliant with the Information Security Forum Standard of Good Practice for Information Security number 7.
359. UNICEF agreed with the Board’s recommendation that it implement vulnerability assessment of firewalls on a more regular basis, to be determined after considering United Nations and private sector best practices in this respect.
Access security and segregation of duties
360. UNICEF best practices, available on the Intranet, describe the process for choosing a password. Nevertheless, UNICEF does not use “easy-to-guess restrictions” when creating passwords, and does not perform tests with password-breaking software to determine the degree of security. UNICEF responded that it had included the further strengthening of the existing logical security controls in the office management plan and support budget for 2006-2007.
361. UNICEF agreed with the Board’s recommendation that it implement logical security controls in order to strengthen the protection of computer facilities against fraud or misuse.
362. UNICEF allows remote access to its information systems including its accounting system to some employees. Its authentication measures are limited to passwords, with no smart cards or similar sophisticated devices. That may present a security risk for an organization as decentralized as UNICEF. For instance, three laptops were stolen in November 2004 from the Botswana country office — password-breaking software could have been used to access UNICEF IT systems from those devices. UNICEF commented that: “No budget was currently available for this or foreseen in the next biennium. At present the concept is being discussed by the United Nations Department of Safety and Security, on a strategic level. We do not yet know implications for UNICEF.”

A/61/5/Add.2
06-42517 68
363. UNICEF agreed with the Board’s recommendation that it strengthen remote access security, with due consideration of the inter-agency context.
364. Financial Circular 34 states that in order to maintain proper financial control in a UNICEF office, there should be allotment, authorization, expenditure, and payment controls, which should be exercised by authorizing, certifying, approving and paying officers. That group is currently composed of 77 staff members at Headquarters. The Board’s test disclosed that 13 employees were granted access rights on all four different duties. That is not compliant with the basic segregation of duties controls and represents a risk for the organization because the same person could access the creation of a supplier, the posting of an invoice and the payment of a supplier.
365. UNICEF commented that “those staff members who have access to both parking and posting, do not perform both functions on any one particular document”. UNICEF had no guarantee that that ideal scheme would in fact have been respected.
366. The Board also observed that 42 of the 77 people in the group of certifying, approving and paying officers were granted with modification access to the General Ledger Account parameters. That access right is critical and covers parameters such as Account destination and taxes management, and must be limited to the strict authorized and qualified personnel. UNICEF answered that “That point is a carryover from the 4.7 upgrade in 2003 when there was a problem with posting transactions. In order to troubleshoot the problem, this authorization was turned on, but unfortunately it was never reset … We are currently taking action to prevent the other users from having modification access.” The Board’s review of all General Ledger Account modifications from the time of the upgrade confirmed that only qualified personnel had in fact changed these parameters.
367. UNICEF controlled access rights of FLS every six months by editing the list of employees and correspondent access rights, and sending the list to the Supply Division and Private Sector Division for validation. That control did not ensure an adequate segregation of FLS duties and access rights. UNICEF was to implement an automatic segregation of duties report in FLS.
368. UNICEF agreed with the Board’s recommendation that it ensure a proper segregation of duties in its information technology systems.
369. Eight users have an adapted super-user access (seven in New York, one in Geneva). Users with such access are able to erase every trace of their actions in the system as they have access to all system tables. The extended authorizations represent a security risk.
370. UNICEF agreed with the Board’s recommendation that it review its policy on extended access in the production system.
UNICEF payroll migration
Background
371. The development of IMIS for the United Nations was approved in 1988 with the stated purpose of having an integrated system for processing and reporting on administrative actions at all major duty stations. Following a thorough review and

A/61/5/Add.2
69 06-42517
evaluation of the United Nations IMIS, UNICEF adopted the view that IMIS did not provide the functionality it required for finance, programmes and contributions. Additionally, the account structure did not support the UNICEF Financial Regulations and Rules — reflecting variances from those of the United Nations — or the commercial aspects required by UNICEF for fund-raising and management of its Private Sector Division.
372. In 1998 and 1999, UNICEF implemented add-on modules and enhancements incorporated into the IMIS base system. Implementation of add-on covering payroll had been planned for 1997-1998 but owing to delays in the overall development of IMIS at the United Nations, the date was postponed. UNICEF then opted for SAP, in 2003 regarding payroll. The SAP project scope included master data and payroll processes concerning the local staff of New York, Geneva, Copenhagen, Huningue and Brussels locations as well as worldwide international Professional staff members, totalling 2,897 at the time of the Board’s audit. It also included master data, only for worldwide local staff and non-staff, to support the travel management process.
373. The management project structure was such that the UNICEF Chief Information Officer was the “Executive Sponsor” of the project. The project “owners”, responsible for providing long-term goals and objectives and supporting the project, were the Chief Information Officer, the Comptroller and the Director of Human Resources. The Project Board (Director of Human Resources, Division of Financial and Administrative Management and the Information Technology Division) provided functional and technical oversight. The project manager had the primary ownership of the project deliverables and would provide day-to-day direction to the project team. He was also responsible for maintaining the project plan, streamlining resolution of issues and communicating the project status to project owners.
Budget and delivery schedule
374. The project went into production on 4 March 2005, on schedule. The Agreement dated 31 March 2003 defined the total estimate of the overall budget at $7.02 million plus maintenance. At the time of the audit, the expenditures stood at $5.73 million, which was not a final figure. No significant deviation from the initial budget was identified and the budget was expected to remain in line with the initial forecast.
375. The Board commends UNICEF for implementing the payroll migration project on schedule and on budget.
376. According to the “Statement of Work 2” to the Agreement, section 7, UNICEF agreed to provide the vendor, SAP, with appropriate resources, including but not limited to personnel such as a Project Manager. However, UNICEF did not forecast those internal costs in the budget. The project team did not have time sheets, and therefore did not track internal staff costs. It was unable to provide the Board with an estimate of internal resources devoted to the project.
377. UNICEF commented that other United Nations organizations, including the United Nations, UNDP, WHO and WFP, did not have either a system of time sheets for their systems development process or for ERP implementation. That negative benchmarking does not provide a justification. In its report A/59/5/Add.2, para. 221,

A/61/5/Add.2
06-42517 70
the Board had recommended in 2004 “that UNICEF adopt a common methodology with the other United Nations organizations for (a) determining the total cost of ownership of ICT, (b) determining the variations in cost in different parts of the organization, (c) determining whether or not outsourcing of ICT activities may be a viable option and (d) evaluating ICT projects, their benefits, costs and risks, based on best practices”.
378. UNICEF had indicated on 16 May 2003 that the budget process for the 2004-2005 biennium, and subsequent establishment of specific cost centres for such projects, “will ensure that major ICT projects are easily trackable. In addition, ITD [Information Technology Division] will document the funding sources of the project in the Project Charters to facilitate tracking and monitoring”.
379. UNICEF agreed with the Board’s recommendation that it adopt and implement a methodology to determine the total costs, including staff costs, of its major information technology projects.
System selection
380. The International Telecommunication Union had sponsored a meeting in November 1998 to review the feasibility of a SAP solution for management of human resources and payroll within the United Nations system. UNICEF further reviewed the options under consideration, focusing on the alternative of IMIS versus SAP. In the meantime, the World Food Programme began the implementation of a SAP solution through a contract with IBM. UNICEF envisaged contracting out its payroll to a third-party service provider, and conducted extensive discussions on that option in 2000-2001. However, the vendor concluded that they “could not easily accommodate the requirements of the United Nations”. UNICEF concluded in April 2001 that it should implement a long-term solution based on the SAP Human Resources (HR) suite of products.
381. The selection of the SAP HR implementation partners was then limited to two parties: SAP AG and IBM. On the one hand, IBM Global services offered to implement the HR application which their Italian partner developed for the World Food Programme, based on the SAP AG software. On the other hand, SAP Public services, Inc., a fully owned subsidiary of SAP AG, the developer and owner of the SAP suite of products, offered to develop a new HR application based on its suite of products and drawing on its experience with ITU. UNICEF chose the latter.
382. UNICEF Financial Circular 19 (10 (d) (i)) states that it is the responsibility of a contracts review committee to ensure that … at least three bids have been obtained or in cases where ICT was not able to obtain three bids, the reasons are recorded in detailed file notes as part of the Contract Review Committee submission. In that case, the Supply Division submission file notes indicate that: “It was felt that only these companies offered the breadth and depth of technical expertise and knowledge of the SAP software and could leverage experience gained in past implementation” of the HR system for a United Nations agency based on the SAP software (i.e., SAP for ITU and IBM for WFP). Although that explains why only two suppliers were solicited to implement the SAP solution, ICT did not justify why a third quote was not requested from a competitor offering an alternative to the SAP solution. As no such offer was requested from a SAP competitor, UNICEF was not able to perform a full costs/benefits analysis, weighting the costs of a non-SAP solution against its potential benefits.

A/61/5/Add.2
71 06-42517
383. Management explained that a SAP competitor’s solution would have been inconsistent with the UNICEF ICT strategy, which aimed — through the use of one single ERP (Enterprise Resource Planning), i.e., SAP — to reduce the number of applications and platforms or skills sets required to run them (“technological footprint”), as well as the number of interfaces. That explanation was not entirely convincing, as the alternative IBM offer solicited by UNICEF relied on an interface with the UNICEF existing systems — it was based on a different version of SAP than UNICEF’s own. The Contract Review Committee was presented with two offers, one of which required an interface with the existing UNICEF SAP financial and logistics system. UNICEF had had, therefore, no objection in principle to such interfaces, and could have solicited a third bid from a non-SAP competitor, also based on an interface. That alternative might have been more costly (platform, skill set, interface, etc.), but the only way to ascertain that was to ask for a bid and to compare the figures. That was not done.
384. Therefore, instead of fully complying with United Nations financial regulation 5.12 (c), UNICEF financial rule 112.30 and Financial Circular 19 (10), UNICEF did not demonstrate that “it was not possible to obtain three bids” to meet its requirement, defined as “the migration to the next generation of automated systems for the management of its human resources” in paragraph 1.1 of the Contract Review Committee submission. At least one third option could be found through UNHCR, which was developing at the same time a similar Human Resources solution, based on another platform (PeopleSoft).
385. UNICEF agreed with the Board’s recommendation that it improve the documentation of its information and communication technology system selection by performing formal multi-vendor, cost/benefit evaluations in compliance with UNICEF Financial Circular 19.
Implementation of the migration
386. The Board reviewed, on a test basis, the payroll master data and was satisfied that its integrity and consistency had been safeguarded by adequate project management and migration procedures. However, IT projects quality assurance processes should be upgraded for UNICEF to be fully in line with industry best practices. That includes formalizing the quality assurance function in ICT project management, improving the documentation of data migration strategies and of the audit trails of system tests.
387. UNICEF agreed with the Board’s recommendation that it further improve its information technology quality assurance process to bring it fully into line with industry best practices.
18. Country audits
388. During the biennium 2004-2005, the Board visited 11 field offices. Significant findings from those visits have been included in the previous sections. Each office was left to devise its own procedure to monitor the implementation of the Board’s recommendations. In one case (the Democratic Republic of the Congo), the Office had failed to follow up on the implementation of the Board’s previous recommendations.

A/61/5/Add.2
06-42517 72
389. UNICEF agreed with the Board’s recommendation that it issue an instruction on the follow-up of external audit recommendation.
19. Fraud and presumptive fraud
390. During the biennium 2004-2005, UNICEF reported 42 cases of fraud or presumptive fraud to the Board (as against 37 in 2002-2003). UNICEF had not yet determined the financial loss in one case, but estimated a total loss of $482,979 in the other 41. Those cases related to, among other things, theft of cash, counterfeit cheques, theft of vehicles, poor management of inventory, misappropriation of funds and other financial irregularities. UNICEF recovered $210,884 of the total loss.
Table II.10 Cases of fraud and presumptive fraud, 2004-2005 (United States dollars)
Number of cases Amount involved Amount recovered
Theft or robbery 7 221 864 57 594
Misuse of assets 13 21 892 3 154
Loss of assets 7 85 362 3 898
Forgery or attempted forgery 7 135 655 135 655
Procurement irregularities 3 0 0
Irregularities in programme implementation 8 18 206 10 583
Total 45 482 979 210 884
391. Remedial action against the staff members involved in those cases included 7 summary dismissals, 5 non-renewals of contracts, 1 termination of secondment, 25 written reprimands and 3 other measures. Three staff members resigned following the discovery of the cases. There was no indication of the involvement of any UNICEF staff member in 7 cases out of 42 (16.7 per cent). UNICEF reported insufficient evidence for disciplinary proceedings to be undertaken in three further cases. In all cases, UNICEF has identified the conditions that facilitated the fraud or presumptive fraud and has reported having addressed any weaknesses identified in its systems and procedures.

A/61/5/Add.2
73 06-42517
D. Acknowledgement
392. The Board of Auditors wishes to express its appreciation for the cooperation and assistance extended by the Executive Director and staff of the United Nations Children’s Fund.
(Signed) Philippe Séguin First President of the Court of Accounts of France
Lead Auditor
(Signed) Shauket A. Fakie Chairman, Auditor-General of the Republic of South Africa
(Signed) Guillermo N. Carague Chairman, Philippine Commission on Audit
28 July 2006
Note: The members of the Board of Auditors have signed only the original English version of the present report.

A/61/5/Add.2
06-42517 74
Annex
Summary of status of implementation of recommendations of the Board of Auditors in its report for the biennium ended 31 December 2003a
Topic Biennium first reported Implemented Under implementation
Not implemented
Reference in present report
Payables and receivables para. 23
Presentation of financial statements
paras. 36, 51 and 53 —
2002-2003 — paras. 33 and 44 paras. 36-41
2000-2001 — para. 48 paras. 42-46
Liabilities para. 56 — —
Non-expendable property 2002-2003 paras. 60 and 63 paras. 52-54
Accounts receivable para. 79 — —
para. 66 —
2002-2003 para. 72 paras. 52-57
para. 76 —
Programme expenditure para. 135
Human resources paras. 140, 144, 148, 152, 157, 162, 167, 170, 176, 181 and 184
— —
2002-2003 — para. 138 — paras. 12-13
2002-2003 — — para. 173 paras. 12-13
Supply Division para. 192 — —
2000-2001 — para. 188 — paras. 118-120
Information and communication technology
paras. 199, 204, 216, 221, 224, 231 and 235
2002-2003 — paras. 202, 226 and 233
paras. 281-288
Innocenti Research Centre paras. 239, 244 and 247 — —
Country offices para. 253 — —
2002-2003 para. 249 — —
Division of communication paras. 255 and 259 — —
Fraud para. 263 — —
Private Sector Division paras. 109 and 118 — —
2002-2003 — paras. 81, 90, 99, 105, 114 and 123
— paras. 67-90
Total 37 18 1
Percentage 66.1 32.1 1.8
a Official Records of the General Assembly, Fifty-ninth Session, Supplement No. 5B (A/59/5/Add.2), chap. II.

A/61/5/Add.2
75 06-42517
Chapter III Audit opinion
We have audited the accompanying financial statements of the United Nations Children’s Fund, comprising statements I to VII, schedules 1 to 3 and the supporting notes for the biennium ended 31 December 2005. These financial statements are the responsibility of the Executive Director. Our responsibility is to express an opinion on these financial statements based on our audit.
We conducted our audit in accordance with the common auditing standards of the Panel of External Auditors of the United Nations, the specialized agencies and the International Atomic Energy Agency and with the International Standards on Auditing. Those standards require that we plan and perform the audit to obtain reasonable assurance about whether the financial statements are free of material misstatement. An audit includes examining, on a test basis, evidence supporting the amounts and disclosures in the financial statements. An audit also includes assessing the accounting principles used and significant estimates made by the Executive Director, as well as evaluating the overall presentation of the financial statements. We believe that our audit provides a reasonable basis for the audit opinion.
In our opinion, the financial statements present fairly, in all material respects, the financial position as at 31 December 2005, and the results of its operations and its cash flows for the period then ended, in accordance with the United Nations system accounting standards.
Furthermore, in our opinion, the transactions of the United Nations Children’s Fund that have come to our notice or that we have tested as part of our audit have, in all significant respects, been in accordance with the Financial Regulations and legislative authority.
In accordance with article VII of the Financial Regulations, we have also issued a long-form report on our audit of the United Nations Children’s Fund’s financial statements.
(Signed) Philippe Séguin First President of the Court of Accounts of France
Lead Auditor
(Signed) Shauket A. Fakie Chairman, Auditor-General of the Republic of South Africa
(Signed) Guillermo N. Carague Chairman, Philippine Commission on Audit
28 July 2006
Note: The members of the Board of Auditors have signed only the original English version of the present report.

A/61/5/Add.2
06-42517 76
Chapter IV Financial statements for the biennium ended
31 December 2005

A/61/5/A
dd.2
06-42517 77

A/61/5/A
dd.2
78 06-42517

A/61/5/A
dd.2
06-42517 79
STATEMENT III
CASH FLOWS FOR THE BIENNIUM ENDED 31 DECEMBER 2005
(In thousands of United States dollars) 2005 2003 CASH FLOWS FROM OPERATING ACTIVITIES: Net excess of income over expenditures 912 208 374 235 (Increase) decrease in contributions receivable 82 044 (56 505) (Increase) in other accounts receivable (8 421) (55 812) (Increase) decrease in other assets 2 977 (2 811) Increase (decrease) in contributions received in advance 15 308 (709) Increase in accounts payable 28 737 12 222 Increase (decrease) in unliquidated obligations 155 836 (45 349) Less: Interest income (91 054) (30 368) NET CASH FROM OPERATING ACTIVITIES 1 097 635 194 903 CASH FLOW FROM INVESTING AND FINANCING ACTIVITIES Increase in balances on trust funds 47 188 91 766 Plus: Interest income 91 054 30 368 NET CASH FROM INVESTING AND FINANCING ACTIVITIES 138 242 122 134 CASH FLOWS FROM OTHER SOURCES: (Increase) in land and buildings (2 792) (309) Transfer to reserve for after-service health insurance 30 000 30 000 Transfer from regular resources (30 000) (30 000) Increase in regular resources fund 67 81 NET CASH FROM OTHER SOURCES (2 725) (228) NET INCREASE IN CASH AND TERM DEPOSITS 1 233 152 316 809 CASH AND TERM DEPOSITS, 1 JANUARY 961 359 644 550 CASH AND TERM DEPOSITS, 31 DECEMBER 2 194 511 961 359

A/61/5/A
dd.2
80 06-42517
STATEMENT IV
STATEMENT OF APPROPRIATIONS FOR THE 2004-2005 BIENNIUM AS AT 31 DECEMBER 2005
(In thousands of United States dollars)
Appropriations Expenditures a/ Management Transfers/ Programme and Original Supplement adjustments Revised support administration Total Unspent Programme support Country and regional offices 373 014 3 000 (6 239) 369 775 357 484 357 484 12 291 Headquarters 96 088 4 532 100 620 98 007 98 007 2 613 Subtotal 469 102 3 000 (1 707) 470 395 455 491 455 491 14 904 Management and administration 229 804 1 707 231 511 226 748 226 748 4 763 Total 698 906 3 000 701 906 455 491 226 748 682 239 19 667
a/ Expenditures 455 491 226 748 682 239 Less: Recovery from packing and assembly activities 10 647 10 647 Recovery from programme assistance (supplementary-funded projects) b/ 74 613 14 413 89 026 Recovery from programme assistance (emergency relief and rehabilitation-funded projects)b/ 59 956 13 458 73 414 Agency commissions from administration of non-procurement trust funds and Junior Professional Officers 3 636 3 636 Government contribution towards local costs 346 346 Transfer from income in respect of income tax reimbursement 8 314 15 517 23 831 Subtotal 153 876 47 024 200 900 Net expenditures (statement I) 301 615 179 724 481 339
b/ The figures are presented in line with the 2004-2005 biennium support budget preparation.

A/61/5/A
dd.2
06-42517 81
STATEMENT V
ALL FINANCIAL RESOURCES
FOR THE BIENNIUM ENDED 31 DECEMBER 2005
(In thousands of United States dollars)
2004 - 2005 2002 - 2003 Other resources Regular Supplementary Emergency relief resources funds and rehabilitation Trust funds Total Total Opening balances 368 036 439 540 213 565 268 374 1 289 515 799 499 Income/receipts 1 579 058 1 615 958 1 520 257 1 357 428 6 072 701 4 107 409 Funds available 1 947 094 2 055 498 1 733 822 1 625 802 7 362 216 4 906 908 Expenditures 1 365 353 1 400 643 1 024 603 1 293 910 5 084 509 3 570 992 Write-offs/prior periods' adjustments 4 457 2 665 5 344 12 466 16 401 Transfer to reserve for after-service health insurance 30 000 30 000 30 000 Closing balances 547 284 652 190 703 875 331 892 2 235 241 1 289 515

A/61/5/A
dd.2
82 06-42517
STATEMENT VI
STATUS OF FUNDING FOR APPROVED REGULAR RESOURCES, SUPPLEMENTARY FUNDS AND EMERGENCY RELIEF AND REHABILITATION AS AT 31 DECEMBER 2005
(In thousands of United States dollars)
Regular Other resources resources Supplementary Emergency relief Total funds and rehabilitation Unspent balances of programmes as at 1 January 2004 1 841 449 564 222 251 876 2 657 547 Approved at the Executive Board sessions a/ New programmes 735 647 735 647 Made between Executive Board sessions b/ 149 831 1 767 308 1 500 054 3 417 193 Write-off of pledges (2 665) (5 344) (8 009) Programme cancellations c/ (40 481) (40 481) Savings of 2004-2005 budget (19 667) (19 667) Recoveries to the budget (200 900) (200 900) Subtotal 2 465 879 2 328 865 1 746 586 6 541 330 Expenditures 1 365 353 1 400 643 1 024 603 3 790 599 Unspent balances of programmes as at 31 December 2005 1 100 526 928 222 721 983 2 750 731 Fund balances as at 31 December 2005 547 284 652 190 703 875 1 903 349 To be financed from future income 553 242 276 032 18 108 847 382 a/ E/ICEF/2003/P/L.1 to E/2003/ICEF/P/L.13 (decision 2003/6); E/ICEF/2003/P/L.15 to E/ICEF/2003/P/L.17 (decision 2003/12); E/ICEF/2003/AB/L.14 (decisions 2003/17 and 2005/15); E/ICEF/2003/P/L.29 (decision 2003/18); E/ICEF/2004/P/L.25 (decision 2004/11); E/ICEF/2004/P/L.1 to E/ICEF/2004/P/L.23 (decision 2004/6); E/ICEF/2005/P/L.1 to E/ICEF/2005/P/L.20 (decisions 2005/4, 2005/12, and 2005/14); Decision 2005/5 (additional regular resources for 2005 and 2006); Decision 2005/6 (additional other resources); E/ICEF/2005/P/L.30 to E/ICEF/2005/P/L.36; E/ICEF/2005/P/L.38 (decision 2005/13); and E/ICEF/2004/7/Rev.1 and E/ICEF/2004/AB/L.2 (decision 2005/16). b/ 2004 and 2005 programme budget allotments arising from Private Sector Division income, regular resources for unfunded other resources projects. c/ Regular resources programme cancellations represent unspent balances in the amounts approved by the Executive Board for various programme recommendations which expired between 2002 and 2005.

A/61/5/A
dd.2
06-42517 83
STATEMENT VII
PROGRAMME COOPERATION: STATEMENT OF APPROVED PROGRAMMES, EXPENDITURES AND UNSPENT BALANCES FOR REGULAR RESOURCES, SUPPLEMENTARY FUNDS AND EMERGENCY RELIEF AND REHABILITATION
FOR THE BIENNIUM ENDED 31 DECEMBER 2005
(In thousands of United States dollars)
Approved
programmes New Approved programmes unspent balances programmes Total Total unspent balances Area and country assistance as at January 2004 and cancellations programmes expenditures as at 31 December 2005 AFRICA Angola 14 305 75 317 89 622 52 889 36 733 Benin 13 103 11 704 24 807 14 955 9 852 Botswana 2 849 3 570 6 419 3 390 3 029 Burkina Faso 13 575 51 493 65 068 25 767 39 301 Burundi 7 246 45 123 52 369 35 563 16 806 Cameroon 14 305 10 932 25 237 16 244 8 993 Cape Verde 1 215 4 909 6 124 2 077 4 047 Central African Republic 6 254 10 465 16 719 11 109 5 610 Chad 9 583 57 356 66 939 36 717 30 222 Comoros 3 179 2 554 5 733 2 424 3 309 Congo 5 478 8 543 14 021 6 838 7 183 Côte d'Ivoire 22 507 24 124 46 631 34 546 12 085 Democractic Republic of the Congo 44 470 139 492 183 962 119 083 64 879 Equatorial Guinea 2 270 1 783 4 053 2 201 1 852 Eritrea 17 316 14 871 32 187 22 807 9 380 Ethiopia 88 478 88 896 177 374 138 921 38 453 Gabon 2 093 1 285 3 378 2 550 828 Gambia 3 530 2 431 5 961 3 713 2 248 Ghana 19 029 33 385 52 414 28 980 23 434 Guinea 9 738 12 761 22 499 15 757 6 742 Guinea-Bissau 5 961 6 271 12 232 5 786 6 446 Kenya 30 648 25 146 55 794 25 065 30 729 Lesotho 5 424 5 992 11 416 6 999 4 417 Liberia 10 837 42 274 53 111 34 966 18 145 Madagascar 7 905 39 175 47 080 21 805 25 275 Malawi 26 347 39 383 65 730 42 344 23 386 Mali 26 488 15 500 41 988 27 260 14 728 Mauritania 10 419 5 619 16 038 9 737 6 301 Mauritius 47 (19) 28 28 Mozambique 42 700 17 721 60 421 39 678 20 743 Namibia 3 343 10 482 13 825 7 061 6 764 Niger 36 537 28 664 65 201 44 068 21 133 Nigeria 98 713 148 136 246 849 100 504 146 345 Rwanda 10 110 12 084 22 194 13 418 8 776 Sao Tome and Principe 1 874 645 2 519 1 566 953 Senegal 11 503 14 337 25 840 14 183 11 657 Sierra Leone 19 574 18 886 38 460 24 539 13 921 Somalia 33 061 65 782 98 843 58 591 40 252

A/61/5/A
dd.2
84 06-42517
STATEMENT VII (continued)
Approved
programmes New Approved programmes unspent balances programmes Total Total unspent balances Area and country assistance as at January 2004 and cancellations programmes expenditures as at 31 December 2005 South Africa 5 593 10 862 16 455 10 010 6 445 Swaziland 4 784 9 943 14 727 7 970 6 757 Togo 6 412 4 963 11 375 6 692 4 683 Uganda 21 069 93 591 114 660 54 246 60 414 United Republic of Tanzania 36 083 27 236 63 319 38 759 24 560 Zambia 17 677 11 044 28 721 16 997 11 724 Zimbabwe 12 095 27 583 39 678 25 127 14 551 Regional 8 158 3 328 11 486 4 873 6 613 Area total 793 885 1 285 622 2 079 507 1 218 775 860 732 THE AMERICAS AND THE CARIBBEAN Argentina 2 468 7 663 10 131 6 285 3 846 Barbados 266 266 266 Belize 1 996 374 2 370 1 695 675 Bolivia 12 084 19 403 31 487 15 521 15 966 Brazil 9 803 17 072 26 875 21 052 5 823 Chile 774 1 827 2 601 1 584 1 017 Colombia 6 338 9 679 16 017 9 828 6 189 Costa Rica 2 126 182 2 308 1 507 801 Cuba 2 630 1 848 4 478 3 045 1 433 Dominican Republic 5 738 1 060 6 798 4 875 1 923 Ecuador 5 857 4 209 10 066 6 244 3 822 El Salvador 3 141 4 508 7 649 4 660 2 989 Guatemala 7 114 15 788 22 902 9 950 12 952 Guyana 2 024 5 755 7 779 2 934 4 845 Haiti 8 705 23 460 32 165 21 317 10 848 Honduras 3 577 2 808 6 385 3 806 2 579 Jamaica 2 780 3 278 6 058 4 399 1 659 Mexico 4 531 6 580 11 111 6 538 4 573 Nicaragua 12 728 3 713 16 441 10 342 6 099 Panama 1 161 1 122 2 283 1 533 750 Paraguay 2 829 1 997 4 826 3 729 1 097 Peru 2 993 10 997 13 990 8 189 5 801 Suriname 1 877 1 877 1 877 Uruguay 1 303 2 592 3 895 2 009 1 886 Venezuela 2 216 1 378 3 594 2 664 930 Regional 8 942 3 940 12 882 6 830 6 052 Area total 113 858 153 376 267 234 160 536 106 698 EAST ASIA AND THE PACIFIC Cambodia 26 720 49 227 75 947 32 130 43 817 China 29 885 76 149 106 034 36 604 69 430

A/61/5/A
dd.2
06-42517 85
STATEMENT VII (continued)
Approved
programmes New Approved programmes unspent balances programmes Total Total unspent balances Area and country assistance as at January 2004 and cancellations programmes expenditures as at 31 December 2005 Democratic People's Republic of Korea 5 931 29 711 35 642 30 770 4 872 Indonesia 14 999 403 061 418 060 138 271 279 789 Lao People's Democratic Republic 11 126 6 886 18 012 11 978 6 034 Malaysia 672 5 411 6 083 1 616 4 467 Mongolia 3 602 2 953 6 555 4 493 2 062 Myanmar 18 872 64 203 83 075 25 899 57 176 Pacific island countries 9 349 5 420 14 769 7 446 7 323 Papua New Guinea 5 428 9 616 15 044 5 385 9 659 Philippines 4 040 45 181 49 221 14 236 34 985 Thailand 7 151 30 763 37 914 17 062 20 852 Timor-Leste 11 024 11 272 22 296 12 364 9 932 Viet Nam 18 012 35 354 53 366 23 393 29 973 Regional 6 386 6 386 2 223 4 163 Area total 166 811 781 593 948 404 363 870 584 534 SOUTH ASIA Afghanistan 51 355 120 783 172 138 105 397 66 741 Bangladesh 56 468 158 165 214 633 88 550 126 083 Bhutan 3 942 3 393 7 335 5 051 2 284 India 171 153 170 173 341 326 193 085 148 241 Maldives 2 703 56 108 58 811 25 337 33 474 Nepal 20 871 22 324 43 195 28 523 14 672 Pakistan 85 038 125 727 210 765 117 787 92 978 Sri Lanka 14 610 200 644 215 254 87 550 127 704 Regional 5 465 5 465 2 195 3 270 Area total 406 140 862 782 1 268 922 653 475 615 447 MIDDLE EAST AND NORTH AFRICA Algeria 4 463 895 5 358 3 318 2 040 Djibouti 4 102 3 630 7 732 4 852 2 880 Egypt 14 749 18 503 33 252 23 390 9 862 Iran (Islamic Republic of) 4 184 39 440 43 624 27 445 16 179 Iraq 98 798 143 775 242 573 194 854 47 719 Jordan 3 664 808 4 472 2 311 2 161 Kuwait 30 30 30 Lebanon 2 190 783 2 973 1 909 1 064 Morocco 6 900 3 398 10 298 7 010 3 288 Oman 170 1 188 1 358 965 393 Palestinian children and mothers 9 419 36 697 46 116 25 913 20 203 Sudan 33 862 282 007 315 869 234 812 81 057 Syrian Arab Republic 3 386 850 4 236 2 275 1 961 Tunisia 2 437 830 3 267 2 153 1 114

A/61/5/A
dd.2
86 06-42517
STATEMENT VII (continued)
Approved
programmes New Approved programmes unspent balances programmes Total Total unspent balances Area and country assistance as at January 2004 and cancellations programmes expenditures as at 31 December 2005 Yemen 20 645 19 066 39 711 22 738 16 973 Regional 18 607 3 223 21 830 9 434 12 396 Area total 227 606 555 093 782 699 563 379 219 320 CENTRAL AND EASTERN EUROPE,
THE COMMONWEALTH OF INDEPENDENT STATES
AND THE BALTIC STATES
Albania 5 413 9 907 15 320 6 628 8 692 Armenia 1 028 4 621 5 649 2 061 3 588 Azerbaijan 1 648 8 626 10 274 4 540 5 734 Belarus 1 708 3 735 5 443 1 716 3 727 Bulgaria 214 2 766 2 980 2 980 Bosnia and Herzegovina 4 924 9 037 13 961 8 684 5 277 Croatia 267 1 700 1 967 1 101 866 Georgia 2 043 6 123 8 166 3 061 5 105 Kazakhstan 1 245 7 703 8 948 3 380 5 568 Kosovo, Serbia and Montenegro 2 921 4 870 7 791 6 424 1 367 Kyrgyzstan 1 492 5 751 7 243 2 459 4 784 Republic of Moldova 4 184 8 745 12 929 5 482 7 447 Romania 3 696 6 520 10 216 5 610 4 606 Russian Federation 3 643 24 060 27 703 19 017 8 686 Serbia and Montenegro 5 409 7 242 12 651 6 175 6 476 Tajikistan 3 529 12 750 16 279 10 221 6 058 The former Yugoslav Republic of Macedonia 2 760 5 411 8 171 3 613 4 558 Turkey 3 270 17 384 20 654 5 950 14 704 Turkmenistan 1 395 4 702 6 097 2 278 3 819 Ukraine 2 750 7 142 9 892 4 570 5 322 Uzbekistan 2 184 10 765 12 949 4 826 8 123 Yugoslavia (former) 24 24 24 Regional 11 944 617 12 561 4 082 8 479 Area total 67 691 170 177 237 868 111 878 125 990 GLOBAL ASSISTANCE Emergency Programme Fund 47 111 23 856 70 967 20 256 50 711 Immunization 3 537 7 824 11 361 5 521 5 840 Inter-country programmes 124 553 227 638 352 191 204 242 147 949 Innocenti Research Centre 7 449 7 789 15 238 7 328 7 910 Total GLOBAL ASSISTANCE 182 650 267 107 449 757 237 347 212 410 TOTAL PROGRAMME ASSISTANCE 1 958 641 4 075 750 6 034 391 3 309 260 2 725 131

A/61/5/A
dd.2
06-42517 87
STATEMENT VII (concluded)
Approved
programmes New Approved programmes unspent balances programmes Total Total unspent balances Area and country assistance as at January 2004 and cancellations programmes expenditures as at 31 December 2005 Programme support 469 102 3 767 472 869 455 491 17 378 Management and administration 229 804 5 166 234 970 226 748 8 222 Recoveries to the budget (200 900) (200 900) (200 900) TOTAL BUDGET 698 906 (191 967) 506 939 481 339 25 600 TOTAL COOPERATION 2 657 547 3 883 783 6 541 330 3 790 599 2 750 731

A/61/5/A
dd.2
88 06-42517
STATEMENT VII-1
PROGRAMME COOPERATION: STATEMENT OF APPROVED PROGRAMMES, EXPENDITURES AND UNSPENT BALANCES
FOR REGULAR RESOURCES FOR THE BIENNIUM ENDED 31 DECEMBER 2005
(In thousands of United States dollars) Approved programmes New Approved programmes unspent balances programmes Total Total unspent balances Area and country assistance at at January 2004 and cancellations programmes expenditures as at 31 December 2005 AFRICA Angola 5 725 23 642 29 367 12 987 16 380 Benin 9 632 991 10 623 5 192 5 431 Botswana 2 614 593 3 207 1 581 1 626 Burkina Faso 8 562 38 121 46 683 11 973 34 710 Burundi 3 167 14 203 17 370 8 153 9 217 Cameroon 12 005 112 12 117 5 919 6 198 Cape Verde 669 4 210 4 879 1 311 3 568 Central African Republic 4 854 3 242 8 096 5 436 2 660 Chad 6 432 26 578 33 010 13 194 19 816 Comoros 2 832 (77) 2 755 1 433 1 322 Congo 4 925 433 5 358 2 154 3 204 Côte d'Ivoire 14 928 284 15 212 7 787 7 425 Democractic Republic of the Congo 33 244 51 895 85 139 40 358 44 781 Equatorial Guinea 1 963 216 2 179 1 435 744 Eritrea 4 280 2 212 6 492 4 093 2 399 Ethiopia 52 363 11 904 64 267 41 716 22 551 Gabon 1 842 1 842 1 189 653 Gambia 2 493 811 3 304 1 959 1 345 Ghana 7 333 19 922 27 255 8 408 18 847 Guinea 7 537 2 911 10 448 6 444 4 004 Guinea-Bissau 4 543 1 864 6 407 2 837 3 570 Kenya 26 068 906 26 974 10 205 16 769 Lesotho 4 007 500 4 507 2 759 1 748 Liberia 3 361 7 510 10 871 6 950 3 921 Madagascar 6 133 24 654 30 787 9 690 21 097 Malawi 15 151 2 138 17 289 10 876 6 413 Mali 21 933 (1 072) 20 861 12 501 8 360 Mauritania 7 099 (464) 6 635 3 104 3 531 Mauritius 44 (19) 25 25 Mozambique 24 790 949 25 739 16 448 9 291 Namibia 1 640 4 215 5 855 2 197 3 658 Niger 33 155 (6 883) 26 272 15 004 11 268 Nigeria 87 044 5 457 92 501 48 199 44 302 Rwanda 7 723 5 164 12 887 7 906 4 981 Sao Tome and Principe 1 842 91 1 933 1 298 635 Senegal 6 501 3 601 10 102 6 109 3 993 Sierra Leone 12 246 (437) 11 809 7 074 4 735

A/61/5/A
dd.2
06-42517 89
STATEMENT VII-1 (continued) Approved programmes New Approved programmes unspent balances programmes Total Total unspent balances Area and country assistance as at January 2004 and cancellations programmes expenditures as at 31 December 2005 Somalia 23 011 1 560 24 571 12 603 11 968 South Africa 2 944 933 3 877 2 471 1 406 Swaziland 1 806 3 906 5 712 1 941 3 771 Togo 5 180 829 6 009 3 290 2 719 Uganda 10 741 48 785 59 526 16 392 43 134 United Republic of Tanzania 24 961 9 905 34 866 20 881 13 985 Zambia 11 989 1 851 13 840 8 536 5 304 Zimbabwe 2 423 4 462 6 885 4 471 2 414 Area total 533 735 322 608 856 343 416 464 439 879 THE AMERICAS AND THE CARIBBEAN Argentina 89 3 042 3 131 1 088 2 043 Belize 1 915 298 2 213 1 561 652 Bolivia 4 948 1 063 6 011 3 786 2 225 Brazil 2 111 2 798 4 909 4 044 865 Chile 627 1 053 1 680 954 726 Colombia 3 476 646 4 122 2 369 1 753 Costa Rica 1 882 120 2 002 1 293 709 Cuba 2 106 51 2 157 1 376 781 Dominican Republic 2 317 321 2 638 1 593 1 045 Ecuador 4 284 444 4 728 2 363 2 365 El Salvador 2 159 370 2 529 1 695 834 Guatemala 3 042 3 998 7 040 2 126 4 914 Guyana 1 925 4 055 5 980 2 158 3 822 Haiti 7 273 3 095 10 368 7 183 3 185 Honduras 3 332 380 3 712 2 636 1 076 Jamaica 2 122 625 2 747 1 885 862 Mexico 2 625 551 3 176 2 017 1 159 Nicaragua 3 116 430 3 546 1 852 1 694 Panama 1 113 417 1 530 1 053 477 Paraguay 2 118 421 2 539 1 658 881 Peru 1 915 5 943 7 858 2 950 4 908 Uruguay 759 2 034 2 793 1 049 1 744 Venezuela 1 825 400 2 225 1 555 670 Regional 6 364 1 234 7 598 4 391 3 207 Area total 63 443 33 789 97 232 54 635 42 597 EAST ASIA AND THE PACIFIC Cambodia 7 686 24 884 32 570 8 909 23 661 China 25 121 63 207 88 328 26 733 61 595

A/61/5/A
dd.2
90 06-42517
STATEMENT VII-1 (continued) Approved programmes New Approved programmes unspent balances programmes Total Total unspent balances Area and country assistance as at January 2004 and cancellations programmes expenditures as at 31 December 2005 Democratic People's Republic of Korea 3 650 1 932 5 582 3 666 1 916 Indonesia 10 546 30 230 40 776 11 896 28 880 Lao People's Democratic Republic 5 154 832 5 986 3 963 2 023 Malaysia 672 1 500 2 172 909 1 263 Mongolia 2 520 399 2 919 1 993 926 Myanmar 13 988 44 260 58 248 15 617 42 631 Pacific island countries 8 493 954 9 447 5 317 4 130 Papua New Guinea 4 545 765 5 310 3 014 2 296 Philippines 2 347 12 905 15 252 5 117 10 135 Thailand 3 100 999 4 099 2 155 1 944 Timor-Leste 1 271 3 045 4 316 2 662 1 654 Viet Nam 9 583 20 570 30 153 9 525 20 628 Area total 98 676 206 482 305 158 101 476 203 682 SOUTH ASIA Afghanistan 18 818 52 220 71 038 28 226 42 812 Bangladesh 30 685 60 710 91 395 22 496 68 899 Bhutan 2 706 739 3 445 2 433 1 012 India 131 146 (1 390) 129 756 63 516 66 240 Maldives 2 683 (111) 2 572 1 245 1 327 Nepal 15 131 1 409 16 540 10 288 6 252 Pakistan 67 083 (3 255) 63 828 26 627 37 201 Sri Lanka 2 707 2 707 1 678 1 029 Area total 270 959 110 322 381 281 156 509 224 772 MIDDLE EAST AND NORTH AFRICA Algeria 3 663 3 663 2 304 1 359 Djibouti 3 592 -642 2 950 1 648 1 302 Egypt 5 932 2 347 8 279 5 387 2 892 Iran, (Islamic Republic of) 2 380 8 514 10 894 3 858 7 036 Iraq 2 850 4 028 6 878 3 135 3 743 Jordan 3 100 109 3 209 1 769 1 440 Lebanon 1 937 165 2 102 1 374 728 Morocco 4 683 609 5 292 3 443 1 849 Oman 45 106 151 10 141 Palestinian children and mothers 3 368 5 024 8 392 3 556 4 836 Sudan 15 757 20 041 35 798 27 055 8 743 Syrian Arab Republic 3 119 430 3 549 1 999 1 550 Tunisia 2 180 343 2 523 1 524 999 Yemen 12 863 1 069 13 932 8 718 5 214 Regional 17 426 443 238 205
Area total 65 486 42 569 108 055 66 018 42 037

A/61/5/A
dd.2
06-42517 91
STATEMENT VII-1 (continued) Approved programmes New Approved programmes unspent balances programmes Total Total unspent balances Area and country assistance as at January 2004 and cancellations programmes expenditures as at 31 December 2005 CENTRAL AND EASTERN EUROPE,
THE COMMONWEALTH OF INDEPENDENT STATES
AND THE BALTIC STATES Albania 1 495 4 096 5 591 1 675 3 916 Armenia 723 3 506 4 229 1 507 2 722 Azerbaijan 1 107 5 395 6 502 2 277 4 225 Belarus 1 323 3 486 4 809 1 330 3 479 Bosnia and Herzegovina 939 3 163 4 102 1 729 2 373 Bulgaria 2 464 2 464 2 464 Croatia (17) 484 467 457 10 Georgia 1 517 3 670 5 187 1 640 3 547 Kazakhstan 1 000 5 221 6 221 2 297 3 924 Kosovo, Serbia and Montenegro 1 489 2 410 3 899 3 079 820 Kyrgyzstan 1 157 5 567 6 724 2 035 4 689 Republic of Moldova 2 282 300 2 582 1 754 828 Romania 888 3 905 4 793 1 619 3 174 Russian Federation 1 906 5 412 7 318 2 507 4 811 Tajikistan 1 384 6 421 7 805 3 155 4 650 The former Yugoslav Republic of Macedonia 717 3 597 4 314 1 725 2 589 Turkey 2 229 6 333 8 562 3 137 5 425 Turkmenistan 1 100 4 680 5 780 1 940 3 840 Ukraine 2 243 5 465 7 708 2 467 5 241 Uzbekistan 1 869 9 730 11 599 4 144 7 455 Serbia and Montenegro 879 3 487 4 366 1 728 2 638 Yugoslavia (former) 1 1 1 Regional 4 820 (189) 4 631 2 385 2 246 Area total 31 051 88 603 119 654 44 587 75 067 GLOBAL ASSISTANCE Emergency Programme Fund 42 064 (13 442) 28 622 9 948 18 674 Immunization 737 737 737 Inter-country programmes 36 392 25 466 61 858 34 377 27 481 TOTAL GLOBAL ASSISTANCE 79 193 12 024 91 217 44 325 46 892 TOTAL PROGRAMME ASSISTANCE 1 142 543 816 397 1 958 940 884 014 1 074 926

A/61/5/A
dd.2
92 06-42517
STATEMENT VII-1 (concluded) Approved programmes New Approved programmes unspent balances programmes Total Total unspent balances Area and country assistance as at January 2004 and cancellations programmes expenditures as at 31 December 2005 Programme support 469 102 3 767 472 869 455 491 17 378 Management and administration 229 804 5 166 234 970 226 748 8 222 Recoveries to the budget (200 900) (200 900) (200 900) TOTAL BUDGET 698 906 (191 967) 506 939 481 339 25 600 TOTAL COOPERATION 1 841 449 624 430 2 465 879 1 365 353 1 100 526

A/61/5/A
dd.2
06-42517 93
STATEMENT VII-2
PROGRAMME COOPERATION: STATEMENT OF APPROVED PROGRAMMES, EXPENDITURES AND UNSPENT BALANCES
FOR SUPPLEMENTARY FUNDS FOR THE BIENNIUM ENDED 31 DECEMBER 2005
(In thousands of United States dollars)
Approved
programmes New Approved programmes unspent balances programmes Total Total unspent balances Area and country assistance as at January 2004 and cancellations programmes expenditures as at 31 December 2005 AFRICA Angola 5 118 34 916 40 034 23 010 17 024 Benin 3 460 8 877 12 337 8 839 3 498 Botswana 293 2 997 3 290 1 836 1 454 Burkina Faso 5 044 13 139 18 183 13 530 4 653 Burundi 1 390 10 492 11 882 6 772 5 110 Cameroon 2 300 10 271 12 571 9 833 2 738 Cape Verde 546 699 1 245 766 479 Central African Republic 1 225 4 230 5 455 3 384 2 071 Chad 3 150 11 462 14 612 10 423 4 189 Comoros 99 2 031 2 130 259 1 871 Congo 108 6 327 6 435 3 888 2 547 Côte d'Ivoire 1 972 15 223 17 195 13 932 3 263 Democratic Republic of the Congo 5 657 44 104 49 761 33 020 16 741 Equatorial Guinea 307 1 567 1 874 766 1 108 Eritrea 8 857 3 845 12 702 8 378 4 324 Ethiopia 20 057 42 265 62 322 50 513 11 809 Gabon 251 1 285 1 536 1 361 175 Gambia 1 037 1 515 2 552 1 754 798 Ghana 11 637 13 240 24 877 20 317 4 560 Guinea 1 950 7 341 9 291 6 443 2 848 Guinea-Bissau 1 387 3 769 5 156 2 949 2 207 Kenya 3 736 20 342 24 078 10 708 13 370 Lesotho 1 059 5 195 6 254 3 687 2 567 Liberia 2 609 7 168 9 777 5 324 4 453 Madagascar 1 598 13 889 15 487 11 485 4 002 Malawi 8 408 25 024 33 432 25 366 8 066 Mali 4 588 15 818 20 406 14 659 5 747 Mauritania 2 094 4 933 7 027 4 571 2 456 Mauritius 3 3 3 Mozambique 14 141 14 879 29 020 18 628 10 392 Namibia 1 703 5 846 7 549 4 799 2 750 Niger 3 382 16 528 19 910 13 105 6 805 Nigeria 11 669 142 679 154 348 52 305 102 043 Rwanda 3 180 6 363 9 543 5 382 4 161 Sao Tome and Principe 32 238 270 268 2 Senegal 4 193 10 161 14 354 7 257 7 097

A/61/5/A
dd.2
94 06-42517
STATEMENT VII-2 (continued)
Approved
programmes New Approved programmes unspent balances programmes Total Total unspent balances Area and country assistance as at January 2004 and cancellations programmes expenditures as at 31 December 2005 Sierra Leone 3 270 16 075 19 345 10 777 8 568 Somalia 6 732 33 965 40 697 22 728 17 969 South Africa 2 649 9 929 12 578 7 539 5 039 Swaziland 1 004 4 998 6 002 3 188 2 814 Togo 1 232 4 134 5 366 3 402 1 964 Uganda 8 923 10 410 19 333 14 421 4 912 United Republic of Tanzania 9 486 12 571 22 057 12 443 9 614 Zambia 4 143 8 804 12 947 6 630 6 317 Zimbabwe 3 395 13 460 16 855 9 493 7 362 Regional 845 307 1 152 564 588 Area total 179 919 643 311 823 230 490 702 332 528 THE AMERICAS AND THE CARIBBEAN Argentina 2 379 4 635 7 014 5 197 1 817 Barbados 54 54 54 Belize 81 76 157 134 23 Bolivia 7 134 18 173 25 307 11 567 13 740 Brazil 7 692 14 274 21 966 17 008 4 958 Chile 147 774 921 630 291 Colombia 1 577 6 885 8 462 5 756 2 706 Costa Rica 244 62 306 214 92 Cuba 523 1 674 2 197 1 546 651 Dominican Republic 3 424 729 4 153 3 276 877 Ecuador 1 551 3 765 5 316 3 881 1 435 El Salvador 927 1 305 2 232 1 623 609 Guatemala 4 169 6 959 11 128 6 531 4 597 Guyana 99 1 202 1 301 283 1 018 Haiti 1 432 10 581 12 013 6 013 6 000 Honduras 279 2 428 2 707 1 159 1 548 Jamaica 658 2 429 3 087 2 352 735 Mexico 1 906 5 160 7 066 4 521 2 545 Nicaragua 9 612 2 517 12 129 7 766 4 363 Panama 48 705 753 480 273 Paraguay 711 1 576 2 287 2 071 216 Peru 1 053 4 944 5 997 5 110 887 Suriname 1 877 1 877 1 877 Uruguay 544 558 1 102 960 142 Venezuela 377 885 1 262 1 018 244 Regional 1 387 2 915 4 302 2 129 2 173 Area total 47 954 97 142 145 096 91 225 53 871

A/61/5/A
dd.2
06-42517 95
STATEMENT VII-2 (continued)
Approved
programmes New Approved programmes unspent balances programmes Total Total unspent balances Area and country assistance as at January 2004 and cancellations programmes expenditures as at 31 December 2005 EAST ASIA AND THE PACIFIC Cambodia 19 074 24 343 43 417 23 221 20 196 China 4 766 12 776 17 542 9 704 7 838 Democratic People's Republic of Korea 534 2 411 2 945 1 861 1 084 Indonesia 3 741 63 531 67 272 30 490 36 782 Lao People's Democratic Republic 5 972 6 054 12 026 8 015 4 011 Malaysia 215 215 30 185 Mongolia 1 044 2 578 3 622 2 500 1 122 Myanmar 4 884 9 526 14 410 6 449 7 961 Pacific island countries 856 4 466 5 322 2 129 3 193 Papua New Guinea 883 8 851 9 734 2 371 7 363 Philippines 1 693 30 852 32 545 7 696 24 849 Thailand 4 051 6 428 10 479 7 440 3 039 Timor-Leste 9 026 8 025 17 051 9 088 7 963 Viet Nam 8 415 14 598 23 013 13 805 9 208 Area total 64 939 194 654 259 593 124 799 134 794 SOUTH ASIA Afghanistan 17 693 59 071 76 764 57 894 18 870 Bangladesh 25 562 78 984 104 546 50 066 54 480 Bhutan 1 236 2 654 3 890 2 618 1 272 India 38 183 137 754 175 937 111 486 64 451 Maldives 20 532 552 99 453 Nepal 5 740 20 915 26 655 18 235 8 420 Pakistan 17 952 32 272 50 224 40 775 9 449 Sri Lanka 1 972 11 765 13 737 7 885 5 852 Area total 108 358 343 947 452 305 289 058 163 247 MIDDLE EAST AND NORTH AFRICA Algeria 705 573 1 278 774 504 Djibouti 516 3 932 4 448 2 907 1 541 Egypt 8 817 16 156 24 973 18 003 6 970 Iran (Islamic Republic of) 733 2 452 3 185 1 459 1 726 Iraq 2 571 137 717 140 288 103 485 36 803 Jordan 590 700 1 290 548 742 Lebanon 262 618 880 535 345 Morocco 2 217 2 149 4 366 2 999 1 367 Oman 125 1 082 1 207 955 252 Palestinian children and mothers 4 192 6 027 10 219 6 850 3 369 Sudan 1 522 20 472 21 994 14 657 7 337

A/61/5/A
dd.2
96 06-42517
STATEMENT VII-2 (continued)
Approved
programmes New Approved programmes unspent balances programmes Total Total unspent balances Area and country assistance as at January 2004 and cancellations programmes expenditures as at 31 December 2005 Syrian Arab Republic 290 463 753 276 477 Tunisia 257 487 744 629 115 Yemen 7 781 16 999 24 780 13 767 11 013 Regional 110 1 362 1 472 225 1 247 Area total 30 688 211 189 241 877 168 069 73 808 CENTRAL AND EASTERN EUROPE,
THE COMMONWEALTH OF INDEPENDENT STATES
AND THE BALTIC STATES Albania 3 678 5 848 9 526 4 957 4 569 Armenia 317 1 277 1 594 566 1 028 Azerbaijan 539 3 233 3 772 2 263 1 509 Belarus 383 249 632 386 246 Bosnia and Herzegovina 2 789 5 844 8 633 6 465 2 168 Bulgaria 214 302 516 516 Croatia 64 1 216 1 280 645 635 Georgia 489 1 770 2 259 986 1 273 Kazakhstan 245 2 482 2 727 1 083 1 644 Kosovo, Serbia and Montenegro 1 344 2 381 3 725 2 117 1 608 Kyrgyzstan 335 184 519 424 95 Republic of Moldova 1 902 8 445 10 347 3 728 6 619 Romania 2 802 2 615 5 417 3 991 1 426 Russian Federation 983 5 611 6 594 3 677 2 917 Serbia and Montenegro 3 897 3 862 7 759 4 301 3 458 Tajikistan 1 038 3 881 4 919 3 620 1 299 The former Yugoslav Republic of Macedonia 1 917 1 826 3 743 1 816 1 927 Turkey 982 11 070 12 052 2 803 9 249 Turkmenistan 291 29 320 341 (21) Ukraine 492 1 677 2 169 2 103 66 Uzbekistan 315 1 035 1 350 682 668 Regional 3 901 884 4 785 1 711 3 074 Area total 28 917 65 721 94 638 48 665 45 973 GLOBAL ASSISTANCE Emergency Programme Fund 5 047 13 457 18 504 9 215 9 289 Immunization 2 800 7 824 10 624 5 521 5 103

A/61/5/A
dd.2
06-42517 97
STATEMENT VII-2 (concluded)
Approved
programmes New Approved programmes unspent balances programmes Total Total unspent balances Area and country assistance as at January 2004 and cancellations programmes expenditures as at 31 December 2005 Inter-country programmes 88 151 179 609 267 760 166 061 101 699 Innocenti Research Centre 7 449 7 789 15 238 7 328 7 910 TOTAL GLOBAL ASSISTANCE 103 447 208 679 312 126 188 125 124 001 TOTAL PROGRAMME ASSISTANCE 564 222 1 764 643 2 328 865 1 400 643 928 222

A/61/5/A
dd.2
98 06-42517
STATEMENT VII-3
PROGRAMME COOPERATION: STATEMENT OF APPROVED PROGRAMMES, EXPENDITURES AND UNSPENT BALANCES
FOR EMERGENCY RELIEF AND REHABILITATION FOR THE BIENNIUM ENDED 31 DECEMBER 2005
(In thousands of United States dollars) Approved programmes New Approved programmes unspent balances programmes Total Total unspent balances Area and country assistance as at January 2004 and cancellations programmes expenditures as at 31 December 2005 AFRICA Angola 3 462 16 759 20 221 16 892 3 329 Benin 11 1 836 1 847 924 923 Botswana (58) (20) (78) (27) (51) Burkina Faso (31) 233 202 264 (62) Burundi 2 689 20 428 23 117 20 638 2 479 Cameroon 549 549 492 57 Central African Republic 175 2 993 3 168 2 289 879 Chad 1 19 316 19 317 13 100 6 217 Comoros 248 600 848 732 116 Congo 445 1 783 2 228 796 1 432 Côte d'Ivoire 5 607 8 617 14 224 12 827 1 397 Democratic Republic of the Congo 5 569 43 493 49 062 45 705 3 357 Eritrea 4 179 8 814 12 993 10 336 2 657 Ethiopia 16 058 34 727 50 785 46 692 4 093 Gambia 105 105 105 Ghana 59 223 282 255 27 Guinea 251 2 628 2 879 2 870 9 Guinea-Bissau 31 519 550 550 Kenya 844 3 898 4 742 4 152 590 Lesotho 358 297 655 553 102 Liberia 4 867 27 596 32 463 22 692 9 771 Madagascar 174 632 806 630 176 Malawi 2 788 12 221 15 009 6 102 8 907 Mali (33) 754 721 100 621 Mauritania 1 226 1 150 2 376 2 062 314 Mozambique 3 769 1 893 5 662 4 602 1 060 Namibia 421 421 65 356 Niger 19 019 19 019 15 959 3 060 Rwanda (793) 557 (236) 130 (366) Sao Tome and Principe 316 316 316 Senegal 809 575 1 384 817 567 Sierra Leone 4 058 3 248 7 306 6 688 618 Somalia 3 318 30 257 33 575 23 260 10 315 Swaziland 1 974 1 039 3 013 2 841 172 Uganda 1 405 34 396 35 801 23 433 12 368

A/61/5/A
dd.2
06-42517 99
STATEMENT VII-3 (continued) Approved programmes New Approved programmes unspent balances programmes Total Total unspent balances Area and country assistance as at January 2004 and cancellations programmes expenditures as at 31 December 2005 United Republic of Tanzania 1 636 4 760 6 396 5 435 961 Zambia 1 545 389 1 934 1 831 103 Zimbabwe 6 277 9 661 15 938 11 163 4 775 Regional 7 313 3 021 10 334 4 309 6 025 Area total 80 231 319 703 399 934 311 609 88 325 THE AMERICAS AND THE CARIBBEAN Argentina (14) (14) (14) Barbados 212 212 212 Belize Bolivia 2 167 169 168 1 Colombia 1 285 2 148 3 433 1 703 1 730 Cuba 1 123 124 123 1 Dominican Republic (3) 10 7 6 1 Ecuador 22 22 22 El Salvador 55 2 833 2 888 1 342 1 546 Guatemala (97) 4 831 4 734 1 293 3 441 Guyana 498 498 493 5 Haiti 9 784 9 784 8 121 1 663 Honduras (34) (34) 11 (45) Jamaica 224 224 162 62 Mexico 869 869 869 Nicaragua 766 766 724 42 Peru 25 110 135 129 6 Venezuela 14 93 107 91 16 Regional 1 191 (209) 982 310 672 Area total 2 461 22 445 24 906 14 676 10 230 EAST ASIA AND THE PACIFIC Cambodia (40) (40) (40) China (2) 166 164 167 (3) Democratic People's Republic of Korea 1 747 25 368 27 115 25 243 1 872 Indonesia 712 309 300 310 012 95 885 214 127 Malaysia 3 696 3 696 677 3 019 Mongolia 38 (24) 14 14 Myanmar 10 417 10 417 3 833 6 584 Philippines 1 424 1 424 1 423 1 Thailand 23 336 23 336 7 467 15 869 Timor-Leste 727 202 929 614 315

A/61/5/A
dd.2
100 06-42517
STATEMENT VII-3 (continued)
Approved programmes New Approved programmes unspent balances programmes Total Total unspent balances Area and country assistance as at January 2004 and cancellations programmes expenditures as at 31 December 2005 Viet Nam 14 186 200 63 137 Regional 6 386 6 386 2 223 4 163 Area total 3 196 380 457 383 653 137 595 246 058 SOUTH ASIA Bangladesh 221 18 471 18 692 15 988 2 704 India 1 824 33 809 35 633 18 083 17 550 Maldives 55 687 55 687 23 993 31 694 Pakistan 3 96 710 96 713 50 385 46 328 Sri Lanka 9 931 188 879 198 810 77 987 120 823 Regional 5 465 5 465 2 195 3 270 Area total 11 979 399 021 411 000 188 631 222 369 MIDDLE EAST AND NORTH AFRICA Algeria 95 160 255 240 15 Djibouti (6) 340 334 297 37 Iran (Islamic Republic of) 1 071 28 474 29 545 22 128 7 417 Iraq 93 377 2 030 95 407 88 234 7 173 Jordan (26) (1) (27) (6) (21) Kuwait 30 30 30 Lebanon (9) (9) (9) Morocco 640 640 568 72 Palestinian children and mothers 1 859 25 646 27 505 15 507 11 998 Sudan 16 583 241 494 258 077 193 100 64 977 Syrian Arab Republic (23) (43) (66) (66) Yemen 1 998 999 253 746 Regional 18 480 1 435 19 915 8 971 10 944 Area total 131 432 301 173 432 605 329 292 103 313 CENTRAL AND EASTERN EUROPE,
THE COMMONWEALTH OF INDEPENDENT STATES
AND THE BALTIC STATES Albania 240 (37) 203 (4) 207 Armenia (12) (12) (12) Azerbaijan 2 (2) Belarus 2 2 2 Bosnia and Herzegovina 1 196 30 1 226 490 736 Croatia 220 220 (1) 221 Georgia 37 683 720 435 285

A/61/5/A
dd.2
06-42517 101
STATEMENT VII-3 (concluded) Approved programmes New Approved programmes unspent balances programmes Total Total unspent balances Area and country assistance as at January 2004 and cancellations programmes expenditures as at 31 December 2005 Kosovo, Serbia and Montenegro 88 79 167 1 228 (1 061) Romania 6 6 6 Russian Federation 754 13 037 13 791 12 833 958 Serbia and Montenegro 633 (107) 526 146 380 Tajikistan 1 107 2 448 3 555 3 446 109 The former Yugoslav Republic of Macedonia 126 (12) 114 72 42 Turkey 59 (19) 40 10 30 Turkmenistan 4 (7) (3) (3) Ukraine 15 15 15 Yugoslavia (former) 23 23 23 Regional 3 223 (78) 3 145 (14) 3 159 Area total 7 723 16 015 23 738 18 626 5 112 GLOBAL ASSISTANCE Emergency Programme Fund 23 841 23 841 1 093 22 748 Inter-dcountry programmes 10 22 563 22 573 3 804 18 769 TOTAL GLOBAL ASSISTANCE 10 46 404 46 414 4 897 41 517 TOTAL PROGRAMME ASSISTANCE 237 032 1 485 218 1 722 250 1 005 326 716 924

A/61/5/Add.2
06-42517 102
B. Notes to the financial statements
Note 1 Statement of the objectives and activities of UNICEF
1. UNICEF is mandated by the United Nations General Assembly to advocate for the protection of children’s rights, to help meet their basic needs and to expand their opportunities to reach their full potential. The organization mobilizes political will and material resources to help countries, particularly developing countries, ensure a “first call for children” and build their capacity to form appropriate policies and deliver services for children and their families.
Note 2 Summary of significant accounting policies
Accounting conventions
2. The financial statements are prepared in accordance with the Financial Regulations and Rules of UNICEF and the United Nations system accounting standards.
3. In line with the goal of achieving harmonization of the presentation of the accounts by agencies in the United Nations system, the financial statements are presented in line with the formats agreed upon by the United Nations System Chief Executives Board for Coordination.
Financial period
4. In accordance with the UNICEF Financial Regulations and Rules, the accounts are maintained on a biennial basis.
Unit of account
5. The accounting unit is the United States dollar. The equivalent in United States dollars of other currencies is established on the basis of the United Nations operational rate of exchange.
Translation of currencies
6. Differences between the valuation of the currencies when entered into the accounts and when actual transactions are completed are accounted for as gains or losses on exchange transactions. Periodically, assets and liabilities in currencies other than United States dollars are revalued for accounting purposes at the prevailing United Nations operational rates of exchange. Any variance due to fluctuation of those rates is accounted for as income or loss and shown separately in the statement of income and expenditure. In accordance with UNICEF Executive Board decision 1990/28,a differences resulting from the payment of contributions pledged in currencies other than United States dollars are recorded against the contributions.
__________________
a See Official Records of the Economic and Social Council 1990, Supplement No. 8 (E/1990/28), chap. IV.

A/61/5/Add.2
103 06-42517
Income
7. Income consists of regular resources, supplementary funds and funds for emergency relief and rehabilitation. Regular resources include funds from the voluntary annual contributions of Governments, intergovernmental organizations and NGOs, the net income from the Private Sector Division, unearmarked funds contributed by the public and other income. Supplementary funds are those contributed to UNICEF by Governments, intergovernmental organizations, NGOs and the United Nations system for specific purposes within the programmes approved by the UNICEF Executive Board. Emergency relief and rehabilitation funds include those contributed for emergency operations.
8. Income is recorded on the basis of funds or pledges received for the current year. Funds received for future years for purposes specified by donors are considered deferred income and recorded as “contributions received in advance”.
9. Contribution income received from National Committees for UNICEF is accounted for on a cash basis, with the exception of contributions for supplementary funds and for emergency relief and rehabilitation, which may be recorded on the basis of a valid pledge from a National Committee. The validity of the pledge is determined by the existence of funds raised and a statement from the National Committee that it is committing funds to UNICEF in the form of a pledge.
10. The statement of income and expenditures does not include funds received and disbursements made from trust funds. Those transactions that do not require commitments by the Executive Board are maintained as trust funds.
11. All other income received by UNICEF is classified as miscellaneous income and is credited as regular resources.
12. Contributions in kind (supplies) are valued by management and reflect the cost UNICEF would normally pay for similar items.
13. Supported deliveries are not reflected in the financial accounts of UNICEF, although they are handled through the administrative structures of the organization.
Expenditure
14. All expenditures of UNICEF are accounted for on an accrual basis, except for those relating to staff entitlements, which are accounted for on the basis of cash disbursements only.
15. Deferred charges comprise expenditure items which are not properly chargeable in the current financial period and which will be charged as expenditure in a subsequent financial period.
16. No provision is made for staff entitlements such as repatriation, that will arise in the future or to meet contingencies under appendix D of the United Nations Staff Rules, as funds are provided in the budget appropriations as required.
Cash
17. All funds received, including those under trust fund arrangements, are deposited into UNICEF bank accounts and are reflected as cash holdings.

A/61/5/Add.2
06-42517 104
Stock
18. The stock of programme supplies at the UNICEF Supply Division warehouses is shown at average cost. All costs associated with bringing the goods to the warehouse are considered as part of the average cost. Goods in transit to the warehouse are valued at actual cost.
Capital assets cost
19. Capital assets consist of buildings and staff housing presented at their acquisition cost. The Private Sector Division machinery and equipment are depreciated over the estimated useful life of these assets.
Non-expendable property
20. Furniture, equipment and other non-expendable property are not included in the assets of the organization. Acquisitions are charged against budgetary accounts in the year of purchase.
Capital asset reserve
21. By its decision 1990/26,a the Executive Board authorized the establishment of a capital asset reserve fund to better control future purchases of UNICEF capital assets, mainly buildings to be purchased for office accommodation and staff housing in the field. At such time as may be necessary, additional authorized appropriations will be made to replenish the capital asset reserve.
Consolidation of Private Sector Division accounts
22. The financial report and accounts reflect UNICEF income, expenditure, assets and liabilities, including the net operating income, assets and liabilities of the Private Sector Division. Inter-office transactions between UNICEF and the Division are eliminated for Private Sector Division consolidation purposes.
Private Sector Division accounting conventions
23. The Private Sector Division accounts are maintained in accordance with the Financial Regulations and Rules of UNICEF and the Greeting Card Operation special supplement thereto.
Private Sector Division translation of currencies
24. Proceeds are recorded in local currency on the basis of annual reporting and are converted to United States dollars at the United Nations operational rates of exchange prevailing on 31 December.
Private Sector Division allowance for exchange rate fluctuation and doubtful accounts receivable
25. The policy of making an allowance of 10 per cent of non-United States dollar-denominated outstanding accounts receivable as at 31 December as a provision for delays in the collection thereof was discontinued effective 31 December 2003. In accordance with Private Sector Division accounting policy, a provision to cover accounts receivable that are considered doubtful for collection may be established.

A/61/5/Add.2
105 06-42517
Private Sector Division inventories
26. The inventory of work in process and finished goods are valued at standard cost, while raw materials are valued at moving average cost. It is Private Sector Division policy to write down unsold cards and dated products at the end of the first sales campaign year and all other products at the end of the second sales campaign year. Products that have been written down and carried forward are valued at their add-on cost. All publicity and promotion materials produced in the current campaign year but relating to future campaign years are shown at standard cost and included in inventory.
Private Sector Division capital assets
27. Capital assets costing $100,000 or more are capitalized and depreciated over their estimated useful life.
Private Sector Division liabilities
28. Liabilities are accrued in the Private Sector Division accounts following recognized accounting standards, and appropriate cut-off procedures are followed consistently.
Private Sector Division income
29. Gross proceeds from the sale of cards and products are recorded in foreign currency and accrued on the basis of the provisional sales reports received from the sales partners at year’s end. They are converted into United States dollars at the United Nations operational rates of exchange prevailing on 31 December of the year in question. The accrual is adjusted in the following year on receipt of the final sales report. If the provisional sales report is not received from a sales partner by the end-of-year closure, gross proceeds are accrued on the basis of that sales partner’s average sales-to-delivery ratio for the current year.
30. Income from private sector fund-raising activities and related expenses are recorded separately in the Private Sector Division accounts. The net proceeds raised by National Committees from private sector fund-raising activities are recorded on the basis of the reports they submit at year’s end, while the net proceeds raised by field offices from private sector fund-raising activities are recorded upon receipt of funds.
Note 3 Transfer to the biennium support budget
31. A transfer is made from income to the biennium support budget, in keeping with the budget harmonization of UNDP, the United Nations Population Fund (UNFPA) and UNICEF, as follows:

A/61/5/Add.2
06-42517 106
2004-2005 2002-2003
(thousands of United States dollars)
Government contributions towards local costs 346 571
Income tax reimbursement 23 831 15 278
Total 24 177 15 849
32. In line with the recommendation of the external auditors, UNICEF included the income tax reimbursement for the short-term staff in the transfer to support budget items for the biennium 2004-2005. If the same basis had been applied, the figure for income tax reimbursement for 2002-2003 would have been $4.183 million more, a total of $19.461 million.
Note 4 Private Sector Division income
33. Net income from the Private Sector Division for the biennium ended 31 December 2005 was $579,689,000, broken down as follows:
2004 2005 Total 2002-2003
(thousands of United States dollars)
Income:
Gross proceeds from sales 161 518 145 645 307 163 277 394
Private sector fund-raising 260 988 268 353 529 341 503 687
Other income 8 799 16 440 25 239 10 972
Total 431 305 430 438 861 743 792 053
Total expenditures 140 180 141 873 282 053 221 257
Net income 291 125 288 565 579 690 570 796
Note 5 Miscellaneous income
2004-2005 2002-2003
(thousands of United States dollars)
Liquidation of prior year’s outstanding budgetary obligations 17 766 26 507
Income from the sale of surplus and obsolete property 2 022 1 729
Agency commissions from procurement services 12 689 1 915
Gains and losses on foreign exchange transactions 15 183 5 222
Miscellaneous — others 12 222 3 170
Total 59 882 38 543

A/61/5/Add.2
107 06-42517
Note 6 Write-offs
Regular
resourcesSupplementary
fundsEmergency relief
and rehabilitation Total
2004-2005Total
2002-2003
(thousands of United States dollars)
Uncollectible contributions 110 2665 5 344 8 119 12 453
Stock write-offs and other write-offs 4 347 4 347 3 904
Prior periods’ adjustments 44
Total 4457 2 665 5 344 12 466 16 401
Note 7 Reserves
Reserve for after-service health insurance
34. In 2003, the Executive Board authorized the establishment of a funded reserve for after-service health insurance for $30 million. The reserve was increased by $30 million during 2004-2005. Currently, disbursements for retirees are charged against the budget appropriations of the periods when actual payments are made (see note 19 for actuarial valuation).
Reserve for procurement services — staff and related costs
35. In 1993, the Executive Board authorized the establishment of a reserve for procurement services at $2 million.b There were no movements in the reserve during 2004-2005.
36. The income and expenditures relating to procurement services amounted to:
2004-2005 2002-2003
(thousands of United States dollars)
Funds received 28 710 12 160
Staff-related expenses 16 021 10 245
Transfer to miscellaneous income 12 689 1 915
Reserve for losses of programme supplies and equipment and property loss
37. In 1950, the Executive Board authorized the establishment of a reserve for insurance of $200,000 to absorb losses of UNICEF programme supplies and equipment not covered by commercial insurance. In 1987, UNICEF established a reserve of $100,000 to self-insure for property losses.
__________________
b See Official Records of the Economic and Social Council 1993, Supplement No. 14 (E/1993/34-E/ICEF/1993/14), chap. IV, decision 1993/19.

A/61/5/Add.2
06-42517 108
Reserve for capital asset fund
38. In 1990, the Executive Board authorized the establishment of a reserve for capital asset fund for field office accommodation, and staff housing in a total amount of $25 million.
39. The activities on all reserves are shown as follows:
Balances as at
1 January 2004 Funds receivedExpenses/
adjustments Balances as at
31 December 2005
(thousands of United States dollars)
Reserve for procurement services 2 000 2 000
Reserve for insurance 142 27 115
Reserve for capital assets 26 872 94 26 966
Reserve for after-service health insurance 30 000 30 000 60 000
Total 59 014 30 094 27 89 081
Note 8 Cash and term deposits
2005 2003
(thousands of United States dollars)
Term deposits 2 125 318 927 233
Cash (convertible) 61 636 26 867
Cash (non-convertible) 7 557 7 259
Total cash and term deposits 2 194 511 961 359
Note 9 Ageing analysis of contributions receivable
Prior to 2003 2003 2004 2005 Total 2005 Total 2003
(thousands of United States dollars)
5 535 3 134 14 629 163 751 187 049 269 093
Note 10 Provision for uncollectible contributions receivable
40. In line with the recommendation of the external auditors,c UNICEF maintains a provision for potentially uncollectible contributions receivable. This provision is set at $5 million.
__________________
c See Official Records of the General Assembly, Fifty-first Session, Supplement No. 5B (A/51/5/Add.2), para. 35.

A/61/5/Add.2
109 06-42517
Note 11 Other accounts receivable
2005 2003
(thousands of United States dollars)
From NGOs for fund-raising campaigns of National Committees for UNICEF 309 692 312 504
Less Private Sector Division allowance for exchange rate fluctuation and uncollectible accounts (7 265) (28 241)
From Governments, United Nations agencies and other organizations for trust funds 4 693 21 022
From United Nations and specialized agencies 8 556 4 959
From staff members 21 025 21 432
From banks — accrued interest 6 640 3 074
Advances to suppliers for goods and freight 7 714 8 296
From Governments — other 1 133 1 083
Deposits and prepayments 967 612
Miscellaneous 164 157
Total 353 319 344 898
Note 12 Inventories
2005 2003
(thousands of United States dollars)
Programme supplies in warehouse 18 343 23 222
Packing materials in warehouse 304 251
Private Sector Division — raw materials 2 809 2 402
— work in progress 116 189
— finished goods 3 970 2 455
Total 25 542 28 519

A/61/5/Add.2
06-42517 110
Note 13 Buildings and equipment
UNICEF office
buildingsUNICEF housing
Private Sector Division machinery
and equipment Total
(thousands of United States dollars)
As at 31 December 2003 12 373 580 76 13 029
Additions 2 821 47 2 868
Depreciation 76 76
As at 31 December 2005 15 194 627 15 821
Note 14 Contributions received in advance
2005 2003
(thousands of United States dollars)
Governments and intergovernmental agencies 18 057 1 852
Others 1 898
Total 18 058 2 750
41. Further to contributions received in advance, pledges amounting to $282,217,000 have already been received for future years.
Note 15 Unliquidated obligations
2005 2003
(thousands of United States dollars)
Programme accounts 265 844 117 810
Administrative accounts 17 883 10 081
Total 283 727 127 891

A/61/5/Add.2
111 06-42517
Note 16 Accounts payable
2005 2003
(thousands of United States dollars)
To the United Nations and specialized agencies 18 831 2 621
Central Emergency Revolving Fund 3 621 3 427
Supplies, services and freight 65 954 65 716
Miscellaneous 12 467 8 491
Total 100 873 80 255
Note 17 Trust funds
2005 2003
(thousands of United States dollars)
Net balance 331 892 268 374
Receivable from trust funds 4 693 21 023
Gross balance 336 585 289 397
Note 18 Medical insurance plans
2004-2005 2002-2003
(thousands of United States dollars)
Opening balance 31 450 24 343
Premiums 17 921 15 996
Expenditures 9 802 8 889
Ending balance 39 569 31 450
42. The Medical Insurance Plan is a health and dental insurance plan operated by the United Nations, UNDP, the Office of the United Nations High Commissioner for Refugees (UNHCR) and UNICEF at designated duty stations for the benefit of locally recruited General Service staff members, national Professional officers, former staff members and their eligible family members. Staff and the organization share in the cost of the premiums. The balance represents premiums less expenses.
Note 19 After-service health insurance liability
43. In order to gain a better understanding of the financial dimensions of the organization’s liability for after-service health insurance, a consulting actuary was

A/61/5/Add.2
06-42517 112
engaged to carry out an actuarial valuation of post-retirement health insurance benefits as at 31 December 2005. On the basis of that study, it has been estimated that UNICEF liability as at 31 December 2005 for after-service health insurance benefits covering all participants is as follows:
Present value of future benefits
as at 31 December 2005Accrued liability
as at 31 December 2005
(thousands of United States dollars)
Gross liability 589 213 368 946
Offset from retirees 121 769 76 566
Total 467 444 292 380
44. The present value of future benefits is the discounted value of all benefits, less retiree contributions, to be paid in the future to all current retirees and active employees expected to retire in the future. In actuarial terminology, it is called the expected post-retirement benefit obligation.
45. The accrued liability for future benefits represents that portion of the present value of benefits that has accrued from the employee’s date of hire until the valuation date. An active employee’s benefit is fully accrued when that employee has reached the date of full eligibility for benefits. Thus, for retirees and active employees who are eligible to retire with benefits, the present value of future benefits and the accrued liability are equal. In actuarial terminology, the accrued liability is called the accumulated post-retirement benefit obligation.
46. As at 31 December 2005, the balance for after-service health insurance reserve is $60 million (see note 7, para. 34).
Note 20 Other end-of-service liabilities
47. The net contingent liability for staff benefits as at 31 December 2005 is estimated at $75,811,000, consisting of the following:
2005 2003
(thousands of United States dollars)
Accumulated leave 38 902 33 041
Repatriation grant 36 909 33 911
Total 75 811 66 952
48. There is no provision in the accounts for the above amount. The expenditures will be charged against the budget appropriations of the periods when actual payments are made.

A/61/5/Add.2
113 06-42517
Note 21 United Nations Joint Staff Pension Fund
49. UNICEF is a member organization participating in the United Nations Joint Staff Pension Fund, which was established by the General Assembly to provide retirement, death, disability and related benefits. The Pension Fund is a funded defined benefit plan. The financial obligations of the organization to the Pension Fund consist of its mandated contribution at the rate established by the General Assembly, together with any share of any actuarial deficiency payments under article 26 of the Regulations and Rules of the Fund. Such deficiency payments are payable only if and when the General Assembly has invoked the provision of article 26, following determination that there is a requirement for deficiency payments based on an assessment of the actuarial sufficiency of the Fund as of the valuation date.
50. At the time of preparation of the present report, the General Assembly had not invoked this provision.
Note 22 Non-expendable property
2005 2003
(thousands of United States dollars)
Cost of non-expendable property — UNICEF 44 611 52 922
Cost of non-expendable property — under UNICEF custody 83 676 65 708
Total 128 287 118 630
51. All non-expendable property is charged against current year expenditure at the time of acquisition.
Note 23 Liquidity
52. UNICEF internal liquidity guidelines recommend a year-end regular resources convertible cash balance equal to at least 10 per cent of projected regular resources income for the following year.
53. The financial plan for 2005 recommended a minimum regular resource convertible cash balance of $84 million.
54. For the purpose of complying with that internal guideline, UNICEF cash balances, excluding trust funds, are estimated to be split between regular resources and other resources as follows:

A/61/5/Add.2
06-42517 114
Regular resources Other resources
(thousands of United States dollars)
Convertible cash balance 447 391 1 402 978
Non-convertible cash balance 7 557
Total 454 948 1 402 978
55. UNICEF complied with its internal liquidity guideline for the year 2005.
Note 24 In-kind contributions
56. During the biennium 2004-2005 UNICEF provided in-kind contributions to the organizations listed below.
Total 2004-2005 Total 2002-2003
(thousands of United States dollars)
Global Alliance for Vaccines and Immunization 512 953
Joint United Nations Programme on HIV/AIDS 118 113
United Nations Board of Auditors 57 45
Total 687 1 109

A/61/5/A
dd.2
06-42517 115
C. Schedules to the financial statements
SCHEDULE 1 CONTRIBUTIONS RECEIVED OR PLEDGED FOR THE BIENNIUM ENDED 31 DECEMBER 2005
(In thousands of United States Dollars) Other resources Regular resources Supplementary funds Emergency relief and rehabilitation
Donor
Governments and inter-
governmental agencies
Non-governmental
sources
Transfer to biennium support budget Subtotal
Governments and inter-
governmental agencies
Non-governmental
sources Subtotal
Governments and inter-
governmental agencies
Non-governmental
sources Subtotal TOTAL COUNTRIES Afghanistan 5 5 5 Algeria 48 48 34 34 82 Andorra 56 56 855 748 1 603 78 333 411 2 070 Argentina 4 291 4 291 84 84 4 375 Armenia 2 2 30 30 32 Australia 8 427 8 427 31 020 7 549 38 569 29 562 11 336 40 898 87 894 Austria 2 640 2 640 950 647 1 597 473 1 777 2 250 6 487 Azerbaijan 14 14 127 127 141 Bahamas 2 2 2 Bangladesh 69 69 338 8 346 218 218 633 Barbados 9 9 9 Belgium 7 431 7 431 9 604 2 984 12 588 8 369 16 760 25 129 45 148 Belize 100 100 4 4 104 Bhutan 15 15 14 14 29 Bolivia 47 140 187 187 Botswana 8 (8) 57 57 17 17 74 Brazil 9 179 9 179 760 760 9 939 Brunei Darussalam 116 116 116 Bulgaria 6 6 6 Burkina Faso 1 1 1 Burundi 2 2 2 Cambodia 15 15 1 1 16 Canada 21 083 21 083 89 235 9 547 98 782 80 214 21 127 101 341 221 206 Cayman Islands 9 9 9 Chile 155 155 107 584 691 25 800 825 1 671 China 2 417 2 417 1 384 1 384 1 000 176 1 176 4 977 Colombia 1 200 1 200 2 720 2 720 22 22 3 942 Costa Rica 16 16 16 Côte D’Ivoire 88 88 460 3 463 551 Croatia 1 1 51 1 165 1 216 1 217 Cuba 10 10 10 Cyprus 44 44 44 Czech Republic 562 562 39 453 492 232 1 191 1 423 2 477 Democratic People’s Republic of Korea 3 3 3 Denmark 60 317 60 317 9 726 2 226 11 952 11 605 8 568 20 173 92 442 Djibouti 1 1 1 East Timor 2 2 2 Ecuador 1 236 1 236 4 4 1 240 Egypt 3 3 3 Estonia 50 50 38 38 31 31 119 Ethiopia 100 100 100 Fiji 98 98 2 2 100 Finland 33 651 33 651 2 823 2 935 5 758 10 433 3 149 13 582 52 991

A/61/5/A
dd.2
116 06-42517
SCHEDULE 1 (continued) CONTRIBUTIONS RECEIVED OR PLEDGED FOR THE BIENNIUM ENDED 31 DECEMBER 2005
(In thousands of United States Dollars) Other resources Regular resources Supplementary funds Emergency relief and rehabilitation
Donor
Governments and inter-
governmental agencies
Non-governmental
sources
Transfer to biennium support budget Subtotal
Governments and inter-
governmental agencies
Non-governmental
sources Subtotal
Governments and inter-
governmental agencies
Non-governmental
sources Subtotal TOTAL France 21 457 21 457 7 477 13 608 21 085 9 888 78 042 87 930 130 472 Gabon 194 322 516 516 Gambia 112 112 112 Georgia 2 2 54 54 56 Germany 11 578 11 578 250 45 053 45 303 7 640 104 939 112 579 169 460 Ghana 15 15 15 Greece 600 600 1 283 1 283 68 68 136 2 019 Grenada 1 1 1 Guatemala 1 1 12 12 13 Guinea 13 13 13 Guyana 8 8 70 66 136 144 Haiti 10 10 10 Honduras 61 61 622 622 683 Hong Kong (China) 4 302 4 302 17 26 844 26 861 31 163 Hungary 48 48 117 117 47 87 134 299 Iceland 374 374 71 329 400 102 350 452 1 226 India 2 270 2 270 2 874 34 2 908 46 46 5 224 Indonesia 200 200 978 978 1 030 1 030 2 208 Iran, Islamic Republic of 54 54 9 9 8 8 71 Iraq 127 127 127 Ireland 21 977 21 977 4 540 2 094 6 634 8 864 3 984 12 848 41 459 Israel 120 120 33 33 153 Italy 29 004 29 004 15 085 24 096 39 181 19 753 31 075 50 828 119 013 Jamaica 1 (1) 78 78 78 Japan 47 240 47 240 118 957 12 135 131 092 120 886 31 549 152 435 330 767 Jordan 15 15 4 4 1 1 20 Kazakhstan 29 29 22 2 24 53 Kenya 405 405 16 16 421 Kuwait 600 600 500 500 1 100 Lao People’s Democratic Republic 16 16 1 1 17 Lebanon 10 10 283 283 113 113 406 Liechtenstein 17 17 56 56 162 162 235 Lithuania 17 17 17 Luxembourg 2 289 2 289 5 317 670 5 987 3 414 2 243 5 657 13 933 Malawi 9 9 24 24 33 Malaysia 252 252 68 68 447 447 767 Maldives 15 15 10 10 25 Mali 3 3 3 Mauritania 22 22 22 Mauritius 9 9 50 50 59 Mexico 428 428 11 3 992 4 003 3 201 3 201 7 632 Moldova, Republic of 1 1 1 Monaco 50 50 1 1 51 Mongolia 22 22 44 44 66 Morocco 258 258 11 62 73 753 753 1 084 Myanmar 1 (1) Namibia 3 3 120 120 123 Nepal 15 15 1 1 16 Netherlands 72 029 72 029 62 638 14 804 77 442 95 921 44 532 140 453 289 924

A/61/5/A
dd.2
06-42517 117
SCHEDULE 1 (continued) CONTRIBUTIONS RECEIVED OR PLEDGED FOR THE BIENNIUM ENDED 31 DECEMBER 2005
(In thousands of United States Dollars) Other resources Regular resources Supplementary funds Emergency relief and rehabilitation
Donor
Governments and inter-
governmental agencies
Non-governmental
sources
Transfer to biennium support budget Subtotal
Governments and inter-
governmental agencies
Non-governmental
sources Subtotal
Governments and inter-
governmental agencies
Non-governmental
sources Subtotal TOTAL New Zealand 3 038 3 038 5 779 698 6 477 2 163 937 3 100 12 615 Nicaragua 7 7 1 1 4 4 12 Nigeria 654 654 654 Norway 95 676 95 676 154 755 1 306 156 061 90 181 2 098 92 279 344 016 Oman 110 110 1 013 13 1 026 62 62 1 198 Others, Regular resources 2 2 2 Pakistan 150 (46) 104 44 44 4 4 152 Panama 54 54 600 179 779 8 8 841 Papua New Guinea 1 1 1 Paraguay 41 41 41 Peru 20 20 426 426 3 3 449 Philippines 88 (34) 54 1 299 1 299 221 221 1 574 Poland 40 40 62 62 200 164 364 466 Portugal 340 340 868 669 1 537 662 3 537 4 199 6 076 Qatar 100 100 100 Republic of Korea 4 200 4 200 2 613 2 613 3 100 3 100 6 200 13 013 Romania 26 26 735 735 761 Russian Federation 1 000 1 000 377 377 3 176 64 3 240 4 617 Rwanda 1 1 1 Saint Vincent and the Grenadines 2 2 2 Samoa 2 2 2 San Marino 97 97 11 11 108 Saudi Arabia 1 000 1 000 500 1 186 1 686 974 974 3 660 Senegal 26 26 177 177 1 1 204 Sierra Leone 524 524 524 Singapore 100 100 10 10 110 Slovak Republic 24 24 95 95 224 322 546 665 Slovenia 45 45 247 247 77 2 119 2 196 2 488 South Africa 31 31 14 14 356 57 413 458 Spain 4 993 4 993 2 967 14 509 17 476 5 432 19 939 25 371 47 840 Sri Lanka 15 15 216 216 33 33 264 Sweden 99 987 99 987 80 301 7 838 88 139 57 547 8 538 66 085 254 211 Switzerland 28 299 28 299 3 721 11 349 15 070 2 558 2 894 5 452 48 821 Syrian Arab Republic 6 6 6 Tajikistan 25 25 25 Thailand 469 (245) 224 295 4 437 4 732 2 433 2 433 7 389 Togo 44 23 67 67 Trinidad and Tobago 20 20 20 Tunisia 72 (11) 61 18 18 1 9 10 89 Turkey 240 240 598 598 500 1 010 1 510 2 348 Ukraine 47 2 49 49 United Arab Emirates 200 200 825 1 428 2 253 510 510 2 963 United Kingdom of Great Britain and Northern Ireland 69 338 69 338 155 968 29 698 185 666 121 880 50 139 172 019 427 023 United States of America 243 292 (23 831) 219 461 174 848 75 306 250 154 78 529 163 446 241 975 711 590 Uruguay 476 476 3 3 479 Venezuela 94 94 550 550 34 34 678 Viet Nam 33 33 11 11 100 100 144 Yemen 20 20 20

A/61/5/A
dd.2
118 06-42517
SCHEDULE 1 (continued) CONTRIBUTIONS RECEIVED OR PLEDGED FOR THE BIENNIUM ENDED 31 DECEMBER 2005
(In thousands of United States Dollars) Other resources Regular resources Supplementary funds Emergency relief and rehabilitation
Donor
Governments and inter-
governmental agencies
Non-governmental
sources
Transfer to biennium support budget Subtotal
Governments and inter-
governmental agencies
Non-governmental
sources Subtotal
Governments and inter-
governmental agencies
Non-governmental
sources Subtotal TOTAL Yugoslavia, Federal Republic of 249 249 353 18 371 620 Zambia 7 7 7 Zimbabwe 6 6 43 43 49 Subtotal, countries 902 731 (24 177) 878 554 946 772 329 229 1 276 001 777 553 659 187 1 436 740 3 591 295 INTERGOVERNMENTAL AGENCIES Agfund 220 220 150 150 370 Asian Development Bank 80 80 80 Council of Europe 23 23 23 European Commission Humanitarian Office 19 659 19 659 73 848 73 848 93 507 European Economic Community 40 038 40 038 5 869 5 869 45 907 OPEC Fund 2 150 2 150 300 300 2 450 Organization for Security 26 26 26 Subtotal, intergovernmental agencies 62 173 62 173 80 190 80 190 142 363 Income adjustments to prior periods 3 501 3 501 (1 224) 551 (673) (2 574) (373) (2 947) (119) Refund of contributions (3 992) (99) (4 091) (7 915) (73) (7 988) (12 079) TOTAL GOVERNMENT AND INTERGOVERNMENTAL AGENCIES 906 232 (24 177) 882 055 1 003 729 329 681 1 333 410 847 254 658 741 1 505 995 3 721 460 NON-GOVERNMENTAL ORGANIZATIONS Barbados 2 2 2 Bhutan 58 58 58 Canada 16 072 16 072 16 072 Catholic Relief Services (CARE) 150 150 150 Côte D’Ivoire 1 1 56 56 57 Denmark 59 59 59 France 142 142 291 291 433 GAVI Global Fund for Children’s Vaccines 7 824 7 824 7 824 Germany 29 29 25 25 54 Haiti 2 2 2 India 28 28 28 Indonesia 232 232 199 199 431
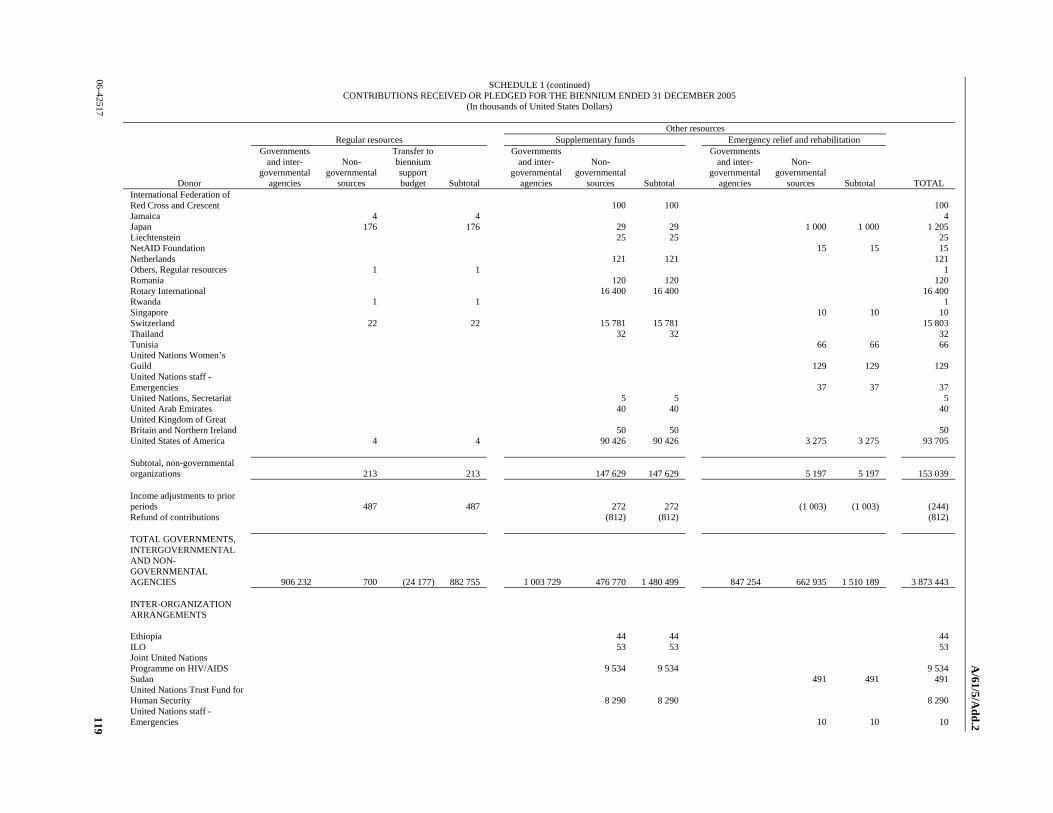
A/61/5/A
dd.2
06-42517 119
SCHEDULE 1 (continued) CONTRIBUTIONS RECEIVED OR PLEDGED FOR THE BIENNIUM ENDED 31 DECEMBER 2005
(In thousands of United States Dollars) Other resources Regular resources Supplementary funds Emergency relief and rehabilitation
Donor
Governments and inter-
governmental agencies
Non-governmental
sources
Transfer to biennium support budget Subtotal
Governments and inter-
governmental agencies
Non-governmental
sources Subtotal
Governments and inter-
governmental agencies
Non-governmental
sources Subtotal TOTAL International Federation of Red Cross and Crescent 100 100 100 Jamaica 4 4 4 Japan 176 176 29 29 1 000 1 000 1 205 Liechtenstein 25 25 25 NetAID Foundation 15 15 15 Netherlands 121 121 121 Others, Regular resources 1 1 1 Romania 120 120 120 Rotary International 16 400 16 400 16 400 Rwanda 1 1 1 Singapore 10 10 10 Switzerland 22 22 15 781 15 781 15 803 Thailand 32 32 32 Tunisia 66 66 66 United Nations Women’s Guild 129 129 129 United Nations staff - Emergencies 37 37 37 United Nations, Secretariat 5 5 5 United Arab Emirates 40 40 40 United Kingdom of Great Britain and Northern Ireland 50 50 50 United States of America 4 4 90 426 90 426 3 275 3 275 93 705
Subtotal, non-governmental organizations 213 213 147 629 147 629 5 197 5 197 153 039 Income adjustments to prior periods 487 487 272 272 (1 003) (1 003) (244) Refund of contributions (812) (812) (812) TOTAL GOVERNMENTS, INTERGOVERNMENTAL AND NON-GOVERNMENTAL AGENCIES 906 232 700 (24 177) 882 755 1 003 729 476 770 1 480 499 847 254 662 935 1 510 189 3 873 443 INTER-ORGANIZATION ARRANGEMENTS Ethiopia 44 44 44 ILO 53 53 53 Joint United Nations Programme on HIV/AIDS 9 534 9 534 9 534 Sudan 491 491 491 United Nations Trust Fund for Human Security 8 290 8 290 8 290 United Nations staff - Emergencies 10 10 10

A/61/5/A
dd.2
120 06-42517
SCHEDULE 1 (concluded) CONTRIBUTIONS RECEIVED OR PLEDGED FOR THE BIENNIUM ENDED 31 DECEMBER 2005
(In thousands of United States Dollars) Other resources Regular resources Supplementary funds Emergency relief and rehabilitation
Donor
Governments and inter-
governmental agencies
Non-governmental
sources
Transfer to biennium support budget Subtotal
Governments and inter-
governmental agencies
Non-governmental
sources Subtotal
Governments and inter-
governmental agencies
Non-governmental
sources Subtotal TOTAL UNDG 93 244 93 244 * 93 244 UNDP 867 867 4 874 4 874 5 741 UNESCO 386 386 386 UNFPA 1 898 1 898 116 116 2 014 UNOCHA 3 351 3 351 3 351 United Nations Capital Development Fund 63 63 63 United Nations Centre for Human Settlement 71 71 71 WHO 10 927 10 927 760 760 11 687 World Bank 10 785 10 785 548 548 11 333 World Food Programme 105 105 105 Subtotal, inter-organizational arrangements 136 267 136 267 10 150 10 150 146 417 Income adjustments to prior periods 144 144 300 300 444 Refund of contributions (256) (256) (82) (82) (338) TOTAL INTER-ORGANIZATIONAL ARRANGEMENTS 144 144 136 311 136 311 10 068 10 068 146 523 GRAND TOTAL 906 232 844 (24 177) 882 899 1 003 729 613 081 1 616 810 847 254 673 003 1 520 257 4 019 966
SUMMARY Regular
Resources Supplementary
Funds
Emergency Relief &
Rehabilitation Total Governments 881 979 941 904 768 168 2 592 051 Intergovernmental agencies 76 61 826 79 086 140 988 National Committees 329 681 658 741 988 422 Non-governmental organizations 700 147 088 4 194 151 982 Inter-organization arrangements 144 136 311 10 068 146 523 GRAND TOTAL 882 899 1 616 810 1 520 257 4 019 966 Contributions received in cash 3 987 844 Contributions received in kind 32 122 TOTAL CONTRIBUTIONS 4 019 966 * Includes $53.5 million from UNDG-ITF, which it received from the Government of Japan.

A/61/5/A
dd.2
06-42517 121
SCHEDULE 2
CONTRIBUTIONS RECEIVABLE FOR REGULAR RESOURCES, SUPPLEMENTARY FUNDS AND EMERGENCY RELIEF AND REHABILITATION AS AT 31 DECEMBER 2005
(In thousands of United States dollars)
Other resources Regular resources Supplementary funds Emergency relief and rehabilitation
Donor
Governments and inter-
governmental agencies
Non-govern-mental sources
Subtotal
Governments and inter-
governmental agencies
Non-govern-mental sources
Subtotal
Governments and inter-
governmental agencies
Non-govern-mental sources
Subtotal Total
GOVERNMENTS Andorra 272 272 272 Australia 1 126 1 126 1 126 Belgium 1 328 1 328 2 352 2 352 3 680 Bhutan 29 29 29 Bulgaria 3 3 3 Cameroon 14 14 14 Canada 9 343 9 343 8 940 8 940 18 283 Cape Verde 1 1 1 Colombia 307 307 307 Denmark 613 613 613 Djibouti 1 1 1 Finland (35) (35) (35) France 6 298 6 298 3 3 6 301 Germany 73 73 73 Iran 54 54 54 Ireland 210 210 210 Italy 350 350 350 Lao, People’s Democratic Republic 5 5 5
Lesotho 3 3 3 Luxembourg 372 372 141 141 513 Malaysia 84 84 84 Maldives, Republic of 8 8 8 Mauritius 10 10 10 Mongolia 22 22 22 Morocco 5 5 5 Netherlands 2 977 2 977 1 680 1 680 4 657 New Zealand 235 235 235 Nicaragua 4 4 4 Norway 4 925 4 925 291 291 5 216 Panama 9 9 9 Portugal 61 61 61 Spain 2 118 2 118 2 118 Sweden 583 583 1 864 1 864 2 447 Switzerland 82 82 82 Syrian Arab Republic 6 6 6 United States of America 44 628 44 628 34 159 34 159 78 787 United Kingdom of Great Britain and Northern Ireland 22 915 22 915 538 538 23 453
United Arab Emirates 100 100 49 49 149 Vietnam 20 20 20 Yemen, Republic of 2 2 2
Subtotal Governments 2 770 2 770 96 330 96 330 50 078 50 078 149 178

A/61/5/A
dd.2
122 06-42517
SCHEDULE 2 (continued) Other resources Regular resources Supplementary funds Emergency relief and rehabilitation
Donor
Governments and inter-
governmental agencies
Non-govern-mental sources
Subtotal
Governments and inter-
governmental agencies
Non-govern-mental sources
Subtotal
Governments and inter-
governmental agencies
Non-govern-mental sources
Subtotal Total
INTERGOVERNMENTAL AGENCIES
Agfund 111 111 111 Delegation of Commission of the European Union 11 348 11 348 2 594 2 594 13 942
European Commission Humanitarian 4 213 4 213 12 052 12 052 16 265
OPEC Fund 100 100 50 50 150 Subtotal intergovernmental agencies 15 772 15 772 14 696 14 696 30 468
NATIONAL COMMITTEES FOR UNICEF
Subtotal National Committees NON-GOVERNMENTAL ORGANIZATIONS
Micronutrient Initiative 243 243 243 Rotary International 8 185 8 185 8 185 Subtotal non-governmental agencies 8 428 8 428 8 428
INTER-ORGANIZATIONAL ARRANGEMENTS
UNDCP - Vienna 6 6 6 United Nations Secretariat 77 77 77 Subtotal inter-organization arrangements 83 83 83
ADJUSTMENTS Revaluation - contribution receivable - prior years (1 103) 428 (433) (1 108)
GRAND TOTAL 2 770 1 667 112 102 8 511 121 041 64 774 64 341 187 049

A/61/5/A
dd.2
06-42517 123
SCHEDULE 2 (concluded) Other resources Regular resources Supplementary funds Emergency relief and rehabilitation
Donor
Governments and inter-
governmental agencies
Non-govern-mental sources
Subtotal
Governments and inter-
governmental agencies
Non-govern-mental sources
Subtotal
Governments and inter-
governmental agencies
Non-govern-mental sources
Subtotal Total
SUMMARY Governments 2 770 96 330 50 078 149 178 Intergovernmental agencies 15 772 14 696 30 468 Non-governmental organizations 8 428 8 428 Inter-organization arrangements 83 83 Contribution revaluation (1 103) 428 (433) (1 108) GRAND TOTAL 1 667 121 041 64 341 187 049

A/61/5/A
dd.2
124 06-42517
Schedule 3
TRUST FUNDS FOR THE BIENNIUM ENDED 31 DECEMBER 2005
(In thousands of United States dollars)
Balances as at 1 January 2004 Funds received and
adjustments Funds disbursed Balances as at 31 December 2005
Government and others Procurement Services 63 517 587 091 530 730 119 878 Procurement Services on behalf of GAVI 145 849 226 173 258 428 113 594 Junior Professional Officers 12 660 22 355 22 124 12 891 Other trust funds 59 297 471 948 459 465 71 780 Subtotal 281 323 1 307 567 1 270 747 318 143 United Nations system International Labour Organization (ILO) 2 2 United Nations agencies 11 1 121 426 706 United Nations Secretariat (13 851) 23 317 9 465 1 UNAIDS 719 (395) 305 19 UNESCO 23 23 UNFPA 22 515 416 121 UNHCR 47 47 UNICT 18 18 United Nations Development Programme 357 23 466 11 422 12 401 United Nations University 6 6 UNRWA 12 (5) 7 World Bank (300) 300 World Food Programme (9) 582 480 93 World Health Organization 88 866 571 383 Subtotal (12 949) 49 861 23 163 13 749 Net balance 268 374 1 357 428 1 293 910 331 892 Receivable for trust funds 21 023 4 693 Gross balance 289 397 336 585

A/61/5/A
dd.2
06-42517 125
Annex I
Income and expenditures and changes in reserves and fund balances for the years ended 31 December 2004 and 31 December 2005 (In thousands of United States dollars)
Other resources
Regular resources Supplementary funds Emergency relief and
rehabilitation Total
2005 2004 2005 2004 2005 2004 2005 2004 INCOME Voluntary contributions Governments 468 593 437 639 412 811 590 919 536 791 310 461 1 418 195 1 339 019 Less: Transfer to support budget (15 264) (8 913) (15 264) (8 913) 453 329 428 726 412 811 590 919 536 791 310 461 1 402 931 1 330 106 Non-governmental/private sector 635 917 289 336 186 581 586 152 76 785 876 123 264 283 Private Sector Division 288 565 291 125 288 565 291 125 Funds received under inter-organization arrangements 144 118 304 18 007 6 241 3 827 124 545 21 978 Other income Interest income 68 062 22 992 68 062 22 992 Miscellaneous income 29 406 30 476 29 406 30 476 Currency exchange adjustments (42 898) 7 579 (42 898) 7 579 TOTAL INCOME 797 099 781 959 820 451 795 507 1 129 184 391 073 2 746 734 1 968 539 EXPENDITURE Programme assistance 484 759 399 255 815 167 585 476 665 580 359 023 1 965 506 1 343 754 Programme support 137 230 164 385 137 230 164 385 Total programme cooperation 621 989 563 640 815 167 585 476 665 580 359 023 2 102 736 1 508 139 Management and administration 88 383 91 341 88 383 91 341 TOTAL EXPENDITURES 710 372 654 981 815 167 585 476 665 580 359 023 2 191 119 1 599 480 EXCESS (SHORTFALL) OF INCOME OVER EXPENDITURES 86 727 126 978 5 284 210 031 463 604 32 050 555 615 369 059 Write-offs/prior period’s adjustments 2 183 2 274 1 162 1 503 2 960 2 384 6 305 6 161 NET EXCESS (SHORTFALL) OF INCOME OVER EXPENDITURES 84 544 124 704 4 122 208 528 460 644 29 666 549 310 362 898 Reserve balances, 1 January 69 055 59 014 69 055 59 014 Reserve for after-service health insurance (20 000) (10 000) (20 000) (10 000) Increase in reserves 20 026 10 041 20 026 10 041 Fund balances, 1 January 482 740 368 036 648 068 439 540 243 231 213 565 1 374 039 1 021 141 RESERVES AND FUND BALANCES, 31 DECEMBER 636 365 551 795 652 190 648 068 703 875 243 231 1 992 430 1 443 094

A/61/5/Add.2
06-42517 126
Annex II
Glossary of selected UNICEF terminology
accounts, audited. The financial statements of the organization for a specified period or at a specified date audited by the External Auditors (United Nations Board of Auditors).
accrual basis of accounting. The accrual basis of accounting for revenue in each financial period means that income is recognized when it is due and not when it is received. Accrual of expenditures in each financial period means that costs are recognized when obligations arise or liabilities are incurred and not when payments are made.
asset. An asset is a resource owned by or due to the organization as a result of past events.
budget. A plan in financial terms for carrying out proposed activities in a specified time. The term “budget” is used to refer to UNICEF programme support, management and administration costs, and programme assistance, as well as to the Private Sector Division. However, the Executive Board approves an appropriation of funds only for the UNICEF support budget and the regular resources part of intercountry programmes.
budget appropriations. The total appropriation of funds approved by the Executive Board for UNICEF programme support, management and administration costs, and programme assistance against which obligations may be incurred for those purposes up to the amount so approved.
budget estimates. Estimates of the costs of proposed programme support, management and administration, and programme assistance prepared for submission to the UNICEF Executive Board for the approval of relevant appropriations.
budget estimates, revised. Resulting from Executive Board approval of “supplementary estimates” proposed to adjust an approved budget.
cash holdings. The aggregation of all the funds of the organization, including coins, bank notes, cheques, balances in current and call accounts, savings accounts and interest-bearing deposits.
cash-in-transit. Cash transfers between one or more UNICEF bank accounts at a specified time.
cash in current bank accounts. The aggregate of money maintained in UNICEF bank accounts, as reflected in the UNICEF books of account, to sustain operational requirements.
cash in interest-bearing deposits. Funds temporarily available, over those needed for immediate requirement, held in short-term, interest-bearing deposits and ready to be drawn down when needed.
cash-on-hand (also called “petty cash”). Cash kept on hand by authorized officers as a convenience for making small payments on behalf of the organization.
contributions, voluntary. Contributions to UNICEF that are offered and accepted without reference to a scale of assessment determined by any United Nations legislative body.

A/61/5/Add.2
127 06-42517
contributions receivable. Contributions pledged to UNICEF but not received until a future time.
currencies of “restricted use” for UNICEF. Currencies, the use of which (mainly in respect of transferability and convertibility) is limited because of foreign exchange regulations or a donor’s wish. When those limitations do not exist, the currencies are considered by UNICEF as “unrestricted” because they are fully convertible.
earmark. To give expression to a restriction imposed by agreement or by administrative action on the use of an account or of an equivalent amount of assets.
expenditures. Expenditure for a financial period is the sum of the disbursements and valid unliquidated obligations made against the appropriation/allocation for the period.
financial periods. The operating period of the organization, covered by the financial statements, is the biennium.
financial regulations. Until 31 December 1987, UNICEF accounts were maintained in accordance with the Financial Regulations of the United Nations, with such modifications as required by the nature of UNICEF work. Since 1 January 1988, UNICEF accounts have been maintained in accordance with the UNICEF Financial Regulations and Rules.
fund balance. Fund balances and reserves represent the difference between the assets and the liabilities of the organization. A fund balance consists of funds available for the implementation of programmes funded by regular resources and supplementary funds as well as funds available for the acquisition of capital assets.
income. Income for a financial period is defined as money or money equivalent received or accrued during the financial period which increases existing net assets. UNICEF income is recorded on the basis of funds or pledges received for the current year. It comprises funds classified as “regular resources”, “supplementary funds” and “emergency relief and rehabilitation”.
income, deferred. Funds received or pledges recorded as receivable, attributable to future financial periods and, therefore, not credited to the income account of the period reported on.
income, regular resources. Unearmarked income, which includes funds from voluntary annual contributions of Governments, the net income from the Private Sector Division, funds contributed by the public and certain other (or miscellaneous) income.
income, other. Also referred to as “miscellaneous income” for regular resources. Miscellaneous income is defined in the United Nations system as income other than (a) the value of assessed or voluntary contributions; and (b) such other income items as may be excluded under the organization’s Financial Regulations and Rules. In UNICEF, this includes income other than the value of the voluntary contributions and the net income of the Private Sector Division.
income, supplementary funds. Specific contributions for programmes approved by the UNICEF Executive Board, in addition to regular resources, which then become part of UNICEF programmes. It consists of funds contributed to UNICEF by

A/61/5/Add.2
06-42517 128
Governments, non-governmental organizations and United Nations agencies for specific purposes.
income, emergency relief and rehabilitation. Consists of funds contributed to UNICEF by Governments, non-governmental organizations and United Nations agencies for emergency appeals.
inventory. The value of supplies and equipment for programmes owned by the organization, as well as Private Sector Division materials, at the end of an accounting or financial period.
liability. A liability is a present obligation of the organization arising from past events, the settlement of which is expected to result in an outflow of resources from the organization.
liquidity policy. Owing to the nature of programme implementation and UNICEF cash flows, there may occur, from time to time, short-term imbalances between regular resources cash disbursements and cash receipts. The UNICEF liquidity policy allows these temporary imbalances to be offset by up to one half of the balance of supplementary cash on hand.
liquidity requirement. In order to meet UNICEF liquidity requirements, regular resources convertible cash balances, at the end of each fiscal year, are required to equal 10 per cent of projected regular resources income for the next fiscal year.
local currency. The currency of the country or area in which the local financial records of an activity are kept and/or in which its local financial transactions take place.
non-expendable property. Items of property and equipment charged to the administrative budget with an individual unit cost of at least $1,500.
obligation. Obligations are amounts of orders placed, contracts awarded, services received and other transactions which involve a charge against the resources of the current financial period. Obligations may be maintained either for that period or until liquidated or cancelled.
pledge. A written commitment by a prospective donor to make a voluntary contribution to UNICEF. A written commitment which is subject to the need to secure appropriate national legislative approval is considered a pledge.
procurement services. UNICEF assists Governments, United Nations agencies and non-governmental organizations working in fields of benefit to children by undertaking, on request and on a reimbursable basis, the procurement of goods and services. A small handling charge is added by UNICEF to the cost of the supplies and services to cover the costs of extra administration and documentation (see trust funds).
rates of exchange. The UNICEF accounts are maintained in United States dollars. Transactions in other currencies are converted for recording into United States dollars, in principle, at the United Nations operational rates of exchange.
reserve for insurance. A reserve of $200,000 was established by the Executive Board in November 1950 when UNICEF adopted a policy of self-insurance for programme supplies. UNICEF also has a reserve for third-party liability, which had a balance as of 31 December 2005 of $26,399.

A/61/5/Add.2
129 06-42517
schedule. Explanatory or supporting analyses accompanying financial statements.
trust funds. Funds accepted by UNICEF mainly to cover the costs of procurement of supplies and services undertaken by UNICEF on behalf of others. They also include financing provided by sponsors to cover the costs relating to Junior Professional Officers, as well as those relating to projects funded by the World Bank, the oil-for-food programme in Iraq and the Global Alliance for Vaccines and Immunization. These funds are not considered to be UNICEF income.
specific contributions. Programme recommendations are often prepared in excess of the input available from regular resources. These recommendations are approved by the Executive Board as suitable for funding by supplementary contributions and contributions for emergency relief and rehabilitation from donors. When a contribution for specific purposes is made for such a programme, the corresponding commitment enters into effect (usually between Executive Board sessions).
unencumbered balance. That portion of the approved budget that has not been expended at the end of the year. The unspent balance at the end of the biennium is cancelled and reported to the Executive Board.
write-off. An adjustment to the accounts in order to record the loss of or reduction in the value of an asset.
06-42517 (E) 290806 *0642517*