
LAWS OF MALAYSIA - divorce malaysia, divorce lawyer, divorce

for poorer.
For richer,
AMP.NATSEM Income and Wealth Report
Issue 39 – December 2016

This report explores the financial impact of divorce in Australia…We look at patterns of divorce in Australia, across individuals and families, and the financial impact of divorce on home ownership, employment status and household income and assets, including superannuation and debt. We also look at the effect of divorce on spending on children and education outcomes.

ContentsForeword 2
Introduction 3
Divorce in Australia 4
The financial wellbeing of divorcees with no dependent children 6
Employment and income 6
Home ownership 7
Household assets and debt 8
Assets 8
Debt 9
Retirement prospects 10
The financial wellbeing of divorced families with children 11
Household income 11
Employment and income 12
Home ownership 14
Household assets and debt 15
Assets 15
Debt 17
Retirement prospects 18
Spending on children 19
Household spending 19
Child care 21
Financial stress 22
Education outcomes 23
Conclusion 24
References 26
Technical Notes 27

2
One in three Australian marriages are likely to end in divorce. An unsettling reality and not a statistic many of us would contemplate on our wedding day.
The emotional shock and effects of separation can be overwhelming, particularly when children are involved.
Quite rightly, looking after the emotional wellbeing of all involved should be the priority. However, dealing with this often means the financial effects of separation are delayed, mishandled or even overlooked.
And, as the findings in this report – the 39th AMP.NATSEM report – show, the financial effects can be considerable, over both the short and long term.
For example, it takes five years to recover from the financial impact of divorce and there remains a 20 per cent gap in the financial wellbeing of divorced and married couples even six years later.
The research also indicates that divorce is happening later in life, during our prime wealth accumulation and child rearing years, amplifying the financial repercussions.
This report does not attempt to address the complexities of divorce or its sometimes devastating psychological consequences. Rather, it analyses marriage and divorce trends, and looks at the financial impacts of divorce on men, women and children.
The report’s objective is to raise awareness of the economic impact of divorce and to enable Australians to make more informed decisions in planning for the future.
The findings reinforce the value of having a plan in place to achieve your goals. A clear strategy and a solid financial foundation will go a long way towards accomplishing what matters to you, regardless of life’s twists and turns.
I hope you find this report informative and helpful.
Paul Sainsbury Chief Customer Officer AMP
Foreword

3
While the rate at which Australians are getting married and getting divorced has dropped2 during the past 20 years, 97,000 Australians are still divorcing each year. With 50 per cent of divorces involving children, marriage breakdown continues to be a key life-course risk that can have a significant impact on families.
During the past 20 years, the age at which Australians have been marrying for the first time has increased. People are also getting divorced later in life. The median age of divorce for men is 45.3 years and women 42.7 years. This means divorce typically occurs right in the middle of couples’ prime wealth accumulation and child-rearing years.
Divorce has a major impact on the lives of everyone involved. In addition to the emotional and psychological aspects, the economic consequences can be particularly significant.
Divorce also impacts communities with estimates suggesting marriage breakdowns cost the nation up to $14 billion in 2014 in government assistance payments and court costs, an increase of $2 billion since 20123.
Divorce: For richer, for poorer examines patterns of divorce in Australia, across individuals and families, and the financial impact of divorce on home ownership, employment status and household income and assets, including superannuation and debt. We also look at the effect of divorce on spending on children and education outcomes.
Introduction
1 NATSEM Modelling.
2 The crude marriage rate dropped from 6.2 in 1994 to 4.8 marriages per 1,000 estimated resident population in 2015 (ABS, 2016).
3 Lauren Wilson and Lisa Cornish, News Corp Australia “Divorce is costing the Australian economy $14 billion a year” http://www.news.com.au/lifestyle/relationships/marriage/divorce-is-costing-the-australian-economy-14-billion-a-year/news-story/e5a101ea76351d4ba145279011b934ac
Today one in three marriages (35 per cent) in Australia is likely to end in divorce1.

4
Nearly 1.5 million Australians aged 25–64 years are currently separated or divorced. This represents one in every eight adults in this age group.
The average age at which Australians are getting married and divorced has risen. In 2014, 18 per cent of individuals aged 45–64 years were separated or divorced compared with 7 per cent of those aged 25–44 years (Table 1).
The average time it takes from separation to divorce is three and a half years.
Four of every ten divorces (43.3 per cent) are applied for jointly by both partners. However, applications made by women outnumber those made by men: 31.6 per cent to 25.1 per cent of all divorces4. The legal granting of a divorce does not in itself determine issues of property distribution, financial support or arrangements for children.
Table 1Marital status of Australians aged 25–64 years (2014)
Marital status (%) Total number of persons
(‘000)Never married Widowed Divorced Separated
Married in a registered
marriage
Married in a defacto marriage
25–44 years
Male 24.5 0.1 3.6 1.8 51.2 18.8 3,237.6
Female 20.3 0.2 4.7 3.7 55.3 15.7 3,293.7
Total 22.3 0.2 4.1 2.8 53.3 17.2 6,531.3
45–64 years
Male 5.3 1.5 11.9 3.2 70.9 7.1 2,795.1
Female 4.8 3.6 16.0 4.3 64.0 7.2 2,896.4
Total 5.1 2.7 14.0 3.8 67.2 7.2 5,691.5
25–64 years
Male 15.6 0.8 7.4 2.4 60.3 13.4 6,032.7
Female 13.1 1.8 10.0 4.0 59.4 11.7 6,190.1
Total 14.3 1.4 8.7 3.2 59.8 12.6 12,222.80
Source: ABS General Social Survey, June 2014, data generated using TableBuilder.
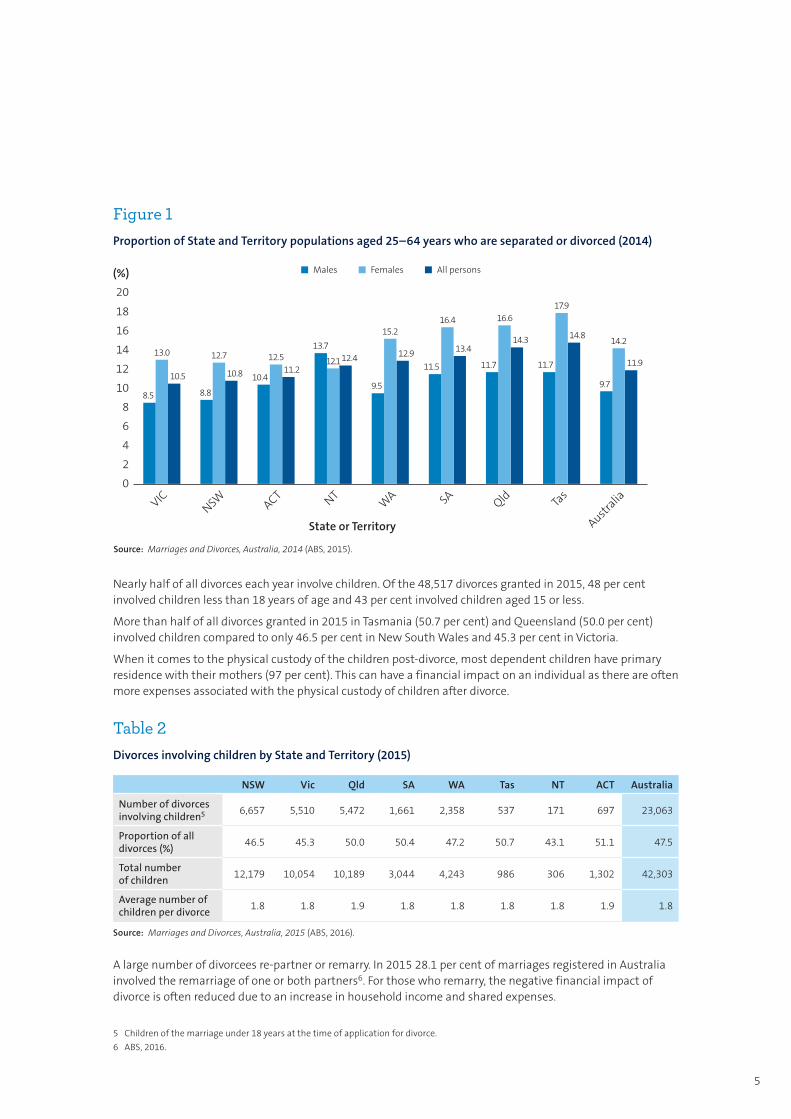
Tasmania has the highest proportion of people aged 25–64 years who are separated or divorced (14.8 per cent) closely followed by Queensland (14.3 per cent). Victoria has the lowest (10.5 per cent) with New South Wales the next lowest at 10.8 per cent (Figure 1). The reasons for the high and low rates in Tasmania and Queensland versus Victoria and New South Wales may reflect the higher incidence of divorce i.e. the number of divorces each year, lower rates of re-partnering once separated or divorced as well as inter-state migration of divorcees.
Divorce in Australia
Tasmania has the highest proportion of people aged 25–64 years who are separated or divorced (14.8 per cent) closely followed by Queensland (14.3 per cent).
4 ABS (2016) Marriages and Divorces in Australia, 2015.
5
Figure 1Proportion of State and Territory populations aged 25–64 years who are separated or divorced (2014)
13.0
State or Territory
(%)
VICNSW ACT NT
WA SA
Qld Tas
Australia
8.5
10.5
12.7
8.8
10.8
12.5
10.411.2
15.2
9.5
12.9
16.4
11.5
13.4
16.6
11.7
14.3
17.9
11.7
14.814.2
9.7
11.912.1
13.712.4
Source: Marriages and Divorces, Australia, 2014 (ABS, 2015).
0
2
4
6
8
10
12
14
16
18
20
Males Females All persons
Nearly half of all divorces each year involve children. Of the 48,517 divorces granted in 2015, 48 per cent involved children less than 18 years of age and 43 per cent involved children aged 15 or less.
More than half of all divorces granted in 2015 in Tasmania (50.7 per cent) and Queensland (50.0 per cent) involved children compared to only 46.5 per cent in New South Wales and 45.3 per cent in Victoria.
When it comes to the physical custody of the children post-divorce, most dependent children have primary residence with their mothers (97 per cent). This can have a financial impact on an individual as there are often more expenses associated with the physical custody of children after divorce.
Table 2Divorces involving children by State and Territory (2015)
NSW Vic Qld SA WA Tas NT ACT Australia
Number of divorces involving children5 6,657 5,510 5,472 1,661 2,358 537 171 697 23,063
Proportion of all divorces (%)
46.5 45.3 50.0 50.4 47.2 50.7 43.1 51.1 47.5
Total number of children
12,179 10,054 10,189 3,044 4,243 986 306 1,302 42,303
Average number of children per divorce
1.8 1.8 1.9 1.8 1.8 1.8 1.8 1.9 1.8
Source: Marriages and Divorces, Australia, 2015 (ABS, 2016).
A large number of divorcees re-partner or remarry. In 2015 28.1 per cent of marriages registered in Australia involved the remarriage of one or both partners6. For those who remarry, the negative financial impact of divorce is often reduced due to an increase in household income and shared expenses.
5 Children of the marriage under 18 years at the time of application for divorce.
6 ABS, 2016.

6
More than half (57 per cent) of all divorces involve couples who do not have a dependent child aged less than 16 years living with them. For this cohort divorce is shown to impact on financial wellbeing both in the short and medium term although there is evidence of recovery five years after divorce.
Divorce has an effect on employment, household income, asset holdings including home ownership, superannuation and debt levels.
Overall, divorced women are worse off than both divorced men, and married women.
Employment and incomeDivorce has little impact on the employment status and income of men aged 25–64 years (Figures 2 and 3). However, divorce leads to greater workforce participation by women of working age who divorce (67.1 per cent of divorced women without dependent children compared with 59 per cent of married women without dependent children five years after divorce). When it comes to income, their earnings from wages and salaries is 10 per cent lower than married women of the same socio-economic background.
Figure 2Change in labour force participation over time for divorced and married adults with no dependent children
Years from divorce
Empl
oym
ent
rate
(%)
Source: NATSEM modelling HILDA data waves 1–14 (2001–2014).
50
55
60
65
70
75
80
85
90
95
100
-4 -3 -2 -1 0 +1 +2 +3 +4 +5-5
Divorced males without children Divorced females without children
Married males without children Married females without children
The financial wellbeing of divorcees with no dependent children
Divorce has little impact on the employment status and income of men aged 25–64 years.

7
Figure 3Income earned over time from labour force participation for divorced and married adults with no dependent children (in 2014 dollars)
Years from divorce
Labo
ur
inco
me
($20
14)
Source: NATSEM modelling HILDA data waves 1–14 (2001–2014).
20,000
30,000
40,000
50,000
60,000
70,000
80,000
90,000
-4 -3 -2 -1 0 +1 +2 +3 +4 +5-5
Divorced males without children Divorced females without children
Married males without children Married females without children
Home ownershipThe rate of home ownership drops when couples separate. Many couples choose to give up the house they jointly own as keeping up with mortgage payments on one income may be tough or even impossible. Home ownership rates drop by 16 per cent for women who divorce and 9 per cent for men, largely through the sale of joint property. Even though people who have divorced re-invest in the housing market, levels of home-ownership five years after divorce are still 85 per cent of those married couples (Figure 4).

8
Figure 4Change over time in the rate of home ownership for divorced and married adults with no dependent children
Years from divorce
Rate
of
hom
e ow
ner
ship
(%)
Source: NATSEM modelling HILDA data waves 1–14 (2001–2014).
20
30
40
50
60
70
80
90
100
-4 -3 -2 -1 0 +1 +2 +3 +4 +5-5
Divorced males without children Divorced females without children
Married males without children Married females without children
Household assets and debtThe value of assets owned by a divorced man is 67 per cent less than a married man of a similar age and socio-economic background. A divorced woman has assets valued at 90 per cent less than a married woman (all other things being equal). These differences are largely caused by the difference in assets held in the form of house ownership and superannuation7.
Assets
The impact of divorce on the asset wealth level of divorced women is particularly noticeable within the first few years of divorce when their financial assets are only 71 per cent of married women, and non-financial assets (primarily property) 85 per cent. However, wealth recovery happens relatively quickly and five years after divorce they have similar levels of assets to married women.
The asset level of divorced men relative to divorced women is higher in the first few years after divorce (especially financial assets) but relative to married men, the asset level of divorced men does not drop as much as that observed for divorced women within the first five years post-divorce.
7 The general principles and conditions that apply in Australia when it comes to reaching an agreement on the division of assets are briefly described in the Technical Notes.
8 Assets can be divided into financial and non-financial assets – financial assets include for example deposits in bank accounts, superannuation, cash and equity investments, trust funds and life insurance. Non-financial assets include property assets including the home, business assets, vehicles and collectibles.
The value of both financial and non-financial assets8 owned by divorced men and women is substantially lower than that of their married counterparts (Table 3).

9
Table 3Components of total assets per adult in the household (2014 dollars) for persons aged 25–64 years with no dependent children
Males FemalesFinancial
assetsNon-financial
assetsTotal
assets(i)Financial
assetsNon-financial
assetsTotal
assets(i)
($) Ratio(ii) ($) Ratio(ii) ($) Ratio(ii) ($) Ratio(ii) ($) Ratio(ii) ($) Ratio(ii)
In a couple 200,805 – 359,474 – 563,084 – 208,916 – 365,923 – 573,763 –
Divorced 1–4 years 179,958 0.90 338,303 0.94 533,467 0.95 148,025 0.71 312,020 0.85 501,475 0.87
Divorced ≥5 years 181,543 0.90 321,306 0.89 500,866 0.89 195,660 0.94 367,525 1.00 565,116 0.98
Source: NATSEM calculations from HILDA data wave 14.
(i) Financial and non-financial assets may not sum to total because of estimation methods.(ii) Ratio of asset value to that of a married adult.
Debt
Marital status significantly affects people’s level of debt and the effects of divorce on debt are significantly different for men and women (Table 4).
There are two likely factors that contribute to these patterns. The first is a shift away from home ownership and the second a reduction in mortgage levels. This could be through a financial settlement or a change in the type of property purchased such as relocating or downsizing to a cheaper house or apartment.
Non-property debt levels (e.g. credit card debts, personal loans, overdue bills) for divorced men are lower (74 per cent) relative to both married men and divorced women with no dependent children.
Of particular note is that females who are newly divorced have non-property debt levels 2.3 times those incurred by married women and three times those owed by divorced men. This could be because divorced women struggle to meet everyday costs with a reduced household income.
There is no significant difference between the debt liability of a divorced male with no dependent children and a ‘matched’ married man. However, a divorced female has a debt liability 40 per cent less than a comparable married female. The effects of marital status on debt liability are largely caused by the difference in debt in the form of home loans.
Divorced women have significantly less property debt than either divorced men or married women and their property debt levels reduce over time.

10
Retirement prospects
Superannuation is a major component of an individual’s and a family’s financial assets with superannuation balances usually being split when partners permanently separate9.
There are significant differences in the superannuation balances of married and divorced adults from similar socio-economic backgrounds, between the genders and across different age groups. A male with no dependent children who has been divorced one to four years has 28 per cent less superannuation than a married male with similar characteristics and a divorced female has 75 per cent less superannuation than a married female from the same socio-economic background.
Figure 5Total superannuation per adult with no dependent children (2014)
128,641136,825
82,200 85,567
132,028 132,338
Males Females
In a couple Divorced 1–4 years Divorced ≥5 years
Source: NATSEM calculations from HILDA data wave 14 (2014).
$201
4 pe
r ad
ult
020,00040,00060,00080,000
100,000120,000140,000160,000
Table 4Components of total debt per adult in the household (2014 dollars) for those with no dependent children
Males FemalesProperty
debtNon-property
debtTotaldebt
Property debt
Non-property debt
Totaldebt
($) Ratio(i) ($) Ratio(i) ($) Ratio(i) ($) Ratio(i) ($) Ratio(i) ($) Ratio(i)
In a couple 100,409 – 19,384 – 119,794 – 92,042 – 18,471 – 110,514 –
Divorced 1–4 years 125,931 1.25 14,355 0.74 140,287 1.17 80,591 0.88 42,474 2.30 123,064 1.11
Divorced ≥5 years 76,156 0.76 14,292 0.74 90,449 0.76 69,864 0.76 12,845 0.70 82,710 0.75
Source: NATSEM calculations from HILDA data wave 14.
(i) Ratio of asset value to that of a married adult.
9 The division of superannuation assets is determined as part of the financial arrangements agreed upon by divorcing parties.

11
The following section presents the findings on changes in the financial wellbeing of families with dependent children who experience divorce. The experiences of these families are compared with those of married couples with children less than 16 years old.
The financial ‘health’ (as measured by household income) of the household in which children live drops when parents separate but the financial wellbeing of the children’s household rises once their parents’ divorce is granted. However, it does not fully recover over the medium term.
Most children live with their mothers after a divorce, so the financial effects of divorce on women impact on children. Generally, women suffer more from financial losses than men because men tend to earn more than women. Women also usually have more expenses associated with the physical custody of children after divorce. Mothers who have been divorced for one to four years spend 21 per cent more on basic items such as groceries, clothing and transport costs compared with newly divorced fathers (see Table 7).
Overall, the home ownership and employment patterns between couples with young children and couples without dependent children are similar. The drop in home ownership leading up to divorce is slightly larger for couples without dependent children. However, the home ownership level of this group also returns to the pre-divorce level faster than those with children. As to the labour market performance, both groups have very similar trends in rates of employment and labour income.
Household incomeHousehold income drops markedly for parents in the immediate years prior to the divorce being granted. One year before the divorce is granted, parents are earning 86 per cent of the income the household had four years previously, reflecting the expense of the divorce process.
While the gap between married couples with children and divorced families with children does close post-divorce, the equivalised household income of divorced families with children is still 20 per cent lower than that of married couples five years after divorce.
The financial wellbeing of divorced families with children
Mothers who have been divorced for one to four years spend more on basic items compared with newly divorced fathers.
12
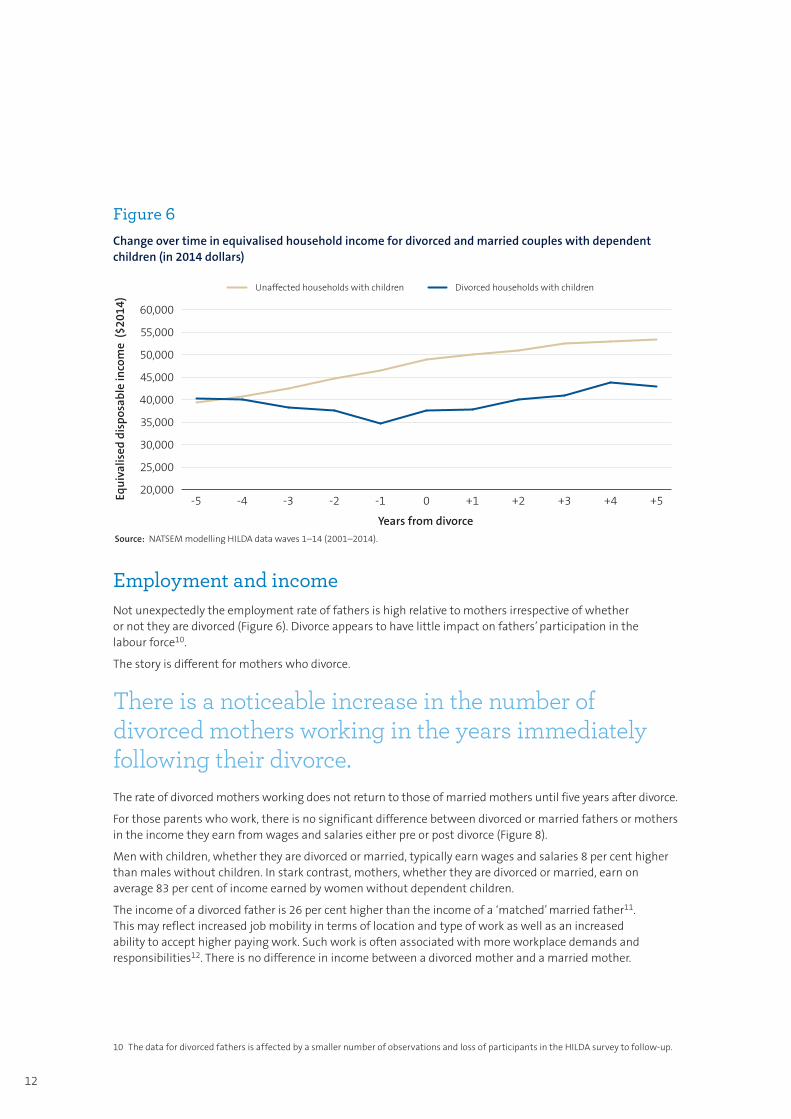
Figure 6Change over time in equivalised household income for divorced and married couples with dependent children (in 2014 dollars)
Years from divorce
Equ
ival
ised
dis
posa
ble
inco
me
($20
14)
Source: NATSEM modelling HILDA data waves 1–14 (2001–2014).
20,000
25,000
30,000
35,000
40,000
45,000
50,000
55,000
60,000
-4 -3 -2 -1 0 +1 +2 +3 +4 +5-5
Unaffected households with children Divorced households with children
Employment and incomeNot unexpectedly the employment rate of fathers is high relative to mothers irrespective of whether or not they are divorced (Figure 6). Divorce appears to have little impact on fathers’ participation in the labour force10.
The story is different for mothers who divorce.
The rate of divorced mothers working does not return to those of married mothers until five years after divorce.
For those parents who work, there is no significant difference between divorced or married fathers or mothers in the income they earn from wages and salaries either pre or post divorce (Figure 8).
Men with children, whether they are divorced or married, typically earn wages and salaries 8 per cent higher than males without children. In stark contrast, mothers, whether they are divorced or married, earn on average 83 per cent of income earned by women without dependent children.
The income of a divorced father is 26 per cent higher than the income of a ‘matched’ married father11. This may reflect increased job mobility in terms of location and type of work as well as an increased ability to accept higher paying work. Such work is often associated with more workplace demands and responsibilities12. There is no difference in income between a divorced mother and a married mother.
There is a noticeable increase in the number of divorced mothers working in the years immediately following their divorce.
10 The data for divorced fathers is affected by a smaller number of observations and loss of participants in the HILDA survey to follow-up.

13
Figure 7Change in labour force participation for divorced and married parents over time
Years from divorce
Empl
oym
ent
rate
(%)
Source: NATSEM modelling HILDA data waves 1–14 (2001–2014).
60
65
70
75
80
85
90
95
100
-4 -3 -2 -1 0 +1 +2 +3 +4 +5-5
Divorced fathers Divorced mothers
Married fathers Married mothers
Figure 8Income earned over time from labour force participation for divorced and married parents (in 2014 dollars)
Years from divorce
Labo
ur
inco
me
($20
14)
Source: NATSEM modelling HILDA data waves 1–14 (2001–2014).
20,000
30,000
40,000
50,000
60,000
70,000
80,000
90,000
100,000
-4 -3 -2 -1 0 +1 +2 +3 +4 +5-5
Divorced fathers Divorced mothers
Married fathers Married mothers
11 Matched on age, gender, hours worked per week, experience in their current occupation and level of education.
12 It may also reflect some bias in the sample of divorced fathers retained in the HILDA survey. Many divorced fathers are lost to follow-up and these individuals may have lower socio-economic status to those still in the survey on which this analysis was based.

14
Home ownershipHome ownership falls significantly for those who divorce, largely reflecting the selling of the joint home.
Home ownership rates increase rapidly in the years following divorce, rising from 47 per cent of divorced mothers and fathers being home owners one year before the divorce is finalised, to 61 per cent of divorced fathers and 57 per cent of divorced mothers five years post-divorce.
However, home ownership remains out of reach of many divorced parents after five years, with rates falling well short of the level reached by married couples with children (85 per cent) who have not experienced the financial and emotional shock of a family breakdown (Figures 9 and 10).
While the proportion of adults living in rental accommodation declines over time for married couples with children, rates of renting rapidly rise for those going through a divorce (Figure 10).
Once the divorce settlement is finalised many stop renting and return to home ownership. However, after five years, 40 per cent of divorced mothers are still living in rental accommodation as are 32 per cent of fathers. This compares with only 14 per cent of married couples with children.
Figure 9Change over time in rates of home ownership for divorced and married parent families
Years from divorce
Rate
of
hom
e ow
ner
ship
(%)
Source: NATSEM modelling HILDA data waves 1–14 (2001–2014).
20
30
40
50
60
70
80
90
100
-4 -3 -2 -1 0 +1 +2 +3 +4 +5-5
Divorced fathers Divorced mothers
Married fathers Married mothers
While transitions in renting are similar for divorced males with and without dependent children, renting is much more common in divorced mothers than divorced females with no children.

15
Figure 10Change over time in rates of renting for divorced and married parent families
Years from divorce
Prop
orti
on re
ntin
g (%
)
Source: NATSEM modelling HILDA data waves 1–14 (2001–2014).
0
10
20
30
40
50
60
-4 -3 -2 -1 0 +1 +2 +3 +4 +5-5
Divorced fathers Divorced mothers
Married fathers Married mothers
Household assets and debt
Assets
The total value of assets owned by mothers and fathers who have been divorced is substantially lower than married parents especially within the first five years of divorce, despite many having remarried or entered new de facto relationships by 2014 (45 per cent of mothers and 55 per cent of fathers who divorced during the period 2001–2014 had re-partnered by 2014) (Table 5).
Asset wealth is low for females one to four years after divorce at only 63 per cent of that of mothers in couple households. Although there is evidence of asset accumulation with time, their asset level five years after divorce is still only 79 per cent of that of married mothers. This gap may reflect divorced mothers having to get rid of financial assets to meet everyday household spending, especially on the children. Divorced mothers may also have fewer financial assets available to re-invest in the property market.
For married couples with children, just 71 per cent of their total assets come from non-financial assets. This largely reflects high rates of home ownership.
In stark contrast, for divorced parents there is a major shift in the balance of assets away from non-financial to financial assets, especially for those who have only been divorced for one to four years.

16
Table 5Components of total assets per adult in the household (2014 dollars)
Fathers MothersFinancial
assetsNon-financial
assetsTotal
assetsFinancial
assetsNon-financial
assetsTotal
assets
($) Ratio(i) ($) Ratio(i) ($) Ratio(i) ($) Ratio(i) ($) Ratio(i) ($) Ratio(i)
In a couple 151,607 –- 375,740 – 527,347 – 148,795 – 372,870 – 521,665 –
Divorced 1–4 years 190,664 1.26 234,395 0.62 425,059 0.81 121,920 0.82 208,196 0.56 330,116 0.63
Divorced ≥5 years 180,496 1.19 280,389 0.75 460,885 0.87 113,085 0.76 299,850 0.80 412,935 0.79
Source: NATSEM calculations from HILDA data wave 14.
(i) Ratio of asset value to that for a parent in a couple household.
This is unsurprising given non-financial assets are frequently liquidised during separation and divorce to enable the division of wealth. On average, newly divorced fathers (divorced one to four years) record the greatest value in financial assets (AU$190,00013). This is 56 per cent higher than newly divorced mothers and 26 per cent higher than married fathers. As the time from divorce increases, both divorced mothers and fathers re-invest in non-financial assets.
The effects of marital status on asset wealth primarily reflect differences in asset holdings in the form of home ownership and superannuation.
Each time an individual divorces their asset holdings are reduced by 9 per cent.
A divorced parent aged less than 45 years has 35 per cent less assets than a married respondent of the same age, while a divorced parent aged 45–64 years has assets valued at only 25 per cent of those of a married parent from a similar socio-economic background.

17
Debt
Marital status significantly affects parents’ level of debt and the effects of divorce on debt are different between men and women (Table 6). Non-property debt levels for divorced parents remain low relative to married couples with children. While property debt decreases immediately after divorce, divorced fathers have the same level of debt to married fathers five or more years after their divorce.
Table 6Components of total debt per adult in the household (2014 dollars)
Fathers MothersFinancial
debtNon-property
debtTotaldebt
Financial debt
Non-property debt
Totaldebt
($) Ratio(i) ($) Ratio(i) ($) Ratio(i) ($) Ratio(i) ($) Ratio(i) ($) Ratio(i)
In a couple 135,727 – 31,636 – 167,363 – 134,383 – 30,211 – 164,594 –
Divorced 1–4 years 77,394 0.57 22,758 0.72 100,152 0.60 70,717 0.53 13,886 0.46 84,603 0.51
Divorced ≥5 years 134,281 0.99 18,173 0.57 152,454 0.91 127,690 0.95 14,404 0.48 142,094 0.86
Source: NATSEM calculations from HILDA data wave 14.
(i) Ratio of debt value to that for a parent in a couple household.
There is no significant difference between the debt liability of a divorced and a married father with similar characteristics. However, a divorced mother has a debt liability that is 37 per cent less than a married mother of the same age and socio-economic background.
This is largely caused by the difference in debt in the form of home loans.
A divorced mother has a debt liability that is 37 per cent less than a married mother of the same age and socio‑economic background.

18
Retirement prospects
There are significant differences in the superannuation balances of married and divorced parents, and the effects of divorce on superannuation are very different for men and women (Figure 11). This reflects the differences in labour force participation and income levels between women and men.
Meanwhile, there is no significant difference in superannuation balances held by a divorced father compared with a matched married father either immediately or five years after divorce.
Within the same age and socio-economic group, a divorced mother has 37 per cent less superannuation than a divorced father.
Super balances are very different for adults with and without children. Married couples without children have super balances 50 per cent higher than those with children. The average superannuation balance of divorced females without children is similarly higher than divorced mothers. Divorced fathers have 20 per cent more in super than divorced men without children.
Figure 11Total superannuation per adult with dependent children ($2014)
86,109 87,193
134,725
63,767
135,845
77,632
Males Females
In a couple Divorced 1–4 years Divorced ≥5 years
Source: NATSEM calculations from HILDA data wave 14 (2014).
$201
4 pe
r ad
ult
0
20,000
40,000
60,000
80,000
100,000
120,000
140,000
160,000
Within the same age group, a divorced mother has 68 per cent less superannuation than a married mother from a similar socio-economic background.
13 Expressed in 2014 dollar terms.
19
Divorce has an impact on the proportion of the family budget that is spent on children following divorce. If families are under financial stress then most of their household budget will be spent on necessity goods14. Divorced mothers, who tend to assume primary responsibility for the children following a marriage breakdown, spend between 60 and 66 per cent of their household budget on necessity items.
Household spendingMarital status significantly affects parents’ total expenditure and the effects of divorce on household spending are different between men and women, as well as between parental age groups.
A divorced father aged 25–44 years spends more of his household budget (18 per cent) on selected necessity and luxury goods and services than a married father from a similar background whereas there is no difference between older fathers.
While there is no difference in the level of expenditure between younger divorced and married mothers of the same socio-economic status, a divorced mum aged 45–64 years tends to spend less than both a married mother (16 per cent) and a divorced dad (17 per cent) on necessity items.
This compares with 59.5 per cent for mothers who have been divorced for more than five years.
In contrast, newly divorced fathers spend 54.5 per cent and fathers who have been divorced for five or more years 59.2 per cent.
Married mothers and fathers spend 52.8 per cent of their household budget on these items.
This expenditure on necessity goods is having a negative impact on spending on private health insurance and education fees.
Surprisingly, a much greater share of the household budgets of divorced mothers and fathers is spent on alcohol, cigarettes and tobacco. Divorced parents also spend relatively more on meals outside of the home such as restaurants, take-aways, bought lunches and snacks.
Spending on children
14 Goods and services can be classified as either ‘necessity’ (e.g. food, electricity or gas) or ‘luxury’ (e.g. HD TV or home entertainment systems, holidays or recreational activities). ‘Necessity’ goods and services have a low income elasticity of demand i.e. when income rises, demand rises but proportionally less than the increase in income so the proportion of household expenditure on this good or service decreases with increasing income and ‘luxury’ goods and services are those that as people become wealthier, their demand for the good or service will increase proportionally more than the increase in income i.e. the share of household expenditure going on this good or service increases with rising income. An explanation of the derivation of household expenditure patterns is provided in the Technical Notes.
If families are under financial stress then most of their household budget will be spent on necessity goods14.
Mothers who have been divorced for less than five years spend 66.4 per cent of their household budget on necessities such as groceries, clothing and footwear, electricity and gas bills and other heating fuel, telephone and internet bills.

20
Table 7Components of equivalised annual household expenditure (2014)
MalesValue ($) Share to total expenditure (%)
In a couple
Divorced 1–4 years
Divorced ≥5 years
In a couple
Divorced 1–4 years
Divorced ≥5 years
Groceries 5,753 4,959 6,195 27.6 30.1 30.2
Clothing and footwear 1,282 784 961 6.1 4.8 4.7
Utilities(i) 2,102 1,764 2,987 10.1 10.7 14.6
Transport(ii) 1,827 1,475 1,979 8.8 8.9 9.7
Education fees 1,613 1,766 1,259 7.7 10.7 6.1
Health professionals and medicines(iii) 723 692 785 3.4 4.2 3.8
Private health insurance 731 537 453 3.5 3.3 2.2
Meals eaten out 1,627 1,404 2,224 7.8 8.5 10.9
Repairs, maintenance and insurance(iv) 4,066 1,713 2,051 19.5 10.4 10.0
Alcohol cigarettes and tobacco 1,140 1,382 1,600 5.5 8.4 7.8
Total 20,864 16,476 20,494 100.0 100.0 100.0
FemalesValue ($) Share to total expenditure (%)
In a couple
Divorced 1–4 years
Divorced ≥5 years
In a couple
Divorced 1–4 years
Divorced ≥5 years
Groceries 5,807 5,779 5,752 27.8 35.4 31.6
Clothing and footwear 1,283 1,164 1,100 6.1 7.1 6.0
Utilities(i) 2,103 2,420 2,248 10.1 14.8 12.4
Transport(ii) 1,852 1,490 1,733 8.9 9.1 9.5
Education fees 1,559 774 1,311 7.5 4.7 7.2
Health professionals and medicines(iii) 745 481 552 3.6 2.9 3.0
Private health insurance 734 371 445 3.5 2.3 2.5
Meals eaten out 1,621 1,424 1,536 7.8 8.7 8.5
Repairs, maintenance and insurance(iv) 4,015 1,384 2,037 19.2 8.5 11.2
Alcohol cigarettes and tobacco 1,164 1,060 1,473 5.6 6.5 8.1
Total 20,883 16,347 18,187 100.0 100.0 100.0
Source: NATSEM calculations from HILDA data wave 14.
(i) Electricity bills, gas bills and other heating fuel; and telephone rent, calls and internet charge.(ii) Public transport and taxis; and motor vehicle fuel.(iii) Fees paid to health practitioners; and medicines, prescriptions, pharmaceuticals, alternative medicines.(iv) Home repairs/renovations/maintenance; motor vehicle repairs/maintenance; and other insurance (home/contents/motor vehicles).
% Share of expenditure is ≤ 90% of that of a parent in a couple family.
% Share of expenditure is ≥ 110% of that of a parent in a couple family.

21
Child careThe cost of child care remains a major financial issue for Australian parents. Currently direct out-of-pocket costs to families for child care after Australian Government subsidies amount to 8.7 per cent of disposable household income on average15.
Nearly a third (30 per cent) of separated or divorced mothers report that the costs of child care over the previous year were difficult for them. This is despite the fact that expenditure by divorced or separated mothers on child care is only 51 per cent of that by couple families or 67 per cent of payments made by divorced or separated fathers.
Table 8Household annual net out-of-pocket costs of child care (2014)
Costs of child care while parents work ($) Other child care costs(i)
($)
Total costs of child care
($)‘not yet at school’
children school age children,
during school holidays
Couples 3,267 1,117 1,365 5,749
Father been divorced/currently separated
2,203 1,115 1,028 4,346
Average number of children per divorce
1,016 811 1,084 2,911
Source: NATSEM calculations from HILDA data wave 14.
(i) Other child care costs include costs for child care for both not yet at school and school age children while parents do not work, and for school age children, during term, while parents work.
15 The Government returns to families depending on their household income between 40 and 78 per cent of the gross costs of child care through child care benefits and rebates (DEEWR, 2013; Phillips, 2014).
Divorced or separated fathers contribute 68 per cent of the costs of child care for very young children.

22
Financial stressDivorced mothers are more likely to experience financial stress than divorced fathers or couple families (Figure 12).16
Figure 12Proportion of State and Territory populations aged 25–64 years who are separated or divorced (2014)
Male Female
17.62
6.386.12
1.79
27.14
10.31
24.94
28.92
16.31
41.65
11.69
5.91
19.93
9.73
15.3417.33
15.42
11.04
emergency funds
holiday spending on kids
emergency funds
holiday spending on kids
Source: NATSEM calculations from HILDA data wave 14.
In a couple Divorced 1–4 years Divorced ≥5 years
Prop
orti
on o
f fa
mili
es (%
)
0
5
10
15
20
25
30
35
40
45
16 The three indicators of financial stress are: 1. not being able to afford $500 in savings for an emergency 2. a week’s holiday away from home each year 3. school clothing, leisure activities, or school trips for the children.
One in five newly divorced mothers report they can’t afford spending on the kids such as school clothing, leisure activities, or school trips for their children. This compares with only one in 50 newly divorced fathers.

23
Education outcomesThe effects of divorce on expenditure on education are significantly different between divorced fathers and mothers (Table 9). Expenditure on education by a divorced mother is 64 per cent less than that of a divorced father from a similar socio-economic background. This may reflect fathers having been the main income earner in the family and that paying for their children’s education is their main source of child support.
The effect of divorce on children’s long term educational outcomes is significant, with children of divorced families more likely to leave school earlier. In 2014, one in five adults aged 25–44 years17 had left school before they completed high school (Table 10). Young adults from separated or divorced families also have a 50 per cent17 less chance of getting a university qualification than those with married parents.
However, these differences may reflect differences in the social and economic characteristics of married versus separated/divorced parents which influence educational attainment.
When socio-economic background is taken into account, family breakdown increases a child’s chance of being an early school leaver (i.e. doesn’t complete year 12) by 6 per cent. It decreases their likelihood of getting a tertiary education also by 6 per cent compared with children whose parents were married when they were 14 years of age.
Table 9The effect of divorce on children’s long term educational outcomes (persons 25–44 years of age in 2014)
Highest educational qualificationYear 11
or below (%)
Completed high school (Year 12)
(%)
Vocational educationqualification(i)
(%)
University degree(ii)
(%)
Male
With both parents at 14 years of age 9.6 16.3 37.2 36.9
Parents divorced/separated at 14 years of age 20.7 16.9 43.4 19.0
Female
With both parents at 14 years of age 10.7 13.8 29.5 46.0
Parents divorced/separated at 14 years of age 18.8 18.7 38.4 24.1
Source: NATSEM calculations from HILDA data wave 14.
(i) Certificate III or IV, or Diploma.(ii) Bachelor degree or postgraduate qualification.
17 Whose parents had been divorced or separated when they were 14 years of age.
Family breakdown increases a child’s chance of being an early school leaver by 6 per cent.

24
Conclusion
Divorce has a significant impact on families’ financial wellbeing, whether they have children or not, both in the short and medium term. While most families start to recover economically five years post-
divorce, there remains a significant gap in the financial well-being of divorced and
married couples even five years later.
The financial impacts of family breakdown are evident well before divorce is formally granted and family dissolution has major negative
economic consequences for parents and children.
Women, men, and children experience the financial consequences of divorce differently. The effects of divorce are, however, most
marked for mothers with smaller impacts being observed for fathers.
But it is clear that financially no one wins from divorce.
The effects of marital status on wealth accumulation are dramatic. The total value of assets owned by divorced individuals is substantially lower
than that of married couples. This is due to joint homes being sold and super balances
being split on separation.
Retirement for divorced couples look bleak, as super balances for divorced
women are 70 per cent less than married women, and 28 per cent lower for divorced men
compared with married men.
The negative effects of divorce on superannuation are most acutely felt by divorced mothers.

25
Nearly half of all divorces each year involve children. Divorced mothers
experience financial hardship more than couple families or families headed by a father
who has been divorced. And with 97 per cent of divorced households headed by divorced
mothers in Australia, Divorce: For richer, for poorer shows divorce has a negative impact
on the financial wellbeing of children of divorced families.
Family dissolution also imposes a small but significant educational disadvantage on children of separated or divorced parents. The negative impacts are seen relatively late in a child’s educational career in
reducing both their chance of completing secondary school as well as getting a university
education.
The financial wellbeing of Australian households can be influenced by good preparation. Men and women at the crossroads of divorce
should evaluate their financial situation carefully. Planning ahead for the financial
challenges of divorce is important to reduce its harmful effects.
While all partners may benefit from getting financial advice, this
seems particularly suitable to ensuring the financial wellbeing of separated and newly
divorced mothers.

26
ABS (2016). Marriages and Divorces, Australia, 2015. ABS Cat No 3310.0, Canberra. ABS (2015). General Social Survey, Australia, 2014. ABS Cat No 4159.0, Canberra.
Australian Government Attorney’s General Department (2016). Superannuation splitting laws – frequently asked questions. Commonwealth of Australia. https://www.ag.gov.au/FamiliesAndMarriage/Families/SuperSplitting/Pages/default.aspx
Australian Government Department of Education, Employment and Workplace Relations (DEEWR) (2013). Child Care in Australia, August 2013. Commonwealth of Australia.
de Vaus, D., Gray, M., Qu, L., & Stanton, D. (2015). The economic consequences of divorce in six OECD countries. Research Report No. 31. Melbourne: Australian Institute of Family Studies.
de Vaus, D., Gray, M., Qu, L., & Stanton, D. (2014). The Economic Consequences of Divorce in Australia. International Journal of Law, Policy and the Family, 2014, 28, 26–47.
Evans M.D.R., Kelley, J. & Wanner, R.A. (2001). Educational attainment of the children of divorce: Australia, 1940–90. Journal of Sociology, 37(3), 275–297.
Gray, M., & Chapman, B. (2007). Relationship breakdown and the economic welfare of Australian mothers and their children. Australian Journal of Labour Economics 10(4), 253–77.
Hewitt, B. (2008). Marriage Breakdown in Australia: Social Correlates, Gender and Initiator Status. FaHCSIA Social Policy Research Paper No. 35.
Kelly, S. & Harding, A. (2005). Love can hurt, divorce will cost. AMP.NATSEM Income and Wealth Report Issue 10, AMP, Sydney.
Phillips, B (2014). Child care affordability in Australia. AMP.NATSEM Income and Wealth Report Issue 35, AMP, Sydney.
References

27
Data used in this report come from the various waves including the latest release of the Household Income and Labour Dynamic Australia (HILDA) survey, which were collected during 2001–2014. The timing of separation and divorce is derived from two questions: “have any of these changes in marital status happened to you” and “when did this change happen”.
Because HILDA is a panel i.e. longitudinal dataset, individuals could be tracked over time so that variations in their social and economic circumstances and activities could be observed.
Financial wellbeing of divorced families with children
“Affected” children were defined as those children whose parents were divorced between 2001 and 2014. “Unaffected” children were selected as children who lived in a household where parents did not experience divorce for ten years. Only households with children under 16 years of age were selected for analysis in this study.
Disposable income is the net income of a household after the deduction of tax and welfare payments. An equivalence scale is used to make an adjustment to the household income so that the living standards of households of different sizes and composition can be compared. This study uses the “modified OECD” scale which is commonly used by academics and government agencies, e.g. ABS. Under such a measure, equivalised disposable income for a lone person household is the same as the household disposable income.
All dollar amounts are adjusted for inflation to reflect 2014 dollar values.
Changes in household assets and debt following divorce and in family expenditure on the kids
When couples separate, they need to reach an agreement on how their assets and debts will be divided. This may occur with spouses or de facto partners either agreeing on how these should be shared without any court involvement, or if they cannot reach an agreement then they may apply to a court for financial orders. Such orders can include the division of property, income, financial resources and debts; maintenance to provide financial support to an ex-partner; and child support which is governed by specific legislation and which is administered through the Australian Government Department of Human Services18.
If the dispute goes to court then a judicial officer will decide on what is just and equitable based on the unique facts of each case i.e. the way assets and debts are shared between ex-partners will depend on the individual circumstances of the family. The general principles the court considers are set out in the Family Law Act 1975 and are the same for both legally married couples and partners from a de facto relationship. In addition to assets and debts, the court typically takes into account:
– the direct financial contributions made by each party to the marriage (social or registered) such as wage and salary earnings;
– indirect financial contributions by each party such as gifts and inheritances from families;
– the non-financial contributions to the marriage or de facto relationship such as caring for children and homemaking; and
– future requirements – reflecting such things as age, health, financial resources, care of children and ability to earn19.
Superannuation is treated as a specific type of asset (property) – principally because it is held in a trust. Superannuation splitting laws allow separating couples to value their superannuation and divide superannuation payments, payable under a superannuation interest that one of them holds (Attorney-General’s Department).
Technical Notes
18 http://www.federalcircuitcourt.gov.au/wps/wcm/connect/fccweb/family-law-matters/property-and-finance/ property-and-finances-after-separation/
19 ibid

28
In terms of the analysis, these two sections of the Report were based on the latest release of the HILDA data which was wave 14 where data were collected in 2014. A number of econometric regression models were constructed to determine the partial effects of divorce on household asset holdings, debt, superannuation, household expenditure and expenditure on education. These dependent variables were equivalised by estimating values per adult in the household, and modelled as a function of gender, age, education level, employment status, income, marital status (married either in a registered marriage or in a de facto relationship, separated or divorced, single), time since divorce, and parental status i.e. whether the respondent had a dependent child aged between 0 and 15 years in 2014.
To estimate the effects of divorce on the educational outcomes of grown-up children (those aged 25–44 years in 2014), an ordered probit model was estimated of the highest educational qualification (year 11 or below, year 12, certificate or diploma, bachelor degree and post graduate qualification) of these individuals. This was based on the question in HILDA; if they did not live with both parents when they were 14 years of age was this because their parents were separated or divorced, controlling for age, gender, country of birth, parents’ educational level, and employment status of parents when the child was 14 years of age.
In wave 14 of HILDA, respondents were asked about household spending on a range of items. Unfortunately not all areas of household expenditure were included. These non-covered items mostly involved areas of discretionary spending on luxury goods such as holidays, entertainment, new and used cars etc. Expenditure is equivalised to take into account both the number of adults and children in the household.

NS2
443
11/
16
Recent AMP.NATSEM Income and Wealth Reports
– Buy now, pay later: Household debt in Australia (December 2015)
– Going the distance (June 2015)
– We can work it out (November 2014)
– Child care affordability in Australia (June 2014)
– Modern Family – The changing shape of Australian Families (October 2013)
– Cost of Kids – The cost of raising children in Australia (May 2013)
– Smart Australians – Education and innovation in Australia (October 2012)
– Prices these days! The cost of living in Australia (May 2012)
– Race against time: How Australians spend their time (November 2011)
– The Great Australian Dream – Just a dream? (July 2011)
– Little Australians – Differences in early childhood development (April 2011)
– Calling Australia Home (November 2010)
– The Pursuit of Happiness (July 2010)
– Saving Tomorrow – The saving and spending patterns of Australians (April 2010)
– Don’t stop thinking about tomorrow – The changing face of retirement – the past, the present and the future (November 2009)
– Healthy, wealthy and wise? – The relationship between health, employment and earnings in Australia (July 2009)
– She works hard for the money – Australian women and the gender divide (April 2009)
– What price the clever country? The cost of tertiary education in Australia (November 2008)
– Advance Australia Fair? – Trends in small area socio-economic inequality 2001–2006 (July 2008)
– Wherever I lay my debt, that’s my home – Trends in housing affordability and housing stress 1995–1996 to 2005–2006 (March 2008)
– Honey I calculated the kids ... it’s $537,000 – Australian child costs in 2007 (December 2007)
– Generation whY? (July 2007)
– Baby Boomers – Doing it for themselves (March 2007).
All the above reports are available from amp.com.au/ampnatsemreports
This report was written by Laurie Brown from the National Centre for Social and Economic Modelling (NATSEM) at the University of Canberra and published by AMP. This report contains general information only and although the information was obtained from sources considered to be reliable, the author, NATSEM and AMP do not guarantee that it is accurate or complete. Therefore, readers should not rely upon this information for any purpose including when making any investment decision. Except where liability under any statute cannot be excluded, NATSEM, AMP and their advisers, employees and officers do not accept any liability (where under contract, tort or otherwise) for any resulting loss or damage suffered by the reader or by any other person.
Suggested Citation: Laurie Brown, ‘Divorce: For richer, for poorer’, AMP.NATSEM Income and Wealth Report Issue 39, December 2016.