For personal use only - ASX · Henderson UK Property PAIF² UK OEICs/UTs Alternatives (0.9%) (1.7%)...
50
Andrew Formica Chief Executive Roger Thompson Chief Financial Officer 1H16 interim results Thursday 28 July 2016 For personal use only
Transcript of For personal use only - ASX · Henderson UK Property PAIF² UK OEICs/UTs Alternatives (0.9%) (1.7%)...

Andrew Formica
Chief Executive
Roger Thompson
Chief Financial Officer
1H16 interim results
Thursday 28 July 2016
For
per
sona
l use
onl
y
2
Agenda
• 1H16 overview
• EU referendum update
• 1H16 financial results
• Strategy and outlook
For
per
sona
l use
onl
y

3
1H16 1H15
3 year investment
performance¹ 77% 83%
Net flows £(2.0)bn £5.6bn
Total AUM £95.0bn £82.1bn
Underlying PBT £100.5m £117.4m
Underlying diluted EPS 7.1p 8.9p
Interim dividend per
share 3.20p 3.10p
1H16 overview
• Investment performance remains solid
• June Retail outflows were c.90% of the
1H16 Retail outflow of £1.4bn
• Institutional flows resilient in 2Q16
• AUM increase to £95.0bn (Dec 2015:
£92.0bn) driven by positive currency
translation
Widespread market uncertainty; operational and strategic resilience
1 Percentage of funds, asset-weighted, that are outperforming based on the relevant metric: peer percentile ranking for Retail, positive for absolute return, positive versus
benchmark for Institutional
For
per
sona
l use
onl
y
4
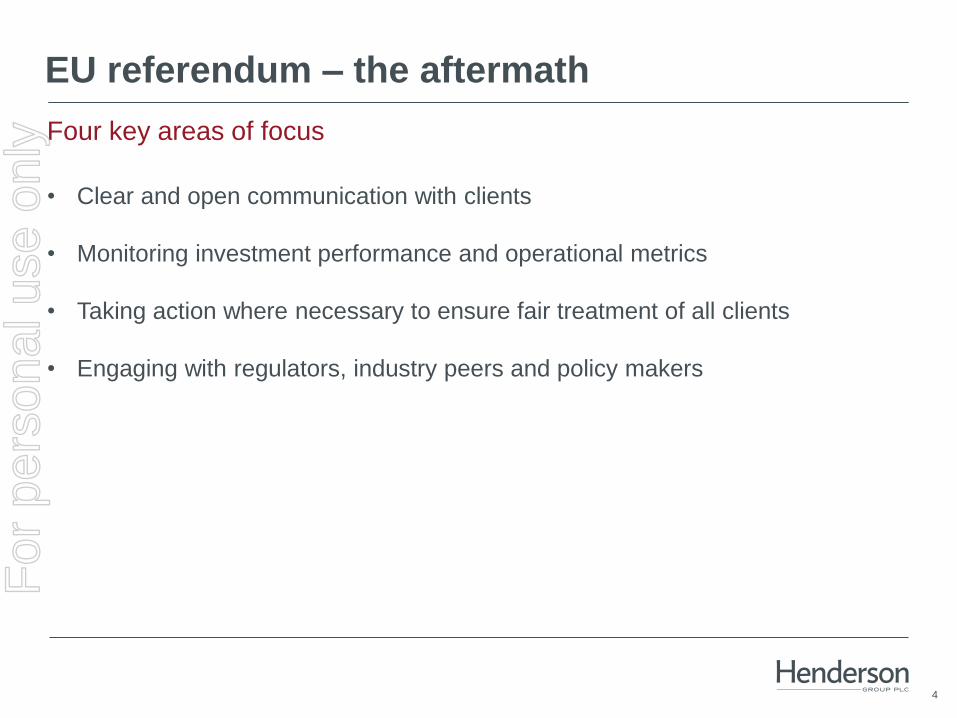
EU referendum – the aftermath
• Clear and open communication with clients
• Monitoring investment performance and operational metrics
• Taking action where necessary to ensure fair treatment of all clients
• Engaging with regulators, industry peers and policy makers
Four key areas of focus
For
per
sona
l use
onl
y

5
EU referendum – engagement with clients
“This was the best piece yet on the subject. Bravo.”
For
per
sona
l use
onl
y

6
EU referendum – investment performance
Relatively modest impact
Relative performance¹
Fund Fund range Capability 11 mths to
31 May 2016
12 mths to
30 Jun 2016
12 mths 22 days
to 22 Jul 2016
Closing AUM
30 Jun 2016
Henderson Gartmore Continental European SICAVs European Equities (1.7%) 1.3% 0.1% £3.7bn
Henderson Gartmore UK Absolute Return SICAVs Alternatives 4.9% 3.3% 3.8% £3.7bn
Henderson UK Property PAIF² UK OEICs/UTs Alternatives (0.9%) (1.7%) n/a £3.6bn
International Opportunities US Mutuals Global Equities (1.0%) (2.7%) (0.7%) £3.5bn
Henderson Horizon Pan Euro Equity SICAVs European Equities 1.2% (0.5%) (0.2%) £3.2bn
Global Equity Income US Mutuals Global Equities 8.6% 9.6% 8.8% £2.9bn
Henderson Horizon Euro Corporate Bond SICAVs Global Fixed Income (0.8%) (0.6%) (0.3%) £2.6bn
Henderson European Selected Opportunities UK OEICs/UTs European Equities (3.5%) (0.9%) (1.1%) £2.2bn
European Focus US Mutuals European Equities (5.3%) (6.7%) (5.4%) £2.1bn
Henderson Cautious Managed UK OEICs/UTs Global Equities (0.7%) (2.4%) (2.7%) £2.1bn
Henderson Strategic Bond UK OEICs/UTs Global Fixed Income 0.4% 0.2% 0.6% £1.6bn
Henderson UK Absolute Return UK OEICs/UTs Alternatives 5.4% 3.6% 4.5% £1.5bn
Henderson Horizon Global Technology SICAVs Global Equities 4.7% 3.5% 3.1% £1.4bn
The City of London Investment Trust Investment Trusts Global Equities 2.0% 3.9% 3.6% £1.3bn
Henderson Horizon Pan European Alpha SICAVs Alternatives (2.5%) (3.7%) (3.4%) £1.1bn
Henderson Horizon Euroland SICAVs European Equities 5.1% 3.4% 3.8% £1.0bn
Henderson European Growth UK OEICs/UTs European Equities 3.2% 4.3% 5.0% £1.0bn
The Bankers Investment Trust Investment Trusts Global Equities (2.9%) (1.4%) (0.9%) £0.8bn
Henderson Gartmore Pan European SICAVs European Equities (0.5%) 1.3% 0.7% £0.8bn
Henderson Fixed Interest Monthly Income UK OEICs/UTs Global Fixed Income 1.3% 0.4% 0.8% £0.8bn
Top 20 Retail funds by AUM
1 Performance relative to a sector, with the exception of Henderson Gartmore UK Absolute Return, Henderson UK Absolute Return and Henderson Horizon Pan European Alpha,
which are absolute returns 2 Henderson UK Property PAIF is measured against a customised sector of direct property funds and is currently suspended from dealing
For
per
sona
l use
onl
y
7
50
60
70
80
90
100
FY10 FY11 FY12 FY13 FY14 FY15 1H16
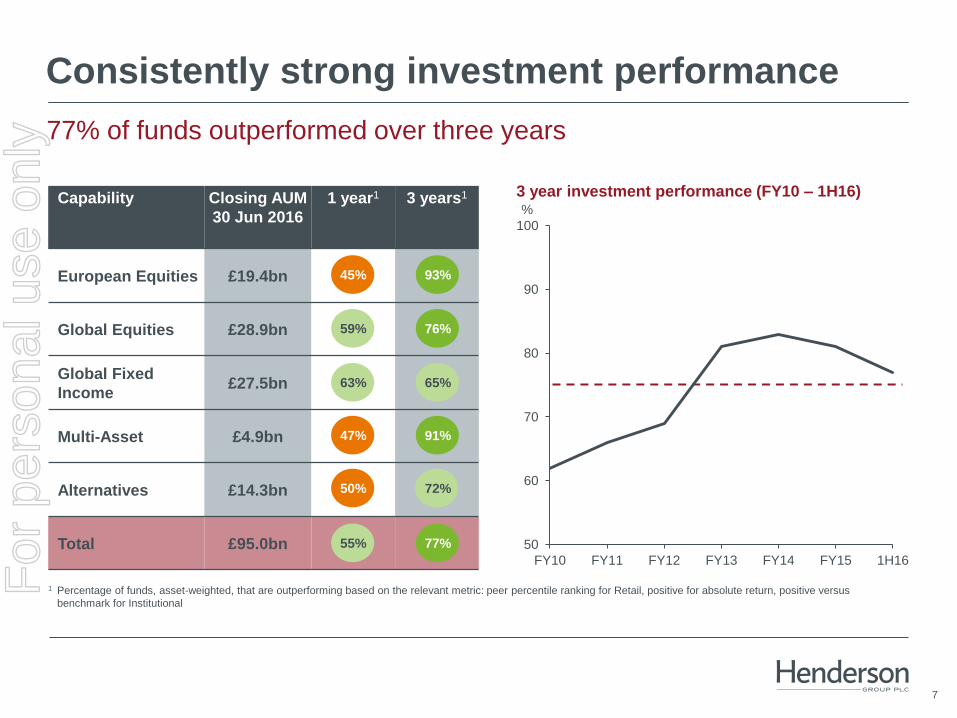
Capability Closing AUM
30 Jun 2016
1 year1 3 years1
European Equities £19.4bn
Global Equities £28.9bn
Global Fixed
Income £27.5bn
Multi-Asset £4.9bn
Alternatives £14.3bn
Total £95.0bn
1 Percentage of funds, asset-weighted, that are outperforming based on the relevant metric: peer percentile ranking for Retail, positive for absolute return, positive versus
benchmark for Institutional
Consistently strong investment performance
77% of funds outperformed over three years
93%
76%
65%
91%
72%
45%
59%
63%
47%
50%
77% 55%
%
3 year investment performance (FY10 – 1H16)
For
per
sona
l use
onl
y
8
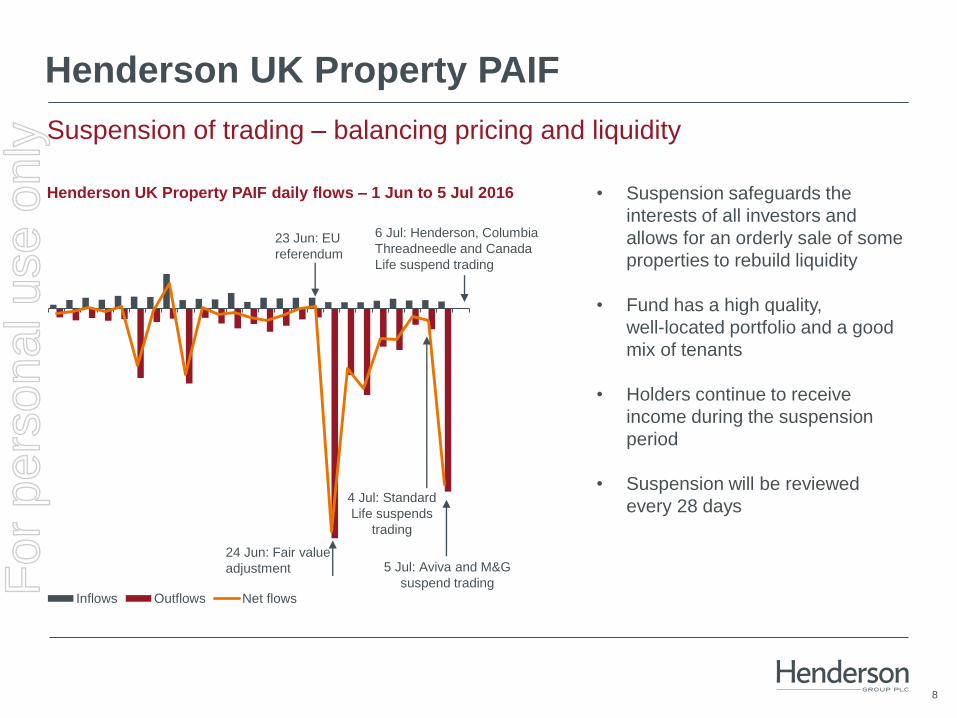
Henderson UK Property PAIF
Inflows Outflows Net flows
Suspension of trading – balancing pricing and liquidity
Henderson UK Property PAIF daily flows – 1 Jun to 5 Jul 2016 • Suspension safeguards the
interests of all investors and
allows for an orderly sale of some
properties to rebuild liquidity
• Fund has a high quality,
well-located portfolio and a good
mix of tenants
• Holders continue to receive
income during the suspension
period
• Suspension will be reviewed
every 28 days
23 Jun: EU
referendum
6 Jul: Henderson, Columbia
Threadneedle and Canada
Life suspend trading
5 Jul: Aviva and M&G
suspend trading
4 Jul: Standard
Life suspends
trading
24 Jun: Fair value
adjustment For
per
sona
l use
onl
y

9
EU referendum – operational considerations
• Client relationships
Clients served primarily by local teams from 7 European offices, with support from London
No change
• UK OEIC product range – £32.6bn
95% of clients are UK based although the range is passportable into Europe
No change
• SICAV product range – £21.1bn
Luxembourg-based ManCo, with funds sub-advised to non EU-based managers.
More in-country oversight may be required in Luxembourg
Minimal change
• EU regulation
Continue to implement MiFID II, PRIIPS etc in order to access the single market
No change
• UK regulation
Engagement at firm and industry level with the UK Government, UK Treasury and FCA
Increased activity at policy level
Minimal change currently expected to the way we operate our business
For
per
sona
l use
onl
y

10
4Q
07
1Q
08
2Q
08
3Q
08
4Q
08
1Q
09
2Q
09
3Q
09
4Q
09
1Q
10
2Q
10
3Q
10
4Q
10
1Q
11
2Q
11
3Q
11
4Q
11
1Q
12
2Q
12
3Q
12
4Q
12
1Q
13
2Q
13
3Q
13
4Q
13
1Q
14
2Q
14
3Q
14
4Q
14
1Q
15
2Q
15
3Q
15
4Q
15
1Q
16
2Q
16
Industry²Henderson
EU
referendum
1 Includes 4Q07 closing AUM and flows from Retail UK OEICs/Unit Trusts/Other, SICAVs and US Mutuals. Australian Managed Investment Schemes are excluded from Nov 2015
onwards 2 Source: Morningstar and Worldwide OE, excluding fund of funds, money market and feeder funds. Rebased to 4Q07 Henderson Retail AUM.
Macro events and their effect on Retail flows
Strategic initiatives have improved Henderson’s resilience
Cumulative effect of Retail flows on AUM as at 1 Jan 2008¹
Lehman Brothers
files for bankruptcy
4Q07 Retail
AUM: £10.8bn
Severe Greek austerity package.
Highest ever European
Unemployment.
Draghi pledge in Jul 2012
Portuguese
bailout. Prospect
of Greek default.
Total number of quarters 34
Total number of positive quarters 22
Total number of negative quarters 12
Average net flow – positive quarters £1.0bn
Average net flow – negative quarters (£0.5bn)
For
per
sona
l use
onl
y

11
(600)
(400)
(200)
0
200
w/c 30 May w/c 6 Jun w/c 13 Jun w/c 20 Jun w/c 27 Jun w/c 4 Jul w/c 11 Jul w/c 18 Jul
EU referendum – impact on Retail flows
Outflows moderating in July
Retail weekly net flows¹ – 30 May 2016 to 22 Jul 2016
£m
23 Jun: EU
referendum
1 Includes flows from UK OEICs, SICAVs and US Mutual funds
For
per
sona
l use
onl
y

12
Post referendum summary
• High levels of political and market uncertainty
• Increased communication with clients to continue to provide excellent service
and market insight
• Minimal change currently expected to the way we operate our business
For
per
sona
l use
onl
y

Roger Thompson
Chief Financial Officer
1H16 interim results
Financial results
For
per
sona
l use
onl
y

14
Financial highlights
1H16
£m
1H15
£m
Change
Management fees (net of commissions) 239.7 230.4 4%
Performance fees 20.1 48.8 (59%)
Other income 19.0 16.9 12%
Net fee income 278.8 296.1 (6%)
Income from associates and joint ventures 0.5 0.4 25%
Finance income 5.5 15.3 (64%)
Net income 284.8 311.8 (9%)
Total expenses (184.3) (194.4) (5%)
Underlying profit before tax 100.5 117.4 (14%)
Diversification and discipline in a tough first half
For
per
sona
l use
onl
y

15
Retail net flows
1Q14 2Q14 3Q14 4Q14 1Q15 2Q15 3Q15 4Q15 1Q16 2Q16
Retail US Mutuals
Retail SICAVs
UK Retail/Other¹
Outflows concentrated in the immediate aftermath of the EU referendum
2,875
1,863
£m
1 Includes flows from UK OEICs, Unit Trusts, Investment Trusts, Australian MIS (Managed Investment Schemes), Singapore Mutual funds and Retail Segregated Mandates
1,170 902
2,898
1,791 1,511
1,832
90
(1,444)
For
per
sona
l use
onl
y

16
Institutional net flows
1Q15 2Q15 3Q15 4Q15 1Q16 2Q16
Australia US UK/Europe Other
Increasingly international client base
£m
• UK is our most established business
• Developing pipeline in Continental Europe
• Positive flows in Australia into Fixed Interest
and Australian Equities
• Positive flows in the US in 2Q16 driven by
mandate wins for Henderson Geneva Small
Cap
• Pipeline building in Emerging Markets
656
249
(206)
(189)
(769)
85
For
per
sona
l use
onl
y
17
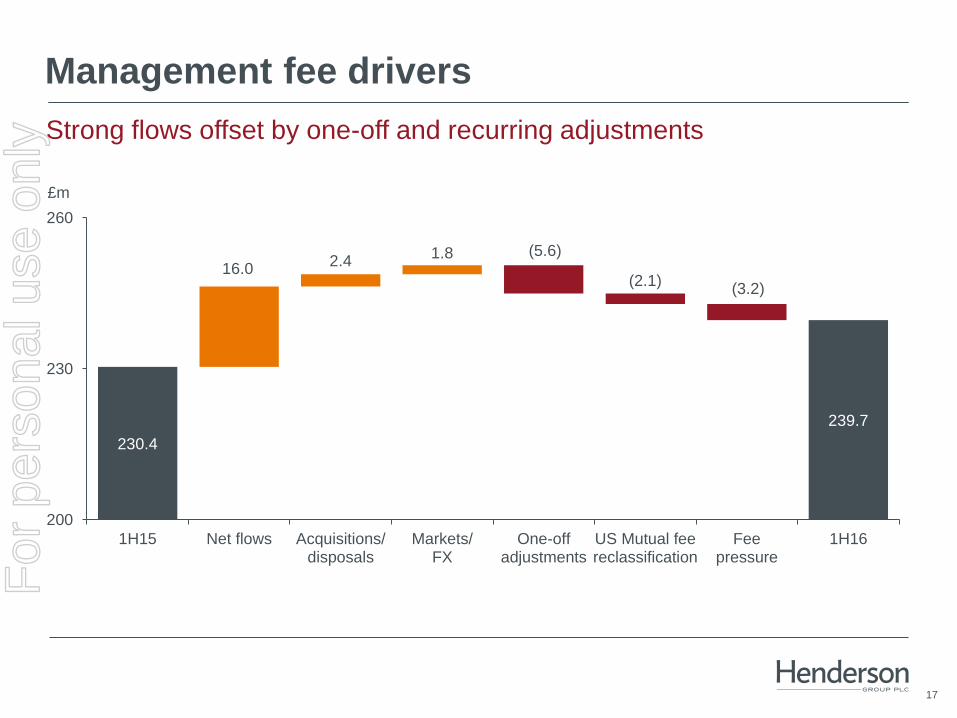
Management fee drivers
Strong flows offset by one-off and recurring adjustments
230.4
246.4 248.8 245 242.9
239.7 239.7
16.0 2.4
1.8 (5.6)
(2.1) (3.2)
200
230
260
1H15 Net flows Acquisitions/disposals
Markets/FX
One-offadjustments
US Mutual feereclassification
Feepressure
1H16
£m
For
per
sona
l use
onl
y
18
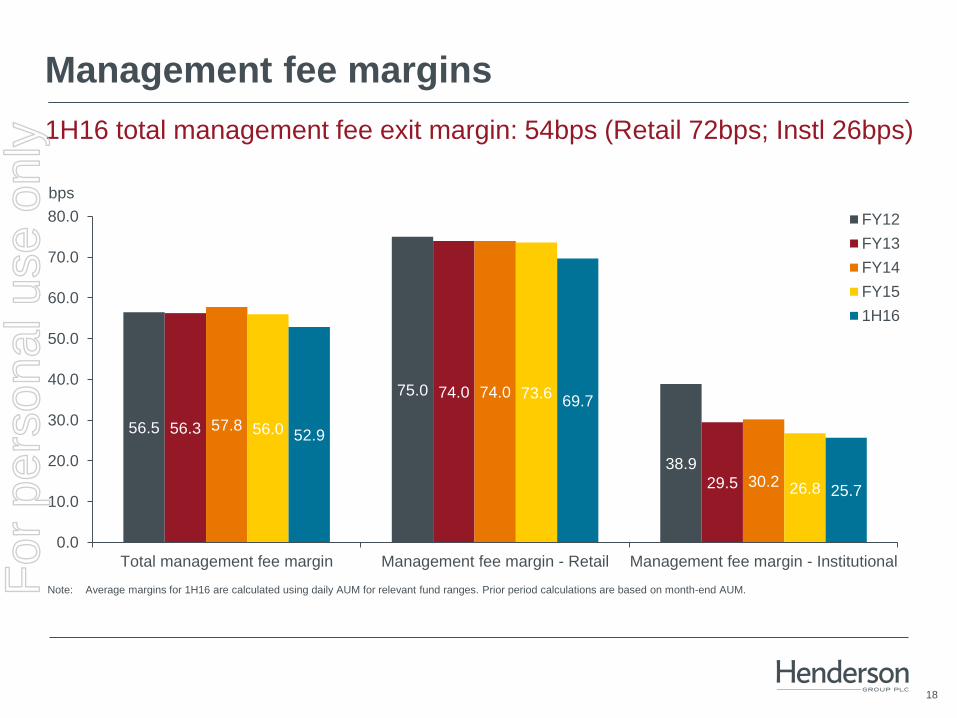
Management fee margins
bps
Note: Average margins for 1H16 are calculated using daily AUM for relevant fund ranges. Prior period calculations are based on month-end AUM.
56.5
75.0
38.9
56.3
74.0
29.5
57.8
74.0
30.2
56.0
73.6
26.8
52.9
69.7
25.7
0.0
10.0
20.0
30.0
40.0
50.0
60.0
70.0
80.0
Total management fee margin Management fee margin - Retail Management fee margin - Institutional
FY12
FY13
FY14
FY15
1H16
1H16 total management fee exit margin: 54bps (Retail 72bps; Instl 26bps)
For
per
sona
l use
onl
y
19
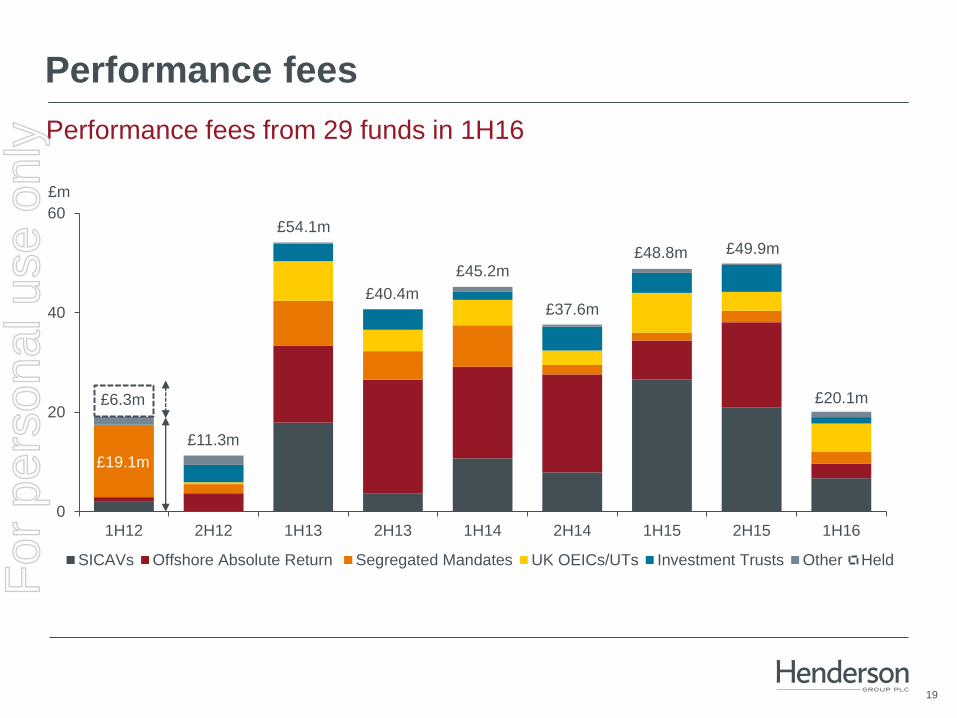
Performance fees
Performance fees from 29 funds in 1H16
0
20
40
60
1H12 2H12 1H13 2H13 1H14 2H14 1H15 2H15 1H16
SICAVs Offshore Absolute Return Segregated Mandates UK OEICs/UTs Investment Trusts Other Held
£m
£19.1m
£11.3m
£54.1m
£40.4m
£45.2m
£37.6m
£48.8m £49.9m
£20.1m £6.3m
For
per
sona
l use
onl
y

20
Operating cost drivers and action
Cost control to protect our investments
47.6 48.6 50.3
52.3 52.3 53.5
54.6 54.6 55.7
1.0
1.7
2.0 1.2
1.2 (0.1) 1.1
40
44
48
52
56
1H15 Australianbuild-out
Otherheadcount
BAUincreases
2H15 Australianbuild-out
FY15headcount
BAUincreases
FX 1H16
2H14 1H15 Change
(1H15 vs 2H14)
2H15 Change
(2H15 vs 1H15)
1H16 Change
(1H16 vs 2H15)
Headcount¹ 922 928 1% 1,016 9% 1,011 -
Fixed staff costs £45.4m £47.6m 5% £52.3m 10% £55.7m 7%
Variable staff costs £72.6m £84.3m 16% £84.4m - £67.0m (21%)
Non-staff costs £51.0m £56.7m 11% £61.5m 8% £58.3m (5%)
Fixed staff costs – 1H15 to 1H16 (£m)
1 At period end. Excludes staff working on capitalised projects.
For
per
sona
l use
onl
y

21
261.9 272.1
311.8 307.1
284.8
1H14 2H14 1H15 2H15 1H16
90.7 97.1
117.4 102.6 100.5
Operating margin and compensation ratio
Focus remains on absolute profit growth
44.8 44.7 44.5 44.7 44.0
35.0
36.0 36.3
35.2 35.1
1H14 2H14 1H15 2H15 1H16
Compensation ratio Operating margin
1 Employee compensation and benefits, divided by net fee income 2 Net fee income less total operating expenses, divided by net fee income
Operating margin and compensation ratio (%) Total income and underlying profit before tax (£m)
1 2
For
per
sona
l use
onl
y
22
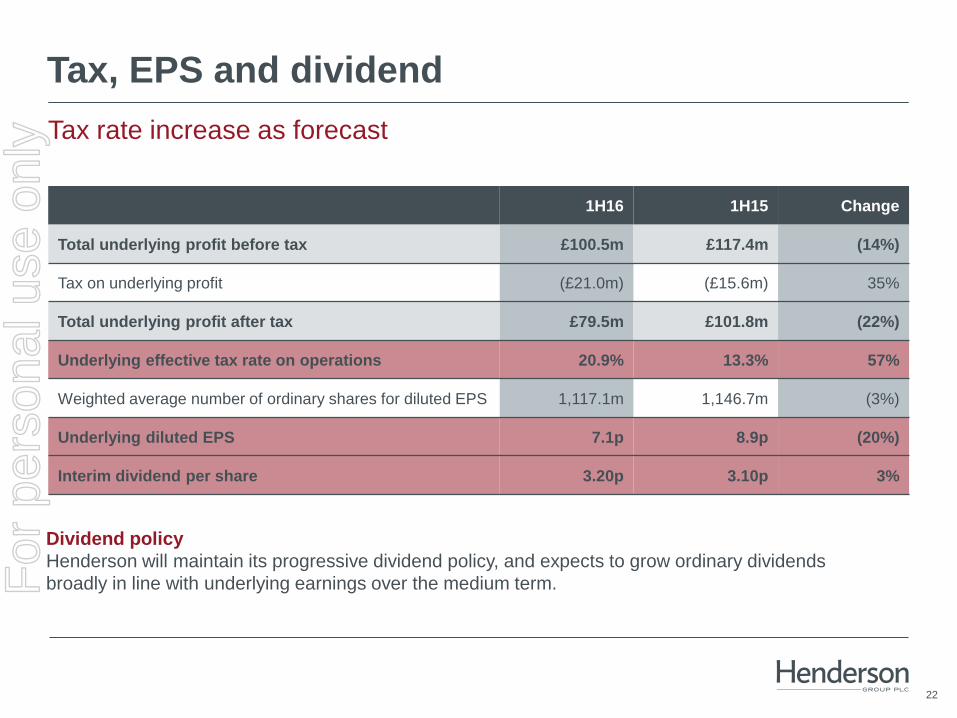
Tax, EPS and dividend
Tax rate increase as forecast
1H16 1H15 Change
Total underlying profit before tax £100.5m £117.4m (14%)
Tax on underlying profit (£21.0m) (£15.6m) 35%
Total underlying profit after tax £79.5m £101.8m (22%)
Underlying effective tax rate on operations 20.9% 13.3% 57%
Weighted average number of ordinary shares for diluted EPS 1,117.1m 1,146.7m (3%)
Underlying diluted EPS 7.1p 8.9p (20%)
Interim dividend per share 3.20p 3.10p 3%
Dividend policy
Henderson will maintain its progressive dividend policy, and expects to grow ordinary dividends
broadly in line with underlying earnings over the medium term. For
per
sona
l use
onl
y
23
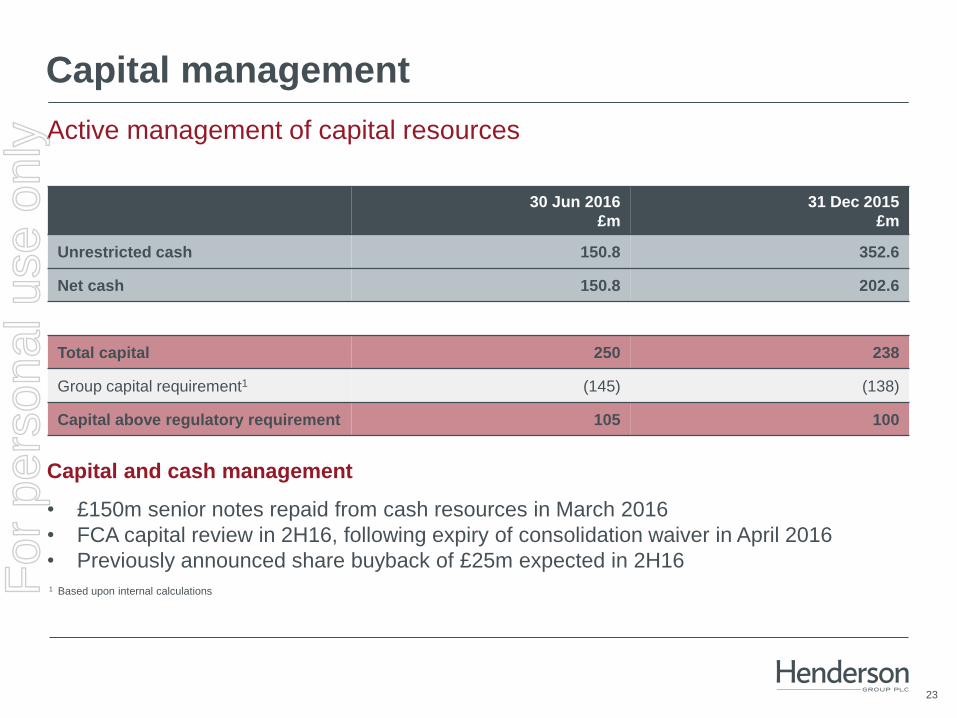
Capital management
30 Jun 2016
£m
31 Dec 2015
£m
Unrestricted cash 150.8 352.6
Net cash 150.8 202.6
Total capital 250 238
Group capital requirement1 (145) (138)
Capital above regulatory requirement 105 100
Active management of capital resources
1 Based upon internal calculations
Capital and cash management
• £150m senior notes repaid from cash resources in March 2016
• FCA capital review in 2H16, following expiry of consolidation waiver in April 2016
• Previously announced share buyback of £25m expected in 2H16 For
per
sona
l use
onl
y

1H16 interim results
Strategy and outlook
Andrew Formica
Chief Executive
For
per
sona
l use
onl
y

25
Growth and globalisation – mid-point review
AUMFY13¹
Net newmoney
Market/FX
Acquisitions AUM1H16
1 Excludes AUM subject to Property transactions with TIAA-CREF and resultant TH Real Estate JV AUM but includes Henderson UK Property OEIC
£63.7bn
Target: 6-8% pa
30 mths to Jun 16:
7% pa
£95.0bn
Target: 4-6% pa
30 mths to Jun 16:
7% pa
Target: 2-4% pa
30 mths to Jun 16:
3% pa
• At the mid-point of our five year plan,
we have executed well on our strategy
• Strong performance in an increasingly
diverse range of investment styles
• Broader client base
• Strong financial position
A fundamentally stronger, more diverse business
For
per
sona
l use
onl
y
26
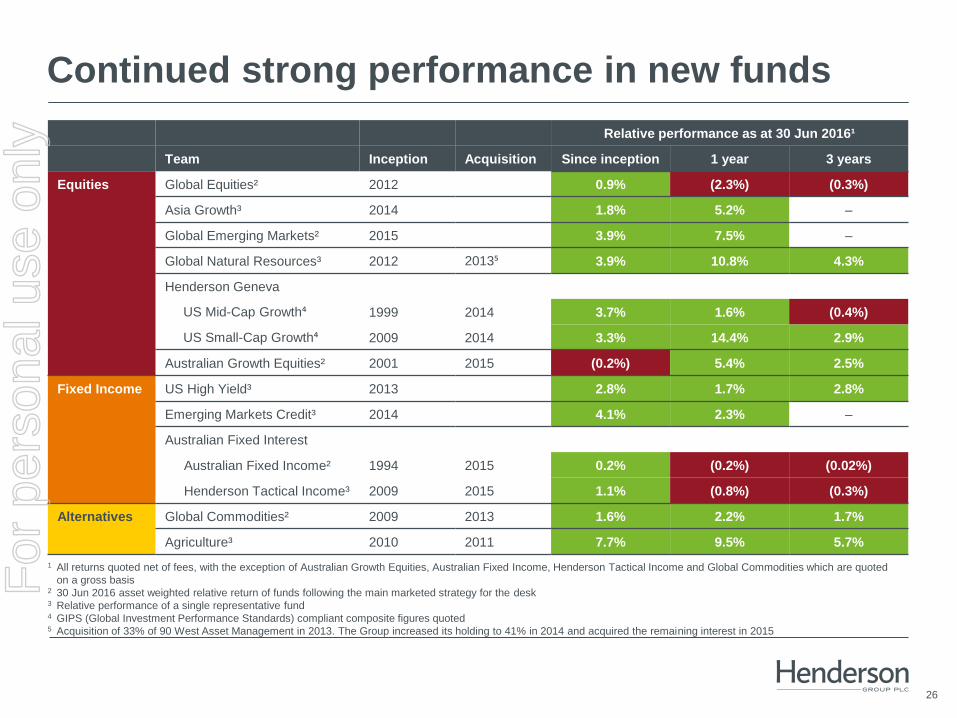
Continued strong performance in new funds
1 All returns quoted net of fees, with the exception of Australian Growth Equities, Australian Fixed Income, Henderson Tactical Income and Global Commodities which are quoted
on a gross basis 2 30 Jun 2016 asset weighted relative return of funds following the main marketed strategy for the desk 3 Relative performance of a single representative fund 4 GIPS (Global Investment Performance Standards) compliant composite figures quoted 5 Acquisition of 33% of 90 West Asset Management in 2013. The Group increased its holding to 41% in 2014 and acquired the remaining interest in 2015
Relative performance as at 30 Jun 2016¹
Team Inception Acquisition Since inception 1 year 3 years
Equities Global Equities² 2012 0.9% (2.3%) (0.3%)
Asia Growth³ 2014 1.8% 5.2% –
Global Emerging Markets² 2015 3.9% 7.5% –
Global Natural Resources³ 2012 2013⁵ 3.9% 10.8% 4.3%
Henderson Geneva
US Mid-Cap Growth⁴ 1999 2014 3.7% 1.6% (0.4%)
US Small-Cap Growth⁴ 2009 2014 3.3% 14.4% 2.9%
Australian Growth Equities² 2001 2015 (0.2%) 5.4% 2.5%
Fixed Income US High Yield³ 2013 2.8% 1.7% 2.8%
Emerging Markets Credit³ 2014 4.1% 2.3% –
Australian Fixed Interest
Australian Fixed Income² 1994 2015 0.2% (0.2%) (0.02%)
Henderson Tactical Income³ 2009 2015 1.1% (0.8%) (0.3%)
Alternatives Global Commodities² 2009 2013 1.6% 2.2% 1.7%
Agriculture³ 2010 2011 7.7% 9.5% 5.7%
For
per
sona
l use
onl
y

27
Increasingly global client base
UK
UK
Continental Europe and
LatAm Continental Europe and
LatAm
North America
North America
Pan-Asia Pan-Asia
0%
100%
FY13 1H16
c.50% of AUM now managed for clients outside the UK
Group AUM by client geography UK
• Well balanced Retail business
• Institutional well positioned
Continental Europe and LatAm
• Strong organic growth
• Broadening client base – Latin America,
discretionary portfolios, Retail advisory,
Institutional mandates
North America
• Diversification of client base: Institutional
flows turned positive in 2Q16 as Retail
flows reversed
Australia
• Strong flow momentum
• Opportunities to broaden platform
relationships For
per
sona
l use
onl
y

28
Outlook
• Retail net outflow starting to moderate in July
• Positive Institutional pipeline
• Stronger and better positioned as a result of growth and globalisation
• Remain vigilant on costs
• Strategy, direction and focus reconfirmed
For
per
sona
l use
onl
y

Q&A
For
per
sona
l use
onl
y

Appendix
For
per
sona
l use
onl
y

31
£m 1H16
Opening AUM
1 Jan 2016
Net flows Market/
FX
Closing AUM
30 Jun 2016
Closing AUM net
mgmt fee1 (bps)
UK OEICs/Unit Trusts/Other2 23,358 (584) 424 23,198
SICAVs 19,328 (817) 1,190 19,701
US Mutuals 8,647 14 454 9,115
Investment Trusts 5,582 33 (52) 5,563
Total Retail 56,915 (1,354) 2,016 57,577 72
UK OEICs/Unit Trusts 9,742 909 450 11,101
SICAVs 1,565 (259) 62 1,368
Australian MIS 1,499 (143) 198 1,554
Managed CDOs 102 (9) 12 105
Offshore Absolute Return Funds 2,397 (372) 198 2,223
Segregated Mandates 19,653 (807) 2,151 20,997
Private Equity Funds 58 (2) (2) 54
Other3 54 (1) 7 60
Total Institutional 35,070 (684) 3,076 37,462 26
Total Group 91,985 (2,038) 5,092 95,039 54
AUM and fund flows
1 Based on closing management fee bps excluding joint ventures and associates AUM 2 Includes Australian Managed Investment Schemes, Singapore Mutual funds and Retail Segregated Mandates 3 Includes US Mutuals
For
per
sona
l use
onl
y

32
AUM and fund flows
1 Based on closing management fee bps excluding joint ventures and associates AUM
2 AUM reported on a direct basis 3 Alternatives includes Property and Private Equity
£m 1H16
Opening AUM
1 Jan 2016
Net flows Market/
FX
Closing AUM
30 Jun 2016
Closing AUM net mgmt
fee1 (bps)
Equity 60,891 (1,928) 2,772 61,735 67
Fixed Income 26,841 331 2,422 29,594 27
Property 4,171 (425) (103) 3,643 n/a
Private Equity 82 (16) 1 67 n/a
Total Group 91,985 (2,038) 5,092 95,039 54
By asset class
£m 1H16
Opening AUM
1 Jan 2016
Net flows Market/
FX
Closing AUM
30 Jun 2016
European Equities 20,442 (1,228) 211 19,425
Global Equities 28,212 (950) 1,665 28,927
Global Fixed Income 24,797 378 2,341 27,516
Multi-Asset 4,890 (290) 299 4,899
Alternatives³ 13,644 52 576 14,272
Total Group 91,985 (2,038) 5,092 95,039
By capability²
For
per
sona
l use
onl
y

33
Henderson net flows
2,988
2,042
£m
Institutional
1 Includes flows from UK OEICs, Unit Trusts, Investment Trusts, Australian Managed Investment Schemes, Singapore Mutual funds and Retail Segregated Mandates
1,366 742
3,554
2,040
1,305 1,643
(679)
(1,359)
1Q14 2Q14 3Q14 4Q14 1Q15 2Q15 3Q15 4Q15 1Q16 2Q16
Retail US Mutuals
Retail SICAVs
UK Retail/Other¹
For
per
sona
l use
onl
y
34
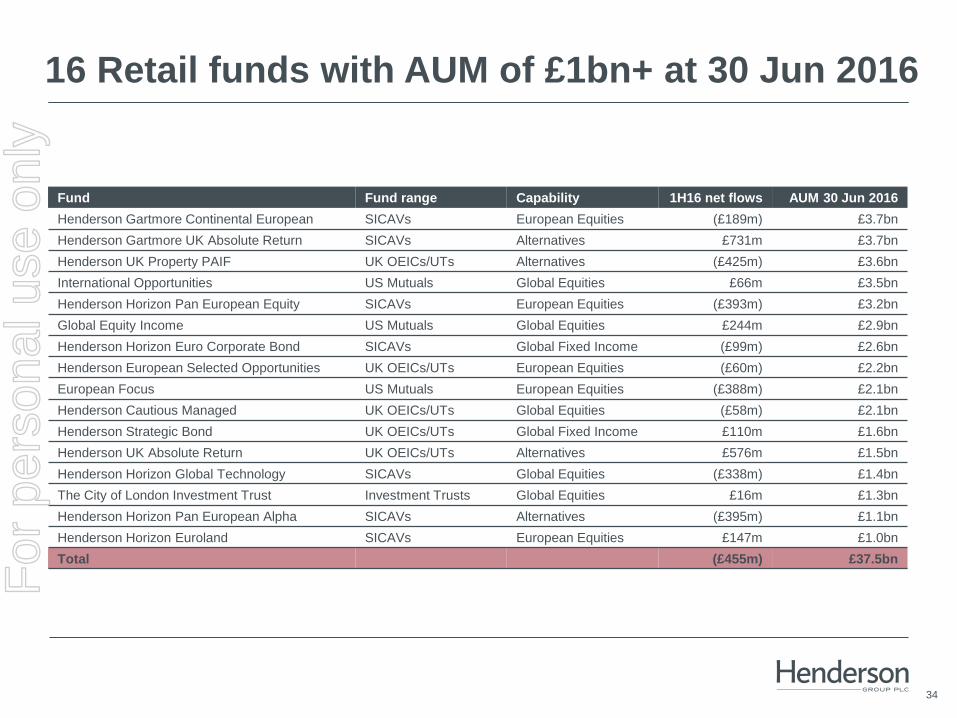
16 Retail funds with AUM of £1bn+ at 30 Jun 2016
Fund Fund range Capability 1H16 net flows AUM 30 Jun 2016
Henderson Gartmore Continental European SICAVs European Equities (£189m) £3.7bn
Henderson Gartmore UK Absolute Return SICAVs Alternatives £731m £3.7bn
Henderson UK Property PAIF UK OEICs/UTs Alternatives (£425m) £3.6bn
International Opportunities US Mutuals Global Equities £66m £3.5bn
Henderson Horizon Pan European Equity SICAVs European Equities (£393m) £3.2bn
Global Equity Income US Mutuals Global Equities £244m £2.9bn
Henderson Horizon Euro Corporate Bond SICAVs Global Fixed Income (£99m) £2.6bn
Henderson European Selected Opportunities UK OEICs/UTs European Equities (£60m) £2.2bn
European Focus US Mutuals European Equities (£388m) £2.1bn
Henderson Cautious Managed UK OEICs/UTs Global Equities (£58m) £2.1bn
Henderson Strategic Bond UK OEICs/UTs Global Fixed Income £110m £1.6bn
Henderson UK Absolute Return UK OEICs/UTs Alternatives £576m £1.5bn
Henderson Horizon Global Technology SICAVs Global Equities (£338m) £1.4bn
The City of London Investment Trust Investment Trusts Global Equities £16m £1.3bn
Henderson Horizon Pan European Alpha SICAVs Alternatives (£395m) £1.1bn
Henderson Horizon Euroland SICAVs European Equities £147m £1.0bn
Total (£455m) £37.5bn
For
per
sona
l use
onl
y

35
European Equities • Diverse, high performance business
Global Equities • Strong specialist franchises, building high
capacity global products
Global Fixed Income • Regional franchises with increasing global
exposure
Multi-Asset • Dual track approach to serve retail and
institutional markets
Alternatives • Expanding in liquid alternatives alongside
traditional hedge funds
European Equities
£19.4bn
AUM
30 Jun 2016
£95.0bn
Global Equities
£28.9bn
Global Fixed Income
£27.5bn
Alternatives
£14.3bn
Multi-Asset
£4.9bn
Retail
Retail
Retail
Retail
Retail
Institutional
Institutional
Institutional Institutional
Institutional
Investment management capabilities F
or p
erso
nal u
se o
nly

36
European Equities
Key funds Product Investment
performance
Fund
AUM
1H16
net flows
1 year 3 years
Henderson Gartmore Continental European SICAV £3.7bn (£0.2bn)
Henderson Horizon Pan European Equity SICAV £3.2bn (£0.4bn)
Henderson European Selected Opportunities OEIC £2.2bn (£0.06bn)
European Focus US Mutual £2.1bn (£0.4bn)
AUM: £19.4bn (Retail £17.1bn; Institutional: £2.3bn)
1H16 net flows: (£1.2bn)
1 year outperformance: 45%
3 years outperformance: 93%
For
per
sona
l use
onl
y

37
Global Equities
Selected key
desks
Desk
AUM
Key funds Product Investment
performance
Fund
AUM
1H16
net flows
1 year 3 years
Global Equity
Income £9.4bn
Global Equity Income US Mutual £2.9bn £0.2bn
The City of London Investment Trust Inv Trust £1.3bn £0.02bn
Asia¹ & GEMs £3.5bn Henderson China Opportunities OEIC £0.4bn (£0.1bn)
Global Technology £2.1bn Henderson Horizon Global Technology SICAV £1.4bn (£0.3bn)
Global Equity £1.5bn Henderson World Select OEIC £0.1bn –
Multiple desks² International Opportunities US Mutual £3.5bn £0.07bn
Multiple desks² Henderson Cautious Managed OEIC £2.1bn (£0.06bn)
AUM: £28.9bn (Retail £19.9bn; Institutional £9.0bn)
1H16 net flows: (£1.0bn)
1 year outperformance: 59%
3 years outperformance: 76%
1 Excludes Japan 2 AUM is managed across multiple desks
For
per
sona
l use
onl
y

38
Global Fixed Income
Selected key desks Desk
AUM
1H16
net flows
Key funds Product Investment
performance
1 year 3 years
Corporate Credit £13.4bn (£0.1bn) Henderson Horizon Euro Corporate Bond SICAV
All Stocks Credit Fund OEIC
Australian Fixed Income £5.1bn £0.3bn Henderson Tactical Income Fund Aus. MIS
Secured Credit £3.9bn £1.0bn Henderson Multi-Asset Credit Fund Unit Trust
Strategic Fixed Income £3.3bn £0.3bn Henderson Strategic Bond OEIC
Diversified Fixed Income
& Rates £1.8bn (£0.8bn)
Various absolute and total return
institutional mandates n/a
1 year outperformance: 63%
3 years outperformance: 65%
AUM: £27.5bn (Retail £8.5bn; Institutional £19.0bn)
1H16 net flows: £0.4bn
Note: Following the launch of the Henderson Institutional Short Duration Bond Fund, some clients moved mandates managed by the Diversified Fixed Income & Rates desk to
the Secured Credit desk. Net flow figures include these switches.
For
per
sona
l use
onl
y

39
Multi-Asset
Selected key funds Product Investment
performance
Fund
AUM
1H16
net flows
1 year 3 years
Institutional
Henderson Diversified Growth Fund OEIC £0.2bn (£0.01bn)
Henderson Diversified Alternatives OEIC £0.06bn –
Retail
All Asset US Mutual £0.03bn –
Henderson Multi-Manager Income & Growth OEIC £0.4bn (£0.02bn)
1 year outperformance: 47%
3 years outperformance: 91%
AUM: £4.9bn (Retail £1.7bn; Institutional £3.2bn)
1H16 net flows: (£0.3bn)
For
per
sona
l use
onl
y

40
Selected key desks Desk
AUM
Key funds Product Investment
performance
Fund
AUM
1H16
net flows
1 year 3 years
Equities £7.7bn
Henderson Gartmore UK
Absolute Return SICAV £3.7bn £0.7bn
Henderson Horizon Pan
European Alpha SICAV £1.1bn (£0.4bn)
Property £3.7bn Henderson UK Property PAIF OEIC/UT £3.6bn (£0.4bn)
Fixed Income £0.8bn Henderson Instl Absolute
Return Bond Unit Trust £0.2bn² (£0.02bn)
Commodities and
Agriculture £1.0bn
Various absolute return
institutional mandates
Alternatives
1 year outperformance: 50%
3 years outperformance: 72%
AUM¹: £14.3bn (Retail £10.3bn; Institutional £4.0bn)
1H16 net flows: £0.1bn
1 Alternatives includes Property and Private Equity. 2 The Henderson Institutional Absolute Return Bond AUM excludes cross holdings in other Henderson fixed income funds. This fund had a gross AUM of £1.0bn at
30 Jun 2016.
For
per
sona
l use
onl
y

41
Profit and loss
£m 1H16 1H15 Change 2H15 FY15
Management fees (net of commissions) 239.7 230.4 4% 237.9 468.3
Performance fees 20.1 48.8 (59%) 49.9 98.7
Other income 19.0 16.9 12% 17.9 34.8
Net fee income 278.8 296.1 (6%) 305.7 601.8
Income from associates and joint ventures 0.5 0.4 25% (0.6) (0.2)
Finance income 5.5 15.3 (64%) 2.0 17.3
Net income 284.8 311.8 (9%) 307.1 618.9
Fixed employee expenses (55.7) (47.6) 17% (52.3) (99.9)
Variable employee expenses (67.0) (84.3) (21%) (84.4) (168.7)
Non-staff operating expenses (58.3) (56.7) 3% (61.5) (118.2)
Total operating expenses (181.0) (188.6) (4%) (198.2) (386.8)
Finance expenses (3.3) (5.8) (43%) (6.3) (12.1)
Total expenses (184.3) (194.4) (5%) (204.5) (398.9)
Total underlying profit before tax 100.5 117.4 (14%) 102.6 220.0
Tax on underlying profit (21.0) (15.6) 35% (7.3) (22.9)
Total underlying profit after tax 79.5 101.8 (22%) 95.3 197.1
Acquisition related and non-recurring items
Acquisition related items (28.8) (30.3) (5%) (29.3) (59.6)
Non-recurring items (3.3) 11.0 (130%) (3.5) 7.5
Tax on acquisition related items 6.1 6.7 (9%) 6.0 12.7
Tax on non-recurring items (0.4) 1.4 (129%) 2.1 3.5
Total profit after tax 53.1 90.6 (41%) 70.6 161.2 For
per
sona
l use
onl
y

42
1H16
£m
1H15
£m
SICAVs 6.7 26.6
Offshore Absolute Return Funds 2.9 7.8
Segregated Mandates 2.5 1.6
UK OEICs & Unit Trusts 5.6 8.0
Investment Trusts 1.3 4.0
Other 1.1 0.8
Total performance fees 20.1 48.8
Performance fees
• Funds generating a performance fee: 29
• Performance fees as a percentage of net fee income: 7%
For
per
sona
l use
onl
y
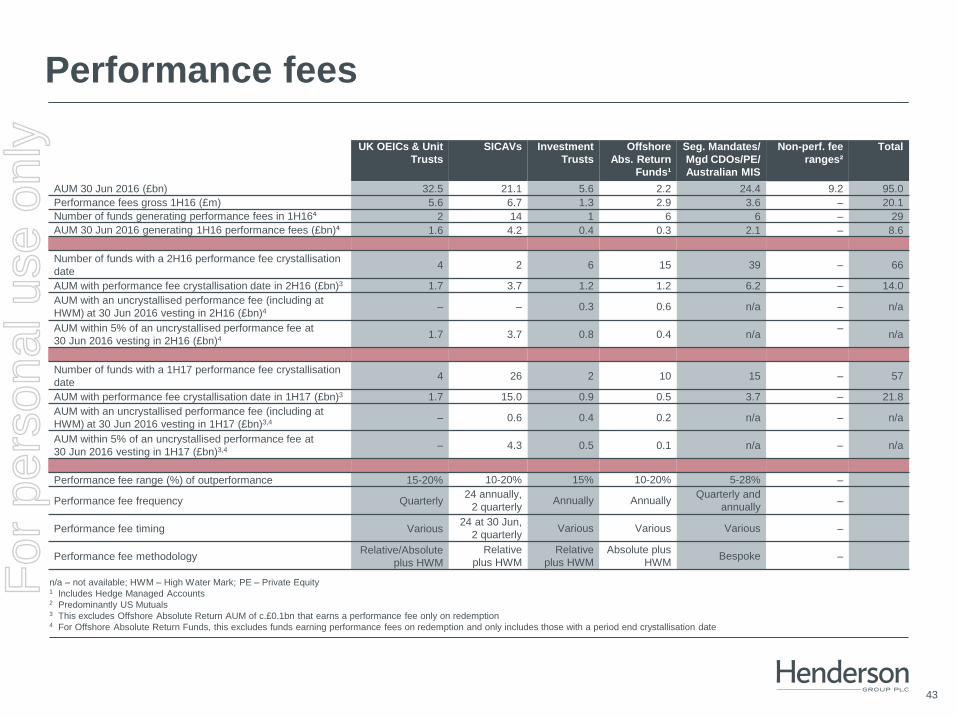
43
UK OEICs & Unit
Trusts
SICAVs Investment
Trusts
Offshore
Abs. Return
Funds¹
Seg. Mandates/
Mgd CDOs/PE/
Australian MIS
Non-perf. fee
ranges²
Total
AUM 30 Jun 2016 (£bn) 32.5 21.1 5.6 2.2 24.4 9.2 95.0
Performance fees gross 1H16 (£m) 5.6 6.7 1.3 2.9 3.6 – 20.1
Number of funds generating performance fees in 1H16⁴ 2 14 1 6 6 – 29
AUM 30 Jun 2016 generating 1H16 performance fees (£bn)⁴ 1.6 4.2 0.4 0.3 2.1 – 8.6
Number of funds with a 2H16 performance fee crystallisation
date 4 2 6 15 39 – 66
AUM with performance fee crystallisation date in 2H16 (£bn)3 1.7 3.7 1.2 1.2 6.2 – 14.0
AUM with an uncrystallised performance fee (including at
HWM) at 30 Jun 2016 vesting in 2H16 (£bn)4 – – 0.3 0.6 n/a – n/a
AUM within 5% of an uncrystallised performance fee at
30 Jun 2016 vesting in 2H16 (£bn)4 1.7 3.7 0.8 0.4 n/a –
n/a
Number of funds with a 1H17 performance fee crystallisation
date 4 26 2 10 15 – 57
AUM with performance fee crystallisation date in 1H17 (£bn)3 1.7 15.0 0.9 0.5 3.7 – 21.8
AUM with an uncrystallised performance fee (including at
HWM) at 30 Jun 2016 vesting in 1H17 (£bn)3,4 – 0.6 0.4 0.2 n/a – n/a
AUM within 5% of an uncrystallised performance fee at
30 Jun 2016 vesting in 1H17 (£bn)3,4 – 4.3 0.5 0.1 n/a – n/a
Performance fee range (%) of outperformance 15-20% 10-20% 15% 10-20% 5-28% –
Performance fee frequency Quarterly 24 annually,
2 quarterly Annually Annually
Quarterly and
annually –
Performance fee timing Various 24 at 30 Jun,
2 quarterly Various Various Various –
Performance fee methodology Relative/Absolute
plus HWM
Relative
plus HWM
Relative
plus HWM
Absolute plus
HWM Bespoke –
n/a – not available; HWM – High Water Mark; PE – Private Equity 1 Includes Hedge Managed Accounts 2 Predominantly US Mutuals 3 This excludes Offshore Absolute Return AUM of c.£0.1bn that earns a performance fee only on redemption 4 For Offshore Absolute Return Funds, this excludes funds earning performance fees on redemption and only includes those with a period end crystallisation date
Performance fees F
or p
erso
nal u
se o
nly
44
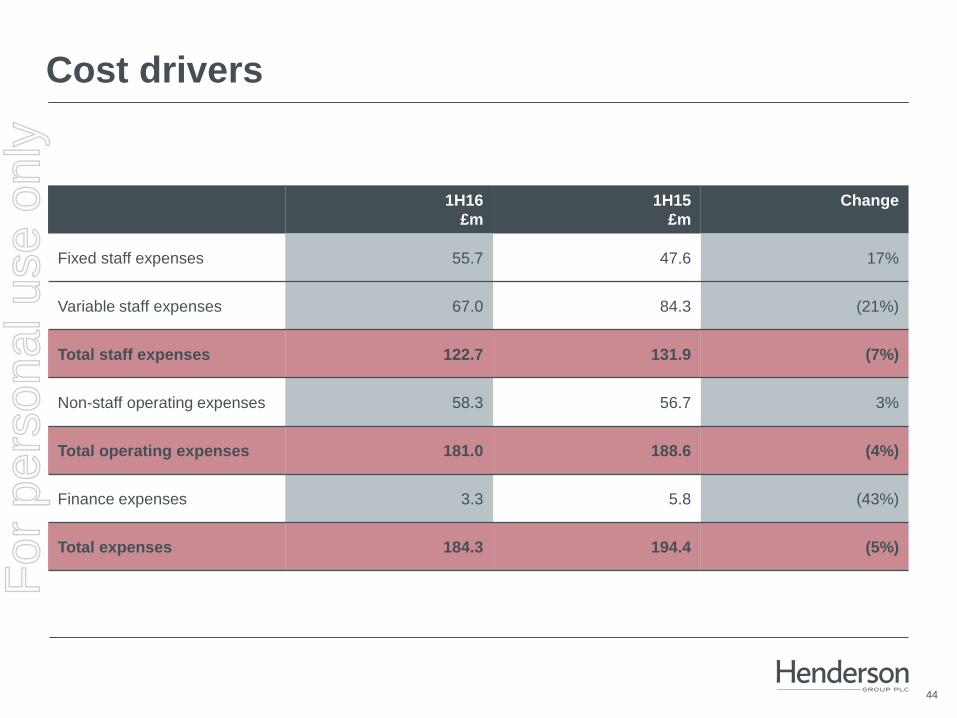
Cost drivers
1H16
£m
1H15
£m
Change
Fixed staff expenses 55.7 47.6 17%
Variable staff expenses 67.0 84.3 (21%)
Total staff expenses 122.7 131.9 (7%)
Non-staff operating expenses 58.3 56.7 3%
Total operating expenses 181.0 188.6 (4%)
Finance expenses 3.3 5.8 (43%)
Total expenses 184.3 194.4 (5%)
For
per
sona
l use
onl
y
45
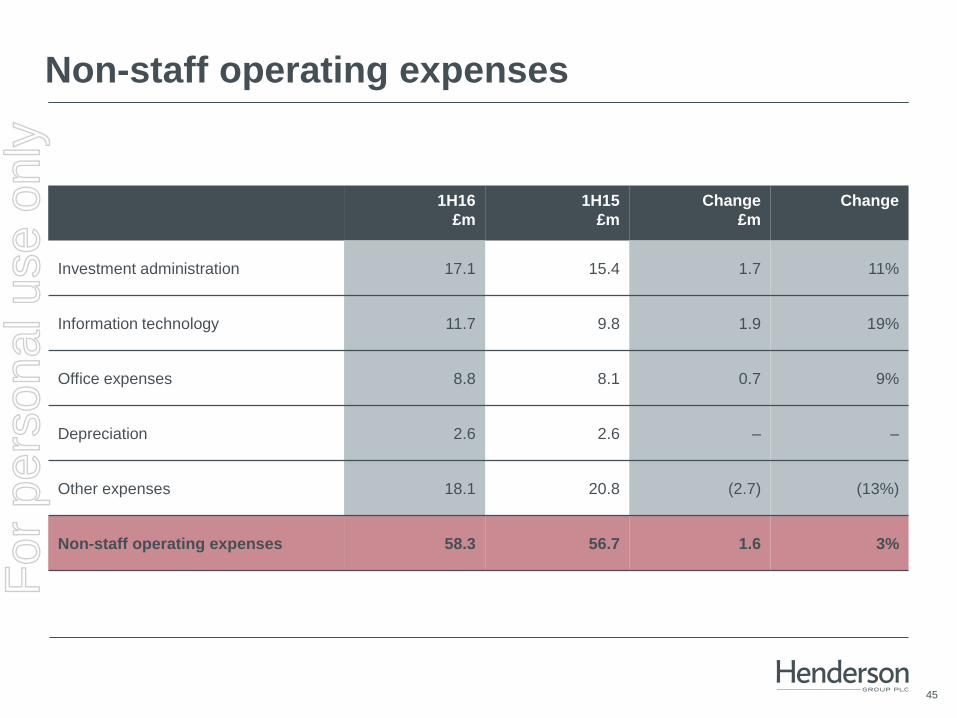
Non-staff operating expenses
1H16
£m
1H15
£m
Change
£m
Change
Investment administration 17.1 15.4 1.7 11%
Information technology 11.7 9.8 1.9 19%
Office expenses 8.8 8.1 0.7 9%
Depreciation 2.6 2.6 – –
Other expenses 18.1 20.8 (2.7) (13%)
Non-staff operating expenses 58.3 56.7 1.6 3%
For
per
sona
l use
onl
y
46
0
5
10
15
20
25
1H16 UKcorporate tax rate
Tax impact ofother jurisdictions
Normalised 1H16tax rate/accounting
and taxtreatment differences
ETR preone-off impacts
Normalised sharescheme
and one-off impacts
1H16 ETR
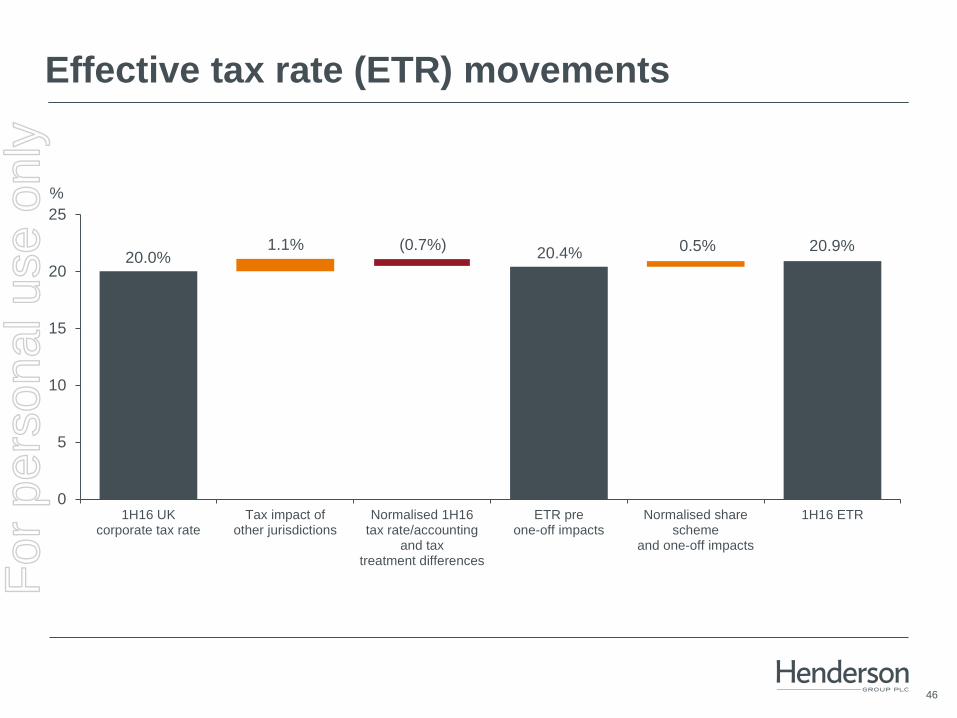
Effective tax rate (ETR) movements
20.0% 1.1% (0.7%)
20.4% 0.5%
%
20.9%
For
per
sona
l use
onl
y
47
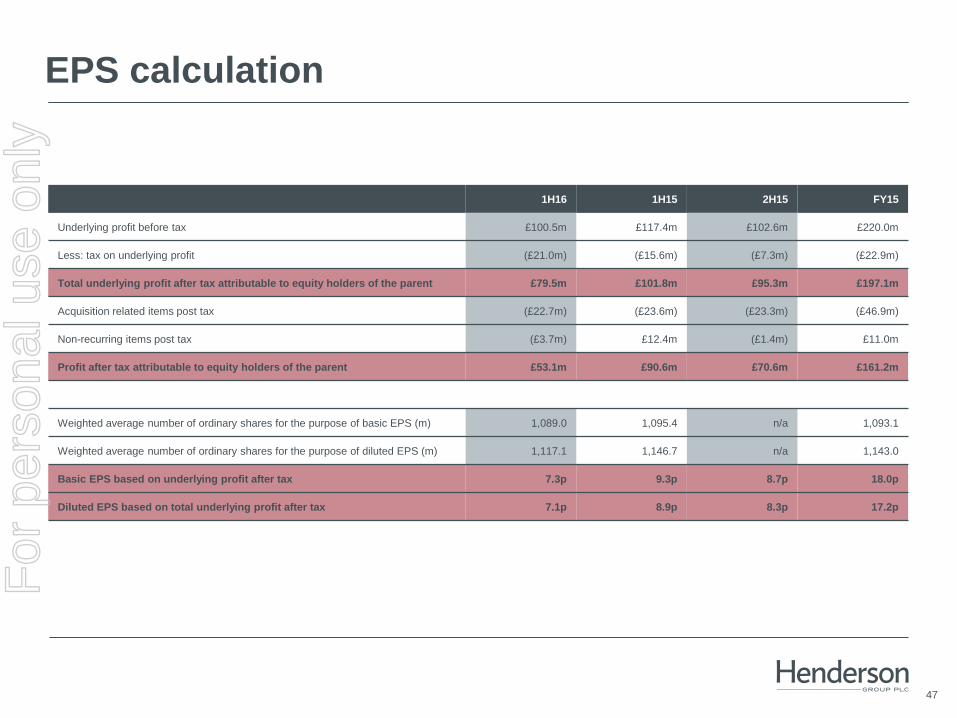
EPS calculation
1H16 1H15 2H15 FY15
Underlying profit before tax £100.5m £117.4m £102.6m £220.0m
Less: tax on underlying profit (£21.0m) (£15.6m) (£7.3m) (£22.9m)
Total underlying profit after tax attributable to equity holders of the parent £79.5m £101.8m £95.3m £197.1m
Acquisition related items post tax (£22.7m) (£23.6m) (£23.3m) (£46.9m)
Non-recurring items post tax (£3.7m) £12.4m (£1.4m) £11.0m
Profit after tax attributable to equity holders of the parent £53.1m £90.6m £70.6m £161.2m
Weighted average number of ordinary shares for the purpose of basic EPS (m) 1,089.0 1,095.4 n/a 1,093.1
Weighted average number of ordinary shares for the purpose of diluted EPS (m) 1,117.1 1,146.7 n/a 1,143.0
Basic EPS based on underlying profit after tax 7.3p 9.3p 8.7p 18.0p
Diluted EPS based on total underlying profit after tax 7.1p 8.9p 8.3p 17.2p
For
per
sona
l use
onl
y
48
0
50
100
150
200
250
300
31 Dec 2015¹ Operating cashflows
Dividendspaid
Net seed capitalinvestments
Purchase of ownshares forstaff shareschemes
30 Jun 2016¹
£m
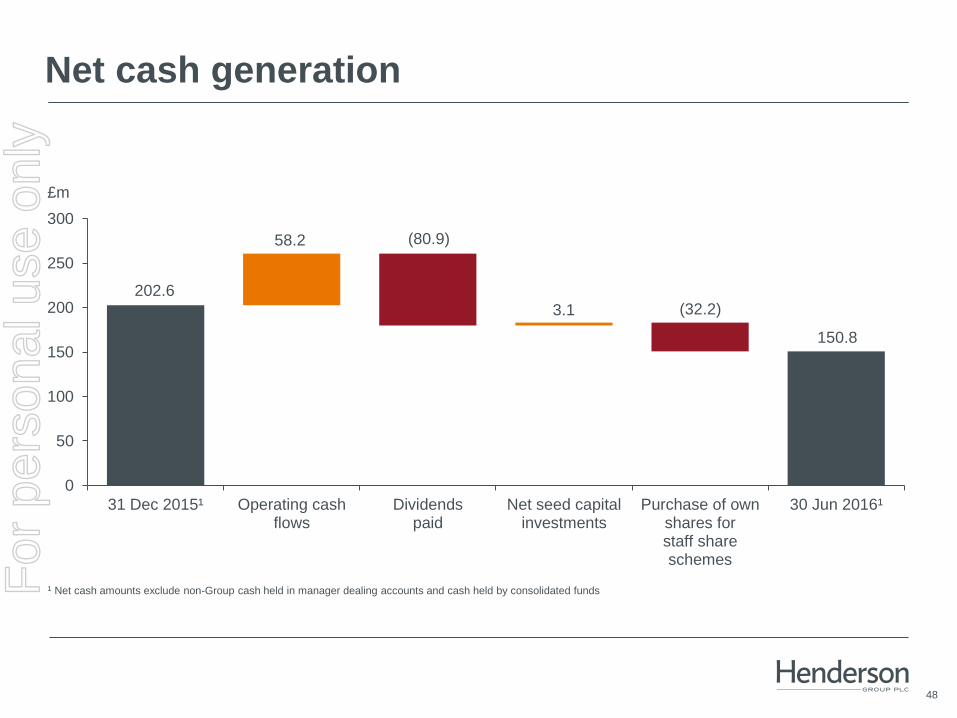
Net cash generation
1 Net cash amounts exclude non-Group cash held in manager dealing accounts and cash held by consolidated funds
202.6
58.2 (80.9)
3.1 (32.2)
150.8
For
per
sona
l use
onl
y

49
Contacts
Investor enquiries
Miriam McKay +44 (0) 20 7818 2106
Head of Investor Relations [email protected]
Louise Curran +44 (0) 20 7818 5927
Investor Relations Manager [email protected]
Investor Relations +44 (0) 20 7818 5310
Media enquiries
Angela Warburton +44 (0) 20 7818 3010
Global Head of Communications [email protected]
United Kingdom: FTI Consulting
Andrew Walton +44 (0) 20 3727 1514
Australia: Honner
Rebecca Piercy +61 2 8248 3740
For
per
sona
l use
onl
y

50
Henderson Group plc
201 Bishopsgate, London EC2M 3AE
Important information
This presentation issued by Henderson Group plc (or the “Group”) is a summary of certain information contained in the stock exchange
announcements dated 28 July 2016 (relating to the Group’s interim results to 30 June 2016) and should be read in conjunction with, and subject
to, the full text of those announcements.
This presentation contains forward-looking statements with respect to the financial condition, results and business of the Group. By their nature,
forward-looking statements involve risk and uncertainty because they relate to events, and depend on circumstances, that may or may not occur
in the future. There are a number of factors that could cause the Group’s actual future performance and results to differ materially from the results
expressed or implied in these forward-looking statements. The forward-looking statements are based on the Directors’ current view and
information available to them at the date of this presentation. The Group makes no undertaking to update or revise any forward-looking
statements whether as a result of new information, future events or otherwise. Nothing in this presentation should be construed as a profit
forecast.
For
per
sona
l use
onl
y