For personal use only - ASX › asxpdf › 20191028 › pdf › 449xz4... · Mitsubshi UFJ 8.0%...
30
Investor Presentation, October 2019 ASX Code: AMI Building the Next Mid-Tier Gold and Base Metals Producer For personal use only
Transcript of For personal use only - ASX › asxpdf › 20191028 › pdf › 449xz4... · Mitsubshi UFJ 8.0%...

Investor Presentation, October 2019 ASX Code: AMI
Building the Next Mid-Tier Gold and Base Metals Producer For
per
sona
l use
onl
y
2
Forward looking statements
This presentation has been prepared by Aurelia Metals Limited (“AMI” or the “Company”). It should not be considered as an offer or invitation to subscribe for or purchase any
securities in the Company or as an inducement to make an offer or invitation with respect to those securities. No agreement to subscribe for securities in the Company will be
entered into on the basis of this presentation.
This presentation contains forward-looking statements that are not based on historical fact, including those identified by the use of forward-looking terminology containing such
words as “believes”, “may”, “will”, “estimates”, “continue”, “anticipates”, “intends”, “expects”, “should”, “schedule”, “program” , “potential” or the negatives thereof and words of similar
import.
AMI cautions that these forward-looking statements are subject to risks and uncertainties that could cause actual events or results to differ materially from those expressed or
implied by the statements. The Company believes that the estimates are reasonable, but should not be relied upon.
AMI makes no representation, warranty (express or implied), or assurance as to the completeness or accuracy of these projections and, accordingly, expresses no opinion or any
other form of assurance regarding them. The Company does not intend to publish updates or revisions of any forward-looking statements included in this document to reflect
Aurelia’s circumstances after the date hereof or to reflect subsequent market analysis, other than to the extent required by law.
By its very nature, production and exploration for gold and base metals is a high risk business and is not suitable for certain investors. Potential investors should consult their
stockbroker or financial advisor. There are a number of risks, both specific to AMI and of a general nature which may affect the future operating and financial performance of AMI
and the value of an investment in AMI including and not limited to economic conditions, stock market fluctuations, commodity price movements, regional infrastructure constrains,
equipment availability, timing of approvals from relevant authorities, regulatory risks, operational risks, reliance on key personnel and foreign currency fluctuations.
You should not act or refrain from acting in reliance on this presentation material. This presentation does not purport to be all inclusive or to contain all information which its
recipients may require in order to make an informed assessment of the Company’s prospects. You should conduct your own investigation and perform your own analysis in order to
satisfy yourself as to the accuracy and completeness of the information, statements and opinions contained in this presentation before making any investment decision.
For
per
sona
l use
onl
y

Corporate snapshot
Major shareholders
Mitsubshi UFJ 8.0%
Australian Super 6.1%
Van Eck 5.7%
39%
19%
42%
Share register composition
Australianinstitutions
Internationalinstitutions
Other
ASX code: AMI
Share price (25 Oct 2019) $0.45
Shares on issue 873.4m
Market capitalisation A$389m
Board and management
Chairman and Acting CEO Cobb Johnstone
Non-Executive Directors
Lawrie Conway
Susie Corlett
Paul Espie
Paul Harris
Michael Menzies
CFO & Company Secretary
Additional Company
Secretary
Tim Churcher
Gillian Nairn
General Managers Scott Ramsay – Hera
Neal Valk – Peak
For
per
sona
l use
onl
y

4
Senior leadership appointments Managing Director & CEO and COO
Dan Clifford appointed Managing Director & CEO
Mining engineer with more than 25 years’ experience in the mining industry
Most recently was Managing Director of ASX-listed Stanmore Coal Limited
Prior experience with Solid Energy, Glencore, Anglo Coal, and BHP
Commences 25 November 2019
Peter Trout appointed as Chief Operating Officer (COO)
Mining engineer with 25 years’ experience in base metals and gold
Most recently Executive General Manager - Technical Support and Studies for PanAust
Prior roles with Caledon Coal, Perilya, Newcrest, and Mt Isa Mines
Commences in late November 2019
Interim arrangements
Cobb Johnstone will resume Non-Executive Chairman role from 25 November
Mike Menzies has resumed Non-Executive Director role
For
per
sona
l use
onl
y
5
Investment highlights
Dominant position in the highly
prospective Cobar Basin
Two major processing plants
with a combined capacity of
approx. 1.3Mtpa
High-margin gold and base
metals production profile
Strong balance sheet:
A$93m cash and no debt
(30 September 2019)
Upgrade and efficiency projects
set to drive margin and
operating life
Recent drilling success
highlights huge near-mine and
regional upside
For
per
sona
l use
onl
y

6
Bourke
Cobar Nyngan
Parkes ORANGE
Bathurst
Lithgow
Newcastle
SYDNEY
100kms
Nymagee Cu Project
Hera Au/Pb/Zn Mine
Cobar
Basin
A u s t r a l i a
NSW
Endeavour Zn/Pb/Ag (CBH-
Toho)
CSA Cu (Glencore)
Peak Au/Cu/Pb/Zn Mines
Mallee Bull Cu/Pb/Zn Project (Peel/CBH)
Wonawinta Ag
Southern Nights (Peel)
Key assets Located in the highly mineralised and productive Cobar Region
Federation Zn-Pb-Au-Cu-Ag
For
per
sona
l use
onl
y

7
Core strategy
Optimise existing operations
Increased development rates and Pb/Zn circuit upgrade
Mine life extension and ongoing efficiencies at Hera
Focus on returns
Margin over volume or commodity preference
Accelerating access to higher margin material for FY21
Leverage extensive UG and surface infrastructure: targeted near-mine drilling
Identify new high-NSR material; and
Extend asset operating lives
Unlock exceptional prospectivity: regional exploration to deliver the next major mine
A mining-for-value approach
1
2
4
3
For
per
sona
l use
onl
y

8
Building for extension and growth
September 2019 quarter benefited from grade and throughput increases at Peak
2H CY19 sees major investment in the business: Peak plant upgrade, accelerating UG
development and access to Kairos (Peak Deeps), exploration spend increased
Delivering higher Peak throughput and lower unit costs from 1H CY20
Heavy investment phase through current half
For
per
sona
l use
onl
y

9
September 2019 quarter dynamics
Group: 29.3koz gold at A$988/oz AISC
Peak: 18.8koz at A$764/oz AISC
Hera: 10.5koz at A$1,149/oz AISC
Cash of A$93M (30 June 2019: A$104M),
after A$18M of growth capital, A$15M of
tax/hedging payments and A$13M
working capital build
Maiden 2c dividend declared (Paid 2 Oct)
Strong gold and base metal production
Hera gold produced oz 14,191 13,864 10,535 10,535
Hera gold sold oz 15,161 11,071 12,789 12,789
Hera lead produced t 1,330 1,313 2,276 2,276
Hera zinc produced t 1,776 2,241 3,201 3,201
Hera AISC $/oz 957 1,122 1,149 1,149
Hera AIC (incl growth capital) $/oz 1,087 1,340 1,364 1,364
Peak gold produced oz 9,132 9,000 18,772 18,772
Peak gold sold oz 12,125 8,512 17,958 17,958
Peak copper produced t 817 1,045 1,590 1,590
Peak lead produced t 2,469 2,701 4,601 4,601
Peak zinc produced t 570 1,007 1,803 1,803
Peak AISC $/oz 1,600 1,752 764 764
Peak AIC (incl. growth capital) $/oz 2,085 2,899 1,631 1,631
Group gold production oz 23,323 22,864 29,307 29,307
Group gold sold oz 27,286 19,583 30,747 30,747
Group copper production t 817 1,045 1,590 1,590
Group lead production t 3,799 4,014 6,877 6,877
Group zinc production t 2,346 3,248 5,004 5,004
Group AISC $/oz 1,302 1,537 988 988
Group AIC $/oz 1,589 2,158 1,583 1,583
4) Numbers are provisional and subject to change.
1) AISC/oz (All-in Sustaining Cost) is the total of on-site mining, processing and admin costs, inventory adjustments, royalites, sustaining capital,
lease payments, less by-product credits divided by gold oz sold.
2) Group AISC includes corporate general and administration expenses
3) AIC/oz (All-in Cost) is AISC cost plus growth capital (expansionary capital and exploration). Income tax, working capital and interest are
excluded from these metrics.
Aurelia Metals Production Summary Units Mar 19 Qtr Jun 19 Qtr Sep 19 Qtr FY20
For
per
sona
l use
onl
y
10
September 2019 quarter dynamics
Peak
11% increase in underground development rates and ore access; targeting further lift
Increased mill throughput and benefit of high grade ore stocks
High level of concentrate stocks at quarter end; expected to unwind this quarter
Further extensional success at Kairos and decline commenced
Peak Pb/Zn plant upgrade on track
Hera
Slightly higher mining rates at reduced gold grade and significantly higher base metal grades
Mill throughput reduced by significant increase in base metal grades from North Pod
Targeting improved filtration performance to increase throughput
Opex impacted by largely one-off factors – water dam repairs, concentrate rehandling
Improved Peak performance
For
per
sona
l use
onl
y

11
Managing risk
Peak requires approx. 780ML/y of water
Traditionally sourced 100% from high security water allocation via Cobar Council
Site has implemented pumping of ground water from New Cobar and water recycling to reduce reliance on high security water
Possibility of future allocation being cut entirely in early 2020
Site implementing pumping of ground water from Great Cobar (planned to be operational by Dec 19), plan is for water self-sufficiency
Hera requires approx. 540 ML/y of water
Sourced from in-mine dewatering, bores and recycled water
Trucking of potable water (7% of overall site demand) increased in the September quarter – to relieve pressure on bores.
To ensure self-sufficiency, site installing pumping capacity from historic Nymagee mine and assessing a range of alternative ground water sources (discovered during this year’s exploration program to the south of Hera).
Actively mitigating water allocation risks at both operations
For
per
sona
l use
onl
y

12
A look at FY20: by mine
Peak
Gold production expected to be 52 – 59koz.
AISC expected to be higher than FY19; lower Au grade and
increased development
Processed throughput expected to be 580 – 610ktpa
Increased underground development rates
Mining up-dip of Chronos – higher Pb/Zn, lower Au
Pb/Zn circuit upgrade target completion in Mar 2020
Quarter
Increased mine and mill throughput from Jun 2020 Quarter
Accelerated access to base of Kairos (Peak Deeps) – high
margin tonnes, open
Forecast reduction in unit opex per tonne from higher
throughput, offset by impact of significantly increased
operating underground development metres
Exploring line-of-lode targets for Chronos and
Perseverance style deposits
Higher base metals output, lower gold production
Hera
Gold production expected to be 33 – 36koz
AISC expected to be lower than FY19; lower Au grade
forecast to be offset by lower operating costs and higher
expected base metal credits
Processed throughput expected to be similar to FY19
Reduced gold grades countered by higher base metals
content
Reduced unit costs and lower sustaining development
Testing highly encouraging targets to extend operating life
(Federation / Dominion and Main Southeast)
It should be noted that this outlook is indicative only and subject to change in response to prevailing and/or expected operating and market conditions.
For
per
sona
l use
onl
y

13
A look at FY20: group level Investing in the business – guidance on track
FY19 actual FY20 outlook
Gold (koz) 118 85 – 95
Lead (kt) 17.8 20 – 24
Zinc (kt) 13.5 25 – 30
Copper (kt) 4.3 4 – 6
Group AISC (A$/oz) 1,045 1,050 – 1,250 Capex and exploration
Growth capital: approx. A$40M, strongly weighted to 1H FY20
being predominantly the Pb/Zn plant upgrade at Peak (approx.
A$38M capital in FY20).
Sustaining capital: A$45-50M, with the majority associated with
Peak mine development
Exploration: current group FY20 budget of A$15M
Hedging
56koz gold hedged at an average of A$1,809/oz for FY20
‒ 21koz delivered at avg. A$1,736/oz for Sep 2019 quarter
‒ 35koz at avg. A$1,854/oz over rem. months to Jun 2020
Group AISC is the total of on-site mining, processing and administrative costs, inventory adjustments, royalties, sustaining capital, corporate
general and administration expense, less by-product credits, divided by gold oz sold. By-product credits include silver, lead, zinc and copper
sales forecast over the outlook period.
All-In-Sustaining-Cost (AISC)
Significant quarterly variation expected driven by expected throughput increases at Peak in 2H FY20 coupled with higher levels of base metal production from both operations
Dec 2019 quarter expected to be particularly weak due to lower forecast grades at Peak combined with partly restricted throughput from planned tie-ins for the Pb/Zn plant upgrade
Jun 2020 quarter should benefit from expected strong lift in Peak throughput following targeted plant upgrade completion in Mar 2020 quarter, with concurrent increase in high-grade Chronos Pb/Zn ore processed
Estimated FY20 Group AISC of A$1,050 to A$1,250/oz is based on reference
base and silver metal prices equivalent to those used for the Company’s June
2019 Ore Reserves estimation: lead A$3,000/t, zinc A$3,421/t, copper
A$8,553/t and silver A$22/oz. Final AISC results will depend on the actual
sales volumes, actual operating costs and actual prices of base metals
received over the outlook period.
It should be noted that this outlook is indicative only and subject to change in response to prevailing and/or expected operating and market conditions.
For
per
sona
l use
onl
y

14
A look ahead
Annual throughput at Peak in FY21 expected to be approaching nameplate 800ktpa capacity
Accelerated UG development expected to deliver access to base of Kairos towards end of
FY20; strong potential for prioritisation and mining of high margin tonnes from Kairos in FY21
Growth capital expenditure in FY21 expected to reduce sharply following expected completion
of the Peak Pb/Zn upgrade in 3Q FY20
FY21 and beyond
It should be noted that this outlook is indicative only and subject to change in response to prevailing and/or expected operating and market conditions.
For
per
sona
l use
onl
y

15
Building value
01 02 03 04
Robust operational
base
Peak: 4 year Reserve life
Hera: 4 year Reserve life
Upgrade and
efficiency projects
Peak: Pb/Zn plant
upgrade
Peak: increasing mining
productivity and
development rates
Hera: lower UG development requirement
Near-mine inventory
additions
Chronos Extensions,
Pb/Zn
Kairos (Peak Deeps)
Great Cobar
Hera near mine
Main South East Deeps
Regional exploration
success
Federation
Dominion
Athena
For
per
sona
l use
onl
y

16
Exploration
For
per
sona
l use
onl
y

17
The exploration value driver
Enhanced financial ability and growing geological understanding of controls on mineralisation
High-grade Kairos deposit
High-grade Cu below Kairos
Upper Chronos extensions
Ongoing results at Federation; large-scale, polymetallic and strong grade tenor
Emerging shallow gold potential at Federation and Athena
FY20 budget of A$15M
Federation/Dominion
Near-mine (Athena et al.)
Peak line-of-lode targets
Significant recent drilling success
For
per
sona
l use
onl
y

18
Cobar Line-of-Lode Targeting high margin mineralisation
World-class mining area with long
history of discovery
Prospective trend extends over 10 km
Multiple high tonnage and/or high
grade deposits along the full strike
Focus on discovery of new high margin
Peak/Perseverance-style orebodies
Renewed focus on potential for
additional Chronos/Kairos-style
mineralisation around known lodes
For
per
sona
l use
onl
y

19
Chronos Significant up-dip potential
[Upper Chronos / Peak Deeps long section] High margin Zn-Pb-Au ores
Recent drilling extends lode more
than 100 metres above current
resources/reserves
Very strong base metals, including:
19m at 34.1% Pb+Zn & 0.9g/t Au
15m at 35.1% Pb+Zn, 2.3g/t Au
24m at 29.6% Pb+Zn & 0.4g/t Au
23m at 27.3% Pb+Zn & 0.2g/t Au
Remains open up-dip, additional
drilling planned For
per
sona
l use
onl
y

20
Kairos: high-margin drilling success
Discovered early 2019; directly beneath Peak decline development
Mineralisation style and geological setting similar to Chronos
Open up- and down-dip
Very high grade intercepts, including:
16m at 71.6g/t Au & 8.5% Pb+Zn
14m at 42.9g/t Au & 13.4% Pb+Zn
23m at 25.9g/t Au & 33.2% Pb+Zn
39m at 6.9g/t Au & 20.3% Pb+Zn
Infill and extensional drilling ongoing, visible gold noted in some holes (assays pending)
Decline access from Perseverance progressing
The next Chronos?
For
per
sona
l use
onl
y

21
Kairos: high-grade Cu at depth Rhyolite hosted, analogous to Peak and Perseverance
New zone of strong copper mineralisation 150m below current Kairos Resource
25m at 3.0% Cu & 9g/t Ag, includes 12m @ 4.1% Cu & 11g/t Ag
Surface drilling program commenced to further test depth potential
Additional high grade base metal and gold lower in Kairos:
19 metres at 19.7% Pb+Zn, 4.3g/t Au & 0.6% Cu
16 metres at 17.8% Pb+Zn, 1.7g/t Au & 0.1% Cu
9 metres at 18.1% Pb+Zn, 5.3g/t Au & 1.7% Cu
For
per
sona
l use
onl
y

22
Federation discovery Accelerating evaluation work
Very recently discovered (April 2019)
10km south-southwest of Hera
Multiple high grade intercepts include:
26m at 16.4% Pb+Zn, 0.1g/t Au, incl.
11.5m at 31.1% Pb+Zn & 0.1g/t Au
20m at 11.9% Pb+Zn, 0.1g/t Au, incl.
6m at 28.2% Pb+Zn & 0.1g/t Au
5m at 22.6% Pb+Zn & 3.1g/t Au
6m at 21.1% Pb+Zn & 0.3g/t Au
Emerging gold potential
Potential ore source for the Hera processing plant
Strong visual sulphide intercepts in step-out drilling to the northeast (assays pending)
Strong Zn-Pb mineralisation intercepted in FRCD019 drill core, ~490m below surface
For
per
sona
l use
onl
y

23
Hera North Pod Extending Hera’s mine life
High grade Pb-Zn-Au-Ag mineralisation
Highest tonnage ore source at Hera
2018/19 drilling extends lode up-dip,
including:
7m at 45.1% Pb+Zn, 229g/t Ag &
0.3g/t Au
6.4m at 43.6% Pb+Zn, 263g/t Ag &
0.3g/t Au
14m at 18.3% Pb+Zn, 188g/t Ag &
0.8g/t Au
Open up-dip
Further underground drilling planned
For
per
sona
l use
onl
y

24
Building Value in
the Cobar Basin
Regional foothold Highly strategic asset base in the polymetallic Cobar Basin with two
major processing plants possessing a combined capacity of 1.3Mtpa
High margin output
Established, high-value gold and base metals production profile
NSR discipline Core focus on margin rather than volume or commodity
Driving margin and life Upgrade and efficiency projects to deliver productivity and cost benefits
Investing in the drill bit Highly targeted near-mine exploration with strong risk-return metrics
Utilising our premium geological postcode Regional exploration targeted to deliver the next major mine
A positive operating presence Targeting sustainable operations with a strong social licence to operate
Leveraging a strategic asset
base in a highly endowed
mineral province
For
per
sona
l use
onl
y

25
Appendix
For
per
sona
l use
onl
y

26
Peak Mine Corridor F
or p
erso
nal u
se o
nly

27 Mineral Resources as at 30 June 2019. This information is extracted from the Aurelia ASX release dated 19 July 2019 and entitled “Mineral Resource and Ore Reserve Statement – June 2019”.
Mineral Resources estimates (June 2019)
Class Tonnes
(kt)
NSR
(A$/t)
Au
(g/t)
Cu
(%)
Pb
(%)
Zn
(%)
Ag
(g/t) Measured 1,919 204 1.7 1.3 0.6 0.7 11
Indicated 7,402 219 1.6 1.3 1.1 1.3 10
Inferred 4,889 207 1.3 1.6 0.5 0.8 7
Total 14,210 213 1.5 1.4 0.9 1.1 9
Peak 2019 Mineral Resources
Class Tonnes
(kt)
NSR
(A$/t)
Au
(g/t)
Pb
(%)
Zn
(%)
Ag
(g/t) Measured 977 238 2.2 2.8 4.2 23
Indicated 957 216 1.4 2.9 4.4 44
Inferred 126 215 2.3 1.6 2.8 39
Total 2,061 227 1.8 2.8 4.2 34
Hera 2019 Mineral Resources
Utilises A$120/t NSR cut-off mineable shapes that include internal dilution; tonnage estimates have been rounded to the nearest 1,000 tonnes
Utilises A$120/t NSR cut-off mineable shapes that include internal dilution; tonnage estimates have been rounded to the nearest 1,000 tonnes For
per
sona
l use
onl
y

28 Ore Reserves as at 30 June 2019. This information is extracted from the Aurelia ASX release dated 19 July 2019 and entitled “Mineral Resource and Ore Reserve Statement – June 2019”.
Ore Reserves estimates (June 2019)
Class Tonnes
(kt)
NSR
(A$/t)
Au
(g/t)
Cu
(%)
Pb
(%)
Zn
(%)
Ag
(g/t)
Proved 376 181 1.2 1.7 0.3 0.6 11
Probable 2,458 232 2.1 1.0 2.0 2.1 16
Total 2,834 225 2.0 1.1 1.8 1.9 15
Class Tonnes
(Kt)
NSR
(A$/t)
Au
(g/t)
Pb
(%)
Zn
(%)
Ag
(g/t) Proved 0 0 0 0 0 0
Probable 1,577 218 1.9 3.0 4.5 34
Total 1,577 218 1.9 3.0 4.5 34
Peak 2019 Ore Reserves
Hera 2019 Ore Reserves
Utilises a A$130/t NSR cut-off; tonnage estimates have been rounded to the nearest 1,000 tonnes
Utilises NSR cut-offs of A$150/t (Peak and Perseverance) and A$130/t (New Cobar, Jubilee and Chesney); tonnage estimates have been rounded to the nearest 1,000 tonnes
For
per
sona
l use
onl
y
29
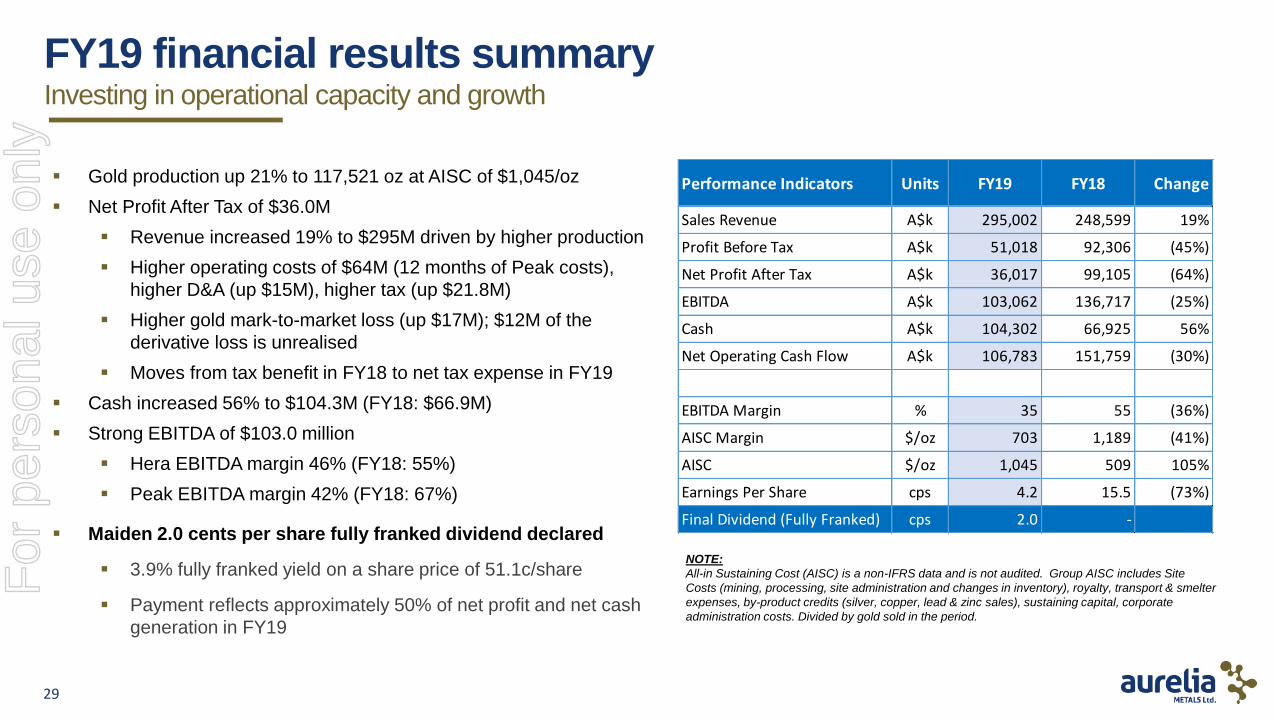
FY19 financial results summary
Gold production up 21% to 117,521 oz at AISC of $1,045/oz
Net Profit After Tax of $36.0M
Revenue increased 19% to $295M driven by higher production
Higher operating costs of $64M (12 months of Peak costs),
higher D&A (up $15M), higher tax (up $21.8M)
Higher gold mark-to-market loss (up $17M); $12M of the
derivative loss is unrealised
Moves from tax benefit in FY18 to net tax expense in FY19
Cash increased 56% to $104.3M (FY18: $66.9M)
Strong EBITDA of $103.0 million
Hera EBITDA margin 46% (FY18: 55%)
Peak EBITDA margin 42% (FY18: 67%)
Maiden 2.0 cents per share fully franked dividend declared
3.9% fully franked yield on a share price of 51.1c/share
Payment reflects approximately 50% of net profit and net cash
generation in FY19
Investing in operational capacity and growth
NOTE:
All-in Sustaining Cost (AISC) is a non-IFRS data and is not audited. Group AISC includes Site
Costs (mining, processing, site administration and changes in inventory), royalty, transport & smelter
expenses, by-product credits (silver, copper, lead & zinc sales), sustaining capital, corporate
administration costs. Divided by gold sold in the period.
Performance Indicators Units FY19 FY18 Change
Sales Revenue A$k 295,002 248,599 19%
Profit Before Tax A$k 51,018 92,306 (45%)
Net Profit After Tax A$k 36,017 99,105 (64%)
EBITDA A$k 103,062 136,717 (25%)
Cash A$k 104,302 66,925 56%
Net Operating Cash Flow A$k 106,783 151,759 (30%)
EBITDA Margin % 35 55 (36%)
AISC Margin $/oz 703 1,189 (41%)
AISC $/oz 1,045 509 105%
Earnings Per Share cps 4.2 15.5 (73%)
Final Dividend (Fully Franked) cps 2.0 -
For
per
sona
l use
onl
y

30
Competent Person(s) Statements
Hera Mineral Resource Estimate
Compilation of the drilling database, assay validation and geological interpretations for the Mineral Resource update were completed by Adam McKinnon, BSc (Hons), PhD, MAusIMM, who is a full time employee of Aurelia Metals Limited. The Mineral Resource estimate has been prepared by Rupert Osborn, BSc, MSc, MAIG, who is an employee of H&S Consultants Pty Ltd. Both Dr McKinnon and Mr Osborn have sufficient experience which is relevant to the style of mineralisation and type of deposit under consideration and to the activity which they are undertaking to qualify as Competent Persons as defined in the 2012 Edition of the ‘Australasian Code for Reporting of Exploration Results, Mineral Resources and Ore Reserves’. Dr McKinnon and Mr Osborn consent to the inclusion in this report of the matters based on their information in the form and context in which it appears.
Hera Ore Reserve Estimate
The Ore Reserve Estimate was compiled by Givemore Kamupita, Senior Mining Engineer at Hera Mine. Mr Kamupita has worked at polymetallic mines including Olympic Dam. He has also worked at KCGM and several mines in Africa. Mr Kamupita is a mining engineer with a BE Mining Eng. obtained at the University of Newcastle Upon Tyne (UK), MSc Mining Engineering (UNSW), Master of Business Administration (UNISA) and is completing a Masters in Geostatistics with Adelaide University. Mr Kamupita has worked in underground hard rock mines since 1984 with 35 years’ experience.
Mr Kamupita has sufficient experience which is relevant to the style of mineralisation, type of deposit and mining method under consideration and to the activity which he is undertaking to qualify as a Competent Person as defined in the 2012 Edition of the ‘Australasian Code for Reporting of Exploration Results, Mineral Resources and Ore Reserves’. Mr Kamupita is a member of the AusIMM with whom he recently completed a Professional Certificate JORC Code Reporting course and also holds both NSW and WA Underground Mining Engineering Manager Certificates.
Anthony Allman, from ANTCIA Consulting Pty Ltd, has assisted Hera Mine in the preparation of the stope designs, mine designs, sensitivity analysis and scheduling of the 2019 Hera Mine Ore Reserve Estimate. Mr Allman is a mining engineer with a BE Min Eng. obtained at the University of NSW and has worked in underground hard rock mines for nearly 30 years. Mr Allman is a Chartered Professional and member of the AusIMM. The Ore Reserve Estimate was produced by Mr Kamupita, who is site based, with assistance from Mr Allman.
Peak Mineral Resource Estimate
Compilation of the drilling database, assay validation and geological interpretations for the Mineral Resource update were completed by Chris Powell, BSc, MAusIMM, who is a full time employee of Aurelia Metals Limited. The Mineral Resource estimate has been prepared by Chris Powell and Arnold van der Heyden, who is the Director of H & S Consultants Pty Ltd. Both Mr Powell and Mr van der Heyden have sufficient experience which is relevant to the style of mineralisation and type of deposit under consideration and to the activity which they are undertaking to qualify as Competent Persons as defined in the 2012 Edition of the ‘Australasian Code for Reporting of Exploration Results, Mineral Resources and Ore Reserves’. Mr Powell and Mr Van der Heyden consent to the inclusion in this report of the matters based on their information in the form and context in which it appears.
Peak Ore Reserve Estimate
The Ore Reserves were compiled by Brett Fowler, who is a full time employee of Peak Gold Mines Pty Ltd. Mr Fowler has over +30 years’ experience in both underground hard rock and surface mines since 1983 and has worked at underground operations including Nifty Copper Mine, Otter Juan, Coronet, Miitel and Mariners Nickel mines and Higginsville Gold Mine and Kalgoorlie Consolidated Gold Mine in Western Australia. Mr Fowler is a dual qualified mining engineer and mining geologist with a Graduate Diploma (Mining) and a Bachelor of Applied Science (Mining Geology) obtained at Curtin University (WA School of Mines) and also holds a Graduate Diploma in Computing (Murdoch University) and Masters of Business Administration (Curtin University).
Mr Fowler has sufficient experience which is relevant to the style of mineralisation, type of deposit and mining method under consideration and to the activity which he is undertaking to qualify as a Competent Person as defined in the 2012 Edition of the ‘Australasian Code for Reporting of Exploration Results, Mineral Resources and Ore Reserves’. Mr Fowler is a member of the AusIMM and also holds a WA First Class Mine Managers Certificate of Competency and a NSW Practising Certificate Engineering Manager Underground Mines.
Anthony Allman, from ANTCIA Consulting Pty Ltd, has assisted Peak Gold Mines in the preparation of the stope designs, mine designs, sensitivity analysis and scheduling of the 2019 Peak Gold Mines Ore Reserve Estimate. Mr Allman is a mining engineer with a BE Min Eng. obtained at the University of NSW and has worked in underground hard rock mines for nearly 30 years. Mr Allman is a Chartered Professional and member of the AusIMM. The Ore Reserve Estimate was produced by Mr Fowler, who is site based, with assistance from Mr Allman.
Exploration Results
Exploration results are based on information compiled by Adam McKinnon, BSc (Hons), PhD, MAusIMM. Dr McKinnon is a full-time employee of Aurelia Metals and has sufficient experience which is relevant to the style of mineralisation and types of deposit under consideration and to the activity which he is undertaking to qualify as a Competent Person as defined in the 2012 Edition of the ‘Australasian Code for Reporting of Exploration Results, Mineral Resources and Ore Reserves.’ Dr McKinnon consents to the inclusion in this presentation of the matters based on his information in the form and context in which it appears.
For
per
sona
l use
onl
y