![28.06.2013. - Lipovica d.o.o., Popovača [PDF 3.23 MB]](https://static.fdocuments.net/doc/165x107/589c48681a28ab814a8b6810/28062013-lipovica-doo-popovaca-pdf-323-mb.jpg)
For personal use only - ASX · $3.23 NTA per unit up 3% 22.4 ¢ ... The Financial Year 2012 total...
108
Investa Office Fund 30 June 2013 Annual Financial Report For personal use only
Transcript of For personal use only - ASX · $3.23 NTA per unit up 3% 22.4 ¢ ... The Financial Year 2012 total...

Investa Office Fund
30 June 2013Annual Financial Report
For
per
sona
l use
onl
y
Investa OffIce fund annual fInancIal RepORt June 2013
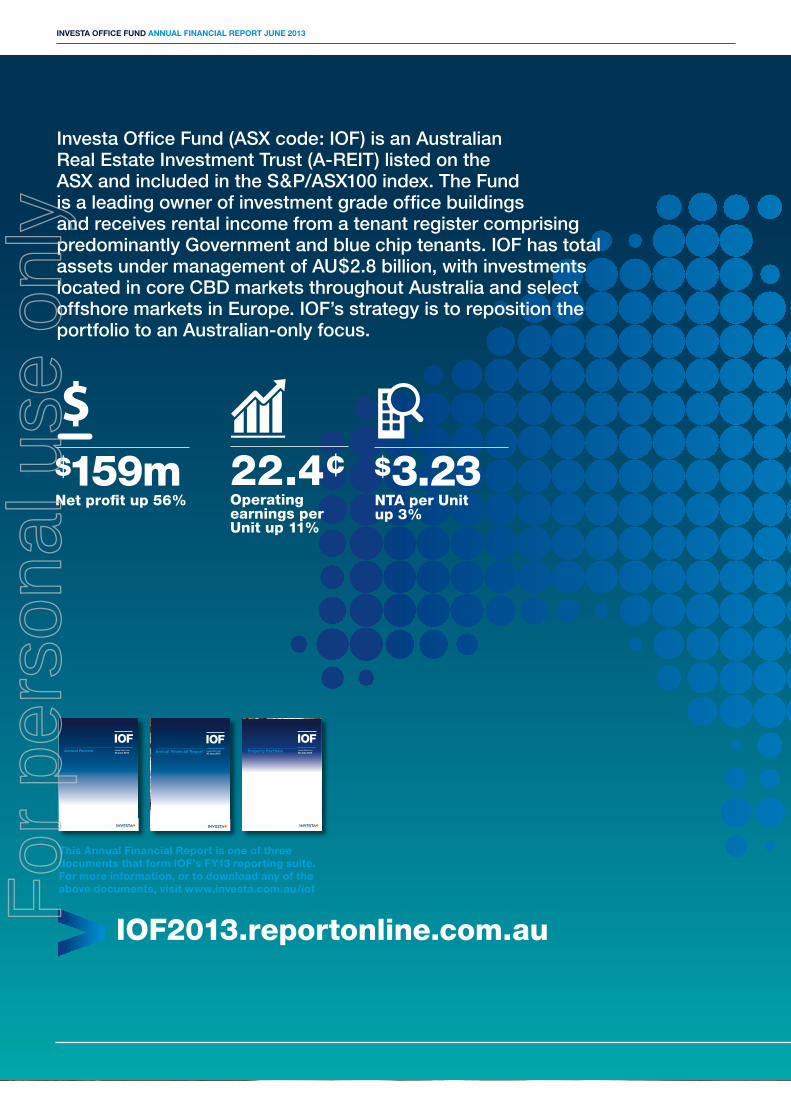
$159mNet profit up 56%
$3.23NTA per unit up 3%
22.4¢Operating earnings per unit up 11%
Investa Office Fund (ASX code: IOF) is an Australian Real Estate Investment Trust (A-REIT) listed on the ASX and included in the S&P/ASX100 index. The Fund is a leading owner of investment grade office buildings and receives rental income from a tenant register comprising predominantly Government and blue chip tenants. IOF has total assets under management of AU$2.8 billion, with investments located in core CBD markets throughout Australia and select offshore markets in Europe. IOF’s strategy is to reposition the portfolio to an Australian-only focus.
iOF2013.reportonline.com.au
this annual financial Report is one of three documents that form IOf’s fY13 reporting suite. for more information, or to download any of the above documents, visit www.investa.com.au/iof
Investa Office Fund
30 June 2013Annual Review
INV
ES
TA O
FF
ICE
FU
ND
AN
NU
AL FIN
AN
CIA
L RE
PO
RT 30 JU
NE
2013
Investa Office Fund
30 June 2013Annual Financial Report Investa Office Fund
30 June 2013Property Portfolio
For
per
sona
l use
onl
y

01A
nn
ua
l Rep
ort
Go
verna
nce
GR
I Ind
exF
ina
ncia
l S
tatemen
tsS
up
plem
enta
ry In
form
ation
Annual Report
Guide to key entities
IOF or the Fund:
Investa Office Fund, which comprises the AJO Fund and the PCP Trust
AJO Fund: Armstrong Jones Office Fund (ARSN 090 242 229)
PCP Trust: Prime Credit Property Trust (ARSN 089 849 196)
ILFML: Investa Listed Funds Management Limited, the responsible entity of IOF (ACN 149 175 655) (AFSL 401 414)
Investa: Investa Office, the manager of IOF
ContentsAnnual Report 02Letter from the Chairman 02Corporate Governance 04GRI Index 16Financial Report 27Directors’ Report 28Financial Statements 38Supplementary Information 99Investor Relations 99Substantial Holders 101Glossary 103Corporate Inside Directory back cover
For
per
sona
l use
onl
y
02 Investa OffIce fund annual fInancIal RepORt June 2013
Dear Unitholder
It has been a good year for IOF. In a period of continued economic and political uncertainty we’ve delivered a strong set of results that were ahead of market expectations. Our key performance metrics all improved, with Earnings per Unit up 11%, Distributions per Unit up 14%1, and Net Tangible Assets up 3%.
portfolio repositioning well progressed
Our strategy of repositioning the portfolio to Australia and optimising portfolio performance is now starting to bear fruit. Since Investa took over management of the Fund in mid-2011, $520 million of offshore assets have been sold, over $800
million of premium and A-grade Australian assets have been acquired, and over 120,000sqm of space has been leased – the equivalent of over 25% of the lettable area of the 2011 portfolio. As a result of Investa’s execution, the portfolio is well positioned to continue to deliver strong risk-adjusted returns.
Ongoing balance sheet de-risking
The balance sheet of the Fund has also undergone significant change since 2011, as a result of Investa’s ability to gain a BBB+ credit rating from Standard & Poors. The Fund’s reliance on 100% bank debt has been removed, and IOF is now funded by a diverse mix of debt sources including bank
Deborah Page, Chairman
Letter from the ChairmanWe are pleased to report a strong set of results for 2013, which demonstrate the continued, effective delivery of iOF’s stated strategy
1. The Financial Year 2012 total distribution was 17.5 cents per Unit including a normal distribution of 15.6 cents and a special distribution of 1.9 cents. The special distribution was paid following offshore asset sales.
For
per
sona
l use
onl
y

03A
nn
ua
l Rep
ort
Go
verna
nce
GR
I Ind
exF
ina
ncia
l S
tatemen
tsS
up
plem
enta
ry In
form
ation
> see the letter from the fund Manager on page 6 in the 2013 annual Review> see Our performance on page 12 of the 2013 annual Review
debt (62%), domestic capital markets (19%) and the US Private Placement market (19%). As we have diversified our sources of debt we have also increased the average tenure of our funding from 2.4 years to 3.2 years. Our debt maturities are now spread over the next 12 years, reducing the risk of having to refinance large amounts of debt at unfavourable points in the cycle. These actions have de-risked the balance sheet and demonstrate our proactive approach to capital management.
underpinned by the Investa Office platform
The performance of the Fund is underpinned by Investa’s ability to deliver consistent financial, operational and environmental performance across the portfolio, notwithstanding market conditions. Their integrated platform and capability as an office manager translate to better services to tenants in IOF buildings and superior returns to unitholders.
adopting peer comparable reporting guidelines
During 2013, the Property Council of Australia (“PCA”) has been working with key property industry stakeholders to improve the non-AAS measures of operating performance amongst Australian real estate organisations. The aim is to provide investors and analysts with clear, consistent and meaningful information. This has resulted in the PCA releasing a white paper titled “Voluntary best practice guidelines for disclosing FFO and AFFO”. The white paper sets out principles for determining Property Council Funds From Operations (“Property Council FFO”). For the Financial Years ending on and after 30 June 2014 the Responsible Entity’s primary non-AAS measure of the Group’s performance will be based on Property Council FFO rather than Operating Earnings.
Property Council FFO is defined as the Fund’s underlying and recurring earnings from its operations, determined by adjusting statutory net profit (under AIFRS) for non-cash and other items such as the amortisation of tenant incentives and rent free periods, fair value gains/losses on investment property, fair value gains/losses on the mark to market of derivatives, the straight lining of rent, non-FFO deferred tax benefits and expenses, foreign currency translation reserves recognised in net profit, and any other unrealised or one-off items.
We will continue our commitment to outperformance in Financial Year 2014. We have forecasted FFO of 26.5 cents per Unit, representing 6% growth on Financial Year 2013, and our distribution is forecast to increase 4% to 18.5 cents per Unit, a distribution that reflects our conservative and sustainable approach to managing the Fund.
On behalf of the Board and Investa I would like to thank you for your ongoing support of Investa Office Fund.
Yours sincerely,
deborah page aM Chairman, Investa Listed Funds Management Limited
FUN
DS
MA
NA
GM
EN
T
SUPPORT SERVICES
DEVELOPMENT
CAPITAL
TRANSACTIONS
REA
L ES
TATE
OPE
RAT
ION
S
INVESTA’S INTEGRATED
PL
AT
FO
RM
INVESTA’S INTEGRATE
D P
LA
TF
OR
M
For
per
sona
l use
onl
y

04 Investa OffIce fund annual fInancIal RepORt June 2013
Corporate Governance
1. Responsible Entity of investa Office Fund
The Fund is comprised of the Armstrong Jones Office Fund (AJO Fund) and the Prime Credit Property Trust (PCP Trust), two managed investment schemes registered with the Australian Securities and Investments Commission (ASIC).
The Fund is listed on the Australian Securities Exchange (ASX) and the securities in the AJO Fund and the PCP Trust are stapled together and trade as one stapled security.
Investa Listed Funds Management Limited (ILFML), an Investa Office entity, is the responsible entity of each of the AJO Fund and the PCP Trust. ILFML has acted in this role since 8 July 2011.
The corporate governance structure adopted by ILFML reflects its role as responsible entity of a listed real estate trust, which is different from the corporate governance structure adopted by listed companies.
1. deborah page aM2. dr peter dodd3. peter Rowe4. scott Macdonald5. Ming long6. campbell Hanan
Corporate GovernanceInvesta Office is committed to the highest standards of corporate governance and ethical conduct, recognising them as essential components of Investa’s responsibility to investors. through its commitment to transparency, Investa Office has developed a robust framework to ensure its governance objectives are met, risk is monitored and assessed, and performance is optimised.
this section outlines the main corporate governance practices of Investa Office fund (Fund) and addresses compliance with the asX corporate Governance council’s corporate Governance principles and Recommendations1 (ASX Recommendations). a table summarising the fund’s compliance with the asX Recommendations over the reporting period is provided at the end of this corporate Governance section.
1 2
3 4
5 6
1. The Corporate Governance Principles and Recommendations, 2nd edition, ASX Corporate Governance Council are available from the ASX website at http://www.asxgroup.com.au/corporate-governance-council.htm.
For
per
sona
l use
onl
y
05A
nn
ua
l Rep
ort
Go
verna
nce
GR
I Ind
exF
ina
ncia
l S
tatemen
tsS
up
plem
enta
ry In
form
ation
1.1 the Board of IlfMl
As at the date of this Report, ILFML has five Directors, three of whom are Independent Directors and one Alternate Director. An overview of the experience, qualifications and memberships of each Director is set out below:
Deborah Page AM Independent Director and Chairman since 14 June 2011 Term in office – 2 years 3 months
Deborah Page AM brings financial expertise developed from a diverse range of finance and operational executive roles and from her professional background in external audit and corporate advisory. Mrs Page was a partner in Touche Ross/KPMG Peat Marwick until 1992, and subsequently held senior executive positions with the Lend Lease Group, Allen Allen and Hemsley and the Commonwealth Bank. Mrs Page was an Independent Director of Investa Funds Management Limited between July 2006 and July 2011. Mrs Page is a non-executive Director of The Colonial Mutual Life Assurance Society Limited, Commonwealth Insurance Limited, Service Stream Limited and Australian Renewable Fuels Limited.
Mrs Page is a Fellow of the Institute of Chartered Accountants, a Member of the Australian Institute of Company Directors and holds a Bachelor of Economics from the University of Sydney.
Dr. Peter Dodd Independent Director since 14 June 2011 Term in office – 2 years 3 months
Dr Peter Dodd is an experienced non-executive Director with extensive investment banking and financial industry experience. Dr Dodd has over 25 years of senior management experience in both the private sector and higher education institutions.
Dr Dodd’s current appointments are as Director of Ausgrid, Endeavour Energy and Essential Energy which are the three NSW Government owned electricity distribution companies, Chairman of Macquarie University Hospital, and Director of Energy Industries Superannuation Scheme.
Dr Dodd holds a PhD from the University of Rochester and degrees from the Universities of Newcastle and Queensland.
Peter Rowe Independent Director since 14 June 2011 Term in office – 2 years 3 months
Peter Rowe has 35 years’ experience in the funds management industry, including 22 years as a partner of Herbert Smith Freehills. At Herbert Smith Freehills he practiced extensively in the areas of funds management and securitisation and his roles included Head of the Financial Services Group and Deputy Chairman of the Freehills Foundation. He was acknowledged as one of the leading funds management lawyers in Australia and was nominated for the 2011 Justice Medal awarded by the NSW Law and Justice Foundation and in 2012 his work for the Duke of Edinburgh’s Award in Australia was recognized on its 50th anniversary.
Mr Rowe is a member of the Audit and Risk Management Committees for Lend Lease Real Estate Investments Limited and Lend Lease Funds Management Limited and Chair of Managed Investment Schemes Compliance Committees for AMP Capital. He is a director, chair of the Audit and Risk Management Committee and a member of the Remuneration Committee of Religare Health Trust Trustee Manager Pte Ltd. He is also a Director of Mission Australia Housing Limited and
Mission Australia Housing Victoria Limited and was a Director of the Centre for Volunteering. Mr Rowe holds a Dip. Law (SAB).
Scott MacDonald Director since 7 February 2011 (Executive from February 2011 – June 2013; Non-executive from July 2013) Term in office – 2 years 7 months
Scott MacDonald is the Chairman of Investa Property Group and has worked in the real estate industry for more than 30 years, serving as CEO or President of five operating companies. He has developed specialised expertise in corporate management and leadership, as well as formulating and executing corporate repositioning. Mr MacDonald also has vast experience in real estate development and has a long standing relationship with Morgan Stanley Real Estate.
Mr MacDonald holds a Bachelor of Arts (Political Science) from Indiana University and a Masters degree in City and Regional Planning from the University of North Carolina.
Ming Long Executive Director since 7 February 2011 Term in office – 2 years 7 months
Ming Long is the Joint Managing Director & Finance Director of Investa Property Group (Group). She is responsible for the strategic direction of the Group across the Office, Funds and Land businesses. Mrs Long is also responsible for the Group’s financial strategy and provides leadership to treasury, debt and risk management, taxation, and internal and external reporting. Mrs Long is a standing member of the Group’s Due Diligence Committee.
With over 15 years’ experience in the finance industry, Mrs Long joined the Group in 2005 as Group Financial Controller and was appointed Group Chief Financial Officer in 2009. Prior to this, Mrs Long was at APN News & Media Limited as Group Financial Controller.
Mrs Long holds a Bachelor of Economics and a Bachelor of Laws from the University of Sydney and a Masters of Business Administration from the University of Technology, Sydney. She is also an Associate of the Institute of Chartered Accountants and sits on the Property Council’s International Capital Markets Division Council and the CFO Roundtable.
Campbell Hanan Alternate Director (Executive) for Scott MacDonald since 1 July 2013 Term in office – 3 months
Campbell Hanan is the Chief Executive Officer of Investa Office, responsible for the overall strategic direction and leadership of the office platform. He has over 20 years of experience in the property and funds management industry. Mr Hanan has responsibility for Investa Office’s commercial office portfolio, the asset and property management functions and all of Investa Office’s managed funds.
Prior to joining the Group in 2003, Mr Hanan worked at UBS Securities.
Mr Hanan holds a Bachelor of Economics and an Executive Masters of Business Administration from the University of Sydney. He also sits on the Board of Directors of the Property Industry Foundation and is a Fellow of the Australian Property Institute.
For
per
sona
l use
onl
y

06 Investa OffIce fund annual fInancIal RepORt June 2013
1.2 Role of the Board and Management
Role of the Board
The primary role of ILFML is to operate the Fund in accordance with the constitution of each of the AJO Fund and the PCP Trust, the ASX Listing Rules and the Corporations Act 2001 (Cth) (Corporations Act). ILFML must ensure it acts in the best interests of unitholders and that the activities of the Fund are conducted in a proper and efficient manner.
The constitution of each of the AJO Fund and the PCP Trust gives ILFML all the powers in respect of the Fund that it is possible under the law to confer on a trustee as though it were the absolute owner of the assets of the Fund and acting in its personal capacity. The Corporations Act empowers ILFML to appoint a person, including one of its associates, as its delegate, attorney or agent to exercise its powers and perform its obligations. However, ILFML remains responsible for the actions of its delegates, attorneys and agents.
Key responsibilities of the Board include:
> reviewing the performance of management, including the Fund Manager and the adequacy of resources allocated to ILFML;
> providing input into and final approval of management’s strategy and performance objectives for the Fund;
> reviewing and if appropriate approving significant transactions;
> overseeing the administration of ILFML, including risk and compliance monitoring functions;
> reviewing the appropriateness of management’s risk management processes;
> reviewing the Fund’s policies and procedures; and
> establishing formal committees to assist in discharging its responsibilities, for example the Audit and Compliance Committee.
The Board has adopted a charter which sets out additional information about the role and responsibilities of the Board.
Role of Management
Management is responsible for all matters not specifically the responsibility of the Board and for implementing the strategy and performance objectives of the Fund and its day to day operations.
The Board has also granted specific delegated authorities to management, including in respect of project expenditure, operational expenditure, leasing, accounting and treasury.
Investa Office is responsible for providing the resources to enable ILFML to appropriately and adequately conduct its funds management operations and to administer its affairs. The Board oversees the activities of management and provides strategic guidance.
1.3 executive performance, evaluation and remuneration
Investa Office, and not the Fund itself, is responsible for the remuneration and performance of the Directors of ILFML and Investa Office employees involved in the management of the Fund. However, the Board is responsible for reviewing the adequacy of the resources and for making any recommendations to Investa Office as necessary.
Investa Office has an established process for setting and measuring the performance of all employees. This process includes the setting of annual key performance indicators for each employee which are formally reviewed on a half and full year basis. All senior executives have defined objectives and have a discretionary element to their total remuneration, which is based on achieving defined objectives. Furthermore, the management team of the Fund has performance based remuneration aligned to the performance and key objectives of the Fund. Regular reviews are undertaken to ensure that the agreed objectives are met during the year.
The Independent Directors review the key performance indicators associated with the variable component of the Fund Manager’s remuneration to ensure alignment with unitholder interests.
During the financial year, the performance of all Investa Office employees involved in the management of the Fund was reviewed in accordance with the process set out above.
Remuneration Committee
No remuneration committee has been established as ILFML does not have any employees. The fees of the Independent Directors of ILFML are determined and paid for by ILFML and not by the Fund itself. The Executive Directors of ILFML are not remunerated for their Director appointments with ILFML. The remuneration of employees involved in the management of the Fund is determined and paid for by ILFML’s parent, Investa Office Management Pty Ltd (IOM).
During the 2013 financial year, the remuneration paid to the Directors of ILFML was as follows:
Director Director category Remuneration
Deborah Page AM Independent Director and Chairman $201,271
Dr. Peter Dodd Independent Director $150,000
Peter J.S. Rowe Independent Director $150,000
Scott MacDonald Non-Executive Director Nil
Ming Long Executive Director Nil
Campbell Hanan Alternate Director (Executive)
Nil
The remuneration of ILFML in its capacity as responsible entity is regulated by the constitution of each of the AJO Fund and the PCP Trust. ILFML has only a right to be paid a fee or reimbursed an expense from the Fund in relation to the proper performance of its duties.
Corporate Governance (continued)F
or p
erso
nal u
se o
nly

07A
nn
ua
l Rep
ort
Go
verna
nce
GR
I Ind
exF
ina
ncia
l S
tatemen
tsS
up
plem
enta
ry In
form
ation
2. Board Structure
2.1 directors’ appointment and selection
The appointment of Directors is governed by the constitution of ILFML and the Corporations Act. The Board’s policy and procedure for the selection of Directors is included in the Board charter.
As ILFML is wholly owned by IOM, IOM may also appoint or remove a director of ILFML by written notice on ILFML.
At the time ILFML took over the management of IOF, the Group made a commitment to unitholders that:
> the Board will consist of a majority of Independent Directors and the chairman will be an Independent Director;
> each Independent Director will have a term that expires at the conclusion of the general meeting of the unitholders held in the third year after the year in which they were appointed or their re-appointment is approved, unless further 3 year terms are approved by an ordinary resolution of the unitholders; and
> the appointment of an Independent Director by the Board or ILFML’s parent (excluding the appointment of the current Independent Directors in June 2011) will be subject to ratification by the unitholders at the next general meeting, which must be held no more than 12 months after that appointment.
To avoid all Independent Directors retiring at the same time, the Group has committed to ensure that one of the three Independent Directors appointed in June 2011 retires at the conclusion of each annual meeting to be held in 2012, 2013 and 2014.
Dr Peter Dodd’s continuing appointment as an Independent Director was approved by unitholders at the 2012 annual meeting. It was determined that Mr Peter Rowe would be the second Director to stand for re-appointment and his continuing appointment will be submitted to unitholder approval at the general meeting of the Fund’s unitholders to be held on 24 October 2013.
Directors are appointed with the aim of ensuring the Board has:
> an appropriate blend of skills, experience and expertise;
> a proper understanding of, and competence to understand, deal and provide responses and reactions to the day-to-day operation of the Fund; and
> a majority of Independent Directors.
2.2 nomination committee
The existing size of the Board and the frequency of Board meetings are such that IOM is able to determine the selection and appointment process of the members on the Board in an efficient manner, without the need for a separate nomination committee. Furthermore, unitholders have the opportunity to ratify the appointment of Independent Directors.
2.3 Board meetings
The Board meets as and when required. Attendance at Board meetings over the financial year is shown in the table below:
Director
No. of meetings
held
No. of meetings attended by the
Director
Deborah Page AM 17 17
Dr. Peter Dodd 17 16
Peter J.S. Rowe 17 17
Scott MacDonald 17 16
Ming Long 17 16
2.4 director Independence
Independent Directors must satisfy the definition of “external Director” as defined in section 601JA of the Corporations Act in order to be considered “independent”. As at the date of this Report, three of the five Directors are Independent Directors. The Alternate Director is an Executive Director. All Independent Directors satisfy the requirements of independence, and IOM has made this determination with reference to the Corporations Act as well as the ASX Recommendations.
To ensure that the Board remains independent, the Board has also adopted the following procedures for ensuring independence:
Disclosure of Directors who are independent
In the event an existing Director is assessed to no longer be independent, ILFML, on behalf of the Fund, will disclose this fact to the ASX as soon as practicable after the assessment has been made.
Independent decision making
Directors have, in appropriate circumstances, and subject to prior discussion with ILFML’s Chairman the right to seek independent professional advice on matters relating to the Fund, including matters relating to the discharge of ILFML’s obligations under the constitution of the AJO Fund and/or the PCP Trust and the law, the cost of which may be borne by ILFML or, where permitted, the Fund.
Conflicts of Interest and Directors’ Standing Notice Register
Directors owe a duty to avoid any conflicts of interest that may arise. A conflict may arise through a personal interest or a duty to a third party.
Therefore, if a possible conflict of interest arises in respect of a Director i.e. a material personal interest in a matter, that Director is required to make full disclosure to the Board as soon as possible or contact the Company Secretary. A register of Directors’ standing notices of interest is held by the Company Secretary.
In the event a conflict or potential conflict situation exists, the conflicted Director is absent from the meeting while the Board discusses the matter and may not vote on the matter, unless the other Directors, who do not have a material personal interest in the matter are satisfied that the interest should not disqualify the Director from voting or being present.
For
per
sona
l use
onl
y

08 Investa OffIce fund annual fInancIal RepORt June 2013
2.5 Role of the chair
The Chairman is a non-executive Director, who is elected by the Board from time to time.
The Chairman is responsible for the conduct of all Board meetings. This includes being satisfied that the agendas are comprehensive, that all agenda items are appropriate and that recommendations fit within the broad strategic direction approved by the Board.
2.6 Board education and performance evaluation
The Board undertakes a review of the Board’s performance annually. This includes a review of the objectives of the Board and its Committees and progress towards achieving these objectives, a review of the Board and its Committee’s processes, achievements and composition and any areas for improvement.
A performance evaluation for the Board, its committees and Directors has taken place in respect of the reporting period in accordance with this process. The performance evaluation was facilitated by the Secretariat and conducted by questionnaire. The outcomes of the evaluation were then reviewed and discussed by the Board.
Directors have the opportunity to visit the Fund’s properties and to meet with management to gain a better understanding of the Fund’s operations, and receive regular updates on relevant matters such as property industry issues, economic outlook and developments in accounting standards.
3. Promoting Responsible and Ethical Behaviour
3.1 code of conduct
Investa Office has established a Code of Conduct which outlines acceptable standards of behaviour and attitudes expected from staff to promote and maintain the confidence and trust of all those dealing with Investa Office. ILFML has also implemented a number of policies which supplement the Code of Conduct, which include:
> Continuous Disclosure Policy
> Security Trading Policy
> Fund and Business Expense Policy
In accordance with Investa Office’s Whistleblower Policy, staff are expected to report any serious issues and these will be investigated fairly. Individuals who report serious issues in good faith are appropriately protected.
3.2 security trading policy
Investa Office and ILFML have established a Security Trading Policy which applies to all Investa Office employees, Directors (including the Directors of ILFML) and certain contractors. The aim of the policy is to ensure that public confidence is maintained in Investa employees and the trading of Investa Office securities, including Units in the Fund.
The Security Trading Policy prohibits trading in the Fund’s Units by persons in possession of non-public inside information and regulates trading during trading windows and blackouts.
Under the policy, Investa Office Directors and prescribed employees must provide details of any trade of a listed Investa security, including Units in the Fund, to the Company Secretary.
3.3 diversity and Inclusion policy and equal employment Opportunity policy
Investa is fully committed to creating a workplace in which diversity in all its forms is recognised, embraced and respected.
Investa and ILFML have in place a Diversity and Inclusion Policy which includes the following key measurable objectives:
> Improve the representation of women across all levels of Investa;
> Engage a culturally diverse workforce improving representation across age, cultural, religious, ethnic, socio-economic, educational backgrounds;
> Support and encourage on-going career development opportunities for all employees; and
> Ensure fairness and parity across Investa.
Investa Office has established a Diversity and Inclusion Committee which is chaired by Campbell Hanan (CEO Investa Office) and has representation from across the diverse groups that make up Investa Office. The aim of this Committee is to determine and implement Investa Office’s diversity strategy and objectives.
ILFML’s commitment to gender diversity is demonstrated as follows:
> There are two women on the Board of ILFML (40% of the Board);
> The Independent Chairman of ILFML is a woman;
> The joint Company Secretary of ILFML is a woman; and
> While ILFML does not have any employees, the above measurable objectives have also been adopted by Investa Office and ILFML monitors Investa Office’s progress towards achieving these objectives.
Investa also has in place an Equal Employment Opportunity Policy to ensure that it develops a working environment and culture that is fair and enables all employees to make a valuable contribution to their role and the business operation. The policy also ensures that any form of discrimination or harassment is eliminated from the workplace.
4. Financial Reporting
4.1 Review and authorisation
In accordance with section 295A of the Corporations Act, the Chief Executive Officer and Chief Financial Officer have declared in writing to the Board that the financial records of the Fund for the financial year have been properly maintained in accordance with section 286 of the Corporations Act and the Fund’s financial statements present a true and fair view of the Fund’s financial position and performance and are in accordance with relevant accounting standards.
Corporate Governance (continued)F
or p
erso
nal u
se o
nly
09A
nn
ua
l Rep
ort
Go
verna
nce
GR
I Ind
exF
ina
ncia
l S
tatemen
tsS
up
plem
enta
ry In
form
ation
4.2 Board audit and compliance committee and charter
The Board has established an Audit and Compliance Committee (Committee) which operates under a Board approved charter.
The purpose of the Committee is to assist the Board in fulfilling its oversight responsibilities. The Committee reviews, amongst other things, the financial reporting process, the system of internal control, the external and internal audit processes, compliance with the compliance plan for each of the AJO Fund and the PCP Trust and ILFML’s process for monitoring compliance with laws and regulations and Investa Office’s Code of Conduct.
The Committee consists of at least three members, all of whom must be non-executive Directors of ILFML and a majority of whom must be Independent Directors of ILFML. The Chairman of the Board is not permitted to chair the Committee. As at the date of this Report, the members of the Committee are the three Independent Directors of ILFML and the Committee Chair is Dr Peter Dodd.
The Committee is required to meet a minimum of four times per year, or more frequently if required. Attendance at the meetings of the Committee over the financial year is shown in the table below:
Committee member
No. of meetings
held
No. of meetings attended by the
member
Dr. Peter Dodd 4 4
Deborah Page AM 4 4
Peter J.S. Rowe 4 4
The Committee is a committee of the Board and as such, the evaluation of its performance is undertaken as part of the evaluation of the performance of the Board.
4.3 appointment of external auditor
PricewaterhouseCoopers is the current auditor for ILFML, the AJO Fund, the PCP Trust and the compliance plans for the AJO Fund and the PCP Trust.
The appointment and removal of the external auditor is regulated by the Corporations Act. Information on procedures for the selection, appointment and monitoring of the performance of the external auditor and for the rotation of external audit engagement partners is set out in the charter of the Committee.
5. Continuous Disclosure
5.1 continuous disclosure
As the responsible entity of a listed fund, ILFML must comply with the continuous disclosure provisions of the ASX Listing Rules.
ILFML is required to immediately notify the ASX of any information concerning the Fund of which it is or becomes aware, which a reasonable person would expect to have a material effect on the price or value of Units in the Fund, subject to certain limited exceptions.
ILFML has established a policy which deals with:
> information that needs to be disclosed to the market;
> responsibility for responding to market rumours or speculation;
> communications with analysts and major investors;
> procedures for dealing with the media; and
> senior management review and sign off of release of information to the market.
The Company Secretary has been appointed as the person responsible for communicating with the ASX. This person is also responsible for ensuring compliance with the continuous disclosure requirements in the ASX Listing Rules.
6. investor Communications
6.1 unitholder meetings
ILFML may convene a unitholder meeting during the financial year at a time and place that is considered convenient for the majority of the Fund’s unitholders.
The Fund will place a copy of the most recent notice of meeting and any accompanying explanatory memorandum on its website when released to the ASX.
At any unitholder meeting, the Chairman will ensure that a reasonable opportunity exists for unitholders to ask questions relating to the operations of the Fund and if applicable, the resolutions being voted on.
Unitholders are encouraged to attend all unitholder meetings.
During the year, ILFML held a unitholder meeting on 25 October 2012 to provide an update on the Fund’s activities and to consider the continuing appointment of Dr Dodd as an Independent Director of ILFML.
Auditor attendance at unitholder meetings
If ILFML convenes a unitholder meeting, the Company Secretary will request the external auditor or a qualified representative of the auditor to attend the unitholder meeting.
6.2 communication with unitholders
The Fund has procedures in place to ensure that all unitholders and other interested stakeholders have access to balanced, understandable and timely information concerning the operations of the Fund. The Fund’s policy on unitholder communications is contained in the compliance plan for each of the AJO Fund and the PCP Trust and the Fund’s Continuous Disclosure Policy.
The Company Secretary, in conjunction with the Fund Manager and the Investor Relations Representative are primarily responsible for ensuring communications with unitholders are delivered in accordance with these procedures.
The Fund principally communicates with unitholders through its website, which contains the following information:
> Current and archived annual and half year reports;
> ASX announcements, including all investor presentations by the Fund’s management team;
> Significant developments relating to the Fund;
For
per
sona
l use
onl
y
10 Investa OffIce fund annual fInancIal RepORt June 2013
> The Fund’s corporate governance documents, including its key policies, charters and constitutions (please see section 9.1 below for a list of documents available);
> Current and archived webcasts of annual and half-year results presentations; and
> Key dates and events.
The Investa Office website also provides information in respect of the Investa Property Group, other funds managed by Investa Office and profiles of Investa Property Group senior management and Directors.
The Investor Relations section on pages 99-100 summarises unitholder communications over the reporting period and includes contact details for the Fund’s Investor Relations Representative.
7. Risk Management and Compliance Procedures
7.1 Risk management framework
The Board and management recognise that having a well-developed system in place for risk management is an integral part of good management practice. Investa Office actively promotes a culture of compliance and risk management awareness with the aim of ensuring all activities comply with laws, regulations, codes and in-house policies and procedures.
Investa Office regularly analyses its business operations to ensure that:
> key risks can be identified that could lead to an operational loss;
> assessments are made of the potential risks and potential exposures; and
> adequate mitigation measures are implemented to address potential risks in the business.
Investa Office has designed and implemented a risk management and internal control framework (RMF) to manage its business risks and the business risks of the managed investment schemes that it operates. The Board has adopted the RMF to manage the Fund’s business risks. The Group’s Risk & Sustainability Committee (RSC) assists the Board in the management of the RMF. Management report to the Board and the RSC on a regular basis on whether the RMF is operating effectively in respect of the Fund. The Chairman of the Board is a member of the RSC.
The RSC operates under a Board adopted charter which sets out the RSC’s role, responsibilities (including reporting obligations), objectives and authority. Broadly, the RSC reviews and guides the implementation, operation and effectiveness of Investa Office’s Sustainability, Safety, Health & Environment Policies, the Investa Property Group financial reporting process and its system of internal control and compliance with laws, regulations and internal policies.
Management and the Fund Manager also formally review the Fund’s risk profile on a semi-annual basis and report to the Committee and the Board on the Fund’s key business, operational and compliance risks and the effectiveness of the controls and mitigation actions to manage these risks.
The Fund Manager includes an assessment of risks facing the Fund as part of his regular Board reporting, and specifically in respect to capital transactions.
7.2 compliance plan
The RMF is further supported by the compliance plan for each of the AJO Fund and PCP Trust. The purpose of each compliance plan is to set out key processes, systems and measures ILFML will apply to ensure compliance with:
> the Corporations Act;
> the Constitution of each of the AJO Fund and the PCP Trust;
> industry practice standards relevant to the Fund; and
> Investa Office and ILFML internal policies and procedures.
Each compliance plan describes the key obligations that ILFML must meet under the Corporations Act and the constitution of each of the AJO Fund and the PCP Trust, the measures in place to comply with these obligations and how compliance with these measures is monitored. In addition, each compliance plan details the risk of not complying with these obligations, and how breaches are to be reported and addressed.
The compliance plan for each of the AJO Fund and the PCP Trust is audited each year. The audit report, which is lodged with ASIC, includes an assessment on:
> whether the procedures and controls set out in the compliance plans sufficiently address the requirements of the Corporations Act; and
> if the controls and procedures described in the compliance plans have been in place and operating effectively over the year.
7.3 Risk management review and reporting to the Board and its committees
In respect of the reporting period, the Board has received the following certifications which have been reviewed by the Committee:
> certification from the Chief Executive Officer and Chief Financial Officer that the declaration provided in accordance with section 295A of the Corporations Act is founded on a sound system of risk management and internal control and that the system is operating effectively in all material respects in relation to financial reporting risks; and
> certification from management confirming that the internal controls and processes in place effectively manage the Fund’s material business risks.
8. Sustainability
8.1 sustainability policy
Investa is committed to sustainability principals encompassing environmental, social and economic, dimensions. The group has established an enviable reputation as a leader in the development and implementation of real estate sustainability initiatives and continues to apply best practices in its management of commercial property. Investa’s approach supports the goal of enhancing investment returns without
Corporate Governance (continued)F
or p
erso
nal u
se o
nly

11A
nn
ua
l Rep
ort
Go
verna
nce
GR
I Ind
exF
ina
ncia
l S
tatemen
tsS
up
plem
enta
ry In
form
ation
sacrificing the environment or compromising standards of conduct, with a specific focus on:
> Improving the identification and management of risk and controlling unnecessary costs, including potential risks and opportunities associated with future changes in the climate;
> Adhering to Investa’s Sustainable Responsible Investment Guidelines incorporating environmental, social and corporate governance issues into investment decision-making and ownership practices;
> Identifying changes in the business environment and adjusting to position investments to weather economic declines and prosper in periods of growth;
> Fostering a culture of innovation;
> Building employee motivation and capacity with skills and tools, and evaluating and rewarding employees using a merit based system;
> Engaging with the communities where Investa works to understand the key issues and prioritise attention on the needs, impacts and opportunities that matter to stakeholders and customers;
> Working with partners and suppliers, investors and customers to improve the sustainability performance of building operations, the property industry and society;
> Exercising company and industry leadership;
> Reporting transparently and regularly on Investa’s sustainability performance.
8.2 Investa Office fund – sustainability strategy fY14
Vision
Investa Office Fund (IOF) aims to be ‘Australia’s best performing office fund’.
> Investa Office (Investa) and its funds will differentiate the sustainability approach through four key priorities in the Environment, Social and Governance (ESG), or Sustainability, approach of the Investa Office platform. An annual IOF Sustainability Action Plan drives delivery of these priorities.
ESG and Sustainability Approach
Investa sets out to improve the operational performance, and therefore investment returns, of the properties it acquires and manages. The sustainability platform provides a framework for focusing upon and enhancing good business practices which in turn contribute to asset income and values and improved social and environmental outcomes. Sustainability is embedded in the fund through:
> Harnessing human capital and meeting tenant needs. Tenants are becoming more focused on tenancy sustainability as a route to more productive, engaged employees. Investa offers sustainability initiatives and tenant and occupant engagement activities to create healthier workplaces, smarter businesses and a better environment.
> Leadership in governance. Through external benchmarks, accreditations and memberships, Investa offers excellence in ESG governance and investor alignment. Investa’s Sustainable Responsible Investment (SRI) Guidelines ensure proactive management of risks for investors. An ongoing
commitment to transparency of results through Investa’s timely online reporting holds the fund accountable and drives continuous improvement.
> Optimising value by improving environmental performance. Careful assessment and implementation of value-add opportunities reduces greenhouse gas emissions, energy and water use whilst increasing occupant comfort and so boosts the financial performance of Investa assets. Investment in sophisticated management capabilities to deliver high performing buildings includes providing functional and behavioural tools which assist managers to identify and replicate good performance and quickly act to manage poor performance.
> Adding value through research and innovation. The Investa Sustainability Institute conducts active research into emerging trends and opportunities in the built environment.
During FY14, the sustainability and ESG approach will deliver the key aims of IOF, by supporting the business to deliver results and drive value through improving leasing income and building values, efficient investment propositions and brand positioning and reputation.
9. Additional Corporate Governance information
9.1 corporate Governance documents
The following documents are available in the Governance section of the Fund’s website:
> Board Charter
> Board Audit and Compliance Committee Charter
> Risk & Sustainability Committee – Safety, Health, Environment & Audit Charter
> Continuous Disclosure Policy
> Security Trading Policy
> Code of Conduct
> Risk Management Policy
> Complaints Policy
> Diversity and Inclusion Policy
> IOF Deed Poll
> Constitution for each of the AJO Fund and the PCP Trust
For
per
sona
l use
onl
y
12 Investa OffIce fund annual fInancIal RepORt June 2013
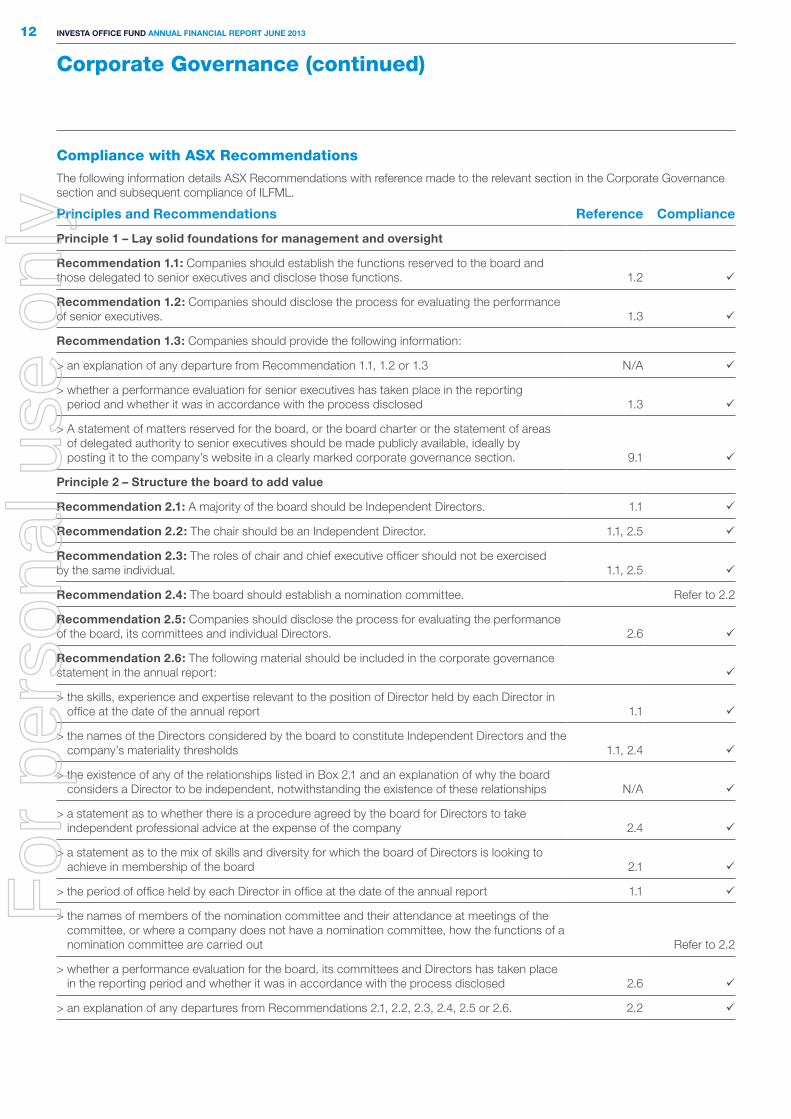
Compliance with ASX Recommendations
The following information details ASX Recommendations with reference made to the relevant section in the Corporate Governance section and subsequent compliance of ILFML.
principles and Recommendations Reference compliance
principle 1 – lay solid foundations for management and oversight
Recommendation 1.1: Companies should establish the functions reserved to the board and those delegated to senior executives and disclose those functions. 1.2
Recommendation 1.2: Companies should disclose the process for evaluating the performance of senior executives. 1.3
Recommendation 1.3: Companies should provide the following information:
> an explanation of any departure from Recommendation 1.1, 1.2 or 1.3 N/A
> whether a performance evaluation for senior executives has taken place in the reporting period and whether it was in accordance with the process disclosed 1.3
> A statement of matters reserved for the board, or the board charter or the statement of areas of delegated authority to senior executives should be made publicly available, ideally by posting it to the company’s website in a clearly marked corporate governance section. 9.1
principle 2 – structure the board to add value
Recommendation 2.1: A majority of the board should be Independent Directors. 1.1
Recommendation 2.2: The chair should be an Independent Director. 1.1, 2.5
Recommendation 2.3: The roles of chair and chief executive officer should not be exercised by the same individual. 1.1, 2.5
Recommendation 2.4: The board should establish a nomination committee. Refer to 2.2
Recommendation 2.5: Companies should disclose the process for evaluating the performance of the board, its committees and individual Directors. 2.6
Recommendation 2.6: The following material should be included in the corporate governance statement in the annual report:
> the skills, experience and expertise relevant to the position of Director held by each Director in office at the date of the annual report 1.1
> the names of the Directors considered by the board to constitute Independent Directors and the company’s materiality thresholds 1.1, 2.4
> the existence of any of the relationships listed in Box 2.1 and an explanation of why the board considers a Director to be independent, notwithstanding the existence of these relationships N/A
> a statement as to whether there is a procedure agreed by the board for Directors to take independent professional advice at the expense of the company 2.4
> a statement as to the mix of skills and diversity for which the board of Directors is looking to achieve in membership of the board 2.1
> the period of office held by each Director in office at the date of the annual report 1.1
> the names of members of the nomination committee and their attendance at meetings of the committee, or where a company does not have a nomination committee, how the functions of a nomination committee are carried out Refer to 2.2
> whether a performance evaluation for the board, its committees and Directors has taken place in the reporting period and whether it was in accordance with the process disclosed 2.6
> an explanation of any departures from Recommendations 2.1, 2.2, 2.3, 2.4, 2.5 or 2.6. 2.2
Corporate Governance (continued)F
or p
erso
nal u
se o
nly
13A
nn
ua
l Rep
ort
Go
verna
nce
GR
I Ind
exF
ina
ncia
l S
tatemen
tsS
up
plem
enta
ry In
form
ation
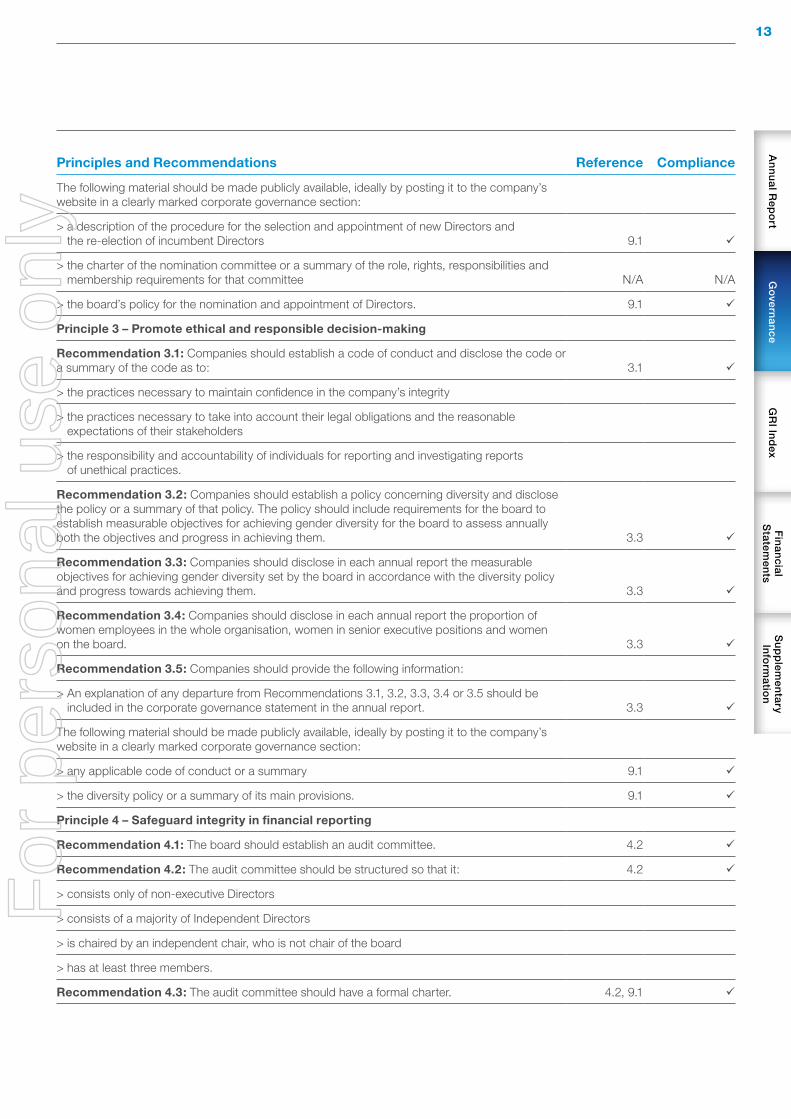
principles and Recommendations Reference compliance
The following material should be made publicly available, ideally by posting it to the company’s website in a clearly marked corporate governance section:
> a description of the procedure for the selection and appointment of new Directors and the re-election of incumbent Directors 9.1
> the charter of the nomination committee or a summary of the role, rights, responsibilities and membership requirements for that committee N/A N/A
> the board’s policy for the nomination and appointment of Directors. 9.1
principle 3 – promote ethical and responsible decision-making
Recommendation 3.1: Companies should establish a code of conduct and disclose the code or a summary of the code as to: 3.1
> the practices necessary to maintain confidence in the company’s integrity
> the practices necessary to take into account their legal obligations and the reasonable expectations of their stakeholders
> the responsibility and accountability of individuals for reporting and investigating reports of unethical practices.
Recommendation 3.2: Companies should establish a policy concerning diversity and disclose the policy or a summary of that policy. The policy should include requirements for the board to establish measurable objectives for achieving gender diversity for the board to assess annually both the objectives and progress in achieving them. 3.3
Recommendation 3.3: Companies should disclose in each annual report the measurable objectives for achieving gender diversity set by the board in accordance with the diversity policy and progress towards achieving them. 3.3
Recommendation 3.4: Companies should disclose in each annual report the proportion of women employees in the whole organisation, women in senior executive positions and women on the board. 3.3
Recommendation 3.5: Companies should provide the following information:
> An explanation of any departure from Recommendations 3.1, 3.2, 3.3, 3.4 or 3.5 should be included in the corporate governance statement in the annual report. 3.3
The following material should be made publicly available, ideally by posting it to the company’s website in a clearly marked corporate governance section:
> any applicable code of conduct or a summary 9.1
> the diversity policy or a summary of its main provisions. 9.1
principle 4 – safeguard integrity in financial reporting
Recommendation 4.1: The board should establish an audit committee. 4.2
Recommendation 4.2: The audit committee should be structured so that it: 4.2
> consists only of non-executive Directors
> consists of a majority of Independent Directors
> is chaired by an independent chair, who is not chair of the board
> has at least three members.
Recommendation 4.3: The audit committee should have a formal charter. 4.2, 9.1
For
per
sona
l use
onl
y

14 Investa OffIce fund annual fInancIal RepORt June 2013
principles and Recommendations Reference compliance
Recommendation 4.3: The audit committee should have a formal charter. 4.2, 9.1
Recommendation 4.4: Companies should provide the following information:
The following material should be included in the corporate governance statement in the annual report:
> the names and qualifications of those appointed to the audit committee and their attendance at meetings of the committee, or, where a company does not have an audit committee, how the functions of an audit committee are carried out 1.1, 4.2
> the number of meetings of the audit committee 4.2
> explanation of any departures from Recommendations 4.1, 4.2, 4.3 or 4.4. N/A
The following material should be made publicly available, ideally by posting it to the company’s website in a clearly marked corporate governance section:
> the audit committee charter 9.1
> information on procedures for the selection and appointment of the external auditor, and for the rotation of external audit engagement partners. 4.3, 9.1
principle 5 – Make timely and balanced disclosure
Recommendation 5.1: Companies should establish written policies designed to ensure compliance with ASX Listing Rule disclosure requirements and to ensure accountability at a senior executive level for that compliance and disclose those policies or a summary of those policies. 5.1
Recommendation 5.2: Companies should provide the following information:
> An explanation of any departures from Recommendations 5.1 or 5.2 should be included in the corporate governance statement in the annual report N/A
> The policies or a summary of those policies designed to guide compliance with Listing Rule disclosure requirements should be made publicly available, ideally by posting them to the company’s website in a clearly marked corporate governance section. 9.1
principle 6 – Respect the rights of shareholders
Recommendation 6.1: Companies should design a communications policy for promoting effective communication with shareholders and encouraging their participation at general meetings and disclose their policy or a summary of that policy. 5.1, 6.1, 6.2
Recommendation 6.2: Companies should provide the following information:
> Recommendations 6.1 or 6.2 should be included in the corporate governance statement in the annual report 5.1, 6.1, 6.2
> The company should describe how it will communicate with its shareholders publicly, ideally by posting the information on the company’s website in a clearly marked corporate governance section. 6.2, 9.1
principle 7 – Recognise and manage risk
Recommendation 7.1: Companies should establish policies for the oversight and management of material business risks and disclose a summary of those policies. 7.1
Recommendation 7.2: The board should require management to design and implement the risk management and internal control system to manage the company’s material business risks and report to it on whether those risks are being managed effectively. The board should disclose that management has reported to it as to the effectiveness of the company’s management of its material business risks. 7.1, 7.3
Corporate Governance (continued)F
or p
erso
nal u
se o
nly

15A
nn
ua
l Rep
ort
Go
verna
nce
GR
I Ind
exF
ina
ncia
l S
tatemen
tsS
up
plem
enta
ry In
form
ation
principles and Recommendations Reference compliance
Recommendation 7.3: The board should disclose whether it has received assurance from the chief executive officer (or equivalent) and the chief financial officer (or equivalent) that the declaration provided in accordance with section 295A of the Corporations Act is founded on a sound system of risk management and internal control and that the system is operating effectively in all material respects in relation to financial reporting risks. 7.3
Recommendation 7.4: Companies should provide the following information:
The following material should be included in the corporate governance statement in the annual report:
> explanation of any departures from Recommendations 7.1, 7.2, 7.3 or 7.4 N/A
> whether the board has received the report from management under Recommendation 7.2 7.3
> whether the board has received assurance from the chief executive officer (or equivalent) and the chief financial officer (or equivalent) under Recommendation 7.3. 7.3
The following material should be made publicly available, ideally by posting it to the company’s website in a clearly marked corporate governance section:
> a summary of the company’s policies on risk oversight and management of material business risks. 7.1
principle 8 – Remunerate fairly and responsibly Refer to 1.3
Recommendation 8.1: The board should establish a remuneration committee.
Recommendation 8.2: The remuneration committee should be structured so that it:
> consists of a majority of Independent Directors
> is chaired by an independent chair
> has at least three members.
Recommendation 8.3: Companies should clearly distinguish the structure of non-executive Directors’ remuneration from that of executive Directors and senior executives.
Recommendation 8.4: Companies should provide the following information:
The following material or a clear cross-reference to the location of the material should be included in the corporate governance statement in the annual report:
> the names of the members of the remuneration committee and their attendance at meetings of the committee, or where a company does not have a remuneration committee, how the functions of a remuneration committee are carried out
> the existence and terms of any schemes for retirement benefits, other than superannuation, for non-executive Directors
> an explanation of any departures from Recommendations 8.1, 8.2, 8.3 or 8.4.
The following material should be made publicly available, ideally by posting it to the company’s website in a clearly marked corporate governance section:
> the charter of the remuneration committee or a summary of the role, rights, responsibilities and membership requirements for that committee
> a summary of the company’s policy on prohibiting entering into transactions in associated products which limit the economic risk of participating in unvested entitlements under any equity-based remuneration schemes.
For
per
sona
l use
onl
y

16 Investa OffIce fund annual fInancIal RepORt June 2013
GRi index
GRI Indicator GRI description IOf 2013 annual financial Report and annual Review
1. Strategy and Analysis
1.1 Chairman and CEO’s Statement
Letter from the Chairman (p.2), IOF 2013 Annual Financial Report
Letter from the Chairman (p.4), IOF 2013 Annual Review
1.2 Key impacts, risks and opportunities
Significant impacts, risks and opportunities for sustainability at IOF are reported in:
Our Sustainability Performance(pp.18-19), Our Strategies (p.8), The Manager and Management Approach (pp.26-31), of the IOF 2013 Annual Review.
Corporate Governance, Sustainability (pp.10-11), Directors’ Report (pp.28-36), IOF 2013 Annual Financial Report.
2. Organisational Profile
2.1 Name of the organisation
Investa Office Fund (“IOF” or “the Fund”) is an ASX-listed real estate investment trust (A-REIT).
Investa Listed Funds Management Limited (ILFML, “the Responsible Entity”), became the responsible entity of IOF in July 2011.
Investa Office (“Investa” or “the Manager”) is part of Investa Property Group and is the responsible manager for the funds under management, the property management of many of the Fund’s Australian assets, and employs the management staff.
2.2 Primary brands, products, and/or services
The Fund is a leading owner of investment grade office buildings and receives rental income from a tenant register comprising predominantly Government and blue chip tenants.
Our Portfolio (pp.14-15), IOF 2013 Annual Review, and the IOF 2013 Property Portfolio book outlines all key assets under management and commercial office leases are supplied to market.
2.3 Operational structure of the organisation
IOF is managed by Investa Office on behalf of investors. Organisational structure diagram: The Manager and Management Approach (pp.26-27), IOF 2013 Annual Review.
2.4 Location of headquarters Sydney, Australia.
2.5 Countries of operation Australia. The Fund has investment assets located in core CBD markets throughout Australia and select offshore markets in Europe.
2.6 Nature of ownership and legal form
Investa Office Fund is an ASX-listed real estate investment trust.
Investa Listed Funds Management Limited, became the responsible entity of IOF in July 2011.
Investa Office is part of Investa Property Group and is the responsible manager for the funds under management, the property management of many of the Fund’s Australian assets, and employs the management staff.
2.7 Markets served IOF has investment assets located in core CBD markets throughout Australia and select offshore markets in Europe.
2.8 Scale of the reporting organisation
IOF has total assets under management of A$2.8 billion.
2.9 Significant changes during the reporting period
IOF’s aim is to reposition the portfolio to an Australian-only focus.
2.10 Awards received IOF was named a “GRESB Green Star 2012” and listed in the top 5 property funds in the world by the Global Real Estate Sustainability Benchmark (GRESB) Foundation.
For
per
sona
l use
onl
y
17A
nn
ua
l Rep
ort
Go
verna
nce
GR
I Ind
exF
ina
ncia
l S
tatemen
tsS
up
plem
enta
ry In
form
ation
GRI Indicator GRI description IOf 2013 annual financial Report and annual Review
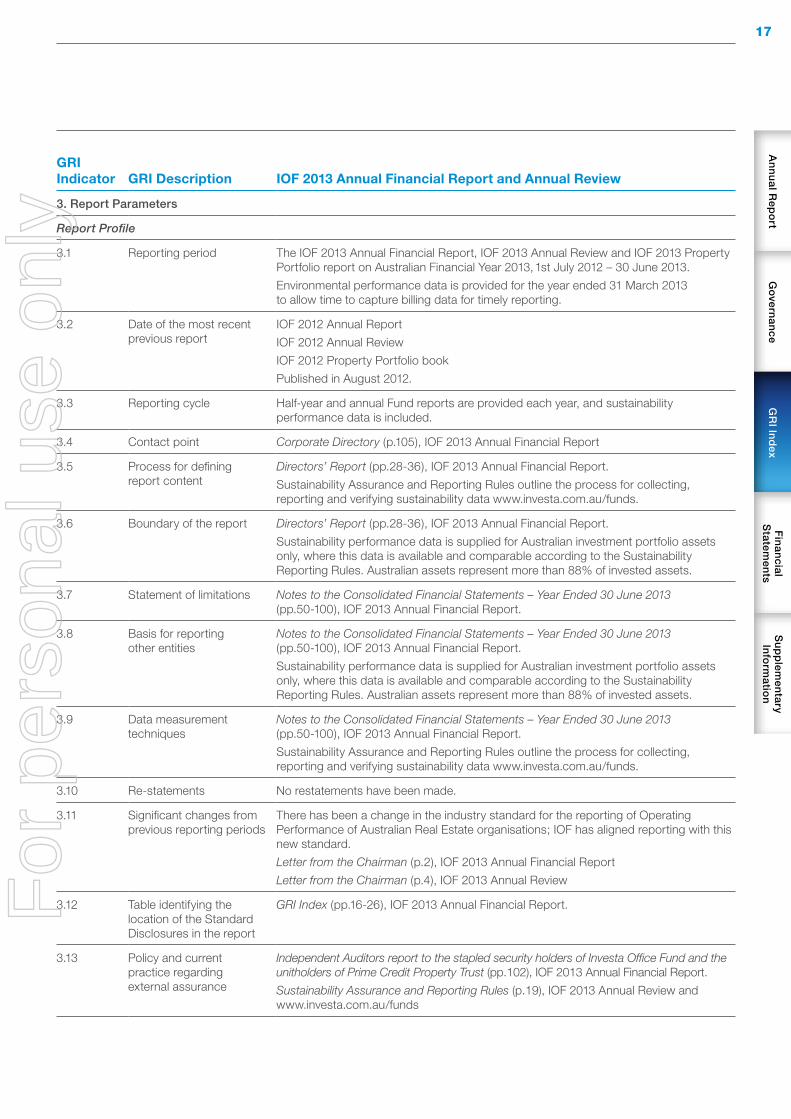
3. Report Parameters
Report Profile
3.1 Reporting period The IOF 2013 Annual Financial Report, IOF 2013 Annual Review and IOF 2013 Property Portfolio report on Australian Financial Year 2013, 1st July 2012 – 30 June 2013.
Environmental performance data is provided for the year ended 31 March 2013 to allow time to capture billing data for timely reporting.
3.2 Date of the most recent previous report
IOF 2012 Annual Report
IOF 2012 Annual Review
IOF 2012 Property Portfolio book
Published in August 2012.
3.3 Reporting cycle Half-year and annual Fund reports are provided each year, and sustainability performance data is included.
3.4 Contact point Corporate Directory (p.105), IOF 2013 Annual Financial Report
3.5 Process for defining report content
Directors’ Report (pp.28-36), IOF 2013 Annual Financial Report.
Sustainability Assurance and Reporting Rules outline the process for collecting, reporting and verifying sustainability data www.investa.com.au/funds.
3.6 Boundary of the report Directors’ Report (pp.28-36), IOF 2013 Annual Financial Report.
Sustainability performance data is supplied for Australian investment portfolio assets only, where this data is available and comparable according to the Sustainability Reporting Rules. Australian assets represent more than 88% of invested assets.
3.7 Statement of limitations Notes to the Consolidated Financial Statements – Year Ended 30 June 2013 (pp.50-100), IOF 2013 Annual Financial Report.
3.8 Basis for reporting other entities
Notes to the Consolidated Financial Statements – Year Ended 30 June 2013 (pp.50-100), IOF 2013 Annual Financial Report.
Sustainability performance data is supplied for Australian investment portfolio assets only, where this data is available and comparable according to the Sustainability Reporting Rules. Australian assets represent more than 88% of invested assets.
3.9 Data measurement techniques
Notes to the Consolidated Financial Statements – Year Ended 30 June 2013 (pp.50-100), IOF 2013 Annual Financial Report.
Sustainability Assurance and Reporting Rules outline the process for collecting, reporting and verifying sustainability data www.investa.com.au/funds.
3.10 Re-statements No restatements have been made.
3.11 Significant changes from previous reporting periods
There has been a change in the industry standard for the reporting of Operating Performance of Australian Real Estate organisations; IOF has aligned reporting with this new standard.
Letter from the Chairman (p.2), IOF 2013 Annual Financial Report
Letter from the Chairman (p.4), IOF 2013 Annual Review
3.12 Table identifying the location of the Standard Disclosures in the report
GRI Index (pp.16-26), IOF 2013 Annual Financial Report.
3.13 Policy and current practice regarding external assurance
Independent Auditors report to the stapled security holders of Investa Office Fund and the unitholders of Prime Credit Property Trust (pp.102), IOF 2013 Annual Financial Report.
Sustainability Assurance and Reporting Rules (p.19), IOF 2013 Annual Review and www.investa.com.au/funds
For
per
sona
l use
onl
y
18 Investa OffIce fund annual fInancIal RepORt June 2013
GRI Indicator GRI description IOf 2013 annual financial Report and annual Review
4. Governance, Commitments and Engagement: Governance
4.1 Governance structure Corporate Governance (pp.4-15), IOF 2013 Annual Financial Report.
There is also a Risk and Sustainability Committee – Safety, Health, Environment & Audit, reporting to the Board of Investa Property Group Holdings Pty Limited (IPGH) and its Charter extends to all activities of all entities owned by IPGH, including Investa Office. This is a management committee independently chaired that assists the Board with all financial, audit, governance and WH&S issues faced by Investa Office; and guides the implementation, operation and effectiveness of Invest Office’s Sustainability, Safety, Health & Environment Policies.
4.2 Chair of the highest governance body
Corporate Governance (p.5), IOF 2013 Annual Financial Report.
4.3 Highest governance body The Board of Investa Listed Funds Management Limited (ILFML, “the Responsible Entity”), became the responsible entity of IOF in July 2011.
Corporate Governance (p.5), IOF 2013 Annual Financial Report.
4.4 Mechanisms to provide recommendations or direction to the highest governance body
Corporate Governance (pp.4-15), IOF 2013 Annual Financial Report.
4.5 Compensation and performance
Corporate Governance (p.6), IOF 2013 Annual Financial Report.
4.6 Conflicts of interest Corporate Governance (p.7), IOF 2013 Annual Financial Report.
4.7 Expertise of governance bodies
Corporate Governance (p.5), IOF 2013 Annual Financial Report.
4.8 Statement of mission and values
Fund Overview (pp.2-3), Our Strategy (p.9), and The Manager and Management Approach (pp.26-31) IOF 2013 Annual Review.
4.9 Management of performance
Corporate Governance (pp.4-15) IOF 2013 Annual Financial Report.
4.10 Performance evaluation Corporate Governance (pp.4-15) IOF 2013 Annual Financial Report.
4.11 Whether and how a precautionary approach is addressed
Corporate Governance (pp.4-15) IOF 2013 Annual Financial Report.
4.12 Charters to which we subscribe
The Fund, through the Manager, subscribes and is committed to a range of corporate governance and responsibility charters and has external associations and accreditations. The Management Approach (pp.26-31), IOF 2013 Annual Review.
4.13 Memberships in associations/advocacy organisations
The Manager is currently a member or participant with the following associations and advocacy organisations:
> UNEPFI – United Nations Environment Program Finance Initiative: http://www.unepfi.org/
> UNPRI – United Nations Principles for Responsible Investment: http://www.unpri.org/
> RIAA – Responsible Investment Association Australasia: http://www.responsibleinvestment.org/
> ANREV – Asian Association for Investors: http://www.anrev.org/
> PCA – Property Council of Australia: http://www.propertyoz.com.au/
> UDIA – Urban Development Institute of Australia: http://www.udia.com.au/
> API – Australian Property Institute
> GBCA – Green Building Council of Australia
> Australian Marketing Institute
> Australian Investor Relations Associations
GRi index (continued)F
or p
erso
nal u
se o
nly

19A
nn
ua
l Rep
ort
Go
verna
nce
GR
I Ind
exF
ina
ncia
l S
tatemen
tsS
up
plem
enta
ry In
form
ation
GRI Indicator GRI description IOf 2013 annual financial Report and annual Review
Stakeholder Engagement
4.14 Stakeholder groups Key stakeholders identified include investors, tenants (customers), the environment, suppliers, employees and the communities the Fund works in, and Australian society at large. Management Approach (p.30), IOF 2013 Annual Review.
4.15 Basis for identification and selection of stakeholders
Stakeholders are identified as those individuals, organisations, sectors and communities where the Fund and Manager operations have some influence or impact on those people, groups and other externalities. Stakeholders are identified in Management Approach (p.30), IOF 2013 Annual Review.
4.16 Approaches to stakeholder engagement
Investor Relations (pp.34-35), and Management Approach (pp.26-31), IOF 2013 Annual Review.
4.17 Concerns raised through stakeholder engagement
Concerns raised through Investa’s tenant helpdesk, tenant surveys and employee surveys are acknowledged and responded to through a formal process and internal procedure. The Fund’s Investor Relations Representative responds directly to investor feedback.
Investor Relations (pp.34-35), and Management Approach (pp.26-31), IOF 2013 Annual Review.
Management Disclosures
Economic Performance
EC1 Direct economic value generated and distributed
Financial Information (pp.27-96), IOF 2013 Annual Financial Report.
Performance Summary (p.12), IOF 2013 Annual Review.
EC2 Financial implications and other risks and opportunities for the organisation’s activities due to climate change
The Fund’s 2012 and 2013 responses to CDP (formally Carbon Disclosure Project) are available via CDP online where detailed annual responses are provided to these issues. www.cdproject.net
EC3 Coverage of the organisation’s defined benefit plan obligations
Superannuation contributions are made by the Manager to employees, in accordance with Australian Government legislative requirements.
EC4 Significant financial assistance received from government
No significant financial assistance was received from government in FY2013.
Market Presence
EC5 Ratios of employee wage compared to the minimum wage
Investa Office employs the management staff of the Fund. The Investa Office Sustainability Report 2012-13 contains information about employment of management staff.
EC6 Policy, practices, and proportion of spending on locally-based suppliers at significant locations of operation
The Manager has management policies, practices and reporting of supply chains, these are detailed in the Investa Office Sustainability Report 2012-13.
Materials
EN1 Materials used by weight or volume
The Manager has procurement processes in place for the purchasing of materials, and these are reported in the Investa Office Sustainability Report 2012-13.
EN2 Percentage of materials used that are recycled and reused input materials
Sustainability Performance (pp.18-19), IOF 2013 Annual Review, and the Investa Office Sustainability Report 2012-13.
Energy
EN3 Direct energy consumption by primary energy source
Sustainability Performance (pp.18-19), IOF 2013 Annual Review.
For
per
sona
l use
onl
y

20 Investa OffIce fund annual fInancIal RepORt June 2013
GRI Indicator GRI description IOf 2013 annual financial Report and annual Review
EN4 Indirect energy consumption by primary source.
Sustainability Performance (pp.18-19), IOF 2013 Annual Review.
CRE1 Building Energy Intensity. Sustainability Performance (pp.18-19), IOF 2013 Annual Review.
EN5 Energy saved due to conservation and efficiency improvements.
Sustainability Performance (pp.18-19), IOF 2013 Annual Review.
EN6 Initiatives to provide energy-efficient or renewable energy based products and services, and reductions results.
Sustainability Performance (pp.18-19), IOF 2013 Annual Review. Key milestone 1 and 3, (p.21 and p.25), and the Management Approach (pp.28-31), IOF 2013 Annual Review.
EN7 Initiatives to reduce indirect energy consumption and reductions achieved.
Sustainability Performance (pp.18-19), IOF 2013 Annual Review.
Water
EN8 Total water withdrawal by source.
Sustainability Performance (pp.18-19), IOF 2013 Annual Review.
EN10 Percentage and total volume of water recycled and reused.
Water is recycled and reused at a number of IOF properties in Australia; however this use is not currently metered.
CRE2 Building water intensity. Sustainability Performance (pp.18-19), IOF 2013 Annual Review.
Biodiversity
EN11 Location and size of land owned, leased, managed in, or adjacent to, areas of high biodiversity value.
The Fund does not have investments in Australia in, or adjacent to, areas of high biodiversity value.
EN12 Description of significant impacts of activities, products, and services on biodiversity in areas of high biodiversity value.
No direct impacts.
EN13 Habitats protected or restored.
No direct interactions.
EN14 Strategies, current actions, and future plans for managing impacts on biodiversity.
The Manager’s Environment Policy specifically notes a principle to “Conserve biodiversity and enhance ecological outcomes”, www.investa.com.au. Options for improving biodiversity through business operations are being considered by the Manager.
Emissions, effluents, & waste
EN16 Total direct and indirect greenhouse gas emissions by weight.
Sustainability Performance (pp.18-19), IOF 2013 Annual Review.
EN17 Other relevant indirect greenhouse gas emissions by weight.
Sustainability Performance (pp.18-19), IOF 2013 Annual Review.
CRE3 Greenhouse gas emissions intensity from buildings.
Sustainability Performance (pp.18-19), IOF 2013 Annual Review.
GRi index (continued)F
or p
erso
nal u
se o
nly

21A
nn
ua
l Rep
ort
Go
verna
nce
GR
I Ind
exF
ina
ncia
l S
tatemen
tsS
up
plem
enta
ry In
form
ation
GRI Indicator GRI description IOf 2013 annual financial Report and annual Review
CRE4 Greenhouse gas emissions from new constructions and redevelopment activity.
Investa Office specifies and in some instances undertakes new constructions and redevelopment activity on behalf of IOF. The Investa Office Sustainability Report 2012-13 contains information about these activities.
EN18 Initiatives to reduce greenhouse gas emissions and reductions achieved.
Sustainability Performance (pp.18-19), IOF 2013 Annual Review. Key milestone 1 and 3, (p.21 and p.25), and the Management Approach (pp.28-31), IOF 2013 Annual Review.
EN19 Emissions of ozone-depleting substances by weight.
Sustainability Performance (pp.18-19), IOF 2013 Annual Review.
EN22 Total weight of waste by type and disposal method.
Sustainability Performance (pp.18-19), IOF 2013 Annual Review.
EN23 Total number and volume of significant spills.
Nil.
EN24 Weight of transported, imported, exported, or treated hazardous waste.
The Fund and Manager’s activities do not generate waste classified as ‘hazardous’.
EN25 Identity, size, protected status, and biodiversity value of water bodies and related habitats significantly affected by the organisations discharges of water and runoff.
Storm water and sewerage discharges are made only into regulated municipal systems for treatment.
Land Degradation, Contamination and Remediation
CRE5 Land remediated and in need of remediation for the existing or intended land use, according to applicable legal designations.
Sustainability Performance (pp.18-19), IOF 2013 Annual Review. Key milestone 1 and 3, (p.21 and p.25), and the Management Approach (pp.28-31), IOF 2013 Annual Review.
Products & services
EN26 Initiatives to enhance efficiency and mitigate environmental impacts of products and services, and extent of impact mitigation.
Sustainability Performance (pp.18-19), IOF 2013 Annual Review. Key milestone 1 and 3, (p.21 and p.25), and the Management Approach (pp.28-31), IOF 2013 Annual Review.
EN27 Percentage of products sold and their packaging materials that are reclaimed by category.
The Fund and the Manager do not manufacture consumer products.
Compliance
EN28 Significant fines and non-monetary sanctions for non-compliance with environmental laws and regulations.
Nil.
For
per
sona
l use
onl
y

22 Investa OffIce fund annual fInancIal RepORt June 2013
GRI Indicator GRI description IOf 2013 annual financial Report and annual Review
Transport
EN29 Significant environmental impacts of transporting products, goods, materials, and members of the workforce.
The Manager has management policies, practices and reporting of supply chains, these are detailed in the Investa Office Sustainability Report 2012-13.
Overall
EN30 Total environmental protection expenditures and investments by type
The Fund and the Manager do not at this time specifically quantify the total expenditure on or investment in environmental protection. The Manager aims to deliver environmental performance improvements as a responsible business. The Fund abides by internal Sustainability Responsible Investment Guidelines.
Workplace and Labour
Employment
LA1 Total workforce by employment type, employment contract, and region.
Investa Office employs the management staff of the Fund. The Investa Office Sustainability Report 2012-13 contains information about employment of management staff. The Manager (p.32-33), IOF 2013 Annual Review.
LA2 Total number and rate of new employee hires and employee turnover by age group, gender, and region.
Investa Office employs the management staff of the Fund. The Investa Office Sustainability Report 2012-13 contains information about employment of management staff.
LA3 Benefits provided to full-time employees that are not provided to temporary or part-time employees.
Investa Office employs the management staff of the Fund. The Investa Office Sustainability Report 2012-13 contains information about employment of management staff.
Labour/Management Relations
LA4 Percentage of employees covered by collective bargaining agreements.
Investa Office employs the management staff of the Fund. The Investa Office Sustainability Report 2012-13 contains information about employment of management staff.
LA5 Minimum notice period(s) regarding significant operational changes.
Investa Office employs the management staff of the Fund. The Investa Office Sustainability Report 2012-13 contains information about employment of management staff.
Occupational Health and Safety
LA6 Percentage of total workforce represented in formal joint management-worker health and safety committees.
Investa Office employs the management staff of the Fund. The Investa Office Sustainability Report 2012-13 contains information about employment of management staff.
LA7 Rates of injury, occupational diseases, lost days, and absenteeism, and number of work-related fatalities by region.
Investa Office employs the management staff of the Fund. The Investa Office Sustainability Report 2012-13 contains information about employment of management staff.
GRi index (continued)F
or p
erso
nal u
se o
nly

23A
nn
ua
l Rep
ort
Go
verna
nce
GR
I Ind
exF
ina
ncia
l S
tatemen
tsS
up
plem
enta
ry In
form
ation
GRI Indicator GRI description IOf 2013 annual financial Report and annual Review
LA8 Programs in place to assist workforce members, their families, or community members regarding serious diseases.
Investa Office employs the management staff of the Fund. The Investa Office Sustainability Report 2012-13 contains information about employment of management staff.
LA9 Health and safety topics covered in formal agreements with trade unions.
Investa Office employs the management staff of the Fund. The Investa Office Sustainability Report 2012-13 contains information about employment of management staff.
Training and Education
LA10 Average hours of training per year per employee by gender and by employee category.
Investa Office employs the management staff of the Fund. The Investa Office Sustainability Report 2012-13 contains information about employment of management staff.
LA11 Programs for skills management and lifelong learning that support employability.
Investa Office employs the management staff of the Fund. The Investa Office Sustainability Report 2012-13 contains information about employment of management staff.
LA12 Percentage of employees receiving regular performance and career development reviews.
Investa Office employs the management staff of the Fund. The Investa Office Sustainability Report 2012-13 contains information about employment of management staff.
Diversity and Equal Opportunity
LA13 Composition of governance bodies and indicators of diversity.
Corporate Governance – Diversity, (p.8), IOF 2013 Annual Financial Report.
Equal remuneration for women and men
LA14 Ratio of basic salary of men to women by employee category.
Investa Office employs the management staff of the Fund. The Investa Office Sustainability Report 2012-13 contains information about employment of management staff.
CRE6 Percentage of the organisation operating in verified compliance with an international recognised health and safety management system.
All assets under investment in Australia are operating in verified compliance with an international recognised health and safety management system, verified to Australian Standard AS/NZS/ISO 14001:2004, AS/NZS 4804:2001. Australian assets represent more than 88% of invested assets.
Human Rights
Investment and Procurement Practices
HR1 Significant investment agreements that screen for human rights.
The Fund primarily operates in Australia where legislation is in place regarding issues relating to human rights. The Manager is a signatory to the UNPRI and there are internal Sustainable Responsible Investment Guidelines.
HR2 Significant suppliers, contractors and other business partners that screen for human rights.
The Fund primarily operates in Australia where legislation is in place regarding issues relating to human rights.
HR3 Total hours of employee training concerning human rights, and percentage trained.
Investa Office employs the management staff of the Fund. The Investa Office Sustainability Report 2012-13 contains information about employment of management staff.
For
per
sona
l use
onl
y

24 Investa OffIce fund annual fInancIal RepORt June 2013
GRI Indicator GRI description IOf 2013 annual financial Report and annual Review
Non-Discrimination
HR4 Incidents of discrimination. No incidents.
Freedom of Association and Collective Bargaining
HR5 Support and protection of rights to exercise freedom of association and collective bargaining.
Investa Office employs the management staff of the Fund. The Investa Office Sustainability Report 2012-13 contains information about employment of management staff.
Child Labour
HR6 Significant risks for operational incidents of child labour and preventative measures.
The Fund primarily operates in Australia where legislation is in place regarding child labour.
Forced and Compulsory Labour
HR7 Operations identified at risk of incidents of forced or compulsory labour.
The Fund primarily operates in Australia where legislation is in place regarding issues relating to human rights.
Security practices
HR8 Operations identified at risk of incidents of forced or compulsory labour.
Investa Office employs the management staff of the Fund. The Investa Office Sustainability Report 2012-13 contains information about employment of management staff.
Indigenous Rights
HR9 Total number of incidents of violations involving rights of indigenous people and actions taken
Nil.
Assessment
HR10 Percentage and number of operations subject to human rights assessments
Nil.
Remediation
HR11 Number of grievances related to human rights through formal mechanisms.
Nil.
Society
Community
SO1 Impacts of operations on communities, including the nature, scope, and effectiveness.
The Manager operates a number of annual assessments, in 2012 including a:
> Customer survey, with responses from 40% of tenants.
> Staff engagement survey, 83% response rate.
> Health and safety staff survey.
CRE7 Number of persons displaced and/or resettled by development
Nil.
GRi index (continued)F
or p
erso
nal u
se o
nly
25A
nn
ua
l Rep
ort
Go
verna
nce
GR
I Ind
exF
ina
ncia
l S
tatemen
tsS
up
plem
enta
ry In
form
ation
GRI Indicator GRI description IOf 2013 annual financial Report and annual Review
Corruption
SO2 Business units analysed for risks related to corruption.
All people employed by the Manager and supplying services to the Fund are subject to an internal Code of Conduct policy, including issues relating to corruption.
Corporate Governance (p.8), IOF 2013 Annual Financial Report.
SO3 Employees trained in anti-corruption policies and procedures.
All people employed by the Manager and supplying services to the Fund are subject to an internal Code of Conduct policy, including issues relating to corruption.
Corporate Governance (p.8), IOF 2013 Annual Financial Report.
SO4 Actions taken in response to incidents of corruption.
Nil incidents.
Public Policy
SO5 Public policy positions and participation in public policy development and lobbying.
The Fund and the Manager are not directly involved in public policy though The Manager makes formal submissions to government consultations on matters of interest or when invited to do so.
SO6 Financial and in-kind contributions to political parties, politicians, and related institutions.
No donations were made to political parties or politicians.
Anti-Competitive Behaviour
SO7 Legal actions for anti-competitive behaviour, anti-trust, and monopoly practices.
Nil actions.
Compliance
SO8 Significant fines and non-monetary sanctions for non-compliance with laws and regulations.
None.
Product Responsibility
Customer Health and Safety
PR1 Health and safety assessments of products and services.
The Manager’s Safety, Health and Environmental (SHE) Management System (SHEMS) provides company-wide identification and management of risks and opportunities, using the Australian Standard AS/NZS/ISO 14001:2004 and AS/NZS 4804:2001 as a basis. Investa engages NSCA (National Safety Council of Australia) to audit premises in accordance with the SHEMS.
PR2 Incidents of non-compliance with regulations and voluntary codes regarding health and safety.
None.
Product and Service Labelling
PR3 Product and service information required by procedures.
In Australia, mandatory Commercial Building Disclosure (CBD) obligations are set out under the Building Energy Efficiency Disclosure Act 2010. Building Energy Efficiency Certificates (BEECs) must be in place and disclosed at the point of sale or lease of office accommodation greater than 2,000 square metres. Current BEECs relating to IOF properties are made publicly accessible on the online Building Energy Efficiency Register.
For
per
sona
l use
onl
y

26 Investa OffIce fund annual fInancIal RepORt June 2013
GRI Indicator GRI description IOf 2013 annual financial Report and annual Review
CRE8 Number of sustainability certifications, ratings and labelling.
IOF and the Manager use the National Australian Built Environment Rating System (NABERS) to rate and disclose the performance of office buildings each year. A full schedule of NABERS ratings is available: The Management Approach (p.29), IOF 2013 Annual Review.
PR4 Incidents of non-compliance with regulations and voluntary codes concerning products and services.
None.
PR5 Customer satisfaction surveys.
The Manager operated a customer survey in 2012, with responses from 40% of tenants.
Investor Relations (pp.34-35), and Management Approach (pp.28-31), IOF 2013 Annual Review.
Marketing Communications
PR6 Programs for adherence to laws, standards, and voluntary codes related to marketing communications.
The Fund and the Manager have internal processes for checking legal and marketing standards compliance for all marketing communications.
PR7 Incidents of non-compliance with regulations and voluntary codes concerning marketing communications.
Nil incidents.
Customer Privacy
PR8 Substantiated complaints regarding breaches of customer privacy.
Nil.
Compliance
PR9 Significant fines for non-compliance with laws and regulations.
Nil.
GRi index (continued)F
or p
erso
nal u
se o
nly

27A
nn
ua
l Rep
ort
Go
verna
nce
GR
I Ind
exF
ina
ncia
l S
tatemen
tsS
up
plem
enta
ry In
form
ation
Contents directors’ Report 28
auditor’s Independence declaration 37
financial statements
Consolidated Income Statements 38
Consolidated Statements of Comprehensive Income 39
Consolidated Statements of Financial Position 40
Consolidated Statements of Changes in Equity 41
Consolidated Statements of Cash Flows 43
Notes to the Consolidated Financial Statements 44
Note 1. Summary of significant accounting policies 44
Note 2. Critical accounting estimates and judgements 53
Note 3. Distributions 54
Note 4. Earnings per unit 55
Note 5. Asset and liabilities classified as held for sale and discontinued operations 56
Note 6. Income tax expense 58
Note 7. Cash and cash equivalents 59
Note 8. Trade and other receivables 59
Note 9. Financial assets at fair value through profit or loss 60
Note 10. Derivative financial instruments 61
Note 11. Investment properties 61
Note 12. Investments accounted for using the equity method 64
Note 13. Trade and other payables 67
Note 14. Borrowings 67
Note 15. Non-current deferred tax liabilities 68
Note 16. Contributed equity 69
Note 17. Reserves 70
Note 18. Accumulated losses 71
Note 19. Commitments 71
Note 20. Capital management 72
Note 21. Financial risk management 74
Note 22. Related parties 87
Note 23. Auditor’s remuneration 90
Note 24. Parent financial information 91
Note 25. Segment information 92
Note 26. Note to the Consolidated Statements of Cash Flows 95
Note 27. Events occurring after the reporting period 95
directors’ declaration 96
Independent auditor’s Report 97
The Investa Office Fund was formed by the stapling of the units in two Australian registered schemes, Armstrong Jones Office Fund (ARSN 090 242 229) and Prime Credit Property Trust (ARSN 089 849 196). Investa Listed Funds Management Limited (ABN 37 149 175 655; AFS licence number 401414) is the Responsible Entity of both schemes, and is incorporated and domiciled in Australia. The registered office of Investa Listed Funds Management Limited is Level 6, Deutsche Bank Place, 126 Phillip Street, Sydney, New South Wales.
This report is not an offer or invitation to subscribe or purchase, or a recommendation of, securities. It does not take into account the investment objectives, financial situation and particular needs of the investor.
Before making an investment in Investa Office Fund, the investor or prospective investor should consider whether such an investment is appropriate to their particular investment needs, objectives and financial circumstances and consult an investment adviser if necessary.
The responsibility for preparation of the financial statements and any financial information contained in this financial report rests solely with the Directors of the Responsible Entity. This financial report was authorised for issue by the Directors on 21 August 2013. The Responsible Entity has the power to amend and reissue this financial report.
Financial informationF
or p
erso
nal u
se o
nly
28 Investa OffIce fund annual fInancIal RepORt June 2013
The Investa Office Fund (“IOF” or the “Group”) was formed by the stapling of the units in two trusts, Armstrong Jones Office Fund (the “Fund”) and Prime Credit Property Trust (“Prime”) (collectively the “Trusts”). The Responsible Entity for the Trusts is Investa Listed Funds Management Limited (“ILFML”), which presents the Group’s Annual Financial Report together with Prime’s Annual Financial Report for the year ended 30 June 2013.
In accordance with Accounting Standard AASB 3 Business Combinations, the stapling arrangement referred to above is regarded as a business combination and the Fund has been identified as the Parent for preparing Consolidated Financial Reports.
The Directors’ report is a combined Directors’ report that covers both Trusts. The financial information for the Group and Prime is taken from the Consolidated Financial Statements and notes.
Directors
The following persons were Directors of Investa Listed Funds Management Limited during the whole of the financial year and up to the date of this report:
Deborah Page AM Independent Non-Executive Chairman
Peter Dodd Independent Non-Executive Director
Peter Rowe Independent Non-Executive Director
Scott MacDonald Non-Executive Director (retired as an Executive Director – effective 1 July 2013)
Ming Long Executive Director
Campbell Hanan Alternate Director (alternate for Scott MacDonald – effective 1 July 2013)
Summary of operations
principal activity
The principal activity of the Trusts is to own investment grade office buildings, generating rental and other property income. These properties are either owned directly or indirectly through the ownership of interests in unlisted entities.
There was no significant change in the nature of either Trust’s activities during the year.
property portfolio
At 30 June 2013 the Group held twenty investments located in Australia and had exchanged contracts for 99 Walker St, North Sydney. It also held two investments located in Europe as at 30 June 2013. By value and including 99 Walker St, North Sydney the Australian portfolio represents 88% of the Group’s total investment portfolio while the European portfolio represents 12%. On the same basis, the total net lettable area of the Australian and European portfolio is 369,188sqm and 133,057sqm respectively.
The Group has a stated aim of selling all of its foreign assets and redeploying that capital into an appropriately diversified portfolio of quality Australian assets that will deliver high risk-adjusted returns.
All properties located in the United States of America were sold in the prior year ending 30 June 2012.
a) Australian property portfolio
As at 30 June 2013, the majority of the Group’s property portfolio was located in the central business districts of major Australian cities. During the current financial year the following key events occurred within the Australian portfolio:
> In August 2012, the Group acquired a 100% interest in 66 St Georges Terrace, Perth for $82.4 million. This acquisition continues to perform in line with expectations.
> In March 2013, the Group, jointly with Investa Commercial Property Fund (“ICPF”), an unlisted fund managed by a related party of the Responsible Entity, acquired land and also entered into a development management agreement to construct a premium grade office building located at 567 Collins St, Melbourne. The Group acquired its share (50%) of the land for $18.8 million and has committed to fund a further $212.3 million of construction costs, which will be paid up to practical completion (expected in the first half of financial year 2016).
> In March 2013, the Group commenced an extensive refurbishment of 16-18 Mort Street, Canberra following the vacation by the previous tenant. The major works being undertaken include updating the façade, upgrading the building services and fully refurbishing the office space and are anticipated to improve the NABERS rating to 4.5 stars. Telstra has entered into a lease to occupy all six floors of office space in the premises once the redevelopment works are completed, which is on track to occur in November 2013.
> In June 2013, the Group exchanged contracts to acquire 99 Walker Street, North Sydney for a purchase price of $124.9 million plus settlement adjustments and transaction costs. The settlement of the acquisition occurred on 24 July 2013.
Over the course of the 30 June 2013 financial year leases were signed in respect of over 32,000sqm of space. This has added to the over 80,000sqm leased in the prior year ending 30 June 2012. A further 11,000sqm has been leased post 30 June 2013. This activity has resulted in a continued level of high occupancy and leaves only 1.5% of the Group’s income included in the 30 June 2014 earnings guidance at risk. Refer earnings guidance section for further details.
Directors’ ReportYear Ended 30 June 2013
For
per
sona
l use
onl
y

29A
nn
ua
l Rep
ort
Go
verna
nce
GR
I Ind
exF
ina
ncia
l S
tatemen
tsS
up
plem
enta
ry In
form
ation
As a result of the significant level of leasing activity, the Group has reduced the number of potential major lease expiries in the next two years to the following:
> 10,947sqm at 140 Creek Street, Brisbane – leased to the ATO until February 2014;
> 4,660sqm at 10-20 Bond Street, Sydney – leased to Origin Energy until November 2014;
> 4,602sqm at 99 Walker Street, North Sydney – leased to AAMI until January 2015; and
> 2,673sqm at 628 Bourke Street, Melbourne – leased to V Line until May 2015.
Key metrics for the Australian portfolio as at and for the year ended 30 June 2013 include:
> Occupancy of 96% (30 June 2012: 98%);
> Tenant retention of 54% (30 June 2012: 76%), current year impacted by the departure of the previous tenant at 16-18 Mort Street, Canberra;
> Like-for-like net property income growth of +4.5% (30 June 2012: +1.4%); and
> Weighted average lease expiry of 4.8 years (30 June 2012: 5.1 years).
As at the date of this report, terms have been agreed but documents are not yet executed across a further 75,000sqm of the portfolio for leases expiring in the near to long term. If all of these transactions are completed the occupancy will improve by 0.3% and the weighted average lease expiry will increase to 5.4 years.
b) European property portfolio
The Group continues to focus on exiting its European portfolio consisting of the Group’s 14.2% investment in the Dutch Office Fund (30 June 2012: 14.2%) and its 50.0% investment in Bastion Tower, Belgium (30 June 2012: 50.0%). At Bastion Tower, a major lease was renewed during the year ending 30 June 2013, extending its weighted average lease expiry to more than 8 years. The asset is now being marketed for sale.
Key metrics for the European portfolio as at and for the year ended 30 June 2013 include:
> Occupancy of 84% (30 June 2012: 86%);
> Tenant retention of 62% (30 June 2012: 81%);
> Like-for-like net property income growth of -1.5% (30 June 2012: -5.8%); and
> Weighted average lease expiry of 5.4 years (30 June 2012: 4.5 years).
c) Revaluations
Independent investment property valuations were completed for 52% by value (30 June 2012: 91%) of the Australian portfolio (including investment properties held by equity accounted investments). This resulted in an overall 3% (30 June 2012: 5%) valuation increase on book values for the Australian portfolio.
Independent investment property valuations were completed for 100% (30 June 2012: 100%) of the European investment properties held by equity accounted investments at 30 June 2013 resulting in an overall 2% decrease (30 June 2012: 2% decrease) on book values for the European equity accounted investments.
A fair value decrease in the Group’s interest in the Dutch Office Fund (“DOF”) of $23.0 million (30 June 2012: $28.9 million) has been recognised. The decrease is due to a decline in the underlying net asset value of DOF. A discount of 15% continues to be applied to DOF’s reported underlying net asset value (30 June 2012: 15%), in recognition of the illiquid nature of the investment and the effect of prevailing economic conditions in Europe.
The weighted average capitalisation rate as at 30 June 2013 was 7.5% for the Australian portfolio (30 June 2012: 7.6%) and 7.3% for the whole portfolio (30 June 2012: 7.4%). Refer to Note 2 of the Financial Statements for the weighted average capitalisation rate used by the external independent property valuers as at 30 June 2013.
d) Acquisitions
Since April 2012, the Group has acquired over $800m of high quality office buildings in Australia and these acquisitions have been a key driver of the growth in operating earnings and net tangible assets during the year to 30 June 2013. In particular:
> The Group’s 50% interest in 242 Exhibition Street, Melbourne (held by an equity investment) has increased in value in accordance with the independent valuation by 7.5% since acquisition in April 2012;
> The Group’s 25% interest in 126 Phillip Street, Sydney (held by an equity investment) has had strong leasing outcomes, with five leases agreed in the second half of the year ended 30 June 2013 amounting to over 5,000sqm; and
> The Group’s 100% interest in 66 St George’s Terrace, Perth has increased in value in accordance with the independent valuation by 8.2% since acquisition in August 2012.
For
per
sona
l use
onl
y

30 Investa OffIce fund annual fInancIal RepORt June 2013
Financial performance
a summary of the Group and prime’s results for the year is set out below:
Investa Office Fund
Prime Credit Property Trust
30 June 2013
$m
30 June 2012
$m
30 June 2013
$m
30 June 2012
$m
Net profit attributable to unitholders 158.7 101.9 96.5 11.4
Net profit from continuing operations 159.3 181.9 97.1 91.4
Operating earnings 137.5 128.1 na na
Distributions paid and payable to unitholders 109.0 109.5 59.9 57.2
cents cents cents cents
Per stapled unit:
Basic and diluted earnings per unit from net profit 25.8 16.0 na na
Basic and diluted earnings per unit from net profit from continuing operations 25.9 28.6 na na
Operating earnings per unit 22.4 20.1 na na
Per unit of each Trust:
Basic and diluted earnings per unit from net profit 10.1 14.2 15.7 1.8
Basic and diluted earnings per unit from net profit from continuing operations 10.1 14.2 15.8 14.4
Distributions per unit 17.75 17.50 9.75 9.20
Directors’ ReportYear Ended 30 June 2013 (continued)
A distribution of $55.3 million for the half-year ended 30 June 2013 was recognised in the 2013 financial year and is scheduled to be paid on 30 August 2013.
Basic and diluted earnings per stapled unit from net profit, as calculated under applicable accounting standards for the year ended 30 June 2013 were 25.8 cents, compared to 16.0 cents for the previous year. The change is predominantly as a result of a prior year loss on the transfer of the US foreign currency translation reserve (included as a component of reserves) to the Consolidated Income Statement, and a lower positive revaluation of the Group’s investments in the current year compared to the year ended 30 June 2012.
Distributions per unit have increased by 1% from 17.50 cents to 17.75 cents for the year ended 30 June 2013. In the previous year a special distribution of 1.90 cents was paid as a consequence of divesting all the US assets, and repatriating those proceeds and associated earnings. Excluding the special distribution, distributions per unit have increased by 14%.
For
per
sona
l use
onl
y
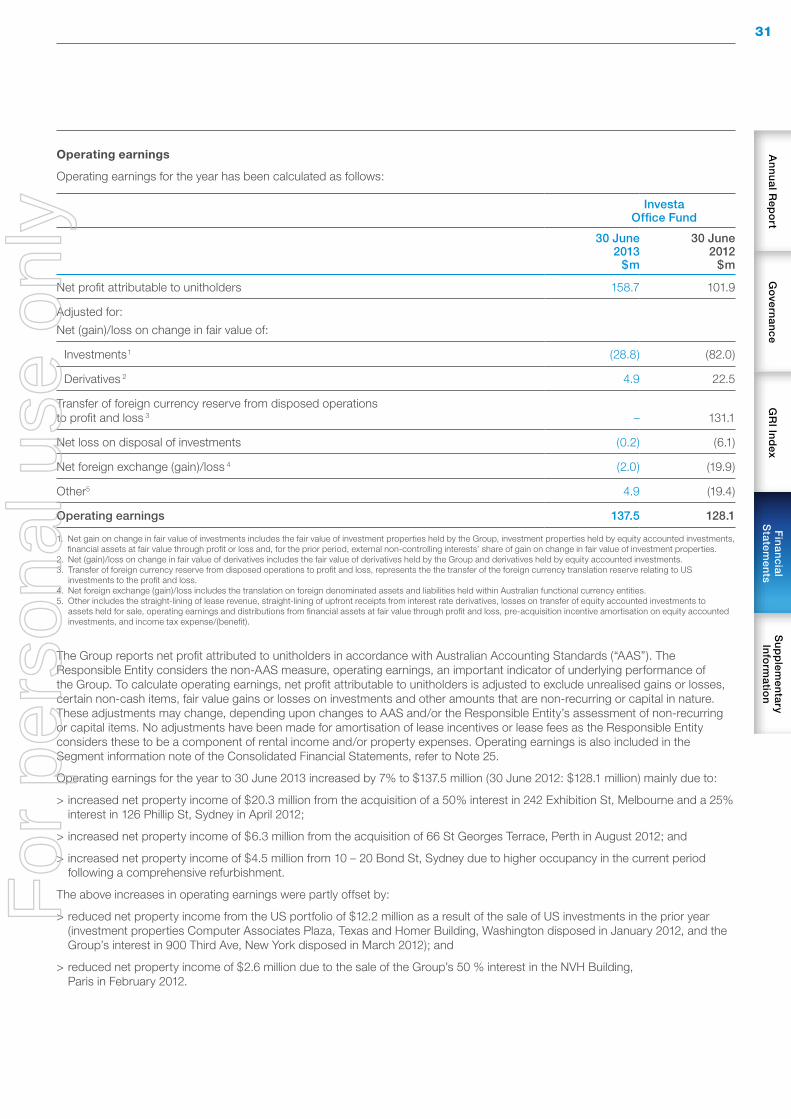
31A
nn
ua
l Rep
ort
Go
verna
nce
GR
I Ind
exF
ina
ncia
l S
tatemen
tsS
up
plem
enta
ry In
form
ation
Operating earnings
Operating earnings for the year has been calculated as follows:
Investa Office Fund
30 June 2013
$m
30 June 2012
$m
Net profit attributable to unitholders 158.7 101.9
Adjusted for:
Net (gain)/loss on change in fair value of:
Investments1 (28.8) (82.0)
Derivatives 2 4.9 22.5
Transfer of foreign currency reserve from disposed operations to profit and loss 3 – 131.1
Net loss on disposal of investments (0.2) (6.1)
Net foreign exchange (gain)/loss 4 (2.0) (19.9)
Other5 4.9 (19.4)
Operating earnings 137.5 128.1
1. Net gain on change in fair value of investments includes the fair value of investment properties held by the Group, investment properties held by equity accounted investments, financial assets at fair value through profit or loss and, for the prior period, external non-controlling interests’ share of gain on change in fair value of investment properties.
2. Net (gain)/loss on change in fair value of derivatives includes the fair value of derivatives held by the Group and derivatives held by equity accounted investments.3. Transfer of foreign currency reserve from disposed operations to profit and loss, represents the the transfer of the foreign currency translation reserve relating to US
investments to the profit and loss. 4. Net foreign exchange (gain)/loss includes the translation on foreign denominated assets and liabilities held within Australian functional currency entities.5. Other includes the straight-lining of lease revenue, straight-lining of upfront receipts from interest rate derivatives, losses on transfer of equity accounted investments to
assets held for sale, operating earnings and distributions from financial assets at fair value through profit and loss, pre-acquisition incentive amortisation on equity accounted investments, and income tax expense/(benefit).
The Group reports net profit attributed to unitholders in accordance with Australian Accounting Standards (“AAS”). The Responsible Entity considers the non-AAS measure, operating earnings, an important indicator of underlying performance of the Group. To calculate operating earnings, net profit attributable to unitholders is adjusted to exclude unrealised gains or losses, certain non-cash items, fair value gains or losses on investments and other amounts that are non-recurring or capital in nature. These adjustments may change, depending upon changes to AAS and/or the Responsible Entity’s assessment of non-recurring or capital items. No adjustments have been made for amortisation of lease incentives or lease fees as the Responsible Entity considers these to be a component of rental income and/or property expenses. Operating earnings is also included in the Segment information note of the Consolidated Financial Statements, refer to Note 25.
Operating earnings for the year to 30 June 2013 increased by 7% to $137.5 million (30 June 2012: $128.1 million) mainly due to:
> increased net property income of $20.3 million from the acquisition of a 50% interest in 242 Exhibition St, Melbourne and a 25% interest in 126 Phillip St, Sydney in April 2012;
> increased net property income of $6.3 million from the acquisition of 66 St Georges Terrace, Perth in August 2012; and
> increased net property income of $4.5 million from 10 – 20 Bond St, Sydney due to higher occupancy in the current period following a comprehensive refurbishment.
The above increases in operating earnings were partly offset by:
> reduced net property income from the US portfolio of $12.2 million as a result of the sale of US investments in the prior year (investment properties Computer Associates Plaza, Texas and Homer Building, Washington disposed in January 2012, and the Group’s interest in 900 Third Ave, New York disposed in March 2012); and
> reduced net property income of $2.6 million due to the sale of the Group’s 50 % interest in the NVH Building, Paris in February 2012.
For
per
sona
l use
onl
y

32 Investa OffIce fund annual fInancIal RepORt June 2013
Directors’ ReportYear Ended 30 June 2013 (continued)
Financial performance (continued)
Operating earnings per unit has increased by 11% to 22.4 cents per unit (30 June 2012: 20.1 cents per unit). The increase in operating earnings per unit has been influenced by higher operating earnings and the lower number of units due to the 10% unit buyback completed in December 2011.
During 2013, the Property Council of Australia (“PCA”) has been working with key property industry stakeholders to improve the non-AAS measures of operating performance amongst Australian real estate organisations. The aim is to provide investors and analysts with clear, consistent and meaningful information. This has resulted in the PCA releasing a White Paper titled “Voluntary best practice guidelines for disclosing FFO and AFFO”. The White Paper sets out principles for determining Property Council Funds From Operations (“Property Council FFO”) and Property Council Adjusted Funds From Operations (“Property Council AFFO”). For the financial years ending on and after 30 June 2014 the Responsible Entity’s primary non-AAS measure of the Group’s performance will be based on Property Council FFO and Property Council AFFO rather than operating earnings.
Property Council FFO is defined as the Group’s underlying and recurring earnings from its operations, determined by adjusting statutory net profit (under AIFRS) for non-cash and other items such as the amortisation of tenant incentives and rent free periods, fair value gains / losses on investment property, fair value gains / losses on the mark to market of derivatives, the straight lining of rent, non-FFO deferred tax benefits and expenses, foreign currency translation reserves recognised in net profit, and any other unrealised or one-off items.
Property Council AFFO is defined as the Group’s Property Council FFO adjusted for other non-cash and other items such as maintenance capital expenditure, incentives given for the accounting period, derivative close out costs, and other one-off items which have not been adjusted in determining Property Council FFO.
Financial position
A summary of the Group and Prime’s net asset position for the year is set out below:
Investa Office Fund
Prime Credit Property Trust
30 June 2013
$m
30 June 2012
$m
30 June 2013
$m
30 June 2012
$m
Value of total assets ($m) 2,723.8 2,502.6 1,336.3 1,182.4
Total liabilities ($m) 737.2 575.8 226.0 108.7
Net assets ($m) 1,986.6 1,926.8 1,110.3 1,073.7
Net tangible assets per unit (dollars) 3.23 3.14 1.81 1.86
The value of the Group and Prime’s total assets is derived using the basis set out in Note 1 of the Financial Statements. The net tangible assets per unit is calculated by dividing the total equity attributable to unitholders of the Group or Prime by the number of units on issue.
Total assets increased by $221.2 million (9%) to $2,723.8 million (30 June 2012: $2,502.6 million) mainly due to the acquisition of 66 St Georges Terrace, Perth in August 2012; additions to existing properties; positive revaluation to the Group’s investment property portfolio; and the acquisition of land and commencement of construction relating to 567 Collins Street, Melbourne, an equity accounted investment. Total liabilities increased by $161.4 million (28%) to $737.2 million (30 June 2012: $575.8 million) predominantly due to an increase in debt to fund the acquisition of 66 St Georges Terrace, Perth and construction of 567 Collins Street, Melbourne.
For
per
sona
l use
onl
y

33A
nn
ua
l Rep
ort
Go
verna
nce
GR
I Ind
exF
ina
ncia
l S
tatemen
tsS
up
plem
enta
ry In
form
ation
capital management
Investa Office Fund
30 June 2013
30 June 2012
Drawn debt ($’m) 617.9 459.1
Drawn debt – look-through ($’m)1 676.8 510.8
Gearing ratio – look-through 26.3% 21.9%
Weighted average debt expiry – look-through 2 3.2 years 2.4 years
Hedged / fixed – look-through 55.0% 72.0%
Leverage ratio – look-through 29.9% 26.0%
Interest coverage – look-through (times) 5.4x 4.9x
1. Excludes debt drawn by the Dutch Office Fund investment.2. Includes the completion of the U.S. Private Placement described below.
The Group had drawn debt on a look-through basis as at 30 June 2013 of $676.8 million (30 June 2012: $510.8 million). The Group had undrawn committed bank facilities on a look-through basis as at 30 June 2013 of $234.3 million (30 June 2012: $240.5 million).
On 7 November 2012, the Group issued a five year Australian dollar denominated $125.0 million Medium Term Note (“MTN”) with a 5.4% coupon rate paid semi-annually, which will mature in November 2017. Proceeds were used to pay down debt drawn under the syndicate bank debt facility.
On 3 April 2013, the Group repaid and cancelled Facility B on its existing syndicate debt facility which had a drawdown limit of $150.0 million.
On 4 April 2013, the Group entered into a number of new bank facilities. The new bank facilities provide the Group the ability to draw $150.0 million on or after 27 June 2013 with a maturity date of 5 August 2016. The terms and conditions of the new facilities are consistent with the Group’s pre-existing syndicate facility.
On 4 June 2013, the Group announced the issue of a twelve year US dollar denominated $125.0 million U.S. Private Placement (“USPP”), swapped back to AU$128.9 million, with a margin of 175 basis points over the Bank Bill Swap Rate (“BBSW”). Proceeds were used to repay bank debt upon settlement, which took place on the 12 August 2013.
The average maturity of the Group’s debt on a look-through basis at 30 June 2013 was 3.2 years (30 June 2012: 2.4 years). This average maturity includes the completion of the USPP. The Group’s earliest maturity date is 14 August 2014 in relation to Tranches A, C and D of the Group’s syndicate debt facility.
Business strategies and prospects for future financial years
Information regarding the Responsible Entity’s business strategies for the Group and future financial prospects is outlined below.
Business strategies
The key business strategies for the Group as at 30 June 2013 are set out below.
a) Portfolio repositioning
Over the long term, the Responsible Entity seeks to enhance and build the Group’s investment property portfolio in major Australian CBD markets consisting of three asset classifications:
> Core assets – these assets will provide a solid income base to support distributions and operations, providing an element of stability through real estate cycles.
> Value add assets - these assets offer greater opportunity for growth through redevelopment, re-leasing, or operational change and improvement.
> Tactical assets – these properties are typically smaller and are not considered to form part of the Group’s long-term portfolio positioning.
The portfolio repositioning will be achieved by continuing to transition to a 100% Australian portfolio by selling the two remaining European assets and focusing on acquiring Australian assets with attractive risk-adjusted returns. The repositioning of the portfolio enhances the future financial prospects of the Group by concentrating the portfolio in Australian CBD office markets where the Manager has strong expertise.
b) Optimisation of portfolio performance
A key strategy of the Responsible Entity is to enhance the property portfolio’s returns. This will be achieved by:
> Addressing short-term lease expiries and vacancy risks to maximise rental income;
> Continuing to upgrade assets to deliver medium to long term value;
> Continuing to focus on property operational efficiencies;
> Optimising environmental performance of assets through appropriate capital expenditure programs; and
> Enhancing tenant communications and service.
c) Capital management
The Responsible Entity continues to be focused on optimising investment returns through prudent and disciplined capital management. This will be achieved by:
> Further diversifying sources and extending the maturities of debt facilities;
> Maintaining a sustainable level of distributions, being at least to taxable income;
> Targeting gearing levels within 25% - 35%, while acknowledging that gearing may vary from the target in the short term from time to time; and
> Maintaining the BBB+ Standard and Poor’s (“S&P”) credit rating.
For
per
sona
l use
onl
y
34 Investa OffIce fund annual fInancIal RepORt June 2013
Directors’ ReportYear Ended 30 June 2013 (continued)
Business strategies and prospects for future financial years (continued)
Material business risks
> Market cycle – Economic growth and economic environment present risks to tenant vacancies, the availability of funding, the property valuation cycle and interest rates. The mitigation of these risks is discussed further below.
> Vacancy levels – The level of vacancy can impact the Group’s rental returns and market value of its office properties. A high vacancy level is likely to result in lower rental returns and a lower property values. This risk is mitigated by a strong focus on tenant service and amenities to encourage high levels of tenant retention, together with a focus on managing lease expiries in the near to medium term. The Group has current low levels of existing vacancy (4%) and weighted average lease expiry of 4.9 years across the Australian portfolio.
> Property valuation cycle – Conditions prevailing in the general economic environment and the property investment markets in Australia and Europe affect the value of the Group’s property investments located in those markets. Decline in the Group’s property values would increase the Group’s gearing levels, which increases the risk of a breach of financing covenants and may increase borrowing costs. This risk is mitigated by the Group targeting a gearing range with reference to the property valuation cycle and by the Group’s investment in high quality commercial grade office buildings.
Unlike other developed property markets such as the United States of America, United Kingdom, Hong Kong and Singapore, property values in Australia, where 88% of the portfolio is located, have not risen substantially since the impact of the Global Financial Crisis. Whilst economic conditions remain uncertain, Australian commercial property investments are currently attracting significant interest from international investors seeking attractive income returns.
> Availability of funding – The availability of capital funding can impact the Group’s level of liquidity and growth as a shortage of available capital would impact the ability to refinance maturing debt facilities and limit the ability to invest in new or existing assets. This risk is mitigated by the Group continuing to diversity sources of financing, staggering debt maturities and the Group’s target gearing range of 25%-35%.
> Interest rates – The level of interest rates can affect the amount of interest payable on the Group’s debt facilities as well impacting investor sentiment towards property assets and hence market values. Higher interest rates increase interest costs and encourage reduced investment, while low interest rates reduce interest costs and can encourage increased investment activity. Interest payable risk is mitigated by the use of interest rate derivatives based on hedge ratio limit ranges outlined in Note 21(a) of the Financial Statements.
> Exchange rate risk – The Group is exposed to movements in the AUD/EUR exchange rate through its investments in the Dutch Office Fund and Bastion Tower, Belgium. Exchange rate risk is mitigated by the matching of the EUR currency assets with EUR currency borrowings. At 30 June 2013, on a look through basis 83% of the value of the Group’s European investment had been hedged with EUR denominated liabilities.
The Group is exposed to movements in the AUD/USD exchange rate through its issue of the US$125.0 million USPP in August 2013. Exchange rate risk is mitigated by the use of a cross currency swap, which minimises both the interest rate and exchange rate risk on these borrowings.
> Euro zone deterioration – The growth outlook within the Euro zone can impact rental and investment returns in the Group’s European investments and its ability to exit these investments. The Responsible Entity intends to exit these investments as soon as market conditions allow, with a sale program underway for the Bastion Tower, Belgium investment.
future financial prospects
The Group’s portfolio is continuing to transition to a 100% Australian portfolio with the aim of selling the Belgian investment, Bastion Tower in the forthcoming year. The exit options and strategies for the DOF investment continue to be assessed by the Responsible Entity. Assuming the sale of Bastion Tower in the near term, the Group’s residual investment in Europe will represent 9% of the overall Group investment portfolio.
The Australian economy is currently experiencing a challenging economic environment as the growth in the resource sector slows. As a result of a slowing economy and continued economic uncertainty offshore, business confidence levels are low. Cost reduction is a key business focus and unemployment is rising. This environment has led to many businesses reducing the amount of office space they occupy and has led to an increase in vacancy rates across the major office markets of Australia. According to the Property Council of Australia, the central business district vacancy rate across Australia as at 30 June 2013 stood at 10.1% (30 June 2012: 7.3%). Current vacancy levels are now at or around long term average level.
With the significant amount of space leased in the Group’s Australian portfolio over the past 24 months, the Group is somewhat isolated from the current weak levels of tenant demand, particularly in Sydney and Melbourne where only 5% of the Group’s income is subject to lease expiry over the period to 30 June 2014. The Group’s key income risk is at 140 Creek Street, Brisbane where the ATO will vacate 10,497sqm in February 2014. This building will be subject to a major upgrade including a new foyer and lifts and the ATO floors will be fully refurbished to maximise the potential for re-letting this space.
While interest rate risk exists, the Group’s exposure to movements in interest rates is managed through risk management techniques, which reduces interest rate volatility to a level where it is not considered to have an adverse effect on the ability of the Responsible Entity to meet its business objectives for the Group.
The Group has $234.3 million in undrawn debt capacity and has proven the ability to raise new debt in the market, as supported by the following activity that has taken place during the 30 June 2013 financial year:
> The issue of the A$125.0 million MTN;
> The arranging of a US$125.0 million USPP; and
> Entering into new debt facility agreements, providing the Group the ability to draw an additional $150.0 million.
For
per
sona
l use
onl
y

35A
nn
ua
l Rep
ort
Go
verna
nce
GR
I Ind
exF
ina
ncia
l S
tatemen
tsS
up
plem
enta
ry In
form
ation
earnings guidance
The Group’s 30 June 2014 forecast earnings guidance (based on Property Council FFO) is 26.5 cents per unit (30 June 2013: 25.0 cents) with a full year distribution of 18.50 cents per unit (30 June 2013: 17.75 cents). This guidance is subject to prevailing market conditions and assumes no acquisitions or disposals other than the sale of Bastion Tower, Belgium.
Events occurring after the reporting period
The settlement of the 99 Walker Street, North Sydney acquisition occurred on 24 July 2013 for a purchase price of $124.9 million plus settlement adjustments and transaction costs.
The USPP settled on 12 August 2013 with funds, amounting to AUD$128.9 million as at that date, used to repay the Group and Prime’s existing syndicated bank debt.
The Directors of the Responsible Entity are not aware of any other matter or circumstance not otherwise dealt within this report or the financial report that has significantly or may significantly affect the operations of the Group or Prime, the results of those operations, or state of the Group’s or Prime’s affairs in future financial periods.
interests in the Trusts
Movement in units during the year is set out below:
Investa Office Fund
Prime Credit Property Trust
30 June 2013
$m
30 June 2012 $m1
30 June 2013
$m
30 June 2012 $m1
Units on issue at the beginning of the year 614.1 682.3 614.1 682.3
Unit buyback – (68.2) – (68.2)
units on issue at the end of the year 614.1 614.1 614.1 614.1
1. Units have been restated for the 1-for-4 unit consolidation which occurred during the 30 June 2012 year. For further details refer to Note 16(d) of the Financial Statements.
Investa Listed Funds Management Limited and its associates had the following interest in the Trusts as at 30 June 2013:
Number of units held
Investa Office Fund
Prime Credit Property Trust
30 June 2013 ’000
30 June 2012 ’000
30 June 2013 ’000
30 June 2012 ’000
Investa Listed Funds Management Limited 17,055 17,055 17,055 17,055
Post Sale Portfolio Issuer Pty Limited 10,576 – 10,576 –
27,631 17,055 27,631 17,055
For
per
sona
l use
onl
y

36 Investa OffIce fund annual fInancIal RepORt June 2013
Directors’ ReportYear Ended 30 June 2013 (continued)
interests of Directors of the Responsible Entity
Units in the Trusts held by Directors of Investa Listed Funds Management Limited as at 30 June 2013 were:
Number of units
Deborah Page AM 16,125
Peter Dodd 19,902
Scott MacDonald 74,450
Ming Long 15,000
Environmental regulation
The Directors of the Responsibility Entity are satisfied that adequate systems are in place for the management of the Trusts’ environmental responsibility and compliance with various license requirements and regulations. Further, the Directors are not aware of any material breaches of these requirements and, to the best of their knowledge; all activities have been undertaken in compliance with environmental requirements.
indemnification and insurance of officers and the auditor
The officers of the Responsible Entity are covered under an insurance policy maintained by Investa Property Group Holdings Pty Limited on behalf of all its subsidiaries, including the Responsible Entity. Premiums for the insurance policies relating to its officers are paid for by Investa Properties Pty Limited and then charged back to the Responsible Entity and not the Group. Furthermore, the Responsible Entity may indemnify, on a full indemnity basis and to the full extent permitted by the law, each officer against all losses or liabilities incurred by the person as an officer of the Responsible Entity.
PricewaterhouseCoopers (“PwC”) as auditor the Group is not indemnified out of the assets of the Group.
Other information
The Australian Taxation Office (“ATO”) is conducting an audit of the income tax returns for the financial years of 2009 and 2010 for the Fund and financial years of 2008, 2009 and 2010 for Prime.
Fees paid and payable to and the number of units in the Trusts held by the Responsible Entity and its associates at the end of the financial year are set out in Note 22 of the Financial Statements.
Audit and non-audit fees
The Directors of the Responsible Entity have adopted a policy governing Auditor Independence which specifies that the auditing firm should not provide services that are or could be perceived to be in conflict with the role of auditor. Each non-audit service is considered in context of this policy. The Responsible Entity may decide to employ the auditor on assignments additional to their statutory audit duties where the auditor’s expertise and experience with the Group and Prime are important.
Details of the amounts paid or payable to the auditor for audit and non-audit services provided are detailed in Note 23 of the Financial Statements.
Auditor’s independence Declaration
A copy of the Auditor’s Independence Declaration as required under section 307C of the Corporations Act 2001 is set out on page 37.
Rounding of amounts
The Trusts are of a kind of entity referred to in Class Order 98/100, issued by the Australian Securities & Investments Commission, relating to the “rounding off” of amounts in the Directors’ report and in the Financial Statements. Amounts in the Directors’ report and the Financial Statements have been rounded off in accordance with that Class Order to the nearest hundred thousand dollars, or in certain cases, the nearest thousand dollars.
This report is made in accordance with a resolution of the Directors.
Deborah Page AM Chairman Sydney 21 August 2013
For
per
sona
l use
onl
y
37A
nn
ua
l Rep
ort
Go
verna
nce
GR
I Ind
exF
ina
ncia
l S
tatemen
tsS
up
plem
enta
ry In
form
ation
Auditor’s independence DeclarationF
or p
erso
nal u
se o
nly

38 Investa OffIce fund annual fInancIal RepORt June 2013
NoteInvesta
Office FundPrime Credit
Property Trust
30 June 2013
$m
30 June 2012
$m
30 June 2013
$m
30 June 2012
$m
Revenue from continuing operations
Rental and other property income 175.3 162.7 81.8 73.3
Distribution received from financial asset at fair value through profit or loss 14.8 16.0 – –
Interest income 0.9 3.7 0.5 11.4
191.0 182.4 82.3 84.7
Other income
Net foreign exchange gain/(loss) 4.8 25.8 1.9 (6.5)
Net gain/(loss) on change in fair value of:
Investment properties 39.4 78.8 14.0 48.1
Derivative financial instruments (5.7) (11.3) (4.0) (1.2)
Loss on financial asset at fair value through profit or loss 9 (23.0) (28.9) – –
Net (loss)/gain on disposal of investments – (0.7) – 0.3
Share of net profit of equity accounted investments 12 41.9 13.8 40.8 5.4
Loss on transfer of equity accounted investments to assets held for sale 5 (1.3) – – –
Total income 247.1 259.9 135.0 130.8
Expenses
Property expenses (40.8) (38.0) (20.9) (18.6)
Responsible Entity’s fees (9.4) (8.6) (5.2) (4.7)
Finance costs (32.2) (15.7) (10.4) (2.8)
Fair value loss of acquisition costs on equity accounted investments 12 – (12.2) – (12.2)
Other expenses (3.0) (2.8) (0.9) (1.1)
Total expenses (85.4) (77.3) (37.4) (39.4)
Profit before income tax 161.7 182.6 97.6 91.4
Income tax expense 6 (2.4) (0.7) (0.5) –
Profit from continuing operations for the year 159.3 181.9 97.1 91.4
Loss from discontinuing operations for the year 5 (0.6) (73.4) (0.6) (73.4)
Profit for the year 158.7 108.5 96.5 18.0
Net profit attributable to external non-controlling interests – (6.6) – (6.6)
Net profit attributable to unitholders 158.7 101.9 96.5 11.4
Attributable to unitholders of:
Armstrong Jones Office Fund 62.2 90.5 – –
Prime Credit Property Trust 96.5 11.4 96.5 11.4
158.7 101.9 96.5 11.4
Distributions and earnings per unit
Distributions per unit 3 17.75 17.50 9.75 9.20
Basic and diluted earnings per unit from net profit from continuing operations:
Per stapled unit 4 25.9 28.6 na na
Per unit of each trust 4 10.1 14.2 15.8 14.4
Basic and diluted earnings per unit from net profit:
Per stapled unit 4 25.8 16.0 na na
Per unit of each trust 4 10.1 14.2 15.7 1.8
The above Consolidated Income Statements should be read in conjunction with the accompanying notes.
Consolidated income StatementsFor the year ended 30 June 2013
For
per
sona
l use
onl
y
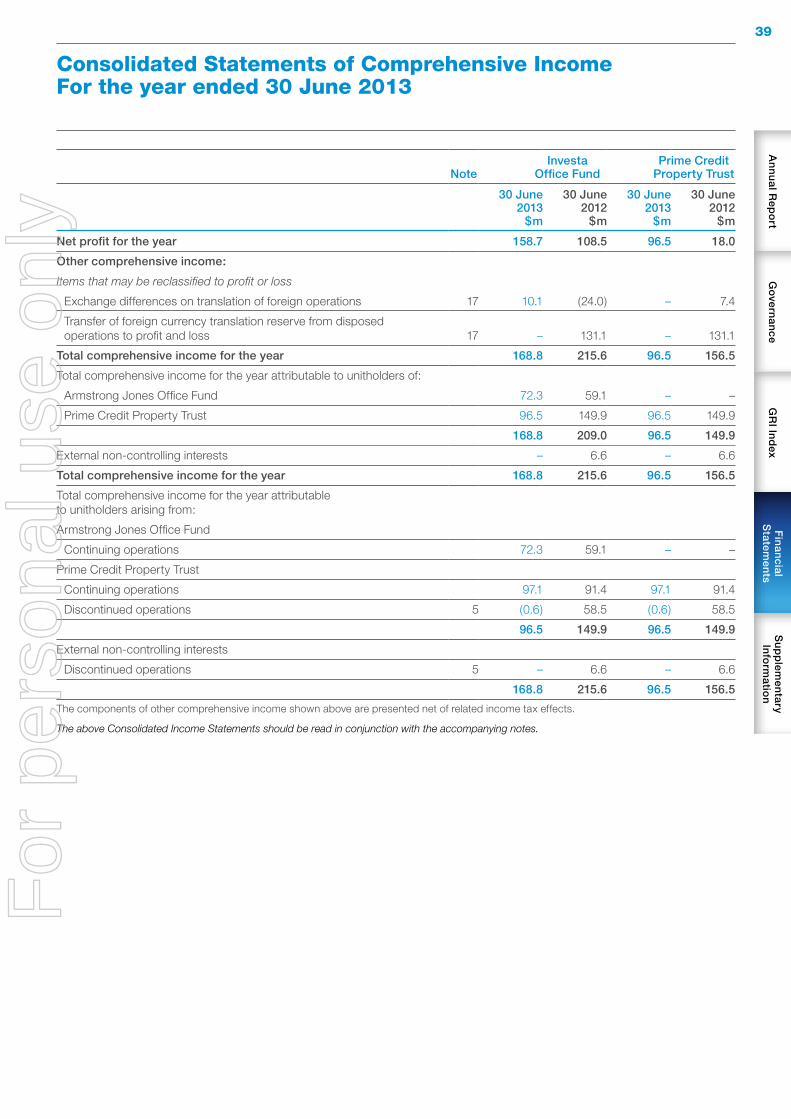
39A
nn
ua
l Rep
ort
Go
verna
nce
GR
I Ind
exF
ina
ncia
l S
tatemen
tsS
up
plem
enta
ry In
form
ation
Consolidated Statements of Comprehensive income For the year ended 30 June 2013
NoteInvesta
Office FundPrime Credit
Property Trust
30 June 2013
$m
30 June 2012
$m
30 June 2013
$m
30 June 2012
$m
Net profit for the year 158.7 108.5 96.5 18.0
Other comprehensive income:
Items that may be reclassified to profit or loss
Exchange differences on translation of foreign operations 17 10.1 (24.0) – 7.4
Transfer of foreign currency translation reserve from disposed operations to profit and loss 17 – 131.1 – 131.1
Total comprehensive income for the year 168.8 215.6 96.5 156.5
Total comprehensive income for the year attributable to unitholders of:
Armstrong Jones Office Fund 72.3 59.1 – –
Prime Credit Property Trust 96.5 149.9 96.5 149.9
168.8 209.0 96.5 149.9
External non-controlling interests – 6.6 – 6.6
Total comprehensive income for the year 168.8 215.6 96.5 156.5
Total comprehensive income for the year attributable to unitholders arising from:
Armstrong Jones Office Fund
Continuing operations 72.3 59.1 – –
Prime Credit Property Trust
Continuing operations 97.1 91.4 97.1 91.4
Discontinued operations 5 (0.6) 58.5 (0.6) 58.5
96.5 149.9 96.5 149.9
External non-controlling interests
Discontinued operations 5 – 6.6 – 6.6
168.8 215.6 96.5 156.5
The components of other comprehensive income shown above are presented net of related income tax effects.
The above Consolidated Income Statements should be read in conjunction with the accompanying notes.
For
per
sona
l use
onl
y

40 Investa OffIce fund annual fInancIal RepORt June 2013
Consolidated Statements of Financial PositionAs at 30 June 2013
NoteInvesta Office
FundPrime Credit
Property Trust
30 June 2013
$m
30 June 2012
$m
30 June 2013
$m
30 June 2012
$m
Current assets
Cash and cash equivalents 7 12.4 18.2 1.9 6.6
Trade and other receivables 8 7.6 2.6 6.6 2.1
Derivative financial instruments 10 4.5 5.0 0.1 1.0
24.5 25.8 8.6 9.7
Assets classified as held for sale 5 60.2 26.2 0.8 5.0
84.7 52.0 9.4 14.7
Non-current assets
Trade and other receivables 8 25.6 3.0 16.2 3.0
Investment properties 11 1,926.8 1,770.7 881.3 770.4
Investments accounted for using the equity method 12 427.6 425.3 427.6 394.3
Financial asset at fair value through profit or loss 9 257.3 247.2 – –
Derivative financial instruments 10 1.8 4.4 1.8 –
2,639.1 2,450.6 1,326.9 1,167.7
Total assets 2,723.8 2,502.6 1,336.3 1,182.4
Current liabilities
Trade and other payables 13 24.7 24.9 13.2 13.9
Derivative financial instruments 10 – 0.4 – –
Distribution payable 3 55.3 59.6 30.7 24.6
80.0 84.9 43.9 38.5
Liabilities directly associated with assets classified as held for sale 5 27.6 23.4 0.4 2.9
107.6 108.3 44.3 41.4
Non-current liabilities
Borrowings 14 616.5 457.8 176.8 67.3
Derivative financial instruments 10 13.1 9.5 4.9 –
Deferred tax liabilities 15 – 0.2 – –
629.6 467.5 181.7 67.3
Total liabilities 737.2 575.8 226.0 108.7
Net assets 1,986.6 1,926.8 1,110.3 1,073.7
Equity
Contributed equity 16 2,142.3 2,142.3 1,193.8 1,193.8
Reserves 17 (105.3) (115.4) – –
Accumulated losses 18 (50.4) (100.1) (83.5) (120.1)
Total equity 1,986.6 1,926.8 1,110.3 1,073.7
Attributable to unitholders of: Armstrong Jones Office Fund
Contributed equity 948.5 948.5 – –
Reserves (105.3) (115.4) – –
Retained earnings 33.1 20.0 – –
876.3 853.1 – –
Prime Credit Property Trust 1,110.3 1,073.7 1,110.3 1,073.7
Total equity 1,986.6 1,926.8 1,110.3 1,073.7
The above Consolidated Statements of Financial Position should be read in conjunction with the accompanying notes.
For
per
sona
l use
onl
y

41A
nn
ua
l Rep
ort
Go
verna
nce
GR
I Ind
exF
ina
ncia
l S
tatemen
tsS
up
plem
enta
ry In
form
ation
Consolidated Statements of Changes in EquityFor the year ended 30 June 2013
Investa Office Fund Note Attributable to unitholders
Contributed equity
$mReserves
$m
Accumulated losses
$mTotal
$m
External non-controlling
interests $m
Total equity
$m
Balance at 1 July 2011 2,308.2 (222.5) (92.5) 1,993.2 23.6 2,016.8
Net profit for the year – – 101.9 101.9 6.6 108.5
Other comprehensive income 17 – 107.1 – 107.1 – 107.1
Total comprehensive income for the year – 107.1 101.9 209.0 6.6 215.6
Transactions with unitholders in their capacity as equity holders:
Buyback of units 16 (165.9) – – (165.9) – (165.9)
Non-controlling interest within disposal of subsidiary – – – – (29.9) (29.9)
Distributions paid or payable 3 – – (109.5) (109.5) (0.3) (109.8)
(165.9) – (109.5) (275.4) (30.2) (305.6)
Balance at 30 June 2012 2,142.3 (115.4) (100.1) 1,926.8 – 1,926.8
Balance at 1 July 2012 2,142.3 (115.4) (100.1) 1,926.8 – 1,926.8
Net profit for the year – – 158.7 158.7 – 158.7
Other comprehensive income 17 – 10.1 – 10.1 – 10.1
Total comprehensive income for the year – 10.1 158.7 168.8 – 168.8
Transactions with unitholders in their capacity as equity holders:
Distributions paid or payable 3 – – (109.0) (109.0) – (109.0)
– – (109.0) (109.0) – (109.0)
Balance at 30 June 2013 2,142.3 (105.3) (50.4) 1,986.6 – 1,986.6
The above Consolidated Statements of Changes in Equity should be read in conjunction with the accompanying notes.
For
per
sona
l use
onl
y
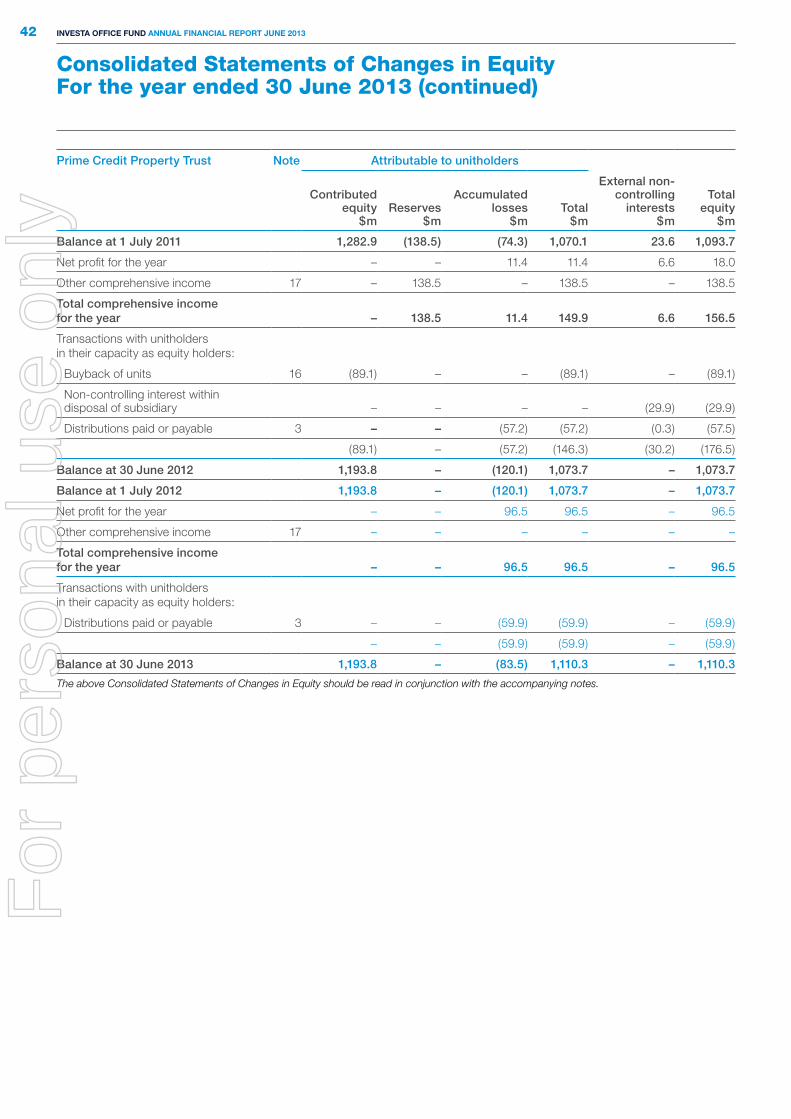
42 Investa OffIce fund annual fInancIal RepORt June 2013
Prime Credit Property Trust Note Attributable to unitholders
Contributed equity
$mReserves
$m
Accumulated losses
$mTotal
$m
External non-controlling
interests $m
Total equity
$m
Balance at 1 July 2011 1,282.9 (138.5) (74.3) 1,070.1 23.6 1,093.7
Net profit for the year – – 11.4 11.4 6.6 18.0
Other comprehensive income 17 – 138.5 – 138.5 – 138.5
Total comprehensive income for the year – 138.5 11.4 149.9 6.6 156.5
Transactions with unitholders in their capacity as equity holders:
Buyback of units 16 (89.1) – – (89.1) – (89.1)
Non-controlling interest within disposal of subsidiary – – – – (29.9) (29.9)
Distributions paid or payable 3 – – (57.2) (57.2) (0.3) (57.5)
(89.1) – (57.2) (146.3) (30.2) (176.5)
Balance at 30 June 2012 1,193.8 – (120.1) 1,073.7 – 1,073.7
Balance at 1 July 2012 1,193.8 – (120.1) 1,073.7 – 1,073.7
Net profit for the year – – 96.5 96.5 – 96.5
Other comprehensive income 17 – – – – – –
Total comprehensive income for the year – – 96.5 96.5 – 96.5
Transactions with unitholders in their capacity as equity holders:
Distributions paid or payable 3 – – (59.9) (59.9) – (59.9)
– – (59.9) (59.9) – (59.9)
Balance at 30 June 2013 1,193.8 – (83.5) 1,110.3 – 1,110.3
The above Consolidated Statements of Changes in Equity should be read in conjunction with the accompanying notes.
Consolidated Statements of Changes in EquityFor the year ended 30 June 2013 (continued)
For
per
sona
l use
onl
y
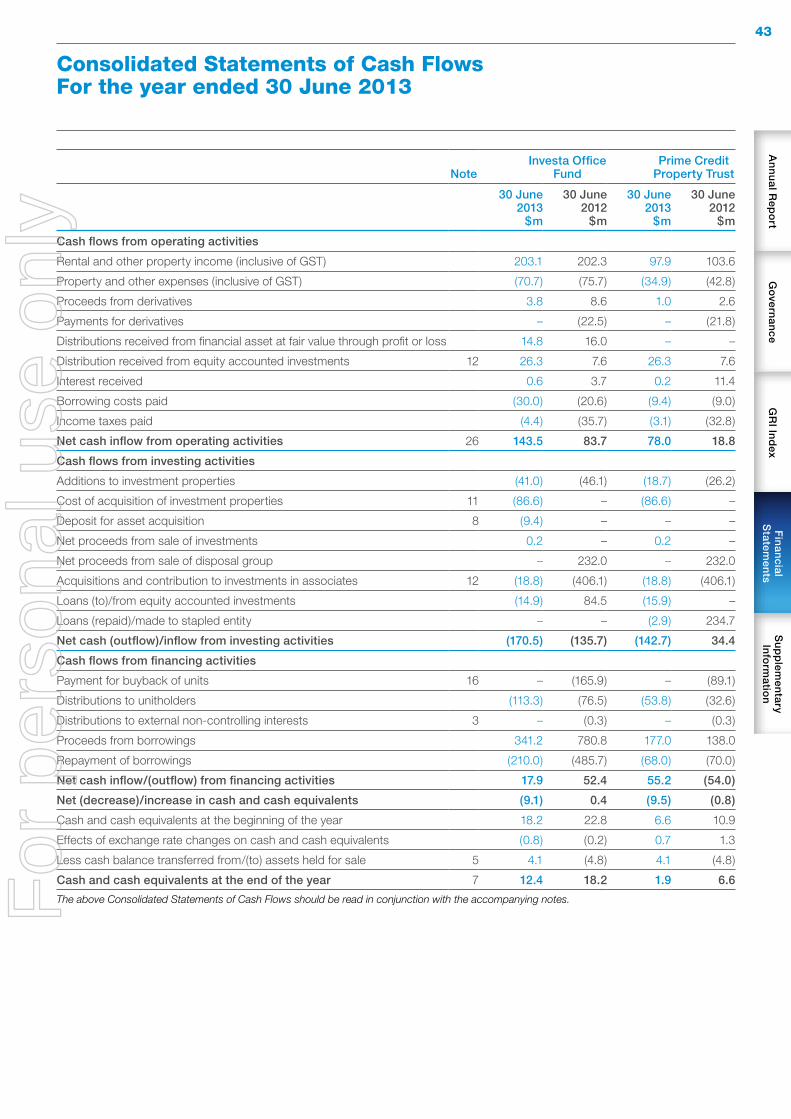
43A
nn
ua
l Rep
ort
Go
verna
nce
GR
I Ind
exF
ina
ncia
l S
tatemen
tsS
up
plem
enta
ry In
form
ation
NoteInvesta Office
FundPrime Credit
Property Trust
30 June 2013
$m
30 June 2012
$m
30 June 2013
$m
30 June 2012
$m
Cash flows from operating activities
Rental and other property income (inclusive of GST) 203.1 202.3 97.9 103.6
Property and other expenses (inclusive of GST) (70.7) (75.7) (34.9) (42.8)
Proceeds from derivatives 3.8 8.6 1.0 2.6
Payments for derivatives – (22.5) – (21.8)
Distributions received from financial asset at fair value through profit or loss 14.8 16.0 – –
Distribution received from equity accounted investments 12 26.3 7.6 26.3 7.6
Interest received 0.6 3.7 0.2 11.4
Borrowing costs paid (30.0) (20.6) (9.4) (9.0)
Income taxes paid (4.4) (35.7) (3.1) (32.8)
Net cash inflow from operating activities 26 143.5 83.7 78.0 18.8
Cash flows from investing activities
Additions to investment properties (41.0) (46.1) (18.7) (26.2)
Cost of acquisition of investment properties 11 (86.6) – (86.6) –
Deposit for asset acquisition 8 (9.4) – – –
Net proceeds from sale of investments 0.2 – 0.2 –
Net proceeds from sale of disposal group – 232.0 – 232.0
Acquisitions and contribution to investments in associates 12 (18.8) (406.1) (18.8) (406.1)
Loans (to)/from equity accounted investments (14.9) 84.5 (15.9) –
Loans (repaid)/made to stapled entity – – (2.9) 234.7
Net cash (outflow)/inflow from investing activities (170.5) (135.7) (142.7) 34.4
Cash flows from financing activities
Payment for buyback of units 16 – (165.9) – (89.1)
Distributions to unitholders (113.3) (76.5) (53.8) (32.6)
Distributions to external non-controlling interests 3 – (0.3) – (0.3)
Proceeds from borrowings 341.2 780.8 177.0 138.0
Repayment of borrowings (210.0) (485.7) (68.0) (70.0)
Net cash inflow/(outflow) from financing activities 17.9 52.4 55.2 (54.0)
Net (decrease)/increase in cash and cash equivalents (9.1) 0.4 (9.5) (0.8)
Cash and cash equivalents at the beginning of the year 18.2 22.8 6.6 10.9
Effects of exchange rate changes on cash and cash equivalents (0.8) (0.2) 0.7 1.3
Less cash balance transferred from/(to) assets held for sale 5 4.1 (4.8) 4.1 (4.8)
Cash and cash equivalents at the end of the year 7 12.4 18.2 1.9 6.6
The above Consolidated Statements of Cash Flows should be read in conjunction with the accompanying notes.
Consolidated Statements of Cash FlowsFor the year ended 30 June 2013
For
per
sona
l use
onl
y

44 Investa OffIce fund annual fInancIal RepORt June 2013
Notes to the Consolidated Financial Statements For the year ended 30 June 2013
1. Summary of significant accounting policies
(a) the Group
The Investa Office Fund (the “Group”) was formed on 1 January 2000 by the stapling of the units in two Australian registered schemes, Armstrong Jones Office Fund (the “Fund” or the “Parent”) and Prime Credit Property Trust (“Prime”) (collectively defined as “the Trusts”). The Fund and Prime were constituted on 23 September 1984 and 12 October 1989, respectively.
The Responsible Entity for the Fund and Prime for the period from 1 July 2011 to 8 July 2011 was ING Management Limited (“IML”). IML is an Australian domiciled company and is a wholly owned company within the ING Group NV group of companies. On 8 July 2011 Investa Listed Funds Management Limited (“ILFML”) replaced IML as the Responsible Entity for the Fund and Prime.
The accounting policies that have been adopted in respect of this Annual Financial Report are those of Investa Listed Funds Management Limited (“ILFML”) as Responsible Entity for the Fund and Prime.
The Fund and Prime have common business objectives and operate as an economic entity collectively known as Investa Office Fund. The accounting policies included in this note apply to the Group as well as the Fund and Prime, unless otherwise noted.
The stapling structure will cease to operate on the first to occur of:
(i) subject to approval by a special resolution of the members of the Fund and Prime, the date determined by the trustee of the Fund or Prime as the unstapling date; or
(ii) the termination of either of the Fund or Prime.
The Australian Securities Exchange reserves the right (but without limiting its absolute discretion) to remove the Fund or Prime, or both, from the official list if any of their units cease to be stapled together, or any equity securities are issued by the Fund or Prime which are not stapled to equivalent securities in the Fund or Prime.
The Directors of the Responsible Entity have authorised the Annual Financial Report for issue and have the power to amend and reissue the Annual Financial Report.
(b) Basis of preparation
These general purpose Financial Statements have been prepared in accordance with Accounting Standards and other pronouncements of the Australian Accounting Standards Board (“AASB”), Urgent Issues Group (“UIG”) Interpretations and the Corporations Act 2001. The Investa Office Fund is a for-profit entity for the purpose of preparing the Financial Statements.
In accordance with Accounting Standard AASB 3 Business Combinations, the stapling arrangement discussed above is regarded as a business combination and Armstrong Jones Office Fund has been identified as the Parent for preparing Consolidated Financial Reports.
As permitted by Class Order 05/642, issued by the Australian Securities and Investments Commission, this Annual Financial Report is a combined financial report that presents the Consolidated Financial Statements and accompanying notes of both the Investa Office Fund (being the Consolidated Financial Statements and notes of the Group) and the Prime Credit Property Trust.
This Annual Financial Report is presented in Australian dollars unless otherwise stated.
(i) Compliance with IFRS
The Consolidated Financial Statements comply with International Financial Reporting Standards (“IFRS”) as issued by International Accounting Standards Board (“IASB”).
(ii) Historical cost convention
These Financial Statements are prepared on the historical cost conventions, as modified by the revaluation of financial assets and liabilities (including derivative financial instruments) and investment property, which are measured at fair value.
(iii) Going Concern
These Consolidated Financial Statements are prepared on the going concern basis. In preparing these Consolidated Financial Statements the Directors note that the Group and Prime are in a net current asset deficiency position due to the provision for distribution and minimising cash and cash equivalents. It is the policy of the Group and Prime to use surplus cash to repay debt, and the Group and Prime have the ability to drawdown funds to pay the distribution on 30 August 2013. Refer to Note 14 for details of the Group’s and Prime’s borrowings.
(iv) Critical accounting estimates
The preparation of financial statements requires the use of certain critical accounting estimates. It also requires the Responsible Entity to exercise its judgement in the process of applying the accounting policies adopted in this Annual Financial Report. The areas involving a higher degree of judgement or complexity, or areas where assumptions and estimates are significant to the Financial Statements are disclosed in Note 2.
(v) New and amended standards adopted by the Responsible Entity
None of the new standards and amendments to standards that are mandatory for the first time for the financial year beginning 1 July 2012 affected any of the amounts recognised in the current period or any prior period and are not likely to affect future periods. However, amendments made to AASB 101 Presentation of Financial Statements effective 1 July 2012 now require the statement of comprehensive income to show the items of comprehensive income grouped into those that are not permitted to be reclassified to profit or loss in a future period and those that may have to be reclassified if certain conditions are met.
(vi) Early adoption of standards
The Responsible Entity has elected not to apply any pronouncements before their operative date in the annual reporting period beginning 1 July 2012.
For
per
sona
l use
onl
y

45A
nn
ua
l Rep
ort
Go
verna
nce
GR
I Ind
exF
ina
ncia
l S
tatemen
tsS
up
plem
enta
ry In
form
ation
(c) principles of consolidation
(i) Subsidiaries
The Consolidated Financial Statements of Investa Office Fund incorporate the assets and liabilities of all subsidiaries of Armstrong Jones Office Fund (the Parent) and its subsidiaries (including Prime and its subsidiaries) as at 30 June 2013 and the results of all subsidiaries for the year then ended. Prime’s Consolidated Financial Statements comprise Prime and its subsidiaries as at 30 June 2013 and the results of all subsidiaries for the year then ended.
Subsidiaries are all entities (including special purpose entities) over which the Group has the power to govern the financial and operating policies, generally accompanying a holding of greater than one-half of the voting rights. The existence and effect of potential voting rights that are currently exercisable or convertible are considered when assessing whether the Group controls another entity.
Subsidiaries are fully consolidated from the date on which control is transferred to the Group. They are de-consolidated from the date that control ceases.
The acquisition method of accounting is used to account for business combinations by the Group.
Intercompany transactions, balances and unrealised gains on transactions between Group companies are eliminated. Unrealised losses are also eliminated unless the transaction provides evidence of the impairment of the asset transferred. Accounting policies of subsidiaries are consistent with the policies adopted by the Group.
Non-controlling interests in the results and equity of subsidiaries are shown separately in the Consolidated Income Statements, Statements of Comprehensive Income, Consolidated Statements of Changes in Equity and Consolidated Statements of Financial Position respectively.
(ii) Associates
Associates are all entities over which the Group has significant influence but not control or joint control, generally accompanying a holding of between 20% and 50% of the voting rights. Investments in associates are accounted for using the equity method of accounting, after initially being recognised at cost.
The Group’s share of its associates’ post-acquisition profits or losses is recognised in profit or loss, and its share of post-acquisition other comprehensive income is recognised in other comprehensive income. The cumulative post-acquisition movements are adjusted against the carrying amount of the investment. Dividends or distributions receivable from associates are recognised as a reduction in the carrying amount of the investment.
When the Group’s share of losses in an associate equals or exceeds its interest in the associate, including any other unsecured long-term receivables, the Group does not recognise further losses, unless it has incurred obligations or made payments on behalf of the associate.
Unrealised gains on transactions between the Group and its associates are eliminated to the extent of the Group’s interest in the associates. Unrealised losses are also eliminated unless the transaction provides evidence of an impairment of the asset transferred. Accounting policies of associates have been changed where necessary to ensure consistency with the policies adopted by the Group.
(iii) Joint venture assets
The Group’s proportionate interests in the assets, liabilities, revenues and expenses of a joint venture activity have been incorporated in the Financial Statements under the appropriate headings.
(d) segment reporting
Operating segments are reported in a manner consistent with the internal reporting provided to the chief operating decision maker. The chief operating decision maker, who is responsible for allocating resources and assessing performance of the operating segments, has been identified as the Directors of the Responsibility Entity.
(e) foreign currency translation
(i) Functional and presentation currency
Items included in the Financial Statements of each of the Group’s entities are measured using the currency of the primary economic environment in which the entity operates (‘the functional currency’). The Consolidated Financial Statements are presented in Australian dollars, which is the Fund’s functional and presentational currency.
(ii) Transactions and balances
Foreign currency transactions are translated into the functional currency using the exchange rates prevailing at the dates of the transactions. Foreign exchange gains and losses resulting from the settlement of such transactions and from the translation at year end exchange rates of monetary assets and liabilities denominated in foreign currencies are recognised in profit or loss, except when they are deferred in equity as qualifying cash flow hedges and qualifying net investment hedges or are attributable to part of the net investment in a foreign operation.
All other foreign exchange gains and losses are presented in the Consolidated Income Statements on a net basis within other income or other expenses.
Non-monetary items that are measured at fair value in a foreign currency are translated using the exchange rates at the date when the fair value was determined. Translation differences on assets and liabilities carried at fair value are reported as part of the fair value gain or loss. For example, translation differences on non-monetary assets and liabilities such as equities held at fair value through profit or loss are recognised in profit or loss as part of the fair value gain or loss and translation differences on non-monetary assets such as equities classified as available-for-sale financial assets are recognised in other comprehensive income.
For
per
sona
l use
onl
y
Notes to the Consolidated Financial StatementsFor the year ended 30 June 2013 (continued)
46 Investa OffIce fund annual fInancIal RepORt June 2013
(iii) Group entities
The results and financial position of foreign operations (none of which has the currency of a hyperinflationary economy) that have a functional currency different from the presentation currency are translated into the presentation currency as follows:
> assets and liabilities for each balance sheet presented are translated at the closing rate at the date of that Statement of Financial Position.
> income and expenses for each Income Statement and Statement of Comprehensive Income are translated at average exchange rates (unless this is not a reasonable approximation of the cumulative effect of the rates prevailing on the transaction dates, in which case income and expenses are translated at the dates of the transactions); and
> all resulting exchange differences are recognised in other comprehensive income.
On consolidation, exchange differences arising from the translation of any net investment in foreign entities, and of borrowings and other financial instruments designated as hedges of such investments, are recognised in other comprehensive income. When a foreign operation is sold, the associated exchange differences are reclassified to profit or loss, as part of the gain or loss on sale.
Goodwill and fair value adjustments arising on the acquisition of a foreign operation are treated as assets and liabilities of the foreign operation and translated at the closing rate.
(f) Revenue recognition
Revenue is measured at the fair value of the consideration received or receivable. Amounts disclosed as revenue are net of returns, trade allowances, rebates and amounts collected on behalf of third parties.
The Group recognises revenue when the amount of revenue can be reliably measured, it is probable that future economic benefits will flow to the entity and specific criteria have been met for each of the Group’s activities as described below. The Group bases its estimates on historical results, taking into consideration the type of customer, the type of transaction and the specifics of each arrangement.
Revenue is recognised for the major business activities as follows:
(i) Rental and other property income
Rental income from operating leases is recognised in income on a straight-line basis over the lease term. An asset is recognised to represent the portion of the operating lease revenue in a reporting period relating to fixed increases in operating lease rentals in future periods.
(ii) Disposal of assets
The gain or loss on disposal is recognised when title to the benefits and risks has effectively passed. The gain or loss on disposal of revalued assets is calculated as the difference between the carrying amount of the asset at the time of the disposal and the consideration received.
(iii) Interest Income
Interest income is recognised using the effective interest method. When a receivable is impaired, the Group reduces the carrying amount to its recoverable amount, being the estimated future cash flow discounted at the original effective interest rate of the instrument, and continues unwinding the discount as interest income. Interest income on impaired loans is recognised using the original effective interest rate.
(iv) Distributions
Distributions are recognised as revenue when the right to receive payment is established. This applies even if they are paid out of pre-acquisition profits. However, the investment may need to be tested for impairment as a consequence, refer Note 1(p).
(g) expenses
(i) Property Expenses
Property expenses include rates, leasing fees, taxes and other property outgoings incurred in relation to investment properties where such expenses are recognised as expenses on an accrual basis.
(ii) Finance costs
Finance costs include interest expense and the amortisation of other costs incurred in respect of obtaining finance. Other costs incurred, including loan establishment fees in respect of obtaining finance, are deferred and expensed over the term of the respective agreement.
(iii) Responsible Entity’s fee
In accordance with the provisions of the Fund and Prime’s Constitutions, the Responsible Entity is entitled to payment of a fee per annum as disclosed in Note 22. The fee is recognised in the Consolidated Income Statements on an accrual basis.
(iv) Other expenses
All other expenses are recognised in the Consolidated Income Statements on an accruals basis.
(h) cash and cash equivalents
For the purpose of presentation in the Statement of Cash Flow, cash and cash equivalents include cash on hand, deposits held at call with financial institutions, other short-term, highly liquid investments with original maturities of 3 months or less that are readily convertible to known amounts of cash and which are subject to an insignificant risk of changes in value.
1. Summary of significant accounting policies (continued)
For
per
sona
l use
onl
y

47A
nn
ua
l Rep
ort
Go
verna
nce
GR
I Ind
exF
ina
ncia
l S
tatemen
tsS
up
plem
enta
ry In
form
ation
(i) trade and other receivables
Trade receivables are recognised initially at fair value and subsequently measured at amortised cost using the effective interest method, less provision for impairment. Trade receivables are generally due for settlement within 30 days. They are presented as current assets unless collection is not expected for greater than 12 months after the reporting date.
Collectability of trade receivables is reviewed on an ongoing basis. Debts which are known to be uncollectible are written off by reducing the carrying amount directly. An allowance account (provision for impairment of trade receivables) is used when there is objective evidence that the Group will not be able to collect all amounts due according to the original terms of the receivables. Significant financial difficulties of the debtor, probability that the debtor will enter bankruptcy or financial reorganisation, and default or delinquency in payments (greater than 30 days overdue) are considered indicators that the trade receivable is impaired. The amount of the impairment allowance is the difference between the asset’s carrying amount and the present value of estimated future cash flows, discounted at the original effective interest rate. Cash flows relating to short-term receivables are not discounted if the effect of discounting is immaterial.
The amount of the impairment loss is recognised in profit or loss. When a trade receivable for which an impairment allowance had been recognised becomes uncollectible in a subsequent period, it is written off against the allowance account. Subsequent recoveries of amounts previously written off are credited in profit or loss.
(j) assets and liabilities held for sale and discontinued operations
Non-current assets (or disposal groups) are classified as held for sale if their carrying amount will be recovered principally through a sale transaction rather than continuing use and a sale is considered highly probable. They are measured at the lower of their carrying amount and fair value less costs to sell, except for assets such as deferred tax assets and liabilities, financial assets and investment property that are carried at fair value.
An impairment loss is recognised for any initial impairment or subsequent write-down of the asset (or disposal group) to fair value less costs to sell. A gain is recognised for any subsequent increases in fair value less costs to sell of an asset (or disposal group), but not in excess of any cumulative impairment loss previously recognised. A gain or loss not previously recognised by the date of the sale of the non-current asset (or disposal group) is recognised at the date of derecognition.
Interest and other expenses attributable to the liabilities of a disposal group classified as held for sale continue to be recognised.
Non-current assets classified as held for sale and the assets of a disposal group classified as held for sale are presented separately from the other assets in the Statements of Financial Position. The liabilities of a disposal group classified as held for sale are presented separately from other liabilities in the Statements of Financial Position.
A discontinued operation is a component of the entity that has been disposed of or is classified as held for sale and that represents a separate major line of business or geographical area of operations, is part of a single co-ordinated plan to dispose of such a line of business or area of operations, or is a subsidiary acquired exclusively with a view to resale. The results of discontinued operations are presented separately in the Income Statements. Comparatives are also adjusted to show the results of a discontinued operation separately in the Income Statements.
(k) acquisition of assets and business combinations
The acquisition method of accounting is used to account for all acquisitions of assets, including business combinations, regardless of whether equity instruments or other assets are acquired. The consideration transferred for the acquisition of a subsidiary comprises the fair value of the assets transferred, the liabilities incurred and the equity interests issued by the Group. The consideration transferred also includes the fair value of any asset or liability resulting from a contingent consideration arrangement and the fair value of any pre-existing equity interest in the subsidiary. Acquisition related costs are expensed as incurred. Identifiable assets acquired and liabilities and contingent liabilities assumed in a business combination are, with limited exceptions, measured initially at their fair values at the acquisition date. On an acquisition-by-acquisition basis, the Group recognises any non-controlling interest in the acquiree either at fair value or at the non-controlling interest’s proportionate share of the acquiree’s net identifiable assets.
The excess of the consideration transferred and the amount of any non-controlling interest in the acquiree over the fair value of the net identifiable assets acquired is recorded as goodwill. If those amounts are less than the fair value of the net identifiable assets of the subsidiary acquired and the measurement of all amounts has been reviewed, the difference is recognised directly in profit or loss as a bargain purchase.
Where settlement of any part of cash consideration is deferred, the amounts payable in the future are discounted to their present value as at the date of exchange. The discount rate used is the entity’s incremental borrowing rate, being the rate at which a similar borrowing could be obtained from an independent financier under comparable terms and conditions.
Contingent consideration is classified either as equity or a financial liability. Amounts classified as a financial liability are subsequently remeasured to fair value with changes in fair value recognised in profit or loss.
(l) Investments and other financial instruments
classification
The Group classifies its financial assets in the following categories: loans and receivables and financial assets at fair value through profit or loss. The classification depends on the purpose for which the investments were acquired. Management determines the classification of its investments at initial recognition.
For
per
sona
l use
onl
y
Notes to the Consolidated Financial StatementsFor the year ended 30 June 2013 (continued)
48 Investa OffIce fund annual fInancIal RepORt June 2013
(i) Loans and receivables
Loans and receivables are non-derivative financial assets with fixed or determinable payments that are not quoted in an active market. They are included in current assets, except for those with maturities greater than 12 months after the reporting period which are classified as non-current assets. Receivables to be settled within 30 days are carried at amounts due.
(ii) Financial assets at fair value through profit or loss
As the Group’s derivatives are not designated as hedges, they are classified as financial assets at fair value through profit or loss, refer to Note 1(m). Assets in this category are classified as current assets if they are expected to be settled within 12 months; otherwise they are classified as non-current.
(iii) Financial assets at fair value through profit or loss (on initial recognition)
The Group classifies certain financial assets as financial assets at fair value through profit or loss on initial recognition as this group of financial assets are managed and its performance are evaluated on a fair value basis in accordance with a documented risk management or investment strategy, and information about the group is provided to the Trusts key management personnel. Assets in this category are classified as current assets if they are expected to be settled within 12 months; otherwise they are classified as non-current.
Recognition and de-recognition
Regular way purchases and sales of financial assets are recognised on trade date – the date on which the Group commits to purchase or sell the asset. Financial assets are derecognised when the rights to receive cash flows from the financial assets have expired or have been transferred and the Group has transferred substantially all the risks and rewards of ownership.
Measurement
At initial recognition, the Group measures a financial asset at its fair value plus, in the case of a financial asset not at fair value through profit or loss, transaction costs that are directly attributable to the acquisition of the financial asset. Transaction costs of financial assets carried at fair value through profit or loss are expensed in profit or loss.
Loans and receivables are subsequently carried at amortised cost using the effective interest method.
Financial assets at fair value through profit or loss are subsequently carried at fair value. Gains or losses arising from changes in the fair value of the financial assets at fair value through profit or loss are presented in profit or loss within other income or other expenses in the period in which they arise. Dividend and distribution income from financial assets at fair value through profit or loss is recognised in profit or loss as part of revenue from continuing operations when the Group’s right to receive payments is established. Interest income from these financial assets is included in the net gains/ (losses).
Details of how the fair value of financial instruments is determined are disclosed in Note 2.
Impairment
The Group assesses at the end of each reporting period whether there is objective evidence that a financial asset or group of financial assets is impaired. A financial asset or a group of financial assets is impaired and impairment losses are incurred only if there is objective evidence of impairment as a result of one or more events that occurred after the initial recognition of the asset (a ‘loss event’) and that loss event (or events) has an impact on the estimated future cash flows of the financial asset or group of financial assets that can be reliably estimated.
For loans and receivables, the amount of the loss is measured as the difference between the asset’s carrying amount and the present value of estimated future cash flows (excluding future credit losses that have not been incurred) discounted at the financial asset’s original effective interest rate. The carrying amount of the asset is reduced and the amount of the loss is recognised in profit or loss. If a loan has a variable interest rate, the discount rate for measuring any impairment loss is the current effective interest rate determined under the contract. As a practical expedient, the Group may measure impairment on the basis of an instrument’s fair value using an observable market price.
(m) derivative financial instruments
Derivative financial assets and liabilities are classified as financial assets at fair value through profit or loss (held for trading).
The Group uses derivative financial instruments such as foreign currency contracts and interest rate derivatives to hedge its risk associated with foreign currency and interest rate fluctuations. Derivative financial instruments are not held for speculative purposes and are recognised at fair value on the date a derivative contract is entered into and are subsequently re-measured to their fair value at the end of each reporting period. The accounting for subsequent changes depends on whether the derivative is designated as a hedging instrument, and if so, the nature of the item being hedged.
(i) Net investment hedges
Hedges of net investments in foreign operations are accounted for similarly to cash flow hedges.
Any gain or loss on the hedging instrument relating to the effective portion of the hedge is recognised in other comprehensive income and accumulated in reserves in equity. The gain or loss relating to the ineffective portion is recognised immediately in profit or loss within other income or other expenses.
Gains and losses accumulated in equity are reclassified to profit or loss when the foreign operation is disposed (see Note 5).
(ii) Other derivatives
Certain derivative instruments do not qualify for hedge accounting. Changes in the fair value of any derivative instrument that does not qualify for hedge accounting are recognised immediately in profit or loss and are included in other income or other expenses.
1. Summary of significant accounting policies (continued)
For
per
sona
l use
onl
y

49A
nn
ua
l Rep
ort
Go
verna
nce
GR
I Ind
exF
ina
ncia
l S
tatemen
tsS
up
plem
enta
ry In
form
ation
(n) Investment properties
Investment property, principally comprising freehold office buildings, is held for long term rental yields and is not wholly occupied by the Group. Investment property is measured initially at cost and subsequently carried at fair value.
The basis of valuation of investment properties is fair value, being the amount for which the assets could be exchanged between knowledgeable, willing parties in an arm’s length transaction.
Fair value is based on active market prices, adjusted, if necessary, for any difference in the nature, location or condition of the specific asset. The Group also uses alternative valuation methods such as discounted cash flow projections; the capitalisation method and recent prices in less active markets. It is the policy of the Responsible Entity to formally review the carrying value of each property every 6 months to assess whether there may be a material change in the carrying value of the property. If there is a material change an external revaluation is obtained. External valuations are also made with sufficient regularity but at least every 2 years to ensure that the carrying amount of each investment property represents its fair value. Changes in fair values are recorded in the profit or loss.
On acquisition of investment property, the Group considers the price outlined in the contract for sale to best reflect its fair value. Therefore, while initially recorded as part of the cost of the investment property, any incidental costs relating to acquisition incurred above-and-beyond the sales price are immediately transferred to the profit or loss as a change in fair value.
The gain or loss on disposal of revalued assets is calculated as the difference between the carrying amount of the asset at the date of disposal and the net proceeds from disposal and is included in profit or loss in the year of disposal.
Land and buildings are an investment and are regarded as a composite asset. Accounting standards do not require investment properties to be depreciated. Accordingly, the building and any component thereof (including plant and equipment) are not depreciated. Expenses capitalised to properties may include the cost of acquisition, additions, refurbishment, redevelopment and fees incurred.
(i) Investment properties under construction
Investment properties also include properties under construction for the future use as investment properties. These are measured initially at cost and subsequently carried at fair value.
Cash or cash equivalents paid, or the fair value of other consideration given to construct investment properties is considered part of the cost of the property under construction. This includes costs such as interest expenses. The cost of an investment property under construction can also include certain types of property related revenue (such as interest income), earned by the Group during the property’s construction.
There are generally no active markets for investment properties under construction resulting in a lack of comparable transactions. As such the Responsible Entity uses a discounted cash flow model in determining the fair value of investment properties under construction.
Where the fair value of an investment property under construction is not reliably determinable, and the Group expects the fair value of the property to be reliably determinable when construction is complete, the Group measures the investment property under construction at cost until either its fair value becomes reliably determinable or construction is completed (whichever is earlier).
(ii) Investment properties under redevelopment
Existing investment properties being redevelopment for continued future use are carried at fair value.
(o) lease incentives and leasing fees
Incentives such as cash, rent-free periods, lessee or lessor owned fit outs may be provided to lessees to enter into an operating lease. Leasing fees may also be paid for the negotiation of leases. These incentives and lease fees are capitalised to the investment property and are amortised on a straight-line basis over the term of the lease as a reduction of rental income. The carrying amount of the lease incentives and leasing fees are reflected in the fair value of investment properties.
(p) Impairment of assets
Assets are tested for impairment whenever events or changes in circumstances indicate that the carrying amount may not be recoverable. An impairment loss is recognised for the amount by which the asset’s carrying amount exceeds its recoverable amount. The recoverable amount is the higher of an asset’s fair value less costs to sell and value in use. For the purposes of assessing impairment, assets are grouped by the lowest levels for which there are separately identifiable cash inflows which are largely independent of the cash inflows from other assets or groups of assets (cash generating units). Non-financial assets other than goodwill that suffered impairment are reviewed for possible reversal of the impairment at the end of each reporting period.
(q) trade and other payables
These amounts represent liabilities for amounts owing by the Group at year end which are unpaid. The amounts are unsecured and are usually paid within 30 days of recognition and also include rent in advance. Trade and other payables are presented as current liabilities unless payment is not due within 12 months from the reporting date. They are recognised initially at fair value and subsequently measured at amortised cost using the effective interest rate method.
(r) Borrowings
Borrowings are initially recognised at fair value, net of transaction costs incurred, and subsequently measured at amortised cost. Any difference between the proceeds (net of transaction costs) and the redemption amount is recognised in profit or loss over the period of the borrowings using the effective interest method. Fees paid on the establishment of loan facilities are deferred and expensed over the term of the respective agreement. Other borrowing costs are expensed. Borrowings are classified as current liabilities unless the Group has an unconditional right to defer settlement of the liability for at least 12 months after the reporting period.
For
per
sona
l use
onl
y
Notes to the Consolidated Financial StatementsFor the year ended 30 June 2013 (continued)
50 Investa OffIce fund annual fInancIal RepORt June 2013
(s) contributed equity
Units issued are classified as equity. Incremental costs directly attributable to the issue of new units are shown in equity as a deduction, net of tax, from the proceeds. Incremental costs directly attributable to the issue of new units for the acquisition of a business are not included in the cost of the acquisition as part of the purchase consideration.
(t) distributions
Provision is made for the amount of any distribution calculated on or before the end of the reporting period but not distributed at the end of the reporting period.
(u) earnings per unit
(i) Basic and dilutive earnings per unit
Basic earnings per unit are calculated on net profit attributable to unitholders of the Group, divided by the weighted average number of issued units. As there are no potentially dilutive units on issue, diluted earnings per unit is the same as basic earnings per unit.
(ii) Basic and dilutive earnings per unit from continuing operations
Basic earnings per unit from continuing operations are calculated on the profit from continuing operations attributable to unitholders of the Group, divided by the weighted average number of issued units. As there are no potentially dilutive units on issue, diluted earnings per unit from continuing operations is the same as basic earnings per unit from continuing operations.
(iii) Basic and dilutive earnings per unit from discontinued operations
Basic earnings per unit from discontinued operations are calculated on the profit from discontinued operations attributable to unitholders of the Group, divided by the weighted average number of issued units. As there are no potentially dilutive units on issue, diluted earnings per unit from discontinued operations is the same as basic earnings per unit from discontinued operations.
(v) Income tax
(i) Australian income tax
Under current legislation, the Group is not liable for Australian income tax, provided that the distributable income calculated in accordance with the constitution of the trusts is fully distributed to unitholders each year.
(ii) Foreign income tax
The subsidiaries that hold the Group’s foreign properties may be subject to corporate income tax and withholding tax in countries in which they operate. Under current Australian income tax legislation, unitholders may be entitled to receive a foreign tax credit for this withholding tax.
The income tax expense or revenue for the year is the tax payable on the current year’s taxable income based on the applicable income tax for each jurisdiction, adjusted by changes in deferred tax assets and liabilities attributable to temporary differences and to unused tax losses.
The current income tax charge is calculated on the basis of the tax laws enacted or substantively enacted at the end of the reporting period. Management periodically evaluates positions taken in tax returns with respect to situations in which applicable tax regulation is subject to interpretation. It establishes provisions where appropriate on the basis of amounts expected to be paid to the tax authorities.
Deferred income tax is provided in full, using the liability method, on temporary differences arising between the tax bases of assets and liabilities and their carrying amounts in the Consolidated Financial Statements. The deferred income tax is also not accounted for if it arises from initial recognition of an asset or liability in a transaction other than a business combination that at the time of the transaction affects either accounting nor taxable profit or loss. Deferred income tax is determined using tax rates (and laws) that have been enacted or substantively enacted by the end of the reporting period and are expected to apply when the related deferred income tax asset is realised or the deferred income tax liability is settled.
Deferred tax assets are recognised for deductible temporary differences and unused tax losses only if it is probable that future taxable amounts will be available to utilise those temporary differences and losses.
Deferred tax assets and liabilities are offset when there is a legally enforceable right to offset current tax assets and liabilities and when the deferred tax balances relate to the same taxation authority. Current tax assets and tax liabilities are offset where the entity has a legally enforceable right to offset and intends either to settle on a net basis, or to realise the asset and settle the liability simultaneously.
Current and deferred tax is recognised in profit or loss, except to the extent that it relates to items recognised in other comprehensive income or directly in equity. In this case, the tax is also recognised in other comprehensive income or directly in equity, respectively.
(w) Goods and services tax (Gst) and valued added tax (vat)
Revenues, expenses and assets are recognised net of the amount of associated GST and VAT, unless the GST or VAT incurred is not recoverable from the taxation authority. In this case it is recognised as part of the cost of acquisition of the asset or as part of the expense.
Receivables and payables are stated inclusive of the amount of GST and VAT receivable or payable. The net amount of GST and VAT recoverable from, or payable to, the taxation authority is included with other receivables or payables in the Consolidated Statements of Financial Position.
Cash flows are presented on a gross basis. The GST and VAT components of cash flows arising from investing or financing activities which are recoverable from, or payable to the taxation authority, are presented as operating cash flows.
1. Summary of significant accounting policies (continued)
For
per
sona
l use
onl
y

51A
nn
ua
l Rep
ort
Go
verna
nce
GR
I Ind
exF
ina
ncia
l S
tatemen
tsS
up
plem
enta
ry In
form
ation
(x) Rounding of amounts
The Fund and Prime are of a kind of entity referred to in Class Order 98/100 (as amended), issued by the Australian Securities and Investments Commission, relating to the rounding off of amounts in the Financial Statements. Amounts in the financial statements have been rounded off, in accordance with that Class Order, to the nearest hundred thousand dollars, or in certain cases, the nearest thousand dollars, unless otherwise indicated.
(y) new accounting standards and interpretations
Certain new accounting standards and interpretations have been published that are not mandatory for reporting periods ended 30 June 2013. The Responsible Entity’s assessment of the impact of these new standards and interpretations is set out below.
(i) AASB 9 Financial Instruments, AASB 2009-11 Amendments to Australian Accounting Standards arising from AASB 9 and AASB 2010-7 Amendments to Australian Accounting Standards arising from AASB 9 (December 2010) (effective from 1 January 2015).
AASB 9 Financial Instruments addresses the classification, measurement and derecognition of financial assets and financial liabilities. The standard is not applicable until 1 January 2013 but is available for early adoption. When adopted, the standard will affect the classification and measurement of financial assets and liabilities.
The Responsible Entity’s preliminary assessment shows that the new standard will not have a significant impact on the composition of the Financial Statements and the Group does not expect to adopt the new standard before the operative date.
(ii) AASB 10 Consolidated Financial Statements, AASB 11 Joint Arrangements, AASB 12 Disclosure of Interests in Other Entities, revised AASB 127 Separate Financial Statements and AASB 128 Investments in Associates and Joint Ventures and AASB 2011-7 Amendments to Australian Accounting Standards arising from the Consolidation and Joint Arrangements Standards (effective 1 January 2013).
In August 2011, the AASB issued a suite of five new and amended standards which address the accounting for joint arrangements, Consolidated Financial Statements and associated disclosures.
AASB 10 replaces all of the guidance on control and consolidation in AASB 127 Consolidated and Separate Financial Statements, and Interpretation 12 Consolidation – Special Purpose Entities. The core principle that a consolidated entity presents a parent and its subsidiaries as if they are a single economic entity remains unchanged, as do the mechanics of consolidation. However, the standard introduces a single definition of control that applies to all entities. It focuses on the need to have both power and rights or exposure to variable returns. Power is the current ability to direct the activities that significantly influence returns. Returns must vary and can be positive, negative or both. Control exists when the investor can use its power to affect the amount of its returns. There is also new guidance on participating and protective rights and on agent/principal relationships.
AASB 11 introduces a principles based approach to accounting for joint arrangements. The focus is no longer on the legal structure of joint arrangements, but rather on how rights and obligations are shared by the parties to the joint arrangement. Based on the assessment of rights and obligations, a joint arrangement will be classified as either a joint operation or a joint venture. Joint ventures are accounted for using the equity method, and the choice to proportionately consolidate will no longer be permitted. Parties to a joint operation will account for their share of revenues, expenses, assets and liabilities in much the same way as under the previous standard. AASB 11 also provides guidance for parties that participate in joint arrangements but do not share joint control.
AASB 12 sets out the required disclosures for entities reporting under the two new standards, AASB 10 and AASB 11, and replaces the disclosure requirements currently found in AASB 127 and AASB 128. Application of this standard by the Group will not affect any of the amounts recognised in the Financial Statements, but will impact the type of information disclosed in relation to the Group’s investments.
AASB 127 is renamed Separate Financial Statements and is now a standard dealing solely with separate Financial Statements. Application of this standard by the Group will not affect any of the amounts recognised in the Financial Statements.
Amendments to AASB 128 provide clarification that an entity continues to apply the equity method and does not remeasure its retained interest as part of ownership changes where a joint venture becomes an associate, and vice versa. The amendments also introduce a “partial disposal” concept.
The Responsible Entity’s preliminary assessment shows that the new standards will not have a significant impact on the composition of the Financial Statements and the Group does not expect to adopt the new standards before the operative date.
(iii) AASB 13 Fair Value Measurement and AASB 2011-8 Amendments to Australian Accounting Standards arising from AASB 13 (effective 1 January 2013).
AASB 13 was released in September 2011. It explains how to measure fair value and aims to enhance fair value disclosures. The Group has yet to determine which, if any, of its current measurement techniques will have to change as a result of the new guidance. It is therefore not possible to state the impact, if any, of the new rules on any of the amounts recognised in the Financial Statements. However, application of the new standard will impact the type of information disclosed in the notes to the Financial Statements. The Group does not intend to adopt the new standard before its operative date.
There are no other standards that are not yet effective and that are expected to have a material impact on the Group in the current or future reporting periods and on foreseeable future transactions.
For
per
sona
l use
onl
y
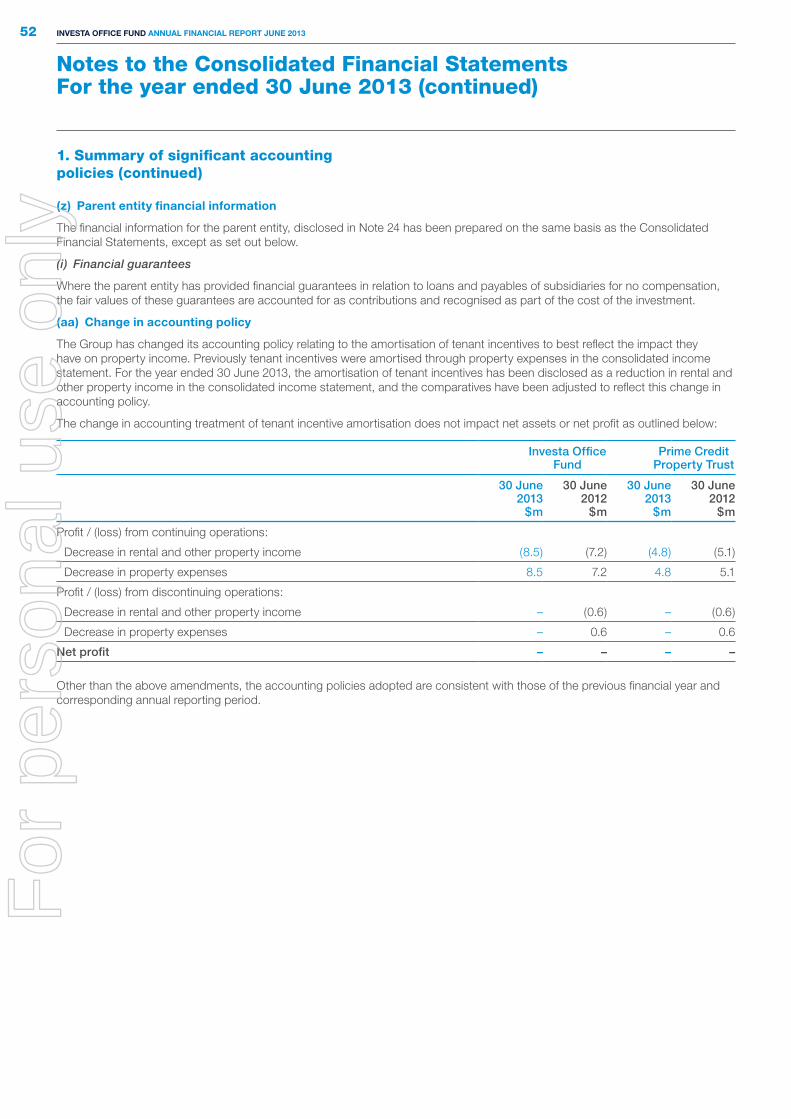
Notes to the Consolidated Financial StatementsFor the year ended 30 June 2013 (continued)
52 Investa OffIce fund annual fInancIal RepORt June 2013
(z) parent entity financial information
The financial information for the parent entity, disclosed in Note 24 has been prepared on the same basis as the Consolidated Financial Statements, except as set out below.
(i) Financial guarantees
Where the parent entity has provided financial guarantees in relation to loans and payables of subsidiaries for no compensation, the fair values of these guarantees are accounted for as contributions and recognised as part of the cost of the investment.
(aa) change in accounting policy
The Group has changed its accounting policy relating to the amortisation of tenant incentives to best reflect the impact they have on property income. Previously tenant incentives were amortised through property expenses in the consolidated income statement. For the year ended 30 June 2013, the amortisation of tenant incentives has been disclosed as a reduction in rental and other property income in the consolidated income statement, and the comparatives have been adjusted to reflect this change in accounting policy.
The change in accounting treatment of tenant incentive amortisation does not impact net assets or net profit as outlined below:
Investa Office Fund
Prime Credit Property Trust
30 June 2013
$m
30 June 2012
$m
30 June 2013
$m
30 June 2012
$m
Profit / (loss) from continuing operations:
Decrease in rental and other property income (8.5) (7.2) (4.8) (5.1)
Decrease in property expenses 8.5 7.2 4.8 5.1
Profit / (loss) from discontinuing operations:
Decrease in rental and other property income – (0.6) – (0.6)
Decrease in property expenses – 0.6 – 0.6
Net profit – – – –
Other than the above amendments, the accounting policies adopted are consistent with those of the previous financial year and corresponding annual reporting period.
1. Summary of significant accounting policies (continued)
For
per
sona
l use
onl
y
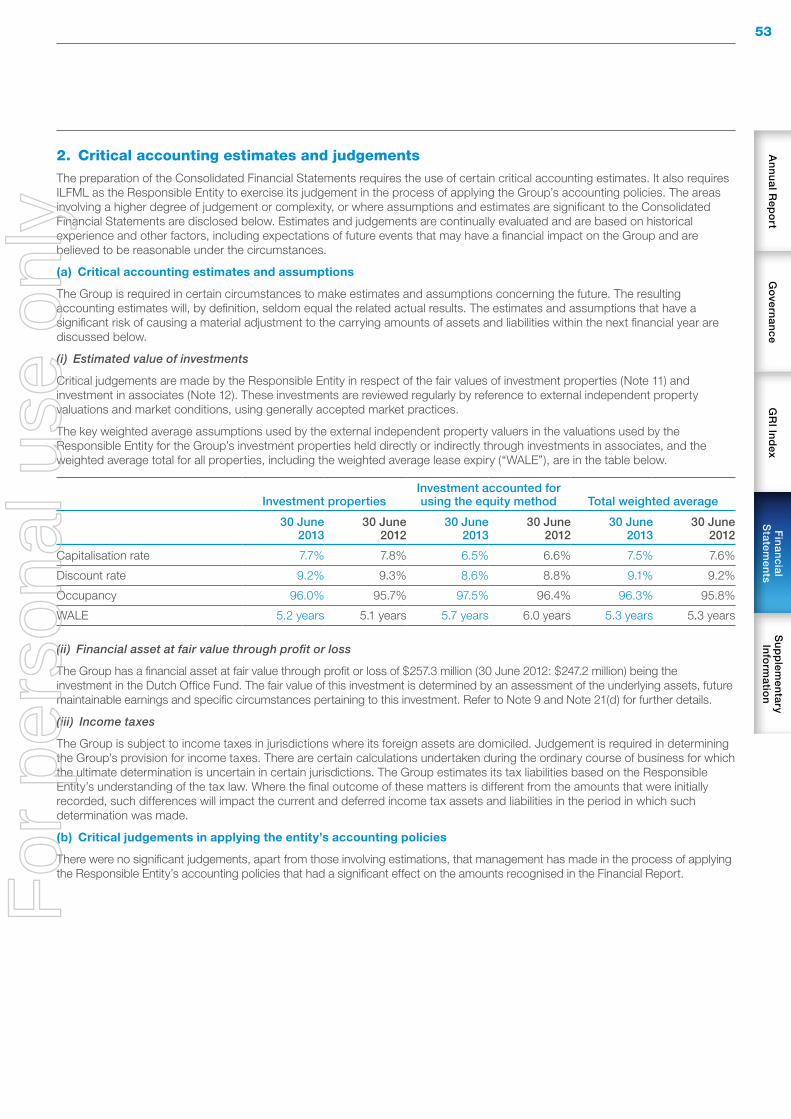
53A
nn
ua
l Rep
ort
Go
verna
nce
GR
I Ind
exF
ina
ncia
l S
tatemen
tsS
up
plem
enta
ry In
form
ation
2. Critical accounting estimates and judgements
The preparation of the Consolidated Financial Statements requires the use of certain critical accounting estimates. It also requires ILFML as the Responsible Entity to exercise its judgement in the process of applying the Group’s accounting policies. The areas involving a higher degree of judgement or complexity, or where assumptions and estimates are significant to the Consolidated Financial Statements are disclosed below. Estimates and judgements are continually evaluated and are based on historical experience and other factors, including expectations of future events that may have a financial impact on the Group and are believed to be reasonable under the circumstances.
(a) critical accounting estimates and assumptions
The Group is required in certain circumstances to make estimates and assumptions concerning the future. The resulting accounting estimates will, by definition, seldom equal the related actual results. The estimates and assumptions that have a significant risk of causing a material adjustment to the carrying amounts of assets and liabilities within the next financial year are discussed below.
(i) Estimated value of investments
Critical judgements are made by the Responsible Entity in respect of the fair values of investment properties (Note 11) and investment in associates (Note 12). These investments are reviewed regularly by reference to external independent property valuations and market conditions, using generally accepted market practices.
The key weighted average assumptions used by the external independent property valuers in the valuations used by the Responsible Entity for the Group’s investment properties held directly or indirectly through investments in associates, and the weighted average total for all properties, including the weighted average lease expiry (“WALE”), are in the table below.
Investment propertiesInvestment accounted for using the equity method Total weighted average
30 June 2013
30 June 2012
30 June 2013
30 June 2012
30 June 2013
30 June 2012
Capitalisation rate 7.7% 7.8% 6.5% 6.6% 7.5% 7.6%
Discount rate 9.2% 9.3% 8.6% 8.8% 9.1% 9.2%
Occupancy 96.0% 95.7% 97.5% 96.4% 96.3% 95.8%
WALE 5.2 years 5.1 years 5.7 years 6.0 years 5.3 years 5.3 years
(ii) Financial asset at fair value through profit or loss
The Group has a financial asset at fair value through profit or loss of $257.3 million (30 June 2012: $247.2 million) being the investment in the Dutch Office Fund. The fair value of this investment is determined by an assessment of the underlying assets, future maintainable earnings and specific circumstances pertaining to this investment. Refer to Note 9 and Note 21(d) for further details.
(iii) Income taxes
The Group is subject to income taxes in jurisdictions where its foreign assets are domiciled. Judgement is required in determining the Group’s provision for income taxes. There are certain calculations undertaken during the ordinary course of business for which the ultimate determination is uncertain in certain jurisdictions. The Group estimates its tax liabilities based on the Responsible Entity’s understanding of the tax law. Where the final outcome of these matters is different from the amounts that were initially recorded, such differences will impact the current and deferred income tax assets and liabilities in the period in which such determination was made.
(b) critical judgements in applying the entity’s accounting policies
There were no significant judgements, apart from those involving estimations, that management has made in the process of applying the Responsible Entity’s accounting policies that had a significant effect on the amounts recognised in the Financial Report.
For
per
sona
l use
onl
y

Notes to the Consolidated Financial StatementsFor the year ended 30 June 2013 (continued)
54 Investa OffIce fund annual fInancIal RepORt June 2013
3. Distributions
(a) Rates and amounts of distributions
Investa Office Fund
Prime Credit Property Trust
30 June 2013
cents
30 June 2012
cents
30 June 2013
cents
30 June 2012
cents
Distributions paid or are payable in respect of the following periods at the following rates (in cents per unit):
Quarter ended 30 September – 3.90 – 1.30
Quarter ended 31 December – 3.90 – 3.90
Half-year ended 31 December 8.75 – 4.75 –
Half-year ended 30 June 1 9.00 9.70 5.00 4.00
17.75 17.50 9.75 9.20
$m $m $m $m
The total amounts of these distributions were:
Quarter ended 30 September – 26.0 – 8.7
Quarter ended 31 December – 23.9 – 23.9
Half-year ended 31 December 53.7 – 29.2 –
Half-year ended 30 June 1 55.3 59.6 30.7 24.6
Total distributions paid and payable to unitholders 109.0 109.5 59.9 57.2
Distributions to external non-controlling interest – 0.3 – 0.3
Total distributions paid or payable 109.0 109.8 59.9 57.5 1. The distribution for the half year ended 30 June 2012, includes a one-off special distribution of 1.90 cents per stapled unit which amounts to $11.7 million. The special
distribution is a consequence of divesting all US assets, and repatriating those proceeds and associated retained earnings.
The distribution for the quarter year ended 30 June 2012 was recognised in the 2012 financial year and paid on 29 August 2012. The distribution for the half year ended 30 June 2013 was recognised in the 2013 financial year and is scheduled to be paid on 30 August 2013. The distributions per unit have been recalculated for the unit consolidation which occurred during the 2012 financial year as detailed in Note 16(d).
(b) distribution period
On 6 December 2011 unitholders approved a change of the distribution frequency from quarterly to half yearly, subsequent to the distribution for the quarter ended 31 December 2011.
For
per
sona
l use
onl
y

55A
nn
ua
l Rep
ort
Go
verna
nce
GR
I Ind
exF
ina
ncia
l S
tatemen
tsS
up
plem
enta
ry In
form
ation
4. Earnings per unit
(a) unit consolidation
In April 2012, the Group undertook a 1-for-4 unit consolidation as outlined in Note 16(d). The basic and diluted earnings per stapled unit and unit of each trust have been recalculated for the unit consolidation which occurred during the year ended 30 June 2012.
Investa Office Fund
30 June 2013
30 June 2012
(b) Per stapled unit
Weighted average number of units outstanding (millions) 614.1 636.5
Profit from continuing operations attributable to unitholders ($ millions) 159.3 181.9
Basic and diluted earnings per unit from continuing operations (cents) 25.9 28.6
(Loss)/profit from discontinued operations attributable to unitholders ($ millions) (0.6) (80.0)
Basic and diluted earnings per unit from discontinued operations (cents) (0.1) (12.6)
Profit attributable to unitholders ($ millions) 158.7 101.9
Basic and diluted earnings per unit (cents) 25.8 16.0
Armstrong Jones Office Fund
Prime Credit Property Trust
30 June 2013
30 June 2012
30 June 2013
30 June 2012
(c) per unit of each trust
Weighted average number of units outstanding (millions) 614.1 636.5 614.1 636.5
Profit from continuing operations attributable to unitholders ($ millions) 62.2 90.5 97.1 91.4
Basic and diluted earnings per unit from continuing operations (cents) 10.1 14.2 15.8 14.4
(Loss)/profit from discontinued operations attributable to unitholders ($ millions) na na (0.6) (80.0)
Basic and diluted earnings per unit from discontinued operations (cents) na na (0.1) (12.6)
Profit attributable to unitholders ($ millions) 62.2 90.5 96.5 11.4
Basic and diluted earnings per unit (cents) 10.1 14.2 15.7 1.8
For
per
sona
l use
onl
y

Notes to the Consolidated Financial StatementsFor the year ended 30 June 2013 (continued)
56 Investa OffIce fund annual fInancIal RepORt June 2013
5. Asset and liabilities classified as held for sale and discontinued operations
(a) assets classified as held for sale
Investa Office Fund
Prime Credit Property Trust
30 June 2013
$m
30 June 2012
$m
30 June 2013
$m
30 June 2012
$m
Disposal group held for sale (discontinued operation – see (d) below)
Cash and cash equivalents 0.7 4.8 0.7 4.8
Trade and other receivables 0.1 0.2 0.1 0.2
Total assets of disposal group held for sale 0.8 5.0 0.8 5.0
Non-current assets held for sale
Investment in Bastion Tower I NV, Belgium (b) 34.2 – – –
Investment in Neuilly Victor Hugo SCI, France 1 25.2 21.2 – –
59.4 21.2 – –
Total assets classified as held for sale 60.2 26.2 0.8 5.01. The investment property held by this equity accounted investment was sold in February 2012. This investment predominantly comprises a receivable of $24.5 million owed by
the Group offset against a payable disclosed in Note 5(c).
(b) transfer from investments accounted for using the equity method
During the year ended 30 June 2013, the Group’s investment in Bastion Tower I NV, Belgium met the criteria as held for sale and accordingly reclassified from an investment accounted for under the equity method to an asset held for sale. As a result of the reclassification, the investment has been valued as follows:
Investa Office Fund
Prime Credit Property Trust
30 June 2013
$m
30 June 2012
$m
30 June 2013
$m
30 June 2012
$m
Transfer from investments accounted for using the equity method – Bastion Tower I NV 35.5 – – –
Selling costs (1.3) – – –
34.2 – – –
(c) Liabilities directly associated with assets classified as held for sale
Investa Office Fund
Prime Credit Property Trust
30 June 2013
$m
30 June 2012
$m
30 June 2013
$m
30 June 2012
$m
Trade and other payables 0.4 0.4 0.4 0.4
Current income tax payable – 2.5 – 2.5
Payable to equity accounted investments 1 27.2 20.5 – –
27.6 23.4 0.4 2.91. $24.5 million (2012: $20.5 million) of this payable relates to the Neuilly Victor Hugo SCI investment which is held for sale. Settlement of this balance will be completed prior to
the liquidation of the Neuilly Victor Hugo SCI investment. During the year ending 30 June 2013, this amount became interest bearing as outlined in Note 21(a).
For
per
sona
l use
onl
y
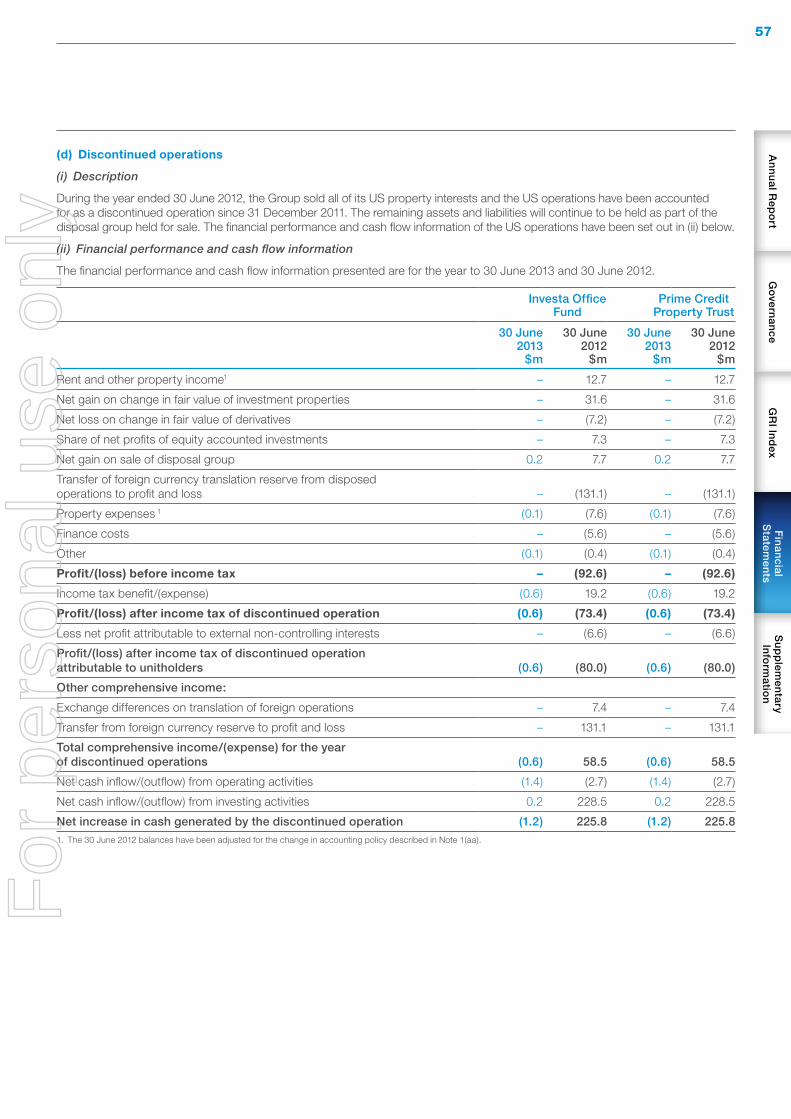
57A
nn
ua
l Rep
ort
Go
verna
nce
GR
I Ind
exF
ina
ncia
l S
tatemen
tsS
up
plem
enta
ry In
form
ation
(d) discontinued operations
(i) Description
During the year ended 30 June 2012, the Group sold all of its US property interests and the US operations have been accounted for as a discontinued operation since 31 December 2011. The remaining assets and liabilities will continue to be held as part of the disposal group held for sale. The financial performance and cash flow information of the US operations have been set out in (ii) below.
(ii) Financial performance and cash flow information
The financial performance and cash flow information presented are for the year to 30 June 2013 and 30 June 2012.
Investa Office Fund
Prime Credit Property Trust
30 June 2013
$m
30 June 2012
$m
30 June 2013
$m
30 June 2012
$m
Rent and other property income1 – 12.7 – 12.7
Net gain on change in fair value of investment properties – 31.6 – 31.6
Net loss on change in fair value of derivatives – (7.2) – (7.2)
Share of net profits of equity accounted investments – 7.3 – 7.3
Net gain on sale of disposal group 0.2 7.7 0.2 7.7
Transfer of foreign currency translation reserve from disposed operations to profit and loss – (131.1) – (131.1)
Property expenses 1 (0.1) (7.6) (0.1) (7.6)
Finance costs – (5.6) – (5.6)
Other (0.1) (0.4) (0.1) (0.4)
profit/(loss) before income tax – (92.6) – (92.6)
Income tax benefit/(expense) (0.6) 19.2 (0.6) 19.2
profit/(loss) after income tax of discontinued operation (0.6) (73.4) (0.6) (73.4)
Less net profit attributable to external non-controlling interests – (6.6) – (6.6)
Profit/(loss) after income tax of discontinued operation attributable to unitholders (0.6) (80.0) (0.6) (80.0)
Other comprehensive income:
Exchange differences on translation of foreign operations – 7.4 – 7.4
Transfer from foreign currency reserve to profit and loss – 131.1 – 131.1
Total comprehensive income/(expense) for the year of discontinued operations (0.6) 58.5 (0.6) 58.5
Net cash inflow/(outflow) from operating activities (1.4) (2.7) (1.4) (2.7)
Net cash inflow/(outflow) from investing activities 0.2 228.5 0.2 228.5
Net increase in cash generated by the discontinued operation (1.2) 225.8 (1.2) 225.81. The 30 June 2012 balances have been adjusted for the change in accounting policy described in Note 1(aa).
For
per
sona
l use
onl
y

Notes to the Consolidated Financial StatementsFor the year ended 30 June 2013 (continued)
58 Investa OffIce fund annual fInancIal RepORt June 2013
(d) discontinued operations (continued)
(iii) Details of disposals during the year
Investa Office Fund
Prime Credit Property Trust
30 June 2013
$m
30 June 2012
$m
30 June 2013
$m
30 June 2012
$m
Cash consideration received or receivable 0.2 236.5 0.2 236.5
Carrying amount of net assets and liabilities 2 – 228.8 – 228.8
Gain on disposal before income tax 0.2 7.7 0.2 7.7
Income tax benefit (0.6) 19.2 (0.6) 19.2
Gain on disposal after income tax (0.4) 26.9 (0.4) 26.92. The 30 June 2012 balance includes minority share of assets and liabilities.
6. income tax expense
(a) Income tax expense/(benefit)
Investa Office Fund
Prime Credit Property Trust
30 June 2013
$m
30 June 2012
$m
30 June 2013
$m
30 June 2012
$m
Current tax 3.0 38.2 1.1 35.3
Deferred tax – (56.7) – (54.5)
3.0 (18.5) 1.1 (19.2)
Income tax expense/(benefit) is attributable to:
Profit from continuing operations 2.4 0.7 0.5 –
Profit/(loss) from discontinued operations 0.6 (19.2) 0.6 (19.2)
Total income tax expense/(benefit) 3.0 (18.5) 1.1 (19.2)
(b) numerical reconciliation of income tax expense to prima facie tax payable
Investa Office Fund
Prime Credit Property Trust
30 June 2013
$m
30 June 2012
$m
30 June 2013
$m
30 June 2012
$m
Profit from continuing operations before income tax expense 161.7 182.6 97.6 91.4
Loss from discontinued operations before income tax expense – (92.6) – (92.6)
161.7 90.0 97.6 (1.2)
Tax at the Australian tax rate of 30% (2012: 30%) 48.5 27.0 29.3 (0.4)
Tax effect of amounts which are not deductible/(taxable) in calculating taxable income:
Australian income (51.0) (57.2) (27.3) (24.0)
Other non-taxable income 6.5 (1.0) – –
Transfer from reserves – non-taxable – 39.3 – 39.3
Foreign income not subject to income tax (0.5) (8.9) (1.1) (14.8)
Difference between Australian and foreign tax rates (0.5) 4.0 0.2 2.4
Previous unrecognised tax losses utilised – (21.7) – (21.7)
Income tax expense/(benefit) 3.0 (18.5) 1.1 (19.2)
5. Asset and liabilities classified as held for sale and discontinued operations (continued)
For
per
sona
l use
onl
y
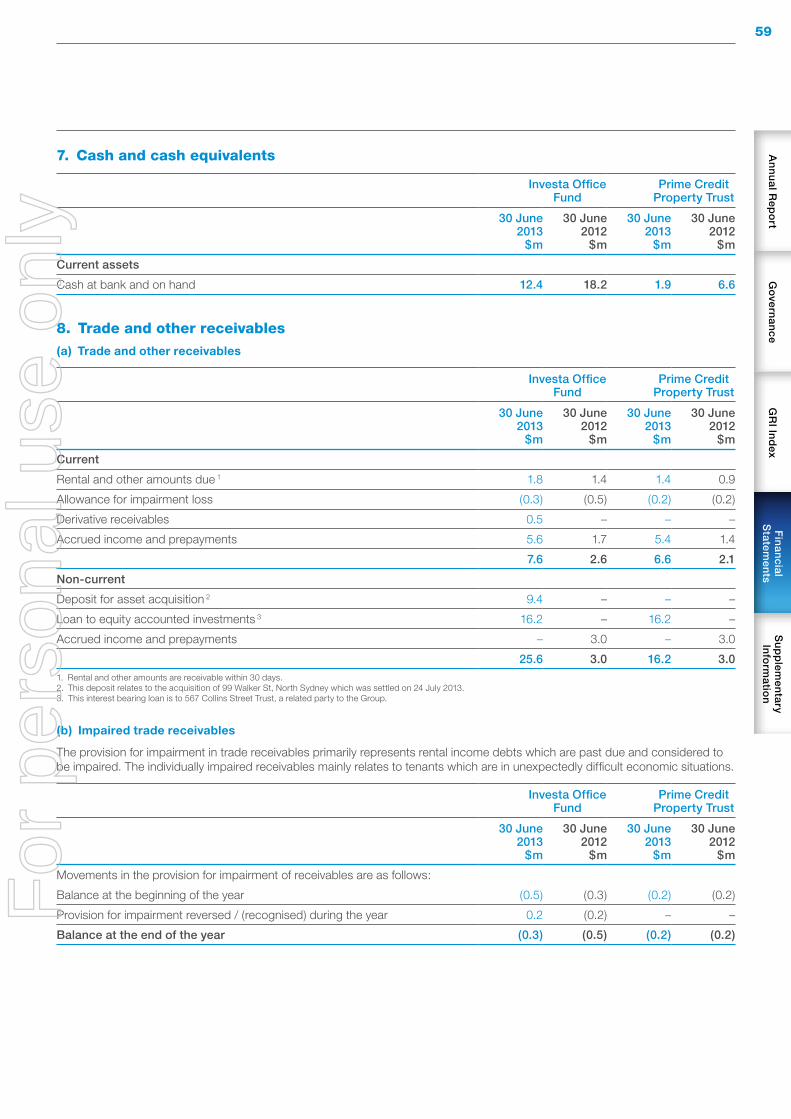
59A
nn
ua
l Rep
ort
Go
verna
nce
GR
I Ind
exF
ina
ncia
l S
tatemen
tsS
up
plem
enta
ry In
form
ation
7. Cash and cash equivalents
Investa Office Fund
Prime Credit Property Trust
30 June 2013
$m
30 June 2012
$m
30 June 2013
$m
30 June 2012
$m
Current assets
Cash at bank and on hand 12.4 18.2 1.9 6.6
8. Trade and other receivables
(a) trade and other receivables
Investa Office Fund
Prime Credit Property Trust
30 June 2013
$m
30 June 2012
$m
30 June 2013
$m
30 June 2012
$m
Current
Rental and other amounts due 1 1.8 1.4 1.4 0.9
Allowance for impairment loss (0.3) (0.5) (0.2) (0.2)
Derivative receivables 0.5 – – –
Accrued income and prepayments 5.6 1.7 5.4 1.4
7.6 2.6 6.6 2.1
Non-current
Deposit for asset acquisition 2 9.4 – – –
Loan to equity accounted investments 3 16.2 – 16.2 –
Accrued income and prepayments – 3.0 – 3.0
25.6 3.0 16.2 3.01. Rental and other amounts are receivable within 30 days.2. This deposit relates to the acquisition of 99 Walker St, North Sydney which was settled on 24 July 2013.3. This interest bearing loan is to 567 Collins Street Trust, a related party to the Group.
(b) Impaired trade receivables
The provision for impairment in trade receivables primarily represents rental income debts which are past due and considered to be impaired. The individually impaired receivables mainly relates to tenants which are in unexpectedly difficult economic situations.
Investa Office Fund
Prime Credit Property Trust
30 June 2013
$m
30 June 2012
$m
30 June 2013
$m
30 June 2012
$m
Movements in the provision for impairment of receivables are as follows:
Balance at the beginning of the year (0.5) (0.3) (0.2) (0.2)
Provision for impairment reversed / (recognised) during the year 0.2 (0.2) – –
Balance at the end of the year (0.3) (0.5) (0.2) (0.2)
For
per
sona
l use
onl
y
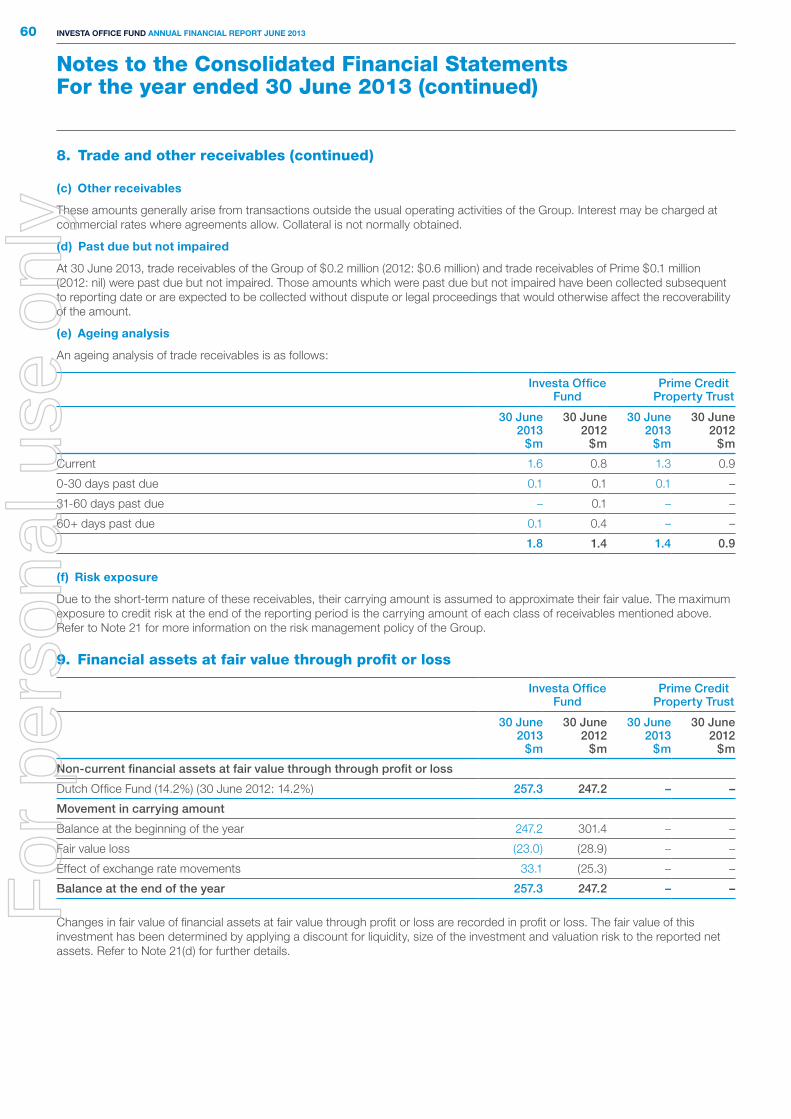
Notes to the Consolidated Financial StatementsFor the year ended 30 June 2013 (continued)
60 Investa OffIce fund annual fInancIal RepORt June 2013
(c) Other receivables
These amounts generally arise from transactions outside the usual operating activities of the Group. Interest may be charged at commercial rates where agreements allow. Collateral is not normally obtained.
(d) past due but not impaired
At 30 June 2013, trade receivables of the Group of $0.2 million (2012: $0.6 million) and trade receivables of Prime $0.1 million (2012: nil) were past due but not impaired. Those amounts which were past due but not impaired have been collected subsequent to reporting date or are expected to be collected without dispute or legal proceedings that would otherwise affect the recoverability of the amount.
(e) ageing analysis
An ageing analysis of trade receivables is as follows:
Investa Office Fund
Prime Credit Property Trust
30 June 2013
$m
30 June 2012
$m
30 June 2013
$m
30 June 2012
$m
Current 1.6 0.8 1.3 0.9
0-30 days past due 0.1 0.1 0.1 –
31-60 days past due – 0.1 – –
60+ days past due 0.1 0.4 – –
1.8 1.4 1.4 0.9
(f) Risk exposure
Due to the short-term nature of these receivables, their carrying amount is assumed to approximate their fair value. The maximum exposure to credit risk at the end of the reporting period is the carrying amount of each class of receivables mentioned above. Refer to Note 21 for more information on the risk management policy of the Group.
9. Financial assets at fair value through profit or loss
Investa Office Fund
Prime Credit Property Trust
30 June 2013
$m
30 June 2012
$m
30 June 2013
$m
30 June 2012
$m
Non-current financial assets at fair value through through profit or loss
Dutch Office Fund (14.2%) (30 June 2012: 14.2%) 257.3 247.2 – –
Movement in carrying amount
Balance at the beginning of the year 247.2 301.4 – –
Fair value loss (23.0) (28.9) – –
Effect of exchange rate movements 33.1 (25.3) – –
Balance at the end of the year 257.3 247.2 – –
Changes in fair value of financial assets at fair value through profit or loss are recorded in profit or loss. The fair value of this investment has been determined by applying a discount for liquidity, size of the investment and valuation risk to the reported net assets. Refer to Note 21(d) for further details.
8. Trade and other receivables (continued)
For
per
sona
l use
onl
y

61A
nn
ua
l Rep
ort
Go
verna
nce
GR
I Ind
exF
ina
ncia
l S
tatemen
tsS
up
plem
enta
ry In
form
ation
10. Derivative financial instruments
Investa Office Fund
Prime Credit Property Trust
30 June 2013
$m
30 June 2012
$m
30 June 2013
$m
30 June 2012
$m
Current assets
Forward foreign exchange contracts 4.5 4.9 0.1 1.0
Interest rate derivative contracts – 0.1 – –
4.5 5.0 0.1 1.0
Non-current assets
Forward foreign exchange contracts – 4.2 – –
Interest rate derivative contracts 1.8 0.2 1.8 –
1.8 4.4 1.8 –
Current liabilities
Interest rate derivative contracts – 0.4 – –
– 0.4 – –
Non-current liabilities
Cross currency swap contracts 4.9 – 4.9 –
Interest rate derivative contracts 8.2 9.5 – –
13.1 9.5 4.9 –
Risk exposures and fair value measurements
Information about the Group’s exposure to credit risk, foreign exchange and interest rate risk and about the methods and assumptions used in determining fair values is provided in Note 21. The maximum exposure to credit risk at the end of the reporting period is the carrying amount of each class of derivative financial assets mentioned above.
11. investment properties (a) Investment properties at fair value
Investa Office Fund
Prime Credit Property Trust
30 June 2013
$m
30 June 2012
$m
30 June 2013
$m
30 June 2012
$m
Investment properties at fair value 1,926.8 1,770.7 881.3 770.4
For
per
sona
l use
onl
y
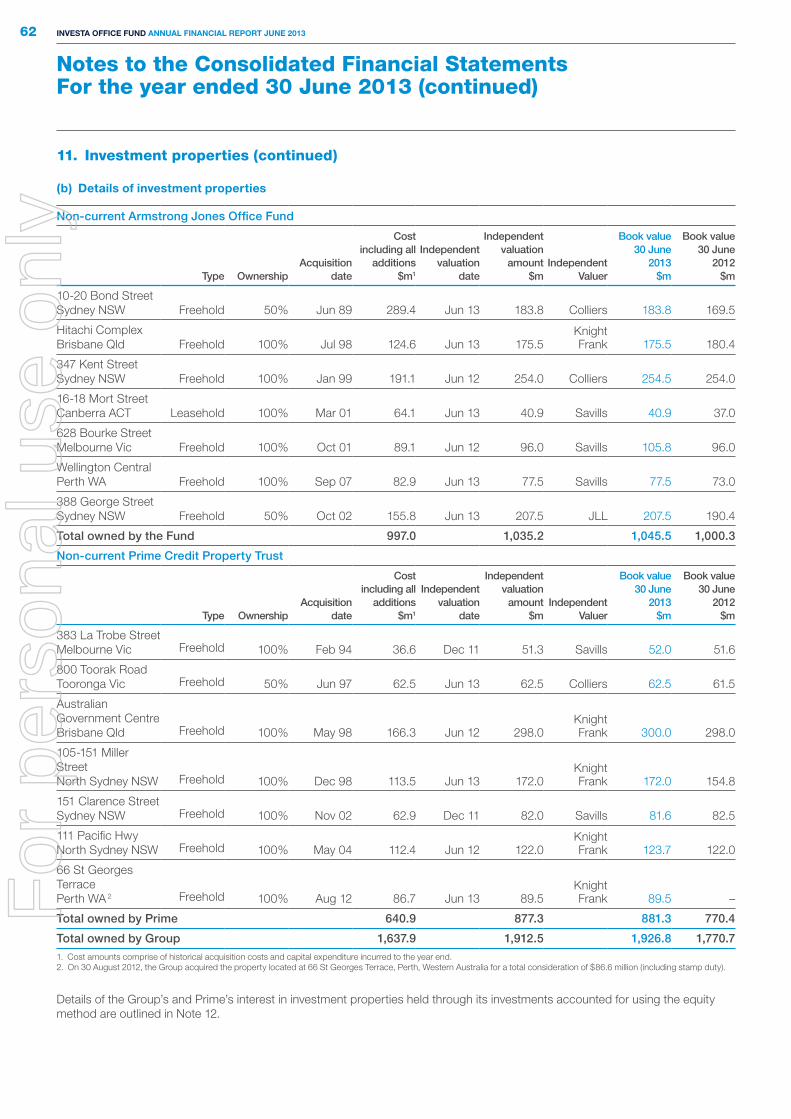
Notes to the Consolidated Financial StatementsFor the year ended 30 June 2013 (continued)
62 Investa OffIce fund annual fInancIal RepORt June 2013
(b) details of investment properties
Non-current Armstrong Jones Office Fund
Type OwnershipAcquisition
date
Cost including all
additions $m1
Independent valuation
date
Independent valuation
amount $m
Independent Valuer
Book value 30 June
2013 $m
Book value 30 June
2012 $m
10-20 Bond Street Sydney NSW Freehold 50% Jun 89 289.4 Jun 13 183.8 Colliers 183.8 169.5
Hitachi Complex Brisbane Qld Freehold 100% Jul 98 124.6 Jun 13 175.5
Knight Frank 175.5 180.4
347 Kent Street Sydney NSW Freehold 100% Jan 99 191.1 Jun 12 254.0 Colliers 254.5 254.0
16-18 Mort Street Canberra ACT Leasehold 100% Mar 01 64.1 Jun 13 40.9 Savills 40.9 37.0
628 Bourke Street Melbourne Vic Freehold 100% Oct 01 89.1 Jun 12 96.0 Savills 105.8 96.0
Wellington Central Perth WA Freehold 100% Sep 07 82.9 Jun 13 77.5 Savills 77.5 73.0
388 George Street Sydney NSW Freehold 50% Oct 02 155.8 Jun 13 207.5 JLL 207.5 190.4
Total owned by the Fund 997.0 1,035.2 1,045.5 1,000.3
Non-current Prime Credit Property Trust
Type OwnershipAcquisition
date
Cost including all
additions $m1
Independent valuation
date
Independent valuation
amount $m
Independent Valuer
Book value 30 June
2013 $m
Book value 30 June
2012 $m
383 La Trobe Street Melbourne Vic Freehold 100% Feb 94 36.6 Dec 11 51.3 Savills 52.0 51.6
800 Toorak Road Tooronga Vic Freehold 50% Jun 97 62.5 Jun 13 62.5 Colliers 62.5 61.5
Australian Government Centre Brisbane Qld Freehold 100% May 98 166.3 Jun 12 298.0
Knight Frank 300.0 298.0
105-151 Miller Street North Sydney NSW Freehold 100% Dec 98 113.5 Jun 13 172.0
Knight Frank 172.0 154.8
151 Clarence Street Sydney NSW Freehold 100% Nov 02 62.9 Dec 11 82.0 Savills 81.6 82.5
111 Pacific Hwy North Sydney NSW Freehold 100% May 04 112.4 Jun 12 122.0
Knight Frank 123.7 122.0
66 St Georges Terrace Perth WA 2 Freehold 100% Aug 12 86.7 Jun 13 89.5
Knight Frank 89.5 –
Total owned by Prime 640.9 877.3 881.3 770.4
Total owned by Group 1,637.9 1,912.5 1,926.8 1,770.71. Cost amounts comprise of historical acquisition costs and capital expenditure incurred to the year end.2. On 30 August 2012, the Group acquired the property located at 66 St Georges Terrace, Perth, Western Australia for a total consideration of $86.6 million (including stamp duty).
Details of the Group’s and Prime’s interest in investment properties held through its investments accounted for using the equity method are outlined in Note 12.
11. investment properties (continued)
For
per
sona
l use
onl
y

63A
nn
ua
l Rep
ort
Go
verna
nce
GR
I Ind
exF
ina
ncia
l S
tatemen
tsS
up
plem
enta
ry In
form
ation
(c) Movement in carrying amounts
Investa Office Fund
Prime Credit Property Trust
30 June 2013
$m
30 June 2012
$m
30 June 2013
$m
30 June 2012
$m
Carrying amount at beginning of the period 1,770.7 1,982.4 770.4 1,032.8
Exchange rate fluctuations – 17.4 – 17.4
Acquisitions 86.6 – 86.6 –
Additions to existing investment properties 47.6 45.3 20.5 22.2
Disposals – (369.5) – (369.5)
Amortisation of tenant incentives and leasing fees (16.7) (14.7) (9.9) (10.8)
Straight-lining of lease revenue (0.8) (0.6) (0.3) (1.4)
Net change in fair value 39.4 110.4 14.0 79.7
Carrying amount at the end of the period 1,926.8 1,770.7 881.3 770.4
(d) tenant incentives and leasing commissions (included in the carrying amounts above)
Investa Office Fund
Prime Credit Property Trust
30 June 2013
$m
30 June 2012
$m
30 June 2013
$m
30 June 2012
$m
Cost 73.7 66.5 37.6 41.1
Accumulated Amortisation (23.5) (18.6) (15.2) (16.1)
50.2 47.9 22.4 25.0
(e) amounts recognised in the Income statements for investment property
Investa Office Fund
Prime Credit Property Trust
30 June 2013
$m
30 June 2012
$m
30 June 2013
$m
30 June 2012
$m
Rental income and other property income 175.3 175.4 81.8 86.0
Direct operating expenses from property that generate rental income (40.8) (45.6) (20.9) (26.2)
134.5 129.8 60.9 59.8
The above amounts include amounts from discontinued operations in Note 5(d) and have been adjusted for the change in accounting policy described in Note 1(aa).
(f) valuation basis
The basis of the valuation of investment properties is fair value, being the amounts for which the properties could be exchanged between willing parties in an arm’s length transaction, based on current prices in an active market for similar properties in the same location and condition and subject to similar leases. Refer to the accounting policy in Note 1(n).
At reporting date, the key weighted average assumptions used by the Group in determining fair value were capitalisation rate, discount rate, occupancy and weighted average lease expiry which are outlined in Note 2(a).
For
per
sona
l use
onl
y
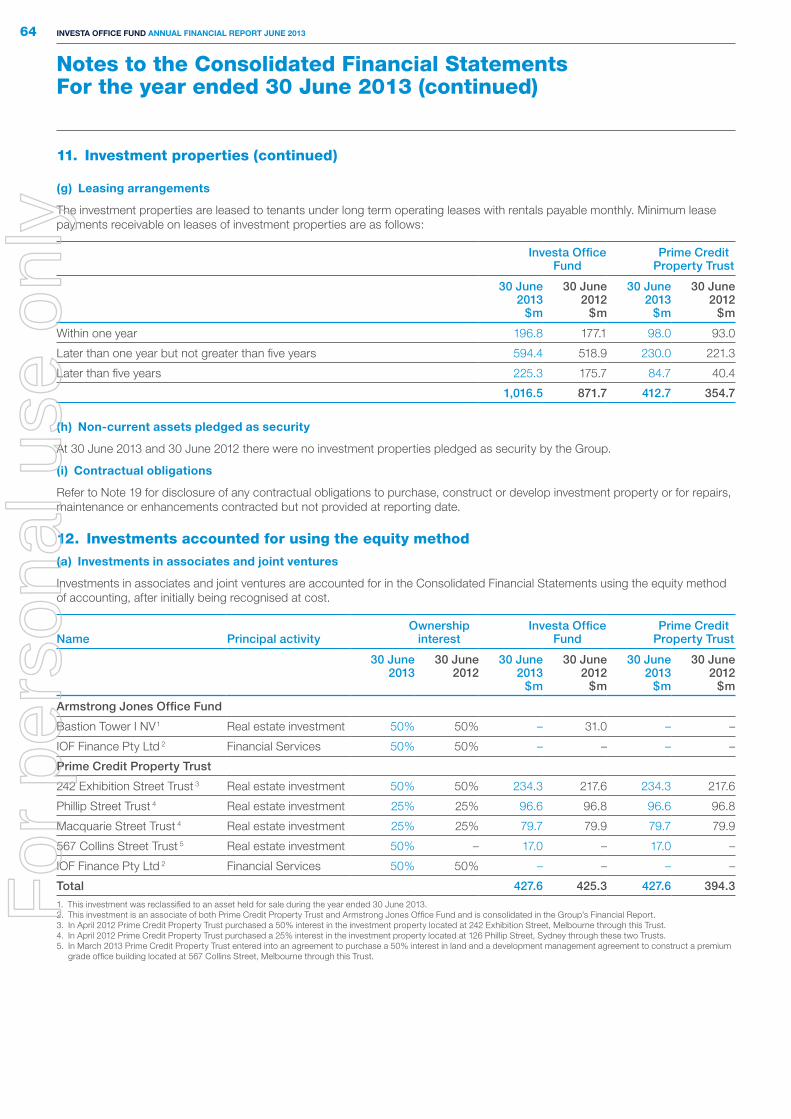
Notes to the Consolidated Financial StatementsFor the year ended 30 June 2013 (continued)
64 Investa OffIce fund annual fInancIal RepORt June 2013
(g) leasing arrangements
The investment properties are leased to tenants under long term operating leases with rentals payable monthly. Minimum lease payments receivable on leases of investment properties are as follows:
Investa Office Fund
Prime Credit Property Trust
30 June 2013
$m
30 June 2012
$m
30 June 2013
$m
30 June 2012
$m
Within one year 196.8 177.1 98.0 93.0
Later than one year but not greater than five years 594.4 518.9 230.0 221.3
Later than five years 225.3 175.7 84.7 40.4
1,016.5 871.7 412.7 354.7
(h) non-current assets pledged as security
At 30 June 2013 and 30 June 2012 there were no investment properties pledged as security by the Group.
(i) contractual obligations
Refer to Note 19 for disclosure of any contractual obligations to purchase, construct or develop investment property or for repairs, maintenance or enhancements contracted but not provided at reporting date.
12. investments accounted for using the equity method
(a) Investments in associates and joint ventures
Investments in associates and joint ventures are accounted for in the Consolidated Financial Statements using the equity method of accounting, after initially being recognised at cost.
Name Principal activityOwnership
interestInvesta Office
FundPrime Credit
Property Trust
30 June 2013
30 June 2012
30 June 2013
$m
30 June 2012
$m
30 June 2013
$m
30 June 2012
$m
Armstrong Jones Office Fund
Bastion Tower I NV1 Real estate investment 50% 50% – 31.0 – –
IOF Finance Pty Ltd 2 Financial Services 50% 50% – – – –
Prime Credit Property Trust
242 Exhibition Street Trust 3 Real estate investment 50% 50% 234.3 217.6 234.3 217.6
Phillip Street Trust 4 Real estate investment 25% 25% 96.6 96.8 96.6 96.8
Macquarie Street Trust 4 Real estate investment 25% 25% 79.7 79.9 79.7 79.9
567 Collins Street Trust 5 Real estate investment 50% – 17.0 – 17.0 –
IOF Finance Pty Ltd 2 Financial Services 50% 50% – – – –
Total 427.6 425.3 427.6 394.3 1. This investment was reclassified to an asset held for sale during the year ended 30 June 2013. 2. This investment is an associate of both Prime Credit Property Trust and Armstrong Jones Office Fund and is consolidated in the Group’s Financial Report.3. In April 2012 Prime Credit Property Trust purchased a 50% interest in the investment property located at 242 Exhibition Street, Melbourne through this Trust.4. In April 2012 Prime Credit Property Trust purchased a 25% interest in the investment property located at 126 Phillip Street, Sydney through these two Trusts.5. In March 2013 Prime Credit Property Trust entered into an agreement to purchase a 50% interest in land and a development management agreement to construct a premium
grade office building located at 567 Collins Street, Melbourne through this Trust.
11. investment properties (continued)
For
per
sona
l use
onl
y
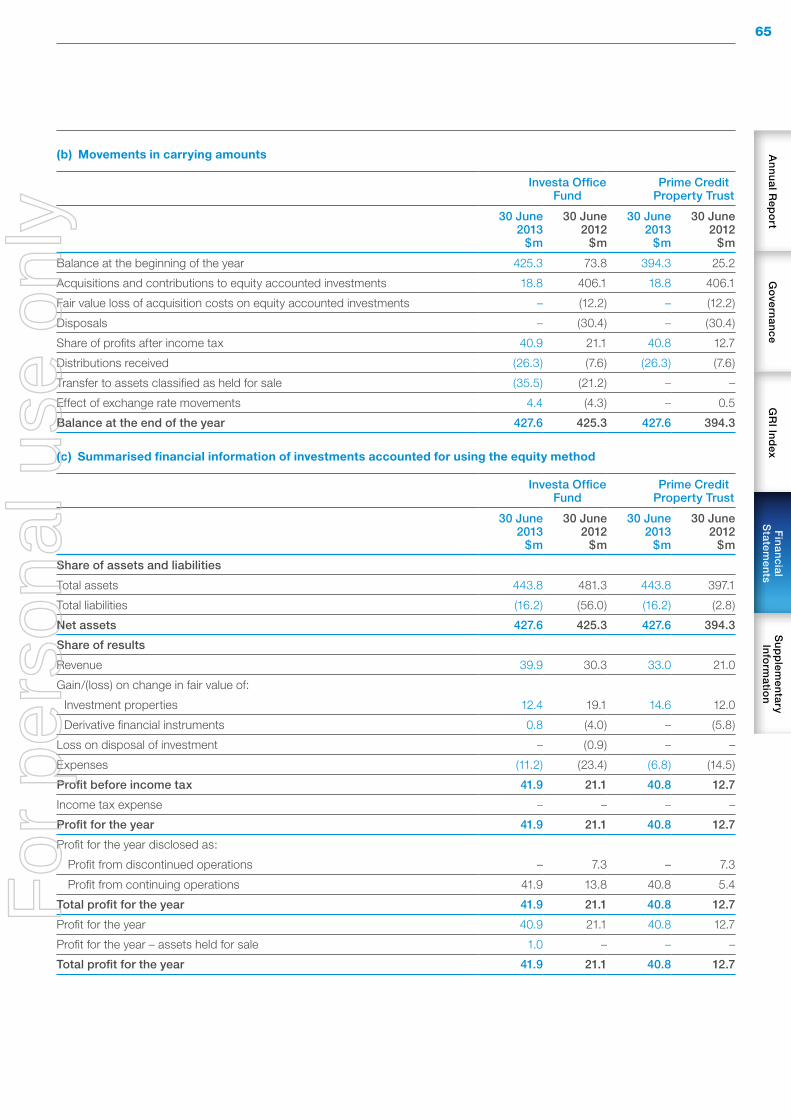
65A
nn
ua
l Rep
ort
Go
verna
nce
GR
I Ind
exF
ina
ncia
l S
tatemen
tsS
up
plem
enta
ry In
form
ation
(b) Movements in carrying amounts
Investa Office Fund
Prime Credit Property Trust
30 June 2013
$m
30 June 2012
$m
30 June 2013
$m
30 June 2012
$m
Balance at the beginning of the year 425.3 73.8 394.3 25.2
Acquisitions and contributions to equity accounted investments 18.8 406.1 18.8 406.1
Fair value loss of acquisition costs on equity accounted investments – (12.2) – (12.2)
Disposals – (30.4) – (30.4)
Share of profits after income tax 40.9 21.1 40.8 12.7
Distributions received (26.3) (7.6) (26.3) (7.6)
Transfer to assets classified as held for sale (35.5) (21.2) – –
Effect of exchange rate movements 4.4 (4.3) – 0.5
Balance at the end of the year 427.6 425.3 427.6 394.3
(c) summarised financial information of investments accounted for using the equity method
Investa Office Fund
Prime Credit Property Trust
30 June 2013
$m
30 June 2012
$m
30 June 2013
$m
30 June 2012
$m
Share of assets and liabilities
Total assets 443.8 481.3 443.8 397.1
Total liabilities (16.2) (56.0) (16.2) (2.8)
Net assets 427.6 425.3 427.6 394.3
Share of results
Revenue 39.9 30.3 33.0 21.0
Gain/(loss) on change in fair value of:
Investment properties 12.4 19.1 14.6 12.0
Derivative financial instruments 0.8 (4.0) – (5.8)
Loss on disposal of investment – (0.9) – –
Expenses (11.2) (23.4) (6.8) (14.5)
Profit before income tax 41.9 21.1 40.8 12.7
Income tax expense – – – –
Profit for the year 41.9 21.1 40.8 12.7
Profit for the year disclosed as:
Profit from discontinued operations – 7.3 – 7.3
Profit from continuing operations 41.9 13.8 40.8 5.4
Total profit for the year 41.9 21.1 40.8 12.7
Profit for the year 40.9 21.1 40.8 12.7
Profit for the year – assets held for sale 1.0 – – –
Total profit for the year 41.9 21.1 40.8 12.7
For
per
sona
l use
onl
y
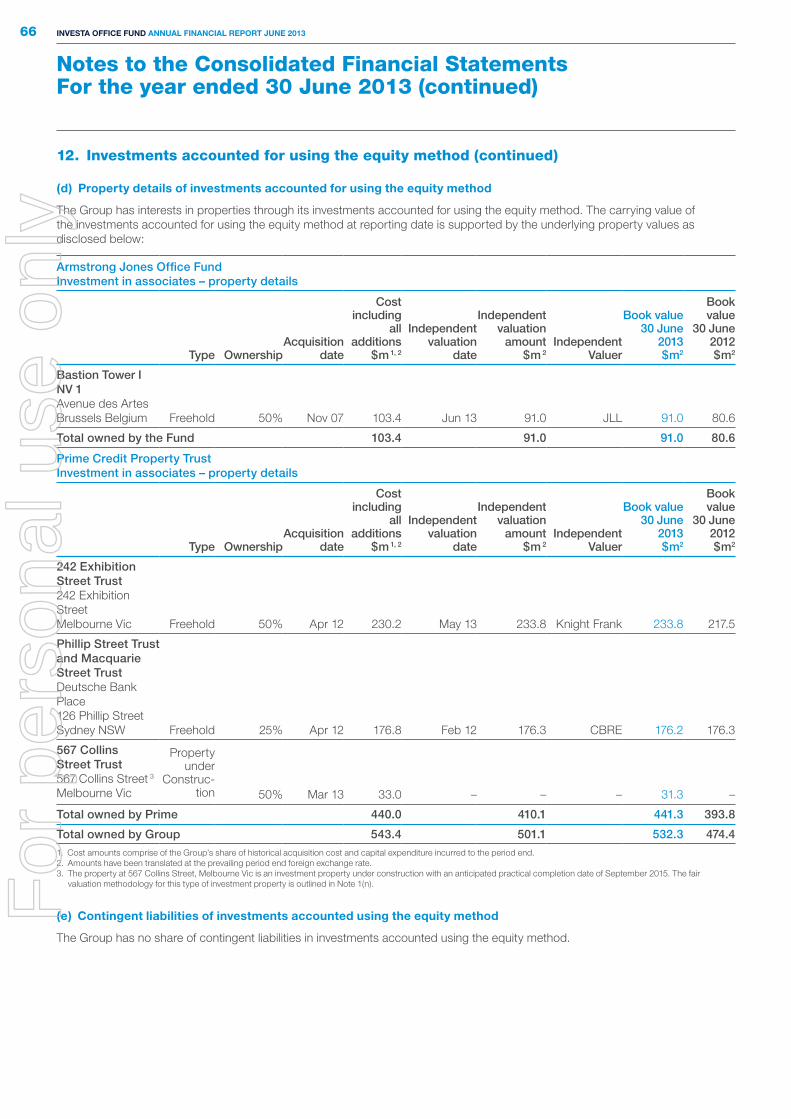
Notes to the Consolidated Financial StatementsFor the year ended 30 June 2013 (continued)
66 Investa OffIce fund annual fInancIal RepORt June 2013
(d) property details of investments accounted for using the equity method
The Group has interests in properties through its investments accounted for using the equity method. The carrying value of the investments accounted for using the equity method at reporting date is supported by the underlying property values as disclosed below:
Armstrong Jones Office Fund Investment in associates – property details
Type
OwnershipAcquisition
date
Cost including
all additions
$m 1, 2
Independent valuation
date
Independent valuation
amount $m 2
Independent Valuer
Book value 30 June
2013 $m2
Book value
30 June 2012 $m2
Bastion Tower I NV 1 Avenue des Artes Brussels Belgium Freehold 50% Nov 07 103.4 Jun 13 91.0 JLL 91.0 80.6
Total owned by the Fund 103.4 91.0 91.0 80.6
Prime Credit Property Trust Investment in associates – property details
Type OwnershipAcquisition
date
Cost including
all additions
$m 1, 2
Independent valuation
date
Independent valuation
amount $m 2
Independent Valuer
Book value 30 June
2013 $m2
Book value
30 June 2012 $m2
242 Exhibition Street Trust 242 Exhibition Street Melbourne Vic Freehold 50% Apr 12 230.2 May 13 233.8 Knight Frank 233.8 217.5
Phillip Street Trust and Macquarie Street Trust Deutsche Bank Place 126 Phillip Street Sydney NSW Freehold 25% Apr 12 176.8 Feb 12 176.3 CBRE 176.2 176.3
567 Collins Street Trust 567 Collins Street 3 Melbourne Vic
Property under
Construc-tion 50% Mar 13 33.0 – – – 31.3 –
Total owned by Prime 440.0 410.1 441.3 393.8
Total owned by Group 543.4 501.1 532.3 474.41. Cost amounts comprise of the Group’s share of historical acquisition cost and capital expenditure incurred to the period end.2. Amounts have been translated at the prevailing period end foreign exchange rate.3. The property at 567 Collins Street, Melbourne Vic is an investment property under construction with an anticipated practical completion date of September 2015. The fair
valuation methodology for this type of investment property is outlined in Note 1(n).
(e) contingent liabilities of investments accounted using the equity method
The Group has no share of contingent liabilities in investments accounted using the equity method.
12. investments accounted for using the equity method (continued)
For
per
sona
l use
onl
y

67A
nn
ua
l Rep
ort
Go
verna
nce
GR
I Ind
exF
ina
ncia
l S
tatemen
tsS
up
plem
enta
ry In
form
ation
13. Trade and other payables
Investa Office Fund
Prime Credit Property Trust
Current
30 June 2013
$m
30 June 2012
$m
30 June 2013
$m
30 June 2012
$m
Trade payables 10.4 10.3 5.2 4.4
Loan from stapled entity 1 – – – 2.9
Payables to equity accounted investments 2 – 3.2 – –
Other payables 14.3 11.4 8.0 6.6
24.7 24.9 13.2 13.91. This loan is from Armstrong Jones Office Fund which is in the Group. This loan was interest bearing.2. This loan to Bastion Tower I NV, Belgium has been transferred to liabilities directly associated with assets classed as held for sale. See Note 5(c).
14. Borrowings
Investa Office Fund
Prime Credit Property Trust
30 June 2013
$m
30 June 2012
$m
30 June 2013
$m
30 June 2012
$m
Non-current liabilities
Bank debt (AUD$) – unsecured (a) 275.0 268.0 177.0 68.0
Bank debt (€) – unsecured 217.9 191.1 – –
Medium Term Note (AUD$) – unsecured (d) 125.0 – – –
617.9 459.1 177.0 68.0
Capitalised commitments and upfront fees (1.4) (1.3) (0.2) (0.7)
Total 616.5 457.8 176.8 67.3
(a) new bank debt
On the 4 April 2013, the Group entered into new bank facility agreements. The new bank facilities provide the Group the ability to draw an additional $150.0 million on or after 27 June 2013 with a maturity date of 5 August 2016. The terms and conditions of the new syndicate bank debt are consistent with the Group’s pre-existing syndicate facility.
(b) existing syndicated bank debt
During the year ended 30 June 2013, the Group repaid and cancelled Facility B on its existing syndicate debt facility.
(c) u.s. private placement
On the 3 June 2013, the Responsible Entity on behalf of Prime entered into a 12 year U.S. Private Placement (“USPP”) through the issue of US$125.0 million with a coupon rate of 3.98% payable on a semi-annual basis.
The USPP settled on the 12 August 2013 with the funds received used to repay existing syndicated bank debt. This settlement is further outlined as a subsequent event in Note 27.
(d) Medium term note
During the year ended 30 June 2013, the Group issued a five year Medium Term Note (“MTN”) for A$125.0 million with a 5.4% coupon rate paid semi-annually, which will mature on 7 November 2017. Proceeds were used to repay existing syndicated bank debt.F
or p
erso
nal u
se o
nly

Notes to the Consolidated Financial StatementsFor the year ended 30 June 2013 (continued)
68 Investa OffIce fund annual fInancIal RepORt June 2013
(e) financing arrangements
At 30 June 2013 the Group had unsecured bank facilities and an unsecured medium term note debt facility each with specific maturities and limits as detailed below:
Investa Office Fund
30 June 2013 30 June 2012
Limit $m
Drawn 2 $m
Undrawn $m
Limit $m
Drawn 2 $m
Undrawn $m
Maturity Date
Syndicated bank debt – unsecured
Facility A (multi-currency) 353.1 275.0 78.1 353.1 140.0 213.1 Aug 2014
Facility B (AUD$) – – – 150.0 128.0 22.0 Apr 2015
Facility C (€)1 211.4 211.4 – 185.4 185.4 – Aug 2014
Facility D (€)1 12.7 6.5 6.2 11.1 5.7 5.4 Aug 2014
Bilateral facilities (multi-currency) 150.0 – 150.0 – – – Aug 2016
727.2 492.9 234.3 699.6 459.1 240.5
Medium Term Note (AUD$) – unsecured 125.0 125.0 – – – – Nov 2017
Total 852.2 617.9 234.3 699.6 459.1 240.51. Tranche C and D amounts have been translated at the prevailing period end foreign exchange rate.2. At 30 June 2013 $177.0 million and $nil (30 June 2012: $nil and $68.0 million) were drawn by Prime under tranche A and B respectively.
The unsecured bank facilities and the MTN facility have a number of market standard terms and conditions and undertakings that include the maintenance of the following financial ratios:
(i) total look-through liabilities will not exceed 50% of look-through total tangible assets; and
(ii) earnings before borrowing costs and taxation will not be less than 2.5 times borrowing costs.
The Trusts complied with the bank debt and MTN facility financial ratios during the year and are expected to remain compliant with the loan covenants.
(f) Risk exposure and fair value disclosures
Refer to Note 21 for further details on the Group’s exposure to risk arising from borrowings, the maturity profile and the fair value of borrowings.
15. Non-current deferred tax liabilities
Investa Office Fund
Prime Credit Property Trust
30 June 2013
$m
30 June 2012
$m
30 June 2013
$m
30 June 2012
$m
Total deferred tax liabilities attributable to investment properties – 0.2 – –
Deferred tax benefit recognised in the Income Statement in respect of deferred tax liabilities is attributable to temporary differences from investments – (56.7) – (54.5)
14. Borrowings (continued)
For
per
sona
l use
onl
y

69A
nn
ua
l Rep
ort
Go
verna
nce
GR
I Ind
exF
ina
ncia
l S
tatemen
tsS
up
plem
enta
ry In
form
ation
16. Contributed equity
(a) carrying amounts
Investa Office Fund
Prime Credit Property Trust
30 June 2013
$m
30 June 2012
$m
30 June 2013
$m
30 June 2012
$m
Balance at the beginning of year 2,142.3 2,308.2 1,193.8 1,282.9
Purchased during the year:
Unit buyback (c) – (165.9) – (89.1)
Balance at the end of the year 2,142.3 2,142.3 1,193.8 1,193.8
The balance at the end of the year is attributable to the unitholders of:
Armstrong Jones Office Fund 948.5 948.5 – –
Prime Credit Property Trust 1,193.8 1,193.8 1,193.8 1,193.8
2,142.3 2,142.3 1,193.8 1,193.8
(b) number of issued units
30 June 2013
millions
30 June 2012
millions
30 June 2013
millions
30 June 2012
millions
Balance at the beginning of the year 614.1 2,729.1 614.1 2,729.1
Unit buyback (c) – (272.9) – (272.9)
Unit consolidation (d) – (1,842.1) – (1,842.1)
Balance at the end of the year 614.1 614.1 614.1 614.1
(c) unit buyback
During the year ended 30 June 2012, the Group completed a buyback for 10% of its issued units. This resulted in the buyback of 272.9 million (pre-unit consolidation) units at an average price of $0.61, for a total payment of $165.9 million. $89.1 million of this amount has been allocated to Prime based on Prime’s share of the Group unitholders’ interest as at 30 June 2011. The number of units on issue after the buyback was 2,456.2 million (pre-unit consolidation). There is no current on-market buyback.
(d) unit consolidation
In April 2012, the Group undertook a consolidation of its units on the basis of one new unit for every four pre-consolidation units. Where the consolidation of a holding resulted in a fractional unit, that fraction was rounded up to the next whole unit. This resulted in the number of units on issue moving from 2,456.2 million to 614.1 million with a corresponding theoretical increase in the unit price by approximately 4 times the pre-consolidation price. This consolidation did not materially change or decrease the underlying value of a unitholder’s aggregate unitholding in the Group.
(e) terms of units
All units are fully paid and rank equally with each other for all purposes. Each unit entitles the holder to one vote, in person or by proxy, at a meeting of unitholders.
(f) capital risk management
Refer to Note 20 for the Capital Management strategy for the Group. For
per
sona
l use
onl
y
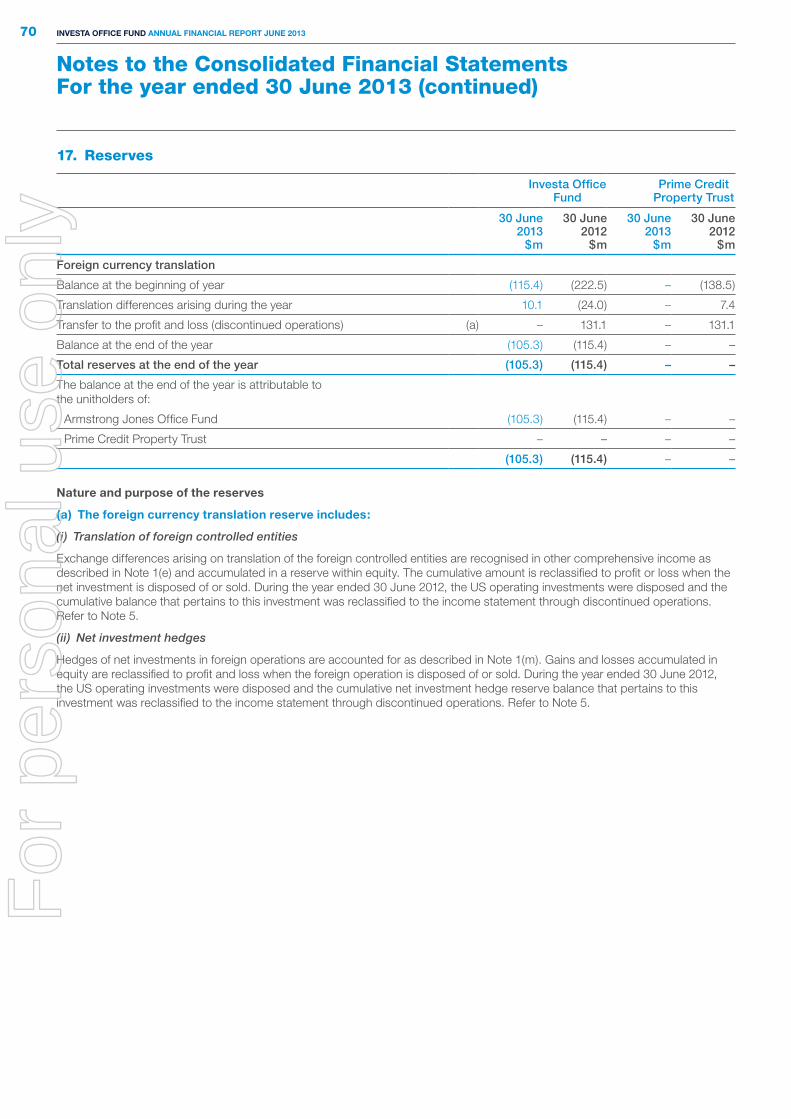
Notes to the Consolidated Financial StatementsFor the year ended 30 June 2013 (continued)
70 Investa OffIce fund annual fInancIal RepORt June 2013
17. Reserves
Investa Office Fund
Prime Credit Property Trust
30 June 2013
$m
30 June 2012
$m
30 June 2013
$m
30 June 2012
$m
Foreign currency translation
Balance at the beginning of year (115.4) (222.5) – (138.5)
Translation differences arising during the year 10.1 (24.0) – 7.4
Transfer to the profit and loss (discontinued operations) (a) – 131.1 – 131.1
Balance at the end of the year (105.3) (115.4) – –
Total reserves at the end of the year (105.3) (115.4) – –
The balance at the end of the year is attributable to the unitholders of:
Armstrong Jones Office Fund (105.3) (115.4) – –
Prime Credit Property Trust – – – –
(105.3) (115.4) – –
nature and purpose of the reserves
(a) the foreign currency translation reserve includes:
(i) Translation of foreign controlled entities
Exchange differences arising on translation of the foreign controlled entities are recognised in other comprehensive income as described in Note 1(e) and accumulated in a reserve within equity. The cumulative amount is reclassified to profit or loss when the net investment is disposed of or sold. During the year ended 30 June 2012, the US operating investments were disposed and the cumulative balance that pertains to this investment was reclassified to the income statement through discontinued operations. Refer to Note 5.
(ii) Net investment hedges
Hedges of net investments in foreign operations are accounted for as described in Note 1(m). Gains and losses accumulated in equity are reclassified to profit and loss when the foreign operation is disposed of or sold. During the year ended 30 June 2012, the US operating investments were disposed and the cumulative net investment hedge reserve balance that pertains to this investment was reclassified to the income statement through discontinued operations. Refer to Note 5.
For
per
sona
l use
onl
y
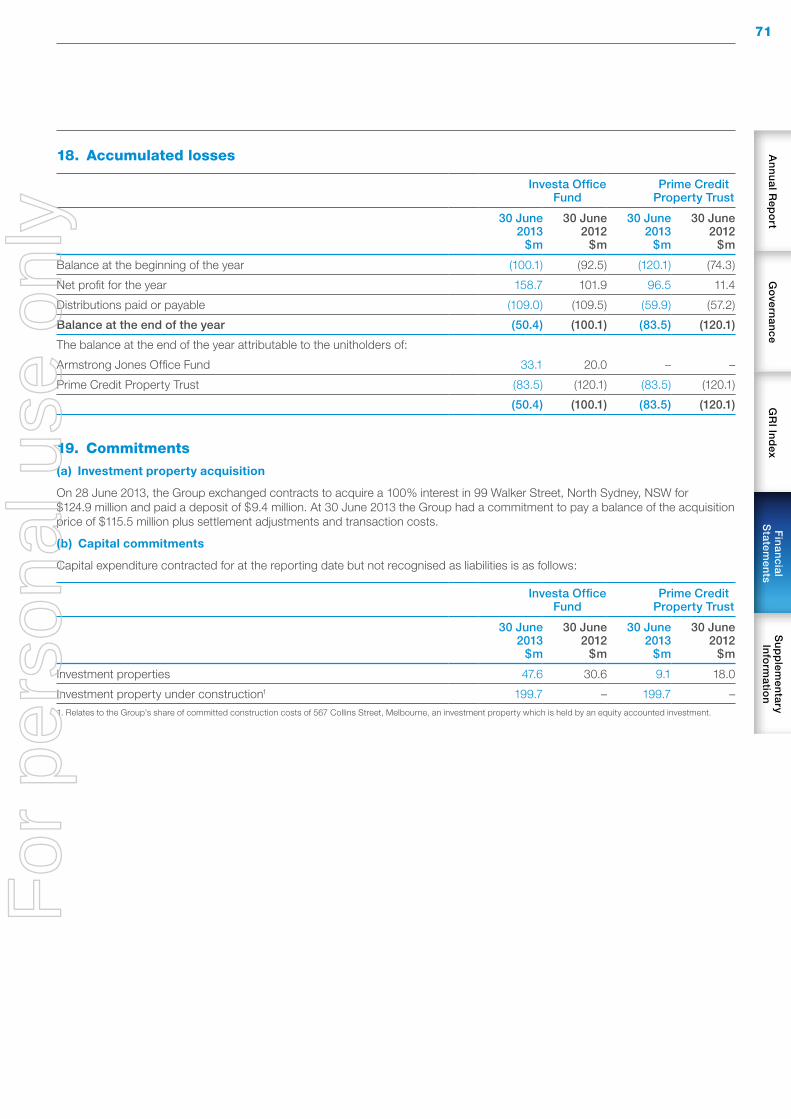
71A
nn
ua
l Rep
ort
Go
verna
nce
GR
I Ind
exF
ina
ncia
l S
tatemen
tsS
up
plem
enta
ry In
form
ation
18. Accumulated losses
Investa Office Fund
Prime Credit Property Trust
30 June 2013
$m
30 June 2012
$m
30 June 2013
$m
30 June 2012
$m
Balance at the beginning of the year (100.1) (92.5) (120.1) (74.3)
Net profit for the year 158.7 101.9 96.5 11.4
Distributions paid or payable (109.0) (109.5) (59.9) (57.2)
Balance at the end of the year (50.4) (100.1) (83.5) (120.1)
The balance at the end of the year attributable to the unitholders of:
Armstrong Jones Office Fund 33.1 20.0 – –
Prime Credit Property Trust (83.5) (120.1) (83.5) (120.1)
(50.4) (100.1) (83.5) (120.1)
19. Commitments
(a) Investment property acquisition
On 28 June 2013, the Group exchanged contracts to acquire a 100% interest in 99 Walker Street, North Sydney, NSW for $124.9 million and paid a deposit of $9.4 million. At 30 June 2013 the Group had a commitment to pay a balance of the acquisition price of $115.5 million plus settlement adjustments and transaction costs.
(b) capital commitments
Capital expenditure contracted for at the reporting date but not recognised as liabilities is as follows:
Investa Office Fund
Prime Credit Property Trust
30 June 2013
$m
30 June 2012
$m
30 June 2013
$m
30 June 2012
$m
Investment properties 47.6 30.6 9.1 18.0
Investment property under construction1 199.7 – 199.7 –1. Relates to the Group’s share of committed construction costs of 567 Collins Street, Melbourne, an investment property which is held by an equity accounted investment.
For
per
sona
l use
onl
y

Notes to the Consolidated Financial StatementsFor the year ended 30 June 2013 (continued)
72 Investa OffIce fund annual fInancIal RepORt June 2013
20. Capital management
The Group aims to meet its strategic objectives and operational needs to maximise returns to unitholders through the appropriate use of debt and equity, taking into account the additional financial risks of using debt.
In determining the optimal capital structure, the Group takes into account a number of factors including the capital needs of its portfolio; the relative cost of debt versus equity; the execution risk of raising equity or debt; the additional financial risks of debt including increased volatility of earnings due to exposure to interest rate movements; the liquidity risk of maturing debt facilities; the potential for acceleration prior to maturity; and the market in general.
In assessing this risk, the Group takes into account the relative security of its income flows, the predictability of its expenses, its debt profile, the degree of hedging and the overall level of debt as measured by gearing.
The actual capital structure at a point in time is the product of a number of factors, many of which are market driven and to various degrees outside of the control of the Group, particularly the impact of revaluations on gearing levels, the availability of new equity and the liquidity in real estate markets. While the Group periodically reviews the optimal capital structure, the ability to achieve the optimal structure may be impacted by market conditions and the actual position may often differ from the initial position. The Group’s capital position is primarily monitored through its ratio of total liabilities to total assets (“Leverage Ratio”), calculated on a look-through basis, in which the Group’s interest in its joint ventures, associates and financial assets at fair value through profit or loss are proportionately consolidated based on the Group’s ownership interest. The Group’s medium term strategy is to maintain the Leverage Ratio in the range of 25% to 35%. The actual Leverage Ratio may vary from this range in the short term from time to time.
At 30 June 2013, the Leverage Ratio was 29.9% (30 June 2012: 26.0%), calculated as follows:
Investa Office Fund
30 June 2013
$m
30 June 2012
$m
Look-through ratio of total liabilities to total assets
Total consolidated liabilities 737.2 575.8
Plus share of liabilities of:
Financial asset at fair value through profit or loss 75.9 67.9
Equity accounted investments 16.2 56.0
Assets classified as held for sale 60.0 –
Less elimination of receivables from and payables to equity accounted investments (43.4) (23.7)
Total look-through liabilities 845.9 676.0
Total consolidated assets 2,723.8 2,502.6
Less:
Financial asset at fair value through profit or loss (257.3) (247.2)
Equity accounted investments (427.6) (425.3)
Equity accounted investments classified as held for sale (59.4) (21.2)
Plus share of assets of:
Financial asset at fair value through profit or loss 333.2 315.1
Equity accounted investments 443.8 481.3
Equity accounted investments classified as held for sale 119.4 21.2
Less elimination of receivables from and payables to equity accounted investments (43.4) (23.7)
Total look-through assets 2,832.5 2,602.8
Leverage ratio 29.9% 26.0%
The leveraged ratio is also used to determine compliance with the Group’s bank debt facilities and medium term note debt facility as at 30 June 2013. Refer to Note 14 for details.
For
per
sona
l use
onl
y
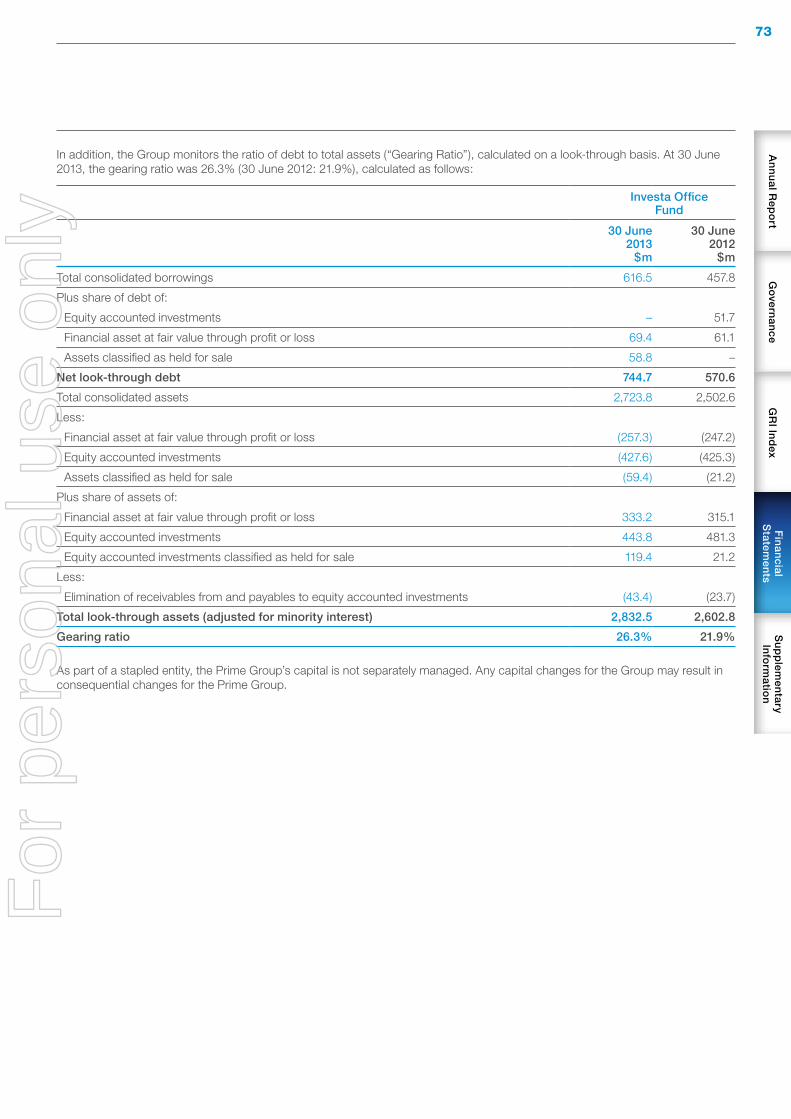
73A
nn
ua
l Rep
ort
Go
verna
nce
GR
I Ind
exF
ina
ncia
l S
tatemen
tsS
up
plem
enta
ry In
form
ation
In addition, the Group monitors the ratio of debt to total assets (“Gearing Ratio”), calculated on a look-through basis. At 30 June 2013, the gearing ratio was 26.3% (30 June 2012: 21.9%), calculated as follows:
Investa Office Fund
30 June 2013
$m
30 June 2012
$m
Total consolidated borrowings 616.5 457.8
Plus share of debt of:
Equity accounted investments – 51.7
Financial asset at fair value through profit or loss 69.4 61.1
Assets classified as held for sale 58.8 –
Net look-through debt 744.7 570.6
Total consolidated assets 2,723.8 2,502.6
Less:
Financial asset at fair value through profit or loss (257.3) (247.2)
Equity accounted investments (427.6) (425.3)
Assets classified as held for sale (59.4) (21.2)
Plus share of assets of:
Financial asset at fair value through profit or loss 333.2 315.1
Equity accounted investments 443.8 481.3
Equity accounted investments classified as held for sale 119.4 21.2
Less:
Elimination of receivables from and payables to equity accounted investments (43.4) (23.7)
Total look-through assets (adjusted for minority interest) 2,832.5 2,602.8
Gearing ratio 26.3% 21.9%
As part of a stapled entity, the Prime Group’s capital is not separately managed. Any capital changes for the Group may result in consequential changes for the Prime Group.
For
per
sona
l use
onl
y

Notes to the Consolidated Financial StatementsFor the year ended 30 June 2013 (continued)
74 Investa OffIce fund annual fInancIal RepORt June 2013
21. Financial risk management
Introduction
The Group’s principal financial instruments comprise receivables, payables, interest bearing liabilities, other financial liabilities, cash and short-term deposits, financial asset at fair value through profit or loss and derivative financial instruments.
The Group’s activities expose it to a variety of financial risks:
(a) Market risk;
(b) Credit risk; and
(c) Liquidity risk
The Group’s overall risk management program focuses on the unpredictability of financial markets and seeks to minimise potential adverse effects on the financial performance of the Group. The Group uses derivative financial instruments such as interest rate swaps, interest rate caps and foreign exchange contracts to hedge certain risk exposures. Derivatives are exclusively used for hedging purposes and not as trading or other speculative instruments. The Group uses different methods to measure different types of risk to which it is exposed. These methods include sensitivity analysis in the case of interest rate risk, foreign exchange and other price risks and ageing analysis for credit risk.
(a) Market risk
Market risk comprises of mainly three types of risk. They are:
(i) Interest rate risk;
(ii) Foreign exchange risk; and
(iii) Price risk
(i) Interest rate risk
Interest rate risk is the risk that the fair value of future cash flows of a financial instrument will fluctuate because of changes in market interest rates. The primary objective of interest risk management is to manage the potential for financial loss measured in terms of impact on earnings arising from unfavourable movements in interest rates.
The Group’s main interest rate risk arises from borrowings. Borrowings issued at variable rates expose the Group to cash flow interest rate risk. The Group’s preference is to protect itself from large and rapid movements in financial markets, to achieve a less volatile exposure to movements in interest rates through prudent risk management techniques. The Group’s policy is to hedge the Group’s forecast borrowings using interest rate derivatives based on the following hedge ratio limit ranges.
Hedge ratio limit range
1 – 3 years 30% – 80%
4 – 5 years 20% – 80%
5+ years 0% – 75%
The Group analyses its interest rate exposure on a regular basis. Various scenarios are simulated taking into consideration refinancing, renewal of existing positions and hedging. Based on these scenarios, the Group calculates the impact on profit or loss of a defined interest rate shift. The scenarios are run only for liabilities that represent the major interest-bearing positions. The simulation is done on a regular basis to verify that the maximum loss potential is within limit established by the Responsible Entity.
Based on the various scenarios, the Group manages its cash flow interest rate risk by using:
> floating-to-fixed interest rate swaps (or swaptions);
> interest rate caps; and
> cross currency interest rate swaps.
Interest rate swaps have the economic effect of converting borrowings from floating rates to fixed rates or from fixed to floating. Generally, the Group raises borrowings some of which are at floating rates and swaps them into fixed rates that are lower than those available if the Group borrowed at fixed rates directly. Under the interest rate swaps, the Group agrees with other parties to exchange, at specified intervals (mainly quarterly), the difference between fixed contract rates and floating-rate interest amounts calculated by reference to the agreed notional principal amounts.
Interest rate caps are derivatives that provide the Group with an upper limit at which the Group will no longer be exposed to increases to floating interest rates.
Cross currency swaps minimise both interest rate and exchange rate risk exposure on foreign borrowings. As a result of issuing USPP medium term notes as outlined in Note 27 the Group and Prime have entered into a cross currency swap which covers 100% of the USPP principals outstanding and are timed to expire when the private placement matures. This swap also swaps the obligation to pay fixed interest to floating interest.
For
per
sona
l use
onl
y
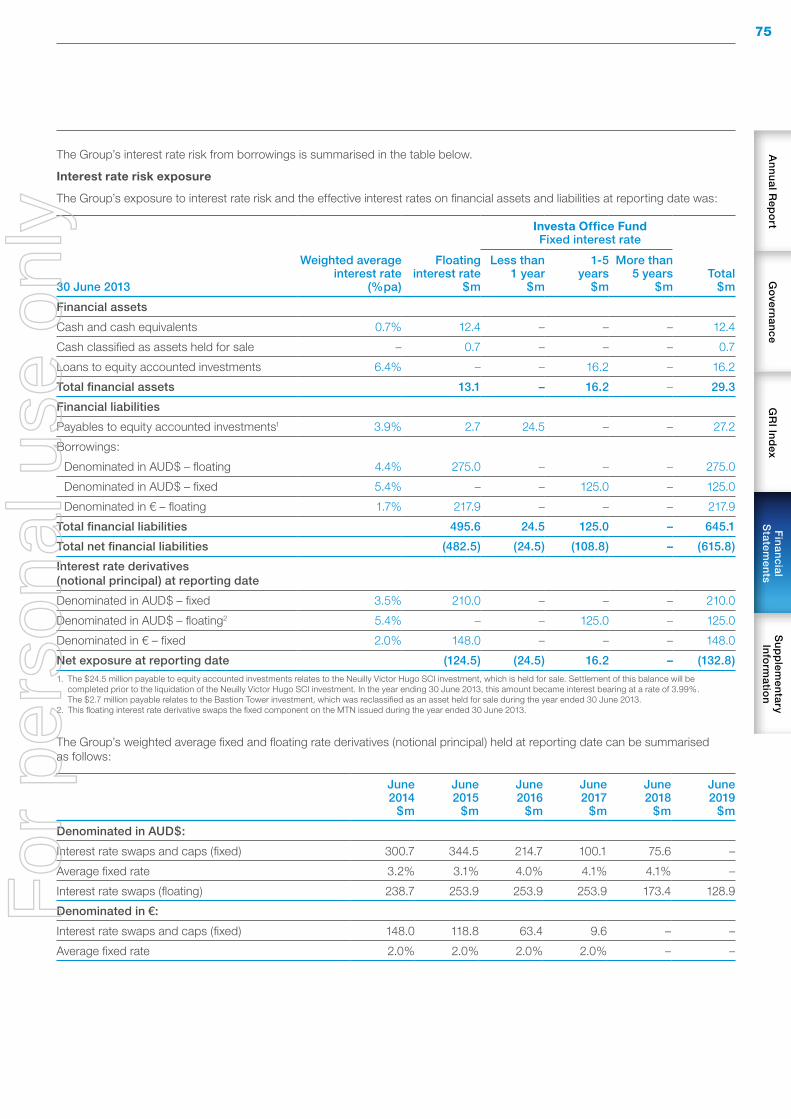
75A
nn
ua
l Rep
ort
Go
verna
nce
GR
I Ind
exF
ina
ncia
l S
tatemen
tsS
up
plem
enta
ry In
form
ation
The Group’s interest rate risk from borrowings is summarised in the table below.
Interest rate risk exposure
The Group’s exposure to interest rate risk and the effective interest rates on financial assets and liabilities at reporting date was:
Investa Office fund Fixed interest rate
30 June 2013
Weighted average interest rate
(%pa)
Floating interest rate
$m
Less than 1 year
$m
1-5 years
$m
More than 5 years
$mTotal
$m
Financial assets
Cash and cash equivalents 0.7% 12.4 – – – 12.4
Cash classified as assets held for sale – 0.7 – – – 0.7
Loans to equity accounted investments 6.4% – – 16.2 – 16.2
Total financial assets 13.1 – 16.2 – 29.3
Financial liabilities
Payables to equity accounted investments1 3.9% 2.7 24.5 – – 27.2
Borrowings:
Denominated in AUD$ – floating 4.4% 275.0 – – – 275.0
Denominated in AUD$ – fixed 5.4% – – 125.0 – 125.0
Denominated in € – floating 1.7% 217.9 – – – 217.9
Total financial liabilities 495.6 24.5 125.0 – 645.1
Total net financial liabilities (482.5) (24.5) (108.8) – (615.8)
Interest rate derivatives (notional principal) at reporting date
Denominated in AUD$ – fixed 3.5% 210.0 – – – 210.0
Denominated in AUD$ – floating2 5.4% – – 125.0 – 125.0
Denominated in € – fixed 2.0% 148.0 – – – 148.0
Net exposure at reporting date (124.5) (24.5) 16.2 – (132.8)1. The $24.5 million payable to equity accounted investments relates to the Neuilly Victor Hugo SCI investment, which is held for sale. Settlement of this balance will be
completed prior to the liquidation of the Neuilly Victor Hugo SCI investment. In the year ending 30 June 2013, this amount became interest bearing at a rate of 3.99%. The $2.7 million payable relates to the Bastion Tower investment, which was reclassified as an asset held for sale during the year ended 30 June 2013.
2. This floating interest rate derivative swaps the fixed component on the MTN issued during the year ended 30 June 2013.
The Group’s weighted average fixed and floating rate derivatives (notional principal) held at reporting date can be summarised as follows:
June 2014
$m
June 2015
$m
June 2016
$m
June 2017
$m
June 2018
$m
June 2019
$m
Denominated in AUD$:
Interest rate swaps and caps (fixed) 300.7 344.5 214.7 100.1 75.6 –
Average fixed rate 3.2% 3.1% 4.0% 4.1% 4.1% –
Interest rate swaps (floating) 238.7 253.9 253.9 253.9 173.4 128.9
Denominated in €:
Interest rate swaps and caps (fixed) 148.0 118.8 63.4 9.6 – –
Average fixed rate 2.0% 2.0% 2.0% 2.0% – –
For
per
sona
l use
onl
y

Notes to the Consolidated Financial StatementsFor the year ended 30 June 2013 (continued)
76 Investa OffIce fund annual fInancIal RepORt June 2013
Other financial instruments of the Group not included in the above tables are non-interest bearing and therefore not subject to interest rate risk.
The Group’s exposure to interest rate risk and the effective interest rates on financial assets and liabilities at the end of the previous financial year was:
Investa Office fund Fixed interest rate
30 June 2012
Weighted average interest rate
(%pa)
Floating interest rate
$m
Less than 1 year
$m
1-5 years
$m
More than 5 years
$mTotal
$m
Financial assets
Cash and cash equivalents 2.2% 18.2 – – – 18.2
Cash classified as assets held for sale 0.3% 4.8 – – – 4.8
Total financial assets 23.0 – – – 23.0
Financial liabilities
Borrowings:
Denominated in AUD$ – floating 4.9% 268.0 – – – 268.0
Denominated in € – floating 2.2% 191.1 – – – 191.1
Total financial liabilities 459.1 – – – 459.1
Total net financial liabilities (436.1) – – – (436.1)
Interest rate derivatives (notional principal) at reporting date
Denominated in AUD$ – fixed 4.2% 210.0 – – – 210.0
Denominated in € – floating 2.9% 105.0 – – – 105.0
Net exposure at reporting date (121.1) – – – (121.1)
The Group’s weighted average fixed rate derivatives (notional principal) held at the end of the previous financial year can be summarised as follows:
June 2014
$m
June 2015
$m
June 2016
$m
June 2017
$m
June 2018
$m
June 2019
$m
Denominated in AUD$:
Interest rate swaps and caps (fixed) 210.0 178.0 85.0 100.0 100.0 75.0
Average fixed rate 4.2% 4.2% 4.3% 4.1% 4.1% 4.1%
Denominated in €:
Interest rate swaps and caps (fixed) 173.0 154.4 98.9 55.6 4.6 –
Average fixed rate 2.6% 2.3% 2.0% 2.0% 2.0% –
Other financial instruments of the Group not included in the above tables are non-interest bearing and therefore not subject to interest rate risk.
21. Financial risk management (continued)
(a) Market risk (continued)
(i) Interest rate risk (continued)
For
per
sona
l use
onl
y
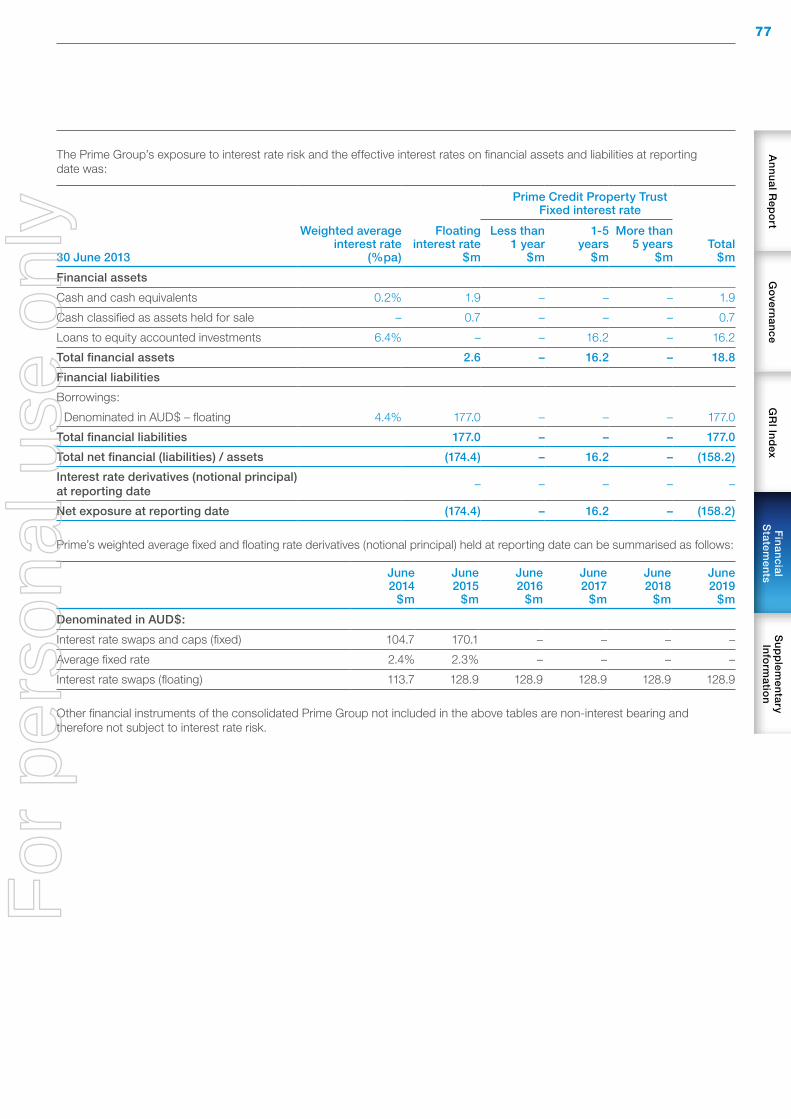
77A
nn
ua
l Rep
ort
Go
verna
nce
GR
I Ind
exF
ina
ncia
l S
tatemen
tsS
up
plem
enta
ry In
form
ation
The Prime Group’s exposure to interest rate risk and the effective interest rates on financial assets and liabilities at reporting date was:
Prime Credit Property Trust Fixed interest rate
30 June 2013
Weighted average interest rate
(%pa)
Floating interest rate
$m
Less than 1 year
$m
1-5 years
$m
More than 5 years
$mTotal
$m
Financial assets
Cash and cash equivalents 0.2% 1.9 – – – 1.9
Cash classified as assets held for sale – 0.7 – – – 0.7
Loans to equity accounted investments 6.4% – – 16.2 – 16.2
Total financial assets 2.6 – 16.2 – 18.8
Financial liabilities
Borrowings:
Denominated in AUD$ – floating 4.4% 177.0 – – – 177.0
Total financial liabilities 177.0 – – – 177.0
Total net financial (liabilities) / assets (174.4) – 16.2 – (158.2)
Interest rate derivatives (notional principal) at reporting date
– – – – –
Net exposure at reporting date (174.4) – 16.2 – (158.2)
Prime’s weighted average fixed and floating rate derivatives (notional principal) held at reporting date can be summarised as follows:
June 2014
$m
June 2015
$m
June 2016
$m
June 2017
$m
June 2018
$m
June 2019
$m
Denominated in AUD$:
Interest rate swaps and caps (fixed) 104.7 170.1 – – – –
Average fixed rate 2.4% 2.3% – – – –
Interest rate swaps (floating) 113.7 128.9 128.9 128.9 128.9 128.9
Other financial instruments of the consolidated Prime Group not included in the above tables are non-interest bearing and therefore not subject to interest rate risk.
For
per
sona
l use
onl
y
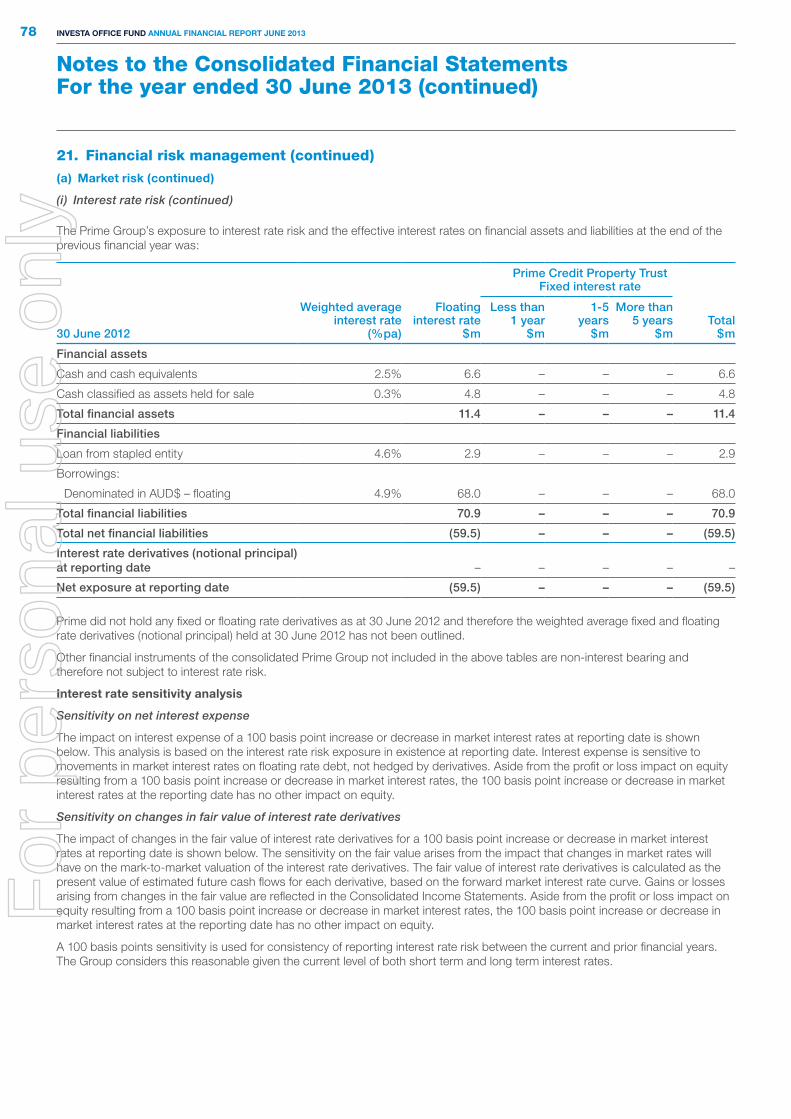
Notes to the Consolidated Financial StatementsFor the year ended 30 June 2013 (continued)
78 Investa OffIce fund annual fInancIal RepORt June 2013
The Prime Group’s exposure to interest rate risk and the effective interest rates on financial assets and liabilities at the end of the previous financial year was:
Prime Credit Property Trust Fixed interest rate
30 June 2012
Weighted average interest rate
(%pa)
Floating interest rate
$m
Less than 1 year
$m
1-5 years
$m
More than 5 years
$mTotal
$m
Financial assets
Cash and cash equivalents 2.5% 6.6 – – – 6.6
Cash classified as assets held for sale 0.3% 4.8 – – – 4.8
Total financial assets 11.4 – – – 11.4
Financial liabilities
Loan from stapled entity 4.6% 2.9 – – – 2.9
Borrowings:
Denominated in AUD$ – floating 4.9% 68.0 – – – 68.0
Total financial liabilities 70.9 – – – 70.9
Total net financial liabilities (59.5) – – – (59.5)
Interest rate derivatives (notional principal) at reporting date – – – – –
Net exposure at reporting date (59.5) – – – (59.5)
Prime did not hold any fixed or floating rate derivatives as at 30 June 2012 and therefore the weighted average fixed and floating rate derivatives (notional principal) held at 30 June 2012 has not been outlined.
Other financial instruments of the consolidated Prime Group not included in the above tables are non-interest bearing and therefore not subject to interest rate risk.
Interest rate sensitivity analysis
Sensitivity on net interest expense
The impact on interest expense of a 100 basis point increase or decrease in market interest rates at reporting date is shown below. This analysis is based on the interest rate risk exposure in existence at reporting date. Interest expense is sensitive to movements in market interest rates on floating rate debt, not hedged by derivatives. Aside from the profit or loss impact on equity resulting from a 100 basis point increase or decrease in market interest rates, the 100 basis point increase or decrease in market interest rates at the reporting date has no other impact on equity.
Sensitivity on changes in fair value of interest rate derivatives
The impact of changes in the fair value of interest rate derivatives for a 100 basis point increase or decrease in market interest rates at reporting date is shown below. The sensitivity on the fair value arises from the impact that changes in market rates will have on the mark-to-market valuation of the interest rate derivatives. The fair value of interest rate derivatives is calculated as the present value of estimated future cash flows for each derivative, based on the forward market interest rate curve. Gains or losses arising from changes in the fair value are reflected in the Consolidated Income Statements. Aside from the profit or loss impact on equity resulting from a 100 basis point increase or decrease in market interest rates, the 100 basis point increase or decrease in market interest rates at the reporting date has no other impact on equity.
A 100 basis points sensitivity is used for consistency of reporting interest rate risk between the current and prior financial years. The Group considers this reasonable given the current level of both short term and long term interest rates.
21. Financial risk management (continued)
(a) Market risk (continued)
(i) Interest rate risk (continued)
For
per
sona
l use
onl
y

79A
nn
ua
l Rep
ort
Go
verna
nce
GR
I Ind
exF
ina
ncia
l S
tatemen
tsS
up
plem
enta
ry In
form
ation
Investa Office fundSensitivity on net interest expense
Sensitivity on change in fair value of interest rate derivatives
+ 100bps $m
– 100bps $m
+ 100bps $m
– 100bps $m
30 June 2013
Variable interest rates denominated in:
Australian dollars (0.6) 1.3 7.6 (8.8)
Euros (0.9) 1.5 2.3 (3.3)
Total (1.5) 2.8 9.9 (12.1)
30 June 2012
Variable interest rates denominated in:
Australian dollars (0.5) 1.2 4.9 (6.0)
Euros (1.3) 1.3 3.4 (5.5)
United States dollars 0.1 (0.1) – –
Total (1.7) 2.4 8.3 (11.5)
prime credit property trustSensitivity on net interest expense
Sensitivity on change in fair value of interest rate derivatives
+ 100bps $m
– 100bps $m
+ 100bps $m
– 100bps $m
30 June 2013
Variable interest rates denominated in:
Australian dollars (1.8) 1.8 2.4 (2.6)
Total (1.8) 1.8 2.4 (2.6)
30 June 2012
Variable interest rates denominated in:
Australian dollars (0.7) 0.7 – –
United States dollars 0.1 (0.1) – –
Total (0.6) 0.6 – –
(ii) Foreign exchange risk
By owning assets in offshore markets the Group is exposed to the risk of movements in foreign exchange rates. Foreign exchange rate movements may reduce the Australian dollar equivalent of the carrying value of the Group’s offshore investments, and may result in lower Australian dollar equivalent proceeds when an offshore investment is sold. In addition, foreign exchange rate movements may reduce the Australian dollar equivalent of the earnings from the offshore investments while they are owned by the Group.
The Group reduces its exposure to the foreign exchange risk inherent in the carrying value of their offshore investments by partly or wholly funding their assets using borrowings denominated in the particular offshore currency. The financial risk management policy sets out a maximum target ratio for the Group of foreign currency denominated liabilities to foreign currency denominated assets.
Hedging the value of offshore properties and interests in offshore investments exposes the Group to the risk that foreign exchange rate movements cause the Group’s Leverage Ratios to increase. The foreign exchange risk inherent in the carrying value of its offshore properties is hedged by the offshore liabilities of the Group and of its equity accounted investments, leaving the equity value of the Group’s offshore investments exposed to adverse movements in foreign exchange rates.
The Group’s exposure to the impact of exchange rate movements on its earnings from its offshore investments is partly mitigated by the foreign denominated interest expense of its foreign denominated borrowings and any foreign exchange derivative hedges. The Group aims to reduce any residual foreign exchange rate exposure by using forward exchange contracts. As a result of the Group exiting offshore markets, the Group’s financial risk management policy has been updated to specify that no new foreign exchange hedging is to be undertaken with exception of case-by-case approval by the Responsible Entity’s Board of Directors.
As outlined in Note 14 and Note 27, the Group arranged a US$125.0 million USPP on 3 June 2013, which settled 12 August 2013. To mitigate the exposure of foreign exchange rate movements relating to the AUD/USD exchange rate, the Group has entered into a cross currency swap which covers 100% of the USPP principal outstanding and is timed to expire when the USPP matures.
As part of a stapled entity, the Prime Group’s foreign exchange risk is not separately managed. Management of this risk for the Group may result in consequential changes for the Prime Group.
For
per
sona
l use
onl
y
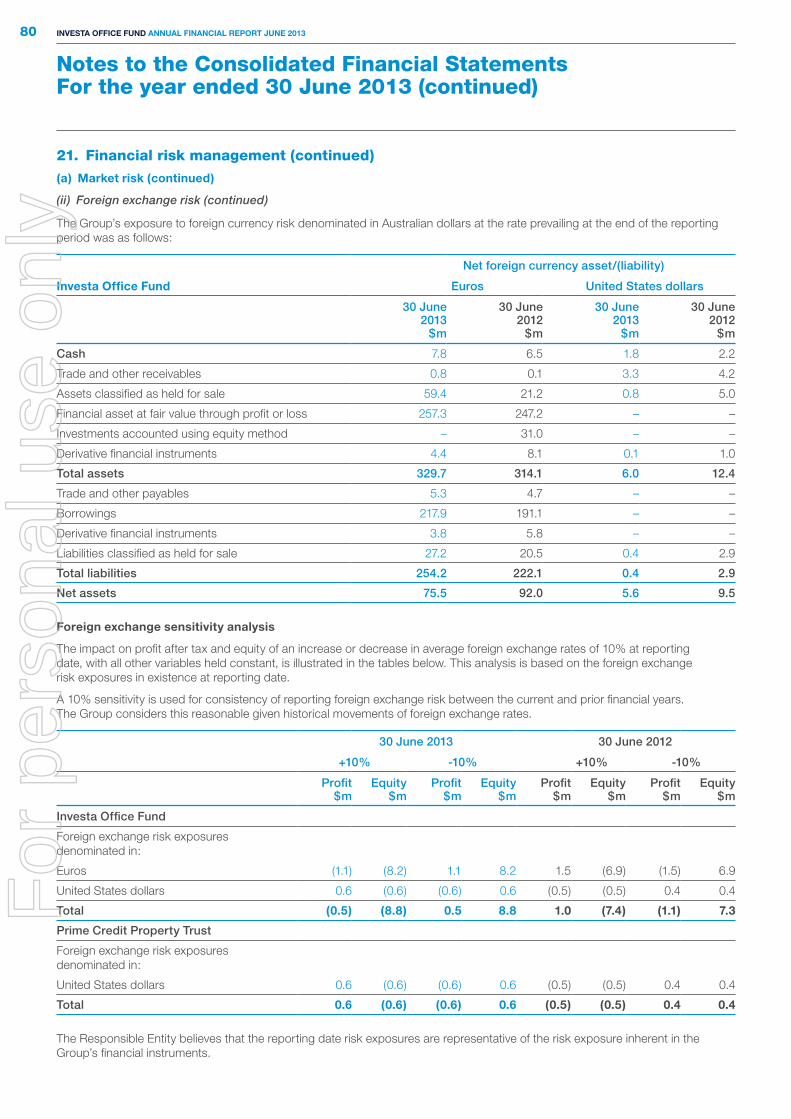
Notes to the Consolidated Financial StatementsFor the year ended 30 June 2013 (continued)
80 Investa OffIce fund annual fInancIal RepORt June 2013
The Group’s exposure to foreign currency risk denominated in Australian dollars at the rate prevailing at the end of the reporting period was as follows:
Investa Office fund
Net foreign currency asset/(liability)
Euros United States dollars
30 June 2013
$m
30 June 2012
$m
30 June 2013
$m
30 June 2012
$m
Cash 7.8 6.5 1.8 2.2
Trade and other receivables 0.8 0.1 3.3 4.2
Assets classified as held for sale 59.4 21.2 0.8 5.0
Financial asset at fair value through profit or loss 257.3 247.2 – –
Investments accounted using equity method – 31.0 – –
Derivative financial instruments 4.4 8.1 0.1 1.0
Total assets 329.7 314.1 6.0 12.4
Trade and other payables 5.3 4.7 – –
Borrowings 217.9 191.1 – –
Derivative financial instruments 3.8 5.8 – –
Liabilities classified as held for sale 27.2 20.5 0.4 2.9
Total liabilities 254.2 222.1 0.4 2.9
Net assets 75.5 92.0 5.6 9.5
foreign exchange sensitivity analysis
The impact on profit after tax and equity of an increase or decrease in average foreign exchange rates of 10% at reporting date, with all other variables held constant, is illustrated in the tables below. This analysis is based on the foreign exchange risk exposures in existence at reporting date.
A 10% sensitivity is used for consistency of reporting foreign exchange risk between the current and prior financial years. The Group considers this reasonable given historical movements of foreign exchange rates.
30 June 2013 30 June 2012
+10% -10% +10% -10%
Profit $m
Equity $m
Profit $m
Equity $m
Profit $m
Equity $m
Profit $m
Equity $m
Investa Office Fund
Foreign exchange risk exposures denominated in:
Euros (1.1) (8.2) 1.1 8.2 1.5 (6.9) (1.5) 6.9
United States dollars 0.6 (0.6) (0.6) 0.6 (0.5) (0.5) 0.4 0.4
Total (0.5) (8.8) 0.5 8.8 1.0 (7.4) (1.1) 7.3
Prime Credit Property Trust
Foreign exchange risk exposures denominated in:
United States dollars 0.6 (0.6) (0.6) 0.6 (0.5) (0.5) 0.4 0.4
Total 0.6 (0.6) (0.6) 0.6 (0.5) (0.5) 0.4 0.4
The Responsible Entity believes that the reporting date risk exposures are representative of the risk exposure inherent in the Group’s financial instruments.
21. Financial risk management (continued)
(a) Market risk (continued)
(ii) Foreign exchange risk (continued)
For
per
sona
l use
onl
y
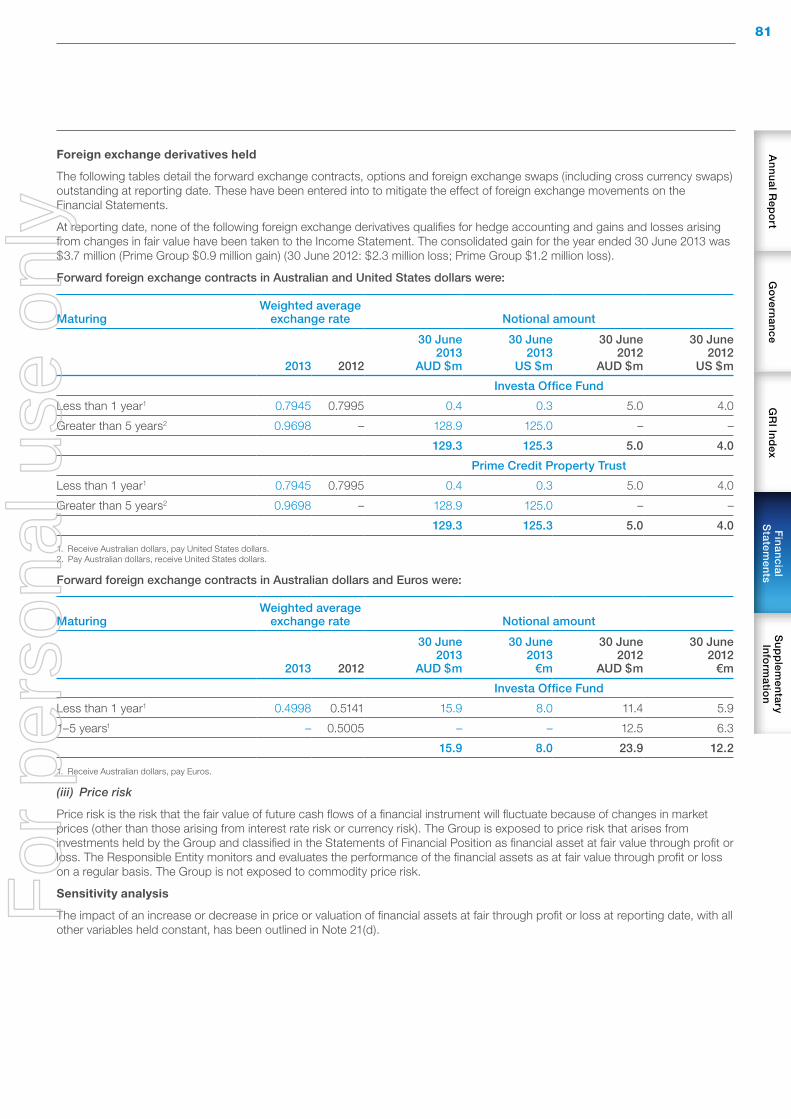
81A
nn
ua
l Rep
ort
Go
verna
nce
GR
I Ind
exF
ina
ncia
l S
tatemen
tsS
up
plem
enta
ry In
form
ation
foreign exchange derivatives held
The following tables detail the forward exchange contracts, options and foreign exchange swaps (including cross currency swaps) outstanding at reporting date. These have been entered into to mitigate the effect of foreign exchange movements on the Financial Statements.
At reporting date, none of the following foreign exchange derivatives qualifies for hedge accounting and gains and losses arising from changes in fair value have been taken to the Income Statement. The consolidated gain for the year ended 30 June 2013 was $3.7 million (Prime Group $0.9 million gain) (30 June 2012: $2.3 million loss; Prime Group $1.2 million loss).
Forward foreign exchange contracts in Australian and United States dollars were:
MaturingWeighted average
exchange rate Notional amount
2013 2012
30 June 2013
AUD $m
30 June 2013
US $m
30 June 2012
AUD $m
30 June 2012
US $m
Investa Office Fund
Less than 1 year1 0.7945 0.7995 0.4 0.3 5.0 4.0
Greater than 5 years2 0.9698 – 128.9 125.0 – –
129.3 125.3 5.0 4.0
Prime Credit Property Trust
Less than 1 year1 0.7945 0.7995 0.4 0.3 5.0 4.0
Greater than 5 years2 0.9698 – 128.9 125.0 – –
129.3 125.3 5.0 4.0
1. Receive Australian dollars, pay United States dollars. 2. Pay Australian dollars, receive United States dollars.
Forward foreign exchange contracts in Australian dollars and Euros were:
MaturingWeighted average
exchange rate Notional amount
2013 2012
30 June 2013
AUD $m
30 June 2013
€m
30 June 2012
AUD $m
30 June 2012
€m
Investa Office Fund
Less than 1 year1 0.4998 0.5141 15.9 8.0 11.4 5.9
1–5 years1 – 0.5005 – – 12.5 6.3
15.9 8.0 23.9 12.2
1. Receive Australian dollars, pay Euros.
(iii) Price risk
Price risk is the risk that the fair value of future cash flows of a financial instrument will fluctuate because of changes in market prices (other than those arising from interest rate risk or currency risk). The Group is exposed to price risk that arises from investments held by the Group and classified in the Statements of Financial Position as financial asset at fair value through profit or loss. The Responsible Entity monitors and evaluates the performance of the financial assets as at fair value through profit or loss on a regular basis. The Group is not exposed to commodity price risk.
sensitivity analysis
The impact of an increase or decrease in price or valuation of financial assets at fair through profit or loss at reporting date, with all other variables held constant, has been outlined in Note 21(d).
For
per
sona
l use
onl
y
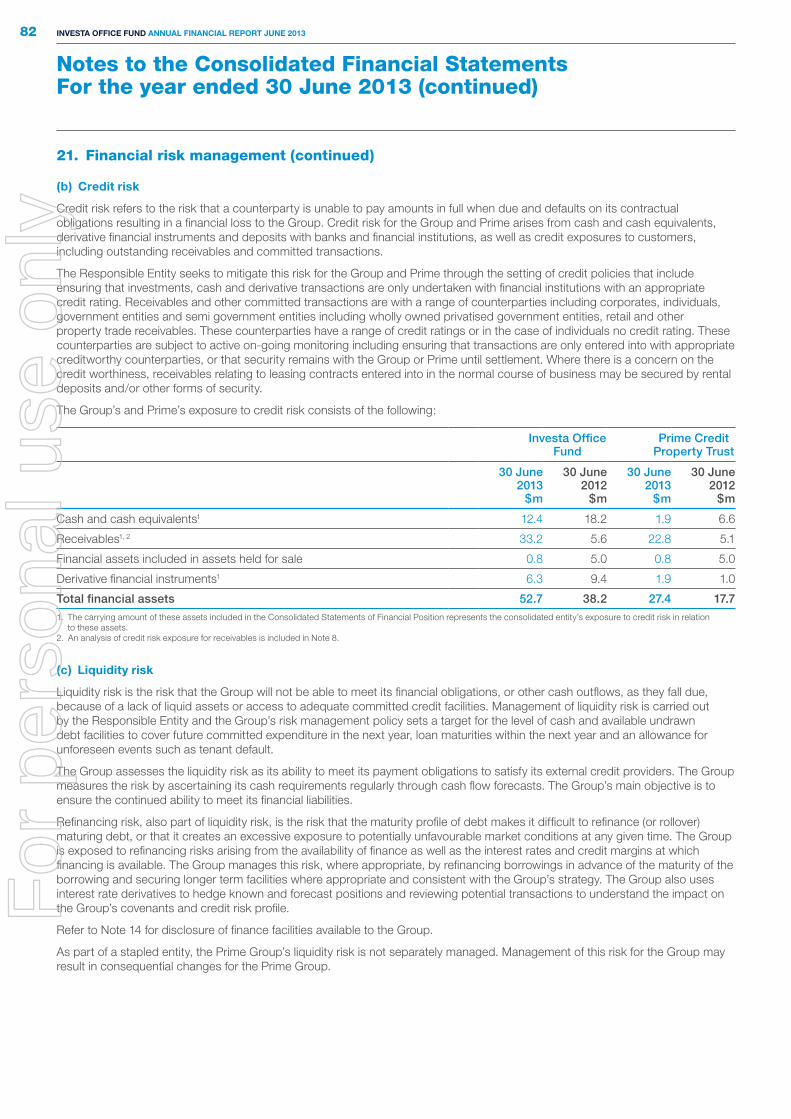
Notes to the Consolidated Financial StatementsFor the year ended 30 June 2013 (continued)
82 Investa OffIce fund annual fInancIal RepORt June 2013
(b) credit risk
Credit risk refers to the risk that a counterparty is unable to pay amounts in full when due and defaults on its contractual obligations resulting in a financial loss to the Group. Credit risk for the Group and Prime arises from cash and cash equivalents, derivative financial instruments and deposits with banks and financial institutions, as well as credit exposures to customers, including outstanding receivables and committed transactions.
The Responsible Entity seeks to mitigate this risk for the Group and Prime through the setting of credit policies that include ensuring that investments, cash and derivative transactions are only undertaken with financial institutions with an appropriate credit rating. Receivables and other committed transactions are with a range of counterparties including corporates, individuals, government entities and semi government entities including wholly owned privatised government entities, retail and other property trade receivables. These counterparties have a range of credit ratings or in the case of individuals no credit rating. These counterparties are subject to active on-going monitoring including ensuring that transactions are only entered into with appropriate creditworthy counterparties, or that security remains with the Group or Prime until settlement. Where there is a concern on the credit worthiness, receivables relating to leasing contracts entered into in the normal course of business may be secured by rental deposits and/or other forms of security.
The Group’s and Prime’s exposure to credit risk consists of the following:
Investa Office Fund
Prime Credit Property Trust
30 June 2013
$m
30 June 2012
$m
30 June 2013
$m
30 June 2012
$m
Cash and cash equivalents1 12.4 18.2 1.9 6.6
Receivables1, 2 33.2 5.6 22.8 5.1
Financial assets included in assets held for sale 0.8 5.0 0.8 5.0
Derivative financial instruments1 6.3 9.4 1.9 1.0
Total financial assets 52.7 38.2 27.4 17.71. The carrying amount of these assets included in the Consolidated Statements of Financial Position represents the consolidated entity’s exposure to credit risk in relation
to these assets.2. An analysis of credit risk exposure for receivables is included in Note 8.
(c) liquidity risk
Liquidity risk is the risk that the Group will not be able to meet its financial obligations, or other cash outflows, as they fall due, because of a lack of liquid assets or access to adequate committed credit facilities. Management of liquidity risk is carried out by the Responsible Entity and the Group’s risk management policy sets a target for the level of cash and available undrawn debt facilities to cover future committed expenditure in the next year, loan maturities within the next year and an allowance for unforeseen events such as tenant default.
The Group assesses the liquidity risk as its ability to meet its payment obligations to satisfy its external credit providers. The Group measures the risk by ascertaining its cash requirements regularly through cash flow forecasts. The Group’s main objective is to ensure the continued ability to meet its financial liabilities.
Refinancing risk, also part of liquidity risk, is the risk that the maturity profile of debt makes it difficult to refinance (or rollover) maturing debt, or that it creates an excessive exposure to potentially unfavourable market conditions at any given time. The Group is exposed to refinancing risks arising from the availability of finance as well as the interest rates and credit margins at which financing is available. The Group manages this risk, where appropriate, by refinancing borrowings in advance of the maturity of the borrowing and securing longer term facilities where appropriate and consistent with the Group’s strategy. The Group also uses interest rate derivatives to hedge known and forecast positions and reviewing potential transactions to understand the impact on the Group’s covenants and credit risk profile.
Refer to Note 14 for disclosure of finance facilities available to the Group.
As part of a stapled entity, the Prime Group’s liquidity risk is not separately managed. Management of this risk for the Group may result in consequential changes for the Prime Group.
21. Financial risk management (continued)
For
per
sona
l use
onl
y

83A
nn
ua
l Rep
ort
Go
verna
nce
GR
I Ind
exF
ina
ncia
l S
tatemen
tsS
up
plem
enta
ry In
form
ation
non-derivative financial liabilities
The contractual maturities of the Group’s non-derivative financial liabilities at reporting date are reflected in the following table. It shows the undiscounted contractual cash flows required to discharge the liabilities including interest at market rates. Foreign currencies have been converted at rates of exchange ruling at reporting date.
Investa Office Fund
Less than 1 year
$m1-5 years
$m
Greater than 5 years
$mTotal
$m
30 June 2013
Trade and other payables 24.7 – – 24.7
Borrowings – 617.9 – 617.9
Projected interest cost on borrowings1 23.3 25.7 – 49.0
Distribution payable 55.3 – – 55.3
Liabilities directly associated with assets classified as held for sale 27.6 – – 27.6
Total forecast undiscounted future cash flow 130.9 643.6 – 774.5
30 June 2012
Trade and other payables 24.9 – – 24.9
Borrowings – 459.1 – 459.1
Projected interest cost on borrowings1 16.0 22.9 – 38.9
Distribution payable 59.6 – – 59.6
Liabilities directly associated with assets classified as held for sale 23.4 – – 23.4
Total forecast undiscounted future cash flow 123.9 482.0 – 605.91. Projection is based on the likely outcome of the facilities given the interest rates, margins, foreign exchange rates and interest rate forward curves as at the reporting date up
until the contractual maturity of the facilities. The projection is based on the undiscounted cash flows.
Prime Credit Property Trust
Less than 1 year
$m1-5 years
$m
Greater than 5 years
$mTotal
$m
30 June 2013
Trade and other payables 13.2 – – 13.2
Borrowings – 177.0 – 177.0
Projected interest cost on borrowings1 7.6 1.2 – 8.8
Distribution payable 30.7 – – 30.7
Liabilities directly associated with assets classified as held for sale 0.4 – – 0.4
Total forecast undiscounted future cash flow 51.9 178.2 – 230.1
30 June 2012
Trade and other payables 13.9 – – 13.9
Borrowings – 68.0 – 68.0
Projected interest cost on borrowings1 3.6 6.5 – 10.1
Distribution payable 24.6 – – 24.6
Liabilities directly associated with assets classified as held for sale 2.9 – – 2.9
Total forecast undiscounted future cash flow 45.0 74.5 – 119.51. Projection is based on the likely outcome of the facilities given the interest rates, margins, foreign exchange rates and interest rate forward curves as at the reporting date up
until the contractual maturity of the facilities. The projection is based on the undiscounted cash flows.
For
per
sona
l use
onl
y

Notes to the Consolidated Financial StatementsFor the year ended 30 June 2013 (continued)
84 Investa OffIce fund annual fInancIal RepORt June 2013
derivative financial liabilities
The following tables show the undiscounted contractual cash flows required to discharge the Group’s derivative financial liabilities including interest at market rates. Foreign currencies have been converted at rates of exchange ruling at reporting date.
Investa Office Fund
Less than 1 year
$m1-5 years
$m
Greater than 5 years
$mTotal
$m
30 June 2013
Liabilities
Interest rate derivatives – net settled (0.9) (6.3) – (7.2)
Cross currency interest rate swaps – gross settled1:
Outflows (2.6) (10.3) (147.3) (160.2)
Inflows 134.3 21.1 37.8 193.2
130.8 4.5 (109.5) 25.8
Assets
Interest rate derivatives – net settled 0.3 0.8 – 1.1
Foreign exchanged – gross settled:
Outflows (11.6) – – (11.6)
Inflows 16.3 – – 16.3
5.0 0.8 – 5.81. Inflows less than 1 year include the AUD receipt associated with the settlement of the USPP. Outflows greater than 5 years include the payment of AUD associated with the
outstanding USD principal of the USPP. Refer to Note 14(c) for further details.
Investa Office Fund
Less than 1 year
$m1-5 years
$m
Greater than 5 years
$mTotal
$m
30 June 2012
Liabilities
Interest rate derivatives – net settled (3.5) (4.4) (0.1) (8.0)
(3.5) (4.4) (0.1) (8.0)
Assets
Foreign exchanged – gross settled:
Outflows (11.2) (7.7) – (18.9)
Inflows 16.5 12.5 – 29.0
5.3 4.8 – 10.1
21. Financial risk management (continued)
(c) liquidity risk (continued)
For
per
sona
l use
onl
y
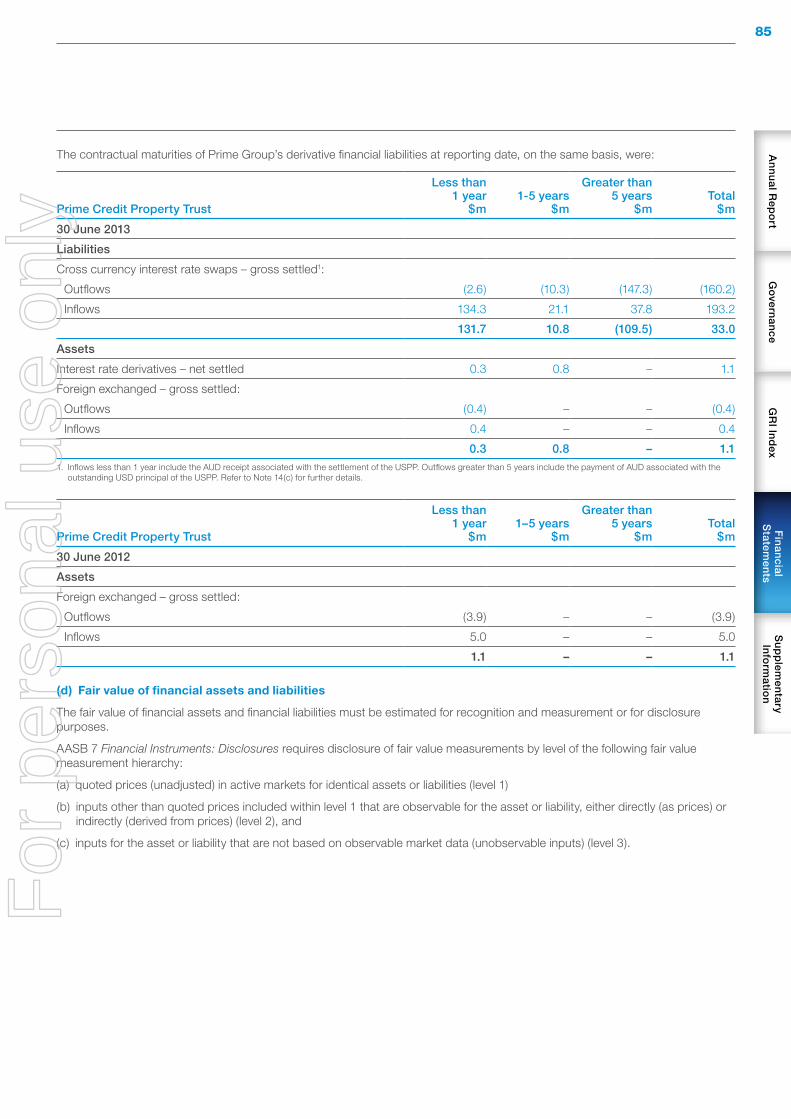
85A
nn
ua
l Rep
ort
Go
verna
nce
GR
I Ind
exF
ina
ncia
l S
tatemen
tsS
up
plem
enta
ry In
form
ation
The contractual maturities of Prime Group’s derivative financial liabilities at reporting date, on the same basis, were:
Prime Credit Property Trust
Less than 1 year
$m1-5 years
$m
Greater than 5 years
$mTotal
$m
30 June 2013
Liabilities
Cross currency interest rate swaps – gross settled1:
Outflows (2.6) (10.3) (147.3) (160.2)
Inflows 134.3 21.1 37.8 193.2
131.7 10.8 (109.5) 33.0
Assets
Interest rate derivatives – net settled 0.3 0.8 – 1.1
Foreign exchanged – gross settled:
Outflows (0.4) – – (0.4)
Inflows 0.4 – – 0.4
0.3 0.8 – 1.11. Inflows less than 1 year include the AUD receipt associated with the settlement of the USPP. Outflows greater than 5 years include the payment of AUD associated with the
outstanding USD principal of the USPP. Refer to Note 14(c) for further details.
Prime Credit Property Trust
Less than 1 year
$m1–5 years
$m
Greater than 5 years
$mTotal
$m
30 June 2012
Assets
Foreign exchanged – gross settled:
Outflows (3.9) – – (3.9)
Inflows 5.0 – – 5.0
1.1 – – 1.1
(d) fair value of financial assets and liabilities
The fair value of financial assets and financial liabilities must be estimated for recognition and measurement or for disclosure purposes.
AASB 7 Financial Instruments: Disclosures requires disclosure of fair value measurements by level of the following fair value measurement hierarchy:
(a) quoted prices (unadjusted) in active markets for identical assets or liabilities (level 1)
(b) inputs other than quoted prices included within level 1 that are observable for the asset or liability, either directly (as prices) or indirectly (derived from prices) (level 2), and
(c) inputs for the asset or liability that are not based on observable market data (unobservable inputs) (level 3).
For
per
sona
l use
onl
y

Notes to the Consolidated Financial StatementsFor the year ended 30 June 2013 (continued)
86 Investa OffIce fund annual fInancIal RepORt June 2013
The following tables present both the Group’s financial assets and liabilities that were measured and recognised at fair value at the 30 June 2013 and 30 June 2012 year end dates.
Investa Office FundLevel 1
$mLevel 2
$mLevel 3
$mTotal
$m
30 June 2013
Assets
Derivatives financial instruments – 6.3 – 6.3
Investment in Dutch Office Fund – – 257.3 257.3
Total assets – 6.3 257.3 263.6
Liabilities
Derivatives financial instruments – 13.1 – 13.1
Total liabilities – 13.1 – 13.1
30 June 2012
Assets
Derivatives financial instruments – 9.4 – 9.4
Investment in Dutch Office Fund – – 247.2 247.2
Total assets – 9.4 247.2 256.6
Liabilities
Derivatives financial instruments – 9.9 – 9.9
Total liabilities – 9.9 – 9.9
The following tables present both the Prime’s financial assets and liabilities that were measured and recognised at fair value at the 30 June 2013 and 30 June 2012 year end dates.
Prime Credit Property Trust Level 1
$mLevel 2
$mLevel 3
$mTotal
$m
30 June 2013
Assets
Derivatives financial instruments – 1.9 – 1.9
Total assets – 1.9 – 1.9
Liabilities
Derivatives financial instruments – 4.9 – 4.9
Total liabilities – 4.9 – 4.9
30 June 2012
Assets
Derivatives financial instruments – 1.0 – 1.0
Total assets – 1.0 – 1.0
For financial instruments not quoted in active markets, the Group uses valuation techniques such as present value, comparison to similar instruments for which market observable prices exist and other relevant models used by market participants. These valuation techniques use both observable and unobservable market inputs.
Financial instruments that use valuation techniques with only observable market inputs or unobservable inputs that are not significant to the overall valuation include forward foreign exchange contract and interest rate derivatives and are all included in level 2 above. Fair value of all derivative contracts has been confirmed with counterparties.
If one or more of the significant inputs is not based on observable market data, the instrument is included in level 3. This is the case for the Group’s investment in the Dutch Office Fund. The fair value of this investment has been determined by applying a discount for liquidity, size of the investment and valuation risk to the reported net assets. If the value of the investment was adjusted to be 10% higher or lower, the fair value would increase/decrease by $25.7 million (2012: $24.7 million).
21. Financial risk management (continued)
(d) fair value of financial assets and liabilities (continued)
For
per
sona
l use
onl
y
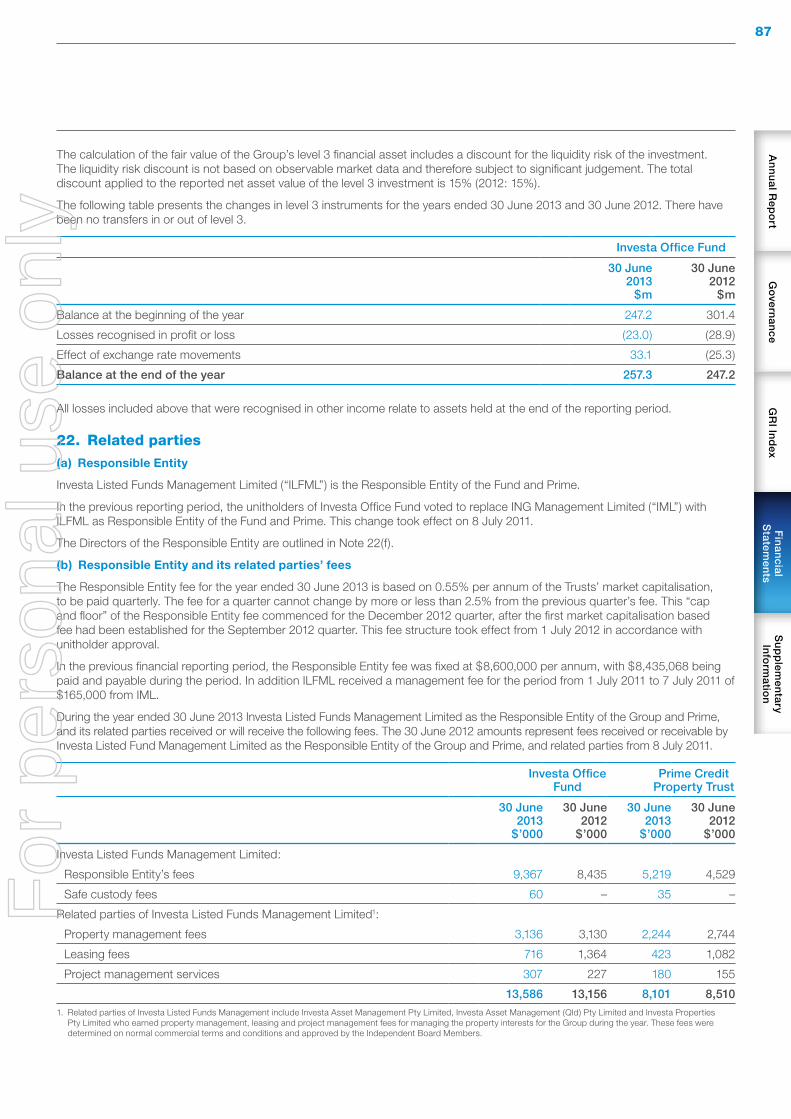
87A
nn
ua
l Rep
ort
Go
verna
nce
GR
I Ind
exF
ina
ncia
l S
tatemen
tsS
up
plem
enta
ry In
form
ation
The calculation of the fair value of the Group’s level 3 financial asset includes a discount for the liquidity risk of the investment. The liquidity risk discount is not based on observable market data and therefore subject to significant judgement. The total discount applied to the reported net asset value of the level 3 investment is 15% (2012: 15%).
The following table presents the changes in level 3 instruments for the years ended 30 June 2013 and 30 June 2012. There have been no transfers in or out of level 3.
Investa Office Fund
30 June 2013
$m
30 June 2012
$m
Balance at the beginning of the year 247.2 301.4
Losses recognised in profit or loss (23.0) (28.9)
Effect of exchange rate movements 33.1 (25.3)
Balance at the end of the year 257.3 247.2
All losses included above that were recognised in other income relate to assets held at the end of the reporting period.
22. Related parties
(a) Responsible entity
Investa Listed Funds Management Limited (“ILFML”) is the Responsible Entity of the Fund and Prime.
In the previous reporting period, the unitholders of Investa Office Fund voted to replace ING Management Limited (“IML”) with ILFML as Responsible Entity of the Fund and Prime. This change took effect on 8 July 2011.
The Directors of the Responsible Entity are outlined in Note 22(f).
(b) Responsible entity and its related parties’ fees
The Responsible Entity fee for the year ended 30 June 2013 is based on 0.55% per annum of the Trusts’ market capitalisation, to be paid quarterly. The fee for a quarter cannot change by more or less than 2.5% from the previous quarter’s fee. This “cap and floor” of the Responsible Entity fee commenced for the December 2012 quarter, after the first market capitalisation based fee had been established for the September 2012 quarter. This fee structure took effect from 1 July 2012 in accordance with unitholder approval.
In the previous financial reporting period, the Responsible Entity fee was fixed at $8,600,000 per annum, with $8,435,068 being paid and payable during the period. In addition ILFML received a management fee for the period from 1 July 2011 to 7 July 2011 of $165,000 from IML.
During the year ended 30 June 2013 Investa Listed Funds Management Limited as the Responsible Entity of the Group and Prime, and its related parties received or will receive the following fees. The 30 June 2012 amounts represent fees received or receivable by Investa Listed Fund Management Limited as the Responsible Entity of the Group and Prime, and related parties from 8 July 2011.
Investa Office Fund
Prime Credit Property Trust
30 June 2013
$’000
30 June 2012
$’000
30 June 2013
$’000
30 June 2012
$’000
Investa Listed Funds Management Limited:
Responsible Entity’s fees 9,367 8,435 5,219 4,529
Safe custody fees 60 – 35 –
Related parties of Investa Listed Funds Management Limited1:
Property management fees 3,136 3,130 2,244 2,744
Leasing fees 716 1,364 423 1,082
Project management services 307 227 180 155
13,586 13,156 8,101 8,5101. Related parties of Investa Listed Funds Management include Investa Asset Management Pty Limited, Investa Asset Management (Qld) Pty Limited and Investa Properties
Pty Limited who earned property management, leasing and project management fees for managing the property interests for the Group during the year. These fees were determined on normal commercial terms and conditions and approved by the Independent Board Members.
For
per
sona
l use
onl
y
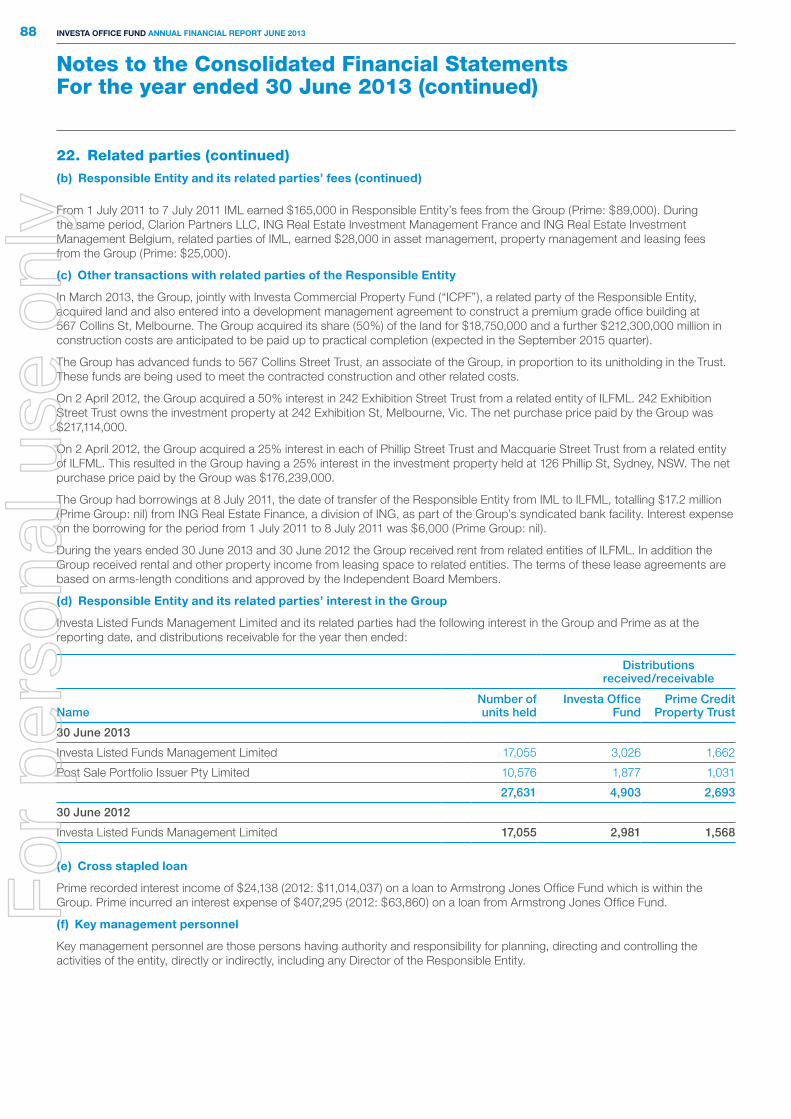
Notes to the Consolidated Financial StatementsFor the year ended 30 June 2013 (continued)
88 Investa OffIce fund annual fInancIal RepORt June 2013
From 1 July 2011 to 7 July 2011 IML earned $165,000 in Responsible Entity’s fees from the Group (Prime: $89,000). During the same period, Clarion Partners LLC, ING Real Estate Investment Management France and ING Real Estate Investment Management Belgium, related parties of IML, earned $28,000 in asset management, property management and leasing fees from the Group (Prime: $25,000).
(c) Other transactions with related parties of the Responsible entity
In March 2013, the Group, jointly with Investa Commercial Property Fund (“ICPF”), a related party of the Responsible Entity, acquired land and also entered into a development management agreement to construct a premium grade office building at 567 Collins St, Melbourne. The Group acquired its share (50%) of the land for $18,750,000 and a further $212,300,000 million in construction costs are anticipated to be paid up to practical completion (expected in the September 2015 quarter).
The Group has advanced funds to 567 Collins Street Trust, an associate of the Group, in proportion to its unitholding in the Trust. These funds are being used to meet the contracted construction and other related costs.
On 2 April 2012, the Group acquired a 50% interest in 242 Exhibition Street Trust from a related entity of ILFML. 242 Exhibition Street Trust owns the investment property at 242 Exhibition St, Melbourne, Vic. The net purchase price paid by the Group was $217,114,000.
On 2 April 2012, the Group acquired a 25% interest in each of Phillip Street Trust and Macquarie Street Trust from a related entity of ILFML. This resulted in the Group having a 25% interest in the investment property held at 126 Phillip St, Sydney, NSW. The net purchase price paid by the Group was $176,239,000.
The Group had borrowings at 8 July 2011, the date of transfer of the Responsible Entity from IML to ILFML, totalling $17.2 million (Prime Group: nil) from ING Real Estate Finance, a division of ING, as part of the Group’s syndicated bank facility. Interest expense on the borrowing for the period from 1 July 2011 to 8 July 2011 was $6,000 (Prime Group: nil).
During the years ended 30 June 2013 and 30 June 2012 the Group received rent from related entities of ILFML. In addition the Group received rental and other property income from leasing space to related entities. The terms of these lease agreements are based on arms-length conditions and approved by the Independent Board Members.
(d) Responsible entity and its related parties’ interest in the Group
Investa Listed Funds Management Limited and its related parties had the following interest in the Group and Prime as at the reporting date, and distributions receivable for the year then ended:
Distributions received/receivable
NameNumber of units held
Investa Office Fund
Prime Credit Property Trust
30 June 2013
Investa Listed Funds Management Limited 17,055 3,026 1,662
Post Sale Portfolio Issuer Pty Limited 10,576 1,877 1,031
27,631 4,903 2,693
30 June 2012
Investa Listed Funds Management Limited 17,055 2,981 1,568
(e) cross stapled loan
Prime recorded interest income of $24,138 (2012: $11,014,037) on a loan to Armstrong Jones Office Fund which is within the Group. Prime incurred an interest expense of $407,295 (2012: $63,860) on a loan from Armstrong Jones Office Fund.
(f) Key management personnel
Key management personnel are those persons having authority and responsibility for planning, directing and controlling the activities of the entity, directly or indirectly, including any Director of the Responsible Entity.
22. Related parties (continued)
(b) Responsible entity and its related parties’ fees (continued)
For
per
sona
l use
onl
y

89A
nn
ua
l Rep
ort
Go
verna
nce
GR
I Ind
exF
ina
ncia
l S
tatemen
tsS
up
plem
enta
ry In
form
ation
The names of the Directors of the Responsible Entity, and their dates of appointment or resignation if they were not Directors during the whole of the financial year, are:
Deborah Page AM Chairman
Peter Dodd
Peter Rowe
Scott MacDonald
Ming Long
The Directors of ING Management Limited (which was the Responsible Entity until 8 July 2011) from 1 July 2011 up until 8 July 2011, and their dates of appointment or resignation if they were not Directors during the whole of the period were:
Michael Coleman Chairman
Philip Clark AM
Michael Easson AM
Scott MacDonald
Hein Brand
The names of other key management personnel, and their dates of appointment or resignation if they did not occupy their position during the whole of the financial year, are:
Valentino Tanfara Fund Manager; resigned 1 February 2012
Toby Phelps Fund Manager; appointed 1 February 2012
Key management personnel do not receive any remuneration directly from the Group. They receive remuneration from the Responsible Entity in their capacity as Directors or employees of the Responsible Entity or its related parties. Consequently, the Group does not pay any compensation as defined in Accounting Standard AASB 124 Related Parties to its key management personnel.
Key management personnel, including their related parties, held the following units and distributions received or receivable directly, indirectly or beneficially in each Trust at each year end.
Distributions received/receivable
Name
Balance at the start of
the year 000’s
Acquired during
the year 000’s
Balance at the end of
the year000’s
Investa Office Fund
$’000
Prime Credit Property Trust
$’000
30 June 2013
Deborah Page AM 13 3 16 3 2
Peter Dodd 20 – 20 4 2
Scott MacDonald 59 15 74 13 7
Ming Long 10 5 15 3 1
Toby Phelps 4 – 4 1 –
30 June 2012
Deborah Page AM 4 9 13 2 1
Peter Dodd – 20 20 4 2
Scott MacDonald – 59 59 9 4
Ming Long – 10 10 1 1
Toby Phelps – 4 4 – –
The above 2012 units held by key management personnel have been recalculated for the unit consolidation which occurred during the 2012 year.
For
per
sona
l use
onl
y
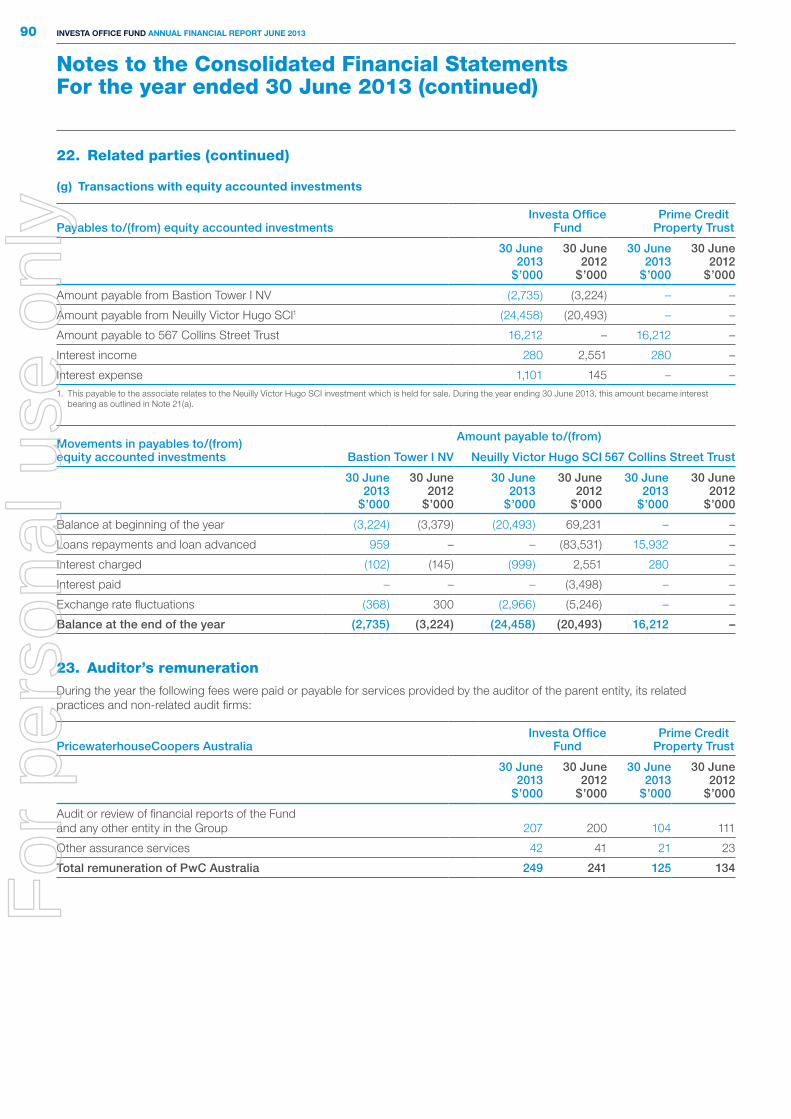
Notes to the Consolidated Financial StatementsFor the year ended 30 June 2013 (continued)
90 Investa OffIce fund annual fInancIal RepORt June 2013
(g) transactions with equity accounted investments
Payables to/(from) equity accounted investmentsInvesta Office
FundPrime Credit
Property Trust
30 June 2013
$’000
30 June 2012
$’000
30 June 2013
$’000
30 June 2012
$’000
Amount payable from Bastion Tower I NV (2,735) (3,224) – –
Amount payable from Neuilly Victor Hugo SCI1 (24,458) (20,493) – –
Amount payable to 567 Collins Street Trust 16,212 – 16,212 –
Interest income 280 2,551 280 –
Interest expense 1,101 145 – –1. This payable to the associate relates to the Neuilly Victor Hugo SCI investment which is held for sale. During the year ending 30 June 2013, this amount became interest
bearing as outlined in Note 21(a).
Movements in payables to/(from) equity accounted investments
Amount payable to/(from)
Bastion Tower I NV Neuilly Victor Hugo SCI 567 Collins Street Trust
30 June 2013
$’000
30 June 2012
$’000
30 June 2013
$’000
30 June 2012
$’000
30 June 2013
$’000
30 June 2012
$’000
Balance at beginning of the year (3,224) (3,379) (20,493) 69,231 – –
Loans repayments and loan advanced 959 – – (83,531) 15,932 –
Interest charged (102) (145) (999) 2,551 280 –
Interest paid – – – (3,498) – –
Exchange rate fluctuations (368) 300 (2,966) (5,246) – –
Balance at the end of the year (2,735) (3,224) (24,458) (20,493) 16,212 –
23. Auditor’s remuneration
During the year the following fees were paid or payable for services provided by the auditor of the parent entity, its related practices and non-related audit firms:
PricewaterhouseCoopers AustraliaInvesta Office
FundPrime Credit
Property Trust
30 June 2013
$’000
30 June 2012
$’000
30 June 2013
$’000
30 June 2012
$’000
Audit or review of financial reports of the Fund and any other entity in the Group 207 200 104 111
Other assurance services 42 41 21 23
Total remuneration of PwC Australia 249 241 125 134
22. Related parties (continued)
For
per
sona
l use
onl
y
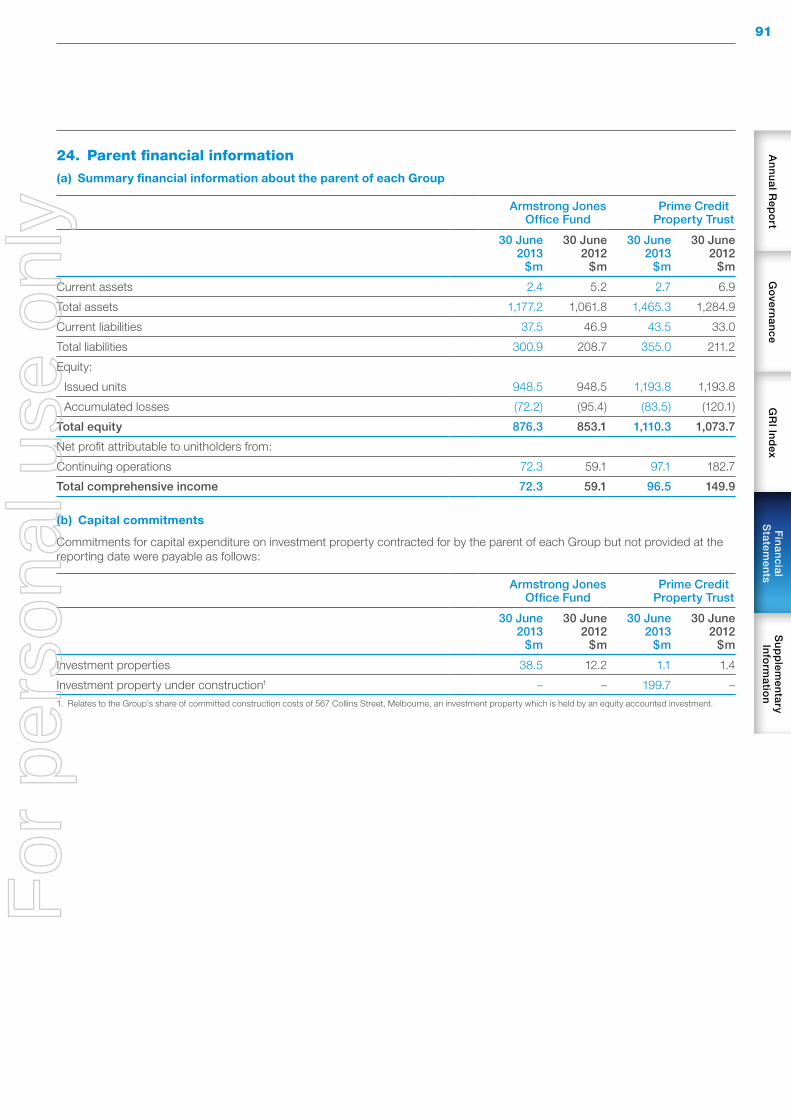
91A
nn
ua
l Rep
ort
Go
verna
nce
GR
I Ind
exF
ina
ncia
l S
tatemen
tsS
up
plem
enta
ry In
form
ation
24. Parent financial information
(a) summary financial information about the parent of each Group
Armstrong Jones Office Fund
Prime Credit Property Trust
30 June 2013
$m
30 June 2012
$m
30 June 2013
$m
30 June 2012
$m
Current assets 2.4 5.2 2.7 6.9
Total assets 1,177.2 1,061.8 1,465.3 1,284.9
Current liabilities 37.5 46.9 43.5 33.0
Total liabilities 300.9 208.7 355.0 211.2
Equity:
Issued units 948.5 948.5 1,193.8 1,193.8
Accumulated losses (72.2) (95.4) (83.5) (120.1)
Total equity 876.3 853.1 1,110.3 1,073.7
Net profit attributable to unitholders from:
Continuing operations 72.3 59.1 97.1 182.7
Total comprehensive income 72.3 59.1 96.5 149.9
(b) capital commitments
Commitments for capital expenditure on investment property contracted for by the parent of each Group but not provided at the reporting date were payable as follows:
Armstrong Jones Office Fund
Prime Credit Property Trust
30 June 2013
$m
30 June 2012
$m
30 June 2013
$m
30 June 2012
$m
Investment properties 38.5 12.2 1.1 1.4
Investment property under construction1 – – 199.7 –1. Relates to the Group’s share of committed construction costs of 567 Collins Street, Melbourne, an investment property which is held by an equity accounted investment.
For
per
sona
l use
onl
y
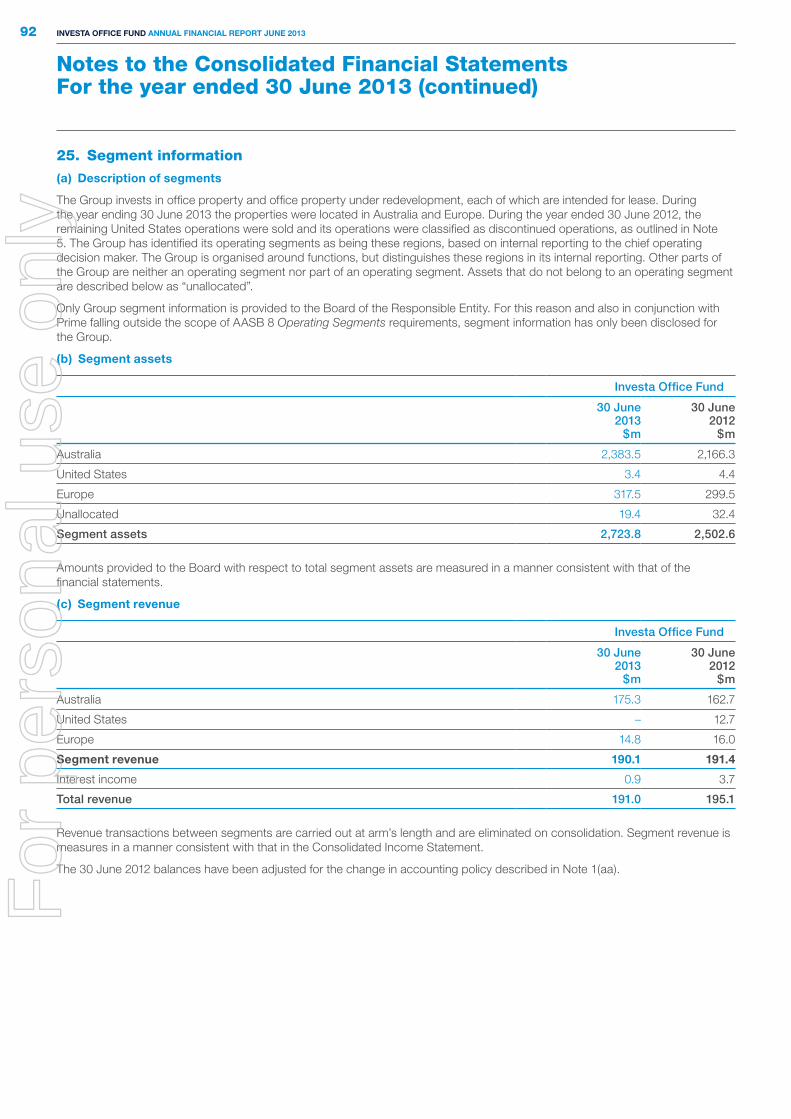
Notes to the Consolidated Financial StatementsFor the year ended 30 June 2013 (continued)
92 Investa OffIce fund annual fInancIal RepORt June 2013
25. Segment information
(a) description of segments
The Group invests in office property and office property under redevelopment, each of which are intended for lease. During the year ending 30 June 2013 the properties were located in Australia and Europe. During the year ended 30 June 2012, the remaining United States operations were sold and its operations were classified as discontinued operations, as outlined in Note 5. The Group has identified its operating segments as being these regions, based on internal reporting to the chief operating decision maker. The Group is organised around functions, but distinguishes these regions in its internal reporting. Other parts of the Group are neither an operating segment nor part of an operating segment. Assets that do not belong to an operating segment are described below as “unallocated”.
Only Group segment information is provided to the Board of the Responsible Entity. For this reason and also in conjunction with Prime falling outside the scope of AASB 8 Operating Segments requirements, segment information has only been disclosed for the Group.
(b) segment assets
Investa Office Fund
30 June 2013
$m
30 June 2012
$m
Australia 2,383.5 2,166.3
United States 3.4 4.4
Europe 317.5 299.5
Unallocated 19.4 32.4
Segment assets 2,723.8 2,502.6
Amounts provided to the Board with respect to total segment assets are measured in a manner consistent with that of the financial statements.
(c) segment revenue
Investa Office Fund
30 June 2013
$m
30 June 2012
$m
Australia 175.3 162.7
United States – 12.7
Europe 14.8 16.0
segment revenue 190.1 191.4
Interest income 0.9 3.7
Total revenue 191.0 195.1
Revenue transactions between segments are carried out at arm’s length and are eliminated on consolidation. Segment revenue is measures in a manner consistent with that in the Consolidated Income Statement.
The 30 June 2012 balances have been adjusted for the change in accounting policy described in Note 1(aa).
For
per
sona
l use
onl
y

93A
nn
ua
l Rep
ort
Go
verna
nce
GR
I Ind
exF
ina
ncia
l S
tatemen
tsS
up
plem
enta
ry In
form
ation
(d) segment result
Investa Office Fund
30 June 2013
$m
30 June 2012
$m
Australia 162.1 130.3
United States – 12.2
Europe 20.3 23.9
Segment result 182.4 166.4
Interest income 0.9 1.3
Finance costs (33.3) (28.8)
Responsible Entity’s fees (9.4) (8.6)
Net foreign exchange gain 2.8 5.9
Foreign asset management fees (0.4) (1.4)
Other expenses (3.6) (3.7)
Current income tax expense (1.9) (2.9)
External non-controlling interests share of operating income – (0.1)
Operating earnings 137.5 128.1
The Group and Prime reports net profit attributed to unitholders in accordance Australian Accounting Standards (“AAS”). The Responsible Entity considers the non-AAS measure, operating earnings, an important indicator of underlying performance of the Group and Prime. To calculate operating earnings, net profit attributable to unitholders is adjusted to exclude unrealised gains or losses, certain non-cash items, fair value gains or losses on investments and other amounts that are non-recurring or capital in nature. These adjustments may change from time to time, depending upon changes to AAS and/or the Responsible Entity’s assessment of non-recurring or capital items. No adjustments have been made for amortisation of lease incentives or lease fees as the Responsible Entity considers these to be a component of rental income.
For
per
sona
l use
onl
y

Notes to the Consolidated Financial StatementsFor the year ended 30 June 2013 (continued)
94 Investa OffIce fund annual fInancIal RepORt June 2013
Note Investa Office Fund
30 June 2013
$m
30 June 2012
$m
Operating earnings 137.5 128.1
Net gain/(loss) on change in fair value of:
Investment properties 11 39.4 110.4
Derivatives (5.7) (18.5)
Items included in share of net profit of equity accounted investments:
Investment properties 12 12.4 19.1
Derivative financial instruments 12 0.8 (4.0)
Loss on financial asset at fair value (DOF) 9 (23.0) (28.9)
Fair value loss of acquisition costs on equity accounted investments 12 – (12.2)
Loss on transfer of equity accounted investments to assets held for sale 5 (1.3) –
Net gain on disposal of investments 0.2 6.1
Transfer of foreign currency translation reserve from disposed operations to profit and loss 5 – (131.1)
Net foreign exchange gain 2.0 19.9
Distribution from financial asset at fair value through profit or loss 14.8 16.0
Operating income from DOF (16.7) (17.5)
Straight-lining of lease revenue (0.8) (0.4)
Upfront receipts from interest rate derivatives1 0.7 –
Pre-acquisition incentive amortisation on equity accounted investments (0.5) –
Income tax (expense)/benefit (1.1) 21.4
External non-controlling interests share of operating income – 0.1
Net profit for the year 158.7 108.5
Net profit attributable to external non-controlling interests – (6.6)
Net profit attributable to unitholders 158.7 101.91. During the year ending 30 June 2013, the Group entered into fixed to floating interest rate derivatives. The transaction included an initial upfront payment of $0.8 million made
to the Group. For the measurement of operating earnings the Responsible Entity considers the upfront receipt as income to be released over the life of the derivatives.
(e) Other information
Investa Office Fund
Australia Europe United States Total
30 June 2013
Share of net profit of equity accounted investments 40.9 1.0 – 41.9
Net gain on change in fair value of investment property 39.4 – – 39.4
Additions to investment properties and equity accounted investments 153.0 – – 153.0
30 June 2012
Share of net profit of equity accounted investments 6.6 7.2 7.3 21.1
Net gain on change in fair value of investment property 78.8 – 31.6 110.4
Additions to investment properties and equity accounted investments 443.9 – 3.3 447.2
25. Segment information (continued)
(d) segment result (continued)
For
per
sona
l use
onl
y
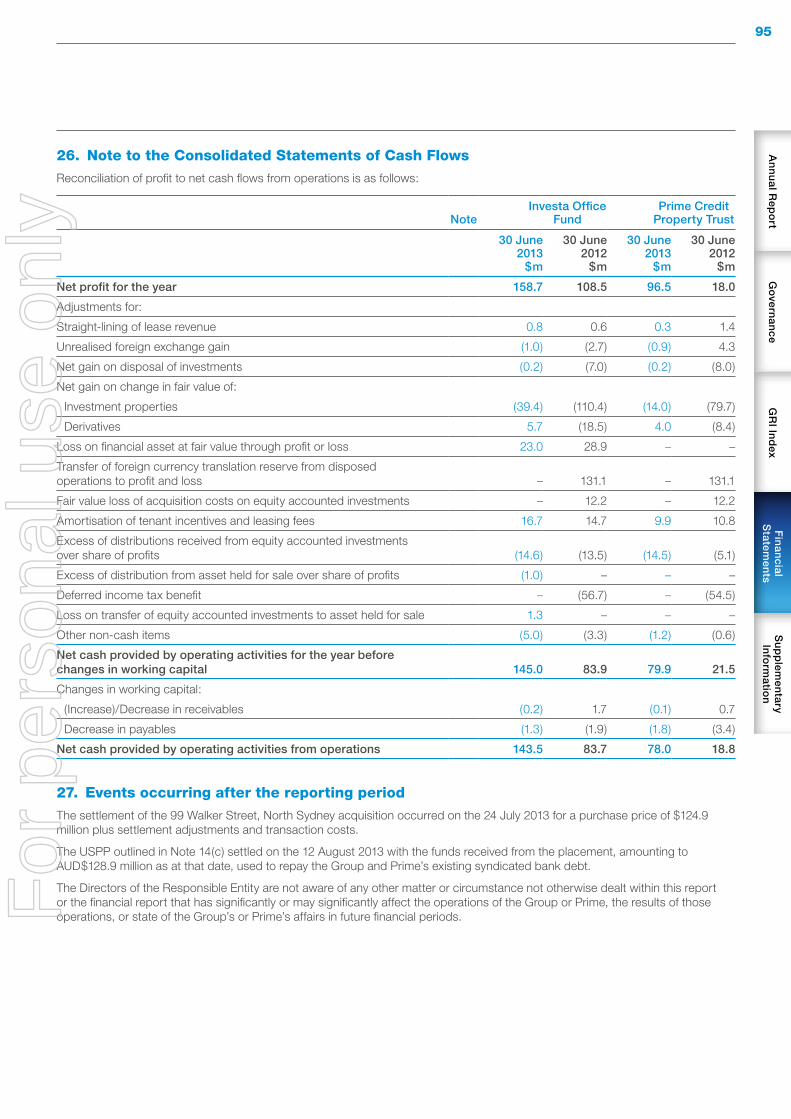
95A
nn
ua
l Rep
ort
Go
verna
nce
GR
I Ind
exF
ina
ncia
l S
tatemen
tsS
up
plem
enta
ry In
form
ation
26. Note to the Consolidated Statements of Cash Flows
Reconciliation of profit to net cash flows from operations is as follows:
NoteInvesta Office
FundPrime Credit
Property Trust
30 June 2013
$m
30 June 2012
$m
30 June 2013
$m
30 June 2012
$m
Net profit for the year 158.7 108.5 96.5 18.0
Adjustments for:
Straight-lining of lease revenue 0.8 0.6 0.3 1.4
Unrealised foreign exchange gain (1.0) (2.7) (0.9) 4.3
Net gain on disposal of investments (0.2) (7.0) (0.2) (8.0)
Net gain on change in fair value of:
Investment properties (39.4) (110.4) (14.0) (79.7)
Derivatives 5.7 (18.5) 4.0 (8.4)
Loss on financial asset at fair value through profit or loss 23.0 28.9 – –
Transfer of foreign currency translation reserve from disposed operations to profit and loss – 131.1 – 131.1
Fair value loss of acquisition costs on equity accounted investments – 12.2 – 12.2
Amortisation of tenant incentives and leasing fees 16.7 14.7 9.9 10.8
Excess of distributions received from equity accounted investments over share of profits (14.6) (13.5) (14.5) (5.1)
Excess of distribution from asset held for sale over share of profits (1.0) – – –
Deferred income tax benefit – (56.7) – (54.5)
Loss on transfer of equity accounted investments to asset held for sale 1.3 – – –
Other non-cash items (5.0) (3.3) (1.2) (0.6)
Net cash provided by operating activities for the year before changes in working capital 145.0 83.9 79.9 21.5
Changes in working capital:
(Increase)/Decrease in receivables (0.2) 1.7 (0.1) 0.7
Decrease in payables (1.3) (1.9) (1.8) (3.4)
Net cash provided by operating activities from operations 143.5 83.7 78.0 18.8
27. Events occurring after the reporting period
The settlement of the 99 Walker Street, North Sydney acquisition occurred on the 24 July 2013 for a purchase price of $124.9 million plus settlement adjustments and transaction costs.
The USPP outlined in Note 14(c) settled on the 12 August 2013 with the funds received from the placement, amounting to AUD$128.9 million as at that date, used to repay the Group and Prime’s existing syndicated bank debt.
The Directors of the Responsible Entity are not aware of any other matter or circumstance not otherwise dealt within this report or the financial report that has significantly or may significantly affect the operations of the Group or Prime, the results of those operations, or state of the Group’s or Prime’s affairs in future financial periods.F
or p
erso
nal u
se o
nly

96 Investa OffIce fund annual fInancIal RepORt June 2013
Directors’ Declaration
In the opinion of the Directors of Investa Listed Funds Management Limited, the Responsible Entity of Armstrong Jones Office Fund and Prime Credit Property Trust:
(a) the Consolidated Financial Statements and notes set out on pages 38 to 95 are in accordance with the Corporations Act 2001, including:
(i) complying with Accounting Standards, the Corporations Regulations 2001 and other mandatory professional reporting requirements;
(ii) giving a true and fair view of each of, the Group and Prime Credit Property Trust’s consolidated financial position as at 30 June 2013 and of their performance for the year ended on that date;
(b) there are reasonable grounds to believe that each of Armstrong Jones Office Fund and Prime Credit Property Trust will be able to pay their debts as and when they become due and payable.
Note 1 confirms that the Financial Statements also comply with International Financial Reporting Standards as issued by the International Accounting Standards Board.
This declaration has been made in accordance with a resolution of the Directors of Investa Listed Funds Management Limited as the Responsible Entity of Armstrong Jones Office Fund and Prime Credit Property Trust and after receiving the declarations required to be made by the Chief Executive Officer and Chief Financial Officer to the Directors in accordance with section 295A of the Corporations Act 2001 for the year ending 30 June 2013.
Deborah Page AM Chairman
Sydney 21 August 2013
For
per
sona
l use
onl
y

97A
nn
ua
l Rep
ort
Go
verna
nce
GR
I Ind
exF
ina
ncia
l S
tatemen
tsS
up
plem
enta
ry In
form
ation
independent auditor’s report to the stapled securityholders of investa Office Fund and the unitholders of Prime Credit Property Trust
For
per
sona
l use
onl
y

98 Investa OffIce fund annual fInancIal RepORt June 2013
independent auditor’s report to the stapled securityholders of investa Office Fund and the unitholders of Prime Credit Property Trust (continued)
For
per
sona
l use
onl
y

99A
nn
ua
l Rep
ort
Go
verna
nce
GR
I Ind
exF
ina
ncia
l S
tatemen
tsS
up
plem
enta
ry In
form
ation
An
nu
al R
epo
rtG
overn
an
ceG
RI In
dex
Fin
an
cial
Statem
ents
Su
pp
lemen
tary
Info
rmatio
n
The IOF website, investa.com.au/IOF has useful information on the Fund including recent annual reports and ASX announcements, historical information about distributions paid, Unit pricing and Units on issue. While visiting the site, unitholders can access a link to Link Market Services, the registry provider for IOF. Link Market Services manage the IOF Unit registry and can assist with investment details including holding balances and payment history.
approach to Investor Relations
The Fund’s unitholder base is made up of both institutional, which form the majority of the unitholder base, and private investors. The management team regularly engage and communicate with all investors through a specific schedule undertaken throughout the year. This includes the results presentation, immediately following the release of the financial statements to the ASX in August and February each year, which provides investors with a detailed overview of the Fund’s performance for the relevant period.
private unitholders
Our private unitholders are a valued part of our unitholder base and are actively encouraged to provide feedback and communicate with the Directors via the Fund’s nominated Investor Relations representative.
The Annual Unitholder Meeting (“AUM”) provides all unitholders with an opportunity to engage directly with the Directors and senior management, and to question the Board and Chairman on matters relating to the business of the Fund. A detailed presentation on the performance and management of the Fund is lodged with the ASX and delivered by the Fund Manager and Chairman at the meeting. During the year private unitholders are also provided with Fund updates via the Annual Reporting Suite and the Half Year Review. Any material announcements during the year are lodged with the ASX and are available on the ASX and the IOF website www.investa.com.au/IOF
Institutional unitholders
Road shows and Investor Meetings
Undertaken after the Funds results presentation each year, management provides an opportunity for institutional investors, analysts and the media to meet one on one or in small forums directly with senior management of the Fund throughout Australia, Asia, US and Europe.
Industry conferences
Throughout the year management promotes the Fund by attending various industry conferences meeting with existing and potential investors and providing further clarification on the Fund’s operations, strategy and competitive advantage.
asX listing
Investa Office Fund is listed on the Australian Securities Exchange (ASX). The ASX code for the Fund is “IOF”.
Units in the Fund trade on the ASX in the same manner as shares in a listed company. Unitholders wishing to trade their Units will need to use the services of a stockbroker or online broking facility.
annual taxation statements
The Fund produces the annual tax statement at the end of August each year. This statement advises the taxable income for the Financial Year ended 30 June. Unitholders may view their 2012/2013 annual taxation statement by visiting www.investa.com.au/IOF and accessing “My Unitholding” on the landing page.
distribution payments
The Fund pays distributions half-yearly in August and February.
Distribution payments to unitholders with registered addresses in Australia will only be made by direct credit to their nominated bank account. Unitholders with registered addresses outside of Australia will receive payment in the same form as they have previously nominated.
You will continue to receive a distribution statement in the form nominated by you (electronic or paper) for your tax records.
Please provide details of your nominated bank account to our share registrar, Link Market Services. If your banking instructions are not received by the record date for each distribution your distribution payment will be retained by Investa Office Fund until your banking instructions are received after which the full amount will be paid into your nominated bank account.
distribution reinvestment plan
The distribution reinvestment plan (DRP) is currently switched off. Should this change, an ASX announcement will be made to the market and participation forms will be sent to unitholders.
On-market Buy Back
There is no current on-market buy back.
investa.com.au/iOF
investor RelationsF
or p
erso
nal u
se o
nly
100 Investa OffIce fund annual fInancIal RepORt June 2013
disposal and acquisition of stapled securities
Investa Office Fund is a stapled security consisting of Units in both PCP Trust and AJO Fund. The sale (or acquisition) of Units in IOF represents the sale (or acquisition) of separate interests in each of the two entities. For capital gains tax purposes, the acquisition costs and disposal proceeds need to be apportioned to each of the two entities, using a reasonable basis of apportionment.
One possible method of apportionment is on the basis of the relative net assets (excluding minority interest) of the individual entities comprising IOF, which is set out in the following table as at 31 December 2012 and 30 June 2013.
31 December 2012 30 June 2013
PCP Trust 55.87% 55.89%
AJO Fund 44.13% 44.11%
units on issue
The number of IOF Units on issue currently stands at 614,047,458.
unitholder meetings
The Annual Unitholder Meeting (“AUM”) for IOF is scheduled to be held on Thursday 24 October 2013. All unitholders will be sent a Notice of Meeting approximately one month in advance to advise of the agenda and venue for the meeting. Details of the location will also be made available on the IOF website.
Additional unitholder meetings may occur at other times during the year and unitholders will be advised in writing of the details.
2013/2014 Key dates1
Distribution paid for half year ended 30 June 2013
31 August 2013
FY2013 Annual Taxation Statements available
31 August 2013
Annual Unitholder Meeting 24 October 2013
Half year results for six months to 31 December 2013 released to ASX
21 February 2014
Distribution payment for half year ended 31 December 2013
28 February 2014
Annual results for year to 30 June 2014 released to ASX
21 August 2014
Distribution paid for half year ended 30 June 2014
31 August 2014
FY2014 Annual Taxation Statements available
31 August 2014
FY2014 Annual Report available September 2014
enquiries
If a unitholder wishes to advise of a change of address, altered or closed bank account to which distributions are directed, or wishes to advise a tax file number, then please contact IOF’s registry provider as follows:
Link Market Services LimitedLocked Bag A14Sydney South NSW 1235
Phone: Freecall (+61) 1300 851 394 (within Australia) Fax: +61 2 9287 0303
Email: [email protected]: www.linkmarketservices.com.au
Enquiries about IOF can be directed to the Investor Relations Representative as follows:
Investa Property Group Level 6 Deutsche Bank Place126 Phillip StreetSydney NSW 2000
Phone: Freecall 1300 130 231 (within Australia) or +61 2 8226 9497 (outside Australia)Fax: +61 2 9844 9341
Email: [email protected]
complaints
Any unitholder wishing to register a complaint should direct it to the Investor Relations Representative of ILFML in the first instance so that we can address your complaint.
Investor Relations RepresentativeInvesta Listed Funds Management LimitedLevel 6 Deutsche Bank Place126 Phillip StreetSydney NSW 2000AUSTRALIA
Phone: 1300 130 231 (within Australia) or +61 2 8226 9497 (outside Australia) Fax: +61 2 9844 9300
Email: [email protected]
Investa Listed Funds Management Limited is a member of an independent dispute resolution scheme, the Financial Ombudsman Service (FOS). If a unitholder believes that a complaint remains unresolved or wishes that it is further investigated, the FOS can be contacted as below:
financial Ombudsman service
GPO Box 3Melbourne VIC 3001AUSTRALIA
Phone: 1300 780 808 Fax: +61 3 9613 6399
Email: [email protected]
Investa Listed Funds Management Limited is committed to ensuring the confidentiality and security of personal information.
1. These timings are indicative only and subject to change.
investor Relations (continued)F
or p
erso
nal u
se o
nly

101A
nn
ua
l Rep
ort
Go
verna
nce
GR
I Ind
exF
ina
ncia
l S
tatemen
tsS
up
plem
enta
ry In
form
ation
The Top 20 and Substantial Holdings
top 20 unitholders
Rank Name 31 August 2013 % IC
1 HSBC CUSTODY NOMINEES (AUSTRALIA) LIMITED 180,401,651 29.38
2 J P MORGAN NOMINEES AUSTRALIA LIMITED 98,334,067 16.01
3 NATIONAL NOMINEES LIMITED 76,163,702 12.40
4 CITICORP NOMINEES PTY LIMITED 35,081,987 5.71
5 BNP PARIBAS NOMS PTY LTD 19,894,422 3.24
6 JP MORGAN NOMINEES AUSTRALIA LIMITED 19,498,441 3.18
7 INVESTA OFFICE MANAGEMENT HOLDINGS PTY LTD 17,763,937 2.89
8 AMP LIFE LIMITED 12,794,547 2.08
9 CITICORP NOMINEES PTY LIMITED 10,043,948 1.64
10 EQUITY TRUSTEES LIMITED 9,919,655 1.62
11 RBC INVESTOR SERVICES AUSTRALIA NOMINEES PTY LIMITED 9,285,663 1.51
12 QUESTOR FINANCIAL SERVICES LIMITED 5,687,163 0.93
13 AVANTEOS INVESTMENTS LIMITED 3,708,389 0.60
14 RBC INVESTOR SERVICES AUSTRALIA NOMINEES PTY LIMITED 2,342,840 0.38
15 CS FOURTH NOMINEES PTY LTD 2,309,390 0.38
16 BOND STREET CUSTODIANS LIMITED 1,632,025 0.27
17 HSBC CUSTODY NOMINEES (AUSTRALIA) LIMITED-GSCO ECA 1,606,381 0.26
18 RBC INVESTOR SERVICES AUSTRALIA NOMINEES PTY LIMITED 1,418,985 0.23
19 SHARE DIRECT NOMINEES PTY LTD 1,206,000 0.20
20 HSBC CUSTODY NOMINEES (AUSTRALIA) LIMITED 1,177,764 0.19
TOTAL 510,270,957 83.10
Balance of Register 103,776,501 16.90
Grand TOTAL 614,047,458 100.00
For
per
sona
l use
onl
y

102 Investa OffIce fund annual fInancIal RepORt June 2013
The Top 20 and Substantial Holdings (continued)
Holdings distribution
Range Number of Holders Number of Units %
100,001 and Over 78 531,462,381 86.55
50,001 to 100,000 61 4,017,626 0.65
10,001 to 50,000 1,764 30,520,888 4.97
5,001 to 10,000 3,397 24,076,409 3.92
1,001 to 5,000 7,842 22,176,373 3.61
1 to 1,000 3,612 1,793,781 0.29
Total 16,754 614,047,458 100.00
Unmarketable Parcels 328 12,159 0.00
substantial Holdings
The table below gives details of the last notice for each substantial unitholder lodged with the Australian Securities Exchange to 30 August 2013.
Effective Date Name Number of Units %
13 June 2013 Westpac Banking Corporation Group 47,919,414 7.80
20 December 2012 Commonwealth Bank of Australia 42,890,350 6.98
20 November 2012 Morgan Stanley Investment Management Company 45,597,778 7.43
9 November 2012 Mitsubishi UFJ Financial Group, Inc 44,686,196 7.28
For
per
sona
l use
onl
y
103A
nn
ua
l Rep
ort
Go
verna
nce
GR
I Ind
exF
ina
ncia
l S
tatemen
tsS
up
plem
enta
ry In
form
ation
Glossary
term MeaningaffO Property Council Adjusted Funds From Operations defined as the Group’s Property
Council FFO adjusted for other non-cash and other items such as maintenance capital expenditure, incentives given for the accounting period, derivative close out costs, and other one-off items which have not been adjusted in determining Property Council FFO.
aIfRs Australian equivalents to International Financial Reporting Standards
aJO Armstrong Jones Office Fund (ARSN 090 242 229)
a-ReIt Australian Real Estate Investment Trust, which is typically referred to as an Australian listed property trust
asIc Australian Securities & Investments Commission
asX ASX Limited (ABN 98 008 624 691) trading as Australian Securities Exchange, which is the main Australian marketplace for the trading of equities, government bonds and other fixed interest securities
auM Annual Unitholder Meeting – equivalent to the Annual General Meeting
Beecs Building Energy Efficiency Certificates, are required under the Mandatory Commercial Building Disclosure (CBD) obligations are set out under the Australian Building Energy Efficiency Disclosure Act 2010. BEECs are publicly accessible on the online Building Energy Efficiency Register.
Board The Board of Directors of the Responsible Entity
cBd Central Business District refers to the business and financial area of an Australian state capital city.
cdp Carbon Disclosure Project is an independent not-for-profit organization that works with investors, businesses and governments to benchmark organisations’ greenhouse gas emissions.
corporations act Corporations Act 2001 (Cth)
directors Directors of the Responsible Entity
dOf Dutch Office Fund, which is an unlisted wholesale fund that has a portfolio of Dutch office properties that are predominantly located throughout the four major markets of the Netherlands.
dpu Distributions per Unit
epu Earnings per Unit
ffO Property Council Funds From Operations defined as the Group’s underlying and recurring earnings from its operations, determined by adjusting statutory net profit (under AIFRS) for non-cash and other items such as the amortisation of tenant incentives and rent free periods, fair value gains / losses on investment property, fair value gains / losses on the mark to market of derivatives, the straight lining of rent, non-FFO deferred tax benefits and expenses, foreign currency translation reserves recognised in net profit, and any other unrealised or one-off items.
GRI Global Reporting Initiative, are voluntary international reporting guidelines to ensure completeness, transparency, materiality and boundary setting of corporate reporting. A ‘GRI Index’ covers environmental, social and financial report contents.
IlfMl Investa Listed Funds Management Limited (ACN 149 175 655)
Independent directors Deborah Page, Peter Rowe and Peter Dodd, who are external directors within the meaning of sub-section 601JA(2) of the Corporations Act 2001
Investa or the Manager Investa Office, the manager of IOF, is one of Australia’s largest office owners and managers and provides an integrated property platform incorporating property services, funds, portfolio and asset management, development and sustainability.
IOf or the fund Investa Office Fund, which comprises of the AJO Fund and the PCP Trust
For
per
sona
l use
onl
y

104 Investa OffIce fund annual fInancIal RepORt June 2013
Glossary (continued)
term MeaningnaBeRs National Australian Built Environment Ratings System, is a national rating system that
measures the environmental performance of Australian buildings, tenancies, homes, shopping centres and hotels
non-aas measure A financial measure not in accordance with Australian Accounting Standards
nta Net Tangible Assets
Operating earnings The Responsible Entity considers the non-AAS measure, Operating earnings, an important indicator of underlying performance of the Group. To calculate Operating earnings, net profit attributable to unitholders is adjusted to exclude unrealised gains or losses, certain non-cash items, fair value gains or losses on investments and other amounts that are non-recurring or capital in nature. Refer to the Statutory Accounts for the complete definition.
pca Property Council of Australia
pcp trust Prime Credit Property Trust (ARSN 089 849 196)
Responsible entity or Re Investa Listed Funds Management Limited (ACN 149 175 655)
s&p Standard & Poor’s
sHeMs Investa’s Safety, Health, Environment Management System, verified to Australian Standard AS/NZS/ISO 14001:2004, AS/NZS 4804:2001
unit A stapled security in IOF consisting of one Unit in AJO Fund stapled to one Unit in PCP Trust or a Unit in AJO Fund or PCP Trust, as the context requires
unit Buyback The Unit Buyback arrangement undertaken by IOF in 2011, which was announced to the ASX on 15 August 2011 and its completion was announced to the ASX on 16 December 2011
unpRI United Nations Principles for Responsible Investment, proclaimed by the UN Secretary-General in 2005 are put into practice through a voluntary framework for investors to incorporate ESG issues into decision-making and ownership practices.
uspp US Private Placement
Wale Weighted Average Lease Expiry – Measures the weighted average lease term remaining to expire across a portfolio
WH&s Work Health & Safety previously known as Occupational Health & Safety
For
per
sona
l use
onl
y

Corporate Directory
disclaimer
This Annual Report was prepared by Investa Listed Funds Management Limited (ACN 149 175 655 and AFSL 401414) on behalf of the Investa Office Fund, which comprises the Prime Credit Property Trust (ARSN 089 849 196) and the Armstrong Jones Office Fund (ARSN 090 242 229). Information contained in this Report is current as at 30 June 2013 unless otherwise stated.
This Annual Report is provided for general information purposes only and has been prepared without taking account of any particular reader’s financial situation, objectives or needs. Nothing contained in this Report constitutes investment, legal, tax or other advice. Accordingly, readers should conduct their own due diligence in relation to any information contained in this Report and, before acting on any information in this Report, consider its appropriateness, having regard to their objectives, financial situation and needs, and seek the assistance of their financial or other licensed professional adviser before making any investment decision. This Report does not constitute an offer, invitation, solicitation or recommendation with respect to the subscription for, purchase or sale of any security, nor does it form the basis of any contract or commitment.
Except as required by law, no representation or warranty, express or implied, is made as to the fairness, accuracy or completeness of the information, opinions and conclusions, or as to the reasonableness of any assumption, contained in this Report. This Report may include forward-looking statements, which are not guarantees or predictions of future performance. Any forward-looking statements contained in this Report involve known and unknown risks and uncertainties which may cause actual results to differ from those contained in this Report.
By reading this Report and to the extent permitted by law, the reader releases Investa Office and its affiliates, and any of their respective Directors, officers, employees, representatives or advisers from any liability (including, without limitation, in respect of direct, indirect or consequential loss or damage arising by negligence) arising in relation to any reader relying on anything contained in or omitted from this Report.
Investa Office fund
Armstrong Jones Office Fund ARSN 090 242 229
Prime Credit Property Trust ARSN 089 849 196
Responsible entity
Investa Listed Funds Management Limited (ILFML) ACN 149 175 655 AFSL 401414
Registered Office
Deutsche Bank Place Level 6, 126-130 Phillip Street Sydney NSW 2000 Australia
Phone: +61 2 8226 9300 Fax: +61 2 9844 9300
Email: [email protected] Website: www.investa.com.au/IOF
directors of IlfMl
Deborah Page AM (Chairman) Peter Dodd Peter Rowe Scott MacDonald Ming Long Campbell Hanan (Alternate)
IOf fund Manager
Toby Phelps
company secretaries
Dorothy Mioduszewska Jonathan Callaghan
asX code
IOF
unit Registry
Link Market Services Limited Level 12, 680 George Street Sydney NSW 2000
Locked Bag A14 Sydney South NSW 1235 Ph: 1300 851 394 (local call cost) or: +61 2 8280 7912 (outside Australia) Fax: +61 2 9287 0303
Email: [email protected]
auditors
PricewaterhouseCoopers Darling Park Tower 2 201 Sussex Street, Sydney NSW 2000
For
per
sona
l use
onl
y
The first choice in Australian Office
iOF2013.reportonline.com.au
if you have any questions about iOF’s reporting or questions in relation to your unitholding, please call the unitholder information line on (+61) 1300 851 394.Further information about the Fund can be accessed and downloaded at www.investa.com.au/iOF
INVESTA LISTED FUNDS MANAGEMENT LIMITED Level 6, Deutsche Bank Place126 Phillip StreetSydney NSW 2000T +61 2 8226 9300 F +61 2 9844 9300
ACN 149 175 655 AFSL 401414
For
per
sona
l use
onl
y