For personal use only - ASX2018/02/27 · Nanomaterials Titanium dioxide uses include solar cells,...
148
Annual Report 2017 For personal use only
Transcript of For personal use only - ASX2018/02/27 · Nanomaterials Titanium dioxide uses include solar cells,...

Annual Report
2017
For
per
sona
l use
onl
y

2 Iluka Resources Limited, Annual Report 2017
Manufacturing
Zircon is heat resistant and non-reactive and is used in steel and glass manufacturing and metal casting
Pigment
Paint coatings, plastic and ceramics use titanium dioxide in the form of pigment
Nanomaterials
Titanium dioxide uses include solar cells, water purification and noise absorption
Bathroom/Lifestyle
Ceramics, sanitary and toilet basins, glass, faucets for taps, cosmetics, pharmaceutical products, toothpaste, anti-perspirants, sunscreens
Roof/Building/ Construction
Solar panels, electrical insulators, bricks/cement, fibre optics, exterior and interior paint, tiles, anti-pollution coatings
Home/OfficeMobile phones, plastic, printer inks, paper, packaging
Kitchen/Utilities
Light bulbs, dishes, glasses, clock parts, food colouring, ceramic knives, pans
Automotive
Brake linings/pads, car parking sensors, automotive paint, catalytic converters, automotive electrics, rubber products
Sporting Goods/ Recreation
Golf clubs, tennis racquets, bicycle frames (titanium)
Healthcare/Medicine
Dental implants, hip and bone replacements, heart pacemakers, kidney dialysis, zirconia-nuclear medicine
Aircraft/Industry
Titanium metal, desalination plants, zirconium metal, corrosion resistant coatings
Mineral sands part of everyday life
Ceramics
Floor and wall tiles shown on the cover contain zircon. Zircon contributes to whiteness and the abrasion and heat resistance that tiles provide
For
per
sona
l use
onl
y

Iluka Resources Limited, Annual Report 2017 1
Zircon
Products
From everyday applications in the home and workplace, to medical, lifestyle and industrial applications, the unique properties of titanium dioxide and zircon are utilised in a vast array of products. Iluka also recovers and markets activated carbon and iron concentrate; both of which are by-products of the synthetic rutile process.
Zr
Titanium Dioxide
TiO2
Iluka is a major producer of high-grade titanium dioxide products (rutile and synthetic rutile), as well as ilmenite. Uses include pigment (paints), titanium metal and welding.
Iluka is the world’s largest producer of zircon. Zircon is opaque; and heat, water, chemical and abrasion resistant. Uses include ceramics, refractory and foundry; and zirconium chemicals.
For
per
sona
l use
onl
y

2 Iluka Resources Limited, Annual Report 2017
About Iluka Resources
lluka Resources Limited (Iluka) is involved in the exploration, project development, mining operations, processing and marketing of mineral sands. The company is a major producer of zircon globally and a large producer of the high-grade titanium dioxide products rutile and synthetic rutile. Iluka’s products are used in an increasing array of applications including home, workplace, medical, lifestyle and industrial uses.
With approximately 2,500 direct employees, the company has operations in Australia and Sierra Leone; projects in Australia, Sierra Leone and Sri Lanka; rehabilitation programmes in the US and Australia; and a globally integrated marketing network.
The company also has a royalty over iron ore sales revenues from tenements of BHP Billiton’s Mining Area C (MAC) province in the north west of Western Australia.
Iluka is listed on the Australian Securities Exchange and its corporate support centre is located in Perth, Western Australia.
Approach
Iluka is involved in all of the main stages of the mineral sands process, from resource development through to delivery of customer benefits.
Iluka’s objective is to create and deliver value for shareholders and its approach is premised on
• Being disciplined in capital allocation
• Seeking a sustainable price environment for mineral sands products
• Preserving and advancing growth opportunities
• Flexing assets in line with market conditions
• Acting-counter cyclically where appropriate.
Iluka conducts its operations to high standards in terms of governance and the environment; and strives for the best outcomes in health and safety management, and engaging with the communities in which it operates.
Geological setting
“Mineral sands” are heavy minerals found in sediments on, or near to the surface of ancient beach, dune or river systems. Mineral sands include minerals such as rutile, ilmenite, zircon and monazite.
Mining approach
Mineral sands mining involves both dry mining and wet (dredge or hydraulic) operations. Mining unit plants and wet concentrator plants concentrate and separate the heavy mineral sands from waste material.
Mineral separation
The heavy mineral concentrate is transported from the mine to a mineral separation plant for final product processing. The plant separates the heavy minerals from each other in multiple stages by magnetic, electrostatic and gravity separation.
Synthetic rutile
Iluka also produces synthetic rutile, ilmenite that is upgraded by high temperature chemical processes.
Mineral sands process
ILUKA IS INVOLVED IN THE EXPLORATION, PROJECT DEVELOPMENT, MINING OPERATIONS, PROCESSING AND MARKETING OF MINERAL SANDS
For
per
sona
l use
onl
y

Iluka Resources Limited, Annual Report 2017 3
Sierra Leone
Sierra Rutile operationsGangama dry mineLanti dry mine Lanti dredge mineSembehun projectSembehun project
Western AustraliaProcessing operationsCataby projectSynthetic rutile kilns
Eucla BasinJacinth-Ambrosia mine Satellite deposits
Murray BasinBalranald project
Sri LankaPuttalam project
Rehabilitation
As mining progresses, the mining pit is backfilled and covered with stockpiled soils that were removed at the start of the process. Rehabilitation is progressively undertaken to return land to a form similar to its pre-mining state and suitable for various uses including agricultural, pastoral and native vegetation.
Marketing
Iluka transports the final products of zircon, rutile, synthetic rutile and ilmenite to customers around the world.
* Mining and processing activities were completed in Virginia, USA, in 2016 and the mineral sands areas are currently being rehabilitated.
*
For
per
sona
l use
onl
y

4 Iluka Resources Limited, Annual Report 2017
About this reportThis annual report is a summary of Iluka Resources and its subsidiary operations, activities and financial position as at 31 December 2017. Currency is expressed in Australian dollars (AUD) unless otherwise stated.
Iluka plans to publish a separate Sustainability Report, in accordance with the Global Reporting Initiative Framework, which will contain information on Iluka’s sustainability approach and performance for the period 1 January 2017 – 31 December 2017. The Sustainability Report is expected to be published in April 2018 on the company’s website www.iluka.com. Iluka’s 2016 Sustainability Report is available on the company’s website.
Iluka is committed to reducing the environmental footprint associated with the production of the annual report, and printed copies are only posted to shareholders who have elected to receive a printed copy.
CREATING ANDDELIVERINGVALUE
Narngulu mineral separation plant, Western Australia
For
per
sona
l use
onl
y

Iluka Resources Limited, Annual Report 2017 5
Contents
Business review
2017 Year in review 6
Chairman’s review 8
Managing Director’s review 10
Board and executive 12
Financial summary 14
Strategy, capital management and future prospects 18
Financial and operational review 20
Sustainability 38
Business risks and mitigations 40
Financial report 42
Results for announcement to the market 44
Directors’ report 45
Remuneration report 53
Auditor’s independence declaration 74
Financial statements 75
Directors’ declaration 123
Independent auditor’s report 124
Physical, financial and corporate information 130
Five year physical and financial summary 132
Operating mines physical data 134
Ore Reserves and Mineral Resources statement 135
Shareholder and investor information 142
Corporate information 144
For
per
sona
l use
onl
y

6 Iluka Resources Limited, Annual Report 2017
2017 Year in review
Strong underlying financial result
• Mineral sands revenue increased 40% to $1,017.5 million with growth in sales volumes and prices.
• Mining Area C royalty income contributed $59.6 million.
• Underlying Group EBITDA increased 140% to $360.5 million, reflecting strong revenue and non-production cost reductions.
• Impairment expense ($185.4 million) and rehabilitation provision increase for closed sites ($127.4 million) resulted in net loss after tax of $171.6 million.
• Strong free cash flow of $321.9 million.
• Significant debt reduction with closing net debt of $182.5 million (2016: $506.3 million).
• A fully franked final dividend of 25 CPS was declared, which together with the interim dividend of 6 CPS brings the total 2017 dividend to 31 CPS representing 40% of free cash flow.
Sustainable business focus continued
• Achieved $61.5 milllion reduction in non-production costs.
• Detailed review of existing production portfolio and projects.
• Consolidated Australian mineral processing plant capacity by idling Hamilton plant with Narngulu plant considered sufficient to process future Australian production.
Cataby project execute and Jacinth-Ambrosia restart
• Cataby project approved in December.
• $250-275 million capital spend for initial 8.5 year mine life. Production to sustain Iluka’s synthetic rutile production.
• Project underpinned by favourable offtake agreements for 85% of synthetic rutile production for at least four years.
• Jacinth-Ambrosia successfully restarted in December.
Recovery in mineral sands markets
• Combined zircon/rutile/synthetic rutile sales of 889 thousand tonnes, up 27% from 2016.
• Moderate underlying demand growth in zircon markets combined with supply constraints.
• Pigment supply issues in China and Europe increasing average utilisation across other plants. High-grade feedstocks used to increase plant yield, leading to strong demand for rutile and synthetic rutile.
• Price improvement across all products from the start of the year: zircon average price up 40% to US$1,128 per tonne in Q4; rutile average price up 13% to US$825 per tonne in H2.
Lanti dredge, Sierra Rutile
For
per
sona
l use
onl
y

Iluka Resources Limited, Annual Report 2017 7
Sierra Rutile improvements achieved and expansion projects progressing
• First full year of ownership and operations fully integrated into Iluka Group.
• Iluka expertise delivered significant operational improvements, including increasing valuable heavy mineral recovery and increasing heavy mineral concentrate grades.
• Delivery of in-pit mining project.
• Expansion projects progressed and on track.
Resource development projects
• Rutile-rich Balranald project full-scale wear test successfully completed in 2017. Planning advanced to progress to production trial in 2018. Continue in staged development approach.
• Sri Lanka Puttalam project sulphate ilmenite deposit work ongoing, including technical aspects and local engagement.
• WIM deposit options and exploration in Kazakhstan and Canada provide longer term pipeline of potential developments.
Committed to sustainable development
• Incorporated into 2017 Australian Dow Jones Sustainability Indices for leading sustainability performance.
• 2017 total recordable injury frequency rate for Iluka, excluding Sierra Rutile, increased from 4.4 to 4.8 with one less injury but fewer overall hours worked than 2016.
• Sierra Rutile total recordable injury frequency rate was 2.2 in 2017.
• Continued integration of Iluka’s safety and risk mitigation framework to strengthen Sierra Rutile’s sustainability performance.
• Sustainability targets set and communicated externally to track and improve performance across material issues.
• Further detailed rehabilitation planning and analysis at closed US operations leading to increase in provision by US$90 million. Reduction in Australian operations rehabilitation provision through completion of 212 hectares.
• Awarded the South Australian Premier’s Community Excellence Award for Social Inclusion.
UNDERLYING GROUP EBITDA INCREASED 140%
TO $360.5 MILLION
PRICE IMPROVEMENT ACROSS ALL PRODUCTS:
ZIRCON PRICE UP 40%; RUTILE PRICE UP 13%
SIGNIFICANT DEBT REDUCTION WITH
CLOSING NET DEBT OF $182.5 MILLION
(2016: $506.3 MILLION)
INCORPORATED INTO 2017 DOW JONES
SUSTAINABILITY INDICES AUSTRALIA
FOR LEADING SUSTAINABILITY PERFORMANCE
For
per
sona
l use
onl
y

8 Iluka Resources Limited, Annual Report 2017
Dear Shareholders
2017 marked a year of transition for Iluka following the appointment of Tom O’Leary as Managing Director in September 2016. Key developments included:
• the integration of the Sierra Rutile operation, which was acquired in December 2016;
• a substantial improvement in mineral sands market conditions;
• changes in operational settings – reflecting both improved markets and a detailed review of Iluka’s production portfolio and projects following the Sierra Rutile acquisition; and
• project approval of Cataby.
Despite reporting an unsatisfactory financial loss for the year, Iluka’s underlying performance in the midst of this transition was strong with the company ending 2017 in sound shape from a financial, operational and governance perspective.
In last year’s Annual Report I conveyed the Board’s cautious optimism in relation to mineral sands markets, which at that time had experienced an extended period of subdued conditions. As such, it was pleasing to witness these markets continue to recover over the course of 2017. Looking ahead, it is the Board’s view that the approach adopted by the company in recent times has positioned Iluka to benefit from improving demand and prices for its products, leading to the creation of value for shareholders in the process.
Iluka’s full year financial result was an after tax loss of $171.6 million. The higher mineral sands revenues achieved – driven by increased volumes and prices and a higher contribution from the Mining Area C iron ore royalty, resulted in a strong underlying performance. Free cash flow was $322 million with Iluka ending 2017 with net debt of $183 million, down from $506 million at the beginning of the year.
THE COMPANY ENDED 2017 IN SOUND SHAPE FROM A FINANCIAL, OPERATIONAL
AND GOVERNANCE PERSPECTIVE
Chairman’s review
Synthetic rutile kiln, mid west operations
For
per
sona
l use
onl
y

Iluka Resources Limited, Annual Report 2017 9
The Board declared a final dividend of 25 cents per share, fully franked. This is consistent with Iluka’s dividend framework to return to shareholders a minimum of 40 per cent of free cash flow not required for investment purposes or balance sheet activity. Adding Iluka’s interim dividend for 2017 of 6 cents per share, fully franked translates to a total dividend for 2017 of 31 cents per share, fully franked.
Protecting the safety and wellbeing of Iluka’s people lies at the heart of the business and is an area of continuing emphasis for the Board and Executive. The company’s total recordable injury frequency rate increased from 4.4 to 4.8 in 2017, with one less injury offset by a slight reduction in hours worked. The lost time injury frequency rate increased from 0.4 to 0.9. As 2017 was a baseline year for data collection at Sierra Rutile following the implementation of Iluka’s safety incident reporting framework, these frequency rates and comparisons to 2016 performance exclude that operation. Sierra Rutile ended 2017 with a total recordable injury frequency rate of 2.2 and a lost time injury frequency rate of 1.0. At 31 December 2017, the combined Group (Iluka Resources including Sierra Rutile) total recordable injury frequency rate was 2.8 and lost time injury frequency rate was 1.0. This will be used for 2018 comparisons.
Environmental incident reporting was also introduced at Sierra Rutile in 2017, with 20 incidents reported for the year. Excluding Sierra Rutile, Iluka recorded a reduction in environmental incidents from 11 in 2016 to 7 in 2017. As reported in December, the company completed detailed rehabilitation planning for its closed Virginia operation in the United States and identified potential additional obligations relating to past rehabilitation activity. This resulted in a US$90 million increase to the rehabilitation provision, which is a disappointing outcome and one that has received close examination by the Board and Executive.
As part of the commitment made to align Iluka’s sustainability practices with the International Council on Mining and Metals (ICMM) Framework for Sustainable Development, the company prepared a separate, detailed sustainability report in April 2017 for the 2016 reporting year. This improvement in transparency and reporting was recognised through Iluka’s first listing on the Dow Jones Sustainability Index (DJSI) Australia as a leading sustainability performer. Standalone sustainability reports will remain an annual feature of Iluka’s communication with shareholders and external stakeholders more broadly.
The Board has reviewed the current remuneration structures for the Managing Director and senior management and determined to implement a new Executive Incentive Plan (EIP) in 2018. Under the new arrangements, the current Short and Long Term Incentive plans will be combined and rewards largely delivered in Iluka shares with deferred vesting. The EIP is designed to support the delivery of Iluka’s strategic objectives and further align management’s interests with those of shareholders. Further details can be found in the Remuneration Report.
On other governance matters, the Board participated in an externally facilitated review of its effectiveness, skills and competency inventory. I am pleased to report that this review identified a number of strengths including a clear, shared sense of the Board’s role; an excellent relationship between the Chair, Board and Managing Director; sound governance policies and processes; and a good mix of experience, skills and knowledge among Directors. As always, the challenge for the Board is continuous improvement in building a governance framework and capability in line with the evolution of Iluka’s operations and strategic priorities for the future. This will be an area of ongoing focus and consideration.
I would like to conclude my letter by acknowledging the leadership of Tom O’Leary and the performance of his Executive team. Eighteen months into his tenure, Tom is focused on delivering on commitments made and ensuring Iluka does what it says it will do in a methodical, transparent and commercial manner. He is supported by an experienced and capable Executive that has adapted well to Iluka’s transition and I thank them, and the broader Iluka workforce, for their collective contribution and dedication over the past year.
I would also like to record my appreciation for the contribution and wise counsel of my fellow Directors throughout 2017.
Finally, I extend my thanks to Iluka’s shareholders for their continued support and interest in the progress and development of the business.
Greg MartinChairman
For
per
sona
l use
onl
y

10 Iluka Resources Limited, Annual Report 2017
Dear Shareholders
I am pleased to report a welcome return to positive mineral sands market conditions in 2017, with a confident outlook for 2018.The year was characterised by price and volume recovery across all of Iluka’s products, including the company securing three separate price increases for zircon, representing a 40 per cent increase in the average premium and standard price by the fourth quarter over the preceding 12 months.
When I wrote to you last year for the first time as Iluka’s Managing Director, I outlined my view that the company needs to be structured and resourced such that it is sustainable not only during periods of attractive market conditions; but also periods of low demand and pricing. This has continued to be a focus throughout 2017, as Iluka further refined its operational profile. The Hamilton mineral separation plant in Victoria was placed on care and maintenance in October; and the Narngulu mineral separation plant in Western Australia will be returned to full capacity over the medium term. This consolidation ensures optimal settings to support planned production and resulted in a pre-tax impairment of $151 million being recorded at the half year. Following the sustainable business review implemented at the end of 2016, non-production costs in 2017 decreased by $62 million.
These factors combined to enable Iluka to achieve strong free cash flow and significantly reduce debt from 2016 levels. The company concluded the year in a robust financial position, reducing gearing to 17 per cent. With the business on a sustainable footing, Iluka’s approach will be defined by disciplined capital allocation; flexing production in line with demand; preserving and advancing growth opportunities; and acting counter-cyclically where appropriate. Over the course of 2017 the company took a range of actions in line with this approach and its ultimate objective to create and deliver value for shareholders.
Notwithstanding the strength of the underlying performance, I am conscious that Iluka’s reported financial result for 2017 was unsatisfactory, having been impacted by impairments and provision increases. In December Iluka announced a US$90 million increase in the rehabilitation provision for the company’s closed operations in the United States. This was a particularly regrettable outcome in the context of the company’s strong environmental performance over recent years. Sustainable development, including land rehabilitation, is an essential part of Iluka’s operating model and I can assure you of the company’s ongoing focus on costs, safety and environmental management. The final US remediation programme is the subject of ongoing engagement between Iluka and regulatory authorities. As the nature and extent of any change remains uncertain, the provision increase has been calculated on a probabilistic basis across a range of scenarios.
Managing Director’s review
Lanti Dredge, Sierra Rutile
For
per
sona
l use
onl
y

Iluka Resources Limited, Annual Report 2017 11
MINERAL SANDS MARKETS ARE EXPERIENCING THEIR BEST
CONDITIONS IN FIVE YEARS
The investment in Metalysis Limited, an unlisted UK-based technology company focused on solid state manufacturing of metal powder, was impaired to $nil in December resulting in a non-cash charge of $30 million. Despite this disappointing development, innovation remains a key element of Iluka’s business model and the company remains committed to exploring opportunities to improve and grow its operations.
Jacinth-Ambrosia, Iluka’s primary zircon operation, restarted mining and concentrating activities in December. This followed a 20 month suspension to allow heavy mineral concentrate inventory to be drawn down during a period of subdued demand. The restart has been completed on time and on budget; and this action enhances Iluka’s ability to take advantage of the positive market dynamics now in effect.
With the acquisition of Sierra Rutile in December 2016, Iluka added a large, long life asset in Sierra Leone and attractive growth options. Sierra Rutile continues to perform broadly in line with Iluka’s expectations. 2017 saw improved performance at the operation across a number of areas, including greater mineral recovery and increased concentrate grades; the extension of the Lanti dredge asset life; enhanced tailings dam construction and management; and progress towards the alignment of safety practices with Iluka’s standards. These improvements reflect both the commitment and dedication of the Sierra Rutile workforce and Iluka’s mineral sands experience. Improving the safety culture in Sierra Rutile will be an enduring focal point.
Turning to capital allocation, in December Iluka announced the development of the Cataby project in Western Australia. Entailing capital expenditure of $250-275 million and an initial mine life of 8.5 years, the development of Cataby ensures continuity of synthetic rutile supply to the company’s customers. The mine is also an important source of high-quality zircon. Central to the development decision were offtake agreements secured by Iluka for 85 per cent of synthetic rutile production associated with Cataby for a minimum of four years. The structure and tenor of these customer agreements deliver an unprecedented level of revenue certainty to Iluka’s synthetic rutile business. They serve to underpin value from the project and illustrate the company’s disciplined approach to capital investment: Iluka will commit funds to new projects only when it is sufficiently confident of achieving satisfactory returns for shareholders.
While Iluka enters the new year in a strong position and with mineral sands markets experiencing their best conditions in five years, there is much work ahead. Delivery is the company’s core focus in 2018, with priorities including the development of Cataby; delivering expansion of production capacity at the Gangama and Lanti Dry mines; decisions on expansions at Jacinth-Ambrosia and at Sembehun in Sierra Leone; and the ongoing pursuit of excellence at all of Iluka’s operations.
The company is also conscious of the need to achieve and maintain a sustainable price environment for its products. Absent a deterioration in global economic conditions, Iluka’s ability to execute these priorities will determine the extent to which it can create and deliver shareholder value over the coming year and in the years ahead. I have confidence in Iluka’s people to meet this challenge; and I thank them for their contribution in 2017.
Tom O’LearyManaging Director and Chief Executive Officer
For
per
sona
l use
onl
y

12 Iluka Resources Limited, Annual Report 2017
Board of Directors
Greg MartinBEc, LLB, FAIM, MAICD
ChairmanJoined Iluka 2013
Murchison Metals Ltd, Australian Gas Light Company Ltd, Santos, Western Power
Tom O’LearyLLB, BJuris
Managing Director and Chief Executive OfficerJoined Iluka 2016
Wesfarmers Chemicals,Energy and Fertilisers,Wesfarmers Ltd
Xiaoling LiuPhD, BEng, GAICD, FAusIMM, FTSE
IndependentNon-Executive DirectorJoined Iluka 2016
Newcrest, South 32, Rio Tinto Minerals, Australian Aluminium Council
Marcelo BastosBEng (Mechanical) (UFMG), MBA (FDC-MG), MAICD
IndependentNon-Executive DirectorJoined Iluka 2014
Vale, BHP, MMG, Aurizon Holdings, Golder Associates
James (Hutch) RanckBSE (Econ), FAICD
IndependentNon-Executive DirectorJoined Iluka 2013
Elders Ltd, CSIRO, DuPont
Jennifer SeabrookBCom, FCA, FAICD
IndependentNon-Executive DirectorJoined Iluka 2008
Gresham Advisory Partners Ltd, MMG, Australian Rail Track Corporation, IRESS Ltd, Western Australian Treasury Corporation
Committees
The Board of Directors comprises five Non-Executive Directors and one Executive Director (the Managing Director and Chief Executive Officer).
Audit and Risk Committee
Chairman – Jennifer Seabrook
People and Performance Committee
Chairman – James (Hutch) Ranck
Nominations and Governance Committee
Chairman – Greg Martin
For
per
sona
l use
onl
y

Iluka Resources Limited, Annual Report 2017 13
Executive
Tom O’LearyLLB, BJuris
Managing Director and Chief Executive OfficerJoined Iluka 2016
Wesfarmers Chemicals,Energy and Fertilisers,Wesfarmers Ltd
Simon HayBSc (Hons), MAppSc, Grad Dip (Mgmt), MAICD
Head of ResourceDevelopmentJoined Iluka 2009
Mount Isa Mines,WMC Resources,BHP
Julian AndrewsBCom (Hons), PhD, CFA, GAICD
Head of BusinessDevelopmentJoined Iluka 2017
Wesfarmers Chemicals, Energy & Fertilisers, PwC
Sarah HodgsonLLB, GAICD
General Manager PeopleJoined Iluka 2013
Mercer, Westpac, KPMG
Adele StrattonBA (Hons), FCA, GAICD
General Manager Finance, Investor Relations & Corporate AffairsJoined Iluka 2011
KPMG, Rio Tinto Iron Ore
Doug WardenBCom, CA, MBA, GAICD
Chief Financial Officerand Head of Strategyand PlanningJoined Iluka 2003
Summit Resources, Jabiru Metals, Ernst & Young, KPMG
Matthew BlackwellBEng (Mech), Grad Dip (Tech Mgt), MBA, MAICD, MIEAust
Head of Marketing,Mineral SandsJoined Iluka 2004
Asia Pacific Resources,WMC Resources,Normandy Poseidon
Rob HattinghMSc (Geochem)
Chief Executive Officer, Sierra RutileJoined Iluka 2008
Richards Bay Minerals,Exxaro
Executive
The Executive is structured to include ten senior executives. Its responsibilities include achieving defined business and financial outcomes, capital deployment, business planning, identification and pursuit of appropriate growth opportunities, sustainability performance, promotion of diversity objectives and succession planning.
Sue WilsonBJuris, LLB, FGIA,FICSA, FAICD
General Counsel andCompany SecretaryJoined Iluka 2016
South32, Bankwest,Herbert Smith Freehills,Western Power
Steve WickhamAssoc Dip in Mechanical Engineering
Chief Operating Officer,Mineral SandsJoined Iluka 2007
Ticor South Africa, Australian Zircon
For
per
sona
l use
onl
y

14 Iluka Resources Limited, Annual Report 2017
Financial summary
13 14 15 16 17
$m
763 725
820726
1,018 88
13 14 15 16 17
67
$m
62
48
60
1 Mineral sands revenue
Mineral sands revenue increased by 40% to $1,017.5 million. Zircon/rutile/synthetic rutile (Z/R/SR) revenue increased by 38% to $959.1 million, its highest level in five years. This result reflects improved conditions in mineral sands markets increasing Iluka’s sales prices and volumes, combined with higher volumes following the acquisition of Sierra Rutile in December 2016. Iluka’s Zircon Reference Price increased in three consecutive quarters achieving a realised zircon standard and premium price of US$1,128 per tonne in Q4, a 40% increase from the start of the year. Rutile prices closed 13% higher, with approximately 40% of Sierra Rutile sales volume on fixed price contracts. Z/R/SR sales volumes grew strongly, up 27%, reflecting increases across all products.
2 Underlying mineral sands EBITDA1
Iluka’s underlying mineral sands EBITDA almost tripled relative to 2016, increasing to $300.9 million. This result reflects the combination of strong revenue growth and reduced non-production costs (exploration, resource development and corporate costs), down $61.5 million, following Iluka’s sustainable business review. Cash production costs increased in 2017 with the inclusion of Sierra Rutile operating costs, and inventory was drawn down in line with Iluka’s planned reduction in inventory levels. Restructure and idle capacity charges of $73.1 million were again significant in 2017, reflecting the operational setting changes with respect to the Hamilton mineral separation plant and having Jacinth-Ambrosia mining and concentrating activities suspended for the full year.
1 Underlying minerals sands and Group EBITDA excludes adjustments including impairments, Sierra Rutile transaction costs and changes to rehabilitation provisions for closed sites. Iluka’s share of Metalysis Ltd’s losses, which are non-cash in nature, are also excluded.
3 Mining Area C EBITDA
Iluka’s royalty income from Mining Area C increased by 25% to $59.6 million. Iron ore prices rose 16% and sales volumes from the royalty area increased 8%. No capacity payments were received in 2017 or 2016.
292
13 14 15 16 17
256
$m
293
151
361
EBITDA1
EBITDA1 margin
Mineral sands
revenue
1 2 3 4Underlying mineral sands
EBITDA1
Mining Area C EBITDA
Underlying Group
EBITDA1
$1,018m $301m $60m $361m
$m
13 14 15 16 17
204
33%33%
28%
14%30%
189
232
103
301
4 Underlying Group EBITDA1
The 2017 underlying Group EBITDA was $360.5 million, up from 2016, reflecting the combination of increased revenue, non-production cost reductions and increased Mining Area C royalty payments.
For
per
sona
l use
onl
y

Iluka Resources Limited, Annual Report 2017 15
5 6 7 8
Net debt
Gearing %
Return on equity
Return on capital
ROE (20)%ROC (12)%
Net loss after tax
Free cash flow
Net (debt) cash
ROE and ROC
$(172)m $322m $(183)m
13 14 15 16 17
%
19
13 14 15 16 17
(63)
$m
54
(224)
(172)
13 14 15 16 17
$m
(28)
196
155
47
322
(207)
(59)
$m
632%
17%
n/a
12%4%
(506)
(183)
13 14 15 16 17
2
(4.0)
4
7
(18)
1
(2)
(17)
(20)
(12)
5 Net loss after tax
Iluka recorded a net loss after tax of $171.6 million in 2017 which included the following:
• $185.4 million pre-tax impairment expense. Iluka’s decision to idle the Hamilton mineral separation plant from October 2017 resulted in $151.4 million impairment recorded at the half year; and $30 million impairment of Iluka’s investment in UK-based, titanium technology company, Metalysis Ltd.
• An increase of $127.4 million in relation to the rehabilitation provision for closed sites. This increase relates to Iluka’s closed US operations in Virginia and Florida and follows detailed rehabilitation planning that has identified potential additional obligations relating to past rehabilitation activities.
6 Free cash flow
2017 free cash flow was $321.9 million, reflecting the strong underlying EBITDA result.
Operating cash flows contributed $391.7 million and Mining Area C contributed $59.9 million.
Capital expenditure in 2017 was $93.1 million. Early works activities and execute capital of $35 million was incurred for Cataby during the year, with remaining expenditure focused on Sierra Rutile projects and Balranald (New South Wales).
THE COMPANY’S CORE OBJECTIVE IS TO CREATE AND DELIVER VALUE
7 Net (debt)
Net debt was reduced by 64% in 2017. As at 31 December 2017, net debt was $182.5 million, down from $506.3 million at the end of 2016. Gearing (net debt / net debt + equity) was reduced to 17.1% at the end of 2017 (2016: 31.5%).
8 ROE and ROC
Return on shareholders’ equity was (20.1)% and return on capital was (11.6)%, reflecting the company’s reported loss for the year.
For
per
sona
l use
onl
y

16 Iluka Resources Limited, Annual Report 2017
Balance sheet
As at 31 December 2017, Iluka had total debt facilities of $695.1 million and net debt of $182.5 million.
Iluka has a Multi Optional Facility Agreement (MOFA) which comprises a series of five year unsecured bilateral revolving credit facilities with several domestic and foreign institutions. Drawings under the MOFA at 31 December 2017 were $238.6 million (2016: $611.2 million). Undrawn MOFA facilities at 31 December 2017 were $456.5 million (2016: $404.2 million).
Of the above interest-bearing liabilities, $238.6 million is subject to an effective weighted average floating interest rate of 3.1% (2016: interest-bearing liabilities of $611.2 million at 2.7%).
Note 15 of Iluka’s Financial Report provides details of the maturity profile and interest rate exposure.
Net (debt) cash
Gearing (%)
Total facilities
Debt, gearing and debt facilities profile
13 14 15 16 17
-400
-200
200 20
400 40
600 60
800 80
1000
833
12
(207)
(59)
(183)
1732
n/a
1,010 1,015
6
(506)
4
871
100
$m Gearing %
0 0
695
Debt facilities maturity profile
18 19 20 21 22
7396
526
For
per
sona
l use
onl
y

Iluka Resources Limited, Annual Report 2017 17
NET DEBT HAS REDUCED BY $324M TO $183M
Dividend framework
Iluka’s dividend framework is to pay a minimum of 40% of free cash flow not required for investing or balance sheet activity. The company also seeks to distribute the maximum franking credits payable.
Iluka’s 2017 full year dividend payment of 31 cents per share (25 cents per share final and 6 cents per share interim dividend), fully franked, represents 40% of free cash flow for the year. This is consistent with Iluka’s framework and reflects the underlying strength in the 2017 result. Iluka continues to target credit metrics broadly consistent with investment grade credit metrics and future dividend decisions will take into account balance sheet position and capital expenditure requirements.
Distribution metrics 2016 2017
Payout ratio % of free cash flow 27 40
Cumulative dividend payout ratio (from 2010) % 66 60
Hedging
Iluka commenced a foreign exchange hedging programme during the year as part of its financial risk management strategy. Iluka entered into foreign exchange collar hedges covering US$271 million of expected USD revenue over the period 2018 to 2022. The collars are:
• comprised of AUD call options with an average strike price of 80.2 cents; and
• largely paid for by selling AUD put options with a strike price of 70 cents.
The five year period corresponds with long-term sales contracts entered into in 2017, including those in support of the Cataby development, however the US$271 million does not represent the full value of expected sales under these contracts.
Iluka also has US$95 million of forward contracts which settle in 2018 at a forward rate of 80 cents.
Synthetic rutile kiln, Western Australia
For
per
sona
l use
onl
y

18 Iluka Resources Limited, Annual Report 2017
Strategy, capital management and future prospects
Iluka’s objective is to create and deliver value for its shareholders. The company undertakes a range of activities to advance this objective, with a business approach comprising the following key elements:
• flexing operations in line with market demand;
• seeking a sustainable price environment for mineral sands products;
• preserving and advancing growth opportunities;
• disciplined capital allocation; and
• acting counter-cyclically where appropriate.
Iluka’s disciplined approach to investment decisions and capital management includes:
• maintaining credit metrics that are broadly consistent with an investment grade credit profile – generally corresponding to a leverage ratio of 1.0 - 1.5 times net debt to EBITDA;
• a dividend framework, which stipulates returns to shareholders of a minimum of 40% of free cash flow not required for investment purposes or balance sheet activity;
• disciplined capital allocation, meaning Iluka will commit funds to new projects only when it is sufficiently confident of achieving satisfactory returns for shareholders; and
• insofar as inorganic growth options are concerned, Iluka considers merger and acquisition opportunities that demonstrate both financial merit and strategic rationale.
In 2017, significant activities undertaken by Iluka as part of this approach included:
• the integration of the Sierra Rutile operation, which was acquired in December 2016;
• the consolidation of the company’s Australian mineral separation plants following a detailed review of Iluka’s production portfolio and projects;
• a focus on maintaining a sustainable cost structure, with a $61.5 million reduction in non-production costs; and
• pursuit of an appropriate pricing strategy to allow sustainable returns from the industry.
THE COMPANY UNDERTAKES A RANGE OF ACTIVITIES TO CREATE AND DELIVER VALUE
For
per
sona
l use
onl
y

Iluka Resources Limited, Annual Report 2017 19
To sustain and grow Iluka’s business over the short to medium term, the company has prioritised the delivery of its expansion projects at both new and existing mines. A summary is detailed below.
• Cataby was approved by the Board on 13 December 2017 and is a large chloride ilmenite deposit located approximately 150 kilometres north of Perth. The ilmenite from this development underpins the continued production of approximately 200ktpa of synthetic rutile from Iluka’s synthetic rutile kiln 2 at Capel over an initial mine life of 8.5 years. Iluka has worked closely with customers to secure offtake agreements for approximately 85% of the synthetic rutile production associated with Cataby, ensuring an appropriate return from the project and delivering an unprecedented level of revenue certainty for the company’s synthetic rutile business.
• Jacinth-Ambrosia is the world’s largest zircon mine. Mining and concentrating activities recommenced in December 2017 in line with improved market conditions following a 20 month suspension to allow heavy mineral concentrate inventory to be drawn down during a period of subdued demand. To offset declining ore grades at Jacinth-Ambrosia, Iluka is planning to expand the operation, increasing plant throughput by approximately 30%.
The scope for this expansion includes an upgrade of the wet concentrator plant; a second mining unit to handle additional ore; and a capacity increase at the site’s accommodation camp. A definitive feasibility study is expected to be completed by mid-2018, with project execution expected to commence in the second half of 2018 and completion in 2019, subject to Board approval and market conditions.
• Sierra Rutile is a large, long life asset in Sierra Leone with a number of attractive growth options. These include expansions to existing operations (the Lanti Dry and Gangama mines); infrastructure improvements (comprising a new in-pit mining unit plant and upgrades at both the mineral separation plant and port); and a new mine development at Sembehun. Currently at various stages of commissioning and planning, these options, once implemented, will substantially enhance the Sierra Rutile operation in line with Iluka’s acquisition case. They will further consolidate Iluka’s position as the world’s largest supplier of natural rutile.
Iluka is also progressing a portfolio of longer-term organic growth options, with a time horizon of approximately two to five years. These include conventional resource development initiatives, such as the Puttalam project in Sri Lanka and exploration activities; and those based on innovation and technical development.
The Balranald project is a large, deep, rutile-rich deposit in the northern Murray Basin, New South Wales. Iluka is pursuing an innovative, unconventional approach to this development, with a mining method based on directional drill technology. Advantages of this approach encompass the ability to access deep deposits (Balranald is approximately 60 metres underground); a minimal environmental footprint versus conventional mining; potentially lower capital intensity; scalable operations; and portfolio flexibility. The company is taking a staged approach to potential production start-up in 2021. This includes continued de-risking in 2018, with a third production trial scheduled at a cost of approximately $25 million.
Jacinth-Ambrosia, South Australia
For
per
sona
l use
onl
y

20 Iluka Resources Limited, Annual Report 2017
Financial and operational review
2017 2016 % change
$ million
Z/R/SR revenue 959.1 696.8 37.6
Ilmenite and other revenue 58.4 29.5 98.0
Mineral sands revenue 1,017.5 726.3 40.1
Cash costs of production (372.4) (260.6) 42.9
Inventory movement - cash (141.5) (107.6) 31.5
Restructure and idle capacity charges (73.3) (69.5) 5.5
Government royalties (25.2) (20.4) 23.5
Marketing and selling costs (33.8) (36.3) (6.9)
Asset sales and other income 0.7 (0.6) (216.7)
Exploration and resources development (24.6) (79.4) (69.0)
Corporate and other costs (47.1) (53.8) (12.5)
Foreign exchange 0.6 4.9 (87.8)
Mineral sands EBITDA 300.9 103.0 192.1
Mining Area C EBITDA 59.6 47.5 25.5
Underlying Group EBITDA1 360.5 150.5 139.5
SRL transaction costs - (14.1) -
Depreciation and amortisation (111.0) (79.9) 38.9
Inventory movement - non-cash (66.8) (57.3) 16.6
Rehabilitation for closed sites (127.4) (42.6) 199.1
Share of Metalysis Ltd's losses (associate) (3.3) (3.3) -
Impairment expense (185.4) (201.0) (7.8)
Group EBIT (133.4) (247.7) (46.1)
Net interest costs and bank charges (15.5) (15.4) 0.6
Rehabilitation unwind and other finance costs (16.7) (14.6) 14.4
Profit (loss) before tax (165.6) (277.7) (40.4)
Tax expense (6.0) 53.7 (111.2)
Profit (loss) for the period (NPAT) (171.6) (224.0) (23.4)
Average AUD/USD (cents) 76.7 74.4 3.1
1 Underlying Group EBITDA excludes adjustments including impairments, SRL transaction costs, changes to rehabilitation provisions for closed sites. Underlying EBITDA also excludes Iluka’s share of Metalysis Ltd’s losses, which are non-cash in nature.
Income statement analysis
For
per
sona
l use
onl
y

Iluka Resources Limited, Annual Report 2017 21
The 2017 loss includes non-cash items of $267.2 million post-tax for impairments and increases to US rehabilitation provisions as noted on page 28.
Sales commentary is contained on pages 22-23.
The Australian dollar strengthened compared to 2016, with the average exchange rate of 76.7 cents compared to 74.4 cents in 2016. This reduces the Australian dollar Z/R/SR revenue received, with the majority of sales denominated in US dollars. Foreign exchange impacts on operating costs, mainly those relating to Sierra Rutile operations, are included in the overall movement in unit cost of goods sold.
Cash costs of production have increased by $112 million, predominantly due to the inclusion of the Sierra Rutile operations for a full 12 months.
Unit cost of goods sold is higher at $743 per tonne compared to $698 per tonne in 2016 as a result of the inclusion of the higher cost operations at Sierra Rutile and a combination of sales mix variances.
Idle costs result from the suspension of mining and concentrating activities at Jacinth-Ambrosia through to December 2017 whilst concentrate inventory was drawn down; the idling of the Hamilton mineral separation plant from October 2017; costs associated with US operations ($8 million); and the prolonged maintenance shut for the Narngulu mineral separation plant prior to it becoming the primary MSP for Australia.
Mineral sands other and corporate costs are lower following the conclusion of a non-production cost review. The prior year included $36.0 million of costs associated with trialling an unconventional mining approach for Balranald. These trials were sufficiently progressed in 2017 to warrant treating the costs as capital in nature and $12 million is included within capital expenditure in 2017.
Tax expense has an effective tax rate of 3.6% compared with corporate tax rates of 30% in the main operating jurisdictions of Australia and Sierra Leone. This distortion results from both the increase in the US rehabilitation provision and the impairment of the UK Metalysis investment, which received no associated tax benefits.
Movement in NPAT
0
-50
-100
-150
-200
-250
31 D
ecem
ber
2016
31 D
ecem
ber
2017
Pric
e
Vol
Mix FX
Ilm a
nd o
ther
Unw
ind
& o
ther
Tax
Uni
t CO
GS
Idle
Reh
abilit
atio
n
Min
eral
san
d ot
her
MA
C
Cor
pora
te
Impa
irmen
t
Dep
reci
atio
n
Inte
rest
86
67
(224) (172)
(13)
(24)
15
(18) (4)
(85)
5412
2116
(12) (0) (2)
(60)
Underlying NPAT
2017 2016
Loss for the period (NPAT) (171.6) (224.0)
Adjustments:
Rehabilitation of closed sites, post tax 125.0 42.1
Impairments, post tax 138.9 140.7
SRL transaction costs, post tax - 14.1
Share of Metalysis Ltd’s losses, post tax 3.3 3.3
Underlying NPAT 95.6 (23.8)
For
per
sona
l use
onl
y

22 Iluka Resources Limited, Annual Report 2017
Financial and operational review
Sales and markets
Zircon
Iluka’s 2017 zircon sales volume of 380 thousand tonnes represents growth of 12% from 2016, a strong result following several years of weak market conditions.
With these improved market conditions, Iluka successfully implemented three price increases in 2017, with US$50 per tonne implemented effective from 15 February 2017, US$130 per tonne effective from 1 July 2017 and a further US$130 per tonne effective for a six month period from 1 October 2017. These follow five years of declining prices for zircon.
Iluka forecasts moderate growth for zircon demand in the short to medium term, in the absence of any changes to the global economic outlook.
High-grade titanium feedstocks
Iluka high-grade titanium feedstock sales volumes increased by 42% to 509 thousand tonnes. Group rutile sales were 264 thousand tonnes, 54% higher than 2016, reflecting the inclusion of 133 thousand tonnes of rutile sales from Sierra Rutile. Synthetic rutile sales were 244 thousand tonnes.
Titanium dioxide pigment is the main end market for high-grade feedstocks. In 2017, solid underlying demand growth coupled with supply issues resulted in pigment price improvement during the year. Pigment inventories remain below seasonal norms as the combined impacts of European plant outages and environmental enforcement actions in China dampened supply. Iluka estimates that the closure of Chinese pigment facilities resulted in a reduction of 250 thousand to 300 thousand tonnes of sulphate pigment capacity. Capacity utilisation rates across the industry have increased in response to these circumstances. Pigment producers have increased the utilisation of high-grade feedstocks to improve plant yields and maximise production in the short term. This has provided support for rutile and synthetic rutile demand in 2017.
With these demand influences continuing and the supply of rutile and synthetic rutile feedstocks being limited across mineral sands producers, especially in the short to medium term, Iluka expects supply of high grade feedstocks to remain tight entering into 2018.
Rutile prices are normally settled on a six month basis. The second half weighted average rutile price of US$825 per tonne was up 13% compared to full year 2016. It is of note that approximately 40% of Sierra Rutile’s 2017 rutile production volumes (~60 thousand tonnes) were contracted at fixed prices for the whole of 2017.
The majority of Iluka’s synthetic rutile sales volumes in 2017 were contracted, and sales volumes reflect a full year of kiln production and some inventory drawdown. Synthetic rutile prices increased relative to 2016 levels, consistent with contractual arrangements and market conditions.
Sales of the lower grade titanium feedstock, ilmenite, were 203 thousand tonnes. The remainder of ilmenite production was consumed internally in the production of synthetic rutile.
13 1314 1415 1516 1617 17
Sales volumes (kt) Sales volumes (kt)
168182 171
187
244
46
82
264
172
13 14 15 16 17
Sales volumes (kt)
370352 346
380
339
Zircon
13 14 15 16 17
Sales volumes (kt)
338317
300
203
18
IlmeniteRutile Synthetic Rutile
134
For
per
sona
l use
onl
y

Iluka Resources Limited, Annual Report 2017 23
% of total 2017 mineral sands sales revenue
China Europe
Americas
Australia
Middle East
Asia including India
33% 26%
8% 13%
14%
6%
Iluka mineral sands weighted average received prices – US$/t FOB
2013 2014 2015 2016 2017
Zircon premium and standard 1,171 1,054 986 810 958
Zircon (all products including zircon in concentrate)1 1,150 1,033 961 773 940
Rutile (excluding HYTI)(2) 1,075 828 763 731 790
Synthetic rutile(3) 1,150 750 - - -
(1) Zircon prices reflect the weighted average price for zircon premium and zircon standard, also with a weighted average price for all zircon materials, including zircon concentrate. The prices for each product vary considerably, as does the mix of such products sold period to period. In 2017 the split of premium, standard and concentrate by zircon sand-equivalent was approximately: 56%; 32%; 12% (2016: 47%; 33%; 20%).
(2) Excluded from rutile sales prices is a lower value titanium dioxide product, HYTI that typically has a titanium dioxide content of 70 to 90%. This product sells at a lower price than rutile, which typically has a titanium dioxide content of 95%.
(3) Iluka’s synthetic rutile sales are, in large part, underpinned by commercial offtake arrangements. The terms of these arrangements, including the pricing arrangements are commercial in confidence and as such not disclosed by Iluka. Synthetic rutile, due to its lower titanium dioxide content than rutile, is priced lower than natural rutile.
ILUKA FORECASTS MODERATE DEMAND GROWTH FOR ZIRCON AND TITANIUM FEEDSTOCKS IN THE SHORT TO MEDIUM TERM
For
per
sona
l use
onl
y

24 Iluka Resources Limited, Annual Report 2017
Financial and operational review
Production and operations
Iluka produced 825 thousand tonnes of zircon/rutile/synthetic rutile in 2017. This is a 22% increase from 2016, reflecting Iluka’s first full year of ownership of the Sierra Rutile operation in Sierra Leone.
Sierra Rutile
At Sierra Rutile, Iluka implemented a number of operational improvements over the year and achieved rutile production of 168 thousand tonnes. The Sierra Rutile operations consist of two dry mines, Lanti Dry and Gangama, a dredge mine, Lanti Dredge, and a mineral separation plant. Adjustments to plant settings at the dredge and dry mines and the establishment of standard operating practice has debottlenecked concentrator throughput and increased runtime, as well as improving valuable heavy mineral recovery and increasing heavy mineral concentrate grades. The mineral separation plant was also debottlenecked and rutile recoveries improved over the year.
Australia
Iluka’s Australian operational settings in 2017 continued to reflect the company’s intent to draw down finished goods and concentrate inventories. During the year Iluka produced 612 thousand tonnes of heavy mineral concentrate and processed 1.28 million tonnes. Rutile production was 134 thousand tonnes and zircon 204 thousand tonnes, largely reflecting production from concentrate inventory.
The Tutunup South mine in south-west Western Australia operated at full capacity throughout the year, producing ilmenite for use as a feedstock to Iluka’s synthetic rutile kiln 2. Mining at Tutunup South is expected to be completed in February 2018 and Cataby will be the next source of ilmenite feedstock to maintain kiln operations. Iluka produced 211 thousand tonnes of synthetic rutile, reflecting a full year of production. Ilmenite stockpiles and external ilmenite purchases have been planned to allow the kiln to continue operating in 2018 prior to the commencement of mining at Cataby in 2019.
Heavy mineral concentrate stockpiles were processed at Iluka’s two Australian mineral separation plants, Narngulu in Western Australia and Hamilton in Victoria. In 2017, in line with Iluka’s approach to maintaining a cost focus and sustainable business operations, processing capacity at Narngulu was considered sufficient for all expected Australian production and the Hamilton plant was idled following the completion of processing of the remnant Murray Basin heavy mineral concentrate stockpiles in October 2017. Narngulu continued to process stockpiled Jacinth-Ambrosia material during the year and intermediate stockpiles are returning to normal levels. Jacinth-Ambrosia mining activities, which were idled in April 2016, were restarted in December 2017 as planned.
US
Iluka’s US operations were closed in 2016. A small amount of remnant zircon concentrate stocks from the US operations were shipped in 2017 and recognised as zircon production (16kt) when sold.
Production volumes (kt)
13 14 15 16 17
585
365
466 448
329
Ilmenite
13 1314 1415 1516 1617 17
Production volumes (kt) Production volumes (kt)
127
177
137118
211
59
0
302 211
Rutile Synthetic rutile
13 14 15 16 17
Production volumes (kt)
285
358389
312347
Zircon
165
For
per
sona
l use
onl
y

Iluka Resources Limited, Annual Report 2017 25
HMC produced and processed
2017 2016 % change
HMC produced 612 395 55
HMC processed 1,280 967 32
Cash cost and unit cost of production $/t
2017 2016 % change
Cash cost of production $m 372.4 260.6 43.0
Unit cash cost per tonne of Z/R/SR produced $/t 451 386 16.8
Unit cash cost per tonne of Z/R/SR excluding by-products $/t 439 373 17.7
Unit costs of goods sold per tonne of Z/R/SR sold $/t 743 700 6.1
COMBINED ZIRCON/RUTILE/SYNTHETIC RUTILE PRODUCTION
OF 825 THOUSAND TONNES, UP 22% FROM 2016
Mineral sands operations results
Revenue Mineral sands EBITDA EBIT
$ million 2017 2016 2017 2016 2017 2016
Australia 833.7 690.2 359.1 281.6 53.5 (52.7)
United States 40.0 18.3 (4.9) (35.4) (124.4) (76.3)
Sierra Rutile 145.9 17.8 30.8 1.1 (0.6) (0.9)
Resource development and support costs - - (83.3) (144.3) (61.1) (117.8)
Intercompany elimination (2.1) - (0.8) - (0.8) -
Total 1,017.5 726.3 300.9 103.0 (133.4) 143.0
For
per
sona
l use
onl
y

26 Iluka Resources Limited, Annual Report 2017
Australia
2017 2016 %change
Production volumes
Zircon kt 293.7 347.0 (15.4)
Rutile kt 134.5 108.8 23.6
Synthetic rutile kt 210.8 210.9 (0.0)
Total Z/R/SR production kt 639.0 666.7 (4.2)
Ilmenite kt 390.5 326.2 19.7
Total production volume kt 1,029.5 992.9 3.7
HMC produced kt 259 371 (30.1)
HMC processed kt 932 942 (1.1)
Unit cash cost of production - Z/R/SR 1 $/t 350 364 3.8
Mineral sands revenue $m 833.7 690.2 20.8
Cash costs of production $m (223.6) (242.5) 7.8
Inventory movements - cash costs of production $m (151.8) (88.2) 72.1
Restructure and idle capacity charges $m (65.3) (38.8) (68.3)
Government royalties $m (18.2) (19.7) 7.6
Marketing and selling costs $m (16.4) (18.3) 10.4
Asset sales and other income $m 0.7 (1.1) (163.6)
EBITDA $m 359.1 281.6 27.5
Depreciation and amortisation $m (67.7) (74.3) 8.9
Inventory movements - non-cash production costs $m (75.0) (57.3) (30.9)
Rehabilitation costs for closed sites $m (7.9) (1.7) (364.7)
Impairment expense $m (155.0) (201.0) 22.9
EBIT $m 53.5 (52.7) 201.5
1 Calculated as cash costs of production, including by-product costs divided by Z/R/SR production.
Financial and operational review
Operations
Across Iluka’s Australian operations, the Tutunup South mine continued to be the only mine to operate throughout the full year, feeding ilmenite to allow the synthetic rutile kiln to operate at full capacity.
Mineral separation activities were consolidated in Australia in October 2017 following the idling of the Hamilton mineral separation plant (MSP) in the Murray Basin. This resulted in an impairment charge of $151.4 million pre-tax. The remaining impairment charge reflects the write-down of land held above its current market value. Capacity at the Narngulu MSP in Geraldton, Western Australia, is considered sufficient for processing all expected Australian production going forward.
Restructure and idle costs mainly reflect costs associated with Jacinth-Ambrosia, which remained idled until December 2017 combined with restructure costs associated with the Hamilton MSP.
Inventory movements reflect the drawdown of both heavy mineral concentrate and finished goods across the operations. Iluka expects inventory levels to return to normal levels of $300-$400 million for the Group in 2018.
For
per
sona
l use
onl
y

Iluka Resources Limited, Annual Report 2017 27
Sierra Rutile
2017 2016
Production volumes
Zircon kt 3.0 0.1
Rutile kt 167.6 8.8
Ilmenite kt 57.6 3.2
Total production volume kt 228.2 12.1
HMC produced kt 352.9 233
HMC processed kt 348.1 24.6
Unit cash cost of production - saleable product 1 $/t 783 777.0
Mineral sands revenue $m 145.9 17.8
Cash costs of production $m (133.5) (9.4)
Inventory movements - cash $m 31.7 (5.5)
Government royalties $m (7.0) (0.7)
Marketing and selling costs $m (6.1) (1.0)
Asset sales and other income $m (0.2) (0.1)
EBITDA $m 30.8 1.1
Depreciation and amortisation $m (39.4) (2.0)
Inventory movement - non-cash $m 8.0 -
EBIT $m (0.6) (0.9)
1 Calculated as cash costs of production, including by-product costs divided by Z/R production.2 2016 results reflect the 24 days of Iluka’s ownership from 7 December 2016.
The Sierra Rutile results represent Iluka’s first full year of ownership, having acquired the business on 7 December 2016.
Iluka has focused on operational improvements in the year, which is demonstrated by rutile production exceeding the guidance issued in January 2017 of 150 thousand tonnes.
The Lanti dredge mine was expected to conclude mining in May 2018, but proactive maintenance and refined mine planning should result in this operation being extended by a further six months. In addition, adjustments to the wet concentrator plant settings have resulted in improved valuable heavy mineral recovery and improved mineral separation plant recoveries following detailed metallurgical work.
Mineral sands revenue of $145.9 million for year was represented by 135.7kt of Z/R sales and 51.2kt of ilmenite sales. Sales volumes were lower than production results due to timing of shipments.
Lanti Dredge, Sierra Rutile
For
per
sona
l use
onl
y

28 Iluka Resources Limited, Annual Report 2017
United States
2017 2016 %change
Production volumes
Zircon kt 15.6 - n/a
Total production kt 15.6 - n/a
Unit cash cost of production $/t 981 - n/a
Mineral sands revenue $m 40.0 18.3 118.6
Cash costs of production $m (15.3) (8.7) (75.9)
Inventory movement $m (22.6) (13.9) (62.6)
Restructure and idle capacity charges $m (8.0) (30.7) 73.9
Marketing and selling costs $m - (0.4) n/a
Asset sales and other income $m 1.0 - n/a
EBITDA $m (4.9) (35.4) (86.2)
Rehabilitation and holding costs for closed sites $m (119.5) (40.9) (192.2)
EBIDTA $m (124.4) (76.3) (63.0)
1 Calculated as cash costs of production, including by-product costs divided by zircon production.
Zircon and ilmenite production ceased in December 2015 following the completion of mining at Brink and Concord deposits in the US. The US operations were permanently closed in December 2016. Production in 2017 represents the processing of remnant stockpiles, to reduce future rehabilitation obligations.
Mineral sands revenue represents the sale of finished goods that had been stockpiled at the end of operations, combined with a component of the remnant stockpiles processed in the year as at 31 December 2017. The US inventory balance was $29.2 million.
Cash costs of production largely reflect activities associated with product transportation, combined with some processing costs for the remnant stockpiles.
Restructure and idle costs reflect regional management and holding costs following closure of operations. These costs are expected to be broadly consistent with 2017 going forward until all stockpiles are diminished and rehabilitation is complete.
Rehabilitation costs reflect a US$90 million increase in the rehabilitation provision as a result of potential additional obligations relating to past rehabilitation. Various remediation alternatives are being considered by the Group. Iluka continues to engage proactively with regulatory agencies to assess the nature and extent of any change to its proposed rehabilitation programme.
The cost of rehabilitating the Virginia operation will largely depend on the rehabilitation programme ultimately undertaken by Iluka, which can only be determined following what is expected to be extensive and ongoing engagement with the regulators. As the nature and extent of any change remains highly uncertain, the provision increase has been calculated on a probabilistic basis across a range of scenarios.
Financial and operational review
For
per
sona
l use
onl
y

Iluka Resources Limited, Annual Report 2017 29
Movement in net (debt) cash
$ million 1H 2H 1H 2H
2016 2016 2017 2017
Opening net cash (debt) 6.0 (124.1) (506.3) (304.6)
Operating cash flow (15.5) 152.8 193.9 197.8
MAC royalty 18.3 25.3 30.5 29.4
Exploration (10.7) (14.0) (5.6) (7.0)
Interest (net) (4.9) (9.1) (8.8) (6.5)
Tax (10.3) (3.5) (6.4) (3.6)
Capital expenditure (16.7) (47.0) (24.6) (65.9)
Purchase of investment in Metalysis Ltd (12.1) (6.7) - -
Sri Lanka investment - - - (2.6)
Payment for hedging option contracts - - - (2.3)
Asset sales 1.3 0.1 1.2 2.4
Free cash flow (50.6) 97.9 180.2 141.7
Dividends (79.5) (12.6) - (25.1)
Net cash flow (130.1) 85.3 180.2 116.6
Exchange revaluation of USD net debt 1.4 (11.0) 22.6 7.0
SRL acquisition - (455.1) - -
Amortisation of deferred borrowing costs (1.4) (1.4) (1.1) (1.5)
(Increase) decrease in net debt (130.1) (382.2) 201.7 122.1
Closing net debt (124.1) (506.3) (304.6) (182.5)
Net debt reduced 64% to $182.5 million, reflecting strong free cash flow of $321.9 million and a strengthening in the Australian dollar revaluing US dollar denominated debt.
Operating cashflow of $391.7 million is a 185% increase from 2016 reflecting the higher underlying EBITDA as a result of improved market conditions.
Cashflows from the MAC royalty are received quarterly in arrears and have increased due to both higher iron ore sales volumes and prices.
Iluka has invested $93.1 million on capital developments during 2017, including Cataby, Sierra Rutile projects, Balranald and an instalment payment for the Sri Lanka tenements.
An interim dividend of 6 cents per share was paid in September and Iluka has announced a final fully franked dividend of 25 cents per share payable in April 2018.F
or p
erso
nal u
se o
nly

30 Iluka Resources Limited, Annual Report 2017
Financial and operational review
Non-IFRS financial information
This document uses non-IFRS financial information including underlying mineral sands EBITDA, underlying Group EBITDA and Group EBIT which are used to measure both Group and operational performance. Non-IFRS measures are unaudited but derived from audited accounts.
All currency shown in the Annual Report is expressed in Australian dollars, unless otherwise indicated.
2017 Aus US SRLExpl
& othMineral
sands MACCorp
& elim Group
Mineral sands revenue 833.7 40.0 145.9 (2.1) 1,017.5 - - 1,017.5
MS expenses (474.6) (44.9) (115.1) (35.5) (670.1) - - (670.1)
Mining Area C - - - - - 59.6 - 59.6
FX - - - - - - 0.6 0.6
Corporate costs - - - - - - (47.1) (47.1)
Underlying EBITDA 359.1 (4.9) 30.8 (37.6) 347.4 59.6 (46.5) 360.5
Depn and amort (67.7) - (39.4) (3.5) (110.6) (0.4) - (111.0)
Inventory movement - non-cash (75.0) - 8.0 0.2 (66.8) - - (66.8)
Rehabilitation for closed sites (7.9) (119.5) - - (127.4) - - (127.4)
Share of Metalysis Ltd's losses - - - - - - (3.3) (3.3)
Impairment (155.0) - - - (155.0) - (30.4) (185.4)
EBIT 53.5 (124.4) (0.6) (40.9) (112.4) 59.2 (80.2) (133.4)
Net interest costs - - - - - - (15.5) (15.5)
Rehab unwind and other finance costs (10.3) (1.9) (1.9) - (14.1) - (2.6) (16.7)
Profit before tax 43.2 (126.3) (2.5) (40.9) (126.5) 59.2 (98.3) (165.6)
Segment result 43.2 (126.3) (2.5) n/a (85.6) 59.2 n/a (26.4)
2016 Aus US SRLExpl
& othMineral
sands MAC Corp Group
Mineral sands revenue 690.2 18.3 17.8 - 726.3 - - 726.3
MS expenses (408.6) (53.7) (16.7) (95.4) (574.4) - - (574.4)
Mining Area C - - - - - 47.5 - 47.5
FX - - - - - - 4.9 4.9
Corporate costs - - - - - - (53.8) (53.8)
Underlying EBITDA 281.6 (35.4) 1.1 (95.4) 151.9 47.5 (48.9) 150.5 SRL transaction costs - - - - - - - -
Depn and amort (74.3) - (2.0) (3.2) (79.5) (0.4) - (79.9)
Inventory movement - non-cash (57.3) - - - (57.3) - - (57.3)
Rehabilitation for closed sites (1.7) (40.9) - - (42.6) - - (42.6)
Share of Metalysis Ltd's losses - - - - - - (3.3) (3.3)
Impairment (201.0) - - - (201.0) - - (201.0)
EBIT (52.7) (76.3) (0.9) (98.6) (228.5) 47.1 (66.3) (247.7)
Net interest costs - - - - - - (15.4) (15.4)
Rehab unwind and other finance costs (10.8) (0.9) - (0.1) (11.8) - (2.8) (14.6)
Profit before tax (63.5) (77.2) (0.9) (98.7) (240.3) 47.1 (84.5) (277.7)
Segment result (63.5) (77.2) (0.9) (n/a) (141.6) 47.1 (n/a) (94.5)
For
per
sona
l use
onl
y

Iluka Resources Limited, Annual Report 2017 31
VISIT ILUKA’S WEBSITE WWW.ILUKA.COM FOR MORE DETAILED INFORMATION ON
MINERAL SANDS MINING AND OPERATIONS
Kararra berth, Geraldton Port
For
per
sona
l use
onl
y

32 Iluka Resources Limited, Annual Report 2017
Financial and operational review
Projects
Cataby, Western Australia
Cataby is a large, chloride ilmenite-rich deposit 150 kilometres north of Perth. The mine development was approved in December 2017 with ilmenite from the mine to underpin the continued production of synthetic rutile at Capel in south-west Western Australia. The approval follows completion of the definitive feasibility study in 2016 and securing offtake agreements for 85% of synthetic rutile production for a minimum of four years, negotiated over the course of 2017, to underpin returns from the project.
The estimated capital cost is $250-275 million and construction is expected to take around 18 months. First production is planned for 2019 with the company producing approximately 200 thousand tonnes of synthetic rutile (from mined ilmenite feedstock), 50 thousand tonnes of zircon and 30 thousand tonnes of rutile on average over an initial 8.5 year mine life. Access to additional ore reserve could extend mine life for a further four years.
Ilmenite will be transported to Capel for synthetic rutile production and the non-magnetic stream to Iluka’s Narngulu mineral separation plant in Geraldton for final processing. Associated infrastructure includes upgrades to power facilities, camps and public roads.
In 2017, pre-execute activities included major environmental approvals, detailed engineering, establishment of the integrated project team and procurement of long lead items. Following approval, contracts were awarded for a range of packages and tendering for the balance of construction contracts advanced.
Lanti Dry and Gangama expansions, Sierra Leone
Iluka’s planning for the acquisition of Sierra Rutile in December 2016 contemplated the expansion of the Lanti Dry and Gangama deposits to increase throughputs and reduce unit costs at the operation.
The Lanti Dry expansion is expected to approximately double mining capacity from 500-600 tonnes per hour of ore to 1,000-1,200 tonnes per hour and involves the construction of a second in-pit mining unit and additional concentrator capacity.
Similarly, the Gangama expansion project involves a doubling of mining capacity (500-600 tonnes per hour of ore to 1,000-1,200 tonnes per hour). Gangama is mined by truck and shovel method and the expansion includes the construction of a second mining unit and concentrator based on the current method.
Detailed feasibility studies were progressed in 2017 for both projects, including detailed option assessment, engineering and construction planning. Commissioning of both expansions is planned for 2019.
Jacinth-Ambrosia, South Australia
To offset declining ore grades at Jacinth-Ambrosia, Iluka is planning to expand the operation, increasing plant throughput by approximately 30%. The scope for this expansion includes an upgrade of the wet concentrator plant; a second mining unit to handle additional ore; and a capacity increase at the site’s accommodation camp. A definitive feasibility study is expected to be completed by mid-2018, with project execution expected to commence in the second half of 2018 and completion in 2019, subject to Board approval and market conditions.
ILUKA HAS A DISCIPLINED APPROACH TO CAPITAL INVESTMENT
For
per
sona
l use
onl
y

Iluka Resources Limited, Annual Report 2017 33
Balranald, Murray Basin, New South Wales
Balranald is two large, deep, high grade rutile-rich deposits in northern Murray Basin. In 2017, Iluka continued to progress an unconventional, underground mining approach to develop these deposits. The approach contemplates the use of directional drilling technology and has the advantages of reduced environmental footprint, potentially lower capital intensity, scalability of operations and portfolio flexibility.
Following the full field trial in 2016, work in 2017 has focused on testing and improving the mining head unit by way of full-scale wear tests of different materials and enhanced designs for key pieces of equipment. Assessment of this work is ongoing.
Subject to this assessment, the project could ultimately move to a staged start-up in 2021, pending necessary approvals.
Sembehun, Sierra Leone
Iluka’s Sembehun project is a proposed new mine development at the company’s Sierra Rutile operations. Iluka’s planning contemplated the development prior to acquisition and it is an integral part of the future of the Sierra Rutile operation, with the deposit containing more than 70% of remaining ore reserves at Sierra Rutile. The proposed initial capacity is 1,000-1,200 tonnes per hour, increasing in subsequent years as other deposits are depleted.
A pre-feasibility study was progressed in 2017 and environmental baseline studies commenced. The Board has approved funding for a detailed feasibility study to be undertaken in 2018. The project has a construction period of around 18 months and commissioning is planned for 2021.
Mineral separation plant upgrade, Sierra Leone
An upgrade to the mineral separation plant is required to meet the additional capacity to be generated by the planned mine expansions. Work will involve upgrades to the feed preparation plant and dry mill, and increase capacity from around 175 thousand tonnes per annum of rutile to up to 300 thousand tonnes per annum. Upgrades will also improve safety, operational and metallurgical efficiencies at the plant. A feasibility study and detailed engineering began in 2017. Project completion is expected in 2019.
Puttalam, Sri Lanka
The Puttalam Quarry (PQ) deposit is a large, sulphate ilmenite deposit in north-west Sri Lanka. The ilmenite ore sits atop a limestone layer currently being mined for cement production. It is a large homogenous deposit with mineralisation close to surface and ore up to 60 metres thick. There is also potential for substantial synergies with the current mining operation, in areas such as infrastructure and rehabilitation.
A key focus of work to date has been securing necessary legal and investment agreements and land access rights with the government of Sri Lanka and the owner of the deposit. Such agreements are essential to provide the certainty required for further development. In 2017, discussions with the Sri Lankan government continued in this regard and Iluka submitted a revised and comprehensive project proposal. Going forward, Iluka hopes to establish a pathway towards securing a binding development agreement.
A pre-feasibility study on the deposit was also progressed in 2017 with works now being undertaken in technical and community engagement areas.
For
per
sona
l use
onl
y

34 Iluka Resources Limited, Annual Report 2017
Financial and operational review
Exploration
Kazakhstan
Iluka began greenfields exploration in northern Kazakhstan in 2015 for a potential new zircon province. The work is being undertaken with Kazgeology under a consortium agreement.
Iluka has 76,192km2 available for exploration under licence and commenced the first major drill programme in 2017, drilling a total of 307 holes for 9,100m. The targeted marine sand geological formation is widely present across the project area and hosts concentrations of heavy minerals. Drill samples have been shipped to Australia for full laboratory analysis, technical assessment and project review. Pending positive results, a targeted drilling campaign may take place in 2018.
Quebec, Canada
Greenfields exploration targeting a large rutile-ilmenite rich deposit continued in 2017 under a farm-in agreement with Vior Inc. Work in 2017 included aeromagnetic and gravity surveys, geological mapping and glacial and petrographic studies. Multiple geophysical targets identified in the hard rock setting have been tested by an initial diamond drilling programme. Results are awaited with technical assessment to follow.
Sierra Leone
At Sierra Rutile, Iluka began updating the local geological model to assist with prioritising exploration targets near to current operations and throughout the region.
Brownfield exploration is targeting extensions and near mine additions to the Sierra Rutile ore reserves.
ILUKA’S BALANCE OF BROWNFIELD AND
GREENFIELD EXPLORATION PROVIDES DEVELOPMENT POTENTIAL IN THE SHORT
AND LONGER TERM
Exploration works in Kazakhstan
For
per
sona
l use
onl
y

Iluka Resources Limited, Annual Report 2017 35
Other regions
Iluka continued to undertake early stage exploration activities in other regions, including initial prospecting, assessment of third party opportunities and tenement acquisition.
Tenement position as at 31 December 2017
Region Approx square kilometres
Eucla Basin (SA, Australia) 15,178
Murray Basin (NSW & VIC, Australia) 5,297
Perth Basin (WA, Australia) 534
Canning Basin (WA) 322
West Siberian Basin (Kazakhstan) 53,688
Sri Lanka 135
Sierra Leone 742
Tanzania 296
Total 76,192
Exploration expenditure 2017 – $12 million
Administration and other costs$1.7m Australia
$3.5m
Americas $1.8mKazakhstan
$3.2m
Other international (Canada, West Africa) $1.7mF
or p
erso
nal u
se o
nly
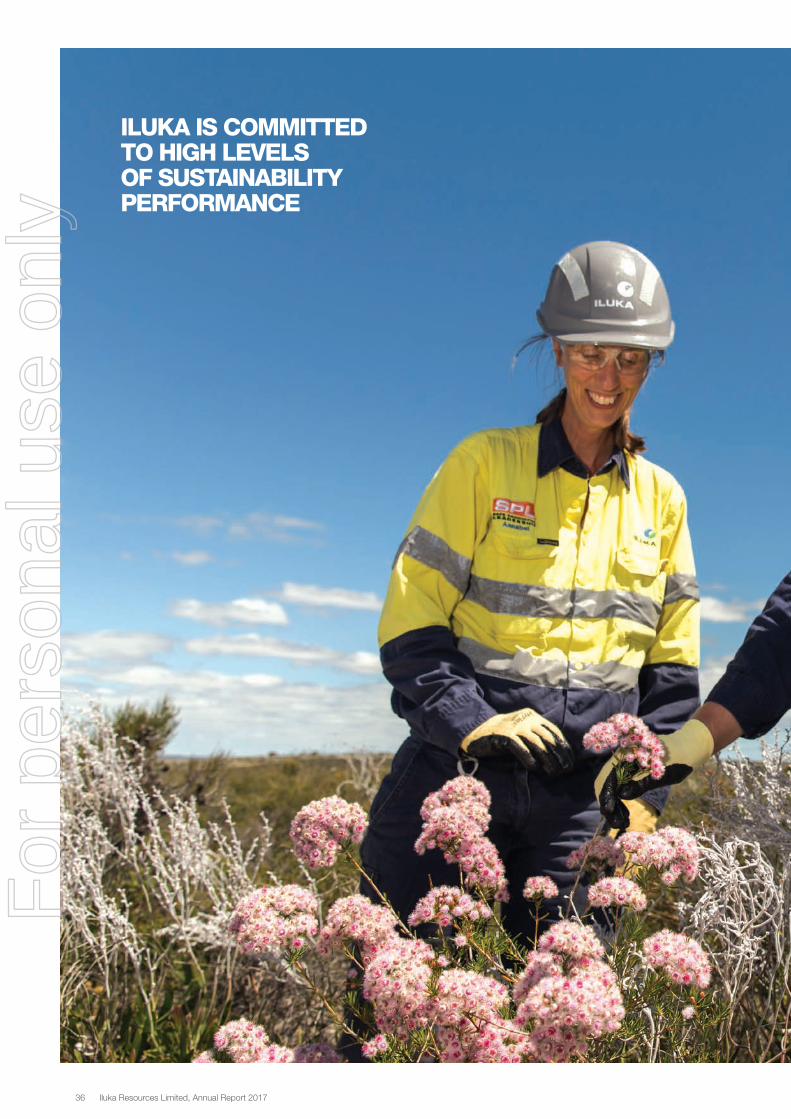
36 Iluka Resources Limited, Annual Report 2017
ILUKA IS COMMITTED TO HIGH LEVELS OF SUSTAINABILITY PERFORMANCE
For
per
sona
l use
onl
y

Iluka Resources Limited, Annual Report 2017 37
Rehabilitation at Eneabba
For
per
sona
l use
onl
y

38 Iluka Resources Limited, Annual Report 2017
Sustainability
Economic responsibility
Iluka is committed to sustainable economic outcomes allowing us to share economic benefits with the communities in which we operate, whilst creating and delivering value to shareholders.
During 2017, Iluka was recognised as a leading sustainability performer in its listing on the Dow Jones Sustainability Index (DJSI) Australia. The DJSI tracks the performance of over 2,500 leading companies worldwide, independently evaluating their long-term economic, environmental and social performance. The top performers are selected for listing on the DJSI.
Iluka’s sustainability approach and performance is overseen by the Board and integrated to all levels of the business.
Commencing 2017, Iluka publicly communicated sustainability improvement targets to enable common understanding, both internally and externally, of Iluka’s sustainable development goals and performance. The progress of these targets is routinely reviewed by the Executive and performance will be presented in the company’s annual Sustainability Report.
The acquisition of Sierra Rutile in December 2016 changed Iluka’s sustainability risk profile.
Iluka recognises the risks and considerations of operating in this new jurisdiction in areas such as human rights, bribery and corruption, resettlement, health, safety and security; and has continued to make significant progress on strengthening its sustainability framework.
Over the last 12 months, integration priorities for Sierra Rutile have included the introduction of Iluka’s safety and risk mitigation frameworks, as well as Code of Conduct, to ensure alignment and integration of Group level procedures and processes.
People
Iluka seeks to attract and retain the best people while building and maintaining a diverse, inclusive and high-achieving workforce.
Health and safety
Iluka is committed to achieving a fatality-free workplace, eliminating injuries and protecting the health and wellbeing of its people.
Social performance
Iluka respects human rights, engages meaningfully with stakeholders and seeks to make a positive difference to the social and economic development of the areas in which it operates.
Environment
Iluka seeks to manage its impact on the environment, use resources efficiently and leave positive rehabilitation and closure outcomes.
Governance
Iluka is committed to conducting its business in accordance with the highest standards of corporate governance.
Sustainability approach
Iluka is a company committed to high levels of sustainability performance. At Iluka that means integrating economic, environmental and social considerations into business practice, and ensuring safe and responsible conduct underpins everything we do.
Iluka’s sustainability approach is governed through a series of policies and management systems that span across six key elements. This is underpinned by the company’s core values of Commitment, Integrity and Responsibility.
Geraldton Port, Western Australia
Hamilton, Victoria
Jacinth-Ambrosia, South Australia
Sembehun, Sierra Leone - Stakeholder engagement meeting
North Capel, Western Australia
Douglas, Victoria - Rehabilitation
For
per
sona
l use
onl
y

Iluka Resources Limited, Annual Report 2017 39
Reporting
Full details of Iluka’s sustainability approach and 2017 performance of material issues will be available in the annual Sustainability Report.
The report, covering the period 1 January 2017 to 31 December 2017, is being prepared in accordance with the Global Reporting Initiative, and will be released in April 2018 on the company’s website, www.iluka.com.
Safety performance
The safety of Iluka’s people is the foundation of its business. Iluka is committed to maintaining a fatality-free workplace and making continual progress on reducing injury potential.
As 2017 was treated as a baseline year for Sierra Rutile, Iluka’s injury frequency rates for 2017 exclude Sierra Rutile. The total recordable injury frequency rate increased from 4.4 to 4.8, with one less injury in 2017 and a reduction in hours worked. The lost time injury frequency rate increased from 0.4 to 0.9.
Sierra Rutile’s total recordable injury frequency rate was 2.2 and lost time injury frequency rate was 1.0 in 2017.
At 31 December 2017, the combined Group total recordable injury frequency rate was 2.8 and lost time injury frequency rate was 1.0. This will be used for 2018 comparisons.
At Sierra Rutile, there has been a focus on safety risk identification and preventative action planning. Over 1,800 employees have been provided with a safety induction and 250 employees provided with detailed risk and hazard training. This resulted in a notable improvement in hazard reporting, increasing from an average of 23 per month in the March quarter to 280 per month in the December quarter.
Total recordable injury frequency rate
Freq
uenc
y R
ate
7.0
6.0
5.0
4.0
3.0
2.0
1.0
0.0 20
13
2014
2015
2016
Jan
17
Feb
17
Mar
17
Apr
17
May
17
Jun
17
Jul 1
7
Aug
17
Sep
17
Oct
17
Nov
17
Dec
17
4.44.8
3.6
4.6
6.7
Lost time injury frequency rate
Freq
uenc
y R
ate
1.0
0.8
0.6
0.4
0.2
0.0
2013
2014
2015
2016
Jan
17
Feb
17
Mar
17
Apr
17
May
17
Jun
17
Jul 1
7
Aug
17
Sep
17
Oct
17
Nov
17
Dec
17
0.4
0.9
0.3
0.9 0.9
RECOGNISED AS A LEADING SUSTAINABILITY PERFORMER ON THE DOW JONES SUSTAINABILITY
INDEX (DJSI) AUSTRALIAFor
per
sona
l use
onl
y

40 Iluka Resources Limited, Annual Report 2017
Business risks and mitigations
The identification and management of risk is fundamental to achieving Iluka’s objective. We are, therefore, committed to managing risk in a proactive and effective manner.
Iluka’s Risk Management Policy is supported by a risk management framework which is aligned to the International Standard for risk management, ISO 31000. This framework provides a whole of business approach to the management of risks and sets out the process for the identification, management and reporting of risk to the achievement of our plans and objectives.
The Board, through the Board Charter, delegates responsibility for identifying and managing risks to management. Management is required to report to the Board on those risks which could have a material impact on the company’s business. The Audit and Risk Committee assists the Board with regard to oversight of the company’s risk management practices.
Through its risk management framework Iluka seeks to:
• embed a culture of risk awareness by integrating risk management into our business activities and processes;
• identify, assess and manage risks in a structured and systematic manner;
• enable prudent risk taking in line with business objectives and strategies;
• establish and monitor appropriate controls in line with agreed risk tolerances;
• ensure material business risks are effectively identified, communicated and appropriately elevated throughout all levels of management and to the Board; and
• continue to fulfil governance requirements for risk management.
Iluka applies a structured and systematic approach to assess the consequence of risk in areas such as environment; injury; illness; reputation; stakeholder; compliance; financial and company objectives. Company risks, and how they are being managed, are reviewed by the Executive team regularly and reported to the Board on a twice yearly basis.
Set out below are the key risk areas that could have a material impact on the company.
The nature and potential impact of risks changes over time. The risks described below are not the only risks that Iluka faces, and whilst reasonable effort is made to identify and manage material risks, additional risks not currently known or detailed below may also adversely affect future performance.
Sustaining operations risks
Maintaining a pipeline of mineral resources, mineral reserves and projects in order to sustain operations and maintain business is a key focus for Iluka. The success of exploration activity and project delivery is critical to sustain operations in a timely manner.
Product demand and price risks
The resources sector typically exhibits cyclicality, and Iluka is subject to cyclical fluctuations in global economic conditions, customer demand and end-use markets. The demand for Iluka’s products may be sensitive to a wide range of factors most of which are outside of the company’s control such as changes in the global economy, adverse changes in pigment or ceramic markets, or technology changes that reduce the level of feedstock required (substitution or thrifting). The prices for our products are also subject to these market conditions generally.
The company’s approach in such conditions is to adjust production and inventory levels in the context of market demand, and seek offtake agreements that underpin project returns where appropriate.
Financial risks
Iluka faces risks relating to the cost of and access to funds, movement in interest rates and foreign exchange rates (refer note 20). Iluka maintains policies which define appropriate financial controls and governance which seeks to ensure financial risks are fully recognised, managed and recorded in a manner consistent with:
• the financial risk appetite and delegations as set by Iluka’s Board;
• generally accepted industry practice and corporate governance standards; and
• shareholder expectations of a mineral sands producer.
Where an operation has entered into long- term contracts with fixed or floor prices (i.e. hedged the commodity price), Iluka may manage the risks related to movements in foreign exchange rates by entering into appropriate hedging arrangements.
Any hedging is done in accordance with Iluka’s risk tolerances and policies including appropriate approvals.
Project development risks
Iluka regularly assesses its ability to enhance its production profile, or extend the economic life of deposits, by the development of new deposits within its portfolio. A failure to develop and operate projects in accordance with expectations could negatively impact results of operations and the company’s financial position.
Risks to major development projects include the ability to acquire and/or obtain appropriate access to property, regulatory approvals, supply chain risks, construction and commissioning risks. There are also technology risks regarding the new unconventional mineral sands mining approach planned for the Balranald deposit.
A structured capital process and project delivery framework is utilised to facilitate successful project development and manage risks in bringing new projects into operation.
Growth risks
To ensure a sustainable business going forward, Iluka attempts to generate growth options through exploration, innovation and appropriate external growth opportunities. The ability of Iluka to create and deliver value for shareholders is to some extent dependent on successful growth strategies.
Evaluating growth opportunities requires prudent risk taking as part of a disciplined process of project selection and interrogation to maximise the opportunity, achieve the desired outcomes, and manage the associated risks to the company. This includes applying the company’s established disciplines and systems to evaluate growth opportunities and assess their potential value and impact considering a range of modifying factors and assumptions.
For
per
sona
l use
onl
y

Iluka Resources Limited, Annual Report 2017 41
Country risk
Increasing international activities have increased Iluka’s exposure to country risks. New or evolving regulations and international standards are outside of the company’s control and are often complex and difficult to predict. The potential development of international opportunities can be jeopardised by changes in fiscal or regulatory regimes, difficulties in interpreting or complying with local laws, material differences in sustainability standards and practices, or reversal of current political, judicial or administrative policies.
Risks in the locations in which Iluka operates could include terrorism, civil unrest, judicial activism, community challenge or opposition, regulatory investigation, nationalisation, protectionism, renegotiation or nullification of existing contracts, leases, permits or other agreements, imposts, restrictions on repatriation of earnings or capital and changes in laws and policy, as well as other unforeseeable risks.
If any of the company’s operations are affected by one or more of these risks, it could have a material adverse effect on its assets in those countries, as well as Iluka’s overall operating results, financial condition and prospects.
Sierra Rutile risks
Sierra Rutile continues to work towards full adoption of Iluka’s governance standards, operational processes and controls. As this continues, there are risks relating to the standard of systems, processes, policies, practices, or any related key controls which require investment or improvement to meet Iluka’s standards.
Iluka has made significant progress in implementing the improvements outlined at the time of acquisition such as modifying the dry mining method to incorporate an in-pit mining unit increasing throughput at Lanti, revising plant designs for the current mining units, improvements in mine pit de-watering and detailed planning for upgrades to the mineral separation plant. A delay in these projects and in achieving further operational improvements could impose unexpected costs that may adversely affect the financial performance of the company.
Anti-bribery and corruption risk
Iluka’s business activities and operations are located in jurisdictions with varying degrees of political and judicial stability, including some countries with a relatively high inherent risk with regards to bribery and corruption. This exposes Iluka to the risk of unauthorised payments or offers of payments to or by employees, agents or distributors that could be in violation of applicable anti-corruption laws. Risks also include possible delays or disruptions resulting from a refusal to make so-called facilitation payments or any other form of benefit inconsistent with Iluka policy or applicable laws.
Iluka has a clear Anti-bribery and Corruption Policy, and internal controls and procedures to protect against such risks including training and compliance programmes for its employees, agents and distributors. However, there is no assurance that such controls, policies, procedures or programmes will protect Iluka from potentially improper or criminal acts. Violations of anti-corruption laws or regulations may result in criminal or civil sanctions and adverse publicity.
Environmental standards risk
Mining operations, by their nature, can have a significant impact on the environment. Given this, Iluka is committed to leading practice in environmental management as outlined in the Iluka Environment, Health and Safety Policy.
Leading practice is based upon current community expectations, applicable legislation and regulatory standards, all of which change over time. With increasing government and public sensitivity to environmental sustainability, environmental regulation is becoming more stringent. Iluka could be subject to increasing environmental responsibility and liability, including laws and regulations dealing with air quality, water and noise pollution and other discharges of materials into the environment, plant and wildlife protection, the reclamation and restoration of certain of its properties, greenhouse gas emissions, the storage, treatment and disposal of wastes and the effects of its business on the water table and groundwater quality. Sanctions for non-compliance with these laws and regulations may include administrative, civil and criminal penalties, revocation of permits, reputational issues, increased licence conditions and corrective action orders.
Accidents, environmental incidents, the failure to comply with laws or regulations and real or perceived threats to the environment or the amenity of local communities could result in a loss of Iluka’s ability to operate, leading to delays, disruption or the shut-down of exploration and production activities. Accidents, environmental incidents and failures to comply with laws or regulations could also lead to fines, additional costs and adverse publicity.
There is a risk that historic operations or disposal methods by the company or its predecessor companies, although materially compliant with regulatory requirements at the time, may be subject to increased or new environmental standards which require additional material remediation costs.
The company monitors these risks on an ongoing basis as part of the ongoing remediation of its former mine sites and operations.
Business interruption risks
Circumstances may arise which preclude sites from operating including natural disaster, material disruption to our logistics, critical plant failure or industrial action. Iluka undertakes regular reviews for mitigation of property and business continuity risks. Iluka also conducts planning and preparedness activities to ensure rapid and effective response in the event of a crisis. Appropriate business plans, policies and training provides support to Iluka’s risk mitigation activities. Iluka also maintains a prudent insurance programme that may offset a portion of the financial impact of a major interruption risk.
Social licence to operate risks
An integral part of Iluka’s activities is maintaining a social licence to operate. Iluka’s safety, health, environmental, people and stakeholder performance expectations are clearly articulated in its policies and overseen by the Board.
The annual Iluka Sustainability Report contains further information on the company’s operating conditions, as well as elements of the business strategy. This document, as well as other company information, is available on Iluka’s website www.iluka.com
For
per
sona
l use
onl
y

42 Iluka Resources Limited, Annual Report 2017
Financial Report
Balranald field trial, Murray Basin, New South Wales
For
per
sona
l use
onl
y

Iluka Resources Limited, Annual Report 2017 43
CREATING AND DELIVERING VALUE
Financial report
Results for announcement to the market 44
Directors’ report 45
Remuneration report 53
Auditor’s independence declaration 74
Financial statements 75
Consolidated statement of profit or loss and other comprehensive income 76
Consolidated balance sheet 77
Consolidated statement of changes in equity 78
Consolidated statement of cash flows 79
Notes to the consolidated financial statements 80
Directors’ declaration 123
Independent auditor’s report 124
For
per
sona
l use
onl
y

44 Iluka Resources Limited, Annual Report 2017
Results for announcement to the marketFor the year ended 31 December 2017
Iluka Resources Limited31 December 2017
RESULTS FOR ANNOUNCEMENT TO THE MARKET
Provided below are the results for announcement to the market in accordance with Australian Securities Exchange(ASX) Listing Rule 4.2A and Appendix 4E for the consolidated entity Iluka Resources Limited and its controlledentities for the year ended 31 December 2017 (the 'financial year') compared with the year ended 31 December2016 ('comparative year').
All currencies shown in this report are Australian dollars unless otherwise indicated.
Revenue from ordinary activities Up 39.2% to $1,077.8mLoss from ordinary activities after tax attributable to members Down 23.4% to $171.6mNet loss for the period attributable to members Down 23.4% to $171.6m
Dividends2017 final: 25 cents per ordinary share (100% franked), to be paid in April 20182017 interim: 6 cents per ordinary share (100% franked), paid in September 20172016 final: nil2016 interim: 3 cents per ordinary share (100% franked), paid in October 2016
Key ratios 2017 2016Basic and diluted loss per share (cents) (41.0) (53.6)Free cash flow per share (cents) (i) 76.9 11.3Return on Equity (ii) (20.1) (17.1)Net tangible assets per share ($) 1.70 2.18
(i) Free cash flow is determined as cash flow before refinance costs, proceeds/repayment of borrowings and dividends paid in the
year. 2016 free cash flow is stated before the acquisition cost of Sierra Rutile Limited of $375.4 million.
(ii) Calculated as Net Loss after Tax (NPAT) for the year as a percentage of average monthly shareholder's equity over the year.
The Company's Dividend Reinvestment Plan was suspended in late 2010 and has been terminated. A newDividend Reinvestment Plan has been introduced effective for the payment of the 2017 final dividend.
The commentary on the consolidated results and outlook are set out in the Operating and Financial Review sectionof the Directors' Report.
Independent auditor's report
The Consolidated Financial Statements upon which this Appendix 4E is based have been audited.
44
For
per
sona
l use
onl
y

Iluka Resources Limited, Annual Report 2017 45
Iluka Resources Limited31 December 2017
Directors' ReportThe directors present their report on the Group consisting of Iluka Resources Limited (the 'Company') and theentities it controlled at the end of, or during, the year ended 31 December 2017.
The information appearing on pages 14 to 41 forms part of the Directors' Report for the financial year ended 31December 2017 and is to be read in conjunction with the following information:
DIRECTORS
The following individuals were directors of Iluka Resources Limited during the whole of the financial year and up tothe date of the report, unless otherwise stated:
G MartinM BastosX LiuT O'LearyJ RanckJ Seabrook
DIRECTORS' PROFILES
Name: Greg MartinQualifications: BEc, LLB, FAIM, MAICDAge: 58Role: Chairman and Non-executive DirectorAppointed: January 2013Independent: Yes
Current positions:• Chairman of the Board• Nominations and Governance Committee - Chairman• Audit and Risk Committee - Member• People and Performance Committee - Member
Relevant skills and experience:Mr Martin has over 35 years’ experience in the energy, utility and infrastructure sectors, having spent 25 years withthe Australian Gas Light Company Ltd (AGL), including five years as CEO and Managing Director. After leavingAGL, Greg was CEO of the infrastructure division of Challenger Financial Services Group and, subsequently,Managing Director of Murchison Metals Limited.
Other relevant directorships and offices (current and recent):• Sydney Desalination Plant Pty Limited - Chairman (current)• Western Power - Deputy Board Chair (current)• Spark Infrastructure - Non-executive Director (current)• Member of CoAG Energy Council Energy Selection Panel (retired December 2017)• Santos Limited - Non-executive Director (retired August 2017)• Prostar Investments (Australia) Pty Ltd - Chairman (retired September 2017)
Name: Tom O'LearyQualifications: LLB, BJurisAge: 54Role: Managing Director and Chief Executive OfficerAppointed: October 2016Independent: No
45
Directors’ reportFor the year ended 31 December 2017
For
per
sona
l use
onl
y

46 Iluka Resources Limited, Annual Report 2017
Iluka Resources Limited31 December 2017
Relevant skills and experience:Mr O’Leary was previously Managing Director of Wesfarmers Chemicals, Energy and Fertilisers division havingbeen appointed to the role in 2010. Tom joined Wesfarmers in 2000 in a Business Development role and was thenappointed to Managing Director, Wesfarmers Energy, in 2009. Prior to joining Wesfarmers, Tom worked in Londonfor 10 years in finance law, investment banking and private equity. Tom holds a law degree from The University ofWestern Australia and has completed the Advanced Management Program at Harvard Business School.
Other relevant directorships and offices (current and recent):• Clontarf Foundation - Director (current)• Edith Cowan University Council - Member (retired June 2017)
Name: James (Hutch) RanckQualifications: BSE (Econ), FAICDAge: 69Role: Non-executive DirectorAppointed: January 2013Independent: Yes
Current positions:• People and Performance Committee - Chairman• Audit and Risk Committee - Member• Nominations and Governance Committee - Member
Relevant skills and experience:Mr Ranck has held senior management positions with DuPont, both in Australia and international in finance,chemicals, pharmaceuticals and agriculture for over 30 years. Hutch also served as a Director of DuPont’s HongKong based subsidiary, Titanium Technologies, for seven years. Hutch retired as Managing Director of DuPontAustralia and New Zealand and Group Managing Director of DuPont ASEAN in May 2010.
Other relevant directorships and offices (current and recent):• Elders Limited - Chairman (current)• CSIRO - Non-executive Member of the Board (current)
Name: Jenny SeabrookQualifications: BCom, FCA, FAICDAge: 61Role: Non-executive DirectorAppointed: May 2008Independent: Yes
Current positions:• Audit and Risk Committee - Chairman• Nominations and Governance Committee - Member• People and Performance Committee - Member
Relevant skills and experience:In Ms Seabrook's executive career, she worked at senior levels in chartered accounting, capital markets andinvestment banking businesses. Jenny is a Senior Advisor to Gresham Advisory Partners Limited. Jenny wasformerly a member of the Takeovers Panel (2000 to 2012), and her previous non-executive directorships include:Export Finance and Insurance Corporation, Amcor Limited, Bank of Western Australia Limited, West AustralianNewspapers Holdings Limited, Australian Postal Corporation, AlintaGas and Western Power Corporation.
Other relevant directorships and offices (current and recent):• MMG Limited - Non-executive Director (current)• IRESS Limited - Non-executive Director (current)• Western Australian Treasury Corporation - Non-executive Director (current)• Australian Rail Track Corporation - Non-executive Director (current)
46
Directors’ reportFor the year ended 31 December 2017
For
per
sona
l use
onl
y

Iluka Resources Limited, Annual Report 2017 47
Directors’ reportFor the year ended 31 December 2017 Iluka Resources Limited
31 December 2017
Name: Marcelo BastosQualifications: Mechanical Engineering (UFMG), MBA (FDC-MG), MAICDAge: 55Role: Non-executive DirectorAppointed: February 2014Independent: Yes
Current positions:• Audit and Risk Committee - Member• Nominations and Governance Committee - Member
Relevant skills and experience:Mr Bastos was formerly the Chief Operating Officer of the global resources company, MMG Limited, withresponsibility for operations in three continents. Marcelo has extensive experience in major projects developmentand operation, and company management in the metals and mining industry (iron ore, gold, copper, nickel and coalsectors). Marcelo also served as the Chief Executive Officer of BHP Billiton Mitsubishi Alliance (BMA), President ofNickel West (BHP Billiton), President and Chief Operating Officer of Cerro Matoso and Nickel Americas (BHPBilliton) and had a 19 year career with Vale (CVRD) in senior management and operational positions, the last ofthose as Director of Non Ferrous Operations. Marcelo is a former Non-executive Director of Golding Contractors PtyLtd. He is also a former Member of the Western Australia Chamber of Mines and Energy and served as VicePresident of the Queensland Resources Council.
Other relevant directorships and offices (current and recent):• Aurizon Holdings Limited - Non-executive Director (appointed November 2017)• Golder Associates - Non-executive Director (appointed July 2017)• MMG Limited - Chief Operating Officer (retired August 2017)
Name: Xiaoling LiuQualifications: PhD, BEng, GAICD, FAusIMM, FTSEAge: 61Role: Non-executive DirectorAppointed: February 2016Independent: Yes
Current positions:• Audit and Risk Committee - Member• Nominations and Governance Committee - Member
Relevant skills and experience:Dr Liu is a former President and Chief Executive Officer of Rio Tinto Minerals. Over Xiaoling’s 26 years with the RioTinto Group she held various positions in smelting operation management through to President and CEO of RioTinto Minerals. Prior to joining Rio Tinto, she worked as a Research Fellow of City University (London). Xiaoling’sprevious Non-executive Director roles included: Board member of the California Chamber of Commerce; VicePresident of the Board of Australian Aluminium Council; and member of the University Council of the University ofTasmania.
Other relevant directorships and offices (current and recent):• Newcrest Mining Limited - Non-executive Director (current)• Melbourne Business School - Non-executive Director (current)• South 32 Limited - Non-executive Director (appointed 1 November 2017)
47
For
per
sona
l use
onl
y

48 Iluka Resources Limited, Annual Report 2017
Iluka Resources Limited31 December 2017
MEETINGS OF DIRECTORS
In 2017, the Board met on 11 occasions, of which six meetings were scheduled. In addition to these meetings, theBoard spent a day primarily focused on strategic planning. The Chairman chaired all the meetings. TheNon-executive Directors periodically met independent of management to discuss relevant issues. Directors’attendance at Board and committee meetings during 2017 is detailed below:
DIRECTORS SHAREHOLDING
Directors shareholding is set out in the Remuneration Report, section 6.4.
48
Directors’ reportFor the year ended 31 December 2017
For
per
sona
l use
onl
y

Iluka Resources Limited, Annual Report 2017 49
Iluka Resources Limited31 December 2017
EXECUTIVE TEAM PROFILES
Julian Andrews, BCom (Hons), PhD, CFA, GAICDHead of Business Development
Mr Andrews joined Iluka as Head of Business Development in 2017. Prior to joining Iluka, Mr Andrews held variousroles at Wesfarmers, including General Manager, Business Development and Chief Financial Officer in WesfarmersChemicals, Energy & Fertilisers division. He began his career in strategy consulting with PricewaterhouseCoopersCanada and worked in project finance and corporate advisory in the USA before relocating to Perth in 2004.
Matthew Blackwell, BEng (Mech), Grad Dip (Tech Mgt), MBA, MAICD, MIEAustHead of Marketing, Mineral Sands
Mr Blackwell joined Iluka in 2004 as President of US Operations. He has had responsibilities for Land Managementand as General Manager, USA, before being appointed Head of Marketing, Mineral Sands in February 2014. Priorto joining Iluka, Mr Blackwell was Executive Vice President of TSX listed Asia Pacific Resources and based inThailand. He also held positions with WMC Resources and Normandy Poseidon. Mr Blackwell has more than 20years' experience in the resources industry including senior positions in project management, maintenance,production and business development.
Rob Hattingh, MSc (Geochem)Chief Executive Officer, Sierra Rutile
Mr Hattingh joined Sierra Rutile in November 2016 from Iluka Resources where he held the position of GeneralManager Innovation, Sustainability and Technology. Mr Hattingh has more than 25 years’ experience in the mineralsand industry in a number of roles. He was Principal Environmental Scientist at Richards Bay Minerals in SouthAfrica and worked in senior roles at Exxaro Resources (now Tronox) where he was responsible for technicaldisciplines for a number of years. In 2008, Mr Hattingh joined Iluka Resources in Perth where he held managementroles in the fields of hydrogeology, metallurgy, sustainability and business development.
Simon Hay, BSc (Hons), MAppSc, Grad Dip (Mgmt), MAICDHead of Resource Development
Mr Hay joined Iluka in 2009 as Manager, South West Operations based in Capel. Mr Hay then moved to theMarketing function and served as Iluka's Country Manager for China and then General Manager Zircon Sales basedin Singapore. He was appointed to his current role as Head of Resource Development in March 2016. Prior tojoining Iluka, Mr Hay worked at Mt Isa Mines, WMC Resources and BHP Billiton in the fields of metallurgy, projectsand operations management in base metals.
Sarah Hodgson, LLB, GAICDGeneral Manager People
Ms Hodgson joined the People team at Iluka in 2013 and was appointed as General Manager People in May 2017.Ms Hodgson has 20 years’ HR experience specialising in remuneration and international mobility and started hercareer at PricewaterhouseCoopers in London before relocating to Australia with KPMG in 2002. Prior to joiningIluka Ms Hodgson held senior remuneration roles both as a consultant and in-house at Mercer, Westpac andKPMG.
Adele Stratton, BA (Hons), FCA, GAICDGeneral Manager Finance, Investor Relations and Corporate Affairs
Ms Stratton joined Iluka in 2011 and held a number of senior financial roles before being appointed to GeneralManager Finance, Investor Relations and Corporate Affairs in May 2017. Ms Stratton is a qualified charteredaccountant with 17 years’ experience working in both practice and public listed companies. Ms Stratton commencedher career with KPMG, spending 7 years in the assurance practice both in the UK, where she qualified as achartered accountant, and Australia. Prior to joining Iluka, Ms Stratton worked in a number of finance roles at RioTinto Iron Ore in Perth.
49
Directors’ reportFor the year ended 31 December 2017
For
per
sona
l use
onl
y

50 Iluka Resources Limited, Annual Report 2017
Iluka Resources Limited31 December 2017
Douglas Warden, BCom, CA, MBA, GAICDChief Financial Officer and Head of Strategy and Planning
Mr Warden joined Iluka in 2003 and held a number of senior financial and commercial roles before leaving theCompany in 2007. Since returning to Iluka in 2009, Mr Warden has held a number of roles including, Head ofResource Development, General Manager Business Development and General Manager Exploration. He wasappointed to his current role as Chief Financial Officer and Head of Strategy and Planning in June 2015. Mr Wardenhas previously been CFO at Summit Resources Limited and Jabiru Metals Limited and began his career incorporate finance and insolvency with Ernst & Young and KPMG.
Steven Wickham, Assoc Dip in Mechanical EngineeringChief Operating Officer, Mineral Sands
Mr Wickham is a mechanical engineer with extensive experience in senior and executive roles in Australia andSouth Africa in the manufacturing and mining sectors. Prior to joining Iluka in 2007, he was Chief Executive Officerof Ticor South Africa and Managing Director of Australian Zircon.
Sue Wilson, BJuris, LLB, FGIA, FICSA, FAICDGeneral Counsel and Company Secretary
Ms Wilson joined Iluka in December 2016. She was previously the Head of Company Secretariat at South32following the demerger from BHP Billiton. She was also General Counsel and Company Secretary and a member ofthe executive team at Bankwest and HBOS Australia. Prior to joining Bankwest, Ms Wilson was a partner of law firmParker & Parker (now part of Herbert Smith Freehills). She is currently the Pro Chancellor and a member of theCouncil at Curtin University and a former non-executive director of Western Power.
COMPANY SECRETARY
Ms Sue Wilson is the Company Secretary of the Company. Ms Wilson was appointed to the position of CompanySecretary in December 2016. Refer to the previous section for Ms Wilson’s profile.
Mr Nigel Tinley BBus CPA GAICD FGIA also acts as Company Secretary for the Company. Mr Tinley wasappointed to the position of Joint Company Secretary in 2013 and prior to that he held senior positions in Financeand Sales and Marketing. Before joining Iluka in 2006, Mr Tinley held a range of accounting, financial andcommercial roles over his 18 years with BHP Billiton Limited (and former BHP Limited) both in Australia andinternationally.
DIRECTORS AND OTHER OFFICERS’ REMUNERATION
Discussion of the Board’s policy for determining the nature and amount of remuneration for directors and seniorexecutives and the relationship between such policy and company performance are contained in the remunerationreport on pages 53 to 73 of this Annual Report.
PRINCIPAL ACTIVITIES
The principal activities and operations of the Group during the financial year were the exploration, projectdevelopment, mining operations, processing and marketing of mineral sands. The Company also has a royalty overiron ore sales revenue from BHP Billiton's Mining Area C province in Western Australia.
INDEMNIFICATION AND INSURANCE OF DIRECTORS AND OFFICERS
The Company indemnifies all directors of the Company named in this report and current and former executiveofficers of the Company and its controlled entities against all liabilities to persons (other than the Company or therelated body corporate) which arise out of the performance of their normal duties as director or executive officerunless the liability relates to conduct involving bad faith. The Company also has a policy to indemnify the directorsand executive officers against all costs and expenses incurred in defending an action that falls within the scope ofthe indemnity and any resulting payments.
During the year the Company has paid a premium in respect of directors' and executive officers' insurance. Thecontract contains a prohibition on disclosure of the amount of the premium and the nature of the liabilities under thepolicy.
50
Directors’ reportFor the year ended 31 December 2017
For
per
sona
l use
onl
y

Iluka Resources Limited, Annual Report 2017 51
Iluka Resources Limited31 December 2017
INDEMNIFICATION OF AUDITORS
The company's auditor is PricewaterhouseCoopers. The terms of engagement of Iluka's external auditor includesan indemnity in favour of the external auditor. This indemnity is in accordance with PricewaterhouseCoopers'standard Terms of Business and is conditional upon PricewaterhouseCoopers acting as external auditor. Iluka hasnot otherwise indemnified or agreed to indemnify the external auditors of Iluka at any time during the financial year.
NON-AUDIT SERVICES
The Group may decide to employ the external auditor, PricewaterhouseCoopers, on assignments additional to theirstatutory audit duties where the auditor's expertise and experience with the Group are important.
Fees that were paid or payable during the year for non-audit services provided by the auditor of the parent entity, itsnetwork firms and non-related audit firms is set out in note 25 on page 114 of the financial report.
The Board of directors has considered the position and, in accordance with advice received from the Audit and RiskCommittee, is satisfied that the provision of the non-audit services is compatible with the general standard ofindependence for auditors imposed by the Corporations Act 2001 for the following reasons:
• all non-audit services were provided in accordance with Iluka’s Non-Audit Services Policy and External AuditorGuidelines; and
• all non-audit services were subject to the corporate governance processes adopted by the company and havebeen reviewed by the Audit & Risk Committee to ensure that they do not affect the integrity or objectivity of theauditor.
A copy of the auditors' independence declaration as required under section 307C of the Corporations Act 2011 isset out on page 74.
ENVIRONMENTAL REGULATIONS
So far as the directors are aware, there have been no material breaches of the Group's licences and all mining andexploration activities have been undertaken in compliance with the relevant environmental regulations.
OTHER MATTERS
On 24 March 2014 Iluka became aware that a litigation funder proposed to fund claims that current or formershareholders may have against the Company in respect of continuous disclosure obligations in 2012. The potentialapplicants sought an order from the Federal Court for pre-action discovery which was dismissed in July 2015 andwhich subsequently appealed to the Full Federal Court. The Full Federal Court upheld the appeal in June 2017. TheFull Federal Court’s decision was then appealed to the High Court of Australia. The High Court dismissed theappeal in October 2017, such that Iluka was required to provide pre-action discovery which was completed inJanuary 2018.
Iluka has not received any substantive claim relating to the potential shareholder class action. Consistent withIluka’s announcement dated 24 March 2014, on receipt of any such substantive claim, Iluka will defend its position.
MATTERS SUBSEQUENT TO THE END OF THE FINANCIAL YEAR
The directors are not aware of any matter or circumstance not otherwise dealt with in the Directors' Report that hasor may significantly affect the operations of the entity, the results of those operations or the state of affairs of theentity in subsequent financial years.
DIVIDEND
The directors have declared a fully franked final dividend of 25 cents per ordinary share payable on 23 April 2018.
LIKELY DEVELOPMENTS AND EXPECTED RESULTS
In the opinion of the directors, likely developments in and expected results of the operations of the Group have beendisclosed in the Operating and Financial Review on pages 20 to 35. Disclosure of any further material relating tothose matters could result in unreasonable prejudice to the interests of the Group.
CORPORATE GOVERNANCE STATEMENT
The Company’s Corporate Governance Statement for the year ended 31 December 2017 may be accessed fromthe Company’s website at http://www.iluka.com/about-iluka/governance.
51
Directors’ reportFor the year ended 31 December 2017
For
per
sona
l use
onl
y

52 Iluka Resources Limited, Annual Report 2017
Directors’ reportFor the year ended 31 December 2017
Iluka Resources Limited31 December 2017
ROUNDING OF AMOUNTS
The Company is of a kind referred to in "ASIC Corporations (Rounding in Financial/Directors' Reports) Instrument2016/191", issued by the Australian Securities and Investments Commission, relating to the 'rounding off' ofamounts in the Directors' Report and accompanying Financial Report. Amounts in the Directors' Report have beenrounded off in accordance with that Rounding Instrument to the nearest hundred thousand dollars, or in certaincases, to the nearest dollar.
This report is made in accordance with a resolution of the directors.
G MartinChairman
T O'LearyManaging Director
27 February 2018
52
For
per
sona
l use
onl
y

Iluka Resources Limited, Annual Report 2017 53
Iluka Resources Limited
53
REMUNERATION REPORT
The directors of Iluka Resources Limited (Iluka or Company) present this Remuneration Report (Report) for the year ended 31 December 2017.
ABOUT THIS REPORT
This Report provides information about the remuneration of Iluka’s key management personnel (KMP), being its executives with authority for planning, directing and controlling the activities of the Company (Executive KMP) and its Non-executive Directors. The Report has been prepared in accordance with the Corporations Act 2001 (Cth) and includes the following sections:
SECTION 1
Overview of 2017 Remuneration
This section of the Report provides a snapshot of key remuneration developments at Iluka in 2017, as well as an overview of the total realised remuneration received by Executive KMP for the relevant year.
SECTION 2
Remuneration at Iluka
This section gives an overview of Iluka’s remuneration principles and the process for determining the structure of remuneration for Executive KMP.
SECTION 3
Executive Remuneration
This section outlines the remuneration structure and outcomes for Iluka’s Executive KMP in 2017, being:
T O’Leary – Managing Director and Chief Executive Officer M Blackwell – Head of Marketing S Hay – Head of Resource Development D Warden – Chief Financial Officer & Head of Strategy and Planning S Wickham – Chief Operating Officer Mineral Sands
It also demonstrates how the components of remuneration at Iluka are aligned with shareholder value-creation by being linked to the Company’s performance.
SECTION 4
Non-executive Director Remuneration
This section outlines the remuneration structure and fees paid to Iluka’s Non-executive Directors in 2017, being:
G Martin – Chairman, Independent Non-executive Director M Bastos – Independent Non-executive Director X Liu – Independent Non-executive Director J Ranck – Independent Non-executive Director J Seabrook – Independent Non-executive Director
SECTION 5
Changes to Remuneration for 2018
During the course of the year a comprehensive review of Iluka’s incentive arrangements was undertaken. This section outlines the changes to incentive arrangements for Iluka’s Executive KMP with effect from the performance period commencing 1 January 2018.
SECTION 6
Statutory Remuneration Disclosures
This section includes statutorily required remuneration disclosures for 2017, including details of equity awards outstanding and Executive KMP and Non-executive Director shareholdings in Iluka.
Directors’ reportFor the year ended 31 December 2017
For
per
sona
l use
onl
y

54 Iluka Resources Limited, Annual Report 2017
Iluka Resources Limited
54
SECTION 1 OVERVIEW OF 2017 REMUNERATION
Iluka’s approach to remuneration is intended to ensure that remuneration received by Executive KMP is closely linked to Iluka's performance and the returns generated for our shareholders.
1.1 Key developments in 2017
During 2017, the following developments occurred in relation to the Company's remuneration arrangements:
Total Fixed Remuneration (TFR)
• No TFR increases were awarded during 2017. • The Head of Marketing, Matthew Blackwell was relocated from the USA to Australia effective
15 March 2017. External benchmarking was undertaken to determine a localised AUD remuneration package which reflected the scope and responsibility of the role, external market conditions, internal relativities and Mr Blackwell’s experience and performance.
Short Term Incentive Plan(STIP)
• The 2017 STIP outcome equated to an average payment of 58 per cent of maximum opportunity for Executive KMP. While underlying earnings exceeded targeted levels, impairments of assets and increases to provisions reduced reported earnings well below targeted levels.
• For the profitability component of the STIP the outcome was 53 per cent.• For the sustainability component of the STIP the outcome was 88 per cent and 109 per cent
for Executive KMP with responsibilities relating to Sierra Rutile.• Individual performance measures for the STIP included the effective integration of the Sierra
Rutile acquisition, assessment of feasibility, attractiveness and timing of several expansion projects, the implementation of commercial arrangements to underpin the Cataby development, the continued flexing of production in light of market demand, market development activities, and the achievement of targeted objectives on projects that are expected to contribute to the Company’s earnings in the medium and long term.
• 50 per cent of the STIP outcome will be delivered in cash and 50 per cent will be deferred for a period up to two years (consistent with previous years, to provide further alignment between Executive KMP and shareholders).
Long Term Incentive Plan (LTIP)
• 25 per cent of the 2015 LTIP (performance period 1 January 2015 to 31 December 2017)vested. The TSR of Iluka over the performance period was 47.8 per cent, which ranked at the 50th percentile of the S&P/ASX 200 Materials Index comparator group. The average ROE over the performance period was negative 11.1 per cent (reported earnings in both 2016 and 2017 were impacted by impairments and increases to provisions).
Long Term Deferred Rights (LTDR)
• In October 2016, LTDR’s were granted to the Managing Director as compensation for incentives foregone from Mr O’Leary’s previous employer.
• During the year, 50 per cent of Tranche 1 of the Managing Director’s LTDR award (performance period 1 October 2016 to 31 December 2017) vested. The TSR over the periodwas 43.3 per cent, which ranked at the 82nd percentile of the S&P/ASX 200 Materials Indexcomparator group. The average ROE was negative 19.5 per cent (reported earnings in both 2016 and 2017 were impacted by impairments and increases to provisions).
Non–Executive Directors Remuneration
• No changes were made to Non-executive Directors’ Board and Committee fees in 2017.• A minimum shareholding policy for Non-executive Directors was approved by the Board in
December, with shareholding levels set at 12,000 shares for Directors and 30,000 shares for the Chairman. There will be a two year transitional period for the shares to be acquired by Non-executive Directors.
Review of Incentive Arrangements
• The Board reviewed its executive remuneration and incentive framework for executives to ensure that it remains fit for purpose with respect to the Company’s strategy and supports the achievement of the Company’s key objective – to create and deliver value for shareholders. Details of the new Executive Incentive Plan (EIP) are provided at section 5.
Directors’ reportFor the year ended 31 December 2017
For
per
sona
l use
onl
y

Iluka Resources Limited, Annual Report 2017 55
Iluka Resources Limited
55
1.2 Total Realised Earnings for Executive KMP (non-IFRS)
This section uses non-IFRS information to explain the "actual pay" received by Executive KMP for 2017. This is a voluntary disclosure intended to demonstrate the link between the remuneration received by Executive KMP and the performance of Iluka over this same period. The information provided in the table below is shown on the following basis:
• “TFR” includes base salary earned in 2017, as well as superannuation for Australian employees.
• "Other" payments include non-monetary benefits received in 2017, including car parking, spousal travel, any relevant US expenses (such as social security payments) and termination entitlements (such as payment in lieu of notice and accrued annual and long service leave).
• “STIP” reflects the total STIP amount receivable by Executive KMP in respect of performance in 2017 (paid in March 2018 following the release of annual results). As outlined below, STIP is awarded half in cash and half in deferred equity (in the form of restricted shares). Restricted shares remain subject to continued service conditions, with half released in 12 months and half released in 24 months.
• “LTIP” reflects LTIP awards of shares as a consequence of rights from prior years which reached the end of theirperformance period and vested in 2017. It does not include 2017 LTIP awards which may vest in future years if performance conditions are met.
Name TFR$
Other$
STIP$
LTIP1/LTDR2
$
Total Earnings
$
Cash Restricted Shares Shares
Managing DirectorT O'Leary 1,400,000 21,350 382,620 382,620 751,634 2,938,224Executive KMPM Blackwell3 705,334 272,342 175,475 175,475 129,881 1,458,507S Hay 608,523 13,402 149,940 149,940 53,108 974,913D Warden 660,000 13,402 170,874 170,874 240,551 1,255,701S Wickham4 734,463 83,249 187,795 187,795 145,960 1,339,262Total 4,108,320 403,745 1,066,704 1,066,704 1,321,134 7,966,607
1 Represents the estimated value of the 2015-2017 LTIP for which the performance period concluded on 31 December 2017. The estimate was calculated using the closing share price of $10.17 at 1 January 2018. The actual value will be calculated using the closing share price at the date of vesting (1 March 2018).
2 The estimated value of the 2016 LTDR award for T O’Leary was calculated using the closing share price of $10.17 at 1 January 2018. The actual value will be calculated using the closing share price at the date of vesting (1 March 2018).
3 M Blackwell relocated from the US to Australia effective 15 March 2017. The USD denominated portion of his earnings have been converted from USD to AUD for 2017 using the average foreign exchange rate for the duration of his 2017 US employment of 0.7510.Expenses relating to US social security, US accrued leave paid out and relocation allowances are included in Other.
4 S Wickham received an additional allowance in consideration of the significant time he is required to spend in Sierra Leone.
Directors’ reportFor the year ended 31 December 2017
For
per
sona
l use
onl
y

56 Iluka Resources Limited, Annual Report 2017
Iluka Resources Limited
56
SECTION 2 REMUNERATION AT ILUKA
2.1 Remuneration governance and principles
The following diagram outlines the governance framework in place at Iluka for setting remuneration for the Company’s KMP and other employees. It also includes the key remuneration principles which underlie Iluka’s remuneration
governance framework and practices.
2.2 Components of Executive KMP remuneration in 2017
Executive remuneration is comprised of both fixed and "at risk" components. The table below describes each of the components making up each Executive KMP’s total remuneration package applicable in 2017:
Directors’ reportFor the year ended 31 December 2017
For
per
sona
l use
onl
y

Iluka Resources Limited, Annual Report 2017 57
Iluka Resources Limited
57
The following diagram sets out the mix of fixed and "at risk" remuneration for Executive KMP in 2017*:
* Percentages are based on achievement of target performance for the “at risk” remuneration components provided in 2017.
2.3 Equity related remuneration policies
Iluka has a number of Company policies in place, designed to support and reinforce the remuneration principles and structure outlined in Section 2.1 of this Report. These policies include the following:
Directors’ reportFor the year ended 31 December 2017
For
per
sona
l use
onl
y
58 Iluka Resources Limited, Annual Report 2017
Iluka Resources Limited
58
SECTION 3 2017 EXECUTIVE REMUNERATION
The remuneration of Executive KMP was linked to both annual business and individual performance outcomes and to the Company’s ability to create and deliver sustainable levels of shareholder value. The terms of the incentive awards for Executive KMP in 2017 are summarised below.
3.1 Short Term Incentive Plan
The STIP aimed to provide an incentive to participants whilst driving shareholder value creation and promoting equity ownership by providing awards partly in cash and partly in deferred equity. The structure of Iluka’s STIP was as follows:
STIP opportunity The STIP award opportunity was based on a percentage range of each participant’s TFR and was determined by an individual’s role within the business and capacity to impact the results of the Company.
Managing Director and Executive KMP targets were 60 per cent of TFR, with stretch set at 90 per cent of TFR.
Performance targets The PPC approved the annual STIP performance targets having regard to Iluka's Corporate Plan, business conditions and market and shareholder expectations. Performance targets included three elements that aligned with Iluka's strategy, being Profitability, Growth and Sustainability.
Profitability measures included return on capital, free cash flow and net profit after tax metrics. A fourth measure, all in unit cash costs of production was included in 2017 given the organisational focus on securing a sustainable cost structure.
Growth objectives were individual objectives that advanced the Company’s longer term prospects and were set at a stretch level. Individual Growth objectives were linked to major business opportunities and risks from the Corporate Plan and business priorities for the year.
Sustainability targets related to safety and environmental objectives and were set based on a combination of industry best practice and continual improvement versus the prior year performance.
Vesting outcomes For the Profitability and Sustainability STIP performance measures, a threshold, target and stretch goal was set at the start of the 2017 performance year. STIP outcomes were calculated according to the following schedule:
Performance Level STI Outcome (% Target)
Threshold Target Stretch
0% 100% 150% (maximum)
A sliding scale operated between threshold and target, and between target and stretch.
For individual Growth objectives, full vesting only occurred if there was a stretch level of performance.
Performance assessment STIP outcomes were determined in early 2018.
Outcomes were subject to rigorous one up assessment and, for the Managing Director and Executive KMP, assessment by the Board.
Payment timing Payments will be made in March 2018.
Directors’ reportFor the year ended 31 December 2017
For
per
sona
l use
onl
y

Iluka Resources Limited, Annual Report 2017 59
Iluka Resources Limited
59
STIP deferral Fifty per cent of the STIP award for Executive KMP will be deferred into restricted shares in March 2018. Restricted shares will be granted for nil consideration.
Half of the restricted shares will vest one year after the grant date, while the remaining half will vest two years after the grant date.
The number of restricted shares awarded to each participant will be based on "face value" and determined by dividing the dollar value of the deferred component by the Volume Weighted Average Price (VWAP) of Iluka shares traded on the ASX over the five trading days following release of the Company’s full year results.
Voting rights and dividends Participants receive dividends and are entitled to exercise voting rights attaching to the restricted shares.
Cessation of employment If a participant resigns or is dismissed for cause all of their restricted shares will be forfeited, unless the Board determines otherwise. If a participant ceases employment due to circumstances such as redundancy or retirement the restricted shares will be released on the original vesting date subject to the original conditions, unless the Board determines otherwise. If a participant ceases employment due to death or total and permanent disablement, all of their restricted shares will be released, unless the Board determines otherwise.
Change of control In the event of a takeover or other transaction that in the Board’s opinion should be treated as a change of control event, the Board has a discretion to determine that vesting of some or all of the restricted shares be accelerated.
Board discretion Where the Board exercises its discretion under the STIP, for example in relation to cessation of employment or a change of control, the Board will consider all relevant factors at the time, which the Board expects will include the participant's performance against the performance targets and the proportion of the performance or deferral period that has elapsed.
3.2 2017 STIP Outcomes
Set out below is commentary on the performance outcome for each component of the 2017 STIP:
Strategic Driver
STIP Measures
Rationale for inclusion Performance outcome and commentary
Profitability (50% weighting)
Return on Capital (ROC)
Reflects how efficiently Iluka utilises capital to generate earnings and is the ‘internal surrogate’ for ROE.
Below threshold performance
The result for the year of negative 11.6 per cent was disappointing (2016: negative 18.3 per cent). Underlying earnings and returns on capital exceeded budgeted levels however impairments and provisions reduced returns well below targeted levels.
Free Cash Flow (FCF)
Reflects the cash generation of Iluka, with higher FCF allowing more dividends to be paid and/or greater investment in sustaining and growing the business while maintaining a conservatively geared balance sheet.
Above stretch performance
Iluka’s free cash flow was $322 million. This reflected the strong underlying earnings result driven by increased sales volumes and prices achieved across the product suite.
Net Profit After Tax (NPAT)
Reflects the profit made by Iluka and the resulting impact on returns generated for shareholders.
Below threshold performance
Iluka recorded a loss after tax for the year of $171.6 million, compared with a loss of $224.0 million for the previous corresponding period. As noted above reported earnings were impacted by impairments following the consolidation of the Australian mineral separation activities into a single plant in Western Australia ($106 million post-tax impairment charge), the write down of the
Directors’ reportFor the year ended 31 December 2017
For
per
sona
l use
onl
y

60 Iluka Resources Limited, Annual Report 2017
Iluka Resources Limited
60
investment in Metalysis Limited ($31 million pre and post-tax) and an increase to the US rehabilitationprovisions.
All in Unit Cash Costs of Production
Reflects the management of total cash costs within the business.
At target performance
The all-in unit cash costs of production of $695 per tonne reflected management’s focus on costs and in particular the reduction in non-production costs by $53 million from the prior year following the sustainable business review undertaken in the fourth quarter of 2016.
Growth(40% weighting)
Individual objectives
Objectives reflect individual roles and are linked to major business opportunities and the management of key risks as identified in Iluka’s five-year Corporate Plan, as well as the priorities for the relevant year.
At target performance
Targeted progress was achieved in relation to the following areas:• the integration of Sierra Rutile• the Sierra Rutile expansion projects• the Cataby project• the Cataby offtake contracts• the development of the Company’s longer term
investment opportunities and projects• the optimisation of the Company’s Australian
mineral separation plant assetsAreas in which less than targeted progress was achieved included:• implementation and delivery of better buying
and better spending initiatives in procurementare not as advanced as planned
• the development of certain Company longer term investment opportunities and projectshave not progressed as far as or as successfully as had been planned.
Sustainability(10% weighting)
Total Recordable Injury Frequency Rate (TRIFR)
Providing a safe workplace for all employees is an integral part of Iluka’s corporate objective and values.
Above threshold performance
In 2017 TRIFR of 4.8 (rolling 12-month average to 31 December 2017, excluding SRL) was achieved,with one less injury than 2016 offset by a slight reduction in hours worked.
Level 3 & above environmental incidents
Iluka has a strong commitment to ensuring that its activities do not have an adverse impact on the environment.
Above stretch performance
Above stretch performance level maintained with an improvement on 2016 levels (7 incidents in 2017 compared with 11 incidents in 2016, excluding SRL).
Sierra Rutile hazard reportingenvironmental incident reporting
For Executive KMP with responsibilities relating to Sierra Rutile, the focus wason hazard reporting and environmental incident reporting to underpin risk assessment and to drive improvement opportunities.
Above stretch performance
Above stretch performance level achieved with an increase from an average of 23 hazards and 23 environmental incidents per month in the first quarter to 342 hazards and 64 environmental incidents per month in the last quarter.
Directors’ reportFor the year ended 31 December 2017
For
per
sona
l use
onl
y

Iluka Resources Limited, Annual Report 2017 61
Iluka Resources Limited
61
The following chart provides a comparison between the maximum STIP opportunity for Executive KMP and the actual amounts which were awarded in 2017 and 2016.
3.3 2017 Long Term Incentive Plan
Iluka’s LTIP was designed to focus executives’ attention on sustainable long-term growth and align the interests of executives with those of shareholders.
Key details of the LTIP are set out in the table below:
LTIP opportunity The award opportunity was determined by an individual’s role within the business and capacity to impact the results of the Company.
In 2017, the maximum LTIP opportunity for the Managing Director and CEO was 120 per cent of TFR, and for other Executive KMP was 60 per cent of TFR.
Instrument As in previous years, the LTIP was awarded in share rights that entitle participants to acquire fully-paid ordinary shares in the Company on vesting (subject to the performance hurdles below). Rights were granted for nil consideration and no price will be payable on exercise of any rights that vest. Share rights do not attract dividends and do not carry voting rights prior to vesting and, where relevant, exercise.
Performance hurdles Return on equity (ROE) - 50% of LTIP award
Half of the award is tested against a ROE performance target which is measured over a four year performance period with vesting occurring on a straight line basis for performance between Threshold and Target.
Targets reflect expectations of the Company’s position within the mineral sands industry, the industry business cycle, Corporate Plan and budget business performance expectations. ROE is averaged over the four years, so a failure to achieve targeted levels of performance in any one year increases the level of ROE required in the remaining years to achieve vesting.
The table below discloses the threshold and target ROE performance targets.
LTIP grant Threshold Target 2017 – 2020 10% 14% 2016 – 2019 10% 14% 2016 – 2018 10% 14% 2015 – 2017 10% 14%
Directors’ reportFor the year ended 31 December 2017
For
per
sona
l use
onl
y

62 Iluka Resources Limited, Annual Report 2017
Iluka Resources Limited
62
Relative total shareholder return (TSR) - 50% of LTIP award
The remaining half of the award is assessed based on a relative TSR performance target, which is also measured over four years. The TSR component vests based on Iluka's TSR relative to a comparator group of companies. The S&P/ASX 200 Materials Index is used as the comparator group, since it reflects the companies that operate within the same industry as Iluka and with which Iluka competes for investment and talent.
A relative TSR hurdle is used as opposed to an absolute TSR hurdle, in recognition of the fact that Iluka and many of its peers operate in cyclical markets. This creates incentives for Executive KMP to continue to grow the business and look to the future at all points in the cycle.
Vesting outcomes Vesting occurs on a straight-line basis for performance between Threshold and Target (ROE measure) and the 50th percentile and 75th percentile (TSR measure) based on the below vesting schedule:
Measure Performance level to be achieved
Percentage of total grant that
will vest
Maximum percentage of
total grant
ROE Below threshold 0%
50% Threshold 25% Target or above 50%
TSRBelow 50th percentile 0%
50% 50th percentile 25% 75th percentile or above 50%
Total Grant (maximum award) 100%
If the performance targets have not been met at the end of the four-year performance period, the share rights will automatically lapse.
Performance assessment
Performance against the ROE and relative TSR performance targets is assessed following the end of the performance period and release of Iluka's full year audited results. There is no re-testing of performance targets.
Cessation of employment
If a member of the Executive KMP resigns or is dismissed for cause all of their unvested share rights will lapse, unless the Board determines otherwise. If a member of the Executive KMP ceases employment due to any other circumstances (including death, total and permanent disability, redundancy or retirement), the Board has discretion how to treat any unvested share rights and may determine that some or all of the share rights lapse, vest or stay on foot.
Change of control In the event of a takeover or other transaction that in the Board’s opinion should be treated as a change of control event, the Board has a discretion to determine that vesting of some or all of the share rights be accelerated.
Board discretion Where the Board exercises its discretion under the LTIP, for example in relation to cessation of employment or a change of control, the Board will consider all relevant factors at the time, which the Board expects will include Iluka’s performance against the performance targets and the proportion of the performance period that has elapsed.
Directors’ reportFor the year ended 31 December 2017
For
per
sona
l use
onl
y
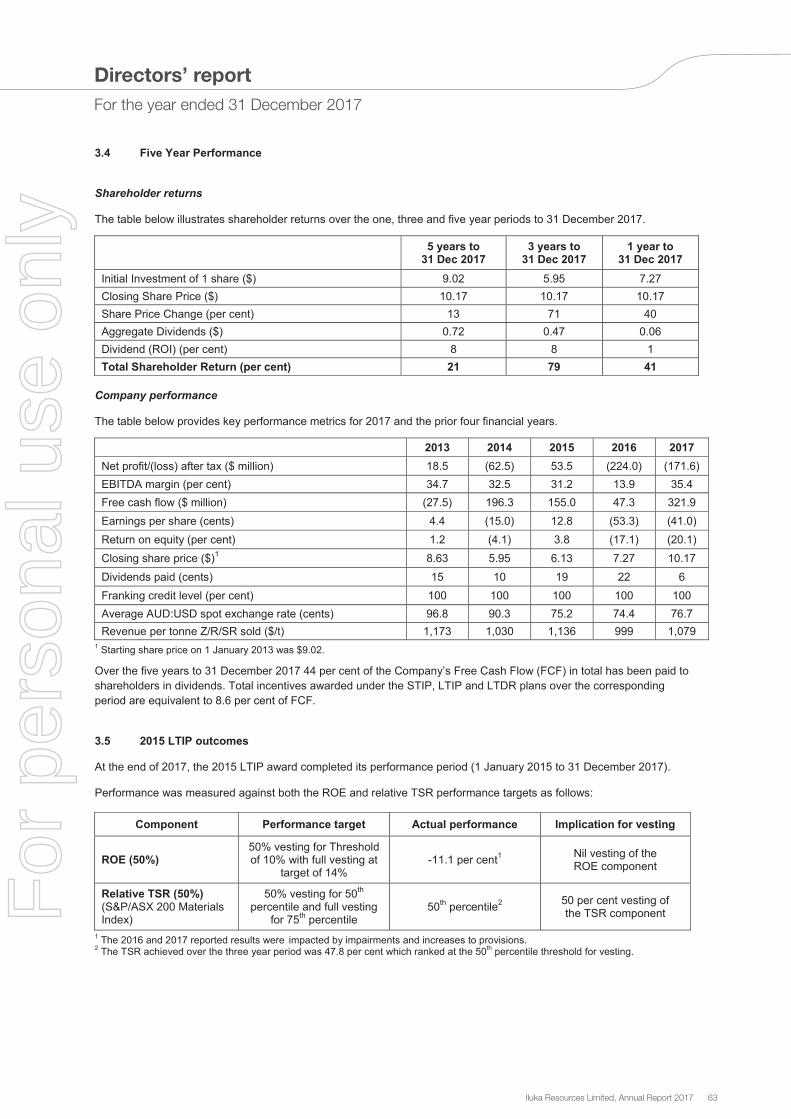
Iluka Resources Limited, Annual Report 2017 63
Iluka Resources Limited
63
3.4 Five Year Performance
Shareholder returns
The table below illustrates shareholder returns over the one, three and five year periods to 31 December 2017.
5 years to 31 Dec 2017
3 years to 31 Dec 2017
1 year to 31 Dec 2017
Initial Investment of 1 share ($) 9.02 5.95 7.27 Closing Share Price ($) 10.17 10.17 10.17 Share Price Change (per cent) 13 71 40 Aggregate Dividends ($) 0.72 0.47 0.06 Dividend (ROI) (per cent) 8 8 1 Total Shareholder Return (per cent) 21 79 41
Company performance
The table below provides key performance metrics for 2017 and the prior four financial years.
2013 2014 2015 2016 2017 Net profit/(loss) after tax ($ million) 18.5 (62.5) 53.5 (224.0) (171.6) EBITDA margin (per cent) 34.7 32.5 31.2 13.9 35.4 Free cash flow ($ million) (27.5) 196.3 155.0 47.3 321.9 Earnings per share (cents) 4.4 (15.0) 12.8 (53.3) (41.0) Return on equity (per cent) 1.2 (4.1) 3.8 (17.1) (20.1) Closing share price ($)1 8.63 5.95 6.13 7.27 10.17 Dividends paid (cents) 15 10 19 22 6 Franking credit level (per cent) 100 100 100 100 100 Average AUD:USD spot exchange rate (cents) 96.8 90.3 75.2 74.4 76.7 Revenue per tonne Z/R/SR sold ($/t) 1,173 1,030 1,136 999 1,079
1 Starting share price on 1 January 2013 was $9.02.
Over the five years to 31 December 2017 44 per cent of the Company’s Free Cash Flow (FCF) in total has been paid to shareholders in dividends. Total incentives awarded under the STIP, LTIP and LTDR plans over the corresponding period are equivalent to 8.6 per cent of FCF.
3.5 2015 LTIP outcomes
At the end of 2017, the 2015 LTIP award completed its performance period (1 January 2015 to 31 December 2017).
Performance was measured against both the ROE and relative TSR performance targets as follows:
Component Performance target Actual performance Implication for vesting
ROE (50%) 50% vesting for Threshold of 10% with full vesting at
target of 14% -11.1 per cent1 Nil vesting of the
ROE component
Relative TSR (50%) (S&P/ASX 200 Materials Index)
50% vesting for 50th
percentile and full vesting for 75th percentile
50th percentile2 50 per cent vesting of the TSR component
1 The 2016 and 2017 reported results were impacted by impairments and increases to provisions. 2 The TSR achieved over the three year period was 47.8 per cent which ranked at the 50th percentile threshold for vesting.
Directors’ reportFor the year ended 31 December 2017
For
per
sona
l use
onl
y

64 Iluka Resources Limited, Annual Report 2017
Iluka Resources Limited
64
3.6 2016 Long Term Deferred Rights – Managing Director
In October 2016, the Managing Director received an award of LTDR in consideration of joining Iluka and thereby forfeiting benefits that he may have become entitled to at his previous employer.
The LTDR award comprised three tranches of share rights which vest subject to ROE and relative TSR performance targets in line with the LTIP performance targets outlined in Section 3.4 above over staggered performance periods. The diagram below illustrates the performance periods over which the performance targets will be measured and the tranches will become eligible for vesting. This staggered approach was designed to promote sustained value creation for shareholders:
Following the end of 2017, Tranche 1 of the LTDR grant was eligible to be tested against the ROE and relative TSR performance targets over the performance period 1 October 2016 to 31 December 2017.
ROE performance of negative 19.5 per cent against a threshold of 10 per cent resulted in no vesting of the ROE component (half of Tranche 1) and TSR of 43.3 per cent that ranked at the 82nd percentile of the S&P/ASX 200 Materials Index comparator group on a relative basis resulted in full vesting of the TSR component (the remaining half of Tranche 1).
3.7 2017 Long Term Deferred Rights – Chief Operating Officer
The Board retains the flexibility to make one-off equity grants in recognition of executive position changes and the impact these new and other specific roles will have on delivering Iluka’s future strategic plan. In recognition of the importance of integration and delivery of the investment case for the Sierra Rutile operations, an equity grant was awarded as LTDR to the Chief Operating Officer in 2017. Key details of the grant are set out in the table below:
LTDR opportunity In 2017, the maximum LTDR opportunity for the Chief Operating Officer was 15 per cent of TFR.
Instrument The LTDR was awarded in share rights that entitle the participant to acquire fully-paid ordinary shares in the Company on vesting and, where relevant, exercise of those rights. Rights are granted for nil consideration and no price is payable on exercise of those rights. Share rights do not attract dividends and do not carry voting rights prior to vesting and, where relevant, exercise.
Performance Hurdles Share rights may vest at the end of the performance period subject to the satisfaction of performance hurdles. Performance metrics, relating to the achievement of the investment case for the Sierra Rutile acquisition and covering financial, sustainability, production and reputational performance outcomes, will be assessed and the outcome disclosed at the conclusion of the three year performance period ending 31 December 2019.
Conditions relating to cessation of employment, change of control and board discretion for the 2017 LTDR award are consistent with the terms of the LTIP.
Directors’ reportFor the year ended 31 December 2017
For
per
sona
l use
onl
y

Iluka Resources Limited, Annual Report 2017 65
Iluka Resources Limited
65
3.8 Executive employment agreements
Executive KMP are employed on terms set out in individual employment agreements. The employment agreements continue on a rolling basis and do not contain a fixed term. Key terms of the agreements are as follows:
Executive KMP Position
Termination Notice Period by Iluka or
Employee Termination Payments1
T O'Leary Managing Director and Chief Executive Officer 6 months 6 months
M Blackwell Head of Marketing, Mineral Sands 3 months 6 months
S Hay Head of Resource Development 3 months 3 months
D Warden Chief Financial Officer and Head of Strategy and Planning 3 months 3 months
S Wickham Chief Operating Officer, Mineral Sands 3 months 6 months
1 Termination payments (other than for gross misconduct) are calculated based on TFR at date of termination and are provided in addition to the notice period or payment in lieu of notice.
Iluka may terminate Executive KMP’s employment agreements without notice and without providing payment in lieu of notice where there is gross misconduct or other grounds for summary dismissal.
SECTION 4 NON-EXECUTIVE DIRECTOR REMUNERATION
The remuneration of the Non-executive Directors is determined by the Board on recommendation from the People and Performance Committee within the maximum aggregate amount approved by shareholders at Iluka's Annual General Meeting. The current cap on Non-executive Directors’ fees (including superannuation) as approved by shareholders in May 2015 is $1.8 million. The total amount paid to Non-executive Directors in 2017 (including superannuation) was $1.0 million. Non-executive Directors do not receive any performance-based remuneration.
Details of Non-executive Director fees in 2017 are as follows:
Non-executive Director base fees Board Chairman (inclusive of Committee fees) $312,000
Board Member $125,000
Board Member Committee fees
Audit and Risk Committee Chair $35,000Audit and Risk Committee Member $17,500People and Performance Committee Chair $25,000People and Performance Committee Member $12,500
Nominations Committee Chair Nil
Nominations Committee Member Nil
The minimum required employer superannuation contribution up to the statutory maximum is paid into each Non-executive Director’s nominated eligible fund and is in addition to the above fees.
Directors’ reportFor the year ended 31 December 2017
For
per
sona
l use
onl
y

66 Iluka Resources Limited, Annual Report 2017
Iluka Resources Limited
66
SECTION 5 CHANGES TO REMUNERATION FOR 2018
5.1 Review of incentive structure for executives
During 2017 the Board undertook an extensive review of the effectiveness of the reward framework for the Company’s strategy and business objectives. In particular the Board wanted to ensure that the incentive structure is fit for purpose with respect to Iluka’s long term strategy and supports the achievement of the Company’s key objective to create and deliver value for shareholders.
A key element of the review was engagement with internal and external stakeholders to ensure all perspectives were considered. The Board continues to believe that executive remuneration is a key driver to incentivise executives to deliver on the Company’s strategic objectives and, following the review, the Board determined that changes were required. The Company has now adopted a new Executive Incentive Plan (EIP) for implementation in 2018. The primary objectives of the new EIP are to:
Align the performance of executives with the interests of shareholders; and To provide appropriate incentives to attract and retain talented and experienced executives.
The Board considers the vesting of equity in the hands of the executives is a powerful means of aligning executive and shareholder interests over the long term. The implementation of an incentive structure that, subject to annual and sustained performance, will result in a significant part of the executives’ overall reward delivered in shares will mean that they are immediately aligned with, and exposed to the same financial consequences as, ordinary shareholders. Further, the structure and arrangements the Board has developed are expected to ensure that executives build, and continue to hold, a personally significant shareholding in Iluka.
5.2 EIP design features
The new EIP will combine the existing STIP and LTIP into a single incentive plan. The quantum of each Executive KMP’s EIP award will be determined by their performance against a scorecard over a 12 month period (the Annual Performance Period). The metrics for the annual performance scorecard will be set by the Board each year.
Following the end of each Annual Performance Period, any resulting EIP award will be delivered to Executive KMP as follows: Two thirds as a combination of:
o a cash payment, made at the end of the Annual Performance Period; and o a grant of restricted shares, to be released in equal tranches over the three years following the end of the
Annual Performance Period; and
One third as a grant of performance rights, which will vest subject to meeting a further gateway test (based on the Company’s relative TSR performance over a four year period commencing at the beginning of the Annual Performance Period (the TSR Performance Period)).
This incentive structure has been designed to provide executives with share ownership and exposure to the Company’s total shareholder returns over time. On this basis, EIP awards will have a lower cash component than under former plans and it will reduce to zero for the Managing Director after two years.
In addition to the plan changes, the minimum shareholding requirements for executives have also been increased to two times fixed remuneration for the Managing Director and once times fixed remuneration for other Executive KMP.
The following diagram provides an overview of the EIP elements and timings.
Directors’ reportFor the year ended 31 December 2017
For
per
sona
l use
onl
y
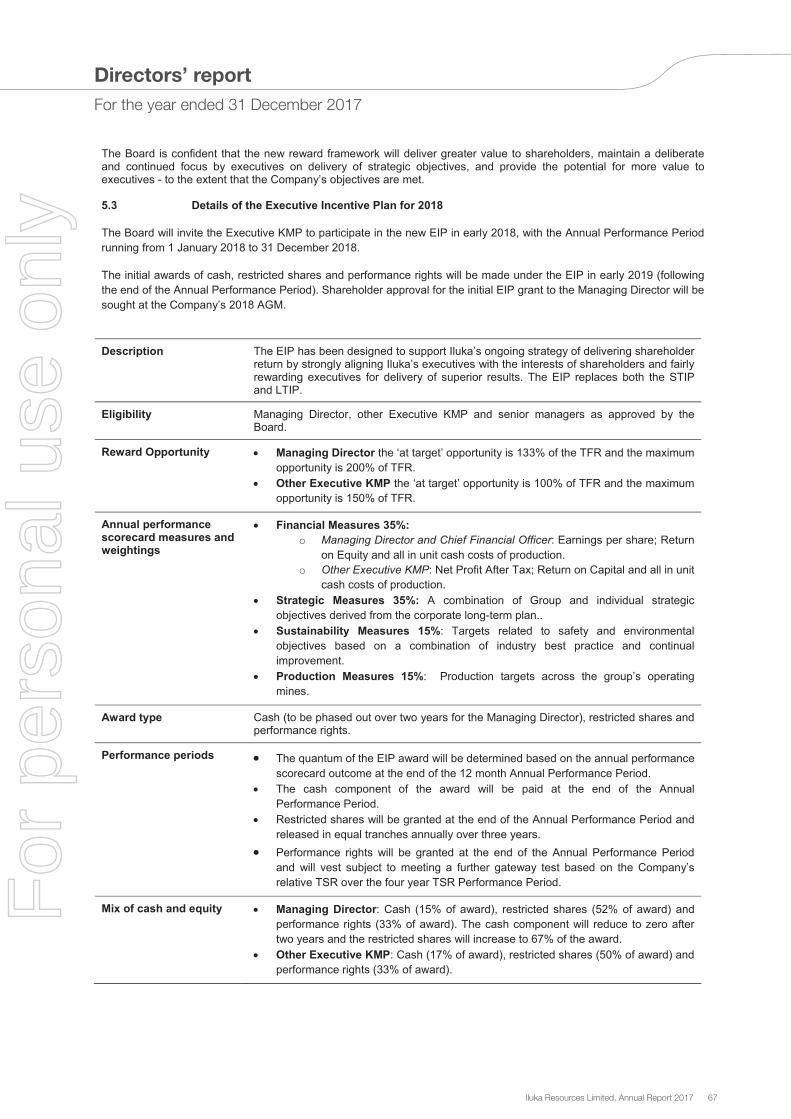
Iluka Resources Limited, Annual Report 2017 67
Iluka Resources Limited
67
The Board is confident that the new reward framework will deliver greater value to shareholders, maintain a deliberate and continued focus by executives on delivery of strategic objectives, and provide the potential for more value to executives - to the extent that the Company’s objectives are met.
5.3 Details of the Executive Incentive Plan for 2018
The Board will invite the Executive KMP to participate in the new EIP in early 2018, with the Annual Performance Period running from 1 January 2018 to 31 December 2018.
The initial awards of cash, restricted shares and performance rights will be made under the EIP in early 2019 (following the end of the Annual Performance Period). Shareholder approval for the initial EIP grant to the Managing Director will be sought at the Company’s 2018 AGM.
Description The EIP has been designed to support Iluka’s ongoing strategy of delivering shareholder return by strongly aligning Iluka’s executives with the interests of shareholders and fairly rewarding executives for delivery of superior results. The EIP replaces both the STIP and LTIP.
Eligibility Managing Director, other Executive KMP and senior managers as approved by the Board.
Reward Opportunity Managing Director the ‘at target’ opportunity is 133% of the TFR and the maximum opportunity is 200% of TFR.
Other Executive KMP the ‘at target’ opportunity is 100% of TFR and the maximum opportunity is 150% of TFR.
Annual performance scorecard measures and weightings
Financial Measures 35%:o Managing Director and Chief Financial Officer: Earnings per share; Return
on Equity and all in unit cash costs of production. o Other Executive KMP: Net Profit After Tax; Return on Capital and all in unit
cash costs of production. Strategic Measures 35%: A combination of Group and individual strategic
objectives derived from the corporate long-term plan.. Sustainability Measures 15%: Targets related to safety and environmental
objectives based on a combination of industry best practice and continual improvement.
Production Measures 15%: Production targets across the group’s operating mines.
Award type Cash (to be phased out over two years for the Managing Director), restricted shares and performance rights.
Performance periods The quantum of the EIP award will be determined based on the annual performance scorecard outcome at the end of the 12 month Annual Performance Period.
The cash component of the award will be paid at the end of the Annual Performance Period.
Restricted shares will be granted at the end of the Annual Performance Period and released in equal tranches annually over three years.
Performance rights will be granted at the end of the Annual Performance Period and will vest subject to meeting a further gateway test based on the Company’s relative TSR over the four year TSR Performance Period.
Mix of cash and equity Managing Director: Cash (15% of award), restricted shares (52% of award) and performance rights (33% of award). The cash component will reduce to zero after two years and the restricted shares will increase to 67% of the award.
Other Executive KMP: Cash (17% of award), restricted shares (50% of award) and performance rights (33% of award).
Directors’ reportFor the year ended 31 December 2017
For
per
sona
l use
onl
y

68 Iluka Resources Limited, Annual Report 2017
Iluka Resources Limited
68
Equity allocation methodology
The number of restricted shares and performance rights to be granted to executives will be based on the dollar value determined by the annual performance scorecard outcome, divided by the five day VWAP of Iluka shares commencing on the day after the release of the Company’s annual results (following the end of the Annual Performance Period).
Release of restricted shares
The restricted shares granted to executives following the end of the Annual Performance Period will be subject to trading and disposal restrictions. They will be released from these restrictions in equal tranches annually over a three year period.
‘Gateway test’ for vesting of performance rights
The performance rights granted to executives will only vest into Iluka ordinary shares if Iluka’s relative TSR ranks at the 50th percentile or greater against a comparator group comprising the ASX 200 Resources Index (excluding companies primarily engaged in the Oil and Gas sector and non-mining) over the four year TSR Performance Period. If the relative TSR gateway test is not satisfied, all of the performance rights will lapse.
Dividends Restricted shares: Participants will receive dividends on restricted shares. Performance rights: No dividends will be paid on performance rights prior to
vesting. For performance rights that vest, a cash payment equivalent to dividends paid by Iluka during the period between grant of the performance rights and vesting, will be made at or around the time of vesting.
Cessation of employment In the event of an executive ceasing employment for reasons of resignation or termination for cause, all of their restricted shares and performance rights will be forfeited or lapse (as applicable). In the event of retirement and redundancy of an executive, the restricted shares and performance rights will remain on foot and subject to the original terms of the award.
Clawback The Board has power under the relevant rules to clawback incentives that have vested and that have been paid or awarded to participants in certain circumstances. For example, restricted shares and performance rights may be lapsed or forfeited (as appropriate) if a participant acts fraudulently or dishonestly or if there is a material misstatement or omission in the accounts of a Group company.
Minimum shareholding requirements
Managing Director: 200% of TFR. Other Executive KMP: 100% of TFR.
Directors’ reportFor the year ended 31 December 2017
For
per
sona
l use
onl
y

Iluka Resources Limited, Annual Report 2017 69
Iluka Resources Limited
69
5.4 Comparison of 2017 incentive structure and Executive Incentive Plan for 2018
Current Arrangements Executive Incentive Plan
STIP LTIP
Performance period
12 months 4 years 12 months entire award 4 years Gateway RTSR test
Performance measures
Profitability Sustainability Growth
RTSR ROE
Financials Strategy Sustainability Production
Long-term Gateway RTSR
Incentive components
50% Cash 50% Equity (restricted shares)
100% Equity (share rights)
One-third Performance Rights Two-thirds Restricted Shares and Cash1
Equity deferral period
1-2 years from end of performance period
4 years from start of performance period
Equity component transferred in equal instalments over 3 years from the end of the performance period; dividends to be paid from original issue date. Gateway RTSR test 4 years from the start of the annual performance period.
Managing Director target opportunity
Target 60% of TFR Maximum 90% of TFR
120% of TFR Single incentive Target 133% of TFR Maximum 200% of TFR
KMP target opportunity
Target 60% of TFR Maximum 90% of TFR
60% of TFR Single incentive Target 100% of TFR Maximum 150% of TFR
Shareholding requirements
Managing Director 100% of TFR Other KMP 75% of TFR
Managing Director 200% of TFR Other KMP 100% of TFR
1 The cash component for the Managing Director will reduce to zero after two years
Directors’ reportFor the year ended 31 December 2017
For
per
sona
l use
onl
y

70 Iluka Resources Limited, Annual Report 2017
Iluka Resources Limited
70
SECTION 6 STATUTORY REMUNERATION DISCLOSURES
Details of the remuneration of the KMP, prepared in accordance with the requirements of the Corporations Act 2001 (Cth) and the relevant Australian Accounting Standards, are set out in the following tables.
6.1 Non-executive Director Statutory Remuneration Disclosures
Name Year Board, Committee
Fees Non-Monetary
Benefits Superannuation Statutory Total
$ $ $ $ G Martin 2017 312,000 - 19,832 331,832 2016 312,000 - 19,462 331,462 M Bastos 2017 142,500 - 13,538 156,038 2016 142,500 - 13,538 156,038 X Liu 2017 142,500 - 13,538 156,038
2016 143,541 8,053 13,636 165,230 J Ranck 2017 167,500 - 15,912 183,412 2016 161,029 8,463 15,298 184,790 J Seabrook 2017 172,500 - 16,388 188,888 2016 172,500 - 16,388 188,888 Total 2017 937,000 - 79,208 1,016,208 2016 931,570 16,516 78,322 1,026,408
Directors’ reportFor the year ended 31 December 2017
For
per
sona
l use
onl
y

Iluka Resources Limited, Annual Report 2017 71
Iluka Resources Limited
71
6.2 Executive KMP Statutory Remuneration Disclosures
Name Year TFR1STIP
Cash2
Non-Monetary Benefits3
Termination Benefits4 Other5
ShareBased
Payments2,6Statutory
Total $ $ $ $ $ $ $
Managing Director T O'Leary7 2017 1,400,000 382,620 21,350 - - 1,740,198 3,544,168 2016 456,061 - 4,335 - - 338,178 798,574 D Robb8 2017 - - - - - - - 2016 1,354,231 1,800,000 46,746 2,081,693 - 864,961 6,147,631 Other Executive KMP MBlackwell9
2017 802,095 175,475 14,600 - 160,981 286,069 1,439,220
2016 717,356 112,984 - - 60,779 323,065 1,214,184
S Hay10 2017 608,523 149,940 13,402 - 53,108 236,010 1,007,875 2016 437,500 90,016 11,085 - - 155,024 693,625 D Warden 2017 660,000 170,874 13,402 - - 202,743 1,047,019 2016 660,000 109,890 11,356 - - 373,462 1,154,708 S Wickham 2017 734,463 187,795 7,012 - 76,237 330,569 1,336,076 2016 732,720 125,343 4,980 - - 341,733 1,204,776 Total 2017 4,205,081 1,066,704 69,766 - 237,218 2,795,589 8,374,358 2016 4,357,868 2,238,233 78,502 2,081,693 60,779 2,396,423 11,213,498 1 Includes base salary and superannuation.2 STIP cash payments and restricted share awards for 2017 will be made in March 2018. 3 Includes non-monetary benefits which consist of car parking and spouse travel. 4 Includes cessation entitlements relating to payment in lieu of notice, accrued leave entitlements and the settlement of the 2016 LTIP award for D Robb. Termination payments were paid in accordance with approval obtained from shareholders at the 2011 AGM. 5 Includes US social security expenses and relocation allowances for M Blackwell and Sierra Leone travel allowance for S Wickham.6 Amounts relate to the fair value of awards from prior years made under various incentive plans attributable to the year measured in accordance with AASB 2 Share Based Payments. 7 T O’Leary became a KMP on 5 September 2016. Remuneration disclosures for 2016 reflect the period he was a KMP. 8 D Robb ceased to be a KMP on 2 September 2016. Remuneration disclosures for 2016 reflect the period he was a KMP.9 M Blackwell relocated from the US to Australia effective 15 March 2017. TFR for 2017 includes $96,761 of US accrued leave paid out. The USD denominated portion of his 2017 earnings have been converted from USD to AUD for 2017 using the average foreign exchange rate for the duration of his 2017 US employment of 0.7510 and for 2016 using the 2016 YTD average foreign exchange rateof 0.7444. 10 S Hay became a KMP on 1 March 2016. Remuneration disclosures for 2016 reflect the period he was a KMP.
6.3 Share–based Compensation
STIP restricted shares
Name 2015 STIP1
(restricted shares)
2016 STIP1
(restricted shares)
2017 STIP1,2
(restricted shares)
% of total STIP opportunity awarded %3
(cash and restricted shares)
2015 2016 2017
T O’Leary - - 37,623 - - 61
M Blackwell 18,664 16,177 17,255 37 35 60
S Hay 6,697 13,208 14,744 37 39 56
D Warden 15,678 16,124 16,802 35 37 58
S Wickham 21,392 18,391 18,466 43 38 57
1 STIP restricted share fair value is determined as the volume weighted average price of ordinary shares over the five trading days following the release of the Company’s annual results. STIP restricted shares are awarded in March of the following year (e.g. 2017 STIP awards will be made in March 2018). 2 Represents the estimated number of restricted shares to be awarded under the 2017 STIP calculated using the closing share price of $10.17 at 1 January 2018. 3 The percentage achieved of the STIP maximum incentive opportunity awarded for the financial year.
Directors’ reportFor the year ended 31 December 2017
For
per
sona
l use
onl
y

72 Iluka Resources Limited, Annual Report 2017
Iluka Resources Limited
72
Share Rights
Number of share rights Value of share rights
Name Balance at 1 January
2017
Granted during 20171
Vested / exercised
into shares in 2017
Lapsed during 20172
Balance at 31 December
2017
Value of rights granted in
2017 $
Value of rights vested /
exercised into shares in 2017
$Managing Director
T O’Leary 758,304 246,493 - - 1,004,797 1,614,529 -
Other Executive KMP
M Blackwell 204,798 57,662 - (19,000) 243,460 377,686 -
S Hay 124,374 52,820 - (8,472) 168,722 345,971 -
D Warden 233,248 58,102 - (19,188) 272,162 380,568 -
S Wickham 211,765 80,662 - (21,697) 270,730 532,615 -
1 Share rights granted in respect of the 2017 LTIP awards for the Managing Director and other Executive KMP and the 2017 LTDR award for the Chief Operating Officer, which form part of share based payments for 2017 to 2020 inclusive. 2 Share rights which lapsed during 2017 relate to the 2014 LTIP award.
Fair Value
The fair value of each restricted share or share right and the vesting year for each incentive plan is set out below.
The maximum value of restricted shares and/or share rights yet to vest is not able to be determined as it is dependent on satisfaction of service and performance conditions and Iluka’s future share price. The minimum value of unvested restricted shares and/or share rights is nil.
Incentive Plan Grant Date Fair Value per
Share or Right at Grant Date2
$Vesting Year Expiry year5
2015 LTIP March 2015 5.88 2018 –
2015 STIP1 March 2016 6.63 2017 & 2018 –
2016 LTIP Tranche 1 May 2016 5.14 2019 2026
2016 LTIP Tranche 2 May 2016 5.07 2020 2026
2016 STIP1 March 2017 6.82 2018 & 2019 –
2016 LTDR October 2016 4.68 2017, 2018 & 2019 2026
2016 LTIP (MD grant) October 2016 4.57 2021 2026
2017 LTIP March 2017 6.55 2021 2027
2017 STIP1,3 March 2018 10.17 2019 & 2020 -
2017 LTDR4 March 2017 6.82 2021 2027
1 Awards under these plans are restricted shares; all other plans grant share rights. 2 The fair value is calculated in accordance with the measurement criteria of Accounting Standard AASB 2 Share Based Payments. 3 Represents the estimated fair value of the 2017 STIP award for which the performance period concluded on 31 December 2017 calculated using the closing share price of $10.17 at 1 January 2018. The actual value will be calculated as the VWAP of ordinary shares over the five trading days following the release of the Company’s 2017 annual results. 4 Represents the face value of the 2017 LTDR award for the Chief Operating Officer being the VWAP of Iluka shares traded over the five trading days following the release of the Company’s 2016 annual results.5 Rights granted from 2016 onwards are not automatically exercised and must be exercised by the executive KMP before the expiry date. Rights that are not exercised by the expiry date are automatically exercised by this date. No amounts are payable on exercise of the rights.
Directors’ reportFor the year ended 31 December 2017
For
per
sona
l use
onl
y

Iluka Resources Limited, Annual Report 2017 73
Iluka Resources Limited
73
6.4 KMP shareholdings
Shareholdings of Executive KMP and their related parties
Number of shares
Name Balance held at 1 January 2017
Vesting of share rights pursuant
to LTDR and LTIP
Awarded as Restricted
Shares pursuant to STIP
Other changesBalance held at 31 December
2017
Managing Director
T O’Leary - - - - -
Other Executive KMP
M Blackwell 70,020 - 16,177 (33,160) 53,037
S Hay 50,606 - 13,208 (2,947) 60,867
D Warden 49,833 - 16,124 (10,511) 55,446
S Wickham 113,780 - 18,391 (60,204) 71,967
Shareholdings of Non-executive Directors and their related parties
Number of shares1
Name Balance held at 1 January 2017 Net movement Balance held at
31 December 2017G Martin2 20,000 - 20,000
M Bastos2 11,000 - 11,000
X Liu2 - 10,000 10,000
J Ranck 10,000 - 10,000
J Seabrook2 19,314 - 19,314
1 Non-executive Directors do not receive share based compensation and movements in their shareholdings reflect on-market trades. 2 Includes shares held indirectly through a nominee or agent (e.g. family trust).
6.5 Transactions with Key Management Personnel
During the financial year there were no product or services purchases by KMP from the Group (2016: nil) and there are no amounts payable at 31 December 2017 (2016: nil).
There have been no loans to KMP during the financial year (2016: nil).
Directors’ reportFor the year ended 31 December 2017
For
per
sona
l use
onl
y

74 Iluka Resources Limited, Annual Report 2017
PricewaterhouseCoopers, ABN 52 780 433 757Brookfield Place, 125 St Georges Terrace, PERTH WA 6000, GPO Box D198, PERTH WA 6840 T: +61 8 9238 3000, F: +61 8 9238 3999, www.pwc.com.au
Liability limited by a scheme approved under Professional Standards Legislation.
74
Auditor’s Independence Declaration
As lead auditor for the audit of Iluka Resources Limited for the year ended 31 December 2017, I declare that to the best of my knowledge and belief, there have been:
(a) no contraventions of the auditor independence requirements of the Corporations Act 2001 in relation to the audit; and
(b) no contraventions of any applicable code of professional conduct in relation to the audit.
This declaration is in respect of Iluka Resources Limited and the entities it controlled during the period.
Justin Carroll PerthPartnerPricewaterhouseCoopers
27 February 2018
Auditor’s Independence DeclarationFor the year ended 31 December 2017
For
per
sona
l use
onl
y

Iluka Resources Limited, Annual Report 2017 75
Iluka Resources Limited ABN 34 008 675 018
Financial Report - 31 December 2017
Contents PageFinancial statements
Consolidated statement of profit or loss and other comprehensive income 76Consolidated balance sheet 77Consolidated statement of changes in equity 78Consolidated statement of cash flows 79Notes to the consolidated financial statements 80
Directors' declaration 123Independent auditor's report to the members 124
About this reportThese financial statements are the consolidated financial statements of the Group consisting of Iluka ResourcesLimited and its subsidiaries (the Group). The financial statements are presented in Australian dollars.
Iluka Resources Limited is a company limited by shares, incorporated and domiciled in Australia. Its registeredoffice and principal place of business is:
Iluka Resources LimitedLevel 23140 St George's TerracePerth WA 6000
A description of the nature of the Group's operations and its principal activities is included in the operating andfinancial review section of the Directors' Report, which is not part of these financial statements.
The financial statements were authorised for issue by the directors on 27 February 2018. The directors have thepower to amend and reissue the financial statements.
Through the use of the internet, we have ensured that our corporate reporting is timely and complete. All ASXreleases, financial reports and other relevant information are available at www.iluka.com
75
For
per
sona
l use
onl
y

76 Iluka Resources Limited, Annual Report 2017
Iluka Resources LimitedConsolidated statement of profit or lossand other comprehensive incomeFor the year ended 31 December 2017
Notes2017
$m2016
$m
Revenue 5 1,077.8 774.4
Other income 2.1 5.5Expenses 7 (1,209.3) (1,023.7)Share of losses of investments accounted for using the equity method 8(b)(ii) (3.3) (3.3)
Interest and finance charges (18.8) (18.8)Rehabilitation and mine closure provision discount unwind (14.1) (11.8)
Total finance costs 15(d) (32.9) (30.6)
Loss before income tax (165.6) (277.7)
Income tax (expense) benefit 11 (6.0) 53.7Loss for the period attributable to owners (171.6) (224.0)
Other comprehensive income
Items that may be reclassified subsequently to profit or lossCurrency translation of foreign operations 17 (38.4) 15.2Hedge of net investment in foreign operation, net of tax 17 14.8 (5.8)Changes in fair value of foreign exchange cash flow hedges, net of tax (2.2) -
Items that will not be reclassified to profit or lossActuarial (losses) gains on defined benefit plans, net of tax 17 (0.5) 0.3Share of losses relating to previously held interests in an associate 17 - (4.7)
Total other comprehensive (loss) income for the year, net of tax (26.3) 5.0
Total comprehensive loss for the year attributable to owners (197.9) (219.0)
Cents Cents
Loss per share attributable to ordinary equity holdersBasic loss per share 19 (41.0) (53.6)Diluted loss per share 19 (41.0) (53.6)
The above consolidated statement of profit or loss and other comprehensive income should be read in conjunction with theaccompanying notes.
76
Consolidated statement of profit or loss and other comprehensive incomeFor the year ended 31 December 2017
For
per
sona
l use
onl
y

Iluka Resources Limited, Annual Report 2017 77
Iluka Resources LimitedConsolidated balance sheetAs at 31 December 2017
Notes2017
$m2016*
$m
ASSETSCurrent assetsCash and cash equivalents 15 53.6 101.3Receivables 13 171.4 169.9Inventories 14 469.6 474.0Derivative financial instruments 21 0.2 -Current tax receivables 20.0 12.4
Total current assets 714.8 757.6
Non-current assetsInvestments accounted for using the equity method 8(b)(ii) - 33.7Derivative financial instruments 21 2.4 -Property, plant and equipment 10 1,029.8 1,218.2Deferred tax assets 12 185.9 208.2Intangible asset - MAC Royalty 5(b) 4.3 4.7Inventories 14 9.8 219.9
Total non-current assets 1,232.2 1,684.7
Total assets 1,947.0 2,442.3
LIABILITIESCurrent liabilitiesPayables 114.2 123.8Derivative financial instruments 21 3.4 -Current tax payable 3.8 -Provisions 9 83.8 44.3
Total current liabilities 205.2 168.1
Non-current liabilitiesInterest-bearing liabilities 15 236.1 607.6Provisions 9 620.2 563.6
Total non-current liabilities 856.3 1,171.2
Total liabilities 1,061.5 1,339.3
Net assets 885.5 1,103.0
EQUITYContributed equity 16 1,119.7 1,117.2Reserves 17 9.4 32.2Accumulated losses 17 (243.6) (46.4)
Total equity 885.5 1,103.0
* Comparative balances have been restated to reflect the final purchase price accounting for the Sierra Rutile acquisition. Refer tonote 6 for details.
The above consolidated balance sheet should be read in conjunction with the accompanying notes.
77
Consolidated balance sheetAs at 31 December 2017
For
per
sona
l use
onl
y
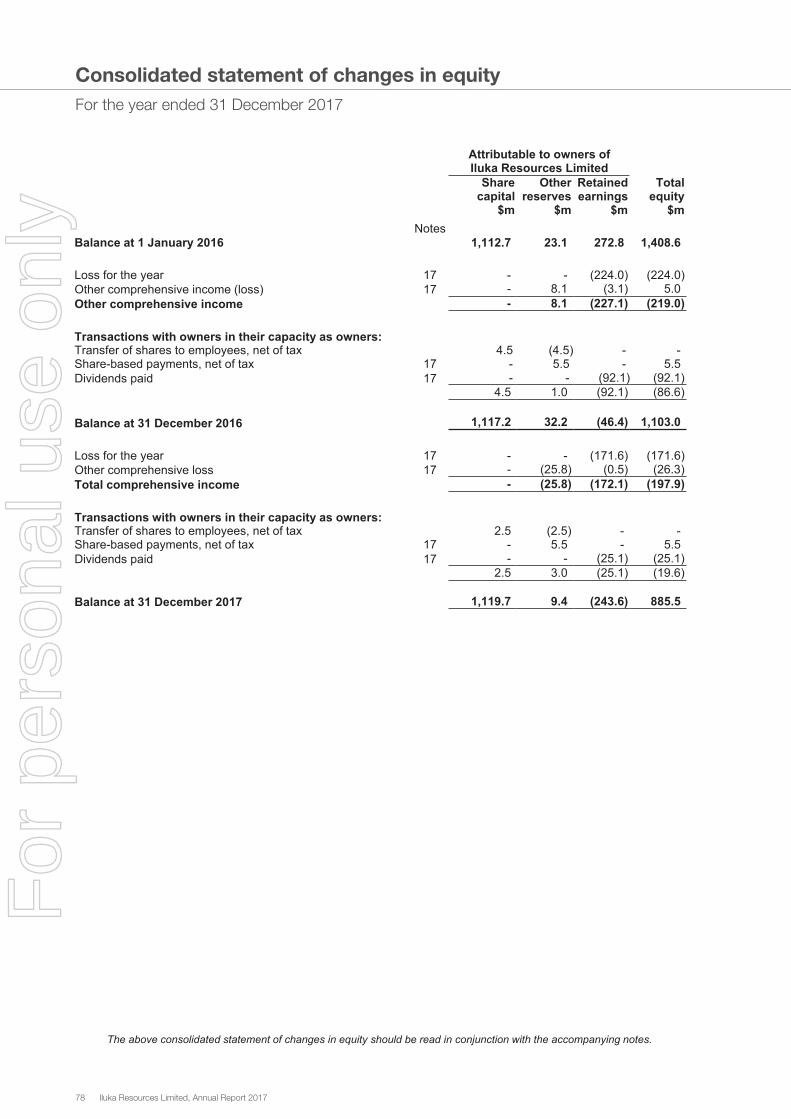
78 Iluka Resources Limited, Annual Report 2017
Iluka Resources LimitedConsolidated statement of changes in equityFor the year ended 31 December 2017
Attributable to owners ofIluka Resources Limited
Notes
Sharecapital
$m
Otherreserves
$m
Retainedearnings
$m
Totalequity
$m
Balance at 1 January 2016 1,112.7 23.1 272.8 1,408.6
Loss for the year 17 - - (224.0) (224.0)Other comprehensive income (loss) 17 - 8.1 (3.1) 5.0
Other comprehensive income - 8.1 (227.1) (219.0)
Transactions with owners in their capacity as owners:Transfer of shares to employees, net of tax 4.5 (4.5) - -Share-based payments, net of tax 17 - 5.5 - 5.5Dividends paid 17 - - (92.1) (92.1)
4.5 1.0 (92.1) (86.6)space
Balance at 31 December 2016 1,117.2 32.2 (46.4) 1,103.0
Loss for the year 17 - - (171.6) (171.6)Other comprehensive loss 17 - (25.8) (0.5) (26.3)
Total comprehensive income - (25.8) (172.1) (197.9)
Transactions with owners in their capacity as owners:Transfer of shares to employees, net of tax 2.5 (2.5) - -Share-based payments, net of tax 17 - 5.5 - 5.5Dividends paid 17 - - (25.1) (25.1)
2.5 3.0 (25.1) (19.6)spaceBalance at 31 December 2017 1,119.7 9.4 (243.6) 885.5
The above consolidated statement of changes in equity should be read in conjunction with the accompanying notes.
78
Consolidated statement of changes in equityFor the year ended 31 December 2017
For
per
sona
l use
onl
y

Iluka Resources Limited, Annual Report 2017 79
Iluka Resources LimitedConsolidated statement of cash flowsFor the year ended 31 December 2017
Notes2017
$m2016
$m
Cash flows from operating activitiesReceipts from customers 994.1 715.4Payments to suppliers and employees (602.4) (578.1)Operating cash flow 391.7 137.3.Interest received 0.7 0.7Interest paid (16.0) (14.7)Income taxes paid (10.0) (13.8)Exploration expenditure (12.6) (24.7)Mining Area C royalty receipts 59.9 43.6
Net cash inflow from operating activities 27 413.7 128.4
Cash flows from investing activitiesPayments for property, plant and equipment (90.5) (63.5)Sale of property, plant and equipment 3.6 1.4Purchase of shares in Metalysis Limited - (19.0)Sierra Rutile Ltd acquisition cost 6 - (375.4)Sri Lanka deposit - instalment payment 23(c) (2.6) -Payments for options contracts (2.3) -
Net cash outflow from investing activities (91.8) (456.5)
Cash flows from financing activitiesRepayment of borrowings (403.7) (210.1)Proceeds from borrowings 62.5 662.5Dividends paid 18 (25.1) (92.1)Debt refinance costs (1.4) (0.5)
Net cash (outflow) inflow from financing activities (367.7) 359.8
Net (decrease) increase in cash and cash equivalents (45.8) 31.7.Cash and cash equivalents at 1 January 101.3 55.0SRL cash acquired 6 - 13.9Effects of exchange rate changes on cash and cash equivalents (1.9) 0.7
Cash and cash equivalents at end of period 15 53.6 101.3
The above consolidated statement of cash flows should be read in conjunction with the accompanying notes.
79
Consolidated statement of cash flowsFor the year ended 31 December 2017
For
per
sona
l use
onl
y

80 Iluka Resources Limited, Annual Report 2017
Iluka Resources Limited31 December 2017
Contents of the notes to the financial statements
Page
Basis of preparation 811. Reporting entity 812. Basis of preparation 813. Critical accounting estimates and judgements 83
Key numbers 834. Segment information 845. Revenue 866. Business combination 877. Expenses 888. Impairment of assets 899. Provisions 91
10. Property, plant and equipment 9311. Income tax 9512. Deferred tax 9713. Receivables 9914. Inventories 100
Capital 10115. Net debt and finance costs 10116. Contributed equity 10217. Reserves and retained earnings 10318. Dividends 10419. Loss per share 105
Risk 10520. Financial risk management 10521. Hedging 108
Group structure 10922. Controlled entities 109
Other notes 11223. Contingent liabilities 11224. Commitments 11325. Remuneration of auditors 11426. Share-based payments 11527. Reconciliation of loss after income tax to net cash inflow from operating activities 11728. Retirement benefit obligations 11729. Key Management Personnel 11930. Parent entity financial information 11931. Related party transactions 12032. New accounting standards and interpretations 121
80
Notes to the financial statementsFor the year ended 31 December 2017
For
per
sona
l use
onl
y
Iluka Resources Limited, Annual Report 2017 81
Iluka Resources Limited31 December 2017
Notes to the financial statementsThe notes include information which is required to understand the financial statements and is material and relevantto the operations and the financial position and performance of the Iluka Group. Information is considered relevantand material if:
• The amount is significant due to its size or nature;• The amount is important in understanding the results of the Group;• It helps to explain the impact of significant changes in the Group's business; or• It relates to an aspect of the Group's operations that is important to its future performance.
Basis of preparationThis section of the financial report sets out the Group’s accounting policies that relate to the financial statements asa whole. This section also sets out information related to critical accounting estimates and judgements applied tothese financial statements.
1 Reporting entity
Iluka Resources Limited (Company or parent entity) is domiciled in Australia. The financial statements are for theGroup consisting of Iluka Resources Limited and its subsidiaries. A list of the Group's subsidiaries is provided innote 22.
2 Basis of preparation
These general purpose financial statements have been prepared in accordance with Australian AccountingStandards and Interpretations issued by the Australian Accounting Standards Board (AASB) and the CorporationsAct 2001. Iluka Resources Limited is a for-profit entity and is primarily involved in mineral sands exploration, projectdevelopment, mining operations, processing and marketing.
The consolidated financial statements of Iluka Resources Limited also comply with International Financial ReportingStandards (IFRS) as issued by the International Accounting Standards Board (IASB).
These financial statements have been prepared under the historical cost convention except for financial assets andliabilities which are required to be measured at fair value.
Iluka Resources Limited had to change some of its accounting policies as the result of new or revised accountingstandards which became effective for the annual reporting period commencing on 1 January 2017, which aredetailed in note 32.
New and amended standards adopted by the Group are disclosed in note 32.
(a) Principles of consolidation
(i) Subsidiaries
The consolidated financial statements incorporate the assets and liabilities of all subsidiaries of Iluka ResourcesLimited as at 31 December 2017 and the results of all subsidiaries for the year then ended. Iluka Resources Limitedand its subsidiaries together are referred to in this financial report as the Group. A list of controlled entities(subsidiaries) at year-end is contained in note 22.
The financial statements of subsidiaries are included in the consolidated financial statements from the date onwhich control commences until the date on which control ceases. Accounting policies of subsidiaries are changedwhere necessary to ensure consistency with the policies adopted by the Group.
Iluka Resources Limited acquired Sierra Rutile Limited ('SRL') on 7 December 2016. The results of SRL areincluded in the consolidated financial statements with the comparative figures representing the 24 days ofownership from 7 December 2016 to 31 December 2016.
Intercompany transactions and balances, and unrealised gains on transactions between Group companies, areeliminated. Unrealised losses are also eliminated unless the transaction provides evidence of the impairment of theasset transferred.
81
Notes to the financial statementsFor the year ended 31 December 2017
For
per
sona
l use
onl
y

82 Iluka Resources Limited, Annual Report 2017
Iluka Resources Limited31 December 2017
The Group accounts for business combinations using the acquisition method when control is transferred to theGroup. Cost is measured as the fair value of the assets given, shares issued or liabilities incurred or assumed at thedate of exchange. Transaction costs are expensed as incurred, except if related to the issue of debt or equitysecurities.
(ii) Associates
Associates are all entities over which the Group has significant influence but not control or joint control. This isgenerally the case where the Group holds between 20% and 50% of the voting rights. Investments in associates areaccounted for using the equity method of accounting from the date on which the investee becomes an associate.
Under the equity method of accounting, the investments are initially recognised at cost and adjusted thereafter torecognise the Group's share of the post-acquisition profits or losses of the investee in profit or loss, and the Group'sshare of movements in other comprehensive income of the investee in other comprehensive income. Dividendsreceived or receivable from associates are recognised as a reduction in the carrying amount of the investment.
The carrying amount of equity-accounted investments is tested for impairment in accordance with the policydescribed in note 8.
(iii) Employee Share Trust
The Group's Employee Share Schemes are administered through the Iluka Director’s Executives and EmployeesShare Acquisition Trust (the trust). This trust is consolidated, as the substance of the relationship is that the trust iscontrolled by the Group. Shares in the Company held by the trust are disclosed as treasury shares in theconsolidated financial statements and deducted from contributed equity, net of tax.
(b) Foreign currency translation
The consolidated financial statements are presented in Australian dollars, which is the Company's functional andpresentation currency.
Where Group companies based in Australia transact in foreign currencies, these transactions are translated intoAustralian dollars using the exchange rate on that day. Foreign currency monetary assets and liabilities aretranslated to Australian dollars at each reporting date exchange rate. Non-monetary assets and liabilities that aremeasured at fair value in a foreign currency are translated to Australian dollars at the exchange rate when the fairvalue was determined. Foreign currency differences are generally recognised in profit or loss. Non-monetary itemsthat are measured based on historical cost in a foreign currency are not re-translated.
The financial position of foreign operations is translated into Australian dollars at the exchange rates at the reportingdate. The income and expenses of foreign operations are translated into Australian dollars at average exchangerates each month. Foreign currency differences are recognised in other comprehensive income and accumulated inthe foreign currency translation reserve.
The Group had US dollar denominated borrowings that were used to hedge against translation differences arisingfrom assets held by the Group's SRL operations (see note 21 for more information).
To the extent that these borrowings did not exceed the net assets of these operations, foreign currency differencesarising on the translation of these borrowings were recognised in other comprehensive income and accumulated inthe foreign currency translation reserve. Any remaining differences were recognised in profit or loss. If theseoperations were to be disposed of (in full or in part), the relevant amount in the foreign currency translation reservewould be transferred to profit or loss as part of the gain or loss on disposal.
(c) Rounding of amounts
The Company is of a kind referred to in Rounding Instrument 2016/191, issued by the Australian Securities andInvestments Commission, relating to the "rounding off" of amounts in the financial statements. Amounts in thefinancial statements have been rounded off in accordance with that Rounding Instrument to the nearest hundredthousand dollars, or in certain cases, the nearest thousand dollars and the nearest dollar.
82
Notes to the financial statementsFor the year ended 31 December 2017
For
per
sona
l use
onl
y

Iluka Resources Limited, Annual Report 2017 83
Iluka Resources Limited31 December 2017
3 Critical accounting estimates and judgements
The Group makes estimates and assumptions concerning the future in applying its accounting policies. Theresulting accounting estimates will, by definition, seldom equal the related actual results. The estimates andassumptions that have a significant risk of causing a material adjustment to the carrying amounts of assets andliabilities within the next financial year are noted below.
Estimates and underlying assumptions are reviewed on an ongoing basis, with revisions recognised in the period inwhich the estimates are revised and future periods affected.
Estimates and assumptions which are material to the financial report are found in the following notes:
Impairment of assets Note 8Rehabilitation and mine closure provisions Note 9Net realisable value and classification of product inventory Note 14SRL acquisition purchase price allocation Note 6Deferred tax asset recognition Note 12Tax balances Note 11
Key numbersSignificant items in the current reporting period
Impairments
During the year, Iluka recorded impairment charges of $185.3 million primarily in relation to the reconfiguration of itsmineral separation processing activities in Australia. Iluka placed the Hamilton mineral separation plant (MSP) oncare and maintenance effective from October 2017 and consolidated all Australian mineral separation activities intothe Narngulu MSP in Western Australia. This resulted in a full impairment charge of $151.4 million against theHamilton MSP.
In addition, Iluka fully impaired its investment in its associate, Metalysis Limited, with an impairment charge of $30.4million recorded during the year.
Further details are provided in note 8.
Sierra Rutile acquisition
In December 2016, Iluka acquired 100% of Sierra Rutile Limited for £215.3 million (A$375.4 million). Sierra Rutile isa mineral sands mining and processing operation based in Sierra Leone.
As at 31 December 2016, the acquisition accounting balances recognised were provisional due to ongoing workfinalising assessment of rehabilitation obligations and tax-related matters. The accounting balances have now beenfinalised, with an increase of $44.6 million to the rehabilitation provision, an increase of $22.0 million to the deferredtax asset and an increase of $23.3 million to mine reserves. The final accounting balances are detailed in note 6.
Rehabilitation provisions
Iluka notes that detailed rehabilitation planning for the Virginia operation identified potential additional obligationsrelating to past rehabilitation; and various remediation alternatives were being considered. The provision forrehabilitation and restoration for the closed US operations has increased by $119.5 million ($US90 million) duringthe year. The cost of rehabilitating the Virginia operation will largely depend on the rehabilitation programmeultimately undertaken by Iluka, which can only be determined following what is expected to be extensive andongoing engagement with the regulators. As the nature and extent of any change remains highly uncertain, theprovision increase has been calculated on a probabilistic basis across a range of scenarios.
Hedging
During the year Iluka entered into both forward foreign exchange and foreign exchange collar contracts to assistwith managing the foreign currency exposure to projects with USD sales contracts. Further details on the financialrisk management and hedging contracts are contained in notes 20 and 21.
83
Notes to the financial statementsFor the year ended 31 December 2017
For
per
sona
l use
onl
y

84 Iluka Resources Limited, Annual Report 2017
Iluka Resources Limited31 December 2017
4 Segment information
(a) Description of segments
The Group has identified its operating segments based on the internal reports that are reviewed and used by theexecutive management team (the chief operating decision-makers) in assessing performance and in determiningthe allocation of resources.
Where finished product capable of sale to a third party is transferred between operating segments, the transfers aremade at arm's length prices. Any transfers of intermediate products between operating segments are made at cost.
Cash, debt and tax balances are managed at a group level together with exploration and other corporate activitiesand are not allocated to segments.
The segments are unchanged from those reported at 31 December 2016.
Australia (AUS) comprises the integrated mineral sands mining and processing operations in Victoria, WesternAustralia and South Australia. The processing activities in Western Australia also include the Group’s syntheticrutile kilns. The Hamilton mineral separation plant in Victoria was idled in October 2017, Jacinth-Ambrosiaoperations were idled in April 2016 and recommenced in December 2017.
Sierra Rutile (SRL) comprises the integrated mineral sands mining and processing operations in Sierra Leone.
United States (US) comprises rehabilitation obligations in both Virginia and Florida. Mining and processingactivities were substantially ceased in Virginia in December 2015.
Mining Area C (MAC) comprises a deferred consideration iron ore royalty interest over certain mining tenements inAustralia operated by BHP Billiton Iron Ore.
(b) Segment information
2017 AUS US SRL MAC Total$m $m $m $m $m
Total segment sales to external customers 833.7 40.0 143.8 - 1,017.5Total segment result** 43.2 (126.3) (2.5) 59.2 (26.4)Impairment of assets 155.0 - - - 155.0Depreciation and amortisation expense 67.7 - 39.4 0.4 107.5Rehabilitation and holding costs for closed sites 7.9 119.5 - - 127.4Segment assets 1,073.3 73.2 487.9 18.1 1,652.5Segment liabilities 458.5 225.9 108.5 - 792.9
Additions to non-current segment assets 49.7 - 58.1 - 107.8
2016* AUS US SRL MAC Total$m $m $m $m $m
Total segment sales to external customers 690.2 18.3 17.8 - 726.3Total segment result** (63.5) (77.2) (0.9) 47.1 (94.5)Impairment of assets 201.0 - - - 201.0Depreciation and amortisation expense 74.3 - 2.0 0.4 76.7Rehabilitation and holding costs for closed sites 1.7 40.9 - - 42.6Segment assets 1,478.6 103.6 485.0 18.8 2,086.0Segment liabilities 448.2 127.6 116.5 - 692.3
Additions to non-current segment assets 39.4 9.8 2.3 - 51.5
* Comparative balances have been restated to reflect the final purchase price accounting for the Sierra Rutileacquisition. Refer to note 6 for details.
** Total segment result includes the impairment charge, depreciation and amortisation expenses and rehabilitationand holding costs for closed sites that are also separately reported above.
84
Notes to the financial statementsFor the year ended 31 December 2017
For
per
sona
l use
onl
y

Iluka Resources Limited, Annual Report 2017 85
Iluka Resources Limited31 December 2017
Revenue is derived from sales to external customers domiciled in various geographical regions. Details of segmentrevenue by location of customers are as follows:
2017$m
2016$m
China 333.6 252.4Asia excluding China 138.2 61.5Europe 267.9 232.0Americas 132.5 65.8Other countries 145.3 114.6
Sale of goods 1,017.5 726.3
Revenue of $147.0 million and $121.5 million was derived from two external customers of the mineral sandssegments, which individually account for greater than 10 per cent of the total segment revenue (2016: revenues of$175.1 million and $84.1 million from two external customers).
Segment result is reconciled to the loss before income tax as follows:
2017$m
2016$m
Segment result (26.4) (94.5)Interest income 0.7 0.6Asset sales and other income (0.8) 0.6Other expenses (0.7) -Marketing and selling (11.3) (16.7)Corporate and other costs (47.1) (53.8)Depreciation (3.5) (3.2)Resource development (24.6) (79.4)Interest and finance charges (18.8) (18.8)Net foreign exchange gains 0.6 4.9Impairments (Metalysis) (30.4) -SRL transaction costs - (14.1)Metalysis losses (3.3) (3.3)
Loss before income tax (165.6) (277.7)
Total segment assets and total segment liabilities are reconciled to the balance sheet as follows:
Segment assets 1,652.5 2,086.0Corporate assets 35.0 34.4Cash and cash equivalents 53.6 101.3Current tax receivable 20.0 12.4Deferred tax assets 185.9 208.2
Total assets as per the balance sheet 1,947.0 2,442.3
Segment liabilities 792.9 692.3Corporate liabilities 28.7 39.4Current tax payable 3.8 -Interest-bearing liabilities 236.1 607.6
Total liabilities as per the balance sheet 1,061.5 1,339.3
85
Notes to the financial statementsFor the year ended 31 December 2017
For
per
sona
l use
onl
y

86 Iluka Resources Limited, Annual Report 2017
Iluka Resources Limited31 December 2017
5 Revenue
2017$m
2016$m
Sales revenueSale of mineral sands 1,017.5 726.3
Other revenueMining Area C royalty income 59.6 47.5Interest 0.7 0.6
60.3 48.1
1,077.8 774.4
(a) Sale of mineral sands
Revenue is measured at the fair value of the consideration received or receivable, net of rebates, salescommissions, duties and other taxes.
The Group sells mineral sands under a range of commercial terms. Sales are recognised as revenue when theGroup has transferred both the significant risks and rewards of ownership, and the amount of revenue can bemeasured reliably. The passing of risk to the customer occurs when the product has been dispatched to thecustomer and is no longer under the physical control of the Group, or when the customer has formallyacknowledged its legal ownership of the product including all inherent risks. Where the sold product continues to bestored in facilities the Group controls, it is clearly identified and available to the buyer.
(b) Mining Area C royalty income and amortisation of royalty asset
Iluka holds a royalty stream over BHP’s Mining Area C (MAC) iron ore mine. The royalty stream is paid as 1.232%of Australian denominated revenue from the royalty area and a one-off payment of $1 million per million tonneincrease in annual production capacity.
Royalty income is recognised on an accrual basis and is received on a quarterly basis in arrears.
The royalty entitlement asset is an intangible asset and is amortised on a straight-line basis ($0.4 million per year)over its estimated useful life of 25 years, of which 11 years is remaining (2016: 12 years remaining). The carryingvalue of the asset at 31 December 2017 is $4.3 million (2016: $4.7 million).
(c) Interest income
Interest income is recognised in profit or loss as it accrues, using the effective interest method.
86
Notes to the financial statementsFor the year ended 31 December 2017
For
per
sona
l use
onl
y

Iluka Resources Limited, Annual Report 2017 87
Iluka Resources Limited31 December 2017
6 Business combination
On 7 December 2016, Iluka completed the acquisition of Sierra Rutile Limited (‘SRL’) by means of a statutorymerger of SRL with Iluka Investments Limited (BVI), a wholly owned Iluka subsidiary. Iluka Investments (BVI)Limited acquired 100 per cent of the issued share capital of SRL for 36 British pence cash per share, totalling£215.3 million (A$375.4 million).
At 31 December 2016, the acquisition accounting balances recognised were provisional due to ongoing workfinalising asset valuations, provision balances and tax related matters. The acquisition accounting for thistransaction has now been finalised.
Comparative financial information has been restated to reflect the finalisation of the acquisition accounting. Therewas no impact to the Group's profit or loss as a result of these changes. The following table summarises thechanges made to the provisional acquisition accounting:
Fair valuerecognised on
acquisition(Final)A$m
Fair valuerecognised on
acquisition(Provisional)
A$m
AssetsCash and cash equivalents 13.9 13.9Receivables 17.1 17.1Inventories 41.4 41.4Property, plant and equipment 373.5 350.2Deferred tax assets 144.0 122.0
Total assets 589.9 544.6
LiabilitiesPayables (32.8) (32.1)Current tax payable (4.0) (4.0)Interest-bearing liabilities (93.5) (93.5)Provisions (84.2) (39.6)
Total liabilities 214.5 169.2
Net assets acquired 375.4 375.4space
Key estimate: SRL purchase price allocation
Business combinations (acquisitions of subsidiaries) are accounted for using the acquisition method. Theconsideration transferred for the acquisition of a subsidiary comprises the fair value of the assets transferred,liabilities assumed and the equity interests issued by the Group.
Identifiable assets acquired and liabilities and contingent liabilities assumed in a business combination are, withlimited exceptions, measured initially at their fair values at the acquisition date. The financial assets and liabilitiesacquired are assessed for appropriate classification and designation in accordance with the contractual terms,economic conditions, the Group’s accounting policies and other pertinent conditions as at the acquisition date.Under the acquisition method, the Group had up to 12 months post the acquisition date to finalise the fair value ofidentifiable assets and liabilities, this is now finalised. This 12 month period expired on 7 December 2017.
Acquisition-related costs are expensed as incurred.
87
Notes to the financial statementsFor the year ended 31 December 2017
For
per
sona
l use
onl
y

88 Iluka Resources Limited, Annual Report 2017
Iluka Resources Limited31 December 2017
7 Expenses
Notes2017
$m2016
$m
ExpensesCash costs of production 7(a) 362.2 252.3Depreciation and amortisation 90.5 71.3Inventory movement - cash costs of production 141.5 107.6Inventory movement - non-cash production costs 66.8 57.3Cost of goods sold 7(b) 661.0 488.5
Ilmenite concentrate and by-product costs 7(c) 10.2 8.3Depreciation (idle, corporate and other) 20.5 8.6Restructure and idle capacity charges 7(d) 73.3 69.5Rehabilitation costs for closed sites 7(e) 127.4 42.6Impairment of assets 8 185.3 201.0Transaction costs - 14.1Government royalties 25.2 20.4Marketing and selling costs 33.8 36.3Corporate and other costs 47.1 53.8Resource development costs 24.6 79.4Net loss on disposal of property, plant and equipment 0.9 1.2
1,209.3 1,023.7
(1,395.2) (1,219.6)(a) Cash costs of production
Cash costs of production include costs for mining and concentrating; transport of heavy mineral concentrate;mineral separation; synthetic rutile production; externally purchased ilmenite and production overheads. Thiscategory also includes landowner royalty payments, but excludes Australian state and Sierra Leone governmentroyalties which are reported separately.
(b) Cost of goods sold
Cost of goods sold is the inventory value of each tonne of finished product sold. All production is added to inventoryat cost, which includes direct costs and an appropriate portion of fixed and variable overhead expenditure, includingdepreciation and amortisation, allocated on the basis of relative sales value. The inventory value recognised as costof goods sold for each tonne of finished product sold is the weighted average value per tonne for the stockpile fromwhich the product is sold.
Inventory movement represents the movement in balance sheet inventory of work in progress and finished goods,including the non-cash depreciation and amortisation components and movement in the net realisable valueadjustments.
(c) Ilmenite concentrate and by-product costs
Ilmenite and by-product costs include by-product costs such as for iron concentrate processing, activated carbonand wet high intensity magnetic separation (WHIMS) ilmenite transport costs.
88
Notes to the financial statementsFor the year ended 31 December 2017
For
per
sona
l use
onl
y
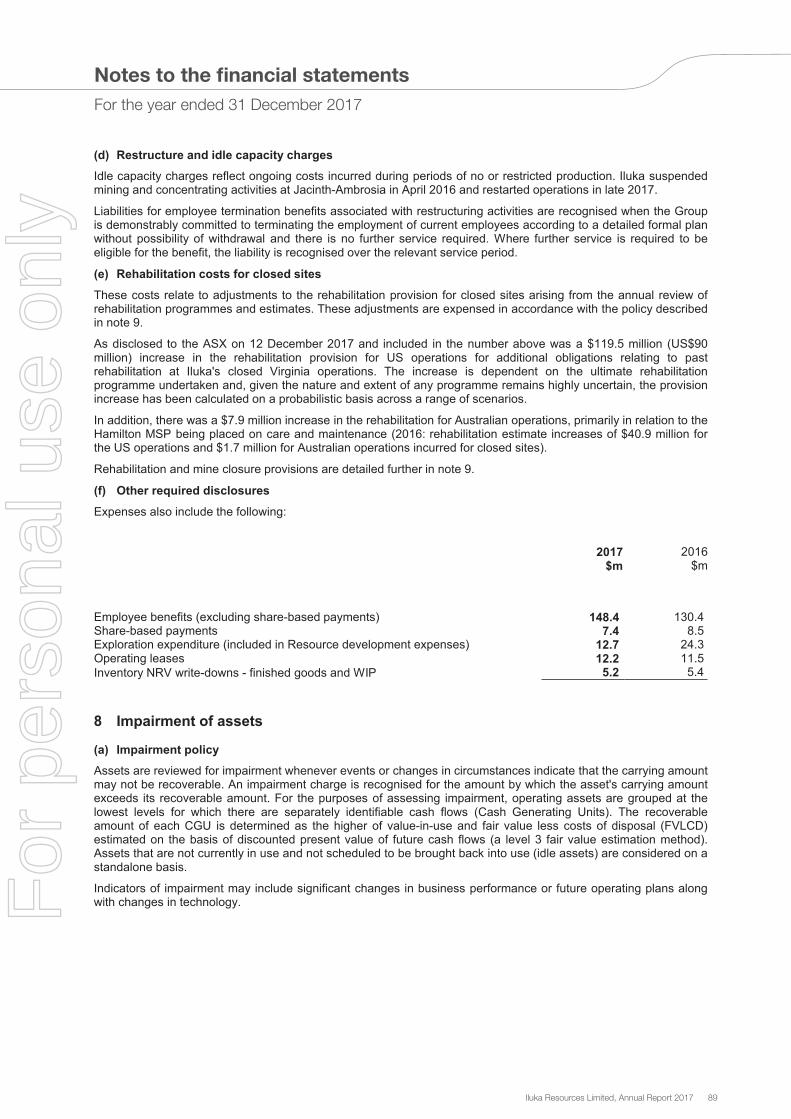
Iluka Resources Limited, Annual Report 2017 89
Iluka Resources Limited31 December 2017
(d) Restructure and idle capacity charges
Idle capacity charges reflect ongoing costs incurred during periods of no or restricted production. Iluka suspendedmining and concentrating activities at Jacinth-Ambrosia in April 2016 and restarted operations in late 2017.
Liabilities for employee termination benefits associated with restructuring activities are recognised when the Groupis demonstrably committed to terminating the employment of current employees according to a detailed formal planwithout possibility of withdrawal and there is no further service required. Where further service is required to beeligible for the benefit, the liability is recognised over the relevant service period.
(e) Rehabilitation costs for closed sites
These costs relate to adjustments to the rehabilitation provision for closed sites arising from the annual review ofrehabilitation programmes and estimates. These adjustments are expensed in accordance with the policy describedin note 9.
As disclosed to the ASX on 12 December 2017 and included in the number above was a $119.5 million (US$90million) increase in the rehabilitation provision for US operations for additional obligations relating to pastrehabilitation at Iluka's closed Virginia operations. The increase is dependent on the ultimate rehabilitationprogramme undertaken and, given the nature and extent of any programme remains highly uncertain, the provisionincrease has been calculated on a probabilistic basis across a range of scenarios.
In addition, there was a $7.9 million increase in the rehabilitation for Australian operations, primarily in relation to theHamilton MSP being placed on care and maintenance (2016: rehabilitation estimate increases of $40.9 million forthe US operations and $1.7 million for Australian operations incurred for closed sites).
Rehabilitation and mine closure provisions are detailed further in note 9.
(f) Other required disclosures
Expenses also include the following:
2017$m
2016$m
Employee benefits (excluding share-based payments) 148.4 130.4Share-based payments 7.4 8.5Exploration expenditure (included in Resource development expenses) 12.7 24.3Operating leases 12.2 11.5Inventory NRV write-downs - finished goods and WIP 5.2 5.4
(185.9) (180.1)
8 Impairment of assets
(a) Impairment policy
Assets are reviewed for impairment whenever events or changes in circumstances indicate that the carrying amountmay not be recoverable. An impairment charge is recognised for the amount by which the asset's carrying amountexceeds its recoverable amount. For the purposes of assessing impairment, operating assets are grouped at thelowest levels for which there are separately identifiable cash flows (Cash Generating Units). The recoverableamount of each CGU is determined as the higher of value-in-use and fair value less costs of disposal (FVLCD)estimated on the basis of discounted present value of future cash flows (a level 3 fair value estimation method).Assets that are not currently in use and not scheduled to be brought back into use (idle assets) are considered on astandalone basis.
Indicators of impairment may include significant changes in business performance or future operating plans alongwith changes in technology.
89
Notes to the financial statementsFor the year ended 31 December 2017
For
per
sona
l use
onl
y

90 Iluka Resources Limited, Annual Report 2017
Iluka Resources Limited31 December 2017
Key estimate: Recoverable amount calculation
The estimates of discounted future cash flows for each CGU are based on significant assumptions including:
• estimates of the quantities of mineral reserves and ore resources for which there is a high degree of confidence ofeconomic extraction and the timing of access to these reserves and ore resources;• future production levels and the ability to sell that production;• future product prices based on the Group’s assessment of short and long-term prices for each of the key products;• future exchange rates for the Australian dollar compared to the US dollar using external forecasts by recognisedeconomic forecasters;• successful development and operation of new mines, consistent with latest forecasts;• future cash costs of production, sustaining capital expenditure, rehabilitation and mine closure; and• the asset specific discount rate applicable to the CGU.
Given the nature of the Group’s mining activities, future changes in assumptions upon which these estimates arebased may give rise to material adjustments in future periods. This could lead to a reversal of part, or all, ofimpairment charges recorded in the current or prior years, or the recognition of new impairment charges in thefuture.
(b) Recognised impairment
Iluka identified the following assets for which an impairment charge has been recognised during 2017:
(i) Hamilton MSP
Iluka refined its operational profile during the year and placed the Hamilton MSP on care and maintenance inOctober 2017. Iluka determined that it has sufficient processing capacity at its main mineral separation plant inNarngulu, Western Australia to accommodate future processing from the Australian mines. Hamilton MSP waspreviously considered able to be utilised to process HMC produced at Balranald, however with a staged approachnow considered likely for any future Balranald development, annual production volumes are likely to be lower thanhad previously been envisaged. While it is possible that the Hamilton MSP may be utilised in the future to treatHMC produced from the Murray Basin by Iluka or others, there is insufficient certainty at this time to justify carryingthe book value. This resulted in an impairment charge of $151.4 million. The recoverable amount was determinedas $nil based on its FVLCD at the time of impairment.
The fair value measurement is categorised as fair value based on the inputs in the valuation technique that are notbased on observable market data. In determining the FVLCD a nominal discount rate of 10 per cent was applied tothe cash flows expressed in nominal terms. The key assumptions used for commodity prices are broadlycomparable to independent industry forecasts, and foreign exchange and inflation rates are aligned with currenteconomic forecast rates.
(ii) Metalysis
As at 31 December 2017 Iluka held a 27.8% share of Metalysis Limited, which is an unlisted UK-based technologycompany focused on the development and commercialisation of solid state production of metal powder to titaniumalloys. Metalysis is accounted for as an investment in an associate resulting in losses of $3.3 million (2016: $3.3million) recorded as the Group’s share of the losses. In December 2017 the remaining carrying value of theinvestment was impaired to $nil, based on management’s assessment of the fair value of the investment whichresulted in an impairment charge of $30.4 million.
(iii) Australian land
Iluka holds land and buildings which relate to past, present and future operations. A review of land assets inAustralia highlighted some parcels of land where the current FVLCD is expected to be less than the carrying values.An impairment charge of $3.6 million was recognised to bring these land parcels to FVLCD.
90
Notes to the financial statementsFor the year ended 31 December 2017
For
per
sona
l use
onl
y

Iluka Resources Limited, Annual Report 2017 91
Iluka Resources Limited31 December 2017
(c) Previously recognised impairment
Iluka recorded an impairment charge of $201.0 million for the year ended 31 December 2016. The impairmentcharge related to the following standalone assets:
(i) Murray Basin property, plant and equipment
Idle and surplus equipment in the Murray Basin of $155.5 million, including the Douglas and Woornack, Rownack,Pirro (WRP) mining units and wet concentrators. The recoverable amount was determined as $nil based on itsFVLCD at the time of impairment.
(ii) Balranald conventional mine development costs
In the Murray Basin, Iluka is continuing with trialling and evaluating an unconventional, underground miningapproach for Balranald following the cessation of work associated with the conventional mine development. As aconsequence, $20 million of capitalised costs associated with feasibility work for the conventional method wereimpaired. The recoverable amount was determined as $nil based on its FVLCD at the time of impairment.
(iii) Exploration and evaluation assets and mine reserves
$25 million related to exploration and evaluation assets previously capitalised, as well as mine reserves in the Perthand Murray Basins were impaired. The recoverable amount was determined as $nil based on its FVLCD at the timeof impairment.
9 Provisions
Notes2017
$m2016*
$m
CurrentRehabilitation and mine closure 9(a) 69.8 30.1Employee benefits - long service leave 9(b) 10.4 10.9Workers compensation and other provisions 3.6 3.3
83.8 44.3
Non-currentRehabilitation and mine closure 9(a) 599.4 544.0Employee benefits - long service leave 9(b) 3.0 3.3Retirement benefit obligations 28 14.8 14.7Other provisions 3.0 1.6
620.2 563.6
* Comparative balances have been restated to reflect the final purchase price accounting for the Sierra Rutileacquisition. Refer to note 6 for details.
Provisions are recognised when the Group has a present obligation (legal or constructive) as a result of a pastevent, it is probable that resources will be expended to settle the obligation and a reliable estimate can be made ofthe amount of the obligation.
Key estimate: Discount rate for provisions
Provisions are determined by discounting the expected future cash flows at a pre-tax rate that reflects currentmarket assessments of the time value of money and the risks specific to the liability to the extent they are notincluded in the cash flows.
Rehabilitation and mine closure provisions have been calculated using discount rates of between 2 and 4 per cent(2016: 2 and 4 per cent).
91
Notes to the financial statementsFor the year ended 31 December 2017
For
per
sona
l use
onl
y

92 Iluka Resources Limited, Annual Report 2017
Iluka Resources Limited31 December 2017
(a) Rehabilitation and mine closure
The movements in the rehabilitation and mine closure provision are set out below:
Notes $m
Movements in rehabilitation and mine closure provisionsBalance at 1 January 2017 574.1Change in provisions - charge for closed sites 7 127.4Change in provision - additions to property, plant and equipment 10 4.7Foreign exchange rate movements (13.5)Rehabilitation and mine closure provision discount unwind 15(d) 14.1Amounts spent during the year (37.6)
Balance at 31 December 2017 669.2
Key estimate: Rehabilitation and mine closure provisions
The Group’s assessment of the present value of the rehabilitation and mine closure provisions requires the use ofsignificant estimates and judgements, including the future cost of performing the work required, timing of the cashflows, discount rates, final remediation strategy and future land use requirements. The provision can also beimpacted prospectively by changes to legislation or regulations.
The provisions are reassessed at least annually. A change in any of the assumptions used to determine theprovisions could have a material impact on the carrying value of the provision. In the case of provisions for assetswhich remain in use, adjustments to the carrying value of the provision are offset by a change in the carrying valueof the related asset. Where the provisions are for assets no longer in use, such as mines and processing sites thathave been closed, any adjustment is reflected directly in profit or loss.
The Group has obligations to dismantle and remove certain items of property, plant and equipment and to restoreand rehabilitate the land on which they sit.
A provision is raised for the estimated cost of settling the rehabilitation and restoration obligations existing atbalance date, discounted to present value using an appropriate pre-tax discount rate.
Where the obligation is related to an item of property, plant and equipment, its cost includes the present value of theestimated costs of dismantling and removing the asset and restoring the site on which it is located. Costs that relateto obligations arising from waste created by the production process are recognised as production costs in the periodin which they arise.
The increase in the provision associated with unwinding of the discount rate is recognised as a finance cost.
The total rehabilitation and mine closure provision of $669.2 million (2016: $528.1 million) includes $493.8 million(2016: $374.5 million) for assets no longer in use. Changes to the provisions for assets no longer in use arecharged/credited directly to profit or loss. A review of cost estimates resulted in a charge of $127.4 million (2016:charge of $42.6 million) which is reported within the expense item Rehabilitation costs for closed sites in note 7.
(b) Employee benefits
The employee benefits provision relates to long service leave entitlements measured as the present value ofexpected future payments to be made in respect of services provided by employees up to the reporting date,discounted using market yields at the reporting date on corporate bonds with terms to maturity and currency thatmatch, as closely as possible, the estimated future cash outflows. Liabilities for annual leave are included inpayables.
The current provision represents amounts for vested long service leave for which the Group does not have anunconditional right to defer settlement, regardless of when the actual settlement is expected to occur. However,based on past experience, the Group does not expect all employees to take the full amount of accrued leave orrequire payment within the next 12 months.
92
Notes to the financial statementsFor the year ended 31 December 2017
For
per
sona
l use
onl
y

Iluka Resources Limited, Annual Report 2017 93
Iluka Resources Limited31 December 2017
10 Property, plant and equipment
Land &buildings
$m
Plant,machinery
&equipment
$m
Minereserves &development
$m
Exploration&
evaluation$m
Total$m
At 1 January 2016Cost 162.5 2,001.2 961.0 43.6 3,168.3Accumulated depreciation* (40.7) (1,307.4) (748.4) (2.0) (2,098.5)Opening written down value 121.8 693.8 212.6 41.6 1,069.8
Additions 15.8 8.1 28.3 - 52.2SRL acquisition** 32.8 152.1 184.6 4.7 374.2Disposals (1.5) (0.6) - (0.3) (2.4)Depreciation and amortisation (2.5) (62.1) (14.8) - (79.4)Exchange differences 0.9 1.4 2.8 (0.3) 4.8Impairment of assets (1.3) (154.1) (30.7) (14.9) (201.0)
Closing written down value 166.0 638.6 382.8 30.8 1,218.2
At 31 December 2016**Cost 209.3 2,030.4 943.0 47.8 3,230.5Accumulated depreciation* (43.3) (1,391.8) (560.2) (17.0) (2,012.3)Closing written down value 166.0 638.6 382.8 30.8 1,218.2PlantYear ended 31 December 2017Additions 6.6 71.6 31.9 3.3 113.4Disposals - (3.8) - - (3.8)Depreciation and amortisation (3.7) (77.0) (29.9) - (110.6)Exchange differences (5.7) (14.9) (14.6) 2.8 (32.4)Transfers - (4.3) 19.3 (15.0) -Impairment of assets (7.2) (147.8) - - (155.0)
Closing written down value 156.0 462.4 389.5 21.9 1,029.8PlantAt 31 December 2017Cost 230.1 2,252.2 1,049.0 38.9 3,570.2Accumulated depreciation* (74.1) (1,789.8) (659.5) (17.0) (2,540.4)
Closing written down value 156.0 462.4 389.5 21.9 1,029.8
* Accumulated depreciation includes cumulative impairment charges.
** Comparative balances have been restated to reflect the final purchase price accounting for the Sierra Rutileacquisition. Refer to note 6 for details.
(a) Property, plant and equipment
Property, plant and equipment is stated at cost, less accumulated depreciation and impairment charges. Costincludes:
• expenditure that is directly attributable to the acquisition of the items;• direct costs associated with the commissioning of plant and equipment, including pre-commissioning costs in
testing the processing plant;• if the asset is constructed by the Group, the cost of all materials used in construction, direct labour on the
project, project management costs and unavoidable borrowing costs incurred during construction of assets witha construction period greater than 12 months and an appropriate proportion of variable and fixed overheads;and
• the present value of the estimated costs of dismantling and removing the asset and restoring the site on which itis located.
93
Notes to the financial statementsFor the year ended 31 December 2017
For
per
sona
l use
onl
y

94 Iluka Resources Limited, Annual Report 2017
Iluka Resources Limited31 December 2017
As set out in note 9, in the case of rehabilitation provisions for assets which remain in use, adjustments to thecarrying value of the provision are offset by a change in the carrying value of the related asset. Total additions in theyear include $4.7 million (2016: $2.2 million) related to changes in the rehabilitation provision (refer note 9).
(b) Maintenance and repairs
Certain items of plant used in the primary extraction, separation and secondary processing of extracted mineralsare subject to a major overhaul on a cyclical basis. Costs incurred during such overhauls are characterised as eithercapital in nature or repairs and maintenance. Work performed may involve:
(i) the replacement of a discrete sub-component asset, in which case an asset addition is recognised and the bookvalue of the replaced item is written off; and
(ii) demonstrably extending the useful life or functionality of an existing asset, in which case the relevant cost isadded to the capitalised cost of the asset in question.
Costs incurred during a major cyclical overhaul which do not constitute (i) or (ii) above, are written off as repairs andmaintenance as incurred. General repairs and maintenance which are not characterised as part of a major cyclicaloverhaul are expensed as incurred.
(c) Depreciation and amortisation
Items of property, plant and equipment are depreciated on a straight-line basis over their useful lives. The estimateduseful life of buildings is the shorter of applicable mine life or 25 years; plant and equipment is between 3 and 20years. Land is not depreciated.
Expenditure on mine reserves and development is amortised over the life of mine, based on the rate of depletion ofthe economically recoverable reserves (units of production methodology). If production has not yet commenced, orthe mine is idle, amortisation is not charged.
(i) Change in estimate of depreciation method effective 1 January 2017
The depreciation method for mine specific plant was revised effective 1 January 2017 from the units of productionmethod, to the straight line method, to more appropriately match depreciation charges with the expected pattern ofconsumption of economic benefit of the asset (three to 20 years). This change in method impacts depreciation onidle assets and reflects the expected duration of use and physical deterioration of assets and the impact of futuretechnical or commercial obsolescence.
(d) Assets not being depreciated
Included in plant, machinery and equipment, mine reserves and development, and land and buildings are amountstotalling $46.6 million, $5.4 million and $0.2 million respectively (2016: $2.6 million, $2.2 million and $0.6 millionrespectively) relating to assets under construction which are currently not being depreciated as the assets are notready for use.
In addition, within property, plant and equipment, excluding exploration and land assets, are amounts totalling$196.8 million which have not been depreciated in the year as mining of the related area of interest has not yetcommenced (2016: $331.2 million). Idle plant, machinery and equipment of $145.1 million at 31 December 2016recommenced depreciating from 1 January 2017 per the depreciation method change from units of production tostraight line noted above.
(e) Exploration, evaluation and development expenditure
Exploration and evaluation expenditure is accumulated separately for each area of interest. Such expenditurecomprises net direct costs and an appropriate portion of related overhead expenditure. Expenditure is carriedforward when incurred in areas for which the Group has rights of tenure and where economic mineralisation isindicated, but activities have not yet reached a stage which permits a reasonable assessment of the existence orotherwise of economically recoverable ore reserves, and active and significant operations in relation to the area arecontinuing. Each such project is regularly reviewed. If the project is abandoned or if it is considered unlikely theproject will proceed to development, accumulated costs to that point are written off immediately.
Each area of interest is limited to a size related to a known mineral resource capable of supporting a miningoperation. Identifiable exploration assets acquired from another mining company are recognised as assets at theircost of acquisition.
94
Notes to the financial statementsFor the year ended 31 December 2017
For
per
sona
l use
onl
y

Iluka Resources Limited, Annual Report 2017 95
Iluka Resources Limited31 December 2017
Projects are advanced to development status when it is expected that accumulated and future expenditure ondevelopment can be recouped through project development or sale. Capitalised exploration is transferred to MineReserves once the related ore body achieved JORC reserve status (reported in accordance with JORC, 2012) andhas been included in the life of mine plan.
All of the above expenditure is carried forward up to commencement of operations at which time it is amortised inaccordance with the reserves and development depreciation policy noted in (c) above.
(f) Impairment of PPE
Refer to note 8 for details on impairment testing.
11 Income tax
Income tax expense comprises current and deferred tax and is recognised in profit or loss, as disclosed in (a)below, except to the extent that it relates to items recognised directly in equity or other comprehensive income asdisclosed in (c) below.
(a) Income tax expense (benefit)
Notes2017
$m2016$m
Current tax (0.4) (5.0)Deferred tax 12 5.2 (50.8)Under (over) provided in prior years 1.2 2.1
6.0 (53.7)
(b) Reconciliation of income tax expense to prima facie tax payable
Loss before income tax expense (165.6) (277.7)Tax at the Australian tax rate of 30% (2016: 30%) (49.7) (83.3)Tax effect of amounts not deductible (taxable) in calculating taxable income:
Research and development credit (1.1) (5.5)Current tax losses not recognised by overseas operations - 26.8Deferred tax losses not recognised by overseas operations 35.7 -Metalysis write-down 10.1 -SRL minimum tax (3.5% of revenue) 5.2 -Non-deductible expenses 4.3 6.1Other items (0.5) -
4.0 (55.9)
Difference in overseas tax rates 0.8 0.1Under provision in prior years 1.2 2.1
Income tax expense (benefit) 6.0 (53.7)
159.5 331.5
95
Notes to the financial statementsFor the year ended 31 December 2017
For
per
sona
l use
onl
y

96 Iluka Resources Limited, Annual Report 2017
Iluka Resources Limited31 December 2017
No tax benefits have been recognised in respect of exploration activities of overseas operations as their recovery isnot currently considered probable.
The idling of the US operations at the end of 2015 means that the recovery of US state tax losses are notconsidered probable. Unrecognised US state tax losses for which no deferred tax asset has been recognised areUS$162.9 million at 31 December 2017 (31 December 2016: US$161.7 million).
Unused capital losses for which no deferred tax asset has been recognised are approximately $92.7 million (2016:$92.7 million) (tax at the Australian rate of 30%: $27.9 million (2016: $27.9 million)). The benefit of these unusedcapital losses will only be obtained if sufficient future capital gains are made and the losses remain available undertax legislation.
Tax transparency code
Iluka has adopted the Board of Taxation’s voluntary Tax Transparency Code (TTC). The TTC requires additional taxdisclosures in two parts. This note together with the income tax note 11 addresses the Part A disclosurerequirements being:- a reconciliation of accounting profit to tax expense and to current year income tax payable;- the identification of material temporary and non-temporary differences; and- the effective company tax rates for Iluka's Australian and global operations.
Part B disclosure requirements will be addressed in the Sustainability Report 2017.
Effective income tax rate: Australian and global operations
2017 2016Effective income tax rate (i)Australia (ii) 42.9% 28.7%Global (iii) (3.6)% 19.4%
Current year income tax payable reconciliation
$m $mLoss before income tax (165.6) (277.7)
Income tax at the statutory rate of 30% (49.7) (83.3)Non-temporary differences - income tax expense (iv) 54.5 27.5Non-temporary differences - equity (v) 2.0 2.5Temporary differences: deferred tax expense (5.2) 50.8
Total 1.6 (2.5)
(i) Effective income tax rate = Income tax expense / profit before income tax.
(ii) Australian effective tax rate is higher than the Australian corporate tax rate of 30% primarily due tonon-deductible expenditure incurred in relation to non-Australian operations.
(iii) Reflects no income tax benefit recognised for tax losses arising from US operations and accounting impairmentof Iluka's investment in Metalysis.
(iv) Being non-temporary differences of $53.7 million and tax rates differences of $0.8 million (refer to note 11).
(v) Income tax impact of non-deductible Australian share based payments recognised to the share option reserve.
96
Notes to the financial statementsFor the year ended 31 December 2017
For
per
sona
l use
onl
y
Iluka Resources Limited, Annual Report 2017 97
Iluka Resources Limited31 December 2017
(c) Tax expense relating to items of other comprehensive income2017
$m2016
$m
Hedge of net investments in foreign operations 6.3 (2.5)Changes in fair value of foreign exchange cash flow hedges (0.9) -Actuarial gains (losses) on retirement benefit obligation (0.2) 0.2
5.2 (2.3)
The income tax expense or benefit for the period is the tax payable on the current period’s taxable income based onthe applicable income tax rate for each jurisdiction adjusted by changes in deferred tax assets and liabilitiesattributable to temporary differences and to unused tax losses. The current tax charge is calculated using the taxrates and tax laws enacted or substantively enacted at the reporting date in the countries where the Group operatesand generates taxable income.
Key estimate: Tax balances
Tax balances are based on management's best estimate and interpretation of the tax legislation in a number ofjurisdictions. This treatment can be subject to changes due to modification to legislation or differences ininterpretation by authorities. Where the amount of tax payable or recoverable includes some uncertainty, the Grouprecognises amounts based on management’s best estimate of the most likely outcome.
12 Deferred tax
2017$m
2016*$m
Deferred tax asset:The balance comprises temporary differences attributable to:Tax losses 185.6 197.2R&D offset - 21.9Employee provisions 6.1 7.8Provisions 146.1 138.1Inventory - 8.4Cash flow hedge reserve (in equity) 1.0 -Other 2.2 11.6
Gross deferred tax assets 341.0 385.0
Amount offset to deferred tax liabilities pursuant to set-off provision (155.1) (176.8)
Net deferred tax assets 185.9 208.2
Deferred tax liability:The balance comprises temporary differences attributable to:Property, plant and equipment (127.9) (145.7)Inventory (19.1) (26.6)Receivables (4.3) (4.3)Treasury shares (in equity) (0.1) (1.2)Other (3.7) 1.0Gross deferred tax liabilities (155.1) (176.8)
Amount offset to deferred tax assets pursuant to set-off provision 155.1 176.8
Net deferred tax liabilities - -
97
Notes to the financial statementsFor the year ended 31 December 2017
For
per
sona
l use
onl
y

98 Iluka Resources Limited, Annual Report 2017
Iluka Resources Limited31 December 2017
2017$m
2016*$m
Movements in net deferred tax balance:Balance at 1 January 208.2 17.8Credited to the income statement (5.2) 50.8Under provision in prior years (1.1) (10.9)DTA recognition on SRL acquisition - 148.5Charged directly to equity (15.9) 2.0Transfers (0.1) -
Balance at 31 December 185.9 208.2
* Comparative balances have been restated to reflect the final purchase price accounting for the Sierra Rutileacquisition. Refer to note 6 for details.
Deferred tax policy
Deferred income tax is provided on all temporary differences at the balance sheet date between accounting carryingamounts and the tax bases of assets and liabilities.
Deferred income tax liabilities are recognised for all taxable temporary differences, other than for the exemptionspermitted under accounting standards.
Deferred income tax assets are recognised for all deductible temporary differences, carry-forward of unused taxassets and unused tax losses, to the extent it is probable that taxable profit will be available to utilise thesedeductible temporary differences, other than for the exemptions permitted under accounting standards. The carryingamount of deferred income tax assets is reviewed at each balance sheet date and reduced to the extent that it is nolonger probable that sufficient taxable profit will be available to allow all or part of the deferred income tax asset tobe utilised.
Deferred income tax assets and liabilities are measured at the tax rates that are expected to apply to the year whenthe asset is realised or the liability is settled, based on tax rates (and tax laws) that have been enacted orsubstantively enacted at the balance sheet date.
Income taxes relating to items recognised directly in equity are also recognised in equity and not in the incomestatement.
Deferred tax assets and deferred tax liabilities are offset only if a legally enforceable right exists to set off current taxassets against current tax liabilities and the deferred tax assets and liabilities relate to the same taxable entity andthe same taxation authority.
Deferred tax recognised
The net deferred tax asset of $185.9 million includes an amount of $185.6 million representing the value of carriedforward losses incurred by SRL. The net deferred tax asset in relation to US operations (2016: $10.8 million) hasbeen derecognised in 2017 as a result of the repeal of the US loss carry back regime from US tax reforms enactedin December 2017.
Key estimate: Deferred tax asset recognition
Deferred income tax assets are recognised for all deductible temporary differences, carried forward unused taxassets and unused tax losses. Deferred tax assets are based on tax laws (and tax rates) that have been enacted orsubstantively enacted at the balance sheet date.
Deferred tax assets have been recognised to the extent that their recovery is probable, having regard to theavailability of sufficient taxable temporary differences relating to the same tax authority and the same taxable entity,the projected future taxable income of these taxable entities and after taking account of specific risk factors that areexpected to affect the recovery of these assets.
98
Notes to the financial statementsFor the year ended 31 December 2017
For
per
sona
l use
onl
y

Iluka Resources Limited, Annual Report 2017 99
Iluka Resources Limited31 December 2017
13 Receivables
2017$m
2016$m
Trade receivables 118.9 107.9Mining Area C royalty receivable 13.8 14.1Other receivables 19.5 18.3Prepayments 19.2 29.6
171.4 169.9
Trade receivables are recognised initially at the value of the invoice sent to the customer and subsequently at theamount considered recoverable. Trade receivables are generally due within 50 days of the invoice being issued(2016: 60 days). The Group sells mineral sands to substantially all its customers on varying credit terms. Sales aregenerally denominated in US dollars. Revenue is recognised using spot exchange rates on the date of sale, withtrade receivables being translated at the spot exchange rate at balance date and translation differences accountedfor in line with the Group’s accounting policy (refer note 2(b)).
Collectability of trade receivables is reviewed on an ongoing basis. Debts which are known to be uncollectible arewritten off. A provision for doubtful receivables is established when there is sufficient evidence that the Group willnot be able to collect all amounts due. Expected credit losses for the Group's trade receivables are reviewed on anongoing basis.
There was $4.1 million overdue (2016: $30.0 million), of which all are less than 28 days overdue (2016: $13.0million). Due to the short-term nature of the Group’s receivables, their carrying value is considered to approximatefair value.
(a) Trade receivables purchase facilities
Iluka has a trade receivables purchase facility for the sale of eligible trade receivables. Under the agreement Ilukatransfers the majority of the risks and rewards of ownership, including credit risk (subject to a maximum first loss).
Iluka maintains an insurance policy to assist in managing the credit risk of its customers. The credit insurance policyis a separate instrument to the receivables and reduces the exposure to credit risk. The trade receivables balanceof $118.9 million excludes $64.0 million (31 December 2016: excludes $88.1 million) of receivables sold under thetrade receivables purchase facility. Iluka has assigned a portion of the insurance policy to the supplier of the tradereceivables purchase facility but retains credit risk up to a maximum loss of $10.9 million (2016: $13.7 million). Anasset for the loss amount has been recognised within other receivables offset by a corresponding continuinginvolvement liability in payables.
(b) Credit risk
At 31 December 2017 the trade receivables balance was $118.9 million, with $113.5 million covered by credit riskinsurance and a further $5.4 million by letters of credit. As a result, the Group had no uninsured receivables at 31December 2017 (31 December 2016: $68.8 million).
99
Notes to the financial statementsFor the year ended 31 December 2017
For
per
sona
l use
onl
y

100 Iluka Resources Limited, Annual Report 2017
Iluka Resources Limited31 December 2017
14 Inventories
2017$m
2016$m
CurrentWork in progress 144.0 113.1Finished goods 261.5 296.4Consumable stores 64.1 64.5
Total current inventories 469.6 474.0
Non-currentWork in progress 4.8 174.9Finished goods 5.0 45.0
Total non-current inventories 9.8 219.9
Non-current heavy mineral concentrate and finished goods reduced in 2017, as inventory was drawn down to meetincreased sales volumes.
Inventories are valued at the lower of weighted average cost and estimated net realisable value. The net realisablevalue is the estimated selling price in the normal course of business, less any anticipated costs of completion andthe estimated costs to sell, including royalties.
There are separate inventory stockpile values for each product, including HMC and other intermediate products, ateach inventory location.
Weighted average cost includes direct costs and an appropriate portion of fixed and variable overhead expenditure,including depreciation and amortisation. As a result of mineral sands being co-products from the same mineralseparation process, costs are allocated to inventory on the basis of the relative sales value of the finished goodsproduced. No cost is attributed to by-products, except direct costs.
Finished goods inventory of $14.3 million (2016: $35.1 million) is carried at net realisable value, with all otherproduct inventory carried at cost.
Consumable stores include ilmenite acquired from third parties, flocculant, coal, diesel and warehouse stores. Aregular and ongoing review is undertaken to establish the extent of surplus, obsolete or damaged stores, which arethen valued at estimated net realisable value.
Inventories expected to be sold (or consumed in the case of stores) within 12 months after the balance sheet dateare classified as current assets; all other inventories are classified as non-current assets.
Key estimate: Net realisable value and classification of product inventory
The Group’s assessment of the net realisable value and classification of its inventory holdings requires the use ofestimates, including the estimation of the relevant future product price and the likely timing of the sale of theinventory.
During the year, inventory write-downs of $5.2 million occurred for work in progress or finished goods (2016: $5.4million). If finished goods future selling prices were 5% lower than expected, no inventory write-down would berequired at 31 December 2017.
Inventory of $9.8 million (2016: $219.9 million) was classified as non-current as it is not expected to be sold within12 months of the balance sheet date.
100
Notes to the financial statementsFor the year ended 31 December 2017
For
per
sona
l use
onl
y

Iluka Resources Limited, Annual Report 2017 101
Iluka Resources Limited31 December 2017
Capital
15 Net debt and finance costs
2017$m
2016$m
Cash and cash equivalentsCash at bank and in hand 53.6 101.3
Total cash and cash equivalents 53.6 101.3
Non-current interest-bearing liabilities (unsecured)Multi Optional Facility Agreement 238.6 611.2Deferred borrowing costs (2.5) (3.6)
236.1 607.6
Total interest-bearing liabilities 236.1 607.6
Net debt 182.5 506.3
(a) Cash and cash equivalents
Cash and cash equivalents include cash on hand and deposits held at call with financial institutions with originalmaturities of three months or less.
Cash and deposits are at floating interest rates between 0.0 per cent and 2.12 per cent (2016: 0.0 per cent and 2.45per cent) on Australian and foreign currency denominated deposits.
(b) Interest-bearing liabilities
Interest-bearing liabilities are initially recognised at fair value less directly attributable transaction costs, withsubsequent measurement at amortised cost using the effective interest rate method. Under the amortised costmethod the difference between the amount initially recognised and the redemption amount is recognised in profit orloss over the period of the borrowings on an effective interest basis.
Interest-bearing liabilities are classified as current liabilities unless the Group has an unconditional right to defersettlement for at least 12 months after the balance sheet date.
(i) Multi Optional Facility Agreement
The Multi Optional Facility Agreement (MOFA) comprises a series of unsecured five year bilateral revolving creditfacilities with several domestic and foreign institutions, totalling A$695.1 million (2016: A$1,015.4 million).
The table below details the facility expiries:
A$millionTotal
facilityFacility expiry
2017 2018 2019 2020 2021 2022
At 31 December 2017 695.1 - - 96.2 72.5 - 526.4At 31 December 2016 1,015.4 175.0 - 102.0 579.0 159.4
Drawings under the MOFA at 2017 were A$238.6 million (2016: A$611.2 million). Undrawn MOFA facilities at 31December 2017 were A$456.5 million (2016: A$404.2 million).
(c) Interest rate exposure
Of the above interest-bearing liabilities, $238.6 million is subject to an effective weighted average floating interestrate of 3.1 per cent (2016: interest-bearing liabilities of $611.2 million at 2.7 per cent). The contractual repricing dateof all of the floating rate interest-bearing liabilities at the balance date is within one year.
101
Notes to the financial statementsFor the year ended 31 December 2017
For
per
sona
l use
onl
y

102 Iluka Resources Limited, Annual Report 2017
Iluka Resources Limited31 December 2017
(d) Finance costs
2017$m
2016$m
Interest charges on interest-bearing liabilities 15.4 14.7Bank fees and similar charges 0.8 1.3Amortisation of deferred borrowing costs 2.6 2.8Rehabilitation and mine closure provision discount unwind 14.1 11.8
Total finance costs 32.9 30.6
(i) Amortisation of deferred borrowing costs
Fees paid on establishment of borrowing facilities are recognised as transaction costs and amortised over theperiod until the next expected facility extension. Transaction costs of $1.5 million associated with the extension ofthe MOFA were incurred and capitalised in 2017 (2016: $0.5 million).
(ii) Rehabilitation and mine closure provision discount unwind
Rehabilitation and mine closure unwind represents the cost associated with the passage of time. Rehabilitationprovisions are recognised as the discounted value of the present obligation to restore, dismantle and rehabilitatewith the increase in the provision due to passage of time being recognised as a finance cost in accordance with thepolicy described in note 9(a).
16 Contributed equity
(a) Share capital
2017Shares
2016Shares
2017$m
2016$m
Ordinary shares - fully paid 418,701,360 418,701,360 1,120.0 1,120.0Treasury shares - net of tax (53,218) (466,050) (0.3) (2.8)
418,648,142 418,235,310 1,119.7 1,117.2
Ordinary shares entitle the holder to participate in dividends and the proceeds on winding up of the Company inproportion to the number of and amounts paid on the shares held. On a show of hands, every holder of ordinaryshares present at a meeting in person or by proxy is entitled to one vote, and upon a poll each share is entitled toone vote. Incremental costs directly attributable to the issue of new shares or options are shown in equity as adeduction, net of tax, from the proceeds. There have been no movements in fully paid ordinary shares since7 May 2009.
(b) Treasury shares
Treasury shares are shares in Iluka Resources Limited acquired on market and held for the purpose of issuingshares under the Directors, Executives and Employees Share Acquisition Plan and the Employee Share Plan.
Number ofshares $m
Opening balance at 1 January 2016 1,194,708 7.3Employee share issues, net of tax (728,658) (4.5)Balance at 31 December 2016 466,050 2.8
Employee share issues, net of tax (412,832) (2.5)
Balance at 31 December 2017 53,218 0.3
102
Notes to the financial statementsFor the year ended 31 December 2017
For
per
sona
l use
onl
y

Iluka Resources Limited, Annual Report 2017 103
Iluka Resources Limited31 December 2017
17 Reserves and retained earnings
Notes2017
$m2016
$m
Asset revaluation reserveBalance at 1 January 11.8 13.1Transfer to retained earnings on disposal - (1.3)
Balance at 31 December 17(a) 11.8 11.8blankHedge reserveMark to market value of hedging instruments (3.2) -Deferred tax 1.0 -
Balance 31 December 17(b) (2.2) -blankShare-based payments reserveBalance at 1 January (1.1) (2.1)Transfer of shares to employees, net of tax (2.5) (4.5)Share-based payments, net of tax 5.5 5.5
Balance at 31 December 17(c) 1.9 (1.1)blankForeign currency translationBalance at 1 January 21.5 12.1Currency translation of US operation 21(a) (0.3) 1.5Currency translation of Sierra Rutile (37.9) 13.9Translation differences on other foreign operations (0.2) (0.2)Hedge of net investment in Sierra Rutile 21.1 (8.3)Deferred tax (6.3) 2.5
Balance at 31 December 17(d) (2.1) 21.5blankTotal reserves 9.4 32.2blank
Retained earningsBalance at 1 January (46.4) 272.8Net loss for the period (171.6) (224.0)Dividends paid (25.1) (92.1)Actuarial (losses) gains on retirement benefit obligation, net of tax (0.5) 0.3Associates conversion to equity accounting share of losses - (4.7)Transfer from asset revaluation reserve - 1.3
Balance at 31 December (243.6) (46.4)
(a) Asset revaluation reserve
The asset revaluation reserve records revaluations of non-current assets prior to the adoption of AIFRS. Transfersare made to retained earnings on disposal of previously revalued assets.
(b) Hedge reserve
Iluka uses two types of hedging instruments as part of its foreign currency risk management strategy associatedwith its US denominated sales, as described in note 21. These include foreign currency forward contracts andforeign currency collars, both of which are designated in cash flow hedge relationships. To the extent these hedgesare effective, the change in fair value of the hedging instrument is recognised in the cash flow hedge reserve.
103
Notes to the financial statementsFor the year ended 31 December 2017
For
per
sona
l use
onl
y

104 Iluka Resources Limited, Annual Report 2017
Iluka Resources Limited31 December 2017
(c) Share-based payments reserve
The employee share-based payments reserve is used to recognise the fair value of equity instruments granted butnot yet issued to employees under the Group's various equity-based incentive schemes. Shares issued toemployees are acquired on-market prior to the issue. Shares not yet issued to employees are shown as treasuryshares. When shares are issued to employees the cost of the on-market acquisition, net of tax, is transferred fromtreasury shares (refer note 16) to the share-based payment reserve.
(d) Foreign currency translation reserve
Exchange differences arising on translation of the net investment in foreign operations, including US dollardenominated debt used as a hedge of the net investment, are taken into the foreign currency translation reserve netof applicable income tax, as described in note 2(b). At 31 December 2017, US$120.7 million was designated as ahedge of the net investment in Sierra Rutile Limited (2016: US$297.0 million). The reserve is recognised in profit orloss when the net investment is disposed of.
18 Dividends
2017$m
2016$m
Final dividendfor 2015 of 19 cents per share, fully franked - 79.5
- 79.5Interim dividendfor 2017 of 6 cents per share, fully franked 25.1 -for 2016 of 3 cents per share, fully franked - 12.6
25.1 12.6
Total dividends 25.1 92.1
Since balance date the directors have determined a final dividend for 2017 of 25 cents per share, fully franked(2016: no final dividend). The dividend is payable on 23 April 2018 for shareholders on the register as at 28 March2018. The aggregate amount of the proposed dividend is $104.7 million, which has not been included in provisionsat balance sheet date as it was not declared on or before the end of the financial year.
The Company's Dividend Reinvestment Plan was suspended in late 2010 and has been terminated. A newDividend Reinvestment Plan has been introduced effective for the payment of the 2017 final dividend.
(a) Franking credits
The balance of franking credits available for future years is $84.3 million (2016: $88.5 million). This balance isbased on a tax rate of 30% (2016: 30%). This amount includes franking credits that will be reduced by the receipt ofthe tax refund of $5.0 million following the lodgement of the 2017 income tax return for the Australian taxconsolidated group (2016: $6.1 million).
104
Notes to the financial statementsFor the year ended 31 December 2017
For
per
sona
l use
onl
y

Iluka Resources Limited, Annual Report 2017 105
Iluka Resources Limited31 December 2017
19 Loss per share
2017Cents
2016Cents
Basic loss per share (cents) (41.0) (53.6)Diluted loss per share (cents) (41.0) (53.6)
Loss (earnings) per share (EPS) is the amount of post-tax loss or earnings attributable to each share.
Basic EPS is calculated on the loss for the period attributable to equity owners of $171.6 million (2016: loss of$224.0 million) divided by the weighted average number of shares on issue during the year, excluding treasuryshares, being 418,525,273 shares (2016: 418,027,206 shares).
Diluted EPS takes into account the dilutive effect of all outstanding share rights vesting as ordinary shares. Theweighted average share rights outstanding would be anti-dilutive in 2017 and 2016 as they would reduce the lossper share and therefore have not been included in the calculation of diluted EPS.
Risk
20 Financial risk management
The Group's activities expose it to a variety of financial risks: market risk (including currency risk and interest raterisk), credit risk and liquidity risk. The Group's overall risk management program focuses on the unpredictability offinancial markets and seeks to minimise potential adverse effects on the financial performance of the Group.Financial risk management is managed by a central treasury department under policies approved by the Board.
(a) Market risk
Market risk is the risk that changes in market prices such as foreign exchange rates and interest rates will affect theGroup’s income or value of its holdings of financial instruments.
(i) Foreign exchange risk
The Group operates internationally and is exposed to foreign exchange risk arising predominantly from the USdollar, which is the currency the Group’s sales are generally denominated in.
The Group has operations in Sierra Leone and rehabilitation obligations in the US, which both have a USDfunctional currency. The balance sheet translation risk is managed by designating part of the Group’s borrowing inUS dollars as a hedge against the net US dollar investment in the Sierra Rutile operation (translation differences aretaken to the foreign currency translation reserve). Other US dollar borrowings act as a ‘natural’ hedge againstmovements in US dollar receivables from Australian sales (translation differences taken to the profit or loss).
Foreign exchange risk is also managed through entering into forward foreign exchange contracts and collarcontracts detailed in note 21.
The treasury function of the Group to address foreign currency risk is managed centrally. The Group hedges foreignexchange exposures for firm commitments relating to sales. The hedging instrument must be in the same currencyas the hedged item.
The objective of Iluka’s policy on foreign exchange hedging is to protect the Group from adverse currencyfluctuations.
105
Notes to the financial statementsFor the year ended 31 December 2017
For
per
sona
l use
onl
y

106 Iluka Resources Limited, Annual Report 2017
Iluka Resources Limited31 December 2017
The Group's exposure to USD foreign currency risk (by entities which have an Australian dollar functional currency)at the end of the reporting period, expressed in Australian dollars, was as follows:
2017 2016$m $m
Cash and cash equivalents 21.9 25.8Receivables 85.6 99.1Payables (25.1) (27.4)Interest-bearing liabilities (238.6) (411.9)
(156.2) (314.4)
The Group's balance sheet exposure to other foreign currency risk is not significant.
(ii) Group sensitivity
The average US dollar exchange rate during the year was 0.7668 (2016: 0.7444). The US dollar spot rate at 31December 2017 was 0.7784 (31 December 2016: 0.7214). Based on the Group's net financial assets at 31December 2017, the following table demonstrates the estimated sensitivity to a -/+ 10% movement in the US dollarspot exchange rate, with all other variables held constant, on the Group's post-tax profit (loss) for the year andequity:
-10% +10%Strengthen Weaken
Profit (loss) Equity Profit (loss) Equity$m $m $m $m
31 December 2017 (0.2) (11.9) 0.2 9.731 December 2016 7.5 (32.1) (6.2) 26.3
(iii) Interest rate risk
Interest rate risk arises from the Group’s borrowings and cash deposits. During 2017 and 2016, the Group'sborrowings at variable rates were denominated in Australian dollars and US dollars. At 31 December 2017, ifvariable interest rates for the full year were -/+ 1% from the year-end rate with all other variables held constant,pre-tax profit for the year would have moved as per the table below.
+1% -1%$m $m
31 December 2017 3.6 (3.6)31 December 2016 2.2 (2.2)
The sensitivity is calculated using the average debt position for the year ended 31 December 2017. The interestcharges in note 15(d) of $15.4 million (2016: $14.7 million) reflect interest-bearing liabilities in 2017 that rangebetween $236.1 million and $607.6 million (2016: $49.0 million and $607.6 million).
(b) Credit risk
Credit risk arises from cash and cash equivalents and hedging instruments held with financial institutions, as well ascredit exposure to customers.
The Group has policies in place to ensure that credit sales are only made to customers with an appropriate credithistory. The Group also maintains an insurance policy to assist in managing the credit risk of its customers. Furtherdetails are set out in note 13.
Derivative counterparties and cash transactions are limited to high credit quality financial institutions and policieslimit the amount of credit exposure to any one financial institution.
The Group's policy is to ensure that cash deposits are held with counterparties with a minimum A-/A3 credit rating.Credit exposure limits are approved by the Board based on both credit and sovereign ratings.
106
Notes to the financial statementsFor the year ended 31 December 2017
For
per
sona
l use
onl
y

Iluka Resources Limited, Annual Report 2017 107
Iluka Resources Limited31 December 2017
(c) Liquidity risk
Liquidity risk is the risk the Group will not be able to meet its financial obligations as they fall due. Liquidity riskmanagement involves maintaining sufficient cash on hand or undrawn credit facilities to meet the operatingrequirements of the business. This is managed through committed undrawn facilities under the MOFA (refer note15(b)(i)) of $456.5 million at balance date as well as cash and cash equivalents of $53.6 million and prudent cashflow management.
(d) Maturities of financial liabilities
The tables below analyse the Group's interest-bearing liabilities into maturity groupings based on the remainingperiod at the reporting date to the contractual maturity date. For the MOFA, the contractual maturity dates are dateswhich range from 2019 to 2022 and contractual cash flows are until the next contractual re-pricing date, which areall within one year. The amounts disclosed in the table are the contractual undiscounted cash flows. Balances duewithin 12 months equal their carrying balances as the impact of discounting is not significant. All other financialliabilities are due within 12 months (refer note 15). Derivative cash flows include the net amounts expected to bepaid for foreign exchange forward contracts and net amounts expected to be received for foreign exchange collarcontracts.
Weightedaverage rate
Less than1 year
Between1 and 2years
Between2 and 5years
Totalcontractualcash flows
Carryingamount
liabilitiesAt 31 December 2017
%
$m $m $m $m $m
Non-derivatives
Payables 114.2 - - 114.2 114.2Interest-bearing variable rate 3.1 1.5 - 238.6 240.1 238.6Total non-derivatives 115.7 - 238.6 354.3 352.8
Weightedaverage rate
Less than 1year
Between1 and 2years
Between2 and 5years
Totalcontractualcash flows
Carryingamount
liabilitiesAt 31 December 2016
$m $m $m $m $m
Non-derivatives
Payables 123.8 - - 123.8 123.8Interest-bearing variable rate 2.7 2.8 - 611.2 614.0 611.2
Total non-derivatives 126.6 - 611.2 737.8 735.0
Less than1 year
Between1 and 2years
Between2 and 5years
Over 5years
Totalcontractualcash flows
Carryingamount
liabilitiesAt 31 December 2017 $m $m $m $m $m $m
Derivatives
Foreign exchange forward contracts 3.4 - - - 3.4 3.4Foreign exchange collar contracts (0.2) (1.2) (1.2) - (2.6) (2.6)Total non-derivatives 3.2 (1.2) (1.2) - 0.8 0.8
Refer to note 21 for detail on derivative instruments.
107
Notes to the financial statementsFor the year ended 31 December 2017
For
per
sona
l use
onl
y

108 Iluka Resources Limited, Annual Report 2017
Iluka Resources Limited31 December 2017
21 Hedging
2017$m
2016$m
Current assetsForeign exchange collar hedges 0.2 -
Total current derivative financial instrument assets 0.2 -
Non-current assetsForeign exchange collar hedges 2.4 -
Total non-current derivative financial instruments assets 2.4 -
Current liabilitiesForeign exchange forward contracts 3.4 -
Total current derivative financial instrument liabilities 3.4 -
The Group is exposed to risk from movements in foreign exchange in relation to its forecast US dollar denominatedsales and as part of the risk management strategy has entered into the following types of derivative contracts duringthe year:
• foreign exchange forward contracts covering US$114.0 million at an average rate of 76.1 cents and a furtherUS$103.9 million at an average rate of 80.1 cents. As at 31 December 2017 there was US$95 million of forwardforeign exchange contracts remaining at an average rate of 80.1 cents; and
• foreign exchange collar hedges, covering US$271.0 million of expected USD revenue over the period 2018 to2022. Over this five year period, the collars comprise US$271 million worth of purchased AUD call options witha weighted average strike price of 80.2 cents, which have been largely paid for by selling US$271 million ofAUD put options at a strike price of 70 cents. The net cost of these collars was $2.3 million, which was paid upfront in December 2017. This five year period corresponds with long-term sales contracts entered into in 2017including those in support of the Cataby development. However, the hedged USD revenues do not representthe full value of expected sales under these contracts over this period.
Recognition
Derivatives are initially recognised at fair value on the date a derivative contract is entered into and aresubsequently re-measured to their fair value at the end of each reporting period. The accounting for subsequentchanges in fair value depends on whether the derivative is designated as a hedging instrument and, if so, the natureof the item being hedged and the type of hedge relationship designated.
Hedge accounting
At the start of a hedge relationship, the Group formally designates and documents the hedge relationship, includingthe risk management strategy for undertaking the hedge. This includes identification of the hedging instrument, thehedged item or transaction, the nature of the risk being hedged and how the entity will assess the hedginginstrument’s effectiveness. Hedge accounting is only applied where effective tests are met on a prospective basis.
Iluka will discontinue hedge accounting prospectively only when the hedging relationship, or part of the hedgingrelationship, no longer qualifies for hedge accounting. This includes where there has been a change to the riskmanagement objective and strategy for undertaking the hedge and instances when the hedging instrument expiresor is sold, terminated or exercised. The replacement or rollover of a hedging instrument into another hedginginstrument is not treated as an expiration or termination if such a replacement or rollover is consistent with ourdocumented risk management objective.
The foreign exchange forward contracts and foreign exchange collars Iluka holds are classified as cash flowhedges. Hedges are classified as cash flow hedges when they hedge a particular risk associated with the cashflows of recognised assets and liabilities and highly probable forecast transactions.
108
Notes to the financial statementsFor the year ended 31 December 2017
For
per
sona
l use
onl
y

Iluka Resources Limited, Annual Report 2017 109
Iluka Resources Limited31 December 2017
Cash flow hedges
For cash flow hedges, the portion of the gain or loss on the hedging instrument that is effective is recogniseddirectly in equity, while the ineffective portion is recognised in profit or loss. This was immaterial in the currentperiod. The maturity profile of these hedges is shown in note 20(d), the recognition of the future gain or loss isexpected to be consistent with this timing.
Amounts recognised in equity are transferred to the income statement when the hedged sale occurs or when thehedging instrument is exercised.
If the forecast transaction is no longer expected to occur, amounts previously recognised in equity are transferred tothe income statement. If the hedging instrument expires or is sold, terminated or exercised without replacement orroll over, or if its designation as a hedge is revoked, amounts previously recognised in equity remain in equity untilthe forecast transaction occurs.
Net investment hedge
The Group also designates US denominated debt as a hedge against the Group's net investment in Sierra Leone,which has a US dollar functional currency. During the period the Group's net investment hedge resulted in $14.8million being recorded in the foreign currency translation reserve (2016: $5.8 million reserve reduction).
Group structure
22 Controlled entities and deed of cross guarantee
The consolidated financial statements incorporate the following subsidiaries:
Country of Equity holdingControlled entities incorporation 2017 2016
% %* Iluka Resources Limited (Parent Company) Australia* Westlime (WA) Limited Australia 100.0 100.0* Ilmenite Proprietary Limited Australia 100.0 100.0* Southwest Properties Pty Ltd Australia 100.0 100.0* Western Mineral Sands Proprietary Limited Australia 100.0 100.0* Yoganup Pty Ltd Australia 100.0 100.0* Iluka Corporation Limited Australia 100.0 100.0* Associated Minerals Consolidated Ltd Australia 100.0 100.0* Iluka Royalty Holdings Limited Australia 100.0 100.0* Iluka Consolidated Pty Limited Australia 100.0 100.0* Iluka Exploration Pty Limited Australia 100.0 100.0* Iluka (Eucla Basin) Pty Ltd Australia 100.0 100.0* Gold Fields Asia Ltd Australia 100.0 100.0* Iluka International Limited Australia 100.0 100.0* NGG Holdings Ltd Australia 100.0 100.0* Iluka Midwest Limited Australia 100.0 100.0* Western Titanium Limited Australia 100.0 100.0* The Mount Lyell Mining and Railway Company Limited Australia 100.0 100.0* Renison Limited Australia 100.0 100.0* Iluka Finance Limited Australia 100.0 100.0* The Nardell Colliery Pty Ltd Australia 100.0 100.0* Glendell Coal Ltd Australia 100.0 100.0* Lion Properties Pty Limited Australia 100.0 100.0* Basin Minerals Limited Australia 100.0 100.0* Basin Minerals Holdings Pty Ltd Australia 100.0 100.0* Basin Properties Pty Ltd Australia 100.0 100.0* Swansands Pty Ltd Australia 100.0 100.0* Iluka International (UAE) Pty Ltd Australia 100.0 100.0* Iluka International (Lanka) Pty Ltd Australia 100.0 100.0* Iluka International (China) Pty Ltd Australia 100.0 100.0* Iluka International (Brazil) Pty Ltd Australia 100.0 100.0
109
Notes to the financial statementsFor the year ended 31 December 2017
For
per
sona
l use
onl
y

110 Iluka Resources Limited, Annual Report 2017
Iluka Resources Limited31 December 2017
* Iluka Share Plan Holdings Pty Ltd Australia 100.0 100.0* Iluka International (Netherlands) Pty Ltd Australia 100.0 100.0* Iluka Royalty (MAC) Pty Limited Australia 100.0 100.0* Iluka International (ERO) Pty Ltd Australia 100.0 100.0* Iluka International (West Africa) Pty Ltd Australia 100.0 100.0Ashton Coal Interests Pty Limited Australia 95.8 95.8Iluka International Coӧperatief U.A. The Netherlands 100.0 100.0Iluka Investments 1 B.V. The Netherlands 100.0 100.0Iluka Trading (Europe) B.V. The Netherlands 100.0 100.0Iluka Lanka P Q (Private) Limited Sri Lanka 100.0 100.0Iluka Lanka Resources (Private) Limited Sri Lanka 100.0 100.0Iluka Lanka Exploration (Private) Limited Sri Lanka 100.0 100.0Iluka Trading (Shanghai) Co., Ltd China 100.0 100.0Iluka Brasil Mineracao Ltda Brazil 100.0 100.0Iluka (UK) Ltd United Kingdom 100.0 100.0Iluka Technology (UK) Ltd United Kingdom 100.0 100.0Associated Minerals Consolidated Investments USA 100.0 100.0Iluka (USA) Investments Inc USA 100.0 100.0Iluka Resources Inc USA 100.0 100.0Iluka Resources (NC) LLC USA 100.0 100.0Iluka Resources (TN) LLC USA 100.0 100.0IR RE Holdings LLC USA 100.0 100.0Iluka Atlantic LLC USA 100.0 100.0Iluka International (SE Asia) Pte. Ltd. Singapore 100.0 100.0Iluka Exploration (Kazakhstan) Limited Liability Partnership Kazakhstan 100.0 100.0ERO (Tanzania) Limited Tanzania 100.0 100.0Iluka Exploration (Canada) Limited Canada 100.0 100.0Iluka Investments (BVI) Limited British Virgin Islands 100.0 100.0SRL Acquisition No. 3 Limited British Virgin Islands 100.0 100.0Sierra Rutile (UK) Limited United Kingdom 100.0 100.0Sierra Rutile Holdings Limited British Virgin Islands 100.0 100.0Sierra Rutile Limited Sierra Leone 100.0 100.0Sierra Rutile Marketing Limited United Kingdom 100.0 100.0
* The above companies are parties to a Deed of Cross Guarantee (the Deed) under which each companyguarantees the debts of the others.
By entering into the Deed of Cross Guarantee, the wholly-owned entities represent a closed group and have beenrelieved from the requirements to prepare a Financial Report and Directors' Report under ASIC Corporations(Wholly-owned Companies) Instrument 2016/785. The closed group is also the extended closed group.
110
Notes to the financial statementsFor the year ended 31 December 2017
For
per
sona
l use
onl
y

Iluka Resources Limited, Annual Report 2017 111
Iluka Resources Limited31 December 2017
(a) Condensed financial statements of the extended closed group
Condensed statement of profit or loss and other comprehensive income2017
$m2016
$m
Revenue from ordinary activities 894.9 738.7Expenses from ordinary activities (839.3) (951.4)Finance costs (28.7) (29.4)Income tax expense (16.1) 59.0Profit (loss) for the period 10.8 (183.1)
Other comprehensive incomeActuarial gains on defined benefit plans, net of tax - 0.2Changes in the fair value of cash flow hedges (2.2) -
Total comprehensive (loss) income for the period 8.6 (182.9)
Summary of movements in consolidated retained earnings
Retained earnings at the beginning of the financial year 3.4 278.6Profit (loss) for the period 10.8 (183.1)Dividends paid (25.1) (92.1)
Retained earnings at the end of the financial year (10.9) 3.4
Condensed balance sheet2017
$m2016
$m
Current assetsCash and cash equivalents 27.1 72.6Receivables 157.7 170.1Inventories 365.1 415.1Current tax receivables 3.7 6.2Derivative financial instruments 0.2 -
Total current assets 553.8 664.0
Non-current assetsInventories 4.7 188.4Other financial assets - investments in non-closed group entities 617.8 532.7Property, plant and equipment 615.8 793.0Intangible assets 4.3 4.7Deferred tax assets 38.0 47.8Derivative financial instruments 2.4 -
Total non-current assets 1,283.0 1,566.6
Total assets 1,836.8 2,230.6
Current liabilitiesPayables 73.6 87.6Provisions 58.0 48.5Derivative financial instruments 3.4 -
Total current liabilities 135.0 136.1
111
Notes to the financial statementsFor the year ended 31 December 2017
For
per
sona
l use
onl
y

112 Iluka Resources Limited, Annual Report 2017
Iluka Resources Limited31 December 2017
Condensed balance sheet2017
$m2016
$m
Non-current liabilitiesInterest-bearing liabilities 236.1 607.6Provisions 343.9 354.7
Total non-current liabilities 580.0 962.3
Total liabilities 715.0 1,098.4
Net assets 1,121.8 1,132.2
EquityContributed equity 1,119.7 1,117.2Reserves 13.0 11.6Retained earnings (10.9) 3.4
Total equity 1,121.8 1,132.2
Other notes
23 Contingent liabilities
(a) Bank guarantees
The Group has a number of bank guarantees in favour of various government authorities and service providers tomeet its obligations under exploration and mining tenements. At 31 December 2017, the total value of performancecommitments and guarantees was $120.4 million (2016: $122.9 million).
(b) Native title
There is some risk that native title, as established by the High Court of Australia's decision in the Mabo case, existsover some of the land over which the Group holds tenements or over land required for access purposes. It isimpossible at this stage to quantify the impact, if any, which these developments may have on the operations of theGroup.
(c) Sri Lanka exploration deposits
In October 2013 the Group acquired all of the share capital in PKD Resources (Pvt) Ltd, a Sri Lankan domiciledcompany which owns an exploration tenement located near the city of Puttalam in the North Western Province ofSri Lanka. The consideration for the acquisition which remains contingent on future events includes:
• payment of US$8.0 million on the Iluka Board approving a development of mining operations on EL 170 or onexpiry of the stage 3 period, being October 2019; and
• the payment of an annual trailing payment calculated at one per cent of the gross sale proceeds received fromthe annual sale of all mineral products and sand clay produced from the tenement, less the US$2.0 million paidon the grant of the mining license over EL 170, which is being treated as an advance on the trailing payment.
Iluka has a put option to transfer either the shares in PKD Resources (Pvt) Ltd or the tenements back to the vendor.If exercised, Iluka will not be required to make the payments referred to above.
(d) Other claims
In the course of its normal business, the Group occasionally receives claims arising from its operating activities. Inthe opinion of the directors, all such matters are covered by insurance or, if not covered, are without merit or are ofsuch a kind or involve such amounts that would not have a material adverse effect on the operating results orfinancial position of the Group if settled unfavourably.
112
Notes to the financial statementsFor the year ended 31 December 2017
For
per
sona
l use
onl
y

Iluka Resources Limited, Annual Report 2017 113
Iluka Resources Limited31 December 2017
24 Commitments
(a) Exploration and mining lease commitments2017
$m2016
$m
Commitments in relation to leases contracted for at reporting date but notrecognised as liabilities payable:
Within one year 18.3 17.9Later than one year but not later than five years 34.3 41.3Later than five years 46.7 49.6
99.3 108.8
These costs are discretionary. If the expenditure commitments are not met then the associated exploration andmining leases may be relinquished.
(b) Lease commitments
Commitments for minimum lease payments in relation to non-cancellable operatingleases are payable as follows:
Within one year 11.5 12.6Later than one year but not later than five years 7.8 15.7Later than five years 0.4 0.6
19.7 28.9
The Group leases various storage facilities, offices, mining equipment and motor vehicles under non-cancellableoperating leases expiring within one to 10 years with varying terms.
(c) Capital commitments
Capital expenditure contracted for and payable, but not recognised as liabilities are $27.0 million (2016: $5.7million). All of the commitments relate to the purchase of property, plant and equipment and are payable within oneyear of the reporting date.
113
Notes to the financial statementsFor the year ended 31 December 2017
For
per
sona
l use
onl
y

114 Iluka Resources Limited, Annual Report 2017
Iluka Resources Limited31 December 2017
25 Remuneration of auditors
During the year the following fees were paid or payable for services provided by the auditor of the parent entity, itsrelated practices and non-related audit firms:
(a) PricewaterhouseCoopers Australia
2017$000
2016$000
Audit and other assurance servicesAudit and review of financial statements* 619 615Other assurance services 13 5
632 620
Tax and other servicesTax compliance and advisory services - 6Other compliance and advisory services 52 50
52 56
Total remuneration 684 676
(b) Network firms of PricewaterhouseCoopers Australia
Audit and review of financial statements* 181 102Other compliance and advisory services 22 11
203 113
(c) Non-PricewaterhouseCoopers audit firms
Audit and review of financial statements* 48 268
Summary of total fees disclosed above:Audit and review of financial statements* 848 985Other assurance services 13 5Tax compliance and advisory services - 6Other compliance and advisory services 74 61
935 1,057
* Included in the remuneration of auditors are the annual costs incurred by Sierra Rutile Limited. Iluka has onlyrecognised a portion of these costs within the Group profit or loss account for 2016, pro-rated in relation to Iluka'speriod of ownership. Full annual costs are disclosed to assist users of accounts.
114
Notes to the financial statementsFor the year ended 31 December 2017
For
per
sona
l use
onl
y

Iluka Resources Limited, Annual Report 2017 115
Iluka Resources Limited31 December 2017
26 Share-based payments
Share-based compensation benefits are provided to employees via incentive plans, the Director's, Executives andEmployees Share Acquisition Plan, the Equity Incentive Plan and the Employee Share Plan. Information relating tothese schemes is set out in the Remuneration Report.
The fair value of shares granted is determined based on market prices at grant date, taking into account the termsand conditions upon which those shares were granted. The fair value is recognised as an expense through profit orloss on a straight-line basis between the grant date and the vesting date for each respective plan.
The fair value of share rights is independently determined using a Monte Carlo simulation that takes into accountthe exercise price, the term of the share right, the impact of dilution, the share price at grant date and expectedprice volatility of the underlying share, the expected dividend yield and the risk free interest rate of the term of theshare right. The fair value of the Long Term Incentive Plan (LTIP - TSR tranche) and Long Term Deferred Rights(LTDR - TSR tranche) also take into account the Company's predicted share prices against the comparator groupperformance at vesting date.
A credit to the share-based payments expense arises where unvested entitlements lapse on resignation or thenon-fulfilment of the vesting conditions that do not relate to market performance. Payroll tax payable on the grant ofrestricted shares or share rights is recognised as a component of the share-based payments expense when paid.
The share-based payment expense recognised in profit or loss of $7.4 million (2016: $8.5 million) results fromseveral schemes summarised below.
Fairvalue
Shares /rights at
Expense2017
Shares /rights at
Expense2016
SchemesGrantdate
Vestingdate $ 31 Dec 17 $m 31 Dec 16 $m
STIP (i)
2017 Mar-18 Mar-19/20 10.17 - 1.3 - -
2016 Mar-17 Mar-18/19 6.82 - 0.7 - 2.2
2015 Mar-16 Mar-17/18 6.63 - 0.3 - 1.2
2014 Mar-15 Mar-16/17 7.66 - - - 0.8
2013 Mar-14 Mar-15/16 9.44 - - - 0.1
LTIP - TSR (ii)
2017 May-17 Mar-21 5.66 431,698 0.6 - -
2016 MD Grant Oct-16 Mar-21 3.71 126,688 - 126,688 -
2016 May-16 Mar-20 4.27 270,656 0.2 321,643 0.4
2016 May-16 Mar-19 4.27 270,656 0.3 321,643 0.6
2015 Feb-15 Mar-18 5.02 261,984 0.3 308,153 0.7
2014 Feb-14 Mar-17 5.74 - - 129,058 0.4
2013 Feb-13 Mar-16 7.72 - - - 0.1
LTIP - ROE (ii)
2017 May-17 Mar-21 7.44 431,724 0.8 - -
2016 MD Grant Oct-16 Mar-21 5.42 126,687 - 126,687 -
2016 May-16 Mar-20 5.86 270,674 0.4 321,664 0.6
2016 May-16 Mar-19 6.01 270,674 0.4 321,664 0.8
2015 Feb-15 Mar-18 6.74 261,984 - 308,153 0.9
2014 Feb-14 Mar-17 8.49 - - 129,058 1.1
MD LTDR (iii) Oct-16 Mar-18/19/20 4.68 504,929 1.3 - 0.3
COO LTDR (iv) Mar-17 Mar-20 6.82 16,133 0.1 - -
Employee Share Plan (v) 9.01 - 0.5 - 0.5
Restricted Share Plan (vi) 6.82 - 0.2 - -
7.4 8.5
115
Notes to the financial statementsFor the year ended 31 December 2017
For
per
sona
l use
onl
y

116 Iluka Resources Limited, Annual Report 2017
Iluka Resources Limited31 December 2017
(i) Short Term Incentive Plan (STIP)
The fair value of the STIP is determined as the volume weighted average price of ordinary shares over the fivetrading days following the release of the Company’s annual results.
(ii) Long Term Incentive Plan (LTIP)
The fair value at grant date for the 2017 LTIP takes into account the exercise price of $nil, the share price at grantdate of $8.39, the expected price volatility of the share price (based on historical volatility), the expected dividendyield of 3.08% and the risk free rate of return of 1.88%. The fair value of the TSR tranche also takes into accountthe Company’s predicted share prices against the comparator group performance at vesting date.
Prior year expenses related to rights that do not vest for the Return on Equity (ROE) tranche are credited to theshare-based payments expense.
(iii) Managing Director's Long Term Deferred Rights (LTDR)
The fair value at grant date for the Managing Director's LTDR takes into account the exercise price of $nil, the shareprice at grant date of $6.27, the expected price volatility of the share price (based on historical volatility), theexpected dividend yield of 3.47% and the risk free rate of return of 1.53%. The fair value of the TSR tranche alsotakes into account the Company’s predicted share prices against the comparator group performance at vestingdate.
Full details of the LTDR granted in October 2016 are set out in the 2016 Remuneration Report. The fair value of$4.68 per right is the weighted average for all share rights in the LTDR.
(iv) Chief Operating Officer's Long Term Deferred Rights (LTDR)
The fair value at grant date for the Chief Operating Officer's LTDR represents the face value of the 16,133 deferredrights.
(v) Employee share plan
A total of 45,954 (2016: 85,007) shares were issued to eligible employees who participated in the plan. Eachparticipant was issued with shares worth $1,000 based on a volume weighted average market price of $9.01 (2016:$5.90) for the five days following the close of the offer period.
(vi) Restricted share plan
95,674 (2016: 33,800) restricted shares were issued to eight (2016: four) eligible employees who participated in theplan. Shares were issued to participants based on a volume weighted average price of $6.82 (2016: $5.90)calculated over the five trading days following the release of the Company’s 2016 annual results.
116
Notes to the financial statementsFor the year ended 31 December 2017
For
per
sona
l use
onl
y

Iluka Resources Limited, Annual Report 2017 117
Iluka Resources Limited31 December 2017
27 Reconciliation of loss after income tax to net cash inflow from operating activities
2017$m
2016$m
Loss for the year (171.6) (224.0)Depreciation and amortisation 111.0 79.9Exploration capitalised - 0.3Doubtful debts 1.3 -Net loss (gain) on disposal of property, plant and equipment 0.9 (1.2)Net exchange differences (1.9) 9.6Rehabilitation and mine closure provision discount unwind 14.1 11.8Non-cash share-based payments expense 7.4 8.5Amortisation of deferred borrowing costs 2.6 2.8Equity accounted share of losses 3.3 3.3Impairment of assets 185.4 201.0Inventory NRV write-down 5.2 -Non-cash rehabilitation for closed sites 127.4 42.6Change in operating assets and liabilities
Increase in receivables (31.1) (30.7)Decrease in inventories 203.4 158.6Increase in net current tax asset (8.5) (28.1)Decrease (increase) in net deferred tax 3.8 (43.0)Decrease in payables (7.0) (14.7)Decrease in provisions (32.0) (48.3)
Net cash inflow from operating activities 413.7 128.4
28 Retirement benefit obligations
(a) Superannuation plan
(i) Australia
Iluka previously provided defined lump sum and pension benefits to employees of the Group who did not elect afund under the Superannuation Fund Choice legislation via the Iluka Resources Superannuation Plan. Iluka hasclosed this defined benefits plan to new members and there are no remaining members. The Group has no furtherlegal or contructive obligation in relation to this plan.
(ii) USA
All employees of the United States (US) operations are entitled to benefits from the US operations' pension plans onretirement, disability or death. The US operations have one defined benefit plan and one defined contribution plan.The defined benefit plan provides a monthly benefit based on average salary and years of service. The definedcontribution plan receives an employee's elected contribution and an employer's match-up to a fixed percentage.The entity's legal or constructive obligation is limited to these contributions.
117
Notes to the financial statementsFor the year ended 31 December 2017
For
per
sona
l use
onl
y

118 Iluka Resources Limited, Annual Report 2017
Iluka Resources Limited31 December 2017
(iii) SRL
SRL does not operate any retirement benefit plan for its employees. For employees of the Sierra Leone basedsubsidiary, the Group makes a contribution of 10% of the employees' basic salary to the National Social Securityand Insurance Trust ("NASSIT") for payment of pension to staff on retirement. These employees also contribute 5%of their basic salary to NASSIT.
The Sierra Leone based subsidiary also provides for end-of-term benefits based on the provisions contained in thecollective bargaining agreements negotiated with the trade unions representing the relevant employees. Thesebenefits are paid to employees falling under this category when they leave the Group. The retirement benefitobligation recognised in the balance sheet represents the present value of the defined benefit obligation in relationto this agreement.
The following sets out details in respect of the defined benefit sections only for Australia, US and SRL.
(b) Financial position
The net financial position of the Group’s defined benefit plans based on information supplied from the plans'actuarial advisors per the table below.
2017 2016
Net plan position$m $m
Australia Surplus 0.4 0.4United States Deficit (11.1) (12.2)Sierra Rutile Deficit (4.1) (2.9)
Total (14.8) (14.7)
A net deficit of $14.8 million (2016: deficit $14.7 million) is included in non-current provisions in note 9. The tablebelow provides a summary of the net financial position at 31 December for the past five years.
2017$m
2016$m
2015$m
2014$m
2013$m
Defined benefit plan obligation (36.0) (35.0) (31.1) (29.5) (20.5)Plan assets 21.2 20.3 20.4 19.3 16.7
Deficit (14.8) (14.7) (10.7) (10.2) (3.8)
(c) Defined benefits superannuation expense
In 2017, $1.7 million (2016: $2.9 million) was recognised in expenses for the year in respect of the defined benefitplans.
Other disclosures in respect of retirement benefit obligations required by AASB 119 are not included in the financialreport as the directors do not consider them to be material to an understanding of the financial position andperformance of the Group.
118
Notes to the financial statementsFor the year ended 31 December 2017
For
per
sona
l use
onl
y
Iluka Resources Limited, Annual Report 2017 119
Iluka Resources Limited31 December 2017
29 Key Management Personnel
(a) Key Management Personnel
Key Management Personnel of the Group comprise directors of Iluka Resources Limited as well as other specificemployees of the Group who met the following criteria: "personnel who have authority and responsibility forplanning, directing and controlling the activities of the Group, either directly or indirectly."
(i) Key Management Personnel compensation
Detailed information about the remuneration received by each key management person is provided in theRemuneration Report on pages 53 to 73.
The below provides a summary:
2017 2016$000 $000
Short-term benefits 6,412 7,835Post-employment benefits 183 211Other long-term benefits - -Termination benefits - 2,082Share-based payments 2,796 2,396
Total 9,391 12,524
(b) Transactions with Key Management Personnel
There were no transactions between the Group and Key Management Personnel that were outside of the naturedescribed below:
(i) occurrence was within a normal employee, customer or supplier relationship on terms and conditions nomore favourable than those it is reasonable to expect the Group would have adopted if dealing at armslength with an unrelated individual;
(ii) information about these transactions does not have the potential to adversely affect the decisions about theallocation of scarce resources made by users of the financial report, or the discharge of accountability bythe Key Management personnel; and
(iii) the transactions are trivial or domestic in nature.
30 Parent entity financial information
(a) Summary financial information for Iluka Resources Limited
2017$m
2016$m
Balance sheetCurrent assets 203.5 264.0Non-current assets 1,228.4 1,888.2
Total assets 1,431.9 2,152.2
Current liabilities 34.0 44.0Non-current liabilities 393.9 871.1
Total liabilities 427.9 915.1
Net assets 1,004.0 1,237.1
119
Notes to the financial statementsFor the year ended 31 December 2017
For
per
sona
l use
onl
y

120 Iluka Resources Limited, Annual Report 2017
Iluka Resources Limited31 December 2017
Shareholders' equityContributed equity 1,120.0 1,120.0Other reserves 10.4 9.8Profit reserve (i) 82.1 -(Accumulated loss) retained earnings (208.5) 107.3
1,004.0 1,237.1spaceLoss (profit) for the year 208.5 (67.9)
Other comprehensive incomeChanges in the fair value of cash flow hedges, net of tax 2.2 -
Total comprehensive loss (income) 210.7 (67.9)
(i) Profits have been appropriated to a profits reserve for future dividend payments.
(b) Contingent liabilities of the parent entity
The parent had contingent liabilities for performance commitments and guarantees of $40.0 million as at 31December 2017 (2016: $38.0 million).
(c) Contractual commitments for the acquisition of property, plant or equipment
As at 31 December 2017, the parent entity had contractual commitments for the acquisition of property, plant orequipment totalling $22.3 million (2016: $0.1 million).
(d) Parent entity financial information
The financial information for the parent entity has been prepared on the same basis as the consolidated financialstatements, except as set out below.
(i) Investments in subsidiariesInvestments in subsidiaries are accounted for at cost.
(ii) Tax consolidation legislationIluka Resources Limited and its wholly-owned Australian controlled entities have implemented the tax consolidationlegislation as of 1 January 2004. On adoption of the tax consolidation legislation, the entities in the tax consolidationgroup entered into a tax sharing agreement which limits the joint and several liability of the wholly-owned entities inthe case of a default by the head entity, Iluka Resources Limited.
31 Related party transactions
The only related party transactions are with Directors and Key Management Personnel (refer note 29). Details ofmaterial controlled entities are set out in note 22. The ultimate Australian controlling entity and the ultimate parententity is Iluka Resources Limited.
120
Notes to the financial statementsFor the year ended 31 December 2017
For
per
sona
l use
onl
y

Iluka Resources Limited, Annual Report 2017 121
Iluka Resources Limited31 December 2017
32 New and amended standards adopted by the group
Iluka Resources Limited is required to change some of its accounting policies as the result of new or revisedaccounting standards which became effective for the annual reporting period commencing on 1 January 2017. Theaffected policies and standards are:
· AASB 2016-1 Amendments to Australian Accounting Standards - Recognition of Deferred Tax Assets forUnrealised Losses
· AASB 2016-2 Amendments to Australian Accounting Standards - Disclosure Initiative: Amendments to AASB 107
· AASB 2017-2 Amendments to Australian Accounting Standards - Further Annual Improvements 2014-2016 Cycle
The adoption of these amendments did not have any impact on the current period or any prior period and is notlikely to affect future periods.
Early adopted standards
(i) AASB 9 Financial InstrumentsThe Group has elected to apply AASB 9 Financial Instruments as issued in December 2014, from 1 January 2017because the new accounting standard provides more relevant information for the users of the financial report. Inaccordance with the transitional provisions in AASB 9 (7.2.15), comparative figures have not been restated.
AASB 9 replaces the provisions of AASB 139 Financial Instruments that relate to the recognition, classification andmeasurement of financial assets and financial liabilities, including derecognition, impairment and changes to hedgeaccounting rules. AASB 9 also amends other standards dealing with financial instruments such as AASB 7 FinancialInstruments: Disclosures.
The adoption of AASB 9 did not result in a significant change to the recognition or measurement of financialinstruments for the Group as presented in the financial report. The new hedge accounting rules align the accountingfor hedging instruments more closely to the Group’s risk management practices, which allows the Group’s naturalhedge relationship and derivatives to qualify for hedge accounting under AASB 9. See note 21.
On adoption of AASB 9 Iluka has also reclassified its financial assets as subsequently measured at amortised costor fair value depending on the business model for those assets and the contractual cash flow characteristics. Therewas no change in the classification or measurement of financial liabilities. The principal impact on Iluka's financialassets at 1 January 2017 is the reclassification of the trade receivables from ‘loans and receivables’ under AASB139 to ‘financial assets at amortised cost’ under AASB 9. This did not change the balance of trade receivablesrecognised at 31 December 2017.
In relation to the reclassification of financial assets and liabilities, there was no impact on the income statement, thestatement of comprehensive income, balance sheet or statement of changes in equity on adoption of AASB 9.
As a result of adopting AASB 9, the accounting policy for trade receivables (note 13) and hedging (note 21) hasbeen updated and is applicable from 1 January 2017.
The terminology in the above policies has been updated in accordance with the requirements of AASB 9. There hasbeen no material change to the measurement and recognition of these items.
121
Notes to the financial statementsFor the year ended 31 December 2017
For
per
sona
l use
onl
y

122 Iluka Resources Limited, Annual Report 2017
Iluka Resources Limited31 December 2017
New accounting standards not yet adopted
Certain new accounting standards and interpretations have been published that are not mandatory for 31 December2017 reporting periods and have not been early adopted by the Group. The Group’s assessment of the impact ofthese new standards and interpretations is set out below.
(i) AASB 15 Revenue from contracts with customers (effective from 1 January 2018)
AASB 15 Revenue from contracts with customers will replace AASB 118 Revenue and introduces a new frameworkfor revenue recognition. The new framework is based on a five step process where revenue is recognised for eachdistinct performance obligation, at the point control of the good or service passes to the customer. This replaces thepreviously applied risks and rewards approach under AASB 15.
The Group sells mineral sands on a variety of shipping terms. Under some of these shipping terms control of thefinal product passes to the customer although the Group still retains obligations to deliver the goods. Under AASB15 this is deemed a separate performance obligation and this component will be separately presented as freightrevenue. This change is not expected to materially impact the overall Group’s reported revenue. No other changesare expected.
The Group has implemented the new standard effective from 1 January 2018.
(ii) AASB 16 Leases (effective from 1 January 2019)
AASB 16 Leases will replace AASB 117 Leases and removes the distinction between operating and financingleases and introduces a single framework which results in the lessee being required to recognise all leases with aterm longer than 12 months on the balance sheet. This is presented in the balance sheet as a right to use assetbeing the leased item, and financial liability being the lease payments over the term of the lease. For operatingleases, the cost of these leases will then be presented as amortisation of the leased asset and interest expense asthe discount rate on the liabilities unwind, rather than operating cash costs as the current approach under AASB117.
The Group has various lease arrangements for office buildings and equipment, although leases for less than 12months will be exempted from recognition on the balance sheet. The Group is currently evaluating the impact ofAASB 16. Information in relation to the current lease commitments is disclosed in note 24.
The Group will implement the new standard on 1 January 2019.
There are no other standards that are not yet effective and that would be expected to have a material impact on theentity in the current or future reporting periods and on foreseeable future transactions.
122
Notes to the financial statementsFor the year ended 31 December 2017
For
per
sona
l use
onl
y

Iluka Resources Limited, Annual Report 2017 123
Iluka Resources Limited31 December 2017
DIRECTORS' DECLARATION
In the directors' opinion:
(a) the financial statements and notes set out on pages 75 to 122 are in accordance with the Corporations Act2001, including:
(i) complying with Accounting Standards and other mandatory professional reporting requirements asdetailed above, and the Corporations Regulations 2001; and
(ii) giving a true and fair view of the Group's financial position as at 31 December 2017 and of itsperformance for the financial year ended on that date, and
(b) there are reasonable grounds to believe that the Company will be able to pay its debts as and when theybecome due and payable, and
(c) at the date of this declaration, there are reasonable grounds to believe that the members of the extendedclosed group identified in note 22 will be able to meet any obligations or liabilities to which they are, or maybecome, subject by virtue of the deed of cross guarantee described in note 22.
Note 2 confirms that the financial statements also comply with International Financial Reporting Standards asissued by the International Accounting Standards Board.
The directors have been given the declarations by the Chief Executive Officer and Chief Financial Officer requiredby section 295A of the Corporations Act 2001.
This declaration is made in accordance with a resolution of the directors.
G MartinChairman
T O'LearyManaging Director
27 February 2018
123
Directors’ declarationFor the year ended 31 December 2017
For
per
sona
l use
onl
y

124 Iluka Resources Limited, Annual Report 2017
PricewaterhouseCoopers, ABN 52 780 433 757Brookfield Place, 125 St Georges Terrace, PERTH WA 6000, GPO Box D198, PERTH WA 6840 T: +61 8 9238 3000, F: +61 8 9238 3999, www.pwc.com.au
Liability limited by a scheme approved under Professional Standards Legislation. 124
Independent auditor’s report To the members of Iluka Resources Limited
Report on the audit of the financial report
Our opinion In our opinion:
The accompanying financial report of Iluka Resources Limited (the Company) and its controlled entities (together the Group) is in accordance with the Corporations Act 2001, including:
(a) giving a true and fair view of the Group's financial position as at 31 December 2017 and of its financial performance for the year then ended
(b) complying with Australian Accounting Standards and the Corporations Regulations 2001.
What we have audited The Group financial report comprises:
the consolidated balance sheet as at 31 December 2017 the consolidated statement of changes in equity for the year then ended the consolidated statement of cash flows for the year then ended the consolidated statement of profit or loss and other comprehensive income for the year then
ended the notes to the consolidated financial statements, which include a summary of significant
accounting policies the directors’ declaration.
Basis for opinion We conducted our audit in accordance with Australian Auditing Standards. Our responsibilities under those standards are further described in the Auditor’s responsibilities for the audit of the financial report section of our report.
We believe that the audit evidence we have obtained is sufficient and appropriate to provide a basis for our opinion.
Independence We are independent of the Group in accordance with the auditor independence requirements of the Corporations Act 2001 and the ethical requirements of the Accounting Professional and Ethical Standards Board’s APES 110 Code of Ethics for Professional Accountants (the Code) that are relevant to our audit of the financial report in Australia. We have also fulfilled our other ethical responsibilities in accordance with the Code.
Independent auditor’s report To the members of Iluka Resources Limited
For the year ended 31 December 2017
For
per
sona
l use
onl
y

Iluka Resources Limited, Annual Report 2017 125
125
Our audit approach An audit is designed to provide reasonable assurance about whether the financial report is free from material misstatement. Misstatements may arise due to fraud or error. They are considered material if individually or in aggregate, they could reasonably be expected to influence the economic decisions of users taken on the basis of the financial report.
We tailored the scope of our audit to ensure that we performed enough work to be able to give an opinion on the financial report as a whole, taking into account the geographic and management structure of the Group, its accounting processes and controls and the industry in which it operates.
The Group is a producer of zircon and high-grade titanium dioxide products of rutile and synthetic rutile, with operations in Australia, the United States and Sierra Leone. The Group also earns royalty income from a tier one iron ore operation – BHP Billiton’s Mining Area C province in Western Australia.
Materiality
For the purpose of our audit we used overall Group materiality of $10.0 million, which represents approximately 1% of the Group’s total revenue.
We applied this threshold, together with qualitative considerations, to determine the scope of our audit and the nature, timing and extent of our audit procedures and to evaluate the effect of misstatements on the financial report as a whole.
We chose revenue as the materiality benchmark rather than profit before tax due to the recent volatility in profit before tax. Revenues are reflective of the Group’s operating activities, are relatively stable when compared to profit before tax and provide a level of materiality which, in our view, is appropriate for the audit having regard to the expected requirements of users of the Group’s financial report.
We utilised a 1% threshold based on our professional judgement, noting it is within the range of commonly acceptable thresholds.
Audit Scope
Our audit focused on where the directors made subjective judgements; for example, significant accounting estimates involving assumptions and inherently uncertain future events.
Component auditors, operating under our instructions, performed audit procedures over the Group’s Sierra Leone operations’ financial information. These procedures, combined with the work performed by us which included reviewing component auditors’ work, as the Group engagement team, provided sufficient appropriate audit evidence as a basis for our opinion on the Group financial report as a whole.
Independent auditor’s report To the members of Iluka Resources Limited
For the year ended 31 December 2017
For
per
sona
l use
onl
y

126 Iluka Resources Limited, Annual Report 2017
126
Key audit matters Key audit matters are those matters that, in our professional judgement, were of most significance in our audit of the financial report for the current period. The key audit matters were addressed in the context of our audit of the financial report as a whole, and in forming our opinion thereon, and we do not provide a separate opinion on these matters. Further, any commentary on the outcomes of a particular audit procedure is made in that context. We communicated the key audit matters to the Audit and Risk Committee.
Key audit matter How our audit addressed the key audit matter
Closure and rehabilitation provisions Refer to Critical accounting estimates and judgements in note 3 and Provisions in note 9 to the financial report
As a result of its mining and processing operations, the Group is obliged to restore and rehabilitate the environment disturbed by these operations. Rehabilitation activities are governed by a combination of legislative requirements and Group policies. At 31 December 2017 the balance sheet included provisions for such obligations of $669.2m. We placed particular focus on the increased closure and rehabilitation provisions of $119.5m and related disclosure for the Group’s legacy operations in Virginia due to the significant estimates made by the Group in determining the likely outcome of the matters identified and the quantum of possible outcomes which may result in further costs to the Group.
This was a key audit matter given the determination of these provisions required judgement in the assessment of the nature and extent of the work to be performed, the future cost of performing the work, the timing of when the rehabilitation will take place and economic assumptions such as the discount rate for future cash outflows associated with rehabilitation activities.
We performed tests on key controls over the assessment of the work required to rehabilitate disturbed areas and the estimated future cost of that work which forms the basis for the Group’s closure and rehabilitation provision models for Australia, the US and Sierra Leone.
We evaluated key assumptions utilised in these models by performing the following procedures:
comparing the rehabilitation costs being incurred at the Group’s sites which are no longer operating to operating sites with similar expected rehabilitation profiles to check that rehabilitation estimates take into account current experience
assessing the ability of the Group to make reliable estimates of the extent of future rehabilitation expenditure by comparing actual cash outflows in 2017 to those forecast as part of the provision in previous years
examining the Group’s assessment of significant changes in future cost estimates from the prior year
reading expert reports obtained by the Group with respect to its rehabilitation obligations
assessing the Group’s range of probable outcomes of the manner in which the rehabilitation of legacy sites in Virginia is likely to occur
comparing the rehabilitation costs being estimated by external experts retained by the Group to the cost inputs in the rehabilitation models
evaluating the competency and independence of the experts retained by the Group to assist with the assessment of its rehabilitation obligations
Independent auditor’s report To the members of Iluka Resources Limited
For the year ended 31 December 2017
For
per
sona
l use
onl
y

Iluka Resources Limited, Annual Report 2017 127
127
Key audit matter How our audit addressed the key audit matter
considering the timing of work to be performed in life of mine plans and/or other environmental requirements, and
considering the appropriateness of the discount rates and inflation rates utilised in calculating the provision by comparing them to current market consensus.
We also evaluated the accounting treatment applied to changes in the rehabilitation provision, including whether they are expensed or capitalised, due to the Group’s significant proportion of sites which are no longer operating and require changes in the rehabilitation provision to be expensed.
We assessed the rehabilitation provision acquired through the acquisition of Sierra Rutile Limited as set out in the key audit matter below – Finalisation of the Sierra Rutile Limited business combination.
Finalisation of the Sierra Rutile Limited business combination Refer to Business combination in note 6 to the financial report
On 7 December 2016, a wholly owned subsidiary of the Company merged with Sierra Rutile Limited for purchase consideration of $375m.
The acquisition of a business is complex and the accounting standards require the Group to identify all assets and liabilities of the newly acquired subsidiary and estimate the fair value of each item. Given the short period of time between acquisition date and the year end, the Group assigned provisional fair values to the identified assets and liabilities at 31 December 2016. Finalisation of the provisional fair values resulted in an increase to property, plant and equipment of $23.5m, deferred tax assets of $22.0m and asset retirement obligations of $44.6m.
The finalisation of these fair values was a key audit matter given its significance to the Group and that significant judgement is involved in determining provisional and final fair values to the assets and liabilities acquired.
We focussed on significant judgements made by the directors in finalising provisional fair value measurements of Sierra Rutile Limited’s assets and liabilities by assessing new information obtained about facts and circumstances that existed at the acquisition date in respect of:
property, plant and equipment. We assessed the reasonableness of key revised model assumptions in the Group’s fair value model. To do this we read the Group’s current life of mine plan, including resource to reserve conversion, and future areas of interest to be developed,
asset retirement obligations. We assessed key revised assumptions including expected timing and quantum of cash outflows to rehabilitate the Sierra Rutile operations, and
deferred tax assets. We assessed the resultant deferred tax impact of the fair value adjustments to property, plant and equipment and asset retirement obligations on the Group’s deferred tax position.
Independent auditor’s report To the members of Iluka Resources Limited
For the year ended 31 December 2017
For
per
sona
l use
onl
y

128 Iluka Resources Limited, Annual Report 2017
128
Key audit matter How our audit addressed the key audit matter
Recognition and measurement of deferred tax assets Refer to Business combination in note 6 to the financial report
As a result of the acquisition of Sierra Rutile Limited on 7 December 2016 and its operating performance for the year ended 31 December 2017, the Group recognised $144.0m of deferred tax assets, primarily comprising the anticipated benefit of existing tax losses reducing future tax payable as at 31 December 2017.
The recognition and measurement of these deferred tax assets was a key audit matter given that there was significant judgement in assessing the availability of these losses and the sufficiency of future taxable profits to utilise these tax losses.
We obtained a reconciliation of the tax losses of Sierra Rutile Limited carried forward as at 31 December 2017 which was prepared by Sierra Rutile Limited’s tax advisors in Sierra Leone. We found this to be materially consistent with the Group’s underlying assessment of carry forward tax losses as at 31 December 2017. We also evaluated advice the Group received with respect to the availability of these losses given the change in control as a result of the acquisition.
We also evaluated the Group’s rationale for the recognition and measurement of deferred tax assets of $144.0m. We evaluated the Group’s mine plan and financial model to assess the Group’s conclusion that sufficient taxable income would likely be earned in the future to utilise the tax losses for which deferred tax assets have been recognised.
Other information The directors are responsible for the other information. The other information comprises the Business review, Results for announcement to the market, Directors’ report, and Physical, financial and corporate information included in the Group’s annual report for the year ended 31 December 2017 but does not include the financial report and our auditor’s report thereon.
Our opinion on the financial report does not cover the other information and accordingly we do not express any form of assurance conclusion thereon.
In connection with our audit of the financial report, our responsibility is to read the other information identified above and, in doing so, consider whether the other information is materially inconsistent with the financial report or our knowledge obtained in the audit, or otherwise appears to be materially misstated.
If, based on the work we have performed, we conclude that there is a material misstatement of this other information, we are required to report that fact. We have nothing to report in this regard.
Responsibilities of the directors for the financial report The directors of the Company are responsible for the preparation of the financial report that gives a true and fair view in accordance with Australian Accounting Standards and Corporations Act 2001 and for such internal control as the directors determine is necessary to enable the preparation of the financial report that gives a true and fair view and is free from material misstatement, whether due to fraud or error.
Independent auditor’s report To the members of Iluka Resources Limited
For the year ended 31 December 2017
For
per
sona
l use
onl
y

Iluka Resources Limited, Annual Report 2017 129
129
In preparing the financial report, the directors are responsible for assessing the ability of the Group to continue as a going concern, disclosing, as applicable, matters related to going concern and using the going concern basis of accounting unless the directors either intend to liquidate the Group or to cease operations, or have no realistic alternative but to do so.
Auditor’s responsibilities for the audit of the financial report Our objectives are to obtain reasonable assurance about whether the financial report as a whole is free from material misstatement, whether due to fraud or error, and to issue an auditor’s report that includes our opinion. Reasonable assurance is a high level of assurance, but is not a guarantee that an audit conducted in accordance with the Australian Auditing Standards will always detect a material misstatement when it exists. Misstatements can arise from fraud or error and are considered material if, individually or in the aggregate, they could reasonably be expected to influence the economic decisions of users taken on the basis of the financial report.
A further description of our responsibilities for the audit of the financial report is located at the Auditing and Assurance Standards Board website at: http://www.auasb.gov.au/auditors_responsibilities/ar1.pdf. This description forms part of our auditor's report.
Report on the remuneration report
Our opinion on the remuneration report We have audited the remuneration report included in pages 53 to 73 of the directors’ report for the year ended 31 December 2017.
In our opinion, the remuneration report of Iluka Resources Limited for the year ended 31 December 2017 complies with section 300A of the Corporations Act 2001.
Responsibilities The directors of the Company are responsible for the preparation and presentation of the remuneration report in accordance with section 300A of the Corporations Act 2001. Our responsibility is to express an opinion on the remuneration report, based on our audit conducted in accordance with Australian Auditing Standards.
PricewaterhouseCoopers
Justin Carroll PerthPartner 27 February 2018
Independent auditor’s report To the members of Iluka Resources Limited
For the year ended 31 December 2017
For
per
sona
l use
onl
y

130 Iluka Resources Limited, Annual Report 2017
Physical, financial and corporate information
South-west operations, Western Australia
For
per
sona
l use
onl
y

Iluka Resources Limited, Annual Report 2017 131
CREATING AND DELIVERING VALUE
Five year physical and financial summary 132
Operating mines physical data 134
Ore Reserves and Mineral Resources statement 135
Shareholder and investor information 142
Corporate information 144
For
per
sona
l use
onl
y

132 Iluka Resources Limited, Annual Report 2017
2017 2016 2015 2014 2013
Production volumes (kt)
- Zircon 312.3 347.1 388.6 357.6 285.1
- Rutile 302.1 117.6 136.5 177.2 127.0
- Synthetic rutile 210.8 210.9 164.9 - 59.0
Total Z/R/SR 825.2 675.6 690 534.8 471.1
- Ilmenite 448.1 329.4 466.1 365.4 584.5
Sales volumes (kt)
- Zircon 380.4 338.8 346.2 352.2 370.2
- Rutile 264.3 172.1 133.6 182.0 168.0
- Synthetic rutile 244.4 186.8 171.2 82.0 46.2
Total Z/R/SR 889.1 697.7 651 616.2 584.4
- Ilmenite 202.7 17.7 299.8 316.6 337.5
Weighted average annual prices (US$/t)
- Zircon (premium and standard) 958 810 986 1,054 1,171
- Zircon (all products) 940 773 961 1,033 1,150
- Rutile (excluding HYTI) 790 731 763 828 1,075
- Synthetic rutile Not disclosed Not disclosed Not disclosed 750 1,150
Average AUD:USD spot exchange rate (cents) 76.7 74.4 75.2 90.3 96.8
AUD:USD range (cents) 71.8/80.6 68.6/78.0 69.2/82.3 81.1/94.9 88.5/105.9
Unit revenue and cash cost ($/t)
Revenue per tonne Z/R/SR sold (A$/t) 1,079 999 1,136 1,030 1,173
Unit cash costs of production per tonne Z/R/SR produced including by-product costs 439 373 558 668 757
Unit cost of goods sold per tonne of Z/R/SR 743 700 780 862 896
Summary financials ($m)
Z/R/SR revenue 959.1 696.8 739.7 634.8 685.8Ilmenite and other revenue 58.4 29.5 80.1 90.1 77.3Revenue from operations 1017.5 726.3 819.8 724.9 763.1Cash costs of production (372.4) (260.6) (392.5) (381.9) (376.1)Inventory movement - cash costs of production (141.5) (107.6) 9.6 14.7 14.0Restructure and idle capacity charges (73.3) (69.5) (38.3) (40.1) (69.6)Government royalties (25.2) (20.4) (21.0) (10.6) (15.2)Marketing and selling costs (33.8) (36.3) (32.0) (30.1) (28.2)Asset sales and other income 0.7 (0.6) 1.4 6.0 3.1Corporate and other costs (47.1) (53.8) (52.7) (48.4) (42.1)Resources development (24.6) (79.4) (58.4) (45.3) (44.9)Underlying mineral sands EBITDA1 300.9 103.0 231.8 189.2 204.1Mining Area C EBITDA 59.6 47.5 61.6 66.8 88.3Underlying Group EBITDA1 360.5 150.5 293.4 256.0 292.4Rehabilitation and holding costs for closed sites (127.4) (42.6) (2.7) 1.0 2.8SRL transaction costs - (14.1) - - -Depreciation and amortisation (111.0) (79.9) (132.0) (191.7) (181.7)Inventory movement - non-cash production costs (66.8) (57.3) (15.3) - -Share of Metalysis Ltd losses (associate) (3.3) (3.3) - - -Significant non-cash items (185.4) (201.0) - (82.0) (40.0)Net interest and finance charges (32.2) (30.0) (56.4) (31.8) (49.5)Income tax (expense) benefit (6.0) 53.7 (33.1) (14.0) (5.5)Net profit (loss) after tax for the period (NPAT) (171.6) (224.0) 53.5 (62.5) 18.5Operating cash flow 391.7 137.3 222.2 254.8 124.0Capital expenditure (93.1) (82.5) (66.4) (48.3) (52.5)Free cash inflow (outflow)2 ($m) 321.9 47.3 155.0 196.3 (27.5)Net (debt) cash (182.5) (506.3) 6.0 (59.0) (206.6)
Five year physical and financial summaryF
or p
erso
nal u
se o
nly

Iluka Resources Limited, Annual Report 2017 133
2017 2016 2015 2014 2013
Capital and dividends
Ordinary shares on issue (millions) 418.7 418.7 418.7 418.7 418.7Dividends per share in respect of the year (cents) 25 3 25 19 9Franking level % 100 100 100 100 100Opening year share price ($) 7.27 6.13 5.95 8.63 9.02Closing year share price ($) 10.17 7.27 6.13 5.95 8.63
Financial ratios
Underlying Group EBITDA/revenue margin % 35.4 20.7 35.8 35.3 38.3Mineral sands EBITDA/revenue margin % 29.6 14.2 28.3 26.1 26.7Basic earnings (loss) per share (cents) (41.0) (53.6) 12.8 (15.0) 4.4Free cash flow per share (cents) 76.9 11.3 37.0 46.9 (6.6)Return on shareholders’ equity3 % (20.1) (17.1) 3.8 (4.1) 1.2Return on capital4 % (11.6) (18.3) 6.8 (2.0) 2.2Gearing (net debt/net debt + equity) % 17.1 31.5 n/a 3.9 11.8
Financial position as at 31 December ($m)
Total assets 1947.0 2442.3 2103.3 2173.4 2368.7Total liabilities (1061.5) (1339.3) (694.7) (738.8) (830.6)Net assets 885.5 1103.0 1408.6 1434.6 1538.1Shareholders’ equity 885.5 1103.0 1408.6 1434.6 1538.1Net tangible asset backing per share ($) 1.7 2.2 3.3 3.4 3.7
Employees, as at 31 December
Full-time equivalent employees5 2543 687 876 827 835
2017 2016 2015 2014 2013
Iluka Ore Reserves and Mineral Resources
Mineral Resources in situ HM tonnes 169.4 170.5 172.9 176.4 178.7
Ore Reserve in situ HM tonnes 16.4 16.7 23 24.9 26.6
HM grade (%) Ore Reserves 5.8 5.9 5.7 5.4 5.6
Assemblage6 (%)
- Zircon 19 19 18 18 19
- Rutile 4 4 6 6 6
- Ilmenite 52 52 53 52 52
2017 2016
Sierra Rutile Ore Reserves and Mineral Resources
Mineral Resources in situ rutile tonnes 7.3 7.5
Ore Reserves in situ rutile tonnes 3.8 3.9
1 Underlying Group EBITDA excludes adjustments including impairments, Sierra Rutile Limited transaction costs, changes to rehabilitation provisions for closed sites. Underlying EBITDA also excludes Iluka’s share of Metalysis Ltd’s losses, which are non-cash in nature.
2 Free cash flow is determined as cash flow before any debt refinance costs, proceeds/repayment of borrowings and dividends paid in the year. 2016 free cash flow is stated before the acquisition cost of Sierra Rutile Limited of $375.4 million.
3 Calculated as NPAT for the year as a percentage of the average monthly shareholders equity over the year.
4 Calculated as EBIT for the year as a percentage of average monthly capital employed for the year.
5 2016 data excludes Sierra Rutile Limited.
6 Mineral assemblage is reported as a percentage of the in situ heavy mineral content.
Refer pages 109 to 115 of the Iluka Annual Report for Iluka’s Ore Reserves and Mineral Resources statement or refer to Iluka’s website www.iluka.com
The Ore Reserves and Mineral Resources for the Sierra Leone rutile deposits are reported separately as there is insufficient information to state the assemblage in terms of a portion of the heavy mineral (HM) content which is traditionally done in reporting heavy minerals. Historical data focused on the in situ rutile content which is honoured in the reporting of Ore Reserves and Mineral Resources for Sierra Leone.
For
per
sona
l use
onl
y

134 Iluka Resources Limited, Annual Report 2017
Operating mines physical data
12 months to 31 December 2017
Jacinth-Ambrosia
Murray Basin
Western Australia
Australia total Virginia
Sierra Leone
Group total 2017
Group total 2016
Mining
Overburden moved kbcm 816 - 210 1,026 - 11 1,037 819
Ore mined kt 620 - 1,635 2,255 - 11,126 13,382 4,894
Ore grade HM % 4.6 - 12.0 10.0 - - n/a n/a
VHM grade % 4.1 - 11.7 9.6 - - n/a n/a
Concentrating
HMC produced kt 11 - 248 259 - 353 612 395
VHM produced kt 10 - 218 229 - 256 485 335
VHM in HMC assemblage % 90.7 - 88.0 88.1 - 72.6 79.2 84.8
- Zircon 65.9 - 15.7 17.9 - 3.6 9.7 29.5
- Rutile 6.1 - 5.6 5.6 - 50.3 31.4 7.9
- Ilmenite 18.7 - 66.7 64.6 - 18.6 38.1 47.4
Processing
HMC processed kt 437 225 270 932 - 348 1,280 967
Finished product[1] kt
- Zircon 213.5 57.2 23.0 293.7 15.6 3.0 312.3 347.1
- Rutile 34.7 92.7 7.1 134.5 - 167.6 302.1 117.6
- Ilmenite (saleable/upgradeable/WHIMS) 117.6 119.4 153.5 390.5 - 57.6 448.1 329.4
Synthetic rutile produced kt - - 210.8 210.8 - - 210.8 210.9
[1] Finished product includes material from heavy mineral concentrate (HMC) initially processed in prior periods.
Glossary
Overburden moved (bank cubic metres) refers to material moved to enable mining of an ore body.
Ore mined (thousands of tonnes) refers to material moved containing heavy mineral ore.
Ore grade HM % refers to percentage of heavy mineral (HM) found in the ore mined.
VHM grade % refers to percentage of valuable heavy mineral (VHM) – titanium dioxide (rutile and ilmenite), and zircon - found in a deposit.
Concentrating refers to the production of heavy mineral concentrate (HMC) through a concentrating process at the mine site, which is then transported for final processing into finished product at one of the company’s two Australian mineral processing plants, or the Virginia mineral processing plant.
HMC produced refers to HMC, which includes the valuable heavy mineral concentrate (zircon, rutile, ilmenite) as well as other non-valuable heavy minerals (gangue).
VHM produced refers to an estimate of valuable heavy mineral in heavy mineral concentrate expected to be processed.
VHM produced and the VHM assemblage – provided to enable an indication of the valuable heavy mineral component in HMC.
HMC processed provides an indication of material emanating from each mining operation to be processed.
Finished product is provided as an indication of the finished production (zircon, rutile, ilmenite – both saleable and upgradeable) attributable to the VHM in HMC production streams from the various mining operations. Finished product levels are subject to recovery factors which can vary. The difference between the VHM produced and finished product reflects the recovery level by operation, as well as processing of finished material/concentrate in inventory. Ultimate finished product production (rutile, ilmenite, and zircon) is subject to recovery loss at the processing stage – this may be in the order of 10 per cent.
Ilmenite is produced for sale or as a feedstock for synthetic rutile production. Typically, one tonne of upgradeable ilmenite will produce between 0.56 to 0.60 tonnes of SR. Iluka also purchases external ilmenite for its synthetic rutile production process. Refer Iluka’s website www.iluka.com – Mineral Sands Technical Information for more detailed information on the mineral sands mining and production process.
For
per
sona
l use
onl
y

Iluka Resources Limited, Annual Report 2017 135
Iluka HM Ore Reserve breakdown by country, region and JORC category at 31 December 2017
Summary of Ore Reserves for Iluka(1,2,3)
HM Assemblage(4)
Country Region
Ore Reserve category
Ore tonnes
millions
In situ HMtonnes
millions
HM grade
(%)
Ilmenitegrade
(%)
Zircongrade
(%)
Rutilegrade
(%)
Change HMtonnes
millions
Australia Eucla Basin Proved 98 3.8 3.9 27 50 4
Probable 4 0.1 2.2 20 52 4
Total Eucla Basin 102 3.9 3.8 27 50 4 (0.0)
Australia Perth Basin Proved 88 5.6 6.3 60 9 4
Probable 92 7.0 7.5 61 8 4
Total Perth Basin(5) 180 12.5 6.9 60 9 4 (0.3)
Total Proved 186 9.4 5.0 47 26 4
Total Probable 96 7.0 7.3 60 9 4
Grand total 283 16.4 5.8 52 19 4 (0.3)
Notes:
(1) Competent Person - Ore Reserves: C Lee (MAusIMM(CP)). The Ore Reserves in this table have been estimated in accordance with the JORC Code (2012 edition), other than the Ore Reserves for the IPL North and South West deposits, which have not materially changed and have been estimated in accordance with the JORC Code (2004 edition). Iluka Resources is undertaking further work in order to report these estimates in accordance with the JORC Code (2012 edition).
(2) Ore Reserves are a sub-set of Mineral Resources.
(3) Rounding may generate differences in last decimal place.
(4) Mineral assemblage is reported as a percentage of in situ HM content.
(5) Rutile component in Perth Basin south west operations is sold as a leucoxene product.
(6) The quoted figures are stated as at the 31 December 2017 and have been depleted for all production conducted to this date.
Ore Reserves and Mineral Resources statement
HM Ore Reserves
For
per
sona
l use
onl
y
136 Iluka Resources Limited, Annual Report 2017
Ore Reserves and Mineral Resources statement
Rutile Ore Reserves (Sierra Leone)
Iluka Rutile Ore Reserve for Sierra Leone by JORC Category at 31 December 2017
Summary of Ore Reserves for Iluka(1,2,3)
In situ mineral content(4)
Country Region
Ore Reserve category
Ore tonnes
millions
In situ rutile
tonnesmillions
Rutilegrade
(%)
Ilmenite(5)
grade(%)
Zircon(5)
grade(%)
Changerutile
tonnesmillions
Sierra Leone Sierra Leone Proved 26 0.4 1.5 - -
Probable 274 3.4 1.2 - -
Total Sierra Leone 300 3.8 1.3 - (0.1)
Notes:
(1) Competent Person - Ore Reserves: C Lee (MAusIMM(CP))
(2) Ore Reserves are a sub-set of Mineral Resources.
(3) Rounding may generate differences in last decimal place.
(4) Mineral content is reported as a percentage of in situ material.
(5) The ilmenite and zircon are only considered to be at an inferred level of confidence in the Mineral Resources estimates, and while present, currently have a low value ascribed in the reserve optimisation process for Sierra Leone. This is not material to the economic viability.
(6) The quoted figures are stated as at 31 December 2017 and have been depleted for all production conducted to this date.
Ore Reserves are estimated using all available geological and relevant drill hole and assay data, including mineralogical sampling and test work on mineral recoveries and final product qualities. Reserve estimates are determined by the consideration of all of the “modifying factors” in accordance with the JORC Code 2004 and 2012, and for example, may include but are not limited to, product prices, mining costs, metallurgical recoveries, environmental consideration, access and approvals. These factors may vary significantly between deposits.
The Ore Reserves and Mineral Resources for the Sierra Leone rutile deposits are reported separately as there is insufficient information to state the assemblage in terms of a portion of the heavy mineral (HM) content which is traditionally done in reporting heavy minerals. Historical data focused on the in situ rutile content which is honoured in the reporting of Ore Reserves and Mineral Resources for Sierra Leone. An equivalent comparison of the rutile tonnages contained in Iluka’s Ore Reserves inventory for heavy minerals can be calculated using the formula:
[Rutile tonnes = HM tonnes * rutile %] that is [16.7*(4/100)] = 0.7 Mt of rutile.
For the year ending 2017, HM Ore Reserves decreased by 0.3Mt HM associated with mining depletion and adjustments, down from 16.7Mt HM to 16.4Mt HM. The main factors contributing to the movement in Iluka’s HM Ore Reserves during 2017 include the following:
• The Eucla Basin Ore Reserves decreased by 0.02Mt HM associated with mining depletion and pit re-design at Jacinth.
• The Perth Basin Ore Reserves decreased by 0.26Mt HM as a result of mine depletion and adjustment at Tutunup South.
For
per
sona
l use
onl
y

Iluka Resources Limited, Annual Report 2017 137
Ore reserves and mineral resources statement
HM Ore Reserves mined and adjusted
Iluka HM Ore Reserves mined and adjusted by country and region at 31 December 2017
Summary of Ore Reserve depletion(1)
Country Region Category
In situ HM
tonnes millions
2016
In situ HM
grade(%)
2016
In situ HM
tonnesmillions
mined 2017
In situ HM
tonnes(2)
millionsadjusted
2017
In situ HM
tonnesmillions
2017
In situ HM
grade(%)
2017
In situ HM
tonnes(3)
millionsnet
change
Australia Eucla Basin Active mines 2.0 4.1 (0.0) (0.0) 2.0 4.3 (0.0)Non-active sites 2.0 3.5 - - 2.0 3.5 -
Total Eucla Basin 3.9 3.8 (0.0) (0.0) 3.9 3.8 (0.0)
Australia Perth Basin Active mines 0.3 12.7 (0.2) (0.1) 0.0 10.2 (0.3)Non-active sites 12.5 5.5 - - 12.5 6.9 -
Total Perth Basin 12.8 5.7 (0.2) (0.1) 12.5 6.9 (0.3)
Total Active mines 2.3 4.6 (0.2) (0.1) 2.0 4.3 (0.3)Total Non-active sites 14.4 6.1 - - 14.4 6.1 -Total Ore Reserves 16.7 5.9 (0.2) (0.1) 16.4 5.8 (0.3)
Notes:
(1) Rounding may generate differences in last decimal place.
(2) Adjusted figure includes write-downs and modifications in mine design.
(3) Net change includes depletion by mining and adjustments.
Rutile Ore Reserves mined and adjusted
Iluka rutile Ore Reserves mined and adjusted for Sierra Leone at 31 December 2017
Summary of Ore Reserve depletion(1)
Country Region Category
In situ rutile
tonnes millions
2016
In situ rutile
grade(%)
2016
In situ rutile
tonnesmillions
mined 2017
In situ rutile
tonnes(2)
millionsadjusted
2017
In situ rutile
tonnesmillions
2017
In situ rutile
grade(%)
2017
In situ rutile
tonnes(3)
millionsnet change
Sierra Leone Sierra Leone Active mines 1.0 1.4 (0.2) 0.1 0.9 1.4 (0.1)Non-active sites 2.9 1.2 - - 2.9 1.2 -
Total Sierra Leone 3.9 1.3 (0.2) 0.1 3.8 1.3 (0.1)
Notes:
(1) Rounding may generate differences in last decimal place.
(2) Adjusted figure includes write-downs and modifications in mine design.
(3) Net change includes depletion by mining and adjustments.
The rutile Ore Reserves for Sierra Leone decreased by 0.1Mt rutile associated with mining depletion and adjustment at Lanti, Gangama and Gbeni, down from 3.9Mt rutile to 3.8Mt rutile.
For
per
sona
l use
onl
y

138 Iluka Resources Limited, Annual Report 2017
Ore Reserves and Mineral Resources statement
HM Mineral Resources
Iluka HM Mineral Resources breakdown by country, region and JORC category at 31 December 2017
Summary of Mineral Resources for Iluka(1,2,3)
HM assemblage(4)
Country Region
Mineral resource category
Material tonnes
millions
In situ HMtonnes
millions
In situ HM
grade(%)
Ilmenitegrade
(%)
Zircongrade
(%)
Rutilegrade
(%)
Change HMtonnes
millions
Australia Eucla Basin Measured 228 7.1 3.1 32 44 4
Indicated 85 8.1 9.5 65 20 2
Inferred 74 3.7 5.1 60 20 2
Total Eucla Basin 387 18.9 4.9 52 29 3 (0.0)
Australia Murray Basin Measured 16 4.4 27.6 62 11 11
Indicated 88 18.5 21.0 56 11 14
Inferred 85 10.1 11.9 49 10 14
Total Murray Basin 189 33.0 17.5 54 11 13 -
Australia Perth Basin Measured 485 28.5 5.9 58 10 5
Indicated 309 16.7 5.4 54 9 5
Inferred 217 11.0 5.1 55 10 5
Total Perth Basin(5) 1,011 56.2 5.6 56 10 5 (0.9)
USA Atlantic Seaboard Measured 52 2.1 4.1 65 12 -
Indicated 43 2.4 5.6 65 10 -
Inferred 16 0.5 2.9 61 11 -
Total Atlantic Seaboard(6) 111 5.0 4.5 64 11 - (0.23)
Sri Lanka Sri Lanka Measured 214 22.2 10.4 70 3 4
Indicated 36 3.1 8.6 69 4 3
Inferred 440 31.0 7.0 66 4 5
Total Sri Lanka(7) 690 56.3 8.2 67 4 4 -
Total Measured 995 64.3 6.5 60 12 5
Total Indicated 561 48.8 8.7 58 11 8
Total Inferred 832 56.3 6.7 61 7 6
Grand Total 2,388 169.4 7.1 60 10 6 (1.1)
Notes:
(1) Competent Person - Mineral Resources: B Gibson (MAIG).
(2) Mineral Resources are inclusive of Ore Reserves.
(3) Rounding may generate differences in last decimal place.
(4) Mineral assemblage is reported as a percentage of the in situ HM component.
(5) Rutile component in Perth Basin South West operations is sold as a leucoxene product.
(6) Rutile is included in Ilmenite for the Atlantic Seaboard region.
(7) The Sri Lanka resource estimates are based on a 100 per cent ownership basis which applies to the exploration stage. The Sri Lankan Exchange Control Act currently limits the percentage holding of a foreign entity in a Sri Lankan mining company to 40 per cent, although approval for up to 100% may be granted.
For
per
sona
l use
onl
y
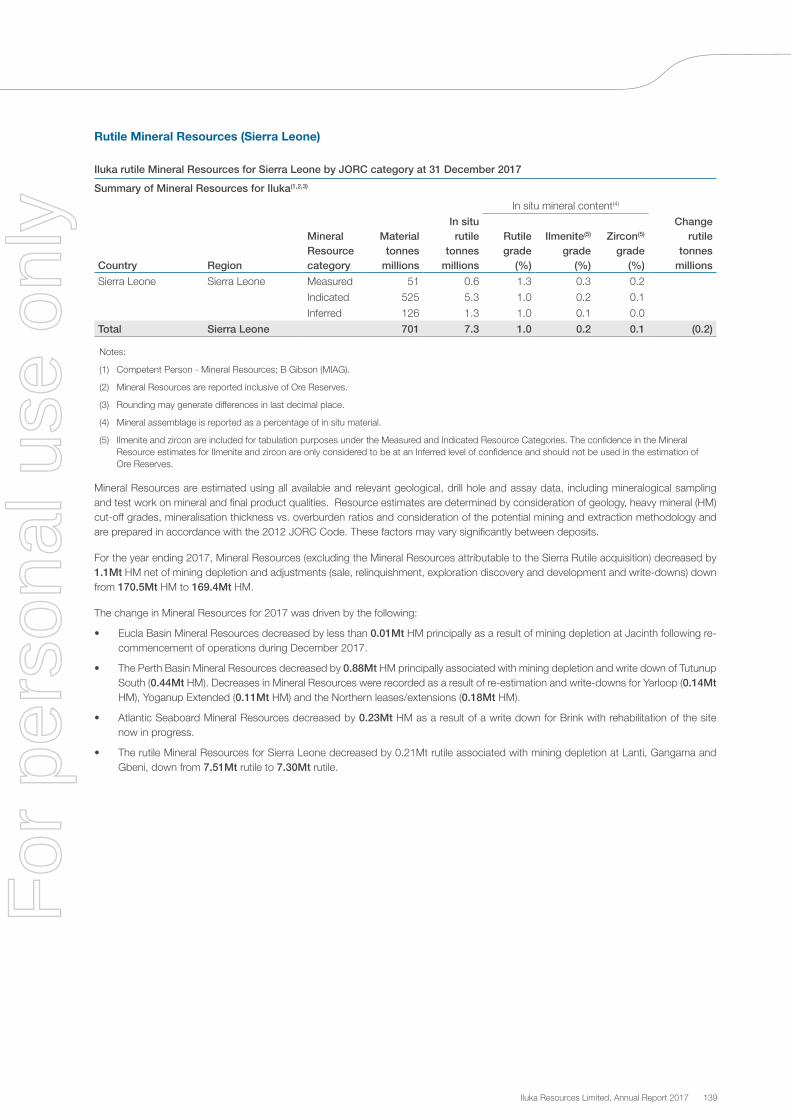
Iluka Resources Limited, Annual Report 2017 139
Iluka rutile Mineral Resources for Sierra Leone by JORC category at 31 December 2017
Summary of Mineral Resources for Iluka(1,2,3)
In situ mineral content(4)
Country Region
Mineral Resource category
Material tonnes
millions
In situ rutile
tonnesmillions
Rutile grade
(%)
Ilmenite(5)
grade(%)
Zircon(5)
grade(%)
Change rutile
tonnesmillions
Sierra Leone Sierra Leone Measured 51 0.6 1.3 0.3 0.2
Indicated 525 5.3 1.0 0.2 0.1
Inferred 126 1.3 1.0 0.1 0.0
Total Sierra Leone 701 7.3 1.0 0.2 0.1 (0.2)
Notes:
(1) Competent Person - Mineral Resources; B Gibson (MIAG).
(2) Mineral Resources are reported inclusive of Ore Reserves.
(3) Rounding may generate differences in last decimal place.
(4) Mineral assemblage is reported as a percentage of in situ material.
(5) Ilmenite and zircon are included for tabulation purposes under the Measured and Indicated Resource Categories. The confidence in the Mineral Resource estimates for Ilmenite and zircon are only considered to be at an Inferred level of confidence and should not be used in the estimation of Ore Reserves.
Mineral Resources are estimated using all available and relevant geological, drill hole and assay data, including mineralogical sampling and test work on mineral and final product qualities. Resource estimates are determined by consideration of geology, heavy mineral (HM) cut-off grades, mineralisation thickness vs. overburden ratios and consideration of the potential mining and extraction methodology and are prepared in accordance with the 2012 JORC Code. These factors may vary significantly between deposits.
For the year ending 2017, Mineral Resources (excluding the Mineral Resources attributable to the Sierra Rutile acquisition) decreased by 1.1Mt HM net of mining depletion and adjustments (sale, relinquishment, exploration discovery and development and write-downs) down from 170.5Mt HM to 169.4Mt HM.
The change in Mineral Resources for 2017 was driven by the following:
• Eucla Basin Mineral Resources decreased by less than 0.01Mt HM principally as a result of mining depletion at Jacinth following re-commencement of operations during December 2017.
• The Perth Basin Mineral Resources decreased by 0.88Mt HM principally associated with mining depletion and write down of Tutunup South (0.44Mt HM). Decreases in Mineral Resources were recorded as a result of re-estimation and write-downs for Yarloop (0.14Mt HM), Yoganup Extended (0.11Mt HM) and the Northern leases/extensions (0.18Mt HM).
• Atlantic Seaboard Mineral Resources decreased by 0.23Mt HM as a result of a write down for Brink with rehabilitation of the site now in progress.
• The rutile Mineral Resources for Sierra Leone decreased by 0.21Mt rutile associated with mining depletion at Lanti, Gangama and Gbeni, down from 7.51Mt rutile to 7.30Mt rutile.
Rutile Mineral Resources (Sierra Leone)
For
per
sona
l use
onl
y

140 Iluka Resources Limited, Annual Report 2017
Ore Reserves and Mineral Resources statement
HM Mineral Resources mined and adjusted
Iluka Mineral Resources mined and adjusted by country and region at 31 December 2017
Summary of Mineral Resource depletion(1)
Country Region Category
In situ HM
tonnesmillions
2016
In situ HM
grade(%)
2016
In situ HM
tonnesmillions
mined 2017
In situ HM
tonnes(2)
millionsadjusted
2017
In situ HM
tonnesmillions
2017
In situ HM
grade(%)
2017
In situ HM
tonnes(3)
millionsnet
change
Australia Eucla Basin Active mines 2.3 3.9 (0.0) 0.0 2.3 3.8 (0.0)Non-active sites 16.6 5.1 - - 16.6 5.1 -
Total Eucla Basin 18.9 4.9 (0.0) 0.0 18.9 4.9 (0.0)
Australia Murray Basin Active mines - - - - - - - Non-active sites 33.0 17.5 - - 33.0 17.5 -
Total Murray Basin 33.0 17.5 - - 33.0 17.5 - Australia Perth Basin Active mines 0.5 9.7 (0.2) (0.2) 0.0 8.5 (0.4)
Non-active sites 56.6 5.5 - (0.4) 56.1 5.6 (0.4)Total Perth Basin 57.0 5.5 (0.2) (0.7) 56.2 5.6 (0.9)
USA Atlantic Seaboard Active mines - - - - - - - Non-active sites 5.2 7.4 - (0.2) 5.0 4.5 (0.2)
Total Atlantic Seaboard 5.2 4.4 - (0.2) 5.0 4.5 (0.2)
Sri Lanka Sri Lanka Active mines - - - - - - - Non-active sites 56.3 8.2 - - 56.3 8.2 -
Total Sri Lanka 56.3 8.2 - - 56.3 8.2 -
Total Active mines 2.8 4.3 (0.2) (0.2) 2.3 3.9 (0.4)Total Non-active sites 167.7 7.1 - (0.7) 167.0 7.2 (0.7)Total Mineral Resources 170.5 7.0 (0.2) (0.9) 169.4 7.1 (1.1)
Notes:
(1) Rounding may generate differences in last decimal place.
(2) Adjusted figure includes write-downs and modifications in mine design.
(3) Net difference includes depletion by mining and adjustments.
Rutile Mineral Resources mined and adjusted (Sierra Leone)
Iluka rutile Mineral Resources mined and adjusted for Sierra Leone at 31 December 2017
Summary of Mineral Resource depletion(1)
Country Region Category
In situ rutile
tonnesmillions
2016
In situ rutile
grade(%)
2016
In situ rutile
tonnesmillions
mined 2017
In situ rutile
tonnes(2)
millionsadjusted
2017
In situ rutile
tonnesmillions
2017
In situ rutile
grade(%)
2017
In situ rutile
tonnes(3)
millionsnet
change
Sierra Leone Sierra Leone Active mines 2.0 1.2 (0.2) (0.0) 1.8 1.2 (0.2)Non-active sites 5.5 1.0 - - 5.5 1.0 -
Total Sierra Leone 7.5 1.0 (0.2) (0.0) 7.3 1.0 (0.2)
Notes:
(1) Rounding may generate differences in last decimal place.
(2) Adjusted figure includes write-downs and modifications in mine design.
(3) Net difference includes depletion by mining and adjustments.
For
per
sona
l use
onl
y

Iluka Resources Limited, Annual Report 2017 141
Annual statement of Mineral Resources and Ore Reserves
The Annual Statement of Mineral Resources and Ore Reserves as at 31 December 2017 presented in this report has been prepared in accordance with the Australasian Code for Reporting of Exploration Results, Mineral Resources and Ore Reserves 2012 Edition (the JORC Code 2012) and ASX listing rules and disclosed in the announcement dated the 20/2/2017. Information prepared and disclosed under the JORC Code 2004 edition which has not materially changed since last reported has not been updated. Iluka is not aware of any new information or data that materially affects the information included in this Annual Statement and confirms that the all the material assumptions and technical parameters underpinning the estimates in the relevant market announcement continue to apply and have not materially changed.
Competent Persons statement
The information in this report that relates to Mineral Resources is based on information compiled by Mr Brett Gibson who is a Member of the Australian Institute of Geoscientists.
The information in this report that relates to Ore Reserves is based on information compiled by Mr Chris Lee who is a member of the Australasian Institute of Mining and Metallurgy (AUSIMM).
Mr Gibson and Mr Lee are full-time employees of Iluka Resources.
Mr Gibson and Mr Lee have sufficient experience that is relevant to the styles of mineralisation and types of deposits under consideration and to the activity which is being undertaken to qualify as a Competent Person as defined in the 2012 Edition of the Australasian Code for Reporting of Exploration Results, Mineral Resources and Ore Reserves, the JORC Code 2012 Edition. Mr Gibson and Mr Lee consent to the inclusion in this report of the matters based on his information in the form and context in which it appears.
The information in this report that relates to specific Mineral Resources and Ore Reserves is based on and accurately reflects reports compiled by Competent Persons as defined in the JORC Code 2012 for each of the company regional business units. Each of these persons is a full-time employee of Iluka Resources Limited or its relevant subsidiaries, holds equity securities in Iluka Resources Limited and is entitled to participate in Iluka’s executive equity long term incentive plan, details of which are included in Iluka’s 2017 remuneration report.
All the Competent Persons named are Members of The Australasian Institute of Mining and Metallurgy and/or The Australian Institute of Geoscientists and/or the relevant jurisdiction Recognised Overseas Professional Organisation (ROPO) and have sufficient experience which is relevant to the styles of mineralisation and types of deposits under consideration and to the activity they are undertaking to qualify as a Competent Person as defined in the JORC Code 2012. At the reporting date, each Competent Person listed in this report is a full-time employee of Iluka Resources Limited or one of its subsidiaries. Each Competent Person consents to the inclusion of material in the form and context in which it appears.
All of the Mineral Resource and Ore Reserve figures reported represent estimates as at 31 December 2017. All tonnes and grade information has been rounded, hence small differences may be present in the totals. All of the Mineral Resource information is inclusive of Ore Reserves (i.e. Mineral Resources are not additional to Ore Reserves).
Mineral Resources and Ore Reserves corporate governance
Iluka has an established governance process supporting the preparation and publication of Mineral Resources and Ore Reserves which includes a series of structures and processes independent of the operational reporting through business units and product groups.
The Audit and Risk Committee has in its remit the governance of resources and reserves. This includes an annual review of Mineral Resources and Ore Reserves at a Group level, as well as review of findings and progress from the Group Resources and Reserves internal audit programme within the regular meeting schedule.
Mineral Resources and Ore Reserves are estimated by Iluka personnel or suitably qualified independent personnel using industry standard techniques and supported by internal guidelines for the estimation and reporting of Mineral Resources and Ore Reserves.
All Mineral Resources and Ore Reserves estimates and supporting documentation is reviewed by Competent Persons employed by Iluka. If there is a material change in the estimate of a Mineral Resource, the modifying factors for the preparation of Ore Reserves, or reporting an inaugural Mineral Resource and Ore Reserve and if it is considered prudent to have an external review then the estimate and supporting documentation in question is reviewed by a suitably qualified independent Competent Person.
The Iluka Mineral Resource and Ore Reserve position is reviewed annually by a suitably qualified independent Competent Person prior to publication and the governance process is also audited by an independent body (PwC).
Iluka has continued the development of internal systems and controls in order to meet JORC (2012) guidelines in all external reporting including the preparation of all reported data by Competent Persons as members of The Australasian Institute of Mining and Metallurgy (The AusIMM), The Australian Institute of Geoscientists (AIG) or ROPOs.
The establishment of an enhanced governance process has also been supported by a number of process improvements and training initiatives over recent years, including a web-based group reporting and sign-off database, annual internal Competent Person reports and Competent Person development and training.
For
per
sona
l use
onl
y

142 Iluka Resources Limited, Annual Report 2017
Shareholder and investor informationAs at 31 January 2018
Australian Securities Exchange listing
Iluka’s shares are listed on the Australian Securities Exchange (ASX) Limited. The company is listed as “Iluka” with an ASX code of ILU.
Shares on issue
The company had 418,701,360 shares on issue as at 31 January 2018. A total of 767,470 ordinary shares are restricted pursuant to the directors, executives and employees share acquisition plan, equity incentive plan and employee share plan.
Shareholdings
There were 19,780 shareholders. Voting rights, on a show of hands, are one vote for every registered holder and on a poll, are one vote for each share held by registered holders.
Distribution of shareholdings
Size of shareholding Number of holders
1 - 1,000 11,322
1,001 - 5,000 6,740
5,001 - 10,000 1,055
10,001 - 100,000 611
100,001 - 1,000,000 35
1,000,001 and over 17
Unmarketable parcel (less than $500) 1,153
Top 20 shareholders (nominee company holdings)
Shareholder Number of shares % of issued capital
HSBC Custody Nominees (Australia) Limited 135,179,604 32.29
J P Morgan Nominees Australia Limited 85,768,549 20.48
Citicorp Nominees Pty Limited 49,913,479 11.92
National Nominees Limited 44,842,729 10.71
BNP Paribas Noms Pty Ltd (DRP) 18,296,623 4.37
BNP Paribas Nominees Pty Ltd (Agency Lending DRP) 12,475,353 2.98
HSBC Custody Nominees (Australia) Limited 3,362,723 0.80
Australian Foundation Investment Company Limited 2,367,000 0.57
Citicorp Nominees Pty Limited 2,230,496 0.53
National Nominees Limited 1,850,000 0.44
(Agency Lending Collateral) 1,833,000 0.44
Argo Investments Limited 1,700,000 0.41
AMP Life Limited 1,511,605 0.36
Australian Foundation Investment Company Limited 1,275,000 0.30
CS Third Nominees Pty Limited 1,187,012 0.28
R O Henderson (Beehive) Pty Limited 1,145,000 0.27
UBS Nominees Pty Ltd 1,074,662 0.26
SBN Nominees Pty Limited 1,000,000 0.24
BNP Paribas Noms (NZ) Ltd (DRP) 909,713 0.22
Mirrabooka Investments Limited 900,000 0.21
Substantial shareholders (as provided in disclosed substantial shareholder notices to the company)
Shareholder Size of shareholding % of issued capital
Schroder Investment Management Australia Limited 36,429,953 8.70%
Blackrock Investment Management (Australia) Limited 35,260,285 8.42%
Cooper Investors Pty Limited 27,325,760 6.53%
Sumitomo Mitsu Trust Holdings, Inc (SMTH) 25,794,175 6.16%
Paradice Investment Management Pty Ltd 22,335,344 5.33%
For
per
sona
l use
onl
y

Iluka Resources Limited, Annual Report 2017 143
Calendar of key events 2018
27 February Announcement of financial results
19 April March quarter report
22 April 9:30am (WST) Closure of acceptances of proxies for AGM
24 April 9:30am (WST) Annual General Meeting – Perth
24 July June quarter report
15 August Announcement of half year financial results
26 October September quarter report
31 December 31 December financial year end
All dates are indicative and subject to change. Shareholders are advised to check with the company to confirm timings.
Shareholder and new investor information
Key shareholder information – Iluka website
To assist those considering an investment in the company, the investors and media section of the Iluka website contains key shareholder information, which includes the calendar of events.
This site contains information on Iuka’s products, marketing, operations, ASX releases and financial and quarterly reports. It also contains links to other sites, including the share registry.
Investor relations enquiries
Adele StrattonGeneral Manager Finance, Investor Relations and Corporate AffairsLevel 23, 140 St Georges TerracePerth WA 6000Telephone: +61 8 9360 463Mobile: +61 415 999 005Email: [email protected]
Dividends
Iluka’s Board of directors typically makes each determination on dividend payments twice a year. Iluka will be operating a dividend reinvestment plan (DRP) in 2018.
Share registry services
Shareholders who require information about their shareholdings, dividend payments or related administrative matters should contact the company’s share registry:
Computershare Investor Services Pty Limited Level 11, 172 St Georges Terrace Perth, WA 6000 Telephone: 1300 733 043 (within Australia) or +61 3 9415 4000 (outside Australia) Facsimile: +61 3 9473 2500
Postal address GPO Box 2975Melbourne VIC 3001Website: www.investorcentre.com
Annual reports and email notification of major accounts
Shareholders can elect to receive a printed copy of the Annual Report and/or receive an email notification related to major company events. Please contact Computershare.
Each enquiry should refer to the shareholder number which is shown on issuer-sponsored holding statements and dividend statements.
For
per
sona
l use
onl
y

144 Iluka Resources Limited, Annual Report 2017
Corporate information
Company details
Iluka Resources Limited ABN: 34 008 675 018
Registered office
Level 23, 140 St Georges Terrace Perth, Western Australia, 6000
Postal address
GPO Box U1988 Perth, Western Australia, 6845 Australia Telephone: +61 8 9360 4700 Facsimile: +61 8 9360 4777
Company Secretary
Sue Wilson, Company SecretaryNigel Tinley, Joint Company Secretary
Website
www.iluka.com
The site contains information on Iluka’s products, marketing, operations, ASX releases and financial and quarterly reports. It also contains links to other sites, including the share registry.
Notice of Annual General Meeting
Iluka’s 63rd Annual General Meeting of Shareholders will be held in River View Room 5 at the Perth Convention and Exhibition Centre, 21 Mounts Bay Road, Perth, Western Australia, on Tuesday, 24 April 2018 commencing at 9:30am (WST).
Disclaimer – forward-looking statements
This document has been prepared by Iluka Resources Limited (Iluka). By viewing this document you acknowledge that you have read and understood the following statement.
Forward-looking statements
This document contains certain statements which constitute “forward-looking statements”.
Often, but not always, forward-looking statements can generally be identified by the use of forward-looking words such as “may”, “will”, “expect”, “plan”, “believes”, “estimate”, “anticipate”, “outlook” and “guidance”, or similar expressions, and may include, without limitation, statements regarding plans; strategies and objectives of management; anticipated production and production potential; estimates of future capital expenditure or construction commencement dates; expected costs or production outputs; estimates of future product supply, demand and consumption; statements regarding future product prices; and statements regarding the expectation of future Mineral Resources and Ore Reserves.
Where Iluka expresses or implies an expectation or belief as to future events or results, such expectation or belief is expressed in good faith and on a reasonable basis. No representation or warranty, express or implied, is made by Iluka that the matters stated in this document will in fact be achieved or prove to be correct.
The information is based on Iluka forecasts and as such is subject to variation related to, but not restricted to, economic, market demand/supply and competitive factors. It is Iluka’s approach to modify its production settings based on market demand, and this can have a significant effect on operational parameters and associated physical and financial characteristics of the company.
Forward-looking statements are only predictions and are subject to known and unknown risks, uncertainties, assumption and other important factors that could cause the actual results, performances or achievements of Iluka to differ materially from future results, performances or achievements expressed, projected or implied by such forward-looking statements. Readers are cautioned not to place undue reliance on these forward-looking statements, which speak only as of the date thereof. Such risks and factors include, but are not limited to: changes in exchange rate assumptions; changes in product pricing assumptions; major changes in mine plans and/or resources; changes in equipment life or capability; emergence of previously underestimated technical challenges; increased costs and demand for production inputs; and environmental or social factors which may affect a licence to operate, including political risk.
Capital estimates include contingency and risk allowances commensurate with international estimating classification systems.
For
per
sona
l use
onl
y

Iluka Resources Limited, Annual Report 2017 145
To the extent permitted by law, Iluka, its officers, employees and advisors expressly disclaim any responsibility for the accuracy or completeness of the material contained in this document and exclude all liability whatsoever (including in negligence) for any loss or damage which may be suffered by a person as a consequence of any information in this document or any error or omission therefrom. Iluka does not undertake to release publicly any revisions to any forward-looking statement to reflect events or circumstances after the date of this document, or to reflect the occurrence of unanticipated events, except as may be required under applicable securities laws.No independent third party has reviewed the reasonableness of the forward-looking statements or any underlying assumptions.
Non-IFRS financial information
This document contains non-IFRS financial measures including cash production costs, non-production costs, mineral sands EBITDA, Underlying Group EBITDA, EBIT, free cash flow, and net debt amongst others. Iluka management considers these to be key financial performance indicators of the business and they are defined and/or reconciled in Iluka’s annual results materials and/or Annual Report. Non-IFRS measures have not been subject to audit or review.
All figures are expressed in Australian dollars unless stated otherwise.
Insi
ght
Com
mun
icat
ion
& D
esig
n
For
per
sona
l use
onl
y

www.iluka.com
For
per
sona
l use
onl
y