For personal use only - ASX2017/08/17 · Refer slide 31 and WES ASX Announcements 2016 Full Year...
37
Viva Energy REIT HY2017 Results 30 June 2017 17 August 2017 For personal use only
Transcript of For personal use only - ASX2017/08/17 · Refer slide 31 and WES ASX Announcements 2016 Full Year...

Viva Energy REIT
HY2017 Results30 June 2017
17 August 2017
For
per
sona
l use
onl
y

Disclaimer:
This presentation has been prepared by Viva Energy REIT
(“VVR” or “Viva Energy REIT”) which is a stapled entity
comprising a share in Viva Energy REIT Limited (ABN 35 612
986 517) stapled with a unit in the Viva Energy REIT Trust
(ARSN 613 146 464). VER Limited (ABN 46 609 868 000 and
AFSL 483795) is the Responsible Entity of the Viva Energy
REIT Trust, and VER Manager Pty Ltd provides management
services to VER Limited and Viva Energy REIT.
The financial information is presented on both a statutory basis
(prepared in accordance with Australian accounting standards
which include Australian equivalent to International Financial
Reporting Standards (IFRS) as well as information provided on
a non-IFRS basis. VVR considers that the non-IFRS financial
information is important to assist in evaluating VVR’s
performance. The information is presented to assist in making
appropriate comparisons with prior periods and to assess the
operating performance of VVR’s business. The information
provided in this presentation should be considered together with
the financial statements, ASX announcements and other
information available on the VVR website
www.vivaenergyreit.com.au. For a reconciliation of the non-IFRS
financial information to IFRS-compliant comparative information,
please refer to slide 13 in this Presentation.
The information is in summary form and does not purport to be
complete. This presentation is for information purposes only, is
of a general nature, does not constitute financial product advice,
nor is it intended to constitute legal, tax or accounting advice or
opinion. It does not constitute in any jurisdiction, whether in
Australia or elsewhere, an invitation to apply for or purchase
stapled securities of VVR or any other financial product.
The distribution of this presentation outside Australia may be
restricted by law. Any recipient of this presentation outside
Australia must seek advice on and observe any such
restrictions.
This presentation has been prepared without taking into account
the investment objectives, financial situation or particular needs
of any particular person. Investors must rely on their own
examination of VVR, including the merits and risks involved.
Each person should consult a professional investment adviser
before making any decision regarding a financial product. In
preparing this presentation the authors has relied upon and
assumed, without independent verification, the accuracy and
completeness of all information available from public sources or
which has otherwise been reviewed in preparation of the
presentation. All reasonable care has been taken in preparing
the information and assumptions contained in this presentation,
however no representation or warranty, express or implied, is
made as to the fairness, accuracy, completeness or correctness
of the information, opinions and conclusions contained in this
presentation. The information contained in this presentation is
current as at the date of this presentation and is subject to
change without notice.
Past performance is not a reliable indicator of future
performance. To the extent that certain statements in this
presentation may constitute ‘forward-looking statements’ or
statements about ‘future matters’, the information reflects VVR’s
intent, belief or expectations at the date of this presentation.
Such prospective financial information contained within
this presentation may be unreliable given the circumstances and
the underlying assumptions to this information may materially
change in the future.
Neither Viva Energy REIT, VER Manager Pty Ltd, nor any of
their associates, related entities or directors, give any warranty
as to the accuracy, reliability or completeness of the information
contained in this presentation.
Except to the extent liability under any applicable laws
cannot be excluded and subject to any continuing obligations
under the ASX listing rules, VER Manager Pty Ltd, Viva Energy
REIT and its associates, related entities, directors, employees
and consultants do not accept and expressly disclaim any
liability for any loss or damage (whether direct, indirect,
consequential or otherwise) arising from the use of, or
reliance on, anything contained in or omitted from this
presentation.
Any forward-looking statements, including projections, guidance
on future revenues, earnings and estimates, are provided as a
general guide only and should not be relied upon as an
indication or guarantee of future performance. Forward-looking
statements involve known and unknown risks, uncertainties and
other factors that may cause VVR’s actual results, performance
or achievements to differ materially from any future results,
performance or achievements expressed or implied
by these forward-looking statements. Any forward-looking
statements, opinions and estimates in this presentation are
based on assumptions and contingencies which are subject to
change without notice, as are statements about market and
industry trends, which are based on interpretations of current
market conditions. For example, the factors that
are likely to affect the results of VVR include, but are not limited
to, general economic conditions in Australia, exchange rates,
competition in the markets in which VVR operates and the
inherent regulatory risks in the business of VVR.
You should rely on your own independent assessment of any
information, statements or representations contained in this
presentation and any reliance on information in this presentation
will be entirely at your own risk.
This presentation may not be reproduced or published, in whole
or in part, for any purpose without the prior written permission of
VVR.
2
Cover image: Shell Coles Express Annerley, QLD
For
per
sona
l use
onl
y

Contents
Highlights 4
Half Year Financial Results 11
Portfolio & Acquisition Update 16
Industry Update 22
Viva Energy Australia Update 26
FY2017 Outlook 31
Questions 35
Appendix 36
3
For
per
sona
l use
onl
y
Highlights
Shell Coles Express West Ryde, NSW
4
Margaret Kennedy
Managing Director
VER Manager Pty Ltd
For
per
sona
l use
onl
y
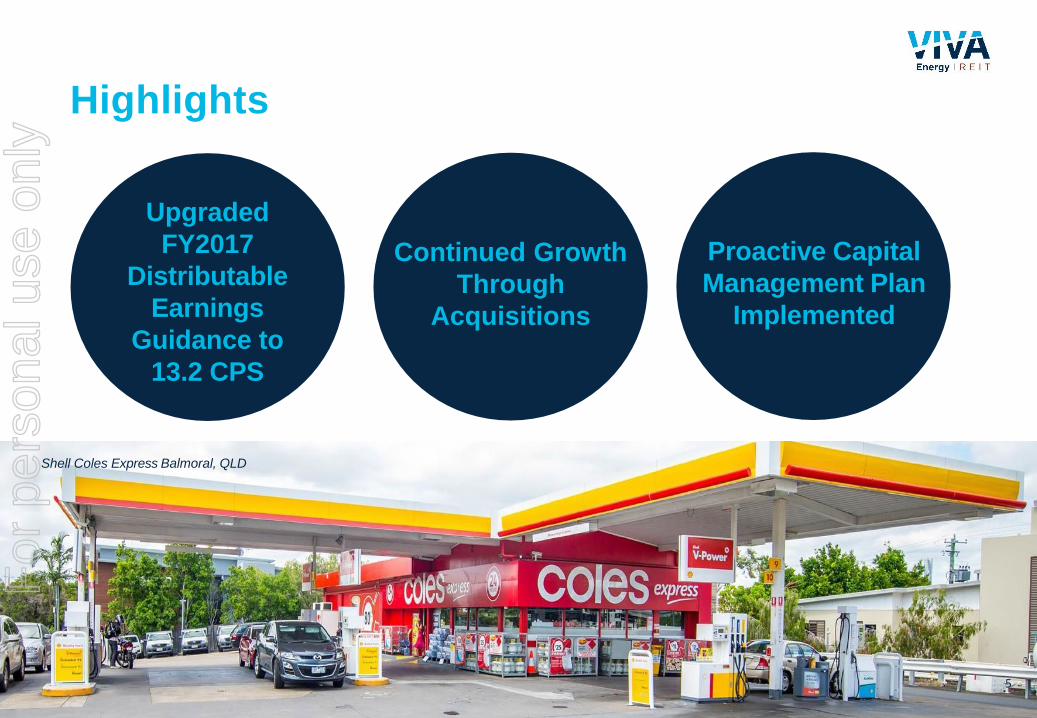
Highlights
Upgraded
FY2017
Distributable
Earnings
Guidance to
13.2 CPS
Continued Growth
Through
Acquisitions
Proactive Capital
Management Plan
Implemented
Shell Coles Express Balmoral, QLD
5
For
per
sona
l use
onl
y
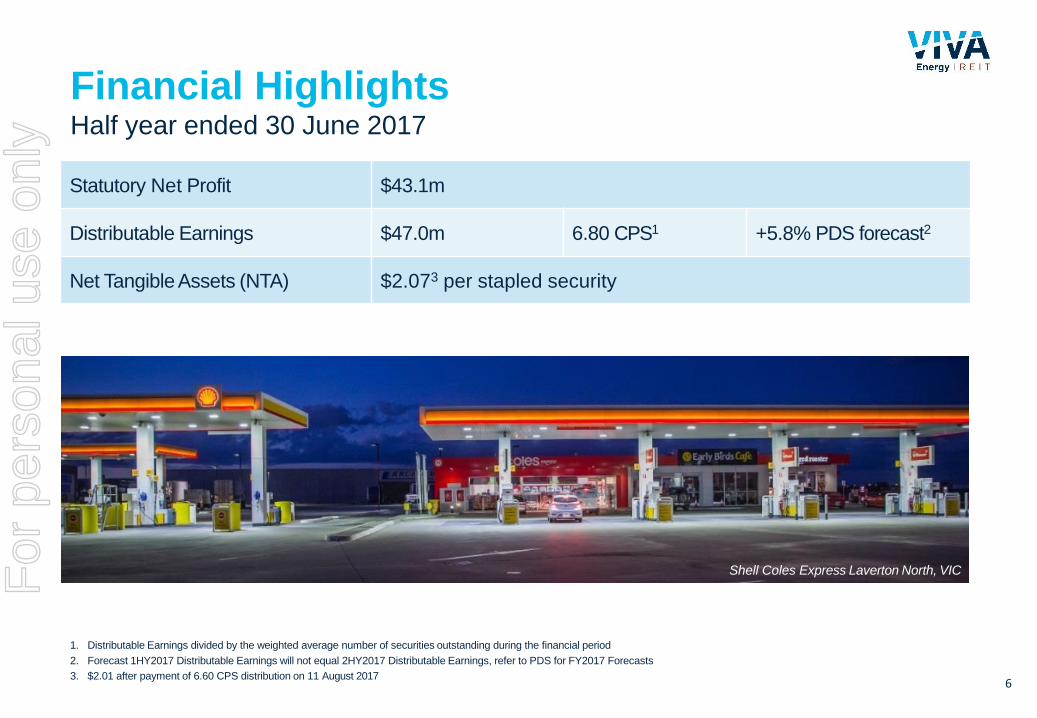
Financial HighlightsHalf year ended 30 June 2017
Statutory Net Profit $43.1m
Distributable Earnings $47.0m 6.80 CPS1 +5.8% PDS forecast2
Net Tangible Assets (NTA) $2.073 per stapled security
6
1. Distributable Earnings divided by the weighted average number of securities outstanding during the financial period
2. Forecast 1HY2017 Distributable Earnings will not equal 2HY2017 Distributable Earnings, refer to PDS for FY2017 Forecasts
3. $2.01 after payment of 6.60 CPS distribution on 11 August 2017
Shell Coles Express Laverton North, VICFor
per
sona
l use
onl
y
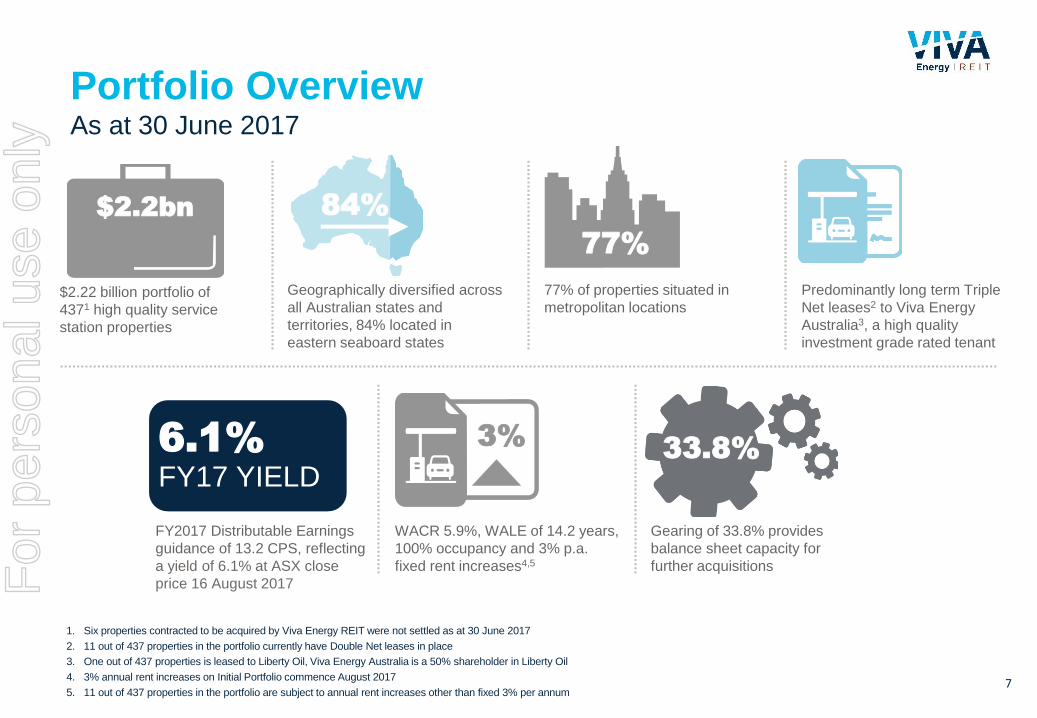
Portfolio OverviewAs at 30 June 2017
1. Six properties contracted to be acquired by Viva Energy REIT were not settled as at 30 June 2017
2. 11 out of 437 properties in the portfolio currently have Double Net leases in place
3. One out of 437 properties is leased to Liberty Oil, Viva Energy Australia is a 50% shareholder in Liberty Oil
4. 3% annual rent increases on Initial Portfolio commence August 2017
5. 11 out of 437 properties in the portfolio are subject to annual rent increases other than fixed 3% per annum
$2.22 billion portfolio of
4371 high quality service
station properties
$2.2bn
Geographically diversified across
all Australian states and
territories, 84% located in
eastern seaboard states
77% of properties situated in
metropolitan locations
Predominantly long term Triple
Net leases2 to Viva Energy
Australia3, a high quality
investment grade rated tenant
FY2017 Distributable Earnings
guidance of 13.2 CPS, reflecting
a yield of 6.1% at ASX close
price 16 August 2017
WACR 5.9%, WALE of 14.2 years,
100% occupancy and 3% p.a.
fixed rent increases4,5
Gearing of 33.8% provides
balance sheet capacity for
further acquisitions
77%
84%
33.8%3%6.1%
FY17 YIELD
7
For
per
sona
l use
onl
y
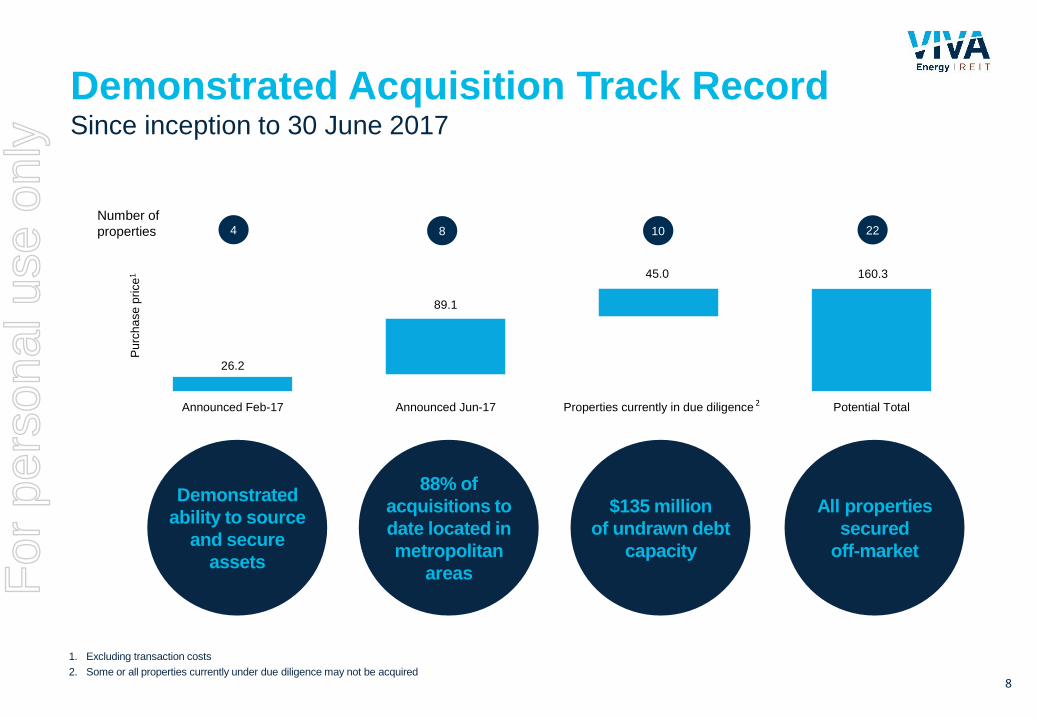
Demonstrated
ability to source
and secure
assets
1. Excluding transaction costs
2. Some or all properties currently under due diligence may not be acquired
88% of
acquisitions to
date located in
metropolitan
areas
$135 million
of undrawn debt
capacity
All properties
secured
off-market
2
Demonstrated Acquisition Track RecordSince inception to 30 June 2017
8
26.2
160.3
89.1
45.0
Announced Feb-17 Announced Jun-17 Properties currently in due diligence Potential Total
Pu
rch
ase
pri
ce
1
Number of
properties 4 8 10 22
For
per
sona
l use
onl
y

1. Total purchase price excluding transaction costs
2. Weighted by contract price excluding transaction costs
3. Some or all properties currently under due diligence may not be acquired
Total contracted acquisitions since inception to 30 June 2017
Total contracted
acquisitions
$115.31 million
12 properties,
88% situated in
metropolitan
areas
$9.6m average
purchase price1
WACR2 5.9% WALE 9.9 years
9
Acquisition Highlights
For
per
sona
l use
onl
y

Strategy
1. Refer slide 31 and WES ASX Announcements 2016 Full Year Results, 2015 Full Year Results & 2014 Full Year Results
2. 11 out of 437 properties in the portfolio have Double Net Leases
3. 11 out of 437 properties in the portfolio are subject to annual rent increases other than fixed 3% per annum
10
Market Leading National Retail Fuel & Convenience Distribution Platform
Irreplicable
high quality
strategically
located retail
fuel &
convenience
properties
Strong growth
in Coles
convenience
store sales1
100%
occupancy,
predominantly
long term
Triple Net
Leases2 to
investment
grade rated
and other
high quality
tenants
Organic
earnings
growth
through
unlevered 3%
annual rent
increases3
Inorganic
earnings
growth
through
ongoing
acquisitions
Portfolio
underpinned
by quality real
estate assets
For
per
sona
l use
onl
y
11
Guy FarrandsChief Financial OfficerVER Manager Pty Ltd
Financial Results
Shell Coles Express Coorparoo, QLDFor
per
sona
l use
onl
y

12
Statutory Financial Performance
Statutory Profit and Loss $mHY2017 Actual HY2017 PDS
Forecast1
REVENUE
Gross property income 63.2 61.8
Straight lining of rental income 15.2 15.2
Interest income 0.3 0.5
Total revenue 78.7 77.5
EXPENSES
Interest expense (14.9) (15.3)
Board and Management expenses (2.4) (3.4)
Total operating expenses (17.3) (18.7)
Net operating profit 61.4 58.8
Fair value adjustments on investment properties (3.1) -
Straight lining adjustment on fair value of investment
properties2 (15.2) (15.2)
Net profit 43.1 43.6
1. Forecast 1HY2017 Distributable Earnings will not equal 2HY2017 Distributable Earnings, refer to PDS for FY2017 Forecasts
2. Straight lining of rental income adjustment on fair value of investments properties included in PDS forecast to enable like for like comparison
For
per
sona
l use
onl
y
13
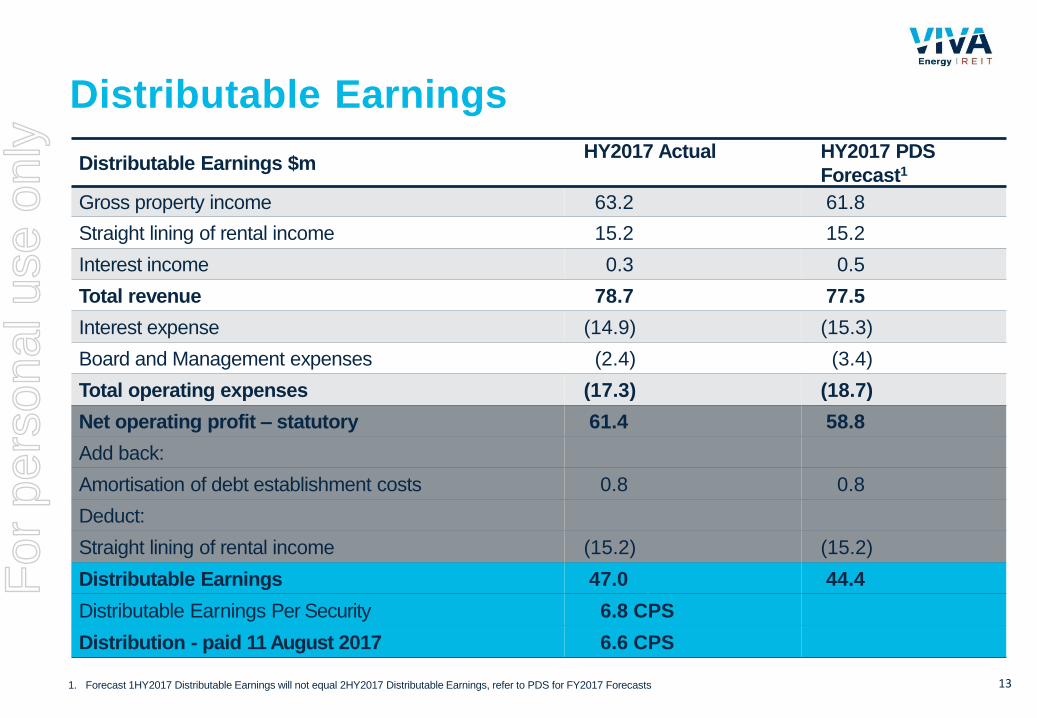
Distributable Earnings
Distributable Earnings $mHY2017 Actual HY2017 PDS
Forecast1
Gross property income 63.2 61.8
Straight lining of rental income 15.2 15.2
Interest income 0.3 0.5
Total revenue 78.7 77.5
Interest expense (14.9) (15.3)
Board and Management expenses (2.4) (3.4)
Total operating expenses (17.3) (18.7)
Net operating profit – statutory 61.4 58.8
Add back:
Amortisation of debt establishment costs 0.8 0.8
Deduct:
Straight lining of rental income (15.2) (15.2)
Distributable Earnings 47.0 44.4
Distributable Earnings Per Security 6.8 CPS
Distribution - paid 11 August 2017 6.6 CPS
1. Forecast 1HY2017 Distributable Earnings will not equal 2HY2017 Distributable Earnings, refer to PDS for FY2017 Forecasts
For
per
sona
l use
onl
y

14
Financial Position
• Directors valuations of investment properties undertaken as at 30 June 2017
• Properties must be independently valued at least every three years on a rolling annual basis commencing
as at 31 December 2017
Balance Sheet $m 30 June 2017
Cash 1191
Investment properties 2,1452
Fair value of interest rate swaps 6
Prepayments and deposits 5
Total Assets 2,275
Accounts payable and accruals 24
Borrowings 742
Total Liabilities 766
Net Assets 1,509
Net Tangible Assets Per Security $2.073
1. Prior to payment of HY2017 distribution of $48 million paid 11 August 2017
2. Does not include six properties contracted to be acquired by Viva Energy REIT which were not settled as at 30 June 2017
3. $2.01 after payment of 6.60 CPS distribution on 11 August 2017
For
per
sona
l use
onl
y

Capital ManagementAs at 30 June 2017
15
Gearing at 33.8% and FY17 ICR expected to be greater than 4.1X
Target gearing range between 35% to 45%
Drawn debt has been 98.7% hedged for a weighted average 3.1 years at an average
interest rate of 3.72%
Unsecured borrowings with no priority security
Additional $90 million 3 years revolving credit facility and $60 million acquisition loan
facility implemented; these facilities are expected to be used primarily to fund growth
opportunities
Successful institutional equity placement raised approximately $80 million (before costs)
at $2.31 per security in late June 2017
For
per
sona
l use
onl
y
Portfolio & Acquisition
Update
Shell Coles Express Ultimo, NSW
16
Margaret Kennedy
For
per
sona
l use
onl
y

Portfolio Overview
Properties Book Value
($m)
Average
Property
($m)
WACR2
R2
WALE
(years)
Metropolitan 313 1,709 5.5 5.6% 14.4
Regional 124 511 4.1 6.8% 13.6
Total 4371 2,2201 5.1 5.9% 14.2
1. Includes six properties contracted to be acquired by Viva Energy REIT which were not settled as at 30 June 2017
2. Weighted by contract price excluding transaction costs
17
Shell Coles Express Laverton North, VIC
For
per
sona
l use
onl
y
Portfolio Profile
Portfolio metropolitan and regional split
Portfolio geographic diversification
18
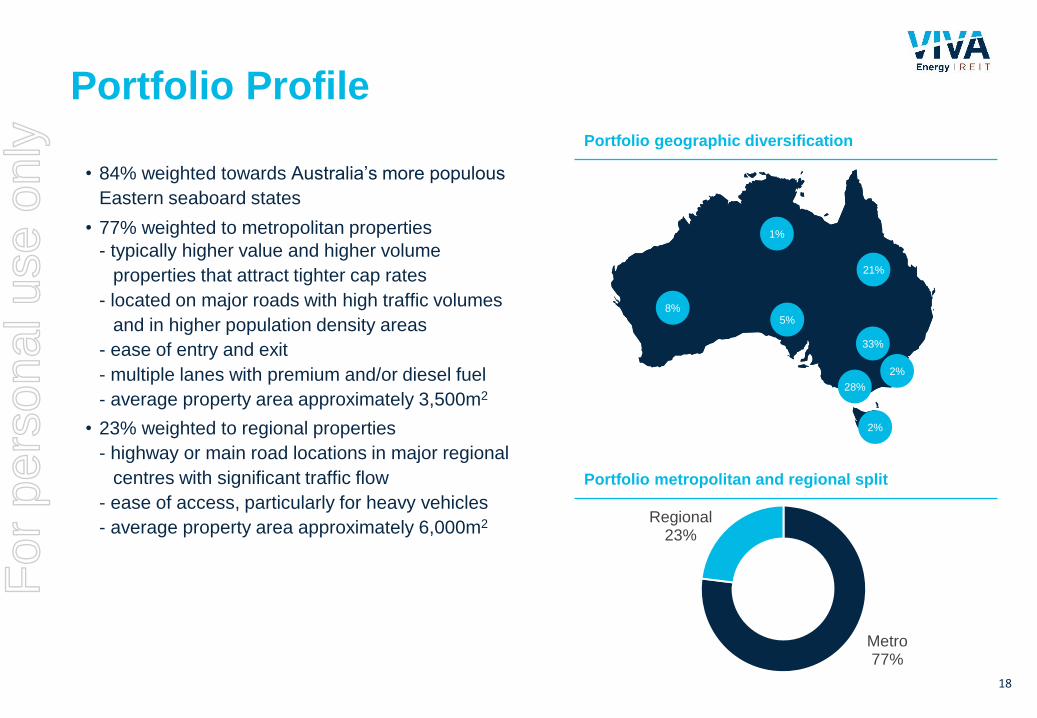
Metro77%
Regional23%
8%
1%
5%
21%
28%
2%
2%
33%
• 84% weighted towards Australia’s more populous
Eastern seaboard states
• 77% weighted to metropolitan properties
- typically higher value and higher volume
properties that attract tighter cap rates
- located on major roads with high traffic volumes
and in higher population density areas
- ease of entry and exit
- multiple lanes with premium and/or diesel fuel
- average property area approximately 3,500m2
• 23% weighted to regional properties
- highway or main road locations in major regional
centres with significant traffic flow
- ease of access, particularly for heavy vehicles
- average property area approximately 6,000m2
For
per
sona
l use
onl
y

• 100% occupancy
• 3% per annum fixed rental growth commencing August 20171
Portfolio Lease Profile
1. 11 out of 437 properties in the portfolio are subject to annual rent increases other than fixed 3% per annum
19
0.4% 0.4% 0.7% 0.3%
4.9% 5.7%
7.2% 8.2%
7.1%
10.9%
14.9%
17.0%
22.4%
0.0%
5.0%
10.0%
15.0%
20.0%
25.0%
2017 2018 2019 2020 2021 2022 2023 2024 2025 2026 2027 2028 2029 2030 2031 2032 2033 2034
% o
f in
com
e
Year of lease expiry
Portfolio WALE – by income
For
per
sona
l use
onl
y
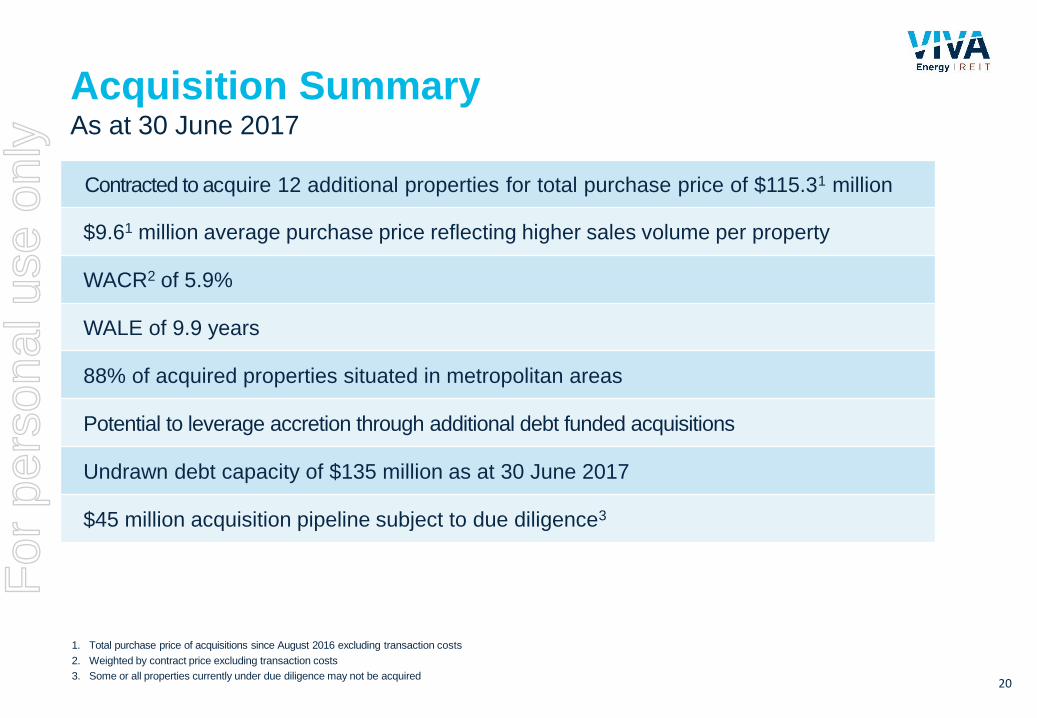
Contracted to acquire 12 additional properties for total purchase price of $115.31 million
$9.61 million average purchase price reflecting higher sales volume per property
WACR2 of 5.9%
WALE of 9.9 years
88% of acquired properties situated in metropolitan areas
Potential to leverage accretion through additional debt funded acquisitions
Undrawn debt capacity of $135 million as at 30 June 2017
$45 million acquisition pipeline subject to due diligence3
Acquisition SummaryAs at 30 June 2017
1. Total purchase price of acquisitions since August 2016 excluding transaction costs
2. Weighted by contract price excluding transaction costs
3. Some or all properties currently under due diligence may not be acquired20
For
per
sona
l use
onl
y
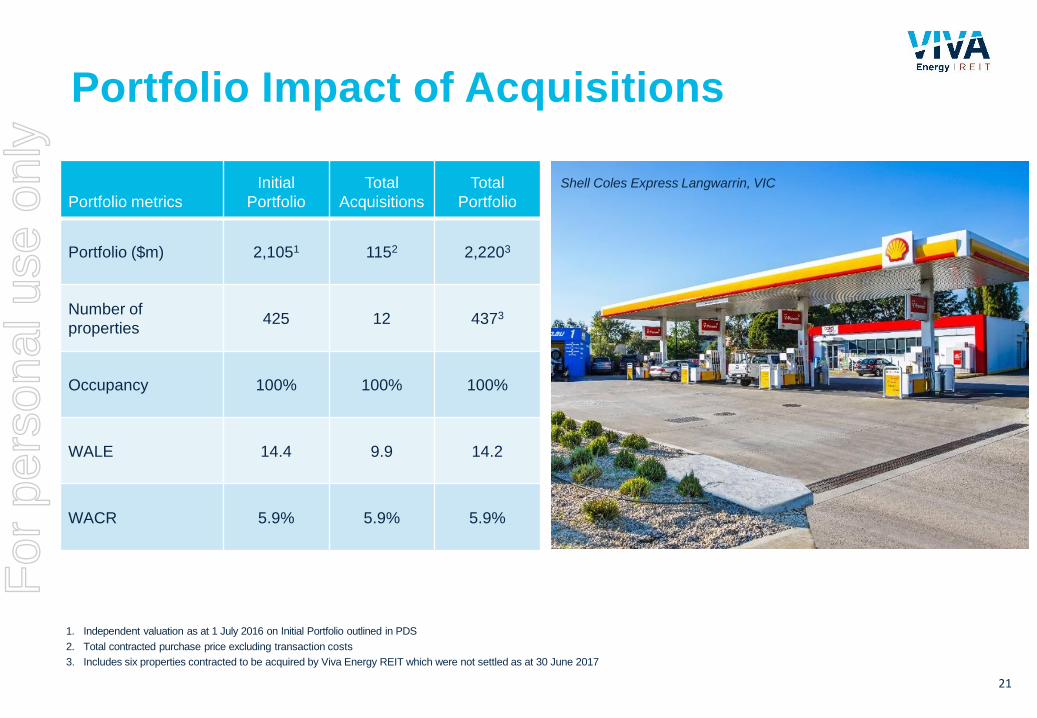
Portfolio metrics
Initial
Portfolio
Total
Acquisitions
Total
Portfolio
Portfolio ($m) 2,1051 1152 2,2203
Number of
properties425 12 4373
Occupancy 100% 100% 100%
WALE 14.4 9.9 14.2
WACR 5.9% 5.9% 5.9%
1. Independent valuation as at 1 July 2016 on Initial Portfolio outlined in PDS
2. Total contracted purchase price excluding transaction costs
3. Includes six properties contracted to be acquired by Viva Energy REIT which were not settled as at 30 June 2017
Shell Coles Express Langwarrin, VIC
Portfolio Impact of Acquisitions
21
For
per
sona
l use
onl
y
22
Shell Coles Express Rouse Hill, NSW
22
Industry
Update
Margaret Kennedy
For
per
sona
l use
onl
y

ACCC flags
preliminary concerns
regarding BP’s
proposed acquisition of
Woolworths fuel
business
Convenience Retail
REIT (ASX: CRR)
admitted to
Official List of ASX
Caltex Australia
Ltd (ASX:CTX)
completes acquisition
of Milemaker
Shell Coles Express Balmoral, QLD
Industry Participants
23
For
per
sona
l use
onl
y

Source: Jones Lang LaSalle Advisory Services Pty Limited (JLL) Market Report 30 June 2017 for VER Manager Pty Ltd as Manager of Viva Energy REIT. Yields are net initial yields based upon
net passing income at the time of sale and are based on a sample of service station sales through metropolitan and regional Australia during 2016 and 2017. This sales data is intended to provide
an indication only, JLL are not representing that every sale within the Sector has been captured within the sample. JLL accepts no liability for any inaccuracies contained in the information that
has been sourced from a variety of industry sources, or for conclusions which are drawn either wholly or partially from that information. No responsibility is accepted to any third parties.
CRR IPO Portfolio
VVR Portfolio
• 2016 sales
• 2017 sales
Retail Fuel & Convenience Property Sales2016 & 2017 year to date
24
2.0%
3.0%
4.0%
5.0%
6.0%
7.0%
8.0%
9.0%
0.00 5.00 10.00 15.00 20.00
Init
ial Y
ield
Remaining Lease Term in Years
Liquid
market
Yields
reflective of
quality
For
per
sona
l use
onl
y

Electric Vehicle Sales in Australia: 2011 - 20162
Electric Vehicles in Australia
There is considerable variance in forecast uptake of electric vehicles (EV) in Australia
Purchase price of EVs are not currently subsidised in Australia
Over 1.18 million sales of new motor vehicles in Australia to year ended 31 December 20161
- 68 full EV and 701 plug-in hybrid EV sales during the period2
- EV sales in Australia fell 35% from 2015 to 20162
1. ABS New Motor Vehicle Sales data
2. Federal Chamber of Automotive Industries New Vehicles Sales data (VFACTS); excludes Tesla sales - Tesla does not publicly release new vehicle sales data
EV sales
represented less
than 0.1% of total
new vehicle sales
in Australia
in 201649
253 293
11381195
769
0
200
400
600
800
1000
1200
1400
2011 2012 2013 2014 2015 2016
25
For
per
sona
l use
onl
y
26
Viva Energy
Australia Update
Shell Coles Express Bunker Hill, VIC
26
This section includes information regarding Viva Energy Australia Pty Ltd and its affiliates and their collective operations (Viva Energy Australia). The information is provided for
background purposes only, and neither Viva Energy REIT, nor the representatives of Viva Energy REIT or VER Manager, do or will make any representation about the performance or
operations of Viva Energy Australia. Further, Viva Energy Australia makes no representations (about itself, Viva Energy REIT or VER Manager) in this presentation, and does not assume
responsibility for the contents of this presentation. General information is sourced from publicly available information (including the PDS), or where relevant, specific data sourced from
Viva Energy Australia has been referenced as such.
Margaret Kennedy
For
per
sona
l use
onl
y
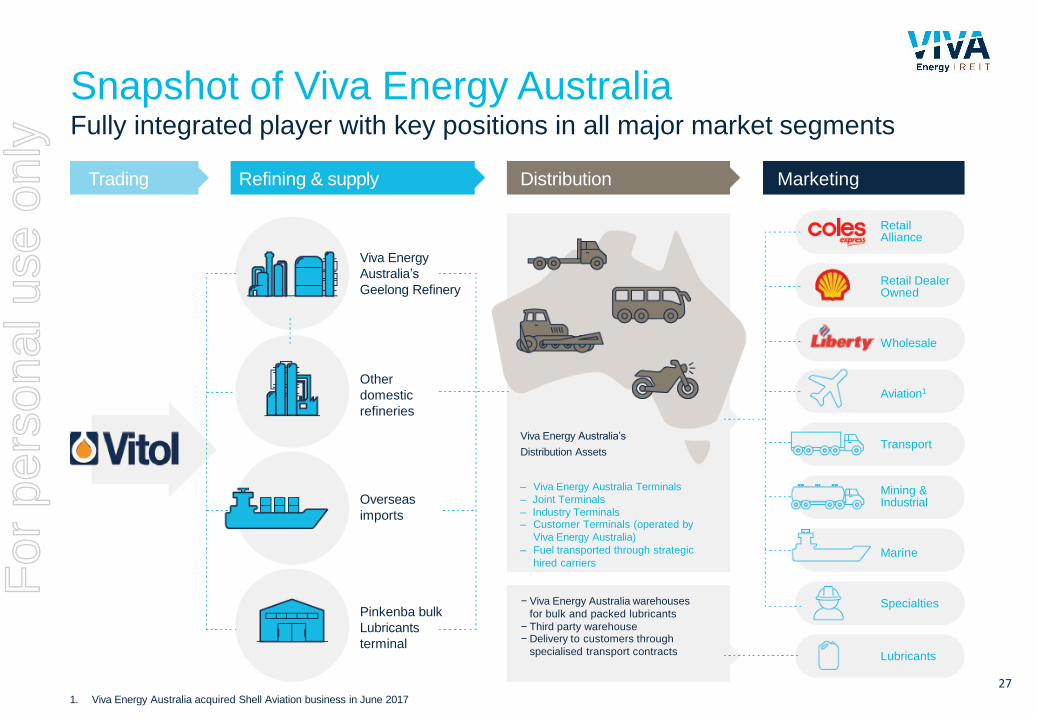
1. Viva Energy Australia acquired Shell Aviation business in June 2017
Trading Refining & supply Distribution Marketing
Viva Energy
Australia’s
Geelong Refinery
Other
domestic
refineries
Overseas
imports
Retail DealerOwned
Retail Alliance
Transport
Lubricants
Specialties− Viva Energy Australia warehouses
for bulk and packed lubricants
− Third party warehouse− Delivery to customers through
specialised transport contracts
Viva Energy Australia’s
Distribution Assets
– Viva Energy Australia Terminals
– Joint Terminals
– Industry Terminals– Customer Terminals (operated by
Viva Energy Australia)
– Fuel transported through strategic
hired carriers
Aviation1
Marine
Mining &Industrial
Wholesale
Pinkenba bulk
Lubricants
terminal
Snapshot of Viva Energy AustraliaFully integrated player with key positions in all major market segments
27
For
per
sona
l use
onl
y
Viva Energy Australia
1. Shell branding is used in the marketing of fuels in Australia by Viva Energy under a Brand Licence Agreement
2. Viva Energy Australia network figures as at 30 June 2017
3. Includes six properties contracted to be acquired by Viva Energy REIT which were not settled as at 30 June 2017
Viva Energy Australia is the exclusive supplier of fuel and other oil products in Australia under
the Shell brand1
Viva Energy Australia manufactures, supplies and markets fuel in Australia through a
market leading retail fuel and convenience platform comprised of 962 primarily Shell
branded service stations2
– 662 Alliance properties
– 300 non Alliance properties (dealer operated, commission agent, truck stops and
development)
Viva Energy REIT owns 431 Alliance, 5 non Alliance and 1 Liberty Oil leased Shell branded
properties3
Assigned S&P BBB- rating; outlook stable
Productive working relationship between Viva Energy Australia and Viva Energy REIT
management
Continues to view its investment in Viva Energy REIT as strategically significant and currently
intend to maintain a significant security holding
28
For
per
sona
l use
onl
y
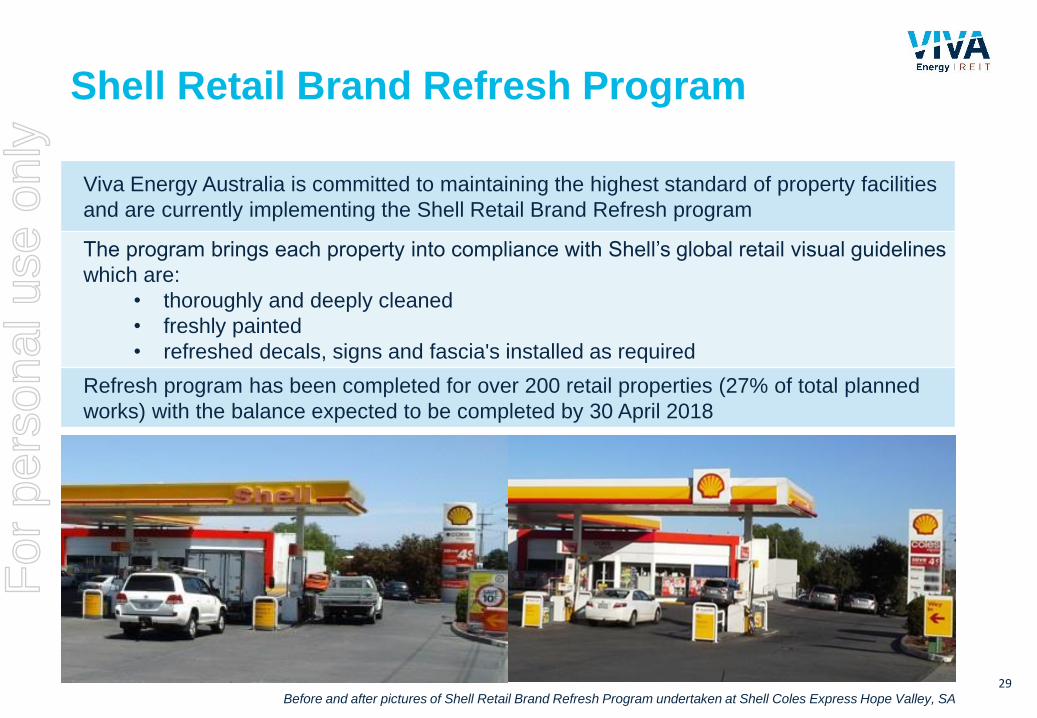
Shell Retail Brand Refresh Program
29Before and after pictures of Shell Retail Brand Refresh Program undertaken at Shell Coles Express Hope Valley, SA
Viva Energy Australia is committed to maintaining the highest standard of property facilities
and are currently implementing the Shell Retail Brand Refresh program
The program brings each property into compliance with Shell’s global retail visual guidelines
which are:
• thoroughly and deeply cleaned
• freshly painted
• refreshed decals, signs and fascia's installed as required
Refresh program has been completed for over 200 retail properties (27% of total planned
works) with the balance expected to be completed by 30 April 2018
For
per
sona
l use
onl
y
Coles Express
1. References to Coles Express refer to Eureka Operations Pty Ltd trading as Coles Express, Eureka Operations Pty Ltd is a subsidiary of Wesfarmers Limited
2. WES ASX Announcements 2016 Full Year Results, 2015 Full Year Results & 2014 Full Year Results
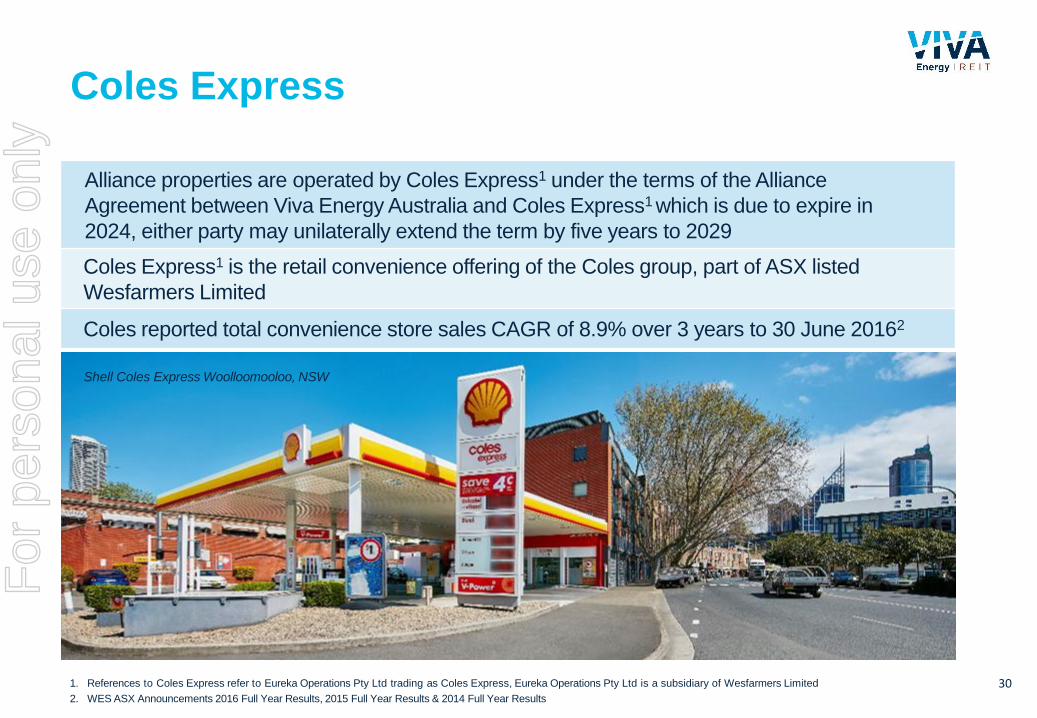
Alliance properties are operated by Coles Express1 under the terms of the Alliance
Agreement between Viva Energy Australia and Coles Express1 which is due to expire in
2024, either party may unilaterally extend the term by five years to 2029
Coles Express1 is the retail convenience offering of the Coles group, part of ASX listed
Wesfarmers Limited
Coles reported total convenience store sales CAGR of 8.9% over 3 years to 30 June 20162
Shell Coles Express Woolloomooloo, NSW
30
For
per
sona
l use
onl
y

31
Coles Express Milton, QLD
FY2017 Outlook
Margaret Kennedy
For
per
sona
l use
onl
y
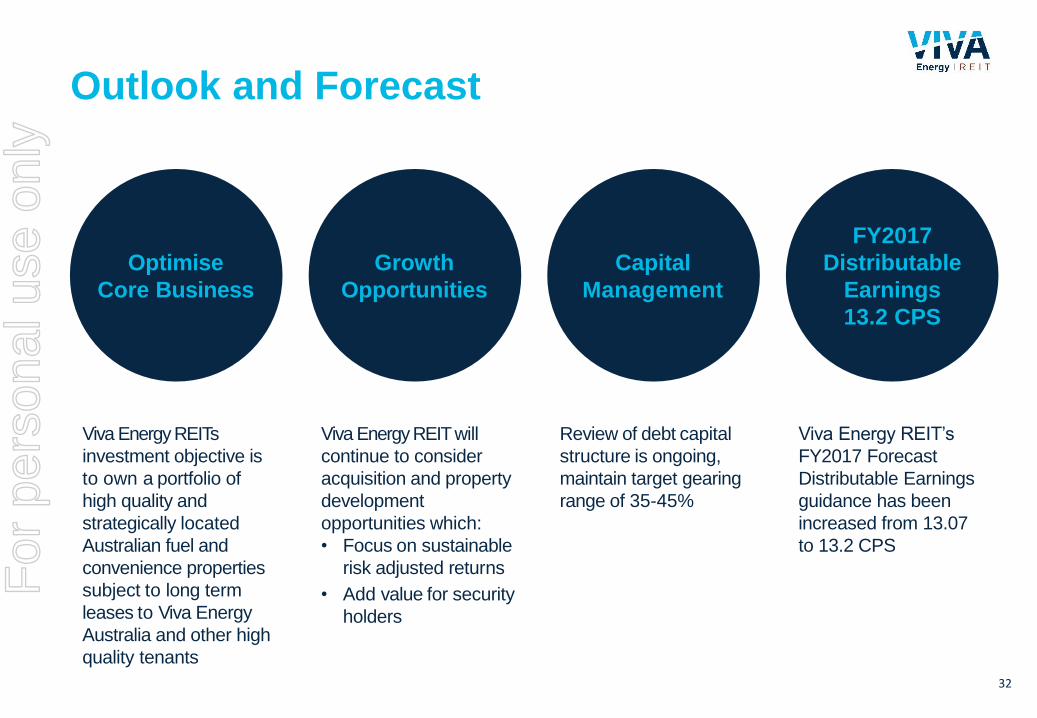
Outlook and Forecast
Viva Energy REITs
investment objective is
to own a portfolio of
high quality and
strategically located
Australian fuel and
convenience properties
subject to long term
leases to Viva Energy
Australia and other high
quality tenants
Viva Energy REIT will
continue to consider
acquisition and property
development
opportunities which:
• Focus on sustainable
risk adjusted returns
• Add value for security
holders
Review of debt capital
structure is ongoing,
maintain target gearing
range of 35-45%
Viva Energy REIT’s
FY2017 Forecast
Distributable Earnings
guidance has been
increased from 13.07
to 13.2 CPS
Optimise
Core Business
Growth
Opportunities
Capital
Management
FY2017
Distributable
Earnings
13.2 CPS
32
For
per
sona
l use
onl
y

Glossary
AllianceThe contractual alliance between Viva Energy Australia and Coles Express (and their associated
entities) including the Alliance Agreement and Site Agreements as outlined in the PDS
CAGR Compound average growth rate
Cap rate Capitalisation rate
CPS Cents per security
Distributable Earnings
This is a non-IFRS measure being net statutory profit adjusted to remove transaction costs and non-
cash items, including straight lining of rental income, amortisation of debt and establishment fees
and any fair value adjustments to investment properties or derivatives
Distributable Earnings
Per Security
Calculated as Distributable Earnings divided by the weighted average number of ordinary securities
outstanding during the financial period
Double Net lease
Agreement where the tenant is responsible for all outgoings except fair wear and tear, capital
expenditure, the difference between single and multiple holding land tax and, in some cases,
the landlord’s property management fees (if any)
Forecast The financial forecasts contained in Viva Energy REITs PDS or other public materials
FY Viva Energy REIT financial year, being year end 31 December
GearingTotal liabilities to total tangible assets measured in accordance with Accounting Standards, but
excluding any mark-to-market valuations of derivative assets/liabilities
33
For
per
sona
l use
onl
y

Glossary
HY Viva Energy REIT half year, being half year end 30 June
Initial Portfolio Portfolio of 425 properties as detailed in the PDS
Interest Coverage Ratio or ICREarnings before interest, tax, depreciation and amortisation (excluding any asset revaluations, mark-
to-market movements and transaction costs) divided by Net Interest Expense
Liberty Oil Liberty Oil Holdings Pty Limited (ABN 67 068 080 124)
PDS Viva Energy REIT’s Replacement Prospectus and Product Disclosure Statement dated 22 July 2016
Triple Net lease
Agreement where the tenant is responsible for all outgoings. In the case of Viva Energy
REIT’s leases to Viva Energy Australia, the landlord’s property management fees (if any)
are not paid by the tenant
Viva Energy Australia Viva Energy Australia Pty Ltd (ABN 46 004 610 459)
Viva Energy REIT or VVRViva Energy REIT is a stapled entity comprising one share in Viva Energy REIT Limited (ABN 35
612 986 517) and one unit in the Viva Energy REIT Trust (ARSN 613 146 464)
WACR Weighted average capitalisation rate, weighted by contract price excluding transaction costs
WALE Weighted average lease expiry, weighted by rental income
34
For
per
sona
l use
onl
y

35
Margaret Kennedy
Questions
Shell Coles Express St Kilda, VICFor
per
sona
l use
onl
y
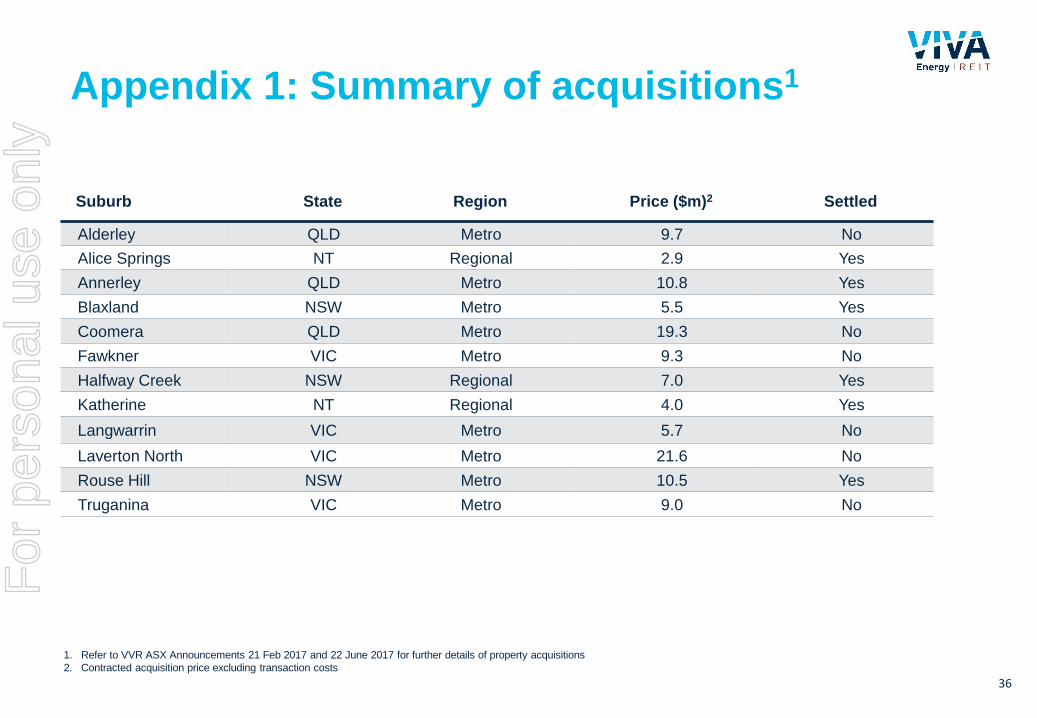
Appendix 1: Summary of acquisitions1
36
Suburb State Region Price ($m)2 Settled
Alderley QLD Metro 9.7 No
Alice Springs NT Regional 2.9 Yes
Annerley QLD Metro 10.8 Yes
Blaxland NSW Metro 5.5 Yes
Coomera QLD Metro 19.3 No
Fawkner VIC Metro 9.3 No
Halfway Creek NSW Regional 7.0 Yes
Katherine NT Regional 4.0 Yes
Langwarrin VIC Metro 5.7 No
Laverton North VIC Metro 21.6 No
Rouse Hill NSW Metro 10.5 Yes
Truganina VIC Metro 9.0 No
1. Refer to VVR ASX Announcements 21 Feb 2017 and 22 June 2017 for further details of property acquisitions
2. Contracted acquisition price excluding transaction costs
For
per
sona
l use
onl
y
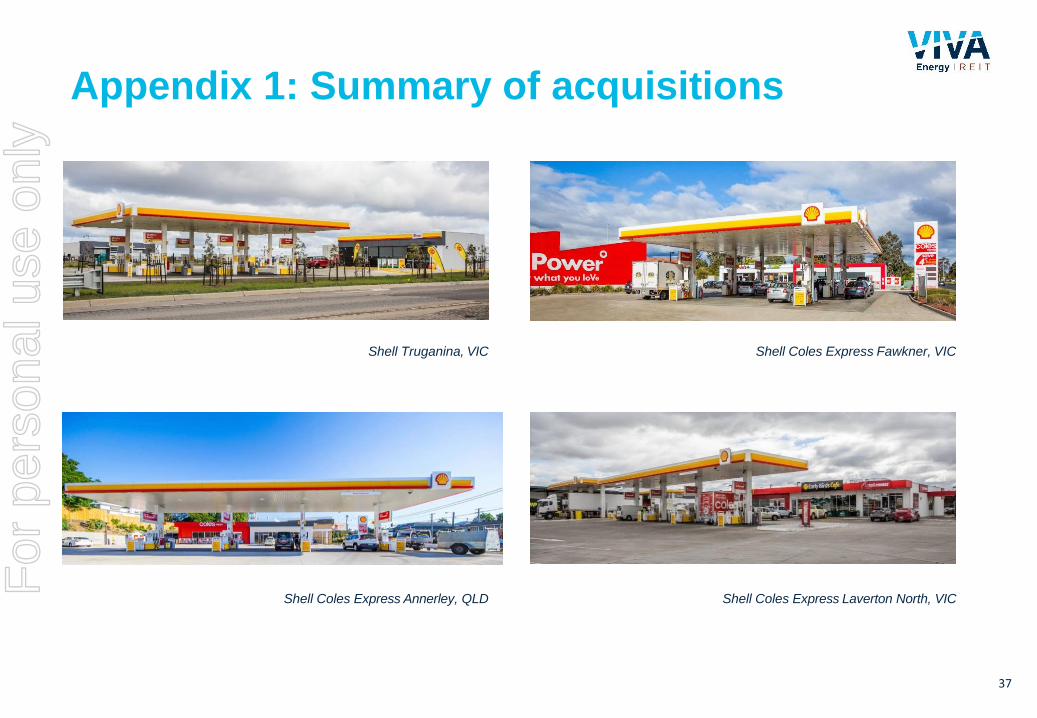
Appendix 1: Summary of acquisitions
Shell Coles Express Annerley, QLD
37
Shell Truganina, VIC Shell Coles Express Fawkner, VIC
Shell Coles Express Laverton North, VIC
For
per
sona
l use
onl
y