For personal use only - ASX2016/03/22 · For everyone, every goal, every step – we’re here to...
141
AMP Limited 33 Alfred Street, Sydney NSW 2000 Australia ABN 49 079 354 519 Public Affairs T 02 9257 6127 E [email protected] W AMP.com.au/media AMP_AU 22 March 2016 Manager ASX Market Announcements Australian Securities Exchange Level 4, 20 Bridge Street Sydney NSW 2000 Client and Market Services Team NZX Limited Level 1, NZX Centre, 11 Cable Street PO Box 2959 Wellington, New Zealand Announcement No: 08/2016 AMP Limited (ASX/NZX: AMP) Part One: 2015 annual report Part Two: 2015 corporate governance statement and Appendix 4G Part Three: 2015 shareholder review Part Four: 2016 notice of annual general meeting and proxy form For personal use only
Transcript of For personal use only - ASX2016/03/22 · For everyone, every goal, every step – we’re here to...

AMP Limited 33 Alfred Street, Sydney NSW 2000 Australia ABN 49 079 354 519
Public Affairs T 02 9257 6127
E [email protected] W AMP.com.au/media
AMP_AU
22 March 2016
Manager ASX Market Announcements Australian Securities Exchange Level 4, 20 Bridge Street Sydney NSW 2000
Client and Market Services Team NZX Limited Level 1, NZX Centre, 11 Cable Street PO Box 2959 Wellington, New Zealand
Announcement No: 08/2016 AMP Limited (ASX/NZX: AMP)
Part One: 2015 annual report
Part Two: 2015 corporate governance statement and Appendix 4G
Part Three: 2015 shareholder review
Part Four: 2016 notice of annual general meeting and proxy form
For
per
sona
l use
onl
y

For everyone, every goal, every step – we’re here to help. To help you own a better tomorrow.
2015 annual report
For
per
sona
l use
onl
y

Contents 1 Chairman’sforeword2 Five-yearfinancialsummary3 2015resultsataglance4 AboutAMP5 Ourstrategy6 Ourbusiness8 Creatingbettertomorrows10 Ourboard12 Ourmanagementteam14 CorporategovernanceatAMP17 Directors’report24 Remunerationreport45 Analysisofshareholderprofit46 Financialreport47 Incomestatement48 Statementofcomprehensiveincome49 Statementoffinancialposition50 Statementofchangesinequity52 Statementofcashflows53 Notestothefinancialstatements133 Directors’declaration134 Independentauditor’sreport135 SecurityholderinformationIBC Glossary
AMP Limited ABN 49 079 354 519
Unlessotherwisespecified,allamountsareinAustraliandollars.Informationinthisreportiscurrentasat18February2016.
For
per
sona
l use
onl
y

AMP 2015 annual report 1
Chairman’s foreword
Our superannuation, investments, advice and banking businesses delivered strong results, and we are seeing encouraging growth from our international expansion through AMP Capital. Our strategy to become a more customer-centred organisation is showing early signs of success and we are making positive progress on our program to reduce costs.
The industry in which we operate is being tested like never before. Customers not only want quality products that offer value for money but they want and expect exceptional customer service. And we believe they deserve nothing less. That’s why we’re putting our customers at the heart of everything we do.
Over the past two years we have laid the foundations for a truly customer-centred organisation, one we believe will also deliver long-term value for shareholders. We’ve listened to our customers – and as a result of what we’ve heard, we’ve transformed our digital capabilities and designed new and better ways for customers to interact with us.
We’ve also continued to expand our presence offshore, partnering with leading companies around the world including China Life and Mitsubishi UFJ Trust and Banking Corporation in Japan. Our alliance with China Life has gone from strength to strength and I’m pleased to say the
financial performance of our joint ventures has exceeded our expectations.
We remain focused on the recovery of our insurance business. While this is taking longer than expected, we believe our new claims process, targeted retention campaigns and a new insurance offer will provide a better outcome for customers and shareholders over the long term.
Dividend and capital positionWe are pleased to have delivered a total 2015 dividend of 28 cents per share for shareholders, with $828 million having been returned to shareholders in the form of dividends and dividend reinvestment plan (DRP) shares for the year. We have extended our dividend payout ratio to 70 to 90% of underlying profit as a reflection of our confidence in the financial strength of the group, and our total dividend represents a payout of 74% of our 2015 underlying profit.
The increase in our taxable income has again enabled us to raise the franking rate, with the final 2015 dividend of 14 cents per share to be franked at 90%. We will continue to purchase DRP shares on market so as to not dilute the value of current shareholdings.
We have maintained a strong capital position and as at 31 December 2015 held $2.5 billion in capital above minimum
regulatory requirements. This means we will remain well capitalised when we redeem $600 million of AXA Notes in March 2016.
BoardWe have announced the appointment of two new directors to our board. Retail expert Holly Kramer joined in October 2015 and Vanessa Wallace, who has extensive financial services experience across Asia, joins in March 2016. Holly and Vanessa bring extensive skills and experience that will prove invaluable to our business as we pursue our strategy.
On behalf of the board I would like to thank John Palmer and Brian Clark who will retire as directors of AMP at the end of the annual general meeting. Both John and Brian have served on the board for almost nine years and their knowledge and sound judgement have proved invaluable during that time. We greatly appreciate the contribution they have made and the particularly high standards they have set.
Simon McKeon AOChairman
Our yearIn 2015, we have witnessed the strength and resilience of AMP, as our company maintained its growth momentum in the face of challenging markets in the second half of the year.
For
per
sona
l use
onl
y

AMP 2015 annual report2
Our results in summary
Our financial performance
Five-year financial summary
Year ended 31 December2015
$m2014
$m2013
$m
Restated2012
$m
Restated2011
$m
Consolidated Income statement Net premium, fee and other revenue 5,493 5,343 5,136 5,166 4,217
Investment gains (losses) 8,529 12,244 14,963 12,258 1,548
Profit (loss) before income tax from continuing operations 1,993 1,814 1,498 1,387 743 Income tax (expense) credit (280) (843) (782) (688) 4 Non-controlling interests (741) (87) (44) (10) 12
Profit after tax attributable to shareholders of AMP Limited 972 884 672 689 759
Consolidated Statement of financial position Cash and cash equivalents 3,955 3,581 2,938 4,388 4,816 Investment assets 128,074 123,292 121,781 107,721 98,221 Intangibles 3,983 4,042 4,136 4,502 4,677 Assets of disposal groups – 100 42 187 – Other assets 3,696 3,840 4,327 4,566 4,999
Total assets 139,708 134,855 133,224 121,364 112,713
Borrowings and subordinated debt 17,452 16,502 16,243 13,473 13,322 Life insurance contract liabilities 23,871 24,403 24,934 25,055 24,399 Investment contract liabilities 69,848 66,980 66,049 58,385 52,940 Liabilities of disposal groups – 69 8 74 – Other liabilities 19,642 18,516 17,790 16,734 15,066
Total liabilities 130,813 126,470 125,024 113,721 105,727
Net assets 8,895 8,385 8,200 7,643 6,986
Contributed equity 9,566 9,508 9,602 9,333 9,074 Reserves (1,866) (1,888) (1,973) (2,157) (2,540)Retained earnings 819 566 461 332 364
Total equity attributable to shareholders of AMP Limited 8,519 8,186 8,090 7,508 6,898 Non-controlling interests 376 199 110 135 88
Total equity 8,895 8,385 8,200 7,643 6,986
Year ended 31 December 2015 2014 2013Restated
2012Restated
2011
Other financial data Basic earnings per ordinary share ($ps) $0.33 $0.30 $0.23 $0.24 $0.29 Diluted earnings per ordinary share ($ps) $0.33 $0.30 $0.23 $0.24 $0.29 Dividends per ordinary share ($ps) $0.28 $0.26 $0.23 $0.25 $0.29 Number of ordinary shares (m) 2,958 2,958 2,958 2,930 2,855 Assets under management ($b) 226 214 197 173 159
For
per
sona
l use
onl
y

AMP 2015 annual report 3
Total dividend for 2015
The final dividend of 14 cents per share is to be paid on 8 April 2016 and will be 90% franked.
$828m returned to shareholders in the form of dividends and dividend reinvestment plan shares for 2015.
Cost to income ratio
We have become a more efficient business – increasing our revenue while maintaining tight cost controls.
Profit attributable to shareholders
Regulatory capital funds held above the minimum regulatory requirement
AMP holds capital above the minimum requirements to protect customers, creditors and shareholders against unexpected losses. This is an indication of the strength of our business.
Underlying profit
Underlying return on equity
Our increase in underlying profit means we improved the return on the money invested by our shareholders.
Underlying profit is AMP’s preferred measure of profitability as it best reflects the underlying performance of AMP. It is the earnings base on which the board determines the dividend payment.
The main difference between the two numbers comes from movements in investment markets and one off costs. A reconciliation of profit attributable to shareholders and underlying profit can be found on pages 18 and 66.
43.8%improved by 1 percentage point
$2,542mup 28%
Net cashflows on AMP platforms
Customers are continuing to invest across our range of investment platforms.
AMP Capital external net cashflows
AMP Capital has seen an increase in investments from both domestic and international clients.
Assets under management
We now manage more money for our customers around the world.
$3,784mup 5%
28cents per shareup 8%
$4,434mup 19%
$972mup 10%
$226bup 6%
$1,120mup 7%
13.2%improved by 0.5 percentage points
Dividends cents per share
Final dividend Interim dividend
0
10
20
30
2014201320122011 2015
12.5 14
13.5 14
26
28
11.5
11.5
23
12.5
12.5
25
1514
29
2014201320122011 2015
$884
m
$972
m
$672
m
$689
m
$759
m
0 0
250 250
500 500
750 750
1,000
1,200
1,000
1,200
Profit attributable to shareholders$ million
2014201320122011 2015
$1,0
45m
$1,1
20m
$849
m
$950
m
$907
m
Underlying profit$ million
2015 results at a glance
For
per
sona
l use
onl
y

AMP 2015 annual report4
What we doAustralian wealth management – we help our customers save for and live well in retirement – through our superannuation and investment products (including self-managed superannuation fund (SMSF) services) and financial advice.
Australian wealth protection –we support our customers and their families during tough times – through our life insurance, income protection and disability insurance products.
AMP Bank – we provide banking products including home loans, savings accounts and lending to SMSF trustees for investment purposes.
Our business, vision and strategy
ChicagoNew York
Tokyo
Beijing
Hong Kong
PerthAdelaide
BrisbaneSydney
Hobart
MelbourneAuckland Wellington
Christchurch
Delhi
London
Dublin
Luxembourg
Bahrain
About AMP
For more than 165 years we’ve dedicated ourselves to making this possible by helping our customers take control of their finances, be debt free, plan for and manage their retirement, and be financially secure in case of misfortune. Today we call this helping people own tomorrow.
We are Australia and New Zealand’s leading independent wealth management company with an expanding international investment management presence and a growing retail banking business in Australia.
Australian wealth management Australian wealth protection AMP Bank AMP Capital New Zealand financial services Australian mature
Percentages based on contribution to operating earnings.
11% 37%
17%9%
12%
14%
Where we help Today we provide advice and products to over four million retail and institutional customers in our core markets of Australia and New Zealand. We also have an expanding global presence through AMP Capital, providing investment management services to institutional and retail clients across Asia, Europe, the Middle East and North America. Our offices are shown below.
In Asia, we partner with international market leaders and have partnerships in China and Japan. – AMP owns a 19.99% stake in China Life Pension Company (CLPC).– AMP Capital holds a 15% stake in China Life AMP Asset Management Company Limited (CLAMP).– Mitsubishi UFJ Trust and Banking Corporation (MUTB) holds a 15% minority interest in AMP Capital Holdings Limited.
AMP was founded on a simple yet bold idea – that every individual should have the power and ability to control his or her life.
AMP Capital – we help customers invest in equities, fixed income, infrastructure and property, as well as diversified, multi- manager and multi-asset funds.
New Zealand financial services – we provide customers in New Zealand with financial advice, superannuation and insurance products.
Australian mature – we carefully manage closed insurance and superannuation products no longer sold by AMP.
For
per
sona
l use
onl
y

AMP 2015 annual report 5
Our strategy
Our vision is to be Australia and New Zealand’s favourite financial services company.
Our 2015 achievements – Maintained our No. 1 market share position
in the Australian superannuation market1
– Maintained our No. 1 market share position in the Australian individual risk insurance market2
– Reinforced our market leading position in SMSF administration
– Grew our bank mortgage business, with 24% of mortgages derived from our financial adviser network
Our 2015 achievements– Piloted a new goals-based face-to-face advice approach– Launched a new online system, My AMP, enabling
customers to see all their banking, superannuation, insurance and investment products in one location
– Deployed a customer feedback and measurement system to drive customer experience improvements
– Introduced new call centre technology so we can identify customers’ needs to proactively help them
Our 2015 achievements– Our three-year business efficiency program is
on track, delivering savings on time and on budget– We have invested $320m in a cost saving program
to achieve $200m in pre-tax recurring run rate cost savings by the end of 2016
Our 2015 achievements– CLAMP launched 19 new mutual funds and now
manages $14.8b in assets under management (AUM) for Chinese retail and institutional investors
– CLPC became the No. 1 provider of trustee services and No. 2 provider of investment management services in China by AUM. Total AUM grew 35% to RMB 301b ($63.7b)
– Attracted strong interest from international investors into our infrastructure and property funds, with $645m in commitments received for the Global Infrastructure Fund
Focus on growth – growing our Australian financial advice, superannuation, insurance, banking and SMSF businesses
Transformation of our business – to better understand and anticipate customers’ needs, help them realise their goals, and give them more choice in how they interact with us
Cost reductions – increasing the efficiency of our business and spending money wisely
Expansion offshore – expanding internationally through AMP Capital by partnering with international market leaders in Asia and internationally capitalising on investor demand for our infrastructure, property and fixed income capabilities
1 Retail Managed Funds – Marketer, Plan for Life, September 2015.2 Life Insurance Overview – Risk Insurance, Plan for Life, September 2015.
Two years ago, we put in place a strategy to transform our business – to place our customers at the centre of everything we do. The consistent execution of this strategy over the past two years has created a strong platform for future growth and in 2016 our focus will be on realising the value from the investments we’ve made so far.
For
per
sona
l use
onl
y

AMP 2015 annual report6
Our business, vision and strategy
Our businessWe are proud to be Australia and New Zealand’s leading independent wealth management company, helping customers achieve their goals through our offers, solutions and personalised financial advice.
Financial advice We operate the leading financial advice network in Australia and New Zealand, with more than 4,000 advisers helping people take control of their finances so they can face the future with confidence.
With some of the highest professional standards in the advice industry, our customers know they can count on us to stand behind our advice.
– Our financial advisers help customers across Australia and New Zealand– Since 2007, the AMP Adviser Academy, Horizons, has launched the careers of
hundreds of new financial advisers through its professional training program – Our advice brands include AMP Financial Planning, Hillross, Charter, Spicers,
AdviceFirst, SMSF Advice, Jigsaw and ipac
Superannuation and retirementWe are Australia’s leading provider of superannuation and a leading KiwiSaver provider in New Zealand. We lead a rapidly growing industry, with the Australian superannuation market expected to double in size by 20261.
AMP supports individuals with simple, easy-to-access solutions and provides award-winning superannuation services for businesses that range from blue-chip companies to small-to-medium enterprises. We also provide advice and solutions to help people manage their money throughout their retirement.
– We provided superannuation services to more than 60,000 companies in Australia– We are No. 1 in superannuation in Australia and No. 1 in corporate superannuation
in New Zealand2
– We helped our customers by paying out $2.2 billion in Australian retirement payments in 2015
– In 2015, our flagship SignatureSuper solution for medium to large businesses was awarded Super Fund of the Year at the Super Review Awards
Insurance AMP is a leading insurance provider, offering income protection, disability and life insurance plans that are held by individuals or included in a superannuation fund.
We hold market-leading positions in the Australian and New Zealand insurance markets.
– We are No. 1 in the individual risk insurance market in Australia and No. 2 in New Zealand3
– We helped our customers by paying out $1,079 million in insurance claims in 2015
– We were named Life Company of the Year in 2015 in the Financial Review’s Smart Investor Blue Ribbon Awards
– In 2015, AMP Elevate won the CANSTAR Outstanding Value award for Term Life Insurance
4,000financial advisers helping people realise their goals
$1,079min insurance payments helped our customers
$2.2bin Australian retirement payments in 2015
1 Dynamics of the Australian Superannuation System, The Next 20 Years: 2015 – 2035, Deloitte, November 2015; AMP modelling.2 Eriksen’s Master Trust Survey, September 2015. 3 Financial Services Council of New Zealand, December 2015.
For
per
sona
l use
onl
y

AMP 2015 annual report 7
43,000 people have an AMP Bank home loan
InvestmentsThrough AMP Capital, we help customers around the world invest in equities, fixed income, infrastructure and property, as well as diversified, multi-manager and multi-asset funds. AMP Capital also manages property and infrastructure assets including shopping centres, aged care facilities, airports, trains and pipelines.
In Asia, we work with international market leaders to extend our distribution and have partnerships in China and Japan.
– AMP Capital is one of the largest direct property fund managers in Asia Pacific, with $20.8 billion in AUM. It owns properties including Macquarie Shopping Centre in North Ryde, 700 Bourke Street in Melbourne and 200 George Street in Sydney
– AMP Capital is also one of the largest infrastructure managers in the world1 managing $10.3 billion in assets including Melbourne Airport, PowerCo in New Zealand and Angel Trains in London
– CLAMP manages $14.8 billion for Chinese investors through mutual fund products, including money market, fixed income, balanced and equity funds
BankingAMP Bank is a growing business, helping Australians with residential and investment property mortgages, and deposit and transaction accounts, along with self-managed superannuation fund products. These products are provided through AMP financial advisers, mortgage brokers, and direct to customers over the phone or online. AMP Bank also provides practice finance loans to financial advisers.
– We help 100,000 Australians with their banking needs– In 2015, we helped over 8,500 customers buy a home – We offer a range of award-winning deposit and transaction accounts,
including the AMP Saver Account which won the CANSTAR award for Outstanding Value in 2015
Self-managed superannuation fundsAMP is the Australian market leader in SMSF administration. Our SMSF business, SuperConcepts, helps customers in Australia establish SMSFs and provides them with administration and compliance management support. It also offers investment products, insurance cash hubs, term deposits and lending services.
– We are Australia’s market leader in SMSF administration, providing administration, software and education services to 38,000 SMSFs
– Our SMSF business includes the brands SuperConcepts, AMP SMSF Solutions, Ascent, Cavendish, Justsuper, Multiport, SuperIQ, SuperMate and yourSMSF
$160binvested for clients around the world
38,000SMSFs supported by SuperConcepts
1 Towers Watson Global Alternatives Survey 2014.
For
per
sona
l use
onl
y

AMP 2015 annual report8
Our business, vision and strategy
Creating better tomorrowsSince 1849, AMP has been committed to improving the communities in which we operate. We know that our success is directly correlated to the prosperity of our shareholders, customers, advisers, business partners, employees and our communities.
Our 5,400 AMP employees around the globe and 4,000 financial advisers in Australia and New Zealand are proud to serve over four million customers and deliver returns to our 800,000 shareholders.
Our first priority is to provide quality financial products and services. Our customers trust us to help them build financial security and be there for them when they need us. It’s a responsibility we take seriously and every day we help millions of customers achieve their financial goals. However, our duty extends beyond just supporting our customers. We want to help create a better tomorrow for all our stakeholders.
Investing in a better tomorrowThrough the AMP Foundation we are helping to provide a better tomorrow for everyone – especially those facing challenges accessing education and employment opportunities. Since 1992, the AMP Foundation has distributed $80 million to help charities and individuals make a positive impact on communities in Australia and New Zealand.
The AMP Foundation works in two ways. It helps people to help themselves by supporting organisations that give disadvantaged Australians life-changing learning and work opportunities. It also helps people to help others, supporting AMP employees and financial advisers to share their time, skills and resources with people in need and through AMP’s Tomorrow Fund grants.
In 2015, the AMP Foundation distributed $4.8 million, including more than $1 million in grants through AMP’s Tomorrow Fund to support 42 amazing Australians achieve their goals. We also presented scholarships to 18 equally extraordinary New Zealanders. While these recipients all have very different interests, like AMP, they are all striving to create a better tomorrow for everyone.
Sharing our knowledgeWe believe it is our responsibility to help people make informed financial decisions. When people have a better understanding and greater control of their financial wellbeing they feel more secure and independent. In 2015, we published two reports with the National Centre for Social and Economic Modelling (NATSEM) – one on household debt and one on our ageing population’s capacity to work, and shared this research with Australia.
In June 2015, AMP hosted The New Old summit where speakers, including AMP Capital’s Chief Economist Shane Oliver and Age and Disability Commissioner Susan Ryan AO, busted myths about the ageing population’s economic impact and capacity to work.
In the same month, AMP also participated in the Indigenous Superannuation Summit in Melbourne, and went on to join The Indigenous Superannuation Working Group – an industry-led group aiming to build better superannuation outcomes for Aboriginal Australians.
We are fortunate to have leading financial experts working for us, and we help share their knowledge with the wider community. In 2015, we invited shareholders to hear from some of our experts and benefit from their insights and expertise. The session was well received and will be held this year in Melbourne on 12 May 2016. All shareholders are invited to participate in person or online. You can find further details of the event on page 14.
Protecting our environmentMinimising our impact on the environment is as important for our company as it is for the communities in which we operate. We actively assess the environmental risks and opportunities across our business and the investments managed by AMP Capital. In 2015, we continued to make progress against our environmental priorities and targets, remaining carbon neutral and reducing our greenhouse gas emissions by a further 9% year on year.
$80mgiven to improve the lives of Australians and New Zealanders
CO2AMP is carbon neutral
$1mgiven to 42 amazing Australians through the AMP Tomorrow Fund
For
per
sona
l use
onl
y

AMP 2015 annual report 9
Representation of women at AMP
Roles 2020 target 2015 target 31 Dec 2015 31 Dec 2014
AMP Limited Board 40% 30% 33% 20%
Senior executives 47% 35% 37% 34%
Middle management 50% 43% 39% 39%
All employees n/a n/a 52% 51%
Since introducing gender diversity targets in 2011, we have increased the representation of women in senior executive roles by 10 percentage points. In 2015, we expanded our inclusion and diversity program and we have now set ourselves even more challenging gender diversity targets. By the end of 2020, our aim is for women to hold half of our middle-management roles and 47% of senior executive roles. We’re also striving to increase the gender balance on our boards, with a 40:40:20 target whereby we want board positions to be filled by 40% women, 40% men and 20% either women or men. We are pleased that when Vanessa Wallace joins our board in March 2016, 40% of the AMP Limited Board will be female.
In 2015, we were honoured to be named an Employer of Choice for Gender Equality by the Australian Government’s Workplace Gender Equality Agency. We also launched AMProud, a community group for lesbian, gay, bisexual, transgender, intersex and questioning (LGBTIQ) employees and supporters.
You can find further information on our 2015 environmental performance, corporate governance work and AMP Foundation activities in the AMP 2015 community report available at amp.com.au/2015annualreport.
Encouraging good corporate governanceAs a major investor in companies and assets on behalf of our customers, AMP Capital is well placed to raise the corporate responsibility bar and influence better outcomes for investors. We have long recognised the strong link between an organisation’s environmental and social impacts, the quality of its corporate governance, and its long-term business success.
Assessing environmental, social and governance (ESG) factors is a key part of our investment process and we are recognised for our work in this area. We actively engage with the boards and management teams of companies, encouraging sound decision-making and risk management, appropriate capital allocation, good board composition, gender diversity, fair remuneration and open and honest disclosure. We use our voting power to encourage corporate behaviour that will deliver better results for investors, shareholders and the community as a whole.
Inclusion and diversityWe also want an inclusive culture – one that enables us to tap into different perspectives. By drawing on the strengths and skills of our people and empowering them to be the best they can be, we are better placed to help others own tomorrow.
In 2015AMP was named an Employer of Choice for Gender Equality
10percentage points increase in the number of women in senior executive roles
ESGassessment is a key factor in our investment process
n/a – not applicable
For
per
sona
l use
onl
y

AMP 2015 annual report10
AMP Limited Board as at 18 February 2016
Our board
1 2 3
Simon McKeon AO1
Independent Chairman BCom, LLBSimon was appointed to the AMP Limited Board in March 2013 and assumed the role of Chairman in May 2014. He also became a member of the Nomination and Governance Committee and the People and Remuneration Committee in May 2014.
ExperienceSimon is a specialist in corporate mergers and acquisitions, fund raising and strategic advice. In his 30 year career, he has worked with Macquarie Group, ultimately as Chairman of its Melbourne office, and as a solicitor with Dawson Waldron. He continues to consult to Macquarie and is Chancellor of Monash University.
Simon has served as Chairman of CSIRO and MYOB and was the Founding President of the Australian Takeovers Panel. He is the inaugural President of the Review Panel for the banking industry’s Banking and Finance Oath, is a member of the Australian Institute of Company Directors’ Chairman’s Forum and was the 2011 Australian Banking Ambassador of the Year.
Simon was Australian of the Year in 2011 and was made an Officer of the Order of Australia in 2012 for distinguished service to business, commerce and the community. In 2015, Simon was awarded an honorary Doctorate of Public Health by La Trobe University.
Government and community involvement– Australia Day Ambassador for the
Victorian Government– Director of Red Dust Role Models– Member of the Big Issue Advisory Board– Chairman of In2Science
Craig Meller2
Chief Executive Officer BSc (Hons) Craig was appointed Chief Executive Officer (CEO) in January 2014. He has been a Director of AMP Life Limited since October 2007, a Director of The National Mutual Life Association of Australasia (NMLA) Limited since March 2011 and a Director of AMP Capital Holdings Limited since January 2014.
ExperiencePrior to becoming CEO, Craig was Managing Director (MD) of AMP Financial Services from 2007–2013. Craig started with the AMP group’s United Kingdom (UK) business in 2001 before coming to Australia in 2002 to take up the role of MD, AMP Banking. He moved to the role of Director of Product Manufacturing in 2003.
Craig started his career at Lloyds TSB in the UK where he spent more than 14 years working across the business in a number of management roles. From 1998 he worked at Virgin Direct where he was MD from 1999–2001.
Patricia (Patty) Akopiantz3
Independent Director BA, MBAPatty was appointed to the AMP Limited Board and the People and Remuneration Committee in March 2011, becoming Chairman of that committee in August 2014. She joined the Risk Committee in November 2014 and the Nomination and Governance Committee in August 2015. Patty was appointed a Director of AMP Bank Limited in November 2011 and Chairman in November 2015. She became a member of the AMP Bank Audit Committee and the AMP Bank Risk Committee in November 2014.
ExperiencePatty has over 25 years senior management and consultancy experience, primarily in the retail and consumer industries both in Australia and overseas. She has served as General Manager of Marketing at David Jones, Vice President for a United States (US) apparel manufacturer and as a management consultant with McKinsey, advising some of Australia’s leading companies on strategy and organisational change.
Over the last 13 years, Patty has served on numerous boards including AXA Asia Pacific Holdings and Coles Group. In 2003, she was awarded a Centenary Medal for services to Australian society in business leadership.
Listed directorship– Director of Ramsay Health Care Limited
(appointed April 2015)
Catherine Brenner4
Independent Director BEc, LLB, MBA Catherine was appointed to the AMP Limited Board in June 2010 and Chairman of its Nomination and Governance Committee in May 2013. She was appointed Chairman of the AMP Life Limited Board in May 2011, having been a member of that board and its Audit Committee since May 2009. Catherine has been Chairman of the NMLA Board and a member of its Audit Committee since March 2011. She was also appointed a member of the AMP Life and NMLA Risk Committees in November 2014.
ExperienceCatherine is a former senior investment banker and corporate lawyer with experience in corporate advisory and equity capital markets. She has served on public company boards in the resources, property and biotech sectors for over a decade. Catherine has also previously served as a member of the Takeovers Panel and as a board member and trustee of not-for-profit and government organisations, including the Sydney Opera House.
Listed directorships– Director of Boral Limited
(appointed September 2010)– Director of Coca-Cola Amatil Limited
(appointed April 2008)
Government and community involvement– Director of SCEGGS Darlinghurst Limited– Panel Member, Adara Partners
Brian Clark5
Independent Director BSc, MSc, DSc Brian was appointed to the AMP Limited Board in January 2008 and was appointed a member of the People and Remuneration Committee in May 2009. Brian was also appointed a member of the AMP Capital Holdings Limited Board and its Audit and Risk Committee in February 2008. He became Chairman of the AMP Capital Holdings Board in March 2009.
ExperienceBrian spent 10 years in a variety of senior executive roles at Vodafone internationally, most recently in the UK as Group Human Resources Director. He was CEO of Vodafone’s Australian business as well as CEO of the Asia Pacific region, based in Tokyo.
For
per
sona
l use
onl
y

AMP 2015 annual report 11
4 5 6
7 8 9
Before joining Vodafone, Brian spent three years as CEO of Telkom SA Ltd, in South Africa.
He began his career at the Council for Scientific and Industrial Research in Pretoria, South Africa, rising to the role of President and overseeing its change from a government institution into a commercially focused contract research business.
Listed directorship– Chairman of Boral Limited (appointed
November 2015, Director since May 2007)
Holly Kramer6
Independent Director BA, MBAHolly was appointed to the AMP Limited Board in October 2015 and was appointed a member of the Audit Committee in November 2015.
ExperienceHolly has more than 20 years experience in general management, marketing and sales for customer-focused organisations. Most recently Holly was CEO of apparel retailer Best & Less, where she transformed the business and returned it to growth and profitability. Holly has also held senior executive and marketing roles with Pacific Brands, Telstra, eCorp and the Ford Motor Company.
Listed directorships– Director of Nine Entertainment Co.
Holdings Limited (appointed May 2015)– Director of Woolworths Limited
(appointed February 2016)
Government and community involvement– Director of Australia Post– Director of Southern Phone
Company Limited– Director of the Alannah and
Madeleine Foundation
Trevor Matthews7
Independent Director MATrevor was appointed to the AMP Limited Board in March 2014, became a member of its Audit Committee in May 2014, Chairman of the Audit Committee in November 2015 and a member of the Risk Committee in November 2014. Trevor joined the AMP Life Limited and NMLA Boards and their respective Audit Committees in June 2014. He was appointed Chairman of those Audit Committees and a member of the AMP Life and NMLA Risk Committees in November 2014.
ExperienceTrevor has extensive international life insurance experience. He was previously with Aviva as Executive Director and Chairman, Developed Markets and prior to that CEO of Aviva UK. Trevor has held the position of Group CEO with Friends Provident and CEO with Standard Life in the UK, and CEO of Manulife Financial in Japan. He has also held senior roles with National Australia Bank and Legal & General in Australia.
Trevor was Commissioner for the UK Commission for Employment and Skills, Chairman of the Financial Services Skills Council in the UK, and served on the boards of the Life Insurance Association of Japan, the Life Office Management Association in the US, and the Life Investment and Superannuation Association in Australia. Trevor is a Director of Bupa Australia and New Zealand and a Fellow of the Institute of Actuaries in Australia and the UK.
Listed directorships– Director of Cover-More Group Limited
(appointed December 2013)– Chairman of 1st Available Ltd
(appointed February 2015)
Government and community involvement– Chairman of the NSW State Insurance
Regulatory Authority
John Palmer ONZM8
Independent Director BAgrScJohn was appointed to the AMP Limited Board in July 2007 and joined the AMP Capital Holdings Limited Board and its Audit and Risk Committee in May 2014. He retired from the AMP Life Limited Board in June 2014 after 10 years of service.
ExperienceJohn has extensive experience as a director and chairman of companies in the agricultural and finance sectors. He has a track record of successfully leading change and reconstruction of diverse corporates in marketing, agribusiness and aviation. John has served numerous companies as Chairman or a Director including Air New Zealand and Solid Energy New Zealand, and is Chairman of Rabobank New Zealand.
In 1998, John received the Bledisloe Cup for outstanding contribution to the New Zealand fruit industry and in 1999, he was awarded with an Officer of the New Zealand Order of Merit for service to the New Zealand kiwifruit industry. In 2015, he was awarded an honorary Doctorate of Commerce by Lincoln University.
Listed directorship– Director of Air New Zealand Limited
(November 2001–March 2014)
Professor Peter Shergold AC9
Independent Director BA (Hons), MA, PhDPeter was appointed to the AMP Limited Board in May 2008, became a member of its Audit Committee in July 2008 and Chairman of the Risk Committee in November 2014. Peter was appointed a Director of the AMP Life Limited Board in August 2008 and a Director of the NMLA Board in March 2011.
ExperiencePeter is Chancellor and Chair of the board of trustees of Western Sydney University. He serves on a number of private sector, government and not-for-profit boards, including as a Director of Corrs Chambers Westgarth and Chairman of Opal Aged Care. Previously, Peter served as Secretary of the Department of the Prime Minister and Cabinet, CEO of the Aboriginal and Torres Strait Islander Commission and Comcare, Public Service Commissioner, Secretary of the Department of Employment, Workplace Relations and Small Business, and Secretary of the Department of Education, Science and Training.
He was appointed a Member of the Order of Australia in 1996, awarded a Centenary Medal in 2003 and made a Companion of the Order of Australia in 2007, each being for public service.
Listed directorship– Director of Veda Group Limited
(appointed October 2013)
Government and community involvement– Chairman of the National Centre
for Vocational Education Research– Chairman of the NSW Public Service
Commission Advisory Board– NSW Coordinator-General for
Refugee Resettlement
For
per
sona
l use
onl
y

AMP 2015 annual report12
AMP management team as at 18 February 2016
Our management team
1 2 3 4
Craig Meller1
Chief Executive Officer BSc (Hons) See page 10 for details of Craig’s roles, responsibilities and experience.
Pauline Blight-Johnston2
Group Executive, Insurance and Superannuation MEc, FIAA, FASSA, ANZIIF (Fellow) CIP, FFin, GAICD, FNZSAPauline Blight-Johnston joined AMP in May 2013 and is responsible for AMP’s risk insurance, retail superannuation, investment, pensions and platforms business portfolio as well as enterprise risk management.
ExperienceDuring a career which includes more than 20 years of financial services industry experience, Pauline has held a number of senior executive posts in life insurance, both in Australia and overseas. Prior to joining AMP, Pauline was Managing Director of RGA Reinsurance Company of Australia and before that, Chief Financial Officer and Appointed Actuary for Asteron Life. Pauline has also held executive roles with Tillinghast (consulting actuary) and Morgan Stanley (investment banker).
Other appointments– Director of the Financial Services Council– Executive Director of AMP Life and
The National Mutual Life Association of Australasia Limited
– Chairman of Council, MLC School Burwood
Robert Caprioli3
Group Executive, Advice and Banking BEng (Elec) (Hons)Rob joined AMP in December 2010 and is responsible for AMP’s advice, banking and corporate superannuation business portfolio.
ExperienceIn a career spanning more than 20 years in the financial and professional services sectors, Rob has held a number of senior strategic and leadership roles, both in Australia and the UK, including Vice President of marchFIRST in London, Associate Partner of Accenture and Principal for the multi-channel consulting services practice at IBM.
Before joining AMP, Rob spent six years at Westpac, leading the bank’s retail and business banking operations and developing and implementing business transformation strategies to increase efficiency and effectiveness, drive revenue, reduce operating expenses and deliver a better experience for customers.
Other appointments– Director of AMP Bank Limited– Director of the Banking and
Finance Oath Limited
Gordon Lefevre4
Chief Financial Officer FCAGordon joined AMP in January 2014 and assumed the Chief Financial Officer role from 1 March 2014.
ExperienceGordon has considerable financial services industry experience including 13 years with the National Australia Bank Group. His career at the bank included a range of both customer facing and group support function roles domestically and overseas. Immediately prior to leaving he was the Deputy Group Chief Financial Officer. Before joining AMP he was Chief Financial Officer of the Grocon Construction Group in Australia.
Other appointment – Director of AMP Bank Limited
Matthew Percival5
Group Executive, Public Affairs and Chief of Staff BAMatthew joined AMP in October 2000 and has group-wide responsibility for AMP’s communication and relationships with a broad variety of stakeholders.
ExperienceMatthew was previously Group General Manager, Public Affairs at Colonial Limited. Prior to this, he was General Manager, Public Affairs at Carlton & United Breweries, and General Manager, Group Public Affairs at the ANZ Banking Group. He also has worked in public affairs for the Coca-Cola Company and Lindeman’s Wines and as a ministerial adviser.
Other appointment – Director of AMP Foundation Limited
Jack Regan6
Managing Director, New Zealand Financial Services BEd, GradDipMktJack joined AMP in 2002 and was appointed Managing Director of New Zealand Financial Services in 2007, responsible for AMP’s operations in New Zealand.
ExperienceJack began his working life as a teacher and has since spent more than 30 years in financial services. He worked in distribution, marketing and operational roles at St.George Bank, IOOF and GIO before joining AMP’s Hillross.
Other appointments– Chairman of AMP Services (NZ) Limited– Chairman of AMP Wealth Management
New Zealand Limited
Craig Ryman7
Chief Information Officer BComCraig joined AMP in 1997 and was appointed to the role of Chief Information Officer on 1 January 2015. Craig is responsible for AMP’s information technology as well as the Strategic Sourcing, Workspace and Project Services teams.
ExperiencePrior to his current role, Craig was IT Director for AMP’s Advice and Banking and Insurance and Superannuation business areas. During his time at AMP Craig has led the IT function for a variety of different areas of the business and has also completed a range of transformation programs including the integration of the Australia and New Zealand businesses of AXA Asia Pacific Holdings, platform consolidation projects and transformation initiatives in Australia and the UK.
Before joining AMP, Craig worked as a superannuation consultant for William M Mercer in Australia.
Paul Sainsbury8
Chief Customer OfficerPaul was appointed Chief Customer Officer in April 2013 and is responsible for taking a strategic focus on AMP customers and improving their experience.
For
per
sona
l use
onl
y

AMP 2015 annual report 13
9
5 6 7 8
10 11 12
Paul is also responsible for the Group Strategy, Customer Strategy and Experience, Brand and Marketing, Customer Segments, Business Development, Digital Services, Design, Innovation and New Ventures and AMP Self-Managed Superannuation teams as well as a dedicated business transformation team.
ExperiencePaul Sainsbury has worked in the finance industry for over 30 years and has held a number of leadership positions since joining AMP in 2000. These include Director, Product Manufacturing; Chief Operating Officer, AMP Financial Planning, Advice and Services; Chief Operating Officer, Product Manufacturing; Director Mature Products and Customer Service; and Operations Manager. From 2010–2013, Paul was responsible for integration following AMP’s merger with the Australian and New Zealand businesses of AXA Asia Pacific Holdings Limited.
Brian Salter9
Group General Counsel BA, LLB (Hons), LLM (Hons)Brian joined AMP in July 2008 as Group General Counsel.
ExperienceBrian has over 30 years experience in the legal profession advising many of Australia’s leading financial and wealth management companies. Before joining AMP, Brian was a partner with a major Australian law firm for 19 years and a member of its executive team for a number of years.
Brian is a former member of the Australian Government’s Corporations and Markets Advisory Committee (CAMAC) which was established to provide independent advice to the Australian Government on issues that arise in corporations and financial markets law and practice. Brian is also a member of the Legal Committee of the Australian Institute of Company Directors and the Corporations Committee of the Business Law Section of the Law Council of Australia and is the Deputy Chair of the General Counsel 100. He is a former Chairman and National Committee member of the Australian Securitisation Forum.
Other appointments– Director of AMP Superannuation Limited
and Director of N M Superannuation Proprietary Limited
– Director of SCECGS Redlands Limited
Wendy Thorpe10
Group Executive, Operations BBus (Acc), BA (French), GradDip (AppFinInv)Wendy joined AMP during the merger with the Australian and New Zealand businesses of AXA Asia Pacific Holdings Limited and is responsible for all contact centres, product administration operations including underwriting and claims, and customer and adviser support services. She is also Director of the AMP Melbourne office.
ExperienceWendy was previously Director, Operations for AMP Financial Services and Chief Operations Officer of AXA Australia having re-joined AXA in January 2008 after a period as General Manager, Institutional Technology at ANZ Bank in 2007 and 2008. Prior to her time at ANZ Bank, Wendy held a number of senior roles at AXA in the business services and information systems areas, including the role of Chief Information Officer from 2003 to 2007. Before joining National Mutual/AXA in 2000 Wendy was Manager, Information Systems at ANA, now known as Australian Unity.
Other appointments– Member of the Swinburne University
Council– Member of the Swinburne University
Resources Committee– Director of Very Special Kids
Adam Tindall11
Managing Director, AMP Capital BE (Hons), GDipMan, GradCertAppFinInvAdam joined AMP Capital in 2009 and was appointed Managing Director in 2015. AMP Capital is a specialist investment manager which manages funds on behalf of retail and institutional clients across a range of asset classes including equities, fixed interest, property and infrastructure.
AMP Capital has offices in Australia, Bahrain, China, Hong Kong, India, Japan, Luxembourg, New Zealand, the United Kingdom and the United States.
ExperienceBefore being appointed Managing Director, Adam held the role of Director and Chief Investment Officer, Property at AMP Capital. Adam has 28 years of extensive experience in the property industry. He joined AMP Capital Property in 2009 from Macquarie Capital where he was Executive Director, Property and Infrastructure, responsible for creating or enhancing a number of major property investment funds. Prior to this, Adam spent 17 years with Lend Lease, ultimately working in various business leadership roles including CEO, Asia Pacific for Bovis Lend Lease.
Other appointments– Director of AMP Capital Holdings Limited– Executive Member of the Australia
Japan Business Co-operation Committee
Fiona Wardlaw12
Group Executive, People and Culture BA (Psych) (Hons)Fiona joined AMP in August 2008 and has responsibility for AMP’s people and culture function.
ExperienceFiona joined AMP from ANZ Bank where, as head of Leadership and Talent, she was responsible for recruitment strategy, talent management, succession planning and senior executive development. Prior to joining ANZ, Fiona worked in the Australian banking operations at National Australia Bank, where her roles included heading up the bank’s unsecured lending and credit card businesses and leading the Australian human resources function.
Her background also includes executive human resources experience in the resources and telecommunications sectors, including Cable and Wireless’ cable TV start-up Optus Vision and BHP.
Other appointment– Director of AMP Foundation Limited
For
per
sona
l use
onl
y

AMP 2015 annual report14
Corporate governance
Our promise is to help people own tomorrow. This is a responsibility we take seriously and our governance framework is designed to provide the right structure and review processes to deliver on our promise for many years to come.
Key information During 2015, we continued to strengthen and enhance our corporate governance practices, including in the following key areas:
Shareholder engagement – we value communication with our shareholders and have introduced more ways for our shareholders to engage with us. We introduced a new shareholder information session and opened new channels of communication to enable shareholders who are unable to attend the annual general meeting (AGM) to still participate in the meeting.
Succession planning – ensuring our board maintains the right compilation of skills and experience to drive our business forward is key to our success. We have formalised our board skills matrix outlining the skills and experience that will ensure we continue to have the right mix of directors to support our strategy. In support of our customer-centred transformation we have appointed Holly Kramer, an expert in retail and marketing, to the board. Vanessa Wallace, an experienced financial services consultant, will join our board from 1 March 2016.
Inclusion and diversity – we believe having an inclusive and diverse workplace delivers better business results so we have expanded our inclusion and diversity program and set ourselves even more challenging gender diversity targets for our boards. We are pleased that, as at 1 March 2016, 40% of the AMP Limited Board will be female.
Engaging with our shareholdersWe encourage our individual and institutional shareholders to actively engage with our business.
Our shareholders are the owners of our company and we value their input. We have the second largest shareholder base in Australia with over 800,000 shareholders, many of whom are also our customers.
Keeping our shareholders informedWe value direct, two-way communication with our shareholders and ensure they receive clear, transparent and timely information about our business. We communicate with our shareholders on all key changes to our business and issues impacting our industry.
We take our continuous disclosure obligations seriously. All material price sensitive information that requires disclosure is made available through the Australian Securities Exchange (ASX) and New Zealand Stock Exchange (NZX). Shareholders can also elect to receive emails directly from AMP on key announcements and we continue to encourage shareholders to provide their email address so we can deliver timely updates direct to their inbox.
Shareholders can elect to receive their annual reports, notices of meeting and dividend statements in print or online. If they choose to receive their reporting information online they can still opt to receive a copy of their dividend statement by post. In addition, shareholders are able to communicate electronically with our share registry, Computershare. Shareholders are also able to lodge their proxy forms online using their computer or mobile device.
Our investor relations team coordinates an investor relations program and conducts group and one-on-one briefings with our institutional investors and analysts. Where possible, our group briefings are webcast. Our dedicated shareholder website includes a calendar of upcoming announcements and presentations and allows users to set up automatic diary reminders of these dates. You can find this website at amp.com.au/shares.
Annual shareholder meetingOur board welcomes the opportunity to meet with our shareholders and encourages them to join us for our AGM each year either in person or via our webcast. In 2015, we enabled shareholders to ask questions online during the AGM if they were unable to attend the meeting in person.
We also introduced an information session for shareholders held just before the AGM. The session provided an opportunity for shareholders to hear from our financial experts and benefit from their insights and expertise. A similar session will be held before the 2016 AGM at 9.30am on Thursday 12 May 2016. All shareholders are invited to join the session in person or online.
2016 annual general meetingThe shareholder information session will be followed by the AMP 2016 annual general meeting at 11am at Grand Hyatt Melbourne, 123 Collins Street, Melbourne, Victoria, Australia. Shareholders who are unable to attend can appoint a proxy to vote on their behalf before the meeting online or by post or fax and can participate in the meeting through our webcast. You can find full details in the 2016 notice of meeting.
Our board of directorsThe AMP Limited Board oversees the management of our company on behalf of shareholders.
The governance and performance of AMP is overseen by a board of directors elected by shareholders. The responsibilities of the board and the directors are outlined in our corporate governance charter.
The board is responsible for overseeing the management of AMP on behalf of shareholders. In addition to the matters the board is required by law to approve, its key responsibilities include:– approving the strategic direction of the company– approving the appointment of the chief executive officer
(CEO) and chief financial officer (CFO), and the remuneration arrangements for certain key executives
– monitoring the performance of the management team and the business
Corporate governance at AMP This section explains how AMP’s business is structured and managed to deliver on our strategy and protect the interests of our shareholders, customers, employees, business partners and communities.
For
per
sona
l use
onl
y

AMP 2015 annual report 15
– approving the company’s risk appetite, monitoring risk management policies and practices and overseeing our risk culture
– overseeing the governance of AMP.
Board composition
Our non-executive directors have diverse backgrounds. Each brings valuable skills and experience to help oversee the delivery of our strategy and manage the opportunities and risks we face.
Under our corporate governance charter, the board must be made up of a majority of independent non-executive directors and will have no more than two executive directors. The chairman of the board will be non-executive and independent.
Our board is made up of eight independent non-executive directors and the CEO. Our Chairman, Simon McKeon joined the board in 2013 and was elected Chairman in 2014. He is responsible for providing leadership to the board and the AMP group as a whole. The chairman’s other responsibilities are documented in the corporate governance charter.
You can find biographies of the board of directors, including details of their qualifications, tenure and experience on pages 10 and 11 and on our website.
Board committeesThe board is supported by four committees, which focus in detail on different areas of the board’s responsibilities and provide a strong governance framework.
The board has the following four committees to assist in the execution of its responsibilities:
Audit Committee – responsible for the integrity of the financial statements, and monitoring the performance and independence of the external auditor and Internal Audit team
Nomination and Governance Committee – responsible for the composition of AMP’s boards, succession planning, director performance reviews and non-executive director remuneration
People and Remuneration Committee – responsible for the effectiveness, integrity and compliance of AMP’s remuneration programs and packages, the remuneration and performance of the CEO and other key employees, succession planning and talent management and AMP’s diversity strategy
Risk Committee – responsible for the appointment of the chief risk officer, maintaining a sound risk culture, managing our risk position relative to our risk appetite, our capital strength and the effectiveness and integrity of AMP’s enterprise risk management framework.
These committees focus on different areas, considering issues, making recommendations and taking action as necessary. The committees meet throughout the year and attendance records are included in the directors’ report. Throughout 2015, all committee members were independent directors. The membership of the committees as at 31 December 2015 is provided in the table below.
You can find the terms of reference for each committee at amp.com.au/corporategovernance.
Managing risksEvery day we monitor and manage risks to deliver sustainable growth, protect our business and our stakeholders’ interests, and meet our legal and regulatory obligations.
To meet our strategic objectives and deliver sustainable growth, we need to take considered risks. Our risk management framework enables us to identify, understand and manage these risks effectively. This enables us to grow our business whilst also meeting the expectations of key stakeholders and safeguarding our customers, our reputation and our capital.
Our shareholders
AMP Limited Board Oversees management of AMP on behalf of shareholders
Audit Committee Oversees financial reporting
Nomination and Governance Committee
Oversees board and committee membership and
succession planning
Chief executive officer Responsible for the day to day management of our company and the implementation of our strategic objectives
Group Leadership Team Responsible for running our business and delivering on our strategic objectives
Our people
People and Remuneration Committee
Oversees key remuneration and people policies and practices
Risk Committee Oversees current and future
risk management
Our governance structure
Audit CommitteeNomination and Governance Committee
People and Remuneration Committee Risk Committee
Trevor Matthews (Chairman)Holly KramerPeter Shergold
Catherine Brenner (Chairman)Patricia AkopiantzSimon McKeon
Patricia Akopiantz (Chairman)Brian ClarkSimon McKeon
Peter Shergold (Chairman)Patricia AkopiantzTrevor Matthews
For
per
sona
l use
onl
y

AMP 2015 annual report16
Corporate governance
GovernanceThe board has overall responsibility for the risk management framework including approval of AMP’s strategic plan, risk management strategy and risk appetite. It also monitors the policies and practices necessary for the business to operate within the agreed appetite and comply with applicable laws and regulations. The board provides clear boundaries for acceptable risk taking and monitors the business to ensure all risks are contained. The Risk Committee monitors AMP’s risk management processes so that they remain appropriate and effective. Our risk management framework is represented above.
Our Risk Committee and board review the risk management framework at least annually, to satisfy themselves that it continues to be sound.
We have a three lines of defence approach to risk management accountability:
Line 1 – management is responsible for identifying, assessing, monitoring and managing material risks
Line 2 – the chief risk officer and the Enterprise Risk Management team are responsible for designing, implementing and monitoring the practices and processes to identify, assess, monitor and manage material risks and provide advice and oversight on all material business decisions
Line 3 – the Internal Audit team provides independent and objective assurance to the board on the management of risks across the business and the effectiveness of our control processes.
Management processes are complemented by the Internal Audit team which regularly reports to the leadership team and the board on the management of risks within the organisation. This team calls on support and advice from external experts as required.
An outline of AMP’s key risks can be found in the directors’ report.
Our approach to taxWe are proud of the contribution we make to the public finances of the countries in which we operate.
We take our tax obligations very seriously and are focused on integrity in both compliance and reporting. The AMP Limited Board does not sanction or support any activities which seek to aggressively structure AMP’s tax affairs.
We publish details of the taxes we pay in the AMP tax report on our shareholder centre website at amp.com.au/shares. The report is consistent with the consultation paper released on 11 December 2015 by the Board of Taxation relating to a proposed new voluntary tax transparency code.
The majority of our tax is paid in Australia and determined by the nature of our business. For example, superannuation is subject to different (lower) tax rates and we pay our taxes accordingly.
We have an annual compliance arrangement in relation to both income tax and GST with the Australian Taxation Office and work closely with them to ensure we meet all our tax requirements.
Comparison of NZX and ASX corporate governance rulesAs an overseas listed issuer, AMP Limited is deemed to satisfy and comply with all the NZX Listing Rules so long as it remains listed on the ASX. The only NZX requirements applicable to AMP are to give the NZX the same information and notices it is required to give to the ASX and to include a statement to this effect in its annual report.
The ASX Listing Rules and the ASX Recommendations may differ materially from NZX’s corporate governance rules and the principles of the NZX Corporate Governance Best Practice Code. You can find further information about the ASX Recommendations on the ASX website: asx.com.au/regulation/corporate-governance-council.htm.
Acting ethically and responsiblyWe want to create a better tomorrow for our customers, employees, business partners, communities and shareholders.
Everything we do, every decision we make has an impact, not only on the long-term success of our business but also on the lives of our customers. We are committed to acting with professionalism, honesty and integrity so all our stakeholders know they can trust us to do the right thing. You can find information on the structure of our business, our board and management teams and our policies and practices at amp.com.au/aboutamp.
Throughout 2015, we complied with the third edition of the ASX Corporate Governance Principles and Recommendations and we continually review our governance practices to ensure we not only meet but exceed the expectations of the regulators and all our stakeholders. Our board approved corporate governance statement, dated 17 February 2016, is available on our website at amp.com.au/corporategovernance.
Risk strategy and appetiteRisk strategy – supports business strategy
Risk appetite – level of risk AMP is willing to accept
Identify risks
Our people and risk culture
Measure and analyse risks
Business systems and information management
Monitor and report risks Optimise and control risks
GovernanceAMP Limited and subsidiary boards and risk committees
Management risk committees Risk policies and procedures
Our risk management framework
For
per
sona
l use
onl
y

AMP 2015 annual report 17
Directors’ report
Operating and financial reviewPrincipal activitiesAMP is Australia and New Zealand’s leading independent wealth management company, with an expanding international investment management business and a growing retail banking business in Australia.
We provide retail customers in Australia and New Zealand with financial advice, superannuation, retirement income and investment products. We also provide superannuation services for businesses, administration, banking and investment services for self-managed superannuation funds (SMSF), income protection, disability and life insurance, and selected banking products. These products and services are delivered directly from AMP and through a network of over 4,000 aligned and employed financial advisers in Australia and New Zealand and extensive relationships with independent financial advisers.
Through AMP Capital, we manage investments across major asset classes including equities, fixed interest, infrastructure, property, diversified funds, multi-manager and multi-asset funds, for domestic and international customers. AMP Capital also provides commercial, industrial and retail property management services.
We have over 5,400 employees, around 800,000 shareholders and manage over $220 billion in assets.
AMP Capital has a strategic alliance with leading Japanese bank, Mitsubishi UFJ Trust and Banking Corporation (MUTB) through which MUTB holds a 15% minority interest in AMP Capital Holdings Limited. AMP Capital holds a 15% stake in China Life AMP Asset Management Company Limited, a funds management company which offers retail and institutional investors in China access to leading investment solutions. AMP also owns a 19.99% stake in China Life Pension Company.
In this report, our business is divided into six areas: Australian wealth management, AMP Capital, Australian wealth protection, AMP Bank, New Zealand financial services and Australian mature.
The Australian wealth management business provides customers with superannuation, retirement income, investment, SMSF administration and financial advice services (through aligned and owned advice businesses).
AMP Capital is a diversified investment manager, managing investments across major asset classes including equities, fixed interest, infrastructure, property, diversified funds, multi-manager and multi-asset funds.
Australian wealth protection comprises individual and group term, disability and income protection insurance products. Products can be bundled with a superannuation product or held independently.
AMP Bank is an Australian retail bank offering residential mortgages, deposits, transaction banking, and SMSF products with around 100,000 customers. It also has a small portfolio of practice finance loans. AMP Bank distributes through brokers, AMP advisers, and direct to retail customers via phone and internet banking.
New Zealand financial services provides tailored financial products and solutions to New Zealanders through a network of financial advisers. New Zealand financial services has a leading market position in both wealth protection and wealth management, in addition to being the market leader in advice and in providing support to advisers.
The Australian mature business is the largest closed life insurance business in Australia. Australian mature assets under management (AUM) comprises capital guaranteed products (76%) and market-linked products (24%). Australian mature products include whole of life, endowment, investment-linked, investment account, retirement savings account, eligible rollover fund, annuities, insurance bonds, personal superannuation and guaranteed savings accounts.
2015 performance
We are pleased with the continued growth momentum and resilience of our business in 2015, especially given the challenging market conditions in the second half. We have delivered growth in our Australian wealth management, AMP Capital, AMP Bank and New Zealand businesses, while controlling costs and further strengthening our capital position.
The profit attributable to shareholders of AMP Limited for the year ended 31 December 2015 was $972 million (2014: $884 million).
Underlying profit for the year ended 31 December 2015 was $1,120 million (2014: $1,045 million).
Underlying profit is our key measure of business profitability, as it normalises investment market volatility stemming from shareholder assets invested in investment markets and aims to reflect the trends in the underlying business performance of the AMP group.
Basic earnings per share for the year ended 31 December 2015 on a statutory basis were 33.3 cents per share (2014: 30.3 cents per share). On an underlying basis, earnings were 37.9 cents per share (2014: 35.3 cents per share).
Key performance measures were as follows:
– 2015 underlying profit of $1,120 million, up 7% on 2014, with strong contributions from AMP’s AUM driven businesses, AMP Bank and New Zealand financial services
– 2015 AMP group cost to income ratio of 43.8%, an improvement of 1.0 percentage point on 2014
This directors’ report provides information on the structure and progress of our business, our 2015 financial performance, our strategies and prospects for the future and the key risks we face. It covers the consolidated entity of AMP Limited and the entities it controlled during the year ended 31 December 2015.
For
per
sona
l use
onl
y

AMP 2015 annual report18
Directors’ report for the year ended 31 December 2015
– Australian wealth management 2015 net cashflows were $2,213 million, down $68 million from net cashflows of $2,281 million in 2014. Growth in AMP’s retail and corporate super platform net cashflows was offset by an increase in external platform net cash outflows, largely due to the closure of Genesys Wealth Advisers. Excluding Genesys advisers who left AMP in 2015, net cashflows increased 27% from 2014
– AMP Capital external net cashflows were $4,434 million, up 19% from net cashflows of $3,723 million in 2014, driven by stronger inflows generated through the China Life AMP Asset Management joint venture and both institutional and retail domestic clients
– Underlying return on equity increased 0.5 percentage points to 13.2% in 2015 from 12.7% in 2014, largely reflecting the increase in underlying profit.
AMP’s total AUM was $226 billion at 31 December 2015 (2014: $214 billion).
Differences between underlying profit and statutory profitThe 31 December 2015 underlying profit of $1,120 million excludes the impact (net of any tax effect) of:– net loss from one-off and non-recurring items of $3 million– business efficiency program costs of $66 million– amortisation of AXA acquired intangible assets of $80 million– market adjustment gains of $45 million– accounting mismatches loss of $44 million.
A reconciliation between underlying profit and statutory profit is provided in note 3 of the financial report.
Under Australian Accounting Standards, some assets held on behalf of policyholders (and related tax balances) are included in the financial statements at different values to those used in the calculation of the liability to policyholders in respect of the same assets. Movements in these policyholder assets flow through to shareholder profit. These differences have no impact on the true economic profits and losses of the AMP group.
The impact of accounting mismatches on profit after tax arising from policyholder assets is as follows:
Accounting mismatch profit/(loss)2015
$m2014
$m
Treasury shares (23) (46)Investments in controlled entities (19) 25Superannuation products invested with AMP Bank 2 4Owner occupied property (4) (1)Total accounting mismatch profit/(loss) (44) (18)
Operating results by business areaThe operating results of each business area for 2015 were as follows:
Australian wealth management – operating earnings increased by $36 million (10%) to $410 million in 2015 from $374 million in 2014. The increase in operating earnings was largely due to strong net cashflows and investment returns generating growth of over 10% in average AUM from 2014 and a continued focus on costs which declined 2.7% from 2014.
AMP Capital – AMP group’s 85% share of AMP Capital’s 2015 operating earnings was $138 million, up 20% from $115 million in 2014. Despite soft equity markets in the second half of 2015,
AMP Capital’s operating earnings benefited from strong fee income growth of 14%, assisted by higher performance fees and strong net cash inflows. The strong fee income growth was partially offset by a 9% increase in controllable costs.
Australian wealth protection – operating earnings declined by $3 million (2%) to $185 million in 2015 from $188 million in 2014, impacted by experience losses of $11 million over the year.
AMP Bank – operating earnings increased $13 million (14%) to $104 million in 2015 from $91 million in 2014. Total revenue increased 14% in 2015 on 2014, driven by improved net interest margin and growth in the loan portfolio.
New Zealand financial services – operating earnings increased by $10 million (9%) to $120 million in 2015 from $110 million in 2014, mainly as a result of higher profit margins and experience profits, partially offset by the reduction in transitional tax relief. Excluding the effect of the tax relief reduction, operating earnings increased by 22%.
Australian mature – operating earnings fell $16 million to $158 million in 2015 from $174 million in 2014. Operating earnings were impacted by the expected portfolio run-off ($8 million decrease), experience losses ($5 million) and large one-off wholesale investor redemptions in the second half of 2014 ($5 million). These were partially offset by lower controllable costs ($2 million).
Capital management and dividendEquity and reserves of the AMP group attributable to shareholders of AMP Limited increased to $8.5 billion at 31 December 2015 from $8.2 billion at 31 December 2014.
AMP remains well capitalised, with $2.5 billion in shareholder regulatory capital resources, above minimum regulatory requirements (MRR) at 31 December 2015 ($2.0 billion at 31 December 2014).
AMP’s final 2015 dividend is 14.0 cents per share, franked to 90%. This represents a final 2015 dividend payout ratio of 74% of underlying profit. AMP will continue to offer the dividend reinvestment plan (DRP) to eligible shareholders. AMP intends to neutralise the impact of the DRP by acquiring shares on market to satisfy any entitlements under the DRP.
Strategy and prospects
Our vision is to be Australia’s and New Zealand’s favourite financial services company.
Our strategy for achieving this vision is outlined below. Information which could affect our competitive advantage if published has been omitted.
AMP’s four strategic initiatives are aligned to our purpose of helping people own tomorrow.
1. GrowthAMP’s priority is to invest in the Australian wealth industry by building on its leading market positions to capture growth.
AMP has chosen to operate in large and growing markets where it can exercise its competitive advantages. The company’s primary priority is to grow in the expanding $2.6 trillion1 Australian wealth management market.
In addition, AMP is also focused on growing its operations in New Zealand, and in selected international markets through its investment manager, AMP Capital.
1 ABS Managed Funds Report, Managed Funds Industry, September 2015.
For
per
sona
l use
onl
y

AMP 2015 annual report 19
AMP maintains its number one2 market share position in the Australian superannuation market, which is projected to double in size by 20263. Self-managed superannuation is the largest segment of the superannuation market, and AMP has become the market leader in SMSF administration. In January 2016, AMP announced a new business name and operating structure for its SMSF unit, known as SuperConcepts. SuperConcepts incorporates a full range of SMSF administration and software services.
AMP maintains its number one position in the individual risk insurance market4. The recovery of the company’s life insurance business continues to be a key priority.
Growing AMP Bank through AMP’s advice network remains a priority. At the end of 2015, 24% of mortgage business was derived from this network.
2. Transform the Australian businessAMP is transforming its core Australian business to be more customer-centric. This means providing better, more relevant customer experiences and solutions.
During the past two years, AMP has put in place the core infrastructure of this customer-centred business.
Transform face-to-face advice modelAMP is aiming to make financial advice more relevant, accessible and affordable for consumers, and at the same time, more efficient and profitable for AMP and its advisers. The company is currently piloting an innovative goals-based face-to-face advice experience.
Diversify customer channelsAMP wants to give customers choice about how to interact with us. To do this, AMP is transforming its digital capabilities and installing the core infrastructure to build a seamless omni-channel experience.
Deliver a superior customer experienceAMP is beginning to transform its customers’ service experiences. Customer-facing teams are now using a customer feedback and measurement system to identify and improve service.
Build a goals-oriented enterpriseConsumer research has built conviction in taking a goals-based approach to products and services. This approach will be rolled out across the company from 2016. Four goals have been prioritised, and customer solutions are now being designed for them.
3. Reduce costsEfficiency continues to be a high priority for AMP, so that the company can continue to invest in better customer experiences – and increase its profitability.
The three year business efficiency program (expected to lead to $200 million in pre-tax recurring run rate cost savings by the end of 2016 for a one-off investment of $320 million pre-tax) continues to be on track.
4. Expand internationallyAMP continues to expand internationally, primarily through AMP Capital, in high-growth potential regions where its expertise and capabilities are in demand.
It is doing this by building strong partnerships with national champions in China and Japan and capitalising on investor demand for infrastructure, property and fixed income capabilities.
Strategies and prospects by business area5,6
Australian wealth managementAustralian wealth management’s key priorities are to:– build a more customer-centric business whilst remaining
vigilant on cost control– improve the quality of the advice experience and expand
the methods by which customers can access AMP’s products and services
– use new capabilities to design customer-centric offers covering advice, products and services
– develop a strong SMSF capability.
The announced closure of Genesys Wealth Advisers in November 2014 will impact current and future period cashflows. However, the impact on Australian wealth management operating earnings and value measures is expected to be immaterial.
AMP CapitalWorking as a unified investment house, AMP Capital’s key priorities are to generate revenue growth through:– delivering outstanding investment outcomes to clients– building a differentiated client experience driving strong
client engagement– partnering effectively across the AMP group to deliver
investment solutions for retail, SMSF and corporate super customers
– expanding the global pension fund client base– building preferential distribution partnerships in select
Asian markets, particularly Japan and China.
Australian wealth protectionThe key priorities for management are to:– drive the ongoing business recovery program to ensure
its long-term sustainability– maximise value creation through the implementation of
customer retention initiatives and claims management– drive improved capital efficiency of the business– increase product sales through AMP’s adviser networks
and corporate super channels.
The gradual reversion of best estimate claims and lapse assumptions to lower longer-term levels, combined with increasing costs from continued investment in the wealth protection business, will require ongoing delivery of improved lapse and claims outcomes in order to avoid negative experience over time.
AMP BankAs the banking arm of a wealth manager, AMP Bank’s role is to leverage and grow the group’s customer base to provide core banking solutions to help meet the goals of customers. In aligning with this strategic imperative, AMP Bank’s priorities are to:– deliver compelling customer-centric banking propositions
to AMP group target customer segments– make banking easier for customers by investing in
technology and service excellence
2 Fund Market Overview Retail – Marketer, Plan for Life, September 2015.3 Dynamics of the Australian Superannuation System, The Next 20 Years: 2015–2035, Deloitte, November 2015; AMP modelling. 4 Life Insurance Overview – Risk Insurance, Plan for Life, September 2015.5 Forward looking statements in the strategies and prospects by business segment section of the directors’ report are based on management’s current
views and assumptions and involve known and unknown risks and uncertainties, many of which are beyond AMP’s control and could cause actual results, performance or events to differ materially from those expressed. These forward looking statements are not guarantees or representations of future performance, and should not be relied upon.
6 AMP does not produce a profit forecast as this is driven by market movements which cannot be predicted. However, AMP does provide forward looking guidance on certain business outcomes.
For
per
sona
l use
onl
y

AMP 2015 annual report20
Directors’ report for the year ended 31 December 2015
– maintain focus and growth in both the aligned adviser and mortgage broker channels
– leverage AMP group investments to build out capabilities in direct and digital
– continue to optimise AMP Bank’s funding sources and invest in operating capacity.
New Zealand financial servicesNew Zealand financial services (NZFS) has the following key priorities to grow shareholder value:– deepen its customer relationships– re-engineer wealth protection to increase product
attractiveness– transform wealth management to maximise efficiency
and market opportunities created by regulatory change– evolve advice and distribution capability– leverage the KiwiSaver opportunity– build on its general insurance partnership– continue its focus on cost control.
Changes to the taxation of life insurance business in New Zealand impacted the business from 1 July 2015. This resulted in a one-off reduction in profit margin of $10 million in the second half of 2015. NZFS continues to grow its revenue base across the business, closely manages costs and is evolving its distribution channels to reduce capital impacts of distributing life insurance. The tax changes apply to all life insurance companies in New Zealand and are not specific to AMP’s NZFS business.
Australian matureKey priorities for the Australian mature business are to:– maintain high persistency– prudently manage asset and liability risk– achieve greater cost efficiency– maintain capital efficiency.
The Australian mature business remains in slow decline but is expected to remain profitable for many years. It is expected to run off between 4% and 6% per annum. In volatile investment markets, this run-off rate can vary substantially. The run-off of AUM mirrors policy liabilities, although there is potential for profit margins to be impacted differently. The run-off of Australian mature AUM is anticipated to have an average duration of approximately 13 years, but will be impacted by investment markets. The expected run-off of Australian mature is not anticipated to be materially different from current guidance as a result of MySuper transition activity.
Key risks
The environment in which we operate is constantly changing. These changes create both opportunities and risks for our business. We have a strong strategic plan in place to drive our business forward and a robust risk management framework to identify, understand and manage risks.
Key risks which may impact AMP’s business strategies and prospects for future financial years include:
– A volatile economic environment: this could have a negative impact on the profitability of AMP. When markets are volatile and investment returns are low, customers are more likely to change their investment preferences and products. This could result in customers choosing to put less of their discretionary savings into AMP superannuation and investment products which would reduce AMP’s cash inflows and create lower profit margins. AMP continues to monitor market conditions and review its product offerings to ensure they continue to meet changing customer needs. Volatile investment markets and a low interest rate environment can also impact the
risks associated with capital guaranteed products, and AMP actively manages capital, liquidity and funding requirements in this context.
– Disruption to business operations: AMP continues to implement programs that change its Australian business to better anticipate and respond to the threats and opportunities that arise from changing customer demands, the evolving market environment, and the strategies of existing and new competitors. Both customers and shareholders will benefit from this reshaping of the Australian business. Programs of this type can naturally cause disruption within a business as it adapts to new approaches, models and ways of working. To manage these changes, AMP has dedicated resources and expertise working with business areas, and well established change programs and processes in place.
– Regulatory changes to the financial services industry: the Australian financial services industry is in a period of significant regulatory change in relation to superannuation, the provision of financial advice, banking, capital requirements, and foreign tax legislation. The interpretation and the practical implementation of regulation, coupled with the failure to manage and implement the required changes, could adversely impact AMP’s business model, or result in a failure to achieve business and/or strategic objectives. AMP actively engages with the government, regulators and industry bodies, and has dedicated resources and change programs underway to ensure compliance with the new requirements.
– Non-compliance with regulatory and legislative requirements: failure to comply with regulatory and legislative requirements could result in breaches, fines, regulatory action or reputational impacts. AMP has established frameworks and dedicated legal, risk and compliance teams who work closely with the business to meet its regulatory and legal obligations. The provision of financial advice to customers is one of the current focus areas and AMP is working closely with regulators and external advisers to review processes and controls to ensure all financial advice provided by AMP advisers is compliant with the relevant regulations and in the best interests of the customer.
– Elevated insurance claims and lapse rates: in recent years, in common with much of the industry, AMP has experienced volatile and elevated insurance claims and lapse rates. However, there are many factors impacting claims and lapse experience including slower economic activity, cost of living pressures and unemployment levels, the impact of the Future of Financial Advice and life insurance adviser remuneration reforms, changes in society’s attitudes to claiming benefits and changes in health of lives insured, changes in state-based injury compensation schemes as well as changes in AMP’s business mix over time. One of AMP’s priorities is to improve the profitability of its insurance products, some of which are in loss recognition and can have a large impact on earnings when claims and lapse experience assumptions change. Key projects are underway to change the way insurance claims are managed to help customers return to work faster and better understand the value and benefits of their policies, with the aim of reducing the number of policies which lapse. Volatility in wealth protection experience is to be expected from period to period given the size of AMP’s in-force book in Australia. Further, whilst remediation of the Australian wealth protection business progresses, there continues to be potential for increased volatility in this area of the business.
For
per
sona
l use
onl
y

AMP 2015 annual report 21
– Outsourcing risk: AMP has a number of material outsourcing arrangements with external service providers that support critical business functions. If these are not appropriately managed it could affect AMP’s service to customers, financial performance, ability to meet regulatory requirements and reputation. AMP would also need to fund the cost of correcting any issues. AMP has policies and processes in place to ensure appropriate governance and management of external service providers. Dedicated teams regularly monitor contracts, service level agreements and performance targets to ensure required deliverables and standards are met.
– Cyber risk: the ongoing evolution of technologies has led to a rapidly changing environment that criminal networks will seek to exploit. Cybercriminals can impact AMP and our customers by finding new ways to exploit weaknesses in processes, hacking into customers’ computers, deceiving employees, and exploiting potential weaknesses in AMP’s control environment. AMP’s network and assets are protected through the use of detective, preventative and responsive tools. While defence systems are continually reviewed and assessed it is inevitable that cybercrime will occur. In assessing and mitigating cybercrime, AMP considers vulnerabilities and the potential for control failures across people, processes and technology.
The directors expect these risks will continue to have the potential to impact AMP and management will continue to monitor and manage these, and other, risks closely.
The environmentIn the normal course of its business operations, AMP is subject to a range of environmental regulations of which there have been no material breaches during the year. Further information on AMP’s environment policy and activities is included in the 2015 community report.
Significant changes to the state of affairsDetails of changes in AMP’s strategic priorities are set out earlier in this report.
Events occurring after the reporting dateAs at the date of this report, the directors are not aware of any matter or circumstance that has arisen since the reporting date that has significantly affected or may significantly affect the entity’s operations in future years; the results of those operations in future years; or the entity’s state of affairs in future years which is not already reflected in this report, other than the following:
– On 18 February 2016, AMP announced a final dividend on ordinary shares of 14.0 cents per share. Details of the announced dividend and dividends paid and declared during the year are disclosed in note 18 of the financial report.
The AMP Limited board of directorsThe management of AMP is overseen by a board of directors who are elected by shareholders.
The directors of AMP Limited during the year ended 31 December 2015 and up to the date of this report are listed below. Directors were in office for this entire period (except where stated otherwise): Simon McKeon (Chairman), Craig Meller (Chief Executive Officer and Managing Director), Patricia Akopiantz, Catherine Brenner, Brian Clark, Paul Fegan (retired 30 November 2015), Holly Kramer (appointed 14 October 2015), Trevor Matthews, John Palmer and Peter Shergold. Vanessa Wallace will join the AMP Limited Board on 1 March 2016.
Details of each of the current directors’ qualifications, experience, special responsibilities, and directorships of other listed companies are given in the Our board section on pages 10 and 11 of this annual report.
Attendance at board and committee meetings The table below shows details of attendance by directors of AMP Limited at meetings of boards and the committees of which they were members during the year ended 31 December 2015. The directors also attended other meetings, including management meetings and meetings of subsidiary boards or committees of which they were not a member during the year.
Board/CommitteeAMP Limited
Board meetingsAudit
CommitteeRisk
Committee
Nomination and Governance
Committee
People and Remuneration
CommitteeAd hoc
committees1
Subsidiary and committee
meetings2
Held/attended A B A B A B A B A B A B A B
Simon McKeon 11 11 – – – – 7 7 9 9 5 5 – –Craig Meller 11 11 – – – – – – – – 2 2 15 14Patricia Akopiantz 11 11 6 6 4 4 4 4 9 9 – – 23 22Catherine Brenner 11 11 – – – – 7 7 – – – – 18 18Brian Clark 11 11 – – – – 3 3 9 9 – – 10 10Paul Fegan (retired 30/11/15)3
11 9 6 5 4 3 – – – – 3 3 14 13
Trevor Matthews 11 11 6 6 4 4 – – – – 4 4 18 18John Palmer 11 10 – – – – – – – – – – 10 10Peter Shergold 11 10 6 5 4 3 – – – – – – 9 8Holly Kramer (app 14/10/15)4
2 2 – – – – – – – – – – – –
Column A – indicates the number of meetings held while the director was a member of the board/committee. Column B – indicates the number of those meetings attended. 1 Ad hoc committees of the board were organised during the year in relation to financial results and AMP group capital initiatives. 2 Subsidiary board and committee meetings include AMP Life/The National Mutual Life Association of Australasia (NMLA), AMP Bank and AMP Capital
Holdings. Where meetings of AMP Life/NMLA were held concurrently, only one meeting has been recorded in the above table.3 Paul Fegan retired as a Director on 30 November 2015.4 Holly Kramer was appointed as a Director on 14 October 2015 and a member of the Audit Committee in November 2015.
For
per
sona
l use
onl
y

AMP 2015 annual report22
Directors’ report for the year ended 31 December 2015
Company secretaries’ detailsDetails of each company secretary of AMP Limited, including their qualifications and experience, are set out below.
Brian SalterGroup General Counsel BA, LLB (Hons), LLM (Hons)Brian joined AMP in July 2008. Before joining AMP, Brian was a partner with a major Australian law firm for 19 years. He has more than 30 years’ experience advising many of Australia’s leading financial and wealth management companies. Brian is a former member of the Australian Government’s Corporations and Markets Advisory Committee, is the Deputy Chair of the General Counsel 100 and is a current member of the Law Committee of the Australian Institute of Company Directors, and the Corporations Committee of the Business Law Section of the Law Council of Australia. He is also a Director of AMP Superannuation Limited, N M Superannuation Proprietary Limited and SCECGS Redlands Limited.
David Cullen Group Company Secretary and General Counsel, Governance BCom, LLB, LLM, PGCert Mgmt David joined AMP in September 2004 and has held various legal and governance roles across AMP Capital and the AMP group, with a particular focus on mergers and acquisitions. He was appointed Group Company Secretary in July 2013 and is Company Secretary for AMP Limited. Prior to joining AMP, David spent eight years in private practice focussing on mergers and acquisitions and equity capital markets in Perth and Sydney and two years with the ASX. David is a director of various AMP subsidiaries.
Vicki VordisCompany Secretary BEc, LLB (Hons), GradDipACGVicki is a Company Secretary of AMP Bank Limited. She joined AMP in December 2000 and held various legal roles before moving into a secretariat role in 2006. Prior to 2000, Vicki worked as a lawyer in several Sydney law practices. She holds a graduate diploma in Applied Corporate Governance and is an Associate of the Governance Institute of Australia.
Indemnification and insurance of directors and officersUnder our constitution, AMP indemnifies, to the extent permitted by law, all current and former officers of the company (including the non-executive directors) against any liability (including the costs and expenses of defending actions for an actual or alleged liability) incurred in their capacity as an officer of the company.
This indemnity is not extended to current or former employees of the AMP group against liability incurred in their capacity as an employee, unless approved by the AMP Limited board. No such indemnities have been provided during or since the end of the financial year.
During the financial year, the company agreed to insure all of the officers (including all directors) of the AMP group against certain liabilities as permitted by the Corporations Act 2001. The insurance policy prohibits disclosure of the nature of the cover, the amount of the premium, the limit of liability and other terms.
In addition, the company and each of the directors, and a subsidiary of the company and each of the secretaries, are parties to deeds of indemnity and access. Those deeds of indemnity and access provide that:– the directors and secretaries will have access to the books of
the company for their period of office and for 10 (or in certain cases, seven) years after they cease to hold office (subject to certain conditions)
– the company indemnifies the directors, and a subsidiary of the company indemnifies the secretaries, to the extent permitted by law
– the indemnities cover liabilities incurred by the directors and secretaries in their capacity as officers of the company and of other AMP group companies, and
– the company will maintain directors’ and officers’ insurance cover for the directors and secretaries to the extent permitted by law for the period of their office and for 10 years after they cease to hold office.
Rounding In accordance with the Australian Securities and Investments Commission Class Order 98/0100, amounts in this directors’ report and the accompanying financial report have been rounded off to the nearest million Australian dollars, unless stated otherwise.
For
per
sona
l use
onl
y

AMP 2015 annual report 23
Non-audit servicesThe Audit Committee has reviewed details of the amounts paid or payable for non-audit services provided to the AMP group during the year ended 31 December 2015, by the company’s auditor, EY.
The directors are satisfied that the provision of those non-audit services by the auditor is compatible with the general standard of independence for auditors imposed by the Corporations Act 2001 and did not compromise the auditor independence requirements of the Corporations Act 2001 for the following reasons:– all non-audit assignments were approved by the nominated
delegate to the chief financial officer or the chairman of the Audit Committee
– no non-audit assignments were carried out which were specifically excluded by the AMP charter of audit independence, and
– the level of fees for non-audit services amounted to $3,421,000 or 23% of the total audit fees paid to the auditors (refer to note 34 of the financial report for further details).
Remuneration disclosuresThe remuneration arrangements for AMP directors and senior executives are outlined in the remuneration report which forms part of the directors’ report for the year ended 31 December 2015.
Directors’ and senior executives’ interests in AMP Limited shares, performance rights and options are also set out in the remuneration report on the following pages.
Tel: +61 2 9248 5555Fax: +61 2 9248 5959ey.com/au
Ernst & Young680 George StreetSydney NSW 2000 AustraliaGPO Box 2646 Sydney NSW 2001
A member firm of Ernst & Young Global LimitedLiability limited by a scheme approved under Professional Standards Legislation
Ernst & Young Tony JohnsonPartnerSydney, 18 February 2016
Auditor’s Independence Declaration to the Directors of AMP Limited
As lead auditor for the audit of AMP Limited for the financial year ended 31 December 2015, I declare to the best of my knowledge and belief, there have been:a) no contraventions of the auditor independence requirements of the Corporations Act 2001 in relation to the audit; andb) no contraventions of any applicable code of professional conduct in relation to the audit.
This declaration is in respect of AMP Limited and the entities it controlled during the financial year.
Auditor’s independence declaration to the directors of AMP LimitedThe directors have obtained an independence declaration from the company’s auditor, Ernst & Young, for the full year ended 31 December 2015.
For
per
sona
l use
onl
y

AMP 2015 annual report24
Directors’ report for the year ended 31 December 2015
1. Our approach to remuneration
Our aim is to attract, motivate and retain exceptional employees who strive to help our customers and create value for our shareholders.
Remuneration at AMP is designed to clearly align the interests of employees with the creation of value for shareholders.
Under AMP’s guiding principles, remuneration arrangements should:– align and contribute to AMP’s key strategic objectives, business outcomes and desired performance culture– be simple and practical and support the attraction and retention of talent within AMP– support AMP’s risk management framework and protect the long-term financial soundness of AMP– align with the interests of shareholders, customers and employees– support the engagement of employees to achieve outstanding performance and bring value to AMP and its shareholders– be supported by a governance framework that manages conflicts of interest, defines clear accountabilities and ensures that
proper checks and balances are in place.
AMP’s remuneration strategy and policy are overseen by the People and Remuneration Committee (PRC). The PRC is made up of NEDs and recommends to the board the nature and amount of remuneration for executives. Where an external perspective is needed, the PRC seeks guidance from a range of independent remuneration advisers. No remuneration recommendation was provided by external consultants to the PRC in 2015.
Remuneration report (audited)
This remuneration report explains how we structure remuneration to incentivise and reward executives for delivering sustained business performance. It provides details of the remuneration arrangements for our key management personnel in 2015.
This report outlines the remuneration arrangements for AMP’s key management personnel (KMP) who have authority and responsibility for planning, directing and controlling the activities of AMP. This includes the chief executive officer (CEO), nominated direct reports of the CEO and the non-executive directors (NEDs). In this report the term executive means the CEO and the other executives who are KMP.
Key informationDuring 2015, there were minimal changes to the structure of AMP’s remuneration or the remuneration received by the executives and NEDs.
– Salary costs continued to be closely managed and on average AMP employees received an increase of 2.3%.
– Short-term incentive (STI) awards are closely linked to company performance against the STI scorecard. In 2015, AMP achieved 10% growth in profit attributable to shareholders and 7% growth in underlying profit. However, this year’s growth was not as strong as 2014, and AMP did not meet all of its STI targets. Therefore the 2015 STI pool was reduced by 11%.
– The methodology for determining the number of rights to be granted to executives under the long-term incentive (LTI) plan changed from fair value to face value. This approach uses the actual share price at the time of the grant, providing shareholders with increased transparency of the maximum potential LTI vesting outcome for executives.
– Following a review of NED fees, board and committee fees were increased by 3% to ensure they remain competitive in the market and we can continue to attract and retain high calibre board members.
– The NED fee pool was increased to $4,620,000 following support from shareholders at the 2015 annual general meeting (AGM).
Contents
1. Our approach to remuneration
2. Our executive remuneration structure
3. Key management personnel
4. 2015 remuneration outcomes
5. Executive equity ownership
6. Executive employment contracts
7. Loans and other transactions
8. 2015 remuneration in detail
9. Our non-executive director remuneration
For
per
sona
l use
onl
y

AMP 2015 annual report 25
2. Our executive remuneration structure
Our executive remuneration is structured to ensure each individual’s remuneration is linked to both their performance and the performance of the company as a whole.
AMP executive remuneration includes both fixed and at risk components to align rewards with AMP’s short and long-term performance.
The fixed component is designed to attract and retain exceptional employees. The at risk component makes up a significant portion of executive remuneration to ensure the actual remuneration received each year is linked to:– the financial and strategic performance of the individual and the company as a whole– the generation of sustainable shareholder value– appropriate risk management.
At the start of each year, personal objectives are agreed for each executive and approved by the board. These personal objectives are connected to the mix of AMP financial and non-financial measures designed to focus executives on activities that will help their business area meet its objectives and also drive the achievement of AMP’s overall strategic objectives.
Executive remuneration structure
Fixed At risk
Fixed remunerationBase salary, superannuation and
any salary sacrificed benefits
Short-term incentive (STI)1
Reward for strong individual and company performance
during the year
Long-term incentive (LTI)Reward for long-term company
performance – measured against AMP’s return on equity and total shareholder
return targets
1 Executives participate in the AMP STI plan with the exception of the managing director of AMP Capital (MD AMP Capital) who participates in the AMP Capital profit share plan (see section 2.3).
Value determined by
Delivered as
Why it is paid
60% – relative total shareholder return hurdle over three years
40% – return on equity hurdle in three years
Rights to AMP Limited shares subject to three year performance targets
To motivate executives to create outstanding long-term value for
shareholders
Performance of both the individual and the company during the year
60% cash
40% rights to AMP Limited shares – deferred for two years
To motivate executives to achieve outstanding performance during the year
Deferral of 40% of payment encourages executives to focus on risk management
Market value and criticality of role, qualifications and experience
Cash and superannuation
To attract and retain exceptional executives
For
per
sona
l use
onl
y

AMP 2015 annual report26
Directors’ report for the year ended 31 December 2015
2.1 Remuneration mix The following illustration shows the remuneration mix for the executives in 2015. It has been modelled based on the average of the executive’s maximum opportunity.
Fixed remuneration for executives other than the CEO makes up 23% of their total remuneration, with the remainder linked to individual and company performance. For the CEO, 19% of the total remuneration is fixed. Having a majority of the executive’s remuneration package linked to the performance of the company is important for ensuring the interests of executives are closely tied to the interests of shareholders.
Fixed 19%
Fixed 23%
STI cash 23%
STI cash 25%
STI deferral 17%
LTI 35%
STI deferral 15%
LTI 43%
At risk 81%
At risk 77%
Deferred equity 58%
CEO Executives
Deferred equity 52%
Cash 42%
Cash 48%
Fixed 19%
Fixed 23%
The managing director, AMP Capital (MD AMP Capital) is excluded from the above illustration as they participate in the AMP Capital enterprise profit share plan and do not have a target opportunity.
2.2 Fixed remuneration
Fixed remuneration includes base salary (which is paid in cash), superannuation and any salary sacrificed benefits.
Fixed remuneration is determined according to the external market for the executive’s role, their individual level of knowledge, skill and performance. AMP generally positions fixed remuneration at the median of the market, sourcing data from Australian listed companies of comparable size to AMP, both within the financial services sector and across the general market.
Executive fixed remuneration is reviewed (but not necessarily increased) annually by the PRC and approved by the board, taking into account: – market remuneration ranges for the role– the individual’s experience and their criticality to the role– the available budget for remuneration increases.
In the 2015 performance year, changes in executives’ fixed remuneration were based on the consideration of the criteria above.
2.3 Short-term incentives
Short-term incentives (STIs) reward executives for their contribution to AMP’s financial and strategic performance during the year.
AMP’s STI plans are designed to reward executives for achieving financial and strategic performance at both a business and individual level. All executives participate in the STI plan, with the exception of the MD AMP Capital. The MD AMP Capital participates in the AMP Capital enterprise profit share plan, which is a more appropriate incentive plan for the executives of AMP’s investment management business.
For
per
sona
l use
onl
y

AMP 2015 annual report 27
AMP short-term incentive plan AMP Capital enterprise profit share plan
Who All executives, excluding the MD AMP Capital MD AMP Capital
Why To motivate executives to achieve outstanding performance at both a business and individual level.
Format of reward 60% cash 40% rights to AMP Limited shares – deferred for two years
How the plan’s performance is measured
Company performance is measured against a scorecard of financial and non-financial measures that aligns with AMP’s strategic objectives.
AMP Capital’s pre-tax profit, allowing for an appropriate cost of capital.
How individual performance is measured
Individual performance is measured against the performance of each executive’s business area and their performance against their personal objectives. Executive performance scorecards and objectives are agreed with the board at the start of each year.
How the STI pool is calculated
The board determines the size of the STI pool, based on performance against the STI scorecard (see section 4.1), taking into account AMP’s financial results, business leadership and progress of AMP’s strategic objectives.
The board may adjust the STI pool up or down if they believe the management team has operated outside board-approved risk appetite levels, or if there have been other extraordinary events which have a broader impact on shareholder value.
A percentage of AMP Capital pre-tax profit is made available for the enterprise profit share plan. The percentage is determined by the board at the start of the performance year. It is not disclosed because it is commercially sensitive.
The board may adjust the pool up or down at its discretion:
– to recognise non-profit related performance, including changes in market conditions and broader financial factors
– if AMP Capital management operates outside board-approved risk appetite levels.
How the awards are allocated
The CEO distributes the STI pool between business areas based on their contribution to AMP’s performance. The CEO recommends to the board STI payments for his direct reports based on their performance and the performance of the company against the STI scorecard. Separately the board assesses the CEO’s performance taking into consideration the group scorecard and objectives and determines an appropriate STI payment.
At the end of the year, the board approves any allocation to the MD AMP Capital based on performance against the AMP Capital scorecard.
STI deferral To ensure a focus on risk management, 40% of any STI payment or profit share rewards are paid in the form of rights to AMP Limited shares (share rights). The share rights have no exercise price and no exercise period and convert to AMP Limited shares (vest) after two years (subject to the available trading window).
Vesting is subject to ongoing employment and compliance with AMP policies, and is at the board’s discretion.
It is the board’s preference to buy the shares on market so the value of existing AMP shares is not affected.
The 2015 STI deferral awards will be granted in April 2016. These share rights will vest if the vesting conditions are met.
How AMP can claw back STI awards
If the executive’s employment is terminated for misconduct (including where results are falsified or poor performance) any unvested rights will lapse.
The board has the right to determine an alternative treatment on cessation of employment if it is considered appropriate in the specific circumstances.
If the executive leaves AMP
If any rights have not yet vested and an executive resigns from AMP any unvested rights will lapse.
If an executive leaves AMP due to retirement or redundancy any unvested rights may be retained and vesting will continue subject to the same vesting conditions as would apply if the person had remained in AMP employment.
If there is a change in control of AMP
In the event AMP is subject to a takeover or change of control, the board will determine the treatment of any unvested rights.
For
per
sona
l use
onl
y

AMP 2015 annual report28
Directors’ report for the year ended 31 December 2015
2.4 Long-term incentives
Long-term incentives (LTIs) reward executives for creating long-term value for shareholders.
AMP’s LTI plan is designed to link the remuneration of executives with the creation of long-term value for shareholders. In 2015 the methodology used to determine the number of rights allocated to executives was changed from fair value to face value to give shareholders greater transparency on the number of rights allocated.
AMP long-term incentive plan
Who All executives
Why To motivate executives to achieve outstanding long-term business performance and ensure remuneration is closely aligned with shareholders’ interests.
Format of reward Rights to AMP Limited shares – the performance rights vest three years after they have been awarded if the vesting conditions have been met. The performance rights have no exercise price and no exercise period. Upon vesting the executive receives one fully paid ordinary AMP Limited share in exchange for each right held. The executive does not receive dividends and voting rights until the rights vest and have been exchanged for shares.
How the awards are allocated
The PRC recommends to the board a total grant value, which is a percentage of the executive’s fixed remuneration. This allocation of performance rights is provided to each executive annually based on the executive’s contractual entitlements. Shareholders are asked to approve the CEO’s allocation each year at the AGM.
Once the total grant value is determined and approved, this total value is converted into a number of performance rights. In 2015, AMP changed the allocation methodology from fair value, which is used for accounting expenses, to face value, which is commonly used in the market and provides greater transparency to shareholders.
The total grant value is calculated as follows:
Total grant value = Total number of rights to be allocated
Face value of an AMP share
The face value of an AMP share is the volume-weighted average price of AMP shares on the Australian Securities Exchange (ASX) during the 10-day trading period up to and including the valuation date of the award (8 May 2015 for the 2015 awards).
The total number of rights is then allocated to each performance hurdle based on the weightings below. Definitions are provided in the following performance hurdles section. – 60% of the rights are subject to a relative total shareholder return (TSR)– 40% of the rights are subject to a return on equity (RoE) hurdle
In 2015, the weighting of the performance measures was changed from 50% each to 60% for TSR and 40% for RoE. Using the new face value allocation methodology, rather than fair value, the board wanted to allocate more rights to TSR than RoE. A focus on TSR provides a greater alignment with shareholder value creation.
For
per
sona
l use
onl
y

AMP 2015 annual report 29
AMP long-term incentive plan
The performance hurdles
Total shareholder return hurdle
TSR measures the benefit delivered to shareholders over three years including dividend payments, capital returns, and movement in the share price.
This hurdle was chosen because it requires AMP to outperform major ASX-listed companies before the plan generates any value.
To meet this hurdle, AMP needs to generate a TSR greater than that achieved by 50% of a comparator group of companies over three years. The more companies AMP outperforms on this measure the greater the percentage of rights that vest. The comparator group is made up of the top 50 industrial companies in the S&P/ASX 100 Index (based on market capitalisation).
Return on equity hurdle
RoE measures the profit generated by the money invested by shareholders at the end of the third year.
This hurdle was introduced in 2013 so performance rights awarded before 2013 were only subject to a TSR hurdle. It was chosen because it drives a strong capital discipline, which is a key contributor to creating sustainable shareholder value.
To meet this hurdle AMP must outperform a RoE measure pre-determined by the board.
RoE for the 2015 LTI was calculated as follows and then expressed as a percentage:
Underlying profit less dividends paid on any preference shares
AMP shareholder equity
Where:
Underlying profit = Underlying profit for the financial year ending 31 December 2017.
AMP shareholder equity is calculated by adding AMP shareholder equity as at 31 December 2016 and AMP shareholder equity at the end of each month throughout 2017, but excluding any equity attributable to any preference shareholders, and dividing the result by 13.
How performance is measured
At the end of the three-year vesting period the TSR and RoE allocations are tested against performance hurdles set at the grant date (start of the vesting period). If either of the allocations pass the performance hurdle the rights allocated to that hurdle will be converted into AMP ordinary shares according to the following diagram. Performance rights which do not pass the performance test will lapse and will not be retested.
TSR RoE% of TSR performance rights that vest
AMP’s TSR ranking against the comparator group
50th percentile
50%
100%
75th percentile
% of RoE performance rights that vest
RoE performance level
Threshold
50%
100%
Maximum
How the rights are converted to shares
At the end of the three year period, any rights that have vested are converted into AMP Limited ordinary shares on behalf of participants. Participants then become entitled to shareholder benefits, including dividends and voting rights.
Source of the shares It is the board’s preference to buy the shares on market so the value of existing AMP shares is not affected.
How AMP can claw back LTI awards
If the executive’s employment is terminated for misconduct (including where results have been falsified or poor performance) any unvested rights will lapse.
The board has the right to determine an alternative treatment on cessation of employment if it is considered appropriate in the specific circumstances.
If the executive leaves AMP
If the rights have not yet vested and an executive resigns from AMP their rights will lapse.
If an executive leaves AMP due to retirement or redundancy any unvested rights may be retained and vesting will continue subject to the same vesting conditions as if the person had remained in AMP employment.
If there is a change in control of AMP
In the event AMP is subject to a takeover or change of control, the board will determine the treatment of any unvested rights.
For
per
sona
l use
onl
y

AMP 2015 annual report30
Directors’ report for the year ended 31 December 2015
3. Key management personnel
The following executives and non-executive directors were the key management personnel between 1 January 2015 and 31 December 2015. Former executives in 2014 have been included for comparative reasons. Their remuneration is covered in this report.
Term as KMP in 2015
Current executives Craig Meller Chief Executive Officer and Managing Director Full YearPauline Blight-Johnston Group Executive, Insurance and Superannuation Full YearRobert Caprioli Group Executive, Advice and Banking Full YearGordon Lefevre Chief Financial Officer Full YearMatthew Percival Group Executive, Public Affairs and Chief of Staff Full YearCraig Ryman Chief Information Officer – appointed 1 January 2015 Full YearPaul Sainsbury Chief Customer Officer Full YearBrian Salter Group General Counsel Full YearWendy Thorpe Group Executive, Operations Full YearAdam Tindall1 Managing Director AMP Capital – appointed 12 October 2015 Three monthsFiona Wardlaw Group Executive, People and Culture Full Year
Former executives Lee Barnett Former Chief Information Officer – retired 31 December 2014 –Stephen Dunne2 Former Managing Director, AMP Capital – retired 9 October 2015 Nine monthsColin Storrie Former Chief Financial Officer – ceased employment 28 February 2014 –
Current non-executive directorsSimon McKeon Chairman – appointed Chairman 8 May 2014 Full YearPatricia Akopiantz Non-executive Director Full YearCatherine Brenner Non-executive Director Full YearBrian Clark Non-executive Director Full YearHolly Kramer Non-executive Director – appointed 14 October 2015 Three monthsTrevor Matthews Non-executive Director – appointed 3 March 2014 Full YearJohn Palmer Non-executive Director Full YearPeter Shergold Non-executive Director Full Year
Former non-executive directorsPeter Mason Chairman – retired 8 May 2014 –Richard Allert Non-executive Director – retired 8 May 2014 –Paul Fegan Non-executive Director – retired 30 November 2015 Eleven months
1 Adam Tindall was appointed MD AMP Capital following the retirement of Stephen Dunne. 2 Stephen Dunne changed role from MD AMP Capital to Consultant on 9 October 2015. At this date Stephen ceased being a KMP. He remained
as a consultant with AMP until 29 February 2016.
For
per
sona
l use
onl
y

AMP 2015 annual report 31
4. 2015 remuneration outcomes
The remuneration each executive receives is based on the performance of AMP and their individual performance during the year.
In 2015 AMP achieved good growth, reporting a profit attributable to shareholders of $972 million (up 10% from 2014) and an underlying profit of $1,120 million (up 7% from 2014). The results were underpinned by growth in the Australian wealth management, AMP Capital, AMP Bank and New Zealand operations.
As a result of our continued strong performance, shareholders will receive a final dividend of 14 cents per share, bringing the 2015 total dividend to 28 cents per share, an increase of 8% on the 2014 total dividend.
4.1 Short-term incentive scorecardThe AMP scorecard is a combination of financial and non-financial measures with the financial measures making up the majority of the weighting. The key financial measure is AMP’s underlying profit as this best reflects the underlying performance of the AMP group. AMP financial measures make up 65% of the STI scorecard with the remaining 35% measuring performance against non-financial customer objectives.
Underlying profit
65%
35%
Measures the profitability of all business areas
Measures the effectiveness of our drive to increase the efficiency of our business
Measures the success of our efforts to leverage our key market positions
Measures the success of our efforts to expand internationally through AMP Capital
Provides feedback from customers on our performance
7% increase on 2014
Continued to tightly control costs
Met some
Met some
Cost to income ratio
Growth measures– Value of net cash flow– Value of risk new business– Net revenue of AMP Capital
Customer objectives
Performance measure Weight Link to strategy Outcome
Financial
Non-financial
AMP Capital has a separate scorecard and has not been included above.
For
per
sona
l use
onl
y

AMP 2015 annual report32
Directors’ report for the year ended 31 December 2015
4.2 Short-term incentive poolIn February 2016, the board assessed AMP’s 2015 performance against each of the measures in the scorecard. After reviewing each element of the scorecard, the board determined the overall STI pool would be reduced by 11% when compared with the 2014 STI pool.
The STI pool is used to pay STI payments to all AMP employees. Whilst we are pleased with the financial performance of the company and the growth momentum of our businesses, we only partially met objectives set at the start of the year. The average STI award executives received this year was 54% of their maximum opportunity which was down 30% on the 2014 performance year. The AMP Capital MD does not have a maximum opportunity and has not been included.
Financial results 2011 2012 2013 2014 2015
Profit attributable to shareholders ($m)This is profit which is distributed to shareholders 688 689 672 884 972
Underlying profit ($m)This is a key measure of business profitability which removes some of the effect of investment market volatility, thereby giving a clearer indication of business performance 909 950 849 1,045 1,120
Benefits delivered to shareholdersTotal dividend (cents per share) 29 25 23 26 28Share price at 31 December $4.07 $4.81 $4.39 $5.50 $5.83
STI poolSTI pool ($m) 89 96 83 118 105STI pool as % of underlying profit (%) 9.8 10.1 9.8 11.3 9.4Average STI received as % of maximum opportunity for executives (%) 60 63 43 70 54
4.3 2015 short-term incentives awardedThe following table shows the STIs awarded to executives for the 2015 performance year. Executives have received this award based on the achievement of financial and non-financial measures in the group STI scorecard as well as their own performance against their personal strategic objectives agreed at the start of the performance year. The awards include both the cash and deferred equity components.
Maximum STI opportunity (% of total fixed pay)
% of maximum STI opportunity awarded
% of maximum STI opportunity not awarded
Current executives Craig Meller 200 60 40Pauline Blight-Johnston 175 51 49Robert Caprioli 175 51 49Gordon Lefevre 200 56 44Matthew Percival 175 51 49Craig Ryman 175 54 46Paul Sainsbury 200 56 44Brian Salter 175 54 46Wendy Thorpe 175 51 49Adam Tindall1 – – –Fiona Wardlaw 175 54 46
Average 54 46
Former executive Stephen Dunne1 – – –
1 Adam Tindall (current MD AMP Capital) and Stephen Dunne (previous MD AMP Capital) received a percentage of profit from the AMP Capital enterprise profit share plan. Their opportunity is uncapped.
4.4 Long-term incentive outcomesDuring 2015, the 2012 LTI performance rights were measured against the TSR performance hurdle set at the grant date (start of the vesting period). This offer had one performance hurdle only.
For the hurdle to be met AMP needed to generate a TSR greater than that achieved by 50% of a comparator group of companies over three years. For the three-year vesting period of the 2012 LTI grant AMP only generated a TSR greater than 41.3% of the comparator group. As the performance hurdle was not met the performance rights did not vest. Details of the performance rights which were granted, lapsed or exercised in 2015 are provided in section 5.2.
For
per
sona
l use
onl
y

AMP 2015 annual report 33
4.5 2015 executive remunerationIn 2015, executives were awarded with remuneration which was earned but has not yet been paid, based on the 2015 performance year. This is different from the take-home pay received by executives during the year, which includes rewards from previous years. By way of example, the remuneration awarded to and received by the CEO in 2015 was made up of the following components:
Awarded– fixed remuneration increased effective 1 April 2015, as approved by the board in the 2015 remuneration review– STI earned on performance in the 2015 year – the 60% cash component will be paid in March 2016 and the 40% deferred equity
component may vest in February 2018– LTI granted in June 2015 which could vest in May 2018 subject to the relevant performance hurdles being met, as explained in
section 2.4.
Received– fixed remuneration which was the actual salary and superannuation paid during the year– STI cash payment reflecting 60% of the total STI earned from the 2014 performance year, which was paid in March 2015– shares as a result of the vesting of the deferred equity component (40%) of the 2012 STI award as explained in section 2.3. No shares
were received from the 2012 LTI award. These lapsed because the performance hurdles were not met as explained in section 2.4.
The remuneration awarded to the CEO and received by him in 2015 is outlined below.
Cash Rights
Fixed remuneration
$’000
Short-term incentive
$’000
Short-term incentive
share rights$’000
Long-term incentive
performance rights$’000
Total$’000
Remuneration awarded from 2015 1,750 1,260 840 3,937 7,787
Remuneration received in 2015 1,7151 1,500 7972 0 4,012
1 The remuneration received reflects the prorated portion of fixed remuneration from 1 January – 1 April 2015 and the awarded fixed remuneration from 1 April – 31 December 2015. It excludes other short-term non-monetary benefits which are reported in table 8.1 as per the statutory requirement.
2 The value of STI share rights received is calculated using an exercise price based on the five day volume weighted average price (VWAP) up to and including the exercise date 2 March 2015 ($6.69 x 119,078 rights = $797,000).
The following table shows the remuneration awarded to executives based on the 2015 performance year, or in the case of LTI, the face value of the LTI awarded for 2015. The total STI awarded includes the 60% cash component and the 40% deferred into share rights. The table in section 8.1 shows the statutory expense value for these awards, which is different from the table provided below.
Fixed remuneration
$’000
2015
total STI awarded
$’000
2015 LTI face value
grant$’000
Total potential remuneration
earned from 2015
$’000
Current executives Craig Meller 1,750 2,100 3,937 7,787Pauline Blight-Johnston 800 714 1,200 2,714Robert Caprioli 775 692 1,162 2,629Gordon Lefevre 925 1,036 1,387 3,348Matthew Percival 600 536 900 2,036Craig Ryman 600 562 900 2,062Paul Sainsbury 870 974 1,305 3,149Brian Salter 785 735 1,177 2,697Wendy Thorpe1 570 509 855 1,934Adam Tindall2 800 475 – 1,275Fiona Wardlaw 700 655 1,050 2,405
Former executive Stephen Dunne3 1,065 2,430 1,917 5,412
Total 10,240 11,418 15,790 37,448
1 Wendy Thorpe’s fixed remuneration takes into account her participation in a defined benefit superannuation arrangement. 2 Adam Tindall’s fixed remuneration is at the time of appointment to his KMP role, not his fixed remuneration at 1 April 2015. His STI represents the
time he was in the KMP role.3 Stephen Dunne was KMP to 9 October 2015. The above STI award reflects his full year STI payment.
For
per
sona
l use
onl
y

AMP 2015 annual report34
Directors’ report for the year ended 31 December 2015
5. Executive equity ownership
Executives are required to hold a significant number of AMP shares to ensure their long-term interests are closely aligned with the interests of shareholders.
Executives’ equity holdings include:– AMP Limited shares – ordinary AMP Limited shares registered in the executive’s name or a related party– AMP share rights – granted to executives eg through the STI deferral program or as a sign on bonus– AMP performance rights – granted to executives through the LTI program.
As part of AMP’s commitment to ensuring the long-term interests of executives are closely aligned with the long-term interests of shareholders, all executives are required to hold a minimum number of AMP Limited shares and/or STI share rights within five years of their appointment. The minimum numbers are:– CEO: 300,000 – other executives: 60,000.
Share rights allocated to executives through the STI deferral plan are included to meet their minimum holding requirement on the basis that there is no future performance condition which is required to be met.
All executives currently either meet their minimum shareholding requirements, or are on track to do so within five years’ tenure.
5.1 Executive shares and share rights holding The following table shows the number of shares, and share rights granted through the STI deferral which were held by executives during 2015. This section also includes equity-based related party transactions. A related party is typically a family member of the executive and/or is an entity in which the executive has direct or indirect control. The definition of units includes AMP Limited shares and share rights which are not subject to any future performance conditions. The related party holdings are not included as part of the calculation of an AMP executive’s minimum shareholdings.
Holding at 1 Jan 2015 Holding at 31 Dec 2015
SharesShare rights
Total number of
units at 1 Jan 2015
Share rights granted
during 20151
Share rights
converted to shares2
Other market
transactions3 SharesShare rights
Total number of
units at 31 Dec 2015
Current executivesCraig Meller 243,168 195,965 439,133 166,944 119,078 – 362,246 243,831 606,077 Pauline Blight-Johnston4 17,241 64,954 82,195 61,435 40,241 20,200 37,282 86,148 123,430 Robert Caprioli 33,149 57,228 90,377 53,088 29,769 – 62,918 80,547 143,465 Gordon Lefevre – – – 69,449 – – – 69,449 69,449 Matthew Percival 30,000 84,223 114,223 44,407 44,864 44,864 30,000 83,766 113,766 Craig Ryman5 – 44,623 44,623 – 16,570 16,570 – 28,053 28,053 Paul Sainsbury – 152,811 152,811 85,141 85,535 85,535 – 152,417 152,417 Brian Salter 109,255 116,478 225,733 58,430 62,474 39,474 132,255 112,434 244,689 Wendy Thorpe 34,674 66,184 100,858 49,081 41,928 34,674 41,928 73,337 115,265 Adam Tindall6 3,561 182,092 185,653 69,181 104,289 75,471 32,379 146,984 179,363 Fiona Wardlaw7 131,732 98,481 230,213 52,420 54,088 104,090 81,730 96,813 178,543
Former executiveStephen Dunne 209,396 314,942 524,338 149,315 149,267 149,267 209,396 314,990 524,386
1 The number of share rights granted on 30 April under the STI deferral plan were determined using the fair value price of $5.99 per share right.2 Unless otherwise stated, the share rights converted to shares during 2015 relate to the vesting of the 2012 STI deferral grants.3 Other market transactions are a result of the executive or their related parties trading AMP Limited shares on the open market.4 Pauline Blight-Johnston’s 40,241 share rights that were converted to shares during 2015 were granted in June 2013 as a sign-on bonus.5 Craig Ryman’s 16,570 share rights that converted to shares during 2015 were granted in June 2012. Craig’s holding of share rights as at
31 December 2015 is made up of 12,987 share rights granted in 2013 and 15,066 share rights granted in 2014. 6 Adam Tindall’s 104,289 share rights that converted to shares during 2015 include 28,818 share rights granted in June 2012. 7 Fiona Wardlaw’s closing balance disclosed in the 2014 remuneration report was 138,604. This was incorrectly disclosed. The 2014 disclosure did not
include 6,872 shares which were sold during 2014. Fiona’s restated closing balance at 31 December 2014 and opening balance for 1 January 2015 is 131,732.
For
per
sona
l use
onl
y

AMP 2015 annual report 35
5.2 Executive performance rights holdingsThe following table shows the LTI performance rights which were granted, lapsed or exercised during 2015. There were no changes during the vesting period for each LTI grant.
The 2015 grant will vest on 31 May 2018 subject to meeting the performance conditions in three years. The TSR measurement period is 5 March 2015 to 4 March 2018, whereas the forecast RoE at the grant date is measured 1 January 2017 to 31 December 2017. The 2012 performance rights were tested in 2015 however, did not vest and lapsed.
NameGrant date
Performance condition
Fair value per
performance right
$Holding at 1 Jan 2015
Rights granted in
2015
Rights exercised
in 2015
Rights lapsed in
2015Holding at
31 Dec 2015
Vested and exercisable
at 31 Dec 2015
Current executives Craig Meller 07/06/12 TSR 1.28 540,609 – – 540,609 – – 06/06/13 TSR 2.00 219,149 – – – 219,149 – RoE 4.21 149,168 – – – 149,168 – 05/06/14 TSR 2.89 355,871 – – – 355,871 – RoE 4.57 297,619 – – – 297,619 – 04/06/15 TSR 2.82 – 363,461 – – 363,461 – RoE 5.39 – 242,308 – – 242,308 –
Total 1,562,416 605,769 – 540,609 1,627,576 –
Pauline Blight-Johnston 06/06/13 TSR 2.00 66,872 – – – 66,872 – RoE 4.21 45,518 – – – 45,518 – 05/06/14 TSR 2.89 105,871 – – – 105,871 – RoE 4.57 88,541 – – – 88,541 – 04/06/15 TSR 2.82 – 110,769 – – 110,769 – RoE 5.39 – 73,846 – – 73,846 –
Total 306,802 184,615 – – 491,417 –
Robert Caprioli 07/06/12 TSR 1.28 126,903 – – 126,903 – – 06/06/13 TSR 2.00 51,440 – – – 51,440 – RoE 4.21 35,014 – – – 35,014 – 05/06/14 TSR 2.89 105,871 – – – 105,871 – RoE 4.57 88,541 – – – 88,541 – 04/06/15 TSR 2.82 – 107,308 – – 107,308 – RoE 5.39 – 71,538 – – 71,538 –
Total 407,769 178,846 – 126,903 459,712 –
Gordon Lefevre 05/06/14 TSR 2.89 128,558 – – – 128,558 – RoE 4.57 107,514 – – – 107,514 – 04/06/15 TSR 2.82 – 128,077 – – 128,077 – RoE 5.39 – 85,384 – – 85,384 –
Total 236,072 213,461 – – 449,533 –
Matthew Percival 07/06/12 TSR 1.28 243,781 – – 243,781 – – 06/06/13 TSR 2.00 98,828 – – – 98,828 – RoE 4.21 67,269 – – – 67,269 – 05/06/14 TSR 2.89 88,478 – – – 88,478 – RoE 4.57 73,995 – – – 73,995 – 04/06/15 TSR 2.82 – 83,077 – – 83,077 – RoE 5.39 – 55,384 – – 55,384 –
Total 572,351 138,461 – 243,781 467,031 –
Craig Ryman 07/06/12 TSR 1.28 29,187 – – 29,187 – – 06/06/13 TSR 2.00 12,345 – – – 12,345 – RoE 4.21 8,403 – – – 8,403 – 05/06/14 TSR 2.89 12,010 – – – 12,010 – RoE 4.57 10,044 – – – 10,044 – 04/06/15 TSR 2.82 – 83,077 – – 83,077 – RoE 5.39 – 55,384 – – 55,384 –
Total 71,989 138,461 – 29,187 181,263 –
For
per
sona
l use
onl
y

AMP 2015 annual report36
Directors’ report for the year ended 31 December 2015
5.2 Executive performance rights holdings continued
NameGrant date
Performance condition
Fair value per
performance right
$Holding at 1 Jan 2015
Rights granted in
2015
Rights exercised
in 2015
Rights lapsed in
2015Holding at
31 Dec 2015
Vested and exercisable
at 31 Dec 2015
Paul Sainsbury 07/06/12 TSR 1.28 280,456 – – 280,456 – – 06/06/13 TSR 2.00 174,897 – – – 174,897 – RoE 4.21 119,047 – – – 119,047 – 05/06/14 TSR 2.89 128,558 – – – 128,558 – RoE 4.57 107,514 – – – 107,514 – 04/06/15 TSR 2.82 – 120,461 – – 120,461 – RoE 5.39 – 80,308 – – 80,308 –
Total 810,472 200,769 – 280,456 730,785 –
Brian Salter 07/06/12 TSR 1.28 332,233 – – 332,233 – – 06/06/13 TSR 2.00 134,682 – – – 134,682 – RoE 4.21 91,674 – – – 91,674 – 05/06/14 TSR 2.89 116,469 – – – 116,469 – RoE 4.57 97,404 – – – 97,404 – 04/06/15 TSR 2.82 – 108,692 – – 108,692 – RoE 5.39 – 72,461 – – 72,461 –
Total 772,462 181,153 – 332,233 621,382 –
Wendy Thorpe 07/06/12 TSR 1.28 129,441 – – 129,441 – – 06/06/13 TSR 2.00 52,469 – – – 52,469 – RoE 4.21 35,714 – – – 35,714 – 05/06/14 TSR 2.89 84,519 – – – 84,519 – RoE 4.57 70,684 – – – 70,684 – 04/06/15 TSR 2.82 – 78,923 – – 78,923 – RoE 5.39 – 52,615 – – 52,615 –
Total 372,827 131,538 – 129,441 374,924 –
Fiona Wardlaw 07/06/12 TSR 1.28 276,142 – – 276,142 – – 06/06/13 TSR 2.00 111,945 – – – 111,945 – RoE 4.21 76,198 – – – 76,198 – 05/06/14 TSR 2.89 96,807 – – – 96,807 – RoE 4.57 80,960 – – – 80,960 – 04/06/15 TSR 2.82 – 96,923 – – 96,923 – RoE 5.39 – 64,615 – – 64,615 –
Total 642,052 161,538 – 276,142 527,448 –
Former executive Stephen Dunne 07/06/12 TSR 1.28 540,609 – – 540,609 – – 06/06/13 TSR 2.00 219,149 – – – 219,149 – RoE 4.21 149,168 – – – 149,168 – 05/06/14 TSR 2.89 189,513 – – – 189,513 – RoE 4.57 158,491 – – – 158,491 – 04/06/15 TSR 2.82 – 176,965 – – 176,965 – RoE 5.39 – 117,976 – – 117,976 –
Total 1,256,930 294,941 – 540,609 1,011,262 –
No performance rights were awarded to Adam Tindall in 2015.For
per
sona
l use
onl
y

AMP 2015 annual report 37
6. Executive employment contracts
AMP employment contracts limit termination payments to protect shareholder interests.
Termination payments are capped at one year’s base salary amounts and do not require shareholder approval.
Contract term CEO Executives
Length of contract Open-ended Open-ended
Notice period 12 months by AMP 6 months by Craig Meller
12 months by AMP6 months by the executive
Entitlements on termination
– Accrued fixed pay, superannuation and other statutory requirements
– Pro-rata STI may be paid for the current period except in cases of misconduct or breach of contract. The STI is calculated based on performance to the date of termination
– Unvested LTI rights may continue in the case of death, disablement, redundancy, retirement or notice without cause, subject to the original performance periods and hurdles
– Vested LTI rights will be retained except in the case of serious misconduct or breach of contract
Post-employment restraint
Six-month restraint on entering employment with a competitor and solicitation of AMP clients and employees and for some executives (specifically the CEO) 12 months.
7. Loans and other transactions
Many executives are also customers of AMP. Below you will find details of loans provided by AMP to executives.
AMP provides home loans to Australians to help them buy, build or renovate properties. This includes executives who are offered loans on terms and conditions the same as those given to other employees, including the term of the loan, security required and the interest rate.
7.1 Loans
Balance at 1 Jan 2015
$’000Written off
$’000
Net advances (repayments)
$’000
Balance at 31 Dec 2015
$’000
Interest charged
$’000
Interest not charged
$’000
Highest indebtedness
during year$’000
Number in group
Total loans to KMPKMP and their related parties 14,116 – (524) 13,592 534 – 15,529 7
Loans to KMP exceeding $100,000 Craig Meller 1,597 – 447 2,044 87 – 2,119 Pauline Blight-Johnston 3,423 – 686 4,109 121 – 4,131 Robert Caprioli 2,644 – (685) 1,958 102 – 2,649 Craig Ryman 2,114 – (98) 2,017 89 – 2,189 Paul Sainsbury 1,497 – (861) 636 45 – 1,598 Adam Tindall 2,746 – – 2,746 87 – 2,748
7.2 Other transactions During 2015, the executives and their related parties may also have access to the following AMP products. They are provided to executives within normal employee terms and conditions. The products include:– personal banking with AMP Bank – the purchase of AMP insurance and investment products– financial investment services.
For
per
sona
l use
onl
y

AMP 2015 annual report38
Directors’ report for the year ended 31 December 2015
8. 2015 remuneration in detail
The following information shows 2015 executive remuneration prepared according to Australian Accounting Standards, including rewards that have been awarded but not yet received.
8.1 2015 executive remuneration
The following table shows the remuneration received by executives in 2015 as well as STI and LTI rewards that have been awarded but not yet received. This includes fixed remuneration as well as the cash portion of the 2015 STI reward and the value of current and previous STI and LTI payments which have not yet vested.
Short-term employee benefits
Post-employment
benefits
Share-based
paymentsLong-term
benefitsTermination
payments
Cash salary$’000
Cash short-term
incentive$’000
Other short-term
benefits1
$’000
Super- annuation
benefits2
$’000Rights3
$’000 Other4
Cash payments
$’000
Share-based
payment$’000
Grand total5
$’000
Current executives
Craig Meller 2015 1,678 1,260 16 25 2,164 136 – – 5,279 Chief Executive Officer 2014 1,562 1,500 44 25 1,601 152 – – 4,884 and Managing Director
Pauline Blight-Johnston6 2015 751 428 33 21 674 5 – – 1,912 Group Executive, 2014 631 552 90 20 443 3 – – 1,739 Insurance and Superannuation
Robert Caprioli 2015 734 415 – 23 631 15 – – 1,818 Group Executive, 2014 677 477 40 23 422 11 – – 1,650 Advice and Banking
Gordon Lefevre7 2015 885 622 366 21 555 4 – – 2,453 Chief Financial Officer 2014 691 523 119 19 156 2 – – 1,510
Matthew Percival 2015 489 321 12 43 678 64 – – 1,607 Group Executive, 2014 516 399 12 27 619 45 – – 1,618 Public Affairs and Chief of Staff
Craig Ryman 2015 565 337 10 25 192 22 – – 1,151 Chief Information Officer 2014 – – – – – – – – –
Paul Sainsbury 2015 736 585 59 36 1,096 89 – – 2,601 Chief Customer Officer 2014 761 765 61 50 963 13 – – 2,613
Brian Salter8 2015 748 441 19 34 907 26 – – 2,175 Group General Counsel 2014 738 525 19 25 841 15 – – 2,163
Wendy Thorpe 2015 515 305 8 56 545 53 – – 1,482 Group Executive, 2014 509 441 23 53 473 31 – – 1,530 Operations
Adam Tindall 2015 171 285 6 7 98 16 – – 583 Managing Director 2014 – – – – – – – – – AMP Capital
Fiona Wardlaw9 2015 624 393 50 25 769 26 – – 1,887 Group Executive, 2014 568 471 47 25 705 13 – – 1,829 People and Culture
The continuation of the table and footnotes 1 to 10 can be found on the following page.For
per
sona
l use
onl
y

AMP 2015 annual report 39
8.1 2015 executive remuneration continued
Short-term employee benefits
Post-employment
benefits
Share-based
paymentsLong-term
benefitsTermination
payments
Cash salary$’000
Cash short-term
incentive$’000
Other short-term
benefits1
$’000
Super- annuation
benefits2
$’000Rights3
$’000 Other4
Cash payments
$’000
Share-based
payment$’000
Grand total5
$’000
Former disclosed executives
Lee Barnett 2015 – – – – – – – – – Former Chief 2014 728 522 60 27 866 176 – – 2,379 Information Officer
Stephen Dunne10 2015 1,044 1,458 256 21 1,787 108 – – 4,674 Former Managing 2014 1,045 1,342 – 20 1,617 144 – – 4,168 Director, AMP Capital
Colin Storrie 2015 – – – – – – – – – Former Chief 2014 147 – 43 4 1,497 4 – – 1,695 Financial Officer
2015 total 8,940 6,850 835 337 10,096 564 – – 27,622
2014 total 8,573 7,517 558 318 10,203 609 – – 27,778
1 Other short-term benefits include non-monetary benefits, for example, purchase annual leave, car benefits and any FBT on each item. The 2014 remuneration report did not disclose the full benefits and applicable FBT on all items correctly. To correct this error the 2014 data in this report has been restated to reflect the correct comparative values against the 2015 data. The restated difference by executive is ($’000): Meller 31, Blight-Johnston 41, Caprioli 40, Lefevre 51, Percival 3, Sainsbury 22, and Thorpe 16.
2 Wendy Thorpe is in a defined benefit plan and the value represents the notional taxable contributions. 3 Includes performance rights and share rights. The minimum future value for these awards is nil and the maximum amount expensed by AMP
is the fair value at grant date using a Monte Carlo simulation. The value of the award made in any year is amortised over the vesting period.4 Other long-term benefits represent long service leave accrued, taken or paid during the year.5 No termination payments were made to nominated executives during 2014 or 2015. 6 Pauline Blight-Johnston received additional remuneration relating to the wash up of her car lease.7 Gordon Lefevre received additional remuneration as commuting and relocation support. In 2014 the full benefits and applicable FBT were not
disclosed correctly and this data has been restated to reflect the correct comparative values against the 2015 data.8 Brian Salter received additional remuneration required to fund his life insurance cover. This was split between a superannuation contribution
and a cash payment.9 Fiona Wardlaw received additional remuneration relating to the wash up of her purchased annual leave.10 Stephen Dunne was KMP to 9 October 2015. The above remuneration reflects his full year remuneration and includes an incentive payment of
$250,000 that will be paid to Stephen on completion of his term as Consultant.
For
per
sona
l use
onl
y

AMP 2015 annual report40
Directors’ report for the year ended 31 December 2015
9. Our non-executive director remuneration
AMP’s NED remuneration is designed to attract and retain high calibre board members who are appropriately paid for their time and effort.
AMP’s remuneration is structured to ensure AMP is able to attract and retain NEDs with the experience and qualifications necessary to oversee a company as complex and highly regulated as AMP.
NED remuneration consists of four components:– AMP Limited board base fee– AMP Limited committee fees and AMP subsidiary board and committee fees– $6,000 expense allowance– superannuation.
NEDs receive fixed remuneration for completing their duties and do not receive any performance based pay. This enables the NEDs to maintain their independence and impartiality when making decisions about the future direction of the company.
To align the interests of NEDs with the interests of shareholders, all NEDs are required to hold a minimum number of AMP shares, as outlined in section 9.3.
Maximum fee pool of $4.62 million
Non-executive director remuneration structure
Fixed
Delivered as
Why it is paid
AMP Limited board base fee and committee fees
To attract and retain high calibre board members and remunerate for time and effort spent on AMP Limited
board activities
Cash
AMP Limited chairman A single fee covers all responsibilities including board committees and expense allowance
Other NEDsA single fee for AMP Limited
board responsibilities and additional fees for participating
in AMP Limited committees
Other NEDsAdditional fees for
participating in AMP subsidiary boards and committees
Other NEDs Set payment to assist
with incidental expenses
AMP subsidiary board and committee fees
To remunerate board members for time and effort spent on AMP subsidiary board and
committee activities
Cash
Expense allowance
For incidental expenses
Cash
Superannuation
To meet legislative requirements that
help Australians fund their retirement
9.5% of total fees paid into superannuation
Superannuation
For
per
sona
l use
onl
y

AMP 2015 annual report 41
9.1 Non-executive director fees The Nomination and Governance Committee is responsible for reviewing and recommending board fees, using market data and/or advice from external remuneration advisers as necessary.
AMP determines board and committee fees by taking into account:– fees paid to board members of other Australian corporations– the complexity of AMP’s operations– the responsibilities and workload requirements of each board/committee.
Board and committee fees are recommended by the Nomination and Governance Committee for approval by the board and the maximum aggregate fee pool is approved by shareholders.
At the 2015 AGM, shareholders approved a maximum aggregate fee pool of $4,620,000 to cover all remuneration (including superannuation) paid to AMP’s NEDs. This fee pool covers all remuneration for NEDs for their services as directors and committee members of AMP and its subsidiaries.
The fee pool covers the following items paid to AMP Limited NEDs:– AMP Limited board base fees – AMP Limited committee fees– AMP subsidiary board and committee fees– expense allowances– superannuation– fees for any additional services provided.
For 2015, the total remuneration paid to AMP Limited NEDs was $3,333,000.
9.1.1 Base feesAll NEDs receive a base fee for their participation on the AMP Limited board. For the AMP Limited chairman, this fee covers all responsibilities, including participation in board committees and incidental expenses. While the chairman is not a member of all the committees or a director of any AMP subsidiaries, he regularly attends AMP Limited committee meetings and board and committee meetings of AMP’s key subsidiaries. Although the CEO is a board member, he is not paid board fees, as his board responsibilities are part of his normal employment conditions.
9.1.2 Committee and subsidiary board and committee fees NEDs, excluding the AMP Limited chairman, receive additional fees for their time and effort on AMP Limited board committees, subsidiary boards and their committees, and other special purpose committees. As a large, diversified financial services group, with significant, highly regulated operating subsidiaries, AMP believes it is important for the AMP Limited NEDs to have knowledge, understanding and oversight of the organisation as a whole and the issues and risks specific to its key subsidiaries. For this reason AMP NEDs also sit on the boards and committees of key subsidiaries.
During 2015, the board approved a 3% increase in board and committee fees for AMP and its key subsidiaries, effective 1 April 2015. This increase was to bring AMP board and committee fees in line with those of other Australian companies and to recognise the increased regulation of AMP’s operations and the additional board oversight this requires. A $4,500 increase for members and $9,000 increase for the chairman of the Nomination and Governance Committee were also approved in recognition of the committee’s increased workload. This is the first increase in fees for that committee since 2005.
9.1.3 Benefits Benefits provided to NEDs are as follows:– superannuation: contributions are paid in addition to fees and allowances. Contributions were 9.5% of total fees in accordance
with superannuation legislation. NEDs may also choose to salary-sacrifice their fees into superannuation– expense allowance: $6,000 is paid to each NED, except the AMP Limited chairman, to assist with the cost of incidental expenses
related to the business of the company – retirement benefits: no retirement benefits are provided to NEDs.
For
per
sona
l use
onl
y
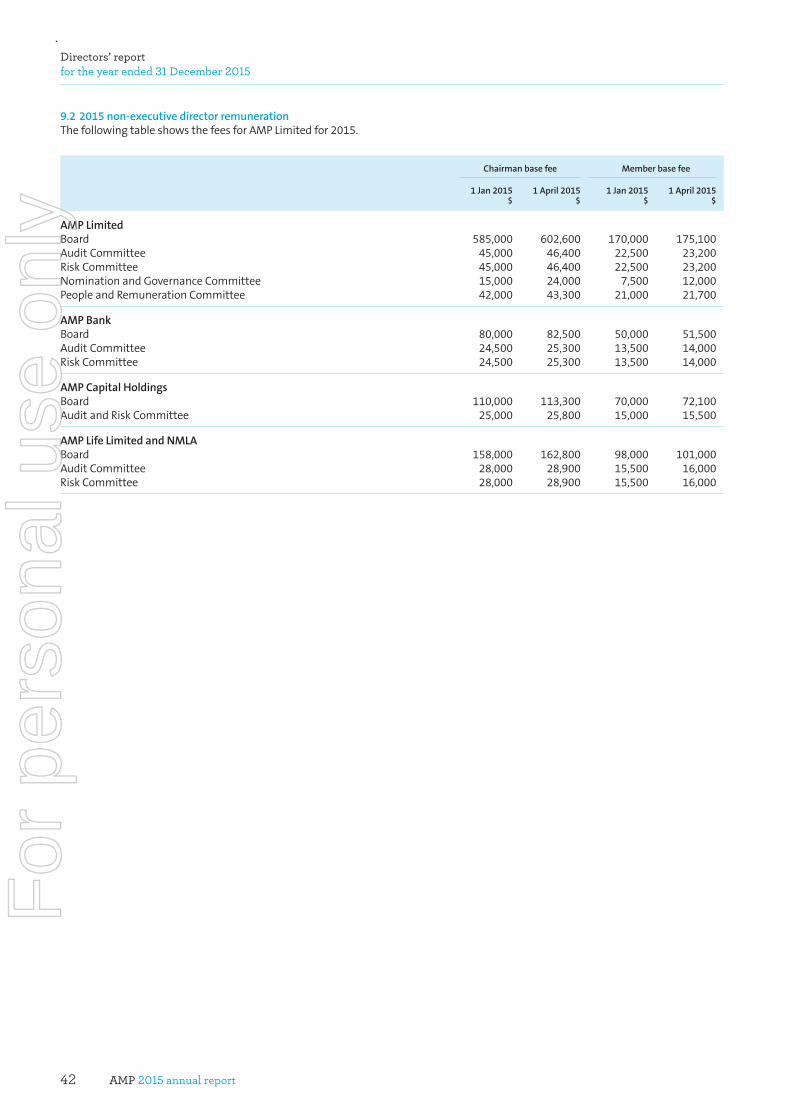
AMP 2015 annual report42
Directors’ report for the year ended 31 December 2015
9.2 2015 non-executive director remunerationThe following table shows the fees for AMP Limited for 2015.
Chairman base fee Member base fee
1 Jan 2015$
1 April 2015$
1 Jan 2015$
1 April 2015$
AMP Limited Board 585,000 602,600 170,000 175,100Audit Committee 45,000 46,400 22,500 23,200Risk Committee 45,000 46,400 22,500 23,200Nomination and Governance Committee 15,000 24,000 7,500 12,000People and Remuneration Committee 42,000 43,300 21,000 21,700
AMP Bank Board 80,000 82,500 50,000 51,500Audit Committee 24,500 25,300 13,500 14,000Risk Committee 24,500 25,300 13,500 14,000
AMP Capital Holdings Board 110,000 113,300 70,000 72,100Audit and Risk Committee 25,000 25,800 15,000 15,500
AMP Life Limited and NMLA Board 158,000 162,800 98,000 101,000Audit Committee 28,000 28,900 15,500 16,000Risk Committee 28,000 28,900 15,500 16,000
For
per
sona
l use
onl
y

AMP 2015 annual report 43
The following table shows the remuneration received by NEDs in 2015.
Short-term benefits
Post-employment
benefits
AMP Limited Board and
committee fees$’000
Fees for other group boards
$’000
Other short-term benefits
$’000
Additional board duties1
$’000
Non-monetary benefits2
$’000
Super- annuation
$’000Total
$’000
Current NEDs Simon McKeon 2015 598 – – – 5 19 622 Chairman 2014 447 31 2 – 2 21 503
Patricia Akopiantz 2015 266 92 6 – – 35 399 Non-executive Director 2014 217 77 6 – – 28 328
Catherine Brenner 2015 196 193 6 – – 38 433 Non-executive Director 2014 185 177 6 – – 35 403
Brian Clark 2015 201 128 6 – – 32 367 Non-executive Director 2014 199 125 6 – – 31 361
Holly Kramer 2015 40 – 1 – – 4 45 Non-executive Director 2014 – – – – – – –
Trevor Matthews 2015 222 145 6 25 – 38 436 Non-executive Director 2014 159 67 5 – – 22 253
John Palmer 2015 174 87 6 – – 25 292 Non-executive Director 2014 197 98 6 – 4 28 333
Peter Shergold 2015 243 100 6 – 1 33 383 Non-executive Director 2014 199 107 6 – 1 29 342
Former NEDs Paul Fegan 2015 221 74 5 25 – 31 356 Former Non-executive Director 2014 218 67 6 – – 27 318
Peter Mason 2015 – – – – – – – Former Non-executive Director 2014 208 – – – – 6 214
Richard Allert 2015 – – – – – – – Former Non-executive Director 2014 69 23 2 – – 9 103
Total for 2015 2,161 819 42 50 6 255 3,333
Total for 20143 2,098 772 45 – 7 236 3,158
1 Relates to additional work performed for the AMP Limited 2015 Notes Offer. 2, 3 The 2014 remuneration report did not disclose the full non-monetary benefits and applicable FBT on all items. The 2014 data in this report has been
restated to reflect the correct comparative values against the 2015 data. The restated difference by NED is ($’000): McKeon 2, Palmer 4 and Shergold 1.
For
per
sona
l use
onl
y

AMP 2015 annual report44
Directors’ report for the year ended 31 December 2015
9.3 Non-executive director share ownershipAMP NEDs are required to hold a specified minimum value of AMP Limited shares to ensure their long-term interests are closely aligned with those of AMP shareholders. These minimum values are: – AMP Limited chairman: $602,550 – the equivalent of the AMP Limited chairman base fee– AMP Limited board members: $175,100 – the equivalent of the AMP Limited NED base fee.
NEDs are expected to achieve these levels within four years of appointment and then maintain them as a minimum shareholding throughout their tenure.
Based on the closing share price of $5.83 on 31 December 2015, all NEDs held or are on track to hold the minimum number of shares as per the minimum shareholding guidelines.
NEDs do not receive performance rights or share rights as part of their remuneration.
Holding at 1 Jan 2015
$
Other market transactions1
$
Holding at 31 Dec 2015
$
Value of holding at
31 Dec 2015 $
Current NEDs Simon McKeon 143,921 31,079 175,000 1,020,250Patricia Akopiantz 47,099 9,140 56,239 327,873Catherine Brenner 66,463 18,000 84,463 492,419Brian Clark 75,813 – 75,813 441,990Holly Kramer 4,400 – 4,400 25,652Trevor Matthews 63,763 – 63,763 371,738John Palmer 96,252 – 96,252 561,149Peter Shergold 63,348 – 63,348 369,319
Former NED Paul Fegan2 49,240 – 49,240 287,069
1 Other market transactions are a result of the NED or their related parties trading AMP Limited shares on the open market.2 The closing balance for Paul Fegan is at 30 November 2015, the date he retired from the AMP Limited Board.
Signed in accordance with a resolution of the directors.
Simon McKeon Craig MellerChairman Chief Executive Officer and Managing Director
Sydney, 18 February 2016
For
per
sona
l use
onl
y

AMP 2015 annual report 45
Analysis of shareholder profit for the year ended 31 December 2015
Analysis of shareholder profit
All amounts are after income tax2015
$m2014
$m
Australian wealth management 410 374 AMP Capital 138 115 Australian wealth protection 185 188 AMP Bank 104 91 New Zealand financial services 120 110 Australian mature 158 174
Business unit operating earnings 1,115 1,052 Group office costs (61) (62)
Total operating earnings 1,054 990 Underlying investment income 125 132 Interest expense on corporate debt (59) (77)
Underlying profit 1,120 1,045 Other items (3) 7 AMP AAPH integration costs – (20)Business efficiency program costs (66) (100)Amortisation of AMP AAPH acquired intangibles (80) (89)
Profit before market adjustments and accounting mismatches 971 843 Market adjustment – investment income 9 42 Market adjustment – annuity fair value 34 6 Market adjustment – risk products 2 11 Accounting mismatches (44) (18)
Profit attributable to shareholders of AMP Limited 972 884
This table shows an analysis of the source of profit after income tax attributable to shareholders of AMP Limited.
For
per
sona
l use
onl
y

AMP 2015 annual report46
Financial report for the year ended 31 December 2015
Financial report
Contents47 Incomestatement48 Statementofcomprehensiveincome49 Statementoffinancialposition50 Statementofchangesinequity52 Statementofcashflows53 Notestothefinancialstatements53 1. Basisofpreparationandsummaryofsignificantaccountingpolicies63 2. Significantaccountingjudgements,estimatesandassumptions64 3. Segmentinformation67 4. Income67 5. Investmentgainsand(losses)68 6. Expenses69 7. Incometax70 8. Receivables71 9. Inventoriesandotherassets71 10. Investmentsinfinancialassetsandotherfinancialliabilities72 11. Investmentproperty73 12. Property,plantandequipment74 13. Intangibles76 14. Payables76 15. Provisions77 16. Borrowings77 17. Subordinateddebt78 18. Dividends78 19. Contributedequity79 20. Lifeinsurancecontracts89 21. Otherlifeinsuranceandinvestmentcontractdisclosures93 22. Riskmanagementandfinancialinstrumentsdisclosures101 23. Fairvalueinformation106 24. Capitalmanagement108 25. NotestoStatementofcashflows110 26. Earningspershare111 27. Superannuationfunds115 28. Share-basedpayments120 29. Groupcontrolledentityholdings129 30. Associates131 31. Operatingleasecommitments131 32. Contingentliabilities131 33. Related-partydisclosures–keymanagementpersonnel132 34. Auditors’remuneration132 35. Eventsoccurringafterreportingdate133 Directors’declaration134 Independentauditor’sreporttothemembersofAMPLimitedF
or p
erso
nal u
se o
nly

AMP 2015 annual report 47
Income statement fortheyearended31December2015
Consolidated Parent
Note2015
$m2014
$m2015
$m2014
$m
Income and expenses of shareholders, policyholders, external unitholders and non-controlling interests1 Lifeinsurancepremiumandrelatedrevenue 4 2,465 2,427 – –Feerevenue 4 2,941 2,790 11 14Otherrevenue 4 87 126 – –Investmentgainsand(losses) 5 8,529 12,244 893 799Shareofprofitor(loss)ofassociatesaccountedforusingtheequitymethod 27 13 – –Lifeinsuranceclaimsandrelatedexpenses 6 (2,164) (2,166) – –Operatingexpenses 6 (3,691) (3,834) (11) (14)Financecosts 6 (732) (685) (28) (18)Movementinexternalunitholderliabilities (855) (1,478) – –Changeinpolicyholderliabilities – lifeinsurancecontracts 20 (240) (1,333) – –– investmentcontracts (4,374) (6,290) – –Incometax(expense)credit 7 (280) (843) 48 51
Profit for the year 1,713 971 913 832
Profit attributable to shareholders of AMP Limited 972 884 913 832Profitattributabletonon-controllinginterests 741 87 – –
Profit for the year 1,713 971 913 832
1 Incomeandexpensesincludeamountsattributabletoshareholders’interests,policyholders’interestsintheAMPlifeinsuranceentities’statutoryfunds,externalunitholders’interestsandnon-controllinginterests.AmountsincludedinrespectoftheAMPlifeinsuranceentities’statutoryfundshaveasubstantialimpactonmostoftheconsolidatedIncomestatementlines,especiallyInvestmentgainsandlossesandIncometax(expense)credit.Ingeneral,policyholders’interestsinthetransactionsfortheperiodareattributedtotheminthelinesChangeinpolicyholderliabilities.
Consolidated
Note2015 cents
2014 cents
Earnings per share for profit attributable to ordinary shareholders of AMP Limited Basic 26 33.3 30.3 Diluted 26 33.1 30.0
For
per
sona
l use
onl
y

AMP 2015 annual report48
Financial report for the year ended 31 December 2015
Statement of comprehensive incomefortheyearended31December2015
Consolidated Parent
Note2015
$m2014
$m2015
$m2014
$m
Profit for the year 1,713 971 913 832
Other comprehensive income
Items that may be reclassified subsequently to profit or loss Available-for-salefinancialassets – gainsand(losses)infairvalueofavailable-for-salefinancialassets – 2 – –
– 2 – –
Cashflowhedges1 – gainsand(losses)infairvalueofcashflowhedges (10) 3 – –– incometax(expense)credit 3 (1) – –– transferredtoprofitfortheyear 18 29 – –– transferredtoprofitfortheyear–incometax(expense)credit (5) (8) – –
6 23 – –
Exchangedifferenceontranslationofforeignoperationsandrevaluationofhedgeofnetinvestments – gains(losses) 7 39 – –– transferredtoprofitfortheyear – 6 – –
7 45 – –
Items that will not be reclassified subsequently to profit or loss Definedbenefitplans2 – actuarialgainsand(losses) 27 94 (119) – –– incometax(expense)credit (29) 36 – –
65 (83) – –
Owner-occupiedpropertyrevaluation – gains(losses)invaluationofowner-occupiedproperty 22 8 – –– incometax(expense)credit (2) (1) – –
20 7 – –
Other comprehensive income for the year 98 (6) – –
Total comprehensive income for the year 1,811 965 913 832
Total comprehensive income attributable to shareholders of AMP Limited 1,063 878 913 832Totalcomprehensiveincome(loss)attributabletonon-controllinginterests 748 87 – –
Total comprehensive income for the year 1,811 965 913 832
1 CashflowhedgemovementsincludesinterestrateswapsusedtomanageAMPBank’sinterestrateriskonitsmortgageportfolioand,in2014,hedgingofahighlyprobablefuturepaymentforaninvestmentbyAMPdenominatedinforeigncurrency.
2 Actuarialgainsand(losses)aredeterminedinaccordancewithAASB119Employee Benefits.Thisisnotthesameasthecalculationmethodsusedtodeterminethefundingrequirementsfortheplans.
For
per
sona
l use
onl
y

AMP 2015 annual report 49
Statement of financial positionasat31December2015
Consolidated Parent
Note2015
$m2014
$m2015
$m2014
$m
Assets Cashandcashequivalents 25 3,955 3,581 21 1Receivables 8 2,558 2,518 293 321Currenttaxassets 11 35 – –Inventoriesandotherassets 9 147 189 – –Investmentsinfinancialassets 10 127,221 122,836 2,247 1,960Investmentproperties 11 386 340 – –Investmentsinassociatesaccountedforusingtheequitymethod 30(a) 467 116 – –Property,plantandequipment 12 423 401 – –Deferredtaxassets 7 557 697 54 55Intangibles 13 3,983 4,042 – –Investmentsincontrolledentities – – 11,355 11,010Assetsofdisposalgroups – 100 – –
Total assets of shareholders of AMP Limited, policyholders, external unitholders and non-controlling interests 139,708 134,855 13,970 13,347
Liabilities Payables 14 2,031 1,951 44 92Currenttaxliabilities 271 247 222 190Provisions 15 487 442 5 5Otherfinancialliabilities 10 1,108 2,015 – –Borrowings 16 15,760 15,352 – –Subordinateddebt 17 1,692 1,150 864 326Deferredtaxliabilities 7 2,076 2,336 – –Externalunitholderliabilities 13,571 11,335 – –Lifeinsurancecontractliabilities 20 23,871 24,403 – –Investmentcontractliabilities 21 69,848 66,980 – –Definedbenefitplanliabilities 27 98 190 – –Liabilitiesofdisposalgroups – 69 – –
Total liabilities of shareholders of AMP Limited, policyholders, external unitholders and non-controlling interests 130,813 126,470 1,135 613
Net assets of shareholders of AMP Limited and non-controlling interests 8,895 8,385 12,835 12,734
Equity1 Contributedequity 19 9,566 9,508 9,747 9,747Reserves (1,866) (1,888) 22 21Retainedearnings 819 566 3,066 2,966
Total equity of shareholders of AMP Limited 8,519 8,186 12,835 12,734Non-controllinginterests 376 199 – –
Total equity of shareholders of AMP Limited and non-controlling interests 8,895 8,385 12,835 12,734
1 FurtherinformationonEquityisprovidedintheStatementofchangesinequityonthefollowingpageandnote19. F
or p
erso
nal u
se o
nly

AMP 2015 annual report50
Financial report for the year ended 31 December 2015
Statement of changes in equityfortheyearended31December2015
Equity attributable to shareholders of AMP Limited
Consolidated
Contributed equity
$m
Equity contribution
reserve1
$m
Share- based
payment reserve2
$m
Capital profits
reserve3
$m
Demerger loss
reserve4
$m
Available- for-sale
financial assets
reserve5
$m
Cash flow
hedge reserve6
$m
Foreign currency
translation and hedge
of net investment reserves7,8
$m
Owner-occupied property
revaluation reserve9
$m
Retained earnings
$m
Total shareholder
equity$m
Non-controlling
interest $m
Total equity
$m
2015
Balanceatthebeginningoftheyear 9,508 1,019 97 329 (3,585) 8 6 136 102 566 8,186 199 8,385
Profit(loss) – – – – – – – – – 972 972 741 1,713
Othercomprehensiveincome – – – – – – 6 – 20 65 91 7 98
Totalcomprehensiveincome – – – – – – 6 – 20 1,037 1,063 748 1,811
Share-basedpaymentexpense – – 32 – – – – – – – 32 2 34
Sharepurchases – – (36) – – – – – – – (36) (2) (38)
Netsale/(purchase)oftreasuryshares 58 – – – – – – – – 16 74 – 74
Dividendspaid10 – – – – – – – – – (813) (813) (582) (1,395)
Dividendspaidontreasuryshares10 – – – – – – – – – 13 13 – 13
Salesandacquisitionsofnon-controllinginterests – – – – – – – – – – – 11 11
Balance at the end of the year 9,566 1,019 93 329 (3,585) 8 12 136 122 819 8,519 376 8,895
2014
Balanceatthebeginningoftheyear 9,602 1,019 89 329 (3,585) 6 (17) 91 95 461 8,090 110 8,200
Profit(loss) – – – – – – – – – 884 884 87 971
Othercomprehensiveincome – – – – – 2 23 45 7 (83) (6) – (6)
Totalcomprehensiveincome – – – – – 2 23 45 7 801 878 87 965
Share-basedpaymentexpense – – 33 – – – – – – – 33 2 35
Sharepurchases – – (25) – – – – – – – (25) (2) (27)
Netsale/(purchase)oftreasuryshares (94) – – – – – – – – 4 (90) – (90)
Dividendspaid10 – – – – – – – – – (710) (710) (18) (728)
Dividendspaidontreasuryshares10 – – – – – – – – – 10 10 – 10
Salesandacquisitionsofnon-controllinginterests – – – – – – – – – – – 20 20
Balance at the end of the year 9,508 1,019 97 329 (3,585) 8 6 136 102 566 8,186 199 8,385
Footnotes1to10canbefoundonthefollowingpage.
For
per
sona
l use
onl
y

AMP 2015 annual report 51
Share- based Total Contributed payment Retained shareholder equity reserve2 earnings equity
AMP Limited parent $m $m $m $m
2015 Balanceatthebeginningoftheyear 9,747 21 2,966 12,734Profit – – 913 913Othercomprehensiveincome – – – –
Totalcomprehensiveincome – – 913 913Share-basedpaymentexpense – 3 – 3 Sharepurchases – (2) – (2)Dividendspaid10 – – (813) (813)
Balance at the end of the year 9,747 22 3,066 12,835
2014 Balanceatthebeginningoftheyear 9,747 18 2,844 12,609Profit – – 832 832Othercomprehensiveincome – – – –
Totalcomprehensiveincome – – 832 832Share-basedpaymentexpense – 6 – 6Sharepurchases – (3) – (3)Dividendspaid10 – – (710) (710)
Balance at the end of the year 9,747 21 2,966 12,734
1 TherehasbeennomovementintheEquitycontributionreserveestablishedin2003torecognisetheadditionallossonthedemergerofAMP’sUKoperationsinDecember2003.Thislosswasthedifferencebetweenthepro-formalossondemerger(basedupondirectors’valuationoftheUKoperationsandtheestimatednetassetstobedemerged)andthemarket-basedfairvalueoftheUKoperations(baseduponthesharepriceoftherestructuredUKoperationsonlistingandtheactualnetassetsoftheUKoperationsondemerger).
2 TheShare-basedpaymentreserverepresentsthecumulativeexpenserecognisedinrelationtoequity-settledshare-basedpaymentslessthecostofsharespurchasedandtransferredtoshare-basedpaymentsrecipientsuponvesting.
3 TheCapitalprofitsreserverepresentsgainsattributabletoshareholdersofAMPonthesaleofminorityinterestsincontrolledentitiestoentitiesoutsidetheAMPgroup.
4 TherehasbeennomovementintheDemergerlossreserveestablishedin2003torecognisethetransferfromshareholders’retainedearnings ofthetotallossonthedemergerofAMP’sUKoperationsinDecember2003.5 Unrealisedgainsorlossesonavailable-for-salefinancialassetsarerecognisedinOthercomprehensiveincomeandaccumulatedinaseparate
reservewithinequity.Uponimpairmentordisposal,theaccumulatedchangeinfairvaluewithintheAvailable-for-salefinancialassetsreserveisrecognisedwithinprofitorlossintheIncomestatement.
6 TheCashflowhedgereserverepresentsthecumulativeimpactofchangesinthefairvalueofderivativesdesignatedascashflowhedgeswhichareeffectiveforhedgeaccounting.HedgegainsandlossesaretransferredtotheIncomestatementwhentheyaredeemedineffectiveoruponrealisationofthecashflow.
7 ExchangedifferencesarisingontranslationofforeigncontrolledentitiesandforeigninvestmentsaccountedforusingtheequitymethodarerecognisedinForeigncurrencytranslationreserve.ExchangegainsandlossesaretransferredtotheIncomestatementuponrealisationoftheinvestmentintheforeigncontrolledentity.
8 TheHedgeofnetinvestmentreservereflectsgainsandlossesoneffectivehedgesofnetinvestmentsinforeignoperations.HedgegainsandlossesaretransferredtotheIncomestatementwhentheyaredeemedineffectiveoruponrealisationoftheinvestmentintheforeigncontrolledentity.
9 TheOwner-occupiedpropertyrevaluationreserverepresentscumulativevaluationgainsandlossesonowner-occupiedpropertyrequiredtoberecognisedinequity.
10 Dividendspaidincludesthedividendspaidontreasuryshares.Dividendspaidontreasurysharesarerequiredtobeexcludedfromtheconsolidatedfinancialstatementsbyadjustingretainedearnings.
For
per
sona
l use
onl
y

AMP 2015 annual report52
Financial report for the year ended 31 December 2015
Statement of cash flowsfortheyearended31December2015
Consolidated Parent
Note2015
$m2014
$m2015
$m2014
$m
Cash flows from operating activities1 Cashreceiptsinthecourseofoperations 19,773 20,326 11 14Interestandotheritemsofasimilarnaturereceived 2,287 2,470 17 16Dividendsanddistributionsreceived2 2,130 3,228 876 578Cashpaymentsinthecourseofoperations (21,663) (24,373) (12) (9)Financecosts (806) (682) (34) (18)Incometaxrefunded(paid) (379) 117 68 (1)
Cash flows from (used in) operating activities 25 1,342 1,086 926 580
Cash flows from investing activities1 Netproceedsfromsaleof(paymentstoacquire): – investmentproperty 26 440 – –– investmentsinfinancialassets3,6 (5,622) 2,439 (345) –– operatingandintangibleassets (198) (186) – –
(Paymentstoacquire)proceedsfromdisposalofoperatingcontrolledentitiesandinvestmentsinassociatesaccountedforusingtheequitymethod4 (348) (135) – –
Netmovementinloans(to)fromcontrolledentities – – (291) 125
Cash flows from (used in) investing activities (6,142) 2,558 (636) 125
Cash flows from financing activities Netmovementindepositsfromcustomers 567 950 – –Proceedsfromborrowings–non-bankingoperations1 669 507 – –Repaymentofborrowings–non-bankingoperations1 (250) (252) – –Netmovementinborrowings–bankingoperations (562) 196 – –Proceedsfromissueofsubordinateddebt 543 – 543 –Repaymentofsubordinateddebt – (280) – –Dividendspaid5 (800) (700) (813) (710)
Cash flows from (used in) financing activities 167 421 (270) (710)
Net increase (decrease) in cash and cash equivalents (4,633) 4,065 20 (5)Cashandcashequivalentsatthebeginningoftheyear 11,232 7,157 1 6Effectofexchangeratechangesoncashandcashequivalents 2 10 – –
Cash and cash equivalents at the end of the year1,6 25 6,601 11,232 21 1
1 Cashflowsandcashandcashequivalentsincludeamountsattributabletoshareholders’interests,policyholders’interestsinAMPlifeinsuranceentities’statutoryfundsandcontrolledentitiesofthosestatutoryfunds,externalunitholders’interestsandnon-controllinginterests.AmountsincludedinrespectofAMPlifeinsuranceentities’statutoryfundsandcontrolledentitiesofthosestatutoryfundshaveasubstantialimpactoncashflowsfromoperatingactivitiesandinvestingactivitiesandproceedsfromandrepaymentsofborrowings–non-bankingoperations,andcashandcashequivalentsbalances.
2 DividendsanddistributionsreceivedareamountsofcashreceivedmainlyfrominvestmentsheldbyAMPlifeinsuranceentities’statutoryfundsandcontrolledentitiesofthestatutoryfunds.Dividendsanddistributionsreinvestedhavebeentreatedasnon-cashitems.
3 Netproceedsfromsaleof(paymentstoacquire)investmentsinfinancialassetsincludesloansandadvancesmade(netofpayments)andpurchasesoffinancialassets(netofmaturities)duringtheperiodbyAMPBank.
4 Paymentstoacquireandproceedsfromdisposalsofoperatingcontrolledentitiesandinvestmentsinassociatesaccountedforusingtheequitymethod(netofcashacquiredandcashindeconsolidatedsubsidiaries)didnothaveamaterialimpactonthecompositionoftheAMPgroup.
5 TheDividendspaidamountispresentednetofdividendsontreasuryshares.SeeStatementofchangesinequityforfurtherinformation.6 ThedecreaseinCashandcashequivalentsattheendoftheperiodandnetcashproceedsfromsaleofinvestmentsinfinancialassetsincludes
theeffectofAMPlosingcontrolofamanagedcashfundduring2015.For
per
sona
l use
onl
y

AMP 2015 annual report 53
Theconsolidatedeconomicentity(theAMPgroup)comprisesAMPLimited(theparententity),acompanylimitedbyshares,andincorporatedanddomiciledinAustralia,andalltheentitiesitcontrolledduringtheperiodandatthereportingdate.
(a) Basis of preparationThisgeneralpurposefinancialreporthasbeenpreparedinaccordancewithAustralianAccountingStandards,otherauthoritativepronouncementsoftheAustralianAccountingStandardsBoard(AASB),andtheCorporations Act 2001(Cth).TheAMPgroupisafor-profitentityforthepurposesofpreparingfinancialstatements.ThefinancialreportalsocomplieswithInternationalFinancialReportingStandardsasissuedbytheInternationalAccountingStandardsBoard.
Thefinancialstatementsfortheyearended31December2015wereauthorisedforissueon18February2016inaccordancewitharesolutionofthedirectors.
ThefinancialreportispresentedinAustraliandollarsandallvaluesareroundedtothenearestmilliondollars($m),unlessotherwisestated.
Thesignificantaccountingpoliciesadoptedinthepreparationofthefinancialreportaresetoutbelow.Thesepolicieshavebeenconsistentlyappliedtothecurrentyearandcomparativeperiod,unlessotherwisestated.Wherenecessary,comparativeinformationhasbeenreclassifiedtobeconsistentwithcurrentperioddisclosure.
TheAMPgroupispredominantlyawealthmanagementbusinessconductingoperationsthroughstatutoryfundsofregisteredlifeinsurancecompanies(AMPlifeinsuranceentities’statutoryfunds)andotherentities.Wherepermittedunderaccountingstandards,theassetsandliabilitiesassociatedwithlifeinsurancecontractsandinvestmentcontractsaregenerallymeasuredonafairvaluebasisandotherassetsandliabilitiesaregenerallymeasuredonanhistoricalcostbasis.
AssetsandliabilitieshavebeenpresentedonthefaceoftheStatementoffinancialpositionindecreasingorderofliquidityanddonotdistinguishbetweencurrentandnon-currentitems.ThemajorityoftheassetsoftheAMPgroupareinvestmentassetsheldtobackinvestmentcontractandlifeinsurancecontractliabilities.Althoughtheamountofthoseassetswhichmayberealisedandthoseliabilitieswhichmaybesettledwithin12monthsofthereportingdatearenotalwaysknown,estimatesofamountsexpectedtoberecoveredorsettled(a)nomorethan12monthsafterthereportingdate,and(b)morethan12monthsafterthereportingdate,havebeenprovidedinfootnotestotherelevantnotes.
Changes in accounting policyAnumberofnewaccountingstandardsandamendmentshavebeenadoptedeffective1January2015,buthavenothadanymaterialeffectonthefinancialpositionorperformanceoftheAMPgroup.
TheAMPgrouphaselectedtoearlyadoptthefollowingnewaccountingstandardsfrom1January2015:– AASB2015-5Amendments to Australian Accounting Standards
– Investment Entities: Applying the Consolidation Exception– AASB2014-9Amendments to Australian Accounting Standards
– Equity Method in Separate Financial Statements.
ThereisnomaterialimpacttothefinancialpositionorperformanceoftheAMPgroupasaresultoftheearlyadoptionoftheseamendments.
Australian Accounting Standards issued but not yet effectiveAnumberofnewaccountingstandardsandamendmentshavebeenissuedbutarenotyeteffective.TheAMPgrouphasnotelectedtoearlyadoptanyofthesenewstandardsoramendmentsinthisfinancialreport.Thesenewstandardsandamendments,whenappliedinfutureperiods,arenotexpectedtohaveamaterialimpactonthefinancialpositionorperformanceoftheAMPgroup,otherthanassetoutbelow.– AASB9Financial Instruments.Thisstandardmakessignificant
changestotheclassificationoffinancialinstrumentsandtohedgeaccountingrequirementsanddisclosures,andintroducesanewexpectedlossmodelwhenrecognisingexpectedcreditlossesonfinancialassets.ThisstandardismandatoryforadoptionbytheAMPgroupfortheyearending31December2018.ThefinancialimpacttotheAMPgroupofadoptingAASB9Financial Instrumentshasnotyetbeenquantified.
– AASB15Revenue from Contracts with Customers.Thisstandardmakessignificantchangestorevenuerecognitionandaddssomeadditionaldisclosures.Theapplicationofthisstandardhasbeendeferreduntil2018.Hence,thisstandardisnowmandatoryforadoptionbytheAMPgroupfortheyearending31December2018.ThefinancialimpacttotheAMPgroupofadoptingAASB15Revenue from Contracts with Customershasnotyetbeenquantified.
Changes in estimatesAASB119Employee Benefitsrequiresemployeebenefitprovisionsanddefinedbenefitplanliabilitiestobedeterminedbydiscountingfuturecashflowsusingdiscountratesdeterminedwithreferencetomarketyieldsattheendofthereportingperiodonhighqualitycorporatebondsor,incountrieswherethereisnodeepmarketinsuchbonds,usingmarketyieldsattheendoftheperiodongovernmentbonds.
Inre-estimatingAustralianemployeebenefitprovisionsanddefinedbenefitplanliabilitiesforfinancialreportingpurposes,AMPgrouphaschangedfromusingablendofmarketyieldsonCommonwealthgovernmentandstategovernmentbondstoablendofhighqualitycorporatebonds.ThischangeisrequiredasaconsequenceofitbeingdeterminedthatthereisadeepmarketinhighqualitycorporatebondsinAustralia.ThishasresultedinadecreaseintheAustraliandefinedbenefitplanliabilitiesof$69maftertaxeffect.Theimpactofchangesindiscountratesonemployeebenefitprovisionswasnotmaterial.
(b) Principles of consolidation Thefinancialstatementsconsolidatethefinancialinformationofcontrolledentities.AnentityiscontrolledwhenAMPLimitedisexposed,orhasrights,tovariablereturnsfromitsinvolvementwiththeentityandhastheabilitytoaffectthosereturnsthroughitspowerovertheentity.
Thefinancialinformationforcontrolledentitiesispreparedforthesamereportingdateastheparententity,usingconsistentaccountingpolicies.Wheredissimilaraccountingpoliciesmayexist,adjustmentsaremadetoensureconformitywiththegroup’saccountingpolicies.
Consolidationprinciplesrequirethetotalamountsofeachunderlyingasset,liability,incomeandexpenseofthecontrolledentitiestoberecognisedintheconsolidatedfinancialstatements.Whenacontrolledmanagedinvestmentschemeisconsolidated,theshareoftheunitholderliabilityattributabletotheAMPgroupiseliminatedbutamountsduetoexternalunitholdersremainasliabilitiesintheconsolidatedStatementoffinancialposition.
Notes to the financial statementsfortheyearended31December2015
1. Basis of preparation and summary of significant accounting policies
For
per
sona
l use
onl
y

AMP 2015 annual report54
Notes to the financial statements for the year ended 31 December 2015
1. Basis of preparation and summary of significant accounting policies continuedTheshareofthenetassetsofcontrolledentitiesattributabletonon-controllinginterestsisdisclosedasaseparatelineitemontheStatementoffinancialposition.IntheIncomestatement,theprofitorlossoftheAMPgroupisallocatedbetweenprofitorlossattributabletonon-controllinginterestsandprofitorlossattributabletoshareholdersoftheparententity.
Controlledentitiesacquiredareaccountedforusingtheacquisitionmethodofaccounting.Informationfromthefinancialstatementsofcontrolledentitiesisincludedfromthedatetheparententityobtainscontroluntilsuchtimeascontrolceases.WheretheAMPgroupceasestocontrolanentity,theconsolidatedfinancialstatementsincludetheresultsforthepartofthereportingperiodduringwhichtheparententityhadcontrol.
Mostacquisitionsanddisposalsofcontrolledentitiesareinrelationtomanagedinvestmentschemeswithunderlyingnetassetstypicallycomprisinginvestmentassetsandcash.Theconsiderationforacquisitionsordisposalsreflectsthefairvalueoftheinvestmentassetsatthedateofthetransactionsaftertakingintoaccountnon-controllinginterests.
Allinter-companybalancesandtransactionsareeliminatedinfull,includingunrealisedprofitsarisingfromintra-grouptransactions.
Consolidation impact of investments of the AMP life insurance entitiesAMPlifeinsuranceentitiesconductwealthmanagementbusinessthroughseparatelifestatutoryfunds.Income,expenses,assetsandliabilitiesattributabletopolicyholderswithinthelifestatutoryfundsareconsolidatedintotheAMPgroupfinancialstatements,alongwiththoseattributabletotheshareholdersoftheparententity.
ThemajorityoftheAMPlifeinsuranceentities’statutoryfunds’investmentsareheldthroughcontrollinginterestsinanumberofmanagedinvestmentschemesandcompanies.TheseinvestmentassetsareheldonbehalfofpolicyholdersandtheAMPlifeinsuranceentities’statutoryfundsrecognisealiabilitytothepolicyholdersvaluedasdescribedinnote1(s)forLifeinsurancecontractliabilities,andnote1(t)forInvestmentcontractliabilities.Incertaincases,theamountofthenetassetsofthecontrolledentitiesrecognisedintheconsolidatedfinancialstatementsmaynotmatchthevaluationoftherelevantliabilitiestopolicyholders,whichresultsincertainpolicyholderassetmovementsimpactingtheprofitattributabletoshareholdersofAMPLimited.
CertaincontrolledentitiesoftheAMPlifeinsuranceentities’statutoryfundsareoperatingcompanieswhichcarryoutbusinessoperationsunrelatedtothecorewealthmanagementoperationsoftheAMPgroup.
Securitisation vehiclesThebankingoperationoftheAMPgroupsellsmortgageloanstosecuritisationvehicles(alsoreferredtoasspecial purpose entities)throughitsloansecuritisationprogram.ThesesecuritisationvehiclesarecontrolledbytheAMPgroupandarethereforeconsolidated.
(c) Accounting for wealth management and life insurance business
Theaccountingtreatmentofcertaintransactionsinthisfinancialreportvariesdependingonthenatureofthecontractunderlyingthetransactions.ThetwomajorcontractclassificationsrelevanttothewealthmanagementandinsurancebusinessoftheAMPgroupareinvestmentcontractsandlifeinsurancecontracts.
Forthepurposesofthisfinancialreport,holdersofinvestmentcontractsorlifeinsurancecontractsarecollectivelyandindividuallyreferredtoaspolicyholders.
Investment contractsThemajorityofthebusinessoftheAMPlifeinsuranceentitiesrelatestowealthmanagementproductssuchassavings,investment-linkedandretirementincomepolicies.ThenatureofthisbusinessisthattheAMPlifeinsuranceentitiesreceivedepositsfrompolicyholdersandthosefundsareinvestedonbehalfofthepolicyholders.Withtheexceptionoffixedretirementincomepolicies,theresultingliabilitytopolicyholdersislinkedtotheperformanceandvalueoftheassetsthatbackthoseliabilities.Forfixedretirementincomepolicies,theresultingliabilityislinkedtothefairvalueofthefixedretirementincomepaymentsandassociatedmanagementservices.
UnderAustralianAccountingStandardssuchcontractsaredefinedaslife investment contractsanddescribedasinvestment contractsthroughoutthisfinancialreport.
Life insurance contractsAMPlifeinsuranceentitiesalsoissuecontractsthattransfersignificantinsuranceriskfromthepolicyholder,coveringdeath,disabilityorlongevityoftheinsured.Inaddition,therearesomepoliciesknownasdiscretionary participating contractsthataresimilartoinvestmentcontracts,butthetimingofthevestingoftheprofitattributabletothepolicyholdersisatthediscretionoftheAMPlifeinsuranceentities.
UnderAustralianAccountingStandards,suchcontractsaredefinedaslife insurance contracts.
Assets measurement basisInvestmentcontractliabilitiesaremeasuredatfairvalueasdescribedinnote1(t)andlifeinsurancecontractliabilitiesaremeasuredasdescribedinnote1(s).Assetsbackingsuchliabilitiesaremeasuredatfairvalue,totheextentpermittedunderAustralianAccountingStandards.RealisedandunrealisedgainsandlossesarisingfromchangesinthefairvaluearerecognisedintheIncomestatement,totheextentpermittedunderAustralianAccountingStandards.Theaccountingpoliciesforindividualassetclassesaredescribedlaterinnote1.
AllassetsthatbackinvestmentcontractliabilitiesandlifeinsurancecontractliabilitiesareincludedwithintheAMPlifeinsuranceentities’statutoryfundsand,assuch,areseparatelyidentifiable.
(d) Cash and cash equivalentsCashandcashequivalentscomprisecash-on-handthatisavailableondemandanddepositsthatareheldatcallwithfinancialinstitutions.Cashandcashequivalentsaremeasuredatfairvalue,beingtheprincipalamount.ForthepurposeoftheStatementofcashflows,Cashandcashequivalentsalsoincludesotherhighlyliquidinvestmentsnotsubjecttosignificantriskofchangeinvalue,withshortperiodstomaturity,netofoutstandingbankoverdrafts.BankoverdraftsareshownwithinBorrowingsintheStatementoffinancialposition.
(e) ReceivablesReceivablesthatbackinvestmentcontractliabilitiesandlifeinsurancecontractliabilitiesaredesignatedasfinancialassetsmeasuredatfairvaluethroughprofitorloss.Reinsuranceandotherrecoveriesarediscountedtopresentvalue.Receivablesthatdonotbackinvestmentcontractandlifeinsurancecontractliabilitiesaremeasuredatnominalamountsdue,lessanyallowancefordoubtfuldebts.Anallowancefordoubtfuldebtsisrecognisedwhencollectionofthefullamountisnolongerprobable.Baddebtsarewrittenoffasincurred.Giventheshort-termnatureofmostreceivables,therecoverableamountapproximatesfairvalue.
(f) InventoriesAssetsheldforsaleintheordinarycourseofbusiness,inthe
For
per
sona
l use
onl
y

AMP 2015 annual report 55
1. Basis of preparation and summary of significant accounting policies continuedprocessofproductionforsuchsaleorintheformofmaterialsorsuppliestobeconsumedintheproductionprocessorintherenderingofservices,areclassifiedasinventories.
Inventoriesaremeasuredatthelowerofcostandnetrealisablevalue.Net realisable valueistheestimatedsellingpriceintheordinarycourseofbusiness,lessestimatedcostsnecessarytomakethesale.
(g) Investments in financial assetsInvestments in financial assets measured at fair value through profit or lossInvestmentsinfinancialassetsdesignatedoninitialrecognitionasfinancial assets measured at fair value through profit or lossareinitiallyrecognisedatfairvaluedeterminedasthepurchasecostoftheasset,exclusiveofanytransactioncosts.Transactioncostsareexpensedasincurredinprofitorloss.AnyrealisedandunrealisedgainsorlossesarisingfromsubsequentmeasurementatfairvaluearerecognisedintheIncomestatementintheperiodinwhichtheyarise.
Subsequenttoinitialrecognition,thefairvalueofinvestmentsmeasuredatfairvaluethroughprofitorlossisdeterminedasfollows:– Thefairvalueoflistedequitysecuritiestradedinanactive
marketandlistedmanagedinvestmentschemesreflectsthequotedbidpriceatthereportingdate.Inthecaseofequitysecuritiesandlistedmanagedinvestmentschemeswherethereisnoactivemarket,fairvalueisestablishedusingvaluationtechniquesincludingtheuseofrecentarm’slengthtransactions,referencestootherinstrumentsthataresubstantiallythesame,discountedcashflowanalysisandoptionpricingmodels.
– Thefairvalueoflisteddebtsecuritiesreflectsthebidpriceatthereportingdate.Listeddebtsecuritiesthatarenotfrequentlytradedarevaluedbydiscountingestimatedrecoverableamounts.Thefairvalueofunlisteddebtsecuritiesisestimatedusinginterestrateyieldsobtainableoncomparablelistedinvestments.Thefairvalueofloansisdeterminedbydiscountingtheestimatedrecoverableamountusingprevailinginterestrates.
– Thefairvalueofinvestmentsinunlistedmanagedinvestmentschemesisdeterminedonthebasisofpublishedredemptionpricesofthosemanagedinvestmentschemesatthereportingdate.
– Thereisnoreductionforrealisationcostsindeterminingfairvalue.
– Thefairvalueofderivativefinancialassetsisdeterminedinaccordancewiththepolicysetoutinnote1(q).
Investments in available-for-sale financial assets Available-for-saleinvestmentsareinitiallyrecognisedatfairvaluedeterminedasthepurchasecostoftheasset,exclusiveofanytransactioncosts.Transactioncostsareexpensedasincurredinprofitorloss.UnrealisedgainsorlossesarisingfromsubsequentmeasurementatfairvaluearerecognisedasOthercomprehensiveincomeintheAvailable-for-salefinancialassetsreserveintheperiodinwhichtheyarise.Testingforimpairmentisconductedinaccordancewithnote1(l).Uponimpairmentordisposal,theaccumulatedchangeinfairvaluewithintheavailable-for-salefinancialassetsreserveisrecognisedwithinprofitorlossintheIncomestatement.
Subsequenttoinitialrecognition,thefairvalueofavailable-for-saleinvestmentsisdeterminedonthesamebasisasforfinancialassetsmeasuredatfairvaluethroughprofitorloss.
Investments in financial assets measured at amortised costInvestmentsinfinancialassetsmeasuredatamortisedcostaremainlyassetsofAMPBank.Loans,advancesandother
receivableswhicharisewhenAMPBankprovidesmoneydirectlytoacustomer,includingloansandadvancestoadvisers,withnointentionoftradingthefinancialassets,aremeasuredatamortisedcost.AllotherdebtsecuritiesheldbyAMPBankareclassifiedasheldtomaturityinvestments.Heldtomaturityinvestmentsarenon-derivativeassetswithfixedordeterminablepaymentsandfixedmaturitiesthatmanagementhasthepositiveintentionandabilitytoholdtomaturity.
Investmentsinfinancialassetsmeasuredatamortisedcostareinitiallyrecognisedatfairvalueplustransactioncoststhataredirectlyattributabletotheacquisitionorissueofthefinancialasset.Theseassetsaresubsequentlyrecognisedatamortisedcostusingtheeffectiveinterestratemethod.
Investments in controlled entitiesInvestmentsbytheparententityincontrolledentitiesaremeasuredatcost(which,inthecaseoftheinvestmentinAMPGroupHoldingsLimited,wasdeterminedasnetassetvalueondemutualisation)lessanyaccumulatedimpairmentlosses.
(h) Investments in associates accounted for using the equity method
Associated entitiesaredefinedasthoseentitiesoverwhichtheAMPgrouphassignificantinfluencebutnocapacitytocontrol.Investmentsinassociates,otherthanthosebackinginvestmentcontractliabilitiesandlifeinsurancecontractliabilities,areinitiallymeasuredatcostplusanyexcessofthefairvalueofAMP’sshareofidentifiableassetsandliabilitiesabovecostatacquisitiondate.ThisissubsequentlyadjustedfortheAMPgroup’sshareofpost-acquisitionprofitorlossandmovementsinreservesnetofanyimpairment.TheAMPgroup’sshareofprofitorlossofassociatesisincludedintheconsolidatedIncomestatement.Anydividendordistributionreceivedfromassociatesisaccountedforasareductionincarryingvalueoftheassociate.
Investmentsinassociatesheldtobackinvestmentcontractliabilitiesandlifeinsurancecontractliabilitiesareexemptfromtherequirementtoapplyequityaccountingandhavebeendesignatedoninitialrecognitionasfinancialassetsmeasuredatfairvaluethroughprofitorloss.
(i) Investment propertyInvestmentpropertyisheldtoearnrevenuefromrentalsand/orforthepurposesofcapitalappreciation.Investmentpropertyincludesalldirectlyheldfreeholdandleaseholdpropertiesbutexcludesowner-occupiedproperties.Seenote1(j).Therearenopropertyinterestsheldunderoperatingleasesaccountedforasinvestmentproperty.
Investmentpropertyisinitiallyrecognisedatcost,includingtransactioncosts.Subsequenttoinitialrecognition,investmentpropertyismeasuredatfairvalue.
ChangesinvalueofinvestmentpropertyaretakendirectlytotheIncomestatementandmaycomprisechangesinthefairvaluefromrevaluationofinvestmentproperty,andfairvalueadjustmentsinrelationto:– thestraight-liningoffixedrentalincome– tenantincentivesincludingrent-freeperiodsandlandlord
andtenantownedfit-outcontributions– capitalisedleasingfees.
Theprocessadoptedtodeterminefairvaluesforinvestmentpropertiesissetoutinnote11.
( j) Property, plant and equipmentOwner-occupied propertyUnderAustralianAccountingStandards,wherethewholeorasignificantportionofapropertyownedbytheAMPgroupisheldforusebytheAMPgroupintheproductionorsupplyofgoodsorservices,orforadministrativepurposes,thatpropertyisclassified
For
per
sona
l use
onl
y

AMP 2015 annual report56
Notes to the financial statements for the year ended 31 December 2015
1. Basis of preparation and summary of significant accounting policies continuedforaccountingpurposesas owner-occupied propertywithinProperty,plantandequipmentintheStatementoffinancialposition.
Owner-occupiedpropertyheldbytheAMPgroupforadministrativepurposesisinitiallyrecognisedatcost,includingtransactioncosts,andissubsequentlymeasuredattherevaluedamount,beingitsfairvalueatthedateoftherevaluation,lessanysubsequentaccumulateddepreciationandaccumulatedimpairmentlosses.Fairvalueisdeterminedonthesamebasisasinvestmentpropertyinnote11.
Whenarevaluationincreasesthecarryingvalueofaproperty,theincreaseisrecogniseddirectlyinOthercomprehensiveincomethroughtheowner-occupiedpropertyrevaluationreserve.However,anincreaseisrecognisedintheIncomestatementtotheextentthattheamountreversesarevaluationdecreaseofthesameassetpreviouslyrecognisedintheIncomestatement.Whenthecarryingvalueofanassetisdecreasedasaresultofarevaluation,thedecreaseisrecognisedintheIncomestatement.However,anydecreaseisrecognisedintheOwner-occupiedpropertyrevaluationreservetotheextentthatitreversesabalanceexistinginthereserveinrespectofthatasset.
GainsorlossesondisposalsaremeasuredasthedifferencebetweenproceedsandthecarryingamountandarerecognisedintheIncomestatement.Thebalanceoftheowner-occupiedpropertyrevaluationreserve,inrespectofapropertydisposedof,istransferredtoretainedearnings.
Eachpartofanowner-occupiedproperty,exceptland,thatissignificantinrelationtothetotalpropertyisdepreciatedonasystematicbasisovertheusefullifeoftheasset,beingaperiodnotexceeding40years.
Totheextentowner-occupiedpropertyisheldbythelifeinsuranceentities’statutoryfunds,theamountsrecognisedfortheassetintheconsolidatedfinancialstatementsmaynotmatchthevaluationoftherelevantliabilitytothepolicyholder,whichresultsincertainpolicyholderassetmovementsimpactingtheprofitattributabletoshareholdersofAMPLimited.
Plant and equipmentPlantandequipmentisinitiallymeasuredatcost,includingtransactioncosts.Itissubsequentlymeasuredatcostlessanysubsequentaccumulateddepreciationandaccumulatedimpairmentlosses.Thewrittendownamountapproximatesfairvalue.
Eachitemofplantandequipmentisdepreciatedonasystematicbasisovertheusefullifeoftheassetof3–10years.
Leasehold improvementsLeaseholdimprovementsarerecognisedasanassetonlywhenitisprobablethatfutureeconomicbenefitsassociatedwiththeassetwillflowtotheAMPgroupandthecostoftheitemcanbereliablymeasured.
(k) Intangible assetsGoodwillWhentheaggregateofthefairvalueoftheconsiderationtransferredinabusinesscombination,therecognisedamountofanynon-controllinginterestandthefairvalueofanypreviouslyheldequityinterestintheacquireeexceedsthefairvalueoftheidentifiableassetsacquiredandliabilitiesassumed,theexcessisrecognisedasgoodwill.Subsequently,goodwillismeasuredatcostlessanyaccumulatedimpairmentlosses.Goodwillisnotsubjecttoamortisation.
Capitalised costsCostsarecapitalisedandcarriedforwardonlywherethecostsrelatetothecreationofanassetwithexpectedfutureeconomic
benefitswhicharecapableofreliablemeasurement.Otherwise,allcostsarerecognisedasexpensesintheperiodinwhichtheyareincurred.Capitalisedcostsareamortisedonastraight-linebasisovertheestimatedusefullifeoftheasset,commencingatthetimetheassetisfirstputintouseorheldreadyforuse(whicheveristheearlier).Theusefullivesofsuchassetsgenerallydonotexceedfiveyears;howeverausefullifeofupto10yearshasbeenappliedtosomecapitalisedcostsrelatingtoITsystemsdevelopmentprojectswheretheAMPgroupexpectsbenefitstoflowoveralongerperiod.
Value of in-force businessIntangibleassetsrecognisedinabusinesscombinationrepresentthefairvalueoffuturebusinessarisingfromtheexistingcontractualarrangementsoftheacquiredbusinesswithitscustomers.Thevalueofin-forcebusinessismeasuredinitiallyatfairvalueandissubsequentlyamortisedonastraight-linebasisoveritsusefullife.Valueofin-forcebusinesshasausefullifeof10yearsforwealthmanagementanddistributionbusinessand20yearsforwealthprotectionandmaturebusiness.
Distribution networksIntangibleassetsrecognisedinabusinesscombinationrepresentthefairvalueoftheexistingcontractualdistributionarrangementsoftheacquiredentity.DistributionnetworksintangiblesarealsorecognisedwheretheAMPgroupacquirescustomerlists,financialplannerclientservicingrightsorotherdistribution-relatedrightsotherthanthroughabusinesscombination.Distributionnetworksaremeasuredinitiallyatfairvalueandsubsequentlyamortisedonastraight-linebasisovertheirusefullivesof3−15years.
Financialplannerclientservicingrightsheldforsaleintheordinarycourseofbusinessareclassifiedasinventoriesandaccountedforasdescribedinnote1(f).
Other intangible assetsOtherintangibleassetscomprise:– Amountsrecognisedinabusinesscombinationfor
thevalueofthesoftwareassetsoftheacquiredentitywhereitisexpectedthatfutureeconomicbenefitswillbederived.Softwareisrecognisedinitiallyatfairvalueandissubsequentlyamortisedonastraight-linebasisoveritsusefullife.Softwarehasausefullifeof2−4years.Softwaremaintenancecostsareexpensedasincurred.
– AcquiredmanagementrightsrelatingtoAMP’sassetmanagementbusiness.Forclosed-endedfundswhereAMPcannotberemovedasmanager,thesemanagementrightshaveanindefiniteusefullifeandarenotamortised.
Reassessment of useful lifeTheusefullifeofeachintangibleassetisreviewedattheendoftheperiodand,wherenecessary,adjustedtoreflectcurrentassessments.
(l) Impairment of assetsAssetsmeasuredatfairvalue,wherechangesinfairvaluearereflectedintheIncomestatement,arenotsubjecttoimpairmenttesting.Asaresult,financialassetsmeasuredatfairvaluethroughprofitorloss,andinvestmentproperties,arenotsubjecttoimpairmenttesting.
Otherassetssubjecttoimpairmenttestinginclude:available-for-saleinvestments;investmentsinfinancialassetsmeasuredatamortisedcost;property,plantandequipment;intangibleassetsincludinggoodwill;investmentsinassociatesaccountedforusingtheequitymethod;inventories;and(inthecaseoftheparententity)investmentsincontrolledentities.
Foravailable-for-saleinvestments,wherethereisobjectiveevidencethataninvestmentisimpaired,animpairmentis
For
per
sona
l use
onl
y

AMP 2015 annual report 57
1. Basis of preparation and summary of significant accounting policies continuedrecognisedintheIncomestatement,andmeasuredasthedifferencebetweentheacquisitioncost(netofanyprincipalrepaymentandamortisation)andcurrentfairvalue,lessanyimpairmentlosspreviouslyrecognisedinprofitorloss.Impairmentlossesforequityinstrumentsarenotreversed.Impairmentlossesfordebtinstrumentsarereversedonlytotheextentofasubsequentincreaseinfairvaluewhichcanbeobjectivelyrelatedtoaneventoccurringaftertheimpairment.
Forloans,advances,heldtomaturityinvestmentsandotherreceivables,impairmentisrecognisedintheIncomestatementwhenthereisobjectiveevidencealosshasbeenincurred.Itismeasuredasthedifferencebetweenthecarryingamountandthepresentvalueofestimatedfuturecashflows,discountedattheoriginaleffectiveinterestrate.
Forotherassets,impairmentisrecognisedintheIncomestatement,measuredastheamountbywhichthecarryingamountofanassetexceedsitsrecoverableamount.Therecoverableamountisthehigherofanasset’sfairvaluelesscostsofdisposalanditsvalueinuse.
Intangibleassetsthathaveindefiniteusefullives,suchasgoodwill,arenotsubjecttoamortisationbutaretestedatleastannuallyforimpairment.Otherintangibleassetsarereviewedforimpairmentwhenevereventsorchangesincircumstancesindicatethatthecarryingamountmaynotberecoverable.
Forthepurposesofassessingimpairmentofgoodwill,assetsaregroupedatthelowestlevelsforwhichthereareseparatelyidentifiablecashflows(cash-generatingunits).Impairmentisdeterminedbyassessingtherecoverableamountofthecash-generatingunittowhichthegoodwillrelates.
(m) TaxesTax consolidationAMPLimitedanditswholly-ownedcontrolledentitieswhichareAustralian-domiciledcompaniescompriseatax-consolidatedgroupofwhichAMPLimitedistheheadentity.
TheimplementationdatefortheAMPLimitedtax-consolidatedgroupwas30June2003.
Undertaxconsolidation,theheadentityassumesthefollowingbalancesfromentitieswithinthetax-consolidatedgroup:– currenttaxbalancesarisingfromexternaltransactions
recognisedbyentitiesinthetax-consolidatedgroup,occurringaftertheimplementationdate
– deferredtaxassetsarisingfromunusedtaxlossesandunusedtaxcreditsrecognisedbyentitiesinthetax-consolidatedgroup.
Ataxfundingagreementhasbeenenteredintobytheheadentityandthecontrolledentitiesinthetax-consolidatedgroup.Entitiesinthetax-consolidatedgroupcontinuetoberesponsible,bytheoperationofthetaxfundingagreement,forfundingtaxpaymentsrequiredtobemadebytheheadentityarisingfromunderlyingtransactionsofthecontrolledentities.Controlledentitiesmake(receive)contributionsto(from)theheadentityforthebalancesassumedbytheheadentity,asdescribedabove.Thecontributionsarecalculatedinaccordancewiththetaxfundingagreement.Thecontributionsarepayableassetoutintheagreementandreflectthetimingoftherespectiveheadentities’obligationstomakepaymentstotheAustralianTaxationOffice.
Assetsandliabilitiesthatariseasaresultofbalancestransferredfromentitieswithinthetax-consolidatedgrouptotheheadentityarerecognisedasrelated-partybalancesreceivableandpayableintheStatementoffinancialpositionofAMPLimited.Therecoverabilityofbalancesarisingfromthetaxfundingarrangementsisbasedontheabilityofthetax-consolidatedgrouptoutilisetheamountsrecognisedbytheheadentity.
Income tax expenseIncometaxexpense/creditisthetaxpayableontaxableincomeforthecurrentperiodbasedontheincometaxrateforeachjurisdictionandadjustedforchangesindeferredtaxassetsandliabilities.Thesechangesareattributableto:– temporarydifferencesbetweenthetaxbasesofassetsand
liabilitiesandtheirStatementoffinancialpositioncarryingamounts
– unusedtaxlosses– theimpactofchangesintheamountsofdeferredtaxassets
andliabilitiesarisingfromchangesintaxratesorinthemannerinwhichthesebalancesareexpectedtoberealised.
Adjustmentstoincometaxexpense/creditarealsomadeforanydifferencesbetweentheamountspaid,orexpectedtobepaid,inrelationtopriorperiodsandtheamountsprovidedfortheseperiodsatthestartofthecurrentperiod.
Anytaximpactonincomeandexpenseitemsthatarerecogniseddirectlyinequityisalsorecogniseddirectlyinequity.
Income tax for investment contracts business and life insurance contracts businessTheincometaxexpenserecognisedintheIncomestatementoftheAMPgroup,whicharisesinrespectoftheAMPlifeinsuranceentities,reflectstaximposedonshareholdersaswellaspolicyholders.
InvestmentcontractsliabilitiesandlifeinsurancecontractsliabilitiesareestablishedinAustralianet,andinNewZealandgross,ofthepolicyholders’shareofanycurrenttaxpayableanddeferredtaxbalancesoftheAMPgroup.
ArrangementsmadewithsomesuperannuationfundsresultintheAMPlifeinsuranceentitiesmakingpaymentstotheAustralianTaxationOfficeinrelationtocontributionstaxarisinginthosefunds.Theamountspaidarerecognisedasadecreaseininvestmentcontractliabilitiesandnotincludedinincometaxexpense.
Deferred taxDeferredtaxassetsandliabilitiesarerecognisedfortemporarydifferencesatthetaxrateswhichareexpectedtoapplywhentheassetsarerecoveredorliabilitiesaresettled,basedonthosetaxrateswhichareenactedorsubstantivelyenactedforeachjurisdiction.
Therelevanttaxratesareappliedtothecumulativeamountsofdeductibleandtaxabletemporarydifferencestomeasurethedeferredtaxassetorliability.Anexceptionismadeforcertaintemporarydifferencesarisingfromtheinitialrecognitionofanassetoraliability.Nodeferredtaxassetorliabilityisrecognisedinrelationtothesetemporarydifferencesiftheyaroseinatransaction,otherthanabusinesscombination,thatatthetimeofthetransactiondidnotaffecteitheraccountingprofitortaxableprofitorloss.
Deferredtaxassetsarerecognisedfordeductibletemporarydifferencesandunusedtaxlossesonlyifitisprobablethatfuturetaxableamountswillbeavailabletoutilisethosetemporarydifferencesandlosses.
Deferredtaxassetsandliabilitiesarenotrecognisedfortemporarydifferencesbetweenthecarryingamountandtaxbasesofinvestmentsincontrolledentitieswheretheparententityisabletocontrolthetimingofthereversalofthetemporarydifferencesanditisprobablethatthedifferenceswillnotreverseintheforeseeablefuture.
Deferredtax,includingamountsinrespectofinvestmentcontractsandlifeinsurancecontracts,isnotdiscountedtopresentvalue.
For
per
sona
l use
onl
y

AMP 2015 annual report58
Notes to the financial statements for the year ended 31 December 2015
1. Basis of preparation and summary of significant accounting policies continuedGoods and services taxTheAMPgroupoperatesacrossanumberoftaxjurisdictionsandoffersproductsandservicesthatmaybesubjecttovariousformsofgoodsandservicestax(GST)imposedbylocaltaxauthorities.
Allincome,expensesandassetsarerecognisednetofanyGSTpaid,exceptwheretheyrelatetoproductsandserviceswhichareinputtaxedforGSTpurposes,orwheretheGSTincurredisnotrecoverablefromtherelevanttaxauthorities.Insuchcircumstances,theGSTpaidisrecognisedaspartofthecostofacquisitionoftheassetsoraspartoftherelevantexpense.
ReceivablesandpayablesaremeasuredwiththeamountofGSTincluded.ThenetamountofGSTrecoverablefromorpayabletothetaxauthoritiesisincludedaseitherareceivableorpayableintheStatementoffinancialposition.
CashflowsarereportedonagrossbasisreflectinganyGSTpaidorcollected.TheGSTcomponentofcashflowsarisingfrominvestingorfinancingactivitieswhicharerecoverablefrom,orpayableto,localtaxauthoritiesareclassifiedasoperatingcashflows.
(n) PayablesPayablesaremeasuredatthenominalamountpayable.Giventheshort-termnatureofmostpayables,thenominalamountpayableapproximatesfairvalue.
(o) ProvisionsProvisionsarerecognisedwhen:– theAMPgrouphasapresentobligation(legalorconstructive)
asaresultofapastevent– itisprobablethatanoutflowofresourcesembodying
economicbenefitswillberequiredtosettletheobligation,and
– areliableestimatecanbemadeoftheamountoftheobligation.
WheretheAMPgroupexpectssomeorallofaprovisiontobereimbursed,egunderaninsurancecontract,thereimbursementisrecognisedasaseparateassetbutonlywhenthereimbursementisvirtuallycertain.TheexpenserelatingtoanyprovisionispresentedintheIncomestatementnetofanyreimbursement.
Provisionsaremeasuredatthepresentvalueofmanagement’sbestestimateoftheexpenditurerequiredtosettlethepresentobligationatthereportingdate.Forprovisionsotherthanemployeeentitlements,thediscountrateusedtodeterminethepresentvaluereflectscurrentmarketassessmentsofthetimevalueofmoneyandtherisksspecifictotheliability.
Employee entitlementsLiabilitiesarisinginrespectofsalariesandwagesandanyotheremployeeentitlementsexpectedtobesettledwithin12monthsofthereportingdatearemeasuredattheirnominalamounts.Allotheremployeeentitlementsaremeasuredatthepresentvalueoftheestimatedfuturecashoutflowstobemadeinrespectofservicesprovidedbyemployeesuptothereportingdate.Indeterminingthepresentvalueoffuturecashoutflows,discountratesaredeterminedwithreferencetomarketyieldsattheendofthereportingperiodonhighqualitycorporatebondsor,incountrieswherethereisnodeepmarketinsuchbonds,byusingmarketyieldsattheendoftheperiodongovernmentbonds.
RestructuringArestructuringprovisionisonlyrecognisedwhenitisprobablethatfuturecostswillbeincurredinrespectofafundamentalreorganisationorchangeinfocusofthebusinessoftheAMPgroup.AprovisionisrecognisedwhentheAMPgroupisdemonstrablycommittedtotheexpenditureandareliableestimateofthecostsinvolvedcanbemade.Theprovisionismeasuredasthebestestimateoftheincremental,directexpenditurestobeincurredasaresultoftherestructureand
doesnotincludecostsassociatedwiththeongoingactivitiesoftheAMPgroup.
(p) Borrowings and subordinated debt Allborrowingsandsubordinateddebtarefinancialliabilitiesandareinitiallyrecognisedatfairvalue.Inthecaseofborrowingsandsubordinateddebtwhicharesubsequentlymeasuredatamortisedcost,initialfairvalueiscalculatednetofdirectlyattributabletransactioncosts.Forborrowingsandsubordinateddebtwhicharesubsequentlymeasuredatfairvaluethroughprofitorloss,directlyattributabletransactioncostsareexpensed.
Borrowingsandsubordinateddebt,otherthanthoseheldbycontrolledentitiesoftheAMPlifeinsuranceentities’statutoryfunds,aresubsequentlymeasuredatamortisedcost.Anydifferencebetweentheproceeds(netoftransactioncosts)andtheredemptionamountisrecognisedintheIncomestatementovertheperiodofthecontract,usingtheeffectiveinterestratemethod.ItisAMP’spolicytohedgecurrencyandinterestrateriskarisingonissuedbondsandsubordinateddebt.Whenfairvaluehedgeaccountingisappliedtoborrowingsandsubordinateddebt,thecarryingamountsofborrowingsandsubordinateddebtareadjustedforchangesinfairvaluefortheperiodthatthefairvaluehedgerelationshipremainseffective.Seenote1(q).
BorrowingsofcertaincontrolledmanagedinvestmentschemesoftheAMPlifeinsuranceentities’statutoryfundsaremeasuredatamortisedcostforthepurposeofdeterminingtheunitpriceofthoseschemes.Theseborrowingsaremeasuredatamortisedcostinthisfinancialreportwithanydifferencebetweentheproceeds(netoftransactioncosts)andtheredemptionamountrecognisedintheIncomestatementovertheperiodofthecontractusingtheeffectiveinterestratemethod.
AllotherborrowingsofthecontrolledentitiesofthestatutoryfundsaresubsequentlymeasuredatfairvaluewithmovementsrecognisedintheIncomestatement.
(q) Derivative financial assets, derivative financial liabilities and hedging
TheAMPgroupisexposedtochangesininterestratesandforeignexchangeratesaswellasmovementsinthefairvalueofinvestmentguaranteesithasissuedinrespectofitsproducts.Tomitigatetherisksarisingfromtheseexposures,theAMPgroupusesderivativefinancialinstrumentssuchascross-currencyandinterest-rateswaps,forwardrateagreements,futures,optionsandforeigncurrencycontracts.Derivativefinancialinstrumentsarealsousedtogainexposuretovariousmarketsforassetandliabilitymanagementpurposes.
Derivativesareinitiallyrecognisedatfairvalueexclusiveofanytransactioncostsonthedateonwhichaderivativecontractisenteredintoandaresubsequentlyremeasuredtotheirfairvalueattheendofeachreportingperiod.Allderivativesarerecognisedasassetswhentheirfairvalueispositiveandasliabilitieswhentheirfairvalueisnegative.
Themethodofrecognisingthemovementinfairvaluedependsonwhetherthederivativeisdesignatedasahedginginstrumentand,ifso,thenatureoftheitembeinghedged.TheAMPgroupdesignatesahedgeas:– ahedgeofthefairvalueofrecognisedassetsorliabilities
orafirmcommitment(fairvaluehedge)– ahedgeofhighlyprobableforecasttransactions(cashflow
hedge),or– ahedgeofanetinvestmentinaforeignoperation
(netinvestmenthedge).
TheAMPgroupdocumentstherelationshipbetweenhedginginstrumentsandhedgeditemsatinceptionofthetransaction,aswellastheAMPgroup’sriskmanagementandstrategyfor
For
per
sona
l use
onl
y

AMP 2015 annual report 59
1. Basis of preparation and summary of significant accounting policies continuedundertakingvarioushedgetransactions.TheAMPgroupalsodocumentsitsassessmentofwhetherthederivativesusedinhedgingtransactionshavebeen,andwillcontinuetobe,highlyeffectiveinoffsettingchangesinfairvaluesorcashflowsofhedgeditems.Thisassessmentiscarriedoutbothathedgeinceptionandonanongoingbasis.
Accounting for hedges(i) Fairvaluehedges:– totheextentthatahedgeiseffective,changesinthefair
valueofderivativesthataredesignatedandqualifyasfairvaluehedgesarerecognisedintheIncomestatement,togetherwithanychangesinthefairvalueofthehedgedassetorliabilitythatareattributabletothehedgedrisk
– thegainorlossrelatingtoanyineffectiveportionofahedgeisrecognisedimmediatelyintheIncomestatement
– ifahedgenolongermeetsthecriteriaforhedgeaccounting,theadjustmenttothecarryingamountofahedgeditem,forwhichtheeffectiveinterestmethodisused,isamortisedtotheIncomestatementovertheperioduntiltheforecasttransactionoccurs.
(ii) Cashflowhedges:– theeffectiveportionofchangesinthefairvalueofderivatives
thataredesignatedandqualifyascashflowhedgesisrecognised(includingrelatedtaximpacts)throughOthercomprehensiveincomeintheCashflowhedgereserveinequity.ThebalanceoftheCashflowhedgereserveinrelationtoeachparticularhedgeistransferredtotheIncomestatementintheperiodwhenthehedgeditemaffectsprofitorloss
– thegainorlossrelatingtoanyineffectiveportionofahedgeisrecognisedimmediatelyintheIncomestatement
– hedgeaccountingisdiscontinuedwhenahedginginstrumentexpiresorissoldorterminated,orwhenahedgenolongermeetsthecriteriaforhedgeaccounting.ThecumulativegainorlossexistinginequityatthattimeremainsinequityandisrecognisedwhentheforecasttransactionisultimatelyrecognisedintheIncomestatement
– whenaforecasttransactionisnolongerexpectedtooccur,thecumulativegainorlossthatwasreportedinequityisimmediatelytransferredtotheIncomestatement.
(iii)Netinvestmenthedges:– hedgesofanetinvestmentinaforeignoperation,including
ahedgeofamonetaryitemthatisaccountedforaspartofthenetinvestment,areaccountedforinasimilarwaytocashflowhedges.Gainsandlossesonthehedginginstrumentrelatingtotheeffectiveportionofthehedgearerecognised(includingrelatedtaximpacts)throughOthercomprehensiveincomeintheHedgeofnetinvestmentreserve,whileanygainsorlossesrelatingtotheineffectiveportionofthehedgearerecognisedinprofitorloss.Ondisposaloftheforeignoperation,thecumulativevalueofanysuchgainsorlossesrecogniseddirectlyinequityistransferredtotheIncomestatement.
Derivatives that do not qualify for hedge accountingCertainderivativefinancialinstrumentsdonotqualifyforhedgeaccounting.ChangesinthefairvalueofanyderivativefinancialinstrumentthatdoesnotqualifyforhedgeaccountingarerecognisedintheIncomestatementintheperiodinwhichtheyarise.
Fair value estimationThefairvalueoffinancialinstrumentstradedinactivemarkets(suchaspubliclytradedderivatives)isbasedonquotedmarketpricesatthereportingdate.Thequotedmarketpriceforfinancialassetsisthecurrentbidprice;thequotedmarket
priceforfinancialliabilitiesisthecurrentofferprice.
Thefairvalueoffinancialinstrumentsnottradedinanactivemarket(egover-the-counterderivatives)isdeterminedusingvaluationtechniques.Valuationtechniquesincludenetpresentvaluetechniques,optionpricingmodels,discountedcashflowmethodsandcomparisontoquotedmarketpricesordealerquotesforsimilarinstruments.
(r) Recognition and de-recognition of financial assets and liabilities
FinancialassetsandfinancialliabilitiesarerecognisedatthedatetheAMPgroupbecomesapartytothecontractualprovisionsoftheinstrument.Financialassetsarede-recognisedwhenthecontractualrightstothecashflowsfromthefinancialassetsexpire,oraretransferred.Atransferoccurswhensubstantiallyalltherisksandrewardsofownershipofthefinancialassetarepassedtoanunrelatedthirdparty.Financialliabilitiesarede-recognisedwhentheobligationspecifiedinthecontractisdischarged,cancelledorexpires.
(s) Life insurance contract liabilities Thefinancialreportingmethodologyusedtodeterminethefairvalueoflifeinsurancecontractliabilitiesisreferredtoasmargin on services(MoS).
UnderMoS,theexcessofpremiumreceivedoverclaimsandexpenses(themargin)isrecognisedoverthelifeofthecontractinamannerthatreflectsthepatternofriskacceptedfromthepolicyholder(theservice).TheplannedreleaseofthismarginisincludedinthemovementinlifeinsurancecontractliabilitiesrecognisedintheIncomestatement.
Lifeinsurancecontractliabilitiesareusuallydeterminedusingaprojectionmethod,wherebyestimatesofpolicycashflows(premiums,benefits,expensesandprofitmarginstobereleasedinfutureperiods)areprojectedusingbest-estimateassumptionsaboutthefuture.Theliabilityiscalculatedasthenetpresentvalueoftheseprojectedcashflows.Whenthebenefitsunderalifeinsurancecontractarelinkedtotheassetsbackingit,thediscountrateappliedisbasedontheexpectedfutureearningsrateofthoseassets.Wherethebenefitsarenotlinkedtotheperformanceofthebackingassets,arisk-freediscountrateisused.Therisk-freediscountrateisbasedonthezerocoupongovernmentbondrateandaliquiditymargin,whichdependonthenature,structureandtermsofthecontractliabilities.
Anaccumulationmethodmaybeusedifitproducesresultsthatarenotmateriallydifferentfromthoseproducedbyaprojectionmethod.Amodifiedaccumulationmethodisusedforsomediscretionaryparticipatingbusiness,wherethelifeinsuranceliabilityistheaccumulationofamountsinvestedbypolicyholders,lessfeesspecifiedinthepolicy,plusinvestmentearningsandvestedbenefits,adjustedtoallowforthefactthatcreditingratesaredeterminedbyreferencetoinvestmentincomeoveraperiodofgreaterthanoneyear.Theaccumulationmethodmaybeadjustedtotheextentthatacquisitionexpensesaretoberecoveredfromfuturemarginsbetweenfeesandexpenses.
Allocation of operating profit and unvested policyholder benefitsTheoperatingprofitarisingfromdiscretionaryparticipatingcontractsisallocatedbetweenshareholdersandparticipatingpolicyholdersbyapplyingtheMoSprinciplesinaccordancewiththeLife Insurance Act 1995(Cth)(LifeAct)and,forTheNationalMutualLifeAssociationofAustralasiaLimited(NMLA),theMemorandumofDemutualisation.
Onceprofitisallocatedtoparticipatingpolicyholdersitcanonlybedistributedtothesepolicyholders.Anydistributionofthisprofittoshareholdersisonlyallowedforoverseasbusinesswithspecificapprovaloftheregulators.
For
per
sona
l use
onl
y

AMP 2015 annual report60
Notes to the financial statements for the year ended 31 December 2015
1. Basis of preparation and summary of significant accounting policies continuedProfitallocatedtoparticipatingpolicyholdersisrecognisedintheIncomestatementasanincreaseinpolicyliabilities.Boththeelementofthisprofitthathasnotyetbeenallocatedtospecificpolicyholders(ieunvested)andthatwhichhasbeenallocatedtospecificpolicyholdersbywayofbonusdistributions(ievested)areincludedwithinlifeinsurancecontractliabilities.
Bonusdistributionstoparticipatingpolicyholdersaremerelyachangeinthenatureoftheliabilityfromunvestedtovestedand,assuch,donotaltertheamountofprofitattributabletoshareholders.
Theprinciplesofallocationoftheprofitarisingfromdiscretionaryparticipatingbusinessareasfollows:
(i) Investmentincome(netoftaxandinvestmentexpenses)onretainedearningsinrespectofdiscretionaryparticipatingbusinessisallocatedbetweenpolicyholdersandshareholdersinproportiontothebalancesofpolicyholders’andshareholders’retainedearnings.Thisproportionis,mostly,80%topolicyholdersand20%toshareholders.
(ii) OtherMoSprofitsarisingfromdiscretionaryparticipatingbusinessareallocated80%topolicyholdersand20%toshareholders,withthefollowingexceptions:
– theprofitarisingfromNewZealandcorporatesuperannuationbusinessisapportionedsuchthatshareholdersareallocated15%oftheprofitallocatedtopolicyholders
– theprofitarisinginrespectofpreservationsuperannuationaccountbusinessisallocated92.5%topolicyholdersand7.5%toshareholders
– theprofitsarisingfromNMLA’sdiscretionaryparticipatinginvestmentaccountbusinesswhere100%ofinvestmentprofitisallocatedtopolicyholdersand100%ofanyotherprofitorlossisallocatedtoshareholders,withtheover-ridingprovisionbeingthatatleast80%ofanyprofitandnotmorethan80%ofanylossbeallocatedtopolicyholders’retainedprofitsoftherelevantstatutoryfund
– theunderwritingprofitarisinginrespectofNMLA’sparticipatingbusinesssuperriskbusinessisallocated90%topolicyholdersand10%toshareholders
– forAMPLife,additionaltaxontaxableincometoshareholdersinrespectofAustraliansuperannuationbusinessisallocatedtoshareholdersonly.
(iii) Allprofitsarisingfromnon-participatingbusiness,includingnetinvestmentreturnsonshareholdercapitalandretainedearningsinlifeentities’statutoryfunds(excludingretainedearningsdealtwithin(i)above),areallocatedtoshareholders.
Allocation of expenses within the life insurance entities’ statutory fundsAlloperatingexpensesrelatingtothelifeinsurancecontractandinvestmentcontractactivitiesareapportionedbetweenacquisition,maintenanceandinvestmentmanagementexpenses.Expenseswhicharedirectlyattributabletoanindividuallifeinsurancecontractorinvestmentcontractorproductareallocateddirectlytoaparticularexpensecategory,fund,classofbusinessandproductlineasappropriate.
Whereexpensesarenotdirectlyattributable,theyareappropriatelyapportioned,accordingtodetailedexpenseanalysis,withdueregardfortheobjectiveinincurringthatexpenseandtheoutcomeachieved.TheapportionmentbasishasbeenmadeinaccordancewithActuarialStandardsandonanequitablebasistothedifferentclassesofbusinessinaccordancewiththeLifeAct.
Thecostsapportionedtolifeinsurancecontractsareincludedinthedeterminationofmargindescribedabove.
Investmentmanagementexpensesofthelifestatutoryfundsareclassifiedasoperatingexpenses.Seenote1(aa).
(t) Investment contract liabilitiesAninvestmentcontractconsistsofafinancialinstrumentandaninvestmentmanagementserviceselement,bothofwhicharemeasuredatfairvalue.Withtheexceptionoffixedretirement-incomepolicies,theresultingliabilitytopolicyholdersiscloselylinkedtotheperformanceandvalueoftheassets(aftertax)thatbackthoseliabilities.Thefairvalueofsuchliabilitiesisthereforethesameasthefairvalueofthoseassets(aftertaxchargedtothepolicyholders)exceptwhereaccountingstandardspreventthoseassetsfrombeingmeasuredatfairvalue.
Forfixedretirementincomepolicies,thefinancialinstrumentelementoftheliabilityisthefairvalueofthefixedretirementincomepayments,beingtheirnetpresentvalueusingafairvaluediscountrate.Thefairvalueoftheassociatedmanagementserviceselementisthenetpresentvalue,usingafairvaluediscountrate,ofallexpensesassociatedwiththeprovisionofservicesandanyprofitmarginsthereon.
(u) Contributed equityIssued capitalIssuedcapitalinrespectofordinarysharesisrecognisedasthefairvalueofconsiderationreceivedbytheparententity.Incrementalcostsdirectlyattributabletotheissueofcertainnewsharesarerecognisedinequityasadeduction,netoftax,fromtheproceeds.
Treasury sharesTheAustralianSecuritiesandInvestmentsCommission(ASIC)hasgrantedrelieffromrestrictionsintheCorporations Act 2001toallowAMP’slifeinsuranceentitiestoholdandtradesharesinAMPLimitedaspartofthepolicyholderfunds’investmentactivities.Theseshares(definedbyAustralianAccountingStandardsastreasury shares)areheldonbehalfofpolicyholdersand,asaresult,theAMPlifeinsuranceentities’statutoryfundsalsorecogniseacorrespondingliabilitytopolicyholders.
UnderAustralianAccountingStandards,theAMPgroupcannotrecognisetreasurysharesintheconsolidatedStatementoffinancialposition.Theseassets,plusanycorrespondingIncomestatementfairvaluemovementontheassetsanddividendincome,areeliminatedwhentheAMPlifeinsuranceentities’statutoryfundsareconsolidatedintotheAMPgroup.Thecostoftheinvestmentinthesharesisdeductedtoarriveattheamountofcontributedequity.
However,thecorrespondinginvestmentcontractandlifeinsurancecontractliabilities,andrelatedIncomestatementchangeintheliabilities,remainonconsolidation.AttheAMPgroupconsolidatedlevel,thismismatchresultsinpolicyholderassetmovementsimpactingtheprofitattributabletoshareholdersofAMPLimited.
TheAMPFoundationalsoholdsAMPLimitedshares.Theseassets,plusanycorrespondingIncomestatementfairvalueamountontheassetsandanydividendincome,arealsoeliminatedonconsolidationoftheAMPFoundationintoAMPgroup.AsthenetassetsandprofitoftheAMPFoundationTrustarefullyattributabletonon-controllinginterests,thishasnoimpactonthenetassetsorprofitattributabletotheshareholdersofAMPLimited.
(v) Foreign currency transactionsFunctional and presentation currencyTheconsolidatedfinancialreportispresentedinAustraliandollars(thepresentationcurrency).ItemsincludedinthefinancialstatementsforeachoftheAMPgroupentitiesaremeasuredusingthecurrencyoftheprimaryeconomic
For
per
sona
l use
onl
y

AMP 2015 annual report 61
1. Basis of preparation and summary of significant accounting policies continuedenvironmentinwhichtheentityoperates(thefunctionalcurrency).ThefunctionalcurrencyoftheparententityisAustraliandollars.
Transactions and balancesIncomeandexpenseitemsdenominatedinacurrencyotherthanthefunctionalcurrencyaretranslatedatthespotexchangerateatthedateofthetransaction.Monetaryassetsandliabilitiesdenominatedinforeigncurrenciesaretranslatedattherateofexchangerulingatthereportingdate,withexchangegainsandlossesrecognisedintheIncomestatement.
Non-monetaryitemsmeasuredatfairvalueinaforeigncurrencyaretranslatedusingtheexchangeratesatthedatewhenthefairvaluewasdetermined.
Translation of controlled entitiesWherethefunctionalcurrencyofacontrolledentityisnotthepresentationcurrency,thetransactionsandbalancesofthatentityaretranslatedasfollows:– Incomeandexpensesaretranslatedataverageexchange
rates,unlessthisisnotareasonableapproximationofthecumulativeeffectoftheratesprevailingonthetransactiondates.Inthiscase,incomeandexpensesaretranslatedatthedatesofthetransactions.
– Assetsandliabilitiesaretranslatedattheclosingrateatthereportingdate.
– AllresultingexchangedifferencesarerecognisedinOthercomprehensiveincomeintheforeigncurrencytranslationreserve.
Whenaforeignoperationissold,thecumulativeamountintheforeigncurrencytranslationreserverelatingtothatoperationisrecognisedintheIncomestatementaspartofthegainorlossonsale.Ifaportionoftheoperationissold,theproportionateshareofthecumulativeamountisrecognised.
(w) Insurance premium and related revenueLife insurance contractsLifeinsurancecontractpremiumsareseparatedintotheirrevenueanddepositcomponents.Premiumamountsearnedbybearinginsurancerisksarerecognisedasrevenue.Otherpremiumamountsreceived,whichareinthenatureofdeposits,arerecognisedasanincreaseinlifeinsurancecontractliabilities.
Premiumswithnoduedateorfixedamountarerecognisedonacash-receivedbasis.Premiumswitharegularduedatearerecognisedonanaccrualsbasis.UnpaidpremiumsareonlyrecognisedduringthedaysofgraceorwheresecuredbythesurrendervalueofthelifeinsurancecontractandarereportedasoutstandingpremiumsandclassifiedasreceivablesintheStatementoffinancialposition.
Investment contractsThereisnopremiumrevenueinrespectofinvestmentcontracts.Amountsreceivedfrompolicyholdersinrespectofinvestmentcontractscomprise:– originationfees,advicefeesandongoinginvestment
managementfees.Seenote1(x)– amountscrediteddirectlytoinvestmentcontractliabilities.
Seenote1(t).
(x) Fee and other revenueFeesarechargedtocustomersinconnectionwithinvestmentcontractsandotherfinancialservicescontracts.Revenueisrecognisedasservicesareprovided.Insomecases,servicesareprovidedattheinceptionofthecontract,whileotherservicesareperformedoverthelifeofthecontract.
Aninvestmentcontractconsistsofafinancialinstrumentandaninvestmentmanagementserviceselement.Thepaymentbythepolicyholderincludestheamounttofundthefinancial
instrumentandafeefortheoriginationofthecontract.Inmanycases,thatoriginationfeeisbasedonamountspaidtofinancialplannersforprovidinginitialadvice.Thefinancialinstrumentisclassifiedasaninvestmentcontractandismeasuredatfairvalue.Seenote1(t).
Therevenuethatcanbeattributedtotheoriginationserviceisrecognisedatinception.Anyamountspaidtofinancialplannersarealsorecognisedasanexpenseatthattime.Seenote1(aa).
Feesforongoinginvestmentmanagementservicesandotherservicesprovidedarechargedonaregularbasis,usuallydaily,andarerecognisedastheserviceisprovided.
FeeschargedforperformingasignificantactinrelationtofundsmanagedbytheAMPgrouparerecognisedasrevenuewhenthatacthasbeencompleted.
(y) Investment gains or lossesDividendandinterestincomeisrecognisedintheIncomestatementonanaccrualsbasiswhentheAMPgroupobtainscontroloftherighttoreceivetherevenue.
Netrealisedandunrealisedgainsandlossesincluderealisedgainsandlosses(beingthechangeinvaluebetweenthepreviouslyreportedvalueandtheamountreceivedonde-recognitionoftheassetorliability),andunrealisedgainsandlosses(beingchangesinthefairvalueoffinancialassetsandinvestmentpropertyrecognisedintheperiod).
Rentsraisedareontermsinaccordancewithindividualleases.Certaintenantallowancesthatareclassifiedasleaseincentives,suchasrent-freeperiods,fit-outsandupfrontpayments,arecapitalisedandamortisedoverthetermofthelease.Theaggregatecostofincentivesisrecognisedasareductiontorevenuefromrentovertheleaseterm.
(z) Insurance claims and related expensesLife insurance contractsLifeinsurancecontractclaimsareseparatedintotheirexpenseandwithdrawalcomponents.Thecomponentthatrelatestothebearingofrisksistreatedasanexpense.Otherclaimamounts,whichareinthenatureofwithdrawals,arerecognisedasadecreaseinlifeinsurancecontractliabilities.
Claimsarerecognisedwhenaliabilitytoapolicyholderunderalifeinsurancecontracthasbeenestablishedoruponnotificationoftheinsuredevent,dependingonthetypeofclaim.
Investment contractsThereisnoclaimsexpenseinrespectofinvestmentcontracts.Amountspaidtopolicyholdersinrespectofinvestmentcontractsarewithdrawalsandarerecognisedasadecreaseininvestmentcontractliabilities.Seenote1(t).
(aa) Operating expensesAlloperatingexpenses,otherthanthoseallocatedtolifeinsurancecontracts(seenote1(s)),areexpensedasincurred.
ExpensesofcontrolledentitiesoftheAMPlifeinsuranceentities’statutoryfundsrepresentthebusinesscostsofthoseentitiesandareconsolidatedintotheresultsoftheAMPgroup.
Themajorityofinvestmentcontractsissuedresultinpaymentstoexternalserviceandadviceproviders.Wheretheamountpaidequatestoafeechargedtopolicyholdersfortheprovisionofadvice,theamountisexpensedeitheratinceptionorovertheperiodofthecontractconsistentwiththebasisforrecognisingthefeerevenueontherespectivecontracts.Seenote1(t).
Operating lease paymentsOperatingleasepaymentsarerecognisedasanexpenseintheIncomestatementonastraight-linebasisovertheleasetermorothersystematicbasisrepresentativeofthepatternsofthe
For
per
sona
l use
onl
y

AMP 2015 annual report62
Notes to the financial statements for the year ended 31 December 2015
1. Basis of preparation and summary of significant accounting policies continuedbenefitsobtained.Operatingincentivesarerecognisedasaliabilitywhenreceivedandsubsequentlyreducedbyallocatingleasepaymentsbetweenrentalexpenseandreductionoftheliability.
(bb) Finance costsFinance costs include:(i) borrowingcosts:– interestonbankoverdrafts,borrowingsandsubordinated
debt– amortisationofdiscountsorpremiumsrelatedto
borrowings(ii) exchangedifferencesarisingfromforeigncurrency
borrowingstotheextentthattheyareregardedasanadjustmenttointerestcosts
(iii) changesinthefairvalueofderivativehedgestogetherwithanychangeinthefairvalueofthehedgedassetsorliabilitiesthataredesignatedandqualifyasfairvaluehedges,foreignexchangegainsandlossesandotherfinancingrelatedamounts.Theaccountingpolicyforderivativesissetoutinnote1(q).
Borrowingcostsarerecognisedasexpenseswhenincurred.
(cc) Share-based paymentsTheAMPgroupissuesperformancerights,restrictedsharesandotherequityinstrumentstoemployeesasaformofequity-settledshare-basedcompensation.Equity-settledshare-basedcompensationtoemployeesisconsideredtobeanexpenseinrespectoftheservicesreceivedandisrecognisedintheIncomestatementoverthevestingperiodoftheinstrumentwithacorrespondingamountintheshare-basedpaymentreservewithinequity.
Theexpenseisbasedonthefairvalueofeachgrant,measuredatthedateofthegrant.Forperformancerightsandsimilarinstruments,thefairvalueisdeterminedbyanexternalvaluer.Thefairvaluecalculationtakesintoconsiderationanumberoffactors,includingthelikelihoodofachievingmarket-basedvestingconditionssuchastotalshareholderreturn.Thefairvaluedeterminedatgrantdateisnotalteredoverthevestingperiod.Non-marketvestingconditionsareincludedinassumptionsaboutthenumberofinstrumentsthatareexpectedtovest.Ateachreportingdate,theAMPgroupreviewsitsestimatesofthenumberofinstrumentsthatareexpectedtovest.AnychangestotheoriginalestimatesarerecognisedintheIncomestatementandtheshare-basedpaymentreserve,overtheremainingvestingperiod.
Wherethetermsofanequity-settledshare-basedpaymentaremodifiedandtheexpenseincreasesasaresultofthemodification,theincreaseisrecognisedovertheremainingvestingperiod.Whenamodificationreducestheexpense,thereisnoadjustmentandthepre-modificationcostcontinuestoberecognised.
Expensesforawardsthatdonotultimatelyvestarereversedintheperiodinwhichtheinstrumentlapses,exceptforawardswherevestingisconditionaluponamarketcondition,inwhichcasenoreversalisrecognised.
Wheninstrumentsvest,sharesarepurchasedon-marketandtransferredtotheemployee.Thecostofthepurchaseisrecognisedintheshare-basedpaymentreserve.
(dd) Superannuation funds TheAMPgroupoperatessuperannuationfundsthatprovidebenefitsforemployeesandtheirdependantsontheresignation,retirement,disabilityordeathoftheemployee.Thefundshavebothdefinedcontributionanddefinedbenefitsections.Refertonote27forfurtherinformationonthefunds.
ThecontributionspaidandpayablebyAMPgrouptodefinedcontributionsfundsarerecognisedintheIncomestatementasanoperatingexpensewhentheyfalldue.Prepaidcontributionsarerecognisedasanassettotheextentthatacashrefundorareductioninthefuturepaymentsisavailable.
ForthedefinedbenefitsectionsofsuperannuationfundsoperatedbytheAMPgroup,theAMPgrouprecognisesthenetdeficitorsurpluspositionofeachfundintheStatementoffinancialposition,asdefinedbyAASB119Employee Benefits.Thisdoesnotrepresentanassessmentofthefunds’fundingpositions.Thedeficitorsurplusismeasuredasthedifferencebetweenthefairvalueofthefunds’assetsandthediscounteddefinedbenefitobligationsofthefunds,usingdiscountratesdeterminedwithreferencetomarketyieldsattheendofthereportingperiodonhighqualitycorporatebondsor,incountrieswherethereisnodeepmarketinsuchbonds,usingmarketyieldsattheendoftheperiodongovernmentbonds.
Aftertakingintoaccountanycontributionspaidintothedefinedbenefitfundsduringtheperiod,movementsinthenetsurplusordeficitofeachfund,exceptactuarialgainsandlosses,arerecognisedintheIncomestatement.Actuarialgainsandlossesarisingfromexperienceadjustmentsandchangesinactuarialassumptionsovertheperiodarerecognised(netoftax)directlyinretainedearningsthroughOthercomprehensiveincome.
Contributionspaidintodefinedbenefitfundsarerecognisedasreductionsinthedeficit.
(ee) Earnings per shareBasicearningspershareiscalculatedbydividingtheconsolidatedprofitattributabletoshareholdersofAMPLimited,bytheweightedaveragenumberofordinarysharesoutstandingduringtheperiod.Theweightedaveragenumberoftreasurysharesheldduringtheperiodisdeductedincalculatingtheweightedaveragenumberofordinarysharesoutstanding.
Dilutedearningspershareiscalculatedbydividingtheprofitusedinthedeterminationofbasicearningspersharebytheweightedaveragenumberofsharesoutstandingduringtheperiodadjustedforpotentialordinarysharesconsideredtobedilutive.Potentialordinarysharesarecontractssuchasoptionsandperformancerightsthatmayentitletheholdertoordinaryshares.Thesepotentialordinarysharesareconsidereddilutivewhentheirconversionintoordinaryshareswouldbelikelytocauseareductioninearningspershare.Theweightedaveragenumberoftreasurysharesheldduringtheperiodisdeductedincalculatingtheweightedaveragenumberofordinarysharesoutstandingfordilutedearningspershare.
(ff) Disposal groups held for saleAdisposal groupisagroupofassetstobedisposedoftogetherasagroupinasingletransaction,andliabilitiesdirectlyassociatedwiththoseassetsthatwillbetransferredinthetransaction.Disposalgroupsareclassifiedasheld-for-saleiftheircarryingamountswillberecoveredprincipallythroughasaletransactionratherthanthroughcontinuinguse.Thecriteriaforheld-for-saleclassificationisregardedasmetonlywhenthesaleishighlyprobable,thedisposalgroupisavailableforimmediatesaleinitspresentcondition,managementiscommittedtoaplantosellthegroupandasaleisexpectedtobecompletedwithinayear.
Disposalgroupsclassifiedasheld-for-salearemeasuredattheloweroftheircarryingamountandfairvaluelesscostsofdisposal.AssetsandliabilitiesofdisposalgroupsareshownseparatelyfromotherassetsandliabilitiesintheStatementoffinancialposition.
For
per
sona
l use
onl
y
AMP 2015 annual report 63
2. Significant accounting judgements, estimates and assumptionsThemakingofjudgements,estimatesandassumptionsisanecessarypartofthefinancialreportingprocessandthesejudgements,estimatesandassumptionscanhaveasignificanteffectonthereportedamountsinthefinancialstatements.Estimatesandassumptionsaredeterminedbasedoninformationavailabletomanagementatthetimeofpreparingthefinancialreportandactualresultsmaydifferfromtheseestimatesandassumptions.Haddifferentestimatesandassumptionsbeenadopted,thismayhavehadasignificantimpactonthefinancialstatements.Significantaccountingjudgements,estimatesandassumptionsarere-evaluatedateachreportingperiodinthelightofhistoricalexperienceandchangestoreasonableexpectationsoffutureevents.Significantaccountingjudgements,estimatesandassumptionsincludebutarenotlimitedtothefollowing:
(a) ConsolidationEntitiesareincludedwithintheconsolidatedfinancialstatementsoftheAMPgroupwhereAMPLimitedhascontrolovertheentities.Controlarisesfromexposure,orrights,tovariablereturnsfrominvolvementwithanentity,whereAMPLimitedhastheabilitytoaffectthosereturnsthroughitspowerovertheentity.Judgementisappliedbymanagementinassessingwhethercontrolexists.
JudgementisappliedindeterminingtherelevantactivitiesofeachentityanddeterminingwhetherAMPLimitedhaspowerovertheseactivities.Thisinvolvesassessmentofthepurposeanddesignoftheentityandidentificationoftheactivitieswhichsignificantlyaffectthatentity’sreturnsandhowdecisionsaremadeaboutthoseactivities.Inassessinghowdecisionsaremade,managementconsidersvotingandvetorights,contractualarrangementswiththeentityorotherparties,andanyrightsorabilitytoappoint,removeordirectkeymanagementpersonnelorentitiesthathavetheabilitytodirecttherelevantactivitiesoftheentity.Considerationisalsogiventothepracticalabilityofotherpartiestoexercisetheirrights.
JudgementisalsoappliedinidentifyingthevariablereturnsofeachentityandassessingAMPLimited’sexposuretothesereturns.Variablereturnsincludedistributions,exposuretogainsorlossesandfeesthatmayvarywiththeperformanceofanentity.
(b) Fair value of investments in financial assetsTheAMPgroupmeasuresinvestmentsinfinancialassets,otherthanthoseheldbyAMPBankandloansandadvancestoadvisers,atfairvalue.Whereavailable,quotedmarketpricesforthesameorsimilarinstrumentsareusedtodeterminefairvalue.Wherethereisnomarketpriceavailableforaninstrument,avaluationtechniqueisused.Managementappliesjudgementinselectingvaluationtechniquesandsettingvaluationassumptionsandinputs.Furtherdetailonthedeterminationoffairvalueoffinancialinstrumentsissetoutinnote23.
(c) Fair values of investment properties and owner-occupied property
TheAMPgroupmeasuresinvestmentpropertiesatfairvaluethroughprofitorloss.Owner-occupiedpropertyismeasuredatfairvalueatlastvaluationdatelesssubsequentdepreciation.Thevaluationofinvestmentpropertiesandowner-occupiedpropertyrequiresjudgementtobeappliedinselectingappropriatevaluationtechniquesandsettingvaluationassumptions.TheAMPgroupengagesindependentregisteredvaluerstovalueeachofitsinvestmentpropertiesonarollingannualbasis.Furtherdetailonthedeterminationoffairvaluesofinvestmentpropertiesissetoutinnote11.
(d) Acquired intangible assetsSubjecttosomeexceptions,accountingstandardsrequiretheassetsandliabilitiesofbusinessesacquiredthroughabusinesscombinationtobemeasuredattheiracquisitiondatefairvalues.Managementappliesjudgementinselectingvaluationtechniquesandsettingvaluationassumptionstodeterminetheacquisitiondatefairvaluesandtoestimatetheusefullivesoftheseassets.Note25(d)providesdetailsofintangiblesacquiredthroughbusinesscombinationsduringtheperiod.
Accountingstandardsrequiremanagementtoassess,ateachreportingperiod,whetherthereareanyindicatorsofimpairmentinrelationtothecarryingvalueofintangibleassets.Whereanimpairmentindicatorisidentified,andatleastannuallyforassetswithindefiniteusefullives,therecoverableamountoftheassetmustbedeterminedandcomparedtothecarryingamount.
Judgementisappliedbymanagementinassessingwhetherthereareanyimpairmentindicatorsand,whererequired,indeterminingtherecoverableamount.Forfurtherdetailsonimpairmentofintangibles,refertonote13.
(e) Goodwill Goodwillisrequiredtobeallocatedtocash-generatingunitsandtestedatleastannuallyforimpairment.Managementappliesjudgementindeterminingcash-generatingunitsandallocatingthegoodwillarisingfrombusinesscombinationstothesecash-generatingunits.Impairmentisassessedannuallybydeterminingtherecoverableamountofeachcash-generatingunitwhichhasagoodwillbalance.Managementappliesjudgementinselectingvaluationtechniquesandsettingvaluationassumptionstodeterminetherecoverableamount.Note13setsoutfurtherinformationontheimpairmenttestingofgoodwill.
(f) TaxTheAMPgroupissubjecttotaxesinAustraliaandotherjurisdictionswhereithasoperations.TheapplicationoftaxlawtothespecificcircumstancesandtransactionsoftheAMPgrouprequirestheexerciseofjudgementbymanagement.Thetaxtreatmentsadoptedbymanagementinpreparingthefinancialstatementsmaybeimpactedbychangesinlegislationandinterpretationsorbesubjecttochallengebytaxauthorities.
Judgementisalsoappliedbymanagementindeterminingtheextenttowhichtherecoveryofcarriedforwardtaxlossesisprobableforthepurposeofmeetingthecriteriaforrecognitionasdeferredtaxassets.Note7setsoutinformationoncarriedforwardtaxlossesforwhichadeferredtaxassethasnotbeenrecognised.
(g) ProvisionsAprovisionisrecognisedforitemswhere:theAMPgrouphasapresentobligationarisingfromapastevent;itisprobablethatanoutflowofeconomicresourceswillberequiredtosettletheobligation;andareliableestimatecanbemadeoftheamountoftheobligation.Theprovisionismeasuredasthebestestimateoftheexpenditurerequiredtosettlethepresentobligation.Managementappliesjudgementinassessingwhetheraparticularitemsatisfiestheabovecriteriaandindeterminingthebestestimate.Note15setsoutfurtherinformationonprovisions.
(h) Life insurance contract liabilitiesThemeasurementofinsurancecontractliabilitiesisdeterminedusingtheMoSmethodology.Thedetermination
For
per
sona
l use
onl
y

AMP 2015 annual report64
Notes to the financial statements for the year ended 31 December 2015
3. Segment information
2. Significant accounting judgements, estimates and assumptions continuedoftheliabilityamountsinvolvesjudgementinselectingthevaluationmethodsandprofitcarriersforeachtypeofbusinessandsettingvaluationassumptions.Thedeterminationissubjectiveandrelativelysmallchangesinassumptionsmayhaveasignificantimpactonthereportedprofit.Theboardofeachofthelifeentitiesisresponsibleforthesejudgementsandassumptions,aftertakingadvicefromtheappointedactuary.Furtherdetailonthedeterminationofinsurancecontractliabilitiesissetoutinnote20.
(i) Investment contract liabilitiesInvestmentcontractliabilitiesaremeasuredatfairvalue.Forthemajorityofcontracts,thefairvalueisdeterminedbasedonpublishedunitpricesandthefairvalueofbackingassets,anddoesnotgenerallyrequiretheexerciseofjudgement.ForfixedincomeproductsandtheNorthcapitalguarantee,fairvalueisdeterminedusingvaluationmodels.Judgementisappliedinselectingthevaluationmodelandsettingthevaluationassumptions.Furtherdetailsoninvestmentcontractliabilitiesaresetoutinnote21.
( j) Defined benefit plan liabilitiesThedefinedbenefitplanliabilitiesoftheAMPgrouparemeasuredasthedifference,foreachfund,betweenthefairvalueofthefund’sassetsandtheactuariallydeterminedpresentvalueoftheobligationtofundmembers.AASB119Employee Benefitsrequiresdefinedbenefitplanliabilitiestobemeasuredusingdiscountratesdeterminedwithreferencetomarketyieldsattheendofthereportingperiodorhighqualitycorporatebondsor,incountrieswherethereisnodeepmarketinsuchbonds,usingmarketyieldsongovernmentbonds.Judgementisappliedinassessingwhetherthereisadeepmarketinhighqualitycorporatebondsandintheselectionofgovernmentbondsusedtodeterminetheyield.
Thedeterminationofthefairvalueofthefund’sassetsisalsosubjecttotheotherjudgements,estimatesandassumptionsdiscussedatnote2(b)above.Thecalculationoftheobligationtofundmembersrequiresjudgementtobeappliedinthesettingofactuarialassumptions.Furtherdetailonthedeterminationofdefinedbenefitplanliabilitiesissetoutinnote27.
(a) Segments – backgroundOperatingsegmentshavebeenidentifiedbasedonseparatefinancialinformationthatisregularlyreviewedbythechiefoperatingdecisionmaker(CODM).ThetermCODMreferstothefunctionperformedbythechiefexecutiveofficerandhisimmediateteam,asateam,inassessingperformanceanddeterminingtheallocationofresources.Theoperatingsegmentsareidentifiedaccordingtothenatureofprofitgeneratedandservicesprovided.Segmentinformationinthisnoteisreportedseparatelyforeachoperatingsegment.TheAMPgroupevaluatestheperformanceofsegmentsonapost-taxoperatingearningsbasis.
SegmentinformationisnotreportedforactivitiesoftheAMPgroupofficecompaniesasitisnotthefunctionofthesedepartmentstoearnrevenueandanyrevenuesearnedareonlyincidentaltotheactivitiesoftheAMPgroup.
AssetsegmentinformationhasnotbeendisclosedbecausethebalancesarenotprovidedtotheCODMforthepurposesofevaluatingsegmentperformanceanddecidingtheallocationofresourcestosegments.
(b) Description of segmentsAMPcomprisesthefollowingbusinessunits:
Australian wealth management (WM)–financialadviceservices(throughalignedandownedadvicebusinesses),platformadministration(includingSMSF),unit-linkedsuperannuation,retirementincomeandmanagedinvestmentproductsbusiness.Superannuationproductsincludepersonalandemployersponsoredplans.
AMP Capital–adiversifiedinvestmentmanagerwithagrowinginternationalpresence,providinginvestmentservicesfordomesticandinternationalcustomers.AMPCapitalmanagesinvestmentsacrossmajorasset
classesincludingequities,fixedinterest,property,infrastructureandmulti-managerandmulti-assetfunds.AMPCapitalalsoprovidescommercial,industrialandretailpropertymanagementservices.
AMPCapitalandMitsubishiUFJTrustandBankingCorporation(MUTB)haveastrategicbusinessandcapitalalliance,withMUTBholdinga15%ownershipinterestinAMPCapital.
InNovember2013,AMPCapitalestablishedafundsmanagementcompanyinChinawithChinaLifecalledChinaLifeAMPAssetManagementCompanyLimited(CLAMP).AMPCapitalisafoundingshareholder,holdinga15%stake,withthebalanceheldbyChinaLifeAssetManagementCompany,asubsidiaryofChinaLife.
Australian wealth protection (WP)–includesindividualandgroupterm,disabilityandincomeprotectioninsuranceproducts.Productscanbebundledwithasuperannuationproductorheldindependentlyofsuperannuation.
AMP Bank–Australianretailbankofferingresidentialmortgages,deposits,transactionbankingandSMSFproducts.Italsohasaportfolioofpracticefinanceloans.AMPBankdistributesthroughAMP’saligneddistributionnetworkaswellasthirdpartybrokers,anddirecttoretailcustomersviaphoneandonline.
New Zealand financial services (NZFS)–ariskinsurancebusinessandmaturebook(traditionalparticipatingbusiness),withagrowingwealthmanagementbusinessdrivenbyKiwiSaver.
Australian mature (Mature)–abusinesscomprisingproductswhicharelargelyclosedtonewbusinessandareinrun-off.ProductswithinAustralianmatureincludewholeoflife,endowment,investment-linked,investmentaccount,RetirementSavingsAccount,EligibleRolloverFund,annuities,insurancebonds,personalsuperannuationandguaranteedsavingsaccounts.
For
per
sona
l use
onl
y

AMP 2015 annual report 65
3. Segment information continued
WM$m
AMP Capital2
$mWP3
$mAMP Bank
$mNZFS3
$mMature3
$m
Total operating segments
$m
(c) Segment profit2015Segment profit after income tax1 410 138 185 104 120 158 1,115
Other segment information4 Externalcustomerrevenue 1,396 322 185 281 120 158 2,462Intersegmentrevenue5 120 254 – – – – 374Incometaxexpense 173 61 79 44 47 68 472Depreciationandamortisation 68 11 20 – 7 6 112
2014 Segment profit after income tax1 374 115 188 91 110 174 1,052
Other segment information4 Externalcustomerrevenue 1,525 254 188 246 110 174 2,497Intersegmentrevenue5 120 258 – – – – 378Incometaxexpense 158 50 81 39 43 75 446Depreciationandamortisation 60 11 17 – 7 6 101
1 SegmentprofitafterincometaxdiffersfromProfitattributabletoshareholdersofAMPLimitedduetotheexclusionofthefollowingitems: i) groupofficecosts ii) investmentreturnonshareholderassetsinvestedinincomeproducinginvestmentassets iii) interestexpenseoncorporatedebt iv) AMPAAPHintegrationcosts,businessefficiencyprogramcostsandotheritems(refertonote3(d)forfurtherdetails).Theseitemsdonotreflect
theunderlyingoperatingperformanceoftheoperatingsegments,and v) accountingmismatches,marketadjustments(annuityfairvalueandriskproducts)andamortisationofAMPAAPHacquiredintangibleassets.2 AMPCapitalsegmentrevenueisreportednetofexternalinvestmentmanagerfeespaidinrespectofcertainassetsundermanagement.
AMPCapitalsegmentprofitisreportednetof15%attributabletoMUTB.OtherAMPCapitalsegmentinformationisreportedbeforedeductionsofminorityinterests.
3 StatutoryreportingrevenueforWP,NZFSandMatureincludespremiumandinvestmentgainsandlosses.However,forsegmentreporting,externalcustomerrevenueisoperatingearningswhichrepresentsgrossrevenuelessclaims,expenses,movementininsurancecontractliabilitiesandtaxrelatingtothosesegments.
4 Othersegmentinformationexcludesrevenue,expensesandtaxrelatingtoassetsbackingpolicyholderliabilities.5 Intersegmentrevenuerepresentsoperatingrevenuebetweensegmentspricedonanarm’s-lengthbasis.
For
per
sona
l use
onl
y

AMP 2015 annual report66
Notes to the financial statements for the year ended 31 December 2015
3. Segment information continued
2015$m
2014 $m
(d) Reconciliation of segment profit after tax Australianwealthmanagement 410 374AMPCapital 138 115Australianwealthprotection 185 188AMPBank 104 91NewZealandfinancialservices 120 110Australianmature 158 174
Business unit operating earnings 1,115 1,052Groupofficecosts (61) (62)
Total operating earnings 1,054 990Underlyinginvestmentincome1 125 132Interestexpenseoncorporatedebt (59) (77)
Underlying profit 1,120 1,045Otheritems2 (3) 7AMPAAPHintegrationcosts – (20)Businessefficiencyprogramcosts (66) (100)AmortisationofAMPAAPHacquiredintangibleassets (80) (89)
Profit before market adjustments and accounting mismatches 971 843Marketadjustment–investmentincome1 9 42Marketadjustment–annuityfairvalue3 34 6Marketadjustment–riskproducts4 2 11Accountingmismatches5 (44) (18)
Profit attributable to shareholders of AMP Limited 972 884Profitattributabletonon-controllinginterests 741 87
Profit for the year 1,713 971
(e) Reconciliation of segment revenue Totalsegmentrevenue 2,836 2,875Addrevenueexcludedfromsegmentrevenue – Investmentgainsand(losses)–shareholdersandpolicyholders(excludingAMPBankinterestrevenue) 7,733 11,414– Revenueofinvestmententitiescontrolledbythelifeentities’statutoryfundswhichcarryout
businessoperationsunrelatedtothecorewealthmanagementoperationsoftheAMPgroup 35 67– Otherrevenue 52 59
Addbackexpensesnettedagainstsegmentrevenue – Claims,expenses,movementininsurancecontractliabilitiesandtaxrelatingto
Australianwealthprotection,AustralianmatureandNewZealandfinancialservices 2,002 1,955– InterestexpenserelatedtoAMPBank 525 594– Externalinvestmentmanagerandadviserfeespaidinrespectofcertainassetsundermanagement 1,240 1,014Removeintersegmentrevenue (374) (378)
Total revenue6 14,049 17,600
1 Underlyinginvestmentincomeconsistsofinvestmentincomeonshareholderassetsinvestedinincomeproducinginvestmentassets(asopposedtoincomeproducingoperatingassets)normalisedinordertobringgreaterclaritytotheresultsbyeliminatingtheimpactofshort-termmarketvolatilityonunderlyingperformance.Underlyingreturnsaresetbasedonlong-termexpectedreturnsforeachassetclass,exceptforashort-termreturn,equivalenttoaone-yeargovernmentbond,setannuallyfortheimplicitdeferredacquisitioncosts(DAC)componentofshareholderassets.Marketadjustment–investmentincomeistheexcess(shortfall)betweentheunderlyinginvestmentincomeandtheactualreturnonshareholderassetsinvestedinincomeproducinginvestmentassets.
2 Otheritemslargelycomprisethenetofone-offandnon-recurringrevenuesandcosts,includingthecostofimplementingsignificantregulatorychanges.
3 Marketadjustment–annuityfairvaluerelatestothenetimpactofinvestmentmarketsonAMP’sannuityportfolio.4 Marketadjustment–riskproductsrelatestothenetimpactofchangesinmarketeconomicassumptions(bondyieldsandCPI)onthevaluation
ofriskinsuranceliabilities.5 UnderAustralianAccountingStandards,someassetsheldonbehalfofthepolicyholders(andrelatedtaxbalances)arerecognisedinthefinancial
statementsatdifferentvaluestothevaluesusedinthecalculationoftheliabilitytopolicyholdersinrespectofthesameassets.Therefore,movementsinthesepolicyholderassetsresultinaccountingmismatcheswhichimpactprofitattributabletoshareholders.ThesedifferenceshavenoimpactontheoperatingearningsoftheAMPgroup.
6 RevenueaspertheIncomestatementof$14,049m(2014:$17,600m)comprisesPremiumsandrelatedrevenue$2,465m(2014:$2,427m),Feerevenue$2,941m(2014:$2,790m),Otherrevenue$87m(2014:$126m),Investmentgainsand(losses)gainsof$8,529m(2014:gainsof$12,244m)andShareofprofitor(loss)ofassociatesaccountedforusingtheequitymethod$27m(2014:$13m).
For
per
sona
l use
onl
y

AMP 2015 annual report 67
4. Income
Consolidated Parent
2015$m
2014$m
2015$m
2014$m
(a) Life insurance premium and related revenue Lifeinsurancecontractpremiumrevenue 2,337 2,290 – –Reinsurancerecoveries 128 137 – –
Total life insurance premium and related revenue 2,465 2,427 – –
(b) Fee revenue Investmentmanagementandoriginationfees 2,197 2,065 – –Financialadvisoryfees 744 725 – –Servicefees–subsidiaries – – 11 14
Total fee revenue 2,941 2,790 11 14
(c) Other revenue InvestmententitiescontrolledbytheAMPlifeinsuranceentities’statutoryfunds1 35 67 – –Otherentities 52 59 – –
Total other revenue 87 126 – –
1 OtherrevenueofinvestmententitiescontrolledbytheAMPlifeinsuranceentities’statutoryfundswhichcarryoutbusinessoperationsunrelatedtothecorewealthmanagementoperationsoftheAMPgroup.
5. Investment gains and (losses)
Consolidated Parent
2015$m
2014$m
2015$m
2014$m
Investment gains and (losses) Interest1 – subsidiaries – – 16 17– otherentities 2,290 2,468 1 1
Dividendsanddistributions – subsidiaries – – 876 578– associatedentitiesnotequityaccounted 1,267 1,494 – –– otherentities 4,886 5,472 – –
Rentalincome 46 505 – –Netrealisedandunrealisedgainsand(losses)2 40 2,305 – 203
Total investment gains and (losses)3 8,529 12,244 893 799
1 Interestincludesinterestincomefromfinancialassetsdesignatedatfairvaluethroughprofitorlossuponinitialrecognition,withtheexceptionof$758m(2014:$783m)interestincomefromheldtomaturityinvestmentsandloansandadvancesinbankingoperations,whicharemeasuredatamortisedcost.
2 Netrealisedandunrealisedgainsandlossesfortheconsolidatedgrouppredominantlyconsistofgainsandlossesonfinancialassetsandfinancialliabilitiesdesignatedatfairvaluethroughprofitorlossuponinitialrecognition.
3 Investmentgainsandlossesincludeamountsattributabletoshareholders’interests,policyholders’interestsintheAMPlifeinsuranceentities’statutoryfunds,externalunitholders’interestsandnon-controllinginterests.
For
per
sona
l use
onl
y

AMP 2015 annual report68
Notes to the financial statements for the year ended 31 December 2015
6. Expenses
Consolidated Parent
2015$m
2014$m
2015$m
2014$m
(a) Life insurance claims and related expenses Lifeinsurancecontractclaimsandrelatedexpenses (1,988) (2,025) – –Outwardsreinsuranceexpense (176) (141) – –
Total life insurance claims and related expenses (2,164) (2,166) – –
(b) Operating expenses1 Commissionandadvisoryfee-for-serviceexpense (1,247) (1,211) – –Investmentmanagementexpenses (316) (297) – –
Fee and commission expenses (1,563) (1,508) – –
Wagesandsalaries (828) (888) (4) (5)Contributionstodefinedcontributionplans (85) (85) (1) (1)Definedbenefitfundexpense (8) (8) – –Share-basedpaymentsexpense (34) (35) (3) (6)Otherstaffcosts (63) (69) (1) (1)
Staff and related expenses (1,018) (1,085) (9) (13)
Occupancyandotherpropertyrelatedexpenses (115) (105) – –Directpropertyexpenses2 (3) (139) – –Informationtechnologyandcommunication (256) (256) – –Professionalandconsultingfees (99) (94) – –Advertisingandmarketing (33) (39) – –Travelandentertainment (36) (34) – –Impairmentofintangibles (18) (13) – –Amortisationofintangibles (261) (258) – –Depreciationofproperty,plantandequipment (23) (17) – –Otherexpenses – investmententitiescontrolledbytheAMPlifeinsuranceentities’statutoryfunds (59) (2) – –– otherentities (207) (284) (2) (1)
Other operating expenses (1,110) (1,241) (2) (1)
Total operating expenses (3,691) (3,834) (11) (14)
(c) Finance costs Interestexpenseonborrowingsandsubordinateddebt (658) (674) (28) (18)Otherfinancecosts (74) (11) – –
Total finance costs (732) (685) (28) (18)
1 OperatingexpensesincludescertaintradingexpensesofinvestmententitiescontrolledbytheAMPlifeinsuranceentities’statutoryfundswhichcarryoutbusinessoperationsunrelatedtothecorewealthmanagementoperationsoftheAMPgroup.
2 Directpropertyexpensesrelatetoinvestmentpropertieswhichgeneraterentalincome.
For
per
sona
l use
onl
y

AMP 2015 annual report 69
7. Income tax
Consolidated Parent
2015$m
2014$m
2015$m
2014$m
(a) Analysis of income tax (expense) credit Currenttax(expense)credit (523) (381) 47 (6)Increase(decrease)indeferredtaxassets (78) (148) (1) 57(Increase)decreaseindeferredtaxliabilities 280 (320) – –Over(under)providedinpreviousyearsincludingamountsattributabletopolicyholders 41 6 2 –
Income tax (expense) credit (280) (843) 48 51
(b) Relationship between income tax expense and accounting profitThefollowingtableprovidesareconciliationofdifferencesbetweenprima facietaxcalculatedas30%oftheprofitbeforeincometaxfortheyearandtheincometaxexpenserecognisedintheIncomestatementfortheyear.Theincometaxexpenseamountreflectstheimpactofbothincometaxattributabletoshareholdersaswellasincometaxattributabletopolicyholders.Inrespectofincometaxexpenseattributabletoshareholders,thetaxratewhichappliesis30%inAustraliaand28%inNewZealand.
Incometaxattributabletopolicyholdersisbasedoninvestmentincomeallocatedtopolicyholderslessexpensesdeductibleagainstthatinvestmentincome.Theimpactofthetaxischargedagainstpolicyholderliabilities.Anumberofdifferenttaxrateregimesapplytopolicyholders.InAustralia,certainclassesofpolicyholderlifeinsuranceincomeandsuperannuationearningsaretaxedat15%,andcertainclassesofincomeonsomeannuitybusinessaretax-exempt.TherateapplicabletoNewZealandlifeinsurancebusinessis28%.
Consolidated Parent
2015$m
2014$m
2015$m
2014$m
Profitbeforeincometax 1,993 1,814 865 781Policyholdertax(expense)creditrecognisedaspartofthechangeinpolicyholderliabilitiesindeterminingprofitbeforetax 48 (540) – –
Profit before income tax excluding tax charged to policyholders 2,041 1,274 865 781
TaxattheAustraliantaxrateof30%(2014:30%) (612) (382) (260) (234)
Taxeffectofdifferencesbetweenamountsofincomeandexpensesrecognisedforaccountingandtheamountsassessable/deductibleincalculatingtaxableincome: – shareholderimpactoflifeinsurancetaxtreatment (11) (30) – –– taxconcessionsincludingresearchanddevelopmentandoffshorebankingunit 11 12 – –– non-deductibleexpenses (10) (7) (4) (1)– non-taxableincome 14 11 2 61– dividendincomefromcontrolledentities – – 263 173– otheritems (12) (7) (5) (5)– non-controllinginterests1 217 20 – –
Over(under)providedinpreviousyearsafterexcludingamountsattributabletopolicyholders 25 17 9 –
Utilisationofpreviouslyunrecognisedtaxlosses 43 56 43 57Differencesinoverseastaxrates 7 7 – –
Incometax(expense)creditattributabletoshareholdersandnon-controllinginterest (328) (303) 48 51Incometax(expense)creditattributabletopolicyholders 48 (540) – –
Income tax (expense) credit per Income statement (280) (843) 48 51
1 $723m(2014:$67m)profitattributabletonon-controllinginterestsininvestmententitiescontrolledbytheAMPlifeinsuranceentities’statutoryfundsisnotsubjecttotax.
For
per
sona
l use
onl
y

AMP 2015 annual report70
Notes to the financial statements for the year ended 31 December 2015
7. Income tax continued
Consolidated Parent
2015$m
2014$m
2015$m
2014$m
(c) Analysis of deferred tax assets Expensesdeductibleandincomerecognisableinfutureyears 234 253 1 1Unrealisedmovementsonborrowingsandderivatives 24 19 – –Unrealisedinvestmentlosses 29 25 – –Lossesavailableforoffsetagainstfuturetaxableincome 175 310 50 50Other 95 90 3 4
Total deferred tax assets 557 697 54 55
(d) Analysis of deferred tax liabilities Unrealisedinvestmentgains 1,596 1,759 – –Unrealisedmovementsonborrowingsandderivatives 17 20 – –Other 463 557 – –
Total deferred tax liabilities 2,076 2,336 – –
(e) Amounts recognised directly in equity Deferredincometax(expense)creditrelatedtoitemstakendirectlytoequityduringthecurrentyear (28) 34 – –
(f) Unused tax losses and deductible temporary differences not recognised Revenuelosses 109 109 108 108Capitallosses 239 343 239 321
8. Receivables
Consolidated Parent
2015$m
2014$m
2015$m
2014$m
Investmentincomereceivable 337 358 1 1Investmentsalesandmarginaccountsreceivable 953 872 – –Lifeinsurancecontractpremiumsreceivable 363 369 – –Reinsuranceandotherrecoveriesreceivable 37 29 – –Reinsurers’shareoflifeinsurancecontractliabilities 491 529 – –Tradedebtors 241 234 – –Otherreceivables – investmententitiescontrolledbytheAMPlifeinsuranceentities’statutoryfunds 13 11 – –– otherentities 123 116 5 4– subsidiaries’tax-relatedamounts – – 287 316
Total receivables1 2,558 2,518 293 321
1 $362m(2014:$425m)ofTotalconsolidatedreceivablesisexpectedtoberecoveredmorethan12monthsfromthereportingdateandnil(2014:nil)ofTotalreceivablesoftheparentisexpectedtoberecoveredmorethan12monthsfromthereportingdate.
For
per
sona
l use
onl
y

AMP 2015 annual report 71
9. Inventories and other assets
Consolidated Parent
2015$m
2014$m
2015$m
2014$m
Inventories1,2 82 136 – –Prepayments 64 51 – –Otherassets 1 2 – –
Total inventories and other assets3 147 189 – –
1 Inventoriesincludeinventoriesanddevelopmentpropertiesofinvestmententitiescontrolledbythelifeentities’statutoryfundswhichcarryoutbusinessoperationsunrelatedtothecorewealthmanagementoperationsoftheAMPgroup.Inventoriesalsoincludefinancialplanningclientservicingrightsheldforsaleintheordinarycourseofbusiness.TheAMPgrouphasarrangementsinplacewithcertainfinancialplanningadviserswherebytheAMPgroupisrequired,subjecttotheadvisermeetingcertainconditions,topayabenefittothoseadvisersonsurrenderoftheclientservicingrights.Thebenefitpaidunderthesearrangementsiscalculatedbasedonvaluemetricsattributabletotheclientregisteratthevaluationdate.AMPhastherighttochangethemultiplesusedtodeterminethebenefitpaid(subjecttoanoticeperiod).Insomecases,thearrangementscanbechangedwithoutnoticeshouldlegislation,economicorproductchangesrendertheminappropriate.Inthenormalcourseofbusiness,theAMPgroupseekstoon-selltheclientservicingrightstootherfinancialplanningadvisersandaccordinglyanyclientservicingrightsacquiredunderthesearrangementsareclassifiedasinventory.
2 Writedownof$18m(2014:nil)ofinventorieswasrecognisedasanexpenseintheperiod.3 $22m(2014:$81m)ofinventoriesandotherassetsisexpectedtoberecoveredmorethan12monthsfromthereportingdate.
10. Investments in financial assets and other financial liabilities
Consolidated Parent
2015$m
2014$m
2015$m
2014$m
Investments in financial assets
Financial assets measured at fair value through profit or loss1 Equitysecuritiesandlistedmanagedinvestmentschemes 53,173 46,830 – –Debtsecurities2 35,743 38,440 – –Investmentsinunlistedmanagedinvestmentschemes 19,421 18,556 – –Derivativefinancialassets 1,790 1,982 – –Otherfinancialassets 8 40 – –
Total financial assets measured at fair value through profit or loss 110,135 105,848 – –
Available-for-sale financial assets Equitysecuritiesandmanagedinvestmentschemes 66 63 – –
Total available-for-sale financial assets 66 63 – –
Financial assets measured at amortised cost Loansandadvances–tosubsidiaries – – 2,247 1,960Loansandadvances 15,281 14,590 – –Debtsecurities–heldtomaturity 1,739 2,335 – –
Total financial assets measured at amortised cost 17,020 16,925 2,247 1,960
Total investments in financial assets 127,221 122,836 2,247 1,960
Other financial liabilities Derivativefinancialliabilities 883 1,150 – –Collateraldepositsheld3 225 865 – –
Total other financial liabilities 1,108 2,015 – –
1 InvestmentsmeasuredatfairvaluethroughprofitorlossaremainlyassetsoftheAMPlifeinsuranceentities’statutoryfundsandcontrolledentitiesoftheAMPlifeinsuranceentities’statutoryfunds.
2 IncludedwithindebtsecuritiesareassetsheldtobacktheliabilityforcollateraldepositsheldinrespectofdebtsecurityrepurchasearrangementsenteredintobytheAMPlifeinsuranceentities’statutoryfundsandthecontrolledentitiesoftheAMPlifeinsuranceentities’statutoryfunds.
3 CollateraldepositsheldaremostlyinrespectoftheobligationtorepaycollateralheldinrespectofdebtsecurityrepurchasearrangementsenteredintobytheAMPlifeinsuranceentities’statutoryfundsandthecontrolledentitiesoftheAMPlifeinsuranceentities’statutoryfunds.
For
per
sona
l use
onl
y

AMP 2015 annual report72
Notes to the financial statements for the year ended 31 December 2015
11. Investment property
Consolidated Parent
2015$m
2014$m
2015$m
2014$m
Investment property Directlyheld 386 340 – –
Total investment property 386 340 – –
Movements in investment property Balanceatthebeginningoftheyear 340 6,889 – –Additions–throughdirectacquisitions – – – –Additions–subsequentexpenditurerecognisedincarryingamount 1 51 – –Acquisitions(disposal)throughbusinesscombinations1 – (2,742) – –Disposals1 (26) (3,922) – –Netgains(losses)fromfairvalueadjustments 71 74 – –Foreigncurrencyexchangedifferences – – – –Transferfrom(to)inventories – (10) – –
Balance at the end of the year 386 340 – –
1 InOctober2014,substantiallyalloftheinvestmentpropertyintheAMPgroupwassoldintotheAMPCapitalDiversifiedPropertyFund(ADPF).TheAMPgroupalsosoldunitsinotherpropertyfundstoADPFand,asaresult,ceasedtocontrolanumberoffundswithdirectpropertyassets.TheAMPgroupcontinuestoinvestinpropertyassetsindirectlythroughADPFandotherpropertyfunds.
Valuation of investment propertyInvestmentpropertyismeasuredatfairvalueateachreportingdate.Fair valuerepresentsthepricethatwouldbereceivedtosellanassetorpaidtotransferaliabilityinanorderlytransactionbetweenmarketparticipantsatthereportingdate.
FairvaluesoftheAMPgroup’spropertiesaredeterminedbyindependentregisteredvaluerswhohaveappropriateregisteredprofessionalqualificationsandrecentexperienceinthelocationandcategoryofthepropertybeingvalued.
Thefairvalueappraisalsareobtainedonarollingannualbasis.Thevaluationschedulemaybealteredwhenapropertyiseitherundergoingorbeingappraisedforredevelopment,refurbishmentorsale;orisexperiencingotherchangesinassetsortenantprofileswhichmaysignificantlyimpactvalue;orwhentherehavebeensignificantchangesinthepropertymarketandbroadereconomysuchasupdatestocomparablepropertysaleswhichmayhaveanimpactontheindividualassetvalues.Thecarryingvalueofeachinvestmentpropertyisassessedatthereportingdatetoensuretherehasbeennomaterialchangetothefairvaluesincethevaluationdate.
Thevaluersuse‘comparablesalesanalysis’andthe‘capitalisedincomeapproach’whichconsidersfactorssuchasannualnetmarketincome,comparablecapitalisationratesandotherproperty-specificadjustmentsaswellasdiscountedcashflowanalysisusingamarketdeterminedriskadjusteddiscountrate.Thefairvalueofinvestmentpropertydoesnotincludefuturecapitalexpenditurethatwillimproveorenhancetheproperty.
Consolidated
2015%
2014%
Primary assumptions used in valuing investment property Capitalisationrates1 7.50 6.63–8.00Marketdetermined,riskadjusteddiscountrate2 9.00 8.00–9.25
1 Thefairvalueofinvestmentpropertieswouldincrease/decreaseifthecapitalisationratewaslower/higher.2 Thefairvalueofinvestmentpropertieswouldincrease/decreaseiftheriskadjusteddiscountratewaslower/higher.
For
per
sona
l use
onl
y

AMP 2015 annual report 73
12. Property, plant and equipment
Owner-occupied property
measured at fair value1
$m
Leasehold improvements
$m
Plant and equipment2
$mTotal
$m
2015 – ConsolidatedProperty, plant and equipment Grosscarryingamount 361 90 146 597 Less:accumulateddepreciationandimpairmentlosses – (70) (104) (174)
Property, plant and equipment at written down value 361 20 42 423
Movements in property, plant and equipment Balanceatthebeginningoftheyear 342 17 42 401 Additions(reductions)throughacquisitions(disposal)ofcontrolledentities2 – 1 (1) – Additions – throughdirectacquisitions – 10 11 21 – subsequentexpenditurerecognisedincarryingamount 3 – – 3 Increases(decreases)fromrevaluationsrecogniseddirectlyinequity 22 – – 22 Disposals – – (1) (1)Depreciationexpense (6) (8) (9) (23)Transferredtodisposalgroup – – – – Othermovements – – – –
Balance at the end of the year 361 20 42 423
2014 – Consolidated Property, plant and equipment Grosscarryingamount 342 107 154 603Less:accumulateddepreciationandimpairmentlosses – (90) (112) (202)
Property, plant and equipment at written down value 342 17 42 401
Movements in property, plant and equipment Balanceatthebeginningoftheyear 331 15 110 456Additions(reductions)throughacquisitions(disposal)ofcontrolledentities2 – – – –Additions – throughdirectacquisitions – 2 16 18– subsequentexpenditurerecognisedincarryingamount 6 – – 6Increases(decreases)fromrevaluationsrecogniseddirectlyinequity 8 – – 8Disposals – – (1) (1)Depreciationexpense (3) (4) (10) (17)Transferredtodisposalgroup – – (69) (69)Othermovements – 4 (4) –
Balance at the end of the year 342 17 42 401
1 ForOwner-occupiedpropertymeasuredatfairvalue;hadtheassetbeenmeasuredathistoriccosttheamortisedcarryingvaluewouldhavebeen$198m(2014:$201m).
2 PlantandequipmentincludesoperatingassetsofinvestmententitiescontrolledbytheAMPlifeinsuranceentities’statutoryfundswhichcarryoutbusinessoperationsunrelatedtothecorewealthmanagementoperationsoftheAMPgroup.
For
per
sona
l use
onl
y

AMP 2015 annual report74
Notes to the financial statements for the year ended 31 December 2015
13. Intangibles
Goodwill1
$m
Capitalised costs
$m
Value of in-force
business$m
Distribution networks
$m
Other intangibles
$mTotal
$m
2015 – ConsolidatedIntangibles Grosscarryingamount 2,890 1,129 1,191 251 95 5,556 Less:accumulatedamortisationand/orimpairmentlosses (108) (755) (488) (128) (94) (1,573)
Intangibles at written down value 2,782 374 703 123 1 3,983
Movements in intangibles Balanceatthebeginningoftheyear 2,717 378 806 136 5 4,042 Additions(reductions)throughacquisitions(disposal)ofcontrolledentities 59 7 – 16 – 82 Additionsthroughseparateacquisition – – – 2 – 2Additionsthroughinternaldevelopment – 114 – – – 114 Transferredfrominventories – – – 17 – 17 Transferredtodisposalgroups – – – – – –Amortisationexpense2 – (117) (103) (37) (4) (261)Impairmentlosses – (8) – (10) – (18)Othermovements 6 – – (1) – 5
Balance at the end of the year 2,782 374 703 123 1 3,983
2014 – Consolidated Intangibles Grosscarryingamount 2,825 1,008 1,191 217 95 5,336Less:accumulatedamortisationand/orimpairmentlosses (108) (630) (385) (81) (90) (1,294)
Intangibles at written down value 2,717 378 806 136 5 4,042
Movements in intangibles Balanceatthebeginningoftheyear 2,711 355 909 140 21 4,136Additions(reductions)throughacquisitions(disposal)ofcontrolledentities 19 – – 5 – 24Additionsthroughseparateacquisition – – – 34 – 34Additionsthroughinternaldevelopment – 127 – – – 127Disposals – – – – – –Transferredtodisposalgroups (13) – – – – (13)Amortisationexpense2 – (104) (103) (35) (16) (258)Impairmentlosses – – – – – –Othermovements – – – (8) – (8)
Balance at the end of the year 2,717 378 806 136 5 4,042
1 Totalgoodwillcomprisesamountsattributabletoshareholdersof$2,767m(2014:$2,702m)andamountsattributabletopolicyholdersof$15m(2014:$15m).
2 AmortisationexpensefortheperiodisincludedinOperatingexpensesintheIncomestatement.
For
per
sona
l use
onl
y

AMP 2015 annual report 75
13. Intangibles continuedImpairment testing of goodwillGoodwillincludesbalancesattributabletoshareholdersandbalancesattributabletopolicyholdersininvestmententitiescontrolledbytheAMPlifeinsuranceentities’statutoryfunds.
Goodwill attributable to shareholders$2,767m(2014:$2,702m)ofthegoodwillisattributabletoshareholdersandarosefromtheacquisitionofAMPAAPHLimitedgroupin2011,apreviousLifeActPart9transferoflifeinsurancebusinessintothestatutoryfundsofAMPLifeandotherbusinesscombinationswheretheAMPgroupwastheacquirer.
EachofthebusinessesacquiredincludedactivitiesconductedinthesamebusinessunitsalreadyoperatedbyAMP.ThosebusinessunitsareAustralianwealthmanagement,Australianwealthprotection,Australianmature,AMPFinancialServicesNewZealandandAMPCapitalandthosebusinessunitsareidentifiedasthecash-generatingunitsforthepurposeofassessinggoodwillimpairment.
Forthepurposesofimpairmenttesting,theamountisallocatedtothecash-generatingunitsasfollows:– Australianwealthmanagement–goodwillattributable:$1,485m(2014:$1,425m)– Australianwealthprotection–goodwillattributable:$668m(2014:$668m)– Australianmature–goodwillattributable:$350m(2014:$350m)– AMPFinancialServicesNewZealand–goodwillattributable$177m(2014:$172m)– AMPCapital–goodwillattributable$87m(2014:$87m).
Therewerenootherintangibleassetswithindefiniteusefullivesallocatedtothesecash-generatingunits(31December2014:nil).
Therecoverableamountforeachcash-generatingunithasbeendeterminedusingabasisofthefairvaluelesscostsofdisposal.Foreachcash-generatingunitotherthanAMPCapital,therecoverableamounthasbeendeterminedconsideringacombinationoftheestimatedembeddedvalueplusthevalueofoneyear’snewbusinesstimesamultiplier.Thesearegenerallyregardedasfeaturesofalifeinsurancebusinessthat,whentakentogether,wouldbeanestimateoffairvalue.Embeddedvalueisacalculationthatrepresentstheeconomicvalueoftheshareholdercapitalinthebusinessandthefutureprofitsexpectedtoemergefromthebusinesscurrentlyin-forceexpressedintoday’sdollars.
Indeterminingthefairvalueoffuturenewbusiness,multiplesof10to15wereappliedtotheactuariallydeterminedvalueofoneyear’snewbusiness.Thekeyassumptionsappliedinestimatingtheembeddedvalueandvalueofoneyear’snewbusinessare:mortality,morbidity,discontinuancerates,maintenanceunitcosts,futureratesofsupportablebonusforparticipatingbusiness,frankingcredits,riskdiscountrates,investmentreturnsandinflationrates.Premiumandclaimamountsareestimatedovertheexpectedlifeofthein-forcepolicieswhichvariesdependingonthenatureoftheproduct.Futuremaintenanceandinvestmentexpensesarebasedonunitcostsderivedfrombudgetedamountsforthefollowingyearandincreasedinfutureyearsforexpectedratesofinflation.AssumptionsappliedinthisvaluationareconsistentwiththebestestimateassumptionsusedincalculatingthepolicyliabilitiesofAMP’slifeinsuranceentitiesexceptthevalueofin-forceandnewbusinesscalculationincludesariskdiscountrate.Note1(s)andnote20provideextensivedetailswithrespecttotheassumptions,management’sapproachtodeterminingthevaluesassignedtoeachkeyassumptionandtheirconsistencywithpastexperienceandexternalsourcesofinformation.Allrelevantbusinessisprojectedfortheembeddedvalueandthedescriptionoftheassumptionsinnote20appliesevenwherethatbusinessisnotvaluedbyprojectionmethodsforprofitreporting.Thevalueofin-forceandnewbusinesscalculationusesariskdiscountratebasedonanannualised10yeargovernmentbondyieldplusadiscountmarginof4%(2014:4%):Australia6.9%(2014:6.8%),NewZealand7.6%(2014:7.7%).
TherecoverableamountfortheAMPCapitalcash-generatingunitisdeterminedbasedonamultipleof18timescurrentperiodearnings(2014:19times),whichapproximatesthefairvalueofthisbusiness,lessanallowancefordisposalcosts.
Theconclusionfromthegoodwillimpairmenttestingisthattherehasbeennoimpairmenttotheamountofthegoodwillrecognised.
Atthereportingdate,thereisnoreasonablypossiblechangeinkeyassumptionsthatcouldcausethecarryingamounttoexceedtherecoverableamount.
Goodwill attributable to policyholdersThepolicyholdergoodwillarisesonacquisitionsofoperatingsubsidiariescontrolledbytheAMPlifeinsuranceentities’statutoryfunds,whichcarryoutbusinessoperationsunrelatedtothecorewealthmanagementoperationsoftheAMPgroup.Thegoodwillrepresentsthefuturevalueofcashflowsexpectedtobederivedfromthoseoperatingsubsidiaries.
Policyholdercash-generatingunitswereallocated$15mgoodwillat31December2015(31December2014:$15m).Policyholdercash-generatingunitshadnootherintangibleswithindefiniteusefullives(31December2014:nil).
Impairmenttestingofthesegoodwillbalancesisbasedoneachasset’svalueinuse,calculatedasthepresentvalueofforecastfuturecashflowsfromthoseassetsusingadiscountrateof8.75%(2014:between9.3%and19.6%).
Atthereportingdate,thereisnoreasonablypossiblechangeinkeyassumptionsthatcouldcausethecarryingamounttoexceedtherecoverableamount.
Shareholdershavenodirectexposuretomovementsingoodwillattributabletopolicyholders.However,duetotheimpactoftheaccountingforinvestmentsincontrolledentitiesoftheAMPlifeinsuranceentities’statutoryfunds(seenote1(b)),policyholderassetmovements(includinggoodwill)canimpactthenetprofitaftertaxattributabletoshareholders.Anyimpactistemporaryinnature,reversingnolaterthanthepointatwhichtheAMPgroupceasestocontroltheinvestments.
For
per
sona
l use
onl
y

AMP 2015 annual report76
Notes to the financial statements for the year ended 31 December 2015
14. Payables
Consolidated Parent
2015$m
2014$m
2015$m
2014$m
Investmentpurchasesandmarginaccountspayable 694 795 – –Lifeinsuranceandinvestmentcontractsinprocessofsettlement 394 367 – –Accruedexpenses 136 86 – –Interestpayable 4 4 – –Tradecreditors 52 56 – –Otherpayables – subsidiaries’tax-relatedamounts – – 42 91– subsidiaries – – 1 –– investmententitiescontrolledbyAMPlifeinsuranceentities’statutoryfunds 198 159 – –– otherentities 553 484 1 1
Total payables1,2 2,031 1,951 44 92
1 TotalpayablesincludepayablesofinvestmententitiescontrolledbytheAMPlifeinsuranceentities’statutoryfundswhichcarryoutbusinessoperationsunrelatedtothecorewealthmanagementoperationsoftheAMPgroup.
2 $91m(2014:$60m)ofTotalpayablesoftheAMPgroupisexpectedtobesettledmorethan12monthsfromthereportingdateandnil(2014:nil)ofTotalpayablesoftheparentisexpectedtobesettledmorethan12monthsfromthereportingdate.
15. Provisions
Consolidated Parent
2015$m
2014$m
2015$m
2014$m
(a) Provisions Employeeentitlements1 290 295 5 5Restructuring2 8 17 – –Other3 189 130 – –
Total provisions 487 442 5 5
Employee entitlements1
$mRestructuring2
$mOther3
$mTotal
$m
(b) Movements in provisions – consolidated Balanceatthebeginningoftheyear 295 17 130 442 Additions(reductions)throughacquisitions(disposal)ofcontrolledentities 2 – – 2Additionalprovisionsmadeduringtheyear 226 14 124 364 Unusedamountsreversedduringtheyear (16) (3) (9) (28)Provisionsusedduringtheyear (218) (20) (55) (293)Foreignexchangemovements 1 – (1) –
Balance at the end of the year 290 8 189 487
(c) Movements in provisions – parent Balanceatthebeginningoftheyear 5 – – 5 Additionalprovisionsmadeduringtheyear 3 – – 3 Unusedamountsreversedduringtheyear – – – – Provisionsusedduringtheyear (3) – – (3)Foreignexchangemovements – – – –
Balance at the end of the year 5 – – 5
1 Provisionsforemployeeentitlementsareinrespectofamountsaccumulatedasaresultofemployeesrenderingservicesuptothereportingdate.Theseentitlementsincludesalaries,wages,bonuses,annualleaveandlongserviceleave,butexcludeshare-basedpayments.$17m(2014:$13m)oftheconsolidatedbalanceisexpectedtobesettledmorethan12monthsfromthereportingdate.Nil(2014:nil)oftheparentbalanceisexpectedtobesettledmorethan12monthsfromthereportingdate.
2 Restructuringprovisionsarerecognisedinrespectofprogramsthatmateriallychangethescopeofthebusinessorthemannerinwhichthebusinessisconducted.Nil(2014:nil)isexpectedtobesettledmorethan12monthsfromthereportingdate.
3 Otherprovisionsareinrespectofprobableoutgoingsondataqualityandintegrityprojects,settlements,andvariousotheroperationalprovisions.$17m(2014:$15m)isexpectedtobesettledmorethan12monthsfromthereportingdate.
For
per
sona
l use
onl
y

AMP 2015 annual report 77
16. Borrowings
Consolidated Parent
2015$m
2014$m
2015$m
2014$m
Deposits1 6,772 6,392 – –Borrowingsandinterestbearingliabilities – AMPBankandsecuritisationvehicles 6,774 7,224 – –– Corporateborrowings 271 463 – –– InvestmententitiescontrolledbyAMPlifeinsuranceentities’statutoryfunds 1,943 1,273 – –
Total borrowings2 15,760 15,352 – –
1 DepositsmainlycompriseatcallretailcashondepositandretailtermdepositsatvariableinterestrateswithintheAMPBank.2 Totalborrowingscompriseamountstofund: i) CorporateborrowingsofAMPgroup$271m(2014:$463m).Ofthisbalance$271m(2014:$255m)isexpectedtobesettledmorethan
12monthsfromthereportingdate. ii) AMPBankandsecuritisationtrustsborrowings$13,452m(2014:$13,514m).Ofthisbalance$3,651m(2014:$2,931m)isexpectedtobesettled
morethan12monthsfromthereportingdate. iii) AMPlifeinsuranceentities’statutoryfundsborrowingsandcontrolledentitiesoftheAMPlifeinsuranceentities’statutoryfundsborrowings
$2,037m(2014:$1,375m).Ofthisbalance$95m(2014:$1,238m)isexpectedtobesettledmorethan12monthsfromthereportingdate.
17. Subordinated debt
Consolidated Parent
2015$m
2014$m
2015$m
2014$m
AMPBank – FloatingRateSubordinatedUnsecuredNotes
(firstcalldate2017,maturity2022)1 150 150 – –
Corporatesubordinateddebt2 – 6.875%GBPSubordinatedGuaranteedBonds(maturity2022) 82 79 – –– FloatingRateSubordinatedUnsecuredNotes
(firstcalldate2016,maturity2021)3 601 602 – –– AMPSubordinatedNotes2(firstcalldate2018,maturity2023)4 321 319 326 326– AMPWholesaleCapitalNotes5 276 – 276 –– AMPCapitalNotes6 262 – 262 –
Totalsubordinateddebt 1,692 1,150 864 326
1 FloatingratesubordinatedunsecurednotesaretofundAMPBank’scapitalrequirements.2 SubordinateddebtamountsaretofundcorporateactivitiesofAMPgroup.3 AMPhasissuednoticetoredeemthesubordinateddebtatthefirstcalldateof29March2016.4 AMPSubordinatedNotes2wereissuedon18December2013andarelistedontheASX.Incertaincircumstances,AMPmayberequiredtoconvert
someorallofAMPNotes2intoAMPordinaryshares.5 AMPWholesaleCapitalNoteswereissuedon27March2015.Theyareperpetualnoteswithnomaturitydate.Incertaincircumstances,AMPmay
berequiredtoconvertsomeorallofAMPWholesaleCapitalNotesintoAMPordinaryshares.6 AMPCapitalNoteswereissuedon30November2015andarelistedontheASX.Theyareperpetualnoteswithnomaturitydate.Incertain
circumstances,AMPmayberequiredtoconvertsomeorallofAMPCapitalNotesintoAMPordinaryshares.
For
per
sona
l use
onl
y

AMP 2015 annual report78
Notes to the financial statements for the year ended 31 December 2015
18. Dividends
Consolidated Parent
2015$m
2014$m
2015$m
2014$m
Final dividends paid 2014finaldividendpaidin2015:13.5centsperordinarysharefrankedto80%(2013finaldividendpaidin2014:11.5centsperordinarysharefrankedto70%) 399 340 399 340
Interim dividends paid 2015:14.0centsperordinarysharefrankedto85%(2014:12.5centsperordinarysharefrankedto70%) 414 370 414 370
Total dividends paid1,2 813 710 813 710
Final dividends proposed but not recognised 2015:14.0centsperordinarysharefrankedto90% 414 399 414 399
Dividend franking account3,4 FrankingcreditsavailabletoshareholdersofAMPLimited(at30%) 396 291 396 291
1 Totaldividendspaidincludesdividendspaidontreasuryshares$13m(2014:$10m).SeeStatementofchangesinequityforfurtherinformationregardingtheimpactoftreasurysharesondividendspaidandretainedearnings.
2 Alldividendsarefrankedatataxrateof30%.3 Thefrankingcreditsavailabletoshareholdersarebasedonthebalanceofthedividendfrankingaccountatthereportingdateadjustedfor: i) frankingcreditsthatwillarisefromthepaymentofthecurrenttaxliability ii) frankingdebitsthatwillarisefromthepaymentofdividendsrecognisedasaliabilityattheyearend iii) frankingcreditsthatwillarisefromthereceiptofdividendsrecognisedasreceivablesbythetaxconsolidatedgroupattheyearend,and iv) frankingcreditsthattheentitymaybepreventedfromdistributinginsubsequentyears.4 Thecompany’sabilitytoutilisethefrankingaccountcreditsdependsonmeetingCorporationsActrequirementstodeclaredividends.Theimpact
oftheproposeddividendwillbetoreducethebalanceofthefrankingcreditaccountby$160m.
19. Contributed equity
Consolidated Parent
2015$m
2014$m
2015$m
2014$m
Movements in issued capital1 Balanceatthebeginningoftheyear 9,747 9,747 9,747 9,747
Balance at the end of the year 9,747 9,747 9,747 9,747
Total issued capital 2,957,737,964(2014:2,957,737,964)ordinarysharesfullypaid 9,747 9,747 9,747 9,747
Movements in treasury shares Balanceatthebeginningoftheyear (239) (145) – –(Increase)decreaseduetopurchaseslesssalesduringtheyear 58 (94) – –
Balance at the end of the year (181) (239) – –
Total treasury shares2 33,390,553(2014:46,961,490)treasuryshares (181) (239) – –
Total contributed equity 2,924,347,411(2014:2,910,776,474)ordinarysharesfullypaid 9,566 9,508 9,747 9,747
Holdersofordinaryshareshavetherighttoreceivedividendsasdeclaredand,intheeventofthewindingupofthecompany,toparticipateintheproceedsfromthesaleofallsurplusassetsinproportiontothenumberofandamountspaiduponsharesheld.Fullypaidordinarysharescarrytherighttoonevotepershare.Ordinaryshareshavenoparvalue.
1 Underthetermsofthedividendreinvestmentplan(DRP),shareholdersmayelecttohaveallorpartoftheirdividendentitlementssatisfiedinsharesratherthanbeingpaidcash.TheDRPappliedforthe2014finaldividend(paidinApril2015)at$6.57pershare,2015interimdividend(paidinOctober2015)at$5.75pershare.AMPsettledtheDRPforthe2014finaldividendand2015interimdividendbyacquiringsharesonmarketand,accordingly,nonewshareswereissued.
2 OftheAMPLimitedordinarysharesonissue31,264,166(2014:44,835,103)areheldbyAMP’slifeinsuranceentitiesonbehalfofpolicyholders.ASIChasgrantedrelieffromrestrictionsintheCorporations Act 2001toallowAMP’slifeinsuranceentitiestoholdandtradesharesinAMPLimitedaspartofthepolicyholderfunds’investmentactivities.Thecostoftheinvestmentinthesetreasurysharesisreflectedasadeductionfromtotalcontributedequity.TheremainingbalanceisheldbyAMPFoundationLimitedastrusteefortheAMPFoundation.
3 MitsubishiUFJTrustandBankingCorporation(MUTB)hasanoptiontorequireAMPLimitedtopurchaseMUTB’sinterestinAMPCapitalHoldingsLimited(AMPCH)incertaincircumstances.AsconsiderationfortheacquisitionofAMPCHshares,AMPwouldberequiredtoissueordinarysharesinAMPLimitedtoMUTB(oritsnominee).
For
per
sona
l use
onl
y

AMP 2015 annual report 79
20. Life insurance contractsTheAMPgroup’slifeinsurancerelatedactivitiesareconductedthroughtworegisteredlifeinsurancecompanies,AMPLifeLimited(AMPLife)andTheNationalMutualLifeAssociationofAustralasiaLimited(NMLA).
Consolidated Parent
2015$m
2014$m
2015$m
2014$m
(a) Analysis of life insurance contract premium and related revenue Totallifeinsurancecontractpremiumsreceivedandreceivable 2,804 2,797 – –Less:componentrecognisedasachangeinlifeinsurancecontractliabilities (467) (507) – –
Lifeinsurancecontractpremiumrevenue1 2,337 2,290 – –Reinsurancerecoveries 128 137 – –
Total life insurance contract premium and related revenue 2,465 2,427 – –
(b) Analysis of life insurance contract claims and related expenses Totallifeinsurancecontractclaimspaidandpayable (3,141) (4,620) – –Less:componentrecognisedasachangeinlifeinsurancecontractliabilities 1,153 2,595 – –
Lifeinsurancecontractclaimsexpense (1,988) (2,025) – –Outwardsreinsuranceexpense (176) (141) – –
Total life insurance contract claims and related expenses (2,164) (2,166) – –
(c) Analysis of life insurance contract operating expenses Lifeinsurancecontractacquisitionexpenses – commission (58) (74) – –– otherexpenses (150) (159) – –Lifeinsurancecontractmaintenanceexpenses – commission (192) (195) – –– otherexpenses (378) (391) – –Investmentmanagementexpenses (61) (55) – –
(d) Life insurance contract liabilities Life insurance contract liabilities determined using projection method Best estimate liability – valueoffuturelifeinsurancecontractbenefits 19,333 19,773 – –– valueoffutureexpenses 4,964 5,163 – –– valueoffuturepremiums (19,447) (19,874) – –Value of future profits – lifeinsurancecontractholderbonuses 3,129 2,875 – –– shareholders’profitmargins 3,338 3,445 – –
Total life insurance contract liabilities determined using the projection method2 11,317 11,382 – –
Life insurance contract liabilities determined using accumulation method Best estimate liability – valueoffuturelifeinsurancecontractbenefits 9,617 10,107 – –– valueoffutureacquisitionexpenses (87) (94) – –
Total life insurance contract liabilities determined using the accumulation method 9,530 10,013 – –
Value of declared bonus 316 326 – –Unvested policyholder benefits liabilities2 2,217 2,153 – –
Total life insurance contract liabilities net of reinsurance 23,380 23,874 – –Add:reinsurers’shareoflifeinsurancecontractliabilities 491 529 – –
Total life insurance contract liabilities gross of reinsurance 23,871 24,403 – –
1 Lifeinsurancecontractpremiumrevenueconsistsentirelyofdirectinsurancepremiums;thereisnoinwardreinsurancecomponent.2 Forparticipatingbusinessinthestatutoryfunds,partoftheassetsinexcessofthelifeinsurancecontractandotherliabilitiescalculatedunderMoS
areattributedtopolicyholders.UndertheLifeAct,thisisreferredtoaspolicyholderretainedprofits.Forthepurposeofreportingunderaccountingstandards,thisamountisreferredtoasunvestedpolicyholderbenefitsliabilitiesandisincludedwithinlifeinsurancecontractliabilitieseventhoughitisyettobevestedasspecificpolicyholderentitlements.
For
per
sona
l use
onl
y

AMP 2015 annual report80
Notes to the financial statements for the year ended 31 December 2015
20. Life insurance contracts continued
Consolidated Parent
2015$m
2014$m
2015$m
2014$m
(e) Reconciliation of changes in life insurance contract liabilities Totallifeinsurancecontractliabilitiesatthebeginningoftheyear 24,403 24,934 – –ChangeinlifeinsurancecontractliabilitiesrecognisedintheIncomestatement 240 1,333 – –Premiumsrecognisedasanincreaseinlifeinsurancecontractliabilities 467 507 – –Claimsrecognisedasadecreaseinlifeinsurancecontractliabilities (1,153) (2,595) – –Changeinreinsurers’shareoflifeinsurancecontractliabilities (38) 64 – –Foreignexchangeadjustment (48) 160 – –
Total life insurance contract liabilities at the end of the year 23,871 24,403 – –
(f) Assumptions and methodology applied in the valuation of life insurance contract liabilities Lifeinsurancecontractliabilities,andhencethenetprofitfromlifeinsurancecontracts,arecalculatedbyapplyingtheprinciplesofmarginonservices(MoS).Refertonote1(s)foradescriptionofMoSandthemethodsforcalculatinglifeinsurancecontractliabilities.
Themethodsandprofitcarriersusedtocalculatelifeinsurancecontractliabilitiesforparticularpolicytypesareasfollows:
Business type MethodProfit carriers (for business valued using projection method)
Conventional Projection BonusesInvestmentaccount Modifiedaccumulation n/aRetailrisk(lumpsum) Projection ExpectedpremiumsRetailrisk(incomeprotection–AMPLifeNZonly) Projection ExpectedpremiumsRetailrisk(incomeprotection–allothers) Projection ExpectedclaimsGrouprisk(lumpsum) Accumulation n/aGrouprisk(incomebenefits) Accumulation n/aParticipatingallocatedannuities(AMPLifeonly) Modifiedaccumulation n/aLifeannuities Projection Annuitypayments
Keyassumptionsusedinthecalculationoflifeinsurancecontractliabilitiesareasfollows:
(i) Risk-free discount rates Exceptwherebenefitsarecontractuallylinkedtotheperformanceoftheassetsheld,arisk-freediscountratebasedoncurrentobservable,objectiveratesthatrelatetothenature,structureandtermofthefutureobligationsisused.Theratesaredeterminedasshowninthefollowingtable:
31 December 2015 31 December 2014
Business type Basis1Australia
%New Zealand
%Australia
%New Zealand
%
Retailrisk(otherthanincomebenefitopenclaims)1
Zerocoupongovernmentbondyieldcurve
2.0–3.7 2.7–4.5 2.1–3.8 3.6–4.1
Retailriskandgrouprisk(incomebenefitopenclaims)1
Zerocoupongovernmentbondyieldcurve(includingliquiditypremium)
2.5–4.2 3.1–5.0 2.4–4.0 3.8–4.3
Lifeannuities1,2 Non-CPI Zerocoupongovernmentbondyieldcurve(includingliquiditypremium)
2.6–4.3 3.3–5.1 2.5–4.1 3.9–4.4
CPI Commonwealthindexedbondyieldcurve(includingliquiditypremium)
0.8–1.8 2.0–3.5 0.4–1.5 2.1–2.9
1 Thediscountratesvarybydurationintherangeshownabove. 2 Australiannon-CPIannuitiesandallCPIannuitiesareAMPLifeonly.
For
per
sona
l use
onl
y

AMP 2015 annual report 81
20. Life insurance contracts continued(ii) Participating business discount ratesWherebenefitsarecontractuallylinkedtotheperformanceoftheassetsheld,asisthecaseforparticipatingbusiness,adiscountratebasedontheexpectedmarketreturnonbackingassetsisused.Theassumedearningratesforbackingassetsforparticipatingbusinessarelargelydrivenbylong-term(eg10year)governmentbondyields.The10yeargovernmentbondyieldsusedattherelevantvaluationdatesareasshowninthefollowingtable.
Assumedearningratesforeachassetsectoraredeterminedbyaddingtothebondyieldvariousriskpremiumswhichreflecttherelativedifferencesinexpectedfutureearningratesfordifferentassetsectors.Forproductsbackedbymixedportfolioassets,theassumptionvarieswiththeproportionofeachassetsectorbackingtheproduct.Theriskpremiumsapplicableatthevaluationdateareshowninthetablebelow.
Risk premiums
10 year government
bonds%
Local equities
%
International equities
%
Property and Infrastructure
%
Fixed interest
%Cash
%
31 December 2015 Australia 2.9 4.5 3.5 2.5 AMPLife: 0.7 (0.5) NMLA:0.8NewZealand 3.6 4.5 3.5 2.5 AMPLife:0.7 (0.5) NMLA:0.0
31 December 2014 Australia 2.8 4.5 3.5 2.5 AMPLife:0.6 (0.5) NMLA:0.7NewZealand 3.7 4.5 3.5 2.5 AMPLife:0.6 (0.5) NMLA:0.0
Theriskpremiumsforlocalequitiesincludeallowanceforimputationcredits.Theriskpremiumsforfixedinterestreflectcreditratingsoftheportfolioheld.
Theaveragesoftheassetmixesassumedforthepurposeofsettingfutureinvestmentassumptionsforparticipatingbusinessatthevaluationdateareasshowninthetablebelowforeachlifecompany.Theseassetmixesarenotnecessarilythesameastheactualassetmixatthevaluationdateastheyreflectlong-termassumptions.
Average asset mix1 Equities
%
Property and Infrastructure
%
Fixed interest
%Cash
%
31 December 2015 Australia AMPLife 26 13 39 22 NMLA 36 18 32 14NewZealand AMPLife 34 17 42 7 NMLA 38 19 34 9
31 December 2014 Australia AMPLife 25 13 40 22 NMLA 37 18 32 13NewZealand AMPLife 34 17 42 7 NMLA 38 19 34 9
1 TheassetmixinthetableaboveincludesbothconventionalandinvestmentaccountbusinessforAMPLife,butonlyconventionalbusinessforNMLA.Asdescribedinnote1(s),100%ofinvestmentprofitsonNMLA’sinvestmentaccountbusinessareallocatedtopolicyholders.
Whereanassumptionusedisnetoftax,thetaxoninvestmentincomeisallowedforatratesappropriatetotheclassofbusinessandassetsector,includinganyallowanceforimputationcreditsonequityincome.Forthispurpose,thetotalreturnforeachassetsectorissplitbetweenincomeandcapitalgains.Theactualsplithasvariedateachvaluationdateasthetotalreturnhasvaried.F
or p
erso
nal u
se o
nly
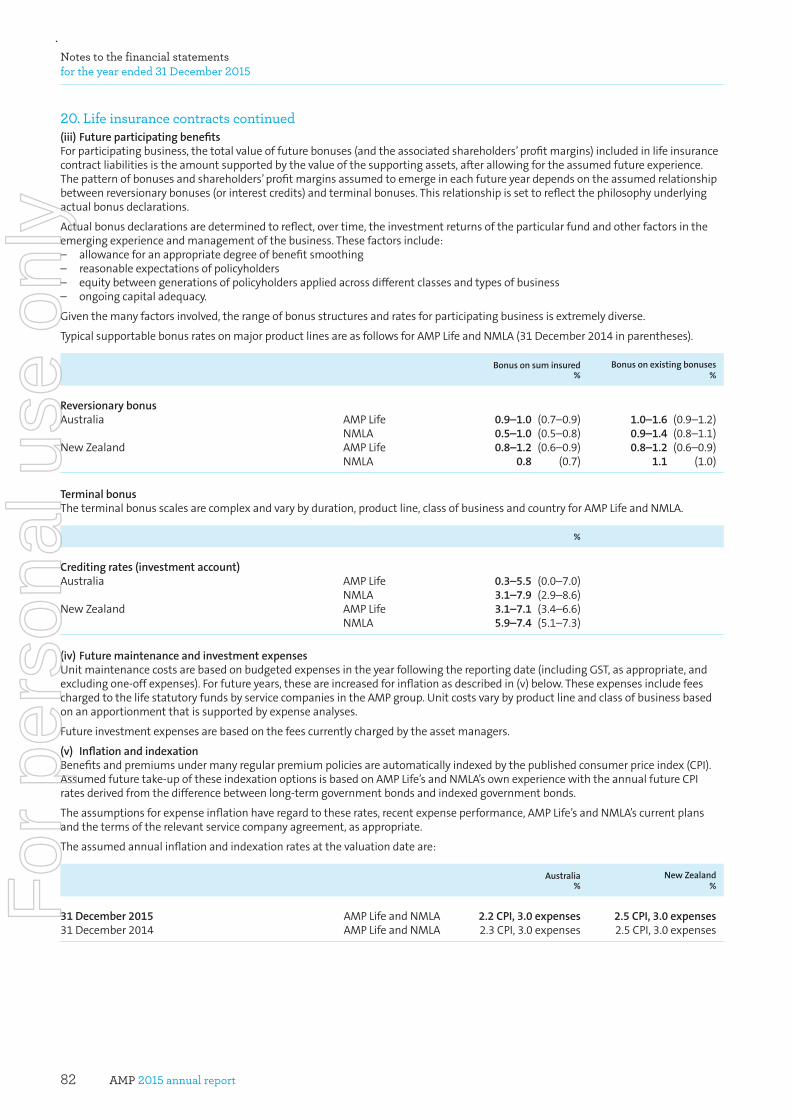
AMP 2015 annual report82
Notes to the financial statements for the year ended 31 December 2015
20. Life insurance contracts continued(iii) Future participating benefitsForparticipatingbusiness,thetotalvalueoffuturebonuses(andtheassociatedshareholders’profitmargins)includedinlifeinsurancecontractliabilitiesistheamountsupportedbythevalueofthesupportingassets,afterallowingfortheassumedfutureexperience.Thepatternofbonusesandshareholders’profitmarginsassumedtoemergeineachfutureyeardependsontheassumedrelationshipbetweenreversionarybonuses(orinterestcredits)andterminalbonuses.Thisrelationshipissettoreflectthephilosophyunderlyingactualbonusdeclarations.
Actualbonusdeclarationsaredeterminedtoreflect,overtime,theinvestmentreturnsoftheparticularfundandotherfactorsintheemergingexperienceandmanagementofthebusiness.Thesefactorsinclude:– allowanceforanappropriatedegreeofbenefitsmoothing– reasonableexpectationsofpolicyholders– equitybetweengenerationsofpolicyholdersappliedacrossdifferentclassesandtypesofbusiness– ongoingcapitaladequacy.
Giventhemanyfactorsinvolved,therangeofbonusstructuresandratesforparticipatingbusinessisextremelydiverse.
TypicalsupportablebonusratesonmajorproductlinesareasfollowsforAMPLifeandNMLA(31December2014inparentheses).
Bonus on sum insured %
Bonus on existing bonuses%
Reversionary bonus Australia AMPLife 0.9–1.0 (0.7–0.9) 1.0–1.6 (0.9–1.2) NMLA 0.5–1.0 (0.5–0.8) 0.9–1.4(0.8–1.1)NewZealand AMPLife 0.8–1.2 (0.6–0.9) 0.8–1.2(0.6–0.9) NMLA 0.8 (0.7) 1.1 (1.0)
Terminal bonusTheterminalbonusscalesarecomplexandvarybyduration,productline,classofbusinessandcountryforAMPLifeandNMLA.
%
Crediting rates (investment account) Australia AMPLife 0.3–5.5 (0.0–7.0) NMLA 3.1–7.9 (2.9–8.6)NewZealand AMPLife 3.1–7.1 (3.4–6.6) NMLA 5.9–7.4 (5.1–7.3)
(iv) Future maintenance and investment expenses Unitmaintenancecostsarebasedonbudgetedexpensesintheyearfollowingthereportingdate(includingGST,asappropriate,andexcludingone-offexpenses).Forfutureyears,theseareincreasedforinflationasdescribedin(v)below.TheseexpensesincludefeeschargedtothelifestatutoryfundsbyservicecompaniesintheAMPgroup.Unitcostsvarybyproductlineandclassofbusinessbasedonanapportionmentthatissupportedbyexpenseanalyses.
Futureinvestmentexpensesarebasedonthefeescurrentlychargedbytheassetmanagers.
(v) Inflation and indexationBenefitsandpremiumsundermanyregularpremiumpoliciesareautomaticallyindexedbythepublishedconsumerpriceindex(CPI).Assumedfuturetake-upoftheseindexationoptionsisbasedonAMPLife’sandNMLA’sownexperiencewiththeannualfutureCPIratesderivedfromthedifferencebetweenlong-termgovernmentbondsandindexedgovernmentbonds.
Theassumptionsforexpenseinflationhaveregardtotheserates,recentexpenseperformance,AMPLife’sandNMLA’scurrentplansandthetermsoftherelevantservicecompanyagreement,asappropriate.
Theassumedannualinflationandindexationratesatthevaluationdateare:
Australia %
New Zealand %
31 December 2015 AMPLifeandNMLA 2.2 CPI, 3.0 expenses 2.5 CPI, 3.0 expenses31December2014 AMPLifeandNMLA 2.3CPI,3.0expenses 2.5CPI,3.0expenses
For
per
sona
l use
onl
y

AMP 2015 annual report 83
20. Life insurance contracts continued(vi) Bases of taxationThebasesoftaxation(includingdeductibilityofexpenses)areassumedtocontinueinaccordancewithlegislationcurrentatthevaluationdate.
(vii) Voluntary discontinuanceAssumptionsfortheincidenceofwithdrawals,paidupsandpremiumdormancyareprimarilybasedoninvestigationsofAMPLife’sandNMLA’sownhistoricalexperience.Theseratesarebasedupontheassessedglobalrateforeachoftheindividualproducts(orproductgroups)andthen,whereappropriate,furtheradjustedforduration,premiumstructure,smokerstatus,ageattainedorshort-termmarketandbusinesseffects.Giventhevarietyofinfluencesaffectingdiscontinuancefordifferentproductgroups,therangeofvoluntarydiscontinuanceratesacrossAMPLifeandNMLAisextremelydiverse.
Theassumptionsforfutureratesofdiscontinuanceforthemajorclassesoflifeinsurancecontractsareshowninthefollowingtable.Thetableincludestheshort-termvoluntarydiscontinuanceassumptionsforAustralianriskbusiness.
31 December 2015 31 December 2014
Business type Life companyAustralia
%New Zealand
%Australia
%New Zealand
%
Conventional AMPLife 1.7–4.1 1.1–1.7 2.1–3.0 1.1–1.9 NMLA 2.1–9.4 1.9–2.5 3.5–4.0 4.1–4.7
Retailrisk(lumpsum) AMPLife 12.1–16.4 12.0–13.0 12.1–17.1 12.0–14.0 NMLA 13.3–15.1 11.6 13.3–15.8 11.6
Retailrisk(incomebenefit) AMPLife 9.1–19.1 11.4 9.1–19.6 11.4 NMLA 12.0–13.3 9.5 12.0–14.0 9.5
FlexibleLifetimeSuper(FLS)riskbusiness AMPLife 10.2–18.9 n/a 10.2–19.4 n/a
Investmentaccount AMPLife n/a n/a n/a n/a NMLA n/a n/a n/a n/a
(viii) Surrender valuesThesurrenderbasesassumedforcalculatingsurrendervaluesarethosecurrentatthereportingdate.Therehavebeennochangestothebasesduringtheyear(ortheprioryear)thatwouldmateriallyaffectthevaluationresults.
(ix) Mortality and morbidity Standardmortalitytables,basedonnationalorindustrywidedata,areused.ThesearethenadjustedbyfactorsthattakeaccountofAMPLife’sandNMLA’sownexperience.
Ratesofmortalityassumedat31December2015forAMPLifeandNMLAareasfollows:
– ConventionalbusinessmortalityratesinAustraliaandNewZealandarebasedonIA95-97withanallowanceforfuturemortalityimprovements.ForAMPLifetheseratesareunchangedfromthoseassumedat31December2014.ForNMLAtheseratesareachangefromthoseassumedat31December2014,whichwerebasedonIA90-92withnoallowanceforfuturemortalityimprovement.TheNMLAassumptionchangewasmadetomorecloselyaligntheassumptiontoactualexperienceovertheprecedingfiveyears.
– Annuitantmortalityratesareunchangedfromthoseassumedat31December2014.
– RetailriskmortalityratesforAMPLifeAustraliahavebeenstrengthenedforsomebusinesslinesfromthoseassumedat31December2014,howevertheystillremainwithinthesamerange,asindicatedinthetables.RetailriskmortalityratesforNMLAAustraliaareunchangedfromthoseassumedat31December2014.TheratesarebasedontheIndustrystandardIA04-08DeathWithoutRiderstablemodifiedbasedonaggregatedexperiencewithoverallproductspecificadjustmentfactors.
– RetailriskmortalityratesforAMPLifeNewZealandandNMLANewZealandarebasedonIndustrystandardIA04-08DeathWithoutRiderstablemodifiedbasedonaggregatedexperiencewithoverallproductspecificadjustmentfactors.
For
per
sona
l use
onl
y

AMP 2015 annual report84
Notes to the financial statements for the year ended 31 December 2015
20. Life insurance contracts continuedForTPDandTraumabusiness,theAMPLifeandNMLAretailriskproductsassumptionsarebasedonthelatestindustrytableIA04-08modifiedbasedonaggregatedexperiencewithoverallproductspecificadjustmentfactors.
Forincomeprotectionbusiness,theassumptionsarebasedontheIAD89-93standardtablemodifiedforAMPLifeandNMLAinbothAustraliaandNewZealandwithoverallproductspecificadjustmentfactors.Theadjustmentfactorsincludeage,gender,occupation,waitingperiod,durationonclaim,benefitbandandbenefitperiod.
Theassumptionsaresummarisedinthefollowingtable:
Conventional – % of IA95-97 (AMP Life)
Conventional – 2015 % of IA95-97
2014 % of IA90-92 (NMLA)
Conventional Male Female Male Female
31 December 2015 Australia 67.5 67.5 67.5 67.5NewZealand 73.0 73.0 73.0 73.0
31 December 2014 Australia 67.5 67.5 60.0 68.0NewZealand 73.0 73.0 81.0 95.0
Retail Lump Sum –% of table (AMP Life)
Retail Lump Sum – % of table (NMLA)
Risk products Male Female Male Female
31 December 2015 Australia1 86–118 86–118 88–104 88–104NewZealand 100 82 120 98
31 December 2014 Australia1 86–118 86–118 88–104 88–104NewZealand 100 82 120 98
1 BaseIA04-08DeathWithoutRiderstablemodifiedbasedonaggregatedexperiencebutwithoverallproductspecificadjustmentfactors.
AMP Life NMLA
AnnuitiesMale –
% of IML00*Female –
% of IFL00*Male –
% of IML00*Female –
% of IFL00*
31 December 2015 AustraliaandNewZealand1 95.0 80.0 95.0 80.0
31 December 2014 AustraliaandNewZealand1 95.0 80.0 95.0 80.0
1 Annuitiestablesmodifiedforfuturemortalityimprovements.
For
per
sona
l use
onl
y

AMP 2015 annual report 85
20. Life insurance contracts continuedTypicalmorbidityassumptions,inaggregate,areasfollows:
Income protection
Incidence rates – % of IAD 89-93
(AMP Life)
Incidence rates – % of IAD 89-93
(NMLA)
Termination rates (ultimate) –
% of IAD 89-93(AMP Life)
Termination rates (ultimate) –
% of IAD 89-93(NMLA)
31 December 2015 Australia 49–138 60–125 44–75 41–72NewZealand 45–67 53–80 57–78 41–57
31 December 2014 Australia 49–138 60–125 44–75 41–72NewZealand 45–67 41–80 57–78 33–46
Retail lump sum
Male % of IA04-08
(AMP Life)
Male % of IA04-08
(NMLA)
Female % of IA04-08
(AMP Life)
Female % of IA04-08
(NMLA)
31 December 2015 AustraliaTPD1 140–155 125–138 177–196 158–175AustraliaTrauma2 105–110 96–116 105–121 96–111NewZealandTPD1 150 194 190 194NewZealandTrauma2 114 101 114 101
31 December 2014 AustraliaTPD1 140–155 125–138 177–196 158–175AustraliaTrauma2 105–110 96–116 105–121 96–111NewZealandTPD1 150 194 190 194NewZealandTrauma2 91 101 91 101
1 BaseIA04-08TPDtablemodifiedbasedonouraggregatedexperiencebutwithoverallproductspecificadjustmentfactors.2 BaseIA04-08Traumatablemodifiedbasedonouraggregatedexperiencebutwithoverallproductspecificadjustmentfactors.
Theactuarialtablesusedwereasfollows:
IA95-97 AmortalitytabledevelopedbytheInstituteofActuariesofAustraliabasedonAustralianinsuredlivesexperiencefrom1995–1997.Thetablehasbeenmodifiedtoallowforfuturemortalityimprovement.
IA90-92 AmortalitytabledevelopedbytheInstituteofActuariesofAustraliabasedonAustralianinsuredlivesexperiencefrom1990-1992.
IML00*/IFL00* IML00andIFL00aremortalitytablesdevelopedbytheInstituteandFacultyofActuariesbasedonUnitedKingdomannuitantlivesexperiencefrom1999–2002.Thetablesrefertomaleandfemalelivesrespectivelyandincorporatefactorsthatallowformortalityimprovementssincethedateoftheinvestigation.IML00*andIFL00*arethesepublishedtablesamendedforsomespecificAMPexperience.
IA04-08DTH ThiswaspublishedbytheInstituteofActuariesofAustraliaunderthenameA graduation of the 2004-2008 Lump Sum Investigation Data.WerefertothistableasIA04-08.ThetablecontainsseparategraduationsforSmokers,Non-Smokers,MalesandFemalesandDeathWithandWithoutRiders.
IA04-08TPD ThisistheTPDgraduationpublishedinthesamepaperasabove.
IA04-08Trauma ThisistheTraumagraduationpublishedinthesamepaperasabove.
IAD89-93 AdisabilitytabledevelopedbytheInstituteofActuariesofAustraliabasedontheAustraliandisabilityincomeexperiencefortheperiod1989–1993.Thistablehasbeenextensivelymodifiedbasedonaggregateexperience.
For
per
sona
l use
onl
y

AMP 2015 annual report86
Notes to the financial statements for the year ended 31 December 2015
20. Life insurance contracts continued(x) Impact of changes in assumptions UnderMoS,forlifeinsurancecontractsvaluationsusingtheprojectionmethod,changesinassumptionsarerecognisedbyadjustingthevalueoffutureprofitmarginsinlifeinsurancecontractliabilities.Futureprofitmarginsarereleasedoverfutureperiods.
Changesinassumptionsdonotincludemarketrelatedchangesindiscountratessuchaschangesinbenchmarkmarketyieldscausedbychangesininvestmentmarketsandeconomicconditions.Thesearereflectedinbothlifeinsurancecontractliabilitiesandassetvaluesatthereportingdate.
Theimpactonfutureprofitmarginsofchangesinassumptionsfrom31December2014to31December2015inrespectoflifeinsurancecontracts(excludingnewbusinesscontractswhicharemeasuredusingassumptionsatreportingdate)isasshowninthetablebelowforthetwolifecompanies.
AMP Life NMLA
Assumption change
Change in future profit
margins$m
Change in life insurance
contract liabilities
$m
Change in shareholders’
profit and equity
$m
Change in future profit
margins$m
Change in life insurance
contract liabilities
$m
Change in shareholders’
profit and equity
$m
Non-marketrelatedchangestodiscountrates 6 – – (1) – –Mortalityandmorbidity (91) – – 14 – –Discontinuancerates – – – – – –Maintenanceexpenses 28 – – 9 – –Otherassumptions1 8 – – (7) – –
1 Otherassumptionchangesincludetheimpactofmodelling,productandpremiumchanges.
Inmostcases,theoverallamountoflifeinsurancecontractliabilitiesandthecurrentperiodprofitarenotaffectedbychangesinassumptions.However,whereinthecaseofaparticularrelatedproductgroup,thechangesinassumptionsattheendofaperiodeliminateanyfutureprofitmarginsfortherelatedproductgroup,andresultsinnegativefutureprofitmargins,thisnegativebalanceisrecognisedasalossinthecurrentperiod.Ifthechangesinassumptionsinaperiodarefavourableforaproductgroupcurrentlyinlossrecognition,thenthepreviouslyrecognisedlossesarereversedintheperiod.
For
per
sona
l use
onl
y

AMP 2015 annual report 87
20. Life insurance contracts continued(g) Insurance risk sensitivity analysis – life insurance contractsForlifeinsurancecontractsthatareaccountedforunderMoS,amountsofliabilities,incomeorexpenserecognisedintheperiodareunlikelytobesensitivetochangesinvariablesevenifthosechangesmayhaveanimpactonfutureprofitmargins,unlesstheproductisinorclosetolossrecognition.
Thistableshowsinformationaboutthesensitivityoflifeinsurancecontractliabilitiesandcurrentperiodshareholderprofitafterincometaxandequity,toanumberofpossiblechangesinassumptionsrelatingtoinsurancerisk.
Change in life insurance contract liabilities
Change in shareholder profit after income tax and equity
Variable Change in variable
Gross of reinsurance
$m
Net of reinsurance
$m
Gross of reinsurance
$m
Net of reinsurance
$m
AMP Life Mortality 10%increaseinmortalityrates (1) (1) 1 1Annuitantmortality 50%increaseintherateof mortalityimprovement 1 1 (1) (1)Morbidity–lumpsumdisablement 20%increaseinlumpsumdisablementrates – – – –Morbidity–disabilityincome 10%increaseinincidencerates 15 11 (11) (8)Morbidity–disabilityincome 10%decreaseinrecoveryrates 36 29 (25) (20)Discontinuancerates 10%increaseindiscontinuancerates – – – –Maintenanceexpenses 10%increaseinmaintenanceexpenses – – – –
NMLA Mortality1 10%increaseinmortalityrates 2 2 (1) (1)Annuitantmortality 50%increaseintherateof mortalityimprovement – – – –Morbidity–lumpsumdisablement 20%increaseinlumpsumdisablementrates – – – –Morbidity–disabilityincome 10%increaseinincidencerates 109 88 (77) (61)Morbidity–disabilityincome 10%decreaseinrecoveryrates 181 139 (127) (98)Discontinuancerates 10%increaseindiscontinuancerates 18 18 (13) (12)Maintenanceexpenses 10%increaseinmaintenanceexpenses 8 8 (5) (5)
1 Thisincludestheimpactondeathbenefitsthatarepayableonsomedisabilityincomeproducts.
(h) Life insurance risk ThelifeinsuranceactivitiesofAMPLifeandNMLAinvolveanumberofnon-financialrisksconcernedwiththepricing,acceptanceandmanagementofthemortality,morbidityandlongevityrisksacceptedfrompolicyholders,ofteninconjunctionwiththeprovisionofwealthmanagementproducts.
Thedesignofproductscarryinginsuranceriskismanagedwithanobjectivetoensurethatpolicywordingandpromotionalmaterialsareclear,unambiguousanddonotleaveAMPLifeandNMLAopentoclaimsfromcausesthatwerenotanticipated.Productpricesaresetthroughaprocessoffinancialanalysis,includingreviewofpreviousAMPLifeandNMLAandindustryexperienceandspecificproductdesignfeatures.Thevariabilityinherentininsurancerisk,includingconcentrationrisk,ismanagedbyhavingalargegeographicallydiverseportfolioofindividualrisks,underwritingandtheuseofreinsurance.
Underwritingismanagedthroughadedicatedunderwritingdepartment,withformalunderwritinglimitsandappropriatetraininganddevelopmentofunderwritingstaff.Individualpoliciescarryinginsuranceriskareunderwrittenontheirmeritsandaregenerallynotissuedwithouthavingbeenexaminedandunderwrittenindividually.Individualpolicieswhicharetransferredfromagroupschemearegenerallyissuedwithoutunderwriting.Groupriskinsurancepoliciesmeetingcertaincriteriaareunderwrittenonthemeritsoftheemployeegroupasawhole.
Claimsaremanagedthroughadedicatedclaimsmanagementteam,withformalclaimsacceptancelimitsandappropriatetraininganddevelopmentofstaffwithanobjectivetoensurepaymentofallgenuineclaims.Claimsexperienceisassessedregularlyandappropriateactuarialreservesareestablishedtoreflectup-to-dateexperienceandanyanticipatedfutureevents.Thisincludesreservesforclaimsincurredbutnotyetreported.
AMPLifeandNMLAreinsure(cede)toreinsurancecompaniesaproportionoftheirportfolioorcertaintypesofinsurancerisk,includingcatastrophe.Thisservesprimarilyto:– reducethenetliabilityonlargeindividualrisks– obtaingreaterdiversificationofinsurancerisks– provideprotectionagainstlargelosses.
ThereinsurancecompaniesareregulatedbytheAustralianPrudentialRegulationAuthority(APRA);orindustryregulatorsinotherjurisdictionsandhavestrongcreditratingsfromA+toAA+.
For
per
sona
l use
onl
y

AMP 2015 annual report88
Notes to the financial statements for the year ended 31 December 2015
20. Life insurance contracts continuedTerms and conditions of life insurance contractsThenatureofthetermsofthelifeinsurancecontractswrittenbyAMPLifeandNMLAissuchthatcertainexternalvariablescanbeidentifiedonwhichrelatedcashflowsforclaimpaymentsdepend.ThefollowingtableprovidesanoverviewofthekeyvariablesuponwhichthetiminganduncertaintyoffuturecashflowsofthevariouslifeinsurancecontractsissuedbyAMPLifeandNMLAdepend.
Type of contract Detail of contract workings Nature of compensation for claims Key variables affecting future cash flows
Non-participating life insurance contracts with fixed and guaranteed terms (term life and disability)
Thesepoliciesprovideguaranteedbenefits,whicharepaidondeathorill-health,thatarefixedandnotatthediscretionoftheLifeCompany.PremiumratesforyearlyrenewablebusinessarenotguaranteedandmaybechangedattheLifeCompany’sdiscretionfortheportfolioasawhole.
Benefits,definedbytheinsurancecontract,arenotdirectlyaffectedbytheperformanceofanyunderlyingassetsortheperformanceofanyassociatedinvestmentcontractsasawhole.
Mortality,morbidity,lapses,expensesandmarketearningratesonassetsbackingtheliabilities.
Life annuity contracts
Inexchangeforaninitialsinglepremium,thesepoliciesprovideaguaranteedregularincomeforthelifeoftheinsured.
Theamountoftheguaranteedregularincomeissetatinceptionofthepolicyincludinganyindexation.
Longevity,expenses,inflationandmarketearningratesonassetsbackingtheliabilities.
Conventional life insurance contracts with discretionary participating benefits (endowment and whole of life)
Thesepoliciescombinelifeinsuranceandsavings.Thepolicyholderpaysaregularpremiumandreceivesthespecifiedsuminsuredplusanyaccruingbonusesondeathormaturity.Thesuminsuredisspecifiedatinceptionandguaranteed.Reversionarybonusesareaddedannually,whichonceadded(vested)areguaranteed.Afurtherterminalbonusmaybeaddedonsurrender,deathormaturity.
Benefitsarisingfromthediscretionarybonusesarebasedontheperformanceofaspecifiedpoolofcontractsandtheassetssupportingthesecontracts.
Marketearningratesonassetsbackingtheliabilities,lapses,expensesandmortality.
Investment account contracts with discretionary participating features
Thegrossvalueofpremiumsreceivedisinvestedintheinvestmentaccountwithfeesandpremiumsforanyassociatedinsurancecoverbeingdeductedfromtheaccountbalancewhendue.Interestiscreditedregularly.
Paymentoftheaccountbalanceisgenerallyguaranteed,althoughitmaybesubjecttocertainpenaltiesonearlysurrenderorlimitedadjustmentinadversemarkets.Operatingprofitarisingfromthesecontractsisallocatedbetweenthepolicyholdersandshareholderswithnotlessthan80%allocatedtopolicyholders.Distributionofpolicyholderprofitisthroughaninterestratemechanism.
Fees,lapses,expensesandmarketearningratesontheassetsbackingtheliabilities.
(i) Liquidity risk and future net cash outflowsThefollowingtableshowstheestimatedtimingoffuturenetcashoutflowsresultingfrominsurancecontractliabilities.Thisincludesestimatedfuturesurrenders,death/disabilityclaimsandmaturitybenefits,offsetbyexpectedfuturepremiumsorcontributionsandreinsurancerecoveries.Allvaluesarediscountedtothereportingdateusingtheassumedfutureinvestmentearningrateforeachproduct.
Up to 1 year$m
1–5 years$m
Over 5 years$m
Total$m
2015 1,116 2,769 8,342 12,2272014 1,233 2,986 9,616 13,835
For
per
sona
l use
onl
y

AMP 2015 annual report 89
21. Other life insurance and investment contract disclosures
Consolidated
2015$m
2014$m
(a) Analysis of life insurance and investment contract profit Componentsofprofitrelatedtolifeinsuranceandinvestmentcontractliabilities: – plannedmarginsofrevenuesoverexpensesreleased 559 546– profits(losses)arisingfromdifferencebetweenactualandassumedexperience 71 171– profits(losses)arisingfromchangesinassumptions 29 (121)– capitalised(losses)reversals – 3
Profit related to life insurance and investment contract liabilities 659 599
Attributableto: – lifeinsurancecontracts 437 381– investmentcontracts 222 218
Profit related to life insurance and investment contract liabilities 659 599
Investment earnings on assets in excess of life insurance and investment contract liabilities 115 133
(b) Restrictions on assets in statutory fundsAMPLifeandNMLAconductinvestment-linkedandnon-investmentlinkedbusiness.Forinvestment-linkedbusiness,depositsarereceivedfrompolicyholders,thefundsareinvestedonbehalfofthepolicyholdersandtheresultingliabilitytopolicyholdersislinkedtotheperformanceandvalueoftheassetsthatbackthoseliabilities.
TheLifeActrequiresthelifeinsurancebusinessofAMPLifeandNMLAtobeconductedwithinlifestatutoryfunds.
AMP Life has three statutory funds as set out below:
No.1fund Australia Capitalguaranteedbusiness(wholeoflife,endowment,investmentaccount,retailandgroupriskandimmediateannuities)
NewZealand Allbusiness(wholeoflife,endowment,investmentaccount,retailandgrouprisk,investment-linkedandimmediateannuities)
No.2fund Australia Investment-linkedsuperannuationbusiness(retailandgroupinvestment-linkedanddeferredannuities)
No.3fund Australia Investment-linkedordinarybusiness
NMLA has six statutory funds as set out below:
No.1fund Australia Capitalguaranteedordinarybusiness(wholeoflife,endowment,investmentaccountandretailandgrouprisk)
NewZealand Allbusiness(wholeoflife,endowment,investmentaccount,retailandgrouprisk,retailandgroupinvestment-linkedandimmediateannuities)
No.2fund Australia Investment-linkedsuperannuationbusiness(retailandgroupinvestment-linkedanddeferredannuities)
No.3fund Taiwan Allbusiness(individualwholeoflife,endowmentandtermandgrouplife)
No.4fund Australia Capitalguaranteedsuperannuationbusiness(wholeoflife,endowment,investmentaccountandretail(lumpsumonly)andgrouprisk)
No.5fund Australia Investment-linkedordinarybusiness
No.6fund Australia NorthlongevityguaranteeFor
per
sona
l use
onl
y

AMP 2015 annual report90
Notes to the financial statements for the year ended 31 December 2015
21. Other life insurance and investment contract disclosures continuedInvestmentsheldinthelifestatutoryfundscanonlybeusedinaccordancewiththerelevantregulatoryrestrictionsimposedundertheLifeActandassociatedrulesandregulations.Themainrestrictionsarethattheassetsinalifestatutoryfundcanonlybeusedtomeettheliabilitiesandexpensesofthatlifestatutoryfund,toacquireinvestmentstofurtherthebusinessofthelifestatutoryfundorasdistributionsprovidedsolvency,capitaladequacyandotherregulatoryrequirementsaremet.Seefurtherdetailsaboutsolvencyandcapitaladequacyinnote21(d).
AustralianAccountingStandardsrequiretheincome,expenses,assetsandliabilitiesinthefinancialstatementsofAMPLifeandNMLAtoincludeamountsattributabletopolicyholdersininvestment-linkedandnon-investmentlinkedbusinessofthelifestatutoryfunds.Thefollowingtableshowsasummaryofthebalancesinthelifestatutoryfundsdisaggregatedbetweennon-investmentlinkedandinvestment-linkedbusiness:
2015 AMP Life and NMLA
2014 AMP Life and NMLA
Non-investment
linked$m
Investment- linked
$m
Total life entities’
statutory funds
$m
Non-investment
linked$m
Investment- linked
$m
Total life entities’
statutory funds
$m
Net assets of life entities’ statutory funds attributable to policyholders and shareholders 30,254 67,096 97,350 30,955 63,968 94,923
Attributable to policyholders Lifeinsurancecontractliabilities 23,871 – 23,871 24,403 – 24,403Investmentcontractliabilities1 2,912 66,849 69,761 3,149 63,728 66,877
26,783 66,849 93,632 27,552 63,728 91,280
Attributable to shareholders 3,471 247 3,718 3,403 240 3,643
1 InvestmentcontractliabilitiesinthetableaboveexcludetheinvestmentcontractliabilityfortheNorthcapitalguaranteewhichisheldoutsidethelifecompanies.
Thenetassetsoflifestatutoryfundsattributabletoshareholdersrepresenttheinterestsofshareholdersincludingfundsrequiredtomeetregulatoryrequirementsaswellasfurtheramountsofshareholderfundsinexcessofregulatoryrequirements.
Impact of the AMP life statutory fund amounts on the AMP group consolidated financial statementsTotheextentthatinvestmentsbytheAMPlifestatutoryfundsareheldthroughwhollyorpartlyownedcontrolledentitiesofthelifestatutoryfunds,thebalancesofthosecontrolledentitiesareconsolidatedbyAMPLifeandNMLAandthereforebecomepartoftheconsolidatedbalancesofthisAMPgroupfinancialreport.Theconsolidatedbalancesinclude100%oftheunderlyinginvestmentsinfinancialassets,investmentproperty,andothernetoperatingassetsofthecontrolledentitiesofAMPlifeinsuranceentities’statutoryfunds.MostofthecontrolledentitiesaremanagedinvestmentschemesandtheshareoftheconsolidatedprofitandnetassetsofthosemanagedinvestmentschemesattributabletounitholdersotherthantheAMPlifeinsuranceentities’statutoryfundsisrecognisedintheconsolidatedIncomestatementasMovementinexternalunitholders’liabilitiesandintheconsolidatedStatementoffinancialpositionasExternalunitholders’liabilities.
For
per
sona
l use
onl
y

AMP 2015 annual report 91
21. Other life insurance and investment contract disclosures continuedThefollowingtableshowsasummaryoftheconsolidatedbalancesofAMPlifeinsuranceentities’statutoryfundsandtheentitiescontrolledbyAMPlifeinsuranceentities’statutoryfunds.
Life entities’ statutory funds consolidated
2015$m
2014$m
Income statement Insurancepremiumandrelatedrevenue 2,465 2,427Feerevenue 1,592 1,184Otherrevenue 38 28Investmentgainsand(losses) 8,016 11,485Insuranceclaimsandrelatedexpenses (2,164) (2,166)Operatingexpensesincludingfinancecosts (2,596) (2,210)Movementinexternalunitholders’liabilities (1,006) (1,473)Changeinlifeinsurancecontractliabilities (240) (1,333)Changeininvestmentcontractliabilities (4,384) (6,229)Incometax(expense)/credit (249) (889)
Profit 1,472 824
Assets Cashandcashequivalents 7,755 7,852Investmentsinfinancialassetsmeasuredatfairvaluethroughprofitorloss 107,061 99,942Investmentproperty 746 682Otherassets 4,546 5,545
Total assets of policyholders, shareholders and non-controlling interests 120,108 114,021
Liabilities Lifeinsurancecontractliabilities 23,871 24,403Investmentcontractliabilities 69,762 66,877Otherliabilities 8,550 7,927Externalunitholders’liabilities 13,893 11,012
Total liabilities of policyholders, shareholders and non-controlling interests 116,076 110,219
Net assets 4,032 3,802
Consolidated
2015$m
2014$m
(c) Capital guarantees Lifeinsurancecontractswithadiscretionaryparticipatingfeature – amountoftheliabilitiesthatrelatetoguarantees 15,991 16,632
Investment-linkedcontracts – amountoftheliabilitiessubjecttoinvestmentperformanceguarantees 973 991
Otherlifeinsurancecontractswithaguaranteedterminationvalue – currentterminationvalue 178 129
For
per
sona
l use
onl
y

AMP 2015 annual report92
Notes to the financial statements for the year ended 31 December 2015
21. Other life insurance and investment contract disclosures continued(d) Capital requirements Registeredlifeinsuranceentitiesarerequiredtoholdprudentialreserves,overandabovetheirlifeinsurancecontractandinvestmentcontractliabilities,asabufferagainstadverseexperienceandpoorinvestmentreturns.ThesereservingrequirementsarespecifiedbytheAPRAprudentialcapitalstandards.Thestandardsareintendedtotakeaccountofthefullrangeofriskstowhicharegulatedinstitutionisexposedandintroducestheprescribedcapitalamount(PCA)requirement.ThePCAistheminimumlevelofcapitalthattheregulatordeemsmustbeheldtomeetpolicyholderobligations.
Inadditiontotheregulatorycapitalrequirements,theAMPlifeinsuranceentitiesmaintainatargetsurplusprovidinganadditionalcapitalbufferagainstadverseevents.TheAMPlifeinsuranceentitiesuseinternalcapitalmodelstodeterminetargetsurplus,withthemodelsreflectingtherisksofthebusiness,principallytheriskofadverseassetmovementsrelativetotheliabilitiesandofworsethanexpectedclaimscosts.
TheexcessoftheAMPlifeinsuranceentities’capitalbaseoverthePCAasat31December2015was$1,228m(2014:$1,188m)and$498m(2014:$441m)forAMPLifeandNMLArespectively.
TheappointedactuaryofAMPLifeandNMLAhasconfirmedthatthecapitalbaseofeachlifestatutoryfundandshareholders’fundhaveexceededPCAatalltimesduring2015and2014.
2015 2014
AMP Life$m
NMLA$m
AMP Life$m
NMLA$m
CommonEquityTier1Capital 3,091 1,450 3,241 1,491AdjustmentstoCommonEquityTier1Capital (1,424) (713) (1,333) (712)AdditionalTier1Capital 205 100 – –AdjustmentstoAdditionalTier1Capital – – – –Tier2Capital 215 85 215 85AdjustmentstoTier2Capital – – – –
Total capital base 2,087 922 2,123 864
Total prescribed capital amount (PCA) 860 424 935 423
Capital adequacy multiple 243% 217% 227% 204%
(e) Actuarial information MrAntonKapel,theappointedactuaryofAMPLifeandNMLA,issatisfiedastotheaccuracyofthedatausedinthevaluationsinthefinancialreportandinthetablesinthisnoteandnote20.
Theliabilitiestopolicyholders(beingthesumofthelifeinsurancecontractandinvestmentcontractliabilities,includinganyassetorliabilityarisinginrespectofthemanagementserviceselementofaninvestmentcontract),capitalbaseandprescribedcapitalamountshavebeendeterminedatthereportingdateinaccordancewiththeLifeAct.
(f) Amounts which may be recovered or settled within 12 months after the reporting date Basedonassumptionsastolikelywithdrawalpatternsofthevariousproductgroups,itisestimatedthatapproximately$13,740m(2014:$13,402m)ofpolicyliabilitiesmaybesettledwithin12monthsofthereportingdate.
For
per
sona
l use
onl
y

AMP 2015 annual report 93
22. Risk management and financial instruments disclosures(a) Financial risk management Financialriskmanagement(FRM)atAMPisanintegralpartoftheAMPgroup’senterpriseriskmanagementframework.
Risks and mitigation FinancialrisksarisingintheAMPgroupincludemarketrisk(investmentrisk,interestraterisk,currencyrisk,propertyrisk,andequitypricerisk);liquidityandrefinancingrisk;andcreditrisk.Theserisksaremanagedaccordingtotheenterpriseriskmanagementpolicyandindividualpoliciesforeachriskcategory.Thisfinancialriskmanagementincludestheuseofderivativefinancialinstrumentssuchascross-currencyandinterestrateswaps,forwardrateagreements,futures,optionsandforeigncurrencycontractstohedgeriskexposuresarisingfromchangesininterestratesandforeignexchangerates.
Financialriskmanagementincludesdecisionsmadeabouttheallocationofinvestmentassetsacrossassetclassesand/ormarketsandthemanagementofriskswithintheseassetclasses.FinancialriskforinvestmentsintheAMPgroupismanagedbyreferencetotheprobabilityoflossrelativetoexpectedincomeoveraone-yeartimehorizonata90%confidencelevel(profitatrisk).Inrespectofinvestmentsheldintheshareholderfundandinthelifestatutoryfunds,thelosstoleranceoverthediscretionaryinvestmentsissetatalowlevelbecauseAMPhasequitymarketexposureinitsbusinesses(egthroughfeesonassetsundermanagement).
Marketriskistheriskthatthefairvalueofassetsandliabilities,orfuturecashflowsofafinancialinstrumentwillfluctuateduetomovementsinthefinancialmarkets.Thesemovementsincludeforeignexchangerates,interestrates,creditspreads,equitypricesorpropertyprices.MarketriskintheAMPgrouparisesfromthemanagementofinsurancecontractsandinvestmentofshareholdercapitalincludinginvestmentsinequities,property,interestbearinginvestmentsandborrowings.
(b) Market risk sensitivity analysisTheparagraphsbelowincludesensitivityanalysistablesshowinghowtheprofitaftertaxandequitywouldhavebeenimpactedbychangesinmarketriskvariablesincludinginterestrateriskandcurrencyriskasdefinedinAASB7Financial Instruments: Disclosures.Theyshowthedirectimpactontheprofitaftertaxorequityofareasonablypossiblechangeinfactorswhichaffectthecarryingvalueoffinancialassetsandfinancialliabilitiesheldattheendofthereportingperiod.
Thesensitivityisrequiredtoshowtheimpactofareasonablypossiblechangeinmarketrate(itisnotintendedtoillustratearemote,worstcase,stresstestscenarionordoesitrepresentaforecast.Inadditionitdoesnotincludetheimpactofanymitigatingmanagementactions)overtheperiodtothesubsequentreportingdate.Thecategoriesofrisksfacedandmethodsusedforderivingsensitivityinformationdidnotchangefrompreviousperiods.
Marketriskrelatingtotheparententityispredominantlyinrelationtosubordinateddebtissues,specificallyAMPNotes2,AMPWholesaleCapitalNotesandAMPCapitalNotes.TheproceedsofeachoftheseissueshavebeenonlenttootherAMPsubsidiariesonsimilartermsandconditions.InthecaseofAMPWholesaleCapitalNotesandAMPCapitalNotestheamountslenttoAMPsubsidiariesareclassifiedasequitysecuritiesintheStatementoffinancialposition.
Interest rate riskInterestrateriskistheriskofanimpactontheAMPgroup’sprofitaftertaxandequityfrommovementsinmarketinterestrates,includingchangesintheabsolutelevelsofinterestrates,theshapeoftheyieldcurve,themarginbetweendifferentyieldcurvesandthevolatilityofinterestrates.
InterestrateriskarisesfrominterestbearingfinancialassetsandfinancialliabilitiesinvariousactivitiesoftheAMPgroup.Managementofthoserisksisdecentralisedaccordingtotheactivity.Detailsareasfollows:
– The AMP group’s long-term borrowings and the AMP group’s and the parent entity’s subordinated debt–interestrateriskarisesinrelationtolong-termborrowingsandsubordinateddebtraisedthroughacombinationofAustraliandollar,NewZealanddollarandpoundsterlingdenominatedfixed-rateandfloating-ratefacilities.MostoftheAMPgroup’sdebtisAustraliandollardenominatedandtheAMPgroup’sforeigndenominateddebtisconvertedtofloating-rateAustraliandollarsthroughcross-currencyswaps.Interestrateriskismanagedbyenteringfloating-to-fixedinterestrateswaps,whichhavetheeffectofconvertingborrowingsfromfloatingratestofixedrates.Undertheinterestrateswaps,theAMPgroupagreeswithotherpartiestoexchange,atspecifiedintervals(mainlyquarterly),thedifferencebetweenfixedcontractratesandfloating-rateinterestamountscalculatedbyreferencetotheagreednotionalprincipalamounts.
For
per
sona
l use
onl
y

AMP 2015 annual report94
Notes to the financial statements for the year ended 31 December 2015
22. Risk management and financial instruments disclosures continued– AMP Life and NMLA–asdiscussedinnote1(c),AMPLifeandNMLAconducttheirwealthmanagementandlifeinsurancebusiness
throughseparatelifestatutoryfunds.Investmentassetsofthelifestatutoryfundsincludinginterest-bearingfinancialassetsareheldtobackinvestmentcontractliabilities,lifeinsurancecontractliabilities,retainedprofitsandcapital.
TheinterestrateriskofAMPLifeandNMLAwhichimpactsshareholdersarisesinrespectoffinancialassetsandliabilitiesheldintheshareholderfundandinthelifestatutoryfunds.Ariskarisestotheextentthatthereisaneconomicmismatchbetweenthetimingofpaymentstolifepolicyholdersandthedurationoftheassetsheldinthelifestatutoryfundstobackthepolicyholderliabilities.Wherealiabilityinrespectofinvestmentcontractsisdirectlylinkedtothevalueoftheassets(whereapplicable,netofrelatedliabilities)heldtobackthatliability(investment-linkedbusiness),thereisnoresidualinterestrateexposurewhichwouldimpactshareholders.
Managementofvariousrisksassociatedwithinvestmentsundertakenbylifestatutoryfundsandthelifeshareholderfund,suchasinterestraterisk,issubjecttotherelevantregulatoryrequirementsgovernedbytheLifeAct.AMPLifeandNMLAarerequiredtosatisfycapitaladequacyrequirements,includingholdingstatutoryreservestocaterforinterestraterisktotheextentthatassetsarenotmatchedagainstliabilities.
AMPLifeandNMLAmanageinterestrateandothermarketriskspursuanttoanassetandliabilitymanagementpolicythathasregardtopolicyholderexpectationsandriskstotheAMPLifeandNMLABoard’stargetsurplusphilosophyforcapitalasadvisedbytheappointedactuary.
– AMP Bank–interestrateriskarisesinAMPBankfrommismatchesintherepricingtermsofassetsandliabilities(egathree-yearfixedrateloanfundedwitha90daytermdeposit–termrisk)andvariablerateshort-termrepricingbases(basisrisk).AMPBankusesnaturaloffsets,interestrateswapsandbasisswapstohedgethemismatcheswithinexposurelimits.GroupTreasurymanagestheinterestrateexposureinAMPBankbymaintaininganetinterestrateriskpositionwithinthelimitsdelegatedandapprovedbytheAMPBankBoard.
Interest rate risk sensitivity analysisThisanalysisdemonstratestheimpactofa100basispointchangeinAustralianandinternationalinterestrates,withallothervariablesheldconstant,onprofitaftertaxandequity.Itisassumedthatallunderlyingexposuresandrelatedhedgesareincludedinthesensitivityanalysis,thatthe100basispointchangeoccursasatthereportingdateandthatthereareconcurrentmovementsininterestratesandparallelshiftsintheyieldcurves.Theimpactonequityincludesboththeimpactonprofitaftertaxaswellastheimpactofamountsthatwouldbetakendirectlytoequityinrespectoftheportionofchangesinthefairvalueofderivativesthatqualifyascashflowhedgesforhedgeaccounting.
2015 2014
Impact on profit after tax
Impact on equity
Impact on profit after tax
Impact on equity
Change in variables
Increase (decrease)
$m
Increase (decrease)
$m
Increase (decrease)
$m
Increase (decrease)
$m
+100basispoints (49) (34) (22) 2-100basispoints 47 32 2 (23)
Currency riskCurrency riskistheriskofanimpactontheAMPgroup’sprofitaftertaxandequityfrommovementsinforeignexchangerates.ChangesinvaluewouldoccurinrespectoftranslatingtheAMPgroup’scapitalinvestedinoverseasoperationsintoAustraliandollarsatthereportingdate(translationrisk)orfromforeignexchangeratemovementsonspecificcashflowtransactions(transactionrisk).
Otherthanwheretheimpactwouldbeimmaterial,borrowingsaretypicallyconvertedtoAustraliandollarsthroughcross-currencyswaps,individualinvestmentassetsinshareholdercapital(excludingtheinternationalequitiesportfolioattributabletoshareholderswithintheAMPLifeStatutoryFundNo.1fund)andseedandsponsorcapitalinvestmentsarehedged,andexpectedforeigncurrencyreceiptsandpaymentsarehedgedoncethevalueandtimingoftheexpectedcashflowisknown.SubjecttoGroupALCOapproval,GroupTreasurymayallowfornaturalhedgingofforeignexchangeriskthroughunhedgedforeigncurrencyborrowings,orenterintodiscretionaryforeignexchangetransactionstohedgeenterprise-wideexposures.
TheAMPgroupdoesnothedgethecapitalinvestedinoverseasoperations(otherthanforeignseedandsponsorcapitalinvestments),therebyacceptingtheforeigncurrencytranslationriskoninvestedcapitalwithmovementsthroughforeigncurrencytranslationreserve.
For
per
sona
l use
onl
y

AMP 2015 annual report 95
22. Risk management and financial instruments disclosures continuedCurrency risk sensitivity analysisThisanalysisdemonstratestheimpactofa10%movementofexchangeratesagainsttheAustraliandollar,withallothervariablesheldconstant,ontheprofitaftertaxandequityduetochangesinfairvalueofcurrencysensitivemonetaryassetsandliabilitiesatthereportingdate.Itisassumedthatthe10%changeoccursasatthereportingdate.
2015 2014
Impact on profit after tax
Impact on equity
Impact on profit after tax
Impact on equity
Change in variables
Increase (decrease)
$m
Increase (decrease)
$m
Increase (decrease)
$m
Increase (decrease)
$m
10%depreciationofAUD 6 38 2 3210%appreciationofAUD (7) (33) (4) (28)
Equity price riskEquity price riskistheriskofanimpactontheAMPgroup’sprofitaftertaxandequityfrommovementsinequityprices.TheAMPgroupmeasuresequitysecuritiesatfairvaluethroughprofitorloss.GroupTreasurymay,withGroupALCOapproval,useequityexposuresorequityfuturesoroptionstohedgeotherenterprise-wideequityexposures.
Equity price risk sensitivity analysisTheanalysisdemonstratestheimpactofa10%movementinAustralianandInternationalequitiesheldatthereportingdate.Thissensitivityanalysishasbeenperformedtoassessthedirectriskofholdingequityinstruments.AnypotentialindirectimpactonfeesfromtheAMPgroup’sinvestment-linkedbusinessisnotincluded.
2015 2014
Impact on profit after tax
Impact on equity
Impact on profit after tax
Impact on equity
Increase (decrease)
$m
Increase (decrease)
$m
Increase (decrease)
$m
Increase (decrease)
$m
10%increaseinAustralianequities 10 10 7 710%increaseinInternationalequities 10 10 11 11
10%decreaseinAustralianequities (11) (11) (9) (9)10%decreaseinInternationalequities (11) (11) (13) (13)
(c) Liquidity and refinancing risk Liquidity riskistheriskthattheAMPgroupisnotabletomeetitsdebtobligationsorothercashoutflowsastheyfallduebecauseofaninabilitytoliquidateassetsorobtainadequatefundingwhenrequired.Refinancing riskistheriskthattheAMPgroupisnotabletorefinancethefullquantumofitsongoingdebtrequirementsonappropriatetermsandpricing.ThisincludestheAMPgroupcorporatedebtportfolio,AMPBankandAMPCapitalthroughvariousinvestmentfunds,entitiesormandatesthatAMPmanagesorcontrolsorinwhichAMPCapital,AMPLifeorNMLAhassignificantownershipinterestorinfluence.
ToensurethattheAMPgrouphassufficientfundsavailable,intheformofcash,liquidassets,borrowingcapacityandundrawncommittedfundingfacilitiestomeetitsliquidityrequirements,GroupTreasurymaintainsadefinedsurplusofcashtomitigaterefinancingrisk,satisfyregulatoryrequirementsandprotectagainstliquidityshocksinaccordancewiththeliquidityriskmanagementpolicyapprovedbytheAMPLimitedBoard.
FinanciersofloanslendingtocontrolledentitiesofthelifestatutoryfundsdonothavelegalrecoursebeyondtheoperatingsubsidiaryborrowerandthereisnodirecteffectonanyotherAMPgroupdebt.
For
per
sona
l use
onl
y

AMP 2015 annual report96
Notes to the financial statements for the year ended 31 December 2015
22. Risk management and financial instruments disclosures continuedThefollowingtablesummarisesthematurityprofilesoftheAMPgroup’sundiscountedfinancialliabilitiesandoff-balancesheetitemsatthereportingdate.Thematurityprofilesarebasedoncontractualundiscountedrepaymentobligations.Repaymentsthataresubjecttonoticearetreatedasifnoticeweretobegivenimmediately.
Maturity profiles of undiscounted financial liabilities and off-balance sheet items
Up to 1 year or no term
$m
1–5 years
$m
Over 5 years
$mOther2
$mTotal
$m
2015Non-derivative financial liabilities1 Payables 1,940 91 – – 2,031 Borrowings 10,454 4,470 1,689 – 16,613Subordinateddebt 675 953 370 – 1,998 Investmentcontractliabilities 927 905 1,473 66,952 70,257 Externalunitholders’liabilities – – – 13,571 13,571
Derivative financial instruments Crosscurrencyswaps – outflows – – – – – – inflows – – – – – Interestrateswaps 27 89 – – 116
Off-balance sheet items Credit-relatedcommitments–AMPBank4 1,785 – – – 1,785 Credit-relatedcommitments–Securitisationvehicles4 1,112 – – – 1,112
Total undiscounted financial liabilities and off-balance sheet items3 16,920 6,508 3,532 80,523 107,483
2014 Non-derivative financial liabilities1 Payables 1,949 2 – – 1,951Borrowings 12,506 4,565 1,464 – 18,535Subordinateddebt 64 1,499 97 – 1,660Investmentcontractliabilities 1,088 944 1,514 63,728 67,274Externalunitholders’liabilities – – – 11,335 11,335
Derivative financial instruments Crosscurrencyswaps – outflows 4 16 10 – 30– inflows (2) (7) (5) – (14)Interestrateswaps 374 630 132 – 1,136
Off-balance sheet items Credit-relatedcommitments–AMPBank4 1,940 – – – 1,940Credit-relatedcommitments–Securitisationvehicles4 865 – – – 865
Total undiscounted financial liabilities and off-balance sheet items3 18,788 7,649 3,212 75,063 104,712
1 ThetableprovidesmaturityanalysisofAMPgroupfinancialliabilitiesincludingfinancialliabilitiesofcontrolledentitiesofthelifeentities’statutoryfundsandnon-linkedinvestmentcontractsincludingtermannuities.
2 Investmentcontractliabilitiesareliabilitiestopolicyholdersforinvestment-linkedbusinesslinkedtotheperformanceandvalueofassetsthatbackthoseliabilities.Ifallthosepolicyholdersclaimedtheirfunds,theremaybesomedelaysinsettlingtheliabilityasassetsareliquidated,buttheshareholderhasnodirectexposuretoanyliquidityrisk.Externalunitholders’liabilitiesallrelatetocontrolledentitiesofthelifeentities’statutoryfundsandwouldonlybepaidwhenthecorrespondingassetsarerealised.
3 Estimatednetcashoutflowprofileoflifeinsurancecontractliabilities,disclosedinnote20,areexcludedfromtheabovetable.4 LoancommitmentsrelatetocommitmentstoprovidecredittocustomersofAMPBank.
For
per
sona
l use
onl
y

AMP 2015 annual report 97
22. Risk management and financial instruments disclosures continued(d) Credit riskCreditriskincludesbothsettlementcreditexposuresandtradedcreditexposures.Credit default riskistheriskofanadverseimpactonresultsandassetvaluesrelativetoexpectationsduetoacounterpartyfailingtomeettheircontractualcommitmentsinfullandontime(obligator’snon-paymentofadebt).Traded credit riskistheriskofanadverseimpactonresultsandassetvaluesrelativetoexpectationsduetochangesinthevalueofatradedfinancialinstrumentasaresultofchangesincreditriskonthatinstrument.
TheAMPconcentrationriskpolicysetsouttheassessmentanddeterminationofwhatconstitutescreditrisk.Thepolicyhassetexposurelimitsforeachcounterpartyandcreditratingband.CompliancewiththispolicyismonitoredandexposuresandbreachesarereportedtoseniormanagementandtheAMPRiskCommitteethroughmonthlyandquarterlyfinancialriskmanagement(FRM)reports.
CreditriskmanagementisdecentralisedinbusinessunitswithintheAMPgroup.However,creditriskdirectlyandindirectly(intheparticipatingbusiness)impactingshareholdercapitalismeasuredandmanagedbyGroupTreasuryonagroupbasis,byaggregatingriskfromcreditexposurestakeninbusinessunits,asdetailedbelow:
– AMP Life and NMLA–wholesalecreditriskontheinvestedfixedincomeportfoliosintheAMPLifeandNMLAstatutoryfundsismanagedbytheAMPCapitalRiskandComplianceCommittee(AMPCapitalR&C)andreportedtothefundmanagers,withinspecifiedcreditcriteriainthemandateapprovedbytheAMPLifeandNMLABoards.TheshareholderportionofwholesalecreditriskinAMPLifeandNMLAisreportedtoGroupALCObyGroupTreasury.
– AMP Capital–wholesalecreditrisk,includingportfolioconstruction,inthefixedincomeportfoliosmanagedbyAMPCapitalistheresponsibilityoftheindividualinvestmentteams.Thereisalsoadedicatedcreditresearchteamandaspecificcreditinvestmentcommittee.TheinvestmentriskandperformanceteamprovidesreportstotheAMPCapitalInvestmentCommittee.Thiswholesalecreditriskinthecashandfixedincomeportfoliosrelatingdirectlytoshareholders’fundsisincludedintheaggregationbyGroupTreasuryandreportedtoGroupALCOandtheAMPRiskCommittee.
– AMP Bank –creditriskarisinginAMPBankaspartoflendingactivitiesandmanagementofliquidityismanagedasprescribedbyAMPBank’sRiskManagementSystemsDescription(RMSD)andreportedtoAMPBankALCOmonthly.WholesalecreditexposuresinAMPBank’sliquidityportfolioareincludedintheaggregationbyGroupTreasuryandreportedtoGroupALCO.
(i) Management of credit risk concentrationConcentrationofcreditriskariseswhenanumberoffinancialinstrumentsorcontractsareenteredintowiththesamecounterpartyorwhereanumberofcounterpartiesareengagedinsimilarbusinessactivitiesthatwouldcausetheirabilitytomeetcontractualobligationstobesimilarlyaffectedbychangesineconomicorotherconditions.Concentrationofcreditriskismanagedthroughbothaggregatecreditratinglimitsandindividualcounterpartylimits,whicharedeterminedpredominantlyonthebasisofthecounterparty’screditrating.
Atthereportingdate,thereisnospecificconcentrationofcreditriskwithasinglecounterpartyarisingfromtheuseoffinancialinstruments,otherthanthenormalclearing-houseexposuresassociatedwithdealingsthroughrecognisedexchanges.
Thecounterpartiestonon-exchangetradedcontracts,atthetimeofenteringthosecontracts,arelimitedtocompanieswithinvestmentgradecredit(BBB-orgreater).ThecreditrisksassociatedwiththesecounterpartiesareassessedunderthesamemanagementpoliciesasappliedtodirectinvestmentsintheAMPgroup’sportfolio.
CreditriskassociatedwithderivativesismitigatedthroughtheuseofCreditSupportAnnex(CSA)whichfacilitatethebi-lateralpostingofcollateralwithderivativecounterparties.
ComplianceismonitoredandexposuresandbreachesarereportedtoseniormanagementandtheAMPRiskCommitteethroughthemonthlyandquarterlyFRMreport.
(ii) Exposure to credit riskTheexposuresoninterestbearingsecuritiesandcashequivalentswhichimpacttheAMPgroup’scapitalpositionaremanagedbyGroupTreasurywithinlimitssetbytheAMPConcentrationRiskPolicy.ThefollowingtableprovidesinformationregardingthecreditriskexposuresforrateditemsmonitoredbyGroupTreasuryaccordingtothecreditratingofthecounterparties.
2015 $m
2014$m
AAA 5,243 5,283AA-toAA+ 11,784 9,252A-to A+ 3,754 3,902BBB-toBBB+ 2,548 2,041BB+andbelow – 519
Total financial assets with credit risk exposure monitored by AMP Treasury 23,329 20,997
For
per
sona
l use
onl
y

AMP 2015 annual report98
Notes to the financial statements for the year ended 31 December 2015
22. Risk management and financial instruments disclosures continued(iii) Credit risk of the loan portfolio in AMP BankAMPBankispredominantlyalenderforresidentialproperties–bothowneroccupiedandforinvestment.Ineverycase,AMPBankcompletesacreditassessment,whichincludescostoflivingallowanceandrequiresvaluationoftheproposedsecurityproperty.About18%(2014:30%)ofAMPBank’sresidentialloanportfolioissecuritisedandallloansinsecuritisationvehiclesaremortgageinsured,therebyfurthermitigatingtherisk.AMPBank’sCreditCommitteeandBoardoverseetrendsinlendingexposuresandcompliancewithconcentrationlimitsasafurtherbasisoflimitinglendingrisk.AMPBanksecuresitsloanwithfirstregisteredmortgagesoverrelevantpropertiesandasaresultmanagescreditriskonitsloanwithconservativelendingpoliciesandparticularfocusontheloantovalueratio(LVR).TheLVRiscalculatedbydividingthetotalloanamountoutstandingbythelowerofAMPBank’sapprovedvaluationamountorthepurchaseprice.LoanswithLVRgreaterthan80%arefullymortgageinsured.MortgageinsuranceisprovidedbyGenworthMortgageInsuranceAustraliaLtdandQBELendersMortgageInsuranceLtdwhoarebothregulatedbyAPRA.ThepotentialcreditexposuretotheloanmortgageinsurershasbeenassessedtobeminimalduetothestablehistoricalrelationshipwiththeBankandminimallevelofhistoricclaimsrejectionsandreductions.TheaverageLVRatoriginationofAMPBank’sloanportfolioforexistingandnewbusinessissetoutinthefollowingtable:
LVR
Existing business
2015 %
New business
2015 %
Existing business
2014 %
New business
2014 %
0–50 16 8 16 851–60 10 7 10 661–70 15 12 15 1071–80 40 50 41 5481–90 14 11 13 1091–95 5 12 4 11>95 – – 1 1
(iv) Past due but not impaired financial assetsThefollowingtableprovidesanageinganalysisoffinancialassetsthatarepastdueasatreportingdatebutnotimpaired.Nodisclosuresarerequiredfortheparententityastheparententitydoesnothaveanyfinancialassetsthatarepastduebutnotimpairedatreportingdate.
Past due but not impaired
Less than 31 days
$m
31–60 days
$m
61–90 days
$m
More than 91 days
$mTotal
$m
2015Receivables – tradedebtors 6 6 4 10 26 – otherreceivables 8 – – 1 9 Debtsecurities – loansandadvances 341 46 18 58 463
Total1 355 52 22 69 498
2014 Receivables – tradedebtors 5 2 1 3 11– otherreceivables 11 – 2 – 13Debtsecurities – loansandadvances 320 48 20 57 445
Total1 336 50 23 60 469
1 Forinvestment-linkedbusinessinAMPLifeandNMLA,theliabilitytopolicyholdersislinkedtotheperformanceandvalueoftheassetsthatbackthoseliabilities.Theshareholderhasnodirectexposuretoanycreditriskinthoseassets.Therefore,thetablesinthissectiondonotshowthepastduefinancialassetsbackinginvestment-linkedbusinessinAMPLife.
For
per
sona
l use
onl
y

AMP 2015 annual report 99
22. Risk management and financial instruments disclosures continued(v) Adjustment for own credit risk in the determination of the fair value of life investment contract policy liabilitiesThefairvalueofnon-investmentlinkedinvestmentcontractliabilitiesincludesthefollowingallowanceforthecreditriskthatanexternalpartywouldascribetoanamountduefromAMPLifeandNMLA.
2015 $m
2014$m
Cumulativeadjustment 8 9Changeduringtheperiod (1) (2)
Theadjustmenthasbeendeterminedasthedifferencebetweenthefairvaluerecognisedandanamountcalculatedonthesamebasisusingarisk-freeinterestrateinplaceofthefairvaluediscountrate.
(vi) Impaired financial assets and impairment assessmentAMPBankmaintainsindividualprovisionsandcollectiveloanimpairmentprovisionsagainstimpairedloans.
(vii) CollateralDetailsoncollateralheldaresetoutinnote22(g).
(e) Derivative financial instrumentsDerivativefinancialinstrumentsaremeasuredatfairvalueintheStatementoffinancialpositionasassetsandliabilities.Assetandliabilityvaluesonindividualtransactionsareonlynettedifthetransactionsarewiththesamecounterpartyandthecashflowswillbesettledonanetbasis.ChangesinvaluesofderivativefinancialinstrumentsarerecognisedintheIncomestatementunlesstheyqualifyaseffectivecashflowhedgesornetinvestmenthedgesforaccountingpurposes,assetoutinnote1(q).
(i) Derivative transactions undertaken by AMP life insurance entities as part of life insurance operationsTheAMPgroupusesderivativefinancialinstrumentsincludingfinancialfutures,forwardforeignexchangecontracts,exchangetradedandotheroptionsandforwardrateagreementstohedgetheimpactofmarketmovementsonthevalueofassetsintheinvestmentportfolios,andtoeffectachangeintheassetmixofinvestmentportfolios.
Inrespectoftherisksassociatedwiththeuseofderivativefinancialinstruments,priceriskiscontrolledbyexposurelimits,whicharesubjecttomonitoringandreview.Foreignexchangehedgesaremonitoredonaregularbasistoensuretheyareeffectiveinthereductionofpricerisk.
(ii) Derivative transactions undertaken in relation to the North product capital guarantee TheAMPgroupsupportstheNorthproduct(North)whichenablesclientstoinvesttheirsuperannuation,pensionandordinarysavingsinarangeofmanagedfunds,withpartorallofthetotalvalueoftheinvestmentsguaranteed.TheNorthguaranteesareeitherterm-basedcapitalguaranteesorprovideaguaranteedlevelofincomethroughoutthelifeofaclient’sretirement.At31December2015FundsundermanagementinvestedsubjecttotheNorthguaranteeswere$2,024m(2014:$1,919m).ThefairvaluerecordedfortheNorthguaranteeliabilitywas$86m(2014:$96m).
HedgingtechniquesareusedtoprotecttheAMPgroupagainstchangesintheexpectedguaranteeclaimpaymentsfrommarketmovements.TheAMPgroupalsohastheabilitytoreviewtheperiodicchargefornewandexistingclients.Totheextentthatthefairvalueoftheguaranteeisbasedonassumptionsthatmaynotbeborneoutinpracticeandthatthehedgeinstrumentsusedarenotaperfectmatchfortheexpectedguaranteepayments,thereisaresidualriskthatdeviationsfromtheseassumptionsmayresultinaprofitorlosstoshareholders.
HedgingoftheNorthguaranteeisperformedbasedontheeconomicvalueoftheguarantee.Theeconomicvalueisconsistentwiththeaccountingfairvalueexceptthatthecalculationofaccountingfairvalueappliesaminimumliability,onacontractbycontractbasis,oftheamountthatwouldbepayableondemandatreportingdate,whereastheeconomicvaluedoesnotincludethisminimum.Thedifferenceinthemovementofaccountingfairvalueandthemovementintheeconomicvalueoftheguaranteealsoresultsinaprofitorlosstotheshareholder.
(iii) Other derivative transactions undertaken by non-life insurance controlled entitiesAMPTreasury,AMPCapitalandAMPBankusederivativefinancialinstrumentstohedgefinancialriskfrommovementsininterestratesandforeignexchangerates.Swaps,forwards,futuresandoptionsintheinterestrateandforeignexchangemarketsmaybeused.Adescriptionofeachofthesederivativesisgivenbelow:
– Swaps–aswaptransactionobligesthetwopartiestothecontracttoexchangeaseriesofcashflowsatspecifiedpaymentorsettlementdates.SwaptransactionsundertakenbytheAMPgroupincludeinterestrateswaps,whichinvolvethecontractualexchangeoffixedandfloatinginterestratepaymentsinasinglecurrencybasedonanotionalamountandareferencerate(egBBSW),andcross-currencyswapswhichinvolvetheexchangeofinterestpaymentsbasedontwodifferentcurrencyprincipalbalancesandreferenceinterestrates,andgenerallyalsoentailexchangeofprincipalamountsatthestartand/orendofthecontract.
– Forward and futures contracts–theseareagreementsbetweentwopartiesestablishingacontractualinterestrateonanotionalprincipaloveraspecifiedperiod,commencingatafuturedate.Forward contractsaretailor-madeagreementsthataretransactedbetweencounterpartiesintheover-the-countermarket(OTC),whereasfuturesarestandardisedcontractstransactedonregulatedexchanges.
– Options–anoptioncontractgivestheoptionbuyertheright,butnottheobligation,tobuyorsellaspecifiedamountofagivencommodityorfinancialinstrumentataspecifiedpriceduringacertainperiodoronaspecificdate.Theselleroftheoptioncontractisobligedtoperformiftheholderexercisestherightcontainedtherein.OptionsmaybetradedOTCoronaregulatedexchange.
For
per
sona
l use
onl
y

AMP 2015 annual report100
Notes to the financial statements for the year ended 31 December 2015
22. Risk management and financial instruments disclosures continued(iv) Risk relating to derivative financial instrumentsThemarketriskofderivativesismanagedandcontrolledasanintegralpartofthefinancialriskoftheAMPgroup.ThecreditriskofderivativesisalsomanagedinthecontextoftheAMPgroup’soverallcreditriskpoliciesandincludestheuseofCSAswhichfacilitatethebi-lateralpostingofcollateral.
(f) Accounting for hedgesTheaccountingtreatmentofhedgetransactionsvariesaccordingtothenatureoftheinstrumenthedgedandwhetherthehedgequalifiesforhedgeaccounting.
Derivativetransactionsmayqualifyasfairvaluehedges,cashflowhedgesorhedgesofnetinvestmentsinforeignoperations.TheAMPgroup’saccountingpoliciesforderivativesdesignatedandaccountedforashedginginstrumentsareexplainedinnote1(q),wheretermsusedinthefollowingsectionarealsoexplained.
TheAMPgroupalsoentersintoderivativetransactionsthatprovideeconomichedgesbutdonotmeettherequirementsforhedgeaccountingtreatment.
(i) Derivative instruments accounted for as fair value hedgesFairvaluehedgesareusedtoprotectagainstchangesinthefairvalueoffinancialassetsandfinancialliabilitiesduetomovementsinexchangeratesandinterestrates.
During2015,theAMPgrouprecognisedanetgainof$4m(2014:$23mgain)onhedginginstrumentsdesignatedasfairvaluehedges.Thenetlossonhedgeditemsattributabletothehedgedrisksamountedto$4m(2014:$23mloss).
(ii) Derivative instruments accounted for as cash flow hedgesTheAMPgroupisexposedtovariabilityinfuturecashflowsonnon-tradingassetsandliabilitiesthatcanbearinterestatfixedandvariablerates.TheAMPgroupusesinterestrateswapsandcashflowhedgestomanagetheserisks.
Thefollowingscheduleshows,asatreportingdate,theperiodswhenthehedgedcashflowsareexpectedtooccurandwhentheyareexpectedtoaffectprofitandloss.
0–1 year$m
1–2 years$m
2–3 years$m
3–4 years$m
4–5 years$m
2015 Cashinflows 155 58 27 13 4 Cashoutflows (179) (43) (16) (5) (1)
Net cash inflow/(outflow) (24) 15 11 8 3
2014 Cashinflows 171 72 26 11 7Cashoutflows (182) (83) (29) (12) (7)
Net cash inflow/(outflow) (11) (11) (3) (1) –
Nil(2014:nil)wasrecognisedintheIncomestatementduetohedgeineffectivenessfromcashflowhedges.
Inadditiontotheabove,during2014AMPLifeenteredintoanagreementtoacquire19.99%ofChinaLifePensionCompany.AMPLifeenteredintoahedgingrelationship,atthetimethetransactionbecamehighlyprobable,whichqualifiedasacashflowhedge.ThetransactionsettledforRMB1,539min2015foranetoutflowof$238m.
(iii) Hedges of net investments in foreign operations TheAMPgrouphedgesitsexposuretochangesinexchangeratesonthevalueofitsforeigncurrencydenominatedseedpoolinvestments.Gainsorlossesoneffectiveseedpoolhedgesaretransferredtoequitytooffsetanygainsorlossesontranslationofthenetinvestmentinforeignoperations.
TheAMPgrouprecognisedaprofitofnil(2014:nil)duetotheineffectiveportionofhedgesrelatingtoinvestmentsinseedpoolforeignoperations.
(g) Collateral and master netting or similar agreements(i) Derivative financial assets and liabilitiesCertainderivativeassetsandliabilitiesaresubjecttolegallyenforceablemasternettingarrangements,suchasanInternationalSwapsandDerivativesAssociation(ISDA)masternettingagreement.Incertaincircumstances,egwhenacrediteventsuchasadefaultoccurs,alloutstandingtransactionsunderanISDAagreementareterminated,theterminationvalueisassessedandonlyasinglenetamountispayableinsettlementofalltransactions.
AnISDAagreementdoesnotmeetthecriteriaforoffsettingintheStatementoffinancialposition.ThisisbecausetheAMPgroupdoesnothaveanycurrentlylegallyenforceablerighttooffsetrecognisedamounts,astherighttooffsetisenforceableonlyontheoccurrenceoffutureeventssuchasadefault.
Ifthesenettingarrangementswereappliedtothederivativeportfolio,thederivativeassetsof$1,790mwouldbereducedby$285mtothenetamountof$1,505mandderivativeliabilitiesof$883mwouldbereducedby$285mtothenetamountof$598m(2014:derivativeassetsof$1,982mwouldbereducedby$125mtothenetamountof$1,857mandderivativeliabilitiesof$1,150mwouldbereducedby$125mtothenetamountof$1,025m).
For
per
sona
l use
onl
y

AMP 2015 annual report 101
22. Risk management and financial instruments disclosures continued(ii) Repurchase agreementsIncludedwithindebtsecuritiesareassetsheldtobacktheliabilityforcollateraldepositsheldinrespectofdebtsecurityrepurchasearrangementsenteredintobythelifeentities’statutoryfundsandcontrolledentitiesofthelifeentities’statutoryfunds.Collateraldepositsheldincludestheobligationtorepaycollateralheldinrespectofdebtsecurityrepurchasearrangementsenteredinto.Asat2015,ifrepurchasearrangementswerenetted,debtsecuritiesof$35,743mwouldbereducedby$162mtothenetamountof$35,581mandcollateraldepositsheldof$225mwouldbereducedby$162mtothenetamountof$63m(2014:debtsecuritiesof$38,440mwouldbereducedby$792mtothenetamountof$37,648mandcollateraldepositsheldof$865mwouldbereducedby$792mtothenetamountof$73m).
(iii) Other collateralTheAMPgrouphascollateralarrangementsinplacewithsomecounterpartiesinadditiontocollateraldepositsheldwithrespecttorepurchaseagreements.TheamountandtypeofcollateralrequiredbyAMPBankonhousingloansdependsonanassessmentofthecreditriskofthecounterparty.Guidelinesareinplacecoveringtheacceptabilityandvaluationofeachtypeofcollateral.
AMPBankholdscollateralagainstitsloansandadvancesprimarilyintheformofmortgageinterestsoverproperty,otherregisteredsecuritiesoverassetsandguarantees.
Managementmonitorsthemarketvalueofcollateralandwillrequestadditionalcollateralinaccordancewiththeunderlyingagreement.Intheeventofcustomerdefault,AMPBankcanenforceanysecurityheldascollateralagainsttheoutstandingclaim.AnyloansecurityisusuallyheldasmortgageeinpossessionwhileAMPBankseekstorealiseitsvaluethroughthesaleofproperty.Therefore,AMPBankdoesnotholdanyrealestateorotherassetsacquiredthroughtherepossessionofcollateral.
Collateralgenerallyconsistsof11amloansanddepositsandisexchangedbetweenthecounterpartiestoreducetheexposurefromthenetfairvalueofderivativeassetsandliabilitiesbetweenthecounterparties.Asat31December2015therewas$63mofcollateraldepositsduetootherfinancialinstitutions(2014:$73m).
23. Fair value information(a) Fair valuesThefollowingtablesummarisesthecarryingamountsandfairvaluesofthosefinancialassetsandliabilitiesnotpresentedontheStatementoffinancialpositionatfairvalue.Bidpricesareusedtoestimatethefairvalueofassets,whereasofferpricesareappliedforliabilities.
Carrying amount
2015$m
Aggregate fair value
2015$m
Carrying amount
2014$m
Aggregate fair value
2014$m
Financial assets Loansandadvances 15,281 15,281 14,590 14,623Debtsecurities–heldtomaturity 1,739 1,745 2,335 2,347
Total financial assets 17,020 17,026 16,925 16,970
Financial liabilities Deposits 6,772 6,892 6,392 6,392Borrowingsandinterestbearingliabilities – AMPBankandsecuritisationvehicles 6,774 6,669 7,224 7,208– Corporateandothershareholderactivities 271 272 463 465– InvestmententitiescontrolledbyAMPlifeinsuranceentities’statutoryfunds 1,943 1,943 1,273 1,273Subordinateddebt1 1,692 1,718 1,150 1,173
Total financial liabilities 17,452 17,494 16,502 16,511
1 Theparenthasfinancialliabilities–subordinateddebtwithacarryingamountof$864m(2014:$326m)andafairvalueof$877m(2014:$341m).
For
per
sona
l use
onl
y

AMP 2015 annual report102
Notes to the financial statements for the year ended 31 December 2015
23. Fair value information continuedFairvaluerepresentsthepricethatwouldbereceivedtosellanassetorpaidtotransferaliabilityinanorderlytransactionbetweenmarketparticipantsatthemeasurementdate.
ThefollowingtableshowsananalysisoftheAMPgroup’sfinancialassetsandliabilitiesnotpresentedontheStatementoffinancialpositionatfairvaluebyeachlevelofthefairvaluehierarchy.
Level 1$m
Level 2$m
Level 3$m
Total fair value
$m
2015Financial assets Loansandadvances – 15,281 – 15,281Debtsecurities–heldtomaturity – 1,745 – 1,745
Total financial assets not measured at fair value – 17,026 – 17,026
Financial liabilities Deposits – 6,892 – 6,892 Borrowingsandinterestbearingliabilities – AMPBankandsecuritisationvehicles – 6,669 – 6,669 – Corporateandothershareholderactivities – 272 – 272 – InvestmententitiescontrolledbyAMPlifeinsuranceentities’statutoryfunds – 1,943 – 1,943 Subordinateddebt 609 1,109 – 1,718
Total financial liabilities not measured at fair value 609 16,885 – 17,494
(i) Debt securities Theestimatedfairvalueofloansandinterestbearingsecuritiesrepresentsthediscountedamountofestimatedfuturecashflowsexpectedtobereceived,basedonthematurityprofileoftheloansandinterestbearingsecurities.Astheloansareunlisted,thediscountratesappliedarebasedontheyieldcurveappropriatetotheremainingtermoftheloans.
Theloansmaybemeasuredatanamountinexcessoffairvalueduetofluctuationsonfixedrateloans.Asthefluctuationsinfairvaluedonotrepresentapermanentdiminutionandthecarryingamountsoftheloansarerecordedatrecoverableamountsafterassessingimpairment,itisnotappropriatetorestatetheircarryingamount.
(ii) Borrowings Borrowingscomprisedomesticcommercialpaper,drawnliquidityfacilitiesandvariousfloating-rateandmedium-termnotes.Thefairvaluesofborrowingsarepredominantlyhedgedbyderivativeinstruments–mainlycross-currencyandinterestrateswaps.Theestimatedfairvalueofborrowingsisdeterminedwithreferencetoquotedmarketprices.Forborrowingswherequotedmarketpricesarenotavailable,adiscountedcashflowmodelisused,basedonacurrentyieldcurveappropriatefortheremainingtermtomaturity.
(iii) Subordinated debtThefairvalueofsubordinateddebtisdeterminedwithreferencetoquotedmarketpricesatthereportingdate.
(b) Fair value measuresTheAMPgroup’sassetsandliabilitiesmeasuredatfairvaluearecategorisedunderathree-levelhierarchy,reflectingtheavailabilityofobservablemarketinputswhenestimatingthefairvalue.Ifdifferentlevelsofinputsareusedtomeasureafinancialinstrument’sfairvalue,theclassificationwithinthehierarchyisbasedonthelowestlevelinputthatissignificanttothefairvaluemeasurement.Thethreelevelsare:
Level1:valuedbyreferencetoquotedpricesinactivemarketsforidenticalassetsorliabilities.Thesequotedpricesrepresentactualandregularlyoccurringmarkettransactionsonanarm’slengthbasis.
Level2:valuedusinginputsotherthanquotedpricesincludedwithinlevel1thatareobservablefortheassetorliability,eitherdirectly(asprices)orindirectly(derivedfromprices),including:quotedpricesinactivemarketsforsimilarassetsorliabilities,quotedpricesinmarketsinwhichtherearefewtransactionsforidenticalorsimilarassetsorliabilities,andotherinputsthatarenotquotedpricesbutareobservablefortheassetorliability,eginterestrateyieldcurvesobservableatcommonlyquotedintervals,currencyrates,optionvolatilities,creditrisks,anddefaultrates.
Level3:valuedinwholeorinpartusingvaluationtechniquesormodelsthatarebasedonunobservableinputsthatareneithersupportedbypricesfromobservablecurrentmarkettransactionsinthesameinstrumentnorbasedonavailablemarketdata.Unobservableinputsaredeterminedbasedonthebestinformationavailable,whichmightincludetheAMPgroup’sowndata,reflectingtheAMPgroup’sownestimatesabouttheassumptionsthatmarketparticipantswoulduseinpricingtheassetorliability.
Valuationtechniquesareusedtotheextentthatobservableinputsarenotavailable,andincludeestimatesaboutthetimingofcashflows,discountrates,earningsmultiplesandotherinputs.
For
per
sona
l use
onl
y

AMP 2015 annual report 103
23. Fair value information continuedThefollowingtableshowsananalysisoftheAMPgroup’sassetsandliabilitiesmeasuredatfairvaluebyeachlevelofthefairvaluehierarchy.
Level 1$m
Level 2$m
Level 3$m
Total fair value$m
2015Assets Measured at fair value on a recurring basis Equitysecuritiesandlistedmanagedinvestmentschemes1 49,811 18 3,410 53,239 Debtsecurities – 34,209 1,534 35,743 Investmentsinunlistedmanagedinvestmentschemes – 16,994 2,427 19,421 Derivativefinancialassets 161 1,629 – 1,790 Investmentproperties2 – – 386 386 Otherfinancialassets – – 8 8
Total financial assets measured at fair value on a recurring basis 49,972 52,850 7,765 110,587
Other assets measured at fair value on a non-recurring basis Assetsofdisposalgroups3 – – – –
Total other assets measured at fair value on a non-recurring basis – – – –
Total assets measured at fair value 49,972 52,850 7,765 110,587
Liabilities Measured at fair value on a recurring basis Derivativefinancialliabilities 117 766 – 883 Collateraldepositsheld 136 89 – 225 Investmentcontractliabilities – 2,364 67,484 69,848
Total financial liabilities measured at fair value on a recurring basis 253 3,219 67,484 70,956
Other liabilities measured at fair value on a non-recurring basis Liabilitiesofdisposalgroups3 – – – –
Total other liabilities measured at fair value on a non-recurring basis – – – –
Total liabilities measured at fair value 253 3,219 67,484 70,956
2014 Assets Measured at fair value on a recurring basis Equitysecuritiesandlistedmanagedinvestmentschemes1 44,496 43 2,354 46,893Debtsecurities – 37,841 599 38,440Investmentsinunlistedmanagedinvestmentschemes – 17,589 967 18,556Derivativefinancialassets 131 1,851 – 1,982Investmentproperties2 – – 340 340Otherfinancialassets – 31 9 40
Total financial assets measured at fair value on a recurring basis 44,627 57,355 4,269 106,251
Other assets measured at fair value on a non-recurring basis Assetsofdisposalgroups3 – – 100 100
Total other assets measured at fair value on a non-recurring basis – – 100 100
Total assets measured at fair value 44,627 57,355 4,369 106,351
Liabilities Measured at fair value on a recurring basis Derivativefinancialliabilities 96 1,054 – 1,150Collateraldepositsheld 792 73 – 865Investmentcontractliabilities – 2,532 64,448 66,980
Total financial liabilities measured at fair value on a recurring basis 888 3,659 64,448 68,995
Other liabilities measured at fair value on a non-recurring basis Liabilitiesofdisposalgroups3 – – 69 69
Total other liabilities measured at fair value on a non-recurring basis – – 69 69
Total liabilities measured at fair value 888 3,659 64,517 69,064
1 Equitysecuritiesandlistedmanagedinvestmentschemesincludefinancialassetsavailableforsalemeasuredatfairvalue.2 Refertonote11forvaluationtechniquesandkeyunobservableinputs.3 Refertonote29fordisposalgroups.
For
per
sona
l use
onl
y

AMP 2015 annual report104
Notes to the financial statements for the year ended 31 December 2015
23. Fair value information continuedThefollowingtableshowsmovementsinthefairvalueoffinancialinstrumentscategorisedaslevel3:
Balance atthe beginning
of the period $m
FX gains or losses1
$m
Total gains/ losses1
$m
Purchases/ deposits
$m
Sales/ withdrawals
$m
Net transfers in/(out)2
$m
Balance at the end of the period
$m
Total gains and losses on
assets and liabilities
held at reporting
date$m
2015Assets classified as level 33 Equitysecuritiesandlistedmanagedinvestmentschemes 2,354 48 378 942 (435) 123 3,410 379
Debtsecurities 599 55 210 764 (93) (1) 1,534 209
Investmentsinunlistedmanagedinvestmentschemes 967 – 142 1,017 (223) 524 2,427 151
Otherfinancialassets 9 – – – (1) – 8 –
Liabilities classified as level 3 Investmentcontractliabilities 64,448 (5) 3,100 11,743 (11,802) – 67,484 2,755
2014 Assets classified as level 33 Equitysecuritiesandlistedmanagedinvestmentschemes 2,480 29 223 29 (19) (388) 2,354 223
Debtsecurities 556 13 65 9 (32) (12) 599 65
Investmentsinunlistedmanagedinvestmentschemes 612 – 128 321 (251) 157 967 128
Otherfinancialassets – – – – – 9 9 –
Liabilities classified as level 3 Investmentcontractliabilities 63,148 12 4,956 11,608 (15,276) – 64,448 4,572
1 GainsandlossesareclassifiedininvestmentgainsandlossesorchangeinpolicyholderliabilitiesintheIncomestatement.2 TheAMPgrouprecognisestransfersasattheendofthereportingperiodduringwhichthetransferhasoccurred.Transfersarerecognisedwhen
therearechangesintheobservabilityofthepricingoftherelevantsecuritiesorwheretheAMPgroupceasetoconsolidateacontrolledentity.3 MovementsrelatingtoInvestmentpropertiesaredisclosedinnote11.
For
per
sona
l use
onl
y

AMP 2015 annual report 105
23. Fair value information continuedThefollowingtableshowsthesensitivityofthefairvalueoflevel3instrumentstochangesinkeyassumptions:
Effect of reasonably possible alternative assumptions3
Carrying amount1,2
$m(+)
$m(-)
$m Valuation technique Key unobservable inputs
2015 AssetsEquitysecuritiesandlistedmanagedinvestmentschemes
3,410 206 (206) Discountedcashflowapproachutilisingcostofequityasthediscountrate.
Discountrate.Terminalvaluegrowthrate.Cashflowforecasts.
Debtsecurities 1,534 – – Discountedcashflowapproach. Discountrate.Cashflowforecasts.
Investmentsinunlistedmanagedinvestmentschemes
2,427 – – Publishedredemptionprices. Valuationoftheunlistedmanagedinvestmentschemes.Suspensionofredemptionsofthemanagedinvestmentschemes.
LiabilitiesInvestmentcontractliabilities 67,484 8 (7) Valuationmodelbasedon
publishedunitpricesandthefairvalueofbackingassets.Fixedretirement-incomepolicies–discountedcashflow.
Fairvalueoffinancialinstruments.Cashflowforecasts.Creditrisk.
2014 AssetsEquitysecuritiesandlistedmanagedinvestmentschemes
2,354 164 (163)
Debtsecurities 599 – –
Investmentsinunlistedmanagedinvestmentschemes
967 – –
Assetsofdisposalgroups 100 – –
LiabilitiesInvestmentcontractliabilities 64,448 9 (9)
Liabilitiesofdisposalgroups 69 – –
1 Thefairvalueoftheassetorliabilitywouldincrease/decreaseifthediscountratedecreases/increases.Thefairvalueoftheassetorliabilitywouldincrease/decreaseiftheotherinputsincrease/decrease.
2 Eachindividualassetandindustryprofilewilldeterminetheappropriatevaluationinputstobeutilisedineachspecificvaluationandcanvaryfromassettoasset.
3 Reasonablypossiblealternativeassumptionshavebeencalculatedbychangingoneormoreofsignificantunobservableinputsforindividualassetstoreasonablypossiblealternativeassumptions.Onfinancialassetsthisincludedadjustingthediscountrateby25bps–100bps.Oninvestmentcontractliabilitiesthisincludedadjustmentstocreditriskby50bps.
Financial asset valuation processForfinancialassetscategorisedwithinlevel3ofthefairvaluehierarchy,thevaluationprocessesappliedinvaluingsuchassetsisgovernedbytheAMPCapitalassetvaluationpolicy.Thispolicyoutlinestheassetvaluationmethodologiesandprocessesappliedtomeasurenon-exchangetradedassetswhichhavenoregularmarketprice,includinginvestmentproperty,infrastructure,privateequity,alternativeassets,andilliquiddebtsecurities.Allsignificantlevel3assetsarereferredtotheappropriatevaluationcommitteewhomeetatleasteverysixmonths,ormorefrequentlyifrequired.
For
per
sona
l use
onl
y

AMP 2015 annual report106
Notes to the financial statements for the year ended 31 December 2015
24. Capital management TheAMPgroupholdscapitaltoprotectcustomers,creditorsandshareholdersagainstunexpectedlossestoalevelthatisconsistentwithAMP’sriskappetite,approvedbytheboard.
TheAMPgroup’scapitalresourcesincludeordinaryequityandinterest-bearingliabilities.TheAMPgroupexcludestheinterest-bearingliabilitiesofitsbankingsubsidiary,AMPBankLimited,andcontrolledinvestmentsubsidiariesandtrustsfromtheAMPgroupcapitalresources.
TheAMPgroupmakesadjustmentstothestatutoryshareholderequity.UnderAustralianAccountingStandards,someassetsheldonbehalfofthepolicyholders(andrelatedtaxbalances)arerecognisedinthefinancialreportatdifferentvaluestothevaluesusedinthecalculationoftheliabilitytopolicyholdersinrespectofthesameassets.Therefore,movementsinthesepolicyholderassetsresultinaccountingmismatcheswhichimpactAMPstatutoryequityattributabletoshareholdersofAMPLimited.Mismatchitemsinclude:– treasuryshares(AMPLimitedsharesheldbythestatutoryfundsonbehalfofpolicyholders)– AMPLifeLimitedstatutoryfunds’investmentsincontrolledentities– AMPLifeLimitedstatutoryfunds’superannuationproductsinvestedinAMPBankLimitedassets.
AdjustmentsarealsomaderelatingtocashflowhedgereservesandanadjustmentforAMPFoundationtoexcludethenetassetsoftheAMPFoundationfromcapitalresources.
ThetablebelowshowstheAMPgroup’scurrentcapitalresourcesatreportingdate:
2015 $m
2014$m
AMPstatutoryequityattributabletoshareholdersofAMPLimited 8,519 8,186Accountingmismatch,cashflowhedgeresourcesandotheradjustments 104 160
AMPshareholderequity 8,623 8,346Subordinateddebt1 1,551 1,008Seniordebt1 250 450
Total AMP capital resources 10,424 9,804
1 Amountsshownforsubordinateddebtandseniordebtaretheamountstoberepaidonmaturity.AmountsrecognisedintheStatementoffinancialpositioninrespectofthesedebtsaremeasuredatamortisedcostusingtheeffectiveinterestratemethod.
TheAMPgroupassessestheadequacyofitscapitalrequirementsagainstregulatorycapitalrequirements.TheAMPgroup’scapitalmanagementplanformspartoftheAMPgroup’sbroaderstrategicplanningprocess.
Inadditiontomanagingthelevelofcapitalresources,theAMPgroupalsoattemptstooptimisethemixofcapitalresourcestominimisethecostofcapitalandmaximiseshareholdervalue.
AnumberoftheoperatingentitieswithintheAMPgroupofcompaniesareregulated.TheAMPgroupofcompaniesincludesanauthoriseddeposit-takinginstitution,lifeinsurancecompaniesandapprovedsuperannuationtrusteesallregulatedbyAPRA.AnumberofcompaniesalsoholdAustralianFinancialServicesLicences.
For
per
sona
l use
onl
y

AMP 2015 annual report 107
24. Capital management continuedTheminimumregulatorycapitalrequirements(MRR)istheamountofcapitalrequiredbyeachofAMP’sregulatedbusinessestomeettheircapitalrequirementsassetbytheappropriateregulator.Themainrequirementsareasfollows:– AMPLifeLimitedandTheNationalMutualLifeAssociationofAustralasiaLimited(NMLA)–capitaladequacyrequirementsas
specifiedundertheAPRALifeInsurancePrudentialStandards.Thisappliestothecompanyasawhole,andeachstatutoryfundandshareholders’fundofthecompany.
– AMPBankLimited–capitalrequirementsasspecifiedunderAPRAAuthorisedDeposit-takingInstitutionPrudentialStandards.– AMPSuperannuationLimitedandNMSuperannuationPtyLimited–OperationalRiskFinancialRequirementsasspecifiedunder
theAPRASuperannuationPrudentialStandards.– AMPCapitalInvestorsLimitedandotherASICregulatedbusinesses–capitalrequirementsunderAustralianFinancialServices
LicencerequirementsandforrisksrelatingtoNorth.
InAugust2014,APRAreleaseditsplannedfinalcapitaladequacystandardsforconglomerategroups.ImplementationofthesestandardshasbeendeferredpendingAPRA’sconsiderationoftheGovernment’sresponsetotherecommendationsoftheFinancialSystemInquiry.APRAhascommittedtoprovidingaminimum12monthstransitiontimebeforeanynewstandardscomeintoforce.
AlloftheAMPgroupregulatedentitieshaveatalltimesduringthecurrentandpriorfinancialyearcompliedwiththeexternallyimposedcapitalrequirementstowhichtheyaresubject.
AMPholdsalevelofcapitalaboveitsMRR.Atthereportingdate,theshareholderregulatorycapitalresourcesaboveMRRwere$2,542m(2014:$1,987m).TheshareholderregulatorycapitalresourcesaboveMRRwillvarythroughouttheyearduetoinvestmentmarketmovements,dividendpaymentsandtheretentionofprofits.
Policyholderretainedprofitscontinuetoberesourcessupportingtheparticipatingbusiness.ThetotalpolicyholderretainedprofitsofAMPLifeandNMLAwere$2,217mat31December2015(2014:$2,153m).
AMP’sbusinessesandtheAMPgroupmaintaincapitaltargets(targetsurplus),reflectingtheirmaterialrisks(includingfinancialrisk,insuranceandproductriskandoperationalrisk)andAMP’sriskappetite.ThetargetsurplusisamanagementguidetothelevelofexcesscapitalthatAMPseekstocarrytoreducetheriskofbreachingMRR.
AMPLimited,AMPLife,NMLAandAMPBankhaveboardminimumcapitallevelsaboveAPRArequirements,withadditionalcapitaltargetsheldabovetheseamounts.Withinthelifeinsurancebusinesses,thecapitaltargetsaboveboardminimumshavebeensettoalessthan10%probabilityofcapitalresourcesfallingbelowtheboardminimumovera12-monthperiod.CapitaltargetsarealsosetforAMPCapitaltocoverriskassociatedwithseedandsponsorcapitalinvestmentsandoperationalrisk.OthercomponentsofAMPgroup’scapitaltargetsincludeamountsrelatingtoAMPgroupofficeinvestments,definedbenefitfundsandotheroperationalrisks.
FollowingthefinalisationoftheconglomeratecapitaladequacystandardsbyAPRA,AMPwillreviewtheappropriatenessofitscapitaltargetsfortheAMPgroup.
Inaddition,theparticipatingbusinessofthelifeinsurancecompaniesismanagedtotargetaveryhighlevelofconfidencethatthebusinessisself-supportingandthattherearesufficientassetstosupportpolicyholderliabilities.
ThetransitionarrangementsprovidedbyAPRAallowsubordinateddebtheldatagrouplevelthatwasissuedpriorto1January2013tocontinuetobe100%recognisedaseligibleregulatorycapitaluntilthecalldateinMarch2016fortheAXANotesof$600manduntiltheimplementationoftheconglomeratecapitalstandardsforthesubordinatedbondmaturingin2022of$83m.
For
per
sona
l use
onl
y

AMP 2015 annual report108
Notes to the financial statements for the year ended 31 December 2015
25. Notes to Statement of cash flows
Consolidated Parent
2015$m
2014$m
2015$m
2014$m
(a) Reconciliation of the net profit after income tax to cash flows from operating activities
Netprofitafterincometax 1,713 971 913 832Depreciationofoperatingassets 23 17 – –Amortisationandimpairmentofintangibles 279 271 – –Investmentgainsandlossesandmovementsinexternalunitholdersliabilities 788 (871) – (203)Dividendanddistributionincomereinvested (4,041) (3,655) – –Share-basedpayments (4) 8 1 3Decrease(increase)inreceivables,intangiblesandotherassets 36 (135) (2) (2)(Decrease)increaseinnetpolicyliabilities 2,336 3,610 – –(Decrease)increaseinincometaxbalances (100) 961 20 (52)(Decrease)increaseinotherpayablesandprovisions 312 (91) (6) 2
Cash flows from (used in) operating activities 1,342 1,086 926 580
(b) Reconciliation of cash Comprises: CashandcashequivalentsforthepurposeoftheStatementoffinancialposition 3,955 3,581 21 1Bankoverdrafts(includedinBorrowings) – (1) – –Short-termbillsandnotes(includedinDebtsecurities) 2,646 7,652 – –
Cash and cash equivalents for the purpose of the Statement of cash flows 6,601 11,232 21 1
(c) Financing arrangements (i) Overdraft facilities Bankoverdraftfacilityavailable 779 828 – –
(ii) Loan facilities and note programs Inadditiontofacilitiesarrangedthroughbondandnoteissues(refernotes16and17),financingfacilitiesareprovidedthroughbankloansundernormalcommercialtermsandconditions.
Available 15,256 13,827 864 326Used (4,316) (2,780) (864) (326)
Unused 10,940 11,047 – –
(d) Acquisitions and disposal of controlled entitiesOperating entitiesDuringtheyearended31December2015,AMPacquiredthefollowingentities:– JustsuperPtyLtd– SupercorpPtyLtd– SuperIQPtyLtd– WealthVisionFinancialServicesPtyLtd.
Duringtheyearended31December2014,AMPacquiredthefollowingentities:– ForsythesFinancialServicesPtyLimited– ProsperitusHoldingsPtyLtd– TotalSuperSolutionsPtyLtd.
Therewerenoothersignificantacquisitionsordisposalsofoperatingentitiesin2014or2015.For
per
sona
l use
onl
y

AMP 2015 annual report 109
25. Notes to Statement of cash flows continuedTheimpactofacquisitionsofoperatingentitiesisasfollows:
Operating entitiesImpact in 2015
$mImpact in 2014
$m
Assets Cashandcashequivalents (34) (24)Investmentsinassociatesaccountedforusingtheequitymethod (16) –Intangibleassets 82 24Otherassets (8) –
Total assets 24 –
Liabilities Payablesandprovisions (11) –Deferredtaxliabilities (8) –Otherliabilities (5) –
Total liabilities (24) –
Controlled entities of AMP life insurance entities’ statutory funds Inthecourseofnormaloperatinginvestmentactivities,theAMPlifeinsuranceentities’statutoryfundsacquireequityinterestsinentitieswhich,insomecases,resultinAMPholdingacontrollinginterestintheinvesteeentity.
Mostacquisitionsanddisposalsofcontrolledentitiesareinrelationtomanagedinvestmentschemeswithunderlyingnetassetstypicallycomprisinginvestmentassetsincludingcash.Theconsiderationforacquisitionsordisposalsreflectsthefairvalueoftheinvestmentassetsatthedateofthetransactionsaftertakingintoaccountminorityinterests.
Certaincontrolledentitiesofthelifeentities’statutoryfundsareoperatingcompanieswhichcarryoutbusinessoperationsunrelatedtothecorewealthmanagementoperationsoftheAMPgroup.
Acquisitions of controlled entities of AMP life insurance entities’ statutory funds – Nosignificantacquisitionsoccurredduring2015.– Nosignificantacquisitionsoccurredduring2014.
Disposals of controlled entities of AMP life insurance entities’ statutory funds – Nosignificantdisposalsoccurredduring2015.– InOctober2014,almostallcontrolledpropertyfundsweresoldintotheAMPCapitalDiversifiedPropertyFund(ADPF).Atthesame
timeAMPincreaseditsownershipinterestinADPF.
Theimpactsofthesetransactionswereasfollows:
DisposalsImpact in 2015
$mImpact in 2014
$m
Assets Cash – (114)Receivables – (18)Investmentproperty – (4,365)Investmentsinfinancialassetsmeasuredatfairvaluethroughprofitorloss – 1,589Deferredtaxassets – –Property,plantandequipment – –Intangibles – –Otherassets – (118)
Total assets – (3,026)
Liabilities Payablesandprovisions – (48)Borrowings – (948)Deferredtaxliabilities – –Otherfinancialliabilities – (6)Externalunitholderliabilities – (2,024)
Total liabilities – (3,026)
For
per
sona
l use
onl
y

AMP 2015 annual report110
Notes to the financial statements for the year ended 31 December 2015
26. Earnings per share(a) Classification of equity securitiesOrdinaryshareshavebeenincludedinthecalculationofbasicearningspershare.
InaccordancewithAASB133Earnings per Share,optionsoverunissuedordinarysharesandperformancerightshavebeenclassifiedaspotential ordinary sharesandhavebeenconsideredinthecalculationofdilutedearningspershare.Performancerightshavebeendeterminedtobedilutivein2015and2014.AlthoughperformancerightshavebeendeterminedtobedilutiveinaccordancewithAASB133 Earnings per Share,iftheseinstrumentsvestandareexercised,itisAMP’spolicytobuyAMPsharesonmarketsotherewillbenodilutiveeffectonthevalueofAMPshares.
OftheAMPLimitedordinarysharesonissue33,390,553(2014:46,961,490)areheldbycontrolledentitiesofAMPLimited.AMP’slifeinsuranceentitieshold31,264,166(2014:44,835,103)sharesonbehalfofpolicyholders.TheAustralianSecuritiesandInvestmentsCommissionhasgrantedrelieffromrestrictionsintheCorporations Act 2001toallowAMP’slifeinsuranceentitiestoholdandtradesharesinAMPLimitedaspartofthepolicyholderfunds’investmentactivities.Thecostoftheinvestmentinthesetreasurysharesisreflectedasadeductionfromtotalcontributedequity.
Consolidated
2015million shares
2014million shares
(b) Weighted average number of ordinary shares used Weightedaveragenumberofordinarysharesusedincalculationofbasicearningspershare 2,918 2,920Add:potentialordinarysharesconsidereddilutive 20 25Weightedaveragenumberofordinarysharesusedincalculationofdilutedearningspershare 2,938 2,945
Consolidated
2015$m
2014$m
(c) Level of earnings used Basic 972 884Diluted 972 884
Consolidated
2015cents
2014cents
(d) Earnings per share Basic 33.3 30.3Diluted 33.1 30.0
For
per
sona
l use
onl
y

AMP 2015 annual report 111
27. Superannuation fundsAMPcontributestofundedemployer-sponsoredsuperannuationfundsthatexisttoprovidebenefitsforemployeesandtheirdependantsonresignation,retirement,disabilityordeathoftheemployee.Thefundsconsistofbothdefinedcontributionsectionsanddefinedbenefitsections.
ThedefinedcontributionsectionsreceivefixedcontributionsfromtheAMPgroupcompaniesandthegroup’slegalobligationislimitedtothesecontributions.Thedefinedbenefitsectionsprovidememberswithachoiceoflumpsumbenefitsorpensionbenefitsbasedonyearsofmembershipandfinalsalary.Newemployeesareonlyoffereddefinedcontributionstylebenefits.Thedisclosuresinthisnoterelateonlytothedefinedbenefitsectionsoftheplans.
Priorto2015,AMPusedablendofgovernmentbondyieldstosetthediscountratesusedforcalculatingtheliability.During2015,anexternalactuarialfirm(MillimanAustralia)releasedareportwhichconcludedthatAustralianowhasadeepcorporatebondmarket.Asaresult,AMPisnowrequiredtousecorporatebondyieldswhichhaveresultedinadecreaseindefinedbenefitliabilitiesof$98m.ThisdecreasehasnotimpactedtheIncomestatementasithasbeenrecognisedthroughOthercomprehensiveincome.
ThefollowingtablessummarisethecomponentsofthenetamountrecognisedintheIncomestatement,Statementofcomprehensiveincome,themovementsinthedefinedbenefitobligationandplanassetsandthenetamountsrecognisedintheconsolidatedStatementoffinancialpositionforthedefinedbenefitfunds,determinedinaccordancewithAASB119Employee Benefits.However,forthepurposesofrecommendingcontributionstothedefinedbenefitfunds,fundactuariesconsiderarangeofotherfactorswhichdonotreflectthefinancialpositionpresentedinthefinancialstatements.
(a) Summary information of defined benefit fundsAustralian defined benefit plansActivemembersofAMP’sAustraliandefinedbenefitplansareentitledtoalumpsumorpensiononretirement.Pensionsprovidedarelifetimeindexedpensionswithareversionaryspousepension.Theplansarenowclosedtonewmembers.
TheSuperannuationIndustrySupervision(SIS)legislationgovernsthesuperannuationindustryandprovidestheframeworkwithinwhichsuperannuationplansoperate.TheSISlegislationgenerallyrequiresanactuarialvaluationtobeperformedeveryyearfordefinedbenefitplans.
Theplansaresub-fundswithintheAMPSuperannuationSavingsTrust(theTrust).TheTrust’strusteesareresponsibleforthegovernanceoftheplans.Thetrusteeshavealegalobligationtoactsolelyinthebestinterestsofplanbeneficiaries.Thetrustees’responsibilitiesincludeadministrationoftheplan,managementandinvestmentoftheplanassets,andcompliancewithsuperannuationlawsandotherapplicableregulations.
Theplansareexposedtoanumberofrisks.Otherthantherisksofactualoutcomesbeingdifferenttotheactuarialassumptionsusedtoestimatethedefinedbenefitobligationassetoutinnote27(g),themostsignificantrisksincludeinvestmentriskandlegislativerisk.TheserisksapplytoallsuperannuationplansandarenotspecifictoAMP.
Asatthemostrecentactuarialupdate,31December2015,thefundactuaryrecommendedcontributionsbemadeatthenormalsuperannuationratesapplicabletothevariousmembersanddidnotidentifyanydeficitforfundingpurposes;andthereforenoadditionalcontributionsarerequired.
New Zealand defined benefit plansActivemembersofAMP’sNewZealanddefinedbenefitplansareentitledtoaccumulationbenefitsandalumpsumpaymentonretirement.Theplansarenowclosedtonewmembers.
TheSuperannuation Scheme Act (1989)(NZ)governsthesuperannuationindustryandprovidestheframeworkwithinwhichthesuperannuationschemesoperate.TheActrequiresanactuarialvaluationtobeperformedeverythreeyears.
Theplans’trusteesareresponsibleforthegovernanceoftheplan.Thisincludesadministrationoftheplan,managementandinvestmentoftheplanassets,andlookingaftertheinterestsofallbeneficiaries.
Theplansareexposedtoanumberofrisks.Otherthantherisksofactualoutcomesbeingdifferenttotheactuarialassumptionsusedtoestimatethedefinedbenefitobligationassetoutinnote27(g),themostsignificantrisksincludeinvestmentriskandlegislativerisk.TheserisksapplytoallsuperannuationplansandarenotspecifictoAMP.
TherearenospecificassetliabilitymatchingstrategiesfortheNewZealanddefinedbenefitplans.
AMPhasadoptedthefunds’actuaries’recommendationsforAMPtomakeadditionalcontributionsof$1mperannum(AMPNewZealanddefinedbenefitplan)and$4mperannum(AMPAAPHNewZealanddefinedbenefitplan)untilthefinancialpositionsoftheplansaresufficientlyimproved.
For
per
sona
l use
onl
y

AMP 2015 annual report112
Notes to the financial statements for the year ended 31 December 2015
27. Superannuation funds continued
Consolidated
2015 $m
2014$m
(b) Defined benefit plan income (expense) Currentservicecost (6) (5)Interestcost (22) (21)Interestincome 18 19Other 2 –
Total defined benefit plan income (expense) (8) (8)
(c) Movements in defined benefit obligation Balanceatthebeginningoftheyear (962) (801)Currentservicecost (6) (5)Interestcost (22) (21)Contributionsbyplanparticipants – (1)Actuarialgainsandlosses1 – changeindemographicassumptions (1) –– changeinfinancialassumptions 99 (177)– experiencegain(loss) (19) (1)– other 3 –Foreigncurrencyexchangeratechanges 3 (5)Benefitspaid 45 49
Balance at the end of the year (860) (962)
(d) Movement in fair value of plan assets Balanceatthebeginningoftheyear 772 728Interestincome 18 19Actuarialgainsandlosses–actualreturnonplanassetslessinterestincome 12 59Foreigncurrencyexchangeratechanges (1) 4Employercontributions 6 10Contributionsbyplanparticipants – 1Benefitspaid (45) (49)
Balance at the end of the year 762 772
(e) Defined benefit (liability) asset Presentvalueofwhollyfundeddefinedbenefitobligations (860) (962)Less:Fairvalueofplanassets 762 772
Defined benefit (liability) asset recognised in the Statement of financial position2 (98) (190)
Movement in defined benefit (liability) asset (Deficit)surplusatthebeginningoftheyear (190) (73)Plus:Totalincome(expenses)recognisedinincome (8) (8)Plus:Employercontributions 6 10Plus:Actuarialgains(losses)recognisedinOthercomprehensiveincome3 94 (119)
Defined benefit (liability) asset recognised at the end of the year (98) (190)
1 Asexplainedinnote1(dd),actuarialgainsandlossesarerecogniseddirectlyinOthercomprehensiveincome.2 ThedefinedbenefitliabilityismeasuredinaccordancewiththerequirementsofAASB119Employee Benefitsanddoesnotrepresentacurrent
obligationtoprovideadditionalfundingtotheplans.Refertonote27(a)fordetailsofthefundingoftheAMPdefinedbenefitfunds.3 ThecumulativeamountofthenetactuarialgainsandlossesrecognisedintheStatementofcomprehensiveincomeisa$104mgain(2014:$10mgain).F
or p
erso
nal u
se o
nly

AMP 2015 annual report 113
27. Superannuation funds continued
Consolidated
2015 $m
2014$m
(f) Analysis of defined benefit (deficit) surplus by planAMP Australian defined benefit (liability) asset Presentvalueofwhollyfundeddefinedbenefitobligations (324) (360)Less:Fairvalueofplanassets 274 279
Net defined benefit (liability) asset recognised in the Statement of financial position (50) (81)
Actuarialgainsand(losses) 33 (33)
AMP AAPH Australian defined benefit (liability) asset Presentvalueofwhollyfundeddefinedbenefitobligations (389) (441)Less:Fairvalueofplanassets 380 381
Net defined benefit (liability) asset recognised in the Statement of financial position (9) (60)
Actuarialgainsand(losses) 54 (67)
AMP New Zealand defined benefit (liability) asset Presentvalueofwhollyfundeddefinedbenefitobligations (27) (28)Less:Fairvalueofplanassets 23 25
Net defined benefit (liability) asset recognised in the Statement of financial position (4) (3)
Actuarialgainsand(losses) (1) (1)
AMP AAPH New Zealand defined benefit (liability) asset Presentvalueofwhollyfundeddefinedbenefitobligations (120) (133)Less:Fairvalueofplanassets 85 87
Net defined benefit (liability) asset recognised in the Statement of financial position (35) (46)
Actuarialgainsand(losses) 7 (18)
(g) Principal actuarial assumptionsThefollowingtablesetsouttheprincipalactuarialassumptionsusedasatthereportingdateinmeasuringthedefinedbenefitobligationsoftheAustralianandNewZealanddefinedbenefitfunds:
AMP AMP AAPH Australia New Zealand Australia New Zealand
2015
%2014
%2015
%2014
%2015
%2014
%2015
%2014
%
Weightedaveragediscountrate 4.5 3.5 3.5 3.9 4.6 3.8 4.1 3.4Expectedrateofsalaryincreases 3.5 4.0 4.0 4.0 3.5 4.0 4.0 4.0
For
per
sona
l use
onl
y

AMP 2015 annual report114
Notes to the financial statements for the year ended 31 December 2015
27. Superannuation funds continued(h) Allocation of assetsTheassetallocationsofthedefinedbenefitfundsareshowninthefollowingtable:
AMP AMP AAPH Australia1 New Zealand1 Australia1 New Zealand1
2015
%2014
%2015
%2014
%2015
%2014
%2015
%2014
%
Equity 39 51 35 37 28 33 34 38Fixedinterest 36 30 35 35 41 42 36 34Property 9 9 10 10 4 5 6 8Cash 6 4 14 14 16 5 14 20Other 10 6 6 4 11 15 10 –
1 TheinvestmentassetsoftheplansmayattimesincludeeitherdirectorindirectinvestmentsinAMPLimitedshares.Theseinvestmentsarepartofnormalinvestmentmandateswithintheplansandarenotsignificantinrelationtototalplanassets.TheplansdonotholdanyotherassetswhichareoccupiedorusedbytheAMPgroup.
(i) Sensitivity analysisThedefinedbenefitobligationhasbeenrecalculatedforeachscenariobychangingonlythespecifiedassumptionasoutlinedbelow,whilstretainingallotherassumptionsasperthebasecase.Thetableshowstheincrease(decrease)foreachassumptionchange.
AMP AMP AAPH
Australia$m
New Zealand $m
Australia$m
New Zealand $m
Higherdiscountrate(0.5%) (21) (2) (27) (16)Lowerdiscountrate(0.5%) 18 2 31 16Higherexpectedsalaryincreaserate(0.5%) n/a n/a 2 n/aLowerexpectedsalaryincreaserate(0.5%) n/a n/a (2) n/aHigherexpecteddeferredbenefitcreditingrate(0.5%) n/a n/a 4 n/aLowerexpecteddeferredbenefitcreditingrate(0.5%) n/a n/a (4) n/aIncreasetopensionerindexationassumption(0.5%) 19 1 25 1Decreasetopensionerindexationassumption(0.5%) (22) (1) (23) (1)Increasetopensionermortalityassumption(10.0%) 7 n/a 8 n/aDecreasetopensionermortalityassumption(10.0%) (7) n/a (8) n/aOneyearadditionallifeexpectancy n/a 1 n/a 3
Notallassumptionsarematerialforeachfund.Immaterialassumptionshavebeenmarkedasn/a.
AMP AMP AAPH
Australia$m
New Zealand $m
Australia$m
New Zealand $m
(j) Expected contributionsExpectedemployercontributions – – 2 3
AMP AMP AAPH
Australia New Zealand Australia New Zealand
(k) Maturity profile of defined benefit obligationWeightedaveragedurationofthedefinedbenefitobligation 12years 8years 14years 14years
For
per
sona
l use
onl
y

AMP 2015 annual report 115
28. Share-based payments(a) Summary of AMP’s share-based payment plansAMPhasanumberofemployeeshare-basedpaymentplans.Share-basedpaymentsplaceemployeesparticipatinginthoseplans(participants)inthepositionoftheshareholder,andindoingso,rewardemployeesforthegenerationofvalueforshareholders.InformationonplanswhichAMPcurrentlyoffersisprovidedbelow.
ThefollowingtableshowstheexpenserecordedforAMPshare-basedpaymentplansduringtheyear:
Consolidated
2015 $’000
2014$’000
Plans currently offered Performancerights 11,433 13,308Sharerights 22,596 21,946Restrictedshares 16 158Employeeshareacquisitionplan–matchingshares 1 1
Total share-based payments expense 34,046 35,413
(b) Performance rightsPlan descriptionTheCEOandhisdirectreports,aswellasselectedseniorexecutives,arerequiredtotaketheirlong-termincentive(LTI)awardsintheformofperformancerights.Thisistoensurethatthoseexecutives,whoaremostdirectlyabletoinfluencecompanyperformance,areappropriatelyalignedwiththeinterestsofshareholders.TheLTIawardsofotherparticipantsarecomprisedofeitheramixofperformancerightsandsharerights,orsharerightsonly.
Aperformance rightisarighttoacquireonefullypaidordinaryshareinAMPLimitedafterathree-yearperformanceperiodatnocosttotheparticipant(ieeffectivelyashareoptionwithazeroexerciseprice),providedaspecificperformancehurdleismet.Priortoconversionintoshares(vesting),performancerightsholdersdonotreceivedividendsorhaveothershareholderbenefits(includinganyvotingrights).Performancerightsmaybesettledthroughacashpaymentinlieuofshares,atthediscretionoftheboard.
The performance hurdleHistorically,LTIawardsintheformofperformancerightsweresubjecttoasinglerelativetotalshareholderreturn(TSR)performancehurdleonly.Afteranextensivereviewofmarketpracticesin2012,theboarddeterminedthatAMPshouldintroduceareturnonequity(RoE)performancemeasure,inadditiontoaTSRmeasure.
Thevestingofperformancerightsgrantedforthe2013and2014LTIawardsisbasedontwoperformancehurdlesasfollows:– 50%oftheLTIawardfairvalue,grantedasperformancerights,willbesubjecttoAMP’sTSRperformancerelativetothetop
industrialcompaniesintheS&P/ASX100Index(TSRtranche),and– 50%oftheLTIawardfairvalue,grantedasperformancerights,willbesubjecttoaRoEmeasure(RoEtranche).
Forthe2015LTIaward,60%oftheLTIawardfacevaluewasbasedontheTSRperformanceconditionandtheremaining40%ontheRoEperformancemeasure.
Thenumberofperformancerightsthatvestisdeterminedasfollows:
TSRtranche:VestingoftheseperformancerightsisdependentonAMP’sTSRperformancerelativetoacomparatorgroupofAustralianlistedcompaniesoverathree-yearperformanceperiod.TSRmeasuresthebenefitdeliveredtoshareholdersoverthegivenperiod,whichincludesdividendpayments,capitalreturnsandmovementintheshareprice.TheperformancehurdlewaschosenbecauseitrequiresparticipantstooutperformmajorASXlistedcompaniesbeforetheawardsgenerateanyvalue.
RoEtranche:Vestingoftheperformancerightsgrantedin2015isbasedonAMP’sRoEperformancefortheyearending31December2017.
Priortothe2015grantbeingawarded,theboarddeterminedthethresholdandmaximumRoEperformancetargets(expressedaspercentageoutcomes)tobeachievedfortheyearending31December2017.ARoEhurdlewaschosenasitdrivesastrongcapitaldisciplinewhichisakeycontributortocreatingsustainableshareholdervalue.
Conversion to sharesIftheawardsvest,theyareautomaticallyconvertedtosharesonbehalfofparticipants.Uponconversion,participantsbecomeentitledtoshareholderbenefits,includingdividendsandvotingrights.Theboardhasthediscretiontosatisfyvestedrightsbyeitheracquiringsharesonmarketorthroughtheissuanceofshares.AMP’spracticehasbeen,andintentionistocontinue,tosourcethesharestosatisfyLTIawardsonmarket,sothattheissueofLTIsdoesnotdilutethevalueofAMPLimitedshares.InthecaseoftheCEO,thevestingofsharesmayonlybeprovidedbyAMPprocuringthetransferofsharespurchasedonmarket.F
or p
erso
nal u
se o
nly

AMP 2015 annual report116
Notes to the financial statements for the year ended 31 December 2015
28. Share-based payments continuedTreatment of performance rights on ceasing employment and change of controlTypically,unvestedLTIawardslapseattheendoftheemployee’snoticeperiodiftheparticipantresignsfromAMPortheiremploymentisterminatedformisconductorinadequateperformance.Inothercases,suchasretirementandredundancy,LTIawardsmayberetainedbytheparticipant,withvestingcontinuingtobesubjecttothesamevestingconditionsasiftheyhadremainedinAMPemployment.
Theboardhasthediscretiontodetermineanalternativetreatmentoncessationofemploymentandchangeofcontrol(ietodeterminethattheLTIawardswouldlapse,areretainedorvestwhentheywouldnothaveotherwise),ifdeemedappropriateinthelightofspecificcircumstances.
Plan valuationTheallocationvaluesfortheperformancerightswiththeTSRhurdleandtheRoEhurdlearebasedonvaluationspreparedbyanindependentexternalconsultant.Thevaluationsarebasedonthe10-dayvolumeweightedaveragesharepriceoverthe10-daytradingperiodafterthereleaseofAMPresultsandendingpriortothestartoftheperformanceperiod.
Indeterminingtheshare-basedpaymentsexpense,thenumberofinstrumentsexpectedtovesthasbeenadjustedtoreflectthenumberofemployeesexpectedtoremainwithAMPuntiltheendoftheperformanceperiod.
Forthepurposesofthevaluationitisassumedperformancerightsareexercisedassoontheyhavevested.AssumptionsregardingthedividendyieldandvolatilityhavebeenestimatedbasedonAMP’sactualhistoricdividendyieldandvolatilityoveranappropriateperiod.
Thefollowingtableshowsthefactorswhichwereconsideredindeterminingtheallocationvalueoftheperformancerightsgrantedduring2015andthecomparativeperiod(2014):
Grant date Share priceContractual
life (years)Dividend
yield Volatility1 Risk-free rate1
TSR performance
hurdle discount
RoE performance
hurdle discount2
TSR performance
rights fair value
RoE performance
rights fair value
18/09/2015 $5.79 2.7 4.6% 23% 1.9% 58% 0% $2.43 $5.1104/06/2015 $6.20 3.0 4.7% 23% 2.1% 55% 0% $2.82 $5.3913/04/2015 $6.69 2.1 4.8% 23% 1.8% 34% 0% $4.44 $6.0505/06/2014 $5.28 3.0 4.8% 25% 2.9% 45% 0% $2.89 $4.5709/09/2013 $4.62 2.5 4.9% 24% 2.8% 71% 0% $1.33 $4.0906/06/2013 $4.97 3.0 5.6% 23% 2.5% 60% 0% $2.00 $4.2107/06/2012 $3.85 2.7 6.3% 26% 2.3% 67% n/a $1.28 n/a
1 AppliestoperformancerightssubjecttoarelativeTSRperformancehurdleonly.ThesefactorsdonotapplytoperformancerightssubjecttoaRoEperformancehurdle.
2 InaccordancewiththeaccountingstandardAASB2,allowancecannotbemadefortheimpactofanon-marketbasedperformancehurdleindeterminingfairvalue.
Thefollowingtableshowsthemovementinperformancerightsoutstandingduringtheperiod:
Grant dateExercise period1
Exercise price
Balance at 1 Jan 2015
Exercised during the year
Granted during the year
Lapsed during the year
Balance at 31 Dec 2015
07/06/2012 n/a Nil 7,009,147 – – 7,009,147 –06/06/2013 n/a Nil 4,664,709 – – 18,327 4,646,38209/09/2013 n/a Nil 29,047 – – 29,047 –05/06/2014 n/a Nil 3,942,342 – – 39,451 3,902,89113/04/2015 n/a Nil – – 8,004 – 8,00404/06/2015 n/a Nil – – 3,477,693 28,615 3,449,07818/09/2015 n/a Nil – – 61,038 – 61,038
Total 15,645,245 – 3,546,735 7,124,587 12,067,393
1 Performancerightshavenoexerciseperiod;theyareexercisedinthefirsttradingwindowfollowingtheapprovalofthevestingbytheboard.
Fromtheendofthefinancialyearanduptothedateofthisreport,noperformancerightshavebeenissued,noperformancerightshavebeenexercised,andnoperformancerightshavelapsed.Oftheperformancerightsoutstandingattheendoftheperiod,nonehavevestedorbecomeexercisable.Duetoinconsistenciesincommunicationtoparticipants;AMPmadeapaymenttoseniormanagersrelatedtothe2012long-termincentiveplan,whichlapsedanddidnotvest.Nokeymanagementpersonnelreceivedthispayment.
For
per
sona
l use
onl
y

AMP 2015 annual report 117
28. Share-based payments continued(c) Share rightsPlan descriptionAsdescribedabove,LTIparticipantsbelowtheCEOandhisdirectreportsmaybeawardedsharerightsaspartoftheiroverallLTIaward.
Ashare rightisarighttoacquireonefullypaidordinaryshareinAMPLimitedafteraspecifiedserviceperiodatnocosttotheparticipant,providedaspecificserviceconditionismet.Theserviceperiodistypicallythreeyears,butmayvarywherethesharerightsareawardedtoretainanemployeeforacriticalperiod.Priortoconversionintoshares(vesting),sharerightsholdersdonotreceivedividendsorhaveothershareholderbenefits(includinganyvotingrights).
Asthisprogramisdesignedasameansofrecognisingandretainingemployees,noperformancehurdlesapply,otherthancontinuedserviceforthedurationofthethree-yearperiod.
Treatment of share rights on ceasing employment and change of controlTypically,unvestedsharerightslapseiftheparticipantresignsfromAMPoristerminatedformisconductorinadequateperformance.Inothercases,suchasretirementandredundancy,theparticipanttypicallyretainstheirsharerightsattheboard’sdiscretion.IntheeventthatAMPissubjecttoatakeoverchangeofcontrol,treatmentofunvestedsharerightsissubjecttotheboard’sdiscretion.
Plan valuationThefairvalueofsharerightshasbeencalculatedasatthegrantdate,byexternalconsultantsusinga‘discountedcashflow’methodology.Fairvaluehasbeendiscountedforthepresentvalueofdividendsexpectedtobepaidduringthevestingperiodtowhichtheparticipantisnotentitled.
Indeterminingtheshare-basedpaymentsexpense,thenumberofinstrumentsexpectedtovesthasbeenadjustedtoreflectthenumberofemployeesexpectedtoremainwithAMPuntiltheendoftheperformanceperiod.
Forthepurposesofthevaluationitisassumedsharerightsareexercisedassoontheyhavevested.AssumptionsregardingthedividendyieldhavebeenestimatedbasedonAMP’sactualhistoricdividendyieldoveranappropriateperiod.
STI deferral planThenominatedexecutives,andselectedotherseniorleaderswhohavetheabilitytoimpactAMP’sfinancialsoundness,participateintheAMPSTIdeferralplan.Theplanrequiresthat40%ofaparticipant’sSTIawardbedeliveredinrightstoAMPshares(sharerights).ThesharerightsconverttoAMPLimitedshares(ievest)afteratwo-yeardeferralperiod.Vestingissubjecttoongoingemployment,compliancewithAMPpoliciesandtheboard’sdiscretion.
STI match planForeachgivenyear,highpotentialemployeesataseniorleaderlevelareeligiblefornominationtoparticipateintheSTImatchplan,whichprovidesanawardofsharerightstothevalueof50%oftheindividual’sSTI.TheSTImatchawardisprovidedinadditiontotheSTIcashopportunity.EmployeesatthislevelarenoteligibletoparticipateinAMP’slong-termincentiveplan.AstheSTImatchisbasedontheSTIplan,thenumberofsharerightsawardedtotheparticipantdependsontheindividual’scontributiontocompanyperformanceduringthefinancialyear.
STImatchsharerightsconverttoAMPLimitedshares(ievest)afteratwo-yeardeferralperiod.Vestingissubjecttoongoingemployment,compliancewithAMPpoliciesandtheboard’sdiscretion.
Conversion to sharesIftheawardsvest,theyareautomaticallyconvertedtosharesonbehalfofparticipants.Uponconversion,participantsbecomeentitledtoshareholderbenefits,includingdividendsandvotingrights.Theboardhasthediscretiontosatisfyvestedrightsbyeitheracquiringsharesonmarketorthroughtheissuanceofshares.AMP’spracticehasbeen,andintentionistocontinue,tosourcethesharestosatisfyLTI,STIdeferralandSTImatchawardsonmarket,sothattheissuanceofsharesdoesnotdilutethevalueofAMPLimitedshares.
For
per
sona
l use
onl
y

AMP 2015 annual report118
Notes to the financial statements for the year ended 31 December 2015
28. Share-based payments continuedThefollowingtableshowsthefactorswhichwereconsideredindeterminingtheindependentfairvalueofthesharerightsgrantedduring2015andthecomparativeperiod(2014):
Grant date Share priceContractual
life (years) Dividend yieldDividend discount Fair value
18/09/2015 $5.79 2.7 4.6% 12% $5.1118/09/2015 $5.79 1.8 4.6% 7% $5.4118/09/2015 $5.79 2.0 4.6% 6% $5.4204/06/2015 $6.20 3.0 4.7% 13% $5.3929/05/2015 $6.66 0.8 4.8% 4% $6.4129/05/2015 $6.66 1.8 4.8% 8% $6.1130/04/2015 $6.44 1.8 4.8% 8% $5.9013/04/2015 $6.69 2.1 4.8% 10% $6.0505/06/2014 $5.28 3.0 4.8% 13% $4.5729/04/2014 $5.07 1.8 4.8% 8% $4.6414/03/2014 $4.92 1.0 4.8% 4% $4.7014/03/2014 $4.92 2.0 4.8% 9% $4.48
Thefollowingtableshowsthemovementinsharerightsoutstandingduringtheperiod:
Grant date Exercise period1 Exercise priceBalance at 1 Jan 2015
Exercised during the year
Granted during the year
Lapsed during the year
Balance at 31 Dec 2015
07/06/2012 n/a Nil 2,089,368 2,089,368 – – –30/04/2013 n/a Nil 2,576,103 2,576,103 – – –30/04/2013 n/a Nil 742,074 738,548 – 3,526 –06/06/2013 n/a Nil 1,449,826 – – 19,046 1,430,78006/06/2013 n/a Nil 40,241 40,241 – – –06/06/2013 n/a Nil 15,756 15,756 – – –27/06/2013 n/a Nil 9,392 9,392 – – –09/09/2013 n/a Nil 71,452 35,726 – – 35,72609/09/2013 n/a Nil 18,181 – – 18,181 –14/03/2014 n/a Nil 75,000 37,500 – – 37,50029/04/2014 n/a Nil 674,606 – – 19,624 654,98229/04/2014 n/a Nil 2,498,925 – – 6,434 2,492,49129/04/2014 n/a Nil 1,481,695 – – 40,344 1,441,35113/04/2015 n/a Nil – – 5,468 – 5,46830/04/2015 n/a Nil – – 871,408 19,232 852,17630/04/2015 n/a Nil – – 1,357,234 – 1,357,23430/04/2015 n/a Nil – – 715,285 448 714,83730/04/2015 n/a Nil – – 166,944 – 166,94429/05/2015 n/a Nil – – 11,848 – 11,84829/05/2015 n/a Nil – – 12,437 – 12,43704/06/2015 n/a Nil – – 1,629,698 42,643 1,587,05518/09/2015 n/a Nil – – 61,037 – 61,03718/09/2015 n/a Nil – – 24,469 – 24,46918/09/2015 n/a Nil – – 83,333 – 83,333
Total 11,742,619 5,542,634 4,939,161 169,478 10,969,668
1 Thesharerightsgrantedhavenoexerciseperiod;theyareexercisedinthefirsttradingwindowfollowingtheapprovalofthevestingbytheboard.
Fromtheendofthefinancialyearanduptothedateofthisreport,nosharerightshavebeenissued,nosharerightshavebeenexercised,and81,351sharerightshavelapsedduetoresignation.Ofthesharerightsoutstandingattheendoftheperiod,nonehavevestedorbecomeexercisable.F
or p
erso
nal u
se o
nly

AMP 2015 annual report 119
28. Share-based payments continued(d) Restricted sharesPlan descriptionArestricted shareisanordinaryAMPsharethathasaholdinglockinplaceuntilthespecifiedvestingperiodends.Thevestingperiodistypicallythreeyears,butmayvarywheretherestrictedsharesareawardedtoretainanemployeeforacriticalperiod.Duringthistime,theholderiseligiblefordividends,butisunabletosell,transferorhedgetheiraward.
Asthisprogramisdesignedasameansofrecognisingandretainingemployees,noperformancehurdlesapply,otherthancontinuedserviceforthedurationofthethree-yearholdinglock.IftheindividualresignsfromAMP(oremploymentisterminatedformisconductorinadequateperformance)duringtheholdingperiod,thesharesareforfeited.
Incasessuchasretirementandredundancy,theindividualretainstheirrestrictedshares;howevertheholdinglockremainsinplaceuntiltheendofthethree-yearvestingperiod.Restrictedsharesareboughtonmarketandgrantedatnocosttoemployees.
Plan valuationThefairvalueofrestrictedshareshasbeendeterminedasthemarketpriceofAMPordinarysharesonthegrantdate.Asemployeesholdingrestrictedsharesareentitledtodividendpayments,noadjustmenthasbeenmadetothefairvalueinrespectoffuturedividendpayments.Indeterminingtheshare-basedpaymentsexpensefortheperiod,thenumberofinstrumentsexpectedtovesthasbeenadjustedtoreflectthenumberofemployeesexpectedtoremainwithAMPuntiltheendofthevestingperiod.
Norestrictedsharesweregrantedduring2014and2015.
(e) Employee share acquisition planPlan descriptionFromtimetotime,AMPhasprovidedemployeesandexecutiveswiththeopportunitytobecomeshareholdersinAMPthroughtheemployeeshareacquisitionplan(ESAP),typicallybywayofsalarysacrificingtheirfixedremunerationorshort-termincentivetoacquireshares.Dependingonthetermsoftheparticularaward,participantsmaybeentitledtoreceivematchingsharesforsharesacquiredundertheESAP(egthemostrecentawardsprovidedonefreeshareforevery10sharesacquiredviasalarysacrifice).Additionally,AMPcanprovideemployeeswithfreesharesundertheESAP.Wheretheawardsareacquiredatnocosttotheparticipant,service-basedconditionsmustbemetfortheparticipanttoreceivetheirfullentitlement.Therearenoperformancehurdlesapplyingtotheplanasitisprimarilydesignedtoencourageemployeeshareownership.
Theplanwassuspendedmid-waythrough2009inAustraliaduetothechangestothetaxationtreatmentofemployeeshareplanawards.Consequently,noshareshavebeenacquiredbyAustralianemployeesundertheESAPplansincemid-2009.TheplancontinuestooperateinNewZealand.
Ifapplicable,matchingsharesareboughtonmarketthroughanindependentthirdparty.
ParticipantswhoceasetobeemployedwithintheAMPgroupwithinthethree-yearholdingperiodmaylosetheirentitlementtosomeoralloftheirmatchingsharesorfreeshares,dependingonthereasonforleavingthecompany.Toreceivethemaximumentitlement,participantsmustbeemployedbyAMPforthewholethree-yearperiod.
Plan valuationAllawardsmadeduring2015,andthecomparativeyear(2014),wereofferstosalarysacrificetoacquireshares,withmatchingsharesawardedonaone-for-tenbasisafterathree-yearvestingperiod.EachmatchingsharehasbeenvaluedbyexternalconsultantsasthefacevalueofanAMPordinaryshareatthedatethesalarysacrificeshareswereacquired,lessthepresentvalueoftheexpecteddividends(towhichtheparticipantisnotentitleduntiltheendofthevestingperiod).ThenumberofmatchingsharesexpectedtobegrantedisestimatedbasedontheaveragenumberofsharesheldintheESAPbyeachemployeeatthebeginningofeachyear.Indeterminingtheshare-basedpaymentsexpensefortheperiod,thenumberofmatchingsharesexpectedtobegrantedhasbeenadjustedtoreflectthenumberofemployeesexpectedtoremainwithAMPuntiltheendofthethree-yearvestingperiod.
ThefollowingtableshowsthenumberofmatchingsharesexpectedtobegrantedbasedonthesharespurchasedbyemployeesundertheESAPduringthecurrentperiodandthecomparativeperiod,andthefairvalue.
Grant dateEstimated number of
matching shares to be grantedWeighted average
fair value
2015 – various 186 $5.242014–various 369 $4.41
For
per
sona
l use
onl
y
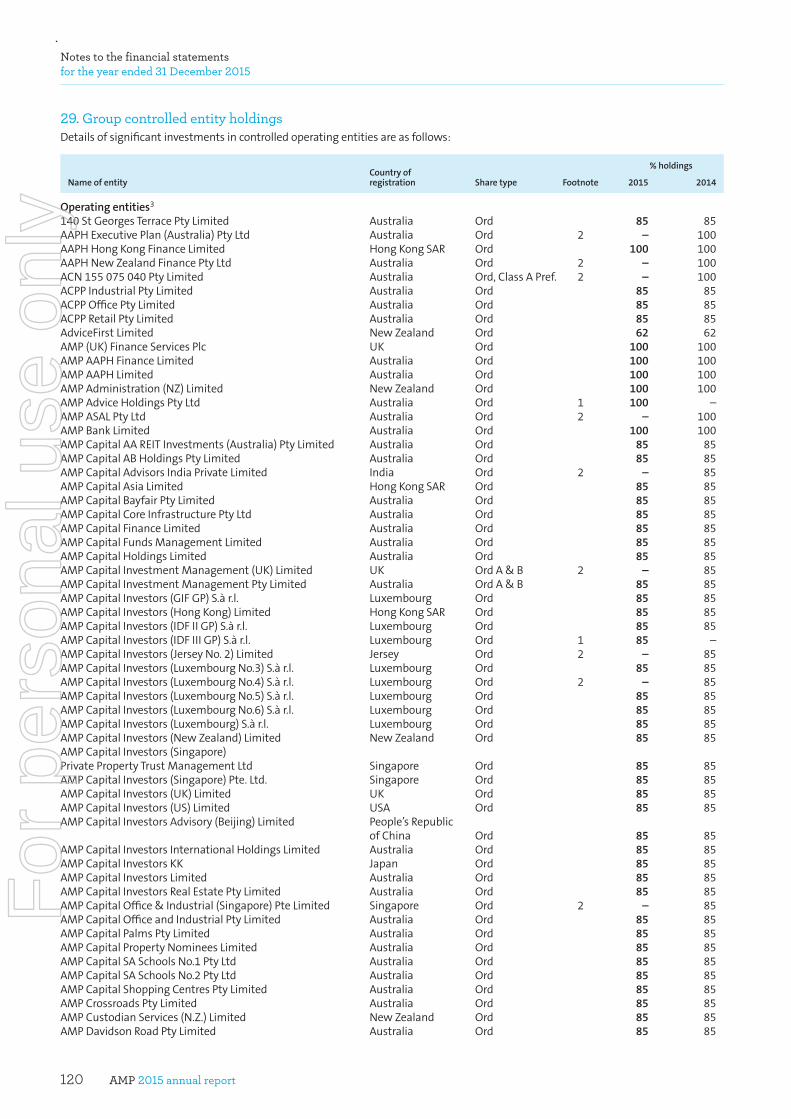
AMP 2015 annual report120
Notes to the financial statements for the year ended 31 December 2015
29. Group controlled entity holdingsDetailsofsignificantinvestmentsincontrolledoperatingentitiesareasfollows:
% holdings
Name of entityCountry of registration Share type Footnote 2015 2014
Operating entities3140StGeorgesTerracePtyLimited Australia Ord 85 85AAPHExecutivePlan(Australia)PtyLtd Australia Ord 2 – 100AAPHHongKongFinanceLimited HongKongSAR Ord 100 100AAPHNewZealandFinancePtyLtd Australia Ord 2 – 100ACN155075040PtyLimited Australia Ord,ClassAPref. 2 – 100ACPPIndustrialPtyLimited Australia Ord 85 85ACPPOfficePtyLimited Australia Ord 85 85ACPPRetailPtyLimited Australia Ord 85 85AdviceFirstLimited NewZealand Ord 62 62AMP(UK)FinanceServicesPlc UK Ord 100 100AMPAAPHFinanceLimited Australia Ord 100 100AMPAAPHLimited Australia Ord 100 100AMPAdministration(NZ)Limited NewZealand Ord 100 100AMPAdviceHoldingsPtyLtd Australia Ord 1 100 –AMPASALPtyLtd Australia Ord 2 – 100AMPBankLimited Australia Ord 100 100AMPCapitalAAREITInvestments(Australia)PtyLimited Australia Ord 85 85AMPCapitalABHoldingsPtyLimited Australia Ord 85 85AMPCapitalAdvisorsIndiaPrivateLimited India Ord 2 – 85AMPCapitalAsiaLimited HongKongSAR Ord 85 85AMPCapitalBayfairPtyLimited Australia Ord 85 85AMPCapitalCoreInfrastructurePtyLtd Australia Ord 85 85AMPCapitalFinanceLimited Australia Ord 85 85AMPCapitalFundsManagementLimited Australia Ord 85 85AMPCapitalHoldingsLimited Australia Ord 85 85AMPCapitalInvestmentManagement(UK)Limited UK OrdA&B 2 – 85AMPCapitalInvestmentManagementPtyLimited Australia OrdA&B 85 85AMPCapitalInvestors(GIFGP)S.àr.l. Luxembourg Ord 85 85AMPCapitalInvestors(HongKong)Limited HongKongSAR Ord 85 85AMPCapitalInvestors(IDFIIGP)S.àr.l. Luxembourg Ord 85 85AMPCapitalInvestors(IDFIIIGP)S.àr.l. Luxembourg Ord 1 85 –AMPCapitalInvestors(JerseyNo.2)Limited Jersey Ord 2 – 85AMPCapitalInvestors(LuxembourgNo.3)S.àr.l. Luxembourg Ord 85 85AMPCapitalInvestors(LuxembourgNo.4)S.àr.l. Luxembourg Ord 2 – 85AMPCapitalInvestors(LuxembourgNo.5)S.àr.l. Luxembourg Ord 85 85AMPCapitalInvestors(LuxembourgNo.6)S.àr.l. Luxembourg Ord 85 85AMPCapitalInvestors(Luxembourg)S.àr.l. Luxembourg Ord 85 85AMPCapitalInvestors(NewZealand)Limited NewZealand Ord 85 85AMPCapitalInvestors(Singapore)PrivatePropertyTrustManagementLtd Singapore Ord 85 85AMPCapitalInvestors(Singapore)Pte.Ltd. Singapore Ord 85 85AMPCapitalInvestors(UK)Limited UK Ord 85 85AMPCapitalInvestors(US)Limited USA Ord 85 85AMPCapitalInvestorsAdvisory(Beijing)Limited People’sRepublic ofChina Ord 85 85AMPCapitalInvestorsInternationalHoldingsLimited Australia Ord 85 85AMPCapitalInvestorsKK Japan Ord 85 85AMPCapitalInvestorsLimited Australia Ord 85 85AMPCapitalInvestorsRealEstatePtyLimited Australia Ord 85 85AMPCapitalOffice&Industrial(Singapore)PteLimited Singapore Ord 2 – 85AMPCapitalOfficeandIndustrialPtyLimited Australia Ord 85 85AMPCapitalPalmsPtyLimited Australia Ord 85 85AMPCapitalPropertyNomineesLimited Australia Ord 85 85AMPCapitalSASchoolsNo.1PtyLtd Australia Ord 85 85AMPCapitalSASchoolsNo.2PtyLtd Australia Ord 85 85AMPCapitalShoppingCentresPtyLimited Australia Ord 85 85AMPCrossroadsPtyLimited Australia Ord 85 85AMPCustodianServices(N.Z.)Limited NewZealand Ord 85 85AMPDavidsonRoadPtyLimited Australia Ord 85 85
For
per
sona
l use
onl
y

AMP 2015 annual report 121
29. Group controlled entity holdings continued
% holdings
Name of entityCountry of registration Share type Footnote 2015 2014
AMPDirectPtyLtd Australia Ord 100 100AMPFinanceLimited Australia Ord 100 100AMPFinanceServicesLimited Australia Ord 100 100AMPFinancialInvestmentGroupHoldingsLimited Australia Ord 100 100AMPFinancialPlanningPtyLimited Australia Ord 100 100AMPFinancialServicesHoldingsLimited Australia OrdA 100 100AMPFoundationIncomeBeneficiaryPtyLtd Australia Ord 100 100AMPFoundationLimited Australia Ord 100 100AMPGBSLimited Australia Fixed 100 100AMPGDPFPtyLimited Australia Ord 85 85AMPGroupFinanceServicesLimited Australia Ord 100 100AMPGroupHoldingsLimited Australia OrdA 100 100AMPGroupServicesLimited Australia OrdA 100 100AMPHoldingsLimited Australia OrdA,OrdB, RedPrefBClass 100 100AMPInsuranceInvestmentHoldingsPtyLimited Australia Ord 100 100AMPInvestmentManagement(N.Z.)Limited NewZealand Ord 85 85AMPInvestmentServicesNo.2PtyLimited Australia Ord 85 85AMPInvestmentServicesPtyLimited Australia Ord 85 85AMPLendingServicesLimited Australia Ord 100 100AMPLifeLimited Australia Ord 100 100AMPMacquarieHoldingPtyLimited Australia Ord 85 85AMPMacquariePtyLimited Australia Ord 85 85AMPNewVenturesHoldingsPtyLtd Australia Ord 100 100AMPNewZealandHoldingsLimited NewZealand Ord 100 100AMPPacificFairPtyLimited Australia Ord 85 85AMPPersonalInvestmentServicesPtyLtd Australia Ord 100 100AMPPlannerRegisterCompanyPtyLimited Australia Ord 100 100AMPPrivateCapitalNewZealandLimited NewZealand Ord 85 85AMPPrivateCapitalNo.2PtyLimited Australia OrdA 85 85AMPPrivateCapitalPtyLimited Australia Ord 85 85AMPPrivateInvestmentsPtyLimited Australia Ord 2 – 85AMPRealEstateAdvisoryHoldingsPtyLimited Australia Ord 2 – 100AMPRemunerationRewardPlansNomineesPtyLimited Australia Ord 100 100AMPRiversidePlazaPtyLimited Australia Ord 85 85AMPRoyalRandwickPtyLimited Australia Ord 85 85AMPServices(NZ)Limited NewZealand Ord 100 100AMPServicesHoldingsLimited Australia OrdA 100 100AMPServicesLimited Australia OrdA 100 100AMPSMSFHoldingCo.PtyLtd Australia Ord 100 100AMPSMSFInvestmentsNo.2PtyLimited Australia Ord 100 100AMPSuperannuationLimited Australia Ord 100 100AMPWarringahMallPtyLimited Australia Ord 85 85AMPWealthManagementNewZealandLimited NewZealand Ord 100 100AMPWholesaleOfficeInvestmentsPtyLimited Australia Ord 1 85 –ArriveWealthManagementPtyLimited Australia Ord 2 – 100AssociatedPlannersFinancialServicesPtyLimited Australia Ord 100 96AssociatedPlannersStrategicFinancePtyLtd Australia Ord 100 96AuburnMegaMallPtyLimited Australia Ord 85 85AustralianMutualProvidentSocietyPtyLimited Australia Ord 100 100AustralianSecuritiesAdministrationLimited Australia Ord 100 100AWOFNewZealandOfficePtyLimited Australia Ord 85 85BMRIFinancialServicesPtyLtd Australia Ord 100 100CarterBaxPtyLtd Australia Ord 2 – 100CavendishAdministrationPtyLtd Australia Ord 100 100CavendishPtyLtd Australia Ord,AClass,BClass, CClass,FClass 100 100CavendishSuperannuationHoldingsPtyLtd Australia Ord 100 100CBDFinancialPlanningPtyLimited Australia Ord 2 – 100CharterFinancialPlanningLimited Australia Ord 100 100ClientcareFinancialPlanningPtyLtd Australia Ord 2 – 100
For
per
sona
l use
onl
y

AMP 2015 annual report122
Notes to the financial statements for the year ended 31 December 2015
29. Group controlled entity holdings continued
% holdings
Name of entityCountry of registration Share type Footnote 2015 2014
CorporateCustodiansPtyLimited Australia Ord 1 100 –ExfordPtyLtd Australia Ord,ClassA, ClassB,ClassC 100 100FinancialComposurePtyLtd Australia Ord 100 96FinanciallyYoursHoldingsPtyLtd Australia Ord,ClassZ 100 100FinanciallyYoursPty.Ltd. Australia Ord 100 100FirstQuestCapitalPtyLtd Australia Ord 100 96ForsythesFinancialServicesPtyLtd Australia Ord 100 100FoundationWealthAdvisersPtyLimited Australia Ord 60 57Garrisons(Rosny)PtyLtd Australia Ord 2 – 100GenesysGroupHoldingsPtyLimited Australia Ord 100 100GenesysGroupPtyLimited Australia Ord 100 96GenesysHobartPtyLtd Australia Ord 100 96GenesysHoldingsLimited Australia Ord 100 96GenesysKewPtyLtd Australia Ord 100 96GenesysWealthAdvisers(WA)PtyLtd Australia Ord 2 – 100GenesysWealthAdvisersLimited Australia Ord 100 96GWMSpicersLimited NewZealand Ord 100 100HillrossAlliancesPtyLtd Australia Ord 100 100HillrossFinancialServicesLimited Australia Ord 100 100HillrossInnisfailPtyLimited Australia Ord 2 – 100HillrossWealthManagementCentreMelbournePtyLimited Australia Ord 2 – 100HindmarshSquareFinancialServicesPtyLtd Australia Ord 100 100HindmarshSquareWealthAdvisersPtyLtd Australia Ord 90 86INSSAPtyLimited Australia Ord 100 100ipacAssetManagementLimited Australia Ord 100 100ipacFinancialCarePtyLtd Australia Ord,Bonus 100 100ipacGroupServicesPtyLtd Australia Ord 100 100IpacPortfolioManagementLimited Australia ConvertingClassA 85 85ipacSecuritiesLimited Australia Ord 100 100ipacTaxationServicesPtyLimited Australia Ord 100 100JigsawSupportServicesLimited Australia Ord 100 100JohnCoombes&CompanyPtyLtd Australia Ord 2 – 55JorekiPtyLimited Australia Ord 2 – 100JustsuperPtyLtd Australia Ord 1 100 –KingFinancialServicesPtyLtd Australia Ord 100 100LifeFXPtyLtd Australia Ord 2 – 100MarrickvilleMetroShoppingCentrePtyLimited Australia Ord 85 85MonitorMoneyCorporationPtyLtd Australia Ord 2 – 100MultiportMalaysiaSDNBHD Malaysia Ord 100 100MultiportPtyLimited Australia Ord,ClassA 100 100MultiportResourcesPtyLtd Australia Ord 100 100NationalMutualFundsManagement(Global)Limited Australia Ord 100 100NationalMutualFundsManagementLtd Australia Ord 100 100NationalMutualLifeNomineesPtyLimited Australia Ord 100 100NMNewZealandNomineesLimited Australia Ord – 100NMMTLimited Australia Ord 100 100NorthstarLendingPtyLtd Australia Ord 100 100Omega(Australia)PtyLimited Australia Ord 85 85PajodaInvestmentsPtyLtd Australia Ord 55 55PPSLifestyleSolutionsPtyLtd Australia Ord 100 100PremierOneMortgageAdvicePtyLimited Australia Ord 100 100PriorityOneAgencyServicesPtyLtd Australia Ord 100 100PriorityOneFinancialServicesLimited Australia Ord 100 100PrivateWealthManagersPtyLtd Australia Ord 2 – 100Progress2006-1Trust Australia 2 – 100Progress2007-1GTrust Australia 100 100Progress2008-1RTrust Australia 100 100Progress2009-1Trust Australia 100 100Progress2010-1Trust Australia 100 100Progress2011-1Trust Australia 100 100
For
per
sona
l use
onl
y

AMP 2015 annual report 123
29. Group controlled entity holdings continued
% holdings
Name of entityCountry of registration Share type Footnote 2015 2014
Progress2012-1Trust Australia 100 100Progress2012-2Trust Australia 100 100Progress2013-1Trust Australia 100 100Progress2014-1Trust Australia 100 100Progress2014-2Trust Australia 100 100ProgressWarehouseTrustNo1 Australia 100 100ProgressWarehouseTrustNo3 Australia 100 100ProsperitusHoldingsPtyLtd Australia Ord 100 100ProsperitusPtyLtd Australia Ord 100 100QuadrantSecuritiesPtyLtd Australia Ord 100 96RDSSPtyLtd Australia 1 100 –SmartsuperPtyLimited Australia 1 100 –SMSFAdvicePtyLimited Australia Ord 100 100SolarRiskPtyLimited Australia Ord 100 100SpicersPortfolioManagementLimited NewZealand Ord 100 100SPPNo.3AInvestmentsPtyLimited Australia Ord 86 85StrategicPlanningPartnersPtyLtd Australia Ord,OrdC, OrdD,OrdE 100 100SugarlandShoppingCentrePtyLimited Australia Ord 85 85SunshineWestIncomePtyLimited Australia Ord 85 85SuperConceptsPtyLtd Australia Ord,ClassA, ClassB,ClassC, ClassD,ClassE 1 100 –SupercorpPtyLtd Australia Ord 1 100 –SupercorpTechnologyPtyLtd Australia Ord 1 100 –SuperIQPtyLtd Australia Ord,AClass, BClass,CClass, DClass 1 100 –SuwaraowPtyLimited Australia Ord 2 – 100SynergyCapitalManagementLimited Australia Ord 100 96TFSFinancialPlanningPtyLtd Australia Ord 100 100TheNationalMutualLifeAssociationofAustralasiaLimited Australia Ord 100 100TMSecuritiesPtyLtd Australia Ord 100 100TotalSuperSolutionsPtyLtd Australia Ord 100 100TrenthillsFinancialPlanningPtyLimited Australia Ord 2 – 100TrenthillsFinancialServicesPtyLimited Australia Ord 100 100TynanMackenzieHoldingsPtyLtd Australia Ord,ClassA 100 99TynanMackenziePtyLtd Australia Ord 100 99WealthVisionFinancialServicesPtyLtd Australia Ord 1 100 –WealthVisionHomeLoansPtyLtd Australia Ord 1 100 –WilsanikPtyLtd Australia Ord 2 – 100yourSMSFAdministrationPtyLimited Australia Ord 100 100
1 Controllinginterestacquiredin2015. 2 Controllinginterestlostin2015. 3 InrespectofcontrolledcompaniesintheAMPCapitalHoldingsLimitedgroup(AMPCapitalgroup),$24m(FY14:$19m)ofprofitisallocatedtothe
15%non-controllinginterestsoftheAMPCapitalgroupandtheaccumulatednon-controllinginterestamountedto$64m(FY14:$62m).
DetailsofsignificantinvestmentsininvestmententitiescontrolledbytheAMPlifeinsuranceentities’statutoryfundsareasfollows:
% holdings
Name of entityCountry of registration
Share type (where applicable) Footnote 2015 2014
Investment entities controlled by the AMP life insurance entities’ statutory funds4,5140StGeorgesTerraceTrust Australia 100 100255GeorgeStreetInvestmentAPtyLtd Australia Ord 100 100255GeorgeStreetInvestmentBPtyLtd Australia Ord 100 10035OceanKeysPtyLimited Australia Ord 100 100AAPHAustraliaStaffSuperannuationPtyLtd Australia Ord 2 – 100AbbeyCapitalRealEstatePtyLimited Australia Ord 100 100
For
per
sona
l use
onl
y

AMP 2015 annual report124
Notes to the financial statements for the year ended 31 December 2015
29. Group controlled entity holdings continued
% holdings
Name of entityCountry of registration
Share type (where applicable) Footnote 2015 2014
ACPPHoldingTrust Australia 100 100ACPPIndustrialTrust Australia 100 100ACPPRetailTrust Australia 100 100ActiveQuantShareFund Australia 91 91AFSAlternativeFund1 Australia 100 100AFSAlternativeFund2 Australia 1 100 –AFSAustralianEquityEnhancedIndexFund1 Australia 100 100AFSAustralianEquityGrowthFund1 Australia 2 – 100AFSAustralianEquityValuePlusFund1 Australia 100 100AFSAustralianPropertySecuritiesFund1 Australia 100 100AFSAustralianShareFund10 Australia 1 100 –AFSAustralianShareFund8 Australia 100 100AFSAustralianShareFund9 Australia 1 100 –AFSExtendedAlphaFund(formerlyAMPCapitalSustainableExtendedAlphaFund) Australia 100 100AFSGlobalPropertySecuritiesFund1 Australia 100 100AFSInternationalShareFund1 Australia 2 – 62AgedCareInvestmentServicesNo.1PtyLimited Australia Ord 100 100AgedCareInvestmentServicesNo.2PtyLimited Australia Ord 100 100AgedCareInvestmentTrustNo.1 Australia 100 81AgedCareInvestmentTrustNo.2 Australia 100 81AggressiveEnhancedIndexFund Australia 100 100AHGIMartineauFund Australia 100 100AHGIMartineauGalleriesFund Australia 100 100AllmargCorporationLimited NewZealand Ord 100 100AMPAustralianFixedInterestIndexFund Australia 1 54 –AMPAustralianPropertyIndexFund Australia 1,3 46 41AMPBalancedEnhancedIndexFund Australia 100 100AMPCapital1950sFund Australia 100 100AMPCapital1960sFund Australia 100 100AMPCapital1970sFund Australia 100 100AMPCapital1980sFund Australia 100 100AMPCapital1990sFund Australia 100 100AMPCapitalAbsoluteReturn–PassiveFund Australia 92 96AMPCapitalAlternativeDefensiveFund Australia 2 – 94AMPCapitalAlternativeDefensiveFund–DelayedRedemption Australia 98 98AMPCapitalAsiaex-JapanFund Australia 100 100AMPCapitalAsiaLocalCurrencyBondFund Australia 2 – 100AMPCapitalAsiaQuantFund Australia 1 100 –AMPCapitalAsianEquityGrowthFund Australia 94 91AMPCapitalAustralianEquityConcentratedFund Australia 76 76AMPCapitalAustralianEquityIncomeFund Australia 59 85AMPCapitalAustralianEquityIndexFund Australia 51 54AMPCapitalAustralianEquityLongShortFund Australia 1 94 –AMPCapitalAustralianEquityOpportunitiesFund Australia 2 – 66AMPCapitalChinaGrowthFund Australia 3 37 38AMPCapitalCreditStrategiesFund Australia 92 90AMPCapitalDirectPropertyFund Australia 100 100AMPCapitalDiversifiedBalancedFund Australia 100 100AMPCapitalDynamicBalancedFund Australia 1 100 –AMPCapitalEquityFund Australia 1 75 –AMPCapitalExtendedMulti-AssetFund Australia 65 66AMPCapitalGlobalEquitiesSectorRotationFund Australia 2 – 59AMPCapitalGlobalInfrastructureSecuritiesFund(Hedged) Australia 93 83AMPCapitalGlobalInfrastructureSecuritiesFund(Unhedged) Australia 89 88AMPCapitalGreaterChinaEquityGrowthFund Australia 1 99 100AMPCapitalInfrastructureTrust1 Australia 100 100AMPCapitalInvestmentsNo.14Limited NewZealand OrdA&B,Pref 100 100AMPCapitalInvestmentsNo.2Limited NewZealand OrdA&B,Pref 100 100AMPCapitalInvestmentsNo.8Limited NewZealand OrdA&B,Pref 100 100
For
per
sona
l use
onl
y

AMP 2015 annual report 125
29. Group controlled entity holdings continued
% holdings
Name of entityCountry of registration
Share type (where applicable) Footnote 2015 2014
AMPCapitalInvestors(AngelTrainsEUNo.1)S.àr.l. Luxembourg Ord 3 27 27AMPCapitalInvestors(AngelTrainsEUNo.2)S.àr.l. Luxembourg Ord 3 6 6AMPCapitalInvestors(AngelTrainsUKNo.1)S.àr.l. Luxembourg Ord 3 37 37AMPCapitalInvestors(AngelTrainsUKNo.2)S.àr.l. Luxembourg Ord 3 25 25AMPCapitalInvestors(CLHNo.1)S.àr.l. Luxembourg Ord 3 7 7AMPCapitalInvestors(CLHNo.2)B.V. Luxembourg Ord 3 22 22AMPCapitalInvestors(InfrastructureNo.1)S.àr.l. Luxembourg Ord 3 25 25AMPCapitalInvestors(InfrastructureNo.2)S.àr.l. Luxembourg Ord 3 25 25AMPCapitalInvestors(InfrastructureNo.3)S.àr.l. Luxembourg Ord 3 25 25AMPCapitalInvestors(InfrastructureNo.4)S.àr.l. Luxembourg Ord 3 25 25AMPCapitalInvestors(KembleWater)S.àr.l. Luxembourg Ord 3 33 33AMPCapitalInvestorsAirportS.àr.l. Luxembourg Ord 3 27 27AMPCapitalInvestorsUKCableLimited Luxembourg Ord 3 27 27AMPCapitalMacroStrategiesFund Australia 81 100AMPCapitalNewZealandSharesIndexFund NewZealand 2 – 33AMPCapitalShellFund3 Australia 98 100AMPCapitalSpecialistAustralianSmallCompaniesFund Australia 93 91AMPCapitalSpecialistDiversifiedFixedIncomeFund Australia 91 91AMPCapitalStableFund Australia 100 100AMPCapitalStrategicInfrastructureTrustofEuropegroup Luxembourg 6 66 52AMPCapitalSustainableShareFund Australia 72 75AMPCMBSNo.1PtyLimited Australia Ord 100 100AMPCMBSNo.2PtyLimited Australia Ord 100 100AMPConservativeEnhancedEquityFund Australia 1 98 –AMPGlobalPropertyInvestmentsPtyLtd Australia Ord 100 100AMPInternationalEquityIndexFund Australia 1 62 –AMPInternationalEquityIndexFundHedged Australia 99 96AMPInternationalFixedInterestIndexFundHedged Australia 66 65AMPLife(NZ)InvestmentsHoldingsLimited NewZealand Ord 100 100AMPLife(NZ)InvestmentsLimited NewZealand Ord 100 100AMPLifeCashManagementTrust Australia 100 100AMPPrivateCapitalTrustNo.9 Australia 100 100AMPPropertyInvestments(Qld)Pty.Ltd. Australia Ord 100 100AMPShareholderCashFund Australia 100 82AMPShareholderFixedIncomeFund Australia 100 73AMPSmallerCompaniesFund Australia 1 62 –AMPUKShoppingCentreFund Australia 100 100AMP/ERGOMortgageandSavingsLimited NewZealand Ord 100 100AMPCIChinaStrategicGrowthFund Australia 100 100AMPCIFDInfrastructureTrust Australia 99 99ArrowSystemsPtyLimited Australia Ord 1,3 33 33AustralianCorporateBondFund Australia 56 62AustralianCreditFund Australia 99 98AustralianGovernmentFixedInterestFund Australia 100 100AustralianPacificAirportsFund Australia 77 77AustralianPacificAirportsFundNo.3 Australia 33 33BCGFinancePtyLimited Australia Ord 100 100BooragoonTrust Australia 100 100CarillonAvenuePtyLtd Australia Ord 3 32 32CautiousEnhancedIndexFund Australia 100 100CollinsPlaceNo.2PtyLtd Australia Ord 100 100CollinsPlacePtyLimited Australia Ord 100 100CommercialLoanPoolNo.1 Australia 100 100ConservativeEnhancedIndexFund Australia 2 – 99CorePlusFund Australia 100 100CrossroadsTrust Australia 100 100DavidsonRoadTrust Australia 100 100DidusPtyLimited Australia Ord 100 100DiversifiedInvestmentStrategyNo.1 Australia 2 – 55EFMAustralianShareFund1 Australia 98 96EFMAustralianShareFund10 Australia 1 100 –
For
per
sona
l use
onl
y
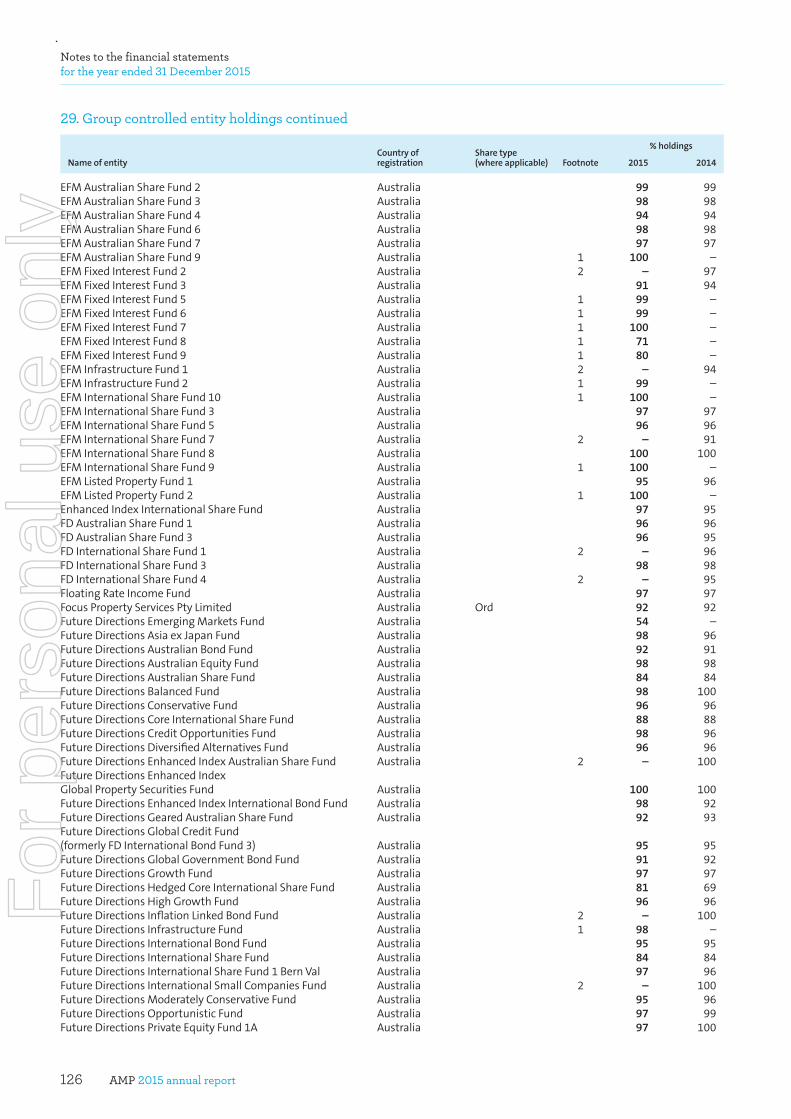
AMP 2015 annual report126
Notes to the financial statements for the year ended 31 December 2015
29. Group controlled entity holdings continued
% holdings
Name of entityCountry of registration
Share type (where applicable) Footnote 2015 2014
EFMAustralianShareFund2 Australia 99 99EFMAustralianShareFund3 Australia 98 98EFMAustralianShareFund4 Australia 94 94EFMAustralianShareFund6 Australia 98 98EFMAustralianShareFund7 Australia 97 97EFMAustralianShareFund9 Australia 1 100 –EFMFixedInterestFund2 Australia 2 – 97EFMFixedInterestFund3 Australia 91 94EFMFixedInterestFund5 Australia 1 99 –EFMFixedInterestFund6 Australia 1 99 –EFMFixedInterestFund7 Australia 1 100 –EFMFixedInterestFund8 Australia 1 71 –EFMFixedInterestFund9 Australia 1 80 –EFMInfrastructureFund1 Australia 2 – 94EFMInfrastructureFund2 Australia 1 99 –EFMInternationalShareFund10 Australia 1 100 –EFMInternationalShareFund3 Australia 97 97EFMInternationalShareFund5 Australia 96 96EFMInternationalShareFund7 Australia 2 – 91EFMInternationalShareFund8 Australia 100 100EFMInternationalShareFund9 Australia 1 100 –EFMListedPropertyFund1 Australia 95 96EFMListedPropertyFund2 Australia 1 100 –EnhancedIndexInternationalShareFund Australia 97 95FDAustralianShareFund1 Australia 96 96FDAustralianShareFund3 Australia 96 95FDInternationalShareFund1 Australia 2 – 96FDInternationalShareFund3 Australia 98 98FDInternationalShareFund4 Australia 2 – 95FloatingRateIncomeFund Australia 97 97FocusPropertyServicesPtyLimited Australia Ord 92 92FutureDirectionsEmergingMarketsFund Australia 54 –FutureDirectionsAsiaexJapanFund Australia 98 96FutureDirectionsAustralianBondFund Australia 92 91FutureDirectionsAustralianEquityFund Australia 98 98FutureDirectionsAustralianShareFund Australia 84 84FutureDirectionsBalancedFund Australia 98 100FutureDirectionsConservativeFund Australia 96 96FutureDirectionsCoreInternationalShareFund Australia 88 88FutureDirectionsCreditOpportunitiesFund Australia 98 96FutureDirectionsDiversifiedAlternativesFund Australia 96 96FutureDirectionsEnhancedIndexAustralianShareFund Australia 2 – 100FutureDirectionsEnhancedIndexGlobalPropertySecuritiesFund Australia 100 100FutureDirectionsEnhancedIndexInternationalBondFund Australia 98 92FutureDirectionsGearedAustralianShareFund Australia 92 93FutureDirectionsGlobalCreditFund(formerlyFDInternationalBondFund3) Australia 95 95FutureDirectionsGlobalGovernmentBondFund Australia 91 92FutureDirectionsGrowthFund Australia 97 97FutureDirectionsHedgedCoreInternationalShareFund Australia 81 69FutureDirectionsHighGrowthFund Australia 96 96FutureDirectionsInflationLinkedBondFund Australia 2 – 100FutureDirectionsInfrastructureFund Australia 1 98 –FutureDirectionsInternationalBondFund Australia 95 95FutureDirectionsInternationalShareFund Australia 84 84FutureDirectionsInternationalShareFund1BernVal Australia 97 96FutureDirectionsInternationalSmallCompaniesFund Australia 2 – 100FutureDirectionsModeratelyConservativeFund Australia 95 96FutureDirectionsOpportunisticFund Australia 97 99FutureDirectionsPrivateEquityFund1A Australia 97 100
For
per
sona
l use
onl
y

AMP 2015 annual report 127
29. Group controlled entity holdings continued
% holdings
Name of entityCountry of registration
Share type (where applicable) Footnote 2015 2014
FutureDirectionsPrivateEquityFund1B Australia 100 100FutureDirectionsPrivateEquityFund2A Australia 97 99FutureDirectionsPrivateEquityFund2B Australia 100 100FutureDirectionsPrivateEquityFund3A Australia 99 99FutureDirectionsPrivateEquityFund3B Australia 100 100FutureDirectionsPrivateEquityFund4A Australia 99 99FutureDirectionsProperty(Feeder)Fund Australia 93 96FutureDirectionsRealPropertyFund Australia 98 100FutureDirectionsTotalReturnFund Australia 90 94FutureDirectionsTransitionFundNo3 Australia 1 98 –GlendenningPtyLimited Australia Ord 100 100GlobalCreditFund Australia 100 100GlobalGovernmentFixedInterestFund Australia 100 100GlobalGrowthOpportunitiesFund Australia 95 96GlobalMatafionS.L. Luxembourg Ord 3 22 22HendersonGlobalCommoditiesFund Australia 2 – 56Honeysuckle231PtyLimited Australia Ord 51 60IEFRelianceRailPtyLimited Australia Ord 1,3 33 33InternationalBondFund Australia 87 92IpacSpecialistInvestmentStrategies–GlobalEmergingMarketsStrategyNo.1 Australia 100 100IpacSpecialistInvestmentStrategies–PassiveGlobalProperty Australia 2 – 100JeminexLimited Australia OrdandPref 51 51KentStreetInvestmentTrust Australia 100 100KentStreetPtyLimited Australia Ord 100 100KiwiKatLimited NewZealand Ord 2 – 70KnoxCityShoppingCentreInvestments(No.2)PtyLimited Australia Ord 100 100ListedPropertyTrustsFund Australia 2 – 52MacquarieBalancedGrowthFund Australia 87 86MacquarielifeAustralianEnhancedEquitiesFund Australia 2 – 96MAFSTransitionTrustNo10 Australia 1 100 –MAFSTransitionTrustNo2 Australia 1 98 –MAFSTransitionTrustNo4 Australia 1 100 –MAFSTransitionTrustNo5 Australia 1 97 –MAFSTransitionTrustNo6 Australia 1 100 –MAFSTransitionTrustNo7 Australia 1 98 –MAFSTransitionTrustNo8 Australia 1 97 –MAFSTransitionTrustNo9 Australia 1 100 –ManagedTreasuryFund Australia 96 88ModeratelyAggressiveEnhancedIndexFund Australia 100 100ModeratelyConservativeEnhancedIndexFund Australia 100 100MonashHouseTrust Australia 100 100MortgageBackedBondsLimited NewZealand Ord 1 100 –MowlaPty.Ltd. Australia Ord 100 100Multi-ManagerPortfolio–AUSTShares Australia 1 100 –Multi-ManagerPortfolio–AustralianEquitiesSector Australia 2 – 100Multi-ManagerPortfolio–Balanced Australia 100 100Multi-ManagerPortfolio–Growth Australia 100 100Multi-ManagerPortfolio–HighGrowth Australia 100 100Multi-ManagerPortfolio–InternationalEquitiesSector Australia 2 – 100Multi-ManagerPortfolio–InternationalShares–Hedged Australia 100 100Multi-ManagerPortfolio–InternationalShares–Unhedged Australia 1 100 –Multi-ManagerPortfolio–PropertySector Australia 100 100Multi-ManagerPortfolio–Secure Australia 100 100Multi-ManagerPortfolio–SecureGrowth Australia 100 100NMComputerServicesPtyLtd Australia Ord 100 100NMRuralEnterprisesPtyLtd Australia Ord 2 – 100NMSuperannuationPtyLimited Australia Ord 100 100NMLAAUSCashPool Australia 100 100NMLANZDCashPool Australia 100 100PrincipalHealthcareHoldingsPtyLimited Australia Ord 100 100
For
per
sona
l use
onl
y

AMP 2015 annual report128
Notes to the financial statements for the year ended 31 December 2015
29. Group controlled entity holdings continued
% holdings
Name of entityCountry of registration
Share type (where applicable) Footnote 2015 2014
PrincipalHealthcareHoldingsTrust Australia 100 100PrivateEquityFundIIIA Australia 94 94PrivateEquityFundIIIB Australia 94 94QuayMining(No.2)Limited Bermuda Ord,RedPref 100 100QuayMiningNo2 Australia 100 100QuayMiningPtyLimited Australia Ord 100 100ResponsibleInvestmentLeadersConservativeFund Australia 94 95ResponsibleInvestmentLeadersGrowthFund Australia 98 97ResponsibleInvestmentLeadersHighGrowthFund Australia 100 100RiversidePlazaTrust Australia 100 100SelectPropertyPortfolioNo.1 Australia 86 86ShortTermCreditFund Australia 100 100SilvertonSecuritiesProprietaryLtd Australia Ord 100 100SouthPeakRealDiversificationFund(4-8%vol) Australia 1 60 –SPPNo.1(AlexandraCanal)PtyLimited Australia Ord 86 86SPPNo.1(Cowes)PtyLimited Australia Ord 86 86SPPNo.1(H)PtyLimited Australia Ord 86 86SPPNo.1(Hawthorn)PtyLimited Australia Ord 86 86SPPNo.1(MonaVale)PtyLimited Australia Ord 86 86SPPNo.1(Mornington)PtyLimited Australia Ord 86 86SPPNo.1(Mt.WaverleyFinancing)PtyLimited Australia Ord 86 86SPPNo.1(Mt.Waverley)PtyLimited Australia Ord 86 86SPPNo.1(Newcastle)PtyLimited Australia Ord 86 86SPPNo.1(NorthMelbourne)PtyLimited Australia Ord 86 86SPPNo.1(Pakenham)PtyLimited Australia Ord 86 86SPPNo.1(PointCook)PtyLimited Australia Ord 86 86SPPNo.1(PortMelbourne)PtyLimited Australia Ord 86 86SPPNo.1(QStores)PtyLimited Australia Ord 86 86SPPNo.1(Rosebery)PtyLimited Australia Ord 86 86SPPNo.1HoldingsPtyLimited Australia Ord 86 86StudentHousingAccommodationGrowthTrust Australia 3 35 19StudentHousingAccommodationGrowthTrustNo.2 Australia 3 35 19SunshineWestDevelopmentPtyLimited Australia Ord 75 75SydneyCoveTrust Australia 100 100TheGlendenningTrust Australia 100 100ThePinnacleFund Australia 100 100TOAPtyLtd Australia Ord 100 100UnitedEquipmentHoldingsPtyLimited Australia APref 56 56WaterfrontPlace(No.2)Pty.Ltd. Australia Ord 100 100WaterfrontPlace(No.3)Pty.Ltd. Australia Ord 100 100WholesaleAustralianBondFund Australia 76 82WholesaleCashManagementTrust7 Australia 2 – 51WholesaleGlobalDiversifiedYieldFund Australia 100 100WholesaleGlobalEquity–IndexFund(Hedged) Australia 100 100WholesaleGlobalEquity–IndexFund(Unhedged) Australia 100 100WholesaleUnitTrustsNZSharesFund NewZealand 100 100WOWFutureDirectionsBalancedFund Australia 1 100 –WTInfrastructureEquityFund Australia 1 32 –
1 Controllinginterestacquiredin2015. 2 Controllinginterestlostin2015. 3 Notmorethan50%holding,butconsolidatedbecauseAMPisexposedorhasrightstosignificantvariablereturnsfromitsinvestmentwiththe
entityandhastheabilitytoaffectthesereturnsthroughitspowerovertheentity. 4 InvestmententitiescontrolledbyAMPlifeinsuranceentitiesaremainlyheldonbehalfofpolicyholdersand,tothatextent,donothaveanydirect
impactontheinterestsofshareholdersofAMPLimited.5 CertainoftheAMPlifeinsuranceentities’statutoryfundsareoperatingcompanieswhichcarryoutbusinessoperationsunrelatedtothecorewealth
managementoperationsoftheAMPgroup.6 InrespectofcontrolledcompaniesintheAMPCapitalStrategicInfrastructureTrustofEuropegroup(SITEgroup),$723m(FY14:$67m)ofprofitis
allocatedtothe34%non-controllinginterestsoftheSITEgroupandtheaccumulatednon-controllinginterestamountedto$288m(FY14:$38m).7 WholesaleCashManagementTrustbecameanassociatedentityduring2015.
For
per
sona
l use
onl
y

AMP 2015 annual report 129
29. Group controlled entity holdings continuedInthecourseofitsnormaloperatinginvestmentsactivities,theAMPlifeinsuranceentities’statutoryfundsacquireequityinterestsinentitieswhich,insomecases,resultsinAMPholdingacontrollinginterestinsomeoftheseinvestees.CertaincontrolledentitiesoftheAMPlifeentities’statutoryfundsareoperatingcompanieswhichcarryoutbusinessoperationsunrelatedtothecorewealthmanagementoperationoftheAMPgroup.
Therearenodisposalgroupsat31December2015.Asat31December2014,AMPgrouphadclassifiedoperatingcompanies,whichwerecontrolledentitiesoftheAMPlifeentities’statutoryfunds,asdisposalgroupsheldforsalewheretheyweresubjecttoactivesaleprocessesatthereportingdateandasalewasexpectedtobecompletedwithinayear.Theseoperatingcompaniesweredisposedinaccordancewiththeinvestmentstrategyofthefundwhichheldtheinvestmentintheseentities.In2014,subsequenttobeingclassifiedasdisposalgroupsanimpairmentof$13mtotheassetsofdisposalgroupswasrecognisedduetoadecreaseintheirfairvalue.Alldisposalgroupsin2014wereheldwithintheAustralianwealthmanagementoperatingsegment.
Themajorclassesofassetsandliabilitiesofthedisposalgroupsareasfollows:
2015 $m
2014$m
Assets Cash – 1Receivables – 16Inventoryandotherassets – 24Property,plantandequipment – 58Intangibles – 1
Total assets of the disposal groups – 100
Liabilities Payables – 20Deferredtaxliability – 2Provisions – 3Borrowings – 44
Total liabilities of the disposal groups – 69
Net assets of the disposal groups – 31
Refertonote23fordetailsregardingfairvaluemeasurement.
30. Associates (a) Investments in associates accounted for using the equity method
Ownership interest Carrying amount
Principal activities2015
%2014
%2015
$m2014
$mPrincipal place
of business
ChinaLife Pensioncompany 19.99 – 282 – People’sRepublicPensionCompany ofChina
InfrashoreGroup Communityhealth 29 – 45 – Australia serviceprovider
AIMSAMPCapital Industrialpropertytrust 5 5 49 43 SingaporeIndustrialREIT1,2
ChinaLifeAMPAsset Investmentmanagement 15 15 20 17 People’sRepublicManagementCompanyLtd3 ofChina
Other(eachlessthan$10m) 71 56
Total investments in associates accounted for using the equity method 467 116
1 Thecombinationofthe5%investmentinAIMSAMPCapitalIndustrialREITandthejointcontrolofthemanagercompaniesresultinsignificantinfluencebyAMP.
2 ThevalueofAMP’sinvestmentinAIMSAMPCapitalIndustrialREITbasedonpublishedquotedpricesasatthereportingdateis$44m(2014:$39m).3 Thecombinationofthe15%investedinChinaLifeAMPAssetManagementCompanyLtdandrightsheldunderashareholders’agreementresultin
significantinfluencebyAMP.
For
per
sona
l use
onl
y

AMP 2015 annual report130
Notes to the financial statements for the year ended 31 December 2015
30. Associates continued(b) Investments in significant associates held by the life entities’ statutory funds measured at fair value through profit or loss1,2,3
Ownership interest Carrying amount
Principal activity32015
%2014
%2015
$m2014
$m
AMPAustralianEquityIndexFund5 Investmenttrusts – 50 – 121AMPCapitalDiversifiedPropertyFund Investmenttrusts 25 25 1,058 1,011AMPCapitalDynamicMarketsFund4 Investmenttrusts 24 – 293 –AMPCapitalBalancedGrowthFund Investmenttrusts 35 20 120 53AMPCapitalGlobalPropertySecuritiesFund Investmenttrusts 41 40 670 614AMPCapitalMulti-AssetFund Investmenttrusts 28 37 126 111AMPCapitalNZSharesFund Investmenttrusts 44 40 173 183AMPCapitalRetailTrust(formerlyAMPCapitalPacificFairandMacquarieShoppingCentreFund) Investmenttrusts 26 26 330 291AMPCapitalShoppingCentreFund Investmenttrusts 30 23 538 504AMPCapitalStrategicNZSharesFund Investmenttrusts 42 45 59 65AMPCapitalWholesaleOfficeFund4 Investmenttrusts 23 – 381 –AMPEquityTrust5 Investmenttrusts – 46 – 202AMPShareholderFixedIncomeFund4 Investmenttrusts 26 – 57 –DiversifiedInvestmentStrategyNo25 Investmenttrusts – 23 – 120DiversifiedInvestmentStrategyNo35 Investmenttrusts – 30 – 62EnhancedIndexShareFund Investmenttrusts 48 50 186 199EFMFixedInterestFund104 Investmenttrusts 49 – 50 –FutureDirectionsEmergingMarketsShareFund5 Investmenttrusts – 49 – 56GoveAluminiumFinanceLimited Investmentcompany 30 30 95 96HyperionAustralianGrowthCompaniesFund5 Investmenttrusts – 24 – 111K2AustralianAbsoluteReturnFund Investmenttrusts 26 28 99 109ListedPropertyTrustFund4 Investmenttrusts 29 – 55 –ManAHLAlpha Investmenttrusts – 26 – 53PimcoDiversifiedFixedInterestFund5 Investmenttrusts – 33 – 145ResponsibleInvestmentsLeaderBalancedFund Investmenttrusts 24 26 243 238TempletonGlobalTrustFund5 Investmenttrusts – 26 – 85ValuePlusAustraliaShareFund Investmenttrusts 33 29 62 57WholesaleCashManagementTrust4 Investmenttrusts 49 – 3,391 –AMPShoppingCentreFund Investmenttrusts 30 – 61 –AMPWholesaleOfficeFund Investmenttrusts 23 – 36 –WholesaleUnitTrustAustralasianPropertyShares Investmenttrusts 26 – 38 –
1 Investmentsinassociatedentitiesthatbackinvestmentcontractandlifeinsurancecontractliabilitiesaretreatedasfinancialassetsandaremeasuredatfairvalue.Refertonote1(g).
2 Thereportingdateforallsignificantassociatedentitiesis31December.3 Inthecourseofnormaloperatinginvestmentactivities,thelifestatutoryfundholdsinvestmentsinvariousoperatingbusinesses.Investmentsin
associatedentitiesreflectinvestmentswherethelifestatutoryfundholdsbetweena20%and50%equityinterest.4 Trustbecameanassociatedentityduring2015.5 Trustceasedbeinganassociatedentityduring2015.
For
per
sona
l use
onl
y
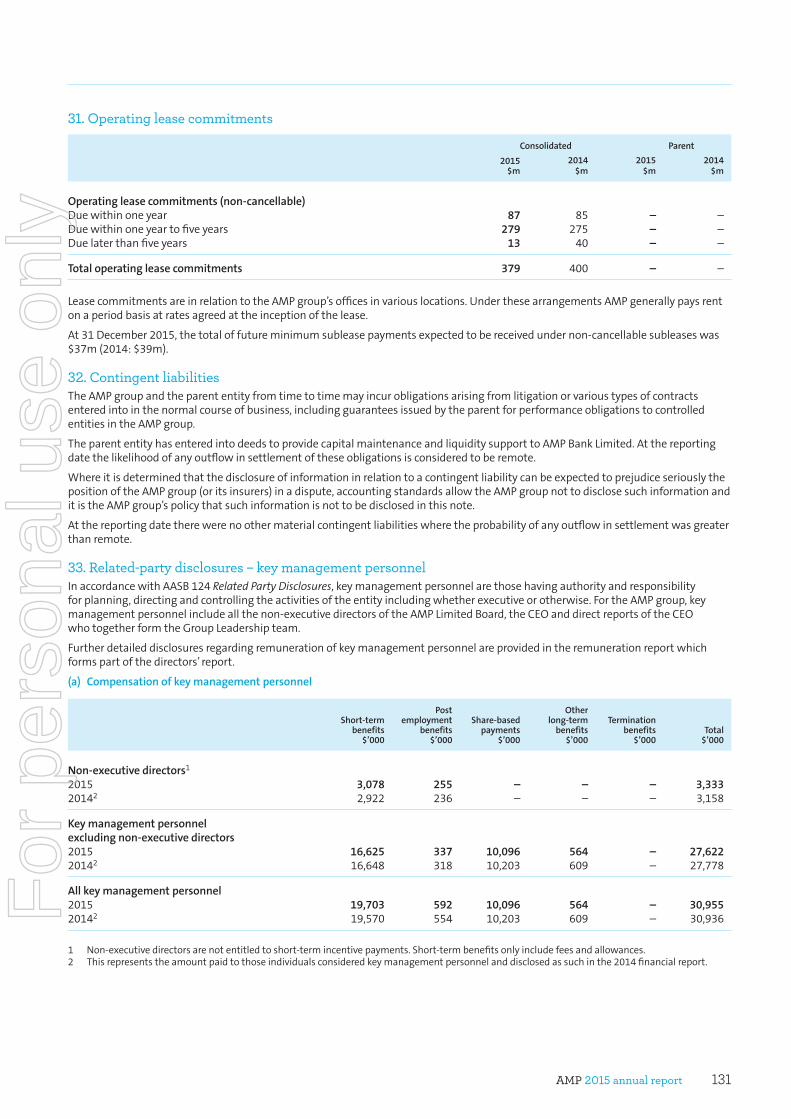
AMP 2015 annual report 131
31. Operating lease commitments
Consolidated Parent
2015$m
2014$m
2015$m
2014$m
Operating lease commitments (non-cancellable) Duewithinoneyear 87 85 – –Duewithinoneyeartofiveyears 279 275 – –Duelaterthanfiveyears 13 40 – –
Total operating lease commitments 379 400 – –
LeasecommitmentsareinrelationtotheAMPgroup’sofficesinvariouslocations.UnderthesearrangementsAMPgenerallypaysrentonaperiodbasisatratesagreedattheinceptionofthelease.
At31December2015,thetotaloffutureminimumsubleasepaymentsexpectedtobereceivedundernon-cancellablesubleaseswas$37m(2014:$39m).
32. Contingent liabilitiesTheAMPgroupandtheparententityfromtimetotimemayincurobligationsarisingfromlitigationorvarioustypesofcontractsenteredintointhenormalcourseofbusiness,includingguaranteesissuedbytheparentforperformanceobligationstocontrolledentitiesintheAMPgroup.
TheparententityhasenteredintodeedstoprovidecapitalmaintenanceandliquiditysupporttoAMPBankLimited.Atthereportingdatethelikelihoodofanyoutflowinsettlementoftheseobligationsisconsideredtoberemote.
WhereitisdeterminedthatthedisclosureofinformationinrelationtoacontingentliabilitycanbeexpectedtoprejudiceseriouslythepositionoftheAMPgroup(oritsinsurers)inadispute,accountingstandardsallowtheAMPgroupnottodisclosesuchinformationanditistheAMPgroup’spolicythatsuchinformationisnottobedisclosedinthisnote.
Atthereportingdatetherewerenoothermaterialcontingentliabilitieswheretheprobabilityofanyoutflowinsettlementwasgreaterthanremote.
33. Related-party disclosures – key management personnelInaccordancewithAASB124Related Party Disclosures,keymanagementpersonnelarethosehavingauthorityandresponsibilityforplanning,directingandcontrollingtheactivitiesoftheentityincludingwhetherexecutiveorotherwise.FortheAMPgroup,keymanagementpersonnelincludeallthenon-executivedirectorsoftheAMPLimitedBoard,theCEOanddirectreportsoftheCEOwhotogetherformtheGroupLeadershipteam.
Furtherdetaileddisclosuresregardingremunerationofkeymanagementpersonnelareprovidedintheremunerationreportwhichformspartofthedirectors’report.
(a) Compensation of key management personnel
Short-term benefits
$’000
Post employment
benefits$’000
Share-based payments
$’000
Other long-term
benefits$’000
Termination benefits
$’000Total
$’000
Non-executive directors1
2015 3,078 255 – – – 3,333 20142 2,922 236 – – – 3,158
Key management personnel excluding non-executive directors 2015 16,625 337 10,096 564 – 27,622 20142 16,648 318 10,203 609 – 27,778
All key management personnel 2015 19,703 592 10,096 564 – 30,95520142 19,570 554 10,203 609 – 30,936
1 Non-executivedirectorsarenotentitledtoshort-termincentivepayments.Short-termbenefitsonlyincludefeesandallowances.2 Thisrepresentstheamountpaidtothoseindividualsconsideredkeymanagementpersonnelanddisclosedassuchinthe2014financialreport.
For
per
sona
l use
onl
y

AMP 2015 annual report132
Notes to the financial statements for the year ended 31 December 2015
33. Related-party disclosures – key management personnel continued(b) Transactions with key management personnelDuringtheyear,keymanagementpersonnelandtheirpersonallyrelatedentitiesmayalsohavehadaccesstothefollowingAMPproducts.Theyareprovidedtokeymanagementpersonnelwithinnormalemployeetermsandconditions.Theproductsinclude:– personalbankingwithAMPBankLimited– thepurchaseofAMPinsuranceandinvestmentproducts– financialinvestmentservices.
Informationaboutsuchtransactionsdoesnothavethepotentialtoaffectadverselydecisionsabouttheallocationofscarceresourcesmadebyusersofthisfinancialreport,orthedischargeofaccountabilitybythespecifiedexecutivesorspecifieddirectors.
ThefollowingtableprovidesdetailsofloansmadetokeymanagementpersonnelandtheirrelatedpartiesbyAMPoranyofitssubsidiaries.
Balance at 1 Jan 15
$’000Written off
$’000
Net advances
(repayments) $’000
Balance at 31 Dec 15
$’000
Interest charged
$’000
Interest not charged
$’000Number in
group
Key management personnel and their related parties1 14,116 – (524) 13,592 534 – 7
1 AllloanstokeymanagementpersonnelandtheirrelatedpartiesareprovidedbyAMPBankandareonsimilartermsandconditionsgenerallyavailabletootheremployeeswithinthegroup.Noguaranteesaregivenorreceivedinrelationtotheseloans.
34. Auditors’ remuneration
Consolidated Parent
2015$’000
2014$’000
2015$’000
2014$’000
Amounts received or due and receivable by auditors of AMP Limited for:
Audit services Auditorreviewoffinancialstatements 10,339 10,559 140 140Otherauditservices1 1,422 2,008 – –
Total audit service fees 11,761 12,567 140 140
Total non-audit services2 3,421 1,386 – –
Total amounts received or due and receivable by auditors of AMP Limited3,4 15,182 13,953 140 140
1 OtherauditservicesincludesfeesforcomplianceauditsandotherauditproceduresperformedforvehiclescontrolledbyAMPlifeinsuranceentities’statutoryfundsandthosemanagedbyAMPCapital.
2 Non-auditservicesincludetaxandcomplianceadvice,generalbusinessandprojectadvice,reviewoflong-termincentivearrangementsandotherproceduresperformedforinvestmentvehiclesownedorcontrolledbyAMPCapitalandAMPLifeinsuranceentities’statutoryfunds.
3 IncludesfeespaidtoEYaffiliatesoverseas.4 Periodically,theAMPgroupgainscontrolofentitieswhoseincumbentauditorisanauditfirmotherthanEY.Inadditiontotheauditfeespaidto
EYforauditingtheAMPgroup,immaterialauditfeesarealsopaidtothesenon-EYauditfirmsinrelationtotheauditofthoseperiodicallycontrolledentities.Thenon-EYauditfirmsarealsoindependentlycontractedtoprovideotherservicestoothercontrolledentitiesoftheAMPgroup,unrelatedtotheirauditwork.
35. Events occurring after reporting dateAsatthedateofthisreport,thedirectorsarenotawareofanymatterorcircumstancethathasarisensincethereportingdatethathassignificantlyaffectedormaysignificantlyaffecttheentity’soperationsinfutureyears;theresultsofthoseoperationsinfutureyears;ortheentity’sstateofaffairsinfutureyearswhichisnotalreadyreflectedinthisreport,otherthanthefollowing:– On18February2016,AMPannouncedafinaldividendonordinarysharesof14.0centspershare.Detailsoftheannounced
dividendanddividendspaidanddeclaredduringtheyeararedisclosedinnote18ofthefinancialreport.For
per
sona
l use
onl
y

AMP 2015 annual report 133
Directors’ declarationfortheyearended31December2015
InaccordancewitharesolutionofthedirectorsofAMPLimited,forthepurposesofsection295(4)oftheCorporations Act 2001,thedirectorsdeclarethat:
(a) intheopinionofthedirectorstherearereasonablegroundstobelievethatAMPLimitedwillbeabletopayitsdebtsasandwhentheybecomedueandpayable
(b) intheopinionofthedirectorsthefinancialstatementsandthenotesofAMPLimitedandtheconsolidatedentityforthefinancialyearended31December2015areinaccordancewiththeCorporations Act 2001,includingsection296(compliancewithaccountingstandards)andsection297(trueandfairview)
(c) thenotestothefinancialstatementsofAMPLimitedandtheconsolidatedentityforthefinancialyearended31December2015includeanexplicitandunreservedstatementofcompliancewiththeInternationalFinancialReportingStandards,assetoutinnote1(a)tothefinancialstatements
(d) thedeclarationsrequiredbysection295AoftheCorporations Act 2001havebeengiventothedirectors.
Simon McKeon Craig MellerChairman ChiefExecutiveOfficerandManagingDirector
Sydney,18February2016
Financial report for the year ended 31 December 2015
For
per
sona
l use
onl
y

AMP 2015 annual report134
Financial report for the year ended 31 December 2015
Tel: +61 2 9248 5555Fax: +61 2 9248 5959ey.com/au
Ernst & Young680 George StreetSydney NSW 2000 AustraliaGPO Box 2646 Sydney NSW 2001
Independent auditor’s report to the members of AMP LimitedReport on the financial reportWehaveauditedtheaccompanyingfinancialreportofAMPLimited,whichcomprisesthestatementsoffinancialpositionasat31December2015,thestatementsofcomprehensiveincome,thestatementsofchangesinequityandthestatementsofcashflowsfortheyearthenended,notescomprisingasummaryofsignificantaccountingpoliciesandotherexplanatoryinformation,andthedirectors’declarationofthecompanyandconsolidatedentitycomprisingthecompanyandtheentitiesitcontrolledattheyear’sendorfromtimetotimeduringthefinancialyear.
Directors’ responsibility for the financial reportThedirectorsofthecompanyareresponsibleforthepreparationofthefinancialreportthatgivesatrueandfairviewinaccordancewithAustralianAccountingStandardsandtheCorporations Act 2001andforsuchinternalcontrolsasthedirectorsdeterminearenecessarytoenablethepreparationofthefinancialreportthatisfreefrommaterialmisstatement,whetherduetofraudorerror.InNote1,thedirectorsalsostate,inaccordancewithAccountingStandardAASB101Presentation of Financial Statements,thatthefinancialstatementscomplywithInternational Financial Reporting Standards.
Auditor’s responsibilityOurresponsibilityistoexpressanopiniononthefinancialreportbasedonouraudit.WeconductedourauditinaccordancewithAustralianAuditingStandards.Thosestandardsrequirethatwecomplywithrelevantethicalrequirementsrelatingtoauditengagementsandplanandperformtheaudittoobtainreasonableassuranceaboutwhetherthefinancialreportisfreefrommaterialmisstatement.
Anauditinvolvesperformingprocedurestoobtainauditevidenceabouttheamountsanddisclosuresinthefinancialreport.Theproceduresselecteddependontheauditor’sjudgment,includingtheassessmentoftherisksofmaterialmisstatementofthefinancialreport,whetherduetofraudorerror.Inmakingthoseriskassessments,theauditorconsidersinternalcontrolsrelevanttotheentity’spreparationandfairpresentationofthefinancialreportinordertodesignauditproceduresthatareappropriateinthecircumstances,butnotforthepurposeofexpressinganopinionontheeffectivenessoftheentity’sinternalcontrols.Anauditalsoincludesevaluatingtheappropriatenessofaccountingpoliciesusedandthereasonablenessofaccountingestimatesmadebythedirectors,aswellasevaluatingtheoverallpresentationofthefinancialreport.
Webelievethattheauditevidencewehaveobtainedissufficientandappropriatetoprovideabasisforourauditopinion.
IndependenceInconductingourauditwehavecompliedwiththeindependencerequirementsoftheCorporations Act 2001.WehavegiventothedirectorsofthecompanyawrittenAuditor’sIndependenceDeclaration,acopyofwhichisincludedinthedirectors’report.
OpinionInouropinion:a. thefinancialreportofAMPLimitedisinaccordancewiththeCorporations Act 2001,including: i givingatrueandfairviewofthecompany’sandconsolidatedentity’sfinancialpositionasat31December2015and
oftheirperformancefortheyearendedonthatdate;and ii complyingwithAustralianAccountingStandardsandtheCorporations Regulations 2001;andb. thefinancialreportalsocomplieswith International Financial Reporting StandardsasdisclosedinNote1.
Report on the remuneration reportWehaveauditedtheRemunerationReportincludedinthedirectors’reportfortheyearended31December2015.ThedirectorsofthecompanyareresponsibleforthepreparationandpresentationoftheRemunerationReportinaccordancewithsection300AoftheCorporations Act 2001.OurresponsibilityistoexpressanopinionontheRemunerationReport,basedonourauditconductedinaccordancewithAustralianAuditingStandards.
OpinionInouropinion,theRemunerationReportofAMPLimitedfortheyearended31December2015,complieswithsection300AoftheCorporations Act 2001.
Ernst & Young Tony JohnsonPartnerSydney, 18 February 2016
A member firm of Ernst & Young Global LimitedLiability limited by a scheme approved under Professional Standards Legislation
For
per
sona
l use
onl
y

AMP 2015 annual report 135
Securityholder information
Securityholder information as at 18 February 2016
Distribution of AMP capital notes holdings
Range Number of holders Notes held % of issued capital
1–1,000 4,232 1,167,266 43.641,001–5,000 231 507,224 18.965,001–10,000 20 140,229 5.2410,001–100,000 21 594,487 22.22100,001andover 2 265,794 9.94
Total 4,506 2,675,000 100.00
Twenty largest AMP capital notes holdings
Rank Name Notes held % of issued capital
1 UBSWealthManagementAustraliaNomineesPtyLtd 152,239 5.692 CiticorpNomineesPtyLimited 113,555 4.253 NationalNomineesLimited 63,920 2.394 NavigatorAustraliaLtd<MLCInvestmentSettA/C> 61,421 2.305 JPMorganNomineesAustraliaLimited 53,775 2.016 NetwealthInvestmentsLimited<WrapServicesA/C> 50,622 1.897 DimbuluPtyLtd 50,000 1.878 BNPParibasNomsPtyLtd<DRP> 42,333 1.589 HSBCCustodyNominees(Australia)Limited 41,974 1.5710 FilburyPtyLtd<PiekarskiGrandchildInvA/C> 25,800 0.9611 HSBCCustodyNominees(Australia)Limited 21,419 0.8012 NulisNominees(Australia)Limited<NavigatorMastPlanSettA/C> 21,340 0.8013 TheAustralianNationalUniversity 20,000 0.7514 NetwealthInvestmentsLimited<SuperServicesA/C> 19,572 0.7315 SandhurstTrusteesLtd<DMPAssetManagementA/C> 18,612 0.7016 QuestorFinancialServicesLimited 18,276 0.6817 MsSinhaiHou 15,000 0.5618 TGBHoldingsPtyLtd 14,100 0.5319 LarkinsBusinessManagementPtyLtd 12,338 0.4620 AvanteosInvestmentsLimited<1703553JohnsonA/C> 11,500 0.43
Total 827,796 30.95
Distribution of AMP wholesale capital notes holdings
Range Number of holders Notes held % of issued capital
1–1,000 10 2,690 9.781,001–5,000 5 17,809 64.765,001–10,000 1 7,001 25.46
Total 16 27,500 100.00
AMP notes voting rightsAMPwholesalecapitalnotesandAMPcapitalnotesconfernorighttoattendorvoteatanygeneralmeetingoftheshareholdersofAMPLimited.Ifaholder’snotesconvertintoAMPsharesinaccordancewiththetermsofthenotes,thoseshareswillhavethevotingrightsdescribedonpage136.
For
per
sona
l use
onl
y

AMP 2015 annual report136
Securityholder information as at 18 February 2016
Distribution of AMP Limited shareholdings
Range Number of holders Ordinary shares held % of issued capital
1–1,000 554,956 243,929,830 8.251,001–5,000 217,518 445,305,387 15.065,001–10,000 22,874 161,811,807 5.4710,001–100,000 12,081 250,172,898 8.46100,001andover 330 1,856,518,042 62.76
Total 807,759 2,957,737,964 100.00
Thetotalnumberofshareholdersholdinglessthanamarketableparcelof93sharesis10,377.
Twenty largest AMP Limited shareholdings
Rank Name Ordinary shares held % of issued capital
1 HSBCCustodyNominees(Australia)Limited 691,811,873 23.392 JPMorganNomineesAustraliaLimited 405,346,970 13.703 NationalNomineesLimited 257,106,114 8.694 CiticorpNomineesPtyLimited 147,252,936 4.985 BNPParibasNomsPtyLtd<DRP> 66,734,199 2.266 CiticorpNomineesPtyLimited<ColonialFirstStateInvA/C> 41,528,041 1.407 AustralianFoundationInvestmentCompanyLimited 20,100,422 0.688 HSBCCustodyNominees(Australia)Limited<NT-ComnwlthSuperCorpA/C> 16,273,215 0.559 AMPLifeLimited 14,329,516 0.4810 NationalNomineesLimited<NA/C> 14,000,001 0.4711 ArgoInvestmentsLimited 12,381,674 0.4212 BNPParibasNomsPtyLtd<AgencyLendingDRPA/C> 10,808,353 0.3713 RBCInvestorServicesAustraliaNomineesPtyLimited<BKCUSTA/C> 7,633,610 0.2614 NavigatorAustraliaLtd<MLCInvestmentSettA/C> 6,413,264 0.2215 SBNNomineesLimited<10004Account> 5,644,868 0.1916 UBSWealthManagementAustraliaNomineesPtyLtd 5,279,943 0.1817 RBCInvestorServicesAustraliaNomineesPtyLimited<MBAA/C> 3,999,066 0.1418 NulisNominees(Australia)Limited 3,924,291 0.1319 HSBCCustodyNominees(Australia)Limited 3,902,918 0.1320 UBSNomineesLimited 3,515,000 0.12
Total 1,737,986,274 58.76
Substantial shareholdersThecompanyhasnosubstantialshareholders.
AMP Limited shares voting rightsThevotingrightsattachedtothesharesarethateachregisteredholderofsharespresentinperson(orbyproxy,attorneyorrepresentative)atameetingofshareholdershasonevoteonavotetakenbyashowofhands,andonevoteforeachfullypaidshareheldonavotetakenatapoll.
Total number of options over unissued shares and option holdersAMPLimitedhasnooptionsonissueoverunissuedordinarysharesinAMPLimited.
On market acquisitions for employee incentive schemes during the financial year ended 31 December 20155,257,980AMPLimitedordinaryshareswerepurchasedonmarkettosatisfyentitlementsunderAMP’semployeeincentiveschemesatanaveragepricepershareof$6.38.
Stock exchange listingsAMPLimited’sordinarysharesarequotedontheAustralianSecuritiesExchangeandtheNewZealandStockExchange.AMPsubordinatednotes2andAMPcapitalnotesarequotedontheAustralianSecuritiesExchange.
Restricted securitiesTherearenorestrictedsecuritiesonissue.
BuybackThereisnocurrentonmarketbuyback.
For
per
sona
l use
onl
y

Glossary
Contingent liabilitiesAsituationexistingatreportingdate,wherepasteventshaveledtoapossibleobligation,theoutcomeofwhichdependsonuncertainfutureevents,oranobligationwheretheoutcomeisnotsufficientlyprobableorreliablymeasurabletowarrantrecognisingtheliabilityatthisreportingdate.
Controllable costsCoststhatAMPincursinrunningitsbusiness.Controllablecostsincludeoperationalandprojectcostsandexcludevariablecosts,provisionforbadanddoubtfuldebtsandinterestoncorporatedebt.
Earnings per share (EPS)Eachearningspershare(EPS)calculationrepresentstheprofitamountdividedbytheweightedaveragenumberofsharesonissueduringtheyear.
Embedded valueAcalculationoftheeconomicvalueoftheshareholdercapitalinthebusinessesotherthanAMPBank,andthefutureshareholderprofitsexpectedtoemergefromthebusinesscurrentlyin-force(expressedintoday’sdollars).
ExecutivesWithinthisreport,thetermexecutivesreferstothechiefexecutiveofficerandnominateddirectreportsoftheCEOwhoareKMP.
Franking rateTheamountoftaxAMPhasalreadypaidonadividendpayment.ThiscanbeusedasataxcreditbyAustralianresidentshareholders.ThefrankingrateisdeterminedbyAMP’staxableincome.AMP’spolicyistoalwaysfrankdividendsatthehighestpossiblerate.
Investment performanceAmeasureofhowwellwemanagefundsonbehalfofourcustomers.ThepercentageofassetsmanagedbyAMPwhichmetorexceededtheirrespectiveclientgoals.
Key management personnel (KMP)Thechiefexecutiveofficer(CEO),nominateddirectreportsoftheCEOandthenon-executivedirectors,whohaveauthorityandresponsibilityforplanning,directingandcontrollingtheactivitiesofAMP.
Long-term incentive (LTI)AnexecutiverewardforhelpingAMPachievespecificlong-termperformancetargets.Itisawardedintheformofsharerightsand/orperformancerightstomotivateexecutivestocreateoutstandinglong-termvalueforshareholders.ArightisanentitlementtoreceiveoneAMPlimitedshareperrightsubjecttomeetingthevestingconditions.
Non-executive directors (NEDs)BoarddirectorswhoarenotemployeesofAMP(theyareindependent).
Operating earningsTotaloperatingearningsaretheshareholderprofitsthatrelatetotheperformanceofAMP.Operatingearningsexcludeinvestmentearningsonshareholdercapitalandone-offitems.
Performance rightAformofexecutiveremunerationdesignedtorewardlong-termperformance.Selectedexecutivesaregrantedperformancerights.EachperformancerightisarighttoacquireoneAMPshareafterathreeyearperformanceperiod,ifspecificperformancehurdleismet.
Return on equity (RoE)Returnonequity(RoE)isameasureusedintheAMPlong-termincentiveplan.ItisapercentagethatshowshoweffectiveAMPhasbeeningrowingthevalueofthemoneyinvestedbyourshareholders.ThepercentageisdeterminedbydividingAMP’sunderlyingprofitbyaveragebookvalueofAMPshareholderequity.
Share rightAsharerightisanentitlementtoacquireoneAMPshareattheendofavestingperiodegtwoyears,aslongastheserviceconditionsaremet.
Short-term incentive (STI)AnexecutiverewardforhelpingAMPachievespecificshort-termperformancetargetsandobjectives.Itispaidintheformofcashandsharerightstomotivateexecutivestoachieveoutstandingperformanceduringtheyear.
STI poolThemoneyusedforthepaymentofSTIrewards.ThepoolsizevarieseachyeardependingonAMP’sfinancialandnon-financialperformanceagainsttheSTIscorecard.
Total shareholder return (TSR)Ameasureofthevaluereturnedtoshareholdersoveraperiodoftime.IttakesintoaccountthechangesinmarketvalueofAMPsharesplusthevalueofanydividendspaidandcapitalreturnsontheshares.
Underlying investment incomeUnderlyinginvestmentincomeisbasedonlong-termexpectedratesofreturn.Actualinvestmentincomecanbehigherorlowerthanthelong-termratefromyeartoyear.
Underlying profitAMP’skeymeasureofbusinessprofitability,asitsmoothsinvestmentmarketvolatilitystemmingfromshareholderassetsinvestedininvestmentmarketsandaimstoreflectthetrendsintheunderlyingbusinessperformanceoftheAMPgroup.Thecomponentsofunderlyingprofitarelistedonpage45.
VestingRemunerationtermdefiningthepointatwhichtherequiredperformancehurdlesand/orservicerequirementshavebeenmet,andafinancialbenefitmayberealisedbytherecipient.
AMPiscommittedtoactivelyreducingitsimpactontheenvironmentandhasprintedthisdocumentonpaperderivedfromcertifiedwellmanagedforestsandmanufacturedbyanISO14001certifiedmill.ThedocumenthasalsobeenprintedatanFSC®certifiedprinter.
For
per
sona
l use
onl
y

NS1
247
03/1
6
Registered office of AMP Limited 33 Alfred StreetSydney NSW 2000AustraliaT +612 9257 5000F +612 9257 7178W amp.com.auCompany Secretary: David Cullen
AMP investor relations Level 22, 33 Alfred StreetSydney NSW 2000AustraliaT +612 9257 9009F +612 8843 8255E [email protected] amp.com.au/sharesHead of shareholder services: Marnie Reid
AMP products and policies AustraliaT 131 267E [email protected]
New ZealandT 0800 808 267E [email protected]
InternationalT +612 8048 8162
Australia AMP share registryReply Paid 2980Melbourne VIC 8060T 1300 654 442F 1300 301 721
New ZealandAMP share registryPO Box 91543Victoria Street WestAuckland 1142T 0800 448 062F 09 488 8787
Other countries AMP share registryGPO Box 2980Melbourne VIC 3001AustraliaT +613 9415 4051F +612 8234 5002
AMP share registry
facebook.com/AMPaustralia @AMP_AU
Contact us
AMP is incorporated and domiciled in Australia
For
per
sona
l use
onl
y