For personal use only - ASX2015/08/25 · As a Group, we continue to have excellent capabilities...
80
For personal use only
Transcript of For personal use only - ASX2015/08/25 · As a Group, we continue to have excellent capabilities...

For
per
sona
l use
onl
y

Front cover from left to right
01 Karen Fisher BMF-Sydney
02 Juliette Keyte Hotwire-London
03 Edmund Iffland Jigsaw-Sydney
04 Mick Thorp Precinct-Sydney
05 Katie Mitchell TLE-London
06 Mick Thorp Precinct-Sydney
07 Will Woods BMF-Sydney
08 Audra Diciunas BMF-Sydney
09 Matthew Melhuish Enero-Sydney
10 Hannah Joyce Hotwire-London
11 Keane Hughes Naked-Sydney
12 Mick Thorp Precinct-Sydney
13 Cyrus Vantoch-Wood Naked-London
14 Cassandra Hannagan BMF-Sydney
15 Graeme Anthony Frank PR-Manchester
16 Matt Cross Hotwire-London
17 Hotwire Team Hotwire-Paris
18 Sarah Scott-Paul Enero-Sydney
19 Will Woods BMF-Sydney
20 Juliette Keyte Hotwire-London
21 Matthew Melhuish Enero-Sydney
22 Will Woods BMF-Sydney
23 Mick Thorp Precinct-Sydney
24 Brynn Fulcher-Meredith Precinct-Sydney
25 Mick Thorp Precinct-Sydney
26 Hotwire Team Hotwire-Paris
27 Jon Wray BMF-Sydney
28 Pascale Nicolet OB Media-Houston
29 Tim Kirby Naked-Sydney
30 Helen Adams Naked-Sydney
31 Phillip Ball Naked-Sydney
32 Daniel O’Sheedy Enero-Sydney
33 Andrew Bryson Naked-New York
34 Will Woods BMF-Sydney
35 Laura Such Frank PR-London
36 Rob Tolan Frank PR-Sydney
We asked our staff across the 15 cities we have offices in, to capture
their team, office, community or city for our annual report in a candid
and fun way. All shots were taken on smartphones.
Back cover from left to right
37 Mick Thorp Precinct-Sydney
38 Cassandra Hannagan BMF-Sydney
39 Hugh Munro BMF-Sydney
40 James Paulik BMF-Sydney
41 Natalie Hellon Naked-Sydney
42 Harry Neville-Towie BMF-Sydney
43 Craig Adams Naked-Sydney
44 Cassandra Hannagan BMF-Sydney
45 Natalie Hellon Naked-Sydney
46 Sam Gilliand Naked-New York
47 Gavin Johns BMF-Sydney
48 Cyrus Vantoch-Wood Naked-London
49 Mick Thorp Precinct-Sydney
50 Thomas Bridges OB Media-Houston
51 Matthew Melhuish Enero-Sydney
52 Georgie & Jason Naked-London
53 James Curtis Frank PR-Sydney
54 Robert Leighton BMF-Sydney
55 Cyrus Vantoch-Wood Naked-London
56 James Paulik BMF-Sydney
57 Gavin Johns BMF-Sydney
58 Jennifer Rhodes BMF-Sydney
59 Keane Hughes Naked-Sydney
60 Hotwire Team Hotwire-Paris
61 Brynn Fulcher-Meredith Precinct-Sydney
62 Mick Thorp Precinct-Sydney
63 Matthew Melhuish Enero-Sydney
64 Gavin Johns BMF-Sydney
65 Georgie & Jason Naked-London
66 Sarah Scott-Paul Enero-Sydney
67 Laura Such Frank PR-London
68 Brigitte Dagg Naked-Sydney
69 James Curtis Frank PR-Sydney
70 Juliette Keyte Hotwire-London
71 Brigitte Dagg Naked-Sydney
72 Mona Moubayed Precinct-Sydney
CONTRIBUTORS
For
per
sona
l use
onl
y

01
The Enero Group is a boutique network of marketing and communications businesses providing outstanding work for clients across the full range of marketing and communications services. Our businesses operate primarily out of three key hubs in Sydney, London and New York and from many places in between.
Contents
02 Chairman’s report
04 CEO’s report
08 Enero’s Businesses
18 Corporate Governance Statement
25 Directors’ Report (including the Remuneration Report)
37 Consolidated income statement
38 Consolidated statement of comprehensive income 39 of changes in equity
40 Consolidated statement of financial position
41 Consolidated statement of cash flows
42 Notes to the consolidated financial statements
72 Directors’ Declaration
73 Independent Auditor’s Report
75 Lead Auditor’s independence declaration
76 ASX additional information
IBC Corporate Directory
For
per
sona
l use
onl
y

Our 11 businesses, in eight countries and 15 cities, have over 550 staff worldwide. Our exposure to international markets, particularly the UK, Europe and the USA gives us leverage to seek out larger-scale revenue opportunities and tap some of the best talent pools in the world.
John Porter Independent Non-Executive Chairman
CHAIRMAN’S REPORT
02 Enero Group Limited Annual Report 2015
For
per
sona
l use
onl
y

Dear Shareholders,
I am pleased to report that the Group continues to make progress towards its strategic goals. This completed year demonstrates further evidence that the Group has a level of reliability to shareholders by delivering a satisfying increase in Operating EBITDA and margin.
As a Group, we continue to have excellent capabilities across public relations, research and insight, strategy, creative ideation, data and production. Our 11 businesses, in eight countries and 15 cities, have over 550 staff worldwide. Our exposure to international markets, particularly the UK, Europe and the USA gives us leverage to seek out larger-scale revenue opportunities and tap some of the best talent pools in the world.
The Group reported a 2% increase in Operating EBITDA to $9.2 million this financial year, notwithstanding an 8% reduction in net revenue. While the reduction in revenue is disappointing, management are working hard to stabilise the baseline revenue and develop a stronger new business pipeline in each of the business units. The marketing services industry continues to deal with a high level of change, through digital and data, changing consumer behaviour and the ongoing convergence of technology and marketing service businesses.
We will continue to carefully assess growth opportunities both via investments in people ahead of the revenue curve or possible bolt-on acquisitions; however we are focused on ensuring the structure of the Group maintains its simplicity.
While the Enero share price has declined since the last time I reported to shareholders, the Board believes the business has the same level, if not more, of capability, momentum and drive as it did a year ago. This group of businesses remains a strong portfolio of assets.
We have expanded our Board this year. I would like to welcome Russel Howcroft as our new Non-Executive Director who joined the Board in May 2015. Russel brings a wealth of networks and experience in the industry and brings a valuable set of skills to our Board to help drive forward our strategic goals.
Thank you my fellow Board members for your continued input and counsel to the Group throughout this last year.
On behalf of the Board, I would like to thank the Executive team and all the employees of Enero’s Group businesses for all your efforts throughout the year.
Finally, thank you to our shareholders for your continued support and belief in our long-term vision for the Group.
John Porter Independent Non-Executive Chairman
03
For
per
sona
l use
onl
y

Being a small, high-quality boutique Group with an international footprint continues to be a decisive advantage in the competitive sector in which we operate. The high quality of our team means we can win tasks and deliver work that exceeds client expectations.
Matthew Melhuish CEO and Executive Director
CHIEF EXECUTIVE OFFICER’S REPORT
04 Enero Group Limited Annual Report 2015
For
per
sona
l use
onl
y

Dear Shareholders,
I am pleased to report on the progress the Group has made in the recently completed financial year. We are now squarely in the “Reliable” phase of our strategic journey and while we didn’t achieve revenue growth to complement our improved operating EBITDA and margin performance, we are satisfied that all efforts made to date are providing a very strong ongoing platform for the Group. Shareholders can be pleased to know that the Group is in much better overall shape with more settled, aligned and considered approaches being taken across all facets of the business. This is, in no small part, due to the longstanding efforts to increase capability and reduce complexity, confusion and “noise in the system”.
Being a small, high-quality boutique Group with an international footprint continues to be a decisive advantage in the competitive sector in which we operate. The high quality of our team means we can win tasks and deliver work that exceeds client expectations. While our nimble boutique approach means we can serve clients wherever they need us to be – often without requiring significant overhead to be active in a given market.
It cannot be forgotten that this is a people-based business and while that brings with it certain challenges, our people are excellent at what they do, they are passionate about their work and are driven to win. Every day our teams are focused on finding the right solution or idea to drive excellent results for their clients’ brands and businesses.
Financial Performance
We are pleased to report that year-on-year operating EBITDA is up 2% to $9.2 million, notwithstanding an 8% decline in year-on-year net revenue to $110.3 million. The Group has been particularly conscious of managing the cost base over the period of revenue decline and the resultant outcome was an improved margin of 8.3% in FY15, up from 7.5% in FY14. There is still room to improve the overall margin further as the Group was impacted during the year by some specific underperforming business units. The staff cost ratio, while trending down over the course of the year, was 72%, which is higher than the benchmark rate set by the Group. Reducing this ratio to the target ratio of 65% remains an ongoing priority.
In the 2015 financial year completed, international markets delivered 60% of the Group’s operating EBITDA (FY14: 66%) and this is in line with our plans. The last two years have seen a steady shift towards the international markets becoming more significant to Group revenue and operating EBITDA contribution. As a boutique global Company the enhanced role played by offshore businesses puts us in a stronger position to leverage larger revenue opportunities in the UK, Europe and USA markets where most significant marketers are headquartered. The weaker Australian dollar, particularly in the later part of the financial year, helped to drive increased reported results. The combined UK and European geography had a strong year with an 8.8% increase in Operating EBITDA year-on-year. There is a confidence in the economic outlook at the moment, particularly around the UK.
The Australian operations of the Group experienced a 16.1% increase in Operating EBITDA despite the difficult trading conditions which saw revenue decline by 11.4%. This increase in Operating EBITDA is a result of more settled leadership in the various Australian operating units.
Our presence in the USA continues to require scale to deliver incremental revenue and Operating EBITDA growth. With only $12.5 million in Net Revenue and $1.1 million in Operating EBITDA achieved in FY15, we will aggressively increase our focus on this market in the upcoming financial year. Our ultimate goal is to achieve a more even spread geographically between our three key hubs.
Our Strategic Journey
05
REMEDIAL
RELIABLE
RE-IMAGINEDFor
per
sona
l use
onl
y
Operational Focus
We have continued our drive towards maximising the space available in our Group properties with January 2015 seeing the completion of our first UK hub office, housing Hotwire, Naked Communications and The Leading Edge. Hub offices in Australia and the USA have significantly increased the opportunities for collaboration between business units. Despite our small size, we have been very effective in servicing global clients in their respective markets through travel and increased use of technology. This has proven to be a more cost-effective way to provide the on-the-ground presence one would expect of a global marketing services business without the capital risk associated with opening a local office in every location where we have a revenue opportunity. For example The Leading Edge conducted work in 20 countries over the last year, operating from just its Sydney and London offices.
Shared services across finance, legal, information technology, human resources, learning and development and recruitment are now well established across our three key markets.
Our consistency in remuneration structures including incentive schemes is encouraging a more effective “owner operator” approach among key leaders running each business unit, with greater accountability to performance metrics.
Business Performance
Our businesses continue to be at the forefront of clients’ marketing needs and are more relevant than ever in our industry. We are a diverse Group with over 750 client relationships across our 11 businesses and exposure to many sectors including retailing, FMCG, media, telecommunications and health care. The largest client in the Group represents only 11% of total Group net revenue.
Hotwire was named the “World’s leading Tech PR agency” in late 2014 by the Holmes Report. The business is extending its global reach and is increasing its presence in the USA market with the relocation of the Global Hotwire CEO to New York along with senior hires in San Francisco.
Frank PR continues to maintain a leading position in the UK consumer PR space with a network of regional office openings including Manchester and Glasgow.
The public relations service represents a sizeable proportion of the Group’s revenue and Operating EBITDA and both Frank PR and Hotwire are world-class businesses with proven track records of consistency, good margins and experienced leadership. The public relations sector is also less susceptible to changes in the economic outlook.
Our Australian-based research and insights businesses The Leading Edge, The Digital Edge and Jigsaw Strategic Research all completed improved years and are benefitting from the focus on converting new business opportunities with new clients as well as unlocking valuable insights on consumer behaviour.
BMF continues to lead in creative reputation here in Australia, being ranked second in the most recent Campaign Brief rankings, and is well placed to lift new business conversion in the upcoming year.
Naked Communications has had a better year despite some leadership changes in both the Australian and USA markets in the second half of the year which required re-booting the respective offices. The UK office benefited greatly from the pan-European social media eBay win during the year, and the combining of the UK and USA leadership teams will deliver a more consistent approach across the two markets.
Our Australian communications businesses Precinct Group and CPR had good years and are set up well to deliver growth.
OBMedia, based in the USA, consolidated its position as a powerful online ad network and is benefitting from the increased push globally to online ad spend.
06 Enero Group Limited Annual Report 2015
CHIEF EXECUTIVE OFFICER’S REPORTCONTINUED
For
per
sona
l use
onl
y

Our People
We have invested a great deal in our hiring this year, increasing our relative bench strength. With new business conversion being a key priority for the upcoming year, we hired to bolster this capability. Our Enero New Business Director is predominantly Australian focused in her efforts at the moment; however is adding value across all operating business units, and we are seeing the desired results.
What is most pleasing is the number of internal promotions we have made during the year. A number of senior leaders in our operating business units stepped up to take on greater responsibility including Managing Director roles. This leap is only possible with a strong support team from within the business and from the Enero support office. Leadership and development of all our staff will remain a key priority for the next year.
Thank you
Thank you to the Board for its continued support of our strategic goals. Our strategic decisions made over the past two years with Board support are beginning to pay off.
I am very proud of all the staff achievements over the course of the year. The professionalism shown in delivering solutions for our clients confirms that we have very talented staff across the broad areas of creative, strategy and technology.
Outlook
As we seek to maintain reliable results for our shareholders, we can now look to invest back into our operating businesses, focusing on two key areas in the upcoming financial year:
• Building our profile and scale in the USA; and
• Improving our new business conversion across all of the businesses.
Based on our efforts in the second half of FY15 in deploying senior, high quality resources to the USA market in both of our New York-based businesses, we feel confident we have the right people for the job.
Our new business drive will be more targeted than ever before. All businesses now have the right tracking tools to outreach, network and follow through with prospective clients.
We will strive for further increases in our operating EBITDA margin by ensuring new business wins lead to incremental operating EBITDA and that our cost base is managed appropriately.
As always, we will continue to foster the collaborative spirit, leaning forward towards technology and always seeking to deliver outstanding work for our clients. This should lead to long-term success and drive value for shareholders.
Matthew Melhuish CEO and Executive Director
07
For
per
sona
l use
onl
y

08 Enero Group Limited Annual Report 2015
ENERO’S BUSINESSESWe operate primarily from three key hubs – Sydney, London and New York – and have offices or affiliates in Auckland, Brazil, Melbourne, Milan, Munich, Paris, San Francisco, Tokyo and other key markets in which we have client relationships.
HOTWIRE NAMED “BEST TECHNOLOGY AGENCY WORLDWIDE” BY GLOBAL PR INDUSTRY AUTHORITY, THE HOLMES REPORT.
It’s a cluttered market out there, and everyone wants to be a game-changer. Hotwire helps ambitious technology and innovation companies build their reputations, stand out from the crowd and yes, change the game.
The communications agency for the digital age since 2000, Hotwire is an integrated communications agency with a global footprint and deep technology background. We continue to build our worldwide presence through our Global Partner Network, extending the reach of the business into Latin America, South East Asia, Central and Eastern Europe and Southern Africa – complementing our already ten (and growing) highly networked offices.
Our Group CEO relocated to New York from London to address high-growth market opportunities in the US and Australia; consequently, the new role of Group MD for Europe was created for our traditional markets.
We wanted to build capabilities outside of traditional PR, so this year saw our Hotwire Labs really come into their own. These PR “swat teams”, headquartered in London but supported by an international delivery team, deliver highly effective insights and analytics, design, messaging, digital build and above-the-line campaigns to clients looking to make a big impact in a short space of time.
www.hotwirepr.com
For
per
sona
l use
onl
y

09
In the last financial year, The Digital Edge conducted around one million interviews. That’s a lot of research. But it’s what we do best.
Market research is constantly evolving but The Digital Edge sits happily at the forefront of these changes.
Our digital-native programmers and developers set new standards in online research and data delivery. We help clients engage with consumers more deeply, through the use of new technology. We design and build surveys, cross-tabulations, database applications, dashboards, online communities, mobile app and mobile browser solutions and other customised digital solutions.
We’re proud that our high-end, complex surveys give researchers the data they need quickly and accurately. And we’re always looking to the future.
So what does our immediate future hold? The Digital Edge will continue to develop our suite of digital tools, in order to gain deeper understanding of consumers. Technology, used cleverly – that’s what gives us our edge.
ONE OF AUSTRALIA’S
MOST RESPECTED
ONLINE RESEARCH
AND DATA DELIVERY
COMPANIES.
www.thedigitaledge.com.au
For
per
sona
l use
onl
y

A lot of agencies like to talk about ideas: big ideas, proactive ideas, small ideas. BMF is, and always has been, the home of the “long idea”. Our long ideas are the sum of small and big and everything in between. Long ideas – the kind that build fulfilling experiences, that transcend the duration of a campaign – are designed to build lasting brand equity and lasting goodwill.
We’re proud that many of our clients have been with us for more than ten years, which is unusual in the advertising landscape. These long-term relationships help us to truly “get” our clients’ businesses, which leads in turn to greater insight and inspired creative work. ALDI is a good example. They’ve been a client for over 13 years, and we have helped them become Australia’s fasting-growing retailer.
Long ideas also win awards. This year, BMF won a phalanx of prestigious awards: 72 in fact. Cannes Lions, One Shows, London International, Adfest, Clios, AWARD… we were shortlisted or awarded in all of them. Our Sydney-based agency really shone internationally, and we couldn’t be more proud.
This year we picked up some terrific new clients, including Sportsbet, Dulux (incorporating British Paints, Hortico and Yates) and James Squire. Current clients P&O, Weight Watchers and Lion’s 5 Seeds also awarded us projects with further scope, after successful pitches. So there’s plenty of opportunity for even more great work – and more long ideas.
We’re looking forward to rolling our new vision out to market next year, and to regular and significant new business wins. Watch this space.
B&T’S AGENCY OF THE DECADE IN 2010. RECENTLY RANKED #2 ON CAMPAIGN BRIEF’S CREATIVE RANKINGS AND #4 IN ADNEWS AGENCY OF THE YEAR RANKINGS.
10 Enero Group Limited Annual Report 2015
For
per
sona
l use
onl
y

11
www.bmf.com.au
Doing business, digitally: We’ve always believed that the online space is a great place for consumers and sellers to meet and transact.
We lead the industry in online advertising with one of the most established and effective Cost Per Click ad networks. Through real-time bidding, our programmatic marketing platform delivers highly targeted advertising campaigns, straight to the consumer. The past financial year saw us place 167 billion ads (yes, billion!)
Via email, display and newsletters we help publishers to reach their potential customers by buying relevant and cost-effective traffic.
We’ve got great people. We’re a talented and passionate team; our analysts and developers work closely with our account managers to optimise and monetise online traffic.
OB Media has had an impressive year, bringing on a number of new publishers and relentlessly building our profile.
It’s a great time to be in this emerging industry, and we’re looking forward to another stellar year.
www.obmedia.com
MONETISING THE WORLD’S
DIGITAL AUDIENCE
For
per
sona
l use
onl
y

12 Enero Group Limited Annual Report 2015
A CLEAR AND PROMINENT VOICE IN THE BRAND AND RESEARCH LANDSCAPE.
Jigsaw delivers transformational insights that help clients identify and convert business opportunities.
We search deeply – and differently – to find catalytic insights that have the power to change. We tell clients human stories that can open up exciting commercial and creative opportunities.
Positioned between the global agencies and the local boutiques, we’re proud of our long-term relationships and our continuing role as thought leaders in the industry.
Major wins this year have included the retention of business for all of Nestlé Australia’s early concept screening, appointment as global supplier for all of Pernod Ricard Wine’s concept screening, the National Australia Bank’s customer value proposition tracking and the acquisition of Estée Lauder as a client for both qualitative research and brand tracking.
Next financial year will be a period of building and development for Jigsaw. With a fresh new team and a sharpened proposition, we aim to put ourselves at the front of research buyers’ minds with a co-ordinated thought leadership and new business campaign.
Traditionally strong in FMCG, we plan to diversify further into technology and service industries.
www.jigsawresearch.com
For
per
sona
l use
onl
y

13
CHALLENGING CONVENTION. ALWAYS.
With a name like Naked, we’re certainly not shy. We’ve been challenging convention since 2000.
Led by strategic creativity, we describe ourselves as: data informed, radically objective, media agnostic, creatively passionate.
What this translates to is great work. Work that wins awards like the Cannes Chimera for innovation, for the second year in a row.
It’s not good enough any more to just have bright ideas, even brilliant ideas. They have to be effective ideas; to be so impactful, so pervasive, that they actually change people’s behaviour. We’re deeply proud of the work we produce.
We’re OK on the number-crunching stuff, too. This year we re-aligned cost base, stabilised revenue and built profitability, adding a swag of new clients like Carr’s Crackers, eBay, Taubmans, Red Rooster, Patties Foods, SBS and Microsoft.
Growth like this inspires us and pushes us to try and top our best efforts. In the next financial year we’ll continue our momentum, completing our transition from being “thinkers” to “makers”.
www.nakedcomms.com
For
per
sona
l use
onl
y

14 Enero Group Limited Annual Report 2015
PROVIDING CLARITY IN AN INCREASINGLY COMPLEX MARKETING ARENA.
At The Leading Edge, we’re known for working together in a way that engages, challenges, surprises and inspires. We’ve grown to be one of the world’s leading boutique global research agencies, working with some incredible blue-chip companies in over 20 countries.
We navigate complexity to create value. Typically our work covers five key areas: Marketing definition, brand strategy, innovation, shopper marketing and communication strategy. We’re pliable and reactive, and able to respond to the trickiest challenges. That’s what gives us our “edge”.
This year TLE was proud to be the Platinum sponsor of the 2015 AMSRS conference. We completed major strategic projects for McDonald’s, AB Inbev and Westpac, with impressive feedback and results.
The Leading Edge’s core values are Truth, Generosity of Spirit, Provocative Thinking and Persistence. They’re working for us, and they’re working for our clients.
www.theleadingedge.com
For
per
sona
l use
onl
y

One of the top five UK consumer PR agencies for over a decade.Frank: as our name suggests, we tell it like it is. And sometimes, how it should be. We’ve re-defined PR from public relations to “public reactions”. At Frank, our goal is always to generate buzz, or “Talkability” for the fantastic brands, products and services we represent.
Frank PR has conjured up some of the most innovative campaigns and stunts in the industry, focusing increasingly on digital and social channels.
An example? This year, Volkswagen tasked us with re-launching their iconic California campervan. We created a unique “getaway” concept that allowed consumers to book an overnight stay in the Hotel VW California, a pop-up hotel where people could experience the vehicle hands-on in some pretty out-there UK locations - starting with a private island in Henley-on-Thames! This campaign delivered immediate campervan sales on the day and 25% sales uplift for the year, and has reaped us several industry awards.
Next year, we’ll expand our range of services to include corporate reputation management; crisis and issues management; more digital consultancy; and to increase our SEO-PR offering. Our regional offices Manc Frank (Manchester) and McFrank (Glasgow, Scotland) should continue to grow.
Creating Talkability just happens to be a whole lot of fun. We can’t wait to see what we’ll dream up next.
www.frankpr.it
For
per
sona
l use
onl
y

16 Enero Group Limited Annual Report 2015
TAKING THE BORING
OUT OF BUSINESS
COMMUNICATIONS.
Precinct is the audience engagement specialist.
We embrace our clients’ B2B communications ambitions
and work tirelessly to make them a reality. What we are is
business-focused. What we are not is dull.
We’re all about tangible results. Working with both local and
international clients, our generalist and specialist teams help
generate pride from the inside out by inspiring and influencing
those at the heart of company success: employees, partners,
communities and investors.
Recently we added new clients QBE, SAP and NAOS and
experienced positive organic growth across several key
relationship clients like Optus, BHP, Plenary and NAB.
Our strategic vision over the next three years is to become
Australia’s leading business creative communications agency.
To achieve this, we plan to maintain our strong operational
foundation, through consistency in our sales approach and
revenue achievement. We want to become known for our
creative brilliance by clients, and envied by our competitors.
Plus, we want to retain and attract the brightest and best
talent. To that end, we’re investing heavily in our people. With
a new MD and new senior talent, we’re geared up to do some
amazing work!
www.precinct.com.au
For
per
sona
l use
onl
y

SAGE ADVICE ON CRITICAL ISSUES.
www.cprcomm.com.au
Complex, regulated environments with high levels of public accountability require specialised – and sensitive – communications. Gravitas, if you will. CPR’s crack team of former media and political professionals delivers expert advice on issues management, government relations and communication strategy. We don’t see any problem as insurmountable; it’s simply our job to solve it.
We are informed, strategic and connected. We deliver policy, funding and media outcomes for clients in every sector.
During the past year we were part of the “Get Wyndham Moving” campaign, which won the Government Communications Australia Award for Best Advocacy/Public Affairs communications campaign in 2015.
CPR helped several clients, notably Alstom and SPC, to secure breakthrough policy and funding decisions. New clients won included ACCIONA, Samsung and the Melbourne Writers Festival.
We’re currently focused on growing our Melbourne team and balancing the roster of political and communications clients. But we’re hardly resting on our laurels. Next year will see us vigorously pursuing new clients in the six sectors identified by the Victorian Government as having extraordinary growth potential.
For
per
sona
l use
onl
y

Corporate Governance Statement
18 Enero Group Limited Annual Report 2015
This statement outlines Enero Group Limited’s corporate governance framework and practices in the form of a report against the Australian Securities Exchange (“ASX”) Corporate Governance Principles and Recommendations, 3rd edition (“Principles”).
The Board of Enero Group Limited (“the Company”) is responsible for the corporate governance of the Company and its subsidiaries. This Corporate Governance Statement was authorised for issue in accordance with a resolution of the Directors on 25 August 2015.
ASX Corporate Governance Principles and Recommendations:
Principle 1. Laying solid foundations for management and oversight 1.1 Responsibilities of the Board and management 1.1.1 Board of Directors The Board has approved a formal Board Charter, which details the Board’s role, powers, duties and functions. A copy of the Board Charter is available on the Enero website.
The Board is responsible for, and has the authority to determine, all matters relating to the policies, practices, management and operations of the Group in order to carry out the objectives of the Group.
Without intending to limit this general role of the Board, the principal functions and responsibilities of the Board include the following:
Oversight of the Company: overseeing the Group and establishing codes that reflect the values of the Company and guide the conduct of the Board, management and employees.
Strategy and planning: overseeing the development and implementation of the Group’s strategic plan.
Shareholder liaison: ensuring effective communications with shareholders through an appropriate communications policy and promoting participation at general meetings of the Company.
Monitoring, compliance and risk management: overseeing and reviewing the Company’s risk management and internal control framework as well as accountability systems and corporate reporting systems.
Financial: adopting the annual budget and financial statements as well as monitoring and directing the financial and operational performance of the Company including capital management.
Human resources: appointing and, where appropriate, removing the Chief Executive Officer (CEO) and Company Executives as well as reviewing the performance of the CEO and monitoring the performance of Company Executives in their implementation of the Company’s strategy.
Ensuring the health, safety and wellbeing of employees: in conjunction with the Executive team, developing, overseeing and reviewing the effectiveness of the Company’s workplace health and safety systems to ensure the wellbeing of all employees.
Delegation of authority: determining delegations to Board Committees and management.
1.1.2 Senior executives Day-to-day management of the Company’s affairs and implementation of the corporate strategy and policy initiatives are delegated by the Board to the CEO and senior executives.
1.2 Appointment of Directors The Constitution of the Company provides that the number of Directors must not be less than three and not more than 13. The names of the Directors of the Company in office atthe date of this report are set out in the Directors’ Reporton page 25 of this report, including the period of office heldby each Director as at the date of this report. There arecurrently six Directors, each of whose skills, experienceand expertise are described in their Director profiles onpage 25. There is one Executive Director (MatthewMelhuish) and five Non-Executive Directors (John Porter,Susan McIntosh, Roger Amos, Max Johnston and RusselHowcroft).
When a vacancy exists for a Board position, through whatever cause, or where the Board considers that it would benefit from the services of a new member with particular skills, the Remuneration and Nomination Committee will consider candidates having regard to:
– what may be appropriate for the Company;
– the skills, expertise and experience of the candidates;
– the desirability of those skills, expertise and experiencewhen combined with those of the existing Directors;and
– the perceived compatibility of the candidates with theCompany and with the existing Directors.
The Board is committed to ensuring that Directors appointed to the Board hold a mix of skills and experience and that Board composition reflects the Company’s commitment to diversity.
The Board undertakes appropriate background checks before the appointment of a new Director including an assessment of their qualifications and experience and details of any material directorships held by the candidate. Any Director appointed by the Board since the previous Annual General Meeting must stand for election by no later than the next Annual General Meeting.
As required under Enero’s Constitution and the ASX Listing Rules, and excluding any Managing Director or Director newly appointed during the relevant year (who must stand for election), at each Annual General Meeting one-third of the Directors (rounded down to the nearest whole number) must retire from office. Retiring Directors are eligible for re-election by shareholders.
For
per
sona
l use
onl
y

19
No Director (other than the Managing Director) may hold office for more than three years without standing for re-election.
1.3 Agreements with Directors and senior executives The Company has written service agreements with Directors and senior executives setting out the terms of appointment.
In relation to Directors, the agreement sets out term of appointment, remuneration, compliance with Company policies, ongoing rights and confidentiality obligations and indemnity and insurance obligations. In relation to senior executives, the agreement sets out term of appointment, remuneration, compliance with Company policies, description of their position, duties, circumstances in which employment will be terminated and any entitlements on termination. 1.4 Company Secretary The Company Secretary is accountable to the Board on all matters relating to the functioning of the Board and all Directors have access to the Company Secretary. The Company Secretary role includes advising the Board on governance matters and monitoring that Board and Committee policy and procedures are followed. 1.5 Diversity Policy and promoting diversity 1.5.1 Diversity policy The Board has adopted a Diversity policy which describes the Company’s commitment to ensuring a diverse mix of skills and talent amongst its Directors, officers and employees, to enhance Company and Group performance. The Diversity policy addresses equal opportunities in the hiring, training and career advancement of Directors, officers and employees and outlines the process by which the Board will set measurable objectives to achieve the aims of its Diversity policy, with particular focus on gender diversity within the Group. The Board is responsible for monitoring Group performance in meeting the Diversity policy requirements, including the achievement of diversity objectives. A copy of the Diversity policy is available on the Enero website.
The Company promotes an environment which is conducive to the employment of well qualified employees, senior management and Board candidates regardless of gender, race or age. Individual entities are responsible for and are encouraged to adopt work practices which ensure that they are able to attract and keep the best employees, regardless of gender, age or race; such measures include flexible work practices, part-time work and, in some instances, paid maternity leave which exceeds the prescribed amounts in the Australian Government Paid Parental Leave Scheme.
The Company continues to monitor and seek to identify ways in which it can promote a corporate culture which embraces diversity when determining the composition of employees, senior management and the Board, including continuing to recruit employees and Directors from a diverse pool of qualified candidates.
1.5.2 Proportions of men and women Women are well represented at Board and senior management level within the Company. Susan McIntosh has been a Director of Enero since June 2000 and is one of six Directors on the Board. Women comprised 17% of the Board, 25% of the Enero Executive team, approximately 36% of Senior Managers and approximately 58% of employees across the Company as at the conclusion of the reporting period.
The Group has defined Senior Managers as those employees who have remuneration in excess of AUD $150,000 (or the equivalent foreign currency amount).
The Remuneration and Nomination Committee has been charged with the duty to review and report annually on the relative proportion of women and men in the workforce at all levels of the Group.
As part of the Company’s ongoing commitment to gender diversity and equality, the Company has lodged an annual public report to the Workplace Gender Equality Agency. A copy can be obtained from the Enero website.
1.6 Evaluation of Board performance The Chair is responsible, in the first instance, for monitoring the contribution of individual Directors, and providing guidance on any areas for improvement.
The Board undertakes an annual self-assessment of both its collective performance and that of individual Directors and seeks specific feedback from the senior management team on particular aspects of its performance. The Remuneration and Nomination Committee oversees this annual performance assessment program. The Deputy Chair is responsible for the performance evaluation of the Chair.
In addition, each Board Committee undertakes an annual self-assessment of the performance of the committee and the achievement of committee objectives. The performance of the CEO is reviewed annually by the Remuneration and Nomination Committee and the Board. The performance of the CEO is reviewed annually against set performance goals and competencies. Performance evaluation of the Board, its committees and Directors has taken place during the reporting period in accordance with the process disclosed.
From the most recent performance evaluation of the Board there were no specific changes to the governance practices of the Company.
1.7 Evaluation of senior Executives’ performance The performance evaluation of key Executives is undertaken by the Board, in conjunction with the CEO, on both a formal regular and informal ongoing basis. Each senior Executive’s performance is reviewed at least annually. Performance evaluation of senior Executives has taken place during the reporting period in accordance with the process disclosed.
The process for evaluating the performance of senior Executives and the remuneration policy for senior Executives is further discussed in the Remuneration Report.
For
per
sona
l use
onl
y

Corporate Governance Statement
20 Enero Group Limited Annual Report 2015
2. Structuring the Board to add value 2.1 Nomination Committee The Board has a Remuneration and Nomination Committee whose purpose is to seek and nominate qualified candidates for election or appointment to the Company’s Board. Details regarding the composition and responsibilities of this Committee are set out in item 8.1 of this Corporate Governance Statement.
2.2 Board skills matrix In determining the composition of the Board, the Remuneration and Nomination Committee ensures that the Board has an optimal size and mix of skills to facilitate efficient and appropriate decision making. Details of the skills, experience and expertise of each Director are set out on page 25 of this report. The Board has an appropriate matrix of skills including:
– relevant industry experience in the marketing and communications sector;
– Board members with Directorships in other listed entities;
– international experience in markets in which the Group operates; and
– corporate leadership.
Based on the Board being satisfied with its current skills matrix, the Board is not actively seeking to achieve any change to the skills matrix. 2.3 Independent Directors The Board meets the ASX Corporate Governance Council’s recommendation that a majority of the Board should be independent.
Directors of the Company are:
Name Role John Porter Independent Non-Executive Director
(Chairman) Roger Amos Independent Non-Executive Director
(Deputy Chairman) Susan McIntosh Non-Executive Director Max Johnston Independent Non-Executive Director Russel Howcroft Independent Non-Executive Director Matthew Melhuish Executive Director
Each Director’s date of appointment is disclosed on page 25 of this report.
The Board uses the following criteria to determine and confirm the independence of each Board member:
– the Director is not:
a substantial shareholder of the Company; or
an officer of, or otherwise associated directly with, a substantial shareholder of the Company;
– the Director is not employed in an executive capacity by the Company or its subsidiaries, or if the Director has previously been employed by the Company or its subsidiaries, there has been a period of at least three
years between ceasing such employment and serving on the Board;
– the Director has not been a principal of a material professional advisor or a material consultant to the Company or its subsidiaries, or an employee materially associated with the service provided within the last three years;
– the Director is not a material supplier or customer of the Company or its subsidiaries, or an officer of or otherwise associated directly or indirectly with a material supplier or customer;
– the Director has no material contractual relationship with the Company or its subsidiaries other than as a Director; and
– the Director has not been on the Board for such a period of time that independence may have been compromised.
Susan McIntosh is not considered independent because she is an officer of the RG Capital group of companies, which has a substantial holding in Enero.
Matthew Melhuish is not considered independent because he is employed in an Executive capacity.
The Board assesses whether each Non-Executive Director is independent on appointment and at least annually.
In relation to conflicts of interest, Directors must:
– disclose to the Board actual or potential conflicts of interest that may or might reasonably be thought to exist between the interests of the Director and the interests of any other parties in carrying out the activities of the Group; and
– if requested by the Board, within seven days or such further period as may be permitted, take such necessary and reasonable steps to remove any conflicts of interest.
If a Director cannot or is unwilling to remove a conflict of interest, then the Director must, as per the Corporations Act, absent himself or herself from the room when discussion and/or voting occurs on matters to which the conflict relates.
2.4 Majority independent Directors Four of the six Directors are classified as independent and therefore this meets with the ASX recommendation that the majority of Directors should be independent.
2.5 Independent Chair and roles of the Chair and CEO The Chair of Enero, John Porter, is an independent Non-Executive Director. This meets with the ASX Recommendation that the Chairman should be an independent Director.
The roles of Chair and CEO are not exercised by the same individual. The division of responsibilities between the Chair and the CEO has been agreed by the Board.
The Chairman is responsible for:
– leadership of the Board;
– overseeing the Board in the effective discharge of its supervisory role;
For
per
sona
l use
onl
y

21
– promoting a strong relationship between the Board and management; and
– ensuring there is regular and effective evaluation of the Board’s performance.
The CEO is responsible for:
– leadership of the management team;
– day-to-day management of the Group’s operations; and
– implementation of the Group’s strategies.
2.6 Induction and professional development of Directors New Directors undergo an induction process conducted by the Company Secretary in which they are given a full briefing on the Group. Information made available to new Directors includes:
– meetings and presentations from senior Executives; – information regarding conduct and contribution
expectations; – details of relevant legal requirements; – a copy of the Board Charter and relevant Committee
Charter; – management reports of the Group; – a copy of the current strategic plan of the Group and
annual budget; and – a copy of the Constitution of the Company. The Board does not have a formal procedure for Directors to take professional advice at the expense of the Company; however, the Directors have the ability to do so. This includes continuing professional development opportunities for Directors. 3. Promoting ethical and responsible decision making 3.1 Company Code of Conduct To assist the Board in carrying out its functions, Enero has developed a Code of Conduct to guide the Directors, the CEO and other key Executives in the performance of their roles. The Company Code of Conduct was adopted by resolution of the Board on 27 May 2004. This Code covers the following expectations in relation to the following matters:
responsibilities to shareholders and the financial community generally;
responsibilities to clients, customers and consumers; employment practices; obligations relative to fair trading and dealing; conflicts of interest; compliance with legislation affecting its operations;
and how the Company monitors and ensures compliance
with its Code. The Code of Conduct is complemented by a range of additional policies including the Securities Trading Policy, Continuous Disclosure Policy, Media and Communications Policy and Workplace Health and Safety Policy.
A copy of the Code of Conduct is available on the Enero website.
4. Safeguarding integrity in corporate reporting 4.1 Audit and Risk Committee The Audit and Risk Committee consists only of Non-Executive Directors, including a majority of independent Directors. The current members of the Audit and Risk Committee are John Porter, Susan McIntosh and Roger Amos.
Roger Amos has been the Chair of this Committee since 1 March 2011. He is an independent Director. All members can read and understand financial statements and are otherwise financially literate.
The details of the members’ qualifications can be found in their Director profiles on page 25.
The Audit and Risk Committee Charter sets out the Committee’s role and responsibilities, structure, membership requirements and procedures. The Committee meets at least four times each year and reports to the Board on all matters within its role and responsibilities. The Audit and Risk Committee meets with an external auditor at least twice a year. Members of management and the external auditors attend meetings of the Audit and Risk Committee by invitation. The Audit and Risk Committee may also have access to financial and legal advisers, in accordance with the Board’s general policy.
Details of the number of meetings of the Audit and Risk Committee and the names of attendees can be found in the Directors’ Report on page 27.
The Audit and Risk Committee monitors and reviews the effectiveness of the Group’s controls in the areas of operational and capital risk, legal, compliance and corporate reporting. The Committee discharges these responsibilities by:
– establishing policy and overseeing the adequacy of the controls established by senior management to identify and manage areas of potential risk and to safeguard the assets of Enero;
– overseeing Enero’s relationship with the external auditor and the external audit function generally including selection, appointment, rotation and removal of the external auditor, audit fees and independence of the auditor; and
– evaluating the processes in place to ensure that accounting records are properly maintained in accordance with statutory requirements, and that financial information provided to investors and the Board is accurate and reliable; and
– monitoring procedures in place to ensure Enero is compliant with various legislative and reporting requirements for financial statements, including the Corporations Act and ASX Listing Rules.
The Audit and Risk Committee has also adopted a policy on the provision of non-audit services, and complies with the statutory requirements regarding the rotation of external audit personnel. All non-audit services were subject to the corporate governance procedures adopted by the Company and have been reviewed by the Audit and Risk Committee to ensure they do not impact the integrity and objectivity of the auditor.
For
per
sona
l use
onl
y

Corporate Governance Statement
22 Enero Group Limited Annual Report 2015
The non-audit services provided do not undermine the general principles relating to auditor independence as set out in APES 110 Code of Ethics for Professional Accountants, as they did not involve reviewing or auditing the auditor’s own work, acting in a management or decision-making capacity for the Company, acting as an advocate for the Company, or jointly sharing risks and rewards.
The Audit and Risk Committee reviews the audited annual and half yearly financial statements and other reports which accompany published financial statements before submission to the Board, and recommends their approval.
A copy of the Charter is available on the Enero website.
4.2 Statement of CEO and CFO in relation to assurance The Board has received assurance from the CEO and the Group Finance Director that the declaration provided by them in accordance with section 295A of the Corporations Act 2001 is founded on a sound system of risk management and internal control and that, in their opinion:
– financial records have been properly maintained;
– financial statements, in all material aspects, are complete and present a true and fair view of the financial position and operational results of the Group and are in accordance with relevant accounting standards;
– the above statement is founded on a sound system of financial risk management and internal control, which implements the policies adopted by the Board; and
– risk management and internal control is operating efficiently and effectively in all material respects in relation to financial reporting risks and material business risks.
The Board notes that due to its nature, internal control assurance from the CEO and Group Finance Director can only be reasonable rather than absolute. This is due to factors such as the need for judgement and because much of the evidence available is persuasive, rather than conclusive, and therefore does not, and cannot be designed to, detect all weaknesses in control procedures. 4.3 Annual General Meeting (AGM) The external auditor attends the AGM each year and is available to answer any questions from security holders relevant to the audit.
5. Making timely and balanced disclosure 5.1 Policy for compliance with continuous disclosure Enero has established a Continuous Disclosure Policy to ensure compliance with the ASX Listing Rules disclosure requirements and provide timely and accurate information to its investors and regulators.
The Board has designated the Company Secretary as the person responsible for overseeing and coordinating disclosure of information to the ASX, as well as communicating with the ASX.
A copy of the Company’s Continuous Disclosure Policy is available on the Enero website.
6. Respecting the rights of security holders 6.1 Company website Communications with investors occurs via ASX announcements, the annual report, half and full year review meetings and other briefings from time to time. All information disclosure to the ASX is available on the Company’s website.
The Company encourages shareholders to participate in the AGM of the Group. The Company seeks to choose a date, venue and time for the AGM that is convenient to the greatest number of its shareholders. Explanatory memorandums on the resolutions are included in the notice of meeting.
The Company’s website www.enero.com has a wide range of information available about the Group including an overview of the Group’s operations and details on the Company’s securities registry.
6.2 Investor relations program To facilitate the effective exercise of the rights of shareholders, the Company is committed to ensuring that all external communications with shareholders will:
– be factual;
– not omit material information; and
– be timely and expressed in a clear and concise manner.
The Company makes the CEO and Group Finance Director available to investors during specific periods of the year to conduct briefings on the Group financial performance and operations.
The Company makes available a telephone number and email address for shareholders to make enquiries of the Group.
6.3 Security holder participation at meetings
The Company makes available all of the Directors at the AGM each year. Security holders have the right to ask questions of the Directors in relation to any Company matters.
The Company facilitates online voting on resolutions through its share registry.
6.4 Electronic communications
The Company gives all security holders the option to receive communications from the Company or the share registry, and send communications electronically either to the Company or the share registry.
7. Recognise and manage risk 7.1 Risk Committee The Board has an Audit and Risk Committee whose purpose is to ensure the Company has adequate processes for managing risk and internal controls. Details regarding the composition and responsibilities of this Committee are set out in item 4.1 of this Corporate Governance Statement.
7.2 Risk oversight and management Enero recognises that identification and effective management of risk is viewed as an essential part of good corporate governance and the Company’s approach to creating long-term shareholder value.
For
per
sona
l use
onl
y

23
The Company has an established risk management framework designed to identify and respond to risks in a way that creates value for Enero shareholders, and to allow the Company to meet its long-term growth objectives. The framework includes specific risk management activities in core areas of risk for the Group, including operational, financial reporting and compliance risks. The risk management framework adopted by the Company includes:
– process for identification of the material business risks faced by the Company;
– prioritisation of material business risks;
– identification of controls to manage the key risks; and
– ongoing reporting and discussion of material business risks throughout the year.
Risk management is a key element of Enero’s strategic planning and decision making. Enero strives to balance the risks and rewards in conducting business to optimise returns, in accordance with its goals of delivering shareholder value and its commitments to stakeholders, customers and the broader community.
Management, through the CEO, is responsible for designing, implementing and reporting on the adequacy of the Company’s risk management and internal control system. Management reports to the Audit and Risk Committee on the Company’s key risks and the extent to which it believes these risks are being managed. This is performed on an annual basis or more frequently as required by the Board. The most recently conducted annual risk review did not result in any changes to the risk management framework.
The Board is responsible for satisfying itself annually, or more frequently as required, that management has developed and implemented a sound risk management and internal control system. Detailed work on this task is delegated to the Audit and Risk Committee and reviewed by the Board. The Audit and Risk Committee also oversees the adequacy of the Company’s risk reporting from management.
Strategic and operational risks are reviewed at least annually by all operating businesses as part of the annual strategic planning and budgeting process. The CEO and MDs of the Company’s subsidiaries are required to report to the Board each month on operational risks. These are then reviewed by the Enero Executive team each month; and by external auditors as part of the half-yearly reporting to shareholders.
The General Counsel and Company Secretary monitor the Company’s compliance with its legal and regulatory obligations. Senior management meets regularly to deal with specific areas of risk, such as treasury risk and foreign exchange rates, and provides reporting to the Board on these areas at least annually.
The Risk Management Policy is available on the Enero website.
7.3 Internal audit function The Board has not implemented an internal audit function. The Board believes the nature and size of the Company’s operations currently do not require a separate function to the functions performed by the Company’s finance department, Audit and Risk Committee and external auditors. Risk management procedures are reviewed, evaluated and updated annually by the Audit and Risk Committee.
7.4 Material exposure to economic, environmental and social sustainability risks The Board does not consider it has any material risk exposure to environmental and social sustainability risks due to the nature of the business.
The Risk Management Policy outlines the specific risk management activities, across core areas for the Group, of operational and compliance risks.
8. Remunerate fairly and responsibly 8.1 Remuneration and Nomination Committee The Remuneration and Nomination Committee consists only of Non-Executive Directors, including a majority of independent Directors. The current members of the Remuneration and Nomination Committee are Max Johnston, John Porter, Susan McIntosh and Roger Amos.
Max Johnston has been the Chair of this Committee since 29 May 2014. He is an independent Director.
The Remuneration and Nomination Committee reviews and makes recommendations to the Board on remuneration packages and policies, including but not limited to succession planning, recruitment and the appointment of the CEO, senior Executives and Directors themselves, and overseeing succession planning, selection and appointment practices and remuneration packages for management and employees of Enero.
The Remuneration and Nomination Committee has adopted a Charter, a copy of which is available on the Company’s website.
Details of the number of meetings of the Remuneration and Nomination Committee and the names of the attendees can be found in the Directors’ Report on page 27.
The responsibilities of the Remuneration and Nomination Committee include setting policies for senior officers’ remuneration, setting the terms and conditions of employment for the CEO, reviewing and making recommendations to the Board on the Company’s incentive schemes and superannuation arrangements, making recommendations to the Board on any proposed changes to the Board, and undertaking an annual review of the CEO’s performance, including setting the CEO’s goals for the coming year and reviewing progress in achieving these goals.
For
per
sona
l use
onl
y

Corporate Governance Statement
24 Enero Group Limited Annual Report 2015
8.2 Senior Executives’, Executive Directors’ and Non-Executive Directors’ remuneration The Senior Executive Remuneration Policy was approved by resolution of the Board in September 2004 and the Non-Executive Director Remuneration Policy was approved by resolution of the Board on 25 March 2004.
8.2.1 Senior Executive Remuneration The Group is committed to remunerating its senior Executives in a manner that is market-competitive and consistent with best practice, as well as supporting the interests of shareholders. Consequently, under the Senior Executive Remuneration Policy, the remuneration of senior Executives may be comprised of (or some combination of) the following:
– fixed salary that is determined from a review of the market and reflects core performance requirements and expectations including statutory superannuation;
– a short-term incentive designed to reward actual achievement by the individual of performance objectives and Company performance targets; and
– participation in the equity-based incentive scheme.
By remunerating senior Executives through performance and long-term incentive plans, in addition to their fixed remuneration, the Company aims to align the interests of senior Executives with those of shareholders, and increase Company performance.
Details of the amount of remuneration, including both monetary and non-monetary components, for each of the (non-Director) Executives during the year (discounting accumulated entitlements) are detailed in the Directors’ Report and Note 26 of the notes to the financial statements.
8.2.2 Non-Executive Director Remuneration The Constitution provides that the Non-Executive Directors are each entitled to be paid such remuneration from the Company as the Directors decide for their services as a Director, but the total amount paid to all Non-Executive Directors for their services must not exceed in aggregate in any financial year the amount fixed by the Company in a general meeting. This amount is currently fixed at $750,000. The remuneration of Non-Executive Directors must not include a commission on, or a percentage of, profits or operating revenue. Directors may also be reimbursed for travelling and other expenses incurred in attending to the Company’s affairs. Directors may be paid such additional or special remuneration as the Directors decide is appropriate where a Director performs extra services or makes exertions for the benefit of the Company.
Non-Executive Directors are entitled to statutory superannuation, but do not otherwise receive retirement benefits.
Details of the amount of remuneration, including both monetary and non-monetary components, for each of the Directors paid during the year (discounting accumulated entitlements) are detailed in the Directors’ Report and Note 26 of the notes to the financial statements.
8.3 Equity-Based Remuneration The Company has an equity-based remuneration plan. The Share Appreciation Rights (SAR) Plan allows selected Executives to participate in appreciations to the Enero share price over specified vesting periods.
Enero has a Securities Trading Policy which applies to Directors, senior Executives and certain employees (and their associates). The policy prohibits Directors and employees from trading in Enero’s securities if they are in possession of price-sensitive information which is not generally available to the market. It also prohibits dealings by Directors and certain employees outside trading windows. During trading windows Directors and certain employees must seek clearance from the delegated officer prior to conducting a trade.
The Company prohibits participants in the SAR to hedge or otherwise limit the economic risk of participating in the plan unless the securities have vested.
The Company also prohibits Key Management Personnel from entering into transactions that involve using Enero’s securities as collateral for a financial transaction, including margin lending.
A copy of the Securities Trading Policy is available on the Company’s website.
For
per
sona
l use
onl
y

Directors’ Report
25
The Directors present their report, together with the financial statements of Enero Group Limited (the Company) and of the Group, being the Company and its controlled entities, for the year ended 30 June 2015; and the auditor’s report thereon.
Directors The Directors of the Company at any time during or since the end of the financial year are:
John Porter – Independent Non-Executive Chairman John was appointed as Chairman and Non-Executive Director of the Company on 24 April 2012. Prior to joining Enero Group, John Porter was Executive Director and Chief Executive Officer of Austar United Communications Limited from June 1999 to April 2012. John was Managing Director of Austar Entertainment Pty Limited from July 1997 to December 1999. From January 1997 to August 1999, he also served as the Chief Operating Officer of United Asia Pacific, Inc. (UAP). He led the establishment of Austar Entertainment Pty Limited in 1995, and by doing so played an integral role in the development of Australia's subscription television industry. Prior to joining Austar, John spent ten years in various senior management capacities for Time Warner Cable, a subsidiary of Time Warner, Inc. He has more than 30 years of management experience in the US and Australian subscription television industries. John is also currently CEO of Telenet Group Holding NV. John is a member of the Audit and Risk Committee, and Remuneration and Nomination Committee. Matthew Melhuish – CEO and Executive Director Matthew was appointed Chief Executive Officer and Executive Director of the Company on 16 January 2012. Matthew has over 30 years’ experience in the advertising and marketing industry across a range of roles in Australia and the UK. Prior to being appointed CEO, Matthew had been the key executive overseeing the Company’s Australian Agencies business. Matthew is a founding partner of leading creative agency BMF, and was CEO of that business for 15 years from its inception through to BMF being named as Agency of the Decade. Matthew is a respected leadership figure within the Australian advertising industry. He was Chairman of the EFFIEs Advertising Effectiveness Awards for 10 years and he has played key roles for over 15 years as a National Board member of the peak industry body, The Communications Council and as a National Board member and National Chairman of its predecessor organisation the Advertising Federation of Australia (AFA). Matthew is a current Board member of the Sydney Festival and was a Board member of the international aid organisation Médecins Sans Frontières/Doctors without Borders (MSF) for 10 years. Susan McIntosh – Non-Executive Director Susan was appointed as a Non-Executive Director of the Company on 2 June 2000. Susan has more than 25 years’ business experience in media (international television production and distribution and radio) and asset management, and is the Managing Director of RG Capital Holdings (Australia) Pty Ltd. Prior to joining RG Capital, Susan was Chief Financial Officer of Grundy Worldwide Ltd and played an integral role in the establishment of its international television operations and in the eventual sale
of the company in 1995. Susan was previously a Director of RG Capital Radio Ltd and E*TRADE Aust Ltd. Susan is a member of the Institute of Chartered Accountants. Susan is a member of the Audit and Risk Committee, and the Remuneration and Nomination Committee. Roger Amos – Independent Non-Executive Director Roger was appointed as a Non-Executive Director of the Company on 23 November 2010. Roger is Chairman of Tyrian Diagnostics Limited and a member of its audit committee. He is a Director of 3P Learning Limited, Chairman of its audit committee and a member of its remuneration committee. He is a Director of REA Group Limited, Chairman of its audit committee and a member of its remuneration committee. He was a Director of Austar United Communications Limited, the Chairman of its audit and risk committee and a member of its remuneration committee until April 2012. All are publicly listed Australian companies. He was the Chairman of Opera Foundation Australia from 2009 to 2013 and is a Governor of the Cerebral Palsy Alliance Research Foundation. Roger retired in 2006 after 25 years as a Partner of KPMG, where he focused on the information, communication and entertainment sector and held a number of global roles. Roger is a Fellow of the Institute of Chartered Accountants and a Fellow of the Australian Institute of Company Directors. Roger is the Deputy Chairman of the Board of Directors, Chairman of the Audit and Risk Committee, and a member of the Remuneration and Nomination Committee. Max Johnston – Independent Non-Executive Director Max was appointed as a Non-Executive Director of the Company on 28 April 2011. Max is the Non-Executive Chairman of Probiotec Limited, Non-Executive Director of PolyNovo Limited and a Director of Medical Developments International. For 11 years he was President and Chief Executive Officer of Johnson & Johnson, Pacific and an Executive Director of Johnson & Johnson. Max has also held several prominent industry roles, including as a past President of ACCORD Australasia Limited, a former Vice Chairman of the Australian Food and Grocery Council and a former member of the Board of ASMI. He has had extensive overseas experience during his career in leading businesses in both Western and Central-Eastern Europe and Africa. Max is Chairman of the Remuneration and Nomination Committee. Russel Howcroft – Independent Non-Executive Director Russel was appointed as a Non-Executive Director of the Company on 21 May 2015. Russel is the Executive General Manager for Network Ten Limited. He has had a long and distinguished career in the advertising industry spanning over 25 years, including six years as MD then CEO at George Patterson Y&R Australia & NZ, and a five-year stint at leading UK creative agency Lowe & Partners. He was also a founding partner of the start-up Brandhouse Agency. Russel is currently a Board member of Freeview and was formerly the Chairman of the Advertising Federation of Australia. Russel is a panel member of ABC’s “The Gruen Transfer” and holds various other media roles.
For
per
sona
l use
onl
y

Directors’ Report
26 Enero Group Limited Annual Report 2015
Company Secretary Brendan York was appointed Company Secretary on 1 July 2012. He is also the Group Finance Director of the Group. Brendan is a Chartered Accountant and has a Bachelor of Business Administration and Bachelor of Commerce from Macquarie University.
Principal activities The principal activities of the Group during the course of the financial year were integrated marketing and communication services, including strategy, market research, advertising, public relations, communications planning, graphic design, events management, direct marketing, and corporate communications.
Operating and financial review
Operations of the Group The Group consists of 11 marketing and communication services businesses across eight countries with more than 550 employees. The Group’s service offering includes public relations, advertising, direct marketing, communications strategy and planning, research and data analytics, stakeholder communications and search marketing.
The Group has three key hubs – Sydney, London and New York – which house the majority of the Group’s businesses and employees.
Please refer to page 8 for details of product offerings for each operating business. Financial performance for the year The Group achieved an increase in Operating EBITDA of 2% to $9.2 million, despite an 8% decline in net revenue. The Operating EBITDA margin increased to 8.3% as compared to 7.5% in the prior year. 60% of the Group’s Operating EBITDA is generated from international markets.
The increased Operating EBITDA and margin was attributable to: reductions to cost base across a number of Operating
Brands and focus on benchmark ratios to measure the Operating Brands against;
new business wins across the Operating Brands despite the overall reduction in Net Revenue; and
continuing to leverage Group assets to service client needs with integration of key skills and resources across Operating Brands.
Reconciliation of loss after tax to Operating EBITDA
In thousands of AUD 2015 2014
Net Revenue 110,347 119,493Operating EBITDA 9,202 8,972Depreciation and amortisation expenses (4,225) (4,791)Net finance income/(costs) 65 (44)Commercial settlement – (1,150)Restructure costs (1,667) (1,717)Loss on deregistration/disposal of subsidiaries (i) (2,644) (68)Profit before tax 731 1,202Income tax expense (2,346) (2,655)Loss after tax (1,615) (1,453)(i) During the current reporting period, the Group deregistered
a number of dormant subsidiaries. Loss on disposal of subsidiaries represents foreign currency translation reserve transferred to income statement at the time of deregistration of foreign subsidiaries. For a list of subsidiaries deregistered, refer to Note 19 Controlled entities in this annual report.
Financial position of the Group The Group continues to maintain a strong balance sheet with no bank debt. Any accumulated cash balances are maintained in the Group due to continued restrictions on alterations to its capital structure and payment of dividends such that no dividends can be paid until the contingent deferred consideration payments as described in Note 23 Deferred consideration payables have been paid, settled or cancelled.
The Group implemented strict working capital management to ensure efficient conversion of EBITDA to cash and has delivered positive operating cash flows of $6,993,000 from an Operating EBITDA of $9,202,000. Strategy and prospects The Group’s primary objectives are to create a world-class boutique marketing and communications group solving clients’ marketing problems.
Please refer to page 8 for further details on the strategy and prospects of the Group.
For
per
sona
l use
onl
y

27
Basis of preparation
The Directors’ Report includes Operating EBITDA, a measure used by the Directors and management in assessing the ongoing performance of the Group. Operating EBITDA is a non-IFRS measure and has not been audited or reviewed.
Operating EBITDA is calculated as net profit excluding net finance costs, income taxes, depreciation, amortisation, loss on disposal of subsidiaries, impairment, commercial settlement and restructure costs. Operating EBITDA, reconciled in the table on page 26, is the primary measure used by management and the Directors in assessing the performance of the Group. It provides information on the Group’s cash flow generation excluding significant transactions and non-cash items which are not representative of the Group’s ongoing operations. Disposals
2015 During the current reporting period, the Group deregistered a number of dormant subsidiaries. For a list of subsidiaries deregistered, refer to Note 19 Controlled entities in this annual report. 2014 There were no disposals during the prior reporting period. Issue of shares and share options
Shares issued on exercise of SAR
During the year ended 30 June 2015, a total of 1,460,386 shares were transferred from a trust account held by the Company to the employees of the Group on exercise of Share Appreciation Rights.
As at 30 June 2015, the Company has 3,324,147 shares (30 June 2014: 4,784,533 shares) in a trust account held by the Company for future use against long-term incentive equity schemes as and when required. Dividends
No dividend was declared during the year ended on 30 June 2015, or after the balance sheet date, at the date of this report. For further details refer to Note 14 Capital and reserves in this annual report. State of affairs
There were no significant changes in the state of affairs of the Group during the financial year.
Directors’ meetings The number of Directors’ meetings (including meetings of committees of Directors) and the number of meetings attended by each of the Directors of the Company during the financial year were:
Board meetings
Audit and Risk
Committee meetings
Remuneration and
Nomination Committee
meetings A B A B A B
John Porter 3 7 – 4 1 3
Matthew Melhuish 7 7 – – – –Susan McIntosh 6 7 4 4 2 3
Roger Amos 7 7 4 4 3 3
Max Johnston 7 7 – – 3 3
Russel Howcroft 1 1 – – – –
A = Number of meetings attended.
B = Number of meetings held during the time the Director held office or was a member of the Committee during the year.
Directors’ interests The relevant interests of each Director in the shares or options issued by the Group, as notified by the Directors to the Australian Securities Exchange in accordance with section 205G(1) of the Corporations Act 2001, at the date of this report are as follows:
Director Ordinary
shares
Share Appreciation
Rights
John Porter 270,833 Nil
Matthew Melhuish 1,091,509 2,061,729
Susan McIntosh 122,223 Nil
Roger Amos 7,556 Nil
Max Johnston 77,778 Nil
Russel Howcroft Nil Nil
Total 1,569,899 2,061,729
Share Appreciation Rights
Unissued shares under Share Appreciation Rights plan At the date of this report, unissued shares of the Company under the Share Appreciation Rights plan are:
Expiry date Number of
SARsExercise
price30 September 2015 395,062 $0.5330 September 2015 2,249,980 $0.7130 September 2016 2,250,013 $0.7130 September 2016 (i) 333,333 n/a30 September 2017 (i) 333,333 n/a30 September 2018 (i) 333,334 n/a
Total 5,895,055
(i) Grant is in relation to SARs provided to the CEO which were issued on 16 June 2015, subject to shareholder approval.
These SARs in the table above do not entitle the holder to participate in any share issue of the Company.
For
per
sona
l use
onl
y

Directors’ Report
28 Enero Group Limited Annual Report 2015
Events subsequent to balance date No matters have arisen, in the interval between the end of the financial year and the date of this report, or any item, transaction or event of a material and unusual nature likely, in the opinion of the Directors of the Company, to affect significantly the operations of the Group, the results of those operations, or the state of affairs of the Group in future financial years.
Please refer to Note 25 Subsequent events for further details.
Likely developments The Group will continue to focus on its strategy outlined in the operating and financial review. The Group will specifically focus on new business conversion to increase net revenues, and building the profile of the USA-based operating units in the upcoming year.
Indemnification and insurance of officers and auditors Indemnification The Company has agreed to indemnify the following current Directors of the Company: John Porter, Matthew Melhuish, Susan McIntosh, Roger Amos, Max Johnston, Russel Howcroft and Company Secretary Brendan York, against liabilities to another person (other than the Company or a related body corporate) that may arise from their positions as Directors, Secretaries or Executives of the Company and its controlled entities, except where the liability arises out of conduct involving a lack of good faith. The agreement stipulates that the Company will meet the full amount of any liabilities, including costs and expenses.
The Company has also agreed to indemnify the current Directors and Secretaries of its controlled entities for all liabilities to another person (other than the Company or a related body corporate) that may arise from their position, except where the liability arises out of conduct involving a lack of good faith. The agreements stipulate that the Company will meet the full amount of any such liabilities, including costs and expenses.
Insurance premiums During the financial year, the Company has paid insurance premiums in respect of Directors’ and Officers’ liabilities, for current Directors and Officers covering the following:
– costs and expenses incurred by the relevant officers in defending proceedings, whether civil or criminal; and
– other liabilities that may arise from their position, with the exception of conduct involving a wilful breach of duty or improper use of information or position to gain a personal advantage.
The Directors have not included details of the amount of the premium paid in respect of the Directors’ and Officers’ liability and legal expenses insurance contracts, as such disclosure is prohibited under the terms of the contracts.
Non-audit services During the year KPMG, the Group’s auditor, has performed certain other services in addition to the audit and review of the financial statements.
The Board has considered the non-audit services provided during the year by the auditor and in accordance with advice provided by resolution of the Audit and Risk Committee, is satisfied that the provision of those non-audit services during the year by the auditor is compatible with, and did not compromise, the auditor independence requirements of the Corporations Act 2001 for the following reasons:
– all non-audit services were subject to the corporate governance procedures adopted by the Company and have been reviewed by the Audit and Risk Committee to ensure they do not impact the integrity and objectivity of the auditor; and
– non-audit services provided do not undermine the general principles relating to auditor independence as set out in APES 110 Code of Ethics for Professional Accountants, as they did not involve reviewing or auditing the auditor’s own work, acting in a management or decision-making capacity for the Group, acting as an advocate for the Group, or jointly sharing risks and rewards.
A copy of the Lead Auditor’s independence declaration as required under section 307C of the Corporations Act 2001 is on page 75 of this annual report.
Details of the amounts paid to the auditor of the Company, KPMG, and its related practices for non-audit services provided during the year, are set out below. In addition, amounts paid to other auditors for the statutory audit have been disclosed in Note 28 Auditors’ remuneration of the notes to the financial statements.
2015 $
2014$
Services other than statutory audit Auditors of the Company Taxation compliance services: KPMG Australia 30,000 30,000Overseas KPMG firms 166,000 197,000Other advisory services: KPMG Australia 7,000 7,000Overseas KPMG firms 3,000 3,000Total services other than statutory audit 206,000 237,000
Rounding off The Company is of a kind referred to in ASIC Class Order 98/100 dated 10 July 1998 and in accordance with that Class Order, amounts in the financial statements and Directors’ Report have been rounded off to the nearest thousand dollars, unless otherwise stated.
For
per
sona
l use
onl
y

29
Remuneration Report – Audited
Contents 1 Introduction 2 Key Management Personnel (KMP) disclosed in this report 3 Remuneration Governance 4 Executive Remuneration policy and framework 5 Executive service agreements 6 Non-Executive Directors 7 Directors’ and Executive officers’ remuneration 8 Share-based payments 9 Directors’ and Executive officers’ holdings of shares 10 Loans to Key Management Personnel 11 Remuneration and Group performance 1 Introduction The Directors of Enero Group Limited present this Remuneration Report for the Group for the year ended 30 June 2015. The information provided in the Remuneration Report has been audited as required by section 308(3C) of the Corporations Act 2001 and forms part of the Directors’ Report.
2 Key Management Personnel (KMP) disclosed in this report The KMP covered in this Remuneration Report are those people having authority and responsibility for planning, directing and controlling the activities of the Group, directly or indirectly. The table below outlines the KMP at any time during the financial year, and unless otherwise indicated, they were KMP for the entire year.
Name RoleNon-Executive Directors John Porter Non-Executive Director (Chairman) Roger Amos Non-Executive Director (Deputy
Chairman) Susan McIntosh Non-Executive Director Max Johnston Non-Executive Director Russel Howcroft Non-Executive Director
(appointed 21 May 2015)
Executives Matthew Melhuish Chief Executive Officer Brendan York Group Finance Director
Stephen Watson Group Strategy & Operations Director
Katie McGrath Group Human Resources Director
3 Remuneration Governance The Board has established the Remuneration and Nominations Committee (“Committee”). It is responsible for making recommendations on remuneration matters to the Board on: – the over-arching executive remuneration framework;
– operation of the incentive plans which apply to Executives including key performance indicators and performance hurdles;
– remuneration levels of Company Executives and Subsidiary Executives;
– appointment of the Chief Executive Officer, senior Executives and Directors themselves; and
– Non-Executive Director fees.
The Committee’s objective is to ensure that remuneration policies and structures are fair, competitive to attract suitably qualified candidates, reward the achievement of strategic short-term and long-term objectives and achieve long-term value creation for shareholders.
The Corporate Governance Statement provides further information on the role of the Committee.
There were no services used from remuneration consultants during the year ended 30 June 2015.
4 Executive Remuneration policy and framework The objective of the Group’s executive reward framework is to attract, motivate and retain employees to ensure the delivery of business strategy.
The Executive Remuneration framework includes the Company Executives and the subsidiary Executives to ensure alignment across all levels of the Group.
The framework aligns executive reward with the achievement of strategic objectives resulting in remuneration structures taking into account:
– the responsibility, performance and experience of key management personnel;
– the key management personnel’s ability to control the relevant Company’s performance;
– the Group’s performance, including:
– the Group’s earnings with profit a core component of remuneration design;
– the growth in share price and delivering constant returns on shareholder wealth; and
– the Group’s achievement of strategic objectives.
For Company Executives, the remuneration framework currently has the following components:
– fixed remuneration – comprising base pay, benefits and superannuation;
– short-term incentive – comprising an annual cash bonus; and
– long-term incentive – equity-based Share Appreciation Rights Plan.
For Subsidiary Executives, the remuneration framework currently has the following components:
– fixed remuneration – comprising base pay, benefits and superannuation;
– short-term incentive – comprising either an annual cash bonus through an EBITDA sharing arrangement or a retained equity interest in the subsidiary entitling a dividend stream linked to profitability; and
– long-term incentive – equity-based Share Appreciation Rights Plan.
The remuneration framework for Subsidiary Executives has been disclosed in this report despite such Executives not meeting the definition of KMP.
For
per
sona
l use
onl
y

Directors’ Report
30 Enero Group Limited Annual Report 2015
4(a) Fixed remuneration Fixed remuneration consists of base remuneration (which is calculated on a total cost-to-Company basis and includes fringe benefits tax charges related to employee benefits), as well as employer contributions to superannuation and pension funds.
Remuneration levels are reviewed annually by the Remuneration and Nomination Committee through a process that considers the responsibility, performance and experience of the individual and the overall performance of the Group and ensures competitive market salaries are provided. An Executive’s remuneration may also be reviewed on promotion.
There are no guaranteed fixed remuneration increases included in any Executive contracts.
4(b) Performance-linked remuneration
Performance-linked remuneration includes both short-term incentives (STI) and long-term incentives (LTI) and is designed to reward KMPs, Executives, subsidiary Executives and key leadership for meeting or exceeding financial, strategic and personal targets.
The Remuneration Committee has changed the STI for the CEO and Company Executives with effect from 1 July 2015. The purpose of this change was to further align Executives with the creation of shareholder value through driving top-line revenue growth along with Operating EBITDA margin improvements.
Short-term incentives (STI):
The purpose of STI is to motivate and reward Executives for contributing to the delivery of annual business performance as assessed against financial and non-financial measures.
Participant Performance measures and rationale CEO For the year ended 30 June 2015, the STI for the CEO is a maximum short-term
incentive payment of $200,000 per annum subject to achievement of annual growth in earnings per share (EPS) of the Company and non-financial performance of the Group. Non-financial performance metric relates to KPIs set against strategic initiatives and other operating metrics. For the year ended 30 June 2016, the STI for the CEO is an annual cash-based maximum short-term incentive payment of 70% of the CEO’s fixed remuneration determined by the achievement of revenue and Operating EBITDA hurdles set by the Remuneration Committee.
Company Executives For the year ended 30 June 2015, the STI for Company Executives is an annual discretionary “at risk” bonus to reward Executives for meeting financial and non-financial objectives. For the year ended 30 June 2016, the STI for Company Executives is an annual cash-based maximum short-term incentive payment of 70% of the Executive’s fixed remuneration determined by the achievement of revenue and Operating EBITDA hurdles set by the Remuneration Committee.
Subsidiary Executives The STI for Subsidiary Executives is linked to the financial performance and direct profitability of their relevant subsidiary. For each subsidiary of the Company (or group of Subsidiaries known as an Operating Business Unit) the STI has either one of the following structures: – an EBITDA sharing arrangement such that the CEO and key senior leadership of
that subsidiary are entitled to a share of EBITDA agreed by the Remuneration and Nomination Committee each year. A component of the share of EBITDA is also subject to the achievement of pre-determined KPIs for both the individual and Operating Brand. This incentive is paid annually in cash at the end of the financial year; or
– a direct equity interest in the subsidiary, retained or earned over a vesting period, entitling the holder to a dividend stream linked to financial performance of that subsidiary.
The STIs (excluding dividends from direct equity interests in subsidiaries) are paid in cash following the end of the financial year and approval from the Remuneration Committee.
The Remuneration Committee has the discretion to take into account any significant non-cash items in determining whether the financial KPIs have been achieved, where it is considered appropriate for linking remuneration reward to Company performance.
The discretionary capped bonuses in the current financial year are detailed on page 34.
For
per
sona
l use
onl
y

31
Long-term incentives (LTI):
The purpose of the LTI is to align Executive remuneration with long-term shareholder value and the performance of the Group. The LTI is provided as an equity-based incentive in the Company under the terms of the Share Appreciation Rights Plan (SAR) (see Note 28).
Description The SAR plan grants rights to shares in the Company on the achievement of
appreciation in the Company’s share price over the vesting period.
Enero’s Board may determine whether or not the grant of rights is conditional on the achievement of performance hurdles (including service conditions), and if so the nature of those hurdles.
No dividends or voting rights are attached to the SAR. Eligibility The plan allows for the Board to determine who is entitled to participate in the SAR
and it may grant rights accordingly.
Performance period The performance period for the LTI is generally three years.
Rights The exercise of each right will entitle the rights holder to receive a fraction of an ordinary share based on a conversion formula of E = (A – B)/A, where:
– E is the share right entitlement;
– A is the volume weighted average price (VWAP) for the Company’s shares for the 20 business days prior to the vesting date of the rights; and
– B is the VWAP for the Company’s shares for the 20 business days before the rights were granted.
If A – B is less than or equal to zero, the share right will not vest and will immediately lapse on the applicable vesting date. Rights expire at 15 business days after the relevant vesting date or the termination of the individual’s employment.
Other conditions One share right shall never convert into more than one share in the capital of the Company.
The Board may exercise discretion on early vesting of rights in the event of a change of control of the Group.
Refer to the below table for a summary of SARs on issue.
Refer to Section 8 Share-based payments of the Remuneration Report for further information regarding the SARs. Summary of Share Appreciation Rights on issue:
Issue Date 16 January 2012 15 October 2013 16 June 2015 (i)
SARs issued 888,889 11,150,000 1,000,000
Participants CEO
CEO and senior Executives
CEO
VWAP for the 20 business days prior to the grant (B)
53 cents 71 cents n/a
Vesting dates: 20 business days after the release of the Group financial report for the year ended: Tranche 1 Tranche 2 Tranche 3
30 June 2013 – 2/9ths
30 June 2014 – 3/9ths
30 June 2015 – 4/9ths
30 June 2014 – 1/3rd 30 June 2015 – 1/3rd 30 June 2016 – 1/3rd
30 June 2016 – 1/3rd 30 June 2017 – 1/3rd 30 June 2018 – 1/3rd
Expiry 30 September 2015 30 September 2016 30 September 2018
Outstanding SARs as at 30 June 2015 395,062 4,499,993 1,000,000
(i) Grant is in relation to SARs provided to the CEO which were issued on 16 June 2015, subject to shareholder approval. Upon shareholder approval, the VWAP for the 20 business days prior to the grant date will be confirmed.
For
per
sona
l use
onl
y

Directors’ Report
32 Enero Group Limited Annual Report 2015
5 Executive service agreements It is the Group’s policy that service contracts for key management personnel are in force either for a fixed period, with an extension period negotiable after completion of the initial term, or on a rolling basis. The agreements are capable of termination, acknowledging appropriate notice periods, and the Group retains the right to terminate the contract immediately for contractual breach by the Executive or by making payment in lieu of notice.
The service agreements outline the components of remuneration paid to the key management personnel. Remuneration levels are reviewed annually by the Remuneration and Nomination Committee or in accordance with the terms of the service agreements.
Summary terms for current service agreements for key management personnel:
Key management personnel Duration of contract
(v)
Notice period on termination by
Group
Notice period on resignation by key management
personnel
Termination payment on termination by
Group (i) (ii) (iii) (iv)
Termination payment on resignation by key
management personnel (i) (ii) (iv)
CEO 30 June 2019 6 months 6 months 6 months base salary 6 months base salary
Group Finance Director
Rolling 6 months 3 months 6 months base salary 3 months base salary
Group Strategy and Operations Director
Rolling 3 months 3 months 3 months base salary 3 months base salary
Group Human Resource Director
Rolling 3 months 3 months 3 months base salary 3 months base salary
(i) In addition to termination payments, key management personnel are also entitled to receive, on termination of their employment, their statutory entitlements of accrued annual and long service leave, together with any superannuation benefits.
(ii) Includes any payment in lieu of notice.
(iii) No termination payment is due if termination is for serious misconduct.
(iv) Executives are entitled to a pro-rata STI payment on termination, except for termination for serious misconduct.
(v) On 16 June 2015, the CEO extended his Executive service agreement for a further four years.
Remuneration details of Executives are set out in Section 7 Directors’ and Executive officers’ remuneration. 6 Non-Executive Directors The Company’s Constitution provides that the Non-Executive Directors are each entitled to be paid such remuneration from the Company as the Directors decide for their services as Director, but the total amount provided to all Non-Executive Directors for their services must not exceed in aggregate in any financial year the amount fixed by the Company in a general meeting. This amount has been fixed by the Company at $750,000 for the financial year ended 30 June 2015.
The remuneration of Non-Executive Directors does not include any performance-based pay and they do not participate in any equity-based incentive plans. Directors may be reimbursed for travelling and other expenses incurred in attending to the Company’s affairs. Directors may be paid such additional or special remuneration as the Directors decide is appropriate where a Director performs extra services or makes special exertions for the benefit of the Company. Non-Executive Director base and committee fees were changed with effect from 1 April 2015. The following Non-Executive Director fees (inclusive of superannuation) have been applied in the years ended 30 June 2015 and 30 June 2014:
2015
$ 2014
SBase fees – annual Chairman 120,000 175,000Other Non-Executive Directors 75,000 136,875 Committee fees – annual
Audit and Risk Committee – Chairman 10,000 16,075Remuneration and Nomination Committee – Chairman 10,000 –
Additionally, the Deputy Chairman is paid a $10,000 annual fee for duties conducted under this role.
Remuneration details of Non-Executive Directors are set out in Section 7 Directors’ and Executive officers’ remuneration.
For
per
sona
l use
onl
y
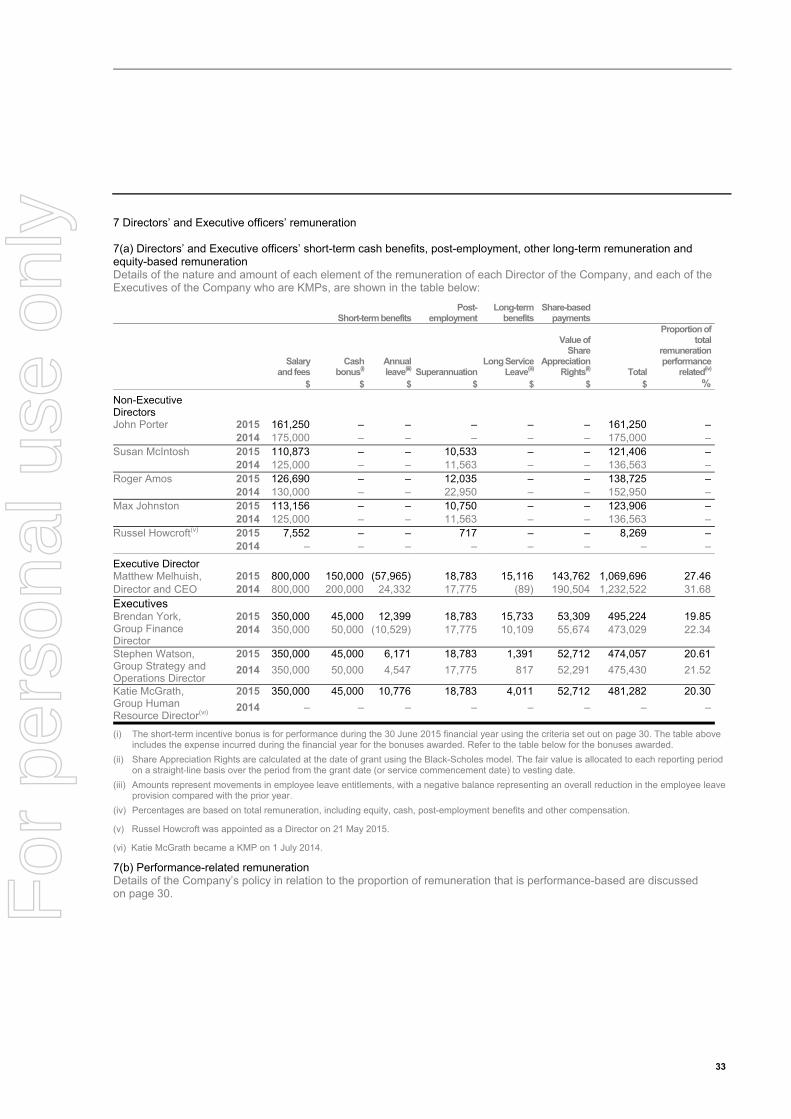
33
7 Directors’ and Executive officers’ remuneration 7(a) Directors’ and Executive officers’ short-term cash benefits, post-employment, other long-term remuneration and equity-based remuneration Details of the nature and amount of each element of the remuneration of each Director of the Company, and each of the Executives of the Company who are KMPs, are shown in the table below:
Short-term benefitsPost-
employmentLong-term
benefitsShare-based
payments
Salary
and fees Cash
bonus(i)Annual leave(iii) Superannuation
Long Service Leave(iii)
Value of Share
Appreciation Rights(ii) Total
Proportion of total
remuneration performance
related(iv)
$ $ $ $ $ $ $ %
Non-Executive Directors
John Porter 2015 161,250 – – – – – 161,250 – 2014 175,000 – – – – – 175,000 –Susan McIntosh 2015 110,873 – – 10,533 – – 121,406 – 2014 125,000 – – 11,563 – – 136,563 –Roger Amos 2015 126,690 – – 12,035 – – 138,725 – 2014 130,000 – – 22,950 – – 152,950 –Max Johnston 2015 113,156 – – 10,750 – – 123,906 – 2014 125,000 – – 11,563 – – 136,563 –Russel Howcroft(v) 2015 7,552 – – 717 – – 8,269 – 2014 – – – – – – – –
Executive Director
Matthew Melhuish, 2015 800,000 150,000 (57,965) 18,783 15,116 143,762 1,069,696 27.46Director and CEO 2014 800,000 200,000 24,332 17,775 (89) 190,504 1,232,522 31.68Executives Brendan York, Group Finance Director
2015 350,000 45,000 12,399 18,783 15,733 53,309 495,224 19.852014 350,000 50,000 (10,529) 17,775 10,109 55,674 473,029 22.34
Stephen Watson, Group Strategy and Operations Director
2015 350,000 45,000 6,171 18,783 1,391 52,712 474,057 20.61
2014 350,000 50,000 4,547 17,775 817 52,291 475,430 21.52
Katie McGrath, Group Human Resource Director(vi)
2015 350,000 45,000 10,776 18,783 4,011 52,712 481,282 20.30
2014 – – – – – – – –
(i) The short-term incentive bonus is for performance during the 30 June 2015 financial year using the criteria set out on page 30. The table above includes the expense incurred during the financial year for the bonuses awarded. Refer to the table below for the bonuses awarded.
(ii) Share Appreciation Rights are calculated at the date of grant using the Black-Scholes model. The fair value is allocated to each reporting period on a straight-line basis over the period from the grant date (or service commencement date) to vesting date.
(iii) Amounts represent movements in employee leave entitlements, with a negative balance representing an overall reduction in the employee leave provision compared with the prior year.
(iv) Percentages are based on total remuneration, including equity, cash, post-employment benefits and other compensation.
(v) Russel Howcroft was appointed as a Director on 21 May 2015.
(vi) Katie McGrath became a KMP on 1 July 2014.
7(b) Performance-related remuneration Details of the Company’s policy in relation to the proportion of remuneration that is performance-based are discussed on page 30. F
or p
erso
nal u
se o
nly

Directors’ Report
34 Enero Group Limited Annual Report 2015
7(c) STI included in remuneration Details of the vesting profile of the short-term incentive bonuses awarded as remuneration to each Executive of the Company and the Group, who was classified a key management personnel, are discussed below.
Short-term incentive bonus(i)
Metric
Included in remuneration
$
% vested in year
Company Executives Matthew Melhuish(ii) EPS target and Discretionary 150,000 100Brendan York Discretionary 45,000 100Stephen Watson Discretionary 45,000 100Katie McGrath Discretionary 45,000 100
(i) Amounts included in remuneration for the financial year represent the amount that vested in the financial year based on the achievement of satisfaction of specified performance criteria as discussed in Section 4(b) Short-term incentives and are approved following the completion of the reporting period audit.
(ii) Matthew Melhuish’s STI comprises of an EPS target achievement STI of $114,777 plus a discretionary component of $35,223.
No bonuses were forfeited during the year.
8 Share-based payments 8(a) Share-based payment arrangements granted as remuneration Details of SAR that were granted as compensation to each key management personnel during the reporting period and details of SAR that vested during the reporting period are as follows:
Type of right granted during
2015 (i)
Number of rights granted
during 2015 Grant date
Fair value per right at grant date
$
Exercise price
$ Expiry date
Number of rights vested during 2015
Directors Matthew Melhuish SAR 1,000,000 16 June 2015 0.16 – 0.29 n/a 30 Sept 2018 –
(i) Grant is in relation to SAR provided to the CEO which were issued on 16 June 2015, subject to shareholder approval. The last expiry date of the rights is 20 business days after the release of the Group’s financial report for the year ended 30 June 2018, which is estimated to be around 30 September 2018. The value per right is estimated as the grant has not been approved by shareholders.
8(b) Analysis of share-based payments granted as remuneration Details of the vesting profile of the rights granted as remuneration to a Director of the Company, and each of the KMPs, are shown below:
Number of
rights granted Type of right
granted Grant date% vested
in year% exercised
in year% remaining
to vest Vesting date(i)
Executive Director Matthew Melhuish 333,334 SAR 18 Aug 2011 45 45 – 30 Sep 2012
30 Sep 201330 Sep 2014
888,889 SAR 16 Jan 2012 33 33 45 30 Sep 201330 Sep 201430 Sep 2015
1,000,000 SAR 15 Oct 2013 33 33 67 30 Sep 201430 Sep 201530 Sep 2016
1,000,000 SAR 16 June 2015 – – 100 30 Sep 201630 Sep 201730 Sep 2018
Executives Brendan York 55,556 SAR 18 Aug 2011 45 45 – 30 Sep 2012
30 Sep 201330 Sep 2014
600,000 SAR 15 Oct 2013 33 33 67 30 Sep 201430 Sep 201530 Sep 2016
Stephen Watson 600,000 SAR 15 Oct 2013 33 33 67 30 Sep 201430 Sep 201530 Sep 2016
Katie McGrath 600,000 SAR 15 Oct 2013 33 33 67 30 Sep 201430 Sep 201530 Sep 2016
(i) The dates reflected in the table above represent all of the vesting dates for each tranche of rights. The vesting date of the SAR is 20 business days after the release of the Group’s preliminary financial report for the relevant financial year. This is estimated to be around 30 September each year.
For
per
sona
l use
onl
y

35
8(c) Analysis of movements in rights and value of rights exercise The movement during the reporting period in the number of rights over ordinary shares in Enero Group Limited held, directly, indirectly or beneficially, by each KMP, including their related entities, and value of rights exercised during the year is as follows:
Granted held at
1 July 2014
Granted as remuneration
in year Cancelled Exercised
Granted held at
30 June 2015 Vested during
the year
Vested and exercisable at 30 June 2015
Value of rights exercised
during the year $
Director Matthew Melhuish 1,839,507 1,000,000 – (777,778) 2,061,729 (777,778) – 205,333 Executives Brendan York 624,691 – – (224,691) 400,000 (224,691) – 41,333Stephen Watson 600,000 – – (200,000) 400,000 (200,000) – 32,000Katie McGrath(i) 600,000 – – (200,000) 400,000 (200,000) – 32,000
(i) Katie McGrath became a KMP on 1 July 2014. The above balance represents SAR granted prior to becoming a KMP. No share-based payments held by KMP expired during the year.
No share-based payments held by KMP are vested but not exercisable at 30 June 2015.
No share-based payments were held by KMP related parties.
No terms of equity-settled share-based payment transactions (including rights granted as compensation to key management personnel) have been altered or modified by the issuing entity during the reporting period or the prior period. 9 Directors’ and Executive officers’ holdings of shares The movement during the reporting period in the number of ordinary shares in Enero Group Limited, held directly, indirectly or beneficially, by each KMP, including their related parties, is as follows:
Held at
1 July 2014 PurchasesIssued as
remuneration
Received on exercise
of right Sales Held at
30 June 2015Directors John Porter 270,833 – – – – 270,833Matthew Melhuish 737,242 – – 354,267 – 1,091,509Susan McIntosh 122,223 – – – – 122,223Roger Amos 7,556 – – – – 7,556Max Johnston 77,778 – – – – 77,778Russel Howcroft(i) – – – – – – Executives Brendan York 119 – – 87,687 – 87,806Stephen Watson – – – 76,522 – 76,522Katie McGrath(ii) – – – 76,522 – 76,522
(i) Russel Howcroft was appointed as a Director on 21 May 2015. The above balance represents shares held at that time.
(ii) Katie McGrath became a KMP on 1 July 2014. The above balance represents shares held at that time.
10 Loans to Key Management Personnel No loans were outstanding at the reporting date to key management personnel and their related parties.
For
per
sona
l use
onl
y

Directors’ Report
36 Enero Group Limited Annual Report 2015
11 Remuneration and Group performance The Remuneration and Nomination Committee has given consideration to the Group’s performance and consequences on shareholder wealth in the current financial year and the four previous financial years. The Remuneration and Nomination Committee has given minimal weighting to the years ended 30 June 2011 and 30 June 2012 given the significant operational restructure which took place including significant divestments of operations along with the change in capital structure following the completion of the divestment program, and therefore has not disclosed these financial years as they provide no meaningful information to determine remuneration structures. Financial performance from operations of the current and last two financial years is indicated in the following table:
30 June 2015 30 June 2014 30 June 2013Metric Net Revenue ($’000) 110,347 119,493 127,315Operating EBITDA ($’000) 9,202 8,972 3,619Operating EBITDA margin (%) 8.34% 7.51% 2.84% Opening share price (1 July) ($) 1.08 0.36 0.51Closing share price (30 June) ($) 0.78 1.07 0.34
The Remuneration and Nomination Committee has determined appropriate remuneration structures which align remuneration of KMPs with future shareholder wealth.
The Remuneration and Nomination Committee considers the achievement of financial targets as well as non-financial measures in setting the short-term incentives. In the financial year to 30 June 2015, an emphasis has been placed by the Remuneration and Nomination Committee on the achievement of outcomes aligned with the strategic direction of the Group. Longer-term profitability, changes in share price and return of capital are factors the Remuneration and Nomination Committee takes into account in assessing the LTI as demonstrated by the implementation of the SAR which aligns remuneration with future share price performance and reward for increases in the share price.
The Remuneration and Nomination Committee has reviewed both the financial performance in the current financial year as well as the achievement of stated strategic objectives which took place during the financial year. The Remuneration and Nomination Committee believes the achievement of improved earnings, Operating EBITDA margin and a stronger network across the Operating Brands are aligned with the achievement of future shareholder wealth.
Lead Auditor’s independence declaration The lead Auditor’s independence declaration is set out on page 75, and forms part of the Directors’ Report for the year ended 30 June 2015.
This report is made in accordance with a resolution of the Directors.
Dated at Sydney this 25th day of August 2015.
John Porter
Chairman
For
per
sona
l use
onl
y

Consolidated income statement for the year ended 30 June 2015
37
In thousands of AUD Note 2015 2014
Gross revenue 3 212,332 212,623
Directly attributable costs of sales 3 (101,985) (93,130)
Net revenue 3 110,347 119,493
Other income 206 378
Employee expenses (81,070) (89,995)
Occupancy costs (8,345) (8,622)
Travel expenses (2,034) (2,530)
Communication expenses (2,184) (2,285)
Compliance expenses (2,114) (2,357)
Depreciation and amortisation expenses (4,225) (4,791)
Administration expenses (7,271) (6,827)
Commercial settlement – (1,150)
Loss on disposal of subsidiaries (2,644) (68)
Net finance income/(costs) 4 65 (44)
Profit before income tax 731 1,202
Income tax expense 5 (2,346) (2,655)
Loss for the year (1,615) (1,453)
Attributable to:
Equity holders of the parent (2,787) (2,912)
Non-controlling interests 1,172 1,459
(1,615) (1,453)
Basic earnings per share (AUD cents) 15 (3.4) (3.6)
Diluted earnings per share (AUD cents) 15 (3.4) (3.8)
The notes on pages 42 to 71 are an integral part of these consolidated financial statements.
For
per
sona
l use
onl
y

Consolidated statement of comprehensive income for the year ended 30 June 2015
38 Enero Group Limited Annual Report 2015
In thousands of AUD Note 2015 2014Loss for the year (1,615) (1,453)
Other comprehensive income
Items that are or may be reclassified subsequently to profit or loss:
Foreign currency translation differences for foreign operations 11,206 5,298
Reclassification of foreign currency differences on disposal of subsidiaries 2,585 –
Total items that are or may be reclassified subsequently to profit or loss 13,791 5,298
Other comprehensive income for the year, net of tax 13,791 5,298
Total comprehensive income for the year 12,176 3,845
Attributable to:
Equity holders of the parent 10,671 2,430
Non-controlling interests 1,505 1,415
12,176 3,845
The notes on pages 42 to 71 are an integral part of these consolidated financial statements.
For
per
sona
l use
onl
y

Consolidated statement of changes of equity as at 30 June 2015
39
Attributable to owners of the Company
In thousands of AUD Note Share capital
Accumulated losses
Option reserve
Reserve change in
ownership interest in
subsidiary
Foreign currency
translation reserve Total
Non- controlling
interestsTotal
equity
Opening balance at 1 July 2013 489,792 (377,916) 13,862 (883) (27,135) 97,720 1,418 99,138
Profit/(loss) for the year – (2,912) – – – (2,912) 1,459 (1,453)Other comprehensive income for the year net of tax – – – – 5,342 5,342 (44) 5,298
Total comprehensive income for the year
– (2,912) – – 5,342 2,430 1,415 3,845
Transactions with owners recorded directly in equity:
Shares issued as part of business combinations 14 38 – – – – 38 – 38
Dividends paid to equity holders – – – – – – (969) (969)
Share-based payment expense – – 1,453 – – 1,453 – 1,453Changes in ownership interests in subsidiaries Disposal of non-controlling interests without a change in control – – – (234) – (234) 234 –Shares issued to non-controlling interests in controlled entities – – (96) – – (96) 96 –
Closing balance at 30 June 2014 489,830 (380,828) 15,219 (1,117) (21,793) 101,311 2,194 103,505
Opening balance at 1 July 2014 489,830 (380,828) 15,219 (1,117) (21,793) 101,311 2,194 103,505
Profit/(loss) for the year – (2,787) – – – (2,787) 1,172 (1,615)Other comprehensive income for the year net of tax – – – – 13,458 13,458 333 13,791
Total comprehensive income for the year
– (2,787) – – 13,458 10,671 1,505 12,176
Transactions with owners recorded directly in equity:
Shares issued to employees on exercise of Share Appreciation Rights 14 1,679 – (1,679) – – – – –
Dividends paid to equity holders – – – – – – (1,284) (1,284)
Share-based payment expense – – 1,121 – – 1,121 – 1,121Changes in ownership interests in subsidiaries Disposal of non-controlling interests without a change in control – – – (300) – (300) 300 –Shares issued to non-controlling interests in controlled entities – – (109) – – (109) 109 –
Closing balance at 30 June 2015 491,509 (383,615) 14,552 (1,417) (8,335) 112,694 2,824 115,518
The notes on pages 42 to 71 are an integral part of these consolidated financial statements.
For
per
sona
l use
onl
y

Consolidated statement of financial position as at 30 June 2015
40 Enero Group Limited Annual Report 2015
In thousands of AUD Note 2015 2014
Assets
Cash and cash equivalents 6 25,812 22,513
Trade and other receivables 7 27,852 26,542
Other assets 8 4,335 4,905
Income tax receivable 5 273 263
Total current assets 58,272 54,223
Receivables 7 21 50
Deferred tax assets 5 1,887 2,546
Plant and equipment 9 7,034 7,240
Other assets 8 427 750
Intangible assets 10 84,545 76,697
Total non-current assets 93,914 87,283
Total assets 2 152,186 141,506
Liabilities
Trade and other payables 11 31,561 30,467
Interest-bearing loans and borrowings 16 27 1,658
Employee benefits 12 2,356 2,826
Income tax payable 5 748 713
Provisions 13 220 633
Total current liabilities 34,912 36,297
Interest-bearing loans and borrowings 16 – 24
Employee benefits 12 480 522
Provisions 13 1,276 1,158
Total non-current liabilities 1,756 1,704
Total liabilities 2 36,668 38,001
Net assets 115,518 103,505
Equity
Issued capital 14 491,509 489,830
Reserves 4,800 (7,691)
Accumulated losses (383,615) (380,828)
Total equity attributable to equity holders of the parent 112,694 101,311
Non-controlling interests 2,824 2,194
Total equity 115,518 103,505
The notes on pages 42 to 71 are an integral part of these consolidated financial statements.
For
per
sona
l use
onl
y

Consolidated statement of cash flows for the year ended 30 June 2015
41
In thousands of AUD Note 2015 2014
Cash flows from operating activities
Cash receipts from customers 236,667 240,131
Cash paid to suppliers and employees (228,043) (230,577)
Cash generated from operations 8,624 9,554
Interest received 237 261
Income taxes paid (1,696) (1,782)
Interest paid (172) (305)
Cash paid for commercial settlement – (1,150)
Net cash from operating activities 6 6,993 6,578
Cash flows from investing activities
Proceeds from disposal of non-current assets 10 80
Payments of deferred consideration – (66)
Acquisition of plant and equipment (2,635) (1,903)
Net cash used in investing activities (2,625) (1,889)
Cash flows from financing activities
Finance lease payments (1,726) (924)
Dividends paid to non-controlling interests in controlled entities (1,284) (969)
Net cash used in financing activities (3,010) (1,893)
Net increase in cash and cash equivalents 1,358 2,796
Effect of exchange rate fluctuations on cash held 1,941 291
Cash and cash equivalents at 1 July 22,513 19,426
Cash and cash equivalents at 30 June 6 25,812 22,513
The notes on pages 42 to 71 are an integral part of these consolidated financial statements.
For
per
sona
l use
onl
y

Notes to the consolidated financial statements for the year ended 30 June 2015
42 Enero Group Limited Annual Report 2015
Page
Basis of preparation
1. Basis of preparation 43
Key numbers
2. Operating segments 45
3. Revenue 47
4. Net finance income/(costs) 47
5. Income tax expense and deferred tax 48
6. Cash and cash equivalents 50
7. Trade and other receivables 51
8. Other assets 51
9. Plant and equipment 52
10. Intangible assets 53
11. Trade and other payables 55
12. Employee benefits 55
13. Provisions 56
Capital
14. Capital and reserves 57
15. Earnings/(loss) per share 58
16. Loans and borrowings 58
Risk
17. Financial risk management/financial instruments 60
18. Impairment of non-financial assets 64
Group structure
19. Controlled entities 65
20. Parent entity disclosures 67
21. Deed of Cross Guarantee 67
Unrecognised items
22. Commitments 68
23. Deferred consideration payables 68
24. Contingencies 68
25. Subsequent events 68
Other items
26. Key Management Personnel and other related party disclosures 68
27. Share-based payments 69
28. Auditor’s remuneration 71
For
per
sona
l use
onl
y

43
1. Basis of preparation
In preparing these financial statements, the format and layout of the notes has been changed to make the financial statements less complex and more relevant to readers. The notes have been grouped into sections under certain key headings. Each section sets out the accounting policies applied together with any key judgements and estimates used.
(a) Reporting entity Enero Group Limited (the Company) is a for-profit Company domiciled in Australia. The consolidated financial statements of the Company as at and for the year ended 30 June 2015 comprise the Company and its subsidiaries (together referred to as the “Group”).
The financial statements for the year ended 30 June 2015 were authorised for issue in accordance with a resolution of the Directors on 25 August 2015.
(b) Statement of compliance The consolidated financial statements are a general purpose financial report which has been prepared in accordance with Australian Accounting Standards (“AASBs”) (including Australian Interpretations) adopted by the Australian Accounting Standards Board (“AASB”) and the Corporations Act 2001. The consolidated financial statements comply with International Financial Reporting Standards (IFRS) and interpretations adopted by the International Accounting Standards Board (IASB).
(c) Basis of preparation (i) Basis of measurement The consolidated financial statements are prepared on the historical cost basis except for the items as described in Note 1(c)(iv).
The Company is of a kind referred to in ASIC Class Order 98/100 dated 10 July 1998 and, in accordance with that Class Order, amounts in the consolidated financial statements and Directors’ Report have been rounded off to the nearest thousand dollars, unless otherwise stated.
(ii) Going concern The consolidated financial statements have been prepared on a going concern basis which assumes the Group will continue its operations and be able to meet its obligations as and when they become due and payable. This assumption is based on an analysis of the Group’s ability to meet its future cash flow requirements using its projected cash flows from operations and existing cash reserves held on the balance sheet date.
(iii) Use of estimates and judgements The preparation of financial statements in conformity with AASBs requires management to make judgements, estimates and assumptions that affect the application of policies and reported amounts of assets and liabilities, income and expenses. Actual results may differ from these estimates. The estimates and associated assumptions are based on historical experience and various other factors that are believed to be reasonable under the circumstances, the results of which form the basis of making the judgements about carrying values of assets and liabilities that are not readily apparent from other sources.
The estimates and underlying assumptions are reviewed on an ongoing basis. Revisions to accounting estimates are recognised in the period in which the estimate is revised and in any future periods if affected.
Further information about critical accounting estimates and judgements made is included in the following notes:
3. Revenue
5. Income tax expense and deferred tax
17. Financial risk management/financial instruments (Trade receivables)
18. Impairment of non-financial assets
23. Deferred consideration
27. Share-based payments
(iv) Measurement of fair value A number of the Group’s accounting policies and disclosures require the measurement of fair values, for both financial and non-financial assets and liabilities.
When measuring the fair value of an asset or liability, the Group uses market observable data as far as possible. Fair values are categorised into different levels in a fair value hierarchy based on the inputs used in the valuation techniques as follows:
Level 1: quoted prices (unadjusted) in active markets for identical assets or liabilities;
Level 2: inputs other than quoted prices included in Level 1 that are observable for the asset or liability, either directly (i.e. as prices) or indirectly (i.e. derived from prices); and
Level 3: inputs for the asset or liability that are not based on observable market data (unobservable inputs).
If the inputs used to measure the fair value of an asset or a liability might be categorised in different levels of the fair value hierarchy, then the fair value measurement is categorised in its entirety in the same level of the fair value hierarchy as the lowest level of input that is significant to the entire measurement.
The Group recognises transfers between levels of the fair value hierarchy at the end of the reporting period during which the change has occurred.
Further information about the assumptions made in measuring fair values is included in the following notes:
10. Intangible assets
23. Deferred consideration
27. Share-based payments
(v) New standard early adopted AASB 2015-2 Amendments to AASB 101 Presentation of Financial Statements, which applies to annual reporting periods commencing on or after 1 January 2016, has been early adopted for the preparation of the 2015 financial statements and notes. This standard removed certain minimum disclosure requirements from AASB 101 including the removal of reference to a “summary of significant accounting policies”, allowing re-organisation and grouping of notes to the financial statements giving prominence to the areas most relevant to understanding the organisation and encouraging companies to no longer disclose information that is not material.
For
per
sona
l use
onl
y

Notes to the consolidated financial statements for the year ended 30 June 2015
44 Enero Group Limited Annual Report 2015
1. Basis of preparation (continued)
(d) Foreign currency (i) Functional and presentation currency The consolidated financial statements are presented in Australian dollars, which is the Company’s functional currency.
(ii) Foreign currency transactions Transactions in foreign currencies are translated to the respective functional currencies of Group at the foreign exchange rates ruling at the dates of the transactions. Monetary assets and liabilities denominated in foreign currencies at the reporting date are translated to the respective functional currencies of the Group at the foreign exchange rate ruling at that date. Foreign exchange differences arising on retranslation are recognised in the income statement. Non-monetary assets and liabilities that are measured in terms of historical cost in a foreign currency are translated using the exchange rate at the date of the transaction. Non-monetary assets and liabilities denominated in foreign currencies that are stated at fair value are translated to the functional currency at foreign exchange rates ruling at the dates the fair value was determined.
(iii) Foreign operations The assets and liabilities of foreign operations, including goodwill and fair value adjustments arising on consolidation, are translated to Australian dollars at foreign exchange rates prevailing at the reporting date. The income and expenses of foreign operations are translated to Australian dollars at rates approximating the foreign exchange rates ruling at the dates of the transactions.
Foreign currency differences are recognised in other comprehensive income, and presented in the foreign currency translation reserve (FCTR) in equity. When a foreign operation is disposed of, in part or in full, the relevant amount in the FCTR is transferred to the income statement as part of the profit or loss on disposal.
Foreign exchange gains and losses arising from a monetary item receivable from or payable to a foreign operation, the settlement of which is neither planned nor likely in the foreseeable future, are considered to form part of a net investment in a foreign operation and are recognised in other comprehensive income, and are presented within equity in the FCTR.
(e) Goods and services tax (GST) Revenue, expenses and assets are recognised net of the amount of GST, unless GST incurred is not recoverable from the taxation authority. In this case it is recognised as part of the cost of acquisition of the asset or as part of the expense.
Receivables and payables are stated with the amount of GST included. The net amount of GST recoverable from, or payable to, the taxation authority is included as a current asset or liability in the statement of financial position.
Cash flows are presented on a gross basis. The GST components of cash flows arising from investing or financing activities, which are recoverable from or payable to the taxation authority, are presented as operating cash flows.
(f) Changes in accounting policies The accounting policies provided throughout the Notes 1 to 28 of this report have been applied consistently to all periods presented in the consolidated financial statements. (g) New standards and interpretations not yet adopted A number of new standards, amendments to standards and interpretations are effective for annual periods beginning after 1 July 2015, and have not been applied in preparing these consolidated financial statements. None of these are expected to have a significant effect on the Group’s financial statements, except for:
AASB 9 Financial Instruments, which becomes mandatory for the Group’s 2018 consolidated financial statements; and
AASB 15 Revenue from Contracts with customers, which becomes mandatory for the Group’s 2018 consolidated financial statements.
The Group does not plan to early adopt the above named standards and the extent of the impact of these standards has not yet been determined. (h) The notes to the financial statements The notes include information which is required to understand the financial statements and is material and relevant to the operations, financial position and performance of the Group. Information is considered material and relevant if, for example: the amount in question is significant because of its
size or nature;
it is important for understanding the results of the Group;
it helps to explain the impact of significant changes in the Group’s business – for example, acquisitions and impairment write-downs; or
it relates to an aspect of the Group’s operations that is important to its future performance.
The notes are organised into the following sections: Key numbers: provides a breakdown of individual
line items in the financial statements that the Directors consider most relevant and summarises the accounting policies, judgements and estimates relevant to understanding these line items;
Capital: provides information about the capital management practices of the Group and shareholder returns for the year;
Risk: discusses the Group’s exposure to various financial risks, explains how these affect the Group’s financial position and performance and what the Group does to manage these risks;
Group structure: explains aspects of the Group structure and changes during the year;
Unrecognised items: provides information about items that are not recognised in the financial statements but could potentially have a significant impact on the Group’s financial position and performance; and
Other items: provides information on items which require disclosure to comply with Australian Accounting Standards and other regulatory pronouncements, however are not considered critical in understanding the financial performance or position of the Group.
For
per
sona
l use
onl
y

45
2. Operating segments
The Group had one operating segment (Operating Brands) based on internal reporting regularly reviewed by the Chief Executive Officer (CEO), who is the Group’s chief operating decision maker (CODM).
The operating segment is defined based on the manner in which service is provided in the geographies operated in, and it correlates to the way in which results are reported to the CEO on a monthly basis. Revenues are derived from marketing services.
The Operating Brands segment includes International and Australian specialised marketing services including public relations, communications planning, strategy, research and data analytics, advertising, direct marketing and stakeholder communications.
The measure of reporting to the CEO is on an Operating EBITDA basis (defined below), which excludes significant and non-operating items which are separately presented because of their nature, size and expected infrequent occurrence and does not reflect the underlying trading of the operations.
In relation to segment reporting, the following definitions apply to operating segments:
Operating EBITDA: earnings before interest, taxes, depreciation, amortisation, loss on disposal of subsidiaries, impairment, commercial settlement and restructure costs.
2015 In thousands of AUD
Operating Brands
Total segment Unallocated Eliminations Consolidated
Gross revenue 212,332 212,332 _ _ 212,332
Directly attributable cost of sales (101,985) (101,985) _ _ (101,985)
Net revenue 110,347 110,347 _ _ 110,347
Other income 206 206 _ _ 206
Operating expenses (94,881) (94,881) (6,470) _ (101,351)
Operating EBITDA 15,672 15,672 (6,470) _ 9,202
Restructure costs (1,667) (1,667) _ _ (1,667)
Loss on disposal of subsidiaries (2,644)
Depreciation and amortisation expenses (4,225)
Net finance income 65
Income tax expense (2,346)
Loss for the period (1,615)
Goodwill 84,430 84,430 _ _ 84,430
Other intangibles 115 115 _ _ 115
Assets excluding intangibles 56,595 56,595 32,769 (21,723) 67,641
Total assets 141,140 141,140 32,769 (21,723) 152,186
Liabilities 34,569 34,569 23,822 (21,723) 36,668
Total liabilities 34,569 34,569 23,822 (21,723) 36,668
Amortisation of intangibles 875 875 _ _ 875
Depreciation 2,853 2,853 497 _ 3,350
Capital expenditure 2,343 2,343 292 _ 2,635
* All segments are continuing operations.
Geographical segments The operating segments are managed on a worldwide basis. However, there are three geographic areas of operation.
Geographical information 2015 2014
In thousands of AUD Net revenues Non-current
assets Net revenues Non-current assets Australasia 53,392 4,592 60,296 6,235
UK and Europe 44,416 3,217 44,427 3,125
USA 12,539 1,560 14,770 1,226
Unallocated intangibles(i) _ 84,545 _ 76,697
Total 110,347 93,914 119,493 87,283
(i) Goodwill and other intangibles are allocated to the Operating Brands segment. However, as the Operating Brands are managed at a global level they cannot be allocated across geographical segments.
For
per
sona
l use
onl
y

Notes to the consolidated financial statements for the year ended 30 June 2015
46 Enero Group Limited Annual Report 2015
2. Operating segments (continued)
2014 In thousands of AUD
Operating Brands
Total segment Unallocated Eliminations Consolidated
Gross revenue 212,623 212,623 _ _ 212,623
Directly attributable cost of sales (93,130) (93,130) _ _ (93,130)
Net revenue 119,493 119,493 _ _ 119,493
Other income 378 378 _ _ 378
Operating expenses (103,965) (103,965) (6,934) _ (110,899)
Operating EBITDA 15,906 15,906 (6,934) _ 8,972
Restructure costs (1,717) (1,717) _ _ (1,717)
Commercial settlement (1,150)
Loss on disposal of subsidiaries (68)
Depreciation and amortisation expenses (4,791)
Net finance costs (44)
Income tax expense (2,655)
Loss for the period (1,453)
Goodwill 75,707 75,707 _ _ 75,707
Other intangibles 990 990 _ _ 990
Assets excluding intangibles 51,974 51,974 18,082 (5,247) 64,809
Total assets 128,671 128,671 18,082 (5,247) 141,506
Liabilities 33,415 33,415 9,833 (5,247) 38,001
Total liabilities 33,415 33,415 9,833 (5,247) 38,001
Amortisation of intangibles 1,532 1,532 _ _ 1,532
Depreciation 2,939 2,939 320 _ 3,259
Capital expenditure 1,676 1,676 227 _ 1,903
Major Customer Net revenue from one customer of the Group’s Operating Brands segment represented approximately 10.7% (2014: 9.3%) of the Group’s total Net Revenue.
Accounting policy The Group determines and presents segments based on the information that is provided internally to the Chief Executive Officer (CEO), who is the Group’s chief operating decision maker (CODM).
An operating segment is a component of the Group that engages in business activities from which it may earn revenues and incur expenses, including revenues and expenses that relate to transactions with any of the Group’s other components. All operating segments’ operating results are regularly reviewed by the Group’s CEO to make decisions about resources to be allocated to the segment and assess its performance, and for which discrete financial information is available.
Segment results that are reported to the CEO include items directly attributable to a segment, as well as those that can be allocated on a reasonable basis.
Unallocated items comprise corporate overheads: costs associated with the centralised management and governance of Enero Group Limited, such as interest-bearing loans, costs of borrowings and related expenses, and corporate head office assets and expenses.
Segment capital expenditure is the total cost incurred during the period to acquire assets that are expected to be used for more than one period.
For
per
sona
l use
onl
y

47
3. Revenue
In thousands of AUD 2015 2014Gross revenue from the rendering of services 212,332 212,623Directly attributable cost of sales (101,985) (93,130)
Net revenue 110,347 119,493
Accounting policy The Group recognises revenue when the amount of revenue can be reliably measured, it is probable that future economic benefits will flow to the entity and specific criteria have been met for each of the Group’s activities as described below.
Revenue from services rendered is recognised in the income statement in proportion to the stage of completion of the transaction at the reporting date. The stage of completion is determined by reference to outputs and deliverables in connection with the completion of the service.
Gross revenue represents billings to clients, inclusive of directly attributable costs of sales, relating to Group subsidiaries where a principal relationship exists between the subsidiary and its client. Where the Group subsidiaries act as an agent, the amount included as revenue is recognised net of amounts collected/paid on behalf of clients.
Net revenue is the amount that flows to the Group net of directly attributable cost of sales. Directly attributable cost of sales includes any project-related costs and rechargeable disbursements.
(i) Advertising and production revenue Advertising and production revenue is recognised net of directly attributable cost of sales.
(ii) Retainer fee Retainer fee for services rendered is recognised over the term of the contract on a straight-line basis, unless there is some other method that better represents the stage of completion.
Key estimates Stage of completion estimates are determined by reference to the relative value of services completed in comparison to the total expected services to be completed in any specific project. The estimates require judgements and assumptions of the stage of completion of the service using information of the time and costs incurred to date as a percentage of the forecasted total time and costs. Actual results may differ from estimates as at the reporting date.
4. Net finance income/(costs)
In thousands of AUD 2015 2014Net finance income/(costs) Interest and finance costs (90) (147)Finance lease interest (82) (158)Interest income 237 261
Net finance income/(costs) 65 (44)
Foreign exchange losses of $28,000 (2014: $118,000) have been recognised in the consolidated income statement and have been included in administration expenses.
Accounting policy (i) Interest income Interest income is recognised as it accrues to the related financial asset using the effective interest method.
(ii) Finance costs Finance costs are recognised in the income statement using the effective interest method. They include interest on bank overdraft, amortisation of ancillary costs incurred in connection with financing arrangements and finance lease interest.
For
per
sona
l use
onl
y

Notes to the consolidated financial statements for the year ended 30 June 2015
48 Enero Group Limited Annual Report 2015
5. Income tax expense and deferred tax
Income tax expense
Recognised in the income statement
In thousands of AUD 2015 2014Current tax expense Current year 1,793 2,416Adjustments for prior years (168) (211) 1,625 2,205Deferred tax expense Origination and reversal of temporary differences 721 450 721 450Income tax expense in income statement 2,346 2,655
Numerical reconciliation between tax expense and pre-tax accounting loss Loss for the year (1,615) (1,453)Income tax expense 2,346 2,655Profit excluding income tax 731 1,202Income tax expense using the Company’s domestic tax rate of 30% (2014: 30%) 219 361Increase in income tax expense due to: Accounting amortisation of identifiable intangible assets 244 441Share-based payment expense 184 305Tax losses not brought to account 1,515 2,190Effect of losses on disposal of subsidiaries 793 –Other non-deductible/(subtraction) items 89 (21)Decrease in income tax expense due to: Effect of losses not previously recognised (80) (10)Effect of lower tax rate on overseas incomes (206) (39)Over-provision for tax in previous years (168) (211)Unwinding of deferred tax liability established in business combinations (244) (361)Income tax expense on pre-tax net profit 2,346 2,655
Current taxes The Group has a net current tax payable of $475,000 (2014: payable $450,000). The net current tax payable is comprised of current tax payables of $748,000 (2014: $713,000) and current tax receivables of $273,000 (2014: $263,000).
Deferred taxes
Recognised deferred tax assets and liabilities are attributable to the following:
In thousands of AUD 2015 2014Deferred tax assets Tax losses carried forward 3,941 3,918Employee benefits 726 909Impairment of doubtful debts 58 12Accruals and income in advance 472 652Lease make good 187 216Lease incentive 157 77Deductible share issue costs 71 769Plant and equipment 533 474Other 43 25Gross deferred tax assets 6,188 7,052 Deferred tax liabilities Identifiable intangibles 1 244Lease make good asset 63 95Work in progress 217 175Fair value gain 3,941 3,887Plant and equipment 79 15Other – 90Gross deferred tax liabilities 4,301 4,506
Net deferred tax asset 1,887 2,546
For
per
sona
l use
onl
y

49
Movement in deferred tax balances The movement in deferred tax balances during the year was all recognised in the income statement.
Deferred tax assets not recognised Deferred tax assets have not been recognised in respect of the following items because it is not probable that future taxable profit will be available against which the Group can utilise the benefits:
In thousands of AUD 2015 2014Revenue losses 38,796 45,472Capital losses 207,785 198,553
Gross tax losses carried forward 246,581 244,025
Accounting policy Income tax on the profit or loss for the year comprises current and deferred tax. Current and deferred tax is recognised in the income statement except to the extent that it relates to a business combination, or items recognised directly in equity or in other comprehensive income.
Current tax is the expected tax payable on the taxable income for the year, using tax rates enacted or substantively enacted at the reporting date, and any adjustment to tax payable in respect of previous years.
Deferred tax is recognised in respect of temporary differences between the carrying amounts of assets and liabilities for financial reporting purposes and the amounts used for taxation purposes. The following temporary differences are not provided for: goodwill, the initial recognition of assets or liabilities that affect neither the accounting nor the taxable profit, and differences relating to investments in subsidiaries to the extent that they will probably not reverse in the foreseeable future.
The amount of deferred tax provided is based on the expected manner of realisation or settlement of the carrying amount of assets and liabilities, using tax rates enacted or substantively enacted at the reporting date.
Deferred tax assets and liabilities are offset if there is a legally enforceable right to offset current tax liabilities and assets, and they relate to income taxes levied by the same tax authority on the same taxable entity, or on different tax entities, but they intend to settle current tax liabilities and assets on a net basis or their tax assets and liabilities will be realised simultaneously.
A deferred tax asset is recognised only to the extent that it is probable that future taxable profits will be available, against which the asset can be utilised. Deferred tax assets are reduced to the extent that it is no longer probable that the related tax benefit will be realised.
Key assumption The Group has recognised deferred tax assets on tax capital losses arising from disposed subsidiaries. The recognition of tax losses as deferred tax assets is based on the assumption of future taxable capital gains in the same tax jurisdiction due to the recognition of fair value gains in relation to deferred consideration liabilities.
For
per
sona
l use
onl
y

Notes to the consolidated financial statements for the year ended 30 June 2015
50 Enero Group Limited Annual Report 2015
6. Cash and cash equivalents
In thousands of AUD Note 2015 2014
Cash at bank and on hand 23,462 18,913
Bank short-term deposits 2,350 3,600
Cash and cash equivalents in statement of financial position and statement of cash flows
25,812 22,513
For statement of cash flow presentation purposes, cash and cash equivalents include cash on hand, short-term deposits with original maturities of three months or less that are readily convertible to known amounts of cash and which are subject to an insignificant risk of change in value, and bank overdrafts. Bank overdrafts are shown in current liabilities in the statement of financial position.
The Group’s exposure to interest rate risk and a sensitivity analysis for financial assets and liabilities are disclosed in Note 17 Financial risk management/financial instruments.
Reconciliation of cash flows from operating activities
(i) Reconciliation of cash For the purpose of the statements of cash flows, cash includes cash on hand and at bank and short-term deposits at call, net of outstanding bank overdrafts. Cash at the end of the financial year as shown in the statements of cash flows is reconciled to the related items in the statement of financial position as follows:
Cash assets 25,812 22,513
(ii) Reconciliation of loss after income tax to net cash provided by operating activities
Loss after income tax (1,615) (1,453)
Add/(less) non-cash items:
Loss/(profit) on sale of non-current assets 1 (5)
Share-based payments expense 1,121 1,453
Depreciation and amortisation 3,350 3,259
Release of lease incentive/rent straight-line 211 113
Lease make good amortisation 212 481
Release of lease make good provision (236) (745)
Amortisation of identifiable intangibles 875 1,532
Loss on disposal of subsidiaries 2,644 68
Increase in income taxes payable (net) 24 439
(Increase)/decrease in deferred tax assets and liabilities 659 436
Net cash provided by operating activities before changes in assets and liabilities
7,246 5,578
Changes in assets and liabilities adjusted for the effects of purchase and disposal of controlled entities during the financial year:
(Increase)/decrease in receivables (1,310) 4,353
(Increase)/decrease in work in progress 487 3,183
(Increase)/decrease in prepayments 28 280
(Increase)/decrease in other assets 260 78
Increase/(decrease) in payables 1,359 (3,737)
Increase/(decrease) in unearned revenue (189) (2,075)
Increase/(decrease) in provisions (888) (1,082)
Net cash from operating activities 6,993 6,578
For
per
sona
l use
onl
y

51
7. Trade and other receivables
In thousands of AUD Note 2015 2014
Current
Trade receivables 28,050 26,524
Less: provision for impairment loss 17 (292) (134)
27,758 26,390
Other receivables 94 152
27,852 26,542
Non-current
Other non-current receivables 21 50
21 50
Total trade and other receivables 27,873 26,592
No interest is charged on trade debtors. The Group’s exposure to credit and currency risk and impairment losses related to trade and other receivables is disclosed in Note 17 Financial risk management/financial instruments.
8. Other assets
In thousands of AUD 2015 2014
Current
Work in progress 973 1,460
Prepayments 3,222 3,251
Other current assets 140 194
4,335 4,905
Non-current
Deposits 209 403
Other non-current assets 218 347
427 750
For
per
sona
l use
onl
y

Notes to the consolidated financial statements for the year ended 30 June 2015
52 Enero Group Limited Annual Report 2015
9. Plant and equipment
In thousands of AUD
Computer equipment
Office furniture
and equipment
Plant and equipment
Leasehold improvements
Plant and equipment
under finance
lease
Total
2015 Cost 6,360 2,693 306 6,622 1,608 17,589Accumulated depreciation (4,516) (1,766) (114) (2,725) (1,434) (10,555)Net carrying amount 1,844 927 192 3,897 174 7,034Reconciliations of the carrying amounts of each class of property, plant and equipment are set out below:
Carrying amount at the beginning of the year 2,067 987 132 3,489 565 7,240Additions 1,036 305 110 1,104 80 2,635Depreciation (1,358) (426) (62) (1,033) (471) (3,350)Effect of movements in exchange rates 103 71 9 337 – 520Disposals (4) (10) 3 – – (11)
Carrying amount at the end of the year 1,844 927 192 3,897 174 7,034
2014 Cost 6,998 3,683 402 5,991 2,114 19,188Accumulated depreciation (4,931) (2,696) (270) (2,502) (1,549) (11,948)Net carrying amount 2,067 987 132 3,489 565 7,240Reconciliations of the carrying amounts of each class of property, plant and equipment are set out below:
Carrying amount at the beginning of the year 2,050 972 130 3,452 1,027 7,631Additions 1,236 487 85 980 2 2,790Depreciation (1,256) (498) (79) (1,012) (414) (3,259)Effect of movements in exchange rates 51 31 2 69 – 153Disposals (14) (5) (6) – (50) (75)
Carrying amount at the end of the year 2,067 987 132 3,489 565 7,240
Accounting policy
(i) Recognition and measurement Plant and equipment are stated at cost less accumulated depreciation (see below) and impairment losses (see Note 18 Impairment of non-financial assets). The cost of the asset also includes the cost of replacing parts on an item of plant and equipment when it is probable that the future economic benefits embodied within the item will flow to the Group and the cost of the item can be measured reliably. All other costs are charged to the income statement as incurred.
Cost includes expenditure that is directly attributable to the acquisition of the asset. Purchased software that is integral to the functionality of the related equipment is capitalised as part of that equipment.
Where parts of an item of plant and equipment have different useful lives, they are accounted for as separate items of plant and equipment.
(ii) Derecognition An item of property, plant and equipment is derecognised when it is sold or otherwise disposed of, or when its use is expected to bring no future economic benefits.
Gains and losses on derecognition are determined by comparing the proceeds with the carrying amount and recognised within “Administration expenses” in the income statement.
(iii) Leased assets Leases in terms of which the Group assumes substantially all the risks and rewards of ownership are classified as finance leases. Upon initial recognition the leased asset is measured at an amount equal to the lower of its fair value and the present value of the minimum lease payments. Subsequent to initial recognition, the asset is accounted for in accordance with the accounting policy applicable to that asset. Other leases are operating leases; the leased assets are not recognised on the Group’s statement of financial position.
For
per
sona
l use
onl
y

53
(iv) Depreciation Depreciation is charged to the income statement on a straight-line basis over the assets’ estimated useful lives. Leased assets are depreciated over the shorter of the lease term and their useful lives, unless it is reasonably certain that the Group will obtain ownership of the asset by the end of the lease term. The major categories of plant and equipment are depreciated as follows:
2015 2014
Computer equipment 25% – 40% 25% – 40%Office furniture and equipment 5% – 25% 5% – 25%Plant and equipment 10% – 25% 10% – 25%Leasehold improvements Life of lease Life of leasePlant and equipment under finance lease Life of lease Life of lease
Depreciation methods, useful lives and residual values are reviewed at each financial year end and adjusted if appropriate.
10. Intangible assets
In thousands of AUD
Goodwill IT related intellectual
property
Contracts and
customer relationships
Internally generated intangible
assets
Total
2015 Cost 305,956 9,094 16,927 3,085 335,062Accumulated amortisation – (299) (16,246) (1,287) (17,832)Impairment (221,526) (8,795) (681) (1,683) (232,685)Net carrying amount 84,430 – – 115 84,545Reconciliations of the carrying amounts of intangibles are set out below:
Carrying amount at the beginning of the year 75,707 – 814 176 76,697Amortisation – – (814) (61) (875)Effect of movements in exchange rates 8,723 – – – 8,723
Carrying amount at the end of the year 84,430 – – 115 84,545
2014 Cost 323,320 9,306 16,927 3,085 352,638Accumulated amortisation – (511) (15,432) (1,226) (17,169)Impairment (247,613) (8,795) (681) (1,683) (258,772)Net carrying amount 75,707 – 814 176 76,697Reconciliations of the carrying amounts of intangibles are set out below:
Carrying amount at the beginning of the year 70,922 – 2,017 238 73,177Amortisation – – (1,470) (62) (1,532)Effect of movements in exchange rates 4,785 – 267 – 5,052
Carrying amount at the end of the year 75,707 – 814 176 76,697
Amortisation charge The amortisation charge of $875,000 (2014: $1,532,000) is recognised in the depreciation and amortisation expense in the income statement.
Goodwill CGU group allocation The Group has two CGUs, the Operating Brands CGU and the Search Marketing CGU. The entire goodwill balance of $84,430,000 (2014: $75,707,000) relates to the Operating Brands CGU.
The increase in the goodwill carrying value as compared to the prior reporting period is in relation to the increased Australian dollar translation of foreign currency denominated goodwill.
For
per
sona
l use
onl
y

Notes to the consolidated financial statements for the year ended 30 June 2015
54 Enero Group Limited Annual Report 2015
10. Intangible assets (continued)
Accounting policy
(i) Goodwill Goodwill acquired in a business combination is initially measured at cost. Cost is measured as the cost of the business combination minus the net fair value of the acquired and identifiable assets, liabilities and contingent liabilities.
Following initial recognition, goodwill is measured at cost less any accumulated impairment losses.
Goodwill is allocated to cash generating units expected to benefit from synergies created by the business combination.
Goodwill is not amortised, but instead is reviewed for impairment annually or more frequently if events or changes in circumstances indicate that the carrying value may be impaired.
(ii) Research and development Expenditure on research activities is charged to the income statement as incurred.
Expenditure on development activities (including internally developed software), is capitalised only if development costs can be reliably measured, the product or process is technically and commercially feasible, future economic benefits are probable, and the Group intends to, and has sufficient resources to, complete development and to use or sell the asset.
The capitalised development expenditure includes the cost of materials, direct labour and an appropriate proportion of overhead costs that are directly attributable to preparing the asset for its intended use. Capitalised development expenditure is measured at cost, less accumulated amortisation and impairment losses.
(iii) Other intangible assets Other intangible assets acquired separately are measured on initial recognition at cost. The other intangible assets acquired in business combinations are mainly customer relationships and customer contracts. The cost of these assets is their fair value at date of acquisition based on valuation techniques generally using the excess earnings method. Following initial recognition, intangible assets are carried at cost less amortisation and any impairment losses.
Subsequent expenditure Subsequent expenditure on capitalised intangible assets is capitalised only when it increases the future economic benefits embodied in the specific asset to which it relates. All other expenditure is expensed as incurred.
(iv) Amortisation Intangibles assets other than goodwill are amortised on a straight-line basis over their estimated useful lives from the date they are available for use.
A summary of the useful lives of intangible assets is as follows:
Intangible asset Useful life
IT related intellectual property 2 to 8 years
Customer contracts 3 to 4 years
Customer relationships 2 to 8 years
Internally generated intangibles 2 to 5 years
Amortisation methods, useful lives and residual values are reviewed at each financial year end and adjusted if appropriate.
(v) Impairment Refer to Note 18 Impairment of non-financial assets for further details on impairment.
For
per
sona
l use
onl
y

55
11. Trade and other payables
In thousands of AUD 2015 2014Current liabilities Trade payables 12,248 11,484Other trade payables and accrued expenses 9,209 8,690Unearned income 10,104 10,293
31,561 30,467
The Group’s exposure to currency and liquidity risk related to trade and other payables is disclosed in Note 17 Financial risk management/financial instruments. 12. Employee benefits
In thousands of AUD 2015 2014Aggregate liability for employee benefits, including on-costs Current Employee benefits provision 2,356 2,826Non-current
Employee benefits provision 480 522
The Group has recognised $1,991,000 (2014: $1,924,000) as an expense in the income statement for defined contribution plans during the reporting period. For further details refer to Note 27 Share-based payments.
Accounting policy Provision is made for employee benefits including annual leave and long service leave for employees.
(i) Long-term employee benefits The Group’s net obligation in respect of long-term service benefits, other than superannuation and pension plans, is the amount of future benefit that employees have earned in return for their service provided up to the reporting date. The obligation is calculated using expected future increases in wage and salary rates, including related on-costs and expected settlement dates, and is discounted using the rates attached to the Corporate bond rate at 30 June 2015 and Commonwealth Government bonds at 30 June 2014 which have maturity dates approximating to the terms of the Group’s obligations.
(ii) Wages, salaries, annual leave, and non-monetary benefits Liabilities for employee benefits for wages, salaries, and annual leave, that are due to be settled within 12 months of the reporting date, represent present obligations resulting from employees’ services provided to reporting date, and are calculated at undiscounted amounts based on remuneration wage and salary rates that the Group expects to pay as at reporting date, including related on-costs.
A provision is recognised for the amount expected to be paid under short-term cash bonus or profit-sharing plans if the Group has a present legal or constructive obligation to pay this amount as a result of past services provided by the employee and the obligation can be reliably estimated.
(iii) Termination benefits Termination benefits are charged to the income statement when the Group is demonstrably committed, without realistic possibility of withdrawal, to a formal detailed plan to either terminate employment before the normal retirement date, or to provide termination benefits as a result of an offer made to encourage voluntary redundancy. Termination benefits for voluntary redundancies are charged to the income statement if the Group has made an offer encouraging voluntary redundancy, it is probable that the offer will be accepted, and the number of acceptances can be estimated reliably.
For
per
sona
l use
onl
y

Notes to the consolidated financial statements for the year ended 30 June 2015
56 Enero Group Limited Annual Report 2015
13. Provisions
In thousands of AUD Lease make
goodLease
incentiveRent
straight-lineRestructure
provision Total
2015 Current 3 182 35 – 220Non-current 881 62 333 – 1,276Total provisions current and non-current 884 244 368 – 1,496Reconciliations of the carrying amounts of each class of provision, except for employee benefits, are set out below:
Carrying amount at the beginning of the year 1,015 187 214 375 1,791Increase due to new provision 36 100 153 – 289Effect of movement in exchange rates 69 8 41 – 118Released/used during the year (236) (51) (40) (375) (702)
Carrying amount at the end of the year 884 244 368 – 1,496
2014 Current – 187 71 375 633Non-current 1,015 – 143 – 1,158Total provisions current and non-current 1,015 187 214 375 1,791Reconciliations of the carrying amounts of each class of provision, except for employee benefits, are set out below:
Carrying amount at the beginning of the year 1,499 185 103 485 2,272Increase due to new provision 223 24 148 375 770Effect of movement in exchange rates 38 – (4) – 34Released/used during the year (745) (22) (33) (485) (1,285)
Carrying amount at the end of the year 1,015 187 214 375 1,791
Accounting policy
A provision is recognised in the statement of financial position when the Group has a present legal or constructive obligation as a result of a past event, and it is probable that an outflow of economic benefits will be required to settle the obligation.
(i) Make good provision The Group has made provision for make good on all operating leases for premises which require make good expenditure at completion of the lease. The amount of the provision for make good is capitalised and then amortised over the remaining term of the individual leases. The provision is the best estimate of the expenditure required to settle the make good obligation.
Future make good costs are reviewed annually and any changes are reflected in the provision at the end of the reporting period.
(ii) Lease incentive provision The Group has made provision for lease incentives received. Lease incentives received are recognised in the income statement as an integral part of the total lease expense spread over the lease term.
(iii) Rent The Group has made provision for increase in rent for operating leases for premises. Rent is recognised in the income statement on a straight-line basis over the lease term.
(iv) Restructuring provision A provision for restructuring is recognised when the Group has approved a detailed and formal restructuring plan, and the restructuring either has commenced or has been announced. Future operating losses are not provided for. F
or p
erso
nal u
se o
nly

57
14. Capital and reserves
In thousands of AUD 2015 2014Share capital
Ordinary shares, fully paid 491,509 489,830
The Company does not have authorised capital or par value in respect of its shares. Movement in ordinary shares
2015
Shares2015
In thousands of AUD
2014 Shares
2014In thousands
of AUD
Balance at beginning of year 85,604,954 489,830 85,604,954 489,7921,460,386 shares transferred from a trust account held by the Company to the employees of the Group on exercise of Share Appreciation Rights for $1.15 per share(i)
– 1,679 – –
20,833 shares released from escrow condition pursuant to acquisition of subsidiaries for $1.80 per share
– – – 38
Balance at end of year 85,604,954 491,509 85,604,954 489,830
(i) As at 30 June 2015, a total of 3,324,147 shares (30 June 2014: 4,784,533) were held in trust by the Company.
Ordinary shares Holders of ordinary shares are entitled to receive dividends as declared from time to time and are entitled to one vote per share at shareholder meetings.
Translation reserve The translation reserve comprises all foreign currency differences arising from the translation of the financial statements of foreign operations.
Options reserve The options reserve comprises the cumulative expense relating to the fair value of options, rights and equity plans on issue to key management personnel, senior Executives and employees of the Group.
Reserve change in ownership interest in subsidiary The reserve change in ownership interest in subsidiary relates to the subsidiary equity plan. For details of the plan see Note 27 Share-based payments.
Dividends No dividend was declared during the year ended on 30 June 2015 (30 June 2014: Nil) or after the balance sheet date but before the date of this report.
Dividend franking account In thousands of AUD 2015 2014
Franking credits available for future years at 30% to shareholders of Enero Group Limited 21,887 21,887
The above amounts represent the balance of the franking account at end of the financial year adjusted for:
franking credits that will arise from the payment of the current tax liability; franking debits that will arise from the payment of dividends recognised as a liability at year end; franking credits that will arise from the receipt of dividends recognised as receivables at year end; and franking credits that may be prevented from being distributed in subsequent years.
The ability to utilise the franking credits is dependent upon there being sufficient available profits to declare dividends and any restrictions to paying dividends. There is no impact on the dividend franking account as no dividends have been proposed after the reporting date.
Accounting policy (i) Ordinary shares Ordinary shares are classified as equity. Incremental costs directly attributable to the issue of ordinary shares and share options are recognised as a deduction from equity, net of tax effects.
(ii) Dividends Dividends are recognised as a liability in the period in which they are declared.
(iii) Transaction costs Transaction costs of an equity transaction are accounted for as a deduction from equity, net of any related income tax benefit.
For
per
sona
l use
onl
y

Notes to the consolidated financial statements for the year ended 30 June 2015
58 Enero Group Limited Annual Report 2015
15. Earnings/(loss) per share
Profit/(loss) attributable to equity holders of the parent In thousands of AUD 2015 2014
Loss for the year (1,615) (1,453)
Non-controlling interests (1,172) (1,459)
Loss for the year attributable to equity holders of the parent (2,787) (2,912)
Participative rights that have dilutive effect – (135)
Diluted net loss attributable to equity holders of the parent (2,787) (3,047)
Weighted average number of ordinary shares In thousands of shares 2015 2014
Weighted average number of ordinary shares – basic 81,917 80,815
Shares issuable under equity-based compensation plans(i) 2,097 1,581
Weighted average number of ordinary shares – diluted 84,014 82,396
Earnings/(loss) per share
In AUD cents 2015 2014
Basic (3.4) (3.6)
Diluted (3.4) (3.8)
(i) The weighted average shares outstanding includes the incremental shares that would be issued upon the assumed exercise of share rights if the effect is dilutive. Because the Group had a loss both in the current and prior reporting periods, no potentially dilutive shares were included in the denominator computing diluted loss per shares since the impact on loss per share would be anti-dilutive.
Accounting policy The Group presents basic and diluted earnings per share (EPS) data for its ordinary shares. Basic EPS is calculated by dividing the profit or loss attributable to ordinary shareholders of the Company by the weighted average number of ordinary shares outstanding during the period. Diluted EPS is determined by adjusting the profit and loss attributable to ordinary shareholders and the weighted average number of ordinary shares outstanding for the effects of all dilutive potential ordinary shares, which comprise share rights granted to employees.
16. Loans and borrowings
This Note provides information about the contractual terms of the Group’s interest-bearing loans and borrowings. For more information about the Group’s exposure to interest rate risk, liquidity risk and foreign currency risk, see Note 17 Financial risk management/financial instruments.
In thousands of AUD 2015 2014
Current liabilities
Hire purchase lease liabilities 27 1,658
Non-current liabilities
Hire purchase lease liabilities – 24
Financing facilities The Group has access to the following lines of credit:
In thousands of AUD
Bank overdrafts
Lease finance facility
Indemnity guarantee
facility
Credit card facility
Total
2015 Total facilities available – 1,727 3,000 1,875 6,602Facilities used at reporting date – 27 2,203 262 2,492
Facilities not utilised at reporting date – 1,700 797 1,613 4,110
2014 Total facilities available 724 2,229 3,000 1,742 7,695Facilities used at reporting date – 1,682 2,290 265 4,237
Facilities not utilised at reporting date 724 547 710 1,477 3,458
For
per
sona
l use
onl
y

59
Financing arrangements All finance facilities are negotiated by the Company on behalf of the Group. The carrying amount of amounts drawn down on facilities as at the reporting date equates to face value. The indemnity guarantee facility and lease finance facility are secured by cash deposits held with Westpac.
Lease finance facility The lease finance facility is subject to annual review and is in place to assist with capital expenditure requirements.
In thousands of AUD 2015 2014
Finance lease and hire purchase payable commitments
Finance lease commitments are payable:
Within one year 28 1,697
One year or later and no later than five years – 24
28 1,721
Less: Future lease finance charges (1) (39)
27 1,682
Finance lease and hire purchase liabilities provided for in the financial statements
Current 27 1,658
Non-current – 24
27 1,682
The Group leases plant and equipment under finance leases expiring from one to five years (2014: one to five years). At the end of the lease term, the Group has the option to purchase the equipment at a substantial discount to market value. The terms of the leases require that additional debt and further leases are not undertaken without prior approval of the lessor.
Indemnity guarantee facility
The indemnity guarantee facility is in place to support financial guarantees outstanding at any one time. Specific guarantee amounts are $2,203,000 (2014: $2,290,000) supporting property rental and other obligations.
Credit card facility The credit card facility is subject to annual review and is subject to application approval and the bank or financial services company’s standard terms and conditions.
Accounting policy Finance lease Leases where the Group has substantially all the risks and rewards of ownership are classified as finance leases. Finance leases are capitalised at the inception at the lower of the fair value of the leased asset and the present value of the minimum lease payments. The corresponding rental obligations, net of finance charges, are included in loans and borrowings.
Lease payments are apportioned between the finance charge and the reduction of the outstanding liability. The finance charge is allocated to each period during the lease term so as to produce a constant periodic rate of interest on the remaining balance of the liability.
The finance charge component of finance lease payments is recognised in the income statement using the effective interest method.
For
per
sona
l use
onl
y

Notes to the consolidated financial statements for the year ended 30 June 2015
60 Enero Group Limited Annual Report 2015
17. Financial risk management/financial instruments The Group’s exposure to financial risks, objectives, policies and processes for managing the risks including methods used to measure the risks, and the management of capital are presented below.
The Group’s activities expose it to the following financial risks:
credit risk;
liquidity risk; and
market risk.
The Group’s principal financial instruments comprise cash, receivables, payables, interest-bearing liabilities and other financial liabilities.
The Board has overall responsibility for the oversight of the risk management framework. Risk management policies are established to identify and analyse the risks faced by the Group, to set appropriate risk limits and controls, and to monitor risks and adherence to limits. Risk management policies and systems are reviewed regularly and modified as appropriate to reflect changes in market conditions and the Group’s activities.
The Group considers that there are no changes to the objectives, policies and processes to managing risk and the exposure to risks from the prior reporting period.
Credit risk Exposure to credit risk Credit risk is the risk of financial loss to the Group if a customer or counterparty to a financial instrument fails to meet its contractual obligation, and arises principally from a Group’s receivables from customers.
Each subsidiary performs credit analysis of a new customer and standard payment terms are offered only to creditworthy customers.
During the year ended 30 June 2015, the Group entered into transactions with more than 750 unique customers. The 10 largest customers accounted for 37.7% of net revenue for the year ended 30 June 2015, with no one customer accounting for more than 10.7% of net revenue. There are no material credit exposures relating to a single receivable or groups of receivables.
The maximum exposure to credit risk is net of any provisions for impairment of those assets, as disclosed in the statement of financial position.
The carrying amount of financial assets represents the maximum credit exposure. The maximum credit exposure to credit risk at the reporting date was:
Carrying amountIn thousands of AUD Note 2015 2014Cash and cash equivalents 6 25,812 22,513Trade and other receivables
7 27,873 26,592
Deposits 8 209 403
53,894 49,508
The Group’s maximum exposure to trade receivables credit risk at the reporting date was:
Carrying amountIn thousands of AUD Note 2015 2014Trade receivables 7 27,758 26,390
The Group’s credit risk exposure is consistent across the geographic and business segments in which the Group operates.
The movement in the allowance for impairment in respect of trade receivables during the year was as follows:
In thousands of AUD 2015 2014Balance at 1 July 134 481Bad debts recovered – (111)Impairment loss recognised in income statement 201 –Provision used during year (43) (236)
Balance at 30 June 292 134
Based on the credit history, the Group believes that no impairment allowance is necessary in respect of trade receivables not past due or past due by up to 90 days, which represents 98.1% (2014: 98.7%) of the trade receivables balance. For trade receivables which are past due and over 90 days, the Group individually assesses each trade receivable and if a trade receivable is assessed as non-recoverable, an impairment allowance is made, which represents 1.0% (2014: 0.5%) of the total trade receivables balance.
Impairment losses The ageing of the Group’s trade receivables at the reporting date was:
In thousands of AUD 2015 2014Not past due 23,164 22,715Past due and less than 90 days 4,340 3,464Past due and more than 90 days 254 211Past due, more than 90 days and impaired
292 134
Gross trade receivables 28,050 26,524Less: Impairment (292) (134)
Net trade receivables 27,758 26,390
Market risk Market risk is the risk relating to changes in market prices, such as foreign exchange rates, interest rates and equity prices, which will affect the Group’s income or the value of its holding of financial instruments. The objective of market risk management is to manage and control market risk exposure within acceptable parameters, while optimising the return on risk.
For
per
sona
l use
onl
y

61
Currency risk Currency risk is the risk that the fair value of future cash flows of a financial instrument will fluctuate because of changes in foreign exchange rates. The source and nature of this risk arises from operations and translation risks.
The Operating Brands segment generated approximately 52.1% of its net revenue and 60.7% of Operating EBITDA in the year ended 30 June 2015 from outside Australia. The Group’s reporting currency is Australian dollars. However, the international operations give rise to an exposure to changes in foreign exchange rates, as the majority of its revenues from outside Australia are denominated in currencies other than Australian dollars, most significantly Great British pound (GBP) and US dollar (USD).
The Group has minimal exposure to profit and loss translation risk as the majority of transactions denominated in foreign currencies are transacted by entities within the Group with the same functional currency of the relevant transaction.
Liquidity risk Liquidity risk is the risk that the Group will not be able to meet its financial obligations as they become due. The Group’s approach to managing liquidity is to ensure, as far as possible, that it will always have sufficient liquidity to meet its liabilities when due.
The Group manages liquidity risk by monitoring forecast operating cash flows, and committed unutilised facilities; and re-estimating the value of deferred consideration liabilities semi-annually.
The following are the contractual maturities of financial liabilities, including estimated interest payments and excluding the impact of netting agreements.
2015 In thousands of AUD
Carrying amount
Contractual cash flows
Less than 1 year 1 to 5 years Over 5 years
Non-derivative financial liabilities Hire purchase liabilities 27 28 28 – –Trade and other payables (excluding unearned revenue) 21,457 21,457 21,457 – –
21,484 21,485 21,485 – –
2014 In thousands of AUD
Carrying amount
Contractual cash flows
Less than 1 year 1 to 5 years Over 5 years
Non-derivative financial liabilities Hire purchase liabilities 1,682 1,721 1,697 24 –Trade and other payables (excluding unearned revenue) 20,174 20,174 20,174 – –
21,856 21,895 21,871 24 –
It is not expected that the cash flows included in the maturity analysis could occur significantly earlier or at significantly different amounts.
Liquidity risk in relation to deferred consideration liabilities There are critical accounting estimates and judgements in relation to deferred consideration liabilities. Refer to Note 23 Deferred consideration for further details.
There are no other significant uncertainties in the timing or amounts of contractual liabilities.
Interest rate risk Interest rate risk refers to the risk that the fair value of the future cash flows of financial instruments will fluctuate because of changes in market interest rates. The Group has no significant interest-bearing assets or liabilities at 30 June 2015.
Fair value hierarchy The Group did not have any financial instruments carried at fair value by valuation method at 30 June 2015 or 30 June 2014.
Capital management The Group’s key sources of capital are available committed facilities and share capital. The Board seeks to maintain a balance between higher returns that might be possible with higher levels of gearing and the advantages afforded by a prudent capital position. The Group currently has no bank debt.
The Group is also subject to restrictions on alterations to its capital structure, and payment of dividends such that no dividends can be paid until the contingent deferred consideration payments have been made (with a final expiry date of September 2018) keeping within certain leverage targets.
For
per
sona
l use
onl
y

Notes to the consolidated financial statements for the year ended 30 June 2015
62 Enero Group Limited Annual Report 2015
17. Financial risk management/financial instruments (continued) Fair values Fair values versus carrying amounts The fair values of financial assets and liabilities, together with the carrying amounts shown in the statement of financial position, are as follows:
2015 2014Consolidated In thousands of AUD
Carrying amount Fair value
Carrying amount Fair value
Cash and cash equivalents 23,462 23,462 18,913 18,913Bank short-term deposits 2,350 2,350 3,600 3,600Trade receivables 27,758 27,758 26,390 26,390Trade and other payables (21,457) (21,457) (20,174) (20,174)Hire purchase lease liabilities (27) (27) (1,682) (1,682) 32,086 32,086 27,047 27,047
The fair value which is determined for disclosure purposes only is calculated as:
Trade receivables: is the present value of future cash flows, discounted at the market rate of interest at the reporting date.
Trade and other payables and hire purchase lease liabilities: is present value of future principal and interest cash flows, discounted at the market rate of interest at the reporting date. For finance leases, the market rate of interest is determined by reference to similar lease arrangements.
Fair value measurement: the carrying amount of cash and cash equivalents, trade and other receivables, trade and other payables and lease liabilities approximates their fair value. Accounting policy Non-derivative financial assets Non-derivative financial assets are recognised on the date that they are originated. All other financial assets (including assets designated as fair value through the profit and loss) are recognised initially on the trade date at which the Group becomes a party to the contractual provisions of the instrument.
Non-derivative financial assets are derecognised when the rights to receive cash flows from the financial assets have expired or have been transferred and the Group has transferred substantially all the risks and rewards of ownership.
Financial assets and liabilities are offset and the net amount presented in the statement of financial position when, and only when, the Group has a legal right to offset the amounts and intends either to settle on a net basis or to realise the asset and settle the liability simultaneously.
The Group has the following non-derivative financial assets:
(i) Loans and receivables Loans and receivables are financial assets with fixed or determinable payments that are not quoted in an active market. They arise when the Group provides money or services directly to a debtor with no intention of selling the receivable. Loans and receivables comprise trade and other receivables.
Loans and receivables are recognised initially at fair value, plus any directly attributable transaction costs. Subsequent to initial recognition, loans and receivables are measured at amortised cost using the effective interest method, less any impairment losses.
(ii) Work in progress Work in progress represents accrued revenue recognised on a percentage of completion basis and rechargeable disbursements at the period end, and is stated at the lower of cost and net realisable value.
(iii) Cash and cash equivalents Cash and cash equivalents comprise cash balances and call deposits with original maturities of three months or less. Bank overdrafts that are repayable on demand and form an integral part of the Group’s cash management are included as a component of cash and cash equivalents for the purpose of the statement of cash flows.
Non-derivative financial liabilities Non-derivative financial liabilities are recognised on the date they are originated. All other financial liabilities (including liabilities designated at fair value through profit or loss) are recognised initially on the trade date at which the Group becomes a party to the contractual provisions of the instrument.
Non-derivative financial liabilities are derecognised when the Group’s contractual obligations are discharged or cancelled, or expire.
The Group has the following non-derivative financial liabilities: loans and borrowings, bank overdrafts and trade, other payables and deferred consideration.
Non-derivative financial liabilities, other than deferred consideration, are recognised initially at fair value, plus any directly attributable transaction costs. Subsequent to initial recognition, these financial liabilities are measured at amortised cost using the effective interest rate method.
For
per
sona
l use
onl
y

63
Deferred consideration Deferred consideration is classified as a financial liability and is measured at fair value through profit or loss. Deferred consideration relating to acquisition of subsidiaries is recognised based on management’s best estimate of the liability (up to any relevant cap) at the reporting date. The liability is discounted using a market interest rate for the liability and a present value interest charge is recognised in the income statement as the discount unwinds. Any change in estimate of deferred consideration payable is recognised in the income statement as a fair value gain or loss during the period when the estimate is revised.
Derivative financial instruments including hedging accounting The Group may use derivative financial instruments to hedge its exposure to interest rate risks and foreign currency risks.
Derivatives are initially recognised at fair value on the date a derivative contract is entered into and are subsequently remeasured to their fair value. The method of recognising the resulting gain or loss depends on whether the derivative is designated as a hedging instrument, and if so, the nature of the item being hedged.
The Group designates certain derivatives as either hedges of the fair value of recognised assets or liabilities or a firm commitment (fair value hedges), or hedges of probable forecast transactions (cash flow hedges).
The Group documents at the inception of the transaction the relationship between hedging instruments and hedged items, as well as its risk management objective and strategy for undertaking various hedge transactions. The Group also documents its assessment, both at hedge inception and on an on-going basis, of whether the derivatives that are used in hedging transactions have been and will continue to be effective in offsetting changes in fair values or cash flows of hedged items.
Cash flow hedges The effective portion of changes in the fair value of derivatives that are designated and qualify as cash flow hedges is recognised in other comprehensive income. The gain or loss relating to the ineffective portion is recognised immediately in the income statement.
When a hedging instrument expires or is sold or terminated, or when a hedge no longer meets the criteria for hedge accounting, any cumulative gain or loss existing in equity at that time remains in equity and is recognised when the forecast transaction is ultimately recognised in the income statement.
When the hedged item is a non-financial asset, the amount recognised in other comprehensive income is transferred to the carrying amount of the asset when it is recognised. When a forecast transaction is no longer expected to occur, the cumulative gain or loss that was reported in equity is immediately transferred to the income statement.
Impairment of Financial assets (including receivables) A financial asset not carried at fair value through profit or loss is assessed at each reporting date to determine whether there is any objective evidence that it is impaired. A financial asset is considered to be impaired if objective evidence indicates that one or more events have had a negative effect on the estimated future cash flows of that asset that can be estimated reliably.
Objective evidence that financial assets are impaired can include default or delinquency by a debtor, restructuring of an amount due to the Group on terms that the Group would not consider otherwise, and/or indications that a debtor or issuer will enter bankruptcy.
An impairment loss in respect of a financial asset measured at amortised cost is calculated as the difference between its carrying amount and the present value of the estimated future cash flows discounted at the original effective interest rate. Losses are recognised in the income statement and reflected in an allowance account against receivables. When a subsequent event causes the amount of impairment loss to decrease, the decrease in impairment loss is reversed through the income statement.
The Group considers evidence of impairment for receivables at a specific asset level. In assessing impairment the Group uses historical trends of the probability of default, timing of recoveries, and the amount of loss incurred/adjusted for management’s judgement. The remaining financial assets are assessed collectively, which share similar credit risk characteristics.
Key estimates Trade receivables are carried at amortised cost less impairment. The impairment of these receivables is an estimate based on whether there is evidence suggesting that an event has occurred leading to a negative effect on the estimated future cash inflow. Events subsequent to the reporting date but prior to the signing of the financial statements which indicate a negative effect are taken into account in the calculation of impairment. Future events may occur which change these estimates of the future cash inflows related to impaired trade receivables.
For
per
sona
l use
onl
y

Notes to the consolidated financial statements for the year ended 30 June 2015
64 Enero Group Limited Annual Report 2015
18. Impairment of non-financial assets The process of impairment testing is to estimate the recoverable amount of the assets concerned, and recognise an impairment loss in the Income Statement whenever the carrying amount of those assets exceeds the recoverable amount. Impairment tests for cash generating unit (CGU) groups containing goodwill All the operating businesses are managed as one collective group which forms the Operating Brands segment.
For the purpose of impairment testing, goodwill is allocated to the Group’s operating business units that represent the lowest level within the Group at which goodwill is monitored for internal management purposes and synergies obtained by the business unit.
The aggregation of assets in the CGU group continues to be determined using a service offering. The Search Marketing businesses do not form part of the Operating Brands CGU as they do not obtain synergies with the businesses in that CGU. However they are included in the Operating Brands segment. They have no carrying value.
The recoverable amount of CGU was based on value in use in both the current and prior year. The methodologies and assumptions used for calculating value in use for all of the CGU groups have remained materially consistent with those applied in prior years.
Key assumptions Key assumptions used in the value in use approach to test for impairment relate to the discount rate and the medium-term and long-term growth rates applied to projected cash flows.
Projected cash flows The projected first year of cash flows are derived from results for the current financial year adjusted in some cases for expectations of future trading performance to reflect the best estimate of the CGU group’s cash flows at the time of this report. Projected cash flows can differ from future actual results of operations and cash flows.
Discount rate The discount rate is based on the Group’s pre-tax weighted average cost of capital (WACC) adjusted if necessary to reflect the specific characteristics of each CGU group and to obtain a post-tax discount rate. The discount rate has been adjusted to reflect the current view on the appropriate debt equity ratio and risks inherent in assessing future cash flows.
Growth rate A compound average growth rate (CAGR) of 2.4% (30 June 2014: 2.4%) has been applied to the cash flows of the first five years of cash flows. The five years of cash flows are discounted to present value. The growth rate is based on analysis of organic growth expectations, historical and industry growth rates. The growth rate also takes into account weighting of international operations of the Group.
Long-term growth rate into perpetuity Long-term growth rate of 2.5% (30 June 2014: 2.5%) is used into perpetuity, based on expected long-range growth rate for the industry.
Impairment testing key assumptions for Operating Brands CGU
In thousands of AUD 2015 2014Post-tax discount rate % 10.63 11.45Pre-tax discount rate % 12.73 13.69Long-term perpetuity growth rate % 2.50 2.50
Sensitivity range for impairment testing assumptions As at 30 June 2015, management has identified that for the carrying amount to exceed the recoverable amount the discount rate would need to increase by approximately 2%. A nil growth rate would continue to generate an estimated recoverable amount above the carrying amount.
Accounting policy The carrying amounts of the Group’s non-financial assets, other than deferred tax assets, are reviewed at each reporting date to determine whether there is any indication of impairment. If any such indication exists, then the asset’s recoverable amount is estimated. Goodwill and intangible assets that have an indefinite useful life are not subject to amortisation and are tested annually for impairment or more frequently if events or changes in circumstances indicate that they might be impaired.
An impairment loss is recognised if the carrying amount of an asset exceeds its recoverable amount. The recoverable amount is the higher of an asset’s value in use and fair value less costs to sell. In assessing value in use, the estimated future post-tax cash flows are discounted to their present value using a post-tax discount rate that reflects current market assessments of the time value of money and the risks specific to the asset.
For the purpose of assessing impairment, assets are grouped together into the smallest group of assets that generates cash inflows from continuing use that are largely independent of the cash inflows of other assets or groups of assets (the “cash generating unit”).
For the purposes of goodwill impairment testing, cash generating units (CGUs) to which goodwill has been allocated are aggregated so that the level at which impairment is tested reflects the lowest level at which goodwill is monitored for internal reporting purposes.
Impairment losses recognised in respect of CGUs are allocated first to reduce the carrying amount of goodwill and then to reduce the carrying amount of the other assets on a pro-rata basis.
At each reporting date, the Group reviews non-financial assets other than goodwill that have been previously impaired for indications that the conditions that resulted in the impairment have reversed.
For
per
sona
l use
onl
y

65
19. Controlled entities Particulars in relation to controlled entities:
Group interest
Name 2015
%2014
% Country of
incorporationParent entity Enero Group Limited Controlled entities Enero Group UK Holdings Pty Limited 100 100 AustraliaEnero Group UK Limited 100 100 UKEnero Group (US) Pty Limited 100 100 AustraliaEnero Group (US) Inc. 100 100 USABMF Holdco Pty Limited 100 100 AustraliaBMF Advertising Pty Limited 100 100 AustraliaJigsaw Strategic Research Pty Limited 100 100 AustraliaThe Precinct Group Pty Limited 100 100 AustraliaNaked Communications Australia Pty Limited 100 100 Australia
– Naked NZ Limited(i) – 100 New ZealandHotwire Australia Pty Limited 100 100 AustraliaThe Leading Edge Market Research Consultants Pty Limited 100 100 Australia
– The Leading Edge Market Research Consultants Limited 100 100 UK
– Enero Group Singapore Pte Limited 100 100 Singapore– Enero Communications India Private Limited – 100 India
The Digital Edge Online Consultants Pty Limited 100 100 AustraliaBrigade Pty Limited 100 100 AustraliaThe Hotwire Public Relations Group Limited 100 100 UK
– Hotwire Public Relations GMBH 100 100 Germany
– Hotwire Public Relations SARL 100 100 France
– Hotwire Public Relations SL 100 100 Spain
– Hotwire Public Relations SRL 100 100 Italy
– Hotwire Public Relations Limited 100 100 UK
– Skywrite Communications Limited 100 100 UK
– 33 Digital Limited 100 100 UKCPR Communications and Public Relations Pty Limited 100 100 AustraliaNaked Communications Limited 100 100 UK
– Naked Numbers Limited 100 100 UK
– Naked Ventures Limited(i) – 100 UK
– Hyper Happen Limited(i) – 100 UK
– Ne Kid SAS(i) – 100 France
– Naked Communications BV(i) – 100 Netherlands
– Naked Communications AS(i) – 100 Norway– Naked Communications Sweden AB(i) – 100 Sweden– Naked Communications ApS(i) – 100 Denmark
– Naked Communications Holdings Inc. 100 100 USA
– Naked New York LLC 100 100 USALorica Group Limited 100 100 UK
– Corporate Edge Group Limited 100 100 UKFrank Public Relations Limited 75 75 UK
– Frank Public Relations Pty Limited 75 75 Australia
– Frank Public Reactions Inc. 75 75 USAOB Media LLC 51 51 USA
– Bluestarads.com LLC 51 51 USAThe Leading Edge Research & Strategy Consultants LLC 100 100 USAHotwire Public Relations Group LLC 100 100 USAHotwire New Zealand Limited 100 100 New ZealandLove Pty Limited 100 100 AustraliaEnero (Hong Kong) Limited 100 100 Hong KongDomain Active Holdco Pty Limited 100 100 Australia
– Domain Active Pty Limited 100 100 Australia
For
per
sona
l use
onl
y

Notes to the consolidated financial statements for the year ended 30 June 2015
66 Enero Group Limited Annual Report 2015
19. Controlled entities (continued)
Group interest
Name 2015
%2014
% Country of
incorporationDark Blue Sea Pty Limited 100 100 Australia
– Dark Blue Sea Enterprises Pty Limited 100 100 Australia– Fabulous Parking Pty Limited 100 100 Australia– DarkBlue.com Pty Limited 100 100 Australia– DBS Administration Pty Limited 100 100 Australia– Fabulous.com Pty Limited 100 100 Australia– Pageseeker.com Pty Limited 100 100 Australia– Protopixel Pty Limited 100 100 Australia– Roar.com Pty Limited 100 100 Australia– Fabulous.com.au Pty Limited 100 100 Australia– Yexa.com Pty Limited 100 100 Australia– Whois Privacy Services Pty Limited 100 100 Australia– Drop.com.au Pty Limited 100 100 Australia– Yexa.com.au Pty Limited 100 100 Australia– Domain Active Europe Limited 100 100 Australia
Enero Group NZ Ltd 100 100 New ZealandAustralian Business Theatre Pty Limited 100 100 Australia
– Australian Business Theatre (Hong Kong) Limited 100 100 Hong Kong– ABT Creative Consulting Co Limited 100 100 China
Enero Participacoes Ltda(i) – 100 Brazil
– The Leading Edge Consultores Ltda(i) – 100 BrazilCounterpoint Marketing & Sales Pty Limited(i) – 100 AustraliaBelong Pty Limited(i) – 100 AustraliaThe Bailey Group NZ Ltd(i) – 100 New ZealandDemonstration Plus (NZ) Pty Limited(i) – 100 New ZealandISS Marketing NZ Limited(i) – 100 New ZealandMedia Zoo Pty Limited(i) – 99.1 AustraliaCrystal Storm Pty Limited(i) – 51 AustraliaiMega Pty Ltd(i) – 100 Australia
– iMarketing Pty Limited(i) – 100 Australia
– Zearch Pty Limited(i) – 100 Australia
(i) Entities deregistered during the year.
Accounting policy Basis of consolidation (i) Business combinations Business combinations are accounted for using the acquisition method. For every business combination, the Group identifies the acquirer, which is the combining entity that obtains control of other combining entities or businesses. The acquisition date is the date on which control is transferred to the acquirer. Judgement is applied in determining the acquisition date and determining whether control is transferred from one party to another.
Goodwill arising from the business combination is measured at fair value of the consideration transferred including the recognised amount of any non-controlling interests in the acquiree, less the net recognised amount (generally fair value) of the identifiable assets acquired and liabilities assumed, all measured as of the acquisition date. Non-controlling interest is measured at its proportionate interest in the identifiable net assets of the acquiree.
Consideration transferred includes the fair values of the assets transferred, liabilities incurred by the Group to the previous owners of the acquiree, and equity interests issued by the Group. Consideration transferred also includes the fair value of any contingent consideration and
share-based payment awards of the acquiree that are replaced mandatorily in the business combination.
A contingent liability of the acquiree assumed in a business combination is recognised only if such a liability represents a present obligation and arises from a past event, and its fair value can be measured reliably.
Transaction costs incurred in connection with a business combination are expensed as incurred.
(ii) Subsidiaries Subsidiaries are entities controlled by the Group. The Group controls an entity when it is exposed to, or has rights to, variable returns from its involvement with the entity and has the ability to affect those returns through its power to direct the activities of the entity.
The financial statements of subsidiaries are included in the consolidated financial statements from the date on which control commences until the date on which control ceases.
Intra-group balances, and any unrealised gains and losses or income and expenses arising from intra-group transactions, are eliminated in preparing the consolidated financial statements.
For
per
sona
l use
onl
y

67
20. Parent entity disclosures As at, and throughout, the financial year ended 30 June 2015, the parent Company of the Group was Enero Group Limited.
The Company
In thousands of AUD 2015 2014Result of the parent entity (Loss)/profit for the year (21,591) 6,668Other comprehensive income – –Total comprehensive income for the period
(21,591) 6,668
Financial position of the parent entity at year end Current assets 7,945 9,683Total assets 97,569 116,943Current liabilities 5,996 3,970Total liabilities 9,821 8,117Total equity of the parent entity comprising of: Share capital 491,509 489,830Option reserve 12,766 13,932Accumulated losses (416,527) (394,936)
Total equity 87,748 108,826
Parent entity guarantees in respect of debts of its subsidiaries The parent entity has entered into a Deed of Cross Guarantee with the effect that the Company guarantees debts in respect of its subsidiaries.
Further details of the Deed of Cross Guarantee, and the subsidiaries subject to the deed, are disclosed in Note 21 Deed of Cross Guarantee.
Contingent liabilities Indemnities Indemnities have been provided to Directors and certain Executive Officers of the Company in respect to third parties arising from their positions, except where the liability arises out of conduct involving lack of good faith. No monetary limit applied to these agreements and there are no known obligations outstanding at 30 June 2015. 21. Deed of Cross Guarantee Pursuant to ASIC Class Order 98/1418 (as amended) dated 13 August 1998, the wholly-owned subsidiaries listed below are relieved from the Corporations Act 2001 requirements for the preparation, audit and lodgement of financial statements, and a Directors’ Report.
It is a condition of the Class Order that the Company and each of the subsidiaries enter into a Deed of Cross Guarantee. The effect of the Deed is that the Company guarantees to each creditor payment in full of any debt in the event of winding up of any of the subsidiaries under certain provisions of the Corporations Act 2001. If a winding up occurs under other provisions of the Act, the Company will only be liable in the event that after six months any creditor has not been paid in full. The subsidiaries have also given similar guarantees in the event that the Company is wound up.
The subsidiaries subject to the Deed are: – The Leading Edge Market Research Consultants Pty
Limited; and
– BMF Holdco Pty Limited.
A consolidated income statement and consolidated statement of financial position, comprising the Company and controlled entities which are party to the Deed, after eliminating all transactions between parties to the Deed of Cross Guarantee, at 30 June 2015, is set out as follows:
Summarised income statement and retained profits In thousands of AUD 2015 2014Net Revenue 26,251 32,132
Employee expenses (24,229) (28,807)
Operating and other expenses (16,869) (11,995)
Loss before tax (14,847) (8,670)Income tax benefit/(expense) 62 220
Loss after tax (14,785) (8,450)
Accumulated losses at beginning of year (409,840) (402,238)Accumulated losses relating to entities disposed during the year – 848Accumulated losses at end of year (424,625) (409,840)
Attributable to: Equity holders of the Company (14,785) (8,450)
Loss for the period (14,785) (8,450)
Statement of financial position In thousands of AUD 2015 2014Assets Cash and cash equivalents 7,492 8,679
Trade and other receivables 8,166 9,023
Other assets 618 1,044
Total current assets 16,276 18,746
Receivables 49,498 57,571
Other financial assets 5,162 8,088
Deferred tax assets 1,037 1,802
Plant and equipment 2,173 2,872
Other assets 67 168
Intangible assets 16,391 17,211
Total non-current assets 74,328 87,712
Total assets 90,604 106,458
Liabilities Trade and other payables 8,827 8,668
Interest-bearing loans and borrowings 1,414 1,153
Employee benefits 150 1,827
Provision – 222
Total current liabilities 10,391 11,870
Employee benefits 280 331
Provisions 283 335
Total non-current liabilities 563 666
Total liabilities 10,954 12,536
Net assets 79,650 93,922
Equity Issued capital 491,509 489,830
Reserves 12,766 13,932
Accumulated losses (424,625) (409,840)
Total equity 79,650 93,922
For
per
sona
l use
onl
y

Notes to the consolidated financial statements for the year ended 30 June 2015
68 Enero Group Limited Annual Report 2015
22. Commitments Operating leases Leases as lessee Commitments for minimum lease payments in relation to non-cancellable operating leases are payable as follows:
In thousands of AUD 2015 2014
Less than one year 6,209 5,655
Between one and five years 12,657 11,867
Over five years 3,588 4,994
22,454 22,516
The Group leases property under non-cancellable operating leases generally expiring in two to ten years. Generally operating leases are subject to standard two to five year renewal terms, with no purchase option or escalation clauses included.
During the year ended 30 June 2015, $6,168,000 (2014: $6,802,000) was recognised as an expense in the income statement in respect of operating leases.
Accounting policy Leases in which a significant portion of the risks and rewards of ownership are retained by the lessor are classified as operating leases. Payments made under operating leases (net of any incentives received from the lessor) are charged to the income statement on a straight-line basis over the period of the lease. 23. Deferred consideration payables The Group has not recognised an amount of $54,754,000 (2014: $52,148,000) of contingent deferred consideration liabilities as payment of these amounts is not considered probable.
The increase in the contingent deferred consideration liability as compared to the prior reporting period is in relation to the increased Australian dollar translation of foreign currency denominated liability.
Fair value measurement and key estimate During the year ended 30 June 2011, the Group entered into agreements to restructure its deferred consideration liabilities such that substantially all agreements contain caps on the total liability. The time period to calculate the potential capped liabilities has now been completed.
Fair value of future deferred consideration liabilities is estimated based on the Group achieving certain EBITDA targets. There is uncertainty around the actual payments that will be made subject to the performance of the Group subsequent to the reporting date versus the targets. Actual future payments may exceed the estimated liability. As the inputs in these valuations are not based on observable market data, this is deemed a Level 3 measurement of fair value.
24. Contingencies Contingent liabilities Indemnities Indemnities have been provided to Directors and certain Executive Officers of the Company in respect to third parties arising from their positions, except where the liability arises out of conduct involving lack of good faith. No monetary limit has been applied to these agreements and there are no known obligations outstanding at 30 June 2015.
25. Subsequent events
There has not arisen, in the interval between the end of the financial year and the date of this report, any item, transaction or event of a material and unusual nature likely, in the opinion of the Directors of the Company, to affect significantly the operations of the Group, the results of those operations, or the state of affairs of the Group in future financial years.
26. Key management personnel and other related party disclosures In addition to Executive and Non-Executive Directors, the following were key management personnel of the Group at any time during the reporting period.
Name Position
Brendan York Group Finance Director Stephen Watson
Group Strategy and Operations Director
Katie McGrath Group Human Resources Director
Other transactions with the Company or its controlled entities A number of the key management personnel, or their related entities, hold positions in other entities that result in them having control or significant influence over the financial or operating policies of those entities.
There were no transactions with the Company or its subsidiaries and key management personnel in the current or prior reporting period.
Director related party transactions There were no transactions with the Director related party during the current or prior reporting period.
The key management personnel compensation (including all Directors) is as follows: In AUD 2015 2014
Short-term employee benefits 2,654,521 2,355,000
Other long-term benefits 7,632 29,187
Post-employment benefits 109,167 99,401
Share-based payments – Share Appreciation Rights
302,495 298,469
Total share-based payments 302,495 298,469
Total key management personnel compensation
3,073,815 2,782,057
For
per
sona
l use
onl
y

69
27. Share-based payments
Equity-based plans Long-term incentives (LTI) were provided as equity-based incentives in the Company under the Share Appreciation Rights plan (SAR) in prior financial years which remain outstanding at 30 June 2015.
Share Appreciation Rights (SARs) The Share Appreciation Rights plan is designed to incentivise the Company’s senior Executives and other senior management of the Group.
The fair value of the SARs is measured using the Black-Scholes model. Measurement inputs include share price on measurement date, exercise price of the instruments, expected volatility (based on weighted average historical volatility), weighted average expected life of the instruments (based on historical experience and general option holder behaviour), expected dividends, and the risk-free interest rate (based on government bonds). Service conditions attached to the transactions are not taken into account in determining fair value.
The plan allows for the Board to determine who is entitled to participate in the SAR plan, and it may grant rights accordingly. Enero’s Board may determine whether or not the grant of rights is conditional on the
achievement of performance hurdles, and if so the nature of those hurdles.
The exercise of each right will entitle the rights holder to receive a fraction of an ordinary share based on a conversion formula of E = (A – B)/A, where:
– E is the share right entitlement;
– A is the volume weighted average price (VWAP) for the Company’s shares for the 20 business days prior to the vesting date of the rights; and
– B is the VWAP for the Company’s shares for the 20 business days before the rights were granted.
If A – B is less than or equal to zero, the share right will not vest and will immediately lapse on the applicable vesting date. One share right shall never convert into more than one share in the capital of the Company. Rights expire at 15 business days after the relevant vesting date or the termination of the individual’s employment. The Board may exercise discretion on early vesting of rights in the event of a change of control of the Group. Refer to the table below for a summary of SARs on issue.
Summary of Share Appreciation Rights on issue: Issue Date 16 January 2012 15 October 2013 16 June 2015 (i)
SARs issued 888,889 11,150,000 1,000,000
Participants CEO
CEO and senior Executives
CEO
VWAP for the 20 business days prior to the grant (B)
53 cents 71 cents n/a
Vesting dates: 20 business days after the release of the Group financial report for the year ended: Tranche 1 Tranche 2 Tranche 3
30 June 2013 – 2/9ths
30 June 2014 – 3/9ths
30 June 2015 – 4/9ths
30 June 2014 – 1/3rd 30 June 2015 – 1/3rd 30 June 2016 – 1/3rd
30 June 2016 – 1/3rd 30 June 2017 – 1/3rd 30 June 2018 – 1/3rd
Expiry 30 September 2015 30 September 2016 30 September 2018
Outstanding SARs as at 30 June 2015 395,062 4,499,993 1,000,000
(i) Grant is in relation to SARs provided to the CEO which were issued on 16 June 2015, subject to shareholder approval. Upon shareholder approval, the VWAP for the 20 business days prior to the grant date will be confirmed.
Subsidiary equity plan (equity settled)
During the year ended 30 June 2013, the Company granted an equity plan over a 25% equity interest of its subsidiary, Frank PR Limited, to the existing management. The plan aims to incentivise the senior executives of the business. The rights to equity vest as follows:
6.25% at 1 July 2011;
6.25% at 1 July 2012;
6.25% at 1 July 2013; and
6.25% at 1 July 2014.
The plan allows for the equity holders to participate in dividend distributions from profit generated by the subsidiary on a truncated profile to the vesting profile. The fair value of the Frank PR equity plan was determined using a Discounted Cash Flow valuation model adjusted for minority interest.
For
per
sona
l use
onl
y

Notes to the consolidated financial statements for the year ended 30 June 2015
70 Enero Group Limited Annual Report 2015
27. Share-based payments (continued) Share Appreciation Rights (SARs) and Employee Share Option Scheme (ESOS)
Summary of options/rights over unissued ordinary shares
Grant date Expiry date
Weighted average exercise
price
Number of Options/
Rights outstanding at beginning
of year
Options/ Rights
granted during year
Options/Rights
exercised during year
Options/ Rights
forfeited during year
Number of Options/Rights
at year end
Proceeds received
Date issued
Number of shares issued
Expected life
(years)
Options/Rights
expired during year Outstanding Vested
2015
26 Oct 2009 26 Oct
2014 $19.98 6,251 – – 6,251 – – – – – – 2–5
18 Aug 2011(i) 30 Sep
2014 $0.63 661,313 – 556,627 – 104,686 – – –
30 Sep 2015
184,704 1.1–3.1
16 Jan 2012(i) 30 Sep
2015 $0.53 691,358 – 296,296 – – 395,062 – –
30 Sep 2015
159,742 1.9–3.9
15 Oct 2013(i) 30 Sep
2016 $0.71 11,150,000 – 2,933,341 – 3,716,666 4,499,993 – –
30 Sep 2015
1,115,940 0.9–2.9
16 June 2015(ii) 30 Sep
2018 n/a – 1,000,000 – – – 1,000,000 – – – – 1.3 -3.3
12,508,922 1,000,000 3,786,264 6,251 3,821,352 5,895,055 – – 1,460,386
(i) Relates to SARs.
(ii) Grant is in relation to SARs provided to the CEO which were issued on 16 June 2015, subject to shareholder approval.
Share Appreciation Rights (SARs) and Employee Share Option Scheme (ESOS)
Summary of options/rights over unissued ordinary shares
Grant date Expiry date
Weighted average exercise
price
Number of Options/
Rights outstanding at beginning
of year
Options/ Rights
granted during year
Options/Rights
exercised during year
Options/ Rights
forfeited during year
Number of Options/Rights
at year end
Proceeds received
Date issued
Number of shares issued
Expected life
(years)
Options/Rights
expired during year Outstanding Vested
2014
17 Oct 2006 30 Sep 2011–
30 Sep 2012 $65.52 13,889 – – 13,889 – – – – – – 3.5–6.5
1 Oct 2008 30 Sep 2013 $33.12 5,279 – – 5,279 – – – – – – 2–5
30 Jun 2009 30 Jun 2014 $11.16 8,333 – – – 8,333 – – – – – 2–5
26 Oct 2009 26 Oct 2014 $19.98 6,251 – – – – 6,251 6,251 – – – 2–5
18 Aug 2011(i) 30 Sep 2014 $0.63 1,840,737 – – 788,885 390,539 661,313 – – – – 1.1–3.1
16 Jan 2012(i) 30 Sep 2015 $0.53 888,889 – – 197,531 – 691,358 – – – – 1.9–3.9
15 Oct 2013(i) 30 Sep 2016 $0.71 – 11,150,000 – – – 11,150,000 – – – – 0.9–2.9
2,763,378 11,150,000 – 1,005,584 398,872 12,508,922 6,251 – –
(i) Relates to SARs.
The number and weighted average exercise price of share options/rights is as follows:
Weighted average exercise
price 2015$
Number of options/rights
2015
Weighted average exercise price
2014 $
Number of options/rights
2014Outstanding at 1 July 0.71 12,508,922 0.94 2,763,378Forfeited during the period 0.71 (3,821,352) 0.85 (398,872)Expired during the period 19.98 (6,251) 1.33 (1,005,584)Exercised during the period 0.68 (3,786,264) – –Granted during the period n/a 1,000,000 0.71 11,150,000Outstanding at 30 June 0.70 5,895,055 0.71 12,508,922Exercisable at 30 June – – 19.98 6,251
The options outstanding at 30 June 2015 have an exercise price in the range of $0.53 to $0.71 (30 June 2014: $0.53 to $19.98) and a weighted average contractual life of 0.97 years (30 June 2014: 1.18 years).
The fair value of services received in return from SARs granted is based on the fair value of SARs, measured using the Black-Scholes model.
The total net expenses recognised by the Group for the year ended 30 June 2015 for share-based payment transactions was $1,121,000 (2014: $1,453,000).
The weighted average share price at the date of exercise of SARs was $1.15.
For
per
sona
l use
onl
y

71
Inputs for measurement of grant date fair value The following factors and assumptions were used in determining the fair value of the SARs on the grant date:
Grant date Expiry date Value per option
$
Exercise price
$
Price of shares on grant date
$
Expected volatility
%
Risk-free interest rate
%
Dividend yield
%
Expected life
(years)
15 Oct 2013(i) 30 Sept 2016 0.16 – 0.29 0.71 0.70 60 2.49–2.91 0.0 0.9–2.916 June 2015(ii) 30 Sept 2018 0.16 – 0.29 n/a n/a 60 2.49–2.91 0.0 1.3 -3.3
(i) Grant is in relation to SARs provided to senior employees of the Group which were issued on 15 October 2013. The last expiry date of the rights is 20 business days after the release of the Group’s financial report for the year ended 30 June 2016, which is estimated to be around 30 September 2016.
(ii) Grant is in relation to SARs provided to the CEO which were issued on 16 June 2015, subject to shareholder approval. The last expiry date of the rights is 20 business days after the release of the Group’s financial report for the year ended 30 June 2018, which is estimated to be around 30 September 2018. The value per right is estimated as the grant has not been approved by shareholders.
Accounting policy The grant date fair value of share-based payment awards granted to employees is recognised as an employee expense, with a corresponding increase in equity, over the period that the employees unconditionally become entitled to the awards. The amount recognised as an expense is adjusted to reflect the number of awards for which the related service and non-market vesting conditions are expected to be met, such that the amount ultimately recognised as an expense is based on the number of awards that meet the related services and non-market performance conditions at the vesting date. For share-based payment awards with non-vesting conditions, the grant date fair value of the share-based payment is measured to reflect such conditions and there is no true-up for differences between expected and actual outcomes. Fair value measurement and key estimates The grant date fair value of employee share rights is measured using the Black-Scholes model. This value is determined by an appropriately qualified independent expert commissioned by the Directors. Inputs to the determination of fair value are subjective and include the market value of the Company share price on the grant date, expected volatility (based on weighted average historic volatility adjusted for changes expected due to publicly available information) of the Company’s share price, the risk-free interest rate, the dividend yield, the expected life of the share rights, the probability of occurrence of certain events and the exercise price. Service and non-market performance conditions attached to the transactions are not taken into account in determining fair value. Certain of these inputs are estimates.
The Directors review the methodologies used by the expert and make enquiries with management to assure themselves that the factual information used by the expert is correct prior to relying on the expert’s opinion.
28. Auditor’s remuneration
In AUD 2015 2014Audit services – auditors of the Company KPMG Australia 261,000 256,000Overseas KPMG firm(i) 160,000 134,000
421,000 390,000
Other services – auditors of the Company
Taxation compliance services: KPMG Australia 30,000 30,000Overseas KPMG firm 166,000 197,000
Transaction and due diligence service: KPMG Australia 7,000 7,000Overseas KPMG firm 3,000 3,000
206,000 237,000
(i) The increase in the remuneration to overseas KPMG firm as compared to the prior reporting period is in relation to the increased Australian dollar translation of foreign currency denominated fees. F
or p
erso
nal u
se o
nly

Directors’ Declaration
72 Enero Group Limited Annual Report 2015
1. In the opinion of the Directors of Enero Group Limited (the Company):
(a) the consolidated financial statements and notes, set out on pages 37 to 71 and the Remuneration Report in the Directors’ Report, set out on pages 25 to 36, are in accordance with the Corporations Act 2001, including:
(i) giving a true and fair view of the Group’s financial position as at 30 June 2015 and of its performance for the financial year ended on that date; and
(ii) complying with Australian Accounting Standards (including the Australian Accounting Interpretations) and the Corporations Regulations 2001; and
(b) there are reasonable grounds to believe that the Company will be able to pay its debts as and when they become due and payable.
2. There are reasonable grounds to believe the Company and entities identified in Note 21 will be able to meet any obligations or liabilities to which they are or may become subject by virtue of the Deed of Cross Guarantee between the Company and those entities pursuant to ASIC Class Order 98/1418.
3. The Directors have been given the declarations by the Chief Executive Officer and Chief Financial Officer for the financial year ended 30 June 2015 pursuant to section 295A of the Corporations Act 2001.
4. The Directors draw attention to Note 1(b) to the consolidated financial statements, which includes a statement of compliance with International Financial Reporting Standards.
Dated at Sydney this 25th day of August 2015.
Signed in accordance with a resolution of the Directors:
John Porter
Chairman
For
per
sona
l use
onl
y

Independent Auditor’s Report to the members of Enero Group Limited
73
For
per
sona
l use
onl
y

Independent Auditor’s Report to the members of Enero Group Limited
74 Enero Group Limited Annual Report 2015
For
per
sona
l use
onl
y

Lead Auditor’s independence declaration under section 307 of the Corporations Act 2001
75
For
per
sona
l use
onl
y

ASX additional information
76 Enero Group Limited Annual Report 2015
Additional information required by the Australian Securities Exchange Limited Listing Rules and not disclosed elsewhere in this report is set out below. The shareholder information set out below was applicable at 31 July 2015.
Substantial shareholders The number of ordinary shares held by substantial shareholders and their associates is set out below:
Shareholder Number
RG Capital Multimedia Limited 20,823,268
NAOS Asset Management 13,785,143
Perpetual Limited 12,751,832
Contango Asset Management Limited 5,813,263
Unquoted equity securities
As at 31 July 2015 there were no options granted over unissued ordinary shares in the Company.
Voting rights
Ordinary shares – refer to Note 14 Capital and reserves.
Distribution of equity security holders: Number of equity security holders
Range Ordinary shares1–1,000 269,8071,001–5,000 862,1915,001–10,000 1,022,29310,001–100,000 5,143,857100,001 and over 78,306,806
The number of shareholders holding less than a marketable parcel of ordinary shares is 1,045.
Twenty largest shareholders
Rank Name Units % of issued
capital1 Citicorp Nominees Pty Limited 13,920,076 16.262 RBC Investor Services Australia Nominees Pty Ltd <PICREDIT> 12,627,546 14.753 National Nominees Limited 6,856,853 8.014 Equitas Nominees Pty Limited <2946694 A/C> 6,759,020 7.905 RG Capital Multimedia Limited 4,511,945 5.276 Bell Potter Nominees Ltd <BB Nominees A/C> 4,186,104 4.897 Equitas Nominees Pty Limited <821471 A/C> 3,703,272 4.338 Love Pty Limited <Enero Employee A/C> 3,324,147 3.889 CH Global Pty Ltd <The ABC Investment A/C> 2,548,301 2.98
10 J P Morgan Nominees Australia Limited 2,313,183 2.7011 Felice Testini <GAT Family A/C> 1,632,000 1.9112 BNP Paribas Noms Pty Ltd <DRP> 1,601,473 1.8713 Sandhurst Trustees Ltd <TBF Small Cap Val Grwth A/C> 1,430,000 1.6714 Bond Street Custodians Limited <Forager Wholesale Value FD> 1,249,687 1.4615 Teldar Corporation Pty Limited <Teldar Investment A/C> 1,100,000 1.2816 Bond Street Custodians Limited <Laman D05019 A/C> 782,537 0.9117 Henawall Pty Limited 722,000 0.8418 Irish Global Equity Limited 632,629 0.7419 Antonia Collopy 600,000 0.7020 RG Capital Multimedia Limited 600,000 0.70
Total 71,100,773 83.06
For
per
sona
l use
onl
y

Company SecretaryBrendan York
Principal Registered OfficeEnero Group LimitedLevel 3, 1 Buckingham StreetSurry Hills NSW 2010 AustraliaTelephone: +61 2 8213 3031Facsimile: +61 2 8213 3030
Share RegistryComputershare Investor Services Pty LimitedLevel 3, 60 Carrington StreetSydney NSW 2000 AustraliaTelephone: 1300 855 080Outside Australia: +61 3 9415 4000Facsimile: +61 2 8234 5050
As of Monday 14 September 2015, the Company’s share registry will be available from:
Link Market Services LimitedLocked Bag A14Sydney South NSW 1235 AustraliaTelephone: 1300 554 474Outside Australia: +61 2 8280 7111Facsimile: +61 2 9287 0303
Securities ExchangeThe Company is listed on the Australian Securities Exchange (ASX Code: EGG).The home exchange is Sydney.
Other InformationEnero Group Limited, incorporated and domiciled in Australia, is a publicly listed company limited by shares.
SolicitorsGilbert + Tobin2 Park StreetSydney NSW 2000 Australia
AuditorsKPMG10 Shelley StreetSydney NSW 2000 Australia
CORPORATE DIRECTORY
For
per
sona
l use
onl
y

Enero G
rou
p Lim
ited A
NN
UA
L REPO
RT
2015
For
per
sona
l use
onl
y