For personal use only - ASX · 2014-05-15 · America Central and South America % of all floor...
37
Iluka’s Approach in a Changing Industry David Robb, Managing Director and CEO, Iluka Resources Limited (ASX: ILU) Bank of America Merrill Lynch Global Metals, Mining and Steel Conference Florida, May 2014 For personal use only
Transcript of For personal use only - ASX · 2014-05-15 · America Central and South America % of all floor...

Iluka’s Approach in a Changing Industry
David Robb, Managing Director and CEO, Iluka Resources Limited (ASX: ILU)
Bank of America Merrill Lynch Global Metals, Mining and Steel Conference
Florida, May 2014
For
per
sona
l use
onl
y
2
Disclaimer – Forward Looking Statements
Forward Looking Statements
This presentation contains certain statements which constitute “forward-looking statements”. These statements include, without limitation, estimates of future
production and production potential; estimates of future capital expenditure and cash costs; estimates of future product supply, demand and consumption; statements
regarding future product prices; and statements regarding the expectation of future Mineral Resources and Ore Reserves.
Where Iluka expresses or implies an expectation or belief as to future events or results, such expectation or belief is expressed in good faith and on a reasonable
basis. No representation or warranty, express or implied, is made by Iluka that the matters stated in this presentation will in fact be achieved or prove to be correct.
Forward-looking statements are only predictions and are subject to risks, uncertainties and other factors, which could cause actual results to differ materially from
future results expressed, projected or implied by such forward-looking statements. Such risks and factors include, but are not limited to:
• changes in exchange rate assumptions;
• changes in product pricing assumptions;
• major changes in mine plans and/or resources;
• changes in equipment life or capability;
• emergence of previously underestimated technical challenges; and
• environmental or social factors which may affect a licence to operate.
Except for statutory liability which cannot be excluded, Iluka, its officers, employees and advisers expressly disclaim any responsibility for the accuracy or
completeness of the material contained in this presentation and exclude all liability whatsoever (including in negligence) for any loss or damage which may be suffered
by any person as a consequence of any information in this presentation or any error or omission there from.
Iluka does not undertake any obligation to release publicly any revisions to any forward-looking statement to reflect events or circumstances after the date of this
presentation, or to reflect the occurrence of unanticipated events, except as may be required under applicable securities laws.
For
per
sona
l use
onl
y

3
Industry Themes
• Demand robust medium/long term
• Short term volatility (economies, inventory effects)
• Pigment – ownership, geography, technology shifts
• Feedstock – quality diminishing, pipeline emptying, risk increasing
• Zircon – assemblage decline, tile manufacturing transformations
• Technology to play a bigger role
For
per
sona
l use
onl
y

4
Robust Demand Long Term
Array of applications
Consumption based growth Urbanisation
ZIRCON ceramics, range of chemical and consumer applications
TITANIUM DIOXIDE pigment paint, plastics coatings
MINERAL SANDS Mid-to-late cycle demand characteristics; consumption/GDP related
For
per
sona
l use
onl
y

5
Urbanisation
1Source: McKinsey Global Institute June 2012
• Largest demographic
movement in history
• Massive increases in
built floor space –
equivalent to 85% of
today’s building
stocks by 20251
—
10
20
30
40
2010 2015 2020 2025
Billion sqm
CHINA URBAN RESIDENTIAL FLOOR SPACE
Source: Global Insight (2011), BHP (2011), RBS (2012)
0%
20%
40%
60%
80%
WorldAverage
China AsiaPacific
WesternEurope
EasternEurope
NorthAmerica
Centraland
SouthAmerica
% of all floor covering
Tile Use as Floor Covering
Source: Ceramic World Review (2000-11)
CHINA URBAN RESIDENTIAL
FLOOR SPACE
TILE USE AS FLOOR
COVERING
For
per
sona
l use
onl
y

6
Consumption Led Growth
• Developing economies - from investment to consumption based growth
• Rising incomes and living standards create an S-curve demand trend
• “The next billion consumers” – influential for mineral sands
0.0
1.0
2.0
3.0
4.0
5.0
6.0
7.0
0 5,000 10,000 15,000 20,000 25,000 30,000 35,000
Europe (1993-2010) China (1993-2010) USA (1993-2010)
Kgs per Capita
GDP per Capita (US$; real 1990 terms; at PPP)
China
Europe
USA
TiO2 or Pigment Feedstocks: Intensity of Use Motor Vehicles Per Capita
Period 2010/11
For
per
sona
l use
onl
y
7
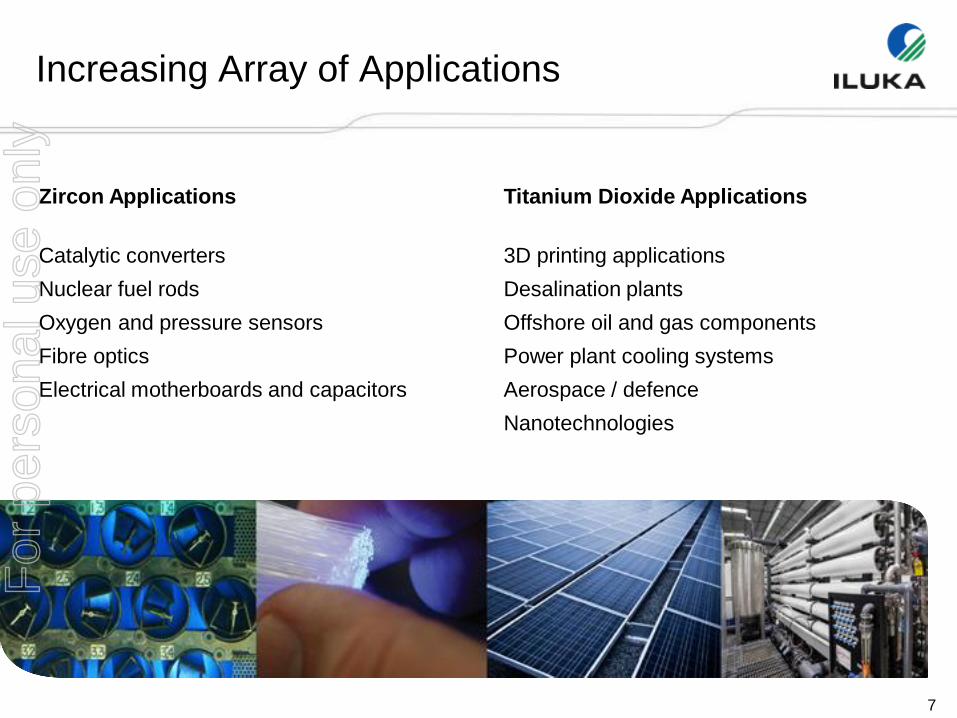
Increasing Array of Applications
Zircon Applications
Catalytic converters
Nuclear fuel rods
Oxygen and pressure sensors
Fibre optics
Electrical motherboards and capacitors
Titanium Dioxide Applications
3D printing applications
Desalination plants
Offshore oil and gas components
Power plant cooling systems
Aerospace / defence
Nanotechnologies
For
per
sona
l use
onl
y

8
A Volatile World
• Most radical restructuring of global economy since Industrial Revolution
• 1 billion Chinese and Indian middle class consumers by 2020
– Equals +$10 trillion GDP
• Global turbulence increasing over past 30 years:
– >50% of most turbulent quarters in past decade
– Intensity > 2X
– Duration 4X
For
per
sona
l use
onl
y

9
Volatile Growth
• Economic cycles are ‘ normal’
– last few years particularly volatile
• Inventory Bullwhip:
– multiple decision/transfer points
– information shortage/asymmetry
– competitive tactics, psychology
-20
-10
0
10
198
0
198
1
198
2
198
3
198
4
198
5
198
6
198
7
198
8
198
9
199
0
199
1
199
2
199
3
199
4
199
5
199
6
199
7
199
8
199
9
200
0
200
1
200
2
200
3
200
4
200
5
200
6
200
7
200
8
200
9
201
0
201
1
201
2
201
3
Growth % United States GDP and Industrial Production
United States: Industrial Production GrowthUnited States: Real GDP Growth5 per. Mov. Avg. (United States: Industrial Production Growth)5 per. Mov. Avg. (United States: Real GDP Growth)
2 4 6 8 10 12 14
For
per
sona
l use
onl
y
10
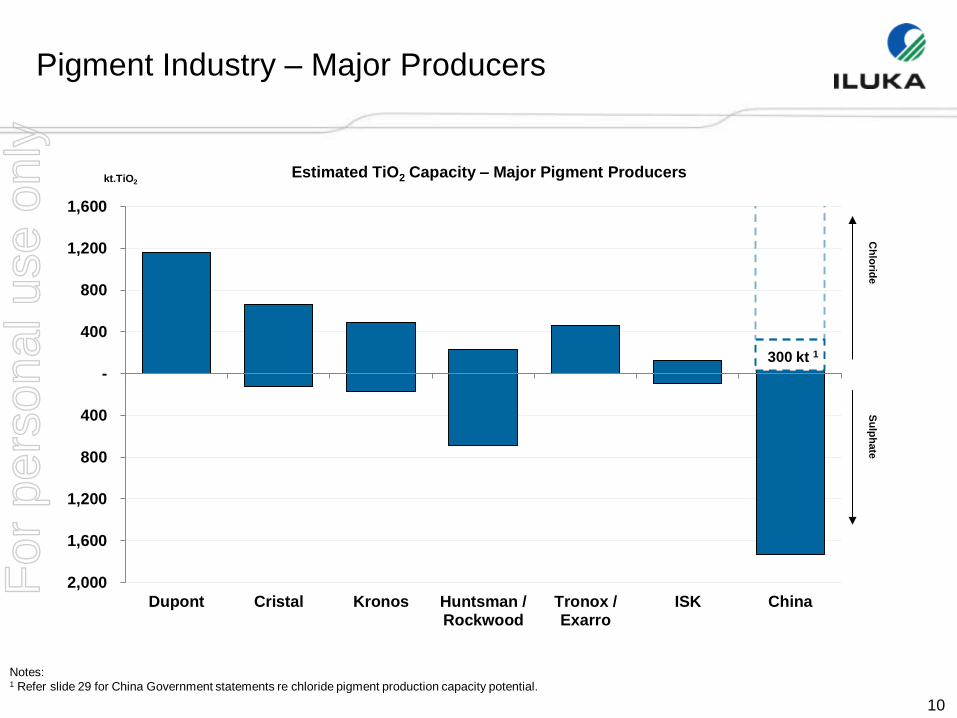
2,000
1,600
1,200
800
400
-
400
800
1,200
1,600
Dupont Cristal Kronos Huntsman /Rockwood
Tronox /Exarro
ISK China
Pigment Industry – Major Producers
Estimated TiO2 Capacity – Major Pigment Producers kt.TiO2
Ch
lorid
e
Su
lph
ate
Notes: 1 Refer slide 29 for China Government statements re chloride pigment production capacity potential.
300 kt 1
For
per
sona
l use
onl
y
11
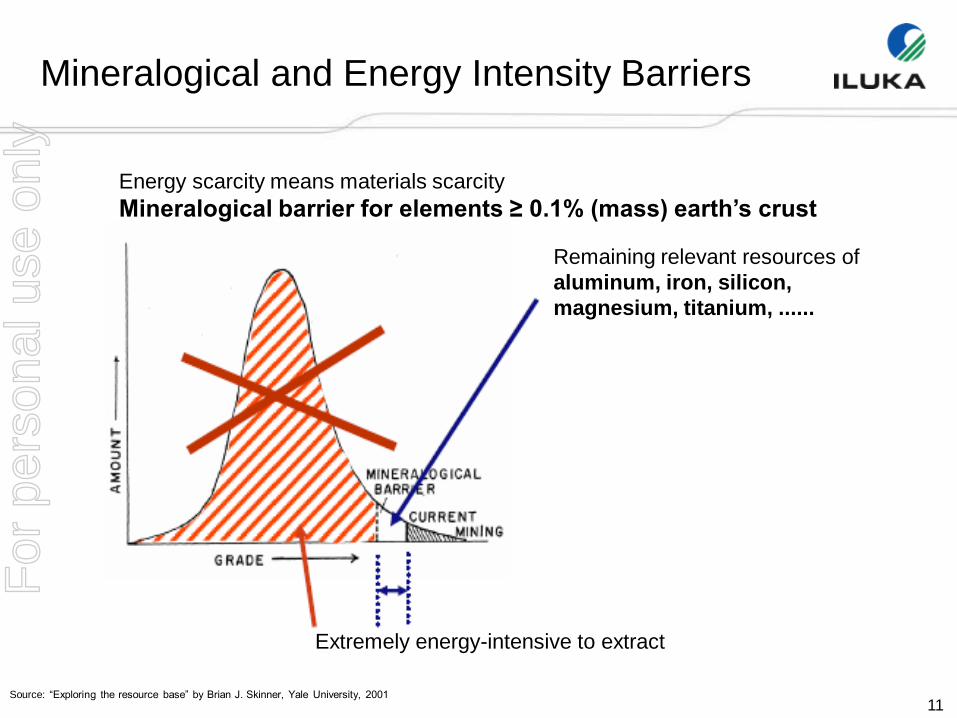
Mineralogical and Energy Intensity Barriers
Energy scarcity means materials scarcity
Mineralogical barrier for elements ≥ 0.1% (mass) earth’s crust
Remaining relevant resources of
aluminum, iron, silicon,
magnesium, titanium, ......
Source: “Exploring the resource base” by Brian J. Skinner, Yale University, 2001
Extremely energy-intensive to extract
For
per
sona
l use
onl
y

12
Grade and Assemblage Challenges Ahead
• Trash component in Heavy Mineral grade increasing
• Valuable Heavy Mineral Grades declining
• Zircon / high grade TiO2 assemblages reducing
13%
9%
6%
0%
3%
6%
9%
12%
15%
0.0%
1.0%
2.0%
3.0%
4.0%
5.0%
Current Operations Active Investigation Limited Information
RZ Assemblage HM Grade Mineral assemblage in resources
Trash
Sulphate Ilmenite
Chloride Ilmenite
Rutile
Zircon
Combined RZ in HM (RHS)
(and other high grade TiO2)
Potential Supply
For
per
sona
l use
onl
y

13
Increasing Supply Chain Risk and Cost
9%
USA
15%
13% 19%
Canada
South
Africa
Mozambique
Sierra
Leone
Ukraine
India
China
Australia
Insignificant / low
Medium
High / extreme
IHS Political / operational risk
TiO2 units produced (2020 Forecast)
6%
8%
5%
Norway
Africa: 30%
Kenya
Sri Lanka Vietnam
Kalimantan
7%
Source: Iluka and TZMI (2011), IHS Control Risks (June 2013)
For
per
sona
l use
onl
y

14
Iluka’s Approach
• Focus on shareholder returns through the cycle
• Flex asset operation in line with market demand
• Continue market development through the cycle
• Maintain strong balance sheet
• Preserve/advance mineral sands growth opportunities
• Continue to evaluate/pursue corporate growth opportunities
• Act counter-cyclically where appropriate
For
per
sona
l use
onl
y

15
Iluka’s Approach – Managing the Cycle
• Focus on shareholder returns through the cycle
• Flex asset operation in line with market demand
• Continue market development through the cycle
• Maintain strong balance sheet
• Preserve/advance mineral sands growth opportunities
• Continue to evaluate/pursue corporate growth opportunities
• Act counter-cyclically where appropriate
For
per
sona
l use
onl
y

16
Managing the Cycle
The recent cycle extreme….but an industry in transformation
Annual Average Selected Mineral Sands Prices, to end 2013
0
500
1000
1500
2000
2500
3000
1980 1983 1986 1989 1992 1995 1998 2001 2004 2007 2010 2013
US$/t
Zircon Rutile Synthetic Rutile
Source: Iluka and TZMI
Long term legacy
TiO2 Contracts
Iluka adopts shorter
dated pricing; zircon
leads way then TiO2
Multi-tier markets emerge;
inventory builds as demand
slower than expected
Finding a floor
Source: Iluka
For
per
sona
l use
onl
y

17
Minimal Raw Material Costs in End Products
Source: Iluka estimates and Ceramics Tile Survey 2013
tiles
For
per
sona
l use
onl
y

18
Flex Production in Light of Market Demand
• Supply flexibility, not chasing the marginal tonne
• Significant production reduction – Iluka and some other industry participants
• Iluka maintains rapid reactivation capability
67%
reduction 52%
reduction
Sales profile (rutile and synthetic rutile) Sales profile - zircon
For
per
sona
l use
onl
y

19
63%
reduction
Relates to ~ $200m to ~$250m average p.a. sustaining and
growth capital expenditure, which is both an historical average
and expectation for the company’s 2014-2018 corporate
planning cycle. The $200m level shown on the chart.
40%
reduction
Cash Conservation Focus
While preserving growth objectives
• Balance unit cash cost efficiencies with inventory objectives
• Preserve cash – keep growth options on track
For
per
sona
l use
onl
y

20
Creating a Strong Balance Sheet
Sources and Use of Funds
(45)
(30)
(15)
-
15
30
45
(600)
(400)
(200)
-
200
400
600
Ave 2002 - 2007 Ave 2008 - 2010 Ave 2011 - 2013
Gearing (%) A$m
Cash from operations Disposals Equity issued
Tax refund Net debt drawn Tax paid
Net capex Share purchases/acquisitions Dividends paid
Net debt repaid Net cash/net debt Gearing
For
per
sona
l use
onl
y

21
Debt Profile
Balance Sheet and Capital Management
Capital Management Cumulative 76% of Free Cash Returned since 2010
Distribution Metrics FCF NPAT
Cumulative dividend payout ratio (2010 -2013) (%) 76 55
Cumulative retained free cash flow (2010 -2013)($m) 172 N/A
For
per
sona
l use
onl
y

22
Iluka Approach – Eyes on the Horizon
• Focus on shareholder returns through the cycle
• Flex asset operation in line with market demand
• Continue market development through the cycle
• Maintain strong balance sheet
• Preserve/advance mineral sands growth opportunities
• Continue to evaluate/pursue corporate growth opportunities
• Act counter-cyclically where appropriate
For
per
sona
l use
onl
y

23
Market Development
• Expansion of global offices / logistics
– 13 warehouses
– 6 marketing offices
• Dedicated zircon and TiO2 sales teams
• Improving market analysis
• Expanded customer base
• ‘Long tail’ capability
For
per
sona
l use
onl
y

24
Digital Printing of Ceramics
• Global shift
– strong growth rate since 2010
– highest penetration in Spain and Italy
– but by end-2012, global application only at ~12%
– rapid China adoption expected from current low level
• Positive for zircon demand in ceramics and higher
demand for opaque frits (for engobe and glazes)
– higher zircon loading in body or engobe of tiles
– materially higher zircon loadings than conventional
printing techniques
– zircon used in printer inks
– flexibility in design & manufacture, plus quality, may see
shift from lower zircon intensity tiles (e.g. from low-
zircon soluble salts & unglazed tiles)
Source: CWR, Asian Ceramics, Ceramic Town Weekly
Note: Simplified assumption of 2.5 M sqm per annum output per production line and
average of 3 digital printers per production line (per obtained industry intelligence)
GLOBAL ADOPTION OF DIGITAL PRINTING CHARACTERISTICS
For
per
sona
l use
onl
y

25
Digital Printing of Ceramics
For
per
sona
l use
onl
y

26
Zircon Loading in Tiles
Zircon content of digitally printed and non-digitally printed tiles1,2 Zircon Intensity in Ceramic Tiles
Source: TZMI and Ceramic World Review
Source: Iluka
Notes:
1 This slide charts the distribution of zircon loadings for conventionally printed and digitally printed tiles, from Iluka’s 2013 ceramics tile survey.
The zircon distribution is shown as grams/sqm (data excluded for proprietary reasons).
2 The mean of conventionally printed tile zircon loadings is shown as 100. Digitally printed mean zircon loading is shown as 180, hence 80% higher than the mean
of conventionally printed tiles. The low and high zircon loadings for both types of tiles are shown in the table at 5% and 95% confidence intervals.
Mean = 100 Mean = 180
Zircon Loadings (Indexed to 100)
Low Mean High
Conventionally Printed 65 100 135
Digitally Printed 140 180 210 For
per
sona
l use
onl
y

27
Market Development – China Pigment
• Sichuan is largest pigment
producer due to proximity to
largest reserves, although high
sulfuric acid cost.
• Coastal producers (Shandong,
Jiangsu, Zhejiang, Shanghai,
Guangdong & Liaoning) benefit
from lower logistics and access to
feedstock imports.
Source: CM Study
For
per
sona
l use
onl
y

28
Market Development – China Pigment
*MIIT: Ministry of Industry and Information Technology
Sulphate Pigment Large Installed Base
SITUATION
• Largest pigment producer globally - sulphate
• Reliant on imported feed stocks ~1/3rd of requirements
INFLUENCES
• Installed sulphate base will be retained in the main
• Less efficient component rationalised
• Need for high quality ilmenite / upgraded feed stocks
ELEMENTS OF ILUKA’S APPROACH
• Sulphate ilmenite sales
• Acid Soluble Synthetic Rutile (ASSR)
• Sri Lanka – sulphate resource
Emergent Chloride Pigment Industry
SITUATION
• Minimal existing in-country chloride production
• China dependent almost exclusively on imports
• World’s largest car manufacturers use chloride
• MIIT* anticipates 300ktpa chloride capacity by 2014
INFLUENCES
• Acquisition of best technology
• China Government imperative
• Need for high grade imported feedstocks
ELEMENTS OF ILUKA’S APPROACH
• Detailed analysis
• Develop relationships
• Focus on current and potential new producers
• Rutile and synthetic rutile trial supply
For
per
sona
l use
onl
y

29
China Pigment - Chloride Growth Directive
Chloride Process Projects in China
2.2 mtpa Chloride pigment capacity possible by 2020
• Jan 2011, MIIT published “Cleaner Production
Technology Implementation Scheme for Five
Industries Including Titanium Dioxide”, stating:
by 2014, it is anticipated that TiO2 production
capacity using the chloride process will reach
300 kt/year…
• March 2011, NDRC published the “Directory
Catalogue on Readjustment of Industrial
Structure, (2011 version No. 9)”, stating:
Encouraging the production line of TiO2 with
the chloride process, having over 30 kt/year
capacity for each production line and using
Ti-rich materials with minimum 90% TiO2
content, such as synthetic rutile, natural rutile
and titanium-rich slag. Restricting newly
constructed facilities for production of
sulphate Ti pigment.
Source: CM Study
For
per
sona
l use
onl
y

30
Advance Mineral Sands Growth Opportunities
Exploration
• International and Australian programme
• 50 explorationists, funding available for consistent search
• 50 thousand square kilometres of tenements in Australia
• International reconnaissance / exploration – 11 countries
• Sri Lanka tenement acquisition
• New commodities team
For
per
sona
l use
onl
y

31
Advance Mineral Sands Growth Opportunities
2 in USA Utilisation of
existing
infrastructure
3 in AUSTRALIA Utilisation of existing infrastructure
Internal Mineral Sands Projects – 5 at advanced evaluation
For
per
sona
l use
onl
y

32
Innovation and Technology
• Industry Level
– Zircon Industry Association
– Ceramics zircon intensity surveys
• Company Level
– New processing technologies/capabilities (e.g. ASSR)
– New production technologies
– Downstream opportunities (such as Metalysis)
For
per
sona
l use
onl
y
33
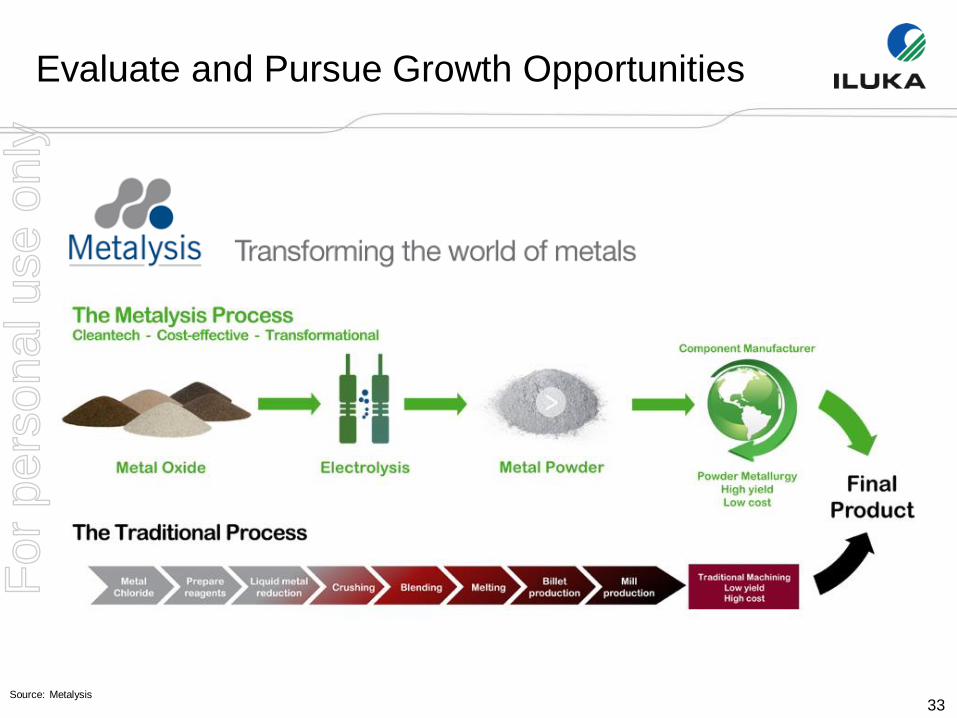
Evaluate and Pursue Growth Opportunities
Source: Metalysis
For
per
sona
l use
onl
y

34
Metalysis
• 18.3% equity interest – A$22.5m
• Mineral sands adjacencies
• “Right” stage of development
• Titanium powder directly from rutile
• Potentially disruptive technology
• Potential new demand for R/SR
• Iluka can contribute more than cash
– supply of high grade feedstocks
– process engineering
– project management
– product development
– global marketing Current Ti metal
Potential Ti metal
Other
Time
2
4
6
8
10
100
12
110
120
Market Size (US$B)
Potential future markets for Ti powder/metal
Includes: - 3D printing - Rare earths licencing - Other metals licencing - Stainless steel - Aluminium alloys
Includes: - conventional titanium market - duplex stainless steel displacement
- high performance alloys displacement
* McKinsey Global Institute, Disruptive Technologies, May 2013
KEY MARKETS – GLOBAL SIGNIFICANCE ILUKA STRATEGIC FIT & BENEFITS
Source: Metalysis, TZMI, Roskill, Iluka research
For
per
sona
l use
onl
y

35
Industry is Changing
• Demand robust medium/long term
– urbanisation, consumerism, application diversity
• Short term volatility (economies, inventory effects)
– ‘down’ cycle ending
• Pigment – ownership, geography, technology shifts
– China factor
• Feedstock – quality diminishing, pipeline emptying, risk increasing
– supply cost and availability challenge
• Zircon – assemblage decline, tile manufacturing transformations
– intensity of use additive to demand, leaner resources to supply
• Technology to play a bigger role
For
per
sona
l use
onl
y

36
Iluka’s Approach
• Focus on shareholder returns through the cycle
• Flex asset operation in line with market demand
• Continue market development through the cycle
• Maintain strong balance sheet
• Preserve/advance mineral sands growth opportunities
• Continue to evaluate/pursue corporate growth opportunities
• Act counter-cyclically where appropriate
For
per
sona
l use
onl
y

37
Download the I luka Investor Relations guide
The I luka Investor Relations Guide (App) for Apple iPad
and other table devices provides online and offline access
to company information, including the latest news and
events.
The App can be downloaded from the Apple App Store or
Google Play Store by searching “ I luka Investor Relations
Guide” .
The I luka Investor Relations Guide is designed for those
wishing to gain an understanding of the main elements
of the company, its assets, industr y context and basis for
shareholder value generation.
Information available on the App includes:
n I luka’s investment proposition, company and
shareholder alignment and capital management
framework;
n company outline, resource base and operations;
n mineral sands industr y overview;
n I luka’s sales and marketing strategy and customer base;
n historical financials and company presentations;
n latest ASX releases; and
n calendar of events.
ILUKA INVESTOR RELATIONS GUIDE (APP)
For further information contact:
Dr Robert Porter
General Manager Investor Relations
+61 3 9225 5008 / +61 (0) 407 391 829
www.iluka.com
For
per
sona
l use
onl
y