For Peer Review - activehealthykidsscotland.co.uk · 31 The Report Cards were developed using a...
62
For Peer Review Report Card Grades on the Physical Activity of Children and Youth Comparing 30 Very High Human Development Index Countries Journal: Journal of Physical Activity & Health Manuscript ID JPAH.2018-0431 Manuscript Type: Original Research Keywords: youth, physical activity, sedentary behavior Human Kinetics, 1607 N Market St, Champaign, IL 61825 Journal of Physical Activity and Health
Transcript of For Peer Review - activehealthykidsscotland.co.uk · 31 The Report Cards were developed using a...

For Peer Review
Report Card Grades on the Physical Activity of Children and
Youth Comparing 30 Very High Human Development Index Countries
Journal: Journal of Physical Activity & Health
Manuscript ID JPAH.2018-0431
Manuscript Type: Original Research
Keywords: youth, physical activity, sedentary behavior
Human Kinetics, 1607 N Market St, Champaign, IL 61825
Journal of Physical Activity and Health
For Peer Review
RUNNING HEAD: Very High HDI Country Physical Activity Grades for Children and Youth
1
Report Card Grades on the Physical Activity of Children and Youth Comparing 30 Very High 1
Human Development Index Countries 2
Original Research 3
Key words 4
Children physical activity, sedentary behavior, international comparison, Report Card, Global Matrix 5
Abstract word count: 198 words 6
Manuscript word count: 8,320 words 7
Date of manuscript submission: August 3rd
, 2018 8
9
10
11
12
13
14
15
16
17
18
19
20
21
22
23
24
Page 1 of 61
Human Kinetics, 1607 N Market St, Champaign, IL 61825
Journal of Physical Activity and Health
123456789101112131415161718192021222324252627282930313233343536373839404142434445464748495051525354555657585960

For Peer Review
RUNNING HEAD: Very High HDI Country Physical Activity Grades for Children and Youth
2
Abstract 25
Background 26
To better understand the childhood physical inactivity crisis, Report Cards on physical activity of children 27
and youth were prepared concurrently in 30 very high HDI countries. The aim of this article was to 28
present, describe, and compare the findings from these Report Cards. 29
Methods 30
The Report Cards were developed using a harmonized process for data gathering, assessing, and assigning 31
grades to ten common physical activity indicators. Descriptive statistics were calculated after converting 32
letter grades to interval variables, and correlational analyses between the ten common indicators were 33
performed using Spearman's rank correlation coefficients. 34
Results 35
A matrix of 300 grades was obtained with substantial variations within and between countries. Low 36
grades were observed for behavioral indicators, and higher grades were observed for sources of influence 37
indicators, indicating a disconnect between supports and desired behaviors. 38
Conclusion 39
This analysis summarizes the level and context of the physical activity of children and youth among very 40
high HDI countries, and provides additional evidence that the situation regarding physical activity in 41
children and youth is very concerning. Unless a major shift to a more active lifestyle happens soon, a high 42
rate of non-communicable diseases can be anticipated when this generation of children reaches adulthood. 43
44
45
46
47
48
49
Page 2 of 61
Human Kinetics, 1607 N Market St, Champaign, IL 61825
Journal of Physical Activity and Health
123456789101112131415161718192021222324252627282930313233343536373839404142434445464748495051525354555657585960

For Peer Review
RUNNING HEAD: Very High HDI Country Physical Activity Grades for Children and Youth
3
Introduction 50
A compelling body of empirical work shows moderate to high levels of physical activity to be associated 51
with a lower risk of cardiovascular disease and all-cause mortality among adults.1 Conversely, physical 52
inactivity has been recognized by some as “the biggest public health problem of the 21st century”.2,3
53
Among school-aged children and adolescents, meeting physical activity guidelines is associated with 54
positive physical, psychological, social, and cognitive health indicators4,5
while physical inactivity, 55
defined as not meeting physical activity guidelines, is associated with adverse physical, mental, social and 56
cognitive health outcomes.4–7
57
58
The Human Development Index (HDI) is a composite index, ranging from zero to one, calculated using 59
education, life expectancy, and per capita income.8 This index was created by the United Nations 60
Development Programme to rank countries on a scale of human development conceptualized in terms of 61
capabilities of humans within the countries to function.9 To be classified as very high HDI, the score of a 62
country must be equal or superior to 0.80. Among children living in countries categorized as being very 63
high by the HDI, moderate-to-vigorous intensity physical activity (MVPA) was positively related to 64
markers of cardiovascular health10–13
and self-reported health-related quality of life.14
Physical inactivity 65
has been estimated to be responsible for at least 10% and 9% of all-cause mortality in North-American 66
and in European countries, respectively.15
Furthermore, very high-income countries bear the largest 67
proportion of economic burden of physical inactivity worldwide (81% of health-care costs and 60% of 68
indirect costs).16
However, the majority of children17–21
and youth19–25
do not meet the current 69
recommendations of 60 minutes of MVPA per day26
in very high HDI European and North American 70
countries and regions. Similar findings were observed among children and/or adolescents from other very 71
high HDI countries or regions such as Australia,27
Chile,28
Chinese Taipei (Taiwan),29
Hong Kong, 30
72
Japan,31
South Korea,32
Qatar,33
and United Arab Emirates.33–35
Very high HDI countries share similar 73
characteristics in terms of education, life expectancy and income; however, differences also exist 74
Page 3 of 61
Human Kinetics, 1607 N Market St, Champaign, IL 61825
Journal of Physical Activity and Health
123456789101112131415161718192021222324252627282930313233343536373839404142434445464748495051525354555657585960

For Peer Review
RUNNING HEAD: Very High HDI Country Physical Activity Grades for Children and Youth
4
geographically, politically, culturally, religiously, and environmentally that may influence physical 75
activity behavior differently across the very high HDI countries. Cooper et al.36
found that there was 76
substantial between-country variation in objectively measured MVPA in the International Children’s 77
Accelerometry Database, even between apparently similar countries, and concluded that further research 78
is needed to explore environmental and sociocultural explanations for these differences. 79
80
To develop a better understanding of childhood physical activity and inactivity across countries, the first 81
Global Matrix (Global Matrix 1.0) of Report Card grades on physical activity was launched in 2014.37
82
Report Cards, based on the Canadian Report Card model,38
were developed by research teams from 15 83
countries (including eight very high HDI countries) using a harmonized process for data gathering, 84
assessing, and assigning grades.37
For each participating country, grades were assigned to nine common 85
physical activity indicators: Overall Physical Activity, Organized Sport Participation, Active Play, Active 86
Transportation, Sedentary Behaviors, Family and Peers, School, Community and the Built Environment, 87
and Government Strategies and Investments. Global Matrix 1.0 grades provided new information upon 88
which researchers, advocates, practitioners, and policy-makers could reflect and derive inspiration for 89
children’s physical activity research projects and promotion activities around the world.37
90
91
Building on the Global Matrix 1.0, investigators from each participating country committed to repeat and 92
further develop the Global Matrix initiative along with teams of researchers from 23 new countries. The 93
Global Matrix 2.0, which was released in 2016 in Bangkok, presented a comprehensive summary of the 94
physical activity behaviors and sources of influence indicators from 38 countries (including 24 very high 95
HDI countries).39
Findings suggested the presence of a complex variety of strengths and limitations across 96
the participating countries, with some universal patterns emerging when comparing countries by 97
continent, HDI, or income inequality. For example, a strong positive correlation was found between the 98
Page 4 of 61
Human Kinetics, 1607 N Market St, Champaign, IL 61825
Journal of Physical Activity and Health
123456789101112131415161718192021222324252627282930313233343536373839404142434445464748495051525354555657585960

For Peer Review
RUNNING HEAD: Very High HDI Country Physical Activity Grades for Children and Youth
5
source of influence grades (combining the grades from Family and Peers, School, Community and the 99
Built Environment, and Government Strategies and Investments) and HDI.39
100
101
In 2017, the Active Healthy Kids Global Alliance40
(AHKGA) called for more countries to participate in 102
the Global Matrix 3.0. Forty-nine countries registered and followed the harmonized steps to develop their 103
country’s Report Card. Out of the 49 participating countries, 30 (61%)were very high HDI countries, 104
from five different continents: Asia (n = 6), Europe (n = 19), North America (n = 2), Oceania (n = 2) and 105
South America (n = 1). The aim of this article is to present, describe, and compare the Report Card grades 106
from the very high HDI countries and regions participating in the Global Matrix 3.0: Australia, Belgium 107
(Flanders), Canada, Chile, Chinese Taipei (Taiwan), Czech Republic, Denmark, England, Estonia, 108
Finland, France, Germany, Guernsey, Hong Kong, Japan, Jersey, Lithuania, Netherlands, New Zealand, 109
Poland, Portugal, Qatar, Scotland, Slovenia, South Korea, Spain, Sweden, United Arab Emirates, United 110
States, and Wales. Companion papers published in this issue of the Journal of Physical Activity and 111
Health present the collective results from the low and medium HDI countries, and the high HDI countries. 112
113
Methods 114
The AHKGA distributed an open call through established networks for interested countries and opened 115
registration for the Global Matrix 3.0 in April, 2017. As a result, 49 countries from five different 116
continents fully participated in the Global Matrix 3.0. Workgroups consisting of experts and stakeholders 117
were established in each country to gather the highest quality and most recently published and 118
unpublished evidence. The workgroups critically appraised the available evidence and reported on 10 119
common indicators (Overall Physical Activity, Organized Sport and Physical Activity, Active Play, 120
Active Transportation, Sedentary Behaviors, Physical Fitness, Family and Peers, School, Community and 121
the Built Environment, and Government) for school-aged children and youth (~5-17 years-old). Through 122
Page 5 of 61
Human Kinetics, 1607 N Market St, Champaign, IL 61825
Journal of Physical Activity and Health
123456789101112131415161718192021222324252627282930313233343536373839404142434445464748495051525354555657585960

For Peer Review
RUNNING HEAD: Very High HDI Country Physical Activity Grades for Children and Youth
6
a harmonized and transparent Report Card development process, each country’s workgroup compiled the 123
available evidence from local, national or international studies, national surveys and official reports, and 124
then synthesized findings and reached consensus for the grading of each indicator. Full details of the 125
Report Card development process based on the Canadian Report Card model38
have been previously 126
described and the detailed methods for the Global Matrix 3.0 are described in a companion paper 127
published in this issue of the Journal of Physical Activity and Health.41
128
For each of the 49 registered countries, up to three joint Report Card leaders were charged with forming a 129
multidisciplinary research workgroup (including physical activity experts, stakeholder groups, and 130
communication specialists) to manage the Report Card project, and to ensure the effective communication 131
between AHKGA and the Report Card team. The workgroups identified and finalized the list of indicators 132
to be graded (i.e., the ten common indicators and potential additional ones that would be included in their 133
national Report Card but not in the Global Matrix 3.0), and compiled potentially relevant datasets and 134
documents that would be used to inform the grades. Countries were advised to consider and synthesize 135
the best available evidence from approximately the past five years for each indicator. Common 136
benchmarks, presented in Table 1, and a common grading scheme, shown in Table 2, were provided by 137
the AHKGA to the 49 Report Card workgroups. Experts in each country evaluated the compiled evidence 138
and reached consensus on the grade assigned for each indicator. Draft country Report Card grades were 139
submitted along with their rationale and were audited by the members of the AHKGA Executive 140
Committee to ensure that the grades were consistent with the harmonized benchmarks and grading 141
scheme. The Report Card leaders were also asked to report details concerning the datasets used to inform 142
their overall physical activity grade (i.e., subjective or objective measures, representativeness, instrument 143
used, age range, and sample size). 144
For analysis purposes, the 49 participating countries and regions were divided into three categories using 145
the United Nations’ HDI groupings (low or medium, high, and very high). The results and analyses 146
presented in this article are on the 30 very high HDI participating countries. 147
Page 6 of 61
Human Kinetics, 1607 N Market St, Champaign, IL 61825
Journal of Physical Activity and Health
123456789101112131415161718192021222324252627282930313233343536373839404142434445464748495051525354555657585960

For Peer Review
RUNNING HEAD: Very High HDI Country Physical Activity Grades for Children and Youth
7
Descriptive statistics (average grade and standard deviation) were calculated after converting categorical 148
variables (letter grades) to interval variables (see corresponding numbers in Table 2), and the incomplete 149
grades (INC) converted into “No Grade” which was treated as a missing value. Averages were calculated 150
from the interval values and the floor (for a given value, the greatest integer less than or equal to the 151
average value) was converted back to a letter grade. Three scores were computed for analysis: 1) Overall 152
score, 2) Behavioral score (Overall Physical Activity, Organized Sport and Physical Activity 153
Participation, Active Play, Active Transportation, and Sedentary Behaviors), and 3) Sources of influence 154
score (Family and Peers, School, Community and the Built Environment, and Government). Scores for 155
each group of indicators were calculated by summing the relevant interval data. INC grades were 156
removed and the scores were re-weighted accordingly. Categorical variables (letter grades) were grouped 157
into one of four levels (“A-B”, “C”, “D-F”, and “No grade”) based on the overall score. These categories 158
were then used to rank countries by letter grade/score and category level in scatter plot data 159
visualizations. Correlational analyses between the ten common indicators were performed using 160
Spearman's rank correlation coefficients. Pairwise deletion was used to treat missing data (incomplete 161
grades) instead of other techniques (e.g., list-wise deletion) in order to minimize the number of cases 162
excluded from the analysis. All statistical analyses were performed using R version 3.4.1 (The R 163
Foundation for Statistical Computing, Vienna, Austria). Several packages were loaded to extend base R 164
including corrplot,42
ggplot2,43
UpSetR,44
and VIM.45
In addition, descriptive statistics of the qualitative 165
information regarding the measurement of overall physical activity were performed. 166
167
Results 168
The sociodemographic characteristics of the 30 very high HDI countries are presented in Table 3. The 169
HDI scores ranged from 0.840 for United Arab Emirates to 0.939 for Australia. Chile was the country 170
with the lowest Gross National Income per capita, the highest Gini Index (highest income inequality), and 171
the highest child poverty rate (0.225). Qatar had the highest Gross National Income per capita, the lowest 172
Page 7 of 61
Human Kinetics, 1607 N Market St, Champaign, IL 61825
Journal of Physical Activity and Health
123456789101112131415161718192021222324252627282930313233343536373839404142434445464748495051525354555657585960

For Peer Review
RUNNING HEAD: Very High HDI Country Physical Activity Grades for Children and Youth
8
relative public health expenditure and the highest Gender Inequality Index. Slovenia had the lowest Gini 173
Index (least income inequality) and the lowest percentage of urban population (49.8%). The life 174
expectancy at birth was above 80 years for most of the countries (23 countries, 77%), with a maximum of 175
84.2 years for Hong Kong. Lithuania had a notably lower life expectancy of 73.5 years compared to other 176
countries. The mean years of schooling ranged from 8.9 years in Portugal to 13.3 years in the United 177
Kingdom nations (England, Scotland, and Wales). Finally, population density ranged from 3.2 178
people/km2
of land area for Australia, to 6987.2 people/km2
of land area for Hong Kong. In summary, 179
despite all 30 countries being within the very high HDI category, countries varied substantially in other 180
characteristics. 181
The 30 country grades for the 10 core Report Card indicators (300 grades or INC in total) and the average 182
grades for each country are shown in Table 4, and the corresponding descriptive information are 183
presented in Table 5. In total, 233 letter grades and 67 INC grades were assigned (Table 4). The country 184
with the highest average grade was Slovenia with “B”, and the countries with the lowest average grade 185
were Chile and the United States with “D”. All 30 countries assigned a grade to Sedentary Behaviors, 29 186
countries (97%) to Overall Physical Activity, and 28 countries (93%) to Organized Sport and Physical 187
Activity and to Active Transportation. Active Play was the indicator with the largest number of INC 188
grades (n = 20), followed by Physical Fitness (n = 13), and Family and Peers (n = 13). The indicator with 189
the highest average grade was Community and the Built Environment with “B-”, while the indicator with 190
the lowest average grade was Overall Physical Activity with “D-”. An average grade of “D+” was 191
obtained for the behavioral indicators combined, “C+” for the source of influence indicators combined, 192
and “C-” was the overall average for the 233 grades. Qatar’s Report Card workgroup decided not to 193
evaluate Active Transportation and considered it “not applicable (N/A)” because of unsafe road 194
conditions and the hot climate during most times of the year.46
Correlation analyses showed that there 195
were no relationships between the Overall Physical Activity grade and any of the other nine core indicator 196
grade (results not shown). Frequency plots illustrating the distribution of the overall 233 grades as well as 197
Page 8 of 61
Human Kinetics, 1607 N Market St, Champaign, IL 61825
Journal of Physical Activity and Health
123456789101112131415161718192021222324252627282930313233343536373839404142434445464748495051525354555657585960

For Peer Review
RUNNING HEAD: Very High HDI Country Physical Activity Grades for Children and Youth
9
the behavioral and the sources of influence indicators are presented in Figure 1A and Figure 1B, 198
respectively. A normal distribution of the letter grades is evident in both Figures 1A and 1B, with the 199
mode being “C” for the 233 letter grades overall, “D” for the behavioral indicators, and “B” for the 200
sources of influence indicators. 201
A plot for the overall score for each country estimated from the 10 indicators is presented in Figure 2, and 202
the behavioral and the source of influence scores in Figure 3 and Figure 4, respectively. For the overall 203
score, Slovenia ranked first while Chile ranked 30th (see more rankings in Figure 2). In terms of the 204
grading completion, the United Arab Emirates had only four graded indicators that were included in the 205
calculation of this score while four other countries (Slovenia, Finland, Czech Republic and Canada) had 206
all 10 indicators graded. For the behavioral score, Japan ranked first while Estonia ranked 30th
(see more 207
rankings in Figure 3). The United Arab Emirates had only two out of five indicators, and Japan and Qatar 208
only had three graded indicators that were included in the calculation of the behavioral score. Similar to 209
the overall score, Slovenia also ranked first for the sources of influence score while Guernsey, with only 210
one out of four graded indicators available, ranked 30th
(see more rankings in Figure 4). 211
Finally, the description of the data sources used to inform the Overall Physical Activity grade for each 212
country (except for Japan that had an INC) are presented in Supplemental File 1. In total, 87 surveys or 213
studies informed the grades of the very high HDI countries, representing a total sample size of 1,005,989 214
children and youth. A total of 21 surveys/studies used an objective measurement of physical activity 215
while 66 used a subjective method, mostly via self-administered questionnaires. Out of 21 surveys/studies 216
that measured physical activity objectively, 20 used accelerometry and one study used pedometry. A 217
minimum wear time for accelerometer ranged between 3 to 7 consecutive days, and nine different 218
accelerometer cut-points were applied for analysis across 20 surveys/studies with the most commonly 219
used cut-points (n = 8) from Evenson et al.47
Regarding the subjective measurement of physical activity, 220
survey-specific questionnaires were used in a significant number of surveys (n = 35), followed by original 221
or adapted versions of the Health Behaviour in School-Aged Children questionnaire (n = 14), uniquely in 222
Page 9 of 61
Human Kinetics, 1607 N Market St, Champaign, IL 61825
Journal of Physical Activity and Health
123456789101112131415161718192021222324252627282930313233343536373839404142434445464748495051525354555657585960

For Peer Review
RUNNING HEAD: Very High HDI Country Physical Activity Grades for Children and Youth
10
European countries), the Global School-based Student Health Survey questionnaire (n = 5), the Youth 223
Risk Behavior Surveillance System questionnaire (n = 4), the International Physical Activity 224
Questionnaire (n=3), and others (n=5). 225
226
Discussion 227
The objective of this paper was to present, describe, and compare the Report Card grades from the 30 228
very high HDI countries and nations participating in the Global Matrix 3.0. A wide range of grades was 229
observed for most indicators across countries. These 30 countries are geographically distributed across 230
Asia, Europe, North America, Oceania, and South America and have very different climatic, geographic, 231
demographic, and cultural characteristics. Despite these contextual differences, most of these countries 232
shared concerning low grades for Overall Physical Activity and Sedentary Behaviors. No country was 233
consistently leading nor falling behind the others across the 10 common indicators, however some 234
countries showed greater or less success than others. The characteristics of the most and the least 235
successful countries are discussed below, followed by a discussion of the findings for each indicator, and 236
an integrated discussion of the findings including the strengths and limitations of this study. 237
238
Most successful countries 239
Slovenia had sufficient data to inform the 10 indicators and obtained the best grades for Overall Physical 240
Activity (“A-”), Family and Peers (“B+”), and Government (“A”), as well as on average (“B”); and 241
shared the best grades for Sedentary Behaviors with Spain (“B+”), and for School (“A”) with Finland and 242
Portugal. A notable feature of Slovenia is the importance of sport for the culture of this almost 30-year 243
old country as “Slovenes tend to view sports as an effective tool in fostering national identity among 244
citizens and making successful global identity claims”.48
Every April since 1987, a national school-based 245
surveillance system of physical fitness (named Slofit) takes place, targeting the majority of Slovenian 246
Page 10 of 61
Human Kinetics, 1607 N Market St, Champaign, IL 61825
Journal of Physical Activity and Health
123456789101112131415161718192021222324252627282930313233343536373839404142434445464748495051525354555657585960

For Peer Review
RUNNING HEAD: Very High HDI Country Physical Activity Grades for Children and Youth
11
school children and youth aged 6 to 19 years.49
Negative trends in motor skills and physical fitness were 247
observed for over two decades in Slovenia, but since 2011, these trends has been reversed after the 248
implementation of a health-oriented physical activity intervention program, which offers children two 249
(optional) additional hours of physical activity per week.50
The estimated proportion of Slovenian 250
children and youth meeting the recommended levels of daily physical activity is now high (over 80%), 251
and this encouraging outcome seems to be the result of the collective support for childhood physical 252
activity from the government, the educational system, and the parents themselves.51
253
The next two most successful countries were Denmark and Japan with an average grade of “B-”. The 254
positive result for these two countries should be interpreted with caution as both had “INC” grades for 255
some indicators. Active Play, Physical Fitness, and Family and Peers for Denmark, and Overall Physical 256
Activity and Active Play for Japan were not graded due to the lack of data. Nonetheless, Denmark was the 257
country with the best grade for Organized Sport and Physical Activity (“A-”), and also obtained a grade 258
of “A-” for both School and Government indicators. Sport is an important part of the Danish culture, and 259
considered important not only for individual and population health, but also in relation to issues such as 260
social inclusion and community cohesion.52
Despite Denmark performing rather well on the strategic and 261
political levels, low grades were attributed to Overall Physical Activity (“D-”) and Sedentary Behaviors 262
(“D+”), indicating an implementation gap between the governmental and individual levels.53
263
Japan had the best grades for Active Transportation (“A-”) and Physical Fitness (“A”), and had no grades 264
lower than “C-”. In fact, Japan has a highly established “walking to school practice” that has been 265
implemented since the School Education Act enforcement order, enacted in 1953, stating that public 266
elementary schools should be sited within no more than 4 kilometers, and for public junior high schools 267
no more than 6 kilometers from the student’s home. This policy is still successful today at promoting 268
active transportation among Japanese children and youth.54
The Physical Fitness grade was assigned 269
based on the performance of Japanese children and youth on the 20-meter shuttle run test. On average, 270
Japanese children were in the 90th percentile,55
based on age- and sex-specific international normative 271
Page 11 of 61
Human Kinetics, 1607 N Market St, Champaign, IL 61825
Journal of Physical Activity and Health
123456789101112131415161718192021222324252627282930313233343536373839404142434445464748495051525354555657585960

For Peer Review
RUNNING HEAD: Very High HDI Country Physical Activity Grades for Children and Youth
12
data.56
The Organized Sport and Physical Activity participation (graded “B-”) and the favorable School 272
environment (graded “B+”) may explain this high level of physical fitness; however, this is speculative 273
and more research is necessary. It was observed that only a minority of time in physical education classes 274
was spent in MVPA (27.3%/45 min/class) in Japanese primary school students.57
275
Least successful countries 276
Chile and the United States were the two countries with the lowest average grade: “D”. They were 277
followed by Guernsey, Jersey, Scotland, South Korea, United Arab Emirates, and Wales, who obtained an 278
average grade of “D+”. Chile had the lowest grades for Active Transportation (“F”), Family and Peers 279
(“F”), and shared the lowest grades for Organized Sport and Physical Activity with Taiwan (“D-”), and 280
for Physical Fitness with Canada, Hong Kong and Jersey (“D”). In Chile’s first Report Card (2016), all 281
indicators had low grades, and data from different surveys indicated that there were consistent disparities 282
across genders, socioeconomic status, and school types.58
In 2018, Chile’s grades remained low in 283
comparison with the first Report Card in 2016 but progress was made on environmental and policy 284
aspects,59
raising hope that these improvements will positively affect behavioral indicators in the future. 285
The low average grade of the United States should be interpreted carefully because three indicators were 286
assigned an “INC” grade: Active Play, Family and Peers, and Government. The United States shared the 287
lowest grades with the United Arab Emirates for School (“D-”), and the Community and the Built 288
Environment (“C”) with England, Jersey, Lithuania, and Poland. Overall, none of the indicators were 289
graded above “C” in the United States. This is the third Report Card for the United States, and the grade 290
for Overall Physical Activity (“D-”) remained consistent with the 2014 and 2016 Report Card.60,61
291
Similarly to Chile, major disparities in physical activity participation across gender, race/ethnicity, age, 292
and socioeconomic status were observed.62
293
294
Overall Physical Activity 295
Page 12 of 61
Human Kinetics, 1607 N Market St, Champaign, IL 61825
Journal of Physical Activity and Health
123456789101112131415161718192021222324252627282930313233343536373839404142434445464748495051525354555657585960
For Peer Review
RUNNING HEAD: Very High HDI Country Physical Activity Grades for Children and Youth
13
Among the 30 very high HDI countries, only Japan assigned an “INC” grade for Overall Physical 296
Activity. The grades ranged from “F” to “A-” for this indicator; however Slovenia was the only country 297
with a “good” grade (“A-”), and all the other countrys’ grades fell between “F” and “C”. Five countries 298
received an “F” (Flanders, Scotland, South Korea, Taiwan, and the United Arab Emirates), four countries 299
assigned “C” grades (England, Hong Kong, Lithuania, and Netherlands), and all the remaining countries 300
had a “D-”, “D”, or “D+”. The comparison and interpretation of the Overall Physical Activity grades 301
should be conducted carefully given the important variation in the methods used to measure Overall 302
Physical Activity between the countries, as seen in Supplemental File 1. In fact, objective data were used 303
in 13 of 29 countries with an Overall Physical Activity letter grade, and subjective data in 27 countries 304
(11 countries combined subjective and objective data to inform their Overall Physical Activity indicator). 305
In addition, even among the subjective or the objective data, the methods differed largely in terms of 306
instruments, analysis, age range, sample size, and representativeness of samples. 307
The correlational analyses showed that there was no relationship between Overall Physical Activity, and 308
the physical activity related indicators (Organized Sport and Physical Activity, Active Play, and Active 309
Transportation). For example, only 56% of children and 33% of adolescents met the international physical 310
activity recommendations in the Netherlands despite a high level of Organized Sport and Physical 311
Activity, Active Play, and Active Transportation (graded “B”, “B”, and “B-”, respectively).63
A similar 312
pattern was observed in Belgium (Flanders), Denmark, Scotland, South Korea and Spain where Overall 313
Physical Activity was graded “F” or “D/D-” despite the fact that grades between “A” and “C” were 314
assigned to Organized Sport and Physical Activity, Active Play, and Active Transportation (note: an 315
“INC” grade was assigned to Active Play for Flanders, Denmark, Scotland, and South Korea).53,64–67
The 316
opposite situation was observed in Slovenia where Overall Physical Activity was graded “A-”, while 317
Organized Sport and Physical Activity, Active Play and Active Transportation were graded “C+”, “D”, 318
and “C”, respectively. 319
Page 13 of 61
Human Kinetics, 1607 N Market St, Champaign, IL 61825
Journal of Physical Activity and Health
123456789101112131415161718192021222324252627282930313233343536373839404142434445464748495051525354555657585960
For Peer Review
RUNNING HEAD: Very High HDI Country Physical Activity Grades for Children and Youth
14
The absence of a relationship between Overall Physical Activity and other behavioral indicators can 320
potentially be explained by the aforementioned differences in methods used to measure these indicators 321
and the diversity of benchmarks between countries. The recommended benchmark for physical activity 322
was “% of children and youth […] who accumulate at least 60 minutes MVPA per day on average, or % 323
of children and youth meeting the guidelines on at least four days a week (when an average cannot be 324
estimated)” (Table 1). The available data in each country did not necessarily allow them to use either of 325
these benchmarks strictly when estimating the prevalence of physically active children and youth in their 326
sample. For example, in France, a “high level of physical activity” corresponded to engage in physical 327
activity five or more days a week, and the regular use of active transportation, for 6-10 year olds (reported 328
by the parents); and practicing a MVPA at least five days a week for 11-17 year olds (self-reported).68
329
While in England’s 2018 Report Card, the percentage of children and youth accumulating at least one 330
hour of MVPA seven days a week was evaluated.69
In addition, among the countries where objective 331
methods were used to measure physical activity, the estimated number of children meeting the physical 332
activity guidelines could also have been significantly affected by the cut-off point that defines the count 333
per minute threshold for MVPA.70
Although the majority of studies included in Global Matrix 3.0 used 334
the Evenson cut-off point,47
several studies used different ones. For example, the Freedson cut-off point71
335
was used in Hong-Kong, while the Puyau cut-off point72
was used in Canada (Supplemental File 1). 336
Notwithstanding the presented methodological issues across countries, 29 out of 30 very high HDI 337
countries assigned a letter grade to the Overall Physical Activity indicator, and for 28 of them, this grade 338
was between “C” and “F”, with an average of “D-”. These results are consistent with the current 339
literature. A systematic review of physical activity in European children and adolescents found that 5%-340
47% of children and adolescents when measured subjectively, or 0%-60% of children and adolescents 341
when measured objectively, achieved the recommended levels of physical activity.73
In another study 342
describing objectively-measured physical activity and sedentary time patterns in children and youth in 10 343
countries (nine very high HDI countries and Brazil), only 9% of boys and 2% of girls accumulated ≥60 344
Page 14 of 61
Human Kinetics, 1607 N Market St, Champaign, IL 61825
Journal of Physical Activity and Health
123456789101112131415161718192021222324252627282930313233343536373839404142434445464748495051525354555657585960
For Peer Review
RUNNING HEAD: Very High HDI Country Physical Activity Grades for Children and Youth
15
minutes of MVPA on all measured days.36
The present study provides additional evidence that the 345
situation regarding the physical activity of children and youth is very concerning in very high HDI 346
countries, and public investment to implement effective interventions for increasing physical activity 347
opportunities are needed urgently. Unless a major shift to a more active lifestyle happens soon, a high rate 348
of premature non-communicable diseases can be anticipated when this generation of children will reach 349
adulthood. 350
351
Organized Sport and Physical Activity 352
Most of the countries assigned a letter grade to Organized Sport and Physical Activity, excepting Jersey 353
and the United Arab Emirates. With an average grade of “C+”, Organized Sport and Physical Activity 354
was the most successful behavioral indicator in the very high HDI countries. Only three countries had a 355
low grade for this indicator: Chile (“D-”), Taiwan (“D-”), and France (“C-”); while 12 countries had 356
relatively higher grades (“B+”, “B”, “B-”) behind the lead of Denmark (“A-”). In Canada, Organized 357
Sport and Physical Activity was the only behavioural indicator with a high grade (“B+”),74
in which the 358
high participation rate (77%) has been relatively stable since 2005.75
Similarly, Organized Sport and 359
Physical Activity was also the highest graded indicator in Sweden.76
In relation to its geographical and 360
population size, Sweden is considered as one of the world’s most sporting nations: out of the seven 361
million inhabitants between the ages of 7 and 70, more than three million were active members of sport 362
clubs and more than two million were competing regularly in 2012.77
However, as presented before, these 363
high rates of sport participation were not associated with a sufficient level of physical activity in the 364
population. 365
Given that the benchmark for Organized Sport and Physical Activity (“% of children and youth who 366
participate in organized sport and/or physical activity programs”) does not specify intensity, duration, or 367
frequency, we are missing important contextual information of this indicator. These characteristics should 368
Page 15 of 61
Human Kinetics, 1607 N Market St, Champaign, IL 61825
Journal of Physical Activity and Health
123456789101112131415161718192021222324252627282930313233343536373839404142434445464748495051525354555657585960

For Peer Review
RUNNING HEAD: Very High HDI Country Physical Activity Grades for Children and Youth
16
be evaluated to estimate the dose of physical activity associated with sport participation among children 369
and youth. However, the popularity of sport among children and youth from very high HDI countries 370
suggests that increasing organized sport opportunities and accessibility could be a strategic solution to 371
address the prevalence of childhood physical inactivity in these countries. Further research focusing on 372
this indicator is needed to evaluate if the available organized physical activity opportunities are indeed 373
saturated. Moreover, are all countries providing free or affordable and appealing physical activity and 374
sport participation opportunities for the entire youth population including different age, gender, 375
socioeconomic, ethnic, and special population groups (e.g., children with learning and/or physical 376
disabilities)? 377
378
Active Play 379
The main finding concerning Active Play was the amount of missing data: 20 out of the 30 very high HDI 380
countries assigned an “INC” grade to this indicator. Among the 10 countries with a letter grade, the 381
Netherlands attained the highest grade (“B”); Estonia the lowest grade (“F”); and the eight remaining 382
countries had “C”s or “D”s. The average grade of “D+” for this indicator suggests that there is a low level 383
of engagement in this behavior, and/or that researchers were not able to detect it with the measurement 384
instruments they used. Indeed, valid and reliable tools to assess active play is largely limited.78
In the 385
Czech Republic, Active Play was measured using self-reports of unstructured/unorganized active play for 386
at least two hours per day;79
while in New Zealand, surveys asked parents/guardians or youth report to 387
indicate if the children or youth had been active while playing (on their own or with others) in the last 388
seven days, if they had been active while playing for at least seven hours in the last seven days, and if 389
they were allowed to go out on their own in the neighborhood.80
The development of standardized tools 390
for the measurement of Active Play is challenged by the need for consensus on a definition. In a recent 391
systematic review synthesizing the literature to identify key concepts used to define and describe active 392
play among young children, Truelove et al.78
proposed the following definition: “a form of gross motor or 393
Page 16 of 61
Human Kinetics, 1607 N Market St, Champaign, IL 61825
Journal of Physical Activity and Health
123456789101112131415161718192021222324252627282930313233343536373839404142434445464748495051525354555657585960

For Peer Review
RUNNING HEAD: Very High HDI Country Physical Activity Grades for Children and Youth
17
total body movement in which young children exert energy in a freely chosen, fun, and unstructured 394
manner”. But a consensus definition needs to be officially internationally agreed upon and acknowledged 395
to advance the development and acceptance of standardised measurement tools. 396
397
Active Transportation 398
For Active Transportation, the grades ranged from “A-” (Japan) to “F” (Chile), with an average of “C-”. 399
Qatar and the United Arab Emirates were the only two countries that did not assign a letter grade to this 400
indicator. Interestingly, three of the four countries from Eastern Asia are leading this indicator: Japan 401
(“A-”), Hong Kong (“B+”), and South Korea (“B+”). The successful school policy that has been 402
identified underlying this high prevalence of active transportation among children and youth in Japan was 403
discussed previously in this paper. In Hong Kong, a high proportion of children using active 404
transportation can be explained by the very high population density of the city: most districts are highly 405
self-contained so children usually attend schools close to their home.81
Similarly, because most students 406
live within 10-minute walking distance to/from school, national data showed that active commuting is 407
prevalent in South Korea: 79.4% of children and youth reported that they take active modes of transport 408
to/from places.66
Previous research has shown that active transportation is associated with increased 409
physical activity;82
however, the Active Transportation indicator was not correlated with Overall Physical 410
Activity among children in very high HDI countries in this study. Similar to Organized Sport and 411
Physical Activity and Active Play, the benchmark for this indicator does not indicate duration or intensity 412
of activity. Therefore, it is not possible to evaluate the extent to which this indicator is contributing to the 413
Overall Physical Activity of children and youth. 414
415
Sedentary Behaviors 416
Page 17 of 61
Human Kinetics, 1607 N Market St, Champaign, IL 61825
Journal of Physical Activity and Health
123456789101112131415161718192021222324252627282930313233343536373839404142434445464748495051525354555657585960

For Peer Review
RUNNING HEAD: Very High HDI Country Physical Activity Grades for Children and Youth
18
Sedentary behavior corresponds to any waking behavior characterized by an energy expenditure ≤1.5 417
metabolic equivalents (METs), while in a sitting, reclining, or lying posture.83
For example, in children 418
and youth, it includes to the use of electronic devices while sitting, reclining or lying, as well as reading, 419
writing, or drawing while sitting.83
While reading is associated with positive outcomes such as higher 420
academic achievement, screen time, often used as a proxy for sedentary behavior in research, has been 421
shown to be associated with a variety of negative health outcomes among children and youth.84
For this 422
reason, guidelines focusing specifically on screen time were developed for the first time in Canada in 423
2011, recommending limiting screen time to two hours daily for the 5-17 year-olds.85
Consistent with the 424
current guidelines, the benchmark for Sedentary Behaviors was solely based on screen time: “% of 425
children and youth who meet the Canadian Sedentary Behaviour Guidelines (5- to 17-year-olds: no more 426
than 2 hours of recreational screen time per day)”. 427
Sedentary Behaviors was the only indicator without any “INC” grades. Estonia, Scotland, and Wales were 428
the three countries with the lowest grade for this indicator (“F”), while Slovenia and Spain had the highest 429
grade (“B+”). The remaining countries all had “C”s or “D”s, and the average for this indicator was “D+”. 430
In total, only five out of the 30 very high HDI countries had a grade of “C” or higher. A small 431
methodological difference was observed between the very high HDI as few countries such as Estonia, 432
France, and Sweden reported the percentage of children and youth who had less than two hours (<2 433
hour/day) of daily screen time, while most of the countries reported those spending two hours or less (≤2 434
hour/day) in front of a screen. Another potential source of bias was not taking into account the potential 435
multi-tasking use of screens (e.g., using a phone while watching a movie) as it was the case for France, 436
which could have led to an overestimation of screen time.68
Despite these potential methodological issues, 437
the grades observed for this indicator are extremely concerning among the very high HDI countries. In 438
Estonia, the prevalence of children meeting the screen time recommendation was estimated as low as 439
7%.86
The development of more effective interventions targeting the reduction of screen time among 440
children and youth in very high HDI countries should be a public health priority. 441
Page 18 of 61
Human Kinetics, 1607 N Market St, Champaign, IL 61825
Journal of Physical Activity and Health
123456789101112131415161718192021222324252627282930313233343536373839404142434445464748495051525354555657585960

For Peer Review
RUNNING HEAD: Very High HDI Country Physical Activity Grades for Children and Youth
19
442
Physical Fitness 443
This is the first time that Physical Fitness has been evaluated in the Global Matrix. Physical fitness 444
corresponds to a state characterized by an ability to perform daily activities with vigor, and a 445
demonstration of traits and capacities that are associated with a lower risk of the premature development 446
of diseases associated with physical inactivity.87
The health-related components of physical fitness are 447
cardiorespiratory endurance, muscular endurance, muscular strength, body composition, and flexibility.88
448
A recent systematic review of the relationship between the 20-meter shuttle run performance and health 449
indicators among children and youth found that performance on this test was associated with favourable 450
indicators of adiposity, and some indicators of cardiometabolic, cognitive, and psychosocial health in 451
boys and girls, and concluded that physical fitness can be used as a holistic indicator of population health 452
in children and youth.89
453
The benchmark for this indicator was the average percentile achieved on certain health-related physical 454
fitness component-based on the normative values published by Tomkinson et al.56
On average, Physical 455
Fitness was graded “C-”. The highest grade was obtained by Japan (“A”), closely followed by Slovenia 456
(“A-”); and four other countries (Canada, Chile, Hong Kong, and Jersey) shared the lowest grade (“D”). 457
An “INC” grade was assigned to Physical Fitness in 13 countries. Various health-related physical fitness 458
components and different normative values were used to calculate the percentile achieved by their sample 459
of children and youth and inform this indicator from one country to another. For example, in Hong Kong 460
this indicator was graded based on peak oxygen consumption, estimated with the performance on the 20-461
meter shuttle run performance among 9-17 year olds;90
Jersey had data on cardiorespiratory fitness, 462
muscular strength, muscular endurance, flexibility, and motor fundamental movement skills development 463
for school-aged children.91
Lithuania had data on endurance, lower body muscular power, upper body 464
muscular endurance, and lower body muscular endurance for 11-18 year olds. Given these significant 465
variations, the comparison of the Physical Fitness indicator between very high HDI countries is 466
Page 19 of 61
Human Kinetics, 1607 N Market St, Champaign, IL 61825
Journal of Physical Activity and Health
123456789101112131415161718192021222324252627282930313233343536373839404142434445464748495051525354555657585960

For Peer Review
RUNNING HEAD: Very High HDI Country Physical Activity Grades for Children and Youth
20
compromised and this highlights the need for developing international standardized measurements of 467
health-related physical fitness components. 468
469
Family and Peers 470
Similarly to Physical Fitness, 13 countries assigned an “INC” grade to the Family and Peers indicator. On 471
average, this indicator was graded “C-”, with Slovenia having the highest grade (“B+”) and Chile having 472
the lowest grade (“F”). Parental support and significant others support has been identified as two of the 16 473
correlates that are consistently associated with physical activity of children and/or adolescents in a 474
systematic review of reviews.92
Because of the complexity of this indicator, several benchmarks were 475
proposed for its evaluation (Table 1), and measurement variations were observed. In Poland, the grade 476
was based on self-report of their parents’ (material, emotional) support to their physical activity 477
participation, on self-report of their parents’ regular participation in physical activity, and on the 478
prevalence of youth who declared being regularly physically active with their father, their mother, and 479
their siblings.93
In Germany, the prevalence of parents regularly participating in physical activity and the 480
prevalence of children feeling that they receive positive support from their parents and friends to be 481
physically active informed the Family and Peers indicator.94
These findings show that there is still a need 482
for an established definition of Family and Peer Influence, and then standardised and validated methods 483
of measurement for the Family and Peers indicator. 484
485
School 486
The School indicator had an average of “C+”, and only three countries had an “INC” grade for this 487
indicator: Guernsey, Scotland, and Wales. The United Arab Emirates and the United States had the lowest 488
grade (“D”), and Finland and Portugal shared the best grade for School (“A”). A variation in data was 489
used to inform this indicator within the countries. In Finland, 87% of the schools participated in the 490
Page 20 of 61
Human Kinetics, 1607 N Market St, Champaign, IL 61825
Journal of Physical Activity and Health
123456789101112131415161718192021222324252627282930313233343536373839404142434445464748495051525354555657585960

For Peer Review
RUNNING HEAD: Very High HDI Country Physical Activity Grades for Children and Youth
21
national Finnish Schools on the Move programme. This programme aims at achieving more pleasant and 491
active schooldays for children and encourages schools to increase physical activity during the school day 492
as well as commuting.95
In Portugal, physical education classes are mandatory for all students from pre-493
school to 12th grade. The time allocated to physical education classes ranges from 90 to 150 min/week 494
over two or three sessions/week, and these classes are taught by a certified physical education teacher. In 495
addition, 85% of Portuguese schools offer school clubs under the supervision of a physical education 496
teacher, including competitions within and between schools.96
The correlational analyses did not find an 497
association between the School and the Overall Physical Activity indicators, but similarly to other 498
indicators, the heterogeneity of data used to inform the School indicator are potentially affecting this 499
relationship. 500
A review of the relationship between academic performance and participation in school-based physical 501
activities, including physical education, free school-based physical activity, and school sports, found that 502
adding time to academic or curricular subjects by taking time from physical education programmes does 503
not enhance grades in the corresponding academic subjects, and could be detrimental to health.97
On the 504
contrary, the authors also suggested that more time can be allocated to physical activity from other 505
subjects without the risk of hindering students’ academic achievement.97
These findings suggest that the 506
school environment, policy, and curriculum have the potential to increase physical activity among 507
children and youth, and more specific interventions targeting the creation of daily physical opportunities 508
at school need to be developed in very high HDI countries. 509
510
Community and the Built Environment 511
With an average of “B-”, Community and the Built Environment was the highest graded indicator of the 512
10 core indicators among the 30 very high HDI countries. The lowest grade for this indicator was “C”, 513
shared by five countries (England, Jersey, Lithuania, Poland, and the United States), and the highest 514
Page 21 of 61
Human Kinetics, 1607 N Market St, Champaign, IL 61825
Journal of Physical Activity and Health
123456789101112131415161718192021222324252627282930313233343536373839404142434445464748495051525354555657585960

For Peer Review
RUNNING HEAD: Very High HDI Country Physical Activity Grades for Children and Youth
22
grade, “A”, was assigned by Sweden. Eight countries assigned an “INC” grade for this indicator. With an 515
“A-”, Australia was the second most successful country for this indicator. In the Australia’s 2018 Report 516
Card, parent-report data showed that most of youth were not faced with problematic traffic in their home 517
or school neighborhood, had access to good roads and footpaths and to public transport in their 518
neighborhood, had a park or playground near their home, and lived in a safe neighborhood.98
In Taiwan, 519
where this indicator was graded “B+”, 81% of 13- to 17-year-olds felt that there were sufficient exercise 520
facilities in their neighbourhood, and they reported spending an average of 9.7 min to reach their primary 521
exercise facilities.99
The lack of correlation between this indicator and the Overall Physical Activity is 522
aligned with some of the research available on access to facilities.92
Community and the Built 523
Environment. In accordance with previous Global Matrices,37,39
the available evidence from this indicator 524
may suggest that the characteristics of the built environment potentially influencing the physical activity 525
of children are already meeting the criteria to be considered favorable in the very high HDI countries. 526
This indicates that having favorable environmental infrastructure alone is not sufficient to promote 527
physical activity in very high HDI countries. Social factors such as family, home, school, and community 528
are also important to promote physical activity among children and youth. 529
530
Government 531
The average grade for the Government indicator was “C+”, and the grades ranged from “A” (Slovenia) to 532
“D” (Australia, Guernsey, Jersey, and South Korea). Five countries assigned an “INC” grade to this 533
indicator. With the exception of the four countries with a “D”, all the other very high HDI countries 534
obtained a favorable grade (“C” or higher) for the Government indicator. Despite the recommended 535
benchmark for this indicator, Government grades were informed by different types of data in different 536
countries. For example, in Wales, 21 policy documents assessed across different sectors including Health, 537
Sport, Education, Environment, Transport, and Urban Design/Planning were evaluated using the Health-538
Enhancing Physical Activity Policy Audit Tool, obtaining a final score of 54% that was converted to a 539
Page 22 of 61
Human Kinetics, 1607 N Market St, Champaign, IL 61825
Journal of Physical Activity and Health
123456789101112131415161718192021222324252627282930313233343536373839404142434445464748495051525354555657585960

For Peer Review
RUNNING HEAD: Very High HDI Country Physical Activity Grades for Children and Youth
23
letter grade of “C+”.100
In some other countries that did not have relevant quantitative data, a letter grade 540
was graded primarily based on expert opinion. Although most countries reported government physical 541
activity strategies and policies, the absence of a relationship between the Government grades and the 542
Overall Physical Activity grades and the mostly low behavioral grades suggest that these actions are not 543
singularly effective at increasing the prevalence of MVPA among children and youth. 544
545
Integrated Discussion 546
Generally, higher grades were reported for the source of influence indicators in comparison with the 547
behavioral indicators among the 30 very high HDI countries integrated in this study. The average grade 548
for the behavioral indicators was “D+” (ranging from “B-” to “D-”) while the average grade for the 549
sources of influence indicators was “C+” (ranging from “A” to “D”). This finding is consistent with 550
previous Global Matrices,37,39
and may be partially explained by the fact that more than half of the 551
countries that participated in the Global Matrix 1.0 and 2.0 belonged to the very high HDI category. 552
Japan, the Netherlands, and Slovenia had the highest behavioral score, while Estonia, Chile and the 553
United Arab Emirates had the lowest score (Figure 3). This score was calculated based on the grades for 554
five indicators, and most of the countries had four to five letter grades to inform the score, with the 555
exception of the United Arab Emirates with only two letter grades, and Qatar, Jersey, and Japan with only 556
three letter grades. The amount of “INC” grades for these four countries questions the accuracy of their 557
ranking, in particular for Japan, in the leading position. For the sources of influence score, Slovenia, 558
Denmark, and Finland led the ranking, while the United States, South Korea, and Guernsey ranked at the 559
bottom (Figure 4). While the calculation of the source of influence score was based on the letter grades 560
for four indicators, eight countries had only two letter grades to inform this score, and Guernsey, the 561
Netherlands and Spain had only one. The amount of “INC” grades challenges the correctness of this 562
classification, in particular for the three countries with only one source of influence indicator graded. The 563
Page 23 of 61
Human Kinetics, 1607 N Market St, Champaign, IL 61825
Journal of Physical Activity and Health
123456789101112131415161718192021222324252627282930313233343536373839404142434445464748495051525354555657585960

For Peer Review
RUNNING HEAD: Very High HDI Country Physical Activity Grades for Children and Youth
24
comparison of these groups of indicators suggests that the adequate to good grades observed for the 564
source of influence indicators are not translated in good behavioral grades for the very high HDI 565
countries. 566
In total, 24 countries had three or less “INC” grades, but six countries were missing data to grade four to 567
six indicators. Including countries with a significantly large number of “INC” grades in the Global Matrix 568
3.0 is a limitation to this study as it limits the comparisons. For example, the United Arab Emirates had 569
six “INC” grades,101
Guernsey had five “INC” grades,102
and Qatar had four “INC” grades, and a “not 570
applicable” for Active Transportation.46
Another major limitation of this study is the diversity of the data 571
that were used to inform the 10 core indicators, challenging the comparativeness of the grades within the 572
same indicator. Two identical grades for the same indicator can potentially reflect very different situations 573
from one country to another. An alternative approach would have been to exclude the countries with 574
insufficient data from the Global Matrix 3.0, and to have assigned “INC” grades to all the countries with 575
data that were not fitting exactly with the benchmarks for each indicator. Yet, this strategy would have 576
considerably reduced the number of countries and indicators included in the analyses of this study and 577
decrease the relevance of conducting international comparisons within an HDI category. Finally, a loss of 578
information potentially occurs when translating original data to a letter grade, as letter grades provide less 579
information than continuous variables. 580
The main strength of this study is the large number of participating countries who adopted the harmonized 581
data gathering, assessing, and grading process and the quantity of data that are informing the international 582
physical activity comparisons. This was possible as a result of the inclusive strategy adopted by AHKGA. 583
This project offers the opportunity to paint a picture of the characteristics of childhood physical activity in 584
each country, as determined and explained by a diverse group of experts within each country. In addition, 585
despite the presented methodological issues, this study allows the identification of major trends 586
concerning the characteristics of the physical activity of children and youth among very high HDI 587
countries. The need for the development and the international adoption of standardized methods to 588
Page 24 of 61
Human Kinetics, 1607 N Market St, Champaign, IL 61825
Journal of Physical Activity and Health
123456789101112131415161718192021222324252627282930313233343536373839404142434445464748495051525354555657585960

For Peer Review
RUNNING HEAD: Very High HDI Country Physical Activity Grades for Children and Youth
25
conceptualise and measure the ten indicators was also highlighted in this paper. An “INC” grade can be 589
useful for advocacy in individual countries in future cards, and the Global Matrix project has the potential 590
to influence the physical activity national surveillance systems in the short to long term. Finally, as 591
demonstrated in the study presenting the international impact of the Report Cards and Global Matrices 592
published in this special issue,103
the development of a national Report Card of physical activity for 593
children and youth, and the participation in the Global Matrix initiative, contributes to raising awareness 594
on the childhood physical inactivity issue nationally and internationally, building capacity within 595
participating countries, and potentially influencing the creation of physical activity opportunities in the 596
future. 597
598
Conclusion 599
This analysis and comparison of the Global Matrix 3.0 grades provide a comprehensive summary of the 600
level and context of the physical activity of children and youth among the participating very high HDI 601
countries. While methodological limitations and research gaps were identified, this work allowed the 602
portrayal of major trends across the 10 physical activity indicators. The majority of very high HDI 603
countries had better grades on the sources of influence levels, but this was not translated in positive 604
outcomes concerning childhood physical activity and sedentary behavior, indicating an implementation 605
gap between the policy/governmental and individual level. This paper provides additional evidence that 606
the situation regarding physical activity in children and youth living in very high HDI countries is 607
extremely concerning. Strategic public investments to implement effective interventions within families, 608
communities, and schools to increase physical activity opportunities are needed. Unless a major shift to a 609
more active lifestyle happens soon, a high rate of non-communicable diseases can be anticipated when 610
this generation of children will reach adulthood. 611
612
Page 25 of 61
Human Kinetics, 1607 N Market St, Champaign, IL 61825
Journal of Physical Activity and Health
123456789101112131415161718192021222324252627282930313233343536373839404142434445464748495051525354555657585960

For Peer Review
RUNNING HEAD: Very High HDI Country Physical Activity Grades for Children and Youth
26
Acknowledgements 613
The authors would like to acknowledge the then Active Healthy Kids Canada (now ParticipACTION) for 614
developing the Report Card methodology, and the AHKGA for modifying and standardizing the 615
benchmarks and grading rubric. The authors are indebted to each country Report Card leaders, Research 616
Work Group, and all other members of their Report Card Committees. 617
618
Page 26 of 61
Human Kinetics, 1607 N Market St, Champaign, IL 61825
Journal of Physical Activity and Health
123456789101112131415161718192021222324252627282930313233343536373839404142434445464748495051525354555657585960

For Peer Review
RUNNING HEAD: Very High HDI Country Physical Activity Grades for Children and Youth
27
References 619
1. Nocon M, Hiemann T, Müller-Riemenschneider F, Thalau F, Roll S, Willich SN. Association of 620
physical activity with all-cause and cardiovascular mortality: a systematic review and meta-621
analysis. Eur J Cardiovasc Prev Rehabil. 2008;15(3):239-246. 622
doi:10.1097/HJR.0b013e3282f55e09 623
2. Trost SG, Blair SN, Khan KM. Physical inactivity remains the greatest public health problem of 624
the 21st century: evidence, improved methods and solutions using the “7 investments that work” 625
as a framework. Br J Sports Med. 2014;48(3):169-170. doi:10.1136/bjsports-2013-093372 626
3. Blair SN. Physical inactivity: the biggest public health problem of the 21st century. Br J Sports 627
Med. 2009;43(1):1-2. http://www.ncbi.nlm.nih.gov/pubmed/19136507. Accessed April 4, 2018. 628
4. Poitras VJ, Gray CE, Borghese MM, et al. Systematic review of the relationships between 629
objectively measured physical activity and health indicators in school-aged children and youth. 630
Appl Physiol Nutr Metab. 2016;41(6 (Suppl. 3)):S197-S239. doi:10.1139/apnm-2015-0663 631
5. Janssen I, LeBlanc AG. Systematic review of the health benefits of physical activity and fitness in 632
school-aged children and youth. Int J Behav Nutr Phys Act. 2010;7(1):40. doi:10.1186/1479-5868-633
7-40 634
6. Kremer P, Elshaug C, Leslie E, Toumbourou JW, Patton GC, Williams J. Physical activity, 635
leisure-time screen use and depression among children and young adolescents. J Sci Med Sport. 636
2014;17(2):183-187. doi:10.1016/J.JSAMS.2013.03.012 637
7. McMahon EM, Corcoran P, O’Regan G, et al. Physical activity in European adolescents and 638
associations with anxiety, depression and well-being. Eur Child Adolesc Psychiatry. 639
2017;26(1):111-122. doi:10.1007/s00787-016-0875-9 640
8. United Nations Development Programme. Human Development Index (HDI) | Human 641
Page 27 of 61
Human Kinetics, 1607 N Market St, Champaign, IL 61825
Journal of Physical Activity and Health
123456789101112131415161718192021222324252627282930313233343536373839404142434445464748495051525354555657585960

For Peer Review
RUNNING HEAD: Very High HDI Country Physical Activity Grades for Children and Youth
28
Development Reports. http://hdr.undp.org/en/content/human-development-index-hdi. Accessed 642
April 7, 2018. 643
9. Land KC. The Human Development Index: Objective Approaches (2). In: Global Handbook of 644
Quality of Life. Dordrecht: Springer Netherlands; 2015:133-157. doi:10.1007/978-94-017-9178-645
6_7 646
10. Fasting MH, Nilsen T IL, Holmen TL, Vik T. Life style related to blood pressure and body weight 647
in adolescence: Cross sectional data from the Young-HUNT study, Norway. BMC Public Health. 648
2008;8(1):111. doi:10.1186/1471-2458-8-111 649
11. Ekelund U, Luan J, Sherar LB, et al. Moderate to Vigorous Physical Activity and Sedentary Time 650
and Cardiometabolic Risk Factors in Children and Adolescents. JAMA. 2012;307(7):704. 651
doi:10.1001/jama.2012.156 652
12. Andersen LB, Harro M, Sardinha LB, et al. Physical activity and clustered cardiovascular risk in 653
children: a cross-sectional study (The European Youth Heart Study). Lancet. 2006;368(9532):299-654
304. doi:10.1016/S0140-6736(06)69075-2 655
13. Ekelund U, Anderssen SA, Froberg K, et al. Independent associations of physical activity and 656
cardiorespiratory fitness with metabolic risk factors in children: the European youth heart study. 657
Diabetologia. 2007;50(9):1832-1840. doi:10.1007/s00125-007-0762-5 658
14. Dumuid D, Maher C, Lewis LK, et al. Human development index, children’s health-related quality 659
of life and movement behaviors: a compositional data analysis. Qual Life Res. 2018;27(6):1473-660
1482. doi:10.1007/s11136-018-1791-x 661
15. Lee I-M, Shiroma EJ, Lobelo F, Puska P, Blair SN, Katzmarzyk PT. Effect of physical inactivity 662
on major non-communicable diseases worldwide: an analysis of burden of disease and life 663
expectancy. Lancet. 2012;380(9838):219-229. doi:10.1016/S0140-6736(12)61031-9 664
Page 28 of 61
Human Kinetics, 1607 N Market St, Champaign, IL 61825
Journal of Physical Activity and Health
123456789101112131415161718192021222324252627282930313233343536373839404142434445464748495051525354555657585960

For Peer Review
RUNNING HEAD: Very High HDI Country Physical Activity Grades for Children and Youth
29
16. Ding Ding M, Lawson KD, Kolbe-Alexander TL, et al. The economic burden of physical 665
inactivity: a global analysis of major non-communicable diseases. Lancet. 2016;388(10051):1311-666
1324. doi:10.1016/S0140-6736(16)30383-X 667
17. Konstabel K, Veidebaum T, Verbestel V, et al. Objectively measured physical activity in 668
European children: the IDEFICS study. Int J Obes. 2014;38(S2):S135-S143. 669
doi:10.1038/ijo.2014.144 670
18. Sheldrick M, Tyler R, Mackintosh K, Stratton G. Relationship between Sedentary Time, Physical 671
Activity and Multiple Lifestyle Factors in Children. J Funct Morphol Kinesiol. 2018;3(1):15. 672
doi:10.3390/jfmk3010015 673
19. BAPTISTA F, SANTOS DA, SILVA AM, et al. Prevalence of the Portuguese Population 674
Attaining Sufficient Physical Activity. Med Sci Sport Exerc. 2012;44(3):466-473. 675
doi:10.1249/MSS.0b013e318230e441 676
20. Mielgo-Ayuso J, Aparicio-Ugarriza R, Castillo A, et al. Physical Activity Patterns of the Spanish 677
Population Are Mostly Determined by Sex and Age: Findings in the ANIBES Study. Carpenter 678
DO, ed. PLoS One. 2016;11(2):e0149969. doi:10.1371/journal.pone.0149969 679
21. Kokko S, Mehtälä A. The Physical Activity Behaviours of Children and Adolescents in Finland. 680
Results of the LIITU Study, 2016.; 2016. 681
22. Kalman M, Inchley J, Sigmundova D, et al. Secular trends in moderate-to-vigorous physical 682
activity in 32 countries from 2002 to 2010: a cross-national perspective. Eur J Public Health. 683
2015;25(suppl 2):37-40. doi:10.1093/eurpub/ckv024 684
23. Tabak I, Mazur J, Nałęcz H. Family and individual predictors and mediators of adolescent 685
physical activity. Heal Psychol Rep. 2017;4(4):333-344. doi:10.5114/hpr.2017.67522 686
24. Sigmund E, Sigmundová D, Badura P, Kalman M, Hamrik Z, Pavelka J. Temporal Trends in 687
Page 29 of 61
Human Kinetics, 1607 N Market St, Champaign, IL 61825
Journal of Physical Activity and Health
123456789101112131415161718192021222324252627282930313233343536373839404142434445464748495051525354555657585960

For Peer Review
RUNNING HEAD: Very High HDI Country Physical Activity Grades for Children and Youth
30
Overweight and Obesity, Physical Activity and Screen Time among Czech Adolescents from 2002 688
to 2014: A National Health Behaviour in School-Aged Children Study. Int J Environ Res Public 689
Health. 2015;12(9):11848-11868. doi:10.3390/ijerph120911848 690
25. Jodkowska M, Mazur J, Oblacińska A. Perceived barriers to physical activity among Polish 691
adolescents. Przegl Epidemiol. 2015;69(1):73-78. 692
http://www.przeglepidemiol.pzh.gov.pl/perceived-barriers-to-physical-activity-among-polish-693
adolescents?lang=pl. Accessed May 30, 2018. 694
26. World Health Organization, WHO. Global recommendation on physical activity for health. 695
http://www.who.int/dietphysicalactivity/factsheet_recommendations/en/. Published 2010. 696
Accessed January 11, 2018. 697
27. Kremer P, Elshaug C, Leslie E, Toumbourou JW, Patton GC, Williams J. Physical activity, 698
leisure-time screen use and depression among children and young adolescents. J Sci Med Sport. 699
2014;17(2):183-187. doi:10.1016/J.JSAMS.2013.03.012 700
28. Aguilar-Farias N, Martino-Fuentealba P, Carcamo-Oyarzun J, et al. A regional vision of physical 701
activity, sedentary behaviour and physical education in adolescents from Latin America and the 702
Caribbean: results from 26 countries. Int J Epidemiol. March 2018. doi:10.1093/ije/dyy033 703
29. Chiang P-H, Huang L-Y, Lee M-S, Tsou H-C, Wahlqvist ML. Fitness and food environments 704
around junior high schools in Taiwan and their association with body composition: Gender 705
differences for recreational, reading, food and beverage exposures. Kaser S, ed. PLoS One. 706
2017;12(8):e0182517. doi:10.1371/journal.pone.0182517 707
30. Wong SH-S, Huang WY, He G. Longitudinal changes in objectively measured physical activity 708
differ for weekdays and weekends among Chinese children in Hong Kong. BMC Public Health. 709
2015;15(1):1310. doi:10.1186/s12889-015-2618-0 710
Page 30 of 61
Human Kinetics, 1607 N Market St, Champaign, IL 61825
Journal of Physical Activity and Health
123456789101112131415161718192021222324252627282930313233343536373839404142434445464748495051525354555657585960
For Peer Review
RUNNING HEAD: Very High HDI Country Physical Activity Grades for Children and Youth
31
31. Tanaka C, Tanaka M, Okuda M, Inoue S, Aoyama T, Tanaka S. Association between objectively 711
evaluated physical activity and sedentary behavior and screen time in primary school children. 712
BMC Res Notes. 2017;10(1):175. doi:10.1186/s13104-017-2495-y 713
32. Lee E-Y, Spence JC, Tremblay MS, Carson V. Meeting 24-Hour Movement Guidelines for 714
Children and Youth and associations with psychological well-being among South Korean 715
adolescents. Ment Health Phys Act. 2018;14:66-73. doi:10.1016/J.MHPA.2018.02.001 716
33. Sharara E, Akik C, Ghattas H, Makhlouf Obermeyer C. Physical inactivity, gender and culture in 717
Arab countries: a systematic assessment of the literature. BMC Public Health. 2018;18(1):639. 718
doi:10.1186/s12889-018-5472-z 719
34. Haroun D, ElSaleh O, Wood L. Dietary and Activity Habits in Adolescents Living in the United 720
Arab Emirates: A Cross-Sectional Study. Vol 1. [s.n.]; 2017. 721
https://knepublishing.com/index.php/AJNE/article/view/1226/2672. Accessed May 24, 2018. 722
35. Zaabi M Al, Shah SM, Sheek-Hussein M, Abdulle A, Junaibi A Al, Loney T. Results From the 723
United Arab Emirates’ 2016 Report Card on Physical Activity for Children and Youth. J Phys Act 724
Heal. 2016;13(11 Suppl 2):S299-S306. doi:10.1123/jpah.2016-0312 725
36. Cooper AR, Goodman A, Page AS, et al. Objectively measured physical activity and sedentary 726
time in youth: the International children’s accelerometry database (ICAD). Int J Behav Nutr Phys 727
Act. 2015;12(1):113. doi:10.1186/s12966-015-0274-5 728
37. Tremblay MS, Gray CE, Akinroye K, et al. Physical Activity of Children: A Global Matrix of 729
Grades Comparing 15 Countries. J Phys Act Heal. 2014;11(s1):S113-S125. 730
doi:10.1123/jpah.2014-0177 731
38. Colley RC, Brownrigg M, Tremblay MS. A Model of Knowledge Translation in Health. Health 732
Promot Pract. 2012;13(3):320-330. doi:10.1177/1524839911432929 733
Page 31 of 61
Human Kinetics, 1607 N Market St, Champaign, IL 61825
Journal of Physical Activity and Health
123456789101112131415161718192021222324252627282930313233343536373839404142434445464748495051525354555657585960

For Peer Review
RUNNING HEAD: Very High HDI Country Physical Activity Grades for Children and Youth
32
39. Tremblay MS, Barnes JD, González SA, et al. Global Matrix 2.0: Report Card Grades on the 734
Physical Activity of Children and Youth Comparing 38 Countries. J Phys Act Heal. 2016;13(11 735
Suppl 2):S343-S366. doi:10.1123/jpah.2016-0594 736
40. Active Healthy Kids Global Alliance. About Us » Active Healthy Kids Global Alliance. 737
https://www.activehealthykids.org/about-us/. Accessed May 27, 2018. 738
41. Aubert S, Barnes JD, Adbeta C, Tremblay MS. Physical Activity Report Card Grades for Children 739
and Youth: Result and Analysis from 49 Countries. J Phys Act Heal. 2018. 740
42. Wei T, Simko V, Levy M, Xie Y, Jin Y, Zemla J. Visualization of a Correlation Matrix: Corrplot. 741
2017. https://github.com/taiyun/corrplot. 742
43. Wickham H. Ggplot2: Elegant Graphics for Data Analysis. Vol 77. Second. (Springer-Verlag, 743
ed.). New York; 2009. 744
44. Conway JR, Lex A, Gehlenborg N. UpSetR: an R package for the visualization of intersecting sets 745
and their properties. Bioinformatics. 2017;33(18):2938-2940. doi:10.1093/bioinformatics/btx364 746
45. Kowarik A, Templ M. Imputation with the R Package VIM. J Stat Softw. 2016;74(7):1-16. 747
doi:10.18637/jss.v074.i07 748
46. Ibrahim I, Al Hammadi E, Sayegh S, et al. Results from Qatar’s 2018 Report Card on Physical 749
Activity for Children and Youth. J Phys Act Heal. 2018. 750
47. Evenson KR, Catellier DJ, Gill K, Ondrak KS, McMurray RG. Calibration of two objective 751
measures of physical activity for children. J Sports Sci. 2008;26(14):1557-1565. 752
doi:10.1080/02640410802334196 753
48. Topič MD, Coakley J. Complicating the Relationship between Sport and National Identity: The 754
Case of Post-Socialist Slovenia. Sociol Sport J. 2010;27(4):371-389. doi:10.1123/ssj.27.4.371 755
Page 32 of 61
Human Kinetics, 1607 N Market St, Champaign, IL 61825
Journal of Physical Activity and Health
123456789101112131415161718192021222324252627282930313233343536373839404142434445464748495051525354555657585960

For Peer Review
RUNNING HEAD: Very High HDI Country Physical Activity Grades for Children and Youth
33
49. SLOfit. What is SLOfit. http://en.slofit.org/. Accessed July 23, 2018. 756
50. Sember V, Starc G, Jurak G, et al. Results From the Republic of Slovenia’s 2016 Report Card on 757
Physical Activity for Children and Youth. J Phys Act Heal. 2016;13(11 Suppl 2):S256-S264. 758
doi:10.1123/jpah.2016-0294 759
51. Sember V, Morrison SA, Jurak G, et al. Results from Slovenia’s 2018 Report Card on Physical 760
Activity for Children and Youth. J Phys Act Heal. 2018. 761
52. The official website of Denmark. Sports for Everyone. http://denmark.dk/en/lifestyle/sport/sports-762
for-everyone/. Accessed July 24, 2018. 763
53. Nørager Johansen DL, Neerfeldt Christensen BF, Fester M, et al. Results from Denmark’s 2018 764
Report Card on Physical Activity for Children and Youth. J Phys Act Heal. 2018. 765
54. Mori N, Armada F, Willcox DC. Walking to school in Japan and childhood obesity prevention: 766
new lessons from an old policy. Am J Public Health. 2012;102(11):2068-2073. 767
doi:10.2105/AJPH.2012.300913 768
55. Tanaka C, Tanaka S, Inoue S, et al. Results From Japan’s 2018 Report Card on Physical Activity 769
for Children and Youth. J Phys Act Heal. 2018. 770
56. Tomkinson GR, Carver KD, Atkinson F, et al. European normative values for physical fitness in 771
children and adolescents aged 9-17 years: results from 2 779 165 Eurofit performances 772
representing 30 countries. Br J Sports Med. November 2017:bjsports-2017-098253. 773
doi:10.1136/bjsports-2017-098253 774
57. Tanaka C, Tanaka M, Tanaka S. Objectively evaluated physical activity and sedentary time in 775
primary school children by gender, grade and types of physical education lessons. BMC Public 776
Health. 777
58. Aguilar-Farias N, Cortinez-O’Ryan A, Sadarangani KP, et al. Results From Chile’s 2016 Report 778
Page 33 of 61
Human Kinetics, 1607 N Market St, Champaign, IL 61825
Journal of Physical Activity and Health
123456789101112131415161718192021222324252627282930313233343536373839404142434445464748495051525354555657585960
For Peer Review
RUNNING HEAD: Very High HDI Country Physical Activity Grades for Children and Youth
34
Card on Physical Activity for Children and Youth. J Phys Act Heal. 2016;13(11 Suppl 2):S117-779
S123. doi:10.1123/jpah.2016-0314 780
59. Aguilar-Farias N, Miranda-Marquez S, Sadarangani KP, et al. Results from Chile’s 2018 Report 781
Card on Physical Activity for Children and Youth. J Phys Act Heal. 2018. 782
60. Dentro KN, Beals K, Crouter SE, et al. Results from the United States’ 2014 Report Card on 783
Physical Activity for Children and Youth. J Phys Act Heal. 2014;11(s1):S105-S112. 784
doi:10.1123/jpah.2014-0184 785
61. Katzmarzyk PT, Denstel KD, Beals K, et al. Results From the United States of America’s 2016 786
Report Card on Physical Activity for Children and Youth. J Phys Act Heal. 2016;13(11 Suppl 787
2):S307-S313. doi:10.1123/jpah.2016-0321 788
62. Katzmarzyk PT, Denstel KD, Beals K, et al. Results from the United States 2018 Report Card on 789
Physical Activity for Children and Youth. J Phys Act Heal. 2018. 790
63. Takken T, de Jong N. Results from the Netherlands’s 2018 Report Card on Physical Activity for 791
Children and Youth. J Phys Act Heal. 2018. 792
64. Seghers J, De Baere S, Verloigne M, Cardon G. Results from Flanders’ 2018 Report Card on 793
Physical Activity for Children and Youth. J Phys Act Heal. 2018. 794
65. Hughes AR, Johnstone A, Bardid F, Reilly JJ. Results from Scotland’s 2018 Report Card on 795
Physical Activity for Children and Youth. J Phys Act Heal. 2018. 796
66. Oh J-W, Lim J, Lee S-H, Jin Y, Oh B, Chung Gun Lee, Deok Hwan Lee, Eun-Young Lee, Han 797
Joo Lee, Hyon Park, Hyun Joo Kang, Justin Y. Jeon, Mi-Seong Yu, Sang-Hoon Suh, SeJung Park, 798
So Jung Lee, Soo Jung Park, Wook Song, Yewon Yu, Yoonkyung Song, Youngwon Kim YSK. 799
Results from South Korea’s 2018 Report Card on Physical Activity for Children and Youth. J 800
Phys Act Heal. 2018. 801
Page 34 of 61
Human Kinetics, 1607 N Market St, Champaign, IL 61825
Journal of Physical Activity and Health
123456789101112131415161718192021222324252627282930313233343536373839404142434445464748495051525354555657585960

For Peer Review
RUNNING HEAD: Very High HDI Country Physical Activity Grades for Children and Youth
35
67. Roman-Viñas B, Zazo F, Martínez-Martínez J, Aznar-Laín S, Serra-Majem L. Results from 802
Spain’s 2018 Report Card on Physical Activity for Children and Youth. J Phys Act Heal. 2018. 803
68. Aubert S, Aucouturier J, Ganière C, et al. Results from France’s 2018 Report Card on Physical 804
Activity for Children and Youth. J Phys Act Heal. 2018. 805
69. Standage M, Sherar L, Curran T, et al. Results from England’s 2018 Report Card on Physical 806
Activity for Children and Youth. J Phys Act Heal. 2018. 807
70. Gába A, Dygrýn J, Mitáš J, Jakubec L, Frömel K. Effect of Accelerometer Cut-Off Points on the 808
Recommended Level of Physical Activity for Obesity Prevention in Children. Buchowski M, ed. 809
PLoS One. 2016;11(10):e0164282. doi:10.1371/journal.pone.0164282 810
71. Dowda M, Pate RR, Sallis J, Freedson PS. Accelerometer (CSA) count cut points for physical 811
activity intensity ranges in youth. Med Sci Sport Exerc. 1997;29(5):72. 812
https://journals.lww.com/acsm-813
msse/pages/articleviewer.aspx?year=1997&issue=05001&article=00412&type=fulltext. 814
72. Puyau MR, Adolph AL, Vohra FA, Zakeri I, Butte NF. Prediction of Activity Energy Expenditure 815
Using Accelerometers in Children. Med Sci Sport Exerc. 2004;36(9):1625-1631. 816
doi:10.1249/01.MSS.0000139898.30804.60 817
73. Van Hecke L, Loyen A, Verloigne M, et al. Variation in population levels of physical activity in 818
European children and adolescents according to cross-European studies: a systematic literature 819
review within DEDIPAC. Int J Behav Nutr Phys Act. 2016;13(1):70. doi:10.1186/s12966-016-820
0396-4 821
74. Barnes JD, Cameron C, Carson V, et al. Results from Canada’s 2018 Report Card on Physical 822
Activity for Children and Youth. J Phys Act Heal. 2018. 823
75. Canadian Fitness and Lifestyle Research Institute. Bulletin 02: Participation in organized physical 824
Page 35 of 61
Human Kinetics, 1607 N Market St, Champaign, IL 61825
Journal of Physical Activity and Health
123456789101112131415161718192021222324252627282930313233343536373839404142434445464748495051525354555657585960

For Peer Review
RUNNING HEAD: Very High HDI Country Physical Activity Grades for Children and Youth
36
activity and sport | www.cflri.ca. http://cflri.ca/document/bulletin-02-participation-organized-825
physical-activity-and-sport. Published 2016. Accessed July 26, 2018. 826
76. Delisle Nyström C, Larsson C, Alexandrou C, et al. Results from Sweden’s 2018 Report Card on 827
Physical Activity for Children and Youth. J Phys Act Heal. 2018. 828
77. RiksidrottsFörbundet. Sport in Sweden.; 2012. www.rf.se. Accessed July 26, 2018. 829
78. Truelove S, Vanderloo LM, Tucker P. Defining and Measuring Active Play Among Young 830
Children: A Systematic Review. J Phys Act Heal. 2017;14(2):155-166. doi:10.1123/jpah.2016-831
0195 832
79. Gába A, Rubín L, Badura P, et al. Results from the Czech Republic’s 2018 Report Card on 833
Physical Activity for Children and Youth. J Phys Act Heal. 2018. 834
80. Smith M, Ikeda E, Hinckson E, et al. Results from New Zealand’s 2018 Report Card on Physical 835
Activity for Children and Youth. J Phys Act Heal. 2018. 836
81. Huang WY, Wong SH-S, Wong MC-S, Sit CH-P, Sum RK-W, He G. Results From Hong Kong’s 837
2016 Report Card on Physical Activity for Children and Youth. J Phys Act Heal. 2016;13(11 838
Suppl 2):S169-S175. doi:10.1123/jpah.2016-0302 839
82. Larouche R, Saunders TJ, John Faulkner GE, Colley R, Tremblay M. Associations between Active 840
School Transport and Physical Activity, Body Composition, and Cardiovascular Fitness: A 841
Systematic Review of 68 Studies. J Phys Act Heal. 2014;11(1):206-227. doi:10.1123/jpah.2011-842
0345 843
83. Tremblay MSMS, Aubert S, Barnes JDJD, et al. Sedentary Behavior Research Network (SBRN) - 844
Terminology Consensus Project process and outcome. Int J Behav Nutr Phys Act. 2017;14(1):75. 845
doi:10.1186/s12966-017-0525-8 846
84. Carson V, Hunter S, Kuzik N, et al. Systematic review of sedentary behaviour and health 847
Page 36 of 61
Human Kinetics, 1607 N Market St, Champaign, IL 61825
Journal of Physical Activity and Health
123456789101112131415161718192021222324252627282930313233343536373839404142434445464748495051525354555657585960

For Peer Review
RUNNING HEAD: Very High HDI Country Physical Activity Grades for Children and Youth
37
indicators in school-aged children and youth: an update. Appl Physiol Nutr Metab. 2016;41(6 848
(Suppl. 3)):S240-S265. doi:10.1139/apnm-2015-0630 849
85. Tremblay MS, LeBlanc AG, Janssen I, et al. Canadian Sedentary Behaviour Guidelines for 850
Children and Youth. Appl Physiol Nutr Metab. 2011;36(1):59-64. doi:10.1139/H11-012 851
86. Mäestu E, Kull M, Mooses K, et al. Results from Estonian’s 2018 Report Card on Physical 852
Activity for Children and Youth. J Phys Act Heal. 2018. 853
87. Pate RR. The Evolving Definition of Physical Fitness. Quest. 1988;40(3):174-179. 854
doi:10.1080/00336297.1988.10483898 855
88. Caspersen CJ, Powell KE, Christenson GM. Physical activity, exercise, and physical fitness: 856
definitions and distinctions for health-related research. Public Health Rep. 1985;100(2):126-131. 857
http://www.ncbi.nlm.nih.gov/pubmed/3920711. Accessed May 13, 2018. 858
89. Lang JJ, Belanger K, Poitras V, Janssen I, Tomkinson GR, Tremblay MS. Systematic review of 859
the relationship between 20m shuttle run performance and health indicators among children and 860
youth. J Sci Med Sport. 2018;21(4):383-397. doi:10.1016/j.jsams.2017.08.002 861
90. Huang WY, Wong SHS, Sit CHP, et al. Results from Hong Kong’s 2018 Report Card on Physical 862
Activity for Children and Youth. J Phys Act Heal. 2018. 863
91. Scriven J, Cabot J, Mitchell D, Kennedy D. Results from Jersey’s 2018 Report Card on Physical 864
Activity for Children and Youth. J Phys Act Heal. 2018. 865
92. Sterdt E, Liersch S, Walter U. Correlates of physical activity of children and adolescents: A 866
systematic review of reviews. Health Educ J. 2014;73(1):72-89. doi:10.1177/0017896912469578 867
93. Zembura P, Korcz A, Cieśla E, Gołdys A, Nałęcz H. Results from Poland’s 2018 Report Card on 868
Physical Activity for Children and Youth. J Phys Act Heal. 2018. 869
Page 37 of 61
Human Kinetics, 1607 N Market St, Champaign, IL 61825
Journal of Physical Activity and Health
123456789101112131415161718192021222324252627282930313233343536373839404142434445464748495051525354555657585960
For Peer Review
RUNNING HEAD: Very High HDI Country Physical Activity Grades for Children and Youth
38
94. Demetriou Y, Hebestreit A, Reimers AK, et al. Results from Germany’s 2018 Report Card on 870
Physical Activity for Children and Youth. J Phys Act Heal. 2018. 871
95. Kämppi K, Aira A, Halme N, et al. Results from Finland’s 2018 Report Card on Physical Activity 872
for Children and Youth. J Phys Act Heal. 2018. 873
96. Mota J, Santos R, Coelho-e-Silva MJ, Raimundo AM, Sardinha LB. Results from Portugal’s 2018 874
Report Card on Physical Activity for Children and Youth. J Phys Act Heal. 2018. 875
97. Trudeau F, Shephard RJ. Physical education, school physical activity, school sports and academic 876
performance. Int J Behav Nutr Phys Act. 2008;5(1):10. doi:10.1186/1479-5868-5-10 877
98. Schranz N, Glennon V, Evans J, et al. Results from Australia’s 2018 Report Card on Physical 878
Activity for Children and Youth. J Phys Act Heal. 2018. 879
99. Chang C-K, Wu C-L. Results from Chinese Taipei (Taiwan)’s 2018 Report Card on Physical 880
Activity for Children and Youth. J Phys Act Heal. 2018. 881
100. Edwards LC, Tyler R, Blain D, et al. Results from Wales’ 2018 Report Card on Physical Activity 882
for Children and Youth. J Phys Act Heal. 2018. 883
101. Paulo MS, Nauman J, Abdulle A, et al. Results from the United Arab Emirates’ 2018 Report Card 884
on Physical Activity for Children and Youth. J Phys Act Heal. 2018. 885
102. Williams A, Whitman L, Le Page Y, Le Page C, Chester G, Sebire SJ. Results from the Bailiwick 886
of Guernsey’s 2018 Report Card on Physical Activity for Children and Youth. J Phys Act Heal. 887
2018. 888
103. Aubert S, Barnes JD, Forse M, Turner E, Schranz N. International Impact of the Report Cards and 889
Global Matrices of Physical Activity Grades for Children and Youth. J Phys Act Heal. 2018. 890
104. The World Bank. GINI index (World Bank estimate) | Data. 891
Page 38 of 61
Human Kinetics, 1607 N Market St, Champaign, IL 61825
Journal of Physical Activity and Health
123456789101112131415161718192021222324252627282930313233343536373839404142434445464748495051525354555657585960
For Peer Review
RUNNING HEAD: Very High HDI Country Physical Activity Grades for Children and Youth
39
https://data.worldbank.org/indicator/SI.POV.GINI?view=map. Accessed April 7, 2018. 892
105. The World Bank. Population density (people per sq. km of land area) | Data. 2016. 893
https://data.worldbank.org/indicator/EN.POP.DNST. Accessed June 27, 2018. 894
106. The Economist Intelligence Unit. Global Food Security Index: Overview. 2017. 895
https://foodsecurityindex.eiu.com/Index. Accessed June 27, 2018. 896
107. The Organisation for Economic Co-operation and Development. Poverty Rate. 897
https://data.oecd.org/inequality/poverty-rate.htm. Accessed June 27, 2018. 898
108. United Nations Department of Economic and Social Affairs. Social Indicators/ Population growth 899
and distribution. https://unstats.un.org/unsd/demographic/products/socind/. Accessed June 27, 900
2018. 901
109. Hastings DA. Filling Gaps in the Human Development Index: Findings for Asia and the Pacific. 902
Bangkok; 2009. https://www.unescap.org/sites/default/files/wp-09-02.pdf. Accessed July 17, 903
2018. 904
110. The United States Central Intelligence Agency. The World Factbook, Guide to Country Profiles. 905
https://www.cia.gov/library/publications/resources/the-world-factbook/docs/profileguide.html. 906
Accessed July 17, 2018. 907
111. State of Guernsey. Guernsey Household Income.; 2015. 908
https://www.gov.gg/CHttpHandler.ashx?id=110715&p=0. Accessed July 17, 2018. 909
112. State of Jersey. Jersey Household Income Distribution 2014/15.; 2015. 910
https://www.gov.je/SiteCollectionDocuments/Government and administration/R Income 911
Distribution Survey Report 2014-15 20151112 SU.pdf. Accessed July 17, 2018. 912
113. National Statistics Republic of China (Taiwan). Report on The Survey of Family Income and 913
Expenditure. https://eng.stat.gov.tw/ct.asp?xItem=3417&CtNode=1596&mp=5. Accessed June 28, 914
Page 39 of 61
Human Kinetics, 1607 N Market St, Champaign, IL 61825
Journal of Physical Activity and Health
123456789101112131415161718192021222324252627282930313233343536373839404142434445464748495051525354555657585960
For Peer Review
RUNNING HEAD: Very High HDI Country Physical Activity Grades for Children and Youth
40
2018. 915
916
917
918
919
920
921
922
923
924
925
926
927
928
929
930
931
932
933
934
Page 40 of 61
Human Kinetics, 1607 N Market St, Champaign, IL 61825
Journal of Physical Activity and Health
123456789101112131415161718192021222324252627282930313233343536373839404142434445464748495051525354555657585960

For Peer Review
RUNNING HEAD: Very High HDI Country Physical Activity Grades for Children and Youth
41
Table 1: Global Matrix 3.0 indicators and benchmarks used to guide the grade assignment process 935
Indicator Benchmark
Overall Physical
Activity
% of children and youth who meet the Global Recommendations on Physical
Activity for Health, which recommend that children and youth accumulate at least
60 minutes of moderate- to vigorous-intensity physical activity per day on
average. Or % of children and youth meeting the guidelines on at least 4 days a
week (when an average cannot be estimated).
Organized Sport and
Physical Activity
% of children and youth who participate in organized sport and/or physical
activity programs.
Active Play % of children and youth who engage in unstructured/unorganized active play at
any intensity for more than 2 hours a day.
% of children and youth who report being outdoors for more than 2 hours a day.
Active
Transportation
% of children and youth who use active transportation to get to and from places
(e.g., school, park, mall, friend’s house).
Sedentary Behaviors % of children and youth who meet the Canadian Sedentary Behaviour Guidelines
(5- to 17-year-olds: no more than 2 hours of recreational screen time per day).
Note: the Guidelines currently provide a time limit recommendation for screen-
related pursuits, but not for non-screen-related pursuits.
Physical Fitness Average percentile achieved on certain physical fitness indicators based on the
normative values published by Tomkinson et al.56
Family and Peers % of family members (e.g., parents, guardians) who facilitate physical activity
and sport opportunities for their children (e.g., volunteering, coaching, driving,
paying for membership fees and equipment).
% of parents who meet the Global Recommendations on Physical Activity for
Health, which recommend that adults accumulate at least 150 minutes of
moderate-intensity aerobic physical activity throughout the week or do at least 75
minutes of vigorous-intensity aerobic physical activity throughout the week or an
equivalent combination of moderate- and vigorous-intensity physical activity.
% of family members (e.g., parents, guardians) who are physically active with
their kids.
% of children and youth with friends and peers who encourage and support them
to be physically active.
% of children and youth who encourage and support their friends and peers to be
physically active.
Page 41 of 61
Human Kinetics, 1607 N Market St, Champaign, IL 61825
Journal of Physical Activity and Health
123456789101112131415161718192021222324252627282930313233343536373839404142434445464748495051525354555657585960

For Peer Review
RUNNING HEAD: Very High HDI Country Physical Activity Grades for Children and Youth
42
School % of schools with active school policies (e.g., daily PE, daily physical activity,
recess, “everyone plays” approach, bike racks at school, traffic calming on school
property, outdoor time).
% of schools where the majority (≥ 80%) of students are taught by a PE specialist.
% of schools where the majority (≥ 80%) of students are offered the mandated
amount of PE (for the given state/territory/region/country).
% of schools that offer physical activity opportunities (excluding PE) to the
majority (> 80%) of their students.
% of parents who report their children and youth have access to physical activity
opportunities at school in addition to PE classes.
% of schools with students who have regular access to facilities and equipment
that support physical activity (e.g., gymnasium, outdoor playgrounds, sporting
fields, multi-purpose space for physical activity, equipment in good condition).
Community and the
Built Environment
% of children or parents who perceive their community/municipality is doing a
good job at promoting physical activity (e.g., variety, location, cost, quality).
% of communities/municipalities that report they have policies promoting
physical activity.
% of communities/municipalities that report they have infrastructure (e.g.,
sidewalks, trails, paths, bike lanes) specifically geared toward promoting physical
activity.
% of children or parents who report having facilities, programs, parks and
playgrounds available to them in their community.
% of children or parents who report living in a safe neighbourhood where they
can be physically active.
% of children or parents who report having well-maintained facilities, parks and
playgrounds in their community that are safe to use.
Government Evidence of leadership and commitment in providing physical activity
opportunities for all children and youth.
Allocated funds and resources for the implementation of physical activity
promotion strategies and initiatives for all children and youth.
Demonstrated progress through the key stages of public policy making (i.e.,
policy agenda, policy formation, policy implementation, policy evaluation and
decisions about the future).
936
937
938
939
940
941
Page 42 of 61
Human Kinetics, 1607 N Market St, Champaign, IL 61825
Journal of Physical Activity and Health
123456789101112131415161718192021222324252627282930313233343536373839404142434445464748495051525354555657585960

For Peer Review
RUNNING HEAD: Very High HDI Country Physical Activity Grades for Children and Youth
43
Table 2: Global Matrix 3.0 grading rubric 942
Grade Interpretation Corresponding
number for analysis
A+ 94% - 100% 15
A We are succeeding with a large majority of children and youth (87% -
93%)
14
A- 80% - 86% 13
B+ 74% - 79% 12
B We are succeeding with well over half of children and youth (67% -
73%)
11
B- 60% - 66% 10
C+ 54% - 59% 9
C We are succeeding with about half of children and youth (47% -
53%)
8
C- 40% - 46% 7
D+ 34% - 39% 6
D We are succeeding with less than half but some children and youth
(27% - 33%)
5
D- 20% - 26% 4
F We are succeeding with very few children and youth (<20%) 2
INC Incomplete - insufficient or inadequate information to assign a grade No Grade
943
944
945
946
947
948
949
950
951
952
Page 43 of 61
Human Kinetics, 1607 N Market St, Champaign, IL 61825
Journal of Physical Activity and Health
123456789101112131415161718192021222324252627282930313233343536373839404142434445464748495051525354555657585960
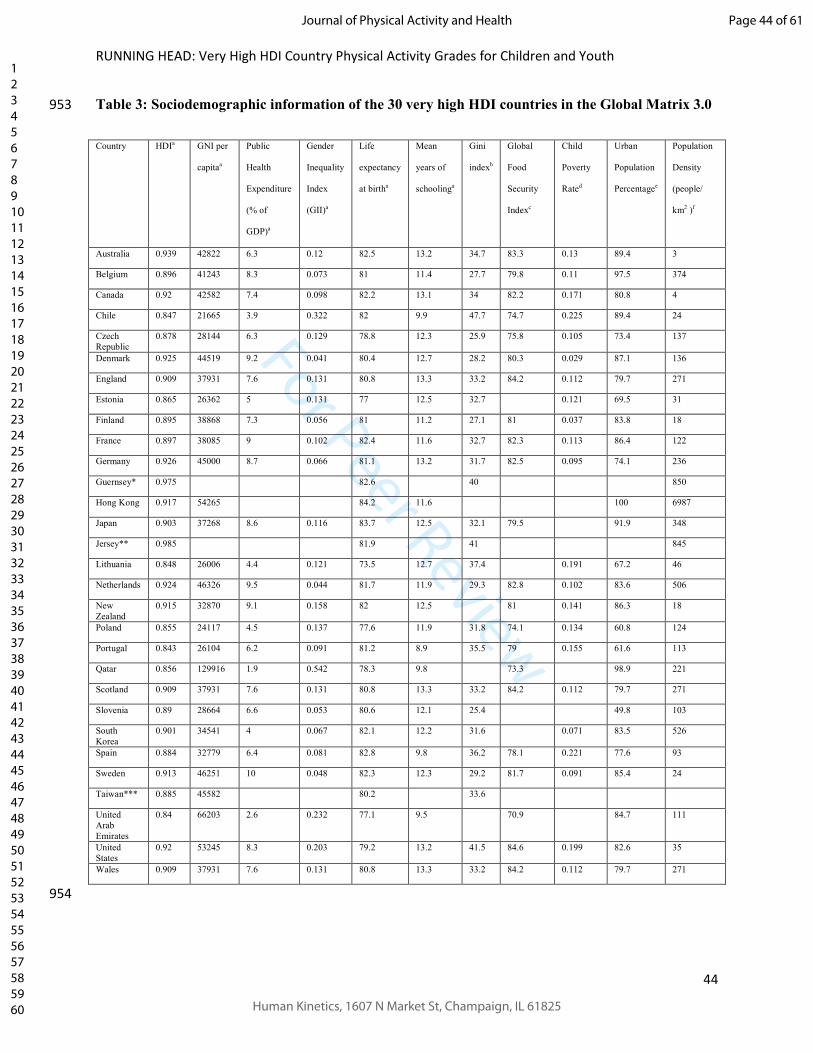
For Peer Review
RUNNING HEAD: Very High HDI Country Physical Activity Grades for Children and Youth
44
Table 3: Sociodemographic information of the 30 very high HDI countries in the Global Matrix 3.0 953
Country HDIa GNI per
capitaa
Public
Health
Expenditure
(% of
GDP)a
Gender
Inequality
Index
(GII)a
Life
expectancy
at birtha
Mean
years of
schoolinga
Gini
indexb
Global
Food
Security
Indexc
Child
Poverty
Rated
Urban
Population
Percentagee
Population
Density
(people/
km2 )f
Australia 0.939 42822 6.3 0.12 82.5 13.2 34.7 83.3 0.13 89.4 3
Belgium 0.896 41243 8.3 0.073 81 11.4 27.7 79.8 0.11 97.5 374
Canada 0.92 42582 7.4 0.098 82.2 13.1 34 82.2 0.171 80.8 4
Chile 0.847 21665 3.9 0.322 82 9.9 47.7 74.7 0.225 89.4 24
Czech
Republic
0.878 28144 6.3 0.129 78.8 12.3 25.9 75.8 0.105 73.4 137
Denmark 0.925 44519 9.2 0.041 80.4 12.7 28.2 80.3 0.029 87.1 136
England 0.909 37931 7.6 0.131 80.8 13.3 33.2 84.2 0.112 79.7 271
Estonia 0.865 26362 5 0.131 77 12.5 32.7 0.121 69.5 31
Finland 0.895 38868 7.3 0.056 81 11.2 27.1 81 0.037 83.8 18
France 0.897 38085 9 0.102 82.4 11.6 32.7 82.3 0.113 86.4 122
Germany 0.926 45000 8.7 0.066 81.1 13.2 31.7 82.5 0.095 74.1 236
Guernsey* 0.975 82.6 40 850
Hong Kong 0.917 54265 84.2 11.6 100 6987
Japan 0.903 37268 8.6 0.116 83.7 12.5 32.1 79.5 91.9 348
Jersey** 0.985 81.9 41 845
Lithuania 0.848 26006 4.4 0.121 73.5 12.7 37.4 0.191 67.2 46
Netherlands 0.924 46326 9.5 0.044 81.7 11.9 29.3 82.8 0.102 83.6 506
New
Zealand
0.915 32870 9.1 0.158 82 12.5 81 0.141 86.3 18
Poland 0.855 24117 4.5 0.137 77.6 11.9 31.8 74.1 0.134 60.8 124
Portugal 0.843 26104 6.2 0.091 81.2 8.9 35.5 79 0.155 61.6 113
Qatar 0.856 129916 1.9 0.542 78.3 9.8 73.3 98.9 221
Scotland 0.909 37931 7.6 0.131 80.8 13.3 33.2 84.2 0.112 79.7 271
Slovenia 0.89 28664 6.6 0.053 80.6 12.1 25.4 49.8 103
South
Korea
0.901 34541 4 0.067 82.1 12.2 31.6 0.071 83.5 526
Spain 0.884 32779 6.4 0.081 82.8 9.8 36.2 78.1 0.221 77.6 93
Sweden 0.913 46251 10 0.048 82.3 12.3 29.2 81.7 0.091 85.4 24
Taiwan*** 0.885 45582 80.2 33.6
United
Arab
Emirates
0.84 66203 2.6 0.232 77.1 9.5 70.9 84.7 111
United
States
0.92 53245 8.3 0.203 79.2 13.2 41.5 84.6 0.199 82.6 35
Wales 0.909 37931 7.6 0.131 80.8 13.3 33.2 84.2 0.112 79.7 271
954
Page 44 of 61
Human Kinetics, 1607 N Market St, Champaign, IL 61825
Journal of Physical Activity and Health
123456789101112131415161718192021222324252627282930313233343536373839404142434445464748495051525354555657585960
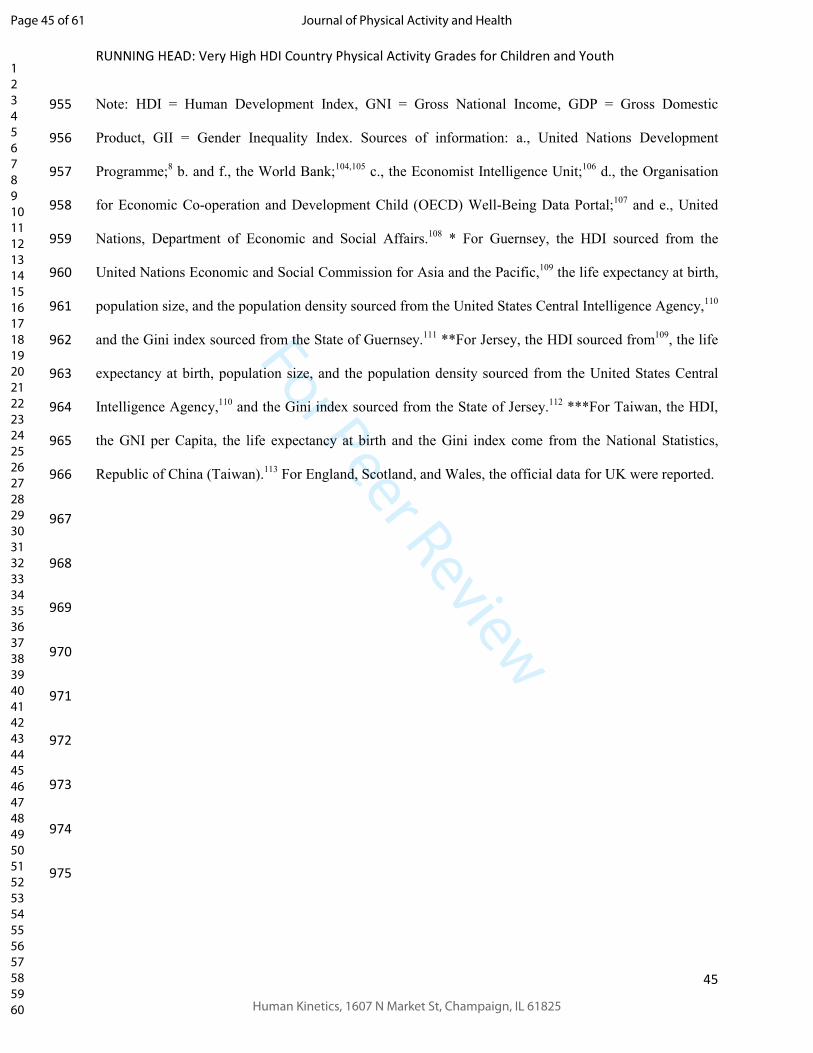
For Peer Review
RUNNING HEAD: Very High HDI Country Physical Activity Grades for Children and Youth
45
Note: HDI = Human Development Index, GNI = Gross National Income, GDP = Gross Domestic 955
Product, GII = Gender Inequality Index. Sources of information: a., United Nations Development 956
Programme;8 b. and f., the World Bank;
104,105 c., the Economist Intelligence Unit;
106 d., the Organisation 957
for Economic Co-operation and Development Child (OECD) Well-Being Data Portal;107
and e., United 958
Nations, Department of Economic and Social Affairs.108
* For Guernsey, the HDI sourced from the 959
United Nations Economic and Social Commission for Asia and the Pacific,109
the life expectancy at birth, 960
population size, and the population density sourced from the United States Central Intelligence Agency,110
961
and the Gini index sourced from the State of Guernsey.111
**For Jersey, the HDI sourced from109
, the life 962
expectancy at birth, population size, and the population density sourced from the United States Central 963
Intelligence Agency,110
and the Gini index sourced from the State of Jersey.112
***For Taiwan, the HDI, 964
the GNI per Capita, the life expectancy at birth and the Gini index come from the National Statistics, 965
Republic of China (Taiwan).113
For England, Scotland, and Wales, the official data for UK were reported. 966
967
968
969
970
971
972
973
974
975
Page 45 of 61
Human Kinetics, 1607 N Market St, Champaign, IL 61825
Journal of Physical Activity and Health
123456789101112131415161718192021222324252627282930313233343536373839404142434445464748495051525354555657585960

For Peer Review
RUNNING HEAD: Very High HDI Country Physical Activity Grades for Children and Youth
46
Table 4: Grades assigned to the 10 core physical activity indicators for the 30 very high HDI 976
countries of the Global Matrix 3.0 977
PA SP AP AT SB PF FAM SCH COM GOV AVG
Australia D- B- INC D+ D- D+ C+ B+ A- D C-
Belgium
(Flanders)
F B INC C+ C INC C+ B- B B C
Canada D+ B+ D D- D+ D C+ B- B+ C+ C-
Chile D- D- INC F C- D F D B B- D
Czech Republic D B- D- C+ D- C+ C+ B+ B C+ C
Denmark D- A- INC B+ D+ INC INC A- B+ A- B-
England C- D+ INC C- D+ C- INC B+ C INC C-
Estonia D- C F D F INC D C+ B B D+
Finland D C+ C B+ D- C B- A B+ A- C+
France D C- INC C- D- B- INC B INC C C-
Germany D- B D- C- D- INC B- B+ B+ INC C
Guernsey D C+ INC D C INC INC INC INC D D+
Hong Kong C- C INC B+ C- D D- C B C C-
Japan INC B- INC A- C- A C- B+ B- B B-
Jersey D- INC INC D+ C D C B- C D D+
Lithuania C- C INC C- C- C+ D C+ C C C-
Netherlands C B B B- C- INC INC C INC INC C+
New Zealand D- B C+ C- D INC C B- B B+ C
Poland D- D INC C D C- C- B C C+ C-
Portugal D B- INC C- C- C C A B B C+
Qatar D D+ INC N/A D+ INC INC C INC B+ C-
Scotland F B INC C F INC INC INC B- C D+
Slovenia A- C+ D C B+ A- B+ A B A B
Page 46 of 61
Human Kinetics, 1607 N Market St, Champaign, IL 61825
Journal of Physical Activity and Health
123456789101112131415161718192021222324252627282930313233343536373839404142434445464748495051525354555657585960
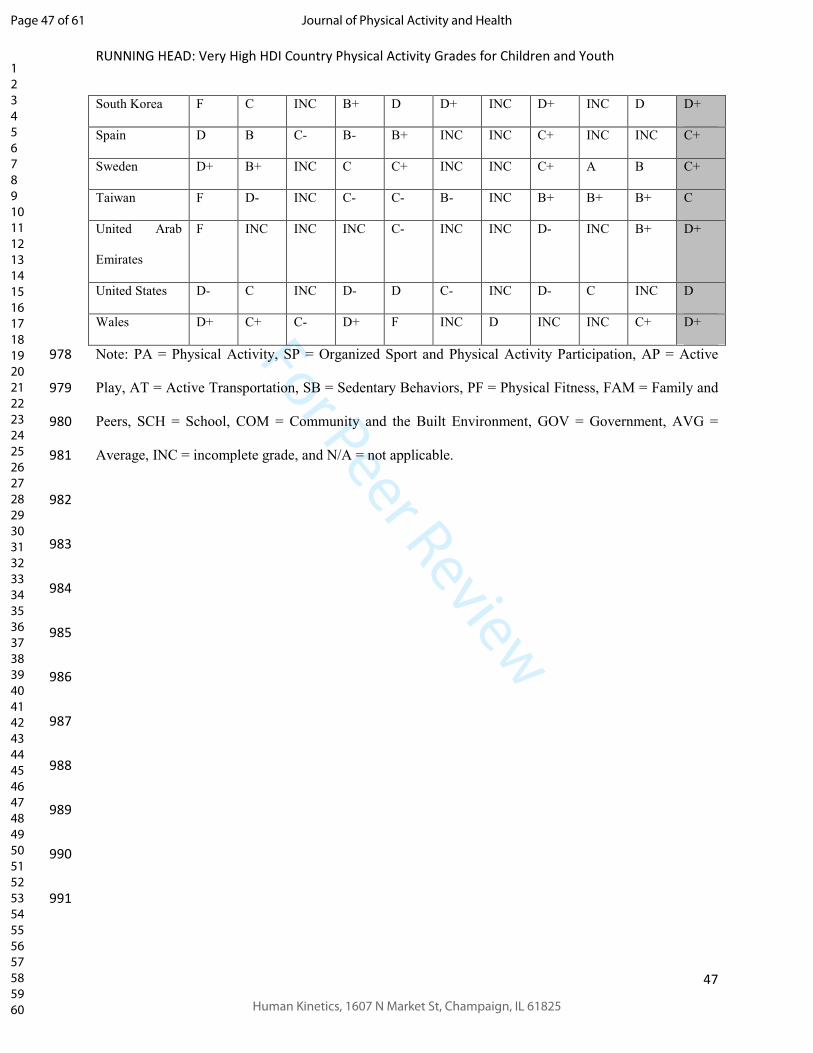
For Peer Review
RUNNING HEAD: Very High HDI Country Physical Activity Grades for Children and Youth
47
South Korea F C INC B+ D D+ INC D+ INC D D+
Spain D B C- B- B+ INC INC C+ INC INC C+
Sweden D+ B+ INC C C+ INC INC C+ A B C+
Taiwan F D- INC C- C- B- INC B+ B+ B+ C
United Arab
Emirates
F INC INC INC C- INC INC D- INC B+ D+
United States D- C INC D- D C- INC D- C INC D
Wales D+ C+ C- D+ F INC D INC INC C+ D+
Note: PA = Physical Activity, SP = Organized Sport and Physical Activity Participation, AP = Active 978
Play, AT = Active Transportation, SB = Sedentary Behaviors, PF = Physical Fitness, FAM = Family and 979
Peers, SCH = School, COM = Community and the Built Environment, GOV = Government, AVG = 980
Average, INC = incomplete grade, and N/A = not applicable. 981
982
983
984
985
986
987
988
989
990
991
Page 47 of 61
Human Kinetics, 1607 N Market St, Champaign, IL 61825
Journal of Physical Activity and Health
123456789101112131415161718192021222324252627282930313233343536373839404142434445464748495051525354555657585960
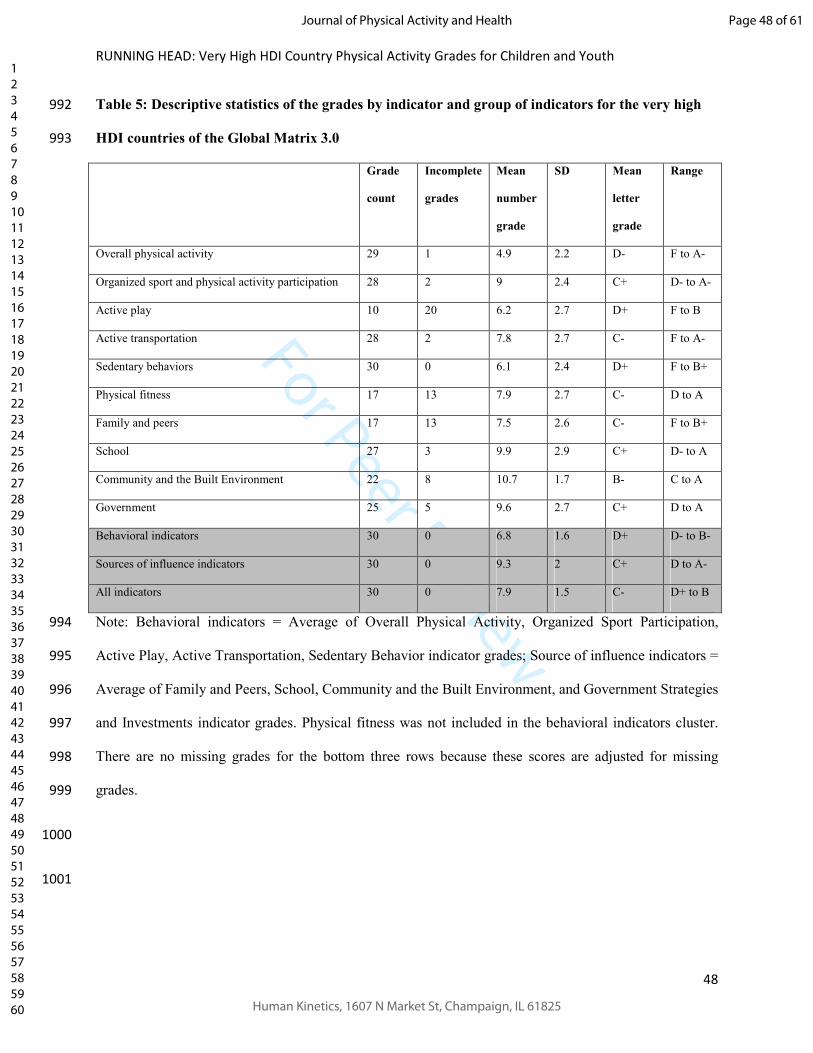
For Peer Review
RUNNING HEAD: Very High HDI Country Physical Activity Grades for Children and Youth
48
Table 5: Descriptive statistics of the grades by indicator and group of indicators for the very high 992
HDI countries of the Global Matrix 3.0 993
Grade
count
Incomplete
grades
Mean
number
grade
SD Mean
letter
grade
Range
Overall physical activity 29 1 4.9 2.2 D- F to A-
Organized sport and physical activity participation 28 2 9 2.4 C+ D- to A-
Active play 10 20 6.2 2.7 D+ F to B
Active transportation 28 2 7.8 2.7 C- F to A-
Sedentary behaviors 30 0 6.1 2.4 D+ F to B+
Physical fitness 17 13 7.9 2.7 C- D to A
Family and peers 17 13 7.5 2.6 C- F to B+
School 27 3 9.9 2.9 C+ D- to A
Community and the Built Environment 22 8 10.7 1.7 B- C to A
Government 25 5 9.6 2.7 C+ D to A
Behavioral indicators 30 0 6.8 1.6 D+ D- to B-
Sources of influence indicators 30 0 9.3 2 C+ D to A-
All indicators 30 0 7.9 1.5 C- D+ to B
Note: Behavioral indicators = Average of Overall Physical Activity, Organized Sport Participation, 994
Active Play, Active Transportation, Sedentary Behavior indicator grades; Source of influence indicators = 995
Average of Family and Peers, School, Community and the Built Environment, and Government Strategies 996
and Investments indicator grades. Physical fitness was not included in the behavioral indicators cluster. 997
There are no missing grades for the bottom three rows because these scores are adjusted for missing 998
grades. 999
1000
1001
Page 48 of 61
Human Kinetics, 1607 N Market St, Champaign, IL 61825
Journal of Physical Activity and Health
123456789101112131415161718192021222324252627282930313233343536373839404142434445464748495051525354555657585960

For Peer Review
RUNNING HEAD: Very High HDI Country Physical Activity Grades for Children and Youth
49
Figure 1: Frequency plot by letter grade among 30 very high-HDI countries in the Global Matrix 1002
3.0. A: For the 10 core indicators. B: For the behavioral indicators and for the source of influence 1003
indicators. 1004
1005
1006
1007
1008
1009
Note: Behavioral indicators = Average of Overall Physical Activity, Organized Sport Participation, 1010
Active Play, Active Transportation, Sedentary Behavior indicator grades; Source of influence indicators = 1011
Average of Family and Peers, School, Community and the Built Environment, and Government Strategies 1012
and Investments indicator grades. Physical fitness was not included in the behavioral indicators cluster. 1013
1014
1015
1016
1017
1018
1019
1020
1021
1022
A B
Frequency
Page 49 of 61
Human Kinetics, 1607 N Market St, Champaign, IL 61825
Journal of Physical Activity and Health
123456789101112131415161718192021222324252627282930313233343536373839404142434445464748495051525354555657585960

For Peer Review
RUNNING HEAD: Very High HDI Country Physical Activity Grades for Children and Youth
50
Figure 2: Plot of the overall score estimated for the 10 core indicators for the 30 very high HDI 1023
countries of the Global Matrix 3.0 1024
Note: The overall score was adjusted for missing and incomplete grades. The number in parenthesis 1025
shows the number of grades available for the calculation of the score. 1026
1027
1028
1029
1030
1031
1032
1033
1034
Page 50 of 61
Human Kinetics, 1607 N Market St, Champaign, IL 61825
Journal of Physical Activity and Health
123456789101112131415161718192021222324252627282930313233343536373839404142434445464748495051525354555657585960

For Peer Review
RUNNING HEAD: Very High HDI Country Physical Activity Grades for Children and Youth
51
Figure 3: Plot of the behavioral score estimated for the very high HDI countries of the Global 1035
Matrix 3.0 1036
Note: The overall score was adjusted for missing and incomplete grades. The number in parenthesis 1037
shows the number of grades available for the calculation of the score. 1038
1039
1040
1041
1042
1043
Page 51 of 61
Human Kinetics, 1607 N Market St, Champaign, IL 61825
Journal of Physical Activity and Health
123456789101112131415161718192021222324252627282930313233343536373839404142434445464748495051525354555657585960

For Peer Review
RUNNING HEAD: Very High HDI Country Physical Activity Grades for Children and Youth
52
Figure 4: Plot of the source of influence indicators score for the very high HDI countries of the 1044
Global Matrix 3.0 1045
Note: The overall score was adjusted for missing and incomplete grades. The number in parenthesis 1046
shows the number of grades available for the calculation of the score. These estimates of sources of 1047
influence score are interpreted with a high degree of caution as they are likely imprecise estimates of 1048
sources of influence due to the level of missing data used to determine this score. 1049
1050
1051
Page 52 of 61
Human Kinetics, 1607 N Market St, Champaign, IL 61825
Journal of Physical Activity and Health
123456789101112131415161718192021222324252627282930313233343536373839404142434445464748495051525354555657585960

For Peer Review
Subjective (self-report)
Subjective (self-report)
Subjective (self-report)
Subjective (self-report)
Subjective (self-report)
Subjective (self-report)
Subjective (self-report)
Subjective (parent/guardian-report)
Subjective (self-report)
Subjective (parent/guardian-report)
Subjective (parent/guardian-report for 5-14
years old, self-report for 15-17years old)
Subjective (parent/guardian-report for 5-10
years old, self-report for 11-15 years old))
Subjective (self-report)
Subjective (parent/guardian-report)
Canada Objective
Subjective (self-report)
Subjective (self-report)
Subjective (self-report)
Subjective (self-report)
Objective
Objective
Objective
Subjective (self-report)
Subjective (self-report)
Subjective (self-report)
Subjective (self-report)
Subjective (self-report)
England Subjective (self-report)
Chinese Taipei Subjective (self-report)
MethodCountry
Belgium (Flanders)
Czech Republic
Objective
Australia
Denmark
Chile
Page 53 of 61
Human Kinetics, 1607 N Market St, Champaign, IL 61825
Journal of Physical Activity and Health
123456789101112131415161718192021222324252627282930313233343536373839404142434445464748495051525354555657585960

For Peer Review
Subjective (parent/guardian-report for 5-12
years old, self-report for 13-15)
Objective
Objective
Subjective (self-report)
Subjective (self-report)
Subjective (self-report)
Subjective (self-report)
Objective
Subjective (parent/guardian-report for 3-11
years old, self report for 12-17 years old)
Subjective (self-report)
Objective
Objective
Objective
Subjective (self-report)
Subjective (self-report)
Subjective (self-report)
Subjective (self-report)
Objective
Objective
Japan NA
Jersey Subjective (self-report)
Subjective (self-report)
Subjective (self-report)
Subjective (parent/guardian-report)
Objective
Finland Subjective (self-report)
Guernsey
South Korea
Estonia
Hong Kong Subjective (self-report)
Lithuania
Germany
France Subjective (parent/guardian-report for 6-10
years old; self-report for 11-17 years old)
Subjective (parent/guardian-report for 6-10
years old; self-report for 11-17 years old)
Page 54 of 61
Human Kinetics, 1607 N Market St, Champaign, IL 61825
Journal of Physical Activity and Health
123456789101112131415161718192021222324252627282930313233343536373839404142434445464748495051525354555657585960

For Peer Review
Subjective (self-report)
Subjective (self-report)
Subjective (self-report)
Subjective (parent/guardian-report for 5-11
years old; self-report for 12-17 years old)
Objective
Objective
Subjective (self-report)
Subjective (self-report)
Objective
Subjective (self report)
Subjective (self report)
Objective
Subjective (self-report)
Scotland Subjective (self-report)
Objective
Subjective (parent/guardian-report)
Subjective (self-report)
Subjective (self-report)
Subjective (parent/guardian-report)
Subjective (parent/guardian-report)
Subjective (self-report)
Objective
Objective
United Arab Emirates Subjective (self-report)
Subjective (self-report)
Subjective (parent/guardian-report)
Subjective (parent/guardian-report)
Subjective (self-report)
Sweden
Wales
New Zealand
Netherlands
Slovenia
Qatar
United States
Portugal
Subjective (parent/guardian-report for 4-11
years old, self report for 12-17 years old)
Spain
Poland
Page 55 of 61
Human Kinetics, 1607 N Market St, Champaign, IL 61825
Journal of Physical Activity and Health
123456789101112131415161718192021222324252627282930313233343536373839404142434445464748495051525354555657585960
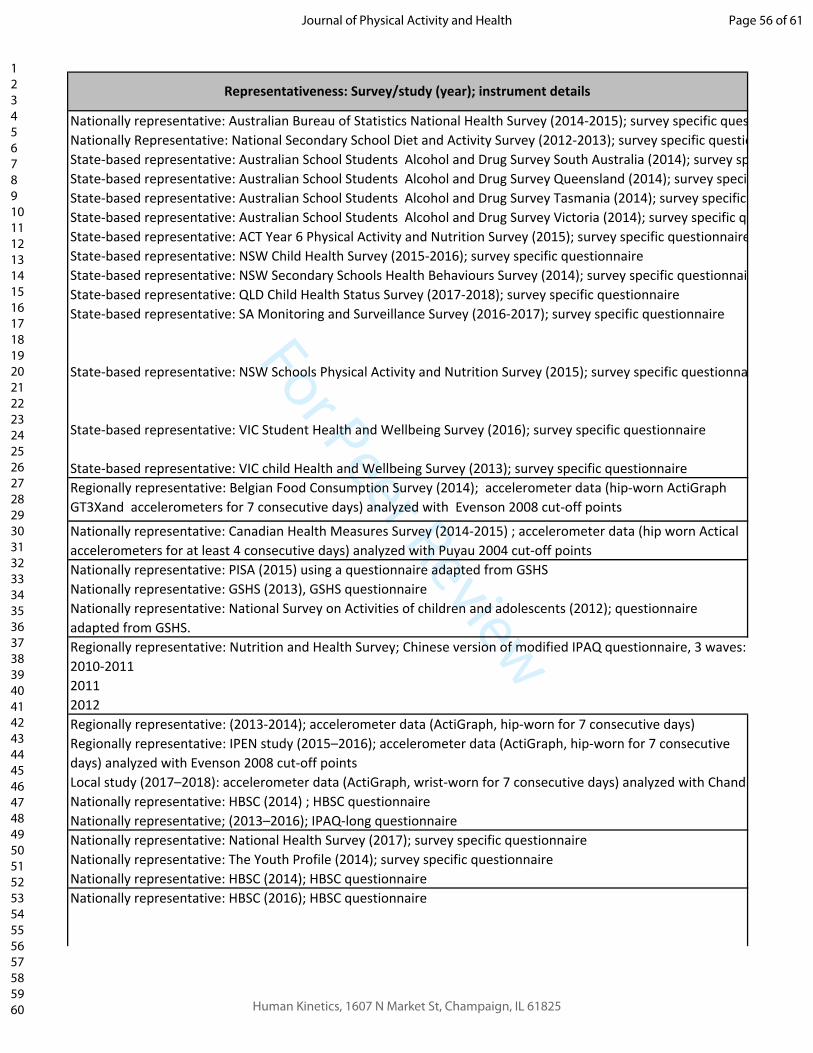
For Peer Review
Nationally representative: Australian Bureau of Statistics National Health Survey (2014-2015); survey specific questionnaire
Nationally Representative: National Secondary School Diet and Activity Survey (2012-2013); survey specific questionnaire
State-based representative: Australian School Students Alcohol and Drug Survey South Australia (2014); survey specific questionnaire
State-based representative: Australian School Students Alcohol and Drug Survey Queensland (2014); survey specific questionnaire
State-based representative: Australian School Students Alcohol and Drug Survey Tasmania (2014); survey specific questionnaire
State-based representative: Australian School Students Alcohol and Drug Survey Victoria (2014); survey specific questionnaire
State-based representative: ACT Year 6 Physical Activity and Nutrition Survey (2015); survey specific questionnaire
State-based representative: NSW Child Health Survey (2015-2016); survey specific questionnaire
State-based representative: NSW Secondary Schools Health Behaviours Survey (2014); survey specific questionnaire
State-based representative: QLD Child Health Status Survey (2017-2018); survey specific questionnaire
State-based representative: SA Monitoring and Surveillance Survey (2016-2017); survey specific questionnaire
State-based representative: NSW Schools Physical Activity and Nutrition Survey (2015); survey specific questionnaire
State-based representative: VIC Student Health and Wellbeing Survey (2016); survey specific questionnaire
State-based representative: VIC child Health and Wellbeing Survey (2013); survey specific questionnaire
Nationally representative: Canadian Health Measures Survey (2014-2015) ; accelerometer data (hip worn Actical
accelerometers for at least 4 consecutive days) analyzed with Puyau 2004 cut-off points
Nationally representative: PISA (2015) using a questionnaire adapted from GSHS
Nationally representative: GSHS (2013), GSHS questionnaire
Regionally representative: Nutrition and Health Survey; Chinese version of modified IPAQ questionnaire, 3 waves:
2010-2011
2011
2012
Regionally representative: (2013-2014); accelerometer data (ActiGraph, hip-worn for 7 consecutive days)
Regionally representative: IPEN study (2015–2016); accelerometer data (ActiGraph, hip-worn for 7 consecutive
days) analyzed with Evenson 2008 cut-off points
Local study (2017–2018): accelerometer data (ActiGraph, wrist-worn for 7 consecutive days) analyzed with Chandler 2005 cut-off points
Nationally representative: HBSC (2014) ; HBSC questionnaire
Nationally representative; (2013–2016); IPAQ-long questionnaire
Nationally representative: National Health Survey (2017); survey specific questionnaire
Nationally representative: The Youth Profile (2014); survey specific questionnaire
Nationally representative: HBSC (2014); HBSC questionnaire
Nationally representative: HBSC (2016); HBSC questionnaire
Representativeness: Survey/study (year); instrument details
Regionally representative: Belgian Food Consumption Survey (2014); accelerometer data (hip-worn ActiGraph
GT3Xand accelerometers for 7 consecutive days) analyzed with Evenson 2008 cut-off points
Nationally representative: National Survey on Activities of children and adolescents (2012); questionnaire
adapted from GSHS.
Page 56 of 61
Human Kinetics, 1607 N Market St, Champaign, IL 61825
Journal of Physical Activity and Health
123456789101112131415161718192021222324252627282930313233343536373839404142434445464748495051525354555657585960

For Peer Review
Nationally representative: Health Survey for England (2015); survey specific questionnaire
Regionally representative: ISCOLE 2015-2016; accelerometer data (hip worn Actigraph wGT3X+ for 7consecutive
days) analyzed with Evenson 2008 cut-off points
Nationally representative: Children´s Physical Activity Study (2015); accelerometer data (hip-worn GT3X for 7
consecutive days) analyzed with Evenson 2008 cut-off points
Nationally representative: HBSC (2014); HBSC questionnaire
Nationally representative: Health Promotion Effectiveness in Estonian Schools (2012-2015);survey specific
Nationally representative: Schools in Motion survey (2018); online survey specific questionnaire
Nationally representative: LIITU study (2016); HBSC questionnaire
Nationally representative: LIITU study (2016) ; accelerometer data (hip-worn UKK AM30 and UKK RM42
monitors for 7 consecutive days) analyzed with Aittasalo 2015 cut-off points
Nationally representative : INCA3 (2014-2015); survey specific questionnaire
Nationally representative: ESTEBAN (2015); survey specific questionnaire
Nationally representative: ESTEBAN (2015); modified version of YRBSS questionnaire
Nationally representation: KiGGs Study (2009-2017); survey specific questionnaire
Nationally representative: HBSC (2010); HBSC questionnaire
Regionally representative: Gini Study (2014); accelerometer data (hip worn ActiGraph GT3X for 7 consecutive
days) analyzed with Fredson 1997 cut-off points
Regionally representative: MAAS-Kids Study (2008); pedometers data (StepWatch 3™ System worn for 7
Regionally representative: IDEFICS Study (2011); accelerometer data (hip-worn ActiGraph GT1M for at least 3
consecutive days) analyzed with Evenson 2008 cut-off points
Nationally representative: Guernsey Young People’s Survey (2016); survey specific questionnaire
Nationally representative: Guernsey Young People’s Survey (2016); survey specific questionnaire
Nationally representative: Guernsey Young People’s Survey (2016); survey specific questionnaire
Regionally representative (2012-2013); Chinese version of GYTS questionnaire
Regionally representative: IPEN Hong Kong study (2012-2013); accelerometer data data (hip-worn ActiGraph
GT3X and GT3X+ for 7 consecutive days) analyzed with Freedson 1997 cut-off points
Local study (2009-2010): accelerometer data (hip-worn actigraph GT3X for 8 consecutive days) analyzed with
No representative data
Nationally representative: Young People’s Health and Lifestyle Survey (2014); HBSC questionnaire
Nationally representative: Korea National Health and Nutrition Examination Survey (2016); GPAQ
Nationally representative: Korea Youth Risk Behavior web-based Survey (2017), online Korean version of YRBSS questionnaire
Nationally representative: Lithuanian COSI study (2013); WHO COSI questionnaire
Regionally representative: B-PROACT1V 2012-2016; accelerometer data (hip worn Actigraph wGT3X for 5
consecutive days) analyzed with Evenson 2008 cut-off points
Nationally representative: National School Health Promotion Study (2017); survey specific questionnaire
Nationally representative : INCA3 (2014-2015); modified version of YRBSS questionnaire
Regionally representative: National Physical Fitness Survey (2011-2012); survey specific questionnaire
Page 57 of 61
Human Kinetics, 1607 N Market St, Champaign, IL 61825
Journal of Physical Activity and Health
123456789101112131415161718192021222324252627282930313233343536373839404142434445464748495051525354555657585960
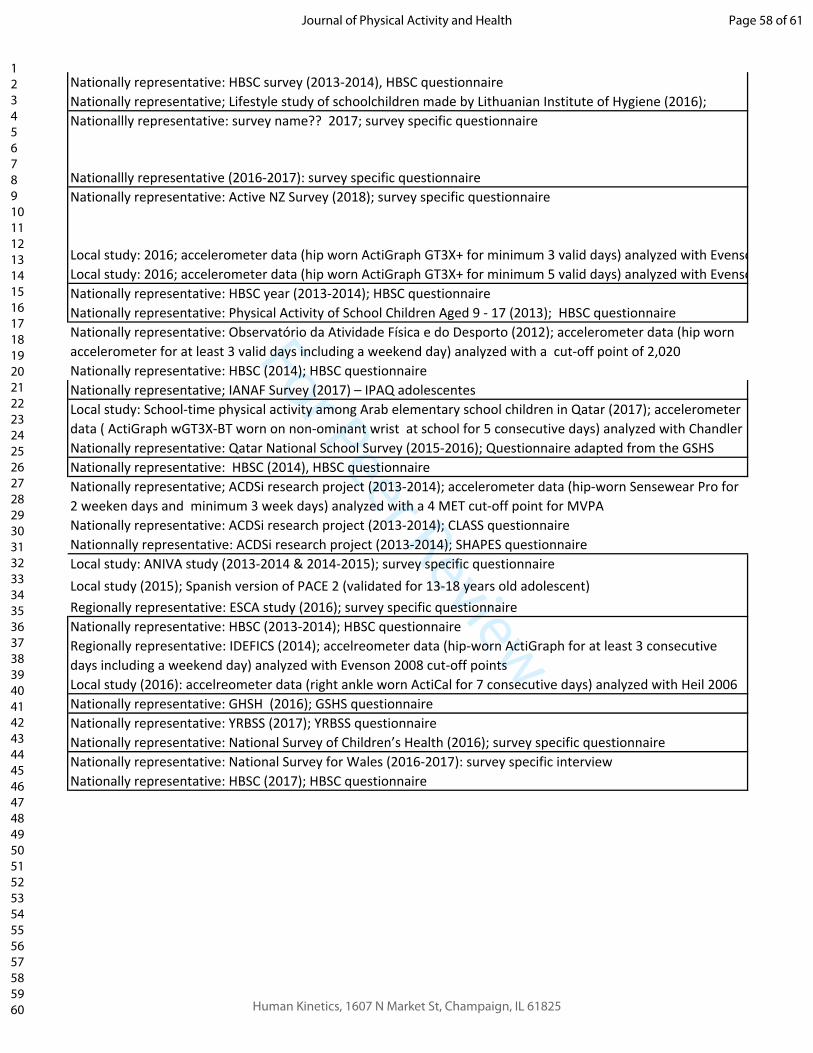
For Peer Review
Nationally representative: HBSC survey (2013-2014), HBSC questionnaire
Nationally representative; Lifestyle study of schoolchildren made by Lithuanian Institute of Hygiene (2016);
Nationallly representative (2016-2017): survey specific questionnaire
Nationally representative: Active NZ Survey (2018); survey specific questionnaire
Local study: 2016; accelerometer data (hip worn ActiGraph GT3X+ for minimum 3 valid days) analyzed with Evenson 2008 cut-off points
Local study: 2016; accelerometer data (hip worn ActiGraph GT3X+ for minimum 5 valid days) analyzed with Evenson 2008 Cut-off points
Nationally representative: HBSC year (2013-2014); HBSC questionnaire
Nationally representative: Physical Activity of School Children Aged 9 - 17 (2013); HBSC questionnaire
Nationally representative: Observatório da Atividade Física e do Desporto (2012); accelerometer data (hip worn
accelerometer for at least 3 valid days including a weekend day) analyzed with a cut-off point of 2,020
Nationally representative: HBSC (2014); HBSC questionnaire
Nationally representative; IANAF Survey (2017) – IPAQ adolescentes
Local study: School-time physical activity among Arab elementary school children in Qatar (2017); accelerometer
data ( ActiGraph wGT3X-BT worn on non-ominant wrist at school for 5 consecutive days) analyzed with Chandler
Nationally representative: Qatar National School Survey (2015-2016); Questionnaire adapted from the GSHS
Nationally representative: HBSC (2014), HBSC questionnaire
Nationally representative; ACDSi research project (2013-2014); accelerometer data (hip-worn Sensewear Pro for
2 weeken days and minimum 3 week days) analyzed with a 4 MET cut-off point for MVPA
Nationally representative: ACDSi research project (2013-2014); CLASS questionnaire
Nationnally representative: ACDSi research project (2013-2014); SHAPES questionnaire
Local study: ANIVA study (2013-2014 & 2014-2015); survey specific questionnaire
Local study (2015); Spanish version of PACE 2 (validated for 13-18 years old adolescent)
Regionally representative: ESCA study (2016); survey specific questionnaire
Nationally representative: HBSC (2013-2014); HBSC questionnaire
Regionally representative: IDEFICS (2014); accelreometer data (hip-worn ActiGraph for at least 3 consecutive
days including a weekend day) analyzed with Evenson 2008 cut-off points
Local study (2016): accelreometer data (right ankle worn ActiCal for 7 consecutive days) analyzed with Heil 2006
Nationally representative: GHSH (2016); GSHS questionnaire
Nationally representative: YRBSS (2017); YRBSS questionnaire
Nationally representative: National Survey of Children’s Health (2016); survey specific questionnaire
Nationally representative: National Survey for Wales (2016-2017): survey specific interview
Nationally representative: HBSC (2017); HBSC questionnaire
Nationallly representative: survey name?? 2017; survey specific questionnaire
Page 58 of 61
Human Kinetics, 1607 N Market St, Champaign, IL 61825
Journal of Physical Activity and Health
123456789101112131415161718192021222324252627282930313233343536373839404142434445464748495051525354555657585960
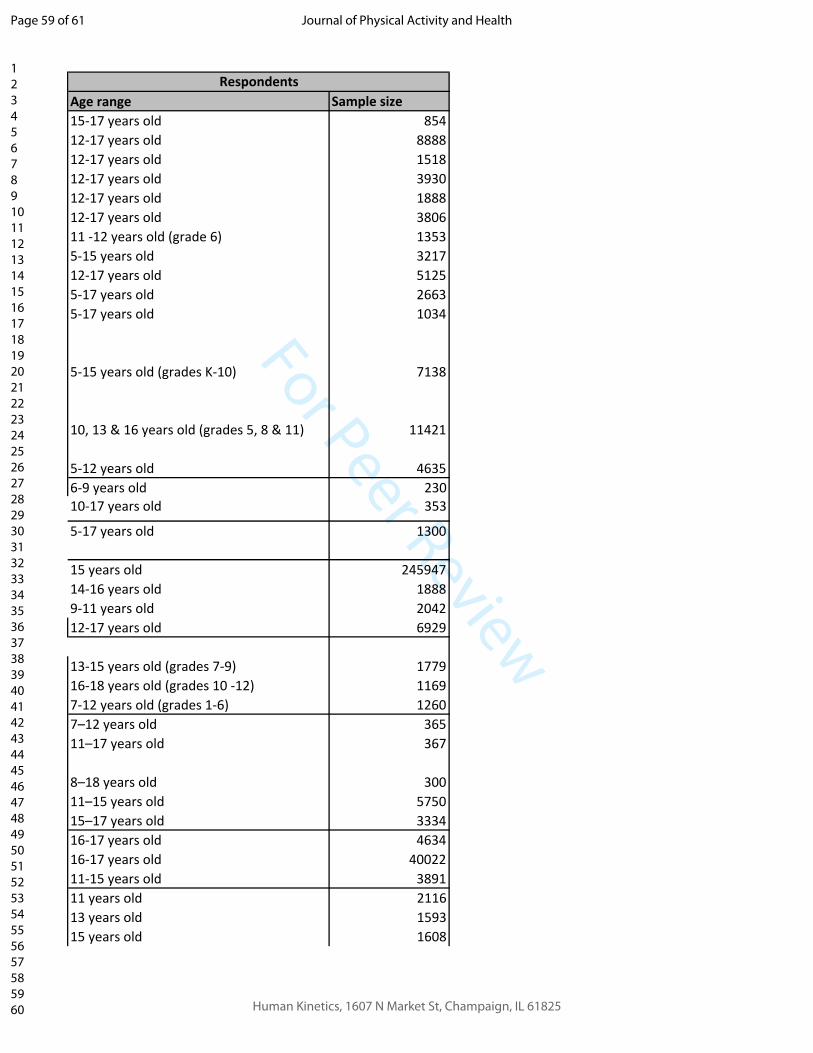
For Peer Review
Age range Sample size
15-17 years old 854
12-17 years old 8888
12-17 years old 1518
12-17 years old 3930
12-17 years old 1888
12-17 years old 3806
11 -12 years old (grade 6) 1353
5-15 years old 3217
12-17 years old 5125
5-17 years old 2663
5-17 years old 1034
5-15 years old (grades K-10) 7138
10, 13 & 16 years old (grades 5, 8 & 11) 11421
5-12 years old 4635
6-9 years old 230
10-17 years old 353
5-17 years old 1300
15 years old 245947
14-16 years old 1888
9-11 years old 2042
12-17 years old 6929
13-15 years old (grades 7-9) 1779
16-18 years old (grades 10 -12) 1169
7-12 years old (grades 1-6) 1260
7–12 years old 365
11–17 years old 367
8–18 years old 300
11–15 years old 5750
15–17 years old 3334
16-17 years old 4634
16-17 years old 40022
11-15 years old 3891
11 years old 2116
13 years old 1593
15 years old 1608
Respondents
Page 59 of 61
Human Kinetics, 1607 N Market St, Champaign, IL 61825
Journal of Physical Activity and Health
123456789101112131415161718192021222324252627282930313233343536373839404142434445464748495051525354555657585960

For Peer Review
5-15 years old 3827
5-6 years old (Phase 1) 1299
8-9 years old (Phase 2) 1223
9-11 years old 374
6-13 years old 492
11, 13 & 15 years old 4057
11-14 years old 1033
10-17 years old 3853
10-11 years old 94531
14-15 years old 71695
9-15 years old 7321
9-15 years old 2931
6-10 years old 644
6-10 years old
11-17 years old
3 to 17 years old 12981
11-15-year 16918
Mean age= 15.6 years old 1054
6-17 year old 1020
2-10.9 years old 516
10-11 years old 564
12-13 & 14-15 years old 875
16-18 years old 800
7-12 years old 2723
13-19 years old 2517
Mean age = 14.8 year old 44478
11-18 years old 552
6-8 years old 263
NA NA
10-15 years old 2842
12-17 years old 524
12-17 years old 57884
Survey of parents/gardians of primary
school children
3802
11-17 years old
1182
1291
Page 60 of 61
Human Kinetics, 1607 N Market St, Champaign, IL 61825
Journal of Physical Activity and Health
123456789101112131415161718192021222324252627282930313233343536373839404142434445464748495051525354555657585960
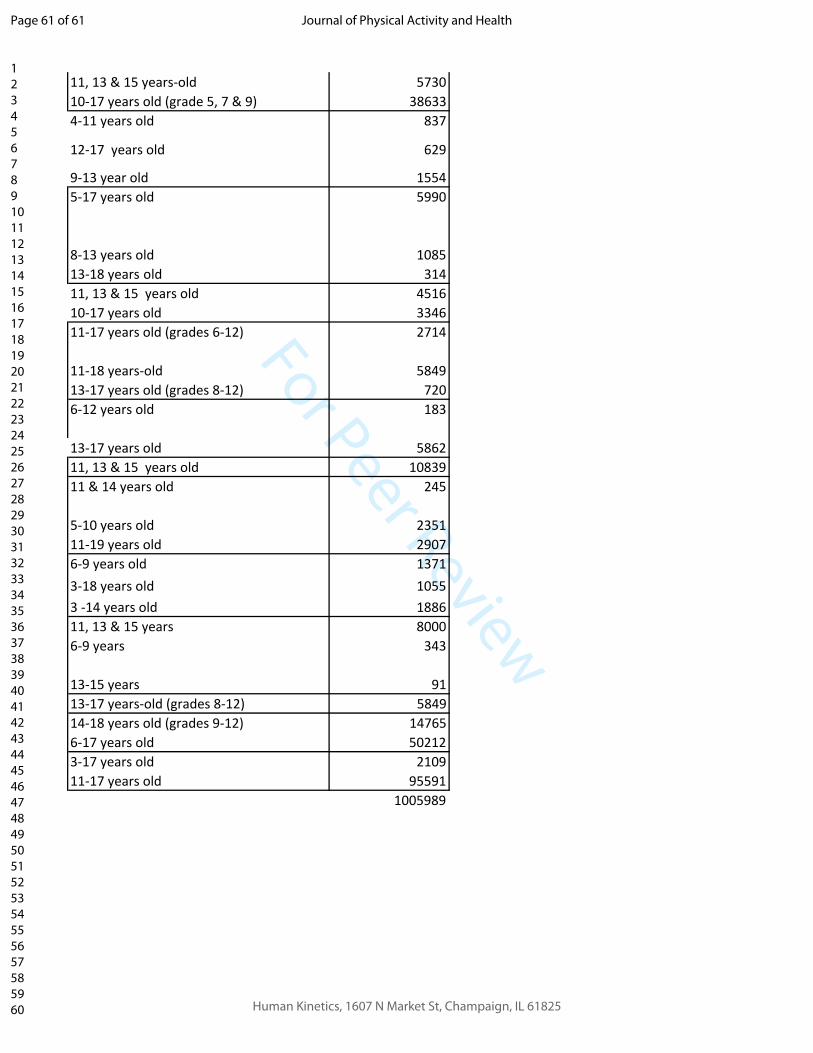
For Peer Review
11, 13 & 15 years-old 5730
10-17 years old (grade 5, 7 & 9) 38633
4-11 years old 837
12-17 years old 629
9-13 year old 1554
5-17 years old 5990
8-13 years old 1085
13-18 years old 314
11, 13 & 15 years old 4516
10-17 years old 3346
11-17 years old (grades 6-12) 2714
11-18 years-old 5849
13-17 years old (grades 8-12) 720
6-12 years old 183
13-17 years old 5862
11, 13 & 15 years old 10839
11 & 14 years old 245
5-10 years old 2351
11-19 years old 2907
6-9 years old 1371
3-18 years old 1055
3 -14 years old 1886
11, 13 & 15 years 8000
6-9 years 343
13-15 years 91
13-17 years-old (grades 8-12) 5849
14-18 years old (grades 9-12) 14765
6-17 years old 50212
3-17 years old 2109
11-17 years old 95591
1005989
Page 61 of 61
Human Kinetics, 1607 N Market St, Champaign, IL 61825
Journal of Physical Activity and Health
123456789101112131415161718192021222324252627282930313233343536373839404142434445464748495051525354555657585960


![Harmonized Tarriffs[1]](https://static.fdocuments.net/doc/165x107/577d2cbd1a28ab4e1eacc307/harmonized-tarriffs1.jpg)