
For our international contacts, please visit: ... · Our turbines deliver reliable output. Legal...
66
Our turbines deliver reliable output.
Transcript of For our international contacts, please visit: ... · Our turbines deliver reliable output. Legal...

Our turbines deliver reliable output.
Legal reference
This Annual Report contains statements oriented to future developments which are based on
our current assumptions and prognoses. As a result of known as well as unknown risks,
uncertainty and influences, the actual results, financial situation or development may deviate
from the assumptions presented in this document. We shall not assume any obligation to
update any statements tuned to future developments.
BR/2
015/
GBR
/AR_
Imag
e
For our international contacts, please visit:www.senvion.com
Senvion GmbH
Überseering 10
22297 Hamburg
Germany
T + 49 40 5555 090-0
F + 49 40 5555 090-3999
www.senvion.com

So do we.
Financial Highlights of Fiscal Year 2015
Important Milestones 2015
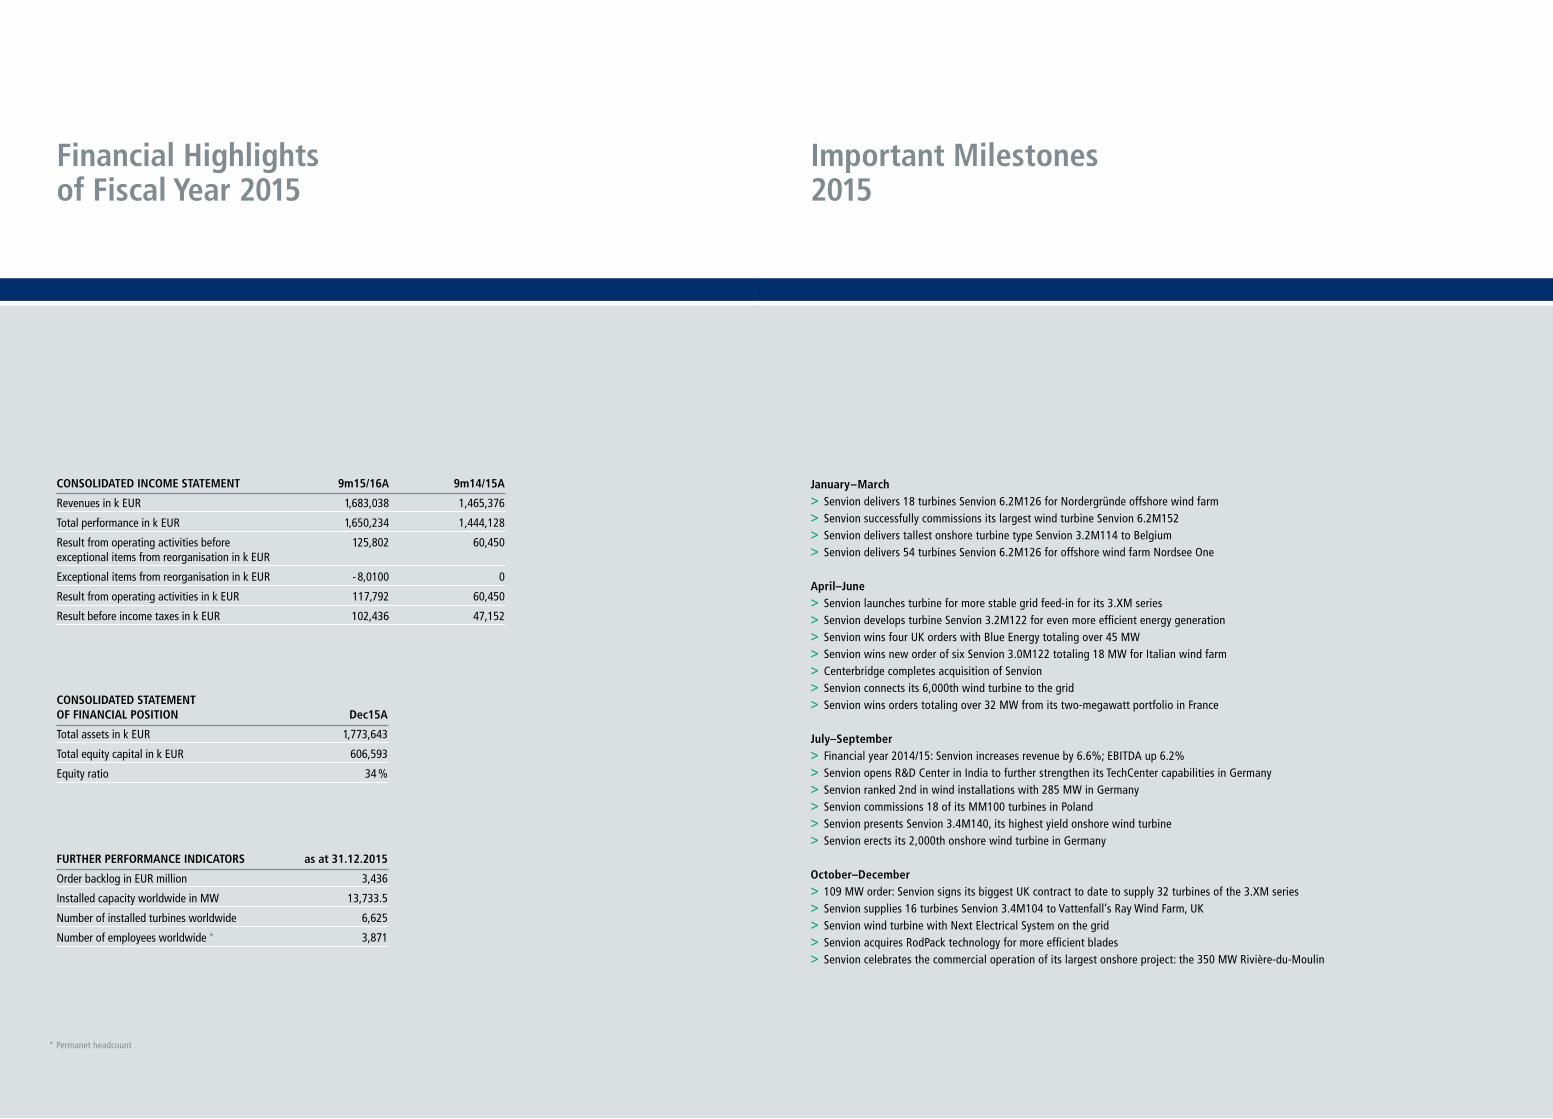
CONSOLIDATED STATEMENT OF FINANCIAL POSITION Dec15A
Total assets in k EUR 1,773,643
Total equity capital in k EUR 606,593
Equity ratio 34 %
FURTHER PERFORMANCE INDICATORS as at 31.12.2015
Order backlog in EUR million 3,436
Installed capacity worldwide in MW 13,733.5
Number of installed turbines worldwide 6,625
Number of employees worldwide * 3,871
CONSOLIDATED INCOME STATEMENT 9m15/16A 9m14/15A
Revenues in k EUR 1,683,038 1,465,376
Total performance in k EUR 1,650,234 1,444,128
Result from operating activities before 125,802 60,450 exceptional items from reorganisation in k EUR
Exceptional items from reorganisation in k EUR - 8,0100 0
Result from operating activities in k EUR 117,792 60,450
Result before income taxes in k EUR 102,436 47,152
January–March > Senvion delivers 18 turbines Senvion 6.2M126 for Nordergründe offshore wind farm > Senvion successfully commissions its largest wind turbine Senvion 6.2M152 > Senvion delivers tallest onshore turbine type Senvion 3.2M114 to Belgium > Senvion delivers 54 turbines Senvion 6.2M126 for offshore wind farm Nordsee One
April–June > Senvion launches turbine for more stable grid feed-in for its 3.XM series > Senvion develops turbine Senvion 3.2M122 for even more efficient energy generation > Senvion wins four UK orders with Blue Energy totaling over 45 MW > Senvion wins new order of six Senvion 3.0M122 totaling 18 MW for Italian wind farm > Centerbridge completes acquisition of Senvion > Senvion connects its 6,000th wind turbine to the grid > Senvion wins orders totaling over 32 MW from its two-megawatt portfolio in France
July–September > Financial year 2014/15: Senvion increases revenue by 6.6%; EBITDA up 6.2% > Senvion opens R&D Center in India to further strengthen its TechCenter capabilities in Germany > Senvion ranked 2nd in wind installations with 285 MW in Germany > Senvion commissions 18 of its MM100 turbines in Poland > Senvion presents Senvion 3.4M140, its highest yield onshore wind turbine > Senvion erects its 2,000th onshore wind turbine in Germany
October–December > 109 MW order: Senvion signs its biggest UK contract to date to supply 32 turbines of the 3.XM series > Senvion supplies 16 turbines Senvion 3.4M104 to Vattenfall’s Ray Wind Farm, UK > Senvion wind turbine with Next Electrical System on the grid > Senvion acquires RodPack technology for more efficient blades > Senvion celebrates the commercial operation of its largest onshore project: the 350 MW Rivière-du-Moulin
Publication details
Published by
Senvion GmbH
Concept, Text, Editing, Realisation
Senvion Holding GmbH, Corporate Communications, Verena Puth
Juliane Hollenhorst PR
Design
Senvion GmbH/Marketing
Verinion GbR
Print/Processing
Müller Ditzen AG
Editorial Deadline: January, 31 2016* Permanet headcount

Our consolidated statements are available as a separate publication.
Our turbines deliver reliable output. So do we.
Content.
3
Today and in the future. 4
With everything the customer needs. 10
And we develop markets. 16
In every kind of wind. 24
Also offshore. 30
For a renewable future. 36
2

Our turbines deliver reliable output. So do we – today and in the future.
4 5

76 Today and in the future. Today and in the future.
Dear readers and wind energy supporters,
For Senvion, 2015 was marked by both continuity and change in equal measure.
We continued to make great strides on our growth trajectory onshore, offshore and in service. As expected after 2014, the wind market experienced a slight up- surge in 2015, and Senvion was able to be competitive in this market environment.
Senvion is working profitably – which is also a funda-mental part of what we understand to be continuity. We were able to improve the operating result, the margin, and also net income for the year over the correspond- ing period the previous year. In the short fiscal year of 2015 (April 1, 2015 to December 31, 2015), we increased our sales compared to the same period in the previous year by 15 percent from EUR 1,465 m to EUR 1,683 m. We were also able to increase our EBITDA by 68 percent from EUR 100 m to EUR 168 m. Following the successful takeover by Centerbridge Partners L.P., our equity has increased significantly, and we invested immediately – as announced – in particular in the development of new products. You can read more about our products in this part of the Annual Report. For the detailed figures, please refer to our consolidated financial statements, which are available as a separate publication.
2015 has also been a year of change. On the one hand, change is naturally an integral element of our business. We invest time and money in modifying our turbines, not only to make them even more powerful, but also to minimize costs. By doing so, we reduce power generation costs while increasing the returns for our customers – and ultimately the returns for us, too. The key premise in all of this change is to maintain quality. What is known as “Made in Germany,” is called “German Engineering Excellence” at Senvion. This value, this requirement even, is part of Senvion’s DNA.
Starting with the companies from which it has emerged, Senvion has been an active player in this sector for 25 years, developing, producing and installing wind turbines. During this time, we have been constituted in various legal forms and worked under various ownership structures. This has certainly been the major change in the past fiscal year: From 2011, we were part of Suzlon Energy Limited of India, but in April 2015, we were taken over by Centerbridge Partners L.P. As a result, we have a strong new partner at our side, with which we can – and in 2015 were already able to – exploit the potential of Senvion in the wind energy market even more dynam-ically. Our increased investments in product innovations are already proof of this. And so is our networking capital, which showed an impressive improvement of EUR 219 m in the last nine months.
Our thanks The past three years have been successful for Senvion, but at the same time demanding, too. In a persistently challenging environment, both in terms of the general economy and our specific industry, we set out on a path of change in 2013, beginning with our POWER program for the future. Since then, we have taken great strides on the path to becoming a more agile and competitive organ-ization, and we have also not slackened in our cost discipline. This has been a demanding time for our employ-ees, and for that reason we would like to take this oppor-tunity to thank all those – including former colleagues who have left the company – who have shown outstanding engagement and dedication. We would in particular like to express our thanks to Andreas Nauen, who led the com-pany successfully from 2007 to December 2015, thus also through these times of change. We are delighted that he will remain with us as a member of our advisory committee and that we will continue to benefit from his experience and expertise.
Our turbines deliver reliable output – and so do we. As at December 31, 2015, 6,600 of our wind turbines generating a total rated output of 13,700 MW have been installed. In the year currently under review, Senvion recorded incoming orders for 1,218 MW (April to Decem-ber 2014: 1,056 MW). We are one of the leading providers in our market worldwide.
Cornerstones of our strategySenvion will continue to pursue the path it has mapped out, and the sector in which we are active will continue to grow. Experts from MAKE Consulting expect market
growth in annual onshore installation of 4.8 percent up to 2020, and an increase in the annual installation of offshore turbines of 45 percent from currently 2.0 giga-watts to 9.0 gigawatts in 2020.
It is expected that Europe will remain the largest onshore market globally, and that this will continue to grow steadily. We are one of the leading providers in our core European markets and can boast a large number of pioneering technical achievements. Our successful service offering generates added value for our customers and our company, while our offshore platform allows for additional growth.
The Senvion Management.
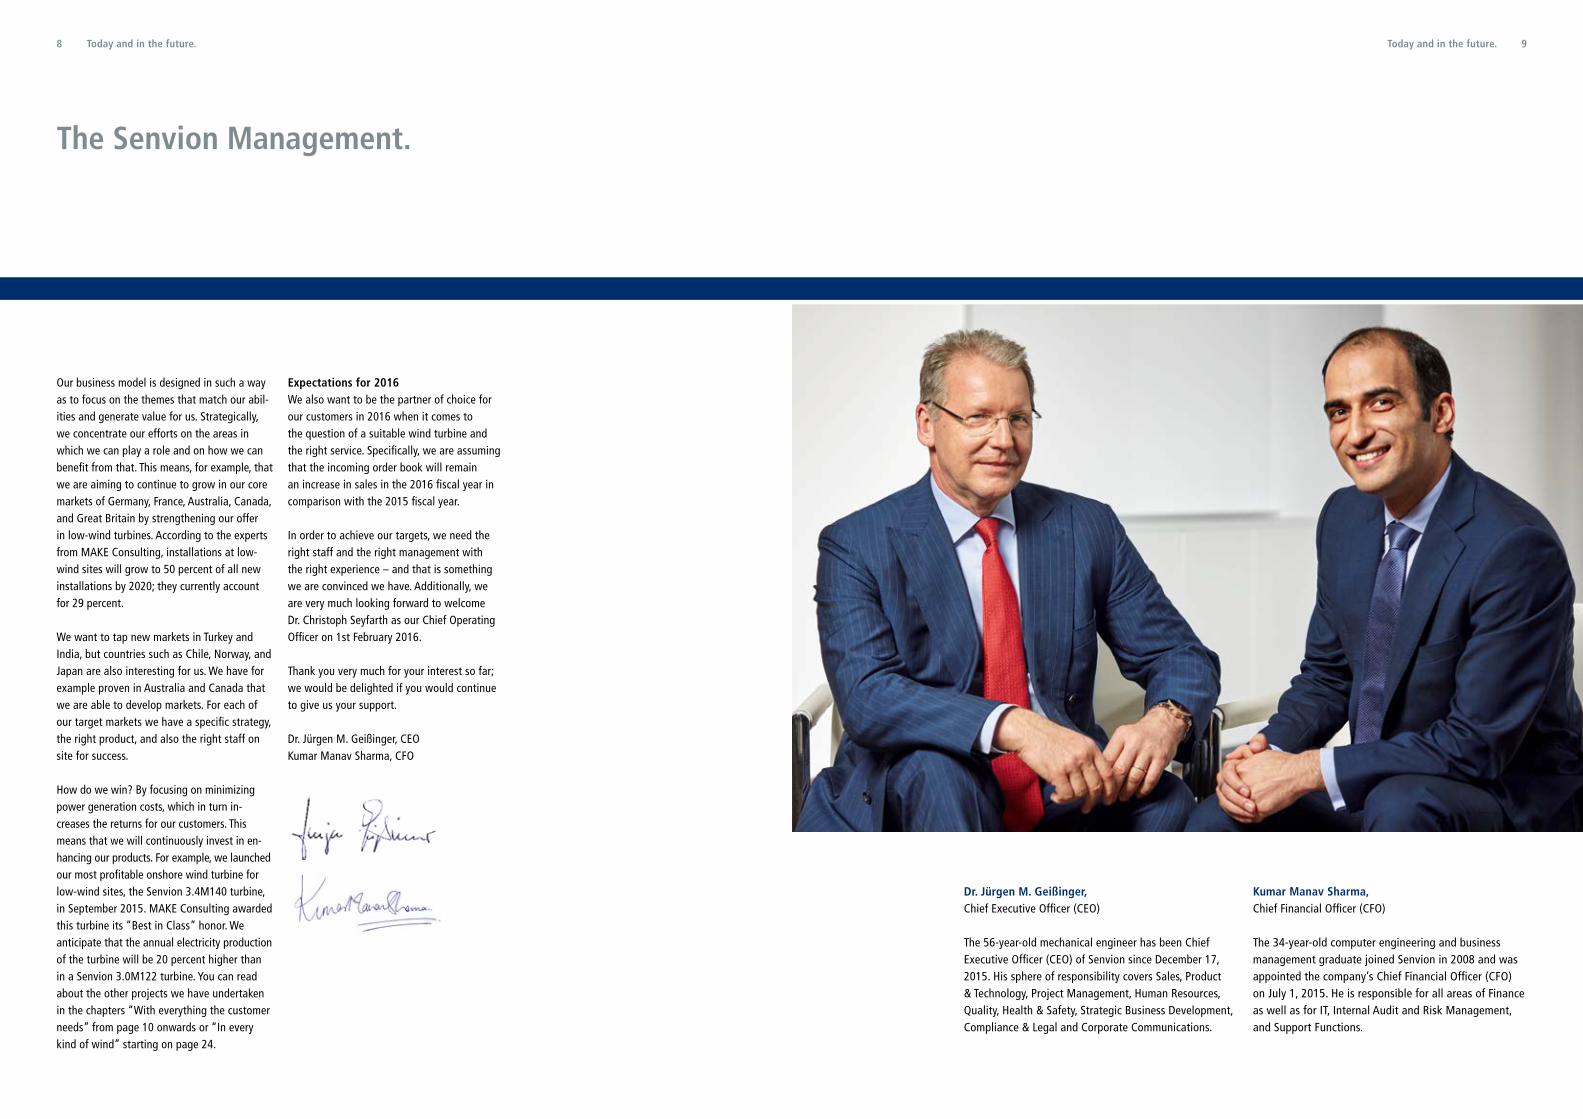
Dr. Jürgen M. Geißinger, Chief Executive Officer (CEO)
The 56-year-old mechanical engineer has been Chief Executive Officer (CEO) of Senvion since December 17, 2015. His sphere of responsibility covers Sales, Product & Technology, Project Management, Human Resources, Quality, Health & Safety, Strategic Business Development, Compliance & Legal and Corporate Communications.
Kumar Manav Sharma, Chief Financial Officer (CFO)
The 34-year-old computer engineering and business management graduate joined Senvion in 2008 and was appointed the company’s Chief Financial Officer (CFO) on July 1, 2015. He is responsible for all areas of Finance as well as for IT, Internal Audit and Risk Management, and Support Functions.
98 Today and in the future. Today and in the future.
Our business model is designed in such a way as to focus on the themes that match our abil-ities and generate value for us. Strategically, we concentrate our efforts on the areas in which we can play a role and on how we can benefit from that. This means, for example, that we are aiming to continue to grow in our core markets of Germany, France, Australia, Canada, and Great Britain by strengthening our offer in low-wind turbines. According to the experts from MAKE Consulting, installations at low-wind sites will grow to 50 percent of all new installations by 2020; they currently account for 29 percent.
We want to tap new markets in Turkey and India, but countries such as Chile, Norway, and Japan are also interesting for us. We have for example proven in Australia and Canada that we are able to develop markets. For each of our target markets we have a specific strategy, the right product, and also the right staff on site for success.
How do we win? By focusing on minimizing power generation costs, which in turn in- creases the returns for our customers. This means that we will continuously invest in en-hancing our products. For example, we launched our most profitable onshore wind turbine for low-wind sites, the Senvion 3.4M140 turbine, in September 2015. MAKE Consulting awarded this turbine its “Best in Class” honor. We anticipate that the annual electricity production of the turbine will be 20 percent higher than in a Senvion 3.0M122 turbine. You can read about the other projects we have undertaken in the chapters “With everything the customer needs” from page 10 onwards or “In every kind of wind” starting on page 24.
Expectations for 2016We also want to be the partner of choice for our customers in 2016 when it comes to the question of a suitable wind turbine and the right service. Specifically, we are assuming that the incoming order book will remain an increase in sales in the 2016 fiscal year in comparison with the 2015 fiscal year.
In order to achieve our targets, we need the right staff and the right management with the right experience – and that is something we are convinced we have. Additionally, we are very much looking forward to welcome Dr. Christoph Seyfarth as our Chief Operating Officer on 1st February 2016.
Thank you very much for your interest so far; we would be delighted if you would continue to give us your support. Dr. Jürgen M. Geißinger, CEOKumar Manav Sharma, CFO

10 11
Our turbines deliver reliable output. So do we – with every thing the customer needs.
12 With everything the customer needs.
What we offerWe develop, produce, and market wind turbines – with rated outputs of 2.0 to 6.2 megawatts and rotor diameters of 82 to 152 meters – for almost any site.1 We also offer our customers project-specific turnkey, service and maintenance, transport and installation as well as foundation planning and construction solutions.
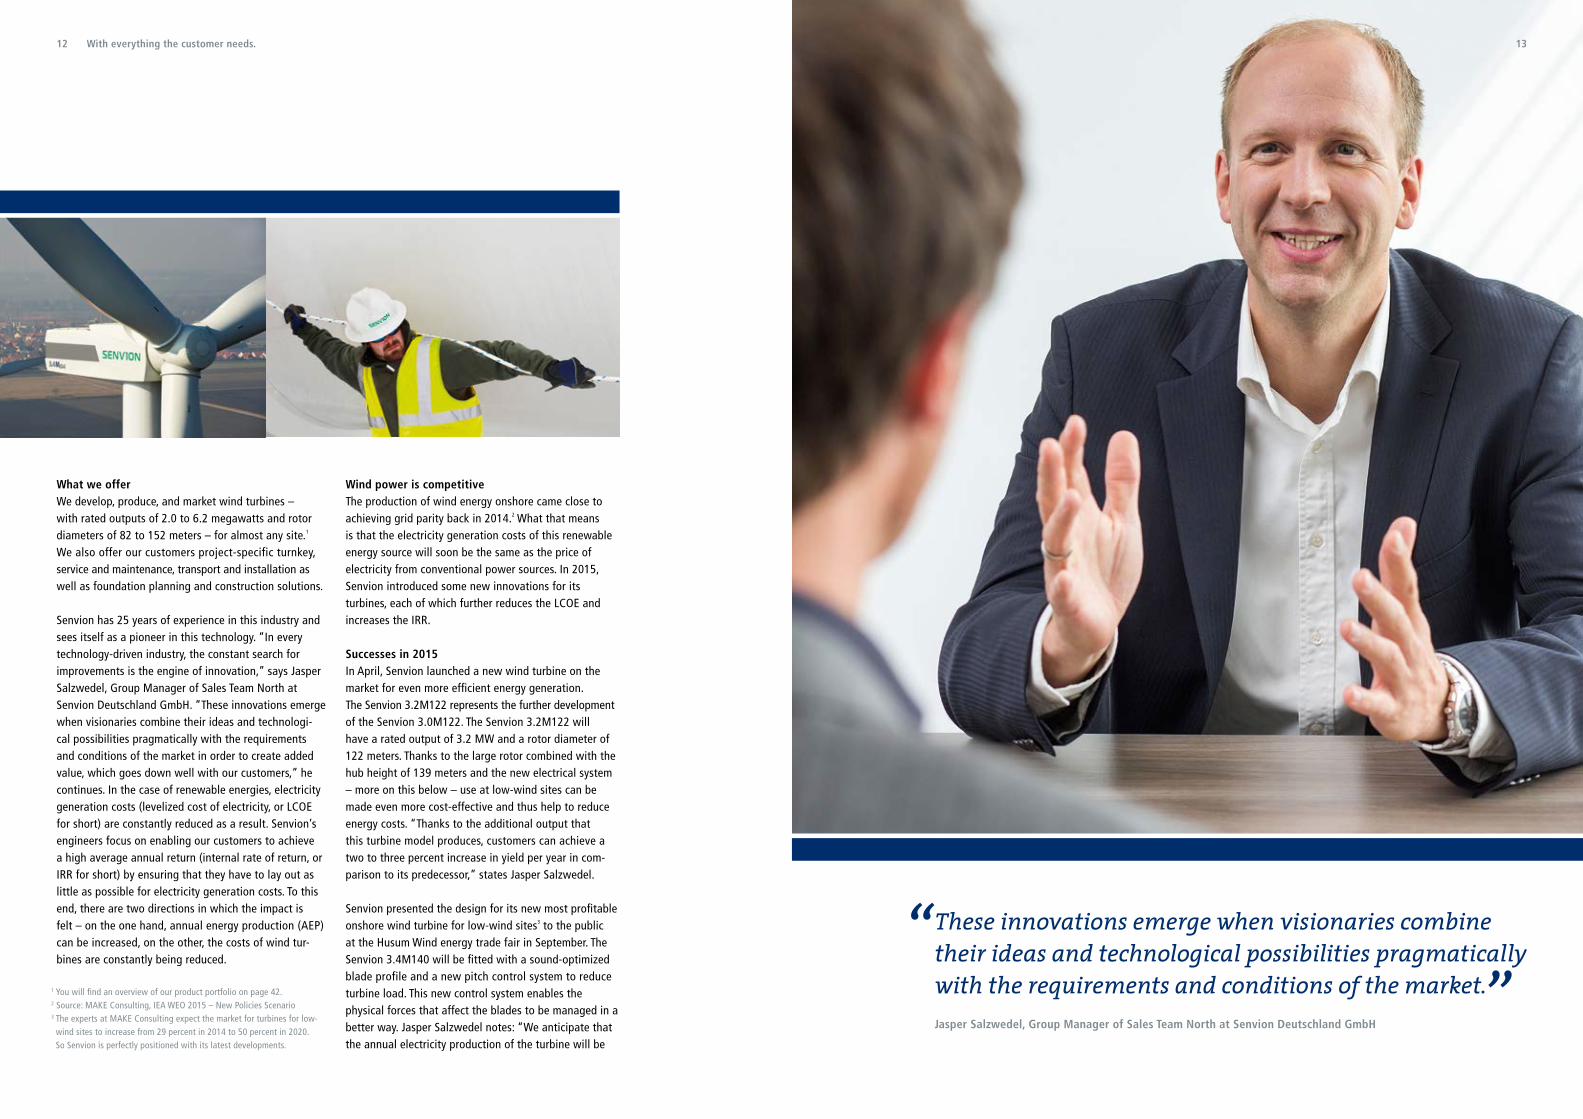
Senvion has 25 years of experience in this industry and sees itself as a pioneer in this technology. “In every technology-driven industry, the constant search for improvements is the engine of innovation,” says Jasper Salzwedel, Group Manager of Sales Team North at Senvion Deutschland GmbH. “These innovations emerge when visionaries combine their ideas and technologi-cal possibilities pragmatically with the requirements and conditions of the market in order to create added value, which goes down well with our customers,” he continues. In the case of renewable energies, electricity generation costs (levelized cost of electricity, or LCOE for short) are constantly reduced as a result. Senvion’s engineers focus on enabling our customers to achieve a high average annual return (internal rate of return, or IRR for short) by ensuring that they have to lay out as little as possible for electricity generation costs. To this end, there are two directions in which the impact is felt – on the one hand, annual energy production (AEP) can be increased, on the other, the costs of wind tur-bines are constantly being reduced.
Wind power is competitiveThe production of wind energy onshore came close to achieving grid parity back in 2014.2 What that means is that the electricity generation costs of this renewable energy source will soon be the same as the price of electricity from conventional power sources. In 2015, Senvion introduced some new innovations for its turbines, each of which further reduces the LCOE and increases the IRR.
Successes in 2015In April, Senvion launched a new wind turbine on the market for even more efficient energy generation. The Senvion 3.2M122 represents the further development of the Senvion 3.0M122. The Senvion 3.2M122 will have a rated output of 3.2 MW and a rotor diameter of 122 meters. Thanks to the large rotor combined with the hub height of 139 meters and the new electrical system – more on this below – use at low-wind sites can be made even more cost-effective and thus help to reduce energy costs. “Thanks to the additional output that this turbine model produces, customers can achieve a two to three percent increase in yield per year in com-parison to its predecessor,” states Jasper Salzwedel.
Senvion presented the design for its new most profitable onshore wind turbine for low-wind sites3 to the public at the Husum Wind energy trade fair in September. The Senvion 3.4M140 will be fitted with a sound-optimized blade profile and a new pitch control system to reduce turbine load. This new control system enables the physical forces that affect the blades to be managed in a better way. Jasper Salzwedel notes: “We anticipate that the annual electricity production of the turbine will be
13
1 You will find an overview of our product portfolio on page 42.2 Source: MAKE Consulting, IEA WEO 2015 – New Policies Scenario3 The experts at MAKE Consulting expect the market for turbines for low- wind sites to increase from 29 percent in 2014 to 50 percent in 2020. So Senvion is perfectly positioned with its latest developments.
These innovations emerge when visionaries combine their ideas and technological possibilities pragmatically with the requirements and conditions of the market.Jasper Salzwedel, Group Manager of Sales Team North at Senvion Deutschland GmbH
“”
15With everything the customer needs.14
20 percent higher than a Senvion 3.0M122.” In addition, the service life of the Senvion 3.4M140 is 25 years, an extension of five years. Senvion is looking to install the prototypes of this turbine in 2017.
The Senvion 3.4M114 NES was connected to the grid in November. The NES included in the model’s name stands for “Next Electrical System,” which consists of a fully rated converter and an asynchronous generator. It constitutes a further development of the previous system based on the DFIG (Double Fed Induction Generator) and enables electricity to be fed into the grid in a more efficient and stable manner. With the NES, Senvion is already able today to fulfill the increasing grid require-ments which will apply in Germany and the EU for connections to the high-voltage grid from 2017 onward. Long-term implementation of these specifications is also expected in many countries for connections to the medium-voltage grid.
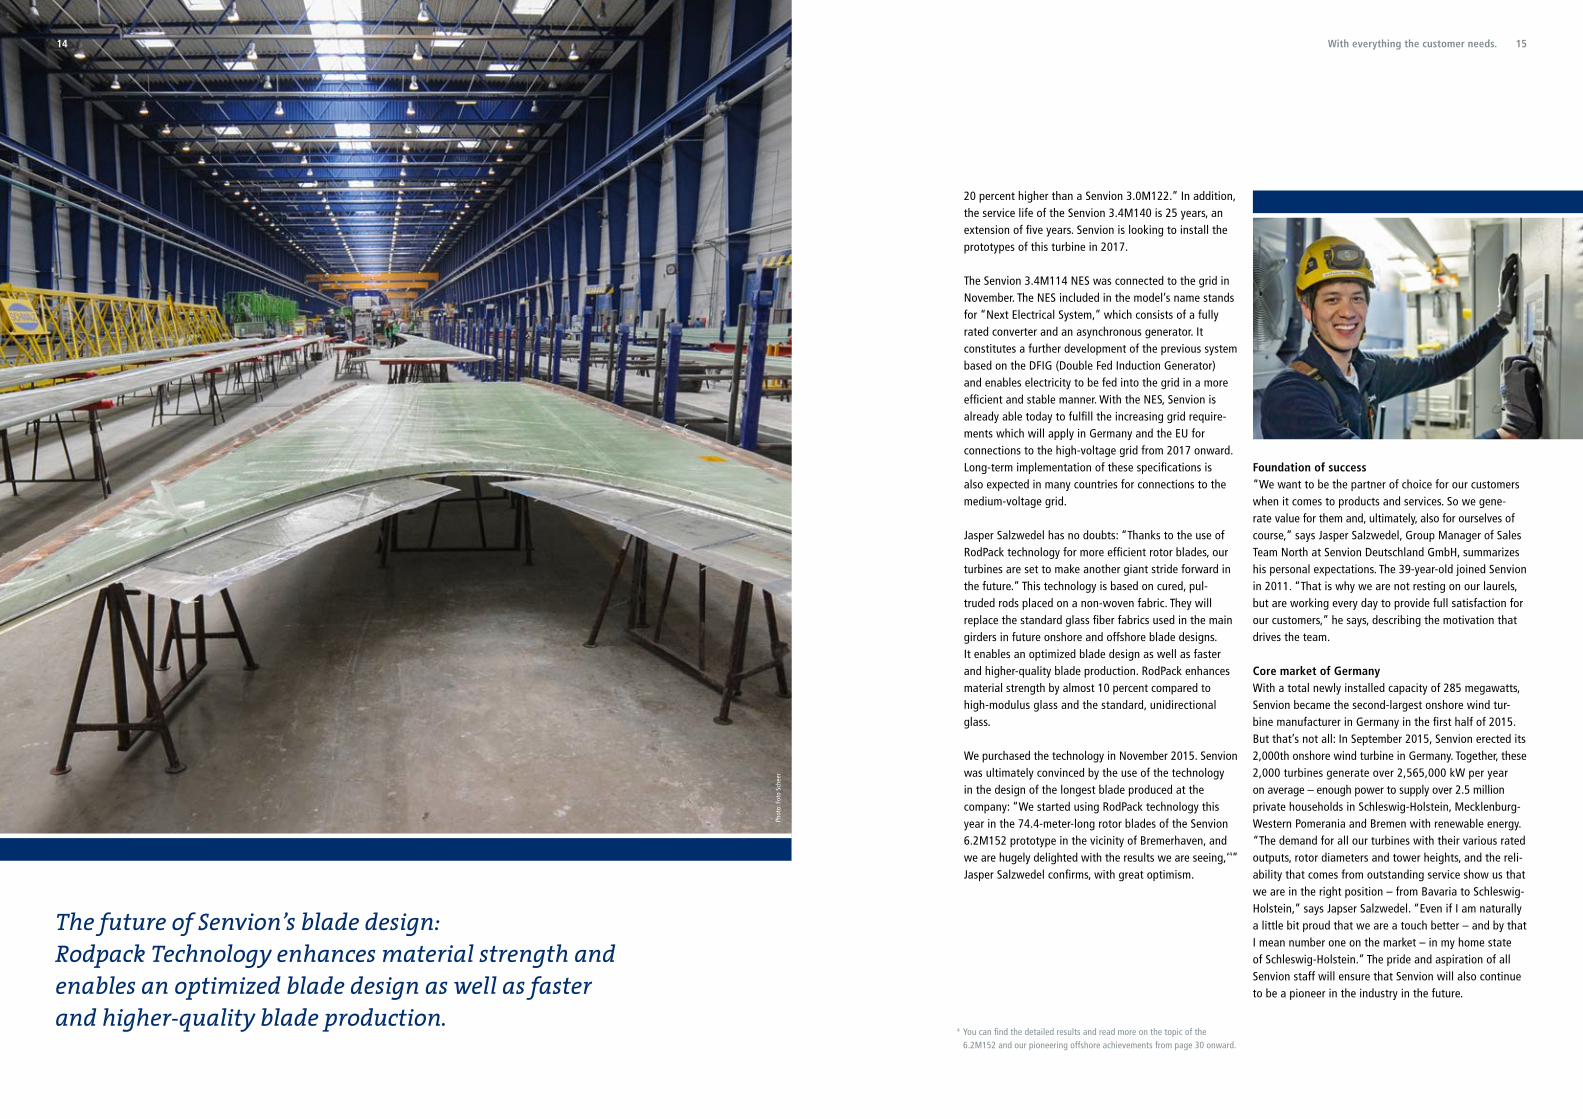
Jasper Salzwedel has no doubts: “Thanks to the use of RodPack technology for more efficient rotor blades, our turbines are set to make another giant stride forward in the future.” This technology is based on cured, pul- truded rods placed on a non-woven fabric. They will replace the standard glass fiber fabrics used in the main girders in future onshore and offshore blade designs. It enables an optimized blade design as well as faster and higher-quality blade production. RodPack enhances material strength by almost 10 percent compared to high-modulus glass and the standard, unidirectional glass.
We purchased the technology in November 2015. Senvion was ultimately convinced by the use of the technology in the design of the longest blade produced at the company: “We started using RodPack technology this year in the 74.4-meter-long rotor blades of the Senvion 6.2M152 prototype in the vicinity of Bremerhaven, and we are hugely delighted with the results we are seeing,‘4” Jasper Salzwedel confirms, with great optimism.
Foundation of success “We want to be the partner of choice for our customers when it comes to products and services. So we gene-rate value for them and, ultimately, also for ourselves of course,” says Jasper Salzwedel, Group Manager of Sales Team North at Senvion Deutschland GmbH, summarizes his personal expectations. The 39-year-old joined Senvion in 2011. “That is why we are not resting on our laurels, but are working every day to provide full satisfaction for our customers,” he says, describing the motivation that drives the team.
Core market of GermanyWith a total newly installed capacity of 285 megawatts, Senvion became the second-largest onshore wind tur- bine manufacturer in Germany in the first half of 2015.
But that’s not all: In September 2015, Senvion erected its 2,000th onshore wind turbine in Germany. Together, these 2,000 turbines generate over 2,565,000 kW per year on average – enough power to supply over 2.5 million private households in Schleswig-Holstein, Mecklenburg-Western Pomerania and Bremen with renewable energy. “The demand for all our turbines with their various rated outputs, rotor diameters and tower heights, and the reli-ability that comes from outstanding service show us that we are in the right position – from Bavaria to Schleswig-Holstein,” says Japser Salzwedel. “Even if I am naturally a little bit proud that we are a touch better – and by that I mean number one on the market – in my home state of Schleswig-Holstein.” The pride and aspiration of all Senvion staff will ensure that Senvion will also continue to be a pioneer in the industry in the future.
4 You can find the detailed results and read more on the topic of the 6.2M152 and our pioneering offshore achievements from page 30 onward.
The future of Senvion’s blade design: Rodpack Technology enhances material strength and enables an optimized blade design as well as faster and higher-quality blade production.
Phot
o: F
oto
Sche
er

1716
Our turbines deliver reliable output. So do we – and we develop markets.
18
Employing a workforce of over 3,900 staff, Senvion is represented in Germany, France, Belgium, Great Britain, Sweden, Poland, Romania, Italy, and Portugal as well as on a global level in the US, China, Australia and Canada. Like Germany, Great Britain, France and Australia, Canada is one of Senvion’s core markets.
Canada is a country of large dimensions. For Senvion, that is not simply on account of its massive geographical scale, particular climatic conditions or the political framework for wind power that varies from state to state. For Senvion, Canada is also very special, given that we signed the largest contract for onshore wind turbines in our company’s history to date there back in 2009. In 2015, we celebrated the commercial com- missioning of our largest onshore project. But first things first. Market entryOur first employee in Canada was Helmut Herold, who is currently Senvion’s managing director in North America. The market opportunities were great, and so a small subsidiary was formed in 2007. 41-year-old Herold was constantly flying back and forth between the company‘s headquarters in Hamburg and the locations of potential customers in Canada. The negotiations lasted one-and-a half years, but the outcome spoke for itself: On November 26, 2009, we concluded our largest master agreement to date, which features a capacity of up to 954 megawatts for five wind power projects in the province of Quebec. So Herold was finally able to pack his bags to move to Canada with his family.
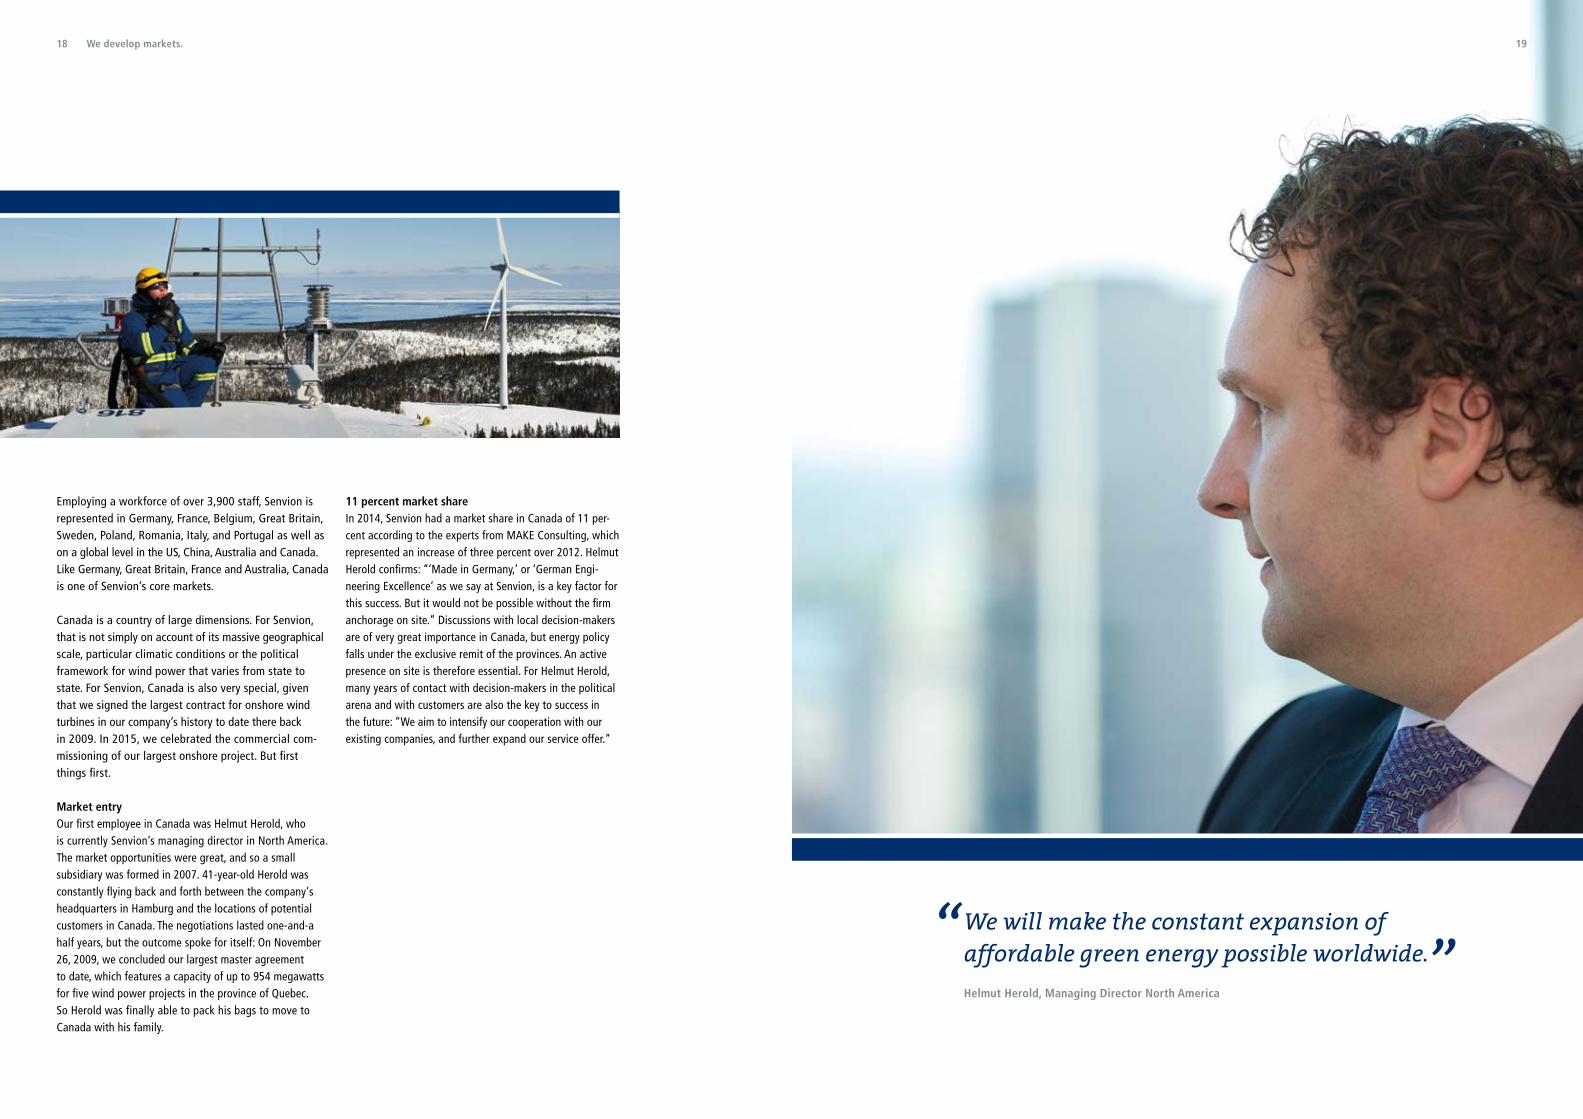
11 percent market shareIn 2014, Senvion had a market share in Canada of 11 per- cent according to the experts from MAKE Consulting, which represented an increase of three percent over 2012. Helmut Herold confirms: “‘Made in Germany,’ or ‘German Engi-neering Excellence’ as we say at Senvion, is a key factor for this success. But it would not be possible without the firm anchorage on site.” Discussions with local decision-makers are of very great importance in Canada, but energy policy falls under the exclusive remit of the provinces. An active presence on site is therefore essential. For Helmut Herold, many years of contact with decision-makers in the political arena and with customers are also the key to success in the future: “We aim to intensify our cooperation with our existing companies, and further expand our service offer.”
We develop markets. 19
We will make the constant expansion of affordable green energy possible worldwide.Helmut Herold, Managing Director North America
“ ”

2120 We develop markets.
1 You can learn about our hot climate version, which we deploy in Australia for example, in detail on page 36. You will find an overview of all our products on page 42.
Service within two hoursIn the fiscal years 2012/2013, 2013/2014 and 2014/2015, Senvion achieved a growth rate of 22 per-cent (compound annual growth rate, or CAGR for short) in revenues with service. The revenues of the current fiscal year, ending December 31, 2015, confirm this development. Nearly 75 percent or almost 10 gigawatts of our turbine fleet are accompanied by a Senvion service agreement. The customer can be offered three different service packages, which cover the maintenance of the wind turbines, repairs, remote monitoring, and logistics. The service offering in the US is managed by Herold’s team from Canada. Helmut Herold says: “When something comes up, our engineers worldwide are within two hours‘ drive of each onshore turbine thanks to their local presence. In countries as large as Canada and the US, the fact that the service is anchored locally is a crucial plus point.”
Products specifically for this market Extreme weather conditions – whether it is extreme heat or extreme cold1 – require special products. Therefore, we have installed the special cold climate versions (CCV) of our MM82 and MM92 turbines in Canada. These are characterized by the fact that they maintain their full functionality, for example through the use of low temperature steel, even in temperatures of minus 40 degrees Celsius, extreme fluctuations in temperature, and the wet Canadian weather conditions marked by a great deal of ice and snow. And they do so for their guaranteed life of 25 years.
Largest wind farm comes on streamSenvion’s largest single project on land worldwide can also be found in Canada, more specifically in the unor-ganized territory of Lac-Pikauba in the regional business community of Charlevoix, Lac-Ministuk and Fjord-du-Saguenay in the province of Quebec. Put into operation in November 2015, it comprises 175 Senvion MM92 and MM82 turbines of the cold climate version (CCV). With a total rated output of 350 megawatts, the Rivière-du-Moulin wind farm is the largest onshore wind farm in Senvion’s history and represents the first part of the one-gigawatt master agreement that Senvion concluded with the developer EDF EN Canada Inc. in 2009.
Demand for regional expertiseConstruction work on the Rivière-du-Moulin wind farm in Quebec only commenced in 2013. Helmut Herold confirms: “This project is a fantastic example of our regional expertise, given that it was completed and put into commercial operation two weeks ahead of schedule. Especially because the terrain is so complex and the weather conditions so difficult, the impressiveness of this achievement cannot be emphasized highly enough.”
Affordable green energy throughout the worldSenvion is well positioned in all of its core markets. New markets that Senvion is now turning its attention to include India and Turkey, as they offer good general conditions, the turbines are well suited for the local wind conditions, and local expertise is on board. How-ever, also markets in Northern Europe such as Norway, in South America such as Chile, or also Japan are very promising and will be looked into more intensively by Senvion in future. Canada serves as a wonderful example of how Senvion is able to conquer markets. Helmut Herold is convinced: “We will make the constant expansi-on of affordable green energy possible worldwide.”
Extreme weather conditions require specially tailoredproducts – like our cold climate version turbines, which are fully functional even at temperatures of minus 40degrees Celcius throughout their life cycle of 25 years.
22 23We develop markets. We develop markets.
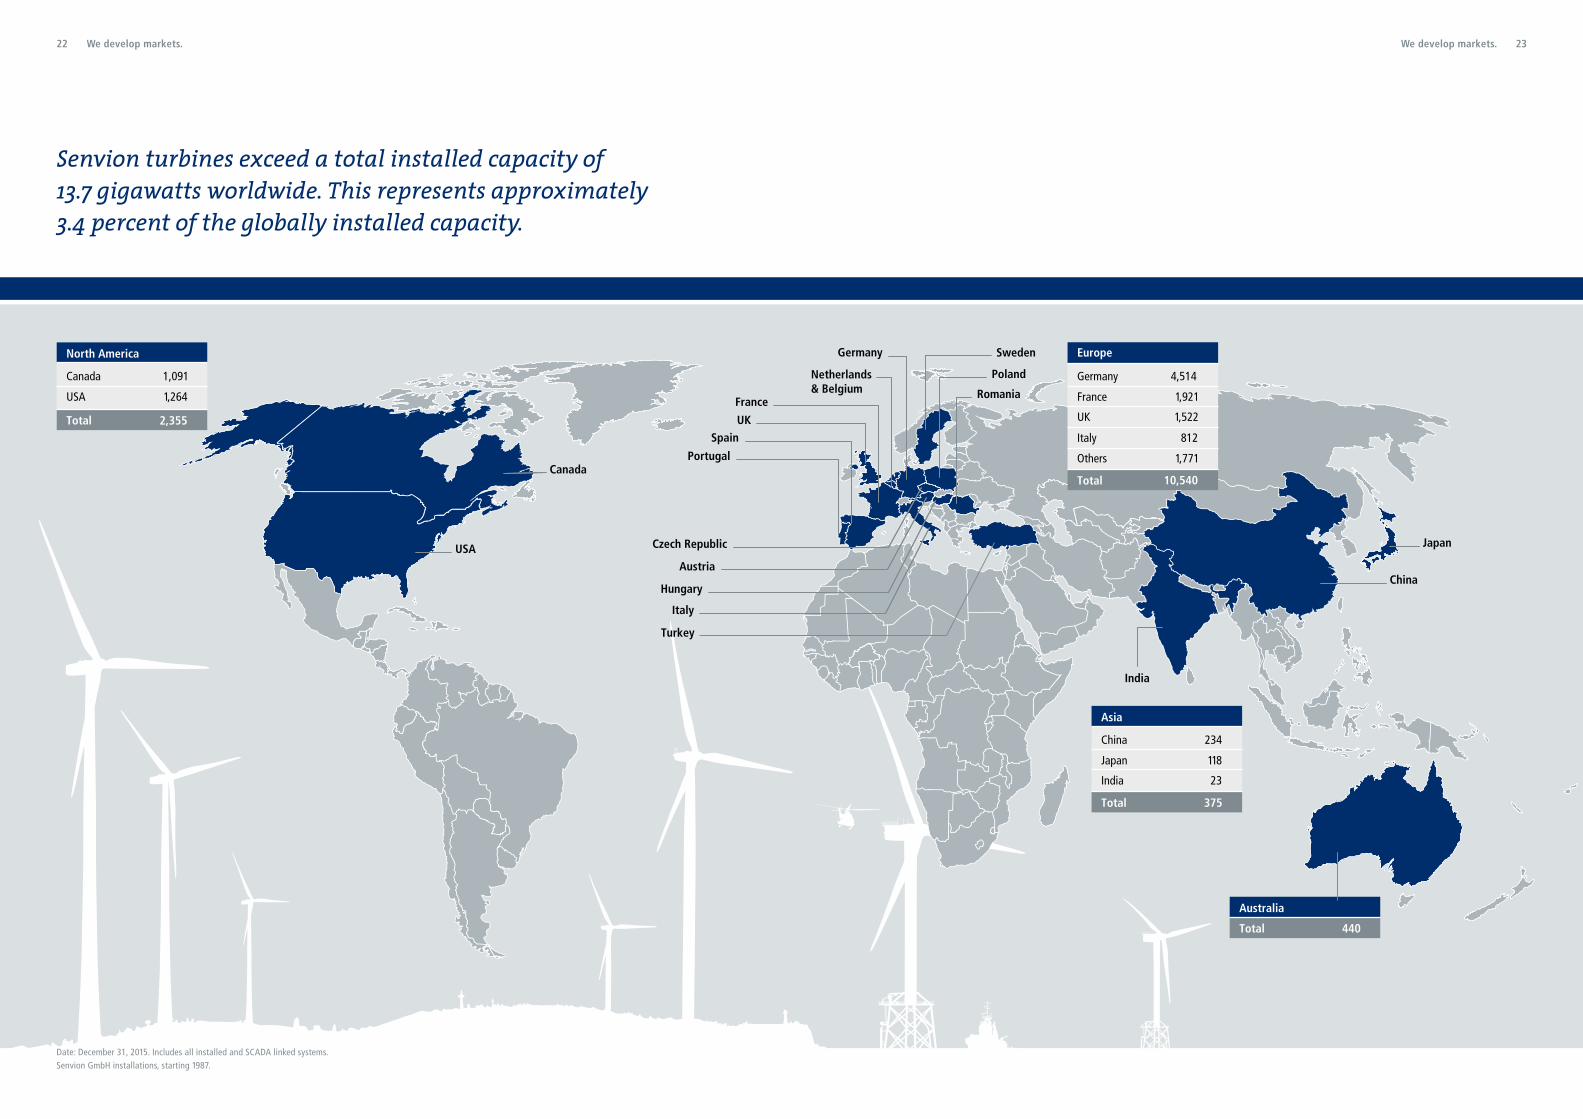
Date: December 31, 2015. Includes all installed and SCADA linked systems.Senvion GmbH installations, starting 1987.
Senvion turbines exceed a total installed capacity of13.7 gigawatts worldwide. This represents approximately3.4 percent of the globally installed capacity.
Poland
Romania
Sweden Germany
Netherlands & Belgium
France
UK Spain
Portugal
Czech Republic
Austria
Hungary
Italy
China
Japan
India
USA
Canada
Europe
Germany
France
UK
Italy
Others
Total
Asia
China
Japan
India
Total
Australia
Total
North America
Canada
USA
Total
Turkey
4,514
1,921
1,522
812 1,771
234
118
23
375
440
1,091
1,264
2,355
10,540
24 25
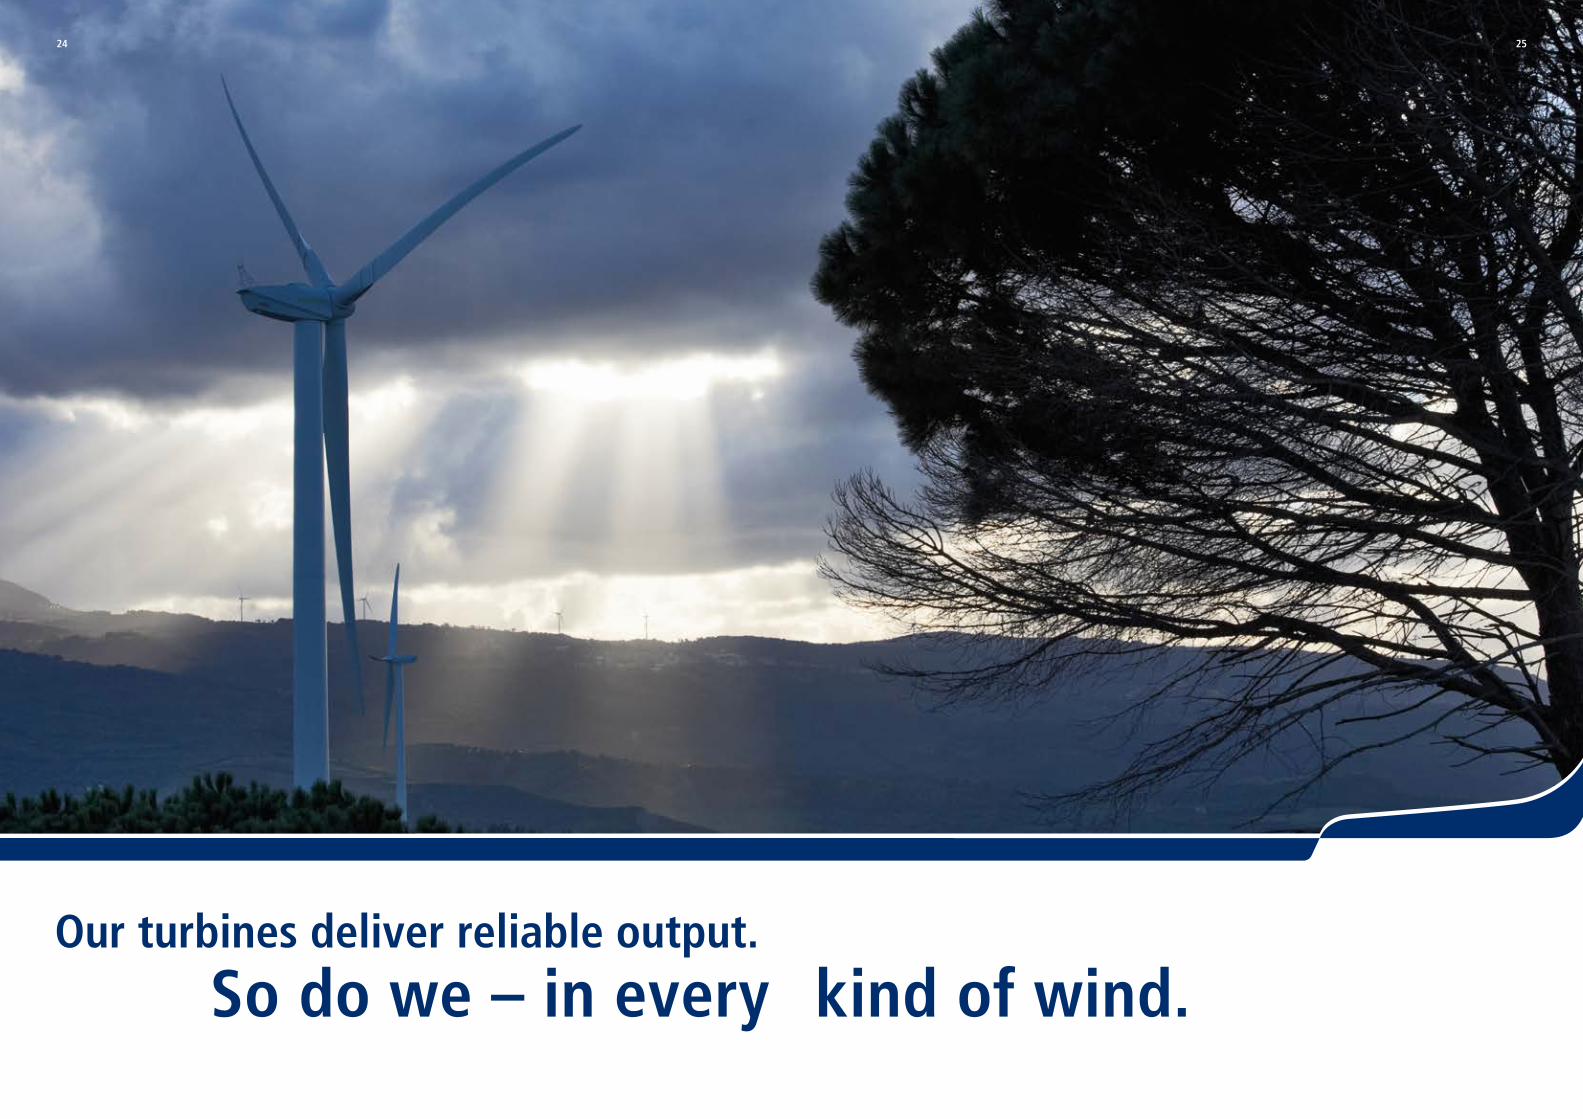
Our turbines deliver reliable output. So do we – in every kind of wind.
26 27In every kind of wind.
Whether at sea or on land, in low, moderate or strong winds, in cold climates or excessive heat, and regardless of the requirements of the relevant market – Senvion offers the right turbine for every wind class.
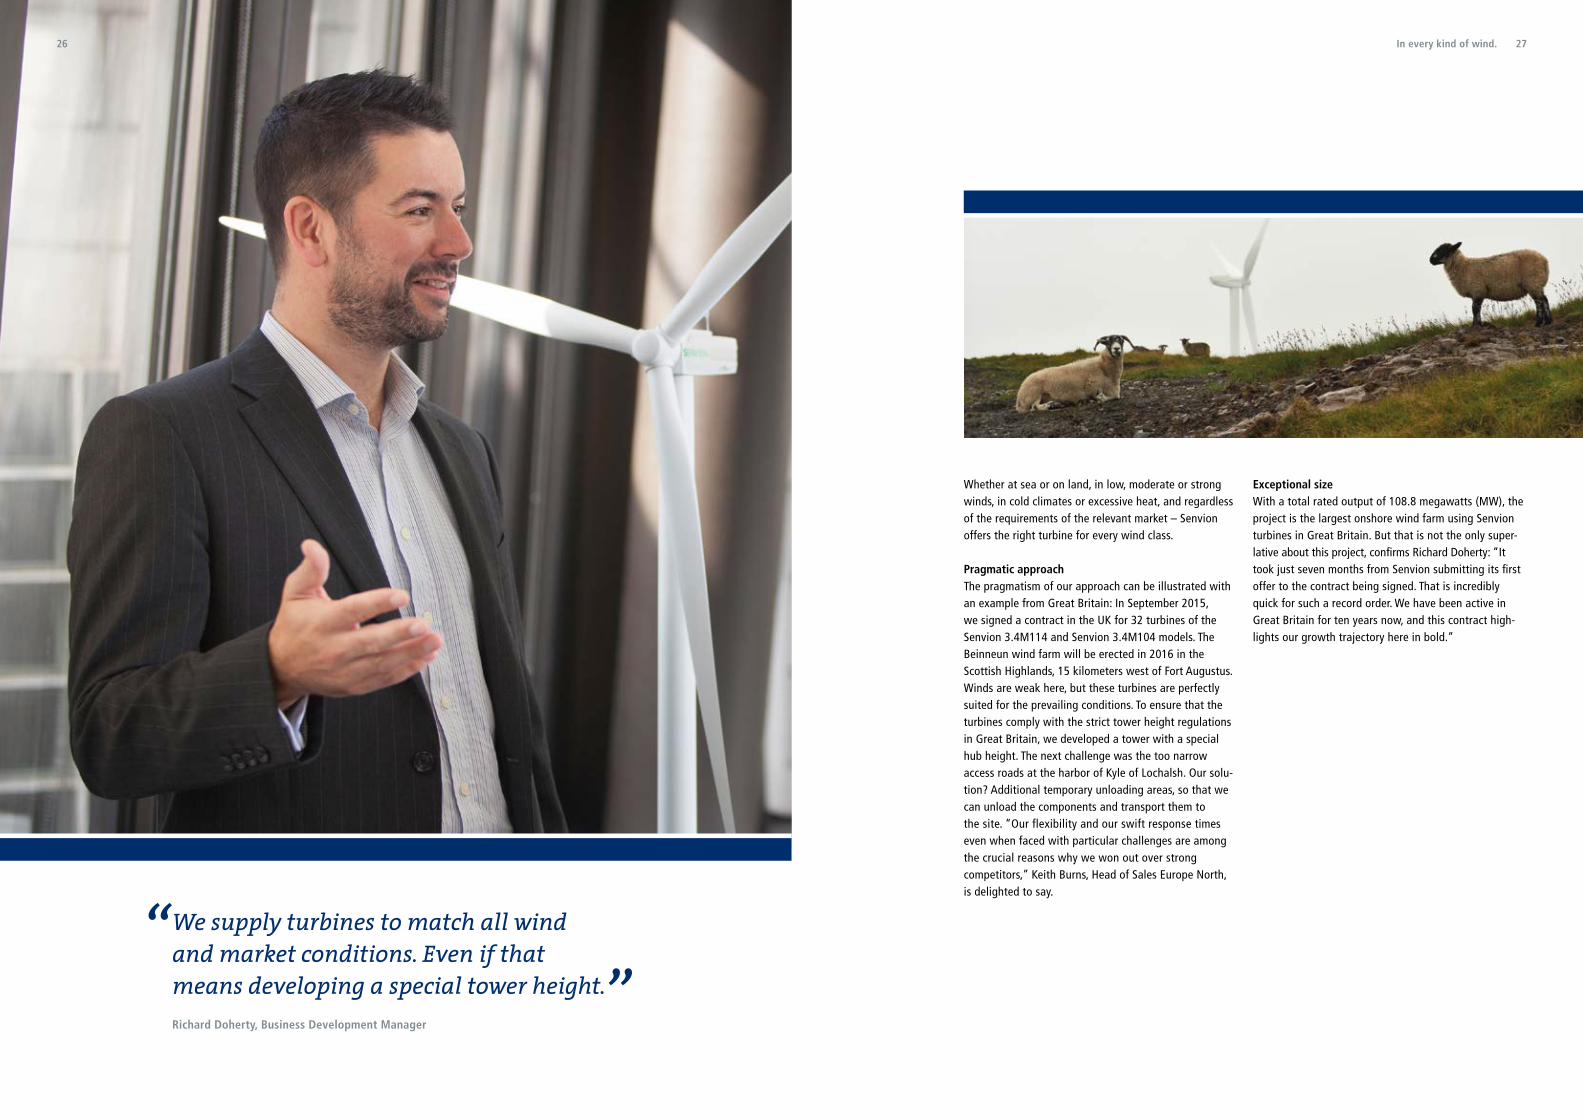
Pragmatic approachThe pragmatism of our approach can be illustrated with an example from Great Britain: In September 2015, we signed a contract in the UK for 32 turbines of the Senvion 3.4M114 and Senvion 3.4M104 models. The Beinneun wind farm will be erected in 2016 in the Scottish Highlands, 15 kilometers west of Fort Augustus. Winds are weak here, but these turbines are perfectly suited for the prevailing conditions. To ensure that the turbines comply with the strict tower height regulations in Great Britain, we developed a tower with a special hub height. The next challenge was the too narrow access roads at the harbor of Kyle of Lochalsh. Our solu-tion? Additional temporary unloading areas, so that we can unload the components and transport them to the site. “Our flexibility and our swift response times even when faced with particular challenges are among the crucial reasons why we won out over strong competitors,” Keith Burns, Head of Sales Europe North, is delighted to say.
Exceptional sizeWith a total rated output of 108.8 megawatts (MW), the project is the largest onshore wind farm using Senvion turbines in Great Britain. But that is not the only super-lative about this project, confirms Richard Doherty: “It took just seven months from Senvion submitting its first offer to the contract being signed. That is incredibly quick for such a record order. We have been active in Great Britain for ten years now, and this contract high-lights our growth trajectory here in bold.”
We supply turbines to match all wind and market conditions. Even if that means developing a special tower height.Richard Doherty, Business Development Manager
“”

28
For every wind classSenvion offers turbines for every wind class,1 something that is illustrated by various other orders from the 2015 fiscal year. In April, we signed a contract for 45 MW using Senvion MM82 and Senvion MM92 turbines for wind farms in Great Britain, where strong winds predominate. We are delivering six Senvion 3.0M122 wind turbines to Brienza in the south of Italy, which will achieve optimal yield measured by the weak winds there. Moderate winds prevail in Villacerf and Sévérac-Guenrouët in France, where we installed 16 Senvion MM92 and Senvion MM100 wind turbines in the fall of 2015 – they are part of a contract we signed in June 2015. In July, we put 18 Senvion MM100 turbines into commission in Gizałki in Poland: With a total rated output of 36 MW, these turbines will generate enough electricity to provide 24,300 Polish households with green energy. That is equivalent to the total number of private households in the city of Konin in the vicinity of the wind farm. In addition, the turbines will provide savings of 24,000 tons of CO2 per year.
Senvion is already making an important contribution to the energy revolution worldwide today. We take our job seriously – establishing wind power as a reliable and sustainable energy source of the future. That is why we invest heavily2 every year in the development and refine-ment of our products, in order to gradually bring down electricity generation costs still further and thus make the investment in a wind turbine even more profitable.
Our product rangeOur product range is very broad. This increases the oppor-tunities for our customers and at the same time minimizes the risk for us. For we are flexibly positioned for every possible market development and can take on an active role wherever new opportunities arise.
According to Keith Burns: “The wind energy industry in Great Britain, for example, is facing several challenges.” Since the general election in May 2015, it has been confirmed that the feed-in tariff system will undergo radical change. The government has announced an end to onshore subsidies and the introduction of new planning requirements, with the result that local authorities will have the final say on projects. The tariff system previously in force, the Renewable Obligation Certificate (ROC), will end in March 2016, a year earlier than originally planned. Equipped with corresponding transitional periods, a large number of major projects, including the project in the Scottish Highlands, will have to be completed swiftly so that they can be assigned to this ROC certificate system. Our two colleagues from the UK are certain that Senvion will approach and solve this issue with great pragmatism. Alongside the right turbines, we also have the right team in place at Senvion.
29In every kind of wind.
Our flexibility and our swift response times are among the crucial reasons why we won out over strong competitors.Keith Burns, Head of Sales Europe North
”“
1 You can discover in the overview of our products on page 42 what other products we have and for which precise wind class each turbine is permitted to be used.2 Find out more about how much we invest in the financial section of this Annual Report.
3130
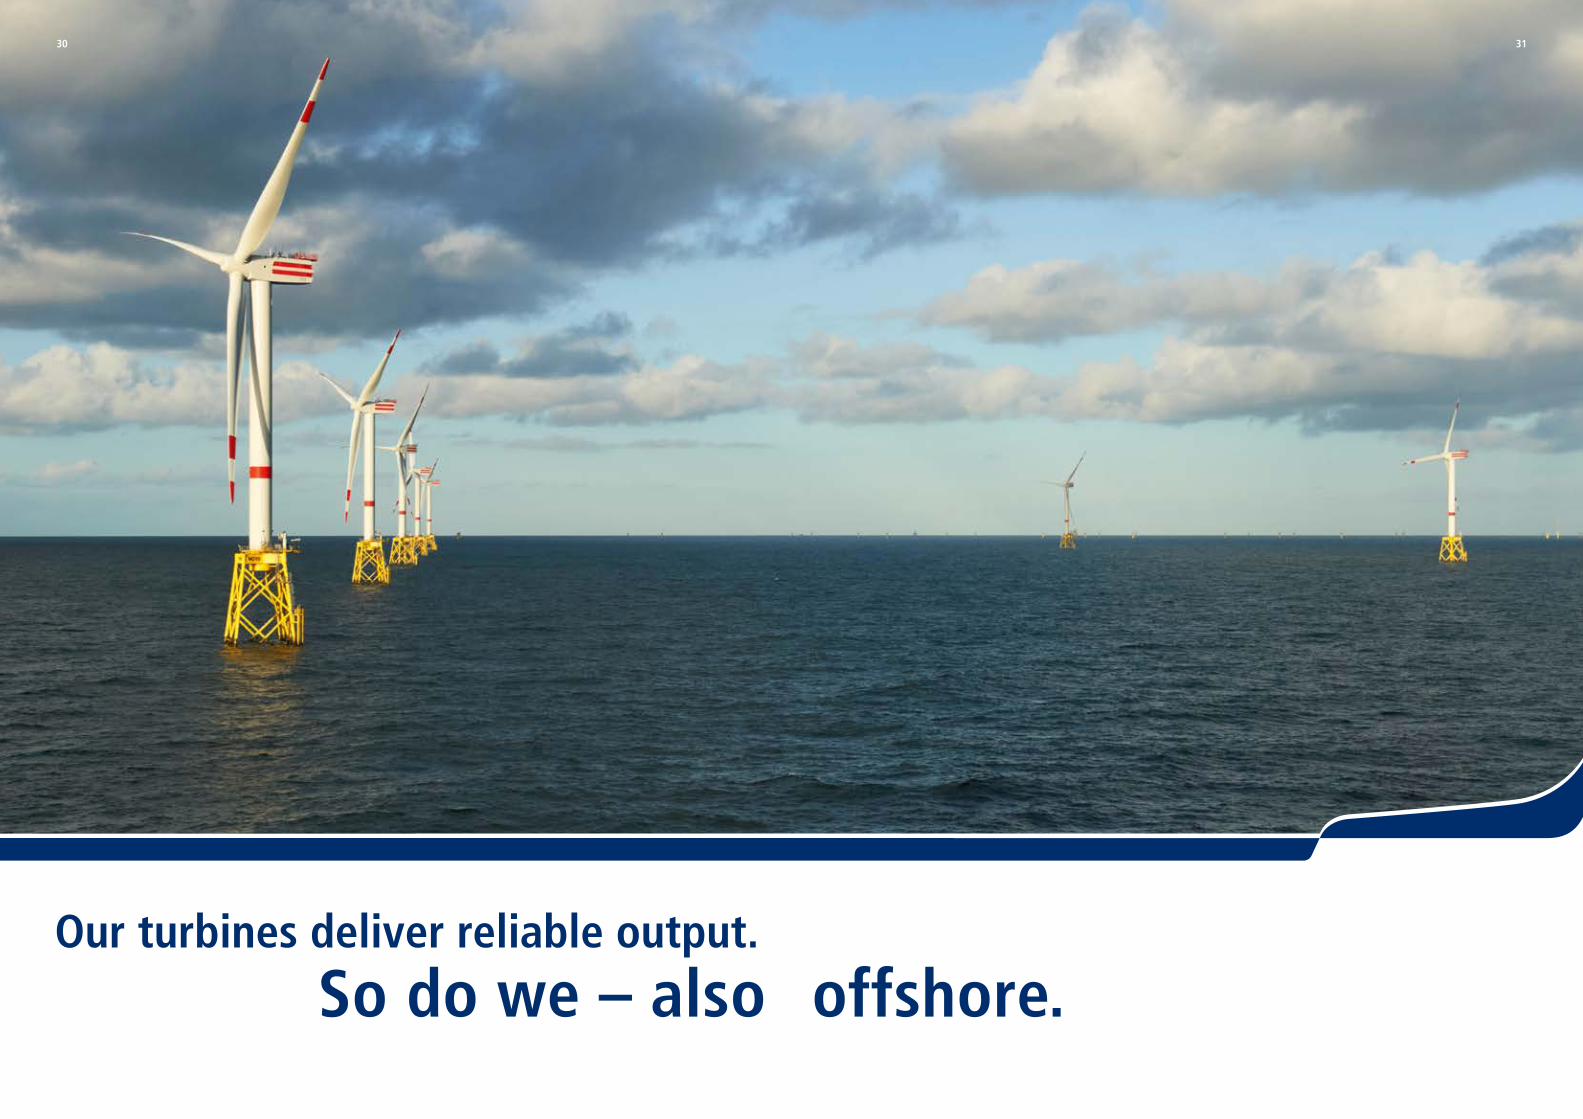
Our turbines deliver reliable output. So do we – also offshore.

32 33Also offshore.
Pioneering in offshoreMaking use of the wind that blows off the coast repre-sents the best chance for replacing our energy supplies worldwide. But there are some particular challenges that have to be overcome offshore, as Cord Böker, Product Line Manager Offshore, well knows: “Because the sites are located far out at sea, are difficult to reach and face potentially extreme wind and weather conditions, the quality and reliability of the turbines are even more critical to success than they are usually. But it’s worth it!“ At sea, and mainly at some distance from the coast,1 there is hardly any wind flatness, implying that tech-nically mature wind turbines can feed electricity into the grid almost without any interruption. Industry experts from MAKE Consulting forecast an increase in the annual installation of offshore wind turbines of 45 percent from currently 2.0 gigawatts to 9.0 gigawatts in 2020. And at that time, offshore wind energy may have reached grid parity2 according to experts.
The offshore wind energy sector would not be where it is today without Senvion’s pioneering achievements. We strongly believe that we are one of three providers worldwide to have multi-megawatt technology that has proven to be commercially successful. We took the first 5 MW turbine out to sea in 2004 and today possess the greatest experience in the world with turbines of 5 MW or more – over 160 turbines of this type with a total capacity of more than one gigawatt have already been installed.
Successes 2015The negotiations for the “Nordsee One“ offshore project have taken four years, after all. From the initial discus-sions in 2011 to the financing commitment made in March 2015, shortly before the 2015 fiscal year started. Senvion will supply 54 Senvion 6.2M126 turbines to this wind farm, which will be erected 40 kilometers north of the island of Juist in Germany. After the planned com-pletion in fall 2017, the wind farm will have an installed capacity of 332 MW, which means it will be able to supply more than 215,000 households with power annually.
Also in March 2015, Senvion signed another offshore con-tract for the supply of 18 Senvion 6.2M126 turbines for the Nordergründe wind farm. Cord Böker feels a sense of relief: “We have now been able to end a two-years period in which no one involved in the sector signed a contract in Germany because funding conditions were so unclear. It has been two difficult years, but they are now going to be followed by two good ones.“ Offshore production capacity in Bremerhaven will be fully utilized for 24 months thanks to these two orders.
1 Senvion is one of the few providers to have any experience at all in areas known as “far offshore” – locations more than 50 km from the coast and where the water is more than 30 meters deep.
2 Grid parity means that the electricity generation costs of renewable energy sources are the same as the price of electricity from conventional electrical energy sources.
Offshore, the quality and reliability of the turbines are even more critical to success than they are usually.Cord Böker, Product Line Manager Offshore
“”
34 35Also offshore.
Combined team effort Cord Böker, 39, joined Senvion seven years ago, and as chief offshore developer, also plays a coordinating role. “Our offshore turbines are technically sophisticated power plants. To ensure that our German engineering can yield its full performance, all units have to work hand in hand – from portfolio and product management, through product line and cost management, all the way to tech-nology and system integration. We don’t sell components, we sell turbines. And that’s why our integrated setup is exactly right,” stresses Böker. Electricity generation costs and average returns are also the bottom line in the offshore business. The chief offshore developer seizes on every good idea to improve those figures, such as the idea not to wait until the platform is already at sea to attach the service crane that every offshore turbine needs for lifting heavy loads. As Cord Böker knows: “If this crane can be bolted to the foundation while it is still on land, it makes a contribution to cost savings – which we can then pass on to our customers.” He continues: “We sell an overall concept, from the optimization of loads for a cost-efficient foundation structure and an optimized installation plan to a sophisticated service concept that guarantees high technical availability even far out at sea.”
Continuous improvement in capacityAt the end of the day, only high technical availability ensures high performance. And that is what Senvion’s offshore turbines produce. Cord Böker knows this from the time when he first started working for Senvion. He was the project manager for the Ormonde wind farm, an offshore installation in the Irish Sea, ten kilometers west of Barrow-in-Furness in Great Britain. Comprising 30 turbines of the 5M model, the wind farm has supplied electricity since the summer of 2011. Böker is obviously proud of how the project has developed: “At Ormonde, we are continually producing more and more output.”
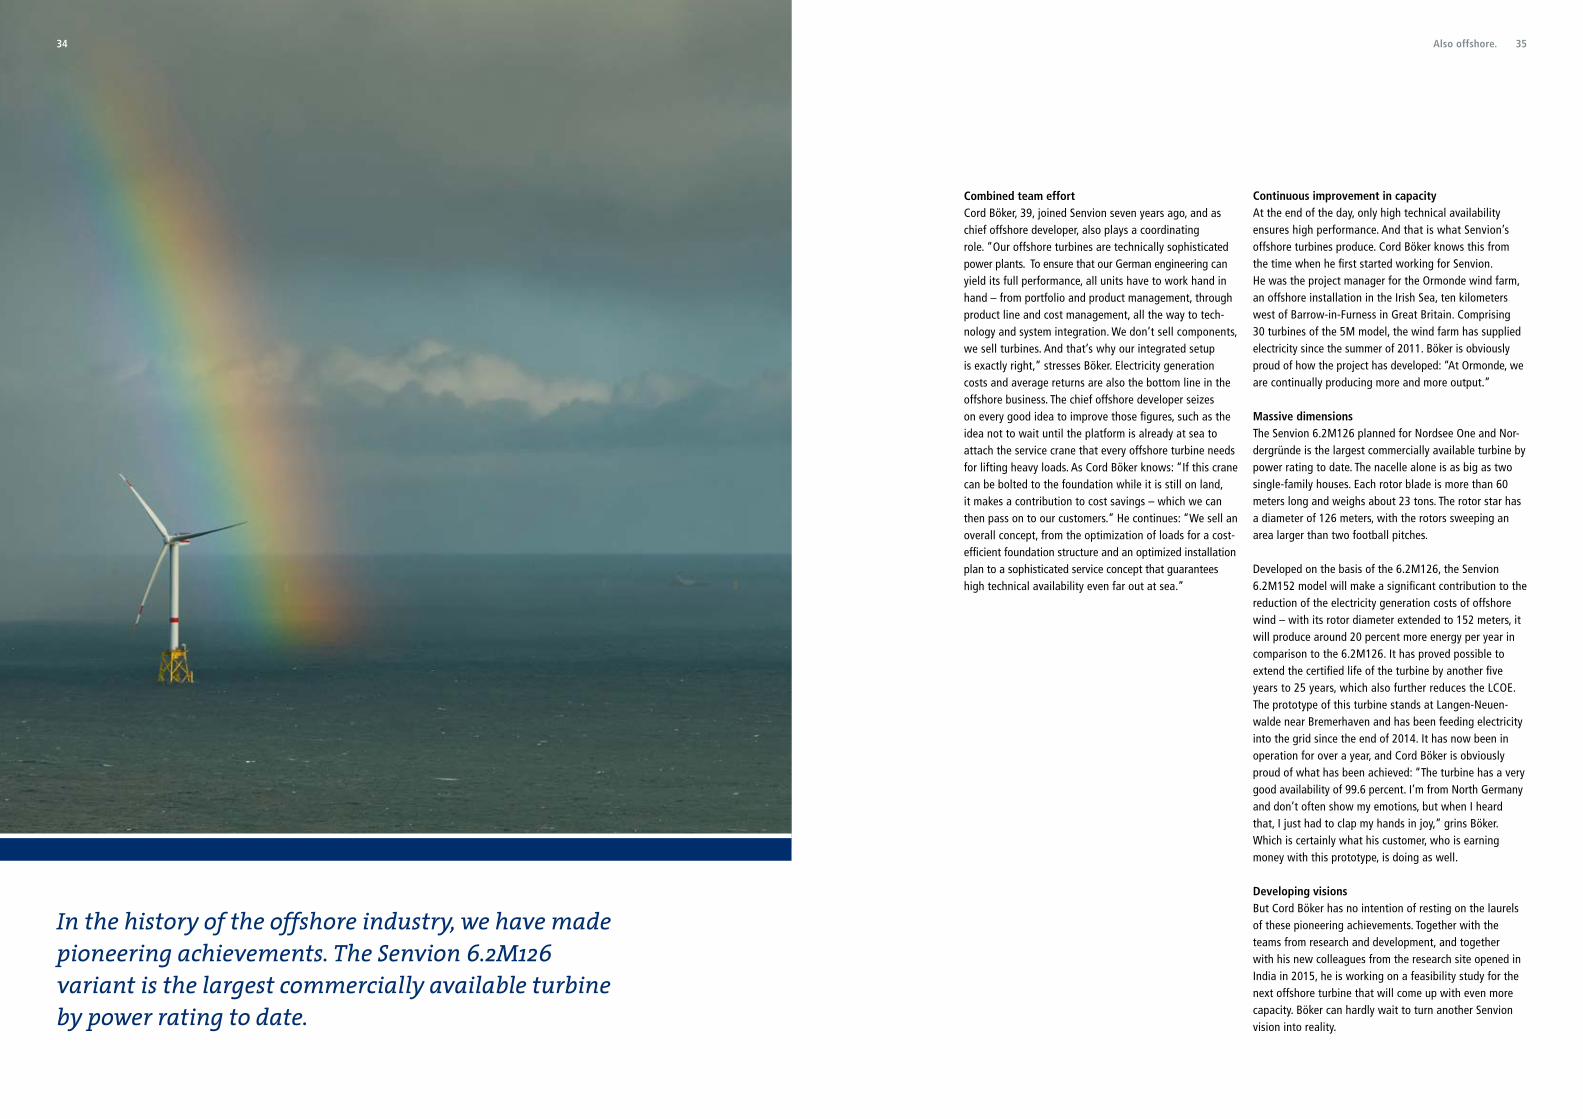
Massive dimensionsThe Senvion 6.2M126 planned for Nordsee One and Nor-dergründe is the largest commercially available turbine by power rating to date. The nacelle alone is as big as two single-family houses. Each rotor blade is more than 60 meters long and weighs about 23 tons. The rotor star has a diameter of 126 meters, with the rotors sweeping an area larger than two football pitches.
Developed on the basis of the 6.2M126, the Senvion 6.2M152 model will make a significant contribution to the reduction of the electricity generation costs of offshore wind – with its rotor diameter extended to 152 meters, it will produce around 20 percent more energy per year in comparison to the 6.2M126. It has proved possible to extend the certified life of the turbine by another five years to 25 years, which also further reduces the LCOE. The prototype of this turbine stands at Langen-Neuen-walde near Bremerhaven and has been feeding electricity into the grid since the end of 2014. It has now been in operation for over a year, and Cord Böker is obviously proud of what has been achieved: “The turbine has a very good availability of 99.6 percent. I’m from North Germany and don’t often show my emotions, but when I heard that, I just had to clap my hands in joy,” grins Böker. Which is certainly what his customer, who is earning money with this prototype, is doing as well.
Developing visionsBut Cord Böker has no intention of resting on the laurels of these pioneering achievements. Together with the teams from research and development, and together with his new colleagues from the research site opened in India in 2015, he is working on a feasibility study for the next offshore turbine that will come up with even more capacity. Böker can hardly wait to turn another Senvion vision into reality.
In the history of the offshore industry, we have made pioneering achievements. The Senvion 6.2M126 variant is the largest commercially available turbine by power rating to date.
3736
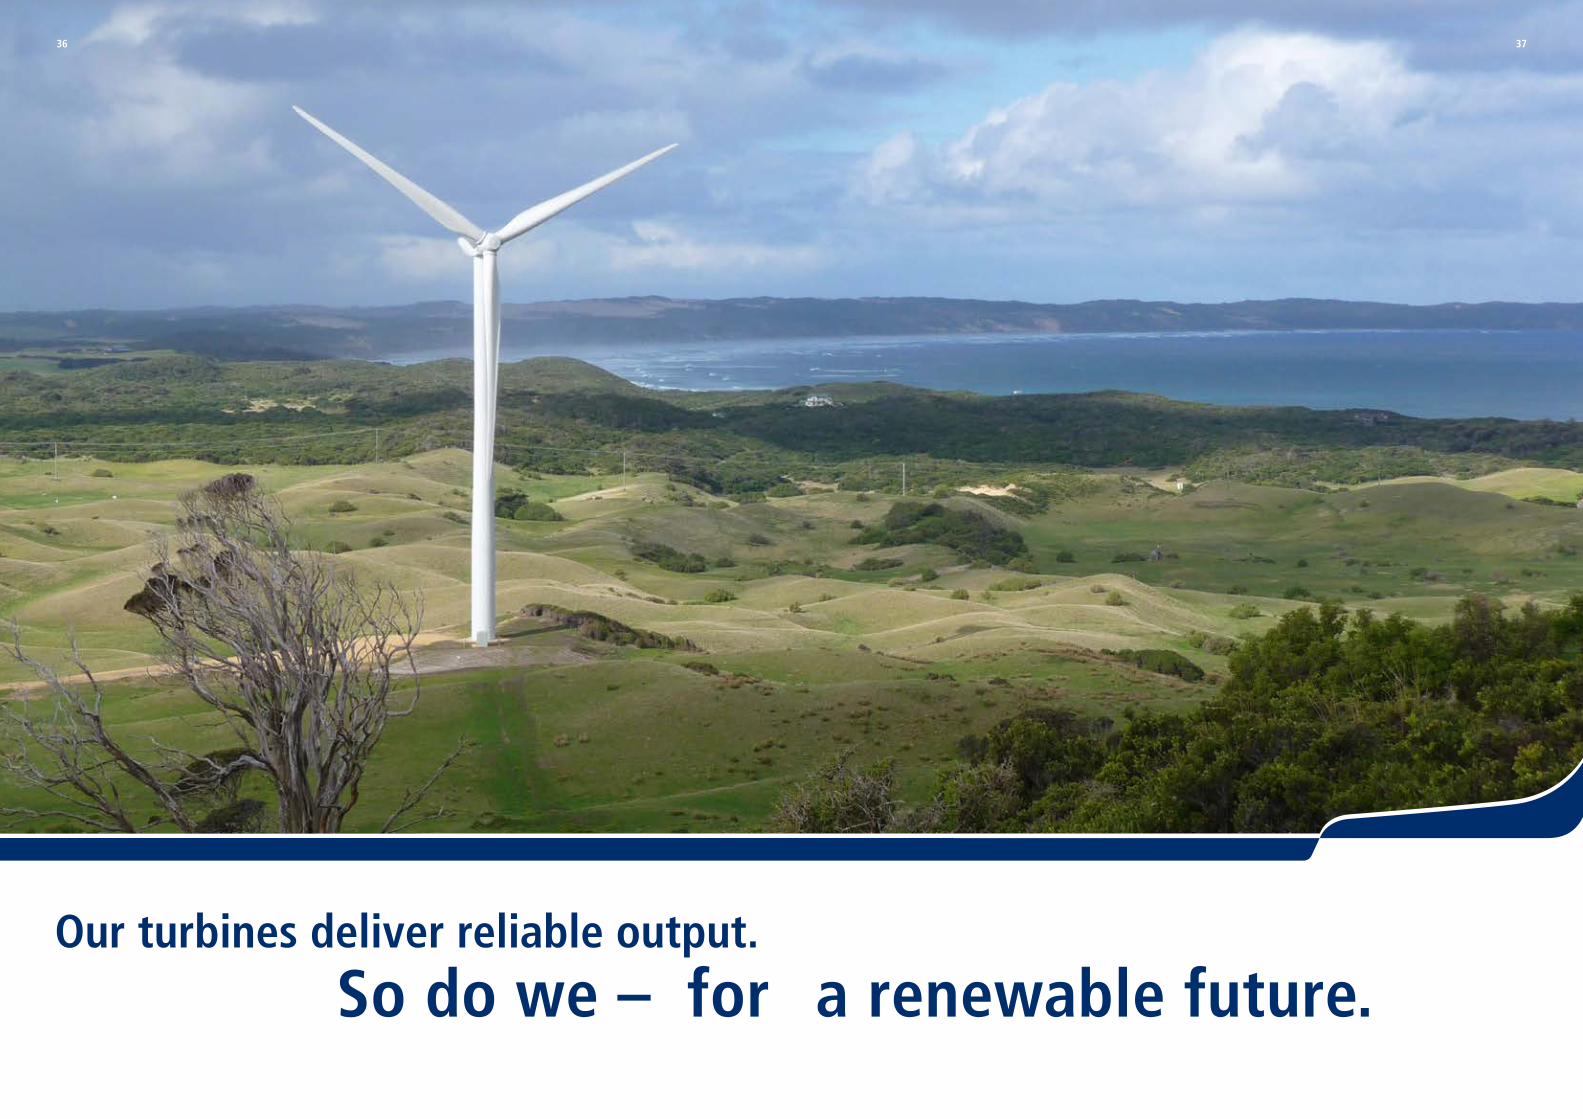
Our turbines deliver reliable output. So do we – for a renewable future.

38 39For a renewable future.
Sustainability is a central motivation and the vision behind our daily activities. Our products convert wind energy into electricity and thus play an important part in protecting the global environment and achieving national and international climate and environment targets.
Positive momentumThe fundamentally positive momentum behind wind power is documented in all the decisions taken globally by the world’s politicians – the COP21 international climate conference in Paris decided in November/December 2015 that global warming must be limited to 1.5 to 2 degrees Celsius in comparison to preindustrial standards. For example, emerging countries are to be provided with support to boost the use of renewable energies. In an agreement in 2014, the EU decided to adopt the most ambitious target worldwide: 27 percent of the energy consumed throughout Europe is to be supplied from renewable resources by 2030.
More than 13.7 gigawatts of renewable energyGlobally, Senvion has erected over 6,600 wind turbines with a total rated output of over 13.7 gigawatts. We reached a new milestone in May 2015 when the 6,000th turbine was connected to the grid at a community wind farm in North Rhine-Westphalia. In total, Senvion has installed more than 600 wind turbines with a total capacity of 1.4 gigawatts in the last fiscal year from April 2015 to December 2015.
Each country has its own pathMany countries such as Germany, Turkey, and India have stable general conditions for expanding renewable energies. So does Australia – after a phase of political discussion and the wide-ranging suspension of new investments that accompanied it, the Australian gov-ernment has set a target for producing 33,000 GWh of renewable electricity by 2020. At the same time, it has cancelled auditing of the target every second year (Renewable Energy Target, or RET for short). This basis will enable additional capacity of around 6,000 mega-watts (MW) of new wind installations in the period from 2016 to 2020.
39
The industry in Australia is ready and able to start immediately, and to invest.Chris Judd, Managing Director of Senvion Australia
“ ”

4140 For a renewable future.
Important decision“The government’s decision was immensely important on the road to a sustainable future,” notes Chris Judd, Managing Director of Senvion Australia. “The industry is ready and able to start immediately, and to invest. Thiswill create a lot of jobs and reduce the price of energy.”
Judd insists: “We notice it every day: People want more renewable energy.” He experienced this for example in Daylesford, a small town of 2,000 households in the local government district of Hepburn Shire. It was here that a group of citizens founded the Hepburn Wind Association to combat climate change in Australia. Their dream was to erect Australia’s first community wind farm, which generates more energy than is needed to cover the local demand for electricity. To that end, we supplied two wind turbines of the MM82 type, and we benefited from the experience that we had previously been able to gain in the installation of turnkey community wind farms in other countries – especially Germany.
“A project of this magnitude may not appear lucrative to everyone, as the time spent on planning and designing the wind farm and concluding the contract with the customer can quickly take on less attractive dimensions from a financial perspective. It was only thanks to our experience with this type and size of project that we were able to complete this project economically and to support the community in Hepburn by building their wind farm.”
Purchasing criterion: reliabilityThe choice of the supplier fell on Senvion at that time, as Hepburn Wind wanted to invest exclusively in proven and trusted, reliable wind turbines, and Senvion was ready and able to deliver a turnkey wind farm. In view of future major projects, Hepburn provided the Senvion Australia team with the ideal opportunity to showcase the successful delivery of turnkey wind farms. In order to guarantee the wind farm’s operation even in the very high temperatures that sometimes hit Australia, special hot climate versions1 of our turbines were installed. Thanks to the enhanced cooling of the converter, these turbines can operate even in temperatures of up to 40 degrees Celsius.
Total commitment to each project46-year-old Chris Judd is still enthusiastic about this pilot community-led project today: “This project shows that a movement to build sustainable energy generation can also emerge from a small group of committed citizens.” Senvion will continue to build and install every single turbine with passion and total commitment. Pride and passion for the vision of a renewable future are embedded deep in Senvion’s DNA. They are a strong building block in Senvion’s foundations and an important starting point for economically sustainable success.
1 What is true of extreme heat in Australia is also true of extreme cold. Read more about our cold climate versions and Senvion’s Canadian success story from page 16 onwards.
Photo: Karl von Moller/Hepburn Wind
Pride and passion for the vision of a renewable future are embedded deep in Senvion’s DNA. They are a strong building block in Senvion’s foundations and an important starting point for economically sustainable success.

Rated power 3,000 kW
Rotor diameter 122.0 m
Hub height 100.0 m (60 Hz) 136.0–139.0 m (50 Hz)
Certification IEC IIIA, WZ 3
Rated power 6,150 kW
Rotor diameter 126.0 m
Hub height Onshore 100.0–117.0 m Offshore 85.0–95.0 m (site-specific)
Certification Onshore IEC IB/IIA, WZ 4 coast Offshore IEC IB/S
Rated power 6,150 kW
Rotor diameter 152.0 m
Hub height Onshore 121.0–124.0 m Offshore 95.0–110.0 m (site-specific)
Certification Onshore IEC Class S, WZ 4 coast Offshore IEC Class S
Rated power 3,400 kW
Rotor diameter 104.0 m
Hub height 78.0–80.0 m 93.0 m 96.5–100.0 m
Certification IEC IB/IIA, WZ 4
Rated power 3,400 kW
Rotor diameter 140.0 m
Hub height 107.0–110.0 m 127.0–130.0 m
Certification IEC IIIA, WZ 2
Rated power 1,800 kW (60 Hz) 2,000 kW (50 Hz)
Rotor diameter 100.0 m
Hub height 78.0–80.0 m 98.0–100.0 m
Certification IEC IIB, WZ 3
Rated power 2,050 kW
Rotor diameter 82.0 m
Hub height 58.5–59.0 m (50 Hz) 68.0–69.0 m (50 Hz) 78.0–80.0 m*
Certification Up to IEC Class IA, up to WZ 4 *60 Hz as CCV only.
Rated power 2,050 kW
Rotor diameter 92.5 m
Hub height 68.0–68.5 m (50 Hz) 78.0–80.0 m 98.0–100.0 m*
Certification Up to IEC Class IB, up to WZ 3 *60 Hz as CCV only.
Rated power 3,200 kW
Rotor diameter 122.0 m
Hub height 136.0–139.0 m (further hub heights to follow)
Certification IEC IIIA, WZ 3
Rated power 3,370 kW (MV-side), 3,400 kW (LV-side)
Rotor diameter 114.0 m
Hub height 90.0–93.0 m 116.0–119.0 m 140.0–143.0 m
Certification IEC IIA, WZ 4 / IEC IIIA, WZ 3
Rated power 3,400 kW
Rotor diameter 114.0 m
Hub height 90.0–93.0 m (further hub heights to follow)
Certification IEC IIA, WZ 4

Financial Highlights of Fiscal Year 2015
Important Milestones 2015
CONSOLIDATED STATEMENT OF FINANCIAL POSITION Dec15A
Total assets in k EUR 1,773,643
Total equity capital in k EUR 606,593
Equity ratio 34 %
FURTHER PERFORMANCE INDICATORS as at 31.12.2015
Order backlog in EUR million 3,436
Installed capacity worldwide in MW 13,733.5
Number of installed turbines worldwide 6,625
Number of employees worldwide * 3,871
CONSOLIDATED INCOME STATEMENT 9m15/16A 9m14/15A
Revenues in k EUR 1,683,038 1,465,376
Total performance in k EUR 1,650,234 1,444,128
Result from operating activities before 125,802 60,450 exceptional items from reorganisation in k EUR
Exceptional items from reorganisation in k EUR - 8,0100 0
Result from operating activities in k EUR 117,792 60,450
Result before income taxes in k EUR 102,436 47,152
January–March > Senvion delivers 18 turbines Senvion 6.2M126 for Nordergründe offshore wind farm > Senvion successfully commissions its largest wind turbine Senvion 6.2M152 > Senvion delivers tallest onshore turbine type Senvion 3.2M114 to Belgium > Senvion delivers 54 turbines Senvion 6.2M126 for offshore wind farm Nordsee One
April–June > Senvion launches turbine for more stable grid feed-in for its 3.XM series > Senvion develops turbine Senvion 3.2M122 for even more efficient energy generation > Senvion wins four UK orders with Blue Energy totaling over 45 MW > Senvion wins new order of six Senvion 3.0M122 totaling 18 MW for Italian wind farm > Centerbridge completes acquisition of Senvion > Senvion connects its 6,000th wind turbine to the grid > Senvion wins orders totaling over 32 MW from its two-megawatt portfolio in France
July–September > Financial year 2014/15: Senvion increases revenue by 6.6%; EBITDA up 6.2% > Senvion opens R&D Center in India to further strengthen its TechCenter capabilities in Germany > Senvion ranked 2nd in wind installations with 285 MW in Germany > Senvion commissions 18 of its MM100 turbines in Poland > Senvion presents Senvion 3.4M140, its highest yield onshore wind turbine > Senvion erects its 2,000th onshore wind turbine in Germany
October–December > 109 MW order: Senvion signs its biggest UK contract to date to supply 32 turbines of the 3.XM series > Senvion supplies 16 turbines Senvion 3.4M104 to Vattenfall’s Ray Wind Farm, UK > Senvion wind turbine with Next Electrical System on the grid > Senvion acquires RodPack technology for more efficient blades > Senvion celebrates the commercial operation of its largest onshore project: the 350 MW Rivière-du-Moulin
Publication details
Published by
Senvion GmbH
Concept, Text, Editing, Realisation
Senvion Holding GmbH, Corporate Communications, Verena Puth
Juliane Hollenhorst PR
Design
Senvion GmbH/Marketing
Verinion GbR
Print/Processing
Müller Ditzen AG
Editorial Deadline: January, 31 2016* Permanet headcount
Our turbines deliver reliable output.
Legal reference
This Annual Report contains statements oriented to future developments which are based on
our current assumptions and prognoses. As a result of known as well as unknown risks,
uncertainty and influences, the actual results, financial situation or development may deviate
from the assumptions presented in this document. We shall not assume any obligation to
update any statements tuned to future developments.
BR/2
015/
GBR
/AR_
Imag
e
For our international contacts, please visit:www.senvion.com
Senvion GmbH
Überseering 10
22297 Hamburg
Germany
T + 49 40 5555 090-0
F + 49 40 5555 090-3999
www.senvion.com

For our international contacts, please visit:www.senvion.com
Consolidated Financial Statements 2015
Senvion GmbH
Überseering 10
22297 Hamburg
Germany
T + 49 40 5555 090-0
F + 49 40 5555 090-3999
www.senvion.com
Legal reference
This Annual Report contains statements oriented to future developments which are based on
our current assumptions and prognoses. As a result of known as well as unknown risks,
uncertainty and influences, the actual results, financial situation or development may deviate from
the assumptions presented in this document. We shall not assume any obligation to
update any statements tuned to future developments.

Consolidated Financial Statements for the short financial year ended 31 December 2015

Consolidated Financial Statements of Senvion GmbH
32 Consolidated Financial Statements

Assets Shareholders’ equity and liabilities
Notes 2015/12/31 2015/03/31 k EUR k EUR
Current liabilitiesShort-term loans and current portion of long-term loans 8.2 5,982 7,568Trade accounts payable 379,748 337,189Liabilities to related parties 12,501 10,851Advance payments received 5.4.1 291,410 264,139Gross amounts due to customers for contract work as a liability 5.1.2 71,847 78,907 Provisions 5.4.2 216,978 236,593 Deferred income 5.4.3 26,147 33,454 Income tax liabilities 5.4.4 62,376 27,070 Other financial liabilities 5.4.5 22,267 22,511 Other miscellaneous liabilities 5.4.5 37,390 18,118Current liabilities 1,126,646 1,036,400
Liabilities of disposal Group classified as held for sale 5.3 0 2,396Total current liabilities 1,126,646 1,038,796
Non-current liabilities Long-term loans 5.5 10,503 14,346Deferred taxes 5.2.3 29,903 36,274Other non-current financial liabilities 0 1,000Total non-current liabilities 40,406 51,620
EquitySubscribed capital 5.6 9,220 9,220Additional paid-in capital 5.6 299,220 299,220Other reserves 7,055 3,097
Revaluation reserve 776 776Currency translation 143 3,164Cash flow hedging reserve 6,136 – 843
Retained earnings 291,098 220,426
Equity attributable to shareholders of the parent company
606,593 531,963
Non-controlling interests 5.6 0 7,040Total equity 606,593 539,003Total equity and liabilities 1,773,645 1,629,419
Notes 2015/12/31 2015/03/31 k EUR k EUR
Current assetsLiquid funds 5.1.1 417,732 301,375Gross amount due from customers for contract work as an asset 5.1.2 49,372 58,753Trade accounts receivable 5.1.3 230,751 178,008Receivables from related parties 5.1.4 199,504 32,009Inventories 5.1.5 415,053 582,710Receivables from income taxes 2,664 1,986Other financial assets 5.1.6 11,557 2,234Other miscellaneous assets 5.1.6 87,316 96,160Current assets 1,413,949 1,253,235
Assets of disposal Group classified as held for sale 5.3 0 16,461Total current assets 1,413,949 1,269,696
Non-current assetsOther intangible assets 5.2.1 145,663 126,361Goodwill 15,632 15,632Property, plant and equipment 5.2.2 193,198 205,188Other financial investment 4,004 66Loans granted 1,028 2,752Deferred taxes 5.2.3 0 6,062Total other non-current assets 171 3,662Total non-current assets 359,696 359,723Total assets 1,773,645 1,629,419
Consolidated statement of financial position
4 5Consolidated Financial Statements

Consolidated statement of comprehensive income
Notes 2015/04/01 – 2015/12/31
2014/04/01 – 2015/03/31
2014/04/01 – 2014/12/31
(9 months) (12 months) (9 months) k EUR k EUR k EUR
Revenues 6.1 1,683,038 1,921,819 1,465,376Changes in work in progress – 64,637 4,394 – 47,255Work performed by the entity and capitalized 5.2.1 31,833 38,767 26,007Total performance 1,650,235 1,964,980 1,444,128
Other operating income 6.2 37,690 33,738 23,882Cost of materials/cost of purchased services – 1,186,201 – 1,476,859 – 1,079,210Personnel expenses 6.3 – 172,124 – 208,929 – 153,249Depreciation of property, plant and equipment and amortization of intangible assets – 41,711 – 53,898 – 39,227Other operating expenses 6.4 – 162,086 – 188,917 – 135,874Result from operating activities before reorganization expenses 125,804 70,115 60,450
Reorganization expenses 6.5 – 8,010 0 0Result from operating activities 117,794 70,115 60,450
Interest and similar financial income 6.6 7,251 1,976 1,343Interest and similar financial expenses 6.6 – 22,607 – 19,968 – 14,641Result before income taxes 102,438 52,123 47,152
Income taxes 5.2.3 – 32,055 – 21,194 – 18,691Profit for the period from continuing operations 70,382 30,929 28,461
Profit for the period from discontinued operations 5.3 19 1,211 1,069Net result for the period 70,401 32,140 29,530
Share of net result for the period attributable to non-controlling interests – 271 559 493
Continuing operations 0 0 0Discontinued operations – 271 559 493
Share of net result for the period attributable to shareholders of the parent 70,672 31,581 29,037
Continuing operations 70,382 30,929 28,461Discontinued operations 290 652 576
Consolidated income statement
2015/04/01 – 2015/12/31
2014/04/01 – 2015/03/31
2014/04/01 – 2014/12/31
(9 months) (12 months) (9 months)k EUR k EUR k EUR
Net result for the period 70,401 32,140 29,530
Other comprehensive income to be reclassified to profit of loss in subsequent periods (net of tax)Cash flow hedges 9,885 – 3,517 – 2,052Income taxes relating to cash flow hedges – 2,906 1,027 598Expenses/income of cash flow hedges after tax 6,979 – 2,490 – 1,454Currency translation – 3,128 3,565 2,107Other comprehensive income 3,851 1,075 653Total comprehensive income 74,252 33,215 30,183
Share of total comprehensive income for the period attributable to non-controlling interests from discontinued operations – 378 1,962 1,159
Share of total comprehensive income for the period attributable to shareholders of the parent company 74,630 31,253 29,024
6 7Consolidated Financial Statements

Consolidated statement of cash flows
Notes 2015/04/01 – 2015/12/31
2014/04/01 – 2015/03/31
2014/04/01 – 2014/12/31
(9 months) (12 months) (9 months) k EUR k EUR k EUR
Cash flow from operating activitiesResult before income taxes 102,457 53,334 48,221Adjustments for:Depreciation on property, plant and equipment, amortization of intangible assets 44,657 53,898 39,227Interest income – 7,251 – 1,976 – 1,343Interest expenses 22,607 19,968 14,641Increase/decrease in provisions – 19,615 – 33 – 5,564Profit/loss from sales of property, plant and equipment, intangible and other long-term assets 28 71 33Gain from loss of control in subsidiary from change in ownership interest – 606 0 0Change in working capital 219,929 30,055 76,463Interest received 6.6 1,114 1,976 1,343Interest paid 6.6 – 9,757 – 25,406 – 21,346Income tax paid – 2,775 – 11,884 – 11,385Cash flow from operating activities* 4.19 350,788 120,003 140,290
Cash flow from investing activitiesCash receipts from the sale of property, plant and equipment, intangible and other long-term assets 5.2.2 767 1,812 1,441Cash payments for the purchase of intangible assets 5.2.1 – 35,348 – 43,555 – 29,670Cash payments from purchase of property, plant and equipment and other long-term assets 5.2.2 – 17,812 – 39,290 – 31,141Cash payments from loans granted to related parties 5.1.4 – 177,325 0 0Acquisition of subsidiary: Net of cash acquired 0 102 102Loss of control in subsidiary from change in ownership interest 5.3 – 5,526 0 0Cash flow from investing activities** 4.19 – 235,244 – 80,931 – 59,268
Cash flow from financing activitiesCash repayments of amounts borrowed – 3,843 – 7,544 – 5,562Cash flow from financing activities 4.19 – 3,843 – 7,544 – 5,562Increase/decrease in cash and cash equivalents 111,701 31,528 75,460Cash and cash equivalents at the beginning of the period 300,049 268,521 268,521Cash and cash equivalents at the end of the period 411,750 300,049 343,981Liquid funds 5.1.1 417,732 301,375 346,271Cash displayed in “Assets of disposal Group classified as held for sale” 5.3 0 6,242 5,799Short-term bank liabilities 8.2 – 5,982 – 7,568 – 8,089Cash and cash equivalents at the end of the period 411,750 300,049 343,981
* thereof from discontinued operations 5.3 – 716 – 663 – 1,106** thereof from discontinued operations 5.3 0 4 3
8 9Consolidated Financial Statements

Consolidated statements of changes in shareholders’ equity
Subscribed capital
Additional paid-in capital
Revaluation reserve
Currency translation
Cash flow hedging reserve
Retained earnings Equity attributable to shareholders of
the parent company
Non-controlling interests
Total equity
k EUR k EUR k EUR k EUR k EUR k EUR k EUR k EUR k EURBalance at 2015/04/01 9,220 299,220 776 3,164 – 843 220,426 531,963 7,040 539,003Net result for the period 70,672 70,672 – 271 70,401Cash flow hedges 6,979 6,979 6,979Currency translation – 3,021 – 3,021 – 107 – 3,128Comprehensive Income – 3,021 6,979 70,672 74,630 – 378 74,252Loss of control in subsidiary from change in ownership interest 0 – 6,662 – 6,662
Balance at 2015/12/31 9,220 299,220 776 143* 6,136 291,098 606,593 0 606,593
Balance at 2014/04/01 9,220 303,676 776 1,002 1,647 188,844 505,165 5,077 510,242Net result for the period 31,581 31,581 559 32,140Cash flow hedges – 2,490 – 2,490 – 2,490Currency translation 2,162 2,162 1,403 3,565Comprehensive Income 2,162 – 2,490 31,581 31,253 1,962 33,215Common control transactions – 4,455 – 4,455 – 4,455
Balance at 2015/03/31 9,220 299,220 776 3,164** – 843 220,426 531,963 7,040 539,003
* Thereof from discontinued operations as of 31 December 2015: 0 k EUR
** Thereof from discontinued operations as of 31 March 2015: 2,333 k EUR (gain)
10 11Consolidated Financial Statements

The Senvion Group (“Senvion” or the “Group”) with Senvion GmbH (formerly Senvion SE until 25 June 2015), Übersee-ring 10, 22297 Hamburg, Federal Republic of Germany, as its parent company, operates in the area of manufacturing and selling wind energy turbines as well as developing and providing turnkey wind farms.
Senvion GmbH voluntarily prepared consolidated financial statements for the short financial year ended 31 December 2015. Senvion will be included in the consolidated financial statements of the parent company, Senvion S.à r.l., as of 31 December 2015 and is therefore according to § 291 (1) of the German Commercial Code (HGB) exempt from preparing and publishing consolidated financial statements. The consolidated financial statements for the year ended 31 December 2015 were prepared in accordance with International Financial Reporting Standards (IFRS) as adopted for use in the European Union.
The consolidated financial statements as of 31 December 2015 were approved by the Executive Board on 11 February 2016.
The consolidated financial statements are prepared with the Euro as the presentation currency. The income statement is presented using the nature of expense method. Unless otherwise stated, all figures in the notes are accurate to the nearest thousand euro (k EUR) using commercial rounding. This may cause sums and subtotals to deviate from its arithmetical result by k EUR 1.
The consolidated financial statements are prepared on a historical cost basis, except for derivative and available-for- sale financial instruments, which are measured at fair value as of the reporting date.
Senvion GmbH as well as the majority of the subsidiaries adopted a new financial year in 2015. The financial year of Senvion ends on 31 December instead of 31 March. The financial year 2015 is a short nine-month financial year from 1 April 2015 to 31 December 2015. The following financial year 2016 will be a regular, twelve-month financial year from 1 January 2016 until 31 December 2016.
These consolidated financial statements present an additional comparative consolidated income statement and consoli-dated cash flow statement for the comparable 9-months period from 1 April 2014 to 31 December 2014 (9-months comparative period 2014) and related note information for those additional statements.
Notes to the consolidated financial statements as of and for the short financial year ended 31 December 2015
1 Introduction 2 Change in the financial year
12 13Notes to the consolidated financial statements
3.1 Principles of consolidationThese consolidated financial statements include all significant directly or indirectly controlled German and foreign subsidiaries.
Subsidiaries are consolidated from the date of acquisition, being the date on which Senvion obtained control, and continue to be consolidated until the date when such control ceases. Control is achieved when Senvion is exposed, or has rights, to variable returns from its involvement with investee and has the ability to affect those returns through its power over the investee. Specifically, Senvion controls an investee if and only if Senvion has:
Power over the investee (i. e. existing rights that give it the current ability to direct the relevant activities of the investee)
Exposure, or rights, to variable returns from its involvement with the investee, and The ability to use its power over the investee to affect its returns
When Senvion has less than a majority of the voting or similar rights of an investee, Senvion considers all relevant facts and circumstances in assessing whether it has power over an investee, including:
The contractual arrangement with other vote holders of the investee Rights arising from other contractual arrangements The Group’s voting rights and potential voting rights
Senvion re-assesses whether or not it controls an investee if facts and circumstances indicate that there are changes to one or more of the three elements of control.
The financial statements of the subsidiaries are prepared for the same reporting period as the parent company, using consistent accounting policies. All intra-Group balances, transactions, unrealised gains and losses resulting from intra-Group transactions and dividends are eliminated in full. Profit or loss and each component of other comprehensive income (OCI) are attributed to the shareholders of the parent company of the Group and to the non-controlling interests.
A change in the ownership interest of a subsidiary, without a loss of control, is accounted for as an equity transaction. If Senvion loses control over a subsidiary it:
Derecognizes the assets (including goodwill) and liabilities of the subsidiary Derecognizes the carrying amount of any non-controlling interest Derecognizes the cumulative translation differences, recorded in equity Recognizes the fair value of the consideration received Recognizes the fair value of any investment retained Recognizes any surplus or deficit in profit or loss Reclassifies the parent’s share of components previously recognized in OCI to profit or loss or retained earnings,
as appropriate
3.2 Business combinations and goodwillBusiness combinations are accounted for using the acquisition method. The cost of an acquisition is measured as the aggregate of the consideration transferred measured at acquisition date fair value and the amount of any non-controlling interests in the acquiree. For each business combination, the Group elects whether to measure the non-controlling interests in the acquiree at fair value or at the proportionate share of the acquiree’s identifiable net assets. Acquisition-related costs are expensed as incurred and included in administrative expenses.
If the business combination is achieved in stages, any previously held equity interest is remeasured at its acquisition date fair value and any resulting gain or loss is recognized in profit or loss.
Any contingent consideration to be transferred by the acquirer will be recognized at fair value at the acquisition date. Contingent consideration classified as an asset or liability are within the scope of IAS 39 Financial Instruments and are measured initially and subsequently at fair value with changes in fair value recognized in profit or loss.
Goodwill is initially measured at cost, being the excess of the aggregate of the consideration transferred and the amount recognized for non-controlling interests, and any previous interest held, over the net identifiable assets acquired and liabilities assumed. If the fair value of the net assets acquired is in excess of the aggregate consideration transferred, the Group re-assesses whether it has correctly identified all of the assets acquired and all of the liabilities assumed and reviews the procedures used to measure the amounts to be recognized at the acquisition date. If the reassessment still results in an excess of the fair value of net assets acquired over the aggregate consideration transferred, then the gain is recognized in profit or loss within other operating income.
After initial recognition, goodwill is measured at cost less any accumulated impairment losses. For the purpose of impairment testing, goodwill acquired in a business combination is, from the acquisition date, allocated to each of the Group’s cash-generating units that are expected to benefit from the combination, irrespective of whether other assets or liabilities of the acquiree are assigned to those units.
Business combinations under common control are not in the scope of IFRS 3. A business combination under common control is a transaction whereby the Group acquires a business which is ultimately controlled by the same party before and after the transaction. Senvion is applying the pooling of interest method to account for business combinations under common control. Assets and liabilities of the transferred business are recorded on the basis of their carrying amounts in the most recent consolidated financial statements of the transferring party. Comparative financial information for periods before the transaction took place is not adjusted.
3 Consolidation
14 15Notes to the consolidated financial statements

3.3 Scope of consolidation
3.3.1 Fully consolidated companiesThe consolidated Group includes Senvion GmbH as well as the following German and foreign subsidiaries:
2015/12/31 2015/03/31Project companies Share in % Share in %Senvion Betriebs- und Beteiligungsgesellschaft mbH, Rendsburg, Germany 100.00 100.00Senvion Windpark Betriebs GmbH, Hamburg, Germany* – 100.00Senvion Investitions- und Projektierungs GmbH & Co.KG, Rendsburg, Germany* – 100.00Windpark Blockland GmbH & Co. KG, Hamburg, Germany* – 100.00Yorke Peninsula Wind Farm Project Pty Ltd., Melbourne, Australia 80.00 80.00 Production and services companies PowerBlades GmbH, Bremerhaven, Germany 100.00 100.00Senvion Deutschland GmbH, Hamburg, Germany 100.00 100.00REpower North (China) Ltd., Baotou, PR China** – 53.87PowerBlades S.A., Vagos, Portugal 100.00 100.00Ventipower S.A., Oliveira de Frades, Portugal 100.00 100.00RiaBlades S.A., Vagos, Portugal 100.00 100.00Ventinveste Indústria, SGPS, S.A., Oliveira de Frades, Portugal 100.00 100.00RETC Renewable Energy Technology Center GmbH, Hamburg, Germany 100.00 100.00Senvion India Ltd., Pune, India 100.00 100.00PowerBlades Industries Inc., Québec, Canada 100.00 100.00 Sales companies Senvion France S.A.S., Courbevoie, France 100.00 100.00Senvion Italia S.r.l., Milan, Italy 100.00 100.00Senvion Holdings Pty Ltd., Melbourne, Australia 100.00 100.00Senvion Australia Pty Ltd., Melbourne, Australia 100.00 100.00Senvion (Beijing) Trading Co. Ltd., Beijing, PR China 100.00 100.00Senvion USA Corp., Denver, U.S.A. 100.00 100.00Senvion Canada Inc., Montreal, Canada 100.00 100.00Senvion Benelux b.v.b.a., Ostend, Belgium 100.00 100.00Senvion UK Ltd., Edinburgh, UK 100.00 100.00Senvion Polska, Sp.z o.o., Warsaw, Poland 100.00 100.00Senvion Portugal S.A., Porto, Portugal 100.00 100.00Senvion Scandinavia AB., Västerås, Sweden 100.00 100.00Senvion Romania SRL., Bucharest, Romania 100.00 100.00Senvion Austria GmbH, Ernstbrunn, Austria 100.00 100.00Senvion Netherlands B.V., Nijkerk, Netherlands 100.00 100.00Senvion Turkey Rüzgar Türbinleri Limited irketi, Ankara, Turkey 100.00 100.00Senvion (Shanghai) Trading Co. Ltd., Shanghai, PR China 100.00 –
Shelf or shell companiesWEL Windenergie Logistik GmbH, Schloß Holte-Stukenbrock, Germany 100.00 100.00
* In the short financial year 2015 Senion Windpark Betriebs GmbH, Hamburg, Germany and Senvion Investitions-und Projektierungs GmbH & Co. KG, Rendsburg,
Germany were merged with Senvion Betriebs-und Beteiligungsgesellschaft mbH, Rendsburg, Germany. The Windpark Blockland was dissolved as a result of the merger.
** Reference is made to note 3.3.2.1 regarding interest retained
3.3.2 Changes in the scope of consolidation
3.3.2.1 Changes in the scope of consolidation in the short financial year 2015The establishment of Senvion (Shanghai) Trading Co. Ltd. was completed in June 2015.
After the entry of a new investor Senvion has no longer control over Repower North (China) Ltd. which had previously been accounted for as a discontinued operation. The subsidiary was deconsolidated as a result of the loss in control from the change in ownership interest. Senvion retained an interest in the company, which is 10.89 %. Senvion accounts for its retained interest as an available-for-sale financial instrument (refer to Note 5.3 Non-current assets held for sale and discontinued operation).
3.3.2.2 Changes in the scope of consolidation in the financial year ended 31 March 2015 (the “financial year 2014/15”)
As part of the expansion of its service and marketing activities, Senvion GmbH established Senvion Netherlands B. V., headquartered in Nijkerk, Netherlands, in April 2014 as well as Senvion Turkey Rüzgar Türbinleri Limited irketi, headquartered in Ankara, Turkey, in June 2014. In addition, Senvion GmbH has started to establish Senvion (Shanghai) Trading Co. Ltd., headquartered in Shanghai, PR China since March 2015.
Senvion acquired 80 % of Yorke Peninsula Wind Farm Project Pty. Ltd., Melbourne, Australia in June 2014.
16 17Notes to the consolidated financial statements

As Yorke Peninsula Wind Farm Project Pty Ltd., Melbourne, Australia, was previously controlled by Valum Holding B. V., Amsterdam, Netherlands, a 100 % subsidiary of Suzlon Energy Ltd., Pune, India, which also owned at the date of the transaction 100 % of the shares in Senvion GmbH indirectly through its subsidiaries, the transfer was considered to be a business combination under common control.
Therefore, the assets and liabilities of Yorke Peninsula Wind Farm Project Pty Ltd were recognized at their carrying value recognized prior to the transaction in the IFRS financial statements of the then ultimate parent entity of Senvion GmbH. The difference between the consideration transferred and the net assets recognized as of the transfer date were recognized directly in equity. Comparative financial information for periods before the transaction was not adjusted.
The following table shows the carrying amounts of assets and liabilities recorded as of transaction date:
1 June 2014Carrying amounts k EUROther current assets 3Intangible assets 333Trade accounts payable 528Net assets acquired – 192Cost of acquisition 4,263Amounts recorded directly in Equity 4,455
The purchase price liability was offset against an outstanding receivable of Suzlon Energy Ltd, Pune, India. The net profit of the Group for the financial year 2014/2015 includes a net loss of 1 k EUR and no revenues from York Peninsula Wind Farm Project Pty Ltd.
The entity Repower Northern Europe A/S, Aarhus was liquidated with effect from 30 September 2014 and is no longer consolidated since then.
The accounting policies applied in the consolidated financial statements for the short financial year ended 31 December 2015 were adjusted to reflect the new standards, as stated in Note 4.21 New accounting standards and their application.
4.1 Liquid fundsCash and Cash equivalents include cash at bank and in hand and short-term deposits with an original maturity of three months or less. The cash equivalents are subject to an insignificant risk of changes in value.
4.2 Receivables and other financial assetsTrade receivables, receivables from related parties and other primary financial assets designated to the loans and receivables category are carried at fair value plus transaction costs on initial recognition. Subsequent measurement is at amortized cost using the effective interest rate method. Valuation allowances for impairment are determined on the basis of past experience and individual risk assessments. Valuation allowances on trade receivables are reported in an allowance account for impairments or in the form of a direct write-down of the carrying amount of the receivable depending on the reliability of the assessment of the risk of impairment. An impairment loss is recognized when the carrying amount of a financial asset is higher than the present value of the expected future cash flows.
The Group assesses, at each reporting date, whether there is objective evidence that a financial asset or a Group of financial assets is impaired. An impairment exists if one or more events have occurred since the initial recognition of the asset (an incurred ‘loss event’), which have an impact on the estimated future cash flows of the financial asset or the Group of financial assets. The following triggers, amongst other things, may provide objective evidence of impairment:
Significant financial difficulty of the obligor; The lender granting a concession to the borrower for economic or legal reasons relating to the borrower’s financial
difficulty; Likely insolvency or need for restructuring on the part of the borrower; Loss of an active market for the financial asset due to financial difficulties.
4.3 InventoriesInventories comprise raw materials and supplies and work in progress. Raw materials and supplies are carried at the lower of cost or net realizable value. Work in progress is measured at the lower of cost or net realizable value. Net realizable value is the estimated selling price less the estimated costs of completion and the estimated costs necessary to make the sale. The cost of inventories is calculated using the weighted average cost basis and comprises all costs of purchase and other costs incurred in bringing the inventories to their present location and condition. In addition to material and production overheads, manufacturing costs comprise overheads attributable within the meaning of IAS 2.
4 Accounting policies
18 19Notes to the consolidated financial statements
4.4 Property, plant and equipmentProperty, plant and equipment is stated at cost and depreciated on a straight-line basis over their useful life. Cost includes all expenses for purchasing the assets, insofar as these can be reliably calculated or estimated. The manufacturing costs of internally generated equipment comprise direct costs as well as attributable overheads.
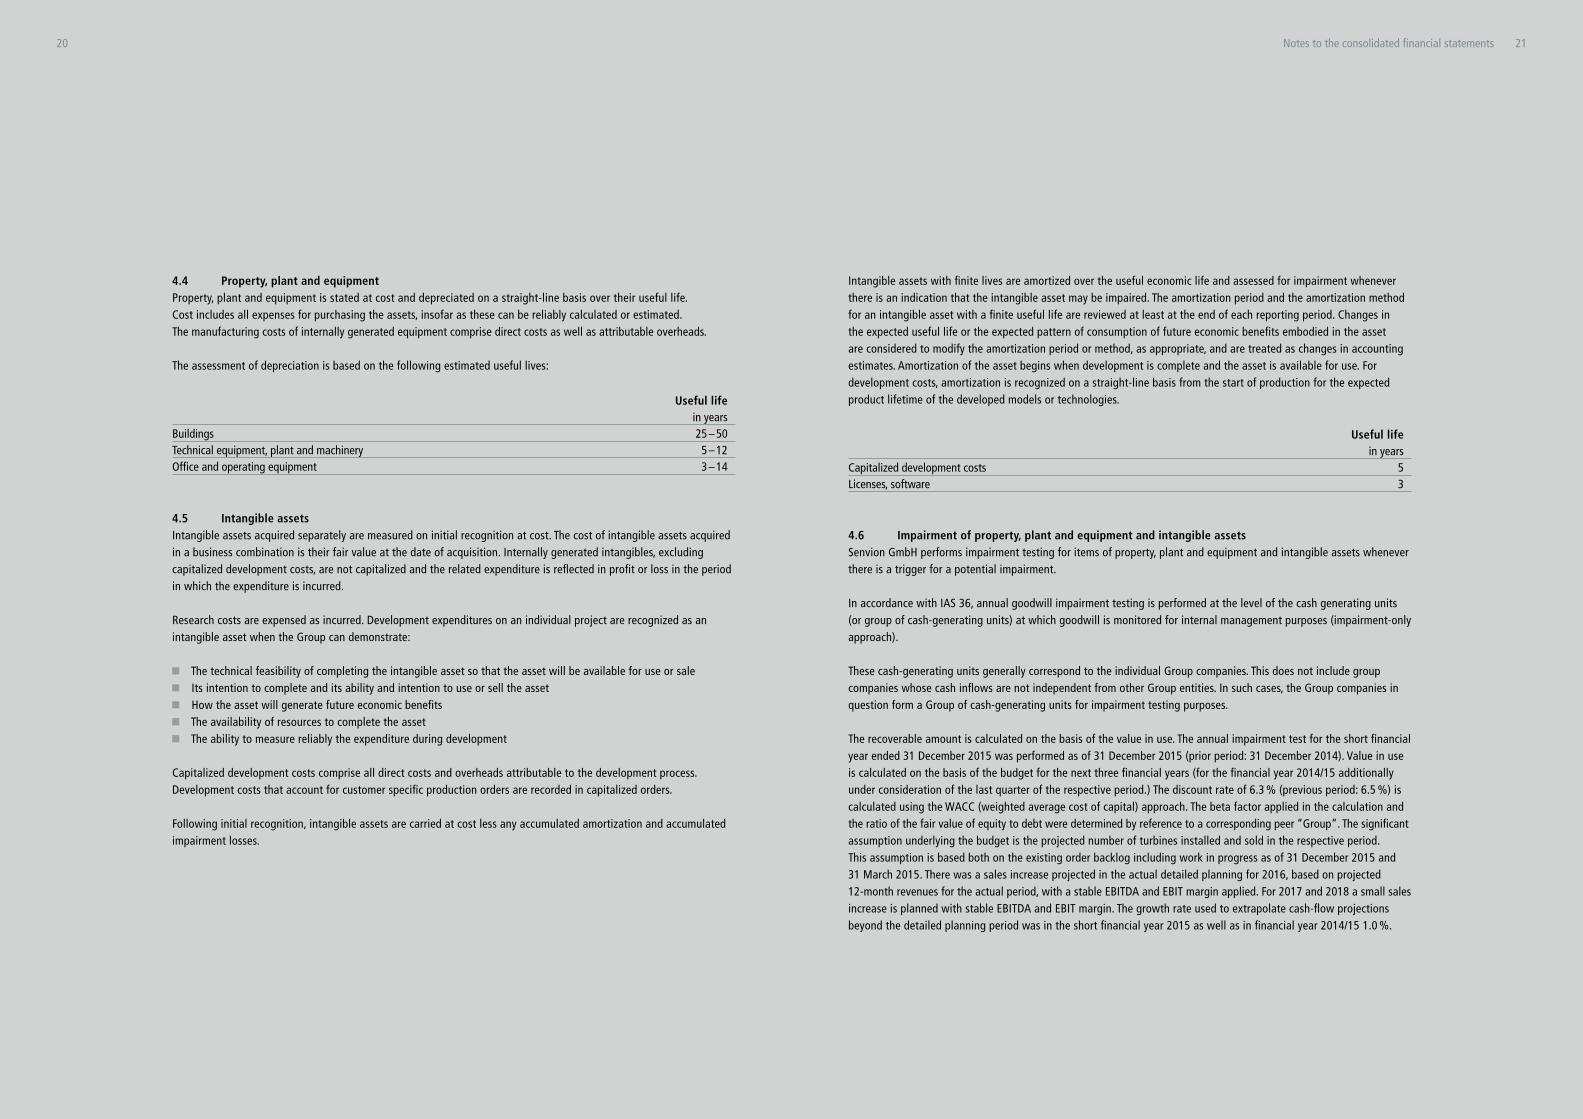
The assessment of depreciation is based on the following estimated useful lives:
Useful lifein years
Buildings 25 – 50Technical equipment, plant and machinery 5 – 12Office and operating equipment 3 – 14
4.5 Intangible assetsIntangible assets acquired separately are measured on initial recognition at cost. The cost of intangible assets acquired in a business combination is their fair value at the date of acquisition. Internally generated intangibles, excluding capitalized development costs, are not capitalized and the related expenditure is reflected in profit or loss in the period in which the expenditure is incurred.
Research costs are expensed as incurred. Development expenditures on an individual project are recognized as an intangible asset when the Group can demonstrate:
The technical feasibility of completing the intangible asset so that the asset will be available for use or sale Its intention to complete and its ability and intention to use or sell the asset How the asset will generate future economic benefits The availability of resources to complete the asset The ability to measure reliably the expenditure during development
Capitalized development costs comprise all direct costs and overheads attributable to the development process. Development costs that account for customer specific production orders are recorded in capitalized orders.
Following initial recognition, intangible assets are carried at cost less any accumulated amortization and accumulated impairment losses.
Intangible assets with finite lives are amortized over the useful economic life and assessed for impairment whenever there is an indication that the intangible asset may be impaired. The amortization period and the amortization method for an intangible asset with a finite useful life are reviewed at least at the end of each reporting period. Changes in the expected useful life or the expected pattern of consumption of future economic benefits embodied in the asset are considered to modify the amortization period or method, as appropriate, and are treated as changes in accounting estimates. Amortization of the asset begins when development is complete and the asset is available for use. For development costs, amortization is recognized on a straight-line basis from the start of production for the expected product lifetime of the developed models or technologies.
Useful lifein years
Capitalized development costs 5Licenses, software 3
4.6 Impairment of property, plant and equipment and intangible assetsSenvion GmbH performs impairment testing for items of property, plant and equipment and intangible assets whenever there is a trigger for a potential impairment.
In accordance with IAS 36, annual goodwill impairment testing is performed at the level of the cash generating units (or group of cash-generating units) at which goodwill is monitored for internal management purposes (impairment-only approach).
These cash-generating units generally correspond to the individual Group companies. This does not include group companies whose cash inflows are not independent from other Group entities. In such cases, the Group companies in question form a Group of cash-generating units for impairment testing purposes.
The recoverable amount is calculated on the basis of the value in use. The annual impairment test for the short financial year ended 31 December 2015 was performed as of 31 December 2015 (prior period: 31 December 2014). Value in use is calculated on the basis of the budget for the next three financial years (for the financial year 2014/15 additionally under consideration of the last quarter of the respective period.) The discount rate of 6.3 % (previous period: 6.5 %) is calculated using the WACC (weighted average cost of capital) approach. The beta factor applied in the calculation and the ratio of the fair value of equity to debt were determined by reference to a corresponding peer “Group”. The significant assumption underlying the budget is the projected number of turbines installed and sold in the respective period. This assumption is based both on the existing order backlog including work in progress as of 31 December 2015 and 31 March 2015. There was a sales increase projected in the actual detailed planning for 2016, based on projected 12-month revenues for the actual period, with a stable EBITDA and EBIT margin applied. For 2017 and 2018 a small sales increase is planned with stable EBITDA and EBIT margin. The growth rate used to extrapolate cash-flow projections beyond the detailed planning period was in the short financial year 2015 as well as in financial year 2014/15 1.0 %.
20 21Notes to the consolidated financial statements
Impairment is recognized for other intangible assets and property, plant and equipment if certain events or develop-ments result in the carrying amount of the asset no longer being covered by the expected proceeds of disposal or the discounted net cash flows from continued use. If the recoverable amount of individual assets cannot be calculated, the cash flow is calculated for the next highest “Group” of assets for which such a cash flow can be calculated. Impairment losses are reversed if the reasons for their recognition no longer apply in subsequent periods.
Impairment cannot be reversed in excess of the carrying amount that would have applied if no impairment had been recognized. Goodwill impairment will not be reversed.
4.7 Non-current assets held for sale and discontinued operationsThe Group classifies non-current assets and disposal groups as held for sale if their carrying amounts will be recovered principally through a sale transaction rather than through continuing use. Non-current assets and disposal groups classified as held for sale are measured at the lower of their carrying amount and fair value less costs to sell. The criteria for held for sale classification is regarded as met when the sale is highly probable and the asset or disposal Group is available for immediate sale in its present condition and the sale is expected to qualify for recognition as a completed sale within one year from the date of classification.
Discontinued operations are excluded from the results of continuing operations and are presented as a single amount as profit or loss after tax from discontinued operations in the consolidated income statement. Property and equipment and intangible assets are not depreciated or amortized once classified as held for sale.
The activities of REpower North (China) Ltd. were displayed as a discontinued operation until 30 November 2015 (refer to Note 5.3 Non-current assets held for sale and discontinued operations).
4.8 Loans grantedLoans granted which are allocated to the loans and receivables category are carried at fair value on initial recognition. Subsequent measurement is at amortized cost using the effective interest rate method.
4.9 ProvisionsProvisions are recognized in accordance with IAS 37. These relate to legal or constructive obligations for which settlement is probable to result in an outflow of financial resources and whose amount can be reliably estimated.
Warranty Provisions Warranty provisions are recognized both for individual risks from technical issues which affect individual wind turbine generators (“WTGs”), a specific series of WTGs or specific components across a number of different WTGs (specific warranty provisions) and for risks and defects of smaller nature which generally occur in every sold WTG during the warranty period (general warranty provisions). Warranty provisions are assurance type warranties which are recognized for the legal or contractual warranty period.
– Specific warranty provisionsSpecific technical warranty risks can be individually quantified by comprehensive documentation and are taken into consideration in the form of individual provisions. The economic risk and the level of provisioning are evaluated on an ongoing basis in coordination with the technical departments, taking existing risks into account. Specific warranty provisions comprise issues falling within the legal warranty period of 2 years as well as issues for which warranty arises from contractual service agreements.
– General warranty provisionsProvisions are recognized for risks and defects of smaller nature which generally occur in every sold WTG on the basis of past experience. General warranty provisions are determined as follows: for turbines erected, provisions are recognized for the anticipated future costs per year for the entire legal warranty period of 2 years. The anticipated costs are determined on the basis of past experience and reviewed on an ongoing basis. Due to the uncertainty involved the estimated costs, and hence the amount of the provisions, may differ from actual costs.
Restructuring ProvisionsRestructuring provisions are recognized only when the Group has a contractual or constructive obligation, which is when a detailed formal plan identifies the business or part of the business concerned, the location and number of employees affected, a detailed estimate of the associated costs, and an appropriate timeline, and the employees affected have been notified of the plan’s main features.
4.10 Trade LiabilitiesTrade accounts payable are measured at amortized cost using the effective interest rate method.
4.11 Revenue recognitionRevenues include all revenues from the sale of wind energy turbines, license revenues, electricity revenues and revenues from service and maintenance contracts.
Wind TurbinesRevenues from the sale of wind turbines include the production, delivery and installation of wind turbines. To a limited degree Senvion sells single components and spare parts of wind turbines.
The production, delivery and installation of wind turbines consist principally of fixed price contracts. If the outcome of such a contract can be reliably measured, in accordance with IAS 11, revenues associated with the construction contract is recognized by reference to the stage of completion of the contract activity at year end (the percentage of completion method). The outcome of a construction contract can be estimated reliably when:
The total contract revenues can be measured reliably, It is probable that the economic benefits associated with the contract will flow to the entity, The costs to complete the contract and the stage of completion can be measured reliably, and The contract costs attributable to the contract can be clearly identified and measured reliably
so that actual contract costs incurred can be compared with prior estimates.
When the outcome of a construction cannot be estimated reliably (generally during early stages of a contract), contract revenues are recognized only to the extent of costs incurred that are expected to be recoverable.
Contract revenues correspond to the initial amount of revenues agreed in the contract and any variations in contract work, claims and incentive payments to the extent that it is probable that they will result in revenues, and they can be reliably measured.
The accounting policy for the recognition of revenues and the method to determine the stage of completion of the contract for the sale of wind turbines is as follows:
22 23Notes to the consolidated financial statements

– Onshore wind turbinesIn applying the percentage of completion method, revenues recognized correspond to the total contract revenues multiplied by the degree of completion measured based on achievement of defined milestones. Senvion identified the following individual milestones which are significant to the overall completion of the contract.
Milestone DescriptionTransit Components are dispatched to site individuallyDelivery on site Components arrive at site and are completeInstallation Wind energy turbine is erected and installation work performed.
Wind energy turbine is connected to GridCommissioning Test run period start, sign-off on full erection by the clientFinal acceptance All remaining work is completed
Revenues recognized under this milestone-method correspond with the value created at this step in the process of an onshore wind farm project.
Cost incurred which relate to future activity or cost for projects which have not yet been dispatched to site are capitalized as inventories (work-in-progress).
– Offshore wind turbinesIn applying the percentage of completion method, revenues recognized correspond to the total contract revenues multiplied by the actual completion rate based on the proportion of total contract costs incurred to date and the estimated total contract costs (cost-to-cost method). Contract costs include costs that relate directly to the specific contract and costs that are attributable to contract activity in general and can be allocated to the contract. Costs that relate directly to a specific contract comprise: site labor costs (including site supervision); costs of materials used in construction; costs of design, and technical assistance that is directly related to the contract.
As offshore wind turbine projects significantly differ from onshore wind turbine projects in terms of contractual arrangements, installation and progress risks, financing and term of production and construction, logistic and environmental risk, the cost-to-cost method most reliably reflects actual progress towards completion.
Projects are presented in the statement of financial position as gross amount due from or to customers for contract work as an asset. If the revenues recorded exceed the invoiced instalments, the contract will be presented as an asset. If the invoiced instalments exceed the revenues recorded, the contract will be presented as a liability.
Single components and spare partsRevenues from single components and spare parts are recognized in accordance with IAS 18. They are regarded as sold when the significant risks and returns have been transferred to the buyer. For conditional exchanges, revenues are recognized only when all the significant conditions are satisfied.
License, electricity and service and maintenanceRevenues from licenses and electricity are also treated according to IAS 18. License revenues are generated from volume-based licenses. Revenues from service and maintenance contracts are recognized as the respective services are rendered; advance payments are deferred.
Interest incomeInterest income is recorded using the effective interest rate (EIR). EIR is the rate that exactly discounts the estimated future cash payments or receipts over the expected life of the financial instrument or a shorter period, where appropri-ate, to the net carrying amount of the financial asset or liability at initial recognition of the financial instrument.
4.12 Income tax expense
Current income taxCurrent income tax assets and liabilities for the current period are measured at the amount expected to be recovered from or paid to the tax authorities. The tax rates and tax laws used to compute the amount are those that are enacted or substantively enacted, at the reporting date in the countries where the Group operates and generates taxable income.
Deferred taxDeferred taxes are recognized using the liability method. According to this method deferred taxes are generally recognized on temporary differences between the tax bases of assets and liabilities and their carrying amounts for financial reporting purposes.
Deferred tax liabilities are recognized for all taxable temporary differences, except:
When the deferred tax liability arises from the initial recognition of goodwill or of an asset or liability in a transaction that is not a business combination and, at the time of the transaction, affects neither the accounting profit nor taxable profit or loss
In respect of taxable temporary differences associated with investments in subsidiaries, associates and interests in joint ventures, where the timing of the reversal of the temporary differences can be controlled and it is probable that the temporary differences will not reverse in the foreseeable future
Deferred tax assets are recognized for all deductible temporary differences, carry forward of unused tax credits and unused tax losses, to the extent that it is probable that taxable profit will be available against which the deductible temporary differences, and the carry forward of unused tax credits and unused tax losses can be utilized, except:
When the deferred tax asset relating to the deductible temporary difference arises from the initial recognition of an asset or liability in a transaction that is not a business combination and, at the time of the transaction, affects neither the accounting profit nor taxable profit or loss
In respect of deductible temporary differences associated with investments in subsidiaries, associates and interests in joint ventures, deferred tax assets are recognized only to the extent that it is probable that the temporary differences will reverse in the foreseeable future and taxable profit will be available against which the temporary differences can be utilized
24 25Notes to the consolidated financial statements
The carrying amount of deferred tax assets is reviewed at each reporting date and reduced to the extent that it is no longer probable that sufficient taxable profit will be available to allow all or part of the deferred tax asset to be utilized. Unrecognized deferred tax assets are reassessed at each reporting date and are recognized to the extent that it has become probable that future taxable profits will allow the deferred tax asset to be recovered.
Deferred tax assets and liabilities are measured at the tax rates that are expected to apply in the year when the asset is realized or the liability is settled, based on tax rates (and tax laws) that have been enacted or substantively enacted at the reporting date.
Deferred tax relating to items recognized outside profit or loss is recognized outside profit or loss. Deferred tax items are recognized in correlation to the underlying transaction either in other comprehensive income or directly in equity.
Deferred tax assets and deferred tax liabilities are offset if a legally enforceable right exists to set off current tax assets against current income tax liabilities and the deferred taxes relate to the same taxable entity and the same taxation authority.
Tax benefits acquired as part of a business combination, but not satisfying the criteria for separate recognition at that date, are recognized subsequently if new information about facts and circumstances change.
4.13 Borrowing costsBorrowing costs directly attributable to the acquisition, construction or production of an asset that necessarily takes a substantial period of time to get ready for its intended use or sale are capitalized as part of the cost of the asset. All other borrowing costs are expensed in the period in which they occur. Borrowing costs consist of interest and other costs that the Group incurs in connection with the borrowing of funds.
The Group considers assets with a construction or production term beyond 12 months as qualifying assets. For the purpose of determining the amount of borrowing cost eligible for capitalization when funds are borrowed generally, the Group computes a weighted average of borrowing cost, which is then applied to qualifying assets as a capitalization rate. The weighted average of borrowing cost is determined for each subsidiary individually when this is appropriate.
4.14 Government grants (investment subsidies)Government grants are recognized depending on the nature of the subsidized expenses. Insofar as subsidies relate to capitalized assets, the grants received serve to reduce the cost of the subsidized assets. Grants provided as an ex-penditure allowance are recognized in the consolidated income statement of the financial year in which the subsidized expenses are incurred.
4.15 Transactions in foreign currenciesThe Group’s financial statements are presented in Euros, which is also the parent company’s functional currency. For each entity the Group determines the functional currency and items included in the financial statements of each entity are measured using that functional currency.
Transactions and balancesTransactions in foreign currencies are initially recorded by Senvion and the subsidiaries at their respective functional currency spot rates prevailing at the date the transaction first qualifies for recognition. Monetary assets and liabilities denominated in foreign currencies are translated at the functional currency spot rate of exchange ruling at the reporting date. Differences arising on settlement or translation of monetary items are recognized in profit or loss.
Non-monetary items that are measured in terms of historical cost in a foreign currency are translated using the ex-change rates at the dates of the initial transactions.
Group companiesOn consolidation, the assets and liabilities of foreign operations are translated into Euro at the rate of exchange pre-vailing at the reporting date and their income statements are translated at the monthly average exchange rates. Fair value adjustments to the carrying amounts of assets and liabilities arising on the acquisition of foreign operations are treated as assets and liabilities of the foreign operation and translated at the spot rate of exchange at the reporting date. The exchange differences arising on translation for consolidation are recognized in OCI. On disposal of a foreign operation, the component of OCI relating to that particular foreign operation is recognized in profit or loss.
Any goodwill arising on the acquisition of a foreign operation and any fair value adjustments to the carrying amounts of assets and liabilities arising on the acquisition are treated as assets and liabilities of the foreign operation and translated at the spot rate of exchange at the reporting date.
4.16 Reorganization expensesSenvion discloses reorganization expenses separately by virtue of their nature, size or incidence to allow a better understanding of the underlying performance of the Group (refer to Note 6.5 Reorganization expenses).
4.17 Share-based paymentsWhen participation rights are granted to employees of the Group by an entity outside the Group, Senvion accounts for these transactions as equity-settled-plans when
The participation rights granted are its own equity instruments, or Senvion has no obligation to settle the share-based payment transaction.
The cost of equity-settled transactions is determined by the fair value at the date when the grant is made using an appropriate valuation model (Black-Scholes Valuation). Expense is recognized based on the fair value so determined and the expectation of how many awards will ultimately vest. Reference is made to Note 10 Related parties.
4.18 Financial instrumentsA financial instrument is any contract that gives rise to a financial asset to one entity and a financial liability or equity instrument of another entity. Financial instruments are recognized as soon as a Senvion company becomes a party to a financial instrument. Financial assets are recognized on delivery, i.e. the date of order fulfilment. Derivative financial instruments are recognized at the trade date. Financial assets and financial liabilities are generally reported separately; they are only offset if the reporting entity has a right to offset and the intention to settle on a net basis.
26 27Notes to the consolidated financial statements

Financial instruments consist of cash and cash equivalents, receivables, equity instruments held in other companies (i. e. shares in project corporations) and other financial assets as well as financial liabilities and loans, insofar as these are based on contracts. The initial recognition of financial assets is at fair value plus directly attributable transaction costs, insofar as the financial assets are not recognized at fair value through profit and loss. Subsequent measurement is at fair value or amortized cost using the effective interest rate, depending on the designation of the individual financial instruments to the IAS 39 categories.
Financial liabilities are carried at fair value less transaction costs on initial recognition and at amortized cost using the effective interest rate method in subsequent measurement.
Financial assets are derecognized if the rights to the cash flows resulting from the assets have expired or substantially all of the risks have been transferred to a third party such that the criteria for derecognition are met. Financial liabilities are derecognized if the relevant obligations have expired or been cancelled.
Financial assets and financial liabilities are offset and the net amount is reported in the consolidated statement of fin-ancial position if there is a currently enforceable legal right to offset the recognized amounts and there is an intention to settle on a net basis, to realize the assets and settle the liabilities simultaneously.
Derivative financial instruments used to hedge foreign exchange and interest rate risks. Derivative financial instruments are carried at fair value. The recognition of changes in the fair value of derivative financial instruments depends on whether these instruments are deployed as hedging instruments and the conditions for hedge accounting in accordance with IAS 39 are met.
If these conditions are not met despite the existence of a hedging relationship, the derivative financial instruments are allocated to the category “at fair value through profit and loss” and the changes in fair value are recognized directly in income.
The effective portion of the change in the fair value of a derivative financial instrument which was classified as a hedging instrument and which meets the definition of a cash flow hedge is recognized in other comprehensive income, net of tax. The ineffective portion is recognized in profit or loss. The effective portion is recognized in profit or loss when the hedged item is also recognized in profit or loss.
The Group measures financial instruments such as derivatives at fair value at each reporting date. Fair value related disclosures for financial instruments that are measured at fair value or where fair values are disclosed, are summarized in the Notes 8.2 Information on the nature and extent of risks associated with financial instruments and 8.3 Information on significance of financial instruments for the consolidated financial statement.
Fair value is the price that would be received to sell an asset or paid to transfer a liability in an orderly transaction between market participants at the measurement date. The fair value measurement is based on the presumption that the transaction to sell the asset or transfer the liability takes place either in the principal market for the asset or liability or in the absence of a principal market, in the most advantageous market for the asset or liability. The principal or the most advantageous market must be accessible by the Group.
The fair value of an asset or a liability is measured using the assumptions that market participants would use when pricing the asset or liability, assuming that market participants act in their economic best interest.
The Group uses valuation techniques that are appropriate in the circumstances and for which sufficient data are available to measure fair value, maximizing the use of relevant observable inputs and minimizing the use of unobservable inputs.
Assets and liabilities for which fair value is measured or disclosed in the financial statements are categorized within the fair value hierarchy, described as follows, based on the lowest level input that is significant to the fair value measurement as a whole:
Level 1 — Quoted (unadjusted) market prices in active markets for identical assets or liabilities Level 2 — Valuation techniques for which the lowest level input that is significant to the fair value measurement
is directly or indirectly observable Level 3 — Valuation techniques for which the lowest level input that is significant to the fair value measurement
is unobservable.
For assets and liabilities that are recognized in the financial statements on a recurring basis, the Group determines whether transfers have occurred between levels in the hierarchy by re-assessing categorization (based on the lowest level input that is significant to the fair value measurement as a whole) at the end of each reporting period.
4.19 Use of assumptionsThe preparation of these consolidated financial statements requires the Group’s management to make estimates and assumptions that form the basis for the value of assets and liabilities and income and expenses in the respective financial years. Key estimates and assumptions relate to impairment tests (refer to Note 4.6 Impairment of property, plant and equipment and intangible assets), warranty provisions (refer to Note 5.4.2 Provisions), the realization of revenues according to the percentage of completion method (refer to Note 5.1.2 Gross amount due from/to customers for contract work as an asset/as a liability) and income taxes (refer to Note 5.2.3 Income taxes) and are described below:
Impairment tests The recoverable amount used in the impairment test is most sensitive to the discount rate used for the discounted cash flow model as well as the expected future cash inflows and the growth rate used for extrapolation purposes. The key assumptions used to determine the recoverable amount for the different cash generating units are disclosed and further explained in Note 4.6 Impairment of property, plant and equipment and intangible assets.
Warranty provisions Specific warranty provisions include expenses for material and labor, which will be incurred to repair individual defects which fall within the respective warranty period. The amount of cost provided is subject to estimates, such as the population of affected turbines as well as the severance and complexity of technical defects.
General warranty provisions are accounted for based on a historical 5 year average cost rate per turbine class. For more information, refer to Note 5.4.2 Provisions.
28 29Notes to the consolidated financial statements

Revenues according to the percentage of completion method The percentage of completion and the revenues to recognize are determined on the basis of a large number of estimates, such as estimated future cost to complete a project. Consequently, the Group has implemented an internal financial budgeting and reporting system to adequately measure incurred and future cost required to completion. The Group reviews monthly the estimates of contract revenue and contract costs as the contract progresses (refer to Note 5.1.2 Gross amount due from/to customers for contract work as an asset/as a liability).
Judgment has also been exercised in determining the percentage of completion allocated to each individual milestone. In determining the percentage of completion per milestone event, which is then applied to all projects, management has considered common technical risks arising during production, logistics, installation and construction as well as contractual arrangements with its customers.
Income taxes Uncertainties exist with respect to the interpretation of complex tax regulations, changes in tax laws, and the amount and timing of future taxable income. Given the wide range of international business relationships, differences arising between the actual results and the assumptions made, or future changes to such assumptions, could necessitate future adjustments to tax income and expense already recorded. The Group establishes provisions, based on reasonable estimates, for possible consequences of audits by the tax authorities of the respective countries in which it operates. The amount of such provisions is based on various factors, such as experience of previous tax audits and differing interpretations of tax regulations by the taxable entity and the responsible tax authority (refer to Note 5.2.3 Income taxes).
4.20 Information on the consolidated statement of cash flowsThe cash and cash equivalents shown in the consolidated statement of cash flows contain cash and bank balances. Short-term bank liabilities are deducted.
The indirect method was used to calculate the cash flow from operating activity. The consolidated statements of cash flows start with result before income taxes from continuing and discontinued operations. The cash outflows from interest and taxes were allocated to ongoing business activity and recognized separately there.
4.21 New accounting standards and their application Financial reporting at Senvion GmbH in accordance with the IFRS is based on the IASB accounting standards adopted by the European Commission in the context of the endorsement process for the European Union, in accordance with Regulation (EC) no. 1606/2002. The new IFRSs and amendments to existing IFRSs published by the IASB are mandatory only following a corresponding resolution by the Commission as part of the endorsement process.
The following standards and interpretations published by the IASB and IFRIC are not yet mandatory because they have not yet been endorsed by the EU or the date of their first mandatory application has not yet been reached and are also not early adopted by the Group:
Standards/interpretationsMandatory application
Endorsement by European Commission
Expected Effects
IFRS 9 Financial InstrumentsExpected:
1 January 2018 NoEffects are still
analyzed
IFRS 11
Amendment: Accounting for Acquisition of Interests in Joint Operations 1 January 2016 Yes No effects
IFRS 15Revenue from Contracts with Customers
Expected: 1 January 2018 No
Effects are still being analyzed
IFRS 16 Leases 1 January 2019 NoEffects are still being analyzed
IAS 1 Disclosure Initiative 1 January 2016 Yes No material effects
IAS 12Recognition of Deferred Tax Assets for Unrealised Losses 1 January 2017 No No material effects
IAS 16 and IAS 38
Property, Plant and Equipment and Intangible asstes 1 January 2016 Yes No material effects
Annual Improvements
Improvements to IFRS (2012 – 2014) 1 January 2016 Yes No material effects
IFRS 15 – will replace all existing IFRS guidance on revenue recognition, including IAS 11. It introduces a five-step approach to revenue recognition and specific new guidance on when revenues can be recognized in a way similar to the percentage of completion approach currently used by the Group. Hence, this new guidance is most relevant to the Group and needs to be analyzed in detail. Based on its preliminary assessment the Group expects that it will still be permitted to recognize revenues over time under the new standard.
IFRS 16 – will replace current IAS 17. The new standard no longer distinguishes between finance and operating leases for lessees, but rather requires that most leases are recognized as assets and liabilities at inception, subject to some limited exceptions. Refer to Note 7 “Contingent liabilities and other financial obligations” on the Group’s current ex-posure to operating leases that may need to be recognized in the balance sheet under the new standard.
IFRS 9 – Financial Instruments will replace IAS 39 Financial Instruments: Recognition and Measurement and all previous versions of IFRS 9. IFRS 9 brings together all three aspects of the accounting for financial instruments project: classification and measurement, impairment and hedge accounting. The Group plans to adopt the new standard on the required effective date. All three aspects of IFRS 9 are still being analyzed by the Group, especially regarding the impairment requirements of IFRS 9. The Group expects changes from first adoption to its allowances and continues to perform a detailed assessment to determine the extent and impact of the revised requirements, although such is currently estimated not to materially affect profit & loss and equity.
30 31Notes to the consolidated financial statements
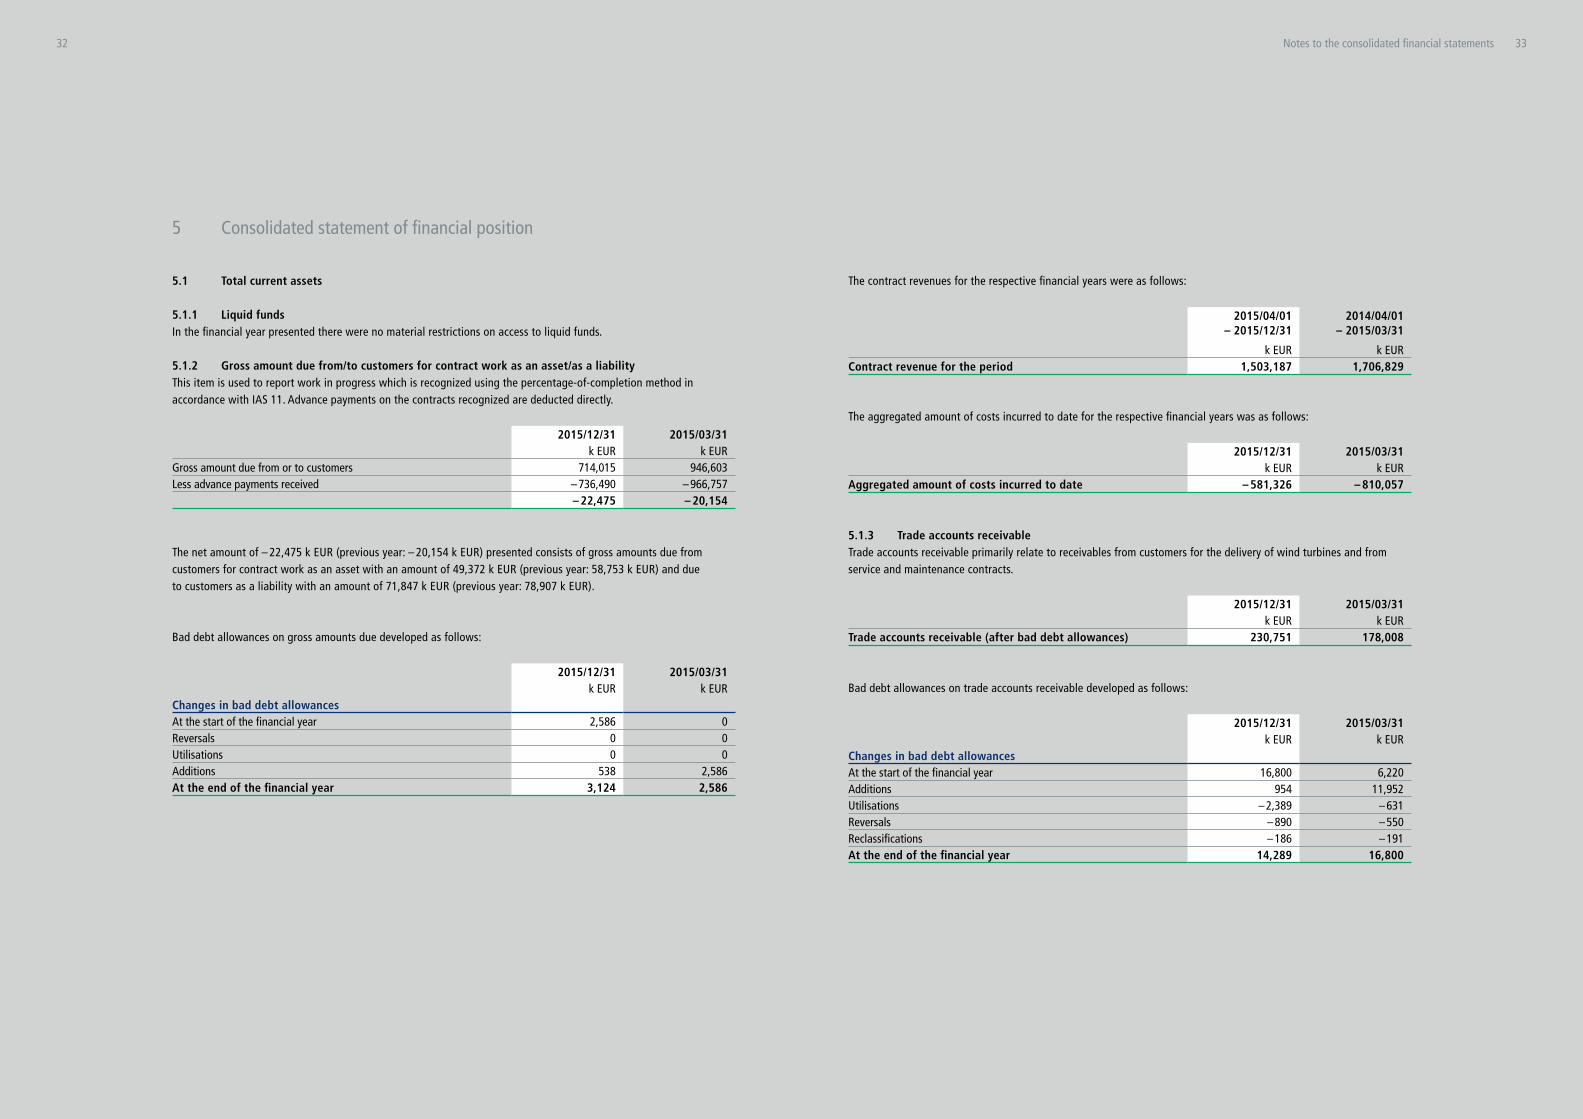
5.1 Total current assets
5.1.1 Liquid fundsIn the financial year presented there were no material restrictions on access to liquid funds.
5.1.2 Gross amount due from/to customers for contract work as an asset/as a liabilityThis item is used to report work in progress which is recognized using the percentage-of-completion method in accordance with IAS 11. Advance payments on the contracts recognized are deducted directly.
2015/12/31 2015/03/31
k EUR k EURGross amount due from or to customers 714,015 946,603Less advance payments received – 736,490 – 966,757 – 22,475 – 20,154
The net amount of – 22,475 k EUR (previous year: – 20,154 k EUR) presented consists of gross amounts due from customers for contract work as an asset with an amount of 49,372 k EUR (previous year: 58,753 k EUR) and due to customers as a liability with an amount of 71,847 k EUR (previous year: 78,907 k EUR).
Bad debt allowances on gross amounts due developed as follows:
2015/12/31 2015/03/31
k EUR k EURChanges in bad debt allowances At the start of the financial year 2,586 0Reversals 0 0Utilisations 0 0Additions 538 2,586At the end of the financial year 3,124 2,586
The contract revenues for the respective financial years were as follows:
2015/04/01 – 2015/12/31
2014/04/01 – 2015/03/31
k EUR k EURContract revenue for the period 1,503,187 1,706,829
The aggregated amount of costs incurred to date for the respective financial years was as follows:
2015/12/31 2015/03/31
k EUR k EURAggregated amount of costs incurred to date – 581,326 – 810,057
5.1.3 Trade accounts receivableTrade accounts receivable primarily relate to receivables from customers for the delivery of wind turbines and from service and maintenance contracts.
2015/12/31 2015/03/31
k EUR k EURTrade accounts receivable (after bad debt allowances) 230,751 178,008
Bad debt allowances on trade accounts receivable developed as follows:
2015/12/31 2015/03/31
k EUR k EURChanges in bad debt allowances At the start of the financial year 16,800 6,220Additions 954 11,952Utilisations – 2,389 – 631Reversals – 890 – 550Reclassifications – 186 – 191At the end of the financial year 14,289 16,800
5 Consolidated statement of financial position
32 33Notes to the consolidated financial statements

The maturity structure of trade accounts receivable was as follows:
Not past due as of the end of the reporting period
nor impaired
As of the end of the reporting period past due as follows
Less than
30 daysBetween 30
and 180 daysMore than
180 daysas of 2015/12/31 k EUR k EUR k EUR k EUR k EURTrade accounts receivable before bad debt allowances 245,040 183,487 10,127 18,517 32,909Thereof past due but not impaired 43,365 – 10,127 18,247 14,991Thereof past due and impaired 18,188 – 0 270 17,918Bad debt allowances 14,289 0 0 135 14,154Trade Accounts receivable after bad debt allowances 230,751 183,487 10,127 18,382 18,755
as of 2015/03/31 k EUR k EUR k EUR k EUR k EURTrade accounts receivable before bad debt allowances 194,808 148,155 11,598 22,990 12,065Thereof past due but not impaired 27,095 – 11,535 11,194 4,366Thereof past due and impaired 19,558 – 63 11,796 7,699Bad debt allowances 16,800 33 52 10,295 6,420Trade Accounts receivable after bad debt allowances 178,008 148,122 11,546 12,695 5,645
In the case of the trade accounts receivable that were neither impaired nor past due, there was no evidence of the debtors being unable to meet their payment obligations as of the reporting date. For further information on the treatment of financial risks refer to Note 8.2 Information on the nature and extent of risks associated with financial instruments.
Senvion GmbH requires collateral from its customers depending on the outcome of credit checks. Collateral is generally requested after signature of the purchase contract in the form of bank guarantees or warranties for the purchase price less any advance payments made. Accordingly, the nominal value of the collateral received typically exceeds the current level of accounts receivable. As of 31 December 2015, the value of the collateral received was 2,845.25 m EUR (previous year: 2,700.69 m EUR).
There were no trade accounts receivables whose terms were renegotiated and that would otherwise have been overdue or impaired as of 31 December 2015.
5.1.4 Receivables from related parties
This item is composed of as follows:
2015/12/31 2015/03/31
k EUR k EURSenvion Holding GmbH 199,504 0Suzlon Energy Australia Pty Ltd 0 31,806Other 0 203 199,504 32,009
In July 2015 Senvion GmbH granted Senvion Holding GmbH, its direct parent entity, a loan of 177.3 m EUR with a maturity until December 2016. Accrued interest from this loan amounts to 6,137 k EUR as of 31 December 2015.
5.1.5 Inventories
This item is composed of as follows:
2015/12/31 2015/03/31
k EUR k EURRaw materials and supplies 269,191 372,212Work in progress 145,862 210,498 415,053 582,710
Valuation allowances on inventories were as follows:
2015/12/31 2015/03/31
k EUR k EURInventories before valuation allowances 442,006 595,388Thereof not impaired 398,381 571,117Thereof impaired 43,625 24,271Valuation allowance – 26,953 – 12,678 415,053 582,710
Expenses for raw materials and supplies amounted to 946,320 k EUR (previous year: 990,387 k EUR; 9-months comparative period 2014: 724,881 k EUR).
34 35Notes to the consolidated financial statements

5.1.6 Other current assets
This item is composed of as follows:
2015/12/31 2015/03/31
k EUR k EUROther financial assets Derivative financial instruments 9,136 0Others 2,421 2,234 11,557 2,234
Other miscellaneous assets Receivables from other taxes 44,226 33,075Advance payments on inventories 20,077 30,155Deferred financing fees for guarantees 0 3,662Others 23,013 29,268 87,316 96,160
5.2 Total non-current assets
5.2.1 Other intangible assetsIn the short financial year 2015 research and development costs amounted to 48,683 k EUR (previous year: 57,505 k EUR; 9-months comparative period 2014: 39,530 k EUR).
Of the development costs 31,834 k EUR (previous year: 38,767 k EUR; 9-months comparative period 2014: 26,007 k EUR) were capitalized in the short financial year 2015. Amortization of capitalized development costs amounted to 11,346 k EUR (previous year: 14,486 k EUR; 9-months comparative period 2014: 12,016 k EUR) in the short financial year 2015.
5.2.2 Property, plant and equipmentLand and buildings relate primarily to the Group’s own production sites and administrative buildings. Technical equip-ment and machinery primarily relates to facilities for the production of wind turbines. No own work was capitalized in either the current year or the previous years presented.
At the reporting date, assets under construction relate primarily to expenses for the construction of rotor blade molds.
Land and buildings of Senvion GmbH in the amount of 46,678 k EUR serve as collateral in the financial years presented (refer to Note 5 Long-term loans).
36 37Notes to the consolidated financial statements
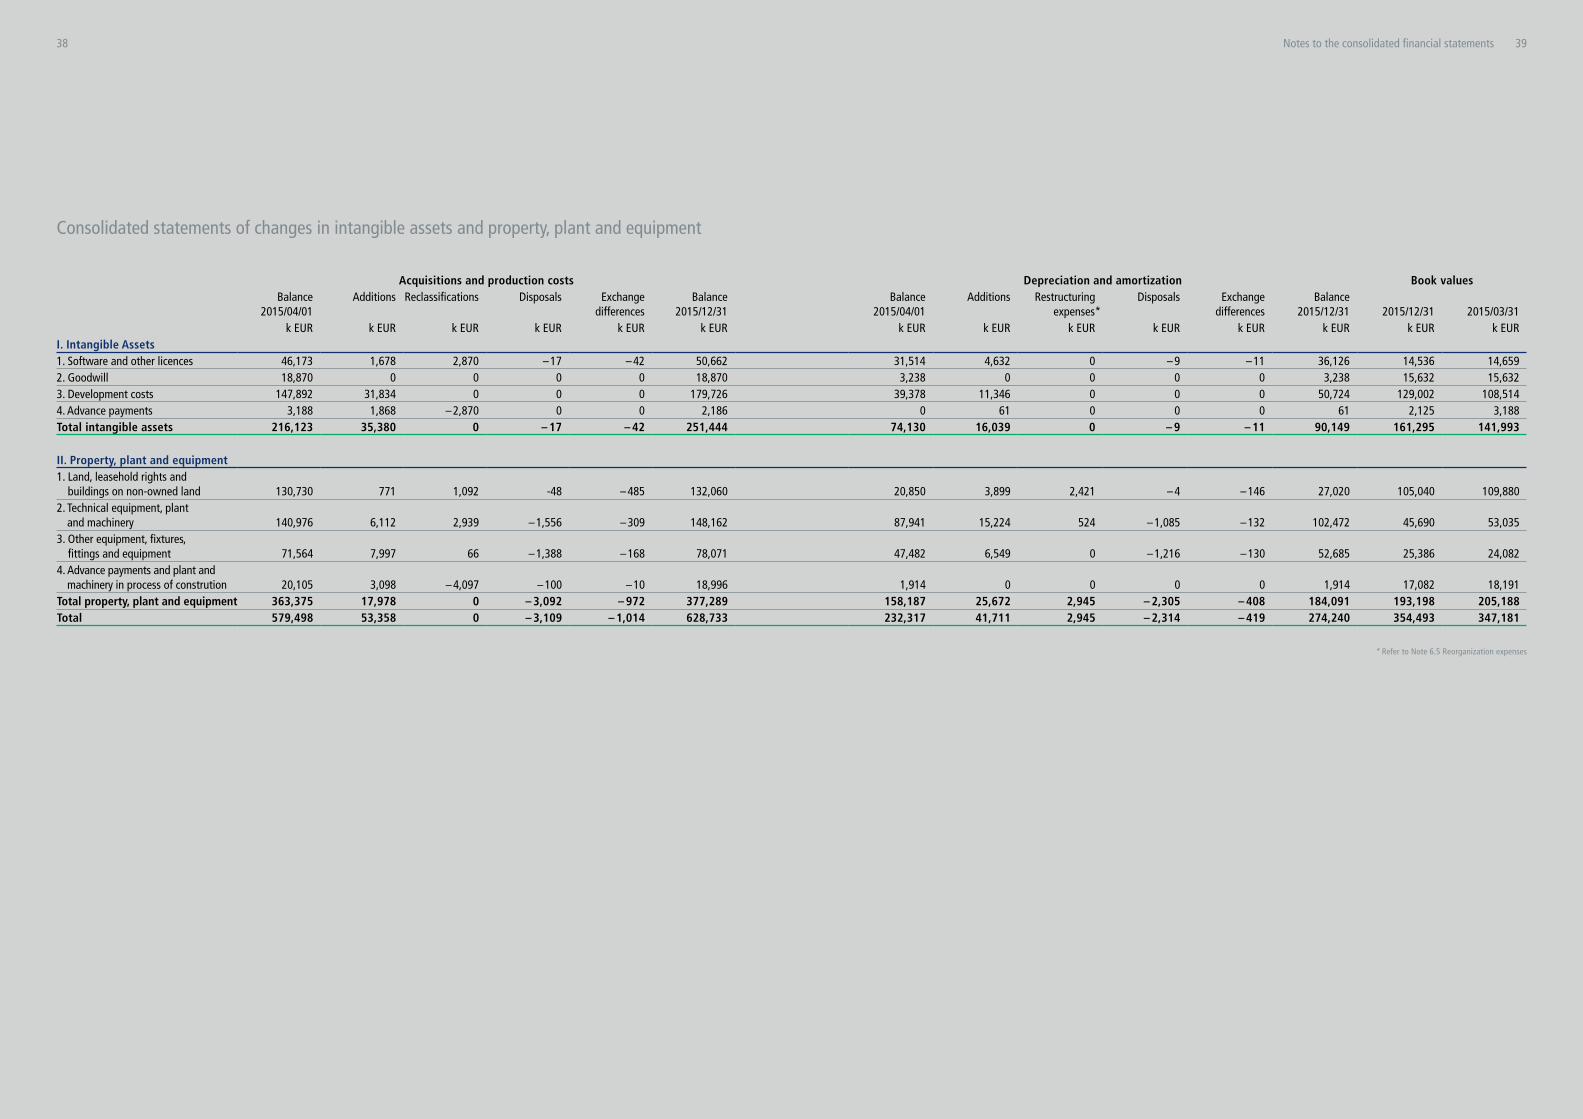
Acquisitions and production costs Depreciation and amortization Book values
Balance2015/04/01
Additions Reclassifications Disposals Exchangedifferences
Balance2015/12/31
Balance2015/04/01
Additions Restructuringexpenses*
Disposals Exchangedifferences
Balance2015/12/31 2015/12/31 2015/03/31
k EUR k EUR k EUR k EUR k EUR k EUR k EUR k EUR k EUR k EUR k EUR k EUR k EUR k EURI. Intangible Assets1. Software and other licences 46,173 1,678 2,870 – 17 – 42 50,662 31,514 4,632 0 – 9 – 11 36,126 14,536 14,6592. Goodwill 18,870 0 0 0 0 18,870 3,238 0 0 0 0 3,238 15,632 15,6323. Development costs 147,892 31,834 0 0 0 179,726 39,378 11,346 0 0 0 50,724 129,002 108,5144. Advance payments 3,188 1,868 – 2,870 0 0 2,186 0 61 0 0 0 61 2,125 3,188Total intangible assets 216,123 35,380 0 – 17 – 42 251,444 74,130 16,039 0 – 9 – 11 90,149 161,295 141,993 II. Property, plant and equipment1. Land, leasehold rights and
buildings on non-owned land 130,730 771 1,092 -48 – 485 132,060 20,850 3,899 2,421 – 4 – 146 27,020 105,040 109,8802. Technical equipment, plant
and machinery 140,976 6,112 2,939 – 1,556 – 309 148,162 87,941 15,224 524 – 1,085 – 132 102,472 45,690 53,0353. Other equipment, fixtures,
fittings and equipment 71,564 7,997 66 – 1,388 – 168 78,071 47,482 6,549 0 – 1,216 – 130 52,685 25,386 24,0824. Advance payments and plant and
machinery in process of constrution 20,105 3,098 – 4,097 – 100 – 10 18,996 1,914 0 0 0 0 1,914 17,082 18,191Total property, plant and equipment 363,375 17,978 0 – 3,092 – 972 377,289 158,187 25,672 2,945 – 2,305 – 408 184,091 193,198 205,188Total 579,498 53,358 0 – 3,109 – 1,014 628,733 232,317 41,711 2,945 – 2,314 – 419 274,240 354,493 347,181
* Refer to Note 6.5 Reorganization expenses
Consolidated statements of changes in intangible assets and property, plant and equipment
38 39Notes to the consolidated financial statements
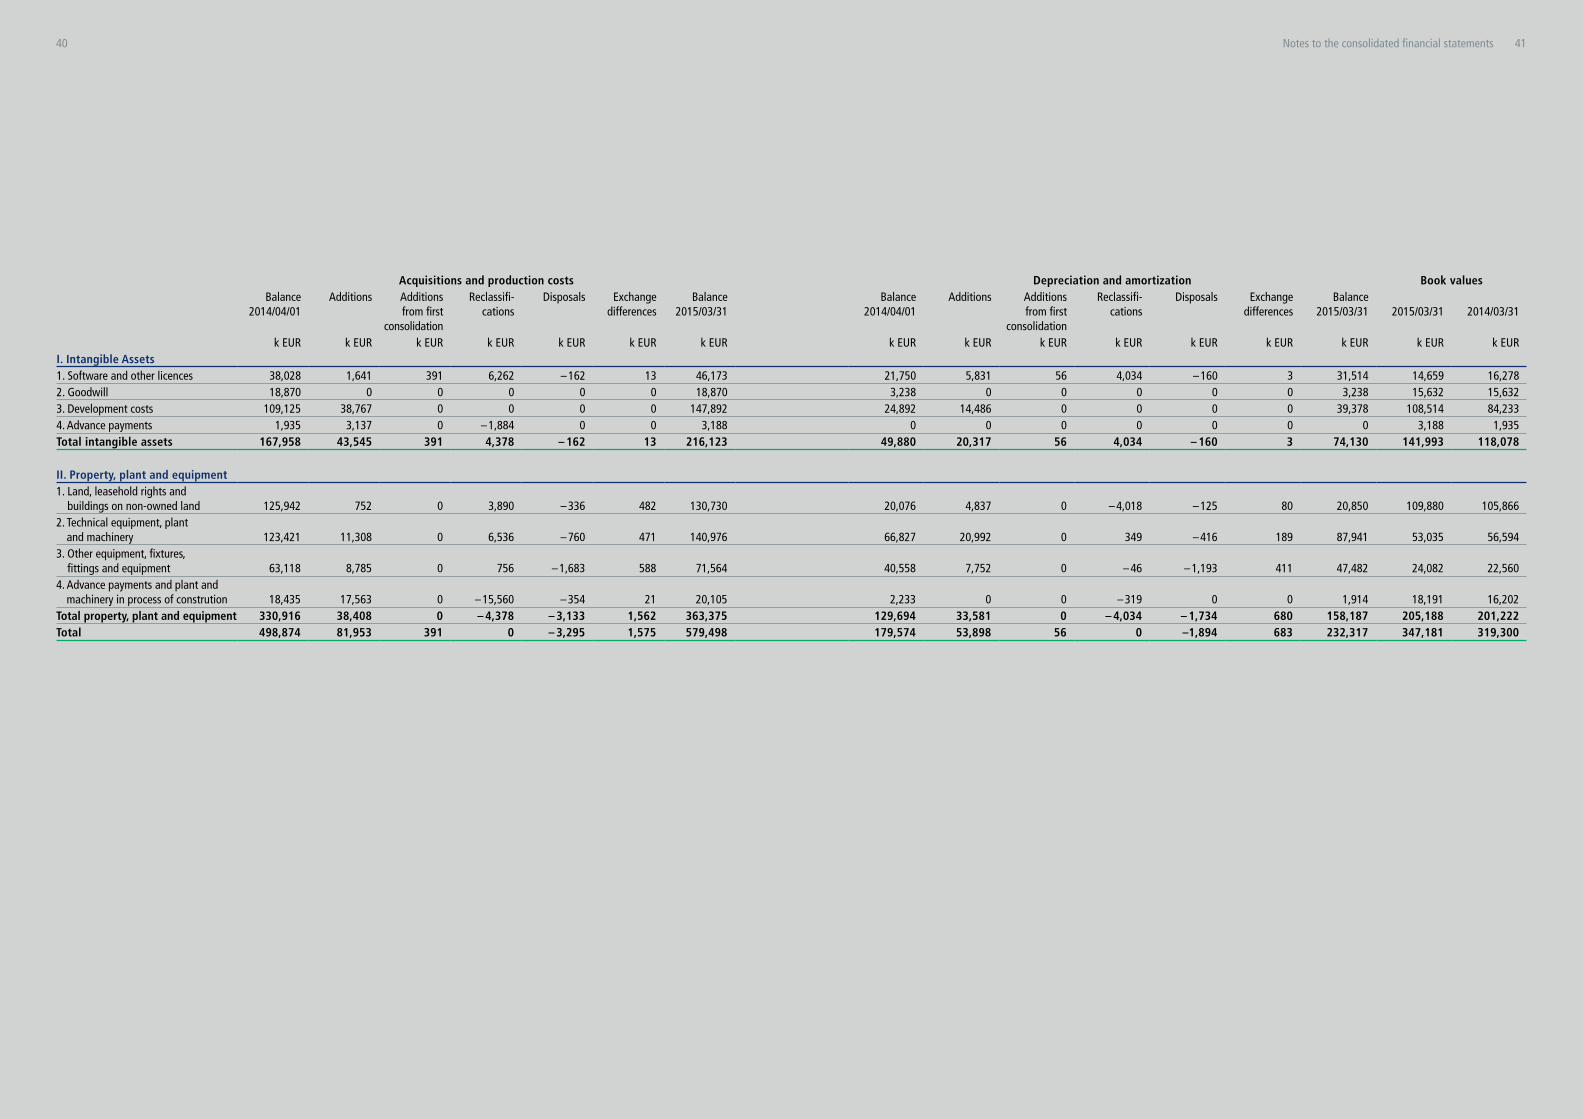
Acquisitions and production costs Depreciation and amortization Book values
Balance2014/04/01
Additions Additions from first
consolidation
Reclassifi-cations
Disposals Exchangedifferences
Balance2015/03/31
Balance2014/04/01
Additions Additions from first
consolidation
Reclassifi-cations
Disposals Exchangedifferences
Balance2015/03/31 2015/03/31 2014/03/31
k EUR k EUR k EUR k EUR k EUR k EUR k EUR k EUR k EUR k EUR k EUR k EUR k EUR k EUR k EUR k EURI. Intangible Assets 1. Software and other licences 38,028 1,641 391 6,262 – 162 13 46,173 21,750 5,831 56 4,034 – 160 3 31,514 14,659 16,2782. Goodwill 18,870 0 0 0 0 0 18,870 3,238 0 0 0 0 0 3,238 15,632 15,6323. Development costs 109,125 38,767 0 0 0 0 147,892 24,892 14,486 0 0 0 0 39,378 108,514 84,2334. Advance payments 1,935 3,137 0 – 1,884 0 0 3,188 0 0 0 0 0 0 0 3,188 1,935Total intangible assets 167,958 43,545 391 4,378 – 162 13 216,123 49,880 20,317 56 4,034 – 160 3 74,130 141,993 118,078
II. Property, plant and equipment1. Land, leasehold rights and
buildings on non-owned land 125,942 752 0 3,890 – 336 482 130,730 20,076 4,837 0 – 4,018 – 125 80 20,850 109,880 105,8662. Technical equipment, plant
and machinery 123,421 11,308 0 6,536 – 760 471 140,976 66,827 20,992 0 349 – 416 189 87,941 53,035 56,5943. Other equipment, fixtures,
fittings and equipment 63,118 8,785 0 756 – 1,683 588 71,564 40,558 7,752 0 – 46 – 1,193 411 47,482 24,082 22,5604. Advance payments and plant and
machinery in process of constrution 18,435 17,563 0 – 15,560 – 354 21 20,105 2,233 0 0 – 319 0 0 1,914 18,191 16,202Total property, plant and equipment 330,916 38,408 0 – 4,378 – 3,133 1,562 363,375 129,694 33,581 0 – 4,034 – 1,734 680 158,187 205,188 201,222Total 498,874 81,953 391 0 – 3,295 1,575 579,498 179,574 53,898 56 0 –1,894 683 232,317 347,181 319,300
40 41Notes to the consolidated financial statements

5.2.3 Income taxesCurrent income tax expense in the individual countries and deferred taxes are reported as income taxes. Income tax expense is composed as follows:
2015/04/01 – 2015/12/31
2014/04/01 – 2015/03/31
2014/04/01 – 2014/12/31
k EUR k EUR k EURDeferred taxes – 3,422 – 6,769 7,496
thereof temporary differences – 5,599 – 19,194 – 3,659thereof tax loss carryforwards and tax credits 2,177 12,425 11,155
Current income taxes 24,051 25,354 8,681Current income taxes for previous years 11,426 2,609 2,514Income taxes 32,055 21,194 18,691
The corporation tax rate for companies in Germany was 15 % plus the solidarity surcharge of 5.5 % of this amount, meaning that the total corporation tax rate was 15.825 % in all periods presented. Including trade tax, the total tax rate of the Group was 29.395 % in the short financial year 2015 (previous year: 29.395 %; 9-months comparative period 2014: 29.11 %). With regard to minimum taxation, the utilization of tax loss carry forwards in Germany is restricted. There are no restrictions for a positive basis of assessment of up to 1 m EUR. No more than 60 % of any amounts exceeding this level may be reduced by offsetting against existing tax loss carry forwards in the period. Unused tax loss carry forwards are carried forward to the next period. There are no temporary restrictions to carry forward unused tax losses in German tax law.
The effects of different tax rates in Germany and abroad compared with the tax rate of the Group are presented under tax rate differences in the following reconciliations:
2015/04/01 – 2015/12/31
2014/04/01 – 2015/03/31
2014/04/01 – 2014/12/31
k EUR k EUR k EURIFRS result profit before income tax from continuing operations 102,438 52,123 47,152Expected income taxes 30,112 15,322 13,726Income taxes for previous year 368 2,609 2,514Non-deductible operating expenses 768 1,420 924Additions to/reductions in trade income tax 304 429 276Changes in tax rates 356 10 0 Ineligible foreign taxes 0 240 0 Different tax rates – 271 – 59 – 467Valuation adjustment of deferred taxes on tax loss carryforwards – 121 1,733 1,751Other tax effects 539 – 510 – 33Actual income taxes 32,055 21,194 18,691
The non-deductible operating expenses primarily result from special features of the tax regulations of the country of residence of foreign subsidiaries.
The effect of income taxes for previous years of 368 k EUR relates to current income tax expense in the amount of 11,426 k EUR and deferred tax income of 11,058 k EUR. The current income tax expenses mainly relate to the tax audit of Senvion GmbH in Germany for fiscal periods 2008 to 2012. As a result of the tax audit, the tax base of assets and liabilities was adjusted for previous years. A deferred tax asset was recorded on the temporary differences arising from the revision of tax bases for previous years with a corresponding deferred tax income being recorded.
The effect of income taxes for previous years in the amount of 2,609 k EUR in financial year 2014/2015 related in the amount of 1,500 k EUR to the finalization of the tax audit in Italy and in the amount of 1,100 k EUR to Canadian withholding tax.
42 43Notes to the consolidated financial statements

Deferred tax assets and deferred tax liabilities are composed as follows as of the respective reporting dates:
2015/04/01 – 2015/12/31
2014/04/01 – 2015/03/31
k EUR k EURDeferred tax assets Tax loss carryforwards and tax credits 3,871 6,228Provisions 31,215 40,690Inventories and receivables 0 2,024Property, plant and equipment 25 32Other 5,306 3,795Total deferred tax assets 40,417 52,769
Offsetting – 40,417 – 46,707Deferred tax assets after offsetting 0 6,062 Deferred tax liabilities Gross amounts due from customers for contract work 25,684 45,669Development costs 39,406 33,974Property, plant and equipment 576 537Other 4,654 2,801Total deferred tax liabilities 70,320 82,981
Offsetting – 40,417 – 46,707Deferred tax liabilities after offsetting 29,903 36,274
Deferred taxes include deferred tax liability of 2,555 k EUR (previous year: deferred tax assets of 351 k EUR; 9-months comparative period 2014: deferred tax liabilities of 79 k EUR) for temporary differences recognized in other comprehensive income.
Deferred taxes on tax loss carry forwards are recognized in the amount of the expected utilizable tax losses of the German and international Group companies. The key factor for determining the value of deferred tax assets is the estimated reversal of the measurement differences and the usability of the tax loss carry forwards which led to deferred tax assets. This depends on the occurrence of future taxable profit during the periods in which tax measurement differences are reversed and tax loss carry forwards can be utilized and on the reversal of temporary differences. According to the current status, tax loss carry forwards, for which deferred tax assets were recognized, can be carried forward without restriction in subsequent years in all countries where tax loss carry forwards exist.
No deferred tax assets were recognized on corporation tax losses totaling 3,965 k EUR, (previous year: 7,451 k EUR; 9-months comparative period: 11,263 k EUR) as well as trade tax losses of 39 k EUR (previous year: 203 k EUR; 9-months comparative period: 96 k EUR) due to the lack of prospects for offsetting in the near future.
According to IAS 12 deferred taxes have to be recognized for temporary differences between the tax base of invest-ments in subsidiaries, associates and interests in joint ventures and the equity of these subsidiaries, associates and joint ventures in Group accounting (so called outside basis differences) to the extent that it is probable that taxable profit will be available against which the deductible temporary differences can be utilized. As Senvion GmbH and the concerned subsidiaries qualify as limited liability companies a future reverse of these differences will mainly be tax exempt according to § 8b KStG and hence qualify as a permanent difference. According to IAS 12.39 no deferred tax liability shall be recognized for any possible temporary differences (e. g. resulting from fictitious 5 % non-deductible expenses related to tax free income from subsidiaries (§ 8b III KStG)) if the parent company is able to control that the temporary differences will not reverse in the foreseeable future. As no reversal of such temporary differences is expected, the existing deferred taxes liability related to outside basis differences of 467 k EUR were not recognized.
5.3 Non-current assets held for sale and discontinued operationsREpower North (China) Ltd. produces wind turbines for the north Chinese market. The assets and liabilities of REpower North (China) Ltd. were recognized as held for sale as a consequence of the initiated sales activities of the shares in REpower North (China) Ltd. until 30 November 2015.
During the financial year 2014/2015 the shareholders resolved to increase capital by a third investor, who is about to become the controlling shareholder through that transaction, was concluded by a shareholder resolution. A corre-sponding letter of intent with this investor was already signed in January 2015. The entry of the new investor was delayed due to legal requirements in China. The entry of the new investor occurred in December 2015. After the entry of the new investor Senvion has no longer control over REpower North (China) Ltd. Senvion retained an interest in the company, which is 10.89 %. Senvion accounts for its retained interest as an available-for-sale financial instrument, which is presented under other financial instrument.
The gain associated with the loss of control over REpower North (China) Ltd. is calculated as follows:
30 November 2015k EUR
Net assets of REpower North (China) Ltd. – 12,885Fair value of investment retained 3,938Carrying amount of non-controlling interests including attributable components of other comprehensive income 6,662Amounts recognized in other comprehensive income by the parent and reclassified to profit or loss 2,891Gain associated with loss of control 606
The fair value of the investment retained has been measured using level 3 inputs in the sense of the fair value hierarchy of IFRS 13. These level 3 inputs include the “capital increase and share transfer agreement” dated 14 December 2015 and appraisal reports prepared in conjunction with the capital increase. The fair value of the non-controlling interest in one of the subsidiaries of Senvion GmbH has been derived from a draft share transfer agreement, which was executed subsequent to the acquisition in December 2015. The subsidiary (Repower North (China) Ltd.) was deconsolidated subsequently on 30 November 2015. The amount of liquid funds in REpower North (China) Ltd. over which control was lost amounts to 5,526 k EUR.
44 45Notes to the consolidated financial statements

As of 30 November 2015 (date of loss of control) and as of 31 March 2015 the assets and liabilities of Repower North (China) were composed of as follows:
2015/11/30 2015/03/31
k EUR k EURAssets of disposal group classified as held for sale Inventories 6,425 6,742Liquid Funds 5,526 6,242Other current assets 3,075 3,477 15,026 16,461
Liabilities of disposal group classified as held for sale Advance payment received 130 322Provision and other liabilities 2,011 2,074 2,141 2,396
Cumulative other comprehensive income associated with the discontinued operationsCurrency translation differences 4,099 4,330
For the short financial year 2015, the financial year 2014/15 and the 9-months comparative period 2014 profit/loss from discontinued operations were composed as follows:
2015/04/01 – 2015/12/31
2014/04/01 – 2015/03/31
2014/04/01 – 2014/12/31
9 months 12 months 9 monthsk EUR k EUR k EUR
Income 589 3,846 3,293Expenses 1,176 2,635 2,224Earnings before taxes from discontinued operations – 587 1,211 1,069Taxes 0 0 0Earnings after taxes from discontinued operations – 587 1,211 1,069Gain associated with loss of control 606 – –Profit for the period from discontinued operations 19 1,211 1,069
5.4 Total current liabilities
5.4.1 Advance payments receivedAdvance payments from customers for orders for which no production work has been carried out are reported as advance payments received.
5.4.2 ProvisionsProvisions developed as follows in the short financial year 2015.
As of2015/04/01
Addition
Utilization
Reversal
As of 2015/12/31
k EUR k EUR k EUR k EUR k EURSpecific warranty provisions 199,567 16,997 – 49,378 0 167,186General warranty provisions 34,242 29,130 – 19,980 – 3,821 39,571Warranty provisions 233,809 46,127 – 69,358 – 3,821 206,757Other provisions 2,784 9,061 – 1,471 – 153 10,221Total provisions 236,593 55,188 – 70,829 – 3,974 216,978
Specific warranty provions as of 31 December 2015 mainly contain expected cost for technical issues with regard to offshore blades for the 6XM WTG series. In the current short financial year, cost of 13,495 k EUR in regard of this technical issue were incurred (previous year: 17,742 k EUR; 9-months comparative period 2014: 9,522 k EUR).
The development of general warranty provisions reflects the increase in the number of WTGs sold and falling within the legal 2-year warranty period.
Due to the restructuring and closure of the blade factory in Ontario, Canada a restructuring provision amounting to 3,103 k EUR was recognized according to IAS 37 within other provisions (refer to Note 6.5 Reorganization expenses).
5.4.3 Deferred incomePrepayments for revenues from service and maintenance are reported as deferred income. Straight-line amortization is applied for these deferred positions over the entire term of the rendered service.
46 47Notes to the consolidated financial statements
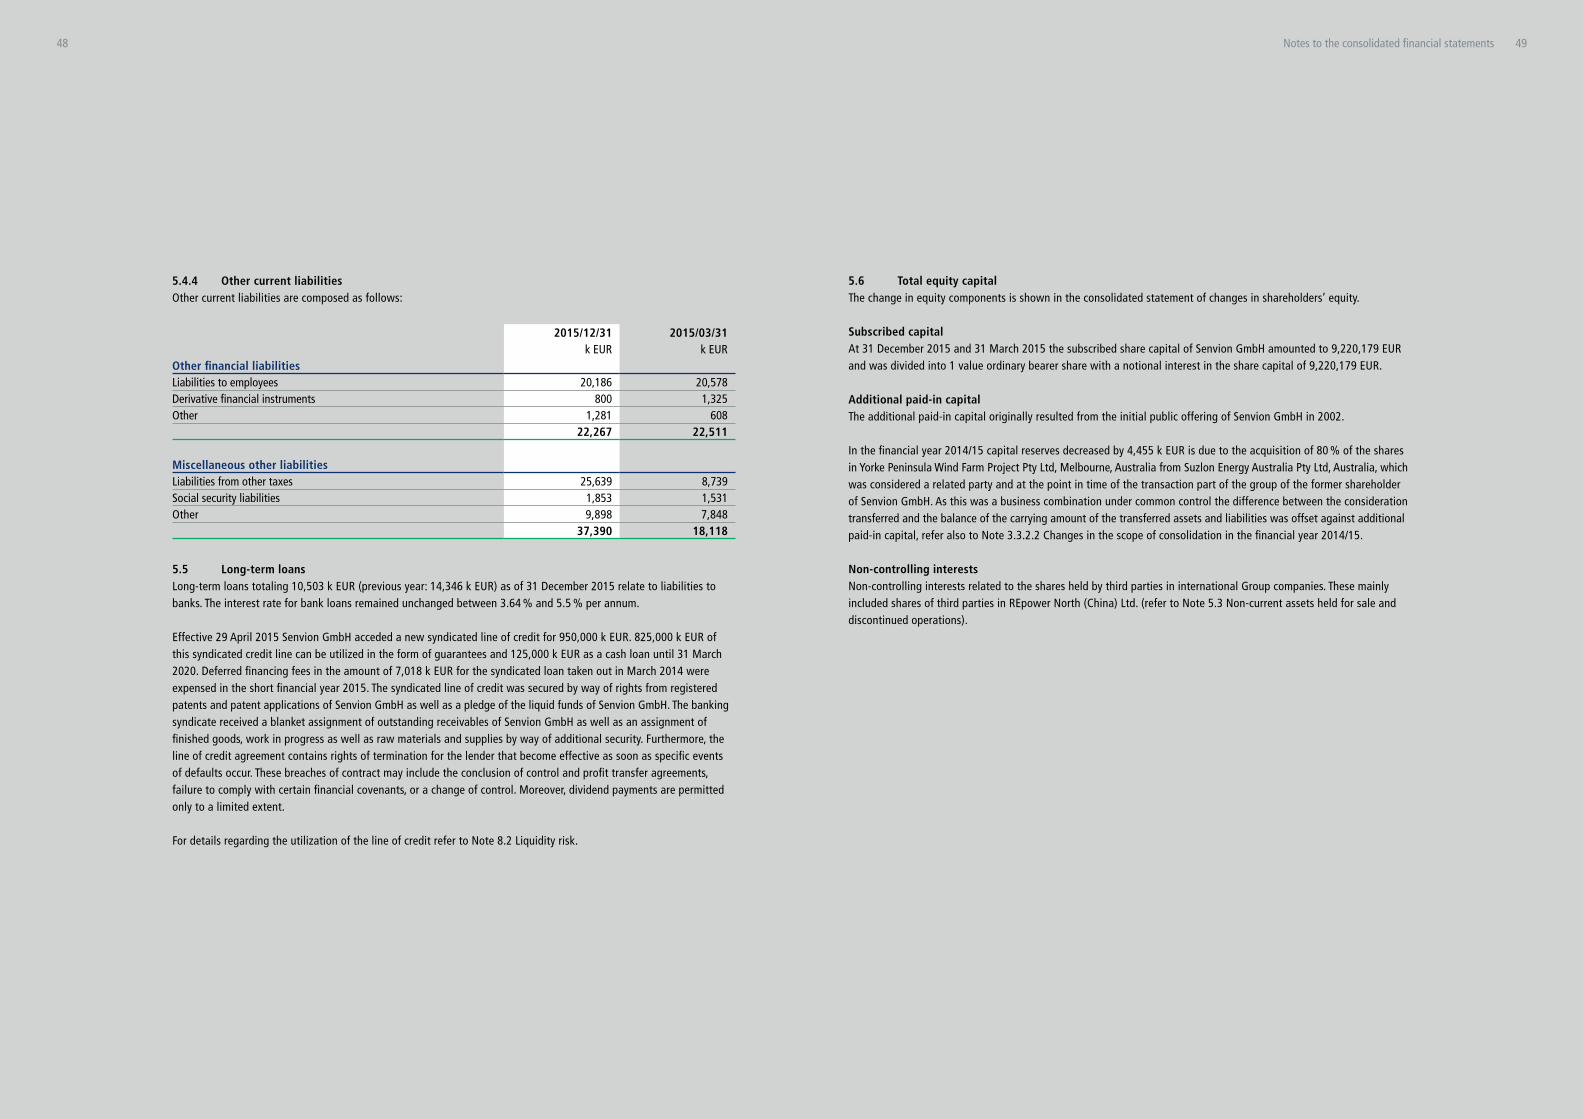
5.4.4 Other current liabilitiesOther current liabilities are composed as follows:
2015/12/31 2015/03/31
k EUR k EUROther financial liabilities Liabilities to employees 20,186 20,578Derivative financial instruments 800 1,325Other 1,281 608 22,267 22,511
Miscellaneous other liabilities Liabilities from other taxes 25,639 8,739Social security liabilities 1,853 1,531Other 9,898 7,848 37,390 18,118
5.5 Long-term loans Long-term loans totaling 10,503 k EUR (previous year: 14,346 k EUR) as of 31 December 2015 relate to liabilities to banks. The interest rate for bank loans remained unchanged between 3.64 % and 5.5 % per annum.
Effective 29 April 2015 Senvion GmbH acceded a new syndicated line of credit for 950,000 k EUR. 825,000 k EUR of this syndicated credit line can be utilized in the form of guarantees and 125,000 k EUR as a cash loan until 31 March 2020. Deferred financing fees in the amount of 7,018 k EUR for the syndicated loan taken out in March 2014 were expensed in the short financial year 2015. The syndicated line of credit was secured by way of rights from registered patents and patent applications of Senvion GmbH as well as a pledge of the liquid funds of Senvion GmbH. The banking syndicate received a blanket assignment of outstanding receivables of Senvion GmbH as well as an assignment of finished goods, work in progress as well as raw materials and supplies by way of additional security. Furthermore, the line of credit agreement contains rights of termination for the lender that become effective as soon as specific events of defaults occur. These breaches of contract may include the conclusion of control and profit transfer agreements, failure to comply with certain financial covenants, or a change of control. Moreover, dividend payments are permitted only to a limited extent.
For details regarding the utilization of the line of credit refer to Note 8.2 Liquidity risk.
5.6 Total equity capitalThe change in equity components is shown in the consolidated statement of changes in shareholders’ equity.
Subscribed capitalAt 31 December 2015 and 31 March 2015 the subscribed share capital of Senvion GmbH amounted to 9,220,179 EUR and was divided into 1 value ordinary bearer share with a notional interest in the share capital of 9,220,179 EUR.
Additional paid-in capitalThe additional paid-in capital originally resulted from the initial public offering of Senvion GmbH in 2002.
In the financial year 2014/15 capital reserves decreased by 4,455 k EUR is due to the acquisition of 80 % of the shares in Yorke Peninsula Wind Farm Project Pty Ltd, Melbourne, Australia from Suzlon Energy Australia Pty Ltd, Australia, which was considered a related party and at the point in time of the transaction part of the group of the former shareholder of Senvion GmbH. As this was a business combination under common control the difference between the consideration transferred and the balance of the carrying amount of the transferred assets and liabilities was offset against additional paid-in capital, refer also to Note 3.3.2.2 Changes in the scope of consolidation in the financial year 2014/15.
Non-controlling interests Non-controlling interests related to the shares held by third parties in international Group companies. These mainly included shares of third parties in REpower North (China) Ltd. (refer to Note 5.3 Non-current assets held for sale and discontinued operations).
48 49Notes to the consolidated financial statements

6.1 RevenuesIn the short financial year 2015 as well as in the financial year 2014/2015 and in the comparative period ended December 2014, the operations of companies of Senvion Group related almost exclusively to the development and manufacturing of wind turbines and wind turbine projects.
2015/04/01 – 2015/12/31
2014/04/01 – 2015/03/31
2014/04/01 – 2014/12/31
k EUR k EUR k EURRevenue from sale of onshore wind turbines 1,432,233 1,605,483 1,236,359Revenue from sale of offshore wind turbines 70,954 101,346 73,567Services 177,245 194,026 138,058Other 2,606 20,964 17,392Revenues 1,683,038 1,921,819 1,465,376
Revenues from sale of onshore wind turbines analyzed by geographies are as follows:
2015/04/01 – 2015/12/31
2014/04/01 – 2015/03/31
2014/04/01 – 2014/12/31
k EUR k EUR k EURGermany 562,339 763,250 563,359Canada 245,926 187,480 179,859United Kingdom 193,827 109,822 64,218France 113,776 176,078 145,693Australia 37,821 203,125 179,907USA 326 85 70Rest of the world 278,218 165,643 103,253Revenues from sale of onshore wind turbines 1,432,233 1,605,483 1,236,359
Senvion has a multi-MW product portfolio, which ranges from 2 to 6.15 MW wind turbines optimized for different wind speeds and locations:
The MM82 model has a nominal power output of 2.05 MW, the hub heights range between 58.5 and 80 meters and it has a rotor diameter of 82 meters
The MM92 model has a nominal power output of 2.05 MW, the hub height ranges from 68 to 100 meters and it has large rotor diameter of 92.5 meters
The MM100 model has a nominal power output of 1.8 MW (60 Hz) or 2.0 MW (50 Hz), hub heights of 78 to 100 meters and a rotor diameter of 100 meters
The 3.0M model has a nominal power output of 3 MW, a hub height of 100 metres (60 Hz) or 136 to 139 meters (50 Hz) and a rotor diameter of 122 meters
The 3.2M has a nominal power output of 3.2 MW, hub heights ranging from 136 to 139 meters and a rotor diameter of 122 meters
The 3.4M model has a nominal power output of 3.4 MW, hub heights ranging from 78 meters to 143 meters and a rotor diameter between 104 and 140 meters
Our offshore portfolio consists of 5M models with 5MW output and the 6.XM series that consists of the Senvion 6.2M126 and the Senvion 6.2M152 with 6.15 MW output
Revenues from the sale of wind turbines analyzed by turbine type are as follows:
2015/04/01 – 2015/12/31
2014/04/01 – 2015/03/31
2014/04/01 – 2014/12/31
k EUR k EUR k EURMM92 521,464 613,230 530,8233.2M 423,376 585,921 446,501MM100 179,599 130,680 84,2123.4M 157,042 113,147 96,415MM82 117,701 109,908 68,3486M 54,214 101,346 73,5673.0M 33,051 52,597 10,0606M+ 9,233 0 05M 7,507 0 0Revenues from sale of wind turbines 1,503,187 1,706,829 1,309,926
6.2 Other operating income
Other operating income is composed as follows:
2015/04/01 – 2015/12/31
2014/04/01 – 2015/03/31
2014/04/01 – 2014/12/31
k EUR k EUR k EURCurrency translation gains 22,386 15,105 7,541Insurance payments/compensations 4,899 7,536 6,354Income from hedging transactions 2,768 5,920 5,678Investment subsidies, research and development subsidies 1,773 1,754 2,015Income from reversal of bad debt allowances 890 895 825Income from reversal of provisions 298 1,278 780Other 4,676 1,250 689 37,690 33,738 23,882
Refer to Note 6.4 “Other operating expenses” for currency translation losses.
6 Consolidated income statement
50 51Notes to the consolidated financial statements
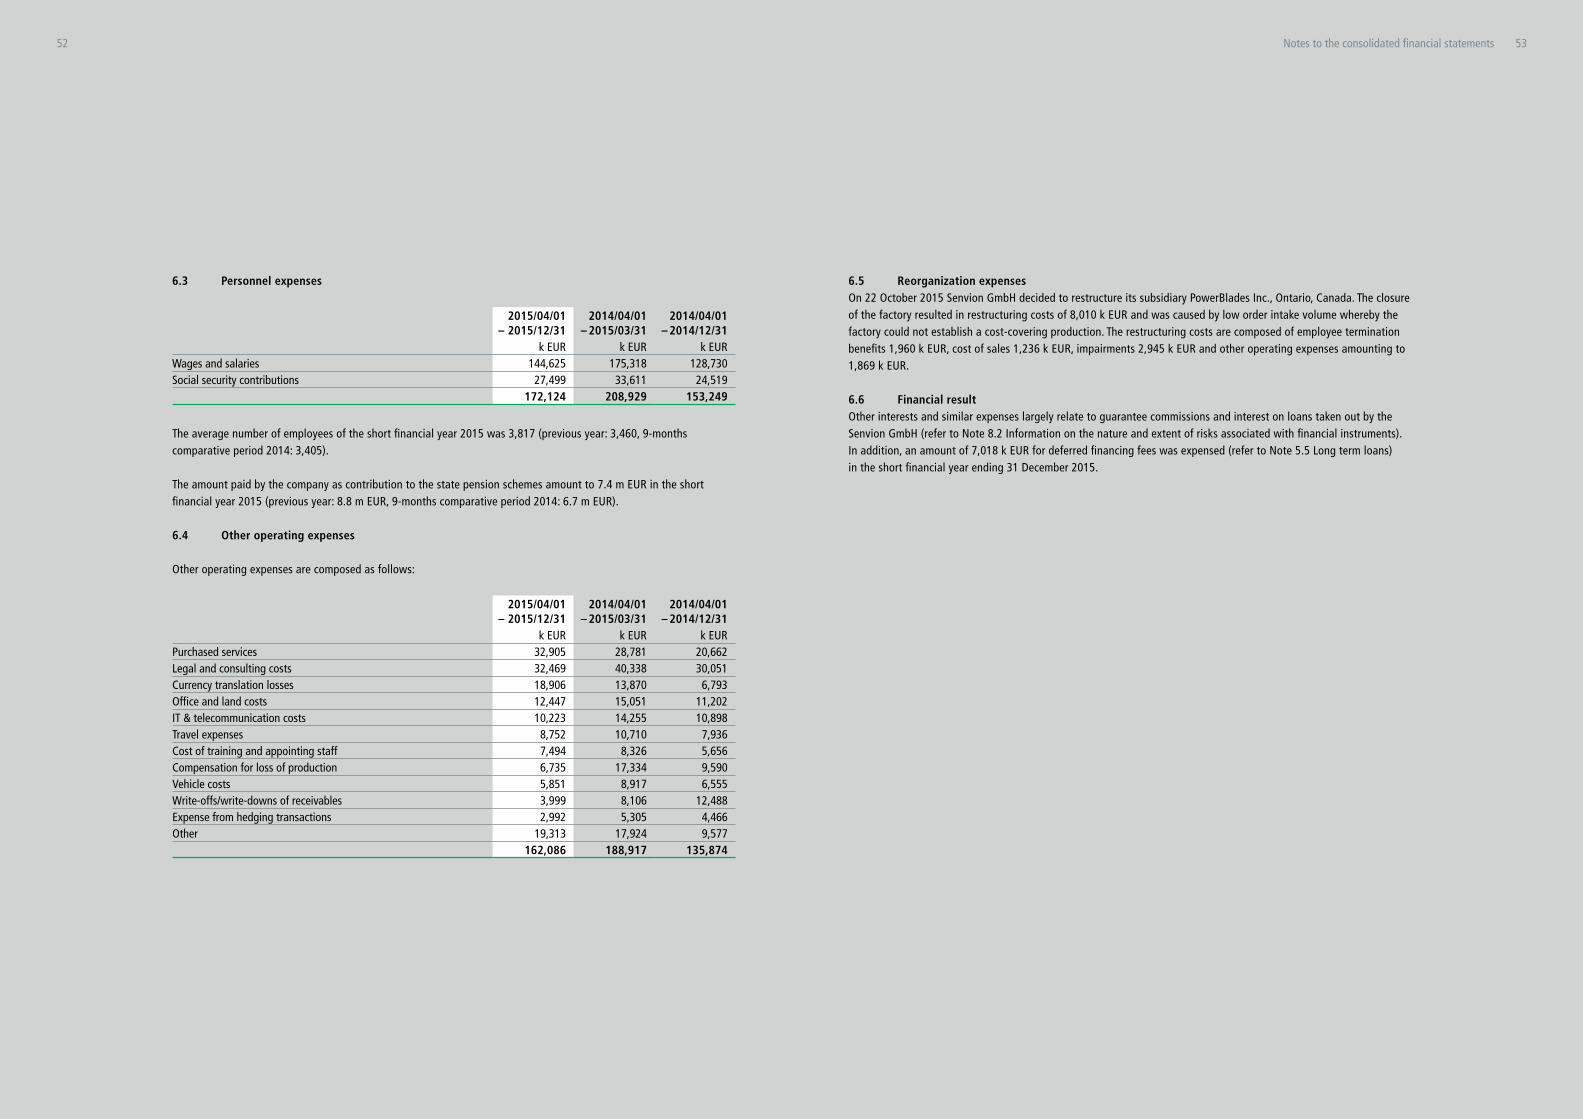
6.3 Personnel expenses
2015/04/01 – 2015/12/31
2014/04/01 – 2015/03/31
2014/04/01 – 2014/12/31
k EUR k EUR k EURWages and salaries 144,625 175,318 128,730Social security contributions 27,499 33,611 24,519 172,124 208,929 153,249
The average number of employees of the short financial year 2015 was 3,817 (previous year: 3,460, 9-months comparative period 2014: 3,405).
The amount paid by the company as contribution to the state pension schemes amount to 7.4 m EUR in the short financial year 2015 (previous year: 8.8 m EUR, 9-months comparative period 2014: 6.7 m EUR).
6.4 Other operating expenses
Other operating expenses are composed as follows:
2015/04/01 – 2015/12/31
2014/04/01 – 2015/03/31
2014/04/01 – 2014/12/31
k EUR k EUR k EURPurchased services 32,905 28,781 20,662Legal and consulting costs 32,469 40,338 30,051Currency translation losses 18,906 13,870 6,793Office and land costs 12,447 15,051 11,202IT & telecommunication costs 10,223 14,255 10,898Travel expenses 8,752 10,710 7,936Cost of training and appointing staff 7,494 8,326 5,656Compensation for loss of production 6,735 17,334 9,590Vehicle costs 5,851 8,917 6,555Write-offs/write-downs of receivables 3,999 8,106 12,488Expense from hedging transactions 2,992 5,305 4,466Other 19,313 17,924 9,577 162,086 188,917 135,874
6.5 Reorganization expensesOn 22 October 2015 Senvion GmbH decided to restructure its subsidiary PowerBlades Inc., Ontario, Canada. The closure of the factory resulted in restructuring costs of 8,010 k EUR and was caused by low order intake volume whereby the factory could not establish a cost-covering production. The restructuring costs are composed of employee termination benefits 1,960 k EUR, cost of sales 1,236 k EUR, impairments 2,945 k EUR and other operating expenses amounting to 1,869 k EUR.
6.6 Financial resultOther interests and similar expenses largely relate to guarantee commissions and interest on loans taken out by the Senvion GmbH (refer to Note 8.2 Information on the nature and extent of risks associated with financial instruments). In addition, an amount of 7,018 k EUR for deferred financing fees was expensed (refer to Note 5.5 Long term loans) in the short financial year ending 31 December 2015.
52 53Notes to the consolidated financial statements

2015/12/31 2015/03/31
k EUR k EUROther financial obligations Obligations from leases and rental contracts
Due within one year 22,168 13,631Due within 1 and 5 years 28,356 25,361Due in more than 5 years 37,811 31,667
88,335 70,659 Purchase commitments 595,004 546,879
thereof for purchase of inventories 588,739 544,890thereof for purchase of property, plant and equipment 6,265 1,989
All leases at Senvion GmbH and the companies included in the scope of consolidation are operating leases. Lease payments are recognized directly in income on a straight-line basis over the term of the lease.
Obligations from leases and rental contracts relate primarily to obligations for the rental of office and warehouse space. Expenses amounting to 16,279 k EUR (previous year: 16,678 k EUR, 9-months comparative period 2014: 12,776 k EUR) were recognized for leases and rental contracts.
8.1 Principles of risk managementWith regard to its assets, financial liabilities and planned transactions, Senvion is subject to risks arising from changes in raw materials and purchase prices, exchange rates, interest rates and share prices. The aim of financial risk manage-ment is to limit these market risks through ongoing operating and financially oriented activities. To this end, specific hedging instruments are employed depending on the assessment of the respective risk. Risks are only hedged if they affect the Group’s cash flow. Derivative financial instruments are only employed to hedge exchange rate risks, particularly those relating to larger customer or purchasing contracts in foreign currency, and are not used for trading or other speculative purposes.
The principles of financial policy were agreed on an annual basis by the Executive Board and monitored by the Super-visory Board, until the Supervisory Board was dissolved in connection to the change of legal corporate form to “GmbH”. The implementation of financial policy and ongoing risk management is the responsibility of the Group’s treasury department with the involvement of the Group’s controlling department. Certain transactions require the prior consent of the Executive Board, which is also regularly informed of the scope and amount of the current risk exposure. The treasury department considers the effective management of financial instruments and market risks as one of its main functions. In order to assess the effects of the different events on the market, simulation calculations are performed using various worst-case and market scenarios.
8.2 Information on the nature and extent of risks associated with financial instrumentsCredit and default risk is constantly monitored. Before entering into purchase and delivery contracts, the Group checks the customer’s credit rating using a standardized credit check process including the evaluation of information from external rating agencies and credit agencies and the analysis of financial information. The Group requires collateral depending upon the rating’s results and materiality considerations. The result of the credit check process is documented for each customer.
The credit and default risk of financial assets is limited to a maximum of the amounts reported on the asset side of the consolidated statement of financial position.
Exchange rate risks only exist insofar as deliveries are made to countries outside the euro zone or cross-border deliveries are made from such countries. Risks within the meaning of IFRS 7 arise from financial instruments that are denomi-nated in a currency other than the functional currency and that are of a monetary nature; exchange rate differences arising from the translation of financial statements into the Group currency are not included.
IFRS 7 requires a currency sensitivity analysis showing the effects of hypothetical changes in relevant risk variables on earnings and shareholders’ equity. Foreign currency sensitivity is calculated for primary monetary financial instruments (cash and cash equivalents, trade receivables and payables, other assets and other liabilities) by simulating a 10 % increase or decrease in the value of all foreign currencies against the functional currency.
7 Contingent liabilities and other financial obligations 8 Financial risks and financial instruments
54 55Notes to the consolidated financial statements

The simulated appreciation or devaluation of the relevant currencies would have impacted the financial statements for the period ending 31 December 2015 as follows:
Currency riskThe following table presents the impact from changes in foreign currency exchange rates on the Group’s net profit for all material foreign currencies.
2015/12/31 USD AUD CAD GBPSensitivity analysis – Total Profit impact in k EURExchange rate + 10 % – 549 – 1,033 – 2,606 – 2,251Exchange rate – 10 % 671 1,263 2,417 2,752
2015/03/31 USD AUD CAD GBPSensitivity analysis – Total Profit impact in k EURExchange rate + 10 % – 412 – 716 2,549 – 133Exchange rate – 10 % 503 875 – 3,273 163
2014/12/31 USD AUD CAD GBPSensitivity analysis – Total Profit impact in k EURExchange rate + 10 % 234 – 1,666 1,285 – 557Exchange rate – 10 % – 287 2,036 – 778 681
A change in foreign currency exchange rates would have no impact on the Group’s net profit for financial instruments designated as hedges. The following table presents the impact on the Group’s equity/other comprehensive income from changes in the fair value of derivative financial instruments.
2015/12/31 Fair value of derivative financial instruments designated as cash flow hedgesSensitivity analysis – Total Impact on equity in k EURExchange rate + 10 % 15,370Exchange rate – 10 % – 18,785
2015/03/31 Fair value of derivative financial instruments designated as cash flow hedgesSensitivity analysis – Total Impact on equity in k EURExchange rate + 10 % 2,674Exchange rate – 10 % – 3,268
2014/12/31 Fair value of derivative financial instruments designated as cash flow hedgesSensitivity analysis – Total Impact on equity in k EURExchange rate + 10 % – 2,360Exchange rate – 10 % 1,931
At Senvion GmbH, exchange rate risk primarily arises from operating activities when contracts are concluded in a currency other than the EUR. The primary risks are in connection with foreign currencies presented in the table above. The treasury department centrally identifies and monitors potential exchange rate risks from transactions and payments in foreign currency. Regarding transactions in foreign currency, subsidiaries and other departments report directly to the treasury department. The Group hedges individual transactions and payments in foreign currency against potential risks from a change in exchange rates. Cash outflows and inflows in the same foreign currency are offset and the net exposure is calculated and separately monitored for each foreign currency.
The risk position per currency measured in this manner is monitored and managed by the treasury department. Hedges are concluded to limit this risk. Exchange rate risks in the Company’s operating activities are hedged using forward exchange contracts, currency swaps, currency options and structured derivatives.
Transacting or holding such contracts for trading or speculation purposes is not permitted. Derivative financial instruments that do not meet the conditions for hedge accounting are placed in the “held for trading” category.
Liquidity risk Liquidity risk is monitored as part of rolling liquidity planning. Financing is provided mainly through advance payments for projects from customers. Payments made and received are monitored continuously as part of liquidity planning. The utilization regarding the syndicated line of credit and other guarantees as of 31 December 2015 is as follows:
Credit facility total Utilized Remaining 2015/12/31 m EUR m EUR m EURSyndicated line of credit 950.0 479.0 471.0
Guarantees 825.0 479.0 346.0Cash loan 125.0 0.0 125.0
Guarantees other 42.3 32,6* 9.7Total 992.3 511.6 480.7
* thereof 1.7 m EUR from rental guarantees
Credit facility total Utilized Remaining 2015/03/31 m EUR m EUR m EURSyndicated line of credit 850.0 369.3 480.7
Guarantees 820.0 367.9 452.1Cash loan 30.0 1,4* 28.6
Guarantees other 10.6 4.9 5.7Total 860.6 374.2 486.4
* from rental guarantees
For further details to the credit facilities please refer to Note 5.5 Long-term loans.
56 57Notes to the consolidated financial statements
Maturity of financial liabilitiesThe following tables show the contractually agreed, undiscounted interest and principal payments for the Senvion Group’s primary financial liabilities and derivative financial instruments with a negative fair value as of 31 December 2015 and 31 March 2015. Derivatives with positive fair values constitute assets, and hence are not included.
Carrying amount as of 2015/12/31
Cash flows up to 1 year
Cash flows between
1 and 5 years
Cash flows more than 5
yearsk EUR k EUR k EUR k EUR
Short-term loans and current portion of long-term loans 5,982 6,634 0 0
thereof redemption payments 5,982 0 0thereof interest payments 652 0 0
Trade accounts payable 379,748 379,748 0 0Liabilities to related parties 12,501 12,501 0 0Derivatives 800 800 Long-term loans 10,503 0 11,209 0
thereof redemption payments 0 10,503 0thereof interest payments 0 706 0
Other financial liabilities 21,467 21,467 0 0Total 431,001 421,150 11,209 0
Carrying amount as of
2015/03/31Cash flows
up to 1 year
Cash flows between
1 and 5 years
Cash flows more than 5
yearsk EUR k EUR k EUR k EUR
Short-term loans and current portion of long-term loans 7,568 8,461 0 0
thereof redemption payments 7,568 0 0thereof interest payments 893 0 0
Trade accounts payable 337,189 337,189 0 0Liabilities to related parties 10,851 10,851 0 0Derivatives 1,325 1,325 0 0Long-term loans 14,346 0 15,067 454
thereof redemption payments 0 13,901 445thereof interest payments 0 1,166 9
Other financial liabilities 22,186 21,186 1,000 0Total 393,465 379,012 16,067 454
Outstanding receivables of Senvion as well as an assignment of finished goods, work in progress and raw materials and supplies were pledged as collateral as of 31 December 2015 for the new syndicated loan (refer also to Note 5.5 Long-term loans).
As of 31 December 2015, as in the previous year, no other financial assets were pledged as collateral.
Interest rate riskThe Company does not have any material assets or liabilities that are sensitive to interest rates as all loans have fixed interest rates.
The recording, measurement and monitoring of potential interest rate risks from external financing is performed centrally by the treasury department. Hedges may be concluded to limit interest rate risks. Interest rate risks are hedged using interest rate swaps, interest rate caps and derivatives if deemed material. Transacting or holding such contracts for trading or speculation purposes is not permitted.
Financial derivativesThe following table shows the carrying amounts and nominal volumes of financial derivatives as of 31 December 2015 and 31 March 2015 respectively:
2015/12/31 2015/03/31Carrying amount Nominal value Carrying amount Nominal value
k EUR k EUR k EUR k EURAssets Forward exchange contracts
not used in hedges 387 4,351 0 0used in cashflow hedges 8,749 172,329 0 0
Liabilities Currency swaps
not used in hedges 0 0 51 20,764used in cashflow hedges 0 0 50 2,715
Forward exchange contracts not used in hedges 733 9,969 38 8,723used in cashflow hedges 67 6,510 1,153 30,889
Currency option transactions not used in hedges 0 0 33 5,684
The effective portion of the changes in the fair value of financial derivatives used in cash flow hedging recognized in other comprehensive income, net of taxes, amounted to 6,979 k EUR (previous year: – 2,490 k EUR, 9-months com-parative period 2014: – 1,455 k EUR).
During the short financial year 2015, the amount transferred from other comprehensive income to profit or loss as part of cash flow hedge accounting was 1,342 k EUR (deferred taxes of 394 k EUR), of which 2,121 k EUR was recorded as other operating income and – 779 k EUR as other operating expense.
During the financial year 2014/2015, the amount transferred from other comprehensive income to profit or loss as part of cash flow hedge accounting was 458 k EUR (deferred taxes of 135 k EUR), of which 787 k EUR was recorded as other operating income and – 329 k EUR as other operating expense.
During the short financial year 2014, the amount transferred from other comprehensive income to profit or loss as part of cash flow hedge accounting was 530 k EUR (deferred taxes of 156 k EUR), of which 530 k EUR was recorded as other operating income.
58 59Notes to the consolidated financial statements

During the short financial year 2015, the financial year 2014/15 and the comparative period ended 31 December 2014 the amount transferred from other comprehensive income to profit or loss due to the discontinuation of underlying transactions was 0 k EUR.
As of 31 December 2015, 31 March 2015 and 31 December 2014, there were no ineffective portions of the change in the fair value of hedging instruments used in cash flow hedging.
The following table shows when the book values of the derivatives used for cash flow hedging are expected to be recognized in profit or loss:
Occurence and recognitionin profit and loss
Carrying amount up to 1 yearbetween
1 and 5 yearsmore than
5 yearsk EUR k EUR k EUR k EUR
2015/12/31Forward exchange contracts Assets 8,749 8,749 0 0Liabilities 67 67 0 0 2015/03/31Forward exchange contracts Liabilities 1,153 1,153 0 0Currency swaps Liabilities 50 50 0 0
8.3 Information on the significance of financial instruments for the consolidated financial statementsBased on the relevant consolidated statement of financial position items, the relationships between the classification of financial instruments in accordance with IFRS 7 and the carrying amounts of the financial instruments including Liquid funds not allocated to any IAS 39 category are shown in the following tables:
Category* 2015/12/31 2015/03/31Carrying amount Fair value
Carrying amount Fair value
k EUR k EUR k EUR k EURLiquid funds n. a. 417,732 417,732 301,375 301,375Gross amount due from customers for contract work as an asset L+R 49,372 49,372 58,753 58,753Trade accounts receivable L+R 230,751 230,751 178,008 178,008Loans granted L+R 1,028 1,109 2,752 2,905Other financial assets – miscellaneous L+R 296 296 567 567Other financial assets – loans L+R 2,125 2,125 1,667 1,667Other financial investments Afs 4,004 4,004 66 66Receivables from related parties L+R 199,504 199,504 32,009 32,009Total L+R L+R 904,812 – 575,197 –Other financial assets – financial derivatives held for trading HfT 387 387 0 0Other financial assets – financial derivatives classified as hedge instruments n. a. 8,749 8,749 0 0
* L+R: loans and receivables
HfT: held for trading
Afs: available-for-sale
Liquid funds, gross amount due from customers for contract work as an asset, trade accounts receivable, receivables from related parties and other financial assets generally have a term of 12 months or less, meaning that their carrying amounts on the respective reporting dates correspond closely to their fair values.
The fair values of non-current receivables correspond to the present value of the payments associated with these assets, taking into account the current parameters reflecting changes in conditions and expectations due to market- and counterparty-related developments.
Financial liabilities are shown in the following table:
Category* 2015/12/31 2015/03/31Carrying amount Fair Value
Carrying amount Fair Value
k EUR k EUR k EUR k EURTrade accounts payable OL 379,748 379,748 337,189 337,189Liabilities to related parties OL 12,501 12,501 10,851 10,851Long-term loans OL 10,503 10,503 14,346 14,346Short-term loans and current portion of long-term loans OL 5,982 5,982 7,568 7,568Other non-current financial liabilities OL 0 0 1,000 1,003Other current financial liabilities OL 21,467 21,467 21,186 21,186Total OL OL 430,201 – 392,140 –Other financial liabilities – financial derivatives held for trading HFT 733 733 122 122Other financial liabilities – financial derivatives classified as hedge instruments n.a. 67 67 1,203 1,203
* OL: other liabilities
Due to the short-term of trade accounts payable, liabilities to related parties and other financial liabilities, it is assumed that their carrying amounts and fair values are identical.
60 61Notes to the consolidated financial statements
The following table provides a breakdown of the fair value hierarchy of financial assets and financial liabilities carried at fair value at the respective reporting date. This implies a differentiation between instruments which fair values are directly observable on active markets (level 1), which fair values are based on observable material input data (level 2) and which fair values are based non-observable material input data (level 3):
2015/12/31Carrying amount Level 1 Level 2 Level 3
k EUR k EUR k EUR k EURAssets carried at fair value Held for Trading (HfT) 387 0 387 0Available-for-Sale (Afs)* 4,004 0 0 4,004Derivative financial instruments classified as hedge instruments 8,749 0 8,749 0Total assets 13,140 0 9,136 4,004
Liabilities Held for Trading (HfT) 733 0 733 0Derivative financial instruments classified as hedge instruments 67 0 67 0Total liabilities 800 0 800 0
* Refer to Note 5.3 “Non-current assets held for sale and discontinued operations” on how fair value was determined
2015/03/31Carrying amount Level 1 Level 2 Level 3
k EUR k EUR k EUR k EURAssets carried at fair value Held for Trading (HfT) 0 0 0 0Derivative financial instruments classified as hedge instruments 0 0 0 0Total assets 0 0 0 0 Liabilities Held for Trading (HfT) 122 0 122 0Derivative financial instruments classified as hedge instruments 1,203 0 1,203 0Total liabilities 1,325 0 1,325 0
There have been no transfers between any levels during the short financial year 2015 and the financial year 2014/2015.The following methods and assumptions were used to estimate the fair values of instruments for which the fair value is disclosed and those which are recognized at fair value:
Long-term receivables are evaluated by the Group based on parameters such as interest rates, specific country risk factors, individual creditworthiness of the customer and the risk characteristics of the financed project (Level 3 meas-urement). Based on this evaluation, allowances are taken into account for the expected losses of these receivables. The fair values of such receivables, net of allowances, were not materially different from their carrying values.
The Group enters into derivative financial instruments with various counterparties, principally financial institutions with investment grade credit ratings. Derivatives valued using valuation techniques with market observable inputs are mainly foreign exchange forward contracts. The most frequently applied valuation techniques include forward pricing and swap models, using present value calculations. The models incorporate various inputs including the credit quality of counterparties and foreign exchange spot and forward rates. The marked-to-market value of derivative asset positions is net of a credit valuation adjustment attributable to derivative counterparty default risk.
Fair values of the Group’s borrowings and loans and other financial liabilities are determined by using DCF method using a discount rate that reflects the issuer’s borrowing rate as of the end of the reporting period (Level 3 measure-ment). The own non-performance risk as of 31 December 2015 and 31 March 2015 was assessed to be insignificant.
Net gains and losses on loans and receivables consist primarily of results from bad debt allowances and reversals thereof. With regard to bad debt allowances, please refer to the Notes on trade accounts receivable (5.1.3) and other current assets (5.1.6). The net results of bad debt allowances and reversals thereof are primarily reported in other operating expenses.
The following table shows the net gains and losses for each valuation category:
Net gain/loss2015/04/01
– 2015/12/312014/04/01
– 2015/03/31k EUR k EUR
Loans and Receivables (L+R) 15,676 – 17,745Financial instruments Held for Trading (HfT) – 224 615Total 15,452 – 17,130
Senvion has received collateral amounting to 2,845.25 m EUR (previous year: 2,700.69 m EUR) as of 31 December 2015; this represents the fair value of the collateral, which primarily relates to standard industry guarantees from third parties for obligations of customers and suppliers for which Senvion has carried out preliminary work or made advance pay-ments. For further information please refer to Note 5.1.3 Trade accounts receivable.
62 63Notes to the consolidated financial statements
The aim of the Group’s capital management is to ensure that it maintains a good equity ratio and a high credit rating in order to support its business activities and maximize shareholder value. This is especially significant in the context of growth targets.
Senvion has a balanced capital structure. Shareholders’ equity covers non-current assets by more than 100 %. The Company is not subject to any statutory capital requirements. It is however subject to loan convenants.
The Group monitors its capital on the basis of the equity ratio, this being the ratio of the shareholders’ equity reported in the consolidated financial statements to total assets.
2015/12/31 2015/03/31
k EUR k EURShareholders’ equity 606,593 531,963Total assets 1,773,645 1,629,419Equity Ratio in % 34.2 32.6
Senvion’s original aim is to consistently achieve an equity ratio of at least 30 %. When events are identified which could result in the equity being lower than the target of 30 % appropriate measures are taken to avoid the equity ratio to fall below the target ratio.
Another figure used in capital management is net working capital or the net working capital ratio. Net working capital is calculated as follows: total current assets (adjusted for liquid funds and assets of disposal Group classified as held for sale) minus total current liabilities (adjusted for provisions, liabilities of disposal Group classified as held for sale and short-term loans and current portion of long-term loans). To calculate the net working capital ratio, this net figure is compared with the total operating performance for the last 12 months.
2015/12/31 2015/03/31
k EUR k EURCurrent assets 1,413,949 1,269,696Adjustments to current assets – 417,732 – 317,836Total current liabilities – 1,126,646 – 1,038,796Adjustments to current liabilities 222,960 246,557Net working capital 92,531 159,621Total operating performance 1,650,235 1,964,980Net working capital ratio in % 5.6 8.1
The Group uses the net working capital to measure the short-term liquidity of the business and to utilize assets in an efficient manner. Consequently the Group always attempts to optimize its net working capital on a sustainable basis.
For Senvion Group, related parties as defined by IAS 24 are, in particular, shareholders, which exercise (joint) control or significant influence, subsidiaries, joint ventures and associates.
In addition, members of the Executive Board and Supervisory Board of Senvions’s direct parent, Senivon Holding GmbH, are related parties as defined by IAS 24, as are people who hold a key position in the management of a parent company of the Senvion Group. Close family members of these related parties are also considered as related parties.
Upon the acquisition of Senvion Group by Centerbridge Partners L. P., New York, USA (29 April 2015) related parties have changed and no longer include Suzlon Energy Ltd. and its subsidiaries for the period after 29 April 2015.
The composition and remuneration of the Executive Board and Supervisory Board are described in Notes 12 “Information on the corporate bodies of Senvion GmbH” and Note 13 “Remuneration for the Supervisory Board and the Executive Board of Senvion GmbH” respectively.
In addition to members of the Supervisory board and board of directors the following related parties were identified:
Senvion Holding GmbH, Hamburg (direct parent) Senvion Midco GmbH, Hamburg (indirect parent) Senvion Topco GmbH, Hamburg (indirect parent) Senvion S.à. r.l., Luxembourg (indirect parent) CCP II Acquisition Senvion S.à r.l., Luxembourg (ultimate shareholder) CCP III Acquisition Senvion S.à r.l., Luxembourg (ultimate shareholder) Rapid Management L. P., Cayman Islands (ultimate shareholder) Rapid Partners L. P., Cayman Islands (ultimate shareholder) Arpwood capital Private Limited, Mumbai Centerbridge Partners Europe LLP, London
Arpwood Capital Private limited and Centerbridge Partners Europe LLP are considered related parties as individuals who are members of the Advisory Board of Senvion S.à r.l. also hold key management positions in these entities.
In addition to business relationships with the subsidiaries eliminated in the consolidated financial statements by means of full consolidation, there were the following business relationships with related parties.
9 Capital management 10 Related parties disclosures
64 65Notes to the consolidated financial statements
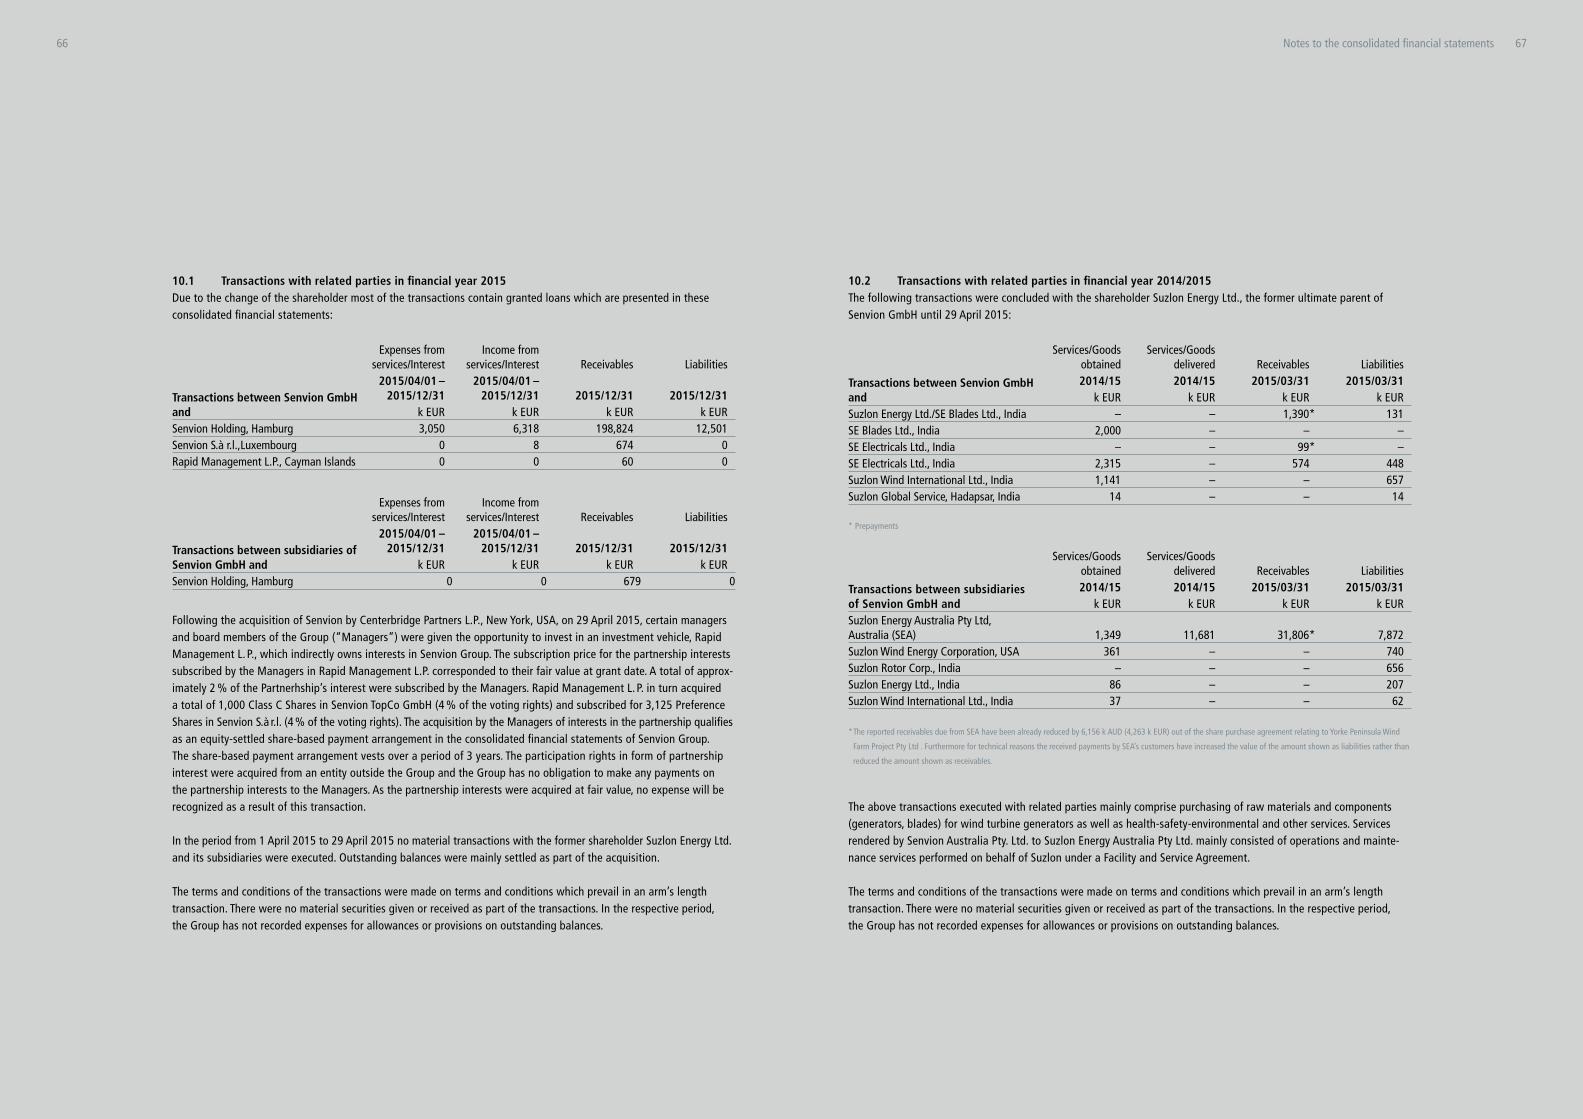
10.1 Transactions with related parties in financial year 2015Due to the change of the shareholder most of the transactions contain granted loans which are presented in these consolidated financial statements:
Transactions between Senvion GmbH and
Expenses from services/Interest
Income from services/Interest Receivables Liabilities
2015/04/01 – 2015/12/31
2015/04/01 – 2015/12/31 2015/12/31 2015/12/31
k EUR k EUR k EUR k EURSenvion Holding, Hamburg 3,050 6,318 198,824 12,501Senvion S.à r.l.,Luxembourg 0 8 674 0Rapid Management L.P., Cayman Islands 0 0 60 0
Transactions between subsidiaries of Senvion GmbH and
Expenses from services/Interest
Income from services/Interest Receivables Liabilities
2015/04/01 – 2015/12/31
2015/04/01 – 2015/12/31 2015/12/31 2015/12/31
k EUR k EUR k EUR k EURSenvion Holding, Hamburg 0 0 679 0
Following the acquisition of Senvion by Centerbridge Partners L.P., New York, USA, on 29 April 2015, certain managers and board members of the Group (“Managers”) were given the opportunity to invest in an investment vehicle, Rapid Management L. P., which indirectly owns interests in Senvion Group. The subscription price for the partnership interests subscribed by the Managers in Rapid Management L.P. corresponded to their fair value at grant date. A total of approx-imately 2 % of the Partnerhship’s interest were subscribed by the Managers. Rapid Management L. P. in turn acquired a total of 1,000 Class C Shares in Senvion TopCo GmbH (4 % of the voting rights) and subscribed for 3,125 Preference Shares in Senvion S.à r.l. (4 % of the voting rights). The acquisition by the Managers of interests in the partnership qualifies as an equity-settled share-based payment arrangement in the consolidated financial statements of Senvion Group. The share-based payment arrangement vests over a period of 3 years. The participation rights in form of partnership interest were acquired from an entity outside the Group and the Group has no obligation to make any payments on the partnership interests to the Managers. As the partnership interests were acquired at fair value, no expense will be recognized as a result of this transaction.
In the period from 1 April 2015 to 29 April 2015 no material transactions with the former shareholder Suzlon Energy Ltd. and its subsidiaries were executed. Outstanding balances were mainly settled as part of the acquisition.
The terms and conditions of the transactions were made on terms and conditions which prevail in an arm’s length transaction. There were no material securities given or received as part of the transactions. In the respective period, the Group has not recorded expenses for allowances or provisions on outstanding balances.
10.2 Transactions with related parties in financial year 2014/2015The following transactions were concluded with the shareholder Suzlon Energy Ltd., the former ultimate parent of Senvion GmbH until 29 April 2015:
Transactions between Senvion GmbH and
Services/Goods obtained
Services/Goods delivered Receivables Liabilities
2014/15 2014/15 2015/03/31 2015/03/31k EUR k EUR k EUR k EUR
Suzlon Energy Ltd./SE Blades Ltd., India – – 1,390* 131SE Blades Ltd., India 2,000 – – –SE Electricals Ltd., India – – 99* –SE Electricals Ltd., India 2,315 – 574 448Suzlon Wind International Ltd., India 1,141 – – 657Suzlon Global Service, Hadapsar, India 14 – – 14
* Prepayments
Transactions between subsidiaries of Senvion GmbH and
Services/Goods obtained
Services/Goods delivered Receivables Liabilities
2014/15 2014/15 2015/03/31 2015/03/31k EUR k EUR k EUR k EUR
Suzlon Energy Australia Pty Ltd, Australia (SEA) 1,349 11,681 31,806* 7,872Suzlon Wind Energy Corporation, USA 361 – – 740Suzlon Rotor Corp., India – – – 656Suzlon Energy Ltd., India 86 – – 207Suzlon Wind International Ltd., India 37 – – 62
* The reported receivables due from SEA have been already reduced by 6,156 k AUD (4,263 k EUR) out of the share purchase agreement relating to Yorke Peninsula Wind
Farm Project Pty Ltd . Furthermore for technical reasons the received payments by SEA’s customers have increased the value of the amount shown as liabilities rather than
reduced the amount shown as receivables.
The above transactions executed with related parties mainly comprise purchasing of raw materials and components (generators, blades) for wind turbine generators as well as health-safety-environmental and other services. Services rendered by Senvion Australia Pty. Ltd. to Suzlon Energy Australia Pty Ltd. mainly consisted of operations and mainte-nance services performed on behalf of Suzlon under a Facility and Service Agreement.
The terms and conditions of the transactions were made on terms and conditions which prevail in an arm’s length transaction. There were no material securities given or received as part of the transactions. In the respective period, the Group has not recorded expenses for allowances or provisions on outstanding balances.
66 67Notes to the consolidated financial statements
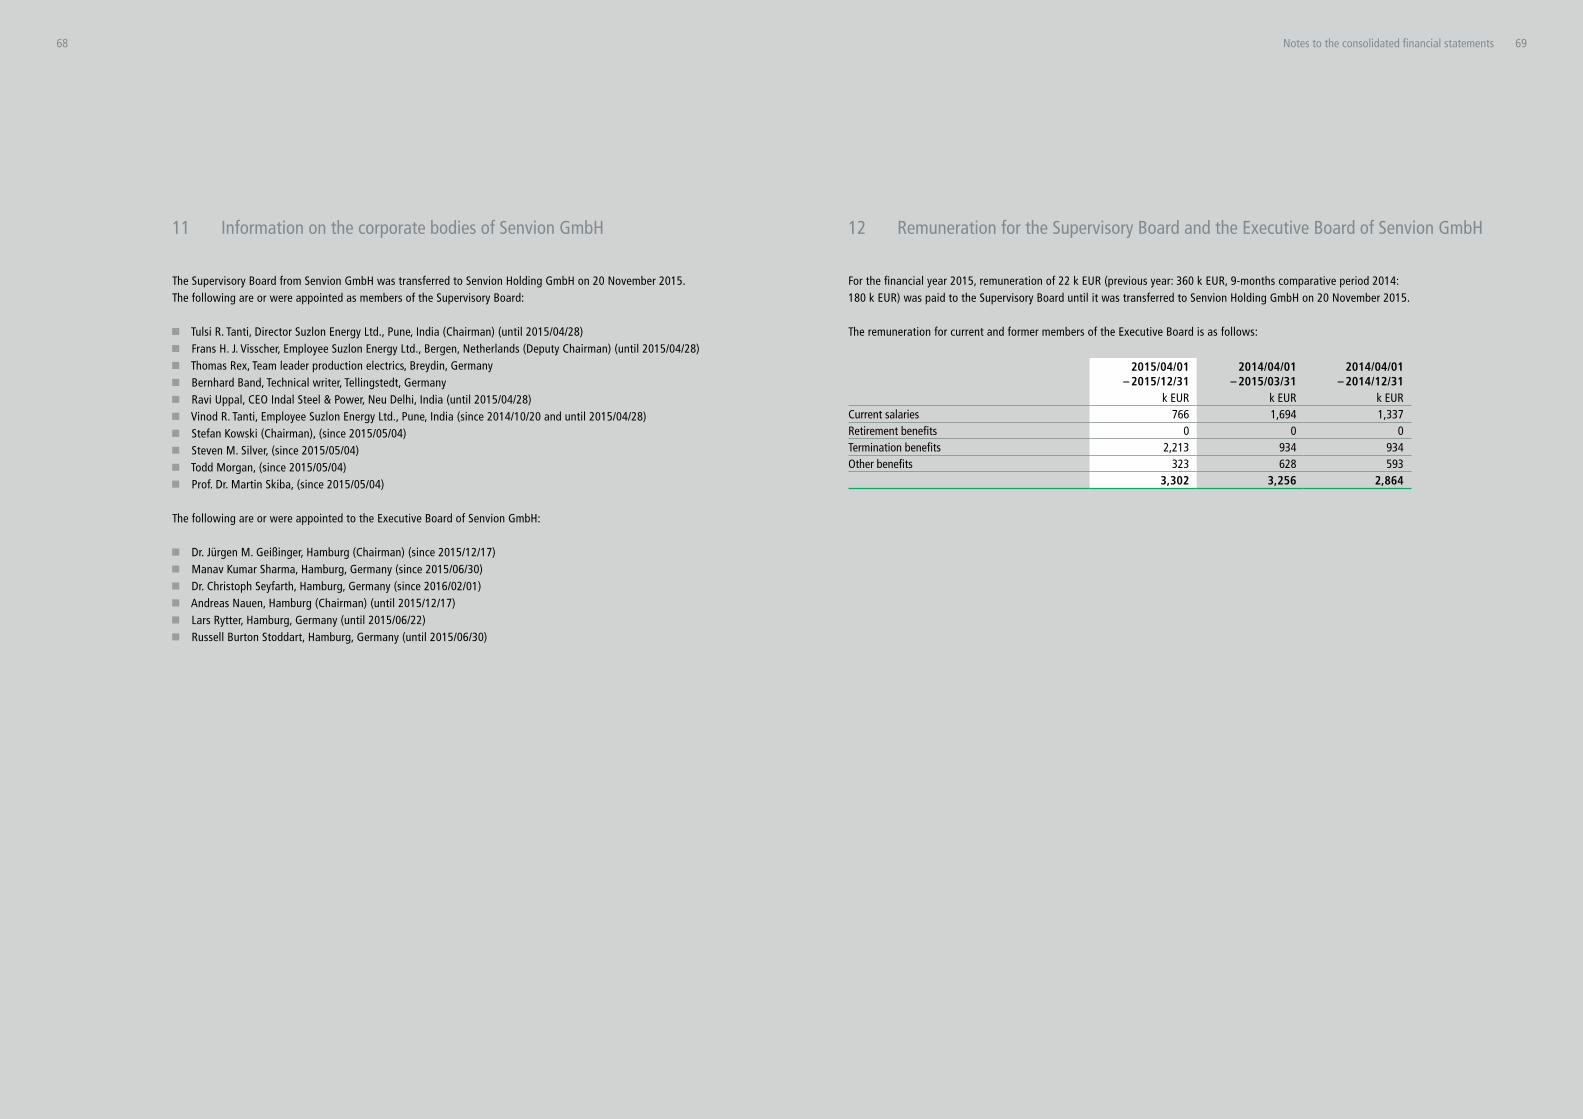
The Supervisory Board from Senvion GmbH was transferred to Senvion Holding GmbH on 20 November 2015. The following are or were appointed as members of the Supervisory Board:
Tulsi R. Tanti, Director Suzlon Energy Ltd., Pune, India (Chairman) (until 2015/04/28) Frans H. J. Visscher, Employee Suzlon Energy Ltd., Bergen, Netherlands (Deputy Chairman) (until 2015/04/28) Thomas Rex, Team leader production electrics, Breydin, Germany Bernhard Band, Technical writer, Tellingstedt, Germany Ravi Uppal, CEO Indal Steel & Power, Neu Delhi, India (until 2015/04/28) Vinod R. Tanti, Employee Suzlon Energy Ltd., Pune, India (since 2014/10/20 and until 2015/04/28) Stefan Kowski (Chairman), (since 2015/05/04) Steven M. Silver, (since 2015/05/04) Todd Morgan, (since 2015/05/04) Prof. Dr. Martin Skiba, (since 2015/05/04)
The following are or were appointed to the Executive Board of Senvion GmbH:
Dr. Jürgen M. Geißinger, Hamburg (Chairman) (since 2015/12/17) Manav Kumar Sharma, Hamburg, Germany (since 2015/06/30) Dr. Christoph Seyfarth, Hamburg, Germany (since 2016/02/01) Andreas Nauen, Hamburg (Chairman) (until 2015/12/17) Lars Rytter, Hamburg, Germany (until 2015/06/22) Russell Burton Stoddart, Hamburg, Germany (until 2015/06/30)
For the financial year 2015, remuneration of 22 k EUR (previous year: 360 k EUR, 9-months comparative period 2014: 180 k EUR) was paid to the Supervisory Board until it was transferred to Senvion Holding GmbH on 20 November 2015.
The remuneration for current and former members of the Executive Board is as follows:
2015/04/01 – 2015/12/31
2014/04/01 – 2015/03/31
2014/04/01 – 2014/12/31
k EUR k EUR k EURCurrent salaries 766 1,694 1,337Retirement benefits 0 0 0Termination benefits 2,213 934 934Other benefits 323 628 593 3,302 3,256 2,864
11 Information on the corporate bodies of Senvion GmbH 12 Remuneration for the Supervisory Board and the Executive Board of Senvion GmbH
68 69Notes to the consolidated financial statements

The following table contains expenses from services rendered by the group auditor, Ernst & Young GmbH Wirtschaftsprüfungsgesellschaft, Germany:
2015/04/01 – 2015/12/31
2014/04/01 – 2015/03/31
2014/04/01 – 2014/12/31
k EUR k EUR k EURAudit fees (consolidated financial statements and annual financial statements) 1,236 455 410Additional audit fees for prior year audit 0 43 0Fees for other assurance services 550 529 529Fees for tax advisory services 1,305 386 486Fees for other services 1,844 3,148 764 4,935 4,561 2,189
No material events after the reporting period occurred.
Hamburg, 11 February 2016
13 Information on the remuneration paid to the auditor 14 Events after the reporting date
Dr. Christoph Seyfarth (COO)
Kumar Manav Sharma (CFO)
Dr. Jürgen M. Geißinger (CEO)
70 71Notes to the consolidated financial statements
Independent Auditor’s Report
To Senvion GmbH We have audited the accompanying consolidated financial statements of Senvion GmbH, Hamburg, and its subsidiaries, which comprise the consolidated statement of financial position as at 31 December 2015 and the consolidated income statement, consolidated statement of comprehensive income, consolidated statement of cash flows, consolidated statement of changes in shareholders’ equity for the short financial year then ended, and the notes to the consolidated financial statements.
Management’s Responsibility for the Consolidated Financial StatementsManagement is responsible for the preparation and fair presentation of these consolidated financial statements in accordance with International Financial Reporting Standards as adopted by the EU, and for such internal control as management determines is necessary to enable the preparation of consolidated financial statements that are free from material misstatement, whether due to fraud or error.
Auditor’s ResponsibilityOur responsibility is to express an opinion on these consolidated financial statements based on our audit. We conducted our audit in accordance with International Standards on Auditing. Those standards require that we comply with ethical requirements and plan and perform the audit to obtain reasonable assurance about whether the consolidated financial statements are free from material misstatement. An audit involves performing procedures to obtain audit evidence about the amounts and disclosures in the consoli–dated financial statements. The procedures selected depend on the auditor’s judgment, including the assessment of the risks of material misstatement of the consolidated financial statements, whether due to fraud or error. In making hose risk assessments, the auditor considers internal control relevant to the entity’s preparation and fair presentation of the consolidated financial statements in order to design audit procedures that are appropriate in the circumstances, but not for the purpose of expressing an opinion on the effectiveness of the entity’s internal control. An audit also includes evaluating the appropriateness of accounting policies used and the reasonableness of accounting estimates made by management, as well as evaluating the overall presentation of the consolidated financial statements.We believe that the audit evidence we have obtained is sufficient and appropriate to provide a basis for our audit.
OpinionIn our opinion, the consolidated financial statements present fairly, in all material respects, the financial position of the company and its subsidiaries as at 31 December 2015 and of their financial performance and cash flows for the short financial year then ended in accordance with International Financial Reporting Standards as adopted by the EU.
Hamburg, 11 February 2016
Ernst & Young GmbH Wirtschaftsprüfungsgesellschaft
72

Publication details
Published by
Senvion GmbH
Concept, Text, Editing, Realisation
Senvion Holding GmbH, Corporate Communications, Verena Puth
Juliane Hollenhorst PR
Design
Senvion GmbH/Marketing
Verinion GbR
Print/Processing
Müller Ditzen AG
Editorial Deadline: January, 31 2016

For our international contacts, please visit:www.senvion.com
Consolidated Financial Statements 2015
Senvion GmbH
Überseering 10
22297 Hamburg
Germany
T + 49 40 5555 090-0
F + 49 40 5555 090-3999
www.senvion.com
Legal reference
This Annual Report contains statements oriented to future developments which are based on
our current assumptions and prognoses. As a result of known as well as unknown risks,
uncertainty and influences, the actual results, financial situation or development may deviate from
the assumptions presented in this document. We shall not assume any obligation to
update any statements tuned to future developments.


![[Our Great Work!] - Getting People Hooked on Yoghurt, by Media Contacts Philippines](https://static.fdocuments.net/doc/165x107/5456d049af795998788b4ef9/our-great-work-getting-people-hooked-on-yoghurt-by-media-contacts-philippines.jpg)


