
FOR IMMEDIATE RELEASE Toyota Tsusho … FOR IMMEDIATE RELEASE Toyota Tsusho Corporation Reports...
23
1 FOR IMMEDIATE RELEASE Toyota Tsusho Corporation Reports Earnings for the Fiscal Year Ended March 31, 2017 Nagoya, Japan; April 28, 2017 — Toyota Tsusho Corporation (TSE: 8015) reported consolidated net sales of 7,919.663 billion yen and profit attributable to owners of the parent of 102.597 billion yen, or 291.56 yen per share, for the fiscal year ended March 31, 2017. 1. Consolidated Results of Operations In the fiscal year ended March 31, 2017, overall global economic growth picked up as the emerging market economic slowdown came to a halt while the U.S. and European economies held firm. The U.S. economic recovery remained intact, fueled by robust personal consumption, improvement in the employment and income environments, growth in capital investment and equity market gains driven by optimism about the new administration’s economic and fiscal policies, most notably tax reform and infrastructure investment. The European economy gradually recovered despite uncertainty stemming from the UK's impending exit from the EU. Its recovery was fueled by domestic demand growth underpinned by monetary accommodation, an improving employment environment and export growth. The Chinese economy remained in a lull. Although bolstered by consumer spending on homes, autos and other goods in response to government policies, the Chinese economy was weighed down by corporate deleveraging and efforts to reduce excess production capacity. Emerging market economies slowly recovered as local economic sentiment improved, largely in response to resurgent resource prices. Against such a backdrop, the Japanese economy continued to recover, driven largely by robust capital investment and growth in exports to Europe, the Americas and Asia. Amid such an environment, the Toyota Tsusho Group's consolidated net sales for the fiscal year ended March 31, 2017, decreased 250.6 billion yen (3.1%) year on year to 7,919.6 billion yen, largely as a result of yen appreciation. Consolidated operating income increased 6.357 billion yen (4.5%) to 146.656 billion yen from 140.299 billion yen in the previous fiscal year, largely by virtue of a reduction in selling, general and administrative expenses. Consolidated ordinary income increased 30.184 billion yen (23.6%) to 158.279 billion yen from 128.095 billion yen in the previous fiscal year. Consolidated profit attributable to owners of the parent was 102.597 billion yen, a 146.311 billion yen improvement from the previous fiscal year’s 43.714 billion yen loss attributable to owners of the parent. The improvement was largely attributable to reduction in extraordinary losses and a decrease in tax expenses as a result of a switch to accounting for income taxes predicated on application of consolidated taxation. Segment Information Effective April 1, 2016, the erstwhile Food & Agribusiness Division and Consumer Products & Services Division were combined to form the Food & Consumer Services Division.
Transcript of FOR IMMEDIATE RELEASE Toyota Tsusho … FOR IMMEDIATE RELEASE Toyota Tsusho Corporation Reports...
1
FOR IMMEDIATE RELEASE
Toyota Tsusho Corporation Reports Earnings forthe Fiscal Year Ended March 31, 2017
Nagoya, Japan; April 28, 2017 — Toyota Tsusho Corporation (TSE: 8015) reported consolidated net sales of 7,919.663 billion yen and profit attributable to owners of the parent of 102.597 billion yen, or 291.56 yen per share, for the fiscal year ended March 31, 2017.
1. Consolidated Results of Operations
In the fiscal year ended March 31, 2017, overall global economic growth picked up as the emerging market economic slowdown came to a halt while the U.S. and European economies held firm.
The U.S. economic recovery remained intact, fueled by robust personal consumption,improvement in the employment and income environments, growth in capital investment and equity market gains driven by optimism about the new administration’s economic and fiscal policies, most notably tax reform and infrastructure investment. The European economy gradually recovered despite uncertainty stemming from the UK's impending exit from the EU. Its recovery was fueled by domestic demand growth underpinned by monetary accommodation, an improving employment environment and export growth. The Chinese economy remained in a lull. Although bolstered by consumer spending on homes, autos and other goods in response to government policies, the Chinese economy was weighed down by corporate deleveraging and efforts to reduce excess production capacity. Emerging market economies slowly recovered as local economic sentiment improved, largely in response to resurgent resource prices.
Against such a backdrop, the Japanese economy continued to recover, driven largely by robust capital investment and growth in exports to Europe, the Americas and Asia.
Amid such an environment, the Toyota Tsusho Group's consolidated net sales for the fiscal year ended March 31, 2017, decreased 250.6 billion yen (3.1%) year on year to 7,919.6 billion yen, largely as a result of yen appreciation. Consolidated operating income increased 6.357 billion yen (4.5%) to 146.656 billion yen from 140.299 billion yen in the previous fiscal year, largely by virtue of a reduction in selling, general and administrative expenses.Consolidated ordinary income increased 30.184 billion yen (23.6%) to 158.279 billion yen from 128.095 billion yen in the previous fiscal year. Consolidated profit attributable to owners of the parent was 102.597 billion yen, a 146.311 billion yen improvement from theprevious fiscal year’s 43.714 billion yen loss attributable to owners of the parent. The improvement was largely attributable to reduction in extraordinary losses and a decrease in tax expenses as a result of a switch to accounting for income taxes predicated on application of consolidated taxation.
Segment Information
Effective April 1, 2016, the erstwhile Food & Agribusiness Division and Consumer Products & Services Division were combined to form the Food & Consumer Services Division.

2
Effective April 1, 2017, product divisions’ African operations were consolidated into the newly established Africa Division.
MetalsNet sales decreased 94.8 billion yen (5.2%) year on year to 1,722.6 billion yen.
In the automotive steel business, TT Steel Service India Private Ltd., a sheet-steel importer, warehouser and processer, is constructing a branch plant in India that is scheduled to commence operation in May 2017. In the nonferrous metals business, subsidiary Toyotsu Rare Earths Corporation was merged into Toyotsu Material Inc. to improve profitability and governance and unify channels for sourcing and stably supplying metal raw materials. The post-merger Toyotsu Material Inc. has been expanding its operations and services since April 1, 2017. In Mexico, TOYOTSU SMELTING TECHNOLOGY MEXICO, S.A. DE C.V.commenced commercial production in the aim of stably producing and supplying smeltedaluminum for die-cast auto parts.
Global Parts & LogisticsNet sales decreased 51.9 billion yen (5.2%) year on year to 947.1 billion yen.
The Group entered into a distribution agreement with Ballard Power Systems Inc., one of the world’s foremost fuel-cell developers and manufacturers, and commenced sales of Ballard fuel cells in the Japanese market. In Kenya, the Group joined forces with Bolloré Transport & Logistics Kenya Limited and NYK Line to jointly establish Bolloré NYK Auto Logistics Limited, a vehicle logistics company.
AutomotiveNet sales decreased 105.4 billion yen (8.4%) year on year to 1,146.9 billion yen.
In Japan, the Group teamed up with leading Korean tire manufacturer NEXEN TIRE Corporation to establish and commence operations of NEXEN TIRE JAPAN INC., an importer and distributor of NEXEN tires. By entering the tire distribution business, the Group aims to expand its aftermarket auto parts value chain. In Uganda, TOYOTA UGANDA LTD., a Toyota vehicle importer and dealer, expanded its network by opening its fourth auto dealership and service center in Uganda.
Machinery, Energy & ProjectNet sales increased 251.3 billion yen (15.7%) year on year to 1,851.6 billion yen.
Group company Eurus Energy Holdings Corporation entered the wind power business in Finland and the Netherlands. It now has projects in 11 countries throughout the world. In January 2017, it completed construction and commenced operation of a large-scale solar power plant in Hawaii. In Iraq, the Group was awarded a contract for construction of stationary and mobile substations by the Iraqi Ministry of Electricity.
Chemicals & ElectronicsNet sales decreased 161.0 billion yen (8.4%) year on year to 1,762.7 billion yen.
In the chemical and synthetic resin business, Toyota Tsusho Fertilizer Africa Limited began developing, manufacturing and selling fertilizer optimized for local soil, in Kenya. In the electronics business, the Group merged Tomen Electronics Corporation and Toyota Tsusho Electronics Corporation to form NEXTY Electronics Corporation, which commenced operations on April 1, 2017.

3
Food & Consumer ServicesNet sales decreased 90.2 billion yen (15.7%) year on year to 484.0 billion yen.
In the food business, investee Country Pure Foods, Inc., a U.S. fruit juice maker co-owned with Sapporo International Inc., acquired the frozen fruit juice business of The Ridgefield's Brand Corporation, Inc., a U.S. commercial frozen fruit juice manufacturer. In the consumer services business, the newly constructed second phase of the AXIA SOUTH CIKARANGresidential hotel complex for long-term residents and business travelers opened for business in Indonesia.
Outlook for Fiscal Year Ending March 31, 2018For the fiscal year ending March 31, 2018, the Company is forecasting 110.0 billion yen of profit attributable to owners of the parent.
Beginning with its consolidated financial statements in its Securities Report for the fiscal year ended March 31, 2017, the Company will voluntarily adopt International Financial Reporting Standards (IFRS). The Company has accordingly prepared its consolidated earnings forecast for the fiscal year ending March 31, 2018, on an IFRS basis.
Consolidated Financial Condition(1) Assets, Liabilities, and Net AssetsAt March 31, 2017, consolidated assets totaled 4,096.8 billion yen, a 144.7 billion yen increase from March 31, 2016. The increase was most notably attributable to a 68.2 billion yen increase in cash and deposits, 47.5 billion yen increase in investment securities and 46.2 billion yen increase in trade notes and accounts receivable.
Consolidated liabilities at March 31, 2017, totaled 2,944.8 billion yen, a 48.5 billion yen increase from March 31, 2016. The increase was mainly attributable to a 65.8 billion yen increase in trade notes and accounts payable.
Consolidated net assets at March 31, 2017, totaled 1,151.9 billion yen, a 96.2 billion yen increase from March 31, 2016. The increase was mostly the net result of an 80.3 billion yen increase in retained earnings mainly derived from profit attributable to owners of the parent, a 33.4 billion yen increase in valuation difference on available-for-sale securities and a 31.7 billion yen decrease in foreign currency translation adjustment.
(2) Cash FlowsCash and cash equivalents (“cash”) at March 31, 2017, totaled 430.517 billion yen, a 31.326 billion yen increase from March 31, 2016. The increase was attributable to positive cash flow from operating activities, partially offset by negative cash flows from investing and financing activities.
Cash flows from operating activitiesOperating activities provided net cash of 193.769 billion yen (114.569 billion yen less than in the previous fiscal year). The net cash inflow came largely from profit before income taxes.
Cash flows from investing activitiesInvesting activities used net cash of 130.428 billion yen (40.411 billion yen less than in the previous fiscal year), mainly for property and equipment purchases.

4
Cash flows from financing activitiesFinancing activities used net cash of 28.343 billion yen (196.859 billion yen less than in the previous fiscal year), largely to pay dividends.
DividendsThe Company aims to pay dividends equivalent to 25% of its consolidated profit before goodwill amortization in accord with its policy of providing stable, ongoing shareholder returns.
For the fiscal year ended March 31, 2017, the Company plans to pay a year-end dividend of 39 yen per share. Including the previously paid interim dividend of 31 yen per share,dividends for the fiscal year ended March 31, 2017, will total 70 yen per share, an increase of eight yen per share from the previous fiscal year.
Going forward, the Company will continue to endeavor to maintain a stable dividend and increase its dividend per share as usual. From the fiscal year ending March 31, 2018, onward, the Company aims to pay dividends equivalent to more than 25% of its consolidated profit before goodwill amortization to meet shareholders’ dividend expectations.
In accord with this revised dividend policy, the Company plans to pay annual dividends forthe fiscal year ending March 31, 2018, of 78 yen per share, consisting of an interim dividend of 39 yen and year-end dividend of 39 yen per share, assuming that it earns 110 billion yen of consolidated profit attributable to owners of the parent, in line with its current forecast.
The Company intends to use internally retained earnings to further enhance and strengthen its operational foundation and invest in business expansion to ensure future shareholder returns.
To enable the Company to flexibly distribute earnings to shareholders in the future, its Articles of Incorporation authorize it to distribute retained earnings and/or additional paid-in capital to shareholders pursuant to a Board of Directors’ resolution in accordance with Article 459(1) of the Companies Act. For the time being, however, the Company plans to continue paying dividends twice a year as usual.
2. Basic Approach to Selection of Accounting StandardsThe Company will voluntarily adopt International Financial Reporting Standards (IFRS), beginning with its consolidated financial statements in its Securities Report for the fiscal year ended March 31, 2017 (its 96th fiscal year).

5
3. Financial Statements(1) Consolidated Balance Sheets
(Unit: Millions of yen)As of
March 31, 2016As of
March 31, 2017Amount Amount
AssetsCurrent assets:Cash and deposits 408,310 476,559Notes and accounts receivable - trade 1,198,337 1,244,532Inventories 580,051 586,097Deferred tax assets 11,600 16,693Other 260,679 243,524Allowance for doubtful accounts (33,086) (33,456)Total current assets 2,425,894 2,533,950
Non-current assets:Property, plant and equipment
Buildings and structures 349,206 360,572Accumulated depreciation (152,174) (161,937)Buildings and structures, net 197,032 198,634
Machinery, equipment and vehicles 485,889 533,707Accumulated depreciation (231,782) (257,551)Machinery, equipment and vehicles, net 254,107 276,156
Land 88,752 87,908Leased assets 24,616 17,889
Accumulated depreciation (13,856) (6,086)Leased assets, net 10,759 11,802
Construction in progress 32,636 36,676Other 42,860 46,020
Accumulated depreciation (27,862) (30,033)Other, net 14,998 15,987
Total property, plant and equipment 598,286 627,164Intangible assets:
Goodwill 135,948 108,652Leased assets 16 8Other 137,832 124,433Total intangible assets 273,797 233,094
Investments and other assets:Investment securities 476,774 524,250Other investments 54,165 43,758Long-term loans receivable 25,789 26,843Net defined benefit asset 9,694 11,219Deferred tax assets 22,833 23,059Other 75,128 86,213Allowance for doubtful accounts (10,264) (12,712)Total investments and other assets 654,122 702,632
Total non-current assets 1,526,205 1,562,892Total assets 3,952,100 4,096,843

6
(Unit: Millions of yen)As of
March 31, 2016As of
March 31, 2017Amount Amount
LiabilitiesCurrent liabilities:
Notes and accounts payable - trade 867,302 933,179Short-term loans payable 468,903 487,611Commercial papers 40,000 -Current portion of bonds 26,042 -Lease obligations 2,717 2,827Income taxes payable 27,210 28,514Deferred tax liabilities 6,206 5,273Reserve for directors’ bonuses 328 781Provision for loss on litigation 616 314Other 297,862 286,681Total current liabilities 1,737,191 1,745,183
Non-current liabilities:Bonds payable 110,000 150,000Long-term loans payable 860,583 883,110Lease obligations 2,851 3,238Deferred tax liabilities 85,631 67,642Directors’ retirement benefit liabilities 678 478Provision for loss on guarantees 55 850Provision for loss on allowance for liquidation of affiliated companies 523 373
Provision for contract loss 1,697 535Provision for loss on litigation 380 379Net defined benefit liability 36,917 36,632Other 59,810 56,451Total non-current liabilities 1,159,130 1,199,691
Total liabilities 2,896,322 2,944,874Net assets
Shareholders’ equity:Capital stock 64,936 64,936Capital surplus 153,725 150,190Retained earnings 562,417 642,732Treasury shares (3,623) (3,540)Total shareholders’ equity 777,455 854,318
Accumulated other comprehensive income: Valuation difference on available-for-sale securities 96,043 129,459
Deferred gains or losses on hedges (25,983) (13,473)Foreign currency translation adjustment 46,993 15,231Remeasurements of defined benefit plans (5,871) (2,294)Total accumulated other comprehensive income 111,180 128,923
Subscription rights to shares 37 -Non-controlling interests 167,103 168,727
Total net assets 1,055,777 1,151,969Total liabilities and net assets 3,952,100 4,096,843

7
(2) Consolidated Statements of Income and Comprehensive IncomeConsolidated Statements of Income
(Unit: Millions of yen)Year ended
March 31, 2016Year ended
March 31, 2017Amount Amount
Net sales 8,170,237 7,919,663Cost of sales 7,554,195 7,340,775Gross profit 616,042 578,887Selling, general and administrative expenses
Commission fee 40,360 35,759Traveling and transportation expenses 20,118 18,553Communication expenses 4,972 4,563Provision of allowance for doubtful accounts 7,802 5,396Salaries and allowances 184,676 177,152Retirement benefit expenses 5,014 6,113Welfare expenses 33,141 31,504Rent expenses 27,461 26,689Depreciation 38,403 35,104Taxes and dues 7,696 7,929Amortization of goodwill 36,399 20,328Other 69,696 63,136Total selling, general and administrative expenses 475,742 432,231
Operating income 140,299 146,656Other income:
Interest income 8,090 7,473Dividend income 19,850 18,756Share of profit of entities accounted for using equity method - 10,254
Other income 13,825 14,419Total other income 41,766 50,904
Other expenses:Interest expense 28,247 25,869Share of loss of entities accounted for using equity method 5,676 -
Foreign exchange loss 11,074 1,622Other expenses 8,973 11,788Total other expenses 53,970 39,280
Ordinary income 128,095 158,279Extraordinary income:
Gain on sales of non-current assets 4,227 5,379Gain on sales of investment securities and investments in capital 5,557 3,688
Gain on sale of golf membership 2 2Gain on liquidation of subsidiaries and associates 421 31Gain on reversal of provision for loss on guarantees 7 -Gain on reversal of allowance for liquidation of affiliated companies 743 290
Gain on bargain purchase 262 -Gain on reversal of subscription rights to shares 17 12Gain on reversal of asset retirement obligations - 1,448Total extraordinary income 11,239 10,853

8
(Unit: Millions of yen)Year ended
March 31, 2016Year ended
March 31, 2017Amount Amount
Extraordinary losses:Loss on disposal of non-current assets 2,462 3,808Impairment of property and intangible assets 64,859 2,225Loss on sales of investment securities and investments in capital 1,427 116
Loss on valuation of investment securities and investments in capital 8,502 2,260
Loss on valuation of golf membership 99 13Loss on liquidation of subsidiaries and associates 7 5,239Bad debts loss 4,398 -Provision of allowance for doubtful accounts - 2,787Provision for loss on guarantees 22 583Loss on provision for liquidation of affiliated companies 242 221Provision for loss on contracts 77 -Loss on cancellation of contract 8,288 -Special retirement expenses 2,409 2,452Loss on disaster - 1,372Total extraordinary losses 92,799 21,081
Profit before income taxes 46,535 148,051Income taxes:
Current 57,935 55,712Deferred 11,840 (30,639)Total income taxes 69,776 25,072
Profit (loss) (23,240) 122,979Profit attributable to non-controlling interests 20,473 20,381Profit (loss) attributable to owners of the parent (43,714) 102,597

9
Consolidated Statements of Comprehensive Income
(Unit: Millions of yen)Year ended
March 31, 2016Year ended
March 31, 2017Amount Amount
Profit (loss) (23,240) 122,979Other comprehensive income:
Valuation difference on available-for-sale securities (41,348) 32,722Deferred gains or losses on hedges (12,358) 12,873Foreign currency translation adjustment (109,726) (27,209)Remeasurements of defined benefit plans (9,833) 3,544Share of other comprehensive income of entities accounted for using equity method (6,737) (5,986)
Total other comprehensive income (180,003) 15,943Comprehensive income (203,244) 138,922
Components:Comprehensive income attributable to owners of the parent (213,576) 120,318
Comprehensive income attributable to non-controlling interests 10,332 18,604

10
(3) Consolidated Statements of Changes in Net Assets Year ended March 31, 2016 (April 1, 2015– March 31, 2016)
(Unit: Millions of yen)Shareholders’ Equity
Capital stock Capital surplus Retained earnings Treasury stock Total shareholders’ equity
Balance at beginning of year 64,936 155,021 628,399 (3,858) 844,499Increase (decrease) during the termCash dividends paid (20,767) (20,767)Profit (loss) attributable to owners of the parent (43,714) (43,714)
Purchase of treasury stock (38) (38)Disposition of treasury stock 33 273 306Change in equity attributable to parent arising from transactions with non-controlling shareholders
(1,329) (1,329)
Effect from change in scope of consolidated subsidiaries (305) (305)
Effect from change in scope of entities accounted for using equity method
(1,172) (1,172)
Other (22) (0) (22)Net increase (decrease) during the term, except for items under shareholders’ equity
Total increase (decrease) - (1,296) (65,981) 234 (67,043)
Balance at end of year 64,936 153,725 562,417 (3,623) 777,455
Accumulated other comprehensive incomeSubscription
rights to shares
Non-controlling
interestsTotal net
assetsValuation
difference onavailable-for-
sale securities
Deferred gains or losses on hedges
Foreign currency
translation adjustment
Remeasurements of defined
benefit plans
Total accumulated
other comprehensive
incomeBalance at beginning of year 137,976 (15,797) 154,903 3,930 281,012 127 178,844 1,304,483
Increase (decrease) during the termCash dividends paid (20,767)Profit (loss) attributable to owners of the parent (43,714)
Purchase of treasury stock (38)Disposition of treasury stock 306Change in equity attributable to parent arising from transactions with non-controlling shareholders
(1,329)
Effect from change in scope of consolidated subsidiaries (305)
Effect from change in scope of entities accounted for using equity method
(1,172)
Other (22)Net increase (decrease) during the term, except for items under shareholders’ equity
(41,933) (10,185) (107,910) (9,802) (169,831) (89) (11,740) (181,662)
Total increase (decrease) (41,933) (10,185) (107,910) (9,802) (169,831) (89) (11,740) (248,705)
Balance at end of year 96,043 (25,983) 46,993 (5,871) 111,180 37 167,103 1,055,777

11
Year ended March 31, 2017 (April 1, 2016– March 31, 2017)(Unit: Millions of yen)
Shareholders’ Equity
Capital stock Capital surplus Retained earnings Treasury stock Total shareholders’ equity
Balance at beginning of year 64,936 153,725 562,417 (3,623) 777,455Increase (decrease) during the termCash dividends paid (21,829) (21,829)Profit (loss) attributable to owners of the parent 102,597 102,597
Purchase of treasury stock (25) (25)Disposition of treasury stock 5 107 113Change in equity attributable to parent arising from transactions with non-controlling shareholders
(3,053) (3,053)
Effect from change in scope of consolidated subsidiaries (38) (38)
Effect from change in scope of entities accounted for using equity method
(165) (165)
Other (487) (248) (0) (735)Net increase (decrease) during the term, except for items under shareholders’ equity
Total increase (decrease) - (3,535) 80,314 82 76,862
Balance at end of year 64,936 150,190 642,732 (3,540) 854,318
Accumulated other comprehensive incomeSubscription
rights to shares
Non-controlling
interestsTotal net
assetsValuation
difference on available-for-
sale securities
Deferred gains or losses on hedges
Foreign currency
translation adjustment
Remeasurements of defined
benefit plans
Total accumulated
other comprehensive
incomeBalance at beginning of year 96,043 (25,983) 46,993 (5,871) 111,180 37 167,103 1,055,777
Increase (decrease) during the termCash dividends paid (21,829)Profit (loss) attributable to owners of the parent 102,597
Purchase of treasury stock (25)Disposition of treasury stock 113Change in equity attributable to parent arising from transactions with non-controlling shareholders
(3,053)
Effect from change in scope of consolidated subsidiaries (38)
Effect from change in scope of entities accounted for using equity method
(165)
Other (735)Net increase (decrease) during the term, except for items under shareholders’ equity
33,416 12,510 (31,761) 3,577 17,742 (37) 1,624 19,328
Total increase (decrease) 33,416 12,510 (31,761) 3,577 17,742 (37) 1,624 96,191
Balance at end of year 129,459 (13,473) 15,231 (2,294) 128,923 - 168,727 1,151,969
12
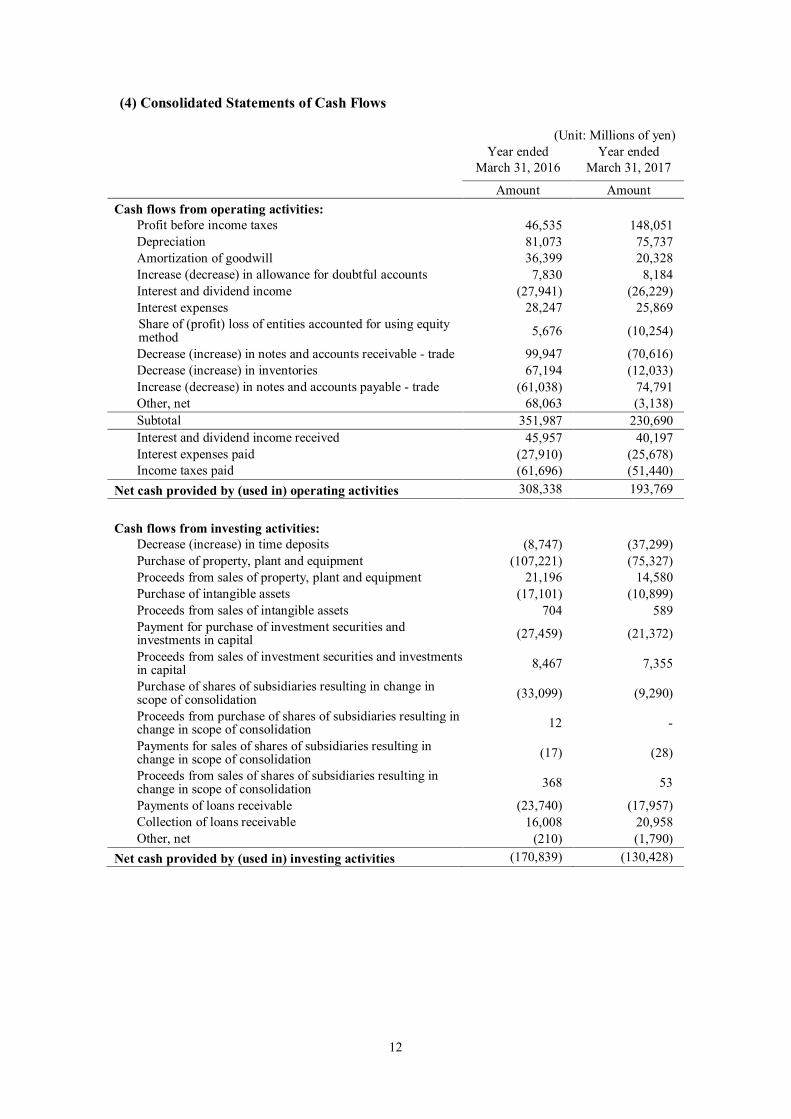
(4) Consolidated Statements of Cash Flows
(Unit: Millions of yen)Year ended
March 31, 2016Year ended
March 31, 2017
Amount AmountCash flows from operating activities:
Profit before income taxes 46,535 148,051Depreciation 81,073 75,737Amortization of goodwill 36,399 20,328Increase (decrease) in allowance for doubtful accounts 7,830 8,184Interest and dividend income (27,941) (26,229)Interest expenses 28,247 25,869Share of (profit) loss of entities accounted for using equity method 5,676 (10,254)
Decrease (increase) in notes and accounts receivable - trade 99,947 (70,616)Decrease (increase) in inventories 67,194 (12,033)Increase (decrease) in notes and accounts payable - trade (61,038) 74,791Other, net 68,063 (3,138)Subtotal 351,987 230,690Interest and dividend income received 45,957 40,197Interest expenses paid (27,910) (25,678)Income taxes paid (61,696) (51,440)
Net cash provided by (used in) operating activities 308,338 193,769
Cash flows from investing activities:Decrease (increase) in time deposits (8,747) (37,299)Purchase of property, plant and equipment (107,221) (75,327)Proceeds from sales of property, plant and equipment 21,196 14,580Purchase of intangible assets (17,101) (10,899)Proceeds from sales of intangible assets 704 589Payment for purchase of investment securities and investments in capital (27,459) (21,372)
Proceeds from sales of investment securities and investments in capital 8,467 7,355
Purchase of shares of subsidiaries resulting in change in scope of consolidation (33,099) (9,290)
Proceeds from purchase of shares of subsidiaries resulting in change in scope of consolidation 12 -
Payments for sales of shares of subsidiaries resulting in change in scope of consolidation (17) (28)
Proceeds from sales of shares of subsidiaries resulting in change in scope of consolidation 368 53
Payments of loans receivable (23,740) (17,957)Collection of loans receivable 16,008 20,958Other, net (210) (1,790)
Net cash provided by (used in) investing activities (170,839) (130,428)

13
(Unit: Millions of yen)
Year ended March 31, 2016
Year ended March 31, 2017
Amount AmountCash flows from financing activities:
Net increase (decrease) in short-term loans payable (206,487) (47,010)Proceeds from long-term loans payable 159,802 153,565Repayments of long-term loans payable (141,420) (105,793)Proceeds from issuance of bonds 20,000 40,000Redemption of bonds (10,000) (25,992)Purchase of treasury shares (38) (25)Proceeds from share issuance to non-controlling shareholders 509 1,516
Cash dividends paid (20,767) (21,829)Dividends paid to non-controlling interests (16,078) (14,575)Payments from changes in ownership interests in subsidiaries that do not result in change in scope of consolidation
(5,197) (5,689)
Proceeds from changes in ownership interests in subsidiaries that do not result in change in scope of consolidation
- 272
Other, net (5,524) (2,780)Net cash provided by (used in) financing activities (225,202) (28,343)
Effect of exchange rate change on cash and cash equivalents (17,632) (4,297)Net increase (decrease) in cash and cash equivalents (105,336) 30,699Cash and cash equivalents at beginning of period 499,157 399,191Cash and cash equivalents from newly consolidated subsidiaries at the beginning of the year
5,370 625
Cash and cash equivalents at end of period 399,191 430,517

14
(5) Notes on Consolidated Financial Statements
(Notes on the Going-concern Assumption)Not applicable
(Changes in accounting policies)(Implementation guidance on recoverability of deferred tax assets)Effective the fiscal year ended March 31, 2017, the Company adopted Revised Implementation Guidance on Recoverability of Deferred Tax Assets (ASBJ Guidance No. 26, revised on March 28, 2016) and made some changes to the accounting treatment related to recoverability of deferred tax assets.
The ASBJ Guidance No. 26 was adopted with transitional treatments stipulated in paragraph 49(4) of the ASBJ Guidance No. 26, and the difference between a) the amounts of deferred tax assets and deferred tax liabilities calculated with application of paragraph 49(3)(i) to (iii) of the ASBJ Guidance No. 26 as of April 1, 2016, the beginning of the fiscal year ended March 31, 2017, and b) the amounts of deferred tax assets and deferred tax liabilities as of March 31, 2016, the end of the previous fiscal year, were included in retained earnings as of the beginning of the fiscal year ended March 31, 2017.
For reference, the effect of this change was minor.
(Additional information)(Consolidated taxation system)During the fiscal year ended March 31, 2017, the Company and some of its consolidated subsidiaries applied for the adoption of consolidated taxation regime, and the consolidated taxation regime was admitted to start from the fiscal year ending March 31, 2018. In line with this, effective the fiscal year ended March 31, 2017, the Company has applied accounting procedures taking into consideration of the adoption of consolidated taxation system, based on Practical Solution on Tentative Treatment of Tax Effect Accounting Under Consolidated Taxation System (Part 1) (PITF No.5 revised on January 16, 2015) and Practical Solution on Tentative Treatment of Tax Effect Accounting Under Consolidated Taxation System (Part 2) (PITF No.7, revised on January 16, 2015).
Due to the change, tax expenses (income taxes current and income taxes deferred) were 25,184 million yen lower.

15
(Segment information)1. Overview of Reportable Segments
The Toyota Tsusho Group’s reportable segments are components of the Group about which separate financial information is available. These segments are subject to periodic examinations to enable the Company’s board of directors to decide how to allocate resources and assess performance.
The main business of the Toyota Tsusho Group is buying and selling of various goods in Japan and overseas. The Group is also engaged in a wide range of business including manufacturing, processing and selling products, investments, and providing services. The Group’s operations are segmented based on product and service categories into six segments, namely Metals, Global Parts & Logistics, Automotive, Machinery, Energy & Project, Chemicals & Electronics, and Food & Consumer Services. These segments correspond to the Group’s six business divisions. The business of each segment is conducted by the Company’s business divisions and affiliates directly supervised by each business division.
The businesses of each division are listed below. For reference, from April 1, 2017, product divisions’ African operations were consolidated into the newly established Africa Division.
Metals Division The Metals Division mainly handles ordinary and special steel products, steel construction materials, nonferrous metal ingots and precious metals, rolled light-metal products, copper alloy products, scrap iron and scrap nonferrous metals, ferroalloy products, wrought iron, recycling of end-of-life vehicles (ELVs) and auto parts, waste catalyst, rare earth resources and rare metals. The division manufactures, processes, sells, and disposes of the products listed above.
Global Parts & Logistics DivisionThe Global Parts & Logistics Division mainly manufactures, sells, and provides services for automotive parts, as well as running a logistics business and a tire assembly business.
Automotive Division The Automotive Division mainly handles passenger vehicles, commercial vehicles, two-wheeled vehicles, trucks and buses, industrial vehicles, and automotive parts. The division imports, sells and provides services for the products listed above as well as operates peripheral businesses such as small and medium-scale production, body mounting and conversion, used vehicle sales, and captive finance and lease.
Machinery, Energy & Project Division The Machinery, Energy & Project Division mainly handles machine tools, testing and measuring instruments, electronic machinery, environmental equipment, coal, crude oil, natural gas products, petroleum products, liquefied petroleum gas (LPG), infrastructure projects, construction machinery, and industrial machinery. The division sells and provides services relevant to the products listed above as well as runs an energy and electric power supply business and water treatment business.
Chemicals & Electronics DivisionThe Chemicals & Electronics Division sells and provides services for component parts for automobile production, electronic devices and semiconductors, modular product, automotive embedded software development, network integration and support, information communication equipment, overseas IT infrastructure exports, PCs, PC peripherals and software, and ITS (Intelligent Transport Systems) equipment. The division also handles synthetic resins, rubber, batteries and electronic materials, fine and inorganic chemicals, fat and oil products, chemical additives, pharmaceuticals, and pharmaceutical ingredients. The division processes, manufactures, sells and provides services relevant to the products listed above.
Food & Consumer Services DivisionThe Food & Consumer Services Division mainly handles livestock feed, grains, processed foods, food ingredients, agricultural, marine and livestock products, alcoholic beverages, as well as property, casualty and life insurance, brokered securities, textile products, apparel, nursing care and medical products, construction and housing materials, and office furniture. The division manufactures, processes, sells, and provides services relevant to the products listed above as well as operates general hospitals and hotel residences.

16
2. Sales, income/loss, assets, and other items by reportable segmentI. Year ended March 31, 2016 (April 1, 2015 to March 31, 2016)
(Unit: Millions of yen)Reportable segment
Other *1 TotalAdjustments
*2
Amounts on the
consolidated financial
statements *3Metals
Global Parts &
Logistics Automotive
Machinery, Energy
&Project
Chemicals&
Electronics
Food & Consumer Services Total
Net salesOutside customers
1,817,408 999,011 1,252,333 1,600,311 1,923,778 574,298 8,167,142 3,094 8,170,237 - 8,170,237
Inter-segment 801 3,122 30 427 5,962 862 11,205 533 11,739 (11,739) -Total 1,818,210 1,002,133 1,252,364 1,600,738 1,929,740 575,161 8,178,348 3,628 8,181,976 (11,739) 8,170,237
Segment income (loss)
37,445 21,692 37,968 21,374 24,950 8,656 152,087 (11,803) 140,284 15 140,299
Segment assets 745,751 320,896 652,814 638,748 733,652 320,189 3,412,052 689,454 4,101,507 (149,407) 3,952,100Other itemsDepreciation 11,664 6,959 23,461 20,367 6,523 6,141 75,118 6,012 81,130 - 81,130
Investment in entities accounted for using equity method
15,037 19,511 27,782 56,079 57,399 26,491 202,302 14,560 216,862 - 216,862
Increase in property, plant and equipment and intangible assets
12,929 4,929 31,192 47,855 7,992 10,544 115,443 6,545 121,989 - 121,989
Notes: 1. “Other” comprises businesses that are not included in reportable segments, such as functional services which provide operation support to the whole Group.
2. Figures in “Adjustments” for the “Segment income (loss)” and the “Segment assets” rows mainly represent the amounts of inter-segment transactions.
3. Segment income (loss) is adjusted based on operating income on the consolidated financial statements.

17
II Year ended March 31, 2017 (April 1, 2016 to March 31, 2017)(Unit: Millions of yen)
Reportable segment
Other *1 TotalAdjustments
*2
Amounts on the
consolidated financial
statements *3Metals
Global Parts &
Logistics Automotive
Machinery, Energy
&Project
Chemicals&
Electronics
Food & Consumer Services Total
Net salesOutside customers
1,722,631 947,197 1,146,973 1,851,668 1,762,759 484,081 7,915,312 4,350 7,919,663 - 7,919,663
Inter-segment 559 3,009 38 792 6,102 1,139 11,641 586 12,228 (12,228) -Total 1,723,191 950,206 1,147,011 1,852,460 1,768,862 485,220 7,926,954 4,937 7,931,891 (12,228) 7,919,663
Segment income (loss)
41,684 20,876 26,140 20,192 37,009 10,176 156,081 (9,441) 146,639 16 146,656
Segment assets 775,363 328,408 632,018 657,310 744,859 323,957 3,461,917 823,106 4,285,024 (188,180) 4,096,843Other itemsDepreciation 10,897 5,642 22,324 18,881 5,998 6,482 70,227 5,510 75,737 - 75,737
Investment in entities accounted for using equity method
16,367 16,337 29,209 52,398 57,744 32,476 204,533 10,237 214,771 - 214,771
Increase in property, plant and equipment and intangible assets
11,390 3,854 22,029 26,238 7,387 5,748 76,649 11,732 88,382 - 88,382
Notes: 1. “Other” comprises businesses that are not included in reportable segments, such as functional services which provide operation support to the whole Group.
2. Figures in “Adjustments” for the “Segment income (loss)” and the “Segment assets” rows mainly represent the amounts of inter-segment transactions.
3. Segment income (loss) is adjusted based on operating income on the consolidated financial statements.
3. Changes in Reportable SegmentEffective the fiscal year ended March 31, 2017, the Food & Agribusiness Division and the Consumer Products & Services Division have been integrated into the Food & Consumer Services Division. In line with this, the segment information for the fiscal year ended March 31, 2016 has been recast to reflect this change.

18
(Per Share Information)Year ended
March 31, 2016(April 1, 2015 to March 31, 2016)
Year endedMarch 31, 2017(April 1, 2016 to March 31, 2017)
Net assets per share (yen) 2,525.69 2,794.14
Profit (loss) per share (yen) (124.26) 291.56Profit per share - fully diluted (yen) - 291.56(Note) 1. Profit per share-fully diluted for the fiscal year ended March 31, 2016 is not indicated, though the
Company has dilutive shares, because a net loss was recorded for the period.2. Basis for calculation of profit (loss) per share and profit per share-fully diluted are as follows.
Year endedMarch 31, 2016
(April 1, 2015 to March 31, 2016)
Year endedMarch 31, 2017(April 1, 2016 to March 31, 2017)
Profit (loss) per shareProfit (loss) attributable to owners of the parent(millions of yen) (43,714) 102,597
Amount not attributable to common stock shareholders (millions of yen) - -
Profit (loss) attributable to common stockholders of owners of the parent (millions of yen) (43,714) 102,597
Average number of common stock shares outstanding (thousands of shares) 351,804 351,884
Profit per share - fully diluted Adjustments to profit attributable to owners of the parent (millions of yen) - -
Increase in the number of common stock shares (thousands of shares) - 11
[Of which share option (subscription rights to shares)] (thousands of shares)
- [11]
Residual securities not included in the calculation for profit per share – fully diluted because they have no dilutive effect
―――― ――――
(Material Subsequent Events)Not applicable

19
4. Outline of Consolidated Results for the Year ended March 31, 2017(April 1, 2016 to March 31, 2017)
(1) Operating Results(Unit: Billions of yen)
Consolidated
Year ended March 31, 2017
Year ended March 31, 2016
Year-on-year change
Amount %Net sales 7,919.6 8,170.2 (250.6) (3.1)Gross profit 578.8 616.0 (37.2) (6.0)SG & A expenses 432.2 475.7 (43.5) -Operating income 146.6 140.2 6.4 4.5
Interest income and expense (18.3) (20.1) 1.8 -Dividend income 18.7 19.8 (1.1) -Share of profit (loss) of entities accounted for using equity method
10.2 (5.6) 15.8 -
Other income (expenses) 1.0 (6.2) 7.2 -Ordinary income 158.2 128.0 30.2 23.6Extraordinary income (losses) (10.2) (81.5) 71.3 -Profit before income taxes 148.0 46.5 101.5 218.1
Income taxes 25.0 69.7 (44.7) -Profit (loss) 122.9 (23.2) 146.1 -Profit attributable to non-controlling interests 20.3 20.4 (0.1) -
Profit (loss) attributable to owners of the parent 102.5 (43.7) 146.2 -
Main factors behind year-on-year changes • Net sales -250.6 billion yen:
• Decrease mainly due to stronger yen which offset the increase in trading volume of petroleum products in Machinery, Energy & Project Division.
• SG & A expenses -43.5 billion yen: • Decrease due mainly to stronger yen and decrease in amortization of goodwill
• Share of profit (loss) of entities accounted for using equity method +15.8 billion yen:• Increase mainly in the Metals Division and the Chemicals & Electronics Division
• Other income/expenses +7.2 billion yen:• Increase due mainly to improvement in foreign exchange gain/loss
• Extraordinary income (losses) +71.3 billion yen:• Increase due mainly to decrease in impairment losses.
For reference:(Unit: Billions of yen)
Quarterly changes 1st quarter 2nd quarter 3rd quarter 4th quarterNet sales 1,862.8 1,806.4 2,141.0 2,109.3Operating income 30.0 29.2 46.3 41.0Ordinary income 43.3 39.1 42.2 33.5Profit attributable to owners of the parent 21.3 20.6 21.5 39.0

20
(2) Financial Position(Unit: Billions of yen)
ConsolidatedAs of
March 31, 2017As of
March 31, 2016Change versus March 31, 2016
Amount %Total assets 4,096.8 3,952.1 144.7 3.7
Current assets 2,533.9 2,425.8 108.1 4.5Investment securities and investments in capital 568.0 530.9 37.1 7.0
Other non-current assets 994.8 995.2 (0.4) (0.0)Net assets 1,151.9 1,055.7 96.2 9.1Net interest-bearing debt 1,050.2 1,102.7 (52.5) (4.8)Debt-equity ratio (times) 1.1 1.2 (0.1)Number of consolidated subsidiaries 731 698 33
Number of entities accounted for using equity method 243 233 10
Main factors behind year-on-year changes• Current assets +108.1 billion yen:
• Cash and deposits increased 68.2 billion yen • Notes and accounts receivable - trade increased 46.2 billion yen
• Investment securities and investments in capital +37.1 billion yen:• Increase due mainly to higher market value
• Net assets +96.2 billion yen:• Retained earnings increased 80.3 billion yen (profit attributable to owners of the parent of 102.5 billion yen less 21.8 billion yen dividends, etc.)
• Valuation difference on available-for-sale securities increased 33.4 billion yen• Deferred gains or losses on hedges increased 12.5 billion yen• Foreign currency translation adjustment decreased 31.7 billion yen
(3) Cash Flow Position(Unit: Billions of yen)
Year ended March 31, 2017
Year ended March 31, 2016 Major factors behind year-on-year changes
1. Cash flows from operating activities
193.7 308.3 Profit for the year ended March 31, 2017
2. Cash flows from investing activities (130.4) (170.8) Purchase of property, plant and equipment
1-2: Free cash flow 63.3 137.5Cash flows from financing
activities (28.3) (225.2) Cash dividends paid

21
(4) Consolidated Net Sales and Operating Income by Segment
*The top row for each segment indicates net sales; the bottom row indicates operating income.(Unit: Billions of yen)
Year endedMarch 31,
2017
Year endedMarch 31,
2016
Year-on-year change
Amounts affected by exchange
rates
Year-on-year change excluding amount affected
by exchange ratesAmount %
Metals1,722.6 1,817.4 (94.8) (102.3) 7.5 0.4
41.6 37.4 4.2 (3.0) 7.2 21.0Global Parts & Logistics
947.1 999.0 (51.9) (101.0) 49.1 5.520.8 21.6 (0.8) (2.0) 1.2 6.0
Automotive1,146.9 1,252.3 (105.4) (102.5) (2.9) (0.2)
26.1 37.9 (11.8) (3.8) (8.0) (23.6)Machinery, Energy & Project
1,851.6 1,600.3 251.3 (68.0) 319.3 20.820.1 21.3 (1.2) (0.3) (0.9) (4.0)
Chemicals & Electronics
1,762.7 1,923.7 (161.0) (98.1) (62.9) (3.4)37.0 24.9 12.1 (1.9) 14.0 60.7
*Food & Consumer Services
484.0 574.2 (90.2) (25.6) (64.6) (11.8)10.1 8.6 1.5 (0.8) 2.3 30.0
Total7,919.6 8,170.2 (250.6) (497.8) 247.2 3.2
146.6 140.2 6.4 (10.6) 17.0 13.1
Main factors behind year-on-year changes• Metals
Net sales and operating income:Both increased due to increase in automobile production which offset the effects of lower market price
• Global Parts & LogisticsNet sale s and operating income:
Both increased due to increase in automotive components handled overseas• Automotive
Net sales and operating income:Both decreased due to decrease in export by Toyota Tsusho Corporation as well as decrease in trading volume handled by overseas auto dealership
• Machinery, Energy & ProjectNet sales:
Increased on the back of increase in trading volume of petroleum products Operating income:
Decreased due to an offset to foreign exchange loss included in non-operating category
• Chemicals & ElectronicsNet sales:
Decreased due to decrease in trading volume of electronics-related products Operating income:
Increased due to decrease in amortization of goodwill and the effect of loss on valuation of inventories recorded in the year ended March 31, 2016
• Food & Consumer ServicesNet sales:
Decreased due to decrease in trading volume of grain imported or handled overseasOperating income:

22
Increased due to decrease in amortization of goodwill as well as the effect of an offset to foreign exchange loss included in non-operating category
* Effective April 1, 2016, the Food & Agribusiness Division and the Consumer Products & Services Division have been integrated into the Food & Consumer Services Division. In line with this, net sales and operating income for the year ended March 31, 2016 have been recast to reflect this change.
(5) Consolidated Financial Results Forecasts for the Year Ending March 31, 2018(April 1, 2017 to March 31, 2018)
(Unit: Billions of yen)Year ending
March 31, 2018Corporate
Gross profit 567.0Profit from operating activities 160.0
Profit before tax 182.0
Profit attributable to owners of the parent 110.0
By division
Metals87.026.0
Global Parts & Logistics67.016.0
Automotive77.016.0
Machinery, Energy & Project75.018.0
Chemicals & Electronics95.025.0
Food & Consumer Services45.0
5.5
*Africa118.0
6.5※Beginning with its consolidated financial statements in its Securities Report for the fiscal year ended March 31, 2017, the Company will voluntarily adopt International Financial Reporting Standards (IFRS). The Company has accordingly prepared its consolidated earnings forecast for the fiscal year ending March 31, 2018, on an IFRS basis.
※The top row for each division indicates gross profit; the bottom row indicates profit attributable to owners of the parent.
*From April 1, 2017, product divisions’ African operations were consolidated into the newly established Africa Division.

23
(6) Dividend per Share
Year endingMarch 31, 2018
(forecast)
Year endedMarch 31, 2017
Year ended March 31, 2016
Interim 39.0 yen 31.0 yen 31.0 yen
Full year 78.0 yen 70.0 yen(projected) 62.0 yen
Payout ratio (consolidated)Before amortization of goodwill 25.0% 20.1% -
(7) Changes in Major Indexes
Year endedMarch 31, 2017
(or as of March 31, 2017)
Year endedMarch 31, 2016
(or as of March 31, 2016)
Exchange rate (yen / US dollar)
Average during the period 108 120End of period 112 113
Interest rate Yen TIBOR 3M average 0.06% 0.16%US dollar LIBOR 3M average 0.86% 0.40%
Dubai oil (US dollars / bbl) 47 46Corn futures (cents / bushel) 358 371


