For and on behalf of Claydon Land Development Ltd - Luton · For and on behalf of Claydon Land...
33
For and on behalf of Claydon Land Development Ltd Examination of Luton Local Plan Representations to Inspector’s MIQs Stage 2 Hearings Matter 5 – Objectively Assessed Need for Housing and any uplift to meet affordable housing needs on behalf of Claydon Land Development Ltd Prepared by Alex J Roberts BSc (Joint Hons) Strategic Planning Research Unit DLP Planning Limited August 2016
Transcript of For and on behalf of Claydon Land Development Ltd - Luton · For and on behalf of Claydon Land...

For and on behalf of Claydon Land Development Ltd
Examination of Luton Local Plan Representations to Inspector’s MIQs Stage 2 Hearings Matter 5 – Objectively Assessed Need for Housing and
any uplift to meet affordable housing needs
on behalf of Claydon Land Development Ltd
Prepared by
Alex J Roberts BSc (Joint Hons)
Strategic Planning Research Unit DLP Planning Limited
August 2016

Examination of Luton Local Plan
Representations to Inspector’s MIQs Stage 2 Hearings Matter 5
Strategic Planning & Research Unit 4 Abbey Court V1 Velocity Building Fraser Road Ground Floor Priory Business Park Tenter Street Bedford Sheffield MK44 3WH S1 4BY Tel: 01234 832740 Tel: 01142 289190 Fax: 01234 831 266 Fax: 01142 721947
DLP Consulting Group disclaims any responsibility to the client and others in respect of matters outside the scope of this report. This report has been prepared with reasonable skill, care and diligence. This
report is confidential to the client and DLP Planning Limited accepts no responsibility of whatsoever nature to third parties to whom this report or any part thereof is made known. Any such party relies
upon the report at their own risk.
Prepared by:
Alex Roberts BSc (Joint Hons)
Associate Director
Approved by:
Roland Bolton BSc (Hons) MRTPI
Senior Director
Date:
August 2016

Examination of Luton Local Plan
Representations to Inspector’s MIQs Stage 2 Hearings Matter 5
Contents Page
Housing Market Area 6 15. Has the Luton functional HMA (which includes all of Luton, a large part of Central Bedfordshire and parts of North Hertfordshire and Aylesbury Vale) been correctly defined? 6 16. The Luton and Central Bedfordshire administrative areas are regarded as a “best fit” for the Luton functional HMA. What are the key factors that justify this being a “best fit” and is this justified? 6 17. Is the Luton HMA correctly and accurately described in para 1.18, 4.5 and 4.7 of the Plan? In particular, is any part of Dacorum Borough Council within the Luton HMA? [Minor Mods MOD9 & MOD29] 7 18. Should the extent of the Luton HMA be shown on a map or diagram and explained in the Plan? Is the precise extent of the Luton HMA within Central Bedfordshire a matter for this plan? 7 OAN – baseline household projections (2016 release) 7 19. The OAN is based on the 2012-based household projections…. The Council’s response….indicates that this increase will be mostly offset if the migration adjustments in the SHMA are applied. Is this justified? What bearing, if any, should the latest household projections have on the assessment of OAN? 7 20. The National PPG states that Local Plans should be kept up to date… How should this guidance be applied here? 8 OAN – demographic downward adjustment to baseline household projections from 53,336 households to 41,345 households. 9 21. In overall terms, why does the use of a 10 year migration trend result in the baseline demographic figure being reduced? 9 22. Is there a robust local justification for using 10 year migration trends (2001-11) rather than 5 year trends? Why are 10 year trends (for inter-census period) likely to be more reliable and representation of what might happen over the plan period than more recent 5 year trends? 10 23. Migration. Which trends are most likely to be representative of what might happen in the plan period and why? Why has in-migration tended to be higher in more recent years and lower before that? 10 24. Is there robust evidence that in-migration over recent years has been over-estimated by ONS? What adjustment should be made to baseline demographic position? 11 25. What is the evidence for the potential under-enumeration in 2001 census for Luton, what was the cause and what impact does this have on 2014-based DCLG household projections? 11 26. Why does the potential data accuracy problem of Luton in 2001 still have a bearing on the OAN for 2011 to 2031? Has the issue been resolved in recent MYE? 12 27. How significant are the variations between ONS MYE population and local data source estimates of population referred to by the Council (school census, state pension, GP patient register)? 12

Examination of Luton Local Plan
Representations to Inspector’s MIQs Stage 2 Hearings Matter 5
28. Have appropriate headship rates been applied to convert the population projection to 2031 into household projects? 12 29. Overall, is the adjusted baseline household projection, taking account of local circumstances of 41,435 households justified? 13 Adjustments to the baseline household projection – vacancies 13 30. Has an appropriate vacancy rate been applied? 13 Adjustments to the baseline household projection – suppressed household formation rates 13 32. What has been the annual housebuilding record in terms of completions in recent years, including years before the current plan period? Does this indicate that a lack of supply might have surpressed household formation rates. 13 Adjustments to the baseline household projections – economic factors 14 33. Does the assessment of OAN correctly take into account projected economic and job growth? Will the demographic starting point (43,936) provide sufficient workers to support economic growth? 14 34. The SHMA Update forecasts 38,100 additional jobs (2011-2031), with 11,300 of these being in Luton… Is this justified? 14 35. The number of additional jobs is then adjusted downwards having regard to projected increase in net out-commuting (to 28,900) and then double jobbing (27,200). Are these figures and assumptions justified? 14 36. The SHMA Update states that the demographic projections would provide 26,300 additional workers leaving a shortfall of 900 workers, equating to a need of 600 additional households. Is this justified and how was the average number of workers per house established? 14 37. The SHMA then notes that the Local Plan is planning for 18,000 jobs in Luton rather than 11,300 from the EEFN forecast. This would lead to a planned increase of c45,000 jobs…Are these figures and the assumptions behind them justified? 14 38. It is then concluded that because out-commuting is likely to increase, 3,200 extra households should be planned for… amounting to 3,300 extra dwellings. Is this conclusion justified? 14 39. Overall, is the uplift of 3,300 for economic factors justified? 14 Adjustments to the baseline household projection – market signals 15 40. Does the assessment of OAN correctly take into account market signals? 15 Establishing the OAN for Luton administrative area 16 Unmet needs an in-migration from outside the HMA, including London 16 49. Should the OAN take into account any unmet needs from outside the HMA? In particular London? 16
Summary of migration assumptions 25 Conclusion on migration assumptions 30

Examination of Luton Local Plan Representations to Inspector’s MIQs Stage 2 Hearings
Matter 5
\\sheffield-svr\Job Files\Bedford\BE\BE108-6PS\Stage 2\17.08.2016.AJR.LBC.BE1086PS.MIQ Rep Matter 5 OAN.FINAL.docx
5
INTRODUCTION 1.1 These representations have been prepared by the Strategic Planning & Research Unit
(SPRU) of DLP (Planning) Ltd (DLP) on behalf of Claydon Land Development Ltd.
1.2 This representation has been made in the context of our client’s interest in land at Lynwood Avenue, Luton and follow substantial representations made throughout the Local Plan preparation process. As the Inspector will be aware, a site location plan was provided in our R.19 consultation submissions in November 2015. The site has been included in the SHLAA using the Council’s reference number 326.
1.3 As requested by the Inspector these representations are structured to respond to the specific questions set out in the Inspector’s MIQs (stage 2 hearings) note, which covers Matters 3 to 15.

Examination of Luton Local Plan Representations to Inspector’s MIQs Stage 2 Hearings
Matter 5
\\sheffield-svr\Job Files\Bedford\BE\BE108-6PS\Stage 2\17.08.2016.AJR.LBC.BE1086PS.MIQ Rep Matter 5 OAN.FINAL.docx
6
MATTER 5 – OBJECTIVELY ASSESSED NEED FOR HOUSING AND ANY UPLIFT TO MEET AFFORDABLE HOUSING NEEDS
Housing Market Area
15. Has the Luton functional HMA (which includes all of Luton, a large part of Central Bedfordshire and parts of North Hertfordshire and Aylesbury Vale) been correctly defined?
2.1 As set out in section 4 of Appendix 2 of our R.19 consultation to the Luton Plan, we do not agree with the HMA defined by the Council’s consultants ORS. In summary:
The definition of such a small areas are less effective for long term strategic planning
It seriously underplays the economic influence of major employment centres often leaving them with no hinterland from which to draw a workforce
Gives insufficient weight to travel to work patterns
It allows diverse assumptions to be adopted which when considered at the higher HMA level result in serious under provision against the national DCLG projections.
2.2 The proposed HMA is a clear short coming of this approach, by being a ‘best fit’ HMA of just only 1 full LPA area, roughly half of another and very small sections of others.
2.3 We consider that the approach used in the National Housing Planning Advisory Unit commissioned work (2010) sets out and justifies a sound approach for determining HMAs across the Country. That specifically the ‘upper tier’ HMA of Luton and Milton Keynes should be used, which includes: Luton, Milton Keynes, Bedford, Central Bedfordshire and Aylesbury Vale.
2.4 As the Inspector will already have read, in tables 4, 5 and 6 found within section 4, appendix 2 of our R.19 submission, set out information taken from the Census supporting the NHPAU work. There are clear migratory, commuting and house move links between the LPAs set out in the Luton and Milton Keynes HMA.
2.5 Furthermore, Section 3, paragraph 3.16 of the Strategic Market Assessment Validation Study (GL Hearn 2013) reviews the HMA boundaries and clearly supports the NHPAU work, that the relevant HMA for strategic planning purposes for Luton and Central Bedfordshire is part of a Luton and Milton Keynes HMA.
2.6 In addition to this, work prepared by ORS for Milton Keynes (SHMA Review 2013) set out that 20.1% of Central Bedfordshire’s population fell within their definition of Milton Keynes HMA (figure 8). No figure was prepared for Luton.
16. The Luton and Central Bedfordshire administrative areas are regarded as a “best fit” for the Luton functional HMA. What are the key factors that justify this being a “best fit” and is this justified?
2.7 We seriously question the rationale behind seeking to define an inadequate HMA, particularly given that Luton is a centre of employment growth (which the submitted Plan supports) and its levels of growth cannot be fully met within its own administrative boundary.

Examination of Luton Local Plan Representations to Inspector’s MIQs Stage 2 Hearings
Matter 5
\\sheffield-svr\Job Files\Bedford\BE\BE108-6PS\Stage 2\17.08.2016.AJR.LBC.BE1086PS.MIQ Rep Matter 5 OAN.FINAL.docx
7
2.8 As already stated we consider the HMA should be truly strategic, to adequately address strategic planning issues. As a result of this poorly defined HMA, the two Council’s must firstly meet housing need with that defined area. There is clearly no certainty to this and Luton is already reliant upon LPAs outside of the Luton and Central Bedfordshire HMA to help meet this housing need.
2.9 The evidence produced by NPHAU, GL Hearn and our review of Census information clearly supports a Luton and Milton Keynes HMA that is in accordance with paragraphs 47 and 159 of the Framework.
2.10 Whilst the ORS approach filters out moves of over 20miles away and commuting to London and the use of finer grain data, the resultant HMAs are simply not fit for purpose. Their sub-division of the top tier CLG HMAs has not enhanced the ability to undertake long term, strategic planning across local authorities, but is making this task much more difficult, due to differences in local approach and the clear overlapping of commuting and migration patterns.
2.11 The convenience of a single consultant undertaking the work for authorities within an wider HMA, producing sub-divided SHMA and OAN reports does not make up for, or indeed replace, positive strategic planning in the wider area.
17. Is the Luton HMA correctly and accurately described in para 1.18, 4.5 and 4.7 of the Plan? In particular, is any part of Dacorum Borough Council within the Luton HMA? [Minor Mods MOD9 & MOD29]
2.12 The paragraphs are unclear as to what the HMA is and where unmet needs should be met. The HMA should be clearly defined and state that the needs of the HMA will be met within the HMA itself. Paragraph 1.18 as currently drafted is ambiguous as to where need will be met and infers that LBC will seek to deliver an unknown quantum of need outside of the proposed HMA.
2.13 The modifications do not resolve this issue, further should be made to address the soundness issue of setting a strategic and functional HMA.
18. Should the extent of the Luton HMA be shown on a map or diagram and explained in the Plan? Is the precise extent of the Luton HMA within Central Bedfordshire a matter for this plan?
2.14 We do not consider it necessary to define the HMA on a map and a description of those LPAs within the HMA should be sufficient. A specific line on a map for the proposed HMA would not be a positive approach to planning as it could unnecessarily restrict development opportunities in the emerging local plans of the other LPAs.
OAN – baseline household projections (2016 release)
19. The OAN is based on the 2012-based household projections…. The Council’s response….indicates that this increase will be mostly offset if the migration adjustments in the SHMA are applied. Is this justified? What bearing, if any, should the latest household projections have on the assessment of OAN?

Examination of Luton Local Plan Representations to Inspector’s MIQs Stage 2 Hearings
Matter 5
\\sheffield-svr\Job Files\Bedford\BE\BE108-6PS\Stage 2\17.08.2016.AJR.LBC.BE1086PS.MIQ Rep Matter 5 OAN.FINAL.docx
8
20. The National PPG states that Local Plans should be kept up to date… How should this guidance be applied here?
[Response to 19 & 20] 2.15 The latest CLG 2014-based household and population projection data should be used,
as prescribed by the PPG when undertaking a SHMA/OAN for a HMA. This new information should be used as the ‘starting point’ when understand the OAN for the HMA which Luton is within.
2.16 Clearly the dates within the PPG should up be updated, regardless of this, as the proposed Plan is still under examination, with a likely adoption date in 2017, the new 2014 based data should be used. There is no justification not to use this information.
2.17 The guidance states; wherever possible, local needs assessment should be informed by the latest available information. Clearly during a local plan examination is when housing need information can be updated, to ensure that at the point of adoption the most up to date information is being used.
2.18 Furthermore, Paragraph: 017 [Reference ID: 2a-017-20140306] of the PPG states that DCLG projections are statistically robust…. Account should also be taken of the most recent demographic evidence including the latest ONS population estimates.
2.19 The Inspector should be aware that the latest ONS 2015 Mid-Year Estimates are now available and should be taken into consideration by the Council’s consultants, particularly understanding current and future levels of migration.
2.20 It is important to consider that the proposed HMA and OAN under examination is not just for Luton, but for Central Bedfordshire’s Local Plan and will be used within the Growth Options Study (GOS). Therefore it is important that the most up to date information is used now, to ensure that by the point at which Central Bedfordshire’s examination begins, it is not using vastly out of date information.
2.21 The 2001 to 2011 migration trend used by the Council is not the most up to date information. A trend using more up to date information should be used. We have set this out in Appendix 1.
2.22 Table 1 sets out the changes the annual rates of household change within the HMA area and London. It clearly shows both the 2012 and 2014-based Household projections to be higher than the recorded 1991 to 2011 average increases.

Examination of Luton Local Plan Representations to Inspector’s MIQs Stage 2 Hearings
Matter 5
\\sheffield-svr\Job Files\Bedford\BE\BE108-6PS\Stage 2\17.08.2016.AJR.LBC.BE1086PS.MIQ Rep Matter 5 OAN.FINAL.docx
9
Table 1 Average annual change in Households across the HMA
1991 to 2011 average
2014 DCLG annual rates of HH change 2011 2031
2014 DCLG 2016 to 2036 annual rates of HH change
Percentage change 2016 to 2036
Change from past rates of growth 1991 to 2011
2012 household projections average household change (2012 to 2036)
Change from 2012 projections (2014 Average 2016 to 2036 compared to 2012 average 2012 to 2037)
Luton 513 1,167 1,132 28% 127% 1,074 5%
Bedford 533 1,000 976 28% 88% 869 11%
Central Bedfordshire 993 1,823 1,704 30% 84% 1,512 11%
Aylesbury Vale 710 1,080 995 26% 52% 895 10%
Milton Keynes 1,587 1,473 1,406 26% -7% 1,468 -4%
Luton and Milton Keynes HMA
4,336 6,543 6,214 5,818
London Total 24,140 58,293 55,343 17% 130% 53,017 26%
2.23
OAN – demographic downward adjustment to baseline household projections from 53,336 households to 41,345 households.
21. In overall terms, why does the use of a 10 year migration trend result in the baseline demographic figure being reduced?
2.24 This is because the migration trend used by ORS (the fact that it is a 10 year trend is irrelevant) demonstrates higher levels of net out-migration than the CLG projections1. It is interesting to note that one of the scenarios modelled in our R.19 consultation appendix 2, considered a Zero Net Migration situation. Whilst this un-realistic scenario, it is a useful control to understand what role migration plays in the CLG2 projections. Table 24 shows that between 2011 and 2031 the dwelling change in Luton would be a 22,715 increase (1,136pa), 4,940 dwellings in the plan period higher than the ORS SHMA 2015 OAN.
2.25 For comparison the DCLG3 projection shows that total net-migration between 2011 and 2031 will be a reduction of 8,745 persons. The ORS revised 10 year migration trend showed a net out-migration flow of 4,900 persons over a 10 year period, 2001 to 2011
1 Both 2012 and 2014-based. 2 2012-based 3 2012-based

Examination of Luton Local Plan Representations to Inspector’s MIQs Stage 2 Hearings
Matter 5
\\sheffield-svr\Job Files\Bedford\BE\BE108-6PS\Stage 2\17.08.2016.AJR.LBC.BE1086PS.MIQ Rep Matter 5 OAN.FINAL.docx
10
(490 per annum), therefore this would be in the region of 14,700 persons, in the 2011 to 2031 period. A difference of 5,955.
22. Is there a robust local justification for using 10 year migration trends (2001-11) rather than 5 year trends? Why are 10 year trends (for inter-census period) likely to be more reliable and representation of what might happen over the plan period than more recent 5 year trends?
2.26 The argument used by ORS for a 10 year migration trend from 2001 to 2011 is not valid. We do not disagree that 10 year trends can be used, but it should be based on the most up to date 10 year period and should be used in conjunction with the most up to date 5 year trend, to sensitivity test the official DCLG household projections.
2.27 The ORS argument4 for an inter-census period is flawed for Luton as they do not consider the 2001 census data reliable and have had to use, remodelled 2001 data. The most logical 10 year period to use, is the period from 2005 to 2015, using the most recent ONS 2015-MYE. This would move away from data which ORS consider to be unreliable.
2.28 Table 1 in Appendix 1 sets out this most recent migration data for Luton, taken from mid-year estimate information from ONS. The ORS net migration trend of -497 persons does not align or seem reasonable to any of the averages we have calculated based on the MYE data.
2.29 Migration trends for the past 14 years show a total net in-migration of 123 average per year and the most recent 10 year and 5 year periods show net in-migration levels of 844 and 871 average per year. It is clear that the years 2001/2 to 2001/5 (which ORS base half of their migration trend on) significantly impact upon levels of net migration, because of higher level of out net-internal migration and lower levels of in net-international migration.
2.30 The migration trend period of 2001 to 2011 is out dated and should no longer be used. The data used by ORS is not credible. There is no justification for using this migration trend.
2.31 The MYE data allows for a more up to date assessment of migration and uses reliable data. We consider that an average net in-migration level of 844 persons per year is more up to date and robust migration trend
23. Migration. Which trends are most likely to be representative of what might happen in the plan period and why? Why has in-migration tended to be higher in more recent years and lower before that?
2.32 The 2001 – 2011 adjusted trend used by ORS is not representative of the levels of growth and development which the Luton Local Plan sets out in the vision and spatial objectives. Further to our concerns of the migration trend used by ORS, it partly based in a period of economic decline and very poor housing completion rates. We note that there is a significant discrepancy between the Council’s own housing completion data and the data compiled by DCLG within live table 2535, as set out in table 2 in appendix
4 As we understand ORS consider that the most robust period to understand migration is between two census years. Taking this approach, would mean that migration trends couldn’t be accurately assessed again until after 2021 census data is released. 5 https://www.gov.uk/government/statistical-data-sets/live-tables-on-house-building

Examination of Luton Local Plan Representations to Inspector’s MIQs Stage 2 Hearings
Matter 5
\\sheffield-svr\Job Files\Bedford\BE\BE108-6PS\Stage 2\17.08.2016.AJR.LBC.BE1086PS.MIQ Rep Matter 5 OAN.FINAL.docx
11
1. Between 2001 and 2013 live table 253 records that 2,800 dwellings were completed in Luton, whereas the SHLAA completion record shows this to be 4,650, a difference of 1,850.
24. Is there robust evidence that in-migration over recent years has been over-estimated by ONS? What adjustment should be made to baseline demographic position?
2.33 There is no justification for this. The most recent 2015 MYE continues the trend identified over the previous 10 years. A large body of evidence has been prepared looking into this issue, which we have summarised in Appendix 2 which also contains our more detailed assessment of migration in Luton and Central Bedfordshire used in previous evidence base documents.
2.34 UPC issues have been resolved and corrected which has led to improved data for both international and internal migration since 2006. This is set out in detail in our R.19 submission.
2.35 We consider that if an adjustment to the baseline demographic position using migration trends is to be made, it should be made using robust, credible and up to date information. The most recent 2015-MYE should be used to at least sensitivity test the most recent 2014-based DCLG household projections.
2.36 The Council should move away from using migration trends based upon data from 15 years ago, to predict growth into the next 15 years. This approach is not robust, credible or justified and does not adequately seek to understand the most recent migration data to inform the Council’s OAN.
2.37 The MYE data over the past 14 years shows that net internal migration levels have been relatively consistent over the past 10 years and that international migration levels have also been relatively consistent.
25. What is the evidence for the potential under-enumeration in 2001 census for Luton, what was the cause and what impact does this have on 2014-based DCLG household projections?
2.38 In the various document produced by the Council reference is made to an under counting of households (therefore population) in the 2001 census. Because of this ONS ‘filled in the gaps’ with data modelled on White British families, but should have filled in those gaps with data modelled on Asian families, as these are the groups most likely not to complete a census return.
2.39 ORS provide no evidence base that points to exceptional levels of under enumeration in Luton from the 2001 census and no evidence is presented that seeks to understand why Asian families do not fill in Census returns more so than other households furthermore there is no evidence from the Council which sets out the other sources of population.
2.40 ONS made a significant change to the way in which the population was counted in the 2001 census. Previous census do not attempt to ‘fill in the gaps’ where under enumeration occurred. ONS made it clear that from 2001 census this issue would be addressed.
Examination of Luton Local Plan Representations to Inspector’s MIQs Stage 2 Hearings
Matter 5
\\sheffield-svr\Job Files\Bedford\BE\BE108-6PS\Stage 2\17.08.2016.AJR.LBC.BE1086PS.MIQ Rep Matter 5 OAN.FINAL.docx
12
2.41 ONS designed the Census Coverage Survey (CCS)6 to specifically enable census population counts to be adjusted for under-enumeration at the national, local and small area level. The CSS consisted of a face to face survey of 320,000 households in England and Wales and specifically took into account hard to count areas7 and their characteristics. Luton had a response rate of 87% for the CCS survey.
2.42 There is no record of either ORS or Luton Borough Council, raising this significant issue with ONS or DCLG. It is extremely difficult to comprehend how this issue was not picked up by ONS and then latterly rectified. It is interesting to note that on Luton’s website8 there is no ‘health warning’ of the 2001 census data, nor any mention of the alternative population estimates used.
2.43 This should have no impact upon the 2014-based household projections. However, as ORS still use a revised migration trend which takes into account their assumptions on under enumeration, using this migration trend on the 2014-based projections, will have a significant impact, as set out in previous answers.
26. Why does the potential data accuracy problem of Luton in 2001 still have a bearing on the OAN for 2011 to 2031? Has the issue been resolved in recent MYE?
2.44 As set out previously it should not have a bearing on the 2014 OAN. It would seem a logical approach for ORS to move away from their 2001-2011 migration trend and use more up to date information, given that a) the MYE data issues have now been resolved by ONS and b) it would move away from having to remodel census data. Using nationally consistent data would be the most robust approach for ORS to take.
27. How significant are the variations between ONS MYE population and local data source estimates of population referred to by the Council (school census, state pension, GP patient register)?
2.45 To reach a view on the significant on the variation and difference between the data sources, one would need to be satisfied that all data sources are reliable. There is no certainty whatsoever that the estimates referred to by ORS are robust or credible.
2.46 The ONS MYE does use these sources as a sensitivity check, however, these are not used a replacement. ONS MYE are statistically robust and should not be replaced by data sources of unknown consistency or accuracy.
28. Have appropriate headship rates been applied to convert the population projection to 2031 into household projects?
2.47 We consider that the most appropriate headship rates to be applied should be those used in the 2014-based household projections.
6 https://www.ons.gov.uk/census/2001censusandearlier/designandconduct/theonenumbercensus/thecensuscoveragesurvey 7 It can be inferred that ORS mean that Asian Families are ‘hard to count’ 8 http://www.luton.gov.uk/community_and_living/luton%20observatory%20census%20statistics%20and%20mapping/pages/what%20did%20the%20census%20tell%20us%20about%20luton_.aspx
Examination of Luton Local Plan Representations to Inspector’s MIQs Stage 2 Hearings
Matter 5
\\sheffield-svr\Job Files\Bedford\BE\BE108-6PS\Stage 2\17.08.2016.AJR.LBC.BE1086PS.MIQ Rep Matter 5 OAN.FINAL.docx
13
29. Overall, is the adjusted baseline household projection, taking account of local circumstances of 41,435 households justified?
2.48 There is no justification for this approach. The alterations to migration trends and the re-calculation of the 2001 census population for Luton has led to ORS making significant changes to the OAN for Luton and Central Bedfordshire. The PPG (paragraph 17) is clear that sensitivity testing can be used and changes made where credible for local circumstances. The approach taken by ORS seeks to discredit the work done by ONS and replace it with its own data sources, which has not been made available for scrutiny and there are no assurances that this data is reliable.
Adjustments to the baseline household projection – vacancies
30. Has an appropriate vacancy rate been applied?
2.49 ORS use 2.8% for Luton and 4% for Central Bedfordshire. The 2011 Census vacancy rate9 in Luton is 2.6% and 4% for Central Bedfordshire
2.50 In Bedford Borough, ORS referred to high vacancy rates as an indicator of under enumeration, this is not true for Luton. It is not clear if ORS have used vacancy rates within their argument for under enumeration in Luton at the 2001 census.
Adjustments to the baseline household projection – suppressed household formation rates
32. What has been the annual housebuilding record in terms of completions in recent years, including years before the current plan period? Does this indicate that a lack of supply might have suppressed household formation rates.
2.51 As set out in response to question 23, there is a significant discrepancy between the two records of completions. This should be clarified by the Council and an accurate figure used.
2.52 We consider that a lack of supply can have an effect on household formation rates and that either household formation rates should be re-modelled to represent rates to be expected in more prosperous times, or to apply a meaningful uplift through increases related to market signals.
9 2011 Census Table KS401EW

Examination of Luton Local Plan Representations to Inspector’s MIQs Stage 2 Hearings
Matter 5
\\sheffield-svr\Job Files\Bedford\BE\BE108-6PS\Stage 2\17.08.2016.AJR.LBC.BE1086PS.MIQ Rep Matter 5 OAN.FINAL.docx
14
Adjustments to the baseline household projections – economic factors
33. Does the assessment of OAN correctly take into account projected economic and job growth? Will the demographic starting point (43,936) provide sufficient workers to support economic growth?
34. The SHMA Update forecasts 38,100 additional jobs (2011-2031), with 11,300 of these being in Luton… Is this justified?
35. The number of additional jobs is then adjusted downwards having regard to projected increase in net out-commuting (to 28,900) and then double jobbing (27,200). Are these figures and assumptions justified?
36. The SHMA Update states that the demographic projections would provide 26,300 additional workers leaving a shortfall of 900 workers, equating to a need of 600 additional households. Is this justified and how was the average number of workers per house established?
37. The SHMA then notes that the Local Plan is planning for 18,000 jobs in Luton rather than 11,300 from the EEFN forecast. This would lead to a planned increase of c 45,000 jobs…Are these figures and the assumptions behind them justified?
38. It is then concluded that because out-commuting is likely to increase, 3,200 extra households should be planned for… amounting to 3,300 extra dwellings. Is this conclusion justified?
39. Overall, is the uplift of 3,300 for economic factors justified?
[Response to questions 33 to 39] 2.53 We do not consider that the demographic starting point used by ORS will provide
sufficient workers to support economic growth.
2.54 Within our R.19 submission, appendix 2, table 24 the SNPP model which is the DCLG 2012-based household projection, shows that there will be a labour force increase of approximately 940 new workers per annum from 2011 to 2031 (18,800) for Luton. This is approximately 1,200 higher than the 2014 EEFM model (table 12). The Plan seeks to increase jobs by 18,000.
2.55 We consider that the DCLG 2012-based household projections provide an adequate indication to the level of job growth for Luton and are similar to forecasting from EEFM and Cambridge Econometrics (Chart 13 R.19 Submission Appendix 2).
2.56 However as stated we consider the HMA should cover the Luton and Milton Keynes area, one of the factors in this being the more appropriate HMA is the strong economic links between Luton, Central Bedfordshire and Milton Keynes. This is set out in detail in our R.19 submission. To summarise this, the Milton Keynes ELR and Growth Study Analysis (2015) shows that for Milton Keynes to reach expected level of economic

Examination of Luton Local Plan Representations to Inspector’s MIQs Stage 2 Hearings
Matter 5
\\sheffield-svr\Job Files\Bedford\BE\BE108-6PS\Stage 2\17.08.2016.AJR.LBC.BE1086PS.MIQ Rep Matter 5 OAN.FINAL.docx
15
growth, an increase of workers in-commuting to Milton Keynes will be necessary. For Luton this would be between 981 and 444 workers and for Central Bedfordshire between 1,998 and 3,994 workers (depending on which economic forecast).
2.57 It is clear that Luton and Central Bedfordshire are set to economically grow over the next 20 years and that they are strategically linked with Milton Keynes which is one of the fastest growing economies in the UK. Luton and Central Bedfordshire cannot be viewed in isolation. The approach taken by ORS unnecessarily sub-divides the HMA and functional economic area to a degree that separate disjointed HMAs are considered in isolation.
2.58 We do not consider that any of the adjustments made by ORS are justified or necessary. The 2012-based household projection demonstrated a reasonable and adequate level of job growth.
2.59 Furthermore the SHMA update has made adjustments to the economic activity rates and this approach should be treated with caution. These changes will project that a smaller increase in labour is required to achieve the same level of economic growth. There is justification to increase economic activity rates for some parts of the population as a result in the changes to state pension age, but evidence should be clearly set out as to why economic activity rates will increase across the population.
2.60 There is no evidence to support this approach from ORS, the national picture of activity rates is that they are decreasing across the country except for London and the South East.
Adjustments to the baseline household projection – market signals
40. Does the assessment of OAN correctly take into account market signals?
2.61 Section 7, appendix 2 of our R.19 submission sets out information on affordability. The NHPAU publication, Meeting the housing requirements of an aspiring and growing nation (June 2008) consider what level of uplift should be made throughout the regions of England. To summarise for the East of England, this uplift should be between 11% (a demographic approach) and 28% (stabilising affordability). The adjustment made to market signals for Luton should take this range into consideration.
2.62 A positive response to address market signals, in particular affordability should be applied. In doing so it would meet the objectives of the Framework, in particular paragraph 17 and 50; an increase in the supply of housing, secure improvements to affordability and widen access to home ownership.
Affordability
2.63 Affordability in Luton (Table 15 of R.19 Submission) has worsened since 1997 and remained steady from 2010 at a ratio of 7.5 and is still higher than the average for England. Adjustments from market signals should consider reducing this ration to levels seen in late 1990s and early 2000s.
2.64 A further factor to consider on affordability is that whilst this is a high ration, it is lower than the South East in general. This could be a factor in altering migration patterns over the next 15 years (in particular from London).
Rate of development
2.65 The past rates of development in Luton are unclear as already set out in this response.

Examination of Luton Local Plan Representations to Inspector’s MIQs Stage 2 Hearings
Matter 5
\\sheffield-svr\Job Files\Bedford\BE\BE108-6PS\Stage 2\17.08.2016.AJR.LBC.BE1086PS.MIQ Rep Matter 5 OAN.FINAL.docx
16
Establishing the OAN for Luton administrative area
[Responses to questions 45 to 48 are contained throughout]
Unmet needs an in-migration from outside the HMA, including London
2.66 As set out throughout this response we consider that the HMA used by ORS is not adequate for strategic planning.
49. Should the OAN take into account any unmet needs from outside the HMA? In particular London?
2.67 We consider that Luton and Central Bedfordshire should help to meet needs arising from London. Section 8 of our R.19 submission sets this out. There is clear evidence demonstrating commuting and migration flows from Luton and Central Bedfordshire with London, but the SHMA update undertakes no analysis of this whatsoever. This is a serious short coming of the SHMA and means the Luton Plan does not meet a core objective of the Framework (paragraph 17) of meeting in full the housing needs of the nation.
2.68 For Luton the OAN should increase by 171 dwellings and for Central Bedfordshire 123 dwellings.

Examination of Luton Local Plan Representations to Inspector’s MIQs Stage 2 Hearings
Matter 5
\\sheffield-svr\Job Files\Bedford\BE\BE108-6PS\Stage 2\17.08.2016.AJR.LBC.BE1086PS.MIQ Rep Matter 5 OAN.FINAL.docx
17
APPENDIX 1 Table 2 Summary of ONS MYE Tables up to 2015 and ORS Migration Data
Luton
Luton Net Internal Migration
International Net
Net Migration
Other Change
Total Migration and other change
ORS Migration Figure 8
2001/2 -2,668 999 -1,669 23 -1,646 -557
2002/3 -3,446 1,271 -2,175 28 -2,147 -1,185
2003/4 -4,017 916 -3,101 53 -3,048 -1,787
2004/5 -3,015 3,116 101 16 117 844
2005/6 -3,548 3,664 116 28 144 -461
2006/7 -3,611 4,074 463 5 468 -926
2007/8 -2,901 3,105 204 -12 192 -987
2008/9 -1,863 3,160 1,297 -69 1,228 -134
2009/10 -2,120 4,262 2,142 -85 2,057 -173
2010/11 -1,828 3,685 1,857 -150 1,707 430
2011/12 -2,161 2,207 46 -9 37 -526
2012/13 -1,931 2,063 132 11 143
2013/14 -1,922 2,683 761 3 764
2014/15 -1,596 3,305 1,709 -7 1,702
14 yr Average 2001/2 to 2014/15
-2,616 2,751 135 -12 123
10 yr Average 2005/6 to 2014/15
-2,348 3,221 873 -29 844
5 yr Average 2010/11 to 2014/15
-1,888 2,789 901 -30 871
10yr Average 2001/2 to 2010/11
-2,902 2,825 -77 -16 -93
DCLG 2012 -2964 2720 -208
ORS -497
Chelmer Baseline (5 year rolling average)
767
767
Average Migration and Other change 2001/2 to 2010/11
-2,902 2,825 -77 -16 -93

Examination of Luton Local Plan Representations to Inspector’s MIQs Stage 2 Hearings
Matter 5
\\sheffield-svr\Job Files\Bedford\BE\BE108-6PS\Stage 2\17.08.2016.AJR.LBC.BE1086PS.MIQ Rep Matter 5 OAN.FINAL.docx
18
Table 3 DCLG Live Table 523 and SHLAA Completions Luton
Year Private Enterprise
Housing Associations
Local Authority
All SHLAA Completions
2000 30 10 0 40 220
2001 180 80 0 260 229
2002 N/A N/A N/A N/A 171
2003 140 0 0 140 557
2004 230 60 0 290 566
2005 200 30 0 230 409
2006 210 40 0 250 478
2007 290 10 0 300 422
2008 210 40 0 250 386
2009 120 70 0 190 224
2010 150 120 0 270 490
2011 180 30 0 210 351
2012 140 180 0 320 147
2013 70 20 0 90 0
2014 110 30 0 140 0
Average 161.4285714 51.42857143 0 213 310
Total 2260 720 0 2980 4650

Examination of Luton Local Plan Representations to Inspector’s MIQs Stage 2 Hearings
Matter 5
\\sheffield-svr\Job Files\Bedford\BE\BE108-6PS\Stage 2\17.08.2016.AJR.LBC.BE1086PS.MIQ Rep Matter 5 OAN.FINAL.docx
19
APPENDIX 2 RELIABILITY OF MIGRATION STATISTICS
Migration Statistics Improvement Programme
A2.1 In April 2008, the Office for National Statistics established the Migration Statistics Improvement Programme (MSIP) was created to improve the quality of migration statistics at both the national level and the local level.
A2.2 The final report of the MSIP identified the following main deliverables from the MSIP:
a. Improvements to the International Passenger Survey (IPS)
b. Coherent Government Reporting on Migration
c. Data sharing, record linking and assessment of administrative data.
d. Improve demographic models to enhance migration and population estimates
e. Introduce Additional Census Questions to identify short and long term migrants
f. Long-term international immigration estimates by local authority
g. Short-term international immigration by local authority
h. Population statistics measures of uncertainty
i. Plausibility Ranges
j. e-Borders
A2.3 As suggested by the range of issued addressed the main focus was the impact of international migration at national and local levels.
House of Commons Public Administration Select Committee (PASC) Seventh Report of Session 2013- 14 (16 July 2013) - International Passenger Survey
A2.4 The Seventh Report of Session 2013- 14 (HC 523) concerned itself with the suitability of the International Passenger Survey and its general underestimation of migration in the decade to 2011 (paragraph 38). The ONS reported that its changes implemented in 2009 had largely addressed migration estimates for local areas (paragraph 42).
A2.5 The select committee concluded in terms of local area that while the IPS did not provide accurate estimates of international migration in local areas the census was too infrequent to act as a routine source of data.
A2.6 The Government’s response was that it did not agree that the IPS was inadequate to measure, manage and understand levels of migration (response to recommendation 1). In response to questions 5 to 8 the government highlights the wealth of data from the 2011 census and changes such as a new question in the IPS on emigration and in the Labour Force Survey.
A2.7 The conclusion I would draw from this evidence is that there is the potential for the level of international migration to be subject to more variation than other parts of the mid-year estimates. Given the underestimation that has occurred in the past in respect of the country as a whole I would not consider it appropriate to model a lower level of international migration compared to that which has occurred in the recent past.

Examination of Luton Local Plan Representations to Inspector’s MIQs Stage 2 Hearings
Matter 5
\\sheffield-svr\Job Files\Bedford\BE\BE108-6PS\Stage 2\17.08.2016.AJR.LBC.BE1086PS.MIQ Rep Matter 5 OAN.FINAL.docx
20
Methods used to revise the national population estimates for mid-2002 to mid-2010 (ONS December 2012)
A2.8 This paper was published to describe the potential causes of the underestimate of some 464,000 persons between the mid-2011 population estimate and the 2011 Census. The population estimate was some 0.8 per cent lower than the official census figure.
A2.9 Table 1 (page 3) highlights that much of this difference is explained by EU8 immigration (‘EU8’ countries are the eight countries of central and eastern Europe that joined the European Union in 2004: Czech Republic, Estonia, Hungary, Latvia, Lithuania, Poland, Slovakia and Slovenia). As well as other international migration but that there remained “other” unidentified factors.
A2.10 On page 14 the report highlights that there were some issues with the 2001 census but improvements were made in the 2011 census.
A2.11 In commenting on the remaining “Other” element of the population the report states that underestimation of migration is likely to be important in particular with the EU8 migration (page 14) so that while 250,000 persons are allocated to the missed EU8 migrants the 134 allocated to “other” “includes the potential for even more EU8 Migrants to have been missed.
A2.12 The detailed work that accompanied this report (Components of difference underlying the revised mid-2002 to mid-2010 population estimates (ONS 30 April 2013)) contained the following adjustments for Central Bedfordshire and Luton. In the case of Central Bedfordshire the increased level of migration modelled actually increased the discrepancy between the modelled population and the 2011 census results. It does not support the proposition forwarded by ORS that all of the discrepancy is due to over estimation of the net effect of migration.

Examination of Luton Local Plan Representations to Inspector’s MIQs Stage 2 Hearings
Matter 5
\\sheffield-svr\Job Files\Bedford\BE\BE108-6PS\Stage 2\17.08.2016.AJR.LBC.BE1086PS.MIQ Rep Matter 5 OAN.FINAL.docx
21
Table 4 Components of difference underlying the revised mid-2002 to mid-2010 population estimates
Area Names M
id-2
01
1 r
oll
ed
-fo
rward
esti
mate
Mid
-201
1 C
en
su
s-b
as
ed
(off
icia
l) e
sti
mate
Dif
fere
nc
e
Mo
ve t
o n
ew
im
mig
rati
on
meth
od
s f
or
ye
ars
en
din
g
mid
-2006 t
o m
id-2
01
1 2
Co
nseq
uen
t im
pa
ct
on
em
igra
tio
n 2
EU
8 i
mm
igra
tio
n
ad
justm
en
t 3
Rep
ub
lic o
f Ir
ela
nd
mig
rati
on
ro
ll b
ac
k 3
Rem
ain
ing
att
rib
uta
ble
co
mp
on
en
ts 3
Oth
er
3
Central Bedfordshire 258,657 255,644 3,013 3,776 -287 487 421 -226 -7,184
Luton UA 204,019 203,641 378 -3,808 321 2,453 513 265 -122 Components of difference underlying the revised mid-2002 to mid-2010 population estimates (ONS 30 April 2013)
A2.13 This report concludes that there was a substantial underestimation of net migration over
the decade with most of the underestimation occurring in the middle part of the decade but that IPS improvements from 2009 led to more accurate figures form 2009 onwards but that a combination of other factors over the decade has also contributed a large proportion of the difference. It goes onto state:
A2.14 “These findings and the subsequent allocation of the difference mean that the revised mid-2002 to mid-2010 estimates offer a much improved series, meeting the need for a continuous series between the mid-2001 and official mid-2011 estimates.”
A2.15 The improvements to the made to the data post 2009 suggest that greater reliance maybe placed on these later data sets.
Understanding the causes of discrepancies between the rolled forward mid-year estimates for 2011 and mid-year estimates based on the 2011 census (ONS 17 September 2015)
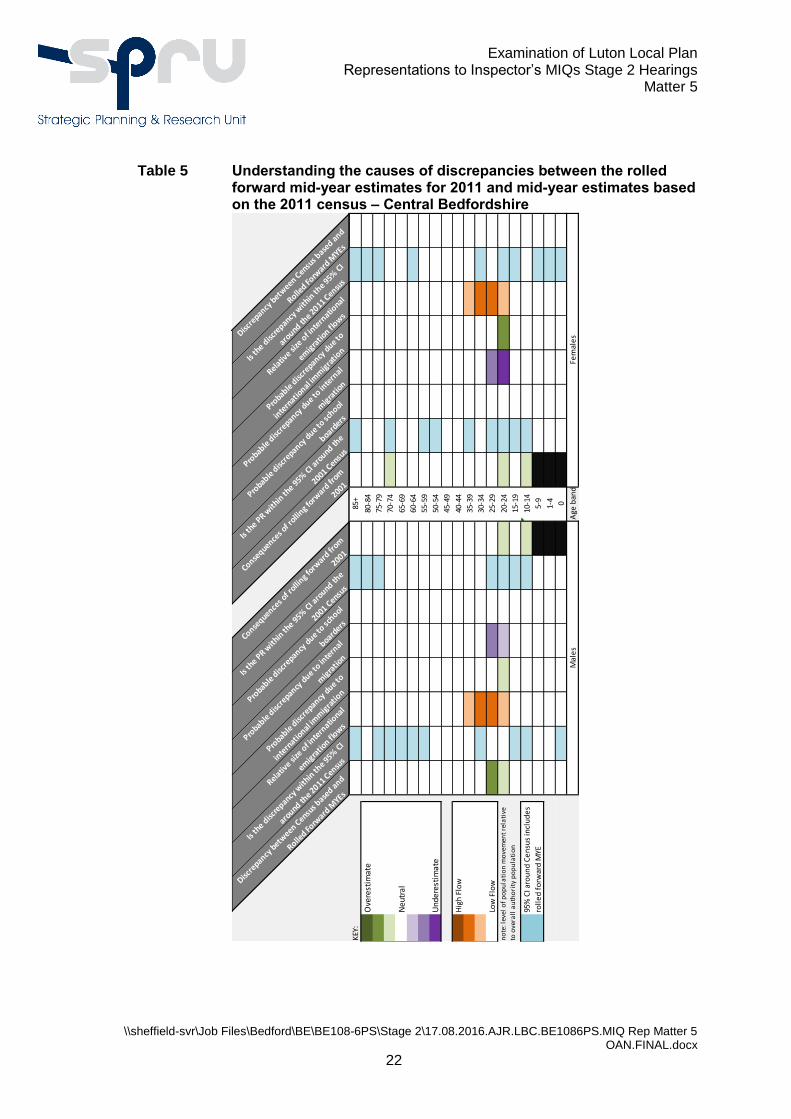
A2.16 This report outlines an approach for providing reasonable indications of the likely causes of discrepancies, by component, between mid-year estimates for 2011, rolled forward from 2001, and census based population estimates for 2011. The aim of this research was to provide indications of whether the accuracy of measurement of each component of the rolled forward mid-year estimates would have led to a tendency for the estimates to be either over or under estimated. It should be noted that this work does not seek to precisely quantify the contribution of any sub optimal estimation of each component to the overall discrepancy. The results of applying these approaches for each lower tier and unitary local authority in England and Wales by five year age and sex are provided in an accompanying data tool.
A2.17 This new tool identifies that the possible causes for the difference between the census and the rolled forward Mid-Year estimates. The output of the analysis for Central Bedfordshire and Luton are shown on the next two pages.
Examination of Luton Local Plan Representations to Inspector’s MIQs Stage 2 Hearings
Matter 5
\\sheffield-svr\Job Files\Bedford\BE\BE108-6PS\Stage 2\17.08.2016.AJR.LBC.BE1086PS.MIQ Rep Matter 5 OAN.FINAL.docx
22
Table 5 Understanding the causes of discrepancies between the rolled forward mid-year estimates for 2011 and mid-year estimates based on the 2011 census – Central Bedfordshire
Discre
pancy b
etween C
ensus b
ased and
Rolled Fo
rward
MYEs
Is th
e disc
repancy
with
in th
e 95% C
I
around th
e 2011 Censu
s
Relativ
e size
of i
ntern
ational
emig
ratio
n flow
s
Probable
disc
repancy
due to
inte
rnatio
nal imm
igra
tion
Probable
disc
repancy
due to
inte
rnal
mig
ratio
n
Probable
disc
repancy
due to
school
boarders
Is th
e PR w
ithin
the 95%
CI a
round th
e
2001 Censu
s
Consequence
s of r
olling f
orward
from
2001
Consequence
s of r
olling f
orward
from
2001
Is th
e PR w
ithin
the 95%
CI a
round th
e
2001 Censu
s
Probable
disc
repancy
due to
school
boarders
Probable
disc
repancy
due to
inte
rnal
mig
ratio
n
Probable
disc
repancy
due to
inte
rnatio
nal imm
igra
tion
Relativ
e size
of i
ntern
ational
emig
ratio
n flow
s
Is th
e disc
repancy
with
in th
e 95% C
I
around th
e 2011 Censu
s
Discre
pancy b
etween C
ensus b
ased and
Rolled Fo
rward
MYEs
KEY
:0
10
00
10
85+
01
00
01
0
3O
vere
stim
ate
00
00
01
080
-84
00
00
01
0
20
10
00
10
75-7
90
00
00
10
10
10
00
00
70-7
41
10
00
00
Neu
tral
01
00
00
065
-69
00
00
00
0
-10
10
00
00
60-6
40
00
00
10
-20
10
00
00
55-5
90
10
00
00
-3U
nder
esti
mat
e0
00
00
00
50-5
40
10
00
00
00
00
00
045
-49
00
00
00
0
3H
igh
Flo
w0
00
00
00
40-4
40
00
00
00
20
01
00
00
35-3
90
10
01
00
10
12
00
00
30-3
40
00
02
10
Low
Flo
w2
02
0-2
01
025
-29
01
0-2
02
00
10
11
-10
11
20-2
41
10
-32
11
0
01
00
00
10
15-1
90
10
00
01
0
01
00
00
11
10-1
41
10
00
00
0
00
00
00
5-9
00
00
10
00
00
01-
40
00
10
01
00
00
00
01
0
Age
ban
d
no
te: l
evel
of
po
pu
lati
on
mo
vem
ent
rela
tive
to o
vera
ll a
uth
ori
ty p
op
ula
tio
n
95%
CI a
rou
nd
Ce
nsu
s in
clu
de
s
roll
ed
fo
rwar
d M
YE
Mal
es
Fem
ale
s
Examination of Luton Local Plan Representations to Inspector’s MIQs Stage 2 Hearings
Matter 5
\\sheffield-svr\Job Files\Bedford\BE\BE108-6PS\Stage 2\17.08.2016.AJR.LBC.BE1086PS.MIQ Rep Matter 5 OAN.FINAL.docx
23
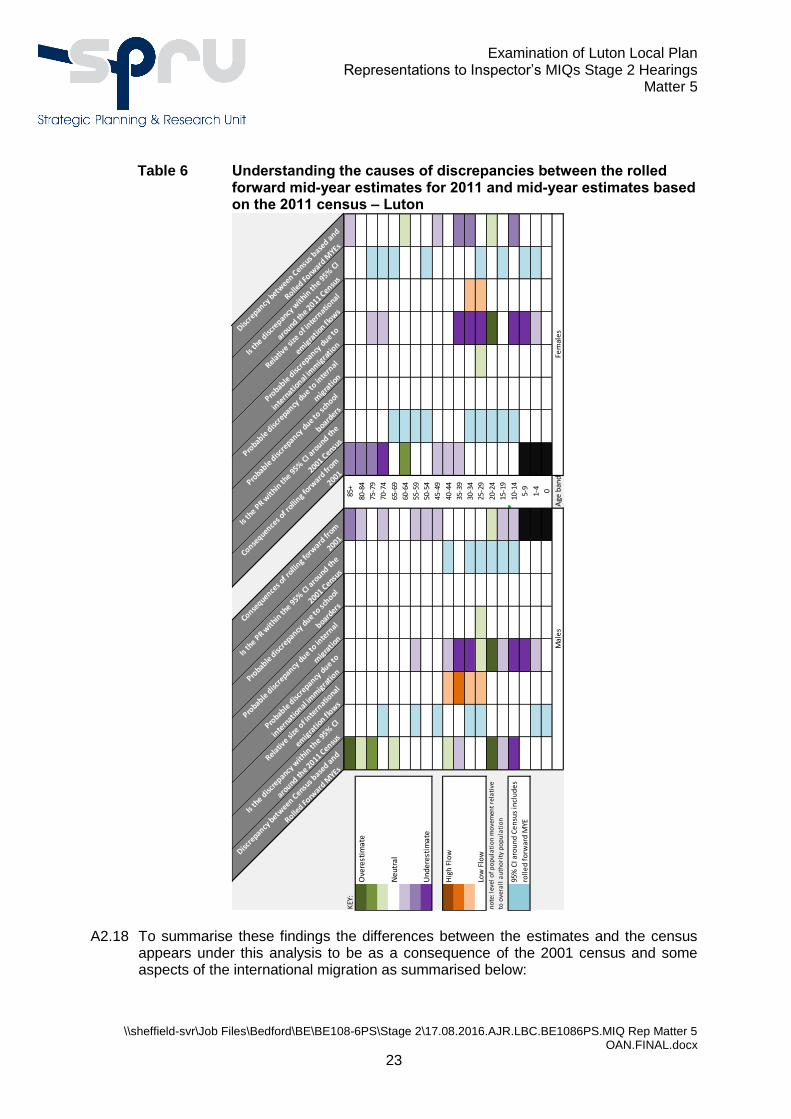
Table 6 Understanding the causes of discrepancies between the rolled forward mid-year estimates for 2011 and mid-year estimates based on the 2011 census – Luton
A2.18 To summarise these findings the differences between the estimates and the census appears under this analysis to be as a consequence of the 2001 census and some aspects of the international migration as summarised below:
Discre
pancy b
etween C
ensus b
ased and
Rolled Fo
rward
MYEs
Is th
e disc
repancy
with
in th
e 95% C
I
around th
e 2011 Censu
s
Relativ
e size
of i
ntern
ational
emig
ratio
n flow
s
Probable
disc
repancy
due to
inte
rnatio
nal imm
igra
tion
Probable
disc
repancy
due to
inte
rnal
mig
ratio
n
Probable
disc
repancy
due to
school
boarders
Is th
e PR w
ithin
the 95%
CI a
round th
e
2001 Censu
s
Consequence
s of r
olling f
orward
from
2001
Consequence
s of r
olling f
orward
from
2001
Is th
e PR w
ithin
the 95%
CI a
round th
e
2001 Censu
s
Probable
disc
repancy
due to
school
boarders
Probable
disc
repancy
due to
inte
rnal
mig
ratio
n
Probable
disc
repancy
due to
inte
rnatio
nal imm
igra
tion
Relativ
e size
of i
ntern
ational
emig
ratio
n flow
s
Is th
e disc
repancy
with
in th
e 95% C
I
around th
e 2011 Censu
s
Discre
pancy b
etween C
ensus b
ased and
Rolled Fo
rward
MYEs
KEY
:3
00
00
0-2
85+
-20
00
00
-1
3O
vere
stim
ate
10
00
00
-180
-84
-20
00
00
0
22
00
00
00
75-7
9-2
00
-10
10
10
10
00
0-1
70-7
4-3
00
-10
10
Neu
tral
10
00
00
065
-69
01
00
01
0
-10
00
00
00
60-6
42
10
00
01
-20
10
-10
0-1
55-5
90
10
00
00
-3U
nder
esti
mat
e0
00
00
0-1
50-5
40
10
00
10
01
00
00
-145
-49
-10
00
00
-1
3H
igh
Flo
w1
01
-10
10
40-4
4-1
00
00
00
2-1
02
-30
00
35-3
9-1
00
-30
0-2
10
11
-30
10
30-3
40
10
-31
0-2
Low
Flo
w0
11
11
01
025
-29
01
01
-31
10
30
03
00
11
20-2
40
10
03
00
1
-10
0-1
00
1-1
15-1
90
10
00
01
0
-30
0-3
00
1-1
10-1
40
10
0-3
00
-2
00
0-3
00
5-9
00
-30
10
01
0-1
01-
40
-10
10
01
00
00
00
00
0
Age
ban
d
no
te: l
evel
of
po
pu
lati
on
mo
vem
ent
rela
tive
to o
vera
ll a
uth
ori
ty p
op
ula
tio
n
95%
CI a
rou
nd
Ce
nsu
s in
clu
de
s
roll
ed
fo
rwar
d M
YE
Mal
es
Fem
ale
s

Examination of Luton Local Plan Representations to Inspector’s MIQs Stage 2 Hearings
Matter 5
\\sheffield-svr\Job Files\Bedford\BE\BE108-6PS\Stage 2\17.08.2016.AJR.LBC.BE1086PS.MIQ Rep Matter 5 OAN.FINAL.docx
24
a. For Central Bedfordshire any over estimation appears to have been driven as much by the consequences of the 2001 census as by international migration. The table suggests that internal migration for Central Bedfordshire has not been over estimated but actually might have been underestimated for 20 – 29 year olds.
b. For Luton the under estimation appears to be a consequence of the 2001 census and international migration. In terms of international migration there are far fewer age groups where migration has been over estimated compared to those where migration has been underestimated. The research suggests that internal migration might have been overestimated for one age group.
A2.19 The analysis does not suggest that the international migration estimates as a whole have overestimated but that some flows might have been underestimated.
A2.20 The analysis also suggests that internal migration estimates may have underestimated migration for the age group 20 to 29 (both sexes) for Central Bedfordshire.
A2.21 This research does not support the ORS assertion that there has been significant over estimation of migration into Central Bedfordshire and Luton.
A2.22 The aim of this work was to:
a. Provide a consistent way of explaining the most likely causes of discrepancies between 2011 Census based and 2011 rolled forward mid-year estimates rolled forward from 2001 and
b. To provide a consistent way of understanding the most likely causes of bias in the mid-year estimates rolled forward from 2011
A2.23 The work was primarily concerned with the first of these aims as there are methodological differences between the compilation of mid-year estimates for the decade to 2011 and the decade post 2011 so it is not possible to simply roll forward all of the methods of assessment used to analyse the previous decade to understand the current decade. Consequently inferring issues with the mid-year estimates for 2011 onwards from the issues indicated between 2001 and 2011 is not straightforward. This work suggests that the impact of recorded levels of internal migration in the period 2001 to 2011 for Central Bedfordshire might have resulted in an underestimation of the population as at 2011 for the 20 – 29 age groups in both sexes.
A2.24 This suggests that the data for internal migration is reasonably reliable if perhaps low.
Internal Migration
A2.25 The Methodology: 2012-based Subnational Population Projections (29 May 2014) sets out the basic methodology used for estimating future internal levels of migration (page 6 - 8).
A2.26 The ONS uses a combination of three administrative data sources as a proxy for internal migration within England and Wales: the National Health Service Central Register (NHSCR), the Patient Register Data Service (PRDS) and Higher Education Statistics Agency (HESA) data. ONS uses these data sources to calculate the internal migration component of the mid-year population estimates, which forms the basis upon which projected internal migration is calculated.

Examination of Luton Local Plan Representations to Inspector’s MIQs Stage 2 Hearings
Matter 5
\\sheffield-svr\Job Files\Bedford\BE\BE108-6PS\Stage 2\17.08.2016.AJR.LBC.BE1086PS.MIQ Rep Matter 5 OAN.FINAL.docx
25
A2.27 The detailed methodology calculates the proportion of people moving from one local authority to another. In some cases with small numbers of moves and/or populations adjustments in the form of caps are sometimes made to smooth the data. In the 2012 SNPP this was only applied to Oadby and Wigston, Rutland and the Isles of Scilly. No other specific local authority adjustments were made to the internal migration assumptions for the 2012-based projections.
User update: reviewing the methods used to estimate internal migration at local authority level in England and Wales (ONS 6 August 2014)
A2.28 The ONS publication states that it is reviewing the methods it uses to estimate annual internal migration at local authority (LA) level in England and Wales and states that if improvements can be developed, they will be implemented in the mid‐2015 LA
population estimates (published mid‐2016) alongside a revised back series to 2011 if data allows.
A2.29 The focus of this work is on two areas these being:
a. Delays in patient registration: People may delay updating their patient record when they move, or not update it at all before moving again. This means some moves are missed and others are estimated to have happened later than was actually the case. These delays in registration can lead to over and under estimation in population estimates when flows are large, and inflow is significantly larger than outflow (or vice versa). This is more likely for younger adults and more likely for some types of LAs than others.
b. The moves a patient register (PR based) comparison misses because a comparison of PR between one year and the next may miss moves made by people who are born, who die, or move more than once during the year.
A2.30 As suggested by the analysis undertaken above there would appear to be a degree of confidence with the internal migration figures while international migration is not as robust. Given that at present international migration is exceeding the projected figure then the SNPP maybe considered to be an underestimation of likely future rates.
Summary of migration assumptions
A2.31 In order to be positively prepared (Framework paragraph 182) the approach adopted should be based upon using “the highest reasonable assumption when modelling future housing need”. This being the approach endorsed by Inspector Clews in his second Interim Findings on the South Worcester Plan.
A2.32 The consequence of not adopting this approach is to substantially increase the risk of not meeting demographic or migration driven elements of the OAN.
A2.33 In considering the appropriate approach to take to future migration it is necessary to consider how the migration is reacting now the economy is emerging from the recession. From the available information (ONS MYE) there would appear to be a general increase in the level of net migration into the Central Bedfordshire and Luton Area as illustrated in the Chart. This considers net migration and other changes and so it heavily discounts the level of net migration in effect treating all UPC as migration as such it is likely to considerably underestimate actual levels of migration.

Examination of Luton Local Plan Representations to Inspector’s MIQs Stage 2 Hearings
Matter 5
\\sheffield-svr\Job Files\Bedford\BE\BE108-6PS\Stage 2\17.08.2016.AJR.LBC.BE1086PS.MIQ Rep Matter 5 OAN.FINAL.docx
26
Migration Assumptions for Central Bedfordshire
A2.34 The recent trend in migration for Central Bedfordshire is an increasing level in migration. This is to be expected as the PAS guidance highlights that locations such as Central Bedfordshire are likely to have experienced suppressed rates of in migration due to the impact of the recession.
A2.35 The evidence above regarding past patterns of migration would appear to support that general observation. In addition evidence of past under supply against contemporary projections will have also reduced net in migration.
A2.36 Despite evidence of an increasing upward trend in migration the pattern of migration we have modelled for this report takes an extremely cautious approach. Against the advice of the ONS we have discounted migration trends by the full UPC.
A2.37 Rather than modelling the increasing trend of in migration we have held the level of migration constant for the next five years to the level recorded in the last five years (208/9 to 2013/14) on the grounds that the next five years are most likely to have similar issues to the immediately preceding five years.
A2.38 The increase in net migration has in part been due to an increase in the levels of net internal migration (see chart on next page), a source with a greater degree of reliability than the international migration series as explained above.
A2.39 We have then stepped the level of migration downwards (against the trend) so that in the longer term it reflects the migration and other changes recorded over the last 10 years.
A2.40 In this projection therefore we have used the Migration and other change 5 year average for period 2011 to 2019 (2400 persons/year) then the half way point of 2025 persons a year (2019 to 20-24) then finally the 10 year average of 1650 persons a year.
A2.41 The comparison of these assumptions to those in the SNPP and previous MYE are illustrated on the chart on the next page. This also contains the baseline assumption using a rolling average from the 20087/8 to 20112/13 period from the Chelmer model.

Examination of Luton Local Plan Representations to Inspector’s MIQs Stage 2 Hearings
Matter 5
\\sheffield-svr\Job Files\Bedford\BE\BE108-6PS\Stage 2\17.08.2016.AJR.LBC.BE1086PS.MIQ Rep Matter 5 OAN.FINAL.docx
27
Chart 1: Central Bedfordshire - past and future internal migration
Chart 2: Central Bedfordshire - past and future migration

Examination of Luton Local Plan Representations to Inspector’s MIQs Stage 2 Hearings
Matter 5
\\sheffield-svr\Job Files\Bedford\BE\BE108-6PS\Stage 2\17.08.2016.AJR.LBC.BE1086PS.MIQ Rep Matter 5 OAN.FINAL.docx
28
Migration Assumptions for Luton
A2.42 The recent trend in migration for Luton is one that changes from large scale out commuting to an increasing level in migration. This is not to be expected as the PAS guidance highlights that locations such as Luton are likely to have experienced suppressed rates of out migration due to the impact of the recession leading to higher populations. While this has occurred the evidence is that the situation has not resorted back to a net out migration.
A2.43 The evidence above regarding past patterns of migration would appear to suggest that there has been a change in the pattern of migration into Luton and that it may well remain a local of net in migration for some time.
A2.44 The recent changes in a reduced level of net internal out migration (see chart on the next page) will have impacted on the rising level of total net migration.
A2.45 Despite evidence of an trend for in migration over the last decade the pattern of migration we have modelled for this report take a cautious approach including treating all UPC as if it where migration (contrary to the advice of the ONS.
A2.46 Rather than modelling the increasing trend of in migration we have held the level of migration constant for the next five years to the level recorded in the last ten years (2003/4 to 2013/14). Although we considered using the higher average for the last five years this was rejected on the grounds that migration had returned to a lower level in the post 2011 period. The 10 year average therefore appeared to be a more realistic assumption regarding future patterns of migration as this still resulted in a small level of net in migration as has been experienced by the borough over the last 10 years.
A2.47 We have then stepped the level of migration downwards (against the trend) so that in the longer term it reflects a zero net migration scenario (this is also the average over the last 13 years). Given the high levels of in migration and the degree of fluctuation then the modelling of a net out migration would appear to represent too high a risk in that it is far from certain the location will become a net exporter of population.
A2.48 In this projection therefore we have used the Migration and other 10 year average for period 2011 to 2019 (686) reduced to half way point (343/yr 2019 to 2024) then 13 yr average (0) for remainder of period. This also contains the baseline assumption using a rolling average from the 20087/8 to 20112/13 period from the Chelmer model.

Examination of Luton Local Plan Representations to Inspector’s MIQs Stage 2 Hearings
Matter 5
\\sheffield-svr\Job Files\Bedford\BE\BE108-6PS\Stage 2\17.08.2016.AJR.LBC.BE1086PS.MIQ Rep Matter 5 OAN.FINAL.docx
29
Chart 3: Luton - past and future internal migration
Chart 4: Luton - past and future migration
-4500
-4000
-3500
-3000
-2500
-2000
-1500
-1000
-500
0
Luton: Net Internal Migration
Net Internal Migration DCLG Net Internal Migration

Examination of Luton Local Plan Representations to Inspector’s MIQs Stage 2 Hearings
Matter 5
\\sheffield-svr\Job Files\Bedford\BE\BE108-6PS\Stage 2\17.08.2016.AJR.LBC.BE1086PS.MIQ Rep Matter 5 OAN.FINAL.docx
30
Migration Assumptions for Central Bedfordshire and Luton
A2.49 The combined impact of these assumptions is set out in the chart on the next page that suggests against the evidence of a rise trend of net in migration the assumptions that have been adopted reverse this trend and model lower levels of migration which decrease further as time progresses, treating recent high levels of migration as a relatively temporary occurrence.
A2.50 There are however any factors which are likely to continue to drive migration upwards in these two districts not least their social and economic relationship with other neighbouring areas such as Milton Keynes and of course London. Continued economic growth and demographic pressure from these sources will quickly render these assumptions of decreasing net migration obsolete. As such caution needs to be exercised in the use of these somewhat suppressed levels of migration.
A2.51 The chart below illustrates how the past trend of net migration is projected to reverse in all of the projections.
Chart 5: Central Bedfordshire and Luton- past and future migration
Conclusion on migration assumptions
A2.52 In conclusion we would normally support the use of the most recent data to inform the levels of migration in projecting the OAN. In particular we have utilised the 5 year period (2007/8 to 2012/13) in the Chelmer “baseline” projection. This suggests a rising trend in net migration which is reaffirmed by reference to the average for more recent 2008/9 to 2013/14 period. The use of this recent information to inform at least the early part of the projections is justified for the following reasons:
a. They reflect the most up to date data including the 2011 census.

Examination of Luton Local Plan Representations to Inspector’s MIQs Stage 2 Hearings
Matter 5
\\sheffield-svr\Job Files\Bedford\BE\BE108-6PS\Stage 2\17.08.2016.AJR.LBC.BE1086PS.MIQ Rep Matter 5 OAN.FINAL.docx
31
b. They reflected the adjusted migration rates in the MYE as a result of the 2011 census
c. Since 2009 there have been improvements in migration data
d. The use of the latest 5 year migration figures reflect ONS methodology
e. The larger proportion of the net migration is attributed to internal migration for these years. This is derived from more reliable data sources than the international migration data.
f. These figures do not reflect the impact of the recession (a major criticism of 2006/7 to 2011/12 data used for the DCLG official projections by PAS)
g. They do not reflect the prolonged period of under provision that has occurred in both Luton and Central Bedfordshire - an issue highlighted by both the PPG and the PAS
h. They reflect the substantial uplift in internal migration from other parts of the UK into Central Bedfordshire – a trend which is supported by evidence of likely emerging demographic pressures from known sources of internal migration into Bedford
A2.53 It is not considered appropriate to base an assessment of the OAN on the SNPP for the following reasons:
a. The particular five year period used to calculate migration was adversely affected by the recession with levels of migration (PAS paragraph 6.23)
b. It does not reflect the most up to date evidence in respect of the increasing level of net internal migration.
A2.54 It is not considered appropriate to adopt a lower level of migration from the official projections as proposed by ORS (Summer 2015) for the following reasons:
a. The period selected between 2001 and 2011 ignores the most recent available evidence which suggests strongly growing levels of net migration.
b. The 2001 to 2011 period represents a period when there was growing affordability issue which was then followed by the recession. Neither of these scenarios are suitable to be taken forward to meet the objectives of the Framework.
c. The two authorities consistently under supplied housing in the 2001 to 2011 period against the contemporary DCLG projections and policy requirements. The NPPG highlights that this may have consequences for future assessments of need in terms of impacting on migration (Paragraph: 017 Reference ID: 2a-017-20140306).
A2.55 The use of a lower level of migration and especially a substantially reduced level of internal migration cannot be undertaken without engaging the Duty to Cooperate as it would result in the needs of some of the population going unmet (PPG Paragraph: 018 Reference ID: 2a-018-20140306). Such an approach would be contrary to paragraph 17 of the Framework that seeks to meet the nation’s housing requirements in full as well paragraphs 178 to 181 which highlight the need to engage the Duty to cooperate in such situations.

Examination of Luton Local Plan Representations to Inspector’s MIQs Stage 2 Hearings
Matter 5
\\sheffield-svr\Job Files\Bedford\BE\BE108-6PS\Stage 2\17.08.2016.AJR.LBC.BE1086PS.MIQ Rep Matter 5 OAN.FINAL.docx
32
A2.56 The 2015 MYE support the trends within our migration projections of a net increase on all migration to Luton, as set out in Appendix 1.