Footprint Power Salem Harbor Development LP …yosemite.epa.gov/oa/eab_web_docket.nsf/Attachments...
105
Footprint Power Salem Harbor Development LP Salem Harbor Redevelopment Project Prevention of Significant Deterioration Permit Response to Comments on Draft Permit Number NE-12-022, Transmittal Number X254064 Introduction On September 9, 2013, notices were published in the Salem Evening News and the Boston Globe for public review and comment on the Draft Prevention of Significant Deterioration (PSD) Permit for the Footprint Power Salem Harbor Development LP’s Salem Harbor Redevelopment (SHR) Project in Salem, Massachusetts. The comment period was extended to November 1, 2013. MassDEP also held a public hearing at the Bentley Elementary School in Salem, MA on Thursday, October 10, 2013. Comments were submitted by various parties during the public comment period. After careful review of all comments received, MassDEP has made a final decision to issue the PSD Permit. As required by 40 CFR part 124 (Procedures for Decision making), MassDEP has prepared this document, known as the “response to comments” (RTC) that describes and addresses any significant issues raised during the comment period and describes the provisions of the Draft PSD Permit that have been changed and the reasons for the changes. The PSD Fact Sheet has also been changed, to reflect changes that were made to the Draft PSD Permit. MassDEP’s decision making process has benefitted from the various comments and additional information submitted. All changes to the Draft PSD Permit are described in detail below and are contained in the Final PSD Permit. The analyses underlying these changes are explained in the PSD Fact Sheet and the responses to comments that follow. The Final PSD Permit and RTC are available on MassDEP’s website at http://www.mass.gov/eea/agencies/massdep/air/approvals/footprint.html . MassDEP is providing copies (electronic or hard copy) of the Final PSD Permit and RTC to everyone who commented on the Draft Permit or who requested copies of these documents. Copies of the Final PSD Permit also may be obtained by writing or calling MassDEP between the hours of 8:45 AM and 5:00 PM, Monday through Friday, excluding holidays: Cosmo Buttaro, Environmental Engineer MassDEP, Northeast Regional Office 205A Lowell Street Wilmington, MA 01887 Telephone number: (978) 694-3200 Cosmo.Buttaro@ state.ma.us
Transcript of Footprint Power Salem Harbor Development LP …yosemite.epa.gov/oa/eab_web_docket.nsf/Attachments...

Footprint Power Salem Harbor Development LP
Salem Harbor Redevelopment Project
Prevention of Significant Deterioration Permit
Response to Comments on
Draft Permit Number NE-12-022, Transmittal Number X254064
Introduction
On September 9, 2013, notices were published in the Salem Evening News and the Boston Globe
for public review and comment on the Draft Prevention of Significant Deterioration (PSD)
Permit for the Footprint Power Salem Harbor Development LP’s Salem Harbor Redevelopment
(SHR) Project in Salem, Massachusetts. The comment period was extended to November 1,
2013. MassDEP also held a public hearing at the Bentley Elementary School in Salem, MA on
Thursday, October 10, 2013. Comments were submitted by various parties during the public
comment period.
After careful review of all comments received, MassDEP has made a final decision to issue the
PSD Permit. As required by 40 CFR part 124 (Procedures for Decision making), MassDEP has
prepared this document, known as the “response to comments” (RTC) that describes and
addresses any significant issues raised during the comment period and describes the provisions
of the Draft PSD Permit that have been changed and the reasons for the changes. The PSD Fact
Sheet has also been changed, to reflect changes that were made to the Draft PSD Permit.
MassDEP’s decision making process has benefitted from the various comments and additional
information submitted. All changes to the Draft PSD Permit are described in detail below and
are contained in the Final PSD Permit. The analyses underlying these changes are explained in
the PSD Fact Sheet and the responses to comments that follow.
The Final PSD Permit and RTC are available on MassDEP’s website at
http://www.mass.gov/eea/agencies/massdep/air/approvals/footprint.html . MassDEP is
providing copies (electronic or hard copy) of the Final PSD Permit and RTC to everyone who
commented on the Draft Permit or who requested copies of these documents. Copies of the Final
PSD Permit also may be obtained by writing or calling MassDEP between the hours of 8:45 AM
and 5:00 PM, Monday through Friday, excluding holidays:
Cosmo Buttaro, Environmental Engineer
MassDEP, Northeast Regional Office
205A Lowell Street
Wilmington, MA 01887
Telephone number: (978) 694-3200
Cosmo.Buttaro@ state.ma.us

2
MassDEP reviewed the significant comments received from commenters and in many cases
grouped related comments together. Comments expressing general opposition to, or general
support of, the proposed facility have been noted and deemed subsumed into more specific
comments, to which MassDEP has responded below.
In some cases, MassDEP has included original comments nearly verbatim for the reader’s
convenience. In others, MassDEP has included brief summaries of those comments to remind
the reader of the topics being discussed. Even though each comment submitted has not been
reproduced here in its entirety, and many of the details of each comment were not repeated in the
summary comments, please be assured that MassDEP has carefully read and considered every
comment in its entirety. The form of this RTC is simply designed to structure MassDEP’s
responses and make them more accessible to the general public. No significance should be
attached to the form in which MassDEP cited or summarized the original comment in this RTC.
The complete text of every comment as submitted, and a complete copy of the transcript from
the public hearing, is in the administrative record and available by request.
TESTIMONY AND COMMENTS
NAME & AFFILIATION DATE RECEIVED
1. Ida E. McDonnell, United States
Environmental Protection Agency
10/30/13 emailed letter
11/1/13 hard copy letter
2. John Keenan, Massachusetts State
Representative
Oral testimony at hearing
3. George W. Atkins, Patricia Maguire
Meservey, The Salem Partnership
10/31/13 hard copy letter
4. Jeff Barz-Snell, Salem Resident, Salem
Alliance for the Environment (SAFE)
Oral testimony at hearing
5. Jane Bright, HealthLink Oral testimony at hearing
11/1/13 emailed letter and email comment
6. Jeff Brooks, Salem Resident Oral testimony at hearing
10/14/13 and 11/1/13 emails, and 10/17/13
letter
7. Paul R. Campbell, Pipe Fitters Local
537
Oral testimony at hearing
8. Shanna Cleveland, Conservation Law
Foundation (CLF) and Elizabeth
Michaud, Michel Beheshti, Jeff Brooks,
Andrea Celestine, William Dearstyne,
Linda Haley, Douglas Haley,
HealthLink, Clean Water Action, Jane
Bright, Martha Dansdill, Rosalind
Nadeau, Sue Kirby (350
Massachusetts), Dorian Williams (a
Better Future Project-350
Massachusetts), Jody Howard, Marlene
Faust
11/1/13 emailed letter

3
9. Dominic Cucinotti, Salem Resident 10/21/13 email
10. Sonja Cucinotti, Salem Resident 10/18/13 email
11. William E. Dearstyne, Salem Resident 11/1/13 emailed letter
12. Rob DeRosier, Salem Resident, Salem
Chamber of Commerce President,
Footprint Power Salem Harbor
Operations LLC Environmental Health
and Safety Manager
Oral testimony at hearing
13. Elise Desmond, Milton Resident 10/5/13 email
14. George Economides, Salem Resident 10/13/13 email
15. Ken Eisenberg, Cambridge Resident 10/24/13 email
16. Meghan Emmers Oral testimony at hearing
17. Timothy Fandel, Plumbers and Gas
Fitters Local 12
Oral testimony at hearing
18. Pat Gozemba, Salem Alliance for the
Environment (SAFE)
Oral testimony at hearing
Written testimony at hearing
19. Linda Haley, Marblehead Resident Oral testimony at hearing
11/1/13 emailed letter
20. Susan Kirby, Salem Resident, 350
Massachusetts
Oral testimony at hearing
11/1/13 emailed letter
21. Robert Liani, Jr., Coffee Time Bake
Shop, Salem, Salem Chamber of
Commerce
Oral testimony at hearing
22. Lauren A. Liss, Rubin and Rudman
LLP on behalf of Footprint Power
Salem Harbor Development LP
11/1/13 emailed letter
11/4/13 hard copy letter
23. Alison Miller, Salem Resident 11/1/13 emailed letter
24. Lynn Nadeau, HealthLink Oral testimony at hearing
11/1/13 emailed letter
25. George Pyros, Mitsubishi Power
Systems Americas Inc.
10/1/13 emailed letter, 10/7/13 email
26. Nancy Ramsden, Salem Resident 10/21/13 email
27. Sue Reid, Conservation Law
Foundation (CLF)
Oral testimony at hearing
28. Wallace and Clare Ritchie, Salem
Residents
10/19/13 email
29. Stan Rogowski 10/20/13 email
30. Scott Silverstein, Footprint Power
Salem Harbor Development LP
Oral testimony at hearing
Presentation Slides received in 10/11/13 e-mail
31. Robert J. Wengronowitz, Boston
College Student
10/14/13 email
32. Dorian Williams, Medford Resident, A
Better Future Project
Oral testimony at hearing
33. Ed Wolfe, Salem Resident Oral testimony at hearing
34. Patricia Zaido, The Salem Partnership Oral testimony at hearing

4
Changes to the PSD Permit
The following is the list of revisions that MassDEP made from the Draft PSD Permit to the final
PSD Permit based upon comments received. The list includes a brief description of the revision,
and the location in the RTC document and PSD Fact Sheet where MassDEP provides a more
detailed description of the revision.
The Best Available Control Technology (BACT) analyses for all subject PSD pollutants,
for all emission units contained in the Applicant’s PSD permit application have been
attached to the PSD Fact Sheet as Appendix 1 (pages 42 – 105, below).
All references to Lowest Achievable Emission Rate (LAER) have been removed from the
PSD permit and the PSD Fact Sheet, with exception that the reader is directed to the
MassDEP CPA Approval for an explanation of the LAER determination. LAER and
Nonattainment review is a state regulated program, administered at 310 CMR 7.00
Appendix A. An explanation of these issues can be found in the MassDEP CPA Approval
concurrently issued with the PSD Permit for the SHR Project.
Since all references to LAER have been removed from the PSD Permit and PSD Fact
Sheet, any comparison of LAER to BACT is no longer germane to the PSD Permit or
PSD Fact Sheet. However, a comment was received regarding the LAER and BACT
emission limits and associated control strategies. As such, this issue is addressed within
the BACT and LAER sections of this Response to Comments (RTC) document.
MassDEP utilized the EPA October 1990 draft New Source Review Workshop Manual
and the MassDEP June 2011 BACT guidance document for the evaluation of BACT for
this project including the evaluation of energy, environmental and economic impacts of
all control options in its selection of BACT for each pollutant. Additional discussion of
this issue can be found in the BACT sections of this RTC document and the PSD Fact
Sheet.
MassDEP does not have the electronic capability at this time to provide a “hyperlink” as
was suggested, to the Applicant’s modeling analysis. MassDEP can provide CD/DVD
copies of the modeling analysis for the proposed SHR Project upon request.
To ensure that the National Ambient Air Quality Standards (NAAQS) and PSD
increments are protected in all instances, MassDEP has compiled information on the
applicable background concentration levels, the NAAQS and applicable Significant
Impact Levels (SILs). This information can be found in the RTC document page 18,
Table B. The Applicant provided comment (November 1, 2013) and also provided
technical information (December 11, 2013 supplemental application submittal) to
MassDEP from the combustion turbine vendor, General Electric (GE), pertaining to
emissions of particulate matter (PM) and carbon monoxide (CO). The turbine vendor
indicated that PM emissions, project wide, could be reduced by approximately 25 percent
from the levels contained in the Draft PSD Permit. Specific PM emission reductions
could be obtained at various operating scenarios. (See Attachment 1, Table A-1,
highlighted text.) The turbine vendor has also supplied new performance data that show
that CO will be controlled to less than 2.0 parts per million by volume, dry basis,
corrected to 15% O2 (ppmvdc) at the minimum emission compliance load and that with
greater loads the CO emissions will not exceed 8.0 lbs/hr with and without duct firing.

5
This emission cap is achievable because the turbines are able to operate more efficiently
under higher load conditions. The Applicant also corrected an error in its calculation of
CO emissions during start up and shut down. The Applicant incorrectly assumed that if
the plant were shut down on Friday night and restarted on Monday morning this would
result in a cold start (a startup after a shutdown of more than 72 hours) rather than a warm
start (a start up after a shutdown of approximately 60 hours). Since warm starts result in
lower CO emissions than cold starts, this correction reduced the plant’s annual CO
emissions. In addition, in response to public comments, MassDEP required the Applicant
to include an oxidation catalyst on its proposed auxiliary boiler (EU3), further reducing
facility wide CO emissions. Taken together, these actions have resulted in the reduction
of facility-wide CO emissions, to 88 tons per year (tpy), a level that is below the PSD
significance level of 100 tpy. This 88 ton per year limit on CO emissions is set forth in
the CPA Approval issued concurrently with the PSD Permit and is a federally
enforceable limit. As a result, CO emissions are no longer subject to PSD review and the
PSD Permit no longer contains limits for CO emissions.
Pollutants listed in the Draft PSD Permit and Draft PSD Fact Sheet have changed. The
Draft PSD Permit and Fact Sheet listed all PSD pollutants and included other non-PSD
pollutants. All non-PSD pollutants have been removed from the PSD Permit and PSD
Fact Sheet. Furthermore, the reduction in CO emissions to 88 tons per year (tpy), below
CO PSD significance level of 100 tpy, eliminated CO from PSD review. In addition, both
SO2 and VOC are proposed to be emitted at less than their PSD Significance levels; thus
SO2 and VOC have also been removed from the PSD Permit. PSD Applicability for the
proposed SHR Project is now limited to regulating nitrogen oxides (NOx), particulate
matter (PM/PM10/PM2.5), sulfuric acid mist (H2SO4) and Greenhouse Gases (GHG).
As mentioned above, the BACT analyses are attached to the PSD Fact Sheet and
identified as Appendix 1. Each emission unit’s PSD applicable pollutants have been
reviewed and evaluated for BACT. MassDEP has reaffirmed its acceptance of BACT for
each PSD applicable pollutant for the proposed SHR Project.
The Draft PSD Fact Sheet erroneously contained the startup and shutdown emission
limits of 23 and 29 lbs, per event, respectively, for PM/PM10/PM2.5 which are actually
the startup and shutdown emission limits for VOC (see August 6, 2013 supplement to
Application, Plan Approval, and PSD Permit). This has been corrected in the PSD Fact
Sheet. An error was also found with respect to the BACT emission limits for the auxiliary
boiler. The Draft PSD Fact Sheet erroneously contained a BACT H2SO4 emission limit of
0.0010 lb/MMBtu instead of 0.0001 lb/MMBtu as stated in the Draft PSD Permit and
Proposed Plan Approval (See December 21, 2012 Application, Appendix B and August
20, 2013 supplement to the Application). This has been corrected in the PSD Permit and
PSD Fact Sheet.
With the addition of the oxidation catalyst on the auxiliary boiler (EU3) come collateral
impacts on H2SO4 emissions. The oxidation catalyst has the potential to convert an
additional quantity of SO2 to H2SO4. Therefore, there is an increase in the sulfuric acid
(H2SO4) emission limit for the auxiliary boiler from 0.0001 lb H2SO4 pounds per million
British thermal units (lb/mmBtu) to 0.0009 lb H2SO4/mmBtu. This H2SO4 emission limit
has been reviewed by MasDEP and determined to be BACT for H2SO4 for EU3. This is
reflected in the PSD Permit emission limit table and the PSD Fact Sheet related to H2SO4
BACT emission limit.

6
The PM/PM10/PM2.5 BACT emission limit for the combustion turbines has been reduced
from 0.0088 lb/mmBtu to 0.0071 lb/mmBtu. The Applicant has provided 25 potential
operating scenarios at various seasonal conditions (differing ambient temperature,
ambient pressure and ambient humidity) during which the PM/PM10/PM2.5 emission rate
varies from 0.0038 lb/mmBtu to 0.0071 lb/mmBtu. The Applicant states that at 0 degree
Fahrenheit the gas turbines can achieve the PM/PM10/PM2.5 rate of 0.0038 lb/mmBtu and
at a high temperature of 105 degree Fahrenheit can achieve the PM/PM10/PM2.5 of 0.0047
lb/mmBtu. MassDEP has reviewed all of the submitted annual projected operating
scenarios for the proposed SHR Project, and all combustion turbine operating conditions
(duct burner firing and duct burner not firing) and as stated above, has determined that
0.0071 lb/mmBtu is BACT for PM/PM10/PM2.5. This discussion may be found in the PSD
Fact sheet, the RTC below and in the PSD Permit emissions Table 2.
BACT emissions limits for PM/PM10/PM2.5 start-ups and shutdowns have increased from
the Draft PSD Permit. However, the PM/PM10/PM2.5 emissions during start-up and
shutdown will never exceed the steady-state, non start-up/shutdown PM/PM10/PM2.5
BACT emission limit in pounds per hour. Therefore, the modified PM/PM10/PM2.5 start-
up/shutdown emission limits are determined to be BACT by MassDEP. The issue is
further explained in the PSD Fact Sheet and RTC sections pertaining to start-
up/shutdown emissions.
Specific changes to the Draft PSD Permit are identified below.
o Section I. Reference to the EPA and MassDEP Delegation Agreement have been
removed.
o Section II. An oxidation catalyst was added to EU3 and is identified as PCD8.
o Section II. All reference to CO is removed from Table 1.
o Section III. Table 2. CO emission limits have been removed.
o Section III. Table 2. PM/PM10/PM2.5 emission limits have been reduced.
o Section III. Table 2. VOC, SO2, NH3, smoke and opacity have been removed.
o Section III. Table 2. Start-up/shutdown PM/PM10/PM2.5 emission limits have been
increased per event. (However, at no time will these emissions exceed
PM/PM10/PM2.5 BACT governing steady state combustion turbine operations.)
o Section III. Table 2. Note 7. CO emissions have been eliminated.
o Section III. Table 2. Note 11. Additional information has been supplied regarding
PVEC CO2 emission factor verses proposed SHR Project CO2e and CO2 emission
factor.
o Section III. Table 2. Note 13. Discussion of BACT verses LAER stringency
removed.
o Section III. Tables 2, 3, 4 and 5. All references to VOC, CO, NH3, smoke and
opacity have been removed.

7
Responses to Comments
Prevention of Significant Deterioration (PSD)
A comment was received pertaining to PSD:
“…a total of six pollutants emitted from this proposed gas power plant will be classified
….as having a significant emission rate….also classified as a ‘major source’....”
Response:
Under the PSD Regulations at 40 CFR 52.21, if the proposed source is one of twenty eight (28)
specific source categories listed at 40 CFR 52.21(b)(23), and it has the potential to emit 100 or
more tons per year (tpy) of one or more PSD pollutants, the applicant must obtain a PSD Permit.
Footprint’s emission units fall under one of those 28 listed PSD categories. As such, the project
is classified as a major source on the basis of potential nitrogen oxides (NOx) emissions
exceeding 100 tpy and Greenhouse Gas (GHG) emissions exceeding 100,000 tons carbon
dioxide equivalent (CO2e) per year. Therefore, the project must undergo the PSD review
process.
Once under PSD review as a major source, the substantive PSD review requirements, including
compliance with Best Available Control Technology (BACT), apply to the pollutants emitted at
major rates (NOx and GHG), as well as the other PSD-regulated pollutants which would be
emitted at or above their respective significant rates, as follows: PM (25 tpy), PM10 (15 tpy),
PM2.5 (10 tpy) and sulfuric acid mist (7 tpy).
Best Available Control Technology (BACT) Analysis
Several comments were received pertaining to the BACT analysis, including:
“The Fact Sheet’s BACT analysis only provided the results of the BACT analysis but not
the analysis itself.”
“…EPA recommends the MassDEP attach the applicant’s BACT analysis as an appendix
to the Fact Sheet or include a hyperlink that links the Fact Sheet to the applicant’s BACT
analysis.”
“…while Lowest Achievable Emission Rate (LAER) and BACT may result in similar
emissions rates for the pollutant under review, LAER and BACT are separate technology
standards used in different permitting programs with different policy and regulatory
requirements.”
“…a BACT analysis requires the permitting agency to evaluate the energy,
environmental and economic impacts for any control option to determine if any
significant collateral impact exists that would preclude a control option to be selected as
BACT…”
“the permit and application do not properly conduct BACT analyses…”
“…PSD Permit establishes CO BACT without conducting the proper BACT analysis…”

8
“…permit applications with lower CO and VOC permit limits are under review (2013
Cove Point LNG project)…”
“…no explanation for VOC emissions increase during duct firing while CO does not
increase…”
“…auxiliary boiler emission limits: 9 ppm NOx, 47 ppm CO, 11.8 ppm VOC; proposed
emission limits high, Delegation Agreement not followed for boiler BACT…”
“…SCR would be BACT for the auxiliary boiler and consistent with MassDEP’s 2011
BACT Guideline Document, Delegation Agreement not followed…”
“…the Delegation Agreement was not followed re: PM BACT…”
“…the draft/proposed permits establish a BACT limit for greenhouse gas emissions, …,
it is unclear whether the project will achieve the same levels of efficiency and the heat
rate limits of recently permitted projects…”
“…the permit references additional greenhouse gas emissions from nitrous oxide and
methane, but it does not appear to account for the methane and nitrous oxide emissions in
determining compliance with the emission limit for total GHGs…”
Response:
MassDEP has modified the appropriate section of the PSD Fact Sheet by removing reference to
LAER, since LAER is a separate technology standard that is not used in the PSD permitting
program.
The applicant performed a project-specific top-down BACT analysis in accordance with the
BACT analysis procedures cited in the PSD regulations at 40 CFR 52.21 and the “Agreement for
Delegation of the Federal Prevention of Significant Deterioration (PSD) Program by the United
States Environmental Protection Agency, Region 1 to the Massachusetts Department of
Environmental Protection” (“Delegation Agreement”) with USEPA Region 1 (signed April 11,
2011).
The applicant’s top-down BACT analysis is appended to the final PSD Fact Sheet as
Appendix 1. Based on MassDEP review, the analysis conforms to USEPA Guidance and results
in BACT determinations and emissions limitations consistent with the Draft PSD Fact Sheet and
Draft PSD Permit. The PSD Fact Sheet now refers to MassDEP’s review of this analysis as the
basis for MassDEP’s BACT determinations. Please note that the applicant has obtained
emissions guarantees from the turbine manufacturer for carbon monoxide (CO) and particulate
matter (PM) emissions that are lower than those contained in the Draft PSD documents. The
final PSD Permit and PSD Fact Sheet reflect the revised lower PM values as enforceable BACT
emissions limitations. Since each turbine’s hourly not-to-exceed CO value has been reduced, and
Footprint has been required to install, operate and maintain an oxidation catalyst on the Auxiliary
Boiler, allowable CO emissions from the Footprint proposal will now be less than the PSD
Significance level of 100 tpy; therefore, CO has been removed from the PSD Permit. In
addition, sulfur dioxide (SO2) and volatile organic compounds (VOC) have been removed from
the PSD Fact Sheet and PSD Permit since neither criteria pollutant will be emitted at or above its
applicable PSD significance level. Finally, since ammonia (NH3) is not a PSD pollutant, it has
also been removed from the PSD Permit. All of these air contaminants are however regulated by
the 310 CMR 7.02 Plan Approval which is being issued concurrently with the PSD Permit.

9
As stated above, MassDEP has added the applicant’s BACT analysis to the final PSD Fact Sheet.
Please note, however, that MassDEP follows the guidance contained in the October 1990
USEPA draft New Source Review Workshop Manual at page B.8. It states that “…an applicant
proposing the top control alternative need not provide cost and other detailed information in
regard to other control options. In such cases the applicant should document, to the satisfaction
of the review agency and for the public record that the control option chosen is, indeed, the top,
and review for collateral environmental impacts.” The USEPA Guidance goes on to state that
“[i]f the applicant accepts the top alternative in the listing as BACT, the applicant proceeds to
consider whether impacts of unregulated air pollutants or impacts in other media would justify
selection of an alternative control option. If there are no outstanding issues regarding collateral
environmental impacts, the analysis is ended and the results proposed as BACT.”
BACT for CO and BACT for VOC are outside the scope of this PSD Permit, but are addressed in
the state issued 310 CMR 7.02 CPA Approval.
The Cove Point CO and VOC emission limits referenced by commenters are only proposed
values, and are not permitted limits. Furthermore, each gas turbine has its own unique emissions
profile. The proposed Cove Point project would be subject to lower CO and VOC emissions
limits; however, the NOx limit is 25 percent higher than the proposed SHR Project (the Cove
Point NOx BACT of 2.5 ppm versus the SHR Project NOx BACT of 2.0 ppm). For the SHR
project, this increased NOx emission limit would equate to a potential NOx emissions increase of
36.2 tons per year (tpy)compared to the claimed potential increase of more than 20 tpy CO and 8
tpy VOC. More importantly, NOx emissions from the Footprint proposal must comply with
LAER as well as BACT; and MassDEP has determined that NOx LAER is 2.0 ppm, not 2.5 ppm
as required for the Cove Point proposal. Furthermore, if Cove Point were required to reduce its
NOx BACT from 2.5 to 2.0 ppm—as required by the SHR PSD Permit—it is a likely
consequence that the Cove Point CO and VOC emissions would increase. Given the case-by-
case nature of the BACT process, MassDEP has chosen to require a stringent NOx emission rate
as NOx BACT for the SHR Project at the expense of marginally higher CO and VOC BACT
limitations. The Applicant’s BACT analysis evaluated the energy, environmental and economic
impacts of the interrelated control options for each pollutant. Upon review, MassDEP concluded
that the particular combination of emissions limitations contained in the PSD Permit is justified.
Please further note that, as a result of comments submitted by the applicant concerning CO
emissions from the GE turbines, the hourly, not-to-exceed CO emission limitation for each
turbine has been reduced from 11 pounds to 8.0 pounds. This revised limit results in less CO
emissions from the SHR project while maintaining the stringent NOx BACT emissions
limitation.
VOC emission limits increase during duct firing operation, as opposed to non-duct firing
operation, primarily due to the firing of additional fuel and the efficiency of the oxidation
catalyst. The applicant has provided data from their equipment vendor GE that VOC emissions
increase during duct firing operation because duct firing results in larger increases in the VOC
mass emission rate and concentration than in the CO emission rate and concentration. Oxidation
catalysts are less efficient for controlling VOC emissions than for CO emissions. Also as noted

10
above, VOC has been removed from the PSD Permit since allowable VOC emissions are below
the VOC PSD significance level.
Regarding the auxiliary boiler, a combined cycle gas turbine is not analogous to a standalone
boiler with respect to exhaust characteristics, technical feasibility of particular emissions
controls, or quantitative emissions concentrations or emissions factors. For example, each has
different combustion air demands, which lead to different volumetric flows through each type of
machine and therefore different achievable BACT emissions limits on a part per million (ppm)
basis. BACT for boilers (the SHR auxiliary boiler) was evaluated in accordance with the
Delegation Agreement, guidance contained in the October 1990 USEPA draft New Source
Review Workshop Manual and MassDEP’s 2011 BACT Guideline Document.
GHG BACT has been addressed in the updated PSD BACT analysis for GHG emissions (Section
4.1.5 of the Applicant’s December 11, 2013 submital) and that analysis has been appended to the
PSD Fact Sheet. The Footprint design thermal efficiency is 57.9 percent. Concern that this value
exceeds the proposed thermal efficiency values cited in a letter written by USEPA’s Steven Riva
(Chief, Permitting Section, Air Programs Branch) addressing recently approved PSD Permits
concerning GHG emission values and thermal efficiencies is misplaced. The use of thermal
efficiencies is not a recommended regulatory requirement due to heat rate degradation, duct
firing operation/no duct firing operation, ambient temperature, cooling technology, and number
of start-ups and shutdowns. Thus the GHG BACT for the SHR Project is expressed in pounds of
CO2e per megawatt hour.
Furthermore, the GHG BACT emission limit is expressed as “CO2e” rather than CO2. CO2e
incorporates all federally enforceable GHGs emitted from emission units at the proposed SHR
Project the including CO2, methane and nitrous oxide.
Particulate Matter (PM/PM10/PM2.5)
Several comments were received pertaining to Particulate Matter emissions, including:
“…MassDEP is forcing 1 million people to take on avoidable health risks every year for
the next 40 years to cover one to two years of a power shortfall that can be met with
existing power plants…”
“… there is *no* safe level of particulate matter for atmosphere humans will be
breathing…”
“…GE will now guarantee [lower] filterable plus condensable particulate stack emissions
for operating loads greater than MECL…this results in a 25% reduction in potential to
emit particulate matter...”
“…distinguish between filterable and condensable limits for PM…”
“…MassDEP has determined that the Footprint position regarding the PVEC (Pioneer
Valley Energy Center) emission limit of 0.004 lb/MMBtu has merit and concludes that
the PM emission rate of 0.0088 lb/MMBtu represents BACT for PM/PM10/PM2.5.”

11
Response:
The Footprint ambient air quality impacts study documented that worst case PM2.5 emissions
from the proposed SHR Project (plus a conservative background value, plus interactive sources
located nearby to the proposed SHR Project Site) will comply with the health based PM2.5
National Ambient Air Quality Standards (NAAQS). Also, please note that Footprint requested a
“25 percent lower” PM2.5 emission limitation as BACT for PM2.5 for its turbines. This lower
PM2.5 BACT emission limit is contained in the PSD Permit.
All of the PM/PM10/PM2.5 emissions limitations contained in the Plan Approval and PSD Permit
include filterable and condensable PM. Filterable PM will be measured via USEPA Reference
Test Method 201A and condensable PM will be measured by USEPA Reference Test Method
202. As long as the sum total of both PM species is at or below the PM2.5 BACT emission
limitation, the facility will be in compliance with that standard.
MassDEP has evaluated the PM emission limits and guarantees for the Pioneer Valley Energy
Center (PVEC) provided by Mitsubishi Power Systems Americas, Inc. (MPSA) for the
M501GAC gas turbine utilizing ultra dry low NOx (DLN) combustors. To date, there is no
empirical data available to MassDEP supporting the 0.004 lb/mmBtu emission limit. A review of
the recently available GE combustion turbine data indicates that the PM/PM10/PM2.5 emission
rate at various operating scenarios and ambient temperatures varies from a low of 0.0038
lb/mmBtu to 0.0071 lb/mmBtu. For the reasons more fully set out in the PSD Fact Sheet,
MassDEP has lowered the PM/PM10/PM2.5 BACT value in the PSD Permit and the Plan
Approval to 0.0071 lb/mmBtu based on its GE Energy 107G Series 5 Rapid Response Combined
Cycle Plant emission data.
Footprint expects to operate the gas turbines in various operational configurations throughout the
calendar year experiencing seasonal fluctuations in ambient temperature, pressures and humidity,
all of which have an effect upon gas turbine performance and emissions. To be responsive to the
Independent System Operator (ISO) – New England (NE) requirements to generate electricity,
the SHR Project.
must be capable of operating at all seasonal conditions and responsive to various electric power
demands. As such, GE Energy provided updated performance data for the GE Energy 107F
Series 5 Rapid Response CCP. The PM/PM10/PM2.5 emissions data across the entire operating
range at various seasonal atmospheric conditions will vary from a low of 0.0038 lb/mmBtu to
0.0071 lb/mmBtu. MassDEP believes that the PM/PM10/PM2.5 emissions range of 0.0038 to
0.0071 lb/mmBtu represents an accurate PM emissions profile for the gas turbine under the
proposed operational scenarios and anticipated seasonal conditions in the Salem area.
Footprint’s gas turbine vendor, GE, has indicated that there are operating scenarios where the
PM emissions are less than the PVEC PM emission limit of 0.004 lb/mmBtu. However, there
are other operating scenarios having PM emissions greater than 0.004 lb/mmBtu. Based upon a
review of available PM/PM10/PM2.5 emissions data from the EPA’s RBLC (RACT/BACT/LAER
Clearinghouse), the PVEC PSD permit and application and the emissions data provided by GE
Energy, MassDEP has determined that the PM/PM10/PM2.5 emission limit of 0.0071 lb/mmBtu
12
represents BACT for PM. This PM/PM10/PM2.5 BACT emission limit properly governs these
emissions over all proposed SHR project operational scenarios.
Lowest Achievable Emission Rate (LAER)
(Outside the Scope of PSD Permit-Pertains Solely to State CPA Approval)
Two comments were received pertaining to the LAER technology standard, including:
“…the auxiliary boiler has an ultra low NOx burner on it but it doesn’t look like LAER
was considered when they were selecting the burners…”
“…Lowest Achievable Emission Rate (LAER) and BACT may result in similar
emissions rates for the pollutant under review, LAER and BACT are separate technology
standards used in different permitting programs with different policy and regulatory
requirements…”
Response:
MassDEP has supplied ambient ozone monitoring data to USEPA demonstrating that the
Commonwealth is attaining the 75 ppb ozone NAAQS. Though having data showing attainment
would normally mean that LAER was no longer required in permitting decisions, MassDEP has
retained the provisions requiring LAER in our regulations and therefore, SHR is subject to
LAER.
The NOx emission limits for the auxiliary boiler and emergency RICE (reciprocating internal
combustion engine/generator set and fire pump) represent LAER. There were no more stringent
applicable SIP emission limitations, no projects found with lower emissions performance
achieved in practice, or lower emissions limits set in permits on the basis of LAER for RICE.
The Plan Approval language regarding LAER has been clarified as stated above.
MassDEP has modified the appropriate section of the PSD Fact Sheet by removing any reference
to LAER, since LAER is a separate technology standard that is not used in the PSD permitting
program. LAER is a technology standard utilized in the new source review permitting program
that exclusively reviews non-attainment pollutant permitting of major stationary sources. The
non-attainment review program is administered by MassDEP through the plan approval
permitting process (pursuant to Regulations 310 CMR 7.02 and 310 CMR 7.00 Appendix A).
Startup/Shutdown Operations (SU/SD)
Several comments were received pertaining to SU/SD operations, including:
“…starting and stopping of the turbines which leads to significant amounts of emissions
to be dispersed into our neighborhoods… until the exhaust heats up to operating
temperature and the ammonia starts injecting into the selective catalyst during start-up…”

13
“…during startups, the SCR system cannot be turned on until the temperature inside the
Heat Recovery Steam Generator (HRSG) at the SCR grid reaches a temperature of
approximately 575 deg F… combined-cycle units can often take as long as 180 minutes
to reach this temperature…”
“…the Siemens SGT6-5000F turbine emits up to 24 lb of NOx over a 12 minute start-up
period and 15.44 lb/hr after the MECL is reached and therefore, 36.4 lb/hr of NOx during
an hour that includes a startup…”
Elevated amounts of emissions during start-up and shutdown of these turbines differ
between submittals provided in charts by the Energy Facilities Siting Board (EFSB) dated
July 12, 2013 and MassDEP’s, Table 3 of the PSD Draft Fact Sheet.
“…Gas turbine start-up and shutdown NOx emissions, Delegation Agreement not
followed re: BACT for start-up and shutdown emissions…”
Response:
Combustion turbine NOx emission rates during startup are affected by the temperature of the
SCR catalyst. In order for the SCR catalyst to be effective in controlling NOx emissions, it has to
reach and maintain a temperature in the range of approximately 550 to 650 Degrees Fahrenheit
prior to the introduction of ammonia to control NOx emissions and to minimize emissions of
unreacted ammonia. Prior to this point, called the minimum emissions compliance load (MECL)
which is the point when the SCR catalyst temperature and other SCR system parameters are
satisfied for SCR operation, NOx emissions are essentially emitted uncontrolled. Therefore, it is
advantageous from an emissions standpoint to have rapid response turbines with quick-start
capability like the GE and Siemens turbines that were under consideration for the Footprint
project, i.e., turbines that reach the MECL in a minimum amount of time.
MassDEP acknowledges that the GE 7FA turbines proposed for the Footprint project emit up to
93.5 pounds (lb) of NOx during an hour that includes a startup, given restricted NOx emissions of
no more than 89 lb per startup event over a period not to exceed 45 minutes. However, note that
this emission rate is only true for a “cold” startup. The applicant has indicated in their plan
submittal that there will be no more than 13 cold startups per year. Startups may be cold,
“warm”, or “hot” with diminishing emission rates and duration, respectively, before the MECL is
reached and the turbine would then be allowed to emit NOx at no more than 18.1 pounds per
hour (lb/hr) for the GE 7FA turbines.
The comment states that the Siemens SGT6-5000F turbine emits up to 24 lb of NOx over a 12
minute start-up period and 15.44 lb/hr after the MECL is reached and therefore, 36.4 lb/hr of
NOx during an hour that includes a startup. The comment does not state whether this NOx
emission rate for the Siemens turbine is for a cold, warm, or hot startup. Based on MassDEP’s
review of the information submitted in Footprint’s application, the Siemens 5000F turbine
cannot achieve the 36.4 lb/hr of NOx for any startup condition. Expected emission rates and
durations for warm and hot turbine startups, and shutdowns, are lower than the emission rate and
duration for cold startups. Similarly, the emission rates and durations of a simple cycle turbine
startup are not comparable to those of a combined cycle turbine like the GE 7FA turbines
proposed for the SHR Project. MassDEP requested that Footprint provide a comparison of the
startup emission rates and durations for the GE and Siemens combined cycle turbines, as

14
addressed in the August 6, 2013 supplement to the Footprint Application. A comparison of the
GE and Siemens NOx startup and shutdown emission data is provided in Table A below. Only
the cold start conditions mean the GE turbine emits higher NOx. However, if one would evaluate
a “full cycle,” that being a shutdown and cold startup, the GE turbine is lower emitting for NOx
than the Siemens unit.
TABLE A
Comparison of GE and Siemens
NOx Startup/Shutdown Emissions Data
(Pounds of NOx per Event)
EVENT GE 7FA Siemens 5000F Difference
Cold Start 89 83 6
Warm Start 54 79 -25
Hot Start 28 58 -30
Shutdown 10 20 -10
Older generations of combined cycle gas turbine power plants could take as long as two to three
hours to complete a “cold” startup. However, Footprint has chosen to use the newest generation
of GE turbines. GE guarantees that these turbines will meet the following parameters: a cold
startup takes no longer than 45 minutes to complete; a “warm” startup takes no longer than 32
minutes to complete; a “hot” startup takes no longer than 18 minutes to complete; and a
shutdown takes no longer than 27 minutes to complete. The shorter startup and shutdown periods
reduce emissions substantially.
The conservative ambient air quality impact analysis protocol required under the state and
federal air quality permitting processes must include consideration of worst case air pollutant
emissions during turbine startup and shutdown periods. Footprint demonstrated, via use of
computer dispersion models which have been approved by USEPA, that combustion turbine
startup and shutdown emissions would not result in an exceedance of any applicable, health
based NAAQS.
MassDEP environmental engineers reviewed the original Footprint Power plan application and
the several supplemental submittals which were made to MassDEP in detail, including
information related to the SHR Project’s turbines regarding startups, shutdowns and associated
emissions. MassDEP based the PSD Fact Sheet and PSD Permit SU/SD numbers on our review
of all of the data which was submitted to MassDEP. MassDEP received data from the applicant

15
on August 6, 2013 comparing the difference between GE and Siemens turbines for SU/SD
operations. Additional SU/SD emissions data was submitted by the Applicant on January 10,
2014. All of this SU/SD data was more recent than the data provided to EFSB.
Stack Height
Several comments were received pertaining to the stack height, including:
“…they lowered the stack height from the initial plans from 250 feet to 230 feet to save
money.”
“…the proposed stacks will be 230 feet high, much lower than the current stack heights
or even the best practices recommendation of over 300 feet…”
“…the stack would be 20 feet lower then specs called for, which would also impact area
residents, particularly the children at the Bentley School…”
Response:
The federal PSD regulations at 40 CFR 52.21 and the Massachusetts Plan Approval Regulations
at 310 CMR 7.02 require that any applicant must, among several other things, demonstrate that
the worst case air emissions from their proposed emission unit(s) would result in compliance
with all applicable, health based, National Ambient Air Quality Standards (NAAQS). This
ambient air quality analysis requires the use of computer dispersion models which have been
reviewed and approved by USEPA. The inputs to these models include the use of: facility
parameters such as stack height, stack velocity, stack temperature, etc., representative
background concentrations of each NAAQS attainment pollutant as measured by the
Massachusetts ambient air monitoring network, representative meteorological parameters, and
the actual emissions of certain large emitters of those pollutants which are located in the area
proximate to the proposed facility’s location. Footprint originally anticipated constructing a 250
foot stack for the proposed SHR project. However, Footprint’s interactive, ambient air quality
impact analysis demonstrated that its worst case emissions from the 230 foot stack, plus
representative background concentrations, plus emissions from certain nearby large emitters of
these pollutants, demonstrates compliance with all applicable, health based NAAQS. Footprint
asserted in their Energy Facilities Siting Board (EFSB) filings that they would prefer a 230 foot
stack since it would represent an appropriate balance between air emissions impacts and visual
impacts.
Air Quality Dispersion Modeling and Ambient Monitoring
Several comments were received pertaining to the air quality dispersion modeling analyses and
ambient monitors, including:
“…the air monitoring station (Lynn, MA.), that is being used as a model is not adequate
in representing the air quality for the area where the gas plant is to be built in Salem…”

16
“…propose that MassDEP set up a sampling station, prior to issuing an air permit, in our
Salem neighborhood that both abut the power plant and the South Essex Wastewater
Treatment plant…”
The Footprint modeling “…[did] not take into consideration anything regarding wind
shift…”
“…very concerned that the proposed project will cause undo harm to those of us living
within the plume radius of such a gas plant…”
“The June 2013 Second Supplement from Tetra Tech shows in Table 6-11 that the
predicted maximum 1 hr concentration for NO2 is 188 µg/m3: exactly equal to the
NAAQS for NO2. This value is higher than that of the September 9, 2013 PPA which
shows a predicted value of 166 µg/m3.”
“…there appears to have been a significant change to the analysis with respect to NO2. In
one of the earlier scenarios, the cumulative impact of the facility along with the
interactive sources appears to reach the 1-hour NAAQS for NO2, 188 μg/m3. See June
2013 revision with modeling for cumulative impacts at Table 6-11 shows that NO2
reaches 188 which is the NAAQS for NO2. They also appear to have changed the tons
[of NOx] per year from 150 to 148.8. However, the final Table 2 of the Proposed Plan
Approval shows a maximum impact of 166 ug/m3.”
“…the predicted ambient concentrations are so close to the NAAQS forces a scrutiny of
the modeling assumptions made…”
“…reference to using an urban or rural designation relates to an outdated methodology
used in the predecessor model to AERMOD, ISCST…”
“…disallow the conclusion presented by Footprint for the NO2 1 hour NAAQS based on
the misuse of EPA interpretations…”
“… The interaction source impacts dominate the maximum total concentrations, so the
results were reviewed to confirm that the proposed SHR facility does not significantly
contribute to any modeled concentration at or above 105.7 ug/m3. This evaluation uses
the EPA default 80% conversion of NOx to NO2...”
“…the cumulative impacts (maximum 1-hour plus ambient background) for NO2 and
SO2 are well below the 1 hour health-protective NAAQS as well as other short-term
exposure guideline levels…”
“…there are two small areas of isolated peak NO2 one-hour concentrations (in the range
of 36 to 42 μg/m3 and well below the NAAQS of 188 μg/m3). These are located very
close to the SHR Project site to the northeast and southwest of the power plant stack.
These areas are not close to any EJ areas…”
“…the dispersion model used rural coefficients…”
“…there was a release model for ammonia, and it looks like it uses the exact same model
to show the dispersion of the accidental release. And it seems a little weird to me to use
the same model…”
“…the Draft PSD Fact Sheet only provided the results from the modeling analysis but not
the analysis itself…”
“The use of Significant Impact Levels (SILs) alone as a screening tool to show
compliance with the National Ambient Air Quality Standards (NAAQS) and PSD
increments may not be adequate.”

17
“…why preconstruction monitoring as provided for through the PSD regulations was not
undertaken, why the monitors from Lynn and Harrison Avenue were considered
appropriate for estimating the impacts of this facility…”
“…the modeling analysis is defective due to its use of Logan Airport meteorological data.
The specific geographic, wind, and other feature differences as between Logan airport
and the site that render it inappropriate for use in the modeling…”
“The PPA states that a 3km radius surrounding the facility was used to determine
dispersion coefficients for use in AERMOD and states that rural coefficients were used.
In fact, EPA requires that the surface conditions (roughness length, albedo and Bowen
Ratio) within a 1 km radius of the anemometer used for dispersion analyses (in this case,
Logan Airport), be used as the basis for determining the roughness length used in the
model algorithms. The reference to using an urban or rural designation relates to an
outdated methodology used in the predecessor model to AERMOD, ISCST.”
Response:
MassDEP’s response to comments concerning air quality dispersion modeling and ambient
monitoring are presented in three sections below:
A. Responses concerning Ambient Background Concentrations/Monitors/Monitoring
Given its location on the southeast perimeter of the Lynn Woods Reservation, the immediate
surroundings of the Lynn air monitoring station are somewhat more rural than the immediate
surroundings of the SHR Project Site. However, the Lynn station measures regional air pollution
being transported to it from highly populated and industrialized areas located upwind within and
beyond Lynn, in a sector from the south to southwest of the station. This sector is the same as
the predominant prevailing winds in the area that would transport pollution into the Lynn area.
From a local perspective, as described in the PSD Fact Sheet, the data from the Lynn monitoring
site is considered to be conservative (i.e., has the potential to measure higher pollution
concentrations) because Lynn is a more industrialized and densely populated area than the
proposed project site area, particularly without the influence of the existing Salem Harbor
Station. Furthermore, the SHR Project Site is located adjacent to Salem Harbor, a large water
body where potential sources of air pollution are more limited. Therefore, MassDEP required the
applicant to use ambient monitoring data from the Lynn station for the most recently available
three calendar years 2010, 2011 and 2012.
Concerning the locations of the GE and Wheelabrator Plants with respect to the Lynn monitoring
station, these plants are south-southwest of the Lynn monitor. This location places the plants
within the south to southwest wind sector that would transport their emissions toward the Lynn
monitor. In addition, the GE and Wheelabrator plant emissions were included in the modeling
analysis, which means they have been explicitly accounted for over the distribution of possible
meteorological conditions. Also, the emissions from existing Salem Harbor Station for calendar
years 2010 and 2011 impacted the Lynn monitor when north and northeast winds prevailed
during those time periods.

18
The South Essex Sewerage facility, located adjacent to the proposed SHR Project site, houses
several small boilers, emergency generators, water heaters, etc. Total air emissions from the
South Essex facility are less than 10 tons per year (tpy). Actual PM10/PM2.5 emissions for
calendar year 2012 were 0.14 tpy, sulfur dioxide (SO2) emissions were 0.29 tpy, nitrogen oxides
(NOx) emissions were 3.3 tpy, and carbon monoxide (CO) emissions were 2.7 tpy. The South
Essex Sewerage facility is a minor source and has an insignificant contribution to the overall
impacts on ambient air quality concentrations in Salem.
MassDEP has compiled Table B (below) listing background ambient concentrations, the
applicable NAAQS, background minus NAAQS, and the applicable SIL. The table is presented
to address concerns that the initial modeling to determine impact significance/insignificance, and
therefore compliance with NAAQS/PSD Increments in the case of insignificant impact findings,
might not be adequate.
TABLE B
Difference Between NAAQS and Background Concentrations
in Comparison to Applicable SIL
Pollutant Averaging
Time
National
Ambient Air
Quality
Standards
(NAAQS)
Background
Concentration
Significant
Impact Level
Difference
Between
Background
and NAAQS
PM2.5 24-hr 35 18.9 1.2 16.1
Annual 12 7.2 0.3 4.8
PM10 24-hr 150 41 5 109
NO2 1-hr 188 82.3 7.5 105.7
Annual 100 19.3 1 80.7
Note: All concentrations are in micrograms per cubic meter.
In all cases, the difference between the NAAQS and background ambient concentration levels is
greater than the applicable SIL value. As such, EPA guidance notes that it would be sufficient in
most cases for permitting authorities to conclude that sources with impacts below the SIL values
will not cause or contribute to a violation of the NAAQS, and additional cumulative modeling is
not needed. MassDEP has taken the above approach, i.e. determined that there is no need for
additional modeling, in this case.
As described above, ambient monitoring data from MassDEP’s Lynn monitoring site for the
three (3) year period of 2010 through 2012 were used to characterize background levels of
criteria pollutant ambient air concentrations. PSD regulations allow proposed sources to use
existing monitoring data in lieu of PSD preconstruction monitoring requirements for a pollutant
if the source can demonstrate that its modeled ambient air impact is less than a de minimis
amount (also called a significant monitoring concentration or SMC) as specified in those
regulations. As shown in Table C below, dispersion modeling conducted by the Permittee

19
predicted maximum proposed SHR Project impact concentrations well below corresponding
SMC levels for all pollutants for which SMCs exist.
TABLE C
Preconstruction Monitoring Analysis
Pollutant Averaging Period Significant Monitoring
Concentrations (SMC)
(ug/m3)
Maximum Predicted Facility
Impact (ug/m3)
NO2 Annual 14 0.4
SO2 24-Hour 13 0.7
PM10 24-Hour 10 4.3
CO 8-Hour 575 112.4
Table C Key: ug/m
3 = micrograms per cubic meter
EPA had also established an SMC for PM2.5 but this SMC was remanded by the United States
Court of Appeals for the DC Circuit on January 22, 2013 (No. 10-1413, Sierra Club v. EPA). On
March 4, 2013, the EPA Office of Air Quality Planning and Standards issued guidance to
applicants and regulators with regard to the ramifications of the January 22, 2013 Appeals Court
decision. The pertinent excerpt of this recent EPA guidance is as follows:
“As a result of the Court’s decision, Federal PSD Permits issued henceforth by either the
EPA or a delegated state permitting authority pursuant to 40 CFR 52.21 should not rely
on the PM2.5 SMC to allow applicants to avoid compiling air quality monitoring data for
PM2.5. Accordingly, all applicants requesting a federal PSD Permit, including those
having already applied for but have not yet received the permit, should submit ambient
PM2.5 monitoring data in accordance with the Clean Air Act requirements whenever
either direct PM2.5 or any PM2.5 precursor is emitted in a significant amount. In lieu of
applicants setting out PM2.5 monitors to collect ambient data, applicants may submit
PM2.5 ambient data collected from existing monitoring networks when the permitting
Authority deems such data to be representative of the air quality in the area of concern for
the year preceding receipt of the application. We believe that applicants will generally be
able to rely on existing representative monitoring data to satisfy the monitoring data
requirement.”
The Lynn monitoring site, located approximately 5.9 miles to the southwest of the proposed SHR
Project, is representative of the proposed SHR Project site due to its proximity. Use of the data
from this monitoring site is conservative for the following reasons:
a) Lynn is a more industrialized and densely populated area than the proposed SHR
Project site, particularly without the influence of the existing Salem Harbor Station
after its shutdown and prior to the proposed SHR Project commencing operation. The
proposed SHR Project site is located adjacent to Salem Harbor, a significantly large
water body where potential emission sources are more limited. The Lynn monitoring
site is located closer to the metropolitan Boston area than the proposed SHR Project

20
site. Any potentially elevated ambient background pollutant concentrations from
mobile and stationary emission sources located in and around the Boston
metropolitan area that may be transported to the proposed SHR Project site via
predominant winds from the south or southwest, typically pass the Lynn monitoring
location and are therefore represented in the measurement data collected at the Lynn
monitoring site.
b) The General Electric Lynn and Wheelabrator Saugus facilities, which have been
identified by MassDEP as the only two major industrial emission sources to be
modeled cumulatively with the proposed SHR Project emissions for 24-Hour PM2.5,
are located slightly less than 2 miles from the Lynn monitoring site but are located
about 7 miles from the proposed SHR Project site. Therefore, the cumulative
modeling compliance demonstration, which includes the background ambient
concentrations and impacts from the interactive existing major sources likely double
counts the contribution of these sources and therefore, provides additional
conservatism to the required modeling results by potentially overestimating
cumulative impact concentrations. This is particularly significant given that these two
major sources are located to the south-southwest of the monitoring site, which means
that they could potentially influence the monitoring site concentrations during winds
coming from the south or southwest, the predominant wind directions in this area.
For the reasons set forth above, in accordance with the PSD regulations and recent EPA
guidance, MassDEP has determined that preconstruction monitoring is not required.
B. Responses concerning Meteorological/Surface Characteristics/Land Use Model Inputs
The required air dispersion modeling analysis performed by Footprint regarding the SHR Project
is central to the overall air quality impact assessment performed for the Project. The modeling
work was thoroughly reviewed by MassDEP and found to be compliant with our Modeling
Guidance for Significant Stationary Sources of Air Pollution, as well as with EPA modeling
requirements for PSD Permit applications. The modeling addressed the impacts of pollutants
required under MassDEP and USEPA regulations and had the proper inputs to provide results
within the accuracy limits of the model. One input to the model is a 5 year meteorological data
set. The meteorological data used in the SHR Project analysis consisted of data collected over
the 5 year period from 2006 to 2010. The data set included surface-based measurements and
upper air measurements as required by the USEPA-approved meteorological preprocessor
(AERMET) to develop a suitable data input file for the USEPA-approved computer dispersion
model (AERMOD). The surface data was collected at the Logan Airport station in Boston,
which is the closest first order National Weather Station (NWS) to the SHR project, while the
corresponding upper air data was collected at the Gray, Maine NWS station. These locations are
considered representative of the project area and use of data from these locations is consistent
with MassDEP and USEPA guidelines. Once processed via AERMET, the meteorological data
included in the input files consisted of wind speed, wind direction, and ambient temperature as
well as other directly measured and derived variables. The data in these files are an hour-by-
hour representation of the meteorological conditions in the SHR Project area for the entire 5 year
period and reflect the hour by hour changes in conditions including varying wind directions (i.e.,
21
“wind shift”). Use of the developed meteorological data input files as required to run the
AERMOD model means that wind shift was in fact taken into account.
Regarding dispersion coefficients based on AERSURFACE parameters, certain inputs are
mandatory to properly execute the AERMOD model. These include the rural/urban designation
as well as the calculation of surface roughness length, Bowen Ratio, and albedo. The comment
is correct that surface roughness length, Bowen Ratio, and albedo are calculated by the
application of the utility program AERSURFACE to the area centered on the location of the
meteorological data collection station (i.e., where the anemometer is located). In particular,
surface roughness length is determined based on land use out to a radius of 1 km from this
location. Bowen ratio and albedo are determined based on land use and other AERSURFACE
inputs over a 10 km by 10 km area centered on this location.
The 3 kilometer (km) radius and 1 km radius references are for two different types of inputs to
AERMOD. The urban versus rural designation is used to employ the correct dispersion
coefficients in the model; and it is a current methodology. The urban or rural designation is
required to properly execute AERMOD, just as it was for the predecessor model ISCST, and is
an option that is used directly in the model (in this case AERMOD). The designation of urban or
rural is based on land use within a radius of 3 km from the proposed new facility being analyzed.
The 1 km radius refers to land use in the area around the location of the meteorological data
collection station (in this case at Logan Airport) and is used to determine the surface roughness
length, as correctly mentioned in the comment. However, this is an input used in the utility
program AERSURFACE, which is a program that allows for the objective determination of
surface roughness, bowen ratio, and albedo in the area of the meteorological station. The output
data generated by AERSURFACE is used as input to the meteorological preprocessor AERMET.
Bowen ratio and albedo are objectively determined by AERSURFACE based on land use
classifications over a 10 by 10 kilometer area centered on the meteorological station, as well as
other inputs related to moisture conditions and precipitation types and amounts.
Due to the effects that urban areas have on meteorological conditions especially at night (e.g., the
urban heat island effect), the land area within 3 km of a proposed project must be assessed using
the Auer method in order to classify it as an urban or rural land use designation. This
designation is mandatory to correctly run the proper dispersion model and obtain accurate,
useable results. In the Auer method, certain land use classifications are associated with the urban
designation, and all the others default to rural. Bodies of water are considered to be rural. Using
the Auer method, the designation for the entire SHR Project area is based on whether the 3 km
area is 50% or more urban. If it is, the urban option is selected in the model and urban dispersion
coefficients are used in the modeling. Otherwise, the rural dispersion option is selected. Based
upon the Auer method and the actual land use in the area within 3 km of the proposed SHR
Project, rural dispersion was properly selected for use in the modeling.
C. Responses concerning Modeling Process and Results
The Application included a conservative predictive analysis of the maximum ambient
concentrations of criteria pollutants (i.e., pollutants regulated by a health based National
22
Ambient Air Quality Standard or NAAQS) and air toxics (pollutants regulated by MassDEP’s
Air Toxics Guidelines), which are used to evaluate potential human health risks from exposures
to chemicals in ambient air that might result when the SHR Project operates. The analysis
shows, and MassDEP concurs, that worst case emissions from the SHR Project will not violate
any of the applicable NAAQS or MassDEP’s air toxics long-term Allowable Ambient Limits
(AALs) for carcinogens or short-term Threshold Effects Exposure Limits (TELs) air toxics
guidelines for non-carcinogens.
The 188 ug/m3 impact value incorrectly reported in the June 2013 Second Supplement was based
on the most conservative approach that assumes 100% conversion of NOx to NO2 in the ambient
air (the Footnote for Table 6-11 in the June Supplement incorrectly stated that an 80%
conversion rate was used). A 100% conversion assumption is overly conservative and not
realistic. The 166 ug/m3 NO2 concentration in the Proposed PSD Permit is the predicted impact
shown by the dispersion modeling analysis and relied on for the demonstration of compliance
with the 1-hour NO2 NAAQS. The modeled cumulative impacts represent an EPA-approved Tier
2 approach reflecting an 80 percent conversion of NOx emissions to NO2 in the ambient air.
“Tier 2” is the Ambient Ratio Method for NOx to NO2 conversion of AERMOD modeling
results. It specifies that the results of NOx modeling be multiplied by an empirically-derived
NO2/NOx ratio, using a value of 0.75 for the annual standard and 0.8 for the 1-hour standard.
This modeling guidance is contained in USEPA’s Clarification Memo, dated March 1, 2011,
“Additional Clarification Regarding Application of Appendix W Modeling Guidance for the 1-
hour NO2 National Ambient Air Quality Standard”. When considering how the 166 ug/m3
impact was derived (project impacts plus interactive source impacts plus ambient air background
concentration), the value of 105.7 ug/m3 has no meaning. It is associated only with the
incorrectly reported 188 ug/m3 impact.
MassDEP properly accepted the conclusion presented by Footprint for the 1-hour NO2
compliance demonstration since the modeling was correctly performed in accordance with EPA
policies and guidance.
The change in the final cumulative impact of the proposed facility for 1-hour NO2 is not related
to the slight change in the expected potential to emit. The basis for the revision is explained
above in detail.
The nature of modeling as part of an air quality impact assessment for regulatory compliance is
such that many assumptions and elements of the overall analysis lead to results that are overly
conservative. Another way of saying this is that due to the conservatism of the analysis, the
margin of compliance with the NAAQS will actually be greater than shown because the real
world impacts will be lower. One example of the conservatism applied in the analysis is the
assumption used for the conversion of NOx to NO2 as previously described. Another element of
conservatism, also previously described, is the inclusion of GE Lynn and Wheelabrator Saugus
as interactive sources in the modeling while also using background ambient air concentrations
from the Lynn ambient monitor, which itself is impacted by emissions from these two facilities.
Furthermore, additional interactive sources were included in the modeling assuming that they
operate continuously at their maximum allowed emission rates when in reality they only operate
for a fraction of the total hours in a year.

23
One comment also mentions the possibility that increased emissions from the SHR Project or
from any of the interactive sources (or increased emissions from newly constructed nearby
sources) could result in a situation where the NAAQS are violated. The way the proposed SHR
Project will be allowed to operate and the way the interactive sources are currently allowed to
operate under their existing operating permits is already fully reflected in the impact assessment
by virtue of modeling the maximum allowable emission rates. If any of these facilities adds a
new emission source or modifies an existing source that results in an increase of emissions then
there are MassDEP and USEPA regulations in place to address this. This might include
additional project modeling to show that any new emissions do not have significant impacts on
existing air quality or cumulative modeling to demonstrate compliance with the NAAQS. The
regulations in place and the modeling requirements associated with them are there to ensure that
NAAQS violations do not occur, while at the same time allowing facilities the flexibility to make
necessary operating and business decisions as long as they comply with all applicable Air
Pollution Control Regulations.
When the term “significantly contribute” is used in assessing model-predicted impacts of NO2, it
refers to whether or not the SHR Project is contributing over or under the Significant Impact
Level (SIL) of 7.5 ug/m3. Only the total impacts from the SHR Project plus interactive sources
that contain a contribution of 7.5 ug/m3 or more from the SHR Project need to be considered
when evaluating whether the SHR Project will cause or contribute to a NAAQS violation.
Notably, the test for “significance” can often come into play twice in an air quality impact
assessment for a pollutant such as NO2 that has a 1-hour NAAQS. The first test of significance
is always employed as it is used to define the significant impact area (SIA) of a proposed new
facility on a pollutant by pollutant basis. The SIL for 1-hour NO2 is 7.5 ug/m3 and it is assessed
based on the maximum impact at each individual receptor in the modeled receptor grid. If the
impact is 7.5 ug/m3 or greater, that receptor then becomes part of the SIA. Once the SIA is
defined, that area is subject to a cumulative modeling analysis that includes appropriate
interacting sources and background air quality data. In order to receive a permit or plan
approval, a proposed project’s air impacts must be documented to be in compliance with the
appropriate NAAQS. This second phase of modeling is assessed against the NAAQS using the
form of the standard, which for 1-hour NO2 is based on model-predicted daily maximum impacts
at the 98th
percentile value for each receptor (in the model this represents the 8th
high value as
opposed to the maximum value).
The second test of significance comes into play when the total impacts are dominated by the
interacting sources rather than those of the proposed facility. So the second test of significance is
not always used. In this case it was used, because the existing interacting sources dominated the
overall impacts. Given that, the results from the cumulative modeling analysis must be reviewed
to determine whether the proposed SHR Project is contributing to the cumulative impacts at a
level equal to or higher than the NO2 SIL (7.5 ug/m3). If determined to be above the SIL
cumulative impacts are assessed against the 1-hour NO2 NAAQS. For this modeling analysis,
with the assumption of an 80% conversion rate, this amounted to a single receptor where the
total impact was 166 ug/m3. The SHR Project’s contribution to this cumulative impact is 7.8
ug/m3.

24
The description of the model-predicted 1-hour NO2 concentrations with respect to impacts in
Environmental Justice or EJ areas and health effects, as contained in the PSD Fact Sheet and as
reproduced in one of the comments MassDEP received, is factually based. The modeling was
performed in accordance with all applicable MassDEP and USEPA guidelines for this type of air
quality impact assessment.
With respect to the accidental release of ammonia, the ammonia emission rate was appropriately
determined via the Areal Locations of Hazardous Atmospheres (ALOHA) accidental release
model. The comment is referring to the AERMOD model. AERMOD was also used to assess
the dispersion of ammonia in the air in the unlikely event that there is an accidental release. The
maximum amount of ammonia that could be released into the air (as opposed to the amount
staying in the diked area within the enclosure) is the emission rate used in AERMOD.
MassDEP has made available copies of the complete cumulative dispersion modeling analysis in
electronic format (CD/DVD) as part of the public record, they may be obtained by request; this
has been noted within the PSD Fact Sheet.
Non-Attainment Review – 310 CMR 7.00 Appendix A- Offsets
(Outside the Scope of PSD Permit-Pertains Solely to State CPA Approval)
Two comments were received pertaining to the NOx emissions offsets, including:
“Allowing Footprint Power to use these credits to produce electricity does not mitigate
the fact that they will be emitting tons of toxic emissions from their exhaust stacks on a
local level into our neighborhoods.”
“…Footprint is purchasing credits from Rhode Island for a plant already slated for
shutdown… it is illustrative of the problems Footprint faces to comply with disease-
causing emissions and does not address local exposure to ozone and resulting illnesses
ozone causes to our community…”
Response:
The use of emission offsets for a proposal such as Footprint’s is a legal and regulatory
requirement. Instead of being allowed to net out of the requirements for emission offsets,
Footprint is using emissions offsets for its worst case NOx emissions, at a 1.26 to 1.0 emission
offset ratio, as required by Regulation 310 CMR 7.00-Appendix A. Use of emission offsets at the
above ratio is required so that the affected airshed experiences a net air quality benefit.

25
Greenhouse Gas (GHG) and Global Warming Solutions Act (GWSA)
(Outside the Scope of PSD Permit Pertains Solely to State CPA Approval)
Numerous comments were received pertaining to Greenhouse Gas (GHG) emissions and the
Global Warming Solutions Act (GWSA), including:
CO2 is a pollutant because of its role in anthropogenic global warming. CO2 is known to
have considerable negative effects as we increase its atmospheric concentration (as well
as in oceans).
Proposed plant will emit 2.5 million TPY of CO2 and will be a “major contributor” in
violating the GWSA.
Proposed plant is “essentially against the law”….will “generate more pollutants than
allowed by a state law mandate”….will run for 40 to 60 years.
Allowing construction of the plant with its CO2 and methane emissions “cannot be
justified with the goals and hopes of the GWSA”
Concern re: guarantees that the plant will meet the conditions of the GWSA.
There is no evidence in the record to support MassDEP’s proposed Section 61 Findings
that this project is consistent with the GWSA. Only analysis MassDEP appears to rely on
is the CRA analysis, which covered only through 2025 and was riddled with flawed
assumptions. No indication that Footprint presented any information on GHG impacts
through 2050.
MassDEP has a special obligation under GWSA because of requirement to promulgate
regulations establishing declining annual aggregate emission limits for sources/categories
of sources by January 1, 2012, to go into effect by January 1. 2013 through December 31,
2020. G.L. c. 21N, § 3d; St. 2008, c. 298, § 16. MassDEP’s failure to promulgate
regulations does not excuse sources of categories from being required to meet mandates
of GWSA.
Footprint is not thinking about the 2050 deadline and has not provided adequate
information depicted in any way to comply with emission reduction targets that we need
in 2050.
Constructing a $900 million natural gas plant keeps funding and focus away from
investment in green energy technologies … much of the $900 million “will be
contributed by the ratepayers” … use the $900 million to build renewable energy sources
such as windmills on the Cape.
Given the climate change trajectory which we are on, building a new natural gas plant is
“insignificant and insufficient” to meet the crisis we face. We must invest in
conservation, efficiency and alternates such as solar and wind.
Proposed plant should be compared with conservation and energy reduction.
Request to see studies review by EFSB that indicates that the proposed plan will reduce
the grid’s reliance on higher emitting fossil plants, thereby reducing regional CO2 by
450,000 TPY, the equivalent of 103,000 cars.
Massachusetts is a leader in the U.S. on reducing GHG, but being the best in the U.S.
does not relieve us of our responsibility globally.
It is time for Massachusetts to finally take a pledge of “no new fossil-fired electric
generation”.
26
Concern that too large a percentage of New England grid is powered by natural gas units.
Science is telling us that 40 years down the road, effects of global warming may include
agricultural drought, rising tides, etc.; “burden” will be placed on younger generation.
Consider your children when deciding whether to issue air permits that allow more GHG
to be put into the atmosphere.
I support the proposed project because of the national and international emergency of
climate change. Based on what we have seen, newer generation fast start combined cycle
gas turbine plants like this are really singularly the most important transitional technology
we have in the next thirty years, forty years, to get us where we need to go in terms of
reducing our carbon emission and decarbonizing our grid.
Proposed plant will allow us to scale up renewables.
Will take 25 years to build national high voltage DC infrastructure required to transmit
renewable energy all over the US, and to really scale up renewable energy sources.
If we only have the older generation natural gas plants running, that is worse, given the
climate emergency.
Response:
MassDEP notes the many comments and concerns that have been submitted during the public
hearing and public comment process regarding GHG emissions from the proposed plant and
compliance with the GWSA. MassDEP agrees that global warming and climate change impacts
are serious concerns and is dedicated to fulfilling all its obligations under the GWSA.
Since 2008, Massachusetts has been a national leader with respect to global warming and climate
change.1 In December, 2010, then Secretary of Executive Office of Energy and Environmental
Affairs (EEA) Ian Bowles established a legally binding statewide GHG emission limit of 25 (%)
percent below statewide 1990 GHG emission levels by 2020. In the Determination of
Greenhouse Gas Emission Limit for 2020, issued on December 28, 2010, Secretary Bowles’
2020 Determination outlined a portfolio of policies designed to achieve the 2020 statewide
emission limit. Since the adoption of the 2020 emission limit, the EEA and its agencies have
implemented numerous policies to ensure that the 25% reduction is reached.
MassDEP encourages interested persons to follow the Commonwealth’s progress under the
GWSA by following the GHG Dashboard which can be found at http://www.mass.gov/eea/air-
water-climate-change/climate-change/massachusetts-global-warming-solutions-act/global-
warming-solutions-act-dashboard.html. Among other information, this site provides periodic
updates on the state’s progress under the GWSA, including progress toward meeting the 2020
goals, GHG trends and related information. In addition, EEA recently released the five year
progress report on the GWSA which can be found at
http://www.mass.gov/eea/docs/eea/gwsa/ma-gwsa-5yr-progress-report-1-6-14.pdf
1 In 2008, Governor Deval Patrick signed the GWSA into law, making Massachusetts one of the first states in the nation
to move forward with a comprehensive program to address climate change. In addition, several other clean energy laws
were enacted in Massachusetts in 2008, including the Green Communities Act, Oceans Management Act, Clean Energy
Biofuels Act and the Green Jobs Act.

27
Pursuant to Section 7 of the GWSA and G.L. c. 30, § 61, the proposed project has been reviewed
extensively and comprehensively with respect to GHG emissions and GWSA compliance by the
Massachusetts Environmental Policy Act (MEPA) unit of EEA, the Energy Facilities Siting
Board (EFSB), and MassDEP. The MEPA environmental review process and the EFSB
proceedings have resulted in determinations and findings that the proposed project’s GHG
emissions are in compliance with applicable state laws and requirements, including the GWSA.
MassDEP agrees that when issuing permits, licenses or other approvals for projects that require
an Environmental Impact Report (EIR), MassDEP is required to consider reasonably foreseeable
climate change impacts, including GHG emissions, and effects such as predicted sea level rise.
G.L. c. 30, § 61. In this case, MassDEP considered the reasonably foreseeable climate change
impacts of the proposed facility by actively participating in the MEPA environmental review
process. See MassDEP Comments on the Environmental Notification Form dated August 28,
2012, MassDEP Comments on the Draft Environmental Impact Report (DEIR) dated January 28,
2013, and MassDEP Comments on the Final Environmental Impact Report (FEIR) dated
May 13, 2013. In these comments, MassDEP pointed out the need for the SHR Project
Proponent to ensure that there will be additional on-site and off-site mitigation as the remainder
of the site is developed. To ensure that this need is addressed, MassDEP recommended that the
Secretary require that the Notices of Project Change (NPCs) for such future development of the
site include an analysis of the impacts of GHG emissions. MassDEP also recommended that the
SHR Project Proponent include mobile sources in its greenhouse gas analysis. The FEIR, the
MEPA Certificate on the FEIR, the Public Benefits Determination, and the SHR Project
Proponent’s Proposed Section 61 Findings reflect, among other things, MassDEP’s comments.
On June 10, 2013, the SHR Project Proponent revised its Proposed Section 61 Findings and
submitted them to the Secretary as required by the Secretary’s Certificate on the FEIR. MassDEP
incorporated the SHR Project Proponent’s Revised Section 61 Findings in its Proposed Plan
Approval.
To respond to the public comments on the SHR Project’s GHG emissions and compliance with
the GWSA, MassDEP carefully examined the detailed applications for a Plan Approval and a
PSD Permit, the ENF, the DEIR, the FEIR, the MassDEP comments and the Secretary’s
Decision on the SHR Project Proponent’s MEPA filings, the SHR Project Proponent’s Revised
Section 61 Findings incorporated in the Proposed Plan Approval, and the EFSB Decision in the
Approval to Construct Proceeding EFSB 12-2. As a result of this review, MassDEP has
incorporated all the GHG mitigation measures needed to ensure compliance with the GWSA as
determined by the Secretary and the EFSB in the Section 61 Findings in the Plan Approval.
MassDEP concludes that the SHR Project as authorized by the Plan Approval including the
GHG mitigation measures set forth in the Modified Section 61 Findings is consistent with the
GHG reduction targets established by the GWSA.
Secretary Richard K. Sullivan, Jr. issued several documents that summarize and reflect the
extensive GHG-related review that took place during the MEPA Environmental Review and the
Public Benefits Determination Process including: the August 28, 2012 Certificate on the ENF,
the January 26, 2018 Certificate on the DEIR, the May 17, 2013 FEIR Certificate and the
June 17, 2013 Public Benefits Determination. The Secretary discussed the GHG analysis in the

28
FEIR Certificate (at pages 10-13) and stated that the SHR Project Proponent’s GHG analysis is
consistent with Massachusetts GHG Policy. In addition, required mitigation measures to address
GHG emissions are summarized in the FEIR Certificate (at pages 21-22). The FEIR Certificate
also required the SHR Project Proponent to submit a revised summary of GHG emissions
(referred to as Table 3-1). On June 10, 2013, the SHR Project Proponent submitted the revised
Table 3-1 as required.
Subsequently, consistent with the provisions of An Act Relative to Licensing Requirements for
Certain Tidelands, Secretary Sullivan issued the Public Benefits Determination, finding that the
proposed SHR Project will have a public benefit. Among other considerations, the Secretary
considered environmental protection and preservation, specifically determining that the proposed
SHR Project has been designed to avoid, minimize and mitigate associated impacts including the
impacts of GHG emissions by inter alia its choice of fuel and technology, installation of a solar
photovoltaic (PV) array, and incorporation of energy efficiency measures into the design of the
Administration and Operation Buildings.
The Public Benefits Determination (at pages 6-7) sets forth a summary of the measures that the
SHR Project Proponent will implement to avoid, minimize and mitigate GHG emission impacts.
These measures include compliance with the Regional Greenhouse Gas Initiative (RGGI). To
comply with RGGI, the SHR Project Proponent is required to obtain and retire one CO2
allowance for each ton of CO2 the SHR Project emits. Massachusetts auctions nearly 100% of
the RGGI allowances and is required to invest at least 80% of those auction proceeds in energy
efficiency measures in the Commonwealth. These energy efficiency measures will yield GHG
emission reductions. The Public Benefits Determination estimates that the SHR Project
Proponent would be required to pay $4,000,000 per year for the necessary allowances.2
The Public Benefits Determination states that in addition to obtaining the RGGI allowances, the
SHR Project Proponent will implement the following measures to mitigate the impact of its GHG
emissions:
Use of combined cycle natural gas turbines;
Solar PV array with potential to offset 175 tons per year of GHG emissions;
Measures designed to ensure that 56.5 tons of GHG reductions will be achieved
each year, or 29%, from Administrative Building and Operations Building:
Administrative Building is designed to meet the United States Green
Building Council’s Leadership in Energy and Environmental Design
(LEED) Certification at the Platinum level and includes a green roof,
geothermal heat pumps for heating and cooling, variable volume
ventilation fans, increased insulation to minimize heat loss, lighting
motion sensors, climate control and building energy management systems,
a 10% reduction for lighting power density (LPD) (and identifies the
2 This amount may underestimate the yearly cost of such allowances. It is estimated that the Proponent will have to
obtain 2,000,000 allowances per year. The current cost of each allowance is approximately $3.00. At a cost of $3.00 per
allowance, the Proponent will have to pay approximately $6,000,000 per year for the required allowances. The cost of
allowances is projected to increase in response to the promulgation of new regulations which reduce the cap on
greenhouse emissions. See 310 CMR 7.70.

29
potential for larger reductions), and water conserving fixtures that exceed
building code requirements; and
Operations Building includes a high albedo roof, geothermal heat pumps
for heating and cooling; increased insulation to minimize heat loss,
daylighting, lighting motion sensors; climate control, building energy
management systems, a 10% reduction for LPD (and identifies the
potential for larger reductions), and water conserving fixtures; and
Submission to the MEPA Office of a Certification by the SHR Project Proponent
indicating that all of the measures proposed to mitigate GHG emissions or
measures to achieve equivalent GHG reductions have been implemented.
Some comments suggest that Massachusetts should take a pledge of “no new fossil-fired electric
generation.” MassDEP acknowledges those comments, but notes that such comments are
beyond the scope of the Department’s review in this matter. MassDEP further notes that the
GWSA does not prohibit the construction of new fossil fuel facilities. Indeed, M.G.L. c. 21N, §
9 expressly provides; “Nothing in this chapter shall preclude, prohibit or restrict the construction
of a new facility or the expansion of an existing facility if all applicable requirements are met
and the facility is in compliance with regulations adopted pursuant to this chapter.” Consistent
with this provision, the Massachusetts Clean Energy and Climate Plan for 2020 (CECP)
assumes that the existing coal burning facility in Salem would be shut down and the energy
previously generated by Salem would come from natural gas fired plants located somewhere in
Massachusetts.3
The Secretary’s FEIR Certificate determined that the proposed SHR Project is consistent with
the CECP for 2020 and the GWSA. In the FEIR Certificate, the Secretary specifically noted that
the CECP for 2020 expressly relies on RGGI and the replacement of the energy generated by the
existing coal burning plants in Salem and Somerset with energy generated by natural gas fired
plants to help meet the state’s goal of reducing GHG emissions by 25% by 2020. The Secretary
pointed out that DEIR included an analysis that showed that by displacing energy generation by
dirtier plants, the SHR Project would reduce regional GHG emissions by 457,626 tons per year
(tpy)4.
Like the Secretary, the EFSB concluded that the proposed SHR Project would lead to an overall
reduction of GHG emissions by displacing less efficient sources. The EFSB recognized that the
CECP for 2020 envisioned the possibility that the existing coal burning plant in Salem could be
replaced by a natural gas fired plant and that natural gas could be a bridge to a clean energy
future. Thus, the EFSB determined that construction of the proposed SHR Project is consistent
with the 2020 goal.
3 The 2020 Climate Plan further assumed that this change in energy production would reduce CO2 emissions by
872,262 metric tons per year. 4 In the DEIR, the Proponent stated that the proposed facility would reduce CO2 emissions by 457,626 tons per year.
This number is based on a study done by Charles River Associates provided as Appendix C of the DEIR. In its
comments on the DEIR, the Department of Energy Resources questioned this number. In the Final Decision in the
Approval to Construct Proceeding, EFSB 12-2, the EFSB concluded that that the proposed facility would result in a net
reduction of regional GHG emissions, but acknowledged that the exact amount of the reduction is uncertain.

30
The EFSB further noted that the CECP for 2020 includes two scenarios for achieving the goal of
reducing GHG emissions by 80% by 2050. Scenario One is based primarily on eliminating the
use of fossil fuels. Scenario Two is based on maximizing efficiency and conservation. The
EFSB noted that Scenario Two represents a plausible scenario in which the proposed SHR
Project could operate into the future without preventing the Commonwealth from meeting the
2050 goal.
The EFSB also recognized that additional measures may be required to ensure that the
Commonwealth meets the 2050 goal. Accordingly, the EFSB put the SHR Project Proponent on
notice that it would have to comply with evolving regulations to meet the GWSA targets. The
EFSB stated its commitment to ensure that evolving GHG policies and regulations are addressed
fully.
Some comments point to, or appear to rely on, a specific section of the GWSA (G.L. c. 21N,
§ 3d; St. 2008, c. 298, § 16) to oppose the issuance of a Final Plan Approval or PSD Permit for
the proposed SHR Project. In pertinent part, the GWSA provides at c. 21N, § 3(d):
The department shall promulgate regulations establishing a desired level of
declining annual aggregate emission limits for sources or categories of sources
that emit greenhouse gas emissions (emphasis added).
In the context of reviewing whether the proposed SHR Project meets applicable state and federal
requirements that govern issuance of a Plan Approval and issuance of a PSD Permit, the
commenters’ reliance on § 3(d) is misplaced. In any event, MasDEP has fully complied with
section 3(d). Among other things, on December 9, 2013, MassDEP has issued final regulations
that impose a new regional cap on carbon dioxide emissions from fossil fuel fired electric
generation. See 310 CMR 7.70. Under these regulations, emissions of CO2 will be limited to 91
million tons in 2014. The annual cap will be reduced 2.5% per year from 2015 through 2020.
This will result in an annual regional cap of 78 million tons in 2020. These regulations, and
similar regulations and statutes in the other eight RGGI states, will ensure that emissions from
power plants in 2020 are approximately half of their 2005 totals. These declining annual
aggregate limits ensure that power plants will comply with the reduction goals in the CECP for
2020, and that reductions within the electric generating sector are much steeper than the overall
25% reduction called for in the CECP for 2020.

31
Non-Attainment Review – 310 CMR 7.00 Appendix A
Public Benefits and Alternatives Review
(Outside the Scope of PSD Permit, Pertains Solely to State CPA Approval)
Several comments were received pertaining to Public Benefits and Alternatives Review,
including:
“…Footprint repeatedly and erroneously attempts to compare the added emissions [from]
this new plant to a plant that will have been closed for two years. Correctly compared to
the baseline of zero emissions, the added pollutants and greenhouse gases are a threat to
the community…”
“…Removing the old plant facility, remediating the property and reusing the site such
that tax revenues and jobs are replaced has total support… there is considerable local
disagreement that the way to meet those economic goals is to burden Salem and the
region environmentally with a new fossil fuel plant…”
“Given the high volatility of natural gas prices, occasional restricted availability in winter
months, the warnings in the study that financing, costs of demolition and remediation
alter the economic viability of such a power plant, the touted economic benefits of tax
revenues and jobs must be disallowed as reasons to support this proposal.”
“The site offers the Permittee the opportunity to significantly reduce air, water supply,
wastewater, noise, visual, and other impacts relative to the existing Salem Harbor
Station facility… Footprint falsely presents this proposed plant as a replacement for the
coal plant…”
“The proposed Facility also serves the Commonwealth’s interest in developing renewable
energy sources. That is, the quick-start technology designed into the proposed Facility
facilitates and supports the development of wind generation…no wind development
under proposal is dependent on this plant being built…”
“Footprint makes no attempt to measure the cost burden for citizens to deal with the
health costs from exposure to PM2.5 and ozone.”
“…Footprint has made no plans to develop the rest of the site, an economic drain on the
city.”
There will not be an increase in jobs associated with the Footprint project, but rather a
decrease local long term employment opportunities. Gas plants employ far fewer
employees than office buildings and other industrial uses for the same amount of land
needed for the Footprint project.
MassDEP accepted the CRA analysis of the potential greenhouse gas emissions impacts
of the facility without examining the underlying assumptions… MassDEP should have
conducted a more thorough analysis of the claims and studies provided by the project
proponent…”
Response:
MassDEP has treated the Footprint proposal as a new facility. With regard to emissions of NOx,
Footprint will fully comply with all applicable Nonattainment New Source Review requirements

32
including the requirement to obtain offsets at a 1.26 to 1.0 offset ratio and Lowest Achievable
Emission Rate. MassDEP has not allowed Footprint to obtain credit for any reductions in
emissions that result from the shutdown of the existing coal burning power plant in 2014. As set
forth in the CPA Approval, MassDEP determined that Footprint adequately demonstrated that
the “benefits of the proposed source significantly outweigh the environmental and social
costs…”
Footprint’s demonstration that the benefits of the proposed Facility outweigh its costs is
supported by the determinations made by the Secretary of EEA and the EFSB with regard to the
SHR Project. On May 17, 2013, Secretary Sullivan, pursuant to the MEPA (G.L.c.30, ss.61-62I)
and Section 11.08 of the MEPA regulations (301 CMR 11.00), issued the Certificate for the
FEIR No. 14937 for the SHR Project. In addition, on June 17, 2013, Secretary Sullivan issued a
Public Benefits Determination concluding that the SHR Project will have a positive public
benefit. Furthermore, EFSB issued a Decision on October 10, 2013 for the SHR Project approving the petition of Footprint Power Salem Harbor Development LP to construct a 630 MW
natural gas-fired, quick-start, combined-cycle facility at the present location of the Salem Harbor
Station in Salem, Massachusetts. For the reasons set forth in the foregoing documents, the SHR
Project adequately demonstrates that the “benefits of the proposed source significantly outweigh
the environmental and social costs.”
Health Impacts
Several comments were received pertaining to Health Impacts, including:
“…studies often fail to be reflective of the real risks of pollutants and particulate
matter...”
“…do not believe the models offered to date provide a true picture of the risks the
proposed 690MW gas burning plant poses for our community…”
“…[Footprint] claims improvements compared to the existing plant...”
Several other collateral health impacts comments may be found in sections addressing
startup/shutdown operations, stack height, modeling, offsets, public benefit/alternatives
review, particulate matter, BACT and LAER.
Response:
The federal PSD regulations at 40 CFR 52.21 and the Massachusetts Plan Approval Regulations
at 310 CMR 7.02 require that any applicant must, among several other things, demonstrate that
the worst case air emissions from their proposed emission unit(s) would result in compliance
with all applicable, health based, attainment National Ambient Air Quality Standards(NAAQS).
This ambient air quality analysis requires the use of computer dispersion models which have
been reviewed and approved by USEPA. The inputs to these models include the use of:
representative background concentrations of each NAAQS attainment pollutant as measured by
the Massachusetts ambient air monitoring network, representative meteorological parameters,
and the actual emissions of certain, large emitters of those pollutants which are located in the
area proximate to the proposed facility’s location, and the worst case air emissions from the SHR

33
Project. Footprint’s interactive, ambient air quality impact analysis demonstrated that its worst
case emissions, plus representative background concentrations, plus emissions from certain
nearby large emitters of these pollutants, would result in compliance with all applicable, health
based NAAQS.
With respect to possible harm to public and environmental health and welfare, the application
included a conservative predictive analysis of the maximum ambient concentrations of criteria
pollutants (i.e., pollutants regulated by a National Ambient Air Quality Standard or NAAQS) and
air toxics (pollutants regulated by MassDEP’s Air Toxics Guidelines) that might result when the
project operates. The analysis shows, and MassDEP concurs, that worst case emissions from the
SHR Project will not violate any of the applicable NAAQS or MassDEP’s air toxics long-term
Allowable Ambient Limits (AALs) for carcinogens or short-term Threshold Effects Exposure
Limits (TELs) air toxics guidelines for non-carcinogens. (Please see pages 15-17 of 60 inclusive
of the Footprint CPA Approval.)
Environmental Justice (EJ) Evaluation
Several comments were received pertaining to Environmental Justice, including:
Based on the statement from Footprint, “The dispersion modeling completed for the SHR
Project demonstrates that the predicted maximum impacts from the Facility for the
majority of criteria air pollutants are below the SILs at all locations and therefore,
represent no adverse human health or environmental effects to Salem and outlying
communities….. Footprint evaluated these as a way to determine if an EJ area would be
disproportionately subject to higher air impacts than other segments of the community at
large.”
“…there is no safe level of PM2.5 and they themselves point out exceedances of PM2.5,
it is clear there are health impacts.”
Based on the statement from Footprint, “The Proposed SHR Facility is not located in or
adjacent to an EJ area, and Footprint has demonstrated that there will be no
disproportional impact to any such community. Indeed, the proposed facility will be an
improvement over emissions from the existing facility, and will reduce regional
emissions of NOx, SO2 and CO2 to the benefit of all area residents. Footprint has
demonstrated that emissions from the proposed SHR facility itself will be well within the
NAAQS, which are designed to be health-protective of the most sensitive populations.”
“..the proposed facility is adjacent to an EJ community…”
“…compare the increased emissions to a plant that will have been closed for two years
such that the baseline for comparison should be zero emissions…”“At 188 NAAQS with
the proposed facility contributing 22.2% of the total 188, they are hardly “well within”
NAAQS.”
Response:
The 166 ug/m3 NO2 concentration in the Proposed Plan Approval is the actual predicted impact
shown by the dispersion modeling analysis and relied on for the demonstration of compliance
34
with the 1-hour NO2 NAAQS. It reflects a modeling methodology whereby NO2 is assumed to
be formed by an 80% conversion of the Project stack emissions of oxides of nitrogen (NOx). In
reality, the conversion of NOx to NO2 in the atmosphere is something that changes hour by hour
and is significantly controlled by the amount of ozone available in the air to allow the conversion
to occur. The actual conversion rate can be higher or lower than 80% and is often lower, so
assuming a constant conversion of 80% for all hours in an analysis yields a conservative result.
The 188 ug/m3 impact value reported in the June 2013 Second Supplement was based on the
most conservative approach that assumes 100% conversion of NOx to NO2 in the ambient air.
(The Footnote for Table 6-11 incorrectly stated that an 80% conversion rate was used). This
assumption is overly conservative and does not reflect the actual atmospheric chemistry that
occurs. Therefore, the original result was not an accurate reflection of what the analysis revealed
when the more realistic level of conservatism was applied.
The nature of modeling as part of an air quality impact assessment for regulatory compliance is
such that many assumptions and elements of the overall analysis lead to results that are overly
conservative. Another way of saying this is that due to the conservatism of the analysis, the
margin of compliance with the NAAQS will actually be greater than shown because the real
world impacts will be lower. One example of the conservatism applied in the analysis is the
assumption used for the conversion of NOx to NO2 as previously described. Another element of
conservatism, also previously described, is the inclusion of GE Lynn and Wheelabrator Saugus
as interactive sources in the modeling while also using background ambient air concentrations
from the Lynn ambient monitor, which itself is impacted by emissions from these two facilities.
Furthermore, additional interactive sources were included in the modeling assuming that they
operate continuously at their maximum allowed emission rates when in reality they only operate
for a fraction of the total hours in a year.
The comment also mentions the possibility that increased emissions from the SHR Project or
from any of the interactive sources (or increased emissions from newly constructed nearby
sources) could result in a situation where the NAAQS are violated. The way the proposed SHR
Project will be allowed to operate and the way the interactive sources are currently allowed to
operate under their existing operating permits is already fully reflected in the impact assessment
by virtue of modeling the maximum allowable emission rates. If any of these facilities adds a
new emission source or modifies an existing source that results in an increase of emissions then
there are MassDEP and USEPA regulations in place to address this. This might include
additional project modeling to show that any new emissions do not have significant impacts on
existing air quality or cumulative modeling to demonstrate compliance with the NAAQS. The
regulations in place and the modeling requirements associated with them exist to ensure that
NAAQS violations do not occur, while at the same time allowing facilities the flexibility to make
necessary operating and business decisions as long as they comply with all applicable Air
Pollution Control Regulations.
Furthermore, MassDEP has treated the Footprint proposal as a new facility, which it is.
MassDEP has not allowed Footprint to claim credit for any emission reductions that may result
from the shutdown of the existing coal burning plant in 2014. With regard to the emissions of
NOx from the SHR Project, Footprint must provide emission offsets, at a 1.26 to 1.0 offset ratio,
and keep its emissions at or below the Lowest Achievable Emission Rate as required by 310

35
CMR 7.00-Appendix A. Indeed, Footprint must fully comply with all applicable Nonattainment
New Source Review requirements. As a result, Footprint has, demonstrated to the satisfaction of
MassDEP that the “benefits of the proposed source significantly outweigh the environmental and
social costs.”
Footprint properly modeled the impacts of the facility and determined that the emissions of the
facility would not contribute to a violation of the NAAQS or PSD increments. (See RTC section
Air Quality Dispersion Modeling and Ambient Monitoring Subsection C). As set forth in the
PSD Fact Sheet, the modeling demonstrates that the SHR Project’s emissions of PM2.5 and NO2
will not have disproportionately high human health or environmental effects on EJ areas. As set
forth in the PSD Fact Sheet, EJ populations may benefit from the reductions in regional GHG
emissions that will result from the SHR Project. As set forth in the CPA Approval, Footprint has
demonstrated to the satisfaction of MassDEP that the benefits of the SHR Project outweigh its
social and environmental costs.
Natural Gas (NG)
Several comments were received pertaining to Natural Gas, including:
“Will the price of natural gas change the procedural protocol on how this plant will
operate?”
“[bringing natural gas into Salem Harbor] would open up Salem Harbor to cruise ships; a
gas line would go under Fort Street - (a residential area) also that the pipe line is smaller
than the amount of gas that needs to go through it…”
“[natural gas extraction via fracking technology]… addressing the threat of well-water
and groundwater contamination posed by fracking-related injections…”
“…when I think of ships containing LNG coming into the busy harbor, I get so
frightened…”
“A gas line would go under the residential area of Fort Street I understand, and the pipe
line is smaller than the amount of gas that needs to go through it.”
“There is no natural gas capacity currently at that site.”
“Will a pipeline need to be drilled under residential neighborhoods?”
“Will LNG tankers need to deliver fuel through the harbor? Is Salem being targeted to
become an LNG port?”
“With health and environmental risks associated with extracting natural gas via fracking,
we are clearly not ready for this plant!”
“We do not have enough supply of natural gas.”
Response:
The analysis of Footprint’s application, which resulted in issuance of the Proposed Plan
Approval and Draft PSD Permit, was based upon combustion of natural gas only in the two
combined cycle gas turbines. Both documents contain enforceable conditions requiring that
solely natural gas be combusted in those turbines. Any change to the approved fuel of use would

36
require an entirely new filing, a new analysis, and if merited, the issuance of significant
modifications to the Plan Approval and PSD Permit.
The issues related to hydro-fracking, LNG storage and transport, and any natural gas supply or
pricing or delivery issues, are beyond the scope of MassDEP’s review of the applications for
the Footprint PSD permit and CPA approval applications.
Use of Urea verses Ammonia
Two comments were received pertaining to the use of urea verses ammonia, including:
“…tried several times to bring up the facts about using urea as opposed to aqueous
ammonia for emissions controls… tried to explain the dangers of using, transporting and
storing aqueous ammonia…”
“…there is an alternative to ammonia by using a harmless urea solution…”
Response:
Neither the federal PSD Regulations nor the MA Plan Approval Regulations require MassDEP
to dictate the reagent to be used, in conjunction with Selective Catalytic Reduction, to control
NOx emissions from a proposed power plant. MassDEP is charged with ensuring that those
emissions will comply with Best Available Control Technology and Lowest Achievable
Emission Rate as applicable. MassDEP required Footprint to analyze the effects of a worst case
ammonia (NH3) spill involving the entire contents of the proposed NH3 storage tank. The details
of this analysis can be found on pages 20-22 of 60 inclusive of the Footprint CPA Approval,
section entitled “Accidental Release Modeling of Aqueous Ammonia (NH3)”. Furthermore,
Footprint is subject to federal risk management planning and accidental release prevention
requirements for any on-site quantities of flammable and extremely hazardous chemicals listed
under 40 CFR 82, and under the General Duty Clause of the federal Clean Air Act, Section
112(r).
MassDEP has established health based ambient air guidelines for a variety of chemicals (air
toxics). These air guidelines establish two maximum impact limits for each chemical listed: an
Allowable Ambient Level (AAL), which is based on an annual average concentration; and a
Threshold Effects Exposure Limit (TEL), which is based on a 24-hour time period. In general,
AALs are lower than TELs, and represent the concentration associated with a one in one million
excess lifetime cancer risk, assuming a lifetime of continuous exposure to that concentration. For
chemicals that do not pose cancer risks, the AAL is equal to the TEL. AALs and TELs are
expressed in micrograms per cubic meter (ug/m3). MassDEP required Footprint to demonstrate
that the worst case NH3 stack emissions from its proposal would not exceed MassDEP’s air
toxics guidelines for NH3. Using the same USEPA reviewed and approved computer dispersion
models employed during the NAAQS analysis, Footprint’s worst case NH3 emissions were
predicted to be: 0.034497 ug/m3 on an annual basis, versus an AAL of 100 ug/m3; and a worst
case 24 hour NH3 concentration of 1.093673 ug/m3 versus a TEL of 100 ug/m3.

37
Appeal Procedures and Venue
Two comments were received pertaining to the appeal procedures, including:
A citizen requested to be informed regarding their rights to appeal the decision of the
Footprint air permit.
“The Draft Prevention of Significant Deterioration Fact Sheet (the “Fact Sheet”)
misstates the law regarding appeals of air permits…. MassDEP needs to clarify the venue
and procedure for appeals of its final PSD Permit Decision in a manner which conforms
to its codified enabling authority.”
Response:
The final Plan Approval (for State Issued Permits and Approvals ONLY) includes the following
information regarding the applicable Appeal Process.
APPEAL PROCESS
This Plan Approval is an action of MassDEP. If you are aggrieved by this action, you
may request an adjudicatory hearing. A request for a hearing must be made in writing and
postmarked within twenty-one (21) days of the date of issuance of this Plan Approval.
Under 310 CMR 1.01(6)(b), the request must state clearly and concisely the facts, which
are the grounds for the request, and the relief sought. Additionally, the request must state
why the Plan Approval is not consistent with applicable laws and regulations.
The hearing request along with a valid check payable to the Commonwealth of
Massachusetts in the amount of one hundred dollars ($100.00) must be mailed to:
Commonwealth of Massachusetts
Department of Environmental Protection
P.O. Box 4062
Boston, MA 02211
This request will be dismissed if the filing fee is not paid, unless the appellant is exempt
or granted a waiver as described below. The filing fee is not required if the appellant is a
city or town (or municipal agency), county, or district of the Commonwealth of
Massachusetts, or a municipal housing authority.
MassDEP may waive the adjudicatory hearing-filing fee for a person who shows that
paying the fee will create an undue financial hardship. A person seeking a waiver must
file, together with the hearing request as provided above, an affidavit setting forth the
facts believed to support the claim of undue financial hardship.

38
The PSD Permit is subject to requirements of the Delegation Agreement with US EPA, Region 1
to implement and enforce the federal Prevention of Significant Deterioration (PSD) regulations
as found in 40 CFR 52.21, the Code of Federal Regulations (CFR), 7-1-10 Edition, with
amendments.
The provisions in 40 CFR 124.19 will apply to all appeals to the EPA Environmental Appeals
Board (EAB) on PSD permits issued by MassDEP under the April 4, 2011 Delegation
Agreement, except with respect to permit conditions that do not derive from federal PSD
requirements, for which applicable Massachusetts administrative procedures apply. If a PSD
permit issued by MassDEP is appealed to the EAB, MassDEP has the primary responsibility for
defending the permit before the EAB and the discretion to withdraw the permit under 40 CFR
124.19(d).
MassDEP will notify the applicant and each person who has submitted written comments or
requested notice of the final permit decision of their right to appeal, and this notice is required to
state that for federal PSD purposes and in accordance with 40 CFR 124.15 and 124.19:
Within 30 days after the final PSD permit decision has been issued under 40 CFR 124.15,
any person who filed comments on the draft permit or participated in any public hearing
may petition EPA’s EAB to review any condition of the permit decision.
The effective date of the permit is 30 days after sevice of notice to the applicant and
commenters of the final decision to issue, modify, or revoke and reissue the permit,
unless review is requested on the permit under 40 CFR 124.19 within the 30 day period.
If an appeal is made to the EAB, the effective date of the permit is suspended until the
appeal is resolved.
A petition for review shall include a statement of the reasons supporting that review including
documentation that any issues being raised were raised during the public comment period
(including any public hearing) to the extent required by the PSD Program regulations, and when
appropriate a showing that the condition in question is based on (i) a finding of fact or
conclusion of law which is clearly erroneous or (ii) an exercise of discretion or an important
policy consideration which the EAB should review.
Procedures for appealing permits can be found at 40 CFR 124. More information on the appeals
process and the EAB can be found at http;//www.epa.gov/eab. The EAB Practice Manual can be
found at http://www.epa.gov./eab/pmanual.pdf. The EAB website and the Practice Manual
should be carefully reviewed prior to filing an appeal.
Monitoring, Record Keeping, and Reporting
Several comments were received pertaining to monitoring, record keeping and reporting,
including:
“Require PM CEMS instead of parametric monitoring for PM,”

39
“Limit of 0.5 grains/100 scf sulfur content in natural gas, but no particular method to
ensure continuous monitoring, reporting and compliance.”
“…recommend requiring that those monthly records be submitted to MassDEP on a
quarterly basis in addition to the semi-annual reporting requirement…”
Response:
Mt. Tom Station, a coal fired power plant, is required to install and operate PM CEMS as part of
a settlement agreement and not as a Plan Approval or Permit requirement; final technical details
concerning the operation of this PM CEMS have been resolved and the PM CEMS has just
recently become operational. Brayton Point, also a coal fired power plant, employs parametric
PM monitoring, not a PM CEMS. Palmer Renewable Energy (PRE) was originally proposed as
a construction and demolition (C&D) waste fired power plant. The PM CEMS was originally
required due to the proposed combustion of C&D waste and to also be used as a surrogate for the
heavy metals emissions that would have occurred as a result of combusting C&D waste. The
PRE proposal has subsequently been changed to combust clean biomass and is currently in
litigation concerning local zoning issues. The PRE facility has not yet been built, and therefore a
PM CEMS has not been installed nor operated. As opposed to the coal fired Mt. Tom power
plant and the proposed, but not yet built PRE biomass fired power plant listed above, the
proposed SHR Project is a natural gas only, combined cycle turbine, power generating facility.
The actual filterable and condensable, in-stack PM concentrations that a PM CEMS installed on
a natural gas turbine would measure is thus extremely small; and significantly smaller than the
in-stack PM-fine concentration that would be emitted by either a coal fired or biomass fired
emission unit. Natural gas fired combustion turbines with low PM emission concentrations
provide a challenging emissions monitoring environment. These exhaust streams are extremely
high volume, low concentration gas streams. MassDEP is of the opinion that the current PM
CEMS on the market have not demonstrated an ability to adequately measure PM over the long
term that enable them to be used in Massachusetts as a direct compliance monitor, particularly on
a natural gas fired only combustion turbine. Therefore, MassDEP did not require PM CEMS for
the proposed SHR Project. In addition, both the proposed PVEC and Brockton combined cycle
combustion turbine projects are not required to install PM CEMS.
With respect to sulfur content of fuel, Footprint Power is required by federal regulations to
comply with the monitoring requirements concerning the sulfur content of natural gas as
contained in 40 CFR 60 Subpart KKKK.
As the owner/operator of a major source of certain criteria air pollutants the SHR Project
owner/operator shall be required to submit semi-annual and annual compliance reports pursuant
to 310 CMR 7.00-Appendix C. In addition, any facility which is required to install, operate and
maintain continuous emissions monitoring systems (CEMS). Footprint must employ NOx, CO
and ammonia CEMS, and an O2 CEMS as a reference gas. Footprint is also required to submit
quarterly CEMS excess emissions reports to MassDEP.

40
Noise
(State Only Requirement – Not PSD Subject)
One comment was received pertaining to noise:
“How noisy would plant operation be for nearby neighbors? These gas burning units can
be as loud as jet engines. How will that impact our neighborhoods?”
Response:
The proposed SHR project is required to comply with the MassDEP noise guidance and ensure
the facility is not having an impact of greater than 10 dbA over existing ambient conditions. In
addition, Footprint was required to evaluate and incorporate best sound migration controls and/or
strategies to all sound producing activities associated with the proposed project. Please see
Section C-NOISE (State-Only Requirement) pages 47-51 of 60 inclusive of Plan Approval,
Application No. NE-12-022, which addresses all noise-related issues. The SHR project is
projected to increase sound by not more than 6 decibels above ambient background (where
background does not include operation of the existing coal and oil fired Salem facility.)
Article 97,
97th
Amendment to the Massachusetts Constitution
(State Only Requirement – Not PSD Subject)
Two comments were received pertaining to Article 97, including:
“…the 97th Amendment to the State Constitution. The amendment reads: The people
shall have the right to clean air and water, freedom from excessive and unnecessary
noise, and the natural, scenic, historic, and esthetic qualities of their environment.”
"The people shall have the right to clean air and water, freedom from excessive and
unnecessary noise, and the natural, scenic, historic, and esthetic qualities of their
environment; and the protection of the people in their right to the conservation,
development and utilization of the agricultural, mineral, forest, water, air and other
natural resources is hereby declared to be a public purpose. The general court shall have
the power to enact legislation necessary or expedient to protect such rights."
Response:
The [Massachusetts] Department of Environmental Protection is the state agency responsible for
ensuring clean air and water, the safe management of toxics and hazards, the recycling of solid
and hazardous wastes, the timely cleanup of hazardous waste sites and spills, and the
preservation of wetlands and coastal resources. (This is MassDEP’s Mission Statement).

41
To ensure a clean environment for the citizens of Massachusetts, MassDEP utilizes its regulatory
authority to review permit applications and issue approvals/permits that comply with state and
federal regulations/laws that protect and preserve the public health and welfare of the citizens of
the Commonwealth.
Opposition to the Proposed Footprint SHR Project
Several comments were received that pertain to opposition for the Proposed Footprint SHR
project, including:
Approximately 22 parties/commenters provided comments and/or testimony in
opposition of the Proposed Footprint SHR Project.
Response:
MassDEP duly notes the opposition to the Footprint SHR project.
Support and Conditional Support for the Proposed Footprint SHR Project
Several comments were received pertaining to support and conditional support of the Proposed
Footprint SHR Project, including:
Approximately 8 parties/commenters provided comments and/or testimony in support
and/or conditional support of the Footprint SHR project.
Response:
MassDEP duly notes the support and conditional support for the Footprint SHR project.

42
APPENDIX 1
BEST AVAILABLE CONTROL ANALYSIS
(BACT)
APPENDIX A
EMISSIONS CALCULATIONS

43
1.0 CONTROL TECHNOLOGY ANALYSIS
This section presents an updated PSD BACT analysis for the Project. This updated analysis addresses
comments made on the draft permit and reflects additional information and corrections. The Project
exceeds PSD significant emission thresholds for NOx, PM/PM10/PM2.5, H2SO4, and GHG, and thus is
subject to PSD BACT for these pollutants. The Project does not exceed PSD significant emissions
thresholds for CO.
The Project remains subject to MassDEP BACT for all pollutants. The MassDEP BACT analysis as
reflected in the prior application materials and the MassDEP draft permit documents remains valid and is
not addressed here. This section specifically addresses PSD BACT requirements.
PSD BACT is defined in 40 CFR 52.21 means “an emissions limitation (including a visible emission
standard) based on the maximum degree of reduction for each pollutant subject to regulation under Act
which would be emitted from any proposed major stationary source or major modification which the
Administrator, on a case-by-case basis, taking into account energy, environmental, and economic impacts
and other costs, determines is achievable for such source or modification through application of
production processes or available methods, systems, and techniques, including fuel cleaning or treatment
or innovative fuel combustion techniques for control of such pollutant. In no event shall application of
best available control technology result in emissions of any pollutant which would exceed the emissions
allowed by any applicable standard under 40 CFR Parts 60 and 61. If the Administrator determines that
technological or economic limitations on the application of measurement methodology to a particular
emissions unit would make the imposition of an emissions standard infeasible, a design, equipment, work
practice, operational standard, or combination thereof, may be prescribed instead to satisfy the
requirement for the application of best available control technology. Such standard shall, to the degree
possible, set forth the emissions reduction achievable by implementation of such design, equipment, work
practice or operation, and shall provide for compliance by means which achieve equivalent results.”
Typically, PSD BACT follows a five step “top-down” approach: (1) identify all control technologies; (2)
eliminate technically infeasible options; (3) rank remaining control technologies by control effectiveness;
(4) evaluate most effective controls and documents results; and (5) select BACT.
However, a key exception to the strict, five-step “top-down” approach is described in page B-8 of the
EPA’s October 1990 draft New Source Review Workshop Manual (the “NSR Manual,” as cited in the
EPA comment letter):
If the applicant accepts the top alternative in the listing as BACT, the applicant proceeds to
consider whether impacts of unregulated air pollutants or impacts in other media would justify
selection of an alternative control option. If there are no outstanding issues regarding collateral
environmental impacts, the analysis is ended and the results proposed as BACT. In the event that
the top candidate is shown to be inappropriate, due to energy, environmental, or economic
impacts, the rationale for this finding should be documented for the public record. Then the next
most stringent alternative in the listing becomes the new control candidate and is similarly
evaluated. This process continues until the technology under consideration cannot be eliminated
by any source-specific environmental, energy, or economic impacts which demonstrate that
alternative to be inappropriate as BACT.

44
1.1 Combined Cycle Combustion Turbines
1.1.1 Fuel Selection
Fuel selection is an important consideration with respect to all pollutants subject to PSD review for the
facility (NOx, PM/PM10/PM2.5, H2SO4, and GHG). Therefore, fuel selection for the combustion turbine
combined cycle units is initially discussed here, prior to the PSD BACT evaluation for the individual PSD
pollutants, instead of repeating this under the evaluation for each pollutant.
The Applicant proposes to use natural gas only for the combined cycle turbines.
Step 1: Identify all control technologies (fuel types).
Identified control technologies (fuel types) for combustion turbine combined cycle units are:
1. Use of natural gas only.
2. Primarily natural gas with liquid fuel as a backup fuel. Liquid fuel could be ultra-low sulfur
distillate (ULSD), biodiesel or a mixture of these.
Step 2: Eliminate technically infeasible options
Both above fuel options are technically feasible. An acceptable mixture for ULSD/biodiesel is subject to
confirmation by turbine suppliers.
Step 3: Rank remaining control technologies by control effectiveness.
Natural gas is the lowest emitting commercially available fuel for combustion turbine combined cycle
units. ULSD and biodiesel have higher emissions than natural gas for NOx, PM/PM10/PM2.5 and GHG.
H2SO4 emissions depend on the maximum sulfur content of the fuel. ULSD and biodiesel are normally
specified at 15 ppm sulfur by weight, and pipeline natural gas is defined by USEPA in 40 CFR 72.2 to
have a maximum sulfur content of 0.5 grains/100 scf. These values are effectively identical in the amount
of sulfur per MMBtu of fuel. However, natural gas as delivered is likely to have a lower actual sulfur
content per MMBtu of fuel compared to ULSD or biodiesel.
Since natural gas is a lower emitting fuel than ULS D or biodiesel, it ranks higher in terms of control
effectiveness and is considered the top BACT alternative.
Step 4: Evaluation of Collateral Impacts Energy Impacts
Within the past decade, natural gas has become increasing abundant in the New England, due to increased
availability of domestic sources of gas. However, concerns have been raised regarding the lack of
regional fuel diversity and potential overreliance on natural gas for energy supplies. In particular, pipeline
infrastructure to deliver gas into New England can become constrained during cold weather as space
heating and electric production compete for available gas supplies. These issues have resulted in
considerations for more energy diversity and backup liquid fuel supplies for electric generation facilities.
Since the Applicant has committed to use natural gas exclusively in the combustion turbine combined
cycle units, potential energy concerns with exclusive natural gas use are an important consideration. The
Project will obtain natural gas from its direct connection to Algonquin’s HubLine interstate natural gas
pipeline near HubLine’s interconnection with the Maritimes & Northeast Pipeline. This unique
interconnection point permits the Project to access supplies of natural gas from both Canadian sources as

45
well as from domestic sources the south and west. The Maritimes & Northeast Pipeline has not had the
same physical delivery constraints as the heavily relied-upon pipelines delivering natural gas into New
England exclusively from the south and west. Therefore, energy concerns due to exclusive natural gas use
are not problematic for this Project.
Economic Impacts
Natural gas is currently a much more favorable economically compared to liquid fuels, and this situation
is expected retain this current pattern into the foreseeable future. With Footprint’s access to Canadian
Maritime gas, potential short-term price spikes due to physical supply constraints are not expected to be
problematic. Therefore, there are no economic considerations that would dictate that backup provisions
for liquid fuel are necessary.
Environmental Impacts
In addition to being a higher emitting fuel for air emissions, liquid fuel has other significant collateral
impacts compared to natural gas. The most significant collateral impact is associated with the truck
delivery of liquid fuel to the site. Although liquid fuel could be delivered by barge as well, the local
community has expressed its strong opposition to the continued storage and combustion of liquid fuel on
the site for power generation. These impacts are of significant concern to the local Salem community, and
in fact have led to a commitment by the Applicant not to use liquid fuel for the combustion turbine
combined cycle units at the site.
The other collateral environmental impact of note is the fact that NOx control for liquid fuel requires the
use of water or steam injection to the turbine combustor. The use of water/steam injection would result in
a significant consumptive water use and an associated discharge of water that is not needed for dry low-
NOx combustors, which are available for natural gas.
Step 5: Select BACT
Use of natural gas as the exclusive fuel for the combustion turbine combined cycle units is clearly
justified as PSD BACT. Natural gas is lower emitting, has significantly lower collateral environmental
impacts, and collateral energy and economy impacts have been determined to be acceptable.
1.1.2 PSD Best Available Control Technology Assessment for NOx
Step 1: Identify Candidate Technologies
NOx control technologies identified for new large > 100 MW combined cycle turbines are as follows:
Dry-low NOx (DLN) Combustion: Turbine vendors offer what is known as lean pre-mix
combustors for natural gas firing which limit NOx formation by reducing peak flame
temperatures.
Water or Steam Injection: Water or steam injection has been historically used for both gas and oil
fire turbines, but for new turbines is generally only used for liquid fuel firing.
Catalytic Combustors: A form of catalytic combustion to limit firing temperature has been under
development using the trade name XONON.
SCONOx: This is an oxidation/absorption technology using hydrogen or methane as a reactant.
This technology is currently marketed as EMx.
46
SCR: This is a catalytic reduction technology using ammonia as a reactant that has been in
widespread use on new combined cycle turbines for over 20 years.
Step 2: Eliminate Infeasible Technologies
Catalytic combustors are not currently technically feasible for large turbines. The only known application
is on a 1.4 MW test turbine. The largest turbine to which SCONOx has been successfully demonstrated is
a 43 MW turbine in California. There are significant SCONOx scale up questions for a new turbine larger
than 100 MW, but for the sake of argument SCONOx will be assumed to be technically feasible here. The
other technologies are all technically feasible.
Step 3: Rank Control Technologies by Control Effectiveness
The ranking of these technologies is as follows:
1. SCR: Widely demonstrated to have achieved 2.0 ppmvd NOx at 15% O2 for gas firing. This is
documented in the LAER analysis presented in the December 21, 2012 Application and First
Application Supplement (April 12, 2013).
2. SCONOx: Demonstrated to have achieved 2.5 ppmvd NOx at 15% O2 at the 43 MW California
unit.
3. DLN: Generally recognized to achieve 9 ppmvd NOx at 15% O2. Commonly used in conjunction
with SCR to achieve 2.0 ppmvd NOx at 15% O2.
4. Steam/Water Injection: Less effective than DLN.
Step 4: Evaluate Controls
Since Footprint is proposing the “top” level for NOx BACT (SCR), the BACT analysis can proceed to the
consideration of whether any collateral energy or environment impacts would indicate other than the top
demonstrated technology be selected.
The one collateral impact that has been identified for SCR is due to the use of ammonia as a reagent, and
the resulting emissions of ammonia “slip” that can occur. SCONOx does not require the use of ammonia.
While SCONOx will eliminate the use of ammonia, the lower NOx emissions demonstrated in practice
with SCR (2.0 ppmvdc vs. 2.5 ppmvdc for SCONOx) and the very high additional cost documented with
SCONOx does not justify a finding that SCONOx is BACT. This same conclusion is found in the EPA
Analysis for the Pioneer Valley Energy Center (PVEC), in the Fact Sheet published in December 2011.
SCONOx is not justified as BACT. In addition, as documented in the Application and supplements, the
predicted ambient air quality impacts for ammonia are well below the MassDEP air toxics guidelines.
Aqueous ammonia will be stored in a 34,000 gallon above ground tank located within a concrete dike
designed to contain 110% of the total tank volume. Passive evaporative controls will be used inside the
dike to control evaporation in the event of a release, and the tank and dike will be in a fully enclosed and
sealed structure except for roof vents. Evaluation of a hypothetical worst case release indicates that
ammonia concentrations at and outside the Project perimeter will be less than the ERPG-1 level. ERPG-1
is defined as the maximum airborne concentration below which nearly all individuals could be exposed
for up to one hour without experiencing other than mild transient adverse health effects or perceiving a
clearly defined, objectionable odor.

47
Step 5: Select BACT
The Footprint Project will meet the same 2.0 ppmvdc NOx limit as determined to be BACT for PVEC.
The Project will also meet a stringent emission limit for ammonia slip (2.0 ppmvdc on a 1-hour basis),
which is the most stringent ammonia limit achieved in practice for facilities of this type. This stringent
ammonia limit assures that collateral impacts are adequately minimized for the use of SCR for the
Footprint Project, and that this represents BACT for NOx.
1.1.3 PSD Best Available Control Technology Assessment for PM/PM10/PM2.5
Emissions of particulate matter result from trace quantities of ash (non-combustibles) in the fuel as well
as products of incomplete combustion. Conservatively, all particulate matter (PM) emissions for the
combustion turbines are assumed to be less than 2.5 microns in size (PM2.5).
Pursuant to identifying candidate control technologies under the “top-down” procedure, Footprint has
compiled all the PSD BACT determinations in the last five years for new large (> 100 MW) combustion
turbine combined cycle project. This compilation is based on the USEPA RBLC (RACT/BACT/LAER
Clearinghouse). Several recent projects not included in RBLC have also been included in this
compilation. The Brockton Energy Center Project in Brockton MA is also included, since it is a similar
recent project in Massachusetts, even though it did not receive a PSD permit. This review confirms that
the only BACT technology identified for large natural gas fired combined cycle turbines is use of clean
fuel (i.e., natural gas) and good combustion practices.
For PM/PM10/PM2.5, this evaluation does not identify and discuss each of the five individual steps of the
“top-down” BACT process, since there are no post-combustion control technologies available for
PM/PM10/PM2.5. Post-combustion particulate control technologies such as fabric filters (baghouses),
electrostatic precipitators, and/or wet scrubbers, which are commonly used on solid fuel boilers, are not
available for combustion turbines since the large amount of excess air inherent to combustion turbine
technology would create adverse backpressure for turbine operation.
The “top-down” procedure does require selection of BACT emission limits, which is addressed in the
following paragraphs.
Table 1-1 presents the results of RBLC compilation for PM/PM10/PM2.5. A review of Table 1-1 indicates
that PM/PM10/PM2.5 emission limits are expressed strictly in lbs/hr or lb/MMBtu, or in both lb/hr and
lb/MMBtu. This review also indicates that different emission limits can be associated with different
turbine suppliers. This is illustrated by some projects which have one set of limit for one supplier and
another set of limits for another supplier.
It is Footprint’s conclusion based on review of available information that differences in PM/PM10/PM2.5
emission limits among various projects are due to different emission guarantee philosophies of the
various suppliers, and are not actual differences in the quantity of PM/PM10/PM2.5 emissions inherently
produced by the supplier of the turbine. The different emission guarantee philosophies are influenced by
the overall uncertainties of the PM/PM10/PM2.5 test procedures, especially given reported difficulties in
achieving test repeatability, and concerns with artifact emissions introduced by the general inclusion of
condensable particulate emissions (as measured by impinger based techniques) in permit limits in the last
decade.

48
Table 1-1. Summary of Recent Particulate PSD BACT Determinations for Large (>100MW) Gas Fired Combined-Cycle Generating Plants
Facility Location Permit Date Turbine
1
Emission Limits2
PM/PM10/PM2.5
Carroll County Energy
Washington Twp., OH
11/5/2013 2 GE 7FA 2045 MMBtu/hr/unit plus 566 MMBtu/hr DF
12.4 lb/hr/unit and 0.0108 lb/MMBtu without DF 19.8 lb/hr and 0.0078 lb/MMBtu with DF
Renaissance Power
Carson City, MI 11/1/2013 4 Siemens 501 FD2 units 2147 MMBtu/hr/unit each with 660 MMBtu/hr
DF
9.0 lb/hr/unit and 0.0042 lb/MMBtu (with and without DF)
Langley Gulch Power
Payette, ID 08/14/2013 1 - Siemens SGT6-5000F 2134 MMBtu/hr/unit with 241.28 MMBtu/hr DF
12.55 lb/hr (w/ and w/o DF)
Oregon Clean Energy
Oregon, OH 06/18/2013 2 Mitsubishi M501GAC or 2 Siemens SCC6-8000H
2932 MMBtu/hr/unit plus 300 MMBtu/hr DF
Mitsubishi: 11.3 lb/hr/unit and 0.00384 lb/MMBtu without DF Mitsubishi: 10.1 lb/hr and 0.00373 lb/MMBtu with DF
Siemens: 14.0 lb/hr/unit and 0.0055 lb/MMBtu without DF Siemens: 13.3 lb/hr and 0.0047 lb/MMBtu with DF
Green Energy Partners / Stonewall
Leesburg, VA 04/30/2013 2 GE 7FA.05 2230 MMBtu/hr/unit plus 650 MMBtu/hr DF or
2 Siemens SGT6-5000F5 2260 MMBtu/hr/unit plus 450 MMBtu/hr DF
GE: 0.00334 lb/MMBtu at full load (w/ and w/o DF) 9.6 lb/hr/unit without DF
16.2 lb/hr with DF Siemens: 0.00374 lb/MMBtu at full load (w/ and w/o DF)
10.1 lb/hr/unit without DF 14.5 lb/hr with DF
Hickory Run Energy LLC
New Beaver Twp., PA
04/23/2013 GE7FA, Siemens SGT6-5000F, Mitsubishi M501G, or Siemens SGT6-8000H.
2 combined cycle units
11.0 lb/hr/unit without DF 18.5 lb/hr/unit with DF
Emissions based on Siemens SGT6-8000H
Sunbury Generation
Sunbury, PA 04/01/2013 “F Class” with DF 2538 MMBtu/hr/unit
0.0088 lb/MMBtu
Brunswick County Power
Freeman, VA 03/12/2013 3 Mitsubishi M501 GAC with DF Combined GT and DF 3442 MMBtu/hr/unit
9.7 lb/hr/unit and 0.0033 lb/MMBtu without DF 16.3 lb/hr and 0.0047 lb/MMBtu with DF
Moxie Patriot LLC Clinton Twp, PA 01/31/2013 Equipment type not specified 2 - 472 or 458 MW combined cycle blocks with
DF
0.0057 lb/MMBtu
Garrison Energy Center
Dover, DE 01/30/2013 GE 7FA 309 MW
32.1 lb/hr
St. Joseph Energy Center
New Carlisle, IN 12/03/2012 4 - “F Class” (GE or Siemens) 1345 MW total
15 lb/hr/unit and 0.0092 lb/MMBtu without DF 18 lb/hr and 0.0078 lb/MMBtu with DF
Hess Newark Energy
Newark, NJ 11/01/2012 2 - GE 7FA.05 2320 MMBtu/hr/unit plus 211 MMBtu/hr DF
11 lb/hr/unit without DF 13.2 lb/hr with DF
Channel Energy Center, LLC
Houston, TX 10/15/2012 2 - Siemens 501F 180 MW plus
425 MMBtu/hr DF
27.0 lb/hr

49
Table 1-1. Summary of Recent Particulate PSD BACT Determinations for Large (>100MW) Gas Fired Combined-Cycle Generating Plants
Facility Location Permit Date Turbine
1
Emission Limits2
PM/PM10/PM2.5
Moxie Liberty LLC Asylum Twp., PA
10/10/2012 Siemens “H Class” 2 – 468 or less MW combined cycle blocks
GT < 2890 MMBtu/hr/unit DF < 3870 MMBtu/hr/unit
0.0057 lb/MMBtu for 454 MW block 0.0040 lb/MMBtu for 468 MW block
Cricket Valley Dover, NY 09/27/2012 3 - GE 7FA.05 2061 MMBtu/hr/unit plus 379 MMBtu/hr DF
0.005 lb/MMBtu without DF 0.006 lb/MMBtu with DF
Deer Park Energy Center LLC
Deer Park, TX 09/26/2012 1 - Siemens 501F 180 MW plus
725 MMBtu/hr DF
27.0 lb/hr
ES Joslin Power Calhoun, TX 09/12/2012 3 - GE 7FA 195 MW per unit
No DF
18.0 lb/hr
Pioneer Valley Energy Center (PVEC)
Westfield, MA 04/05/2012 1 Mitsubishi M501GAC 2542 MMBtu/hr/unit; no DF
9.8 lb/hr 0.004 lb/MMBtu
Palmdale Hybrid Power
Palmdale, CA 10/18/2011 2 GE 7FA 154 MW (1736 MMBtu/hr) per unit plus
500 MMBtu/hr DF
8.46 lb/hr/unit and 0.0048 lb/MMBtu without DF 11.3 lb/hr and 0.0049 lb/MMBtu with DF
Thomas C. Ferguson Power
Llano, TX 09/01/2011 2 - GE 7FA 195 MW per unit
No DF
18.0 lb/hr
Entergy Ninemile Point Unit 6
Westwego, LA 08/16/2011 Vendor not specified Single unit 550MW
26.23 lb/hr/unit without DF 33.16 lb/hr with DF
Brockton Power Brockton MA 07/20/2011 (MA Plan Approval)
1 Siemens SGT6-PAC-5000F 2227 MMBtu/hr plus 641 MMBtu/hr DF
17.4 lb/hr 0.007 lb/MMBtu
Avenal Power Center
Avenal, CA 05/27/2011 2 - GE 7FA 1856.3 MMBtu/hr/unit plus 562.26 MMBtu/hr
DF
8.91 lb/hr/unit without DF 11.78 lb/hr with DF
Portland Gen. Electric Carty Plant
Morrow, OR 12/29/2010 1 - Mitsubishi M501GAC 2866 MMBtu/hr
0.0083 lb/MMBtu
Dominion Warren County
Front Royal, VA 12/21/2010 3 -Mitsubishi M501 GAC 2996 MMBtu/hr/unit plus 500 MMBtu/hr DF
8.0 lb/hr/unit and 0.0027 lb/MMBtu without DF 14.0 lb/hr and 0.0040 lb/MMBtu with DF
Pondera/King Power Station
Houston, TX 08/05/2010 4 GE 7FA.05 2430 MMBtu/hr/unit GT plus DF or
4 Siemens SGT6-5000F5 2693 MMBtu/hr/unit GT plus DF
GE: 19.80 lb/hr/unit (w/ and w/o DF) Siemens: 11.1 lb/hr/unit (w/ and w/o DF)
Live Oaks Power Sterling, GA 03/30/2010 Siemens SGT6-5000F No emission limits specified. PSD BACT for PM10/PM2.5 use of pipeline quality natural gas
Victorville 2 Hybrid Victorville, CA 03/11/2010 2 GE 7FA 154 MW per unit plus 424.3 MMBtu/hr DF
12.0 lb/hr/unit without DF 18.0 lb/hr with DF

50
Table 1-1. Summary of Recent Particulate PSD BACT Determinations for Large (>100MW) Gas Fired Combined-Cycle Generating Plants
Facility Location Permit Date Turbine
1
Emission Limits2
PM/PM10/PM2.5
Stark Power/Wolf Hollow
Granbury, TX 03/03/2010 2 GE 7FA 170 MW/unit plus
570 MMBtu/hr DF or 2 Mitsubishi M501G
254 MW/unit plus 230 MMBtu/hr DF
GE: 12.0 lb/hr/unit (w/ and w/o DF) Mitsubishi: 20.0 lb/hr/unit (w/ and w/o DF)
Panda Sherman Power
Grayson, TX 02/03/2010 2 GE 7FA or 2 Siemens SGT6-5000F
with 468 MMBtu/hr/unit DF
GE: 12.0 lb/hr/unit (without DF) 27.0 lb/hr with DF
Siemens: 11.0 lb/hr/unit without DF 15.4 lb/hr with DF
Russell City Energy Center
Hayward, CA 02/03/2010 2 - Siemens 501F 2238.6 MMBtu/hr/unit plus
200 MMBtu/hr DF
7.5 lb/hr/unit 0.0036 lb/MMBtu
Lamar Power Partners II LLC
Paris, TX 06/22/2009 4 - GE 7FA with 200 MMBtu/hr DF 18.0 lb/hr/unit without DF 20.3 lb/hr with DF
Pattillo Branch Power LLC
Savoy, TX 06/17/2009 4 – GE 7FA, GE7FB, or Siemens SGT6-5000F
With DF
20.8 lb/hr/unit (each option)
Entergy Lewis Creek Plant
The Woodlands, TX
05/19/2009 2 - GE 7FA with 362 MMBtu/hr DF 27.14 lb/hr/unit
____________ 1 DF refers to duct firing
2 Includes front (filterable) and back-half (condensable) PM. Limits obtained from agency permitting documents when not available in RBLC. Short-term emission
limits only are provided.

51
GE has historically guaranteed particulate emissions on constant lb/hr basis, regardless of turbine load.
Thus, as shown in Table 1-1, many of the GE turbines have PSD BACT limits expressed strictly in lb/hr.
Footprint has calculated lb/MMBtu values inclusive of minimum emission compliance load (MECL).
(Note that duct-firing will not occur at MECL, so the MECL-based limit is only for unfired conditions).
Footprint has determined that the flexibility to operate at MECL is important to the Project’s mission of
providing a flexible and quick response to the future system power needs. Footprint’s draft PSD permit
and Plan Approval also require PM/PM10/PM2.5 emission testing at MECL. MECL turbine operation
therefore results in Footprint’s highest lb/MMBtu rate of 0.0071 lb/MMBtu. It is important to note that a
number of the lb/MMBtu emission rates in Table 1-1 correspond to (just) the full load heat input rate. For
comparative purposes, the Footprint full load lb/MMBtu/hr PM/PM10/PM2.5 emission rate (without duct
firing) ranges from 0.0038 to 0.0047 lb/MMBtu.
Table 1-1 lists 34 projects with PSD BACT limits for PM/PM10/PM2.5 approved in the last 5 years. Over
half of these projects (18) clearly have PM/PM10/PM2.5 limits less stringent than the Footprint limits
discussed above. Of the remaining 16 projects, most of these are for turbine suppliers other than GE, and
generally have lower PM/PM10/PM2.5 limits expressed on a lb/MMBtu basis. The lb/MMBtu comparison
allows PM/PM10/PM2.5 rates for projects of different sizes to be more readily compared. The most
stringent lb/MMBtu limit identified is for the Dominion Warren County (VA) project, which is 0.0027
lb/MMBtu without duct firing. The Dominion Warren County project is based on 3 Mitsubishi 501GAC
turbines. Mitsubishi in particular has recently taken a more aggressive approach to PM/PM10/PM2.5
guarantees, as reflected by the Warren County Project as well as the Brunswick County (VA) project
(0.0033 lb/MMBtu without duct firing and 0.0047 lb/MMBtu with duct firing), the Oregon (Ohio) project
(0.00384 lb/MMBtu without duct firing and 0.00373 lb/MMBtu with duct firing) and PVEC (0.004
lb/MMBtu without duct firing as noted in the CLF comment letter to MassDEP on the Footprint project).
With respect to the PM/PM10/PM2.5 limits achievable for the Mitsubishi 501GAC turbine, it is significant
to note that an email from George Pyros of Mitsubishi Power Systems dated October 7, 2013, which was
submitted to MassDEP in comments concerning Footprint Power, indicates that Mitsubishi has “not yet
conducted stack PM emissions testing for our M501GAC gas turbine in combined cycle. However, we
have M501GAC units that will be commissioned next year in combined cycle that will provide such
data.” (The Mitsubishi 501GAC project that is closest to commissioning is the Dominion Warren County
project.) The email from Mitsubishi actually supports Footprint’s position, as provided in supplemental
material submitted to MassDEP on August 20, 2013, insofar as the fact that ultra-low particulate rates for
the 501GAC turbine are not demonstrated in practice. In the August 20, 2013 submission, Footprint
questioned whether the 0.004 lb/MMBtu emission rate for the PVEC was achievable in practice. This is
based on the fact that four Mitsubishi 501G units at Mystic Station (Everett MA), had tested PM
emissions (in 2003) ranging from 0.005 – 0.010 lb/MMBtu. While the 501GAC turbine has a newer
generation combustion system, the majority of the tested particulate matter at Mystic was condensable
particulates. It is not at all clear how a newer generation combustion system would achieve better control
of condensable particles. While careful adherence to particulate testing procedures can minimize testing
variably and artifact condensable emissions, Footprint remains convinced that the Mitsubishi’s recent
501GAC limits, particularly those for the Warren County project, present undue project risk.
In addition, for Mitsubishi and Siemens projects with PM/PM10/PM2.5 lb/MMBtu limits, these limits
appear to be approved as constant across the operating load range. This represents a different guarantee
philosophy than used by GE. Again, Footprint believes this is a guarantee philosophy difference and does
not reflect actual differences in the quantity of PM/PM10/PM2.5 emissions due to the type of turbine. As
noted in Footprint’s comment letter to MassDEP dated November 1, 2013, at full load unfired conditions,
Footprint’s lb/MMBtu rates for PM/PM10/PM2.5 range from 0.0038 to 0.0047 lb/MMBtu. These full load
rates compare favorably to many of the lb/MMBtu rates for Siemens and Mitsubishi in Table 1-1.

52
Several Siemens “F Class” PM/PM10/PM2.5 limits in Table 1-1 (Renaissance, Langley Gulch, Pondera
King) have lb/hr limits higher than the Footprint unfired value of 8.8 lb/hr, but do not incorporate higher
duct firing limits (as is typically found to be necessary by available duct burner guarantees). Again,
Footprint believes this is a guarantee philosophy difference and does not reflect actual differences in the
quantity of PM/PM10/PM2.5 emissions due to the type of turbine and whether duct firing is present or not.
The Russell City Energy Center Project is based on 2 Siemens 501F turbines, and was approved with
PM/PM10/PM2.5 limits of 7.5 lb/hr and 0.0038 lb/MMBtu. Again, Footprint believes this is a guarantee
philosophy difference and does not reflect actual differences in the quantity of PM/PM10/PM2.5 emissions.
However, one item of particular note in the Russell City Energy Center PSD Permit is that the permit
allows the facility to propose alternate measuring techniques to measure condensable PM, such as the use
of a dilution tunnel. A dilution tunnel is expected to result in lower (and more realistic) tested emissions
compared to typical stationary source impinger techniques for measuring condensable PM. Therefore, this
permit provision may explain in part the rationale for the Russell City Energy Center strategy for
accepting lower permit limits. Dilution tunnel based measurements for condensable PM are expected to
more accurately simulate the process by which condensable PM forms compared to impinger techniques,
which still present concerns with artifact emissions.
There is one other GE 7FA unit noted in Table 1-1 that has PM/PM10/PM2.5 limits of comparative note.
This is the Green Energy (VA) project. This project is approved for either GE 7FA or Siemens turbines.
For GE 7FA, the lb/hr limits are less stringent than Footprint but the lb/MMBtu limits are more stringent.
The Green Energy lb/MMBtu limits appear to be incorrectly calculated (too low), even based on the full
load firing rates.
In summary, the available evidence clearly indicates that PSD BACT for PM/PM10/PM2.5 emissions is to
use of state of the art combustion turbines, with good combustion practices and the use of natural gas. The
actual guarantees for PM/PM10/PM2.5 emissions vary by manufacturer, and permit limits within the range
of recently approved projects for a given turbine supplier are justified as PSD BACT limits.
1.1.4 PSD Best Available Control Technology Assessment for Sulfuric Acid Mist (H2SO4)
Emissions of H2SO4 from natural gas-fired combined cycle units result from oxidation of trace quantities
of sulfur in natural gas. Normally, fuel sulfur oxidizes to SO2. A generally small portion of fuel sulfur
may initially oxidize directly to SO3 rather than SO2. Also, a portion of the fuel sulfur which initially
oxidizes to SO2 may subsequently oxidize to SO3 prior to being emitted. For purposes of emission
calculations, all SO3 is assumed to combine with water vapor in the flue gas to form H2SO4.
For H2SO4, this evaluation does not identify and discuss each of the five individual steps of the “top-
down” BACT process, since the only available control for H2SO4 is limiting the fuel sulfur content. Based
on the selection of natural gas as the BACT fuel, this is the lowest sulfur content fuel available.
Key considerations in the development of a specific H2SO4 emission rate for a natural gas-fired combined
cycle unit are the sulfur content of natural gas, and the appropriate allowance for oxidation of fuel sulfur
and SO2 to SO3. For the sulfur content of natural gas, the Project has used the EPA definition of “pipeline
natural gas” in 40 CFR 72.2. This definition is that pipeline natural gas has a maximum sulfur content of
0.5 grains of sulfur per 100 standard cubic feet (scf). Based on data from GE, up to 5% of the fuel sulfur
is expected to convert directly to SO3 in the turbine combustor/duct burners. Then, up to 35% of the
(remaining) SO2 is expected to convert to SO3 in passing through the oxidation catalyst, and up to an
additional 5% of the (remaining) SO2 is expected to convert to SO3 in passing through the SCR system.
As documented in the Project supplemental data submitted to MassDEP on August 20, 2013, the resulting

53
H2SO4 emission rate is 0.0010 lb/MMBtu. This corresponds to a maximum emission rate of 2.3 lb/hr of
H2SO4 per unit.
Pursuant to identifying candidate control technologies under the “top-down” procedure, the Applicant has
compiled all the PSD BACT determinations for H2SO4 in the last five years for new large (> 100 MW)
combustion turbine combined cycle projects. This compilation is based on the USEPA RBLC
(RACT/BACT/LAER Clearinghouse). Several recent projects not included in RBLC have also been
included in this compilation. This review confirms that the only H2SO4 BACT technology identified for
large natural gas fired combined cycle turbines is use of clean fuel (i.e., natural gas). There are no cases
where any post combustion controls have been used to control H2SO4 emissions from large natural gas
fired combined cycle turbines. Therefore, the PSD BACT analysis for H2SO4 does not require any
evaluation of alternative control technologies.
The “top-down” procedure does require selection of BACT emission limits. Table 1-2 presents the results
of RBLC compilation for H2SO4. As for PM/PM10/PM2.5, BACT emissions for H2SO4 can be expressed
either as lb/MMBtu or lb/hr, or both. Table 1-2 lists 22 projects with PSD BACT limits for H2SO4
approved in the last 5 years. More than half of these projects (13) have H2SO4 limits equal or less stringent
than the Footprint limits discussed above. Of the remaining 9 projects, the lower H2SO4 rates appear to be
due to either unrealistically low assumptions on SO2 to SO3 oxidation, low assumed natural gas sulfur
contents, or both. One of the projects listed in Table 1-2 (Panda Sherman) was approved without a CO
oxidation catalyst, which explains the low H2SO4 rate for this project. As noted above, a CO oxidation
catalyst oxidizes some of the SO2 to SO3/H2SO4. However, the other projects in Table 1-2 with lower
H2SO4 rates appear to have assumed a very stringent natural gas sulfur content and/or did not take into
account the unavoidable incremental oxidation of SO2 to SO3 from a CO catalyst. Footprint does not
believe it is prudent to ignore the SO2 to SO3 oxidation from a CO catalyst, or assume a natural gas sulfur
content lower than EPA’s definition for “pipeline natural gas” (0.5 grains of S/100 scf).
In summary, the available evidence clearly indicates that PSD BACT for H2SO4 for combustion turbines
is use of clean low sulfur fuel (e.g., natural gas). The H2SO4 emission calculation needs to allow for a
reasonable variation in the sulfur content of pipeline natural gas, which is outside the control of a given
generation facility, and oxidation of SO2 to SO3 oxidation from a CO catalyst. The Applicant proposes a
H2SO4 limit for the Project (0.0010 lb/MMBtu), which is consistent with recent PSD BACT precedents
which properly account for these variables.

54
Table 1-2. Summary Of Recent H2SO4 PSD BACT Determinations for Large (>100MW) Gas Fired Combined-Cycle Generating Plants
Facility Location Permit Date
Turbine1
Emission Limits2
Sulfuric Acid Mist (H2SO4)
Carroll County Energy
Washington Twp., OH 11/5/2013 2 GE 7FA 2045 MMBtu/hr/unit plus 566 MMBtu/hr DF
0.0012 lb/MMBtu without DF 0.0016 lb/MMBtu with DF
Oregon Clean Energy
Oregon, OH 06/18/2013 2 Mitsubishi M501GAC or 2 Siemens SCC6-8000H
2932 MMBtu/hr/unit plus 300 MMBtu/hr DF
Mitsubishi: 0.00041 lb/MMBtu without DF Mitsubishi: 0.00044 lb/MMBtu with DF Siemens: 0.0006 lb/MMBtu without DF
Siemens: 0.0007 lb/MMBtu with DF
Hickory Run Energy LLC
New Beaver Twp., PA 04/23/2013 GE7FA, Siemens SGT6-5000F, Mitsubishi M501G, or Siemens SGT6-8000H.
2 combined cycle units
0.92 lb/hr/unit without DF 1.08 lb/hr/unit with DF
Emissions based on Siemens SGT6-8000H
Sunbury Generation
Sunbury, PA 04/01/2013 “F Class” with DF 2538 MMBtu/hr/unit
0.0018 lb/MMBtu 4.4 lb/hr/unit without DF
4.7 lb/hr/unit with DF
Brunswick County Power
Freeman, VA 03/12/2013 3 Mitsubishi M501 GAC with DF Combined GT and DF 3442 MMBtu/hr/unit
0.00058 lb/MMBtu without DF 0.00067 lb/MMBtu with DF
Moxie Patriot LLC Clinton Twp, PA 01/31/2013 Equipment type not specified 2 - 472 or 458 MW combined cycle blocks with
DF
0.0005 lb/MMBtu
Garrison Energy Center
Dover, DE 01/30/2013 GE 7FA 309 MW
6.5 lb/hr
St. Joseph Energy Center
New Carlisle, IN 12/03/2012 4 - “F Class” (GE or Siemens) 1345 MW total
0.75 grains S/100 scf of natural gas
Hess Newark Energy
Newark, NJ 11/01/2012 2 - GE 7FA.05 2320 MMBtu/hr/unit plus 211 MMBtu/hr DF
1.36 lb/hr/unit without DF 1.33 lb/hr/unit with DF
Channel Energy Center, LLC
Houston, TX 10/15/2012 2 - Siemens 501F 180 MW plus
425 MMBtu/hr DF
4.8 lb/hr/unit
Moxie Liberty LLC Asylum Twp., PA 10/10/2012 Equipment type not specified 2 – 468 or less MW combined cycle blocks
GT < 2890 MMBtu/hr/unit DF < 3870 MMBtu/hr/unit
0.0002 lb/MMBtu 1.4 lb/hr for 454 MW block 1.5lb/hr for 468 MW block
Cricket Valley Dover, NY 09/27/2012 3 - GE 7FA.05
2061 MMBtu/hr/unit plus 379 MMBtu/hr DF 0.5 grains S/100 scf of natural gas
Deer Park Energy Center LLC
Deer Park, TX 09/26/2012 1 - Siemens 501F 180 MW plus
725 MMBtu/hr DF
4.89 lb/hr/unit
Pioneer Valley Energy Center (PVEC)
Westfield, MA 04/05/2012 1 Mitsubishi M501GAC 2542 MMBtu/hr/unit; no DF
0.0018 lb/MMBtu 3.6 lb/hr
Thomas C. Ferguson Power
Llano, TX 09/01/2011 2 - GE 7FA 195 MW per unit
No DF
13.68 lb/hr

55
Table 1-2. Summary Of Recent H2SO4 PSD BACT Determinations for Large (>100MW) Gas Fired Combined-Cycle Generating Plants
Facility Location Permit Date
Turbine1
Emission Limits2
Sulfuric Acid Mist (H2SO4)
Portland Gen. Electric Carty Plant
Morrow, OR 12/29/2010 1 - Mitsubishi M501GAC 2866 MMBtu/hr
1.5 lb/MMcf (0.0015 lb/MMBtu)
Dominion Warren County
Front Royal, VA 12/21/2010 3 -Mitsubishi M501 GAC 2996 MMBtu/hr/unit plus 500 MMBtu/hr DF
0.00013 lb/MMBtu without DF 0.00025 lb/MMBtu with DF
Pondera/King Power Station
Houston, TX 08/05/2010 4 GE 7FA.05 2430 MMBtu/hr/unit GT plus DF or
4 Siemens SGT6-5000F5 2693 MMBtu/hr/unit GT plus DF
GE: 3.37 lb/hr/unit (w/ and w/o DF) Siemens: 3.77 lb/hr/unit (w/ and w/o DF)
Live Oaks Power Sterling, GA 03/30/2010 Siemens SGT6-5000F No emission limits specified. PSD BACT for H2SO4 use of pipeline quality
natural gas with < 0.5 grains S/100 scf
Panda Sherman Power
Grayson, TX 02/03/2010 2 GE 7FA 170 MW/unit plus
570 MMBtu/hr DF or 2 Mitsubishi M501G
254 MW/unit plus 230 MMBtu/hr DF
GE: 0.56 lb/hr/unit (w/ and w/o DF) Mitsubishi: 0.62 lb/hr/unit (w/ and w/o DF)
Pattillo Branch Power LLC
Savoy, TX 06/17/2009 4 – GE 7FA, GE7FB, or Siemens SGT6-5000F
With DF
GE: 1.9 lb/hr/unit (w/ and w/o DF) Mitsubishi: 2.0 lb/hr/unit (w/ and w/o DF)
Entergy Lewis Creek Plant
The Woodlands, TX 05/19/2009 2 - GE 7FA with 362 MMBtu/hr DF 4.03 lb/hr/unit
____________ 1 DF refers to duct firing
2 Limits obtained from agency permitting documents when not available in RBLC. Short-term emission limits only are provided.

56
1.1.5 Best Available Control Technology Assessment for Greenhouse Gases Step 1: Identify Potentially Feasible GHG Control Options
In Step 1, the applicant must identify all “available” control options which have the potential for practical
application to the emission unit and regulated pollutant under evaluation, including lower-emitting
process and practices. In assessing available GHG control measures, we reviewed EPA’s
RACT/BACT/LAER Clearinghouse, the South Coast Air Quality Management District’s BACT
determinations, and the Pioneer Valley Energy Center permit information found on the EPA Region 1
website (Pioneer Valley is a recently permitted 431 MW combined cycle turbine project in Westfield,
Massachusetts). EPA stated generally that BACT for the Pioneer Valley project is energy efficient
combustion technology and additional energy savings measures at the facility, if possible. Specifically,
BACT was cited as installation of a combined cycle turbine and GHG emission limits were developed.
For the proposed Project, potential GHG controls are:
1. Low carbon-emitting fuels;
2. Carbon capture and storage (CCS); and
3. Energy efficiency and heat rate.
Step 2: Technical Feasibility of Potential GHG Control Options
Low Carbon-Emitting Fuels
Natural gas combustion generates significantly lower carbon dioxide emission rates per unit heat than
distillate oil (approximately 27% less) or coal (approximately 50% less). Use of biofuels would reduce
fossil-based carbon dioxide emissions, since biofuels are produced from recently harvested plant material
rather than ancient plant material that has transformed into fossil fuel. However, biofuels are in liquid
form, and the Project is not being designed for liquid fuel. In addition, combined cycle turbines have
technical issues with biofuels that have yet to be resolved. It is likely that distillate fuel would need to
have a limited percentage of biofuel added to be feasible. In this case, natural gas would still have lower
fossil-based carbon emissions compared a distillate oil/biofuel mixture. For these reasons, biofuels have
been eliminated from consideration. Therefore, natural gas represents the lowest carbon fuel available for
the Project.
Energy Efficiency and Heat Rate
EPA’s GHG permitting guidance states,
“Evaluation of [energy efficiency options] need not include an assessment of each and
every conceivable improvement that could marginally improve the energy efficiency of
[a] new facility as a whole (e.g., installing more efficient light bulbs in the facility’s
cafeteria), since the burden of this level of review would likely outweigh any gain in
emissions reductions achieved. EPA instead recommends that the BACT analyses for
units at a new facility concentrate on the energy efficiency of equipment that uses the
largest amounts of energy, since energy efficient options for such units and equipment
(e.g., induced draft fans, electric water pumps) will have a larger impact on reducing the
facility’s emissions....”
EPA also recommends that permit applicants “propose options that are defined as an overall category or
suite of techniques to yield levels of energy utilization that could then be evaluated and judged by the

57
permitting authority and the public against established benchmarks...which represent a high level of
performance within an industry.” With regard to electric generation from combustion sources, the
combined cycle combustion turbine is considered to be the most efficient technology available. Below is a
discussion of energy efficiency and a comparison to other common combustion-based electric generation
technologies.
GHG emissions from electricity production are primarily a function of the amount of fuel burned;
therefore, a key factor in minimizing GHG emissions is to maximize the efficiency of electricity
production. Another way to refer to maximizing efficiency is minimizing the heat rate. The heat rate of an
electric generating unit is the amount of heat needed in BTU (British Thermal Units) to generate a
kilowatt of electricity (kW), usually reported in Btu/kW-hr. The more efficient generating units have
lower heat rates than less efficient units. Older, more inefficient boilers and turbines consume more fuel
to generate the same amount of electricity than newer, more efficient boilers and turbines. This is due to
equipment wear and tear, improved design in newer models as well as the use of higher quality
metallurgy. In general, a boiler-based steam electric unit is less efficient than a combustion turbine
combined cycle unit. This is because the combustion energy from a combustion turbine is directly
imparted onto the turbine blades, and a combined cycle unit then uses the waste heat from the combustion
turbine exhaust to generate additional power, utilizing a HRSG and subsequent steam cycle.
In addition to the efficiency of the electricity generation cycle itself, there are a number of key plant
internal energy sinks (parasitic losses) that can improve a plant’s net heat rate (efficiency) if reduced.
Measures to increase energy efficiency are clearly technically feasible and are addressed in more detail in
Step 4 of the BACT process.
Carbon Capture and Storage
With regard to CCS, as identified by US EPA, CCS is composed of three main components: CO2 capture
and/or compression, transport, and storage. CCS may be eliminated from a BACT analysis in Step 2 if it
can be shown that there are significant differences pertinent to the successful operation for each of these
three main components from what has already been applied to a differing source type. For example, the
temperature, pressure, pollutant concentration, or volume of the gas stream to be controlled, may differ so
significantly from previous applications that it is uncertain the control device will work in the situation
currently undergoing review. Furthermore, CCS may be eliminated from a BACT analysis in Step 2 if the
three components working together are deemed technically infeasible for the proposed source, taking into
account the integration of the CCS components with the base facility and site-specific considerations
(e.g., space for CO2 capture equipment at an existing facility, right-of-ways to build a pipeline or access
to an existing pipeline, access to suitable geologic reservoirs for sequestration, or other storage options).
While CCS is a promising technology, EPA does not believe that at this time CCS will be a technically
feasible BACT option in certain cases.
As identified by the August 2010 Report of the Interagency Task Force on Carbon Capture and Storage
(co-chaired by US EPA and the US Department of Energy), while amine- or ammonia-based CO2 capture
technologies are commercially available, they have been implemented either in non-combustion
applications (i.e., separating CO2 from field natural gas) or on relatively small-scale combustion
applications (e.g., slip streams from power plants, with volumes on the order of what would correspond to
one megawatt). Scaling up these existing processes represents a significant technical challenge and
potential barrier to widespread commercial deployment in the near term. It is unclear how transferable the
experience with natural gas processing is to separation of power plant flue gases, given the significant
differences in the chemical make-up of the two gas streams. In addition, integration of these technologies
with the power cycle at generating plants present significant cost and operating issues that will need to be
addressed to facility widespread, cost-effective deployment of CO2 capture. Current technologies could be

58
used to capture CO2 from new and existing fossil energy power plants; however, they are not ready for
widespread implementation primarily because they have not been demonstrated at the scale necessary to
establish confidence for power plant applications.
Regarding pipeline transport for CCS, there is no nearby existing CO2 pipeline infrastructure (see
Figure 1-1); the nearest CO2 pipelines to Massachusetts are in northern Michigan and southern
Mississippi. With regard to storage for CCS, the Interagency Task Force concluded that while there is
currently estimated to be a large volume of potential storage sites, “to enable widespread, safe, and
effective CCS, CO2 storage should continue to be field-demonstrated for a variety of geologic reservoir
classes” and that “scale-up from a limited number of demonstration projects to widescale commercial
deployment may necessitate the consideration of basin-scale factors (e.g., brine displacement, overlap of
pressure fronts, spatial variation in depositional environments, etc.)”.
Based on the abovementioned EPA guidance regarding technical feasibility and the conclusions of the
Interagency Task Force for the CO2 capture component alone (let alone a detailed evaluation of the
technical feasibility of right-of-ways to build a pipeline or of storage sites), CCS has been determined to
not be technically feasible.
Step 3: Ranking of Technically Feasible GHG Control Options by Effectiveness
Based on the results of Step 2, the only option being carried further into the analysis is the evaluation
energy efficiency and heat rate. The Project is already using the lowest carbon fuel and carbon capture
and storage is not currently feasible.
Step 4: Evaluation of Energy Efficiency and Heat Rate
Improvements to energy efficiency and “heat rate” are important GHG control measures that can be
employed to mitigate GHG emissions. Heat rate indicates how efficiently power is generated by
combustion of a given amount of fuel. Heat rate is normally expressed in units of British thermal units
(Btu) combusted per net kilowatt-hour (kw-hr) of energy produced. A higher value of “heat rate”
indicates more fuel (i.e., Btu) is needed to produce a given amount of energy (lower or less favorable
efficiency), while a lower value of heat rate indicates less fuel (i.e., Btu) is needed to produce a given
amount of energy (higher or more favorable efficiency).
The Proposed Project is using advanced combustion turbine combined cycle technology, which is
recognized as the most efficient commercially available technology for producing electric power from
fossil fuels. Improvements to the heat rate typically will not change the amount of fuel combusted for a
given combustion turbine installation, but it will allow more power to be produced from a given amount
of fuel (i.e., improve the heat rate) so that more GHG emissions will be displaced from existing sources.
Key factors addressed in the evaluation of energy efficiency and heat rate are the core efficiency of the
selected turbines and the significant factors affecting overall net heat rate in combined cycle operating
mode.

59
Figure 1-1. CO2 Pipelines in the United States
From: “Report of the Interagency Task Force on Carbon Capture and Storage,” August 2010, Appendix B.
The design basis of the proposed project is to install approximately 630 MW of electric, generation which
is equivalent to two “F” Class turbines in combined cycle configuration. “G” class turbines are slightly
more efficient and thus have a lower heat rate; however, “G” class turbines generate approximately 380 to
400 MW per turbine (or 760 to 800 MW for two turbines). In addition, “G” class turbines generally have
a higher low operating limit (the lowest MW output at which the facility can operate in compliance with
its permits) than the proposed “F” class turbines. Although “G” class turbines are slightly more energy
efficient that the proposed “F” Class turbines, “G” Class turbines would alter the scope of the project due
to their size. The “F” Class design size provides the compatible size match to the existing high voltage
switchyard and electrical interconnection infrastructure associated with the exiting Salem Harbor
Generating Station site. The “F” class design also provides greater operational flexibility and therefore
lower overall emissions. The expected heat rate or efficiency differential between “F” and “G” combined
cycles, comparably configured and equipped is less than 1 percent at ISO conditions, in unfired mode,
when both plants are comparably equipped for quick start-up. When site specific conditions are accounted
for, this apparent efficiency difference between “F” and “G” class machines is further reduced by the
higher parasitic power consumption of the fuel gas compressors for the “G” machines, which require
higher natural gas supply pressures compared to “F” class. For these reasons, “G” class machines have
been eliminated from consideration for the Proposed Project.

60
The advanced generation of “F” class machines have upgraded performance with increased MW output
and improved heat rate compared to prior designs. These machines also represent the current state-of-the-
art for the evolving “F” class technology that is now been in operation for greater than 20 years with
thousands of machines in operation. This provides a conservative and predictable basis to formulate
financial plans and to project future reliability and costs. The steam cycle portion of the plant (HRSG,
piping, & steam turbine generator) as designed with two smaller units in the “1 on 1” configuration will
exhibit superior operational flexibility, ability to deal with rapid thermal transients and exhibit acceptable
and foreseeable long term O&M cost impacts.
With regard to energy efficiency considerations in combined cycle combustion turbine facilities, the
activity with the greatest effect on overall efficiency is the method of condenser cooling. As with all
steam-based electric generation, combined cycle plants can use either dry cooling or wet cooling for
condenser cooling. Dry cooling uses large fans to condense steam directly inside a series of piping,
similar in concept to the radiator of a car. Wet cooling can either be closed cycle evaporative cooling
(using cooling towers), or “once-through” cooling using sea water.
Total fuel heat input to the combined cycle combustion turbine (fuel burned in the combustion turbines
and in the HRSG duct burners) and thus total steam flow available to the steam turbine, is fixed. The
efficiency of conversion of the fixed steam flow to electrical output of the steam turbine generator is then
primarily a function of the backpressure at which the low pressure turbine exhausts. A wet cooling system
consisting either of a mechanical draft cooling tower with circulating water pumps and a shell and tube
condenser, or a once-through system directly circulating sea water to the condenser, are capable of
providing significantly lower condensing pressures compared to an all dry ACC system. Wet cooling
performance is superior for efficiency purposes because of the basic thermodynamics of cooling, which
allows either the cooling tower or once through system to produce colder water compared to dry cooling.
As a result, operation of a dry cooling system requires approximately 1-5% more energy than a wet
cooling system depending on ambient conditions (difference between wet and ACC systems gets smaller
with lower ambient temperatures).
However, there are significant drawbacks to either a once-through system or wet mechanical draft cooling
tower system. Once-through cooling involves use of large quantities of sea water that is returned to the
ocean at a higher temperature. The impingement and entrainment associated with intake of the necessary
large quantities of sea water, and the thermal impacts of discharges of once-through cooling, have been
recognized to have negative environmental impacts and once-through cooling has therefore been
eliminated from consideration.
Wet mechanical draft cooling towers also require a significant quantity of water, most of which is lost to
evaporation to the atmosphere. Seawater can potentially be used for makeup to a wet evaporative system,
but this is is a very challenging application. The most likely candidate source for the volumes of cooling
tower makeup water required would be the SESD sewage treatment plant. It is technically feasible to use
effluent from a public sewerage treatment facility as make-up to a wet, evaporative cooling system.
However the presence of typical chemical constituents in the effluent and the likely highly variable
concentrations of certain of these constituents would place a burden on the Project. The effluent
transferred from SESD would require further treatment to make it suitable and safe to use in the cooling
system. Even after further treatment the concentrations of certain dissolved minerals in the circulating
water would impact the design; most likely require a high degree of cooling tower blowdown to maintain
acceptable chemistry and requiring the upgrade of the metallurgy of the piping, condenser tube, pumps
and other components that would be exposed to the more corrosive action of the treated and concentrate
effluent.

61
An additional burden imposed of wet, evaporative cooling is dealing with the creation of visible fog
plume, which discharges from the cooling tower fans. With the typical New England, coastal site weather
conditions, a standard mechanical draft cooling tower would produce a very visible and persistent plume
for many hours of the year. It is possible to use a so-called “plume abated” mechanical draft tower. But
this feature can double the cost of the cooling tower and increase the total fan power consumption and
pumping head on the system. Basically the “plume abatement” feature works by using heat from the hot
condenser discharge water to preheat additional ambient air admitted above the normal cooling tower wet,
evaporative heat exchange zone. This hotter air has a lower relative humidity; such that as it mixes with
the wet, almost saturated air discharged from the evaporative cooling surface, the combined air mixture
reaches a moisture content below the saturation point. As this hotter, dryer air mixture is discharged by
the tower fans it can then mix with the cool, damp ambient air without crossing the saturation line and
producing small water droplets which form the visible plume.
The bottom line is that a wet, evaporative mechanical draft cooling tower with plume abatement features
has a doubled capital cost, higher fan power consumption and higher pumping head than a standard
cooling tower. These latter two factors greatly reduce any potential benefit from reduced parasitic load
from the wet cooling system.
Therefore, Footprint has determined that the marginal heat rate improvement that could be achieved with
a plume abated mechanical draft tower does not outweigh the drawback of the technical issue associated
with use of the SESD sewage effluent, as well as the fact that a visible plume will still be present at times
with a plume abated tower. The use of dry cooling has therefore been selected over either wet cooling
option.
The Administration Building has been designed to meet the U.S. Green Building Council’s Leadership in
Energy and Environmental Design (LEED) at the Platinum level. The Administration Building, as well
as the Operations Building, among various energy conservation features, incorporate green roofs,
geothermal heat pumps for heating and cooling, building energy management systems, and a 10%
reduction in lighting power density.
Step 5: Select BACT
The Project has proposed GHG limits as follows for the combined cycle units:
Initial test limit of 825 lb CO2e/MWhr (net to grid), full load, ISO corrected, without duct firing
Rolling 365-day GHG BACT limit (life of facility) of 895 lb CO2e/MWhr (net to grid)
For purposes of comparison, the initial test GHG limit of 825 lb CO2e/MWhr (net to grid) corresponds to
a “heat rate” of 6,940 Btu HHV/kWhr (net). On a “gross” energy basis, these values are 795 lb
CO2e/MWhr (gross) and 6,688 Btu HHV/kWhr (gross). The rolling 365-day GHG BACT limit of 895 lb
CO2e/MWhr (net to grid) corresponds to a “heat rate” of 7,521 Btu HHV/kWhr (net). On a “gross”
energy basis, these values are 862 lb CO2e/MWhr (gross) and 7,247 Btu HHV/kWhr (gross).
Note that “gross” energy is based on the full electric energy output of the generation equipment, without
consideration of internal plant loads (parasitic losses such as for pumps and fans). Net energy is based on
the amount of electric energy after internal plant demand is satisfied, and reflects the amount of energy
actually sold to the electric grid.
For purposes of comparison with other projects, Footprint’s design thermal efficiency is 57.9%. This is
based on ISO full load operation, without duct firing or evaporative cooling, without any degradation
allowance, and reflects gross energy output fuel energy input based on LHV. This is the most typical way
62
that thermal efficiency is reported. This is not as meaningful for purposes of GHG BACT limits compared
to measures based on net power production, since those based on net power account for the project
internal energy consumption. Footprint considers the proposed rolling 12-month CO2e limit for the life of
the project as the most meaningful limit since it reflects actual long-term emissions, and actual power
delivered to the grid.
Pursuant to supporting these proposed limits consistent with the “top-down” procedure, Footprint has
compiled PSD BACT determinations for GHG in the last five years for new large (> 100 MW)
combustion turbine combined cycle projects. This compilation is based on all entries during this time
period listed in the USEPA RBLC (RACT/BACT/LAER Clearinghouse). Several recent projects not
included in RBLC have also been included in this compilation. This review confirms that the only BACT
technology identified for large natural gas fired combined cycle turbines is use of low carbon fuel (i.e.,
natural gas) in high efficiency combined cycle units. There are no cases where any post combustion
controls (carbon capture and sequestration) have been used to control GHG emissions from large natural
gas fired combined cycle turbines.
Table 1-3 presents the results of RBLC compilation for GHG. GHG BACT emissions are expressed in
varying units, including mass emission (tons or pounds per unit time), lb CO2e per MWhr, and/or “heat
rate” (Btu/kWhr). The energy-based limits are expressed as either “gross” or “net”. Energy units (MWhr
or kWhr) or more meaningful than mass emission limits since they relate directly to the efficiency of the
equipment, which is a key available BACT technology (in addition to low carbon fuel). The mass
emissions are specific to the fuel firing rate of a given project and the carbon content of the fuel, but do
not incorporates the project efficiency.
Table 1-3 lists 15 projects with PSD BACT limits for GHG approved in the last 5 years which have
energy based GHG limits. (The mass limit projects are not considered since they are not meaningful for
GHG BACT comparison). Accounting for the different units for these limits, the Footprint Project
proposed GHG limits are clearly more stringent than most of the energy based limits in Table 1-3. For
limits where this comparison is not clear, the following clarifications are made:
The basis for Oregon (OH) Clean Energy project limits (840 and 833 lb/MWhr gross) is not clear,
but the context of this actual permit suggests these limits are intended for ISO conditions without
duct firing which makes them less stringent than the Footprint limits.
The Brunswick County limit of 7,500 Btu/kWhr net at full load with duct firing does not directly
correspond to either of the Footprint conditions. However, Footprint’s limit of 895 lb
CO2e/MWhr corresponds to a rolling 365-day value of 7,521 Btu/kWhr net which accounts for all
operation on an annual basis including starts, stops, and part load in addition to duct firing.
The Palmdale project limits of 774 lb/MWhr and 7,319 Btu/kWhr (source wide net 365 day
average limits) are more stringent than the Footprint limits. However, the Palmdale project is a

63
Table 1-3. Summary Of Recent GHG PSD BACT Determinations for Large (>100MW) Gas Fired Combined-Cycle Generating Plants
Facility Location Permit Date Turbine
1
Emission Limits2
Greenhouse Gas (GHG) as CO2e unless otherwise noted
Carroll County Energy
Washington Twp., OH
11/5/2013 2 GE 7FA 2045 MMBtu/hr/unit plus 566 MMBtu/hr DF
859 lb/MWhr gross at ISO conditions without duct firing
Renaissance Power
Carson City, MI 11/1/2013 4 Siemens 501 FD2 units 2147 MMBtu/hr/unit each with 660 MMBtu/hr DF
1000 lb/MWhr gross 12-month rolling average
Oregon Clean Energy
Oregon, OH 06/18/2013 2 Mitsubishi M501GAC or 2 Siemens SCC6-8000H 2932 MMBtu/hr/unit plus 300 MMBtu/hr DF
Mitsubishi: 840 lb/MWhr gross Siemens: 833 lb/MWhr gross
Green Energy Partners / Stonewall
Leesburg, VA 04/30/2013 2 GE 7FA.05 2230 MMBtu/hr/unit plus 650 MMBtu/hr DF or
2 Siemens SGT6-5000F5 2260 MMBtu/hr/unit plus 450 MMBtu/hr DF
Heat rate of 7,340 Btu HHV/kWhr gross without DF Heat rate of 7,780 HHV Btu/kWhr gross with DF
Hickory Run Energy LLC
New Beaver Twp., PA
04/23/2013 GE7FA, Siemens SGT6-5000F, Mitsubishi M501G, or Siemens SGT6-8000H.
2 combined cycle units
3,665,974 tpy both units Emissions based on Siemens SGT6-8000H
Sunbury Generation
Sunbury, PA 04/01/2013 “F Class” with DF 2538 MMBtu/hr/unit
281,727 lb/hr without DF 298,106 lb/hr with DF
Brunswick County Power
Freeman, VA 03/12/2013 3 Mitsubishi M501 GAC with DF Combined GT and DF 3442 MMBtu/hr/unit
Heat rate of 7,500 Btu(HHV)/kWhr net; tested at full load and corrected to ISO conditions with DF
Garrison Energy Center
Dover, DE 01/30/2013 GE 7FA with DF 309 MW
Heat rate of 7,717 Btu HHV/kWhr net 12-month rolling average
St. Joseph Energy center
New Carlisle, IN 12/03/2012 4 - “F Class” (GE or Siemens) 1345 MW total
Heat rate of 7,646 Btu/kWhr. Further detail not specified
Hess Newark Energy
Newark, NJ 11/01/2012 2 - GE 7FA.05 2320 MMBtu/hr/unit plus 211 MMBtu/hr DF
887 lb/MWhr gross 12-month rolling average Heat rate of 7,522 Btu(HHV)/kWhr; net basis at full load
and corrected to ISO conditions without DF
Channel Energy Center, LLC
Houston, TX 10/15/2012 2 - Siemens 501F 180 MW plus
425 MMBtu/hr DF
920 lb/MWhr net
Moxie Liberty LLC Asylum Twp., PA
10/10/2012 Equipment type not specified 2 – 468 or less MW combined cycle blocks
GT < 2890 MMBtu/hr/unit DF < 3870 MMBtu/hr/unit
1,388,540 tpy for 454 MW block 1,480,086 tpy for 468 MW block
Cricket Valley Dover, NY 09/27/2012 3 - GE 7FA.05
2061 MMBtu/hr/unit plus 379 MMBtu/hr DF
Heat rate of 7,605 Btu HHV/kWhr ISO without DF 57.4% design thermal efficiency
3,576,943 tpy all 3 units
Deer Park Energy Center LLC
Deer Park, TX 09/26/2012 1 - Siemens 501F 180 MW plus
725 MMBtu/hr DF
920 lb/MWhr net

64
Table 1-3. Summary Of Recent GHG PSD BACT Determinations for Large (>100MW) Gas Fired Combined-Cycle Generating Plants
Facility Location Permit Date Turbine
1
Emission Limits2
Greenhouse Gas (GHG) as CO2e unless otherwise noted
Pioneer Valley Energy Center (PVEC)
Westfield, MA 04/05/2012 1 Mitsubishi M501GAC 2542 MMBtu/hr/unit; no DF
825 lb/MWhr net (initial full load test corrected to ISO conditions)
895 lb/MWhr net (rolling 365-day average)
Palmdale Hybrid Power
Palmdale, CA 10/18/2011 2 GE 7FA 154 MW (1736 MMBtu/hr) per unit plus
500 MMBtu/hr DF
774 lb/MWhr source wide net 365 day rolling average (CO2)
Heat rate: 7,319 Btu/kWhr source wide net 365 day rolling average
Thomas C. Ferguson Power
Llano, TX 09/01/2011 2 - GE 7FA 195 MW per unit
No DF
908,957.6 lb/hr 30-day rolling average
Brockton Power Brockton MA 07/20/2011 (MA Plan Approval)
1 Siemens SGT6-PAC-5000F 2227 MMBtu/hr plus 641 MMBtu/hr DF
870 lb CO2e/MWhr monthly average 842 lb/MWhr rolling 12-month average
1,094,900 tpy
Russell City Energy Center
Hayward, CA 02/03/2010 2 - Siemens 501F 2238.6 MMBtu/hr/unit plus
200 MMBtu/hr DF
Heat rate of 7,730 Btu HHV/kWhr 242 metric tons of CO2e/hr/both units
5,802 metric tons of CO2e/day/both units 1,928,102 metric tons of CO2e/year/both units
119 lb CO2e/MMBtu
____________ 1 DF refers to duct firing
2 Limits obtained from agency permitting documents when not available in RBLC
65
hybrid solar/gas turbine project, and the Palmdale GHG limits appear to account for the solar
energy production component. The Footprint Project’s available land and Massachusetts climate
restrictions preclude a solar component which could achieve the Palmdale limits.
The Brockton (MA) Project was approved for a rolling 12-month CO2 limit of 842 lb/MWhr, and
a monthly maximum of 870 lb/MWhr. The basis for the 842 lb/MWhr limit in the Massachusetts
Plan Application for the Brockton Project is stated to include operation at a variety of loads,
ambient temperatures, with and without evaporative cooling, and with and without duct firing,
and including starts and stops (Brockton Power Plan Application at page 4-30). However, there is
no mention of any allowance for heat rate (efficiency) degradation over the life of the project or
between major turbine overhauls. This is a significant consideration which renders this value of
842 lb CO2/MWhr as inappropriate as a GHG BACT precedent. Footprint notes that the Brockton
Project has not been constructed, and the 842 lb/MWhr value therefore has not been demonstrated
in practice. In addition, the Footprint notes that the Brockton Project did not specifically undergo
a PSD review for GHG BACT. Footprint also notes that in the Plan Application for the Brockton
Project, it is stated that the 842 lb/MWhr value is based on a CO2 emission factor of 117
lb/MMBtu. Footprint notes its proposed limit of 895 lb/net MWhr is based on a CO2e emission
factor of 119 lb/MMBtu. Adjusting the Brockton value of 842 lb/MWhr by 119/117, the
Brockton rate (based on 119 lb CO2/MMBtu) would be 856 lb/MWhr. In this case, the Footprint
Project value (895 lb/MWhr) is only 4.6% higher than the adjusted Brockton value (856
lb/MWhr). In addition, the Brockton Project design is based on wet cooling, while the Footprint
Project will use dry cooling. Projects using dry cooling have higher heat rates (are less efficient)
than wet cooled projects, particularly during the summer months. Reasonable allowance for heat
rate (efficiency) degradation over the life of the project and between major turbine overhauls, as
well as the impact of wet vs. dry cooling, explains the proposed GHG BACT for the SHR Project
of 895 lb/net MWhr compared to the proposed Brockton limit.
CLF comments dated November 1, 2013 on the Footprint public review documents indicate that the
Newark Energy Center has a combined cycle mode heat rate limit of 6005 Btu/kWhr, corresponding to a
thermal efficiency of 58.4%. The CLF comments further note that the Russell Energy Center Project in
CA has proposed to achieve a thermal efficiency of 56.4%, and the Cricket Valley Project (NY) proposed
to achieve 57.4% efficiency. These values are taken from a letter written by Steve Riva dated April 17,
2012.
The Newark Energy Center quoted values of 6005 Btu/kWhr and 58.4% thermal efficiency appear to be
preliminary values, since they do not match the actual New Jersey PSD Permit as discussed below. When
comparing heat rate and efficiency values, these may be quoted with varying assumptions, and it is
important to ensure an “apples to apples” comparison is made. The heat rate used to calculate thermal
efficiency is typically specified based on full load ISO operation, no duct firing, gross output, and on an
LHV basis. That is why it is commonly a lower value than “real world” rolling 12-month, net, HHV
values. These two values (6005 Btu/kWhr and 58.4% thermal efficiency) are actually not consistent with
each other, since thermal efficiency is calculated as 3412 Btu/kW-hr/6005 Btu/kW-hr = 56.8% thermal
efficiency. In any event, the “real” numbers for the Newark Energy Center GHG BACT limits in Table 1-
3 are taken from the actual New Jersey PSD permit dated November 1, 2012, so these represent more
recent information for the Newark Energy Center Project. The actual Newark Energy Center permit has
net “heat” rate limit (without duct firing at base load corrected to ISO conditions) of 7,522 Btu/kWhr
based on the Higher Heating Value (HHV) of the fuel. As indicated above, the Footprint Project has a
nearly numerically identical rolling 365-day GHG limit which corresponds to a net heat rate of 7,521
Btu/kWhr, but that reflects all annual operation and not just base load without duct firing. The Newark
Energy Center also has a direct GHG limit of 887 lb/MWhr, gross basis, rolling 12-month average. The

66
Footprint rolling 365-day GHG limit of 895 lb/MWhr net basis is clearly more stringent than the actual
Newark Energy Center GHG limit.
The Russell Energy Center PSD Permit has a heat rate limit of 7,730 Btu/kW-hr, with the key
assumptions for calculating compliance not specified. In any event, this limit is clearly less stringent than
Footprint’s rolling 365-day GHG limit which corresponds to a net heat rate of 7,521 Btu/kWhr.
Footprint’s design thermal efficiency of 57.9% is also better than the quoted Russell proposal of 56.4%
(not referenced in the Russell’s actual PSD permit).
Cricket Valley’s PSD permit does contain the quoted 57.4% thermal efficiency, and well as a heat rate
limit of 7,605 Btu/kW-hr. The Cricket Valley PSD permit indicates this heat rate is at ISO conditions,
HHV without duct firing. Gross or net electric output is not specified. As with Russell, this limit is clearly
less stringent than Footprint’s rolling 365-day GHG limit which corresponds to a net heat rate of 7,521
Btu/kWhr. Footprint’s design thermal efficiency of 57.9% is also better than the Cricket Valley value
57.4%.
CLF suggests that the GHG limits should also be expressed on a thermal efficiency basis. As stated
above, thermal efficiencies for gas turbines are normally based on the lower heating value (LHV) of the
fuel, on a gross energy basis. The only PSD Permit we identified containing a thermal efficiency value is
the Cricket Valley PSD permit. As MassDEP has done, Footprint concurs it is more appropriate to
propose GHG limits directly as CO2e on a net energy basis, accounting for actual emissions of GHG and
overall project efficiency including parasitic plant loads.
In summary, the available evidence clearly indicates that PSD BACT for GHG for combustion turbines is
use of low carbon fuel (e.g., natural gas) in high efficiency combustion combined cycle turbines.
Footprint’s proposed GHG limits are as or more stringent than any PSD BACT determinations, except for
a hybrid solar facility, and the Brockton Power Project, which has a rolling 12-month limit which does
not properly account for degradation over the life of the equipment. It is concluded that Footprint’s
proposed GHG limits represent PSD BACT.
1.1.6 Combustion Turbine Startup and Shutdown BACT
This section supplements the PSD BACT analysis for the combustion turbine startup and shutdown
(SUSD) limits. Combustion turbine combined cycle units require warm up time to achieve proper
operation of the dry-low NOx combustors discussed above, and also to achieve system warm-up to allow
proper function of the SCR catalysts. Combustion turbine combined cycle units require higher mass
emission limits during SUSD operations for NOx, CO and VOC. Since CO and VOC are not subject to
PSD review, this SUSD BACT assessment only addresses NOx. The other pollutants subject to PSD
review are PM/PM10/PM2.5, H2SO4, and GHG, as these pollutants have lower mass emissions than for
normal operation and thus are not included in this PSD SUSD BACT evaluation. GHG also has the
rolling 12-month limit (lb/MWhr) encompassing all operation including SUSD.
This evaluation does not identify and discuss each of the five individual steps of the “top-down” BACT
process, since the only available control for SUSD are procedures to warm up the systems and begin
operation of the temperature-dependent emission control systems as quickly as practical, consistent with
all system constraints. The Project incorporates new “quick start” technology which minimizes SUSD
emissions significantly compared to prior startup procedures in widespread use. Table 1-4 presents the
proposed NOx SUSD BACT limits for the Project:

67
Table 1-4. Combustion Turbine NOx SUSD PSD BACT Limits
Pollutant Startup (lb/event) Shutdown (lb/event)
NOx 89 10
In addition to these limits, the Project has a limit for startup duration of < 45 minutes and for shutdown
duration of < 27 minutes. Also, the project is required to begin SCR operation (inject ammonia) as soon
as the systems attain the minimum temperatures as specified by the control equipment system vendors,
and other system parameters are satisfied for SCR operation.
As part of the review of these proposed NOx SUSD BACT limits under the “top-down” procedure,
Footprint has compiled all the NOx SUSD PSD BACT determinations in the last five years for new gas-
fired large (> 100 MW) combustion turbine combined cycle projects. This compilation is presented in
Table 1-5. This compilation is based on the USEPA RBLC (RACT/BACT/LAER Clearinghouse).
Several recent projects not included in RBLC have also been included in this compilation. This review
confirms that the only SUSD NOx BACT technologies identified are procedures to warm up the systems
and begin operation of the SCR as quickly as practical consistent with other constraints. Table 1-5
contains 28 new large (> 100 MW) combustion turbine combined cycle projects with NOx SUSD PSD
BACT determinations. These limits are generally expressed as either lb/hr or lb/event. Some units do not
have numerical SUSD limits for NOx, but only requirements to minimize SUSD emissions.
For purposes of comparing the Project limits to determinations only expressed in lb/hr, Footprint’s worst
case lb/hr is calculated as 45 minutes for a cold start (at 89 pounds) plus 15 minutes at full load
(18.1 lb/hr)/4 = 93.5 lb/hr. Also, while the Project’s proposed NOx SUSD limits for a start are only for a
worst-case cold start, for comparison purposes the Project’s values for a warm and hot start, as provided
in the August 6, 2013 Application Supplement, are 54 and 28 pounds, respectively.
All the NOx SUSD BACT limits in Table 1-5 are less stringent than the Footprint limits, except for the
warm start limits at two CA projects (Palmdale and Victorville), and startup/shutdown limits for the
Brockton MA Project. Palmdale and Victorville each have the same limit for a warm and hot start of 40
lbs/event, while the Footprint values are 54 lbs for a warm start and 28 lbs for a hot start. It is logical that
a warm start would have higher emissions than a hot start, and the average of the two Footprint values (54
lbs and 28 lbs) is 41 lbs/event, effectively identical to the Palmdale and Victorville value.
The Brockton project is based on a “quick start” Siemens SGT6-PAC-5000F combined cycle installation,
and has approved SUSD limits of 31.6 lb/hr (startup) and 29.8 lb/hr (shutdown). The startup time is stated
as 0.47 hours and the shutdown time is 0.40 hours. Thus, the lb/event values are calculated as 14.9 pounds
for a start and 11.9 pounds for a shutdown. Footprint did consider a very similar Siemens turbine
subsequent to the approval data of the Brockton permit, and this more recent data for the same basic
“quick start” Siemens machine (5000F) now has 83 lbs NOx over 45 minutes. For a combined cold start
and shutdown, Footprint now has (89 +10 = 99) lbs NOx while the Siemens data provided to Footprint
reflects (83 + 20 = 103) lbs NOx. GE has lower NOx emissions for both the warm and hot start. So, based
on the latest information, there is no advantage to selecting Siemens over GE for NOx startup/shutdown
emissions based on more recent data.

68
Table 1-5. Summary Of Recent NOx SUSD BACT Determinations for Large (>100MW) Gas Fired Combined-Cycle Generating Plants
Facility Location Permit Date Turbine
1
Emission Limits2
SUSD NOx (values are for a single unit at multiple unit facilities)
Carroll County Energy
Washington Twp., OH
11/5/2013 2 GE 7FA 2045 MMBtu/hr/unit plus 566 MMBtu/hr
DF
Cold Start: 476 lbs/event Warm Start: 290 lbs/event
Hot Start: 160 lbs/event Shutdown: 77 lbs/event
Values calculated from approved lb/hr and event durations
Renaissance Power
Carson City, MI 11/1/2013 4 Siemens 501 FD2 units 2147 MMBtu/hr/unit each with 660
MMBtu/hr DF
176.9 lb/hr SU and 147.3 lb/hr SD
Langley Gulch Power
Payette, ID 08/14/2013 1 - Siemens SGT6-5000F 2134 MMBtu/hr/unit with 241.28
MMBtu/hr DF
96 ppm; 3 hr rolling average (for the amount of fuel firing during SUSD for a GE 7FA, 96 ppm corresponds to approximately 450 lbs over a 45 minute
quick start)
Oregon Clean Energy
Oregon, OH 06/18/2013 2 Mitsubishi M501GAC or 2 Siemens SCC6-8000H
2932 MMBtu/hr/unit plus 300 MMBtu/hr DF
Mitsubishi: Cold Start: 108.9 lbs/event Warm Start: 86 lbs/event Hot Start: 47.2 lbs/event Shutdown: 35 lbs/event
Siemens: – Cold Start: 188 lbs/event Warm Start: 126 lbs/event
Hot Start: 108 lbs/event Shutdown: 46 lbs/event
Values calculated from approved lb/hr and event durations
Green Energy Partners / Stonewall
Leesburg, VA 04/30/2013 2 GE 7FA.05 2230 MMBtu/hr/unit plus 650 MMBtu/hr
DF or 2 Siemens SGT6-5000F5
2260 MMBtu/hr/unit plus 450 MMBtu/hr DF
Minimize emissions, No numeric limits
Brunswick County Power
Freeman, VA 03/12/2013 3 Mitsubishi M501 GAC with DF Combined GT and DF 3442 MMBtu/hr/unit
Minimize emissions, No numeric limits
Garrison Energy Center
Dover, DE 01/30/2013 GE 7FA 309 MW
Cold Start/: 500 lbs/event Warm/Hot Start/: 200 lbs/event
Shutdown: 23 lbs/event
St. Joseph Energy Center
New Carlisle, IN 12/03/2012 4 - “F Class” (GE or Siemens) 1345 MW total
443 lb/event
Hess Newark Energy Center
Newark, NJ 11/01/2012 2 - GE 7FA.05 2320 MMBtu/hr/unit plus 211 MMBtu/hr
DF
Cold Start: 140.6 lbs/event Warm Start: 96.8 lbs/event Hot Start: 95.2 lbs/event Shutdown: 25 lbs/event

69
Table 1-5. Summary Of Recent NOx SUSD BACT Determinations for Large (>100MW) Gas Fired Combined-Cycle Generating Plants
Facility Location Permit Date Turbine
1
Emission Limits2
SUSD NOx (values are for a single unit at multiple unit facilities)
Channel Energy Center, LLC
Houston, TX 10/15/2012 2 - Siemens 501F 180 MW plus
425 MMBtu/hr DF
350 lb/hr
Moxie Liberty LLC Asylum Twp., PA
10/10/2012 Siemens “H Class” 2 – 468 or less MW combined cycle
blocks GT < 2890 MMBtu/hr/unit DF < 3870 MMBtu/hr/unit
No SUSD listed in RBLC
Deer Park Energy Center LLC
Deer Park, TX 09/26/2012 1 - Siemens 501F 180 MW plus
725 MMBtu/hr DF
350 lb/hr
ES Joslin Power Calhoun, TX 09/12/2012 3 - GE 7FA 195 MW per unit
No DF
99.9 lb/hr
Pioneer Valley Energy Center (PVEC)
Westfield, MA 04/05/2012 1 Mitsubishi M501GAC 2542 MMBtu/hr/unit; no DF
62 lb/hr (310 lbs/event for cold start) (124 lbs/event for warm start (62 lbs/event for shutdown)
Palmdale Hybrid Power
Palmdale, CA 10/18/2011 2 GE 7FA 154 MW (1736 MMBtu/hr) per unit plus
500 MMBtu/hr DF
Cold Start: 96 lbs/event Warm/Hot Start: 40 lbs/event
Shutdown: 57 lbs/event
Thomas C. Ferguson Power
Llano, TX 09/01/2011 2 - GE 7FA 195 MW per unit
No DF
111.56 lb/hr
Entergy Ninemile Point Unit 6
Westwego, LA 08/16/2011 Vendor not specified Single unit 550MW
No SUSD in RBLC
Brockton Power Brockton MA 07/20/2011 (MA Plan Approval)
1 Siemens SGT6-PAC-5000F 2227 MMBtu/hr plus 641 MMBtu/hr DF
Start: 31.6 lb/hr Shutdown: 29.8 lb/hr
Avenal Power Center
Avenal, CA 05/27/2011 2 - GE 7FA 1856.3 MMBtu/hr/unit plus 562.26
MMBtu/hr DF
Each unit: 160 lb/hr Both units: 240 lb/hr
Portland Gen. Electric Carty Plant
Morrow, OR 12/29/2010 1 - Mitsubishi M501GAC 2866 MMBtu/hr
150 lb/hr; 3-hr rolling average
Dominion Warren County
Front Royal, VA 12/21/2010 3 -Mitsubishi M501 GAC 2996 MMBtu/hr/unit plus 500 MMBtu/hr
DF
Minimize emissions, No numeric limits
Pondera/King Power Station
Houston, TX 08/05/2010 4 GE 7FA.05 2430 MMBtu/hr/unit GT plus DF or
4 Siemens SGT6-5000F5 2693 MMBtu/hr/unit GT plus DF
GE: 216 lb/hr/unit Siemens: 220 lb/hr/unit
Live Oaks Power Sterling, GA 03/30/2010 Siemens SGT6-5000F Minimize emissions, No numeric limits

70
Table 1-5. Summary Of Recent NOx SUSD BACT Determinations for Large (>100MW) Gas Fired Combined-Cycle Generating Plants
Facility Location Permit Date Turbine
1
Emission Limits2
SUSD NOx (values are for a single unit at multiple unit facilities)
Victorville 2 Hybrid Victorville, CA 03/11/2010 2 GE 7FA 154 MW per unit plus 424.3 MMBtu/hr DF
Cold Start: 96 lbs/event Warm/Hot Start: 40 lbs/event
Shutdown: 57 lbs/event
Stark Power/Wolf Hollow
Granbury, TX 03/03/2010 2 GE 7FA 170 MW/unit plus
570 MMBtu/hr DF or 2 Mitsubishi M501G
254 MW/unit plus 230 MMBtu/hr DF
GE: 420 lb/hr/unit Mitsubishi: 239 lb/hr/unit
Russell City Energy Center
Hayward, CA 02/03/2010 2 - Siemens 501F 2238.6 MMBtu/hr/unit plus
200 MMBtu/hr DF
Cold Start: 480 lbs/event/unit Warm Start: 125 lbs/event/unit
Hot Start: 95 lbs/event/unit Shutdown: 40 lbs/event/unit
Panda Sherman Power
Grayson, TX 02/03/2010 2 GE 7FA or 2 Siemens SGT6-5000F
with 468 MMBtu/hr/unit DF
GE: 242 lb/hr/unit Mitsubishi: 148.5 lb/hr/unit
Lamar Power Partners II LLC
Paris, TX 06/22/2009 4 - GE 7FA with 200 MMBtu/hr DF No SUSD limits in RBLC or TX permit
Pattillo Branch Power LLC
Savoy, TX 06/17/2009 4 – GE 7FA, GE7FB, or Siemens SGT6-5000F
With DF
650 lb/hr/unit (each option)
Entergy Lewis Creek Plant
The Woodlands, TX
05/19/2009 2 - GE 7FA with 362 MMBtu/hr DF 200 lb/hr
1 DF refers to duct firing:
2 Short-term limits only. Limits obtained from agency permitting documents when not available in RBLC.

71
PVEC does have a somewhat more stringent NOx SUSD BACT limit on an hourly basis (62.0 lbs per
hour) compared to the equivalent Footprint lb/hr value of 93.5 lbs/hr. However, PVEC has longer startup
and shutdown times, with up to 5 hours for a cold start, 2 hours for a warm start, and 1 hour for a
shutdown. On a pound per event basis, PVEC has greater SUSD emissions compared to Footprint.
Footprint will achieve the lowest practical emissions achievable for SUSD, and the proposed PSD permit
allows the MassDEP to reset the SUSD BACT limits if different values are demonstrated to be
achievable.
1.2 Auxiliary Boiler
This section supplements the PSD BACT analysis for the auxiliary boiler to address public comments
made on the draft permit documents. The Project is subject to PSD review for NOx, PM/PM10/PM2.5,
H2SO4, and GHG, and thus the auxiliary boiler is subject to PSD BACT for these pollutants.
The Project includes an 80 MMBtu/hr auxiliary boiler that will have natural gas as the only fuel of use.
Table 1-6 presents the proposed BACT limits for the auxiliary boiler for pollutants subject to PSD review.
Table 1-6. Auxiliary Boiler Proposed PSD BACT Limits
Pollutant Emission Limitation Control Technology
NOx 9 ppmvd at 3% O2
0.011 lbs/MMBtu Ultra Low NOx Burners (9 ppm) Good combustion practices Natural gas PM/PM10/PM2.5 0.005 lbs/MMBtu
H2SO4 0.0009 lbs/MMBtu Natural Gas
GHG as CO2e 119.0 lb/MMBtu Natural Gas
(Note: the H2SO4 value is revised to reflect the inclusion of a CO oxidation catalyst)
In order to inform the PSD BACT process, Footprint has compiled all the PSD BACT determinations in
the last five years for auxiliary boilers at new large (> 100 MW) combustion turbine combined cycle
projects. This compilation is based on the USEPA RBLC (RACT/BACT/LAER Clearinghouse). Several
recent projects not included in RBLC have also been included in this compilation. Table 1-7 provides this
compilation. Table 1-7 will be referred to in the individual pollutant discussion below.
1.2.1 Fuel Selection
Step 1: Identify Candidate Fuels
Natural gas
ULSD
Step 2: Eliminate Infeasible Technologies
Both these technologies are technically feasible.
Step 3: Rank Control Technologies by Control Effectiveness
Natural gas boilers can achieve lower emissions compared to ULSD.
Step 4: Evaluate Controls
Footprint has chosen the lowest emitting fuel for the auxiliary boiler, natural gas. Therefore, a detailed
evaluation of alternate fuels is not required.
Step 5: Select BACT Natural gas is proposed as the BACT fuel for the auxiliary boiler.

72
Table 1-7. Summary Of Recent PSD BACT Determinations for Natural Gas Auxiliary Boilers at Large (>100MW) Gas Fired Combined-Cycle Generating Plants for NOx, PM, H2SO4, GHG
Facility Location Permit Date
Auxiliary Boiler Size MMBtu/hr
Emission Limits1 (lb/MMBtu except where noted)
NOx PM/PM10/PM2.5 H2SO4 GHG
Carroll County Energy
Washington Twp., OH
11/5/2013 99 0.02 0.008 0.00022 26,259.76 tpy
Renaissance Power
Carson City, MI
11/1/2013 (2) - 40 0.035 0.005 -- 11,503.7 tpy (both units)
Oregon Clean Energy
Oregon, OH 06/18/2013 99 0.02 0.008 0.00011 11,671 tpy
Green Energy Partners / Stonewall
Leesburg, VA
04/30/2013 75 9 ppmvd at 3% O2 (= 0.011 lb/MMBtu)
Pipeline natural gas < 0.1 gr S/100scf
-- Pipeline natural gas
Hickory Run Energy LLC
New Beaver Twp., PA
04/23/2013 40 0.011 0.005 0.0005 13,696 tpy
Sunbury Generation
Sunbury, PA 04/01/2013 Not provided (repowered
unit)
0.036 0.008 -- --
Brunswick County Power
Freeman, VA
03/12/2013 66.7 9 ppmvd at 3% O2 (= 0.011 lb/MMBtu)
Pipeline natural gas < 0.4 gr S/100scf
Pipeline natural gas < 0.4 gr S/100scf
Pipeline natural gas
St. Joseph Energy Center
New Carlisle, IN
12/03/2012 (2) - 80 0.032 0.0075 -- 81,996 tpy; 80% efficiency
Hess Newark Energy Center
Newark, NJ 11/01/2012 66.2 0.66 lb/hr (based on 0.010
lb/MMBtu)
0.33 lb/hr (based on 0.005
lb/MMBtu)
0.006 lb/hr (=0.0001 lb/MMBtu at
full load)
7,788 lb/hr
Channel Energy Center, LLC
Houston, TX 10/15/2012 (3) - 430 21.6 lb/hr/unit (=0.05 lb/MMBtu at full
load)
7.8 lb/hr/unit (=0.018 lb/MMBtu at full
load)
1.0 lb/hr/unit (=0.002 lb/MMBtu at full
load)
--
Cricket Valley Dover, NY 09/27/2012 60 0.011 0.005 -- --
Pioneer Valley Energy Center (PVEC)
Westfield, MA
04/05/2012 21 0.029 0.0048 0.0005 --
Palmdale Hybrid Power
Palmdale, CA
10/18/2011 110 9 ppmvd at 3% O2 (= 0.011 lb/MMBtu)
0.33 lb/hr (=0.003 lb/MMBtu at full
load)
-- Annual tuneup
Entergy Nine-mile Point Unit 6
Westwego, LA
08/16/2011 338 -- 7.6 lb/MMscf (= 0.0076 lb/MMBtu)
-- 117 lb/MMBtu
Brockton Power Brockton MA
07/20/2011 (MA Plan Approval)
60 0.011 0.01 -- --

73
Table 1-7. Summary Of Recent PSD BACT Determinations for Natural Gas Auxiliary Boilers at Large (>100MW) Gas Fired Combined-Cycle Generating Plants for NOx, PM, H2SO4, GHG
Facility Location Permit Date
Auxiliary Boiler Size MMBtu/hr
Emission Limits1 (lb/MMBtu except where noted)
NOx PM/PM10/PM2.5 H2SO4 GHG
Avenal Power Center
Avenal, CA 05/27/2011 37.4 9 ppmvd at 3% O2 (= 0.011 lb/MMBtu)
0.34 grains S/100 dscf and pipeline quality gas
-- --
Portland Gen. Electric Carty Plant
Morrow, OR 12/29/2010 91 50 lb/MMscf (= 0.05 lb/MMBtu)
2.5 lb/MMscf (= 0.0025 lb/MMBtu)
-- --
Dominion Warren County
Front Royal, VA
12/21/2010 88.1 0.011 lb/MMBtu 0.44 lb/hr (=0.005 lb/MMBtu at full
load)
-- --
Pondera/King Power Station
Houston, TX 08/05/2010 (2) - 45 0.45 lb/hr/unit (=0.01 lb/MMBtu at full
load)
0.32 lb/hr/unit (=0.007 lb/MMBtu at full
load)
-- --
Victorville 2 Hybrid
Victorville, CA
03/11/2010 35 9 ppmvd at 3% O2 (= 0.011 lb/MMBtu)
0.2 grains S/100 dscf and pipeline quality gas
-- --
Stark Power/Wolf Hollow
Granbury, TX
03/03/2010 142 1.42 lb/hr/unit (=0.01 lb/MMBtu at full
load)
1.06 lb/hr/unit (=0.0075 lb/MMBtu at full
load)
-- --
Panda Sherman Power
Grayson, TX 02/03/2010 53 0.53 lb/hr/unit (=0.01 lb/MMBtu at full
load)
0.53 lb/hr/unit (=0.01 lb/MMBtu at full
load)
-- --
Pattillo Branch Power LLC
Savoy, TX 06/17/2009 (4) - 40 1.4 lb/hr/unit (=0.01 lb/MMBtu at full
load)
0.3 lb/hr/unit (=0.0075 lb/MMBtu at full
load)
-- --
____________ 1Short term limits only for NOx, PM, and H2SO4.
Limits obtained from agency permitting documents when not available in RBLC

74
1.2.2 NOx Step 1: Identify Candidate Control Technologies
Selective Catalytic Reduction
Ultra-Low NOx burner
Low NOx burner, typically with flue gas recirculation
Step 2: Eliminate Infeasible Technologies
All these technologies are technically feasible, although application of SCR is unusual for natural gas
boilers in this size range.
Step 3: Rank Control Technologies by Control Effectiveness
The ranking of these technologies is as follows:
1. SCR: Demonstrated to have achieved less than 5.0 ppmvd NOx at 3% O2 for gas fired boilers.
Can be used as supplemental control with a low NOx burner but not demonstrated with an ultra-
low-NOx burner.
2. Ultra-Low NOx burner: Demonstrated to have achieved 9 ppmvd NOx at 3% O2
3. Low NOx burner, typically with flue gas recirculation: Generally recognized to achieve
30 ppmvd NOx at 3% O2.
Step 4: Evaluate Controls
Since SCR is technically feasible, an economic analysis of the cost effectiveness for emission control was
conducted. This economic analysis is presented in Table 1-8. The capital cost estimate for an SCR system
and an ultra-low NOx burner are based on information provided by Cleaver Brooks. The SCR has been
conservatively assumed to control 90% of the potential NOx emissions (to 3 ppmvdc at 3% O2) even
though 5 ppmvdc has been approved in past projects. Control to this NOx level is likely to correspond to
an ammonia slip level of 10 ppm at 3% O2. Table 1-8 indicates that the average and particularly the
incremental cost effectiveness of an SCR are excessive, at over $19,000 per ton for average cost of
control, and nearly $70,000 per ton on an incremental basis. The ultra-low-NOx burner is cost effective
and is the proposed BACT. There are no energy or environmental issues with ultra-low NOx burners that
would indicate selection of SCR as BACT, given the unfavorable SCR economics.
Step 5: Select BACT
With respect to NOx, the lowest limit identified for any of the power plant auxiliary boilers in Table 1-7 is
consistent with the standard guarantee for ultra-low-NOx burners, which is 9 ppmvd at 3% O2. This
corresponds to 0.011 lb/MMBtu. There are several boilers with BACT limits for NOx in lb/hr calculated
with 0.01 rather than 0.011 lb/MMBtu, but this is considered effectively the same limit at full load and is
actually less stringent at part-load, since the limits expressed as 9 ppmvd at 3% O2/0.011 lb/MMBtu apply
throughout the load range. The Project auxiliary boiler meets this most stringent limit found for natural
gas-fired auxiliary boilers at new large (> 100 MW) combustion turbine combined cycle projects.

75
Table 1-8. Summary of Auxiliary Boiler Top-Down BACT Analysis for NOx
Control Alternative
NOx Emissions Economic Impacts
Energy Impacts
(compared to
baseline)
Environmental Impacts
ppmvd @ 3% O2
Tons per year (tpy)
Emissions Reduction Compared to Baseline
(tpy)
Installed Capital
Cost (differential
over baseline)
Total Annualized
Cost (differential
over baseline)
Average Cost Effectiveness
Incremental Cost
Effectiveness
Toxics Impacts (Yes/No)
Adverse Environmental
Impacts (Yes/No)
SCR 3 0.95 8.51 $414,750 $162,668 $19,115 $69,786 Small Yes No
ULN 9 2.89 6.57 $134,400 $27.283 $4,153 -- negligible No No
LN (baseline)
30 9.46 -- -- -- -- --
SCR – Selective Catalytic Reduction ULN – Ultra low-NOx burner LN – Low NOx burner See Appendix A, Calculation Sheets 8 and 9, for calculation of cost values.
76
1.2.3 PM/PM10/PM2.5
For PM/PM10/PM2.5, this evaluation does not identify and discuss each of the five individual steps of the
“top-down” BACT process, since there are no post-combustion control technologies available for
PM/PM10/PM2.5. The “top-down” procedure does require selection of BACT emission limits, which is
addressed in the following paragraphs.
Table 1-7 presents the review of BACT precedents for auxiliary boilers. With respect to PM/PM10/PM2.5,
for limits expressed in mass units (lb/MMBtu or lb/hr converted to lb/MMBtu at full load), only two of
the auxiliary boilers listed in the Table 1-7 have PM/PM10/PM2.5 limits that are more stringent than the
Project auxiliary boiler limit of 0.005 lb/MMBtu. One of these boilers is at the Palmdale Hybrid Power
facility, with a limit of 0.33 lb/hr, which corresponds to 0.003 lb/MMBtu at full load. However, this lb/hr
limit could be met by reducing the boiler load, if the actual emissions exceed 0.003 lb/MMBtu. So at
lower loads it is actually less stringent than the Project limit of 0.005 lb/MMBtu, which applies
throughout the load range. The other boiler listed in the RBLC with a lower lb/MMBtu emission limit is
at the Portland (OR) General Electric Carty Plant. This limit of 2.5 lb/MMcf of natural gas (which
corresponds to 0.0025 lb/MMBtu) is considered unrealistically low for a guarantee for a boiler of this
type. This is because of uncertainty and variability with available PM/PM10/PM2.5 test methods, and the
risk of artifact emissions resulting in a tested exceedance. All new gas-fired boilers, properly operated, are
expected to have intrinsically low PM/PM10/PM2.5 emissions. A limit of 0.005 lb/MMBtu is within the
range of recent PSD BACT levels and is justified as PSD BACT.
Several of the boilers listed in Table 1-7 have PM/PM10/PM2.5 PSD BACT limits expressed as the sulfur
content of the natural gas. These values range from 0.1 grains/100 scf to 0.4 grains/100 scf. All of these
values are lower than what USEPA defines as the maximum sulfur content of pipeline natural gas
(0.5 grains/100 scf). The Applicant does not believe it is prudent to assume a natural gas sulfur content
lower than EPA’s definition for pipeline natural gas. Therefore, these sulfur limits for PM/PM10/PM2.5
PSD BACT limits are not appropriate.
1.2.4 H2SO4
For H2SO4, this evaluation does not identify and discuss each of the five individual steps of the “top-
down” BACT process, since the only available control for H2SO4 is limiting the fuel sulfur content. Based
on the selection of natural gas as the BACT fuel, this is the lowest sulfur content fuel suitable for the
auxiliary boiler.
The BACT process for H2SO4 proceeds directly to the selection of BACT. Footprint has based the H2SO4
limit on 40% molar conversion of fuel sulfur to H2SO4. This is because Footprint has incorporated a CO
oxidation catalyst to reduce CO emissions. One of the collateral impacts of this oxidation catalyst is an
increase in H2SO4 emissions. With respect to H2SO4, none of the 6 of the projects in Table 1-7 with
numeric H2SO4 limits have oxidation catalysts. Therefore, the proposed Project limit is less stringent than
5 of these 6 limits. The proposed Project limit of 0.0009 lb/MMBtu H2SO4 is justified as PSD BACT with
the addition of a CO catalyst.
1.2.5 GHG
For GHG, this evaluation does not identify and discuss each of the five individual steps of the “top-down”
BACT process, since there are no post-combustion controls suitable for GHG. The BACT process for
GHG proceeds directly to the selection of BACT.

77
With respect to GHG, most of the auxiliary boilers listed in Table 1-7 with GHG limits for PSD BACT
are expressed as a mass emission value, which is a project specific number reflecting the particular size
and gas throughput limits of the specific project unit. For its proposed GHG limit for the Auxiliary Boiler,
the Project has chosen a conservative value based on the USEPA Part 75 default emission factor (119
lb/MMBtu). Another unit listed in the RBLC has an 80% efficiency specified in addition to an annual
mass limit. This is the only auxiliary boiler approved with this type of limit. The Project will install an
auxiliary boiler with a nominal efficiency of 83.7%. The Applicant proposes a GHG PSD BACT limit
expressed in the units of lb/MMBtu (119 lb/MMBtu) as most appropriate PSD BACT limit.
1.3 Emergency Diesel Generator
This section supplements the PSD BACT analysis for the emergency diesel generator to address public
comments made on the draft permit documents. The Project is subject to PSD review for NOx,
PM/PM10/PM2.5, H2SO4, and GHG, and thus the emergency diesel generator is subject to PSD BACT for
these pollutants.
The Project includes a 750 kW emergency diesel generator that will have ultra-low sulfur diesel (ULSD)
as the only fuel of use. Table 1-9 presents the proposed BACT limits for the emergency diesel generator
for pollutants subject to PSD review.
Table 1-9. Emergency Diesel Generator Proposed PSD BACT Limits
Pollutant Emission Limitation
(grams/kWhr) Emission Limitation
(grams/hphr)
NOx 6.4 4.8
PM/PM10/PM2.5 0.20 0.15
H2SO4 0.0009 lb/hr (0.00012 lb/MMBtu)
GHG as CO2e 162.85 lb/MMBtu
The proposed PSD BACT limits for NOx and PM/PM10/PM2.5 are based on compliance with the EPA New
Source Performance Standards (NSPS), 40 CFR 60 Subpart IIII. For a 750 kW engine, Subpart IIII
requires what is referred to as a Tier 2 engine. For H2SO4, the PSD BACT limit is based on use of ultra-
low sulfur diesel (ULSD) fuel, and conversion of 5% of the fuel sulfur on a molar basis to H2SO4. The
GHG limit is based on EPA emission factors for ULSD.
In order to inform the PSD BACT process, Footprint has compiled all the PSD BACT determinations in
the last five years for emergency generators at new large (> 100 MW) combustion turbine combined cycle
projects. This compilation is based on the USEPA RBLC (RACT/BACT/LAER Clearinghouse). Several
recent projects not included in RBLC have also been included in this compilation. Table 1-10 provides
this compilation. Review of Table 1-10 indicates that only one emergency generator is fired with natural
gas, and all the others are fired with ULSD. The gas-fired engine, at Avenal Power Center in CA, does
have SCR to control NOx. All other emergency generators in Table 1-10 do not have any post
combustion controls for PSD pollutants. Table 1-10 will be referred to in the individual pollutant
discussion below.

78
Table 1-10. Summary Of Recent PSD BACT Determinations for Emergency Generators at Large (>100MW) Gas Fired Combined-Cycle Generating Plants for NOx, PM, H2SO4, GHG
Facility Location Permit Date
Emergency Generator Size
1
Emission Limits1
NOx PM/PM10/PM2.5 H2SO4 GHG
Carroll County Energy
Washington Twp., OH
11/5/2013 1112 kW Subpart IIII
0.000132 grams/kWhr
433.96 tpy
Renaissance Power
Carson City, MI
11/1/2013 (2) – 1000 kW Subpart IIII -- 1731.4 tpy (both units)
Langley Gulch Power
Payette, ID 08/14/2013 750 kW Subpart IIII -- --
Oregon Clean Energy
Oregon, OH 06/18/2013 2250 kW Subpart IIII
0.000132 grams/kWhr
877 tpy (87)
Green Energy Partners / Stonewall
Leesburg, VA
04/30/2013 1500 kW Subpart IIII --
Low carbon fuel and efficient operation
Hickory Run Energy LLC
New Beaver Twp., PA
04/23/2013 750 kW 6.0 grams/kWhr 0.25 grams/kWhr -- 80.5 tpy
Brunswick County Power
Freeman, VA
03/12/2013 2200 kW Subpart IIII ULSD
Low carbon fuel and efficient operation
Moxie Patriot LLC
Clinton Twp PA
01/31/2013 1472 hp 4.93 grams/hp-hr 0.02 grams/hp-hr -- --
St. Joseph Energy Center
New Carlisle, IN
12/03/2012 (2) – 1006 hp Subpart IIII -- 1186 tpy
Hess Newark Energy Center
Newark, NJ 11/01/2012 1500 kW Subpart IIII
-- --
Moxie Liberty LLC
Asylum Twp, PA
10/10/2012 4.93 grams/hp-hr 0.02 grams/hp-hr -- --
Cricket Valley Dover, NY 09/27/12 4 Black Start EDGs 3000 kW
each
Subpart IIII -- --
ES Joslin Power Calhoun, TX 09/12/2012 (2) -EDG 14.11 lb/hr/unit 0.44 lb/hr/unit -- --
Pioneer Valley Energy Center (PVEC)
Westfield, MA
04/05/2012 2174 kW Subpart IIII -- --
Palmdale Hybrid Power
Palmdale, CA
10/18/2011 110 Subpart IIII
-- --
Thomas C. Ferguson Power
Llano, TX 09/01/2011 1340 hp 16.52 lb/hr (5.5 grams/hp-hr)
0.55 lb/hr -- 15,314 lb/hr 30 day rolling average
765.7 tpy 365 day rolling average
Entergy Nine-mile Point Unit 6
Westwego, LA
08/16/2011 1250 hp -- Subpart IIII -- CO2e 163.6 lb/MMBtu,
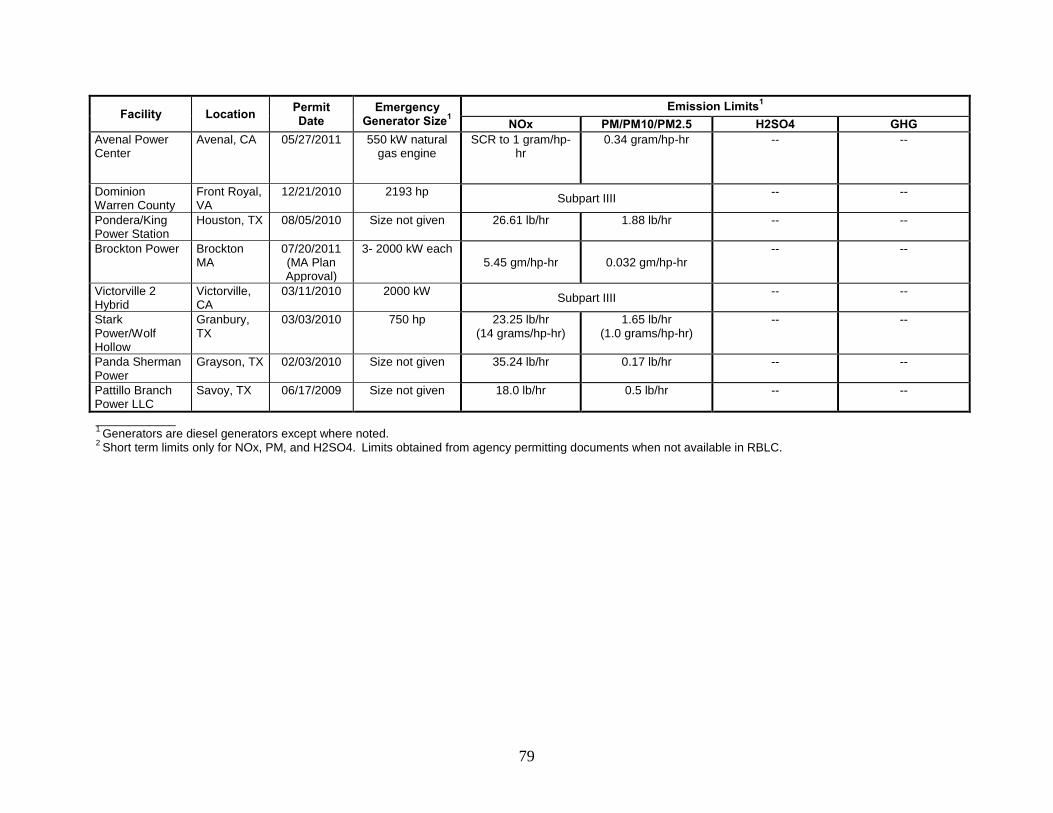
79
Facility Location Permit Date
Emergency Generator Size
1
Emission Limits1
NOx PM/PM10/PM2.5 H2SO4 GHG
Avenal Power Center
Avenal, CA 05/27/2011 550 kW natural gas engine
SCR to 1 gram/hp-hr
0.34 gram/hp-hr -- --
Dominion Warren County
Front Royal, VA
12/21/2010 2193 hp Subpart IIII
-- --
Pondera/King Power Station
Houston, TX 08/05/2010 Size not given 26.61 lb/hr 1.88 lb/hr -- --
Brockton Power Brockton MA
07/20/2011 (MA Plan Approval)
3- 2000 kW each 5.45 gm/hp-hr 0.032 gm/hp-hr
-- --
Victorville 2 Hybrid
Victorville, CA
03/11/2010 2000 kW Subpart IIII
-- --
Stark Power/Wolf Hollow
Granbury, TX
03/03/2010 750 hp 23.25 lb/hr (14 grams/hp-hr)
1.65 lb/hr (1.0 grams/hp-hr)
-- --
Panda Sherman Power
Grayson, TX 02/03/2010 Size not given 35.24 lb/hr 0.17 lb/hr -- --
Pattillo Branch Power LLC
Savoy, TX 06/17/2009 Size not given 18.0 lb/hr 0.5 lb/hr -- --
____________ 1
Generators are diesel generators except where noted. 2
Short term limits only for NOx, PM, and H2SO4. Limits obtained from agency permitting documents when not available in RBLC.

80
1.3.1 Fuel Selection Step 1: Identify Candidate Fuels
Natural gas
ULSD
Step 2: Eliminate Infeasible Technologies
Both these technologies are technically feasible, although use of natural gas is unusual for an emergency
engine.
Step 3: Rank Control Technologies by Control Effectiveness
Natural gas engines can achieve lower emissions compared to ULSD.
Step 4: Evaluate Controls
Normally, for an emergency generator, it is very important to have the fuel supply directly available
without the possibility of a natural gas supply interruption making it impossible to operate the emergency
generator in an emergency. The purpose of the emergency generator is to be able to safely shut the plant
down in the event of an electric power outage. So in order to maintain this important equipment
protection function, ULSD, which can be stored in a small tank adjacent to the emergency generator, is
the fuel of choice. Footprint is not aware of the specific circumstance for the emergency generator fuel
selection at Avenal, but Footprint does not believe a natural gas fired generator for the Salem Project is a
prudent choice.
Step 5: Select BACT
ULSD is proposed as the BACT fuel for the Project emergency generator.
1.3.2 NOx Step 1: Identify Candidate Control Technologies
Selective Catalytic Reduction
Low NOx engine design in accordance with EPA NSPS, 40 CFR 60 Subpart IIII (Tier 2 engine
for 750 kW unit)
Step 2: Eliminate Infeasible Technologies
Both these technologies are technically feasible, although application of SCR is unusual for an emergency
engine.
Step 3: Rank Control Technologies by Control Effectiveness
SCR can normally achieve 90% remove of NOx emissions, so it is more effective than the Tier 2 engine
design which is based on low-NOx engine design. However, for an emergency generator, if this unit is
used just for short period of test and facility shutdown in an actual emergency, the ability of the SCR to
81
control emissions will be significantly reduced since the engine/SCR takes time to warm up to achieve
good NOx control.
Step 4: Evaluate Controls
Since SCR is technically feasible, an economic analysis of the cost effectiveness for emission control was
conducted. This economic analysis is presented in Table 1-11. The capital cost estimate for an SCR
system is based on information provided by Milton Cat Power Systems. The other factors are from the
OAQPS Cost Control Manual. The SCR has been conservatively assumed to control 90% of the potential
NOx emissions even though this is unlikely in this application. Table 1-11 indicates that the cost
effectiveness of an SCR is over $33,000 per ton of NOx. This cost is excessive, even if the emergency
generator runs the maximum allowable amount of 300 hours per year (unlikely) and 90% NOx control of
the full potential to emit is achieved.
There are no energy or environmental issues with a Tier 2 generator that would indicate selection of SCR
as BACT, given the unfavorable SCR economics.
Step 5: Select BACT
With respect to the selection of a PSD BACT for NOx for the emergency generator, Table 1-10 indicates
that compliance with Subpart IIII is the most common limit. Several BACT determinations contain
gram/kWhr or gram/hp-hr limits that approximate the Subpart IIII values but do not specifically reference
Subpart IIII. Several Texas projects have lb/hr limits but do not provide the engine size to determine
limits per unit of output.
Overall, with the elimination of SCR on economic grounds, the review of other RBLC precedents
supports the selection of Subpart IIII compliance as BACT.
1.3.3 PM/PM10/PM2.5 Step 1: Identify Candidate Control Technologies
Active Diesel Particulate Filter (DPF)
Low PM engine design in accordance with EPA NSPS, 40 CFR 60 Subpart IIII (Tier 2 engine
for 750 kW unit)
Step 2: Eliminate Infeasible Technologies
Both these technologies are technically feasible, although application of a DPF is unusual for an
emergency engine.
Step 3: Rank Control Technologies by Control Effectiveness
An active DPF can achieve up to 85% particulate removal (CARB Level 3), so it is more effective than
the Tier 2 engine design which is based on low-emission engine design.
Step 4: Evaluate Controls
Since a DPF is technically feasible, an economic analysis of the cost effectiveness for emission control
was conducted. This economic analysis is presented in Table 1-12. The capital cost estimate for an active
system is based on information provided by Milton Cat Power Systems. The other factors are from the

82
OAQPS Cost Control Manual. Table 1-12 indicates that the cost effectiveness of an active DPF is over
$600,000 per ton of PM/PM10/PM2.5. This cost is excessive, even if the emergency generator runs the
maximum allowable amount of 300 hours per year (unlikely).

83

84

85
There are no energy or environmental issues with a Tier 2 generator that would indicate selection of a
DPF as BACT, given the unfavorable economics.
Step 5: Select BACT
With respect to the selection of a PSD BACT for PM/PM10/PM2.5 for the emergency generator,
Table 1-10 indicates that compliance with Subpart IIII is the most common limit. There are two BACT
determinations for PA projects (Moxie projects) that both have very low PM/PM10/PM2.5 limits of
0.02 gram/hp-hr. Footprint suspects that this limit is a mistaken entry for the Subpart IIII value of
0.2 grams/kWhr. Several Texas projects have lb/hr limits but do not provide the engine size to determine
limits per unit of output. Brockton (MA) also has a very low PM limit, much lower than the Subpart IIII
requirements. Footprint does not consider a PM limit less than the Subpart IIII requirements to be an
appropriate BACT.
Overall, with the elimination of a DPF on economic grounds, the review of other RBLC precedents
supports the selection of Subpart IIII compliance as BACT.
1.3.4 H2SO4
For H2SO4, this evaluation does not identify and discuss each of the five individual steps of the “top-
down” BACT process, since the only available control for H2SO4 is limiting the fuel sulfur content. Based
on the selection of ULSD as the BACT fuel, this is the lowest sulfur content fuel suitable for the
emergency generator.
The BACT process for H2SO4 proceeds directly to the selection of BACT. Footprint has based the H2SO4
limit on 5% molar conversion of fuel sulfur to H2SO4. Most of the emergency generators in Table 1-10 do
not have an H2SO4 limit. The only numerical limits for H2SO4 identified for an emergency generator are
those for the two recent Ohio PSD permits (Oregon and Carroll County). The limit in each case is
0.000132 grams/kWhr. Both these project are approved with ULSD as the emergency generator fuel.
Conversion of the Footprint limit to grams/kWhr indicates that 5% molar conversion of the fuel sulfur to
H2SO4 yields 0.0005 grams/kWhr, or about 4 times the Ohio limits. Review of the Ohio approvals
indicates this factor is based on an EPA toxics emission factor which apparently allows for a much lower
molar conversion of fuel sulfur to H2SO4. While this factor may be suitable for estimating actual
emissions, Footprint believes this factor is not appropriate for setting an emission limit. Therefore, given
that most agencies do not even regulate emergency generator H2SO4, Footprint believes the PSD BACT
emission rate based on 5% molar conversion of fuel sulfur to H2SO4 is justified as BACT. This 5% molar
conversion of fuel sulfur to H2SO4 is a reasonable upper limit permit limit assumption for fuel combustion
sources that do not have an SCR or oxidation catalyst.
1.3.5 GHG
For GHG, this evaluation does not identify and discuss each of the five individual steps of the “top-down”
BACT process, since there are no post-combustion controls suitable for GHG. The BACT process for
GHG proceeds directly to the selection of BACT. Given that emergency generators operate so little,
agencies have not required review of generator efficiency as part of GHG BACT.
With respect to GHG, most of the emergency generators listed on the RBLC with GHG limits for PSD
BACT are expressed as a mass emission value, which is a project specific number reflecting the particular
size and gas throughput limits of the specific project unit. Therefore, these GHG equipment-specific
limits are not automatically transferrable as comparable limits for this Project. One unit listed in
Table 1-10 has a lb/MMBtu limit based on ULSD corresponding to 163.6 lb CO2e/MMBtu. For its

86
proposed GHG limit for the emergency generator, the Project has chosen a value based on the USEPA
Part 75 default emission factors (162.85 lb/MMBtu), incorporating both CO2, CH4, and N2O. The
Applicant proposes a GHG PSD BACT limit expressed in the units of lb/MMBtu (162.85 lb/MMBtu) as
most appropriate PSD BACT limit.
1.4 Emergency Fire Pump
This section supplements the PSD BACT analysis for the emergency diesel fire pump to address public
comments made on the draft permit documents. The Project is subject to PSD review for NOx,
PM/PM10/PM2.5, H2SO4, and GHG, and thus the emergency diesel fire pump is subject to PSD BACT for
these pollutants.
The Project includes a 371 hp emergency diesel fire pump that will have ultra-low sulfur diesel (ULSD)
as the only fuel of use. Table 1-13 presents the proposed BACT limits for the emergency diesel fire pump
for pollutants subject to PSD review.
Table 1-13. Emergency Diesel Fire Pump Proposed PSD BACT Limits
Pollutant Emission Limitation
(grams/kWhr) Emission Limitation
(grams/hphr)
NOx 4.0 3.0
PM/PM10/PM2.5 0.20 0.15
H2SO4 0.0003 lb/hr (0.00012 lb/MMBtu)
GHG as CO2e 162.85 lb/MMBtu
The proposed PSD BACT limits for NOx and PM/PM10/PM2.5 are based on compliance with the EPA New
Source Performance Standards (NSPS), 40 CFR 60 Subpart IIII. For a 371 hp fire pump engine, Subpart
IIII requires what is referred to as a Tier 3 engine. For H2SO4, the PSD BACT limit is based on use of
ultra-low sulfur diesel (ULSD) fuel, and conversion of 5% of the fuel sulfur on a molar basis to H2SO4.
The GHG limit is based on EPA emission factors for ULSD.
In order to inform the PSD BACT process, Footprint has compiled all the PSD BACT determinations in
the last five years for emergency fire pumps at new large (> 100 MW) combustion turbine combined
cycle projects. This compilation is based on the USEPA RBLC (RACT/BACT/LAER Clearinghouse).
Several recent projects not included in RBLC have also been included in this compilation. Table 1-14
provides this compilation. Review of Table 1-14 indicates that all emergency fire pumps are fired with
ULSD. All emergency fire pumps in Table 1-14 do not have any post combustion controls for PSD
pollutants. Table 1-14 will be referred to in the individual pollutant discussion below.

87
Table 1-14. Summary of Recent PSD BACT Determinations for Reciprocating Fire Pump Engines at Large (>100MW) Gas Fired Combined-Cycle Generating Plants for NOx, PM, H2SO4, GHG
Facility Location Permit Date
Fire Pump Engine Size
Emission Limits1
NOx PM/PM10/PM2.5 H2SO4 GHG
Carroll County Energy
Washington Twp., OH
11/5/2013 400 hp Subpart IIII 0.000132
grams/kWhr 115.75 tpy
Oregon Clean Energy
Oregon, OH 06/18/2013 300 hp Subpart IIII
0.000132 grams/kWhr
87 tpy
Green Energy Partners / Stonewall
Leesburg, VA 04/30/2013 330 hp Subpart IIII --
Low carbon fuel and efficient operation
Hickory Run Energy LLC
New Beaver Twp., PA
04/23/2013 450 hp 1.9 gm/hp-hr 0.15 grams/hp-hr 0.00012
grams/hp-hr 33.8 tpy
Brunswick County Power
Freeman, VA
03/12/2013 305 hp
Subpart IIII ULSD Low carbon fuel and
efficient operation
Moxie Patriot LLC
Clinton Twp PA
01/31/2013 460 hp 2.6 grams/hp-
hr 0.09 grams/hp-hr -- --
St. Joseph Energy Center
New Carlisle, IN
12/03/2012 (2) – 371 hp Subpart IIII -- 172 tpy
Hess Newark Energy Center
Newark, NJ 11/01/2012
270 hp Subpart IIII -- --
Moxie Liberty LLC
Asylum Twp PA
10/10/2012 Size not given 2.6 grams/hp-
hr 0.09 grams/hp-hr -- --
Cricket Valley Dover, NY 09/27/2012 460 hp Subpart IIII -- --
ES Joslin Power Calhoun, TX 09/12/2012 Size not given 2.08 lb/hr 0.10 lb/hr -- --
Pioneer Valley Energy Center (PVEC)
Westfield, MA 04/05/2012
270 hp Subpart IIII -- --
Palmdale Hybrid Power
Palmdale, CA
10/18/2011 182 hp
Subpart IIII -- --
Thomas C. Ferguson Power
Llano, TX
09/01/2011
617 hp 3.81 lb/hr 0.20 lb/hr -- 7,027.8 lb/hr 30 day rolling average
351.4 tpy 365 day rolling average
Entergy Nine-mile Point Unit 6
Westwego, LA
08/16/2011 350 hp -- Subpart IIII -- CO2e 163.6 lb/MMBtu,
Brockton Power Brockton MA
07/20/2011 (MA Plan Approval)
100 hp
5.45 gm/hp-hr 0.032 gm/hp-hr
-- --

88
Facility Location Permit Date
Fire Pump Engine Size
Emission Limits1
NOx PM/PM10/PM2.5 H2SO4 GHG
Avenal Power Center
Avenal, CA 05/27/2011 288 hp 3.4 grams/hp-
hr ULSD -- --
Portland Gen. Electric Carty Plant
Morrow, OR 12/29/2010 265 Subpart IIII
-- --
Dominion Warren County
Front Royal, VA
12/21/2010 2,3 MMBtu/hr Subpart IIII
-- --
Pondera/King Power Station
Houston, TX 08/05/2010 Size not given 1.54 lb/hr 0.55 lb/hr -- --
Victorville 2 Hybrid
Victorville, CA
03/11/2010 182 hp Subpart IIII
-- --
Panda Sherman Power
Grayson, TX 02/03/2010 Size not given 7.75 lb/hr 0.55 lb/hr -- --
Pattillo Branch Power LLC
Savoy, TX 06/17/2009 Size not given 9.3 lb/hr 0.7 lb/hr -- --
____________ 1
Short term limits only for NOx, PM, and H2SO4. Limits obtained from agency permitting documents when not available in RBLC

89
1.4.1 Fuel Selection Step 1: Identify Candidate Fuels
Natural gas
ULSD
Step 2: Eliminate Infeasible Technologies
Both these technologies are technically feasible, although use of natural gas would be unusual for an
emergency fire pump engine.
Step 3: Rank Control Technologies by Control Effectiveness
Natural gas engines can achieve lower emissions compared to ULSD.
Step 4: Evaluate Controls
Normally, for an emergency fire pump, it is very important to have the fuel supply directly available
without the possibility of a natural gas supply interruption making it impossible to operate the emergency
fire pump in an emergency. The purpose of the emergency fire pump is to be able to pump water in the
event of a fire. So in order to maintain this important emergency function, ULSD, which can be stored in
a small tank adjacent to the emergency fire pump, is the fuel of choice.
Step 5: Select BACT
ULSD is proposed as the BACT fuel for the Project emergency fire pump.
1.4.2 NOx Step 1: Identify Candidate Control Technologies
Selective Catalytic Reduction
Low NOx engine design in accordance with EPA NSPS, 40 CFR 60 Subpart IIII (Tier 3
engine for 371 hp fire pump unit)
Step 2: Eliminate Infeasible Technologies
Both these technologies are technically feasible, although application of SCR is unusual for an emergency
fire pump.
Step 3: Rank Control Technologies by Control Effectiveness
SCR can normally achieve 90% remove of NOx emissions, so it is more effective than the Tier 3 engine
design which is based on low-NOx engine design. However, for an emergency fire pump, if this unit is
used just for short period of test and facility shutdown in an actual emergency, the ability of the SCR to
control emissions will be significantly reduced since the engine/SCR takes time to warm up to achieve
good NOx control.

90
Step 4: Evaluate Controls
Since SCR is technically feasible, an economic analysis of the cost effectiveness for emission control was
conducted. This economic analysis is presented in Table 1-15. The capital cost estimate for an SCR
system is based on information provided by Milton Cat Power Systems. The other factors are from the
OAQPS Cost Control Manual. The SCR has been conservatively assumed to control 90% of the potential
NOx emissions even though this is unlikely in this application. Table 1-15 indicates that the cost
effectiveness of an SCR is over $90,000 per ton of NOx. This cost is excessive, even if the emergency fire
pump runs the maximum allowable amount of 300 hours per year (unlikely) and 90% NOx control of the
full potential to emit is achieved.
There are no energy or environmental issues with a Tier 3 fire pump that would indicate selection of SCR
as BACT, given the unfavorable SCR economics.
Step 5: Select BACT
With respect to the selection of a PSD BACT for NOx for the emergency fire pump, Table 1-14 indicates
that compliance with Subpart IIII is the most common limit. Several BACT determinations contain
gram/kWhr or gram/hp-hr limits that approximate the Subpart IIII values but do not specifically reference
Subpart IIII. Several Texas projects have lb/hr limits but do not provide the engine size to determine
limits per unit of output.
With the elimination of SCR on economic grounds, the review of other RBLC precedents supports the
selection of Subpart IIII compliance as BACT.
1.4.3 PM/PM10/PM2.5 Step 1: Identify Candidate Control Technologies
Active Diesel Particulate Filter (DPF)
Low PM engine design in accordance with EPA NSPS, 40 CFR 60 Subpart IIII (Tier 3 engine
for 371 hp unit)
Step 2: Eliminate Infeasible Technologies
Both these technologies are technically feasible, although application of a DPF is unusual for an
emergency engine.
Step 3: Rank Control Technologies by Control Effectiveness
An active DPF can achieve up to 85% particulate removal (CARB Level 3), so it is more effective than
the Tier 3 engine design which is based on low-emission engine design.
Step 4: Evaluate Controls Since a DPF is technically feasible, an economic analysis of the cost effectiveness for emission control
was conducted. This economic analysis is presented in Table 1-16. The capital cost estimate for an active
system is based on information provided by Milton Cat Power Systems. The other factors are from the
OAQPS Cost Control Manual. Table 1-16 indicates that the cost effectiveness of an active DPF is over
$1,000,000 per ton of PM/PM10/PM2.5. This cost is excessive, even if the emergency fire pump runs the
maximum allowable amount of 300 hours per year (unlikely)

91

92

93
There are no energy or environmental issues with a Tier 3 fire pump that would indicate selection of a
DPF as BACT, given the unfavorable economics.
Step 5: Select BACT
With respect to the selection of a PSD BACT for PM/PM10/PM2.5 for the emergency fire pump,
Table 1-14 indicates that compliance with Subpart IIII is the most common limit. There are two BACT
determinations for PA project (Moxie projects) that both have very low PM/PM10/PM2.5 limits of
0.02 gram/hp-hr. Footprint suspects that this limit is a mistaken entry for the Subpart IIII value of
0.2 grams/kWhr. Several Texas projects have lb/hr limits but do not provide the engine size to determine
limits per unit of output. Brockton (MA) also has a very low PM limit, much lower than the Subpart IIII
requirements. Footprint does not consider a PM limit less than the Subpart IIII requirements to be an
appropriate BACT.
With the elimination of a DPF on economic grounds, the review of other RBLC precedents supports the
selection of Subpart IIII compliance as BACT.
1.4.4 H2SO4
For H2SO4, this evaluation does not identify and discuss each of the five individual steps of the “top-
down” BACT process, since the only available control for H2SO4 is limiting the fuel sulfur content. Based
on the selection of ULSD as the BACT fuel, this is the lowest sulfur content fuel suitable for the
emergency fire pump.
The BACT process for H2SO4 proceeds directly to the selection of BACT. Footprint has based the H2SO4
limit on 5% molar conversion of fuel sulfur to H2SO4. Most of the emergency fire pumps in Table 1-14 do
not have an H2SO4 limit. The only numerical limits for H2SO4 identified for an emergency fire pump are
those for the two recent Ohio PSD permits (Oregon and Carroll County), and the Hickory Run (PA)
project. The limit for the Ohio cases is 0.000132 grams/kWhr, and for Hickory Run is 0.00012 grams/hp-
hr (0.00016 grams/kW-hr). All these projects are approved with ULSD as the emergency fire pump fuel.
Conversion of the Footprint limit to grams/kWhr indicates that 5% molar conversion of the fuel sulfur to
H2SO4 yields 0.0005 grams/kWhr, or about 4 times the Ohio limits and three times the Hickory Run limit.
Review of the Ohio approvals indicates this factor is based on an EPA toxics emission factor which
apparently allows for a much lower molar conversion of fuel sulfur to H2SO4. While this factor may be
suitable for actual emissions, Footprint believes this factor is not appropriate for setting an emission limit.
Therefore, given that most agencies do not even regulate emergency fire pump H2SO4, Footprint believes
the PSD BACT emission rate based on 5% molar conversion of fuel sulfur to H2SO4 is justified as BACT.
As noted above for the emergency diesel generator, this 5% molar conversion of fuel sulfur to H2SO4 is a
reasonable upper limit permit limit assumption for fuel combustion sources that do not have an SCR or
oxidation catalyst.
1.4.5 GHG
For GHG, this evaluation does not identify and discuss each of the five individual steps of the “top-down”
BACT process, since there are no post-combustion controls suitable for GHG. The BACT process for
GHG proceeds directly to the selection of BACT. Given that emergency fire pumps operate so little,
agencies have not required review of fire pump efficiency as part of GHG BACT.
With respect to GHG, most of the emergency pumps listed on the RBLC with GHG limits for PSD BACT
are expressed as a mass emission value, which is a project specific number reflecting the particular size
and gas throughput limits of the specific project unit. Therefore, these GHG equipment-specific limits are

94
not automatically transferrable as comparable limits for this Project. One unit listed in
Table 1-14 has a lb/MMBtu limit based on ULSD corresponding to 163.6 lb CO2e/MMBtu. For its
proposed GHG limit for the emergency pumps, the Project has chosen a value based on the USEPA Part
75 default emission factors (162.85 lb/MMBtu), incorporating both CO2, CH4, and N2O. The Applicant
proposes a GHG PSD BACT limit expressed in the units of lb/MMBtu (162.85 lb/MMBtu) as most
appropriate PSD BACT limit.
1.5 Auxiliary Cooling Tower
This section provides a PSD BACT analysis for the auxiliary mechanical draft cooling tower. The
primary function for the auxiliary cooling tower is to provide necessary equipment cooling for the gas
turbine itself, which is not possible to provide using the Air Cooled Condenser (ACC) used to condense
steam discharged from steam turbines. The auxiliary mechanical draft cooling tower planned for use is a
3-cell commercial scale tower, with a total circulating water flow (all 3 cells) of 13,000 gallons per
minute (gpm).
In general, mechanical draft cooling towers provide cooling of the circulating water by spraying (warm)
circulating water over sheets of plastic material known as fill. This exposes the circulating water to
ambient air being drawn in through the sides of the tower towards a fan generally located above the fill. A
fraction of the circulating water evaporates into this air, warming it and causing it to become saturated
with moisture. A small portion of the circulating water may be entrained into this air flow. These droplets
of circulating water contain dissolved solids. Specially designed drift eliminators are typically located
above the water sprays to remove most of these droplets and return them to the fill. But a small fraction of
these droplets can escape into the fan discharge into the atmosphere. These droplets then evaporate, and
the particulates in these droplets are a source of particulate (PM/PM10/PM2.5) emissions. PM/PM10/PM2.5
are the only PSD pollutants emitted from the auxiliary cooling tower.
The Footprint auxiliary cooling tower is being designed to limit the drift rate to 0.001% of the circulating
water flow (0.13 gpm). The design dissolved solids concentration for the circulating water is 1,500
milligrams per liter (mg/l) As documented in Appendix B of the December 2012 PSD Application,
Calculation Sheet 6, the potential PM/PM10 emissions from the auxiliary cooling tower are 0.43 tpy, and
the potential PM2.5 emissions are 0.17 tpy.
Step 1: Identify Candidate Technologies
Particulate control technologies identified for cooling towers at new large > 100 MW combined cycle
turbines are as follows:
Air-Cooled Condensers (ACCs): This eliminates the use of circulating water for cooling and thus
eliminates drift for large towers used for steam turbine condenser cooling
High efficiency cooling tower drift eliminators.
Reduction in the dissolved solids concentration in circulating water.
Step 2: Eliminate Infeasible Technologies
ACCs are technically feasible for steam turbine condenser cooling large combined cycle units. However,
use of an ACC is not technically feasible for the auxiliary equipment cooling required for a GE Frame
7FA.05 combustion turbines since ACCs cannot achieve the degree of cooling performance required.
High efficiency cooling tower drift eliminators are also technically feasible for mechanical draft cooling
towers. The total dissolved solids concentration (TDS) in circulating water is a function of the makeup

95
water TDS, which depends on the makeup water source, and the TDS at which the tower is operated.
Removing TDS from the makeup water is considered technically infeasible for a small auxiliary
mechanical draft cooling tower. However, the TDS in the circulating water can be decreased by
increasing the amount of “blowdown” from the tower. Blowdown is a stream of wastewater continuously
discharged from the tower to remove TDS from the circulating water. Increasing blowdown reduces the
TDS and is technically feasible.
Step 3: Rank Control Technologies by Control Effectiveness
The ranking of the technically feasible technologies is as follows:
1. High efficiency cooling tower drift eliminators: Generally recognized to be capable of
achieving a drift rate of 0.0005% of circulating water flow for large cooling tower used for
power plant steam turbine condenser cooling. However, for small commercial mechanical
draft cooling towers being used in this application, the standard design is for 0.001% drift.
2. Reduce the TDS in circulating water: Mechanical draft cooling towers are operated with
circulating water TDS as low as 1000 milligrams/liter (mg/l).
Step 4: Evaluate Controls
Footprint has compiled all the PSD BACT determinations in the last five years for mechanical draft
cooling towers at new large (> 100 MW) combustion turbine combined cycle projects. This compilation
is based on the USEPA RBLC (RACT/BACT/LAER Clearinghouse). Several recent projects not included
in RBLC have also been included in this compilation. Table 1-17 provides this compilation.
Review of Table 1-17 indicates that the available cooling tower BACT determinations are almost
exclusively for large towers used for steam turbine condenser cooling. These towers are commonly
specified for 0.0005% drift. Texas project determinations typically do not have the size of the tower
indicated, and only have lb/hr emissions indicated which does not provide a meaningful comparison.
The smallest tower identified with a PM PSD BACT determination is the 12,000 gpm chiller tower at the
Entergy Ninemile Point project in Louisiana. This tower in fact has drift specified at 0.001%, which
agrees with our finding that small towers are designed for 0.001% drift. Therefore, it is concluded that
0.001% drift is justified as BACT for the small auxiliary mechanical draft cooling tower for Footprint. All
towers identified with drift limits of 0.0005% are significantly larger than the Footprint auxiliary tower.
With respect to the circulating water total dissolved solids (TDS) concentration, for projects where this
value is identified, these values range from 1000 to 6200 mg/l. Only two projects have design values <
Footprint’s 1500 mg/l. A collateral environmental impact of increasing the blowdown to decrease TDS is
increasing consumption of water. Footprint has selected 1500 mg/l as a reasonable TDS value balance to
drift emissions and water conservation.
Step 5: Select BACT
The Footprint Project will meet 0.001% drift and limit the potential PM/PM10 emissions from the
auxiliary cooling tower to 0.43 tpy, and the potential PM2.5 emissions to 0.17 tpy. These values are
justified as BACT.

96
Table 1-17. Summary of Recent Cooling Tower Particulate BACT Determinations for Large (>100MW) Gas Fired Combined-Cycle Generating Plants
Facility Location Permit Date
Cooling Tower Description (total circulating water flow rate in gallons
per minute unless otherwise specified)
BACT1
PM/PM10/PM2.5
Renaissance Power Carson City, MI 11/1/2013 10 cell tower 0.0005% drift
Langley Gulch Power Payette, ID 08/14/2013 76,151 gpm Drift Eliminators (not limit specified); 5000 mg/l
Oregon Clean Energy Oregon, OH 06/18/2013 322,000 gpm 0.0005% drift; 2030.5 mg/l
Green Energy Partners / Stonewall
Leesburg, VA 04/30/2013 187,400 gpm 0.0005% drift; 5000 mg/l
Brunswick County Power Freeman, VA 03/12/2013 46,000 gpm (towers for turbine inlet air chillers)
0.0005% drift; 1000 mg/l
St. Joseph Energy Center New Carlisle, IN 12/03/2012 2 towers at 170,000 gpm each 0.0005% drift
Hess Newark Energy Newark, NJ 11/01/2012 220,870 gpm 0.0005% drift; 4150 mg/l
Channel Energy Center, LLC
Houston, TX 10/15/2012 Size not specified 1.33 lb/hr PM10
Pioneer Valley Energy Center (PVEC)
Westfield, MA 04/05/2012 Full wet cooling for 431 MW combined cycle facility – circulating flow not given
0.0005% drift
Deer Park Energy Center LLC
Deer Park, TX 09/26/2012 Cooling tower size not specified PM –3.13 lb/hr PM10/PM2.5 1.75lb/hr
Entergy Ninemile Point Unit 6
Westwego, LA 08/16/2011 Chiller cooling tower 12,000 gpm Unit 6 cooling tower 115,847 gpm
Chiller cooling tower 0.001% drift Unit 6 cooling tower 0.0005% drift
Brockton Power Brockton MA 7/20/2011 92,500 gpm 0.0005% drift; 3235 mg/l
Portland Gen. Electric Carty Plant
Morrow, OR 12/29/2010 Cooling tower circulating water flow rate 85,000 gpm
0.0005% drift; 1200 mg/l
Pondera/King Power Station
Houston, TX 08/05/2010 2 towers - size not specified 1.28 lb/hr/tower
Victorville 2 Hybrid Victorville, CA 03/11/2010 130,000 gpm 0.0005% drift; 5000 mg/l
Stark Power/Wolf Hollow Granbury, TX 03/03/2010 Cooling tower size not specified 0.0005% drift
Russell Energy Center Hayward, CA 02/03/2010 141,352 gpm 0.0005% drift; 6200 mg/l
Panda Sherman Power Grayson, TX 02/03/2010 Cooling tower sizes not specified Main tower 4.68 lb/hr PM, inlet air chiller tower 0.27 lb/hr PM
Both 0.0005% drift
Lamar Power Partners II LLC
Paris, TX 06/22/2009 Cooling tower size not specified 2.4 lb/hr PM10
Pattillo Branch Power LLC Savoy, TX 06/17/2009 4 towers - size not specified 1.0 lb/hr/tower PM
0.3 lb/hr/tower PM10 1Mass emissions (lb/hr) are only specified if comparable units across projects (% drift, total dissolved solids) are not provided.

97
Appendix A
Updates to Footprint Air Emissions Calculations
Updated GE performance data is provided as Attachment A-1 (3 sheets). These sheets update the performance data previously provided. Items that have changed subsequent to the public review drafts issued by MassDEP are highlighted in yellow on all the sheets that are updates of prior sheets. Calculation Sheet 1 presents the potential to emit (PTE) calculations for one turbine. Two operating cases are used to calculate potential emissions (PTE) are 100% load at 50 °F for baseload operation (8,040 hours/year) and 100% load at 90 °F with the duct burners and evaporative coolers on (720 hours per year). GE Case 7 is 100% load at 50 °F, with a heat input of 2,130 MMBtu/hr. GE Case 12 is 100% load at 90 °F with the duct burners and evaporative coolers on with a heat input of 2,449 MMBtu/hr. The PTE values are based on the direct calculation with the exact lb/MMBtu values shown on Calculation Sheet 1. For CO, Calculation Sheet 1 shows the PTE based on 8,760 hours of operation, but the worst case PTE is based on separate calculations using startup and shutdown (SUSD) emissions and an assumed operating scenario. These calculations are provided on Calculation Sheet 2 for GE and reflect a higher PTE for CO compared to those in Calculation Sheet 1. Therefore, the maximum SUSD scenario value for CO PTE is used. Calculation Sheet 1 shows the revised emissions for CO for both the turbine (based on a maximum rate of 8.0 lb/hr/turbine) and the auxiliary boiler with the CO catalyst. The auxiliary boiler CO emission rate with the oxidation catalyst is 10% of the prior rate (0.035 lb/MMBtu)(0.10) = 0.0035 lb/MMBtu. Calculation Sheet 3 in the December 21, 2012 application had been for Siemens SUSD and is now dropped. Calculation Sheets 4, 5, and 6 presented emission calculations for the emergency generator, emergency diesel fire pump, and auxiliary cooling tower respectively. These have not changed and are not repeated here. Calculation Sheet 7 presents the updated overall summary of potential-to-emit (PTE) for the facility. Calculation Sheets 8 and 9 are new, and are the NOx BACT cost spreadsheets for the auxiliary boiler, supporting the values in Table 1-8.

98

99

100

101

102

103

104

105