FOOTBALL CHAMPIONSHIP SUBDIVISION...
91
1 Individual Records 2 Team Records 13 All-Time Leaders on Offense 20 All-Time Leaders on Defense (Since 2000) 39 All-Time Leaders on Special Teams 48 All-Time Team Season Leaders 55 Team Champions 60 Toughest-Schedule Annual Leaders 63 Most-Improved Teams 65 All-Time Team Won-Lost Records 67 Winningest Teams by Decade 69 National Poll Rankings 72 Streaks and Rivalries 82 FCS Stadiums 84 FCS Statistics Trends 87 Classification History 89 Black College National Champions 90 FOOTBALL CHAMPIONSHIP SUBDIVISION RECORDS
Transcript of FOOTBALL CHAMPIONSHIP SUBDIVISION...

1
Individual Records 2Team Records 13All-Time Leaders on Offense 20All-Time Leaders on Defense (Since 2000) 39All-Time Leaders on Special Teams 48All-Time Team Season Leaders 55Team Champions 60Toughest-Schedule Annual Leaders 63Most-Improved Teams 65All-Time Team Won-Lost Records 67Winningest Teams by Decade 69National Poll Rankings 72Streaks and Rivalries 82FCS Stadiums 84FCS Statistics Trends 87Classification History 89Black College National Champions 90
FOOTBALL CHAMPIONSHIP
SUBDIVISION RECORDS

Individual Records 2
INDIVIDUAL RECORDSUnder a three-division reorganization plan adopt-ed by the special NCAA Convention of August 1973, teams classified major-college in football on August 1, 1973, were placed in Division I. College-division teams were divided into Division II and Division III. At the NCAA Convention of January 1978, Division I was divided into Division I-A and Division I-AA for football only. (In 2006, I-A was renamed Football Bowl Subdivision, and I-AA was renamed Football Championship Subdivision.) Beginning in 1979, passers were rated in all divi-sions on “pass efficiency rating points,” which are derived from a formula that compares passers with the national averages for 14 seasons of two-platoon Division I football starting with the 1965 season. One hundred points equals the 14-year averages for all players in Division I. Those aver-ages break down to 6.29 yards per attempt, 47.14 percent completions, 3.97 percent touchdown passes and 6.54 percent interceptions. The for-mula assumes that touchdowns are as good as interceptions are bad; therefore, these two figures offset each other for the average player. To deter-mine efficiency rating points, multiply a passer’s yards per attempt by 8.4, add his completion percentage, add his touchdown percentage times 3.3, then subtract his interception percentage times two.Passers must have a minimum of 15 attempts per game to determine rating points because fewer attempts could allow a player to win the
championship with fewer than 100 attempts in a season. A passer must play in at least 75 percent of his team’s games to qualify for the rankings (for example, a player on a team with a nine-game season could qualify by playing in seven games); thus, a passer with 105 attempts could qualify for the national rankings.In 2000, defensive stats became a part of the sta-tistics. Individual and team records and rankings included only regular-season games through the 2001 season. Career records of players include only those years in which they competed in FCS.
Collegiate RecordsIndividual and team collegiate records are deter-mined by comparing the best records in all four divisions (FBS, FCS, II and III) in comparable categories. Included are career records of play-ers who played parts of their careers in different divisions (such as Dennis Shaw of San Diego State, Howard Stevens of Randolph-Macon and Louisville, and Doug Williams of Grambling). For individual collegiate career leaders and team records, see the collegiate section.
NCAA Defensive Football Statistics Compilation PoliciesAll individual defensive statistics reported to the NCAA must be compiled by the press box sta-tistics crew during the game. Defensive numbers compiled by the coaching staff or other university/
college personnel using game film will not be con-sidered “official” NCAA statistics.This policy does not preclude a conference or institution from making after-the-game changes to press box numbers. This is consistent with exist-ing NCAA policies involving corrections to any offensive statistics after a contest. Any changes to press box numbers must be obvious errors, such as misidentified players, and this should not be interpreted as a way for press box statistics to be later “updated” by the coaching films. Changes should be made within one week after the game is played. Statisticians also are reminded that NCAA policy does not permit changes to away-game statistics unless approved by the home sports information director.It is important to note that this policy applies ONLY to official NCAA statistics and national rankings, and does not mean a coaching staff cannot com-pile separate defensive statistics for institutional use. Those compilations also could appear in the institution’s press releases and/or Web site, as long as they are identified as coaching film numbers rather than official statistics as used by the NCAA.The NCAA statistics staff reserves the right to review any statistics provided to the national office and may withhold publishing/posting those num-bers until the accuracy of those statistics can be substantiated.
OFFENSE
RUSHINGMost RushesQuarter
20—Arnold Mickens, Butler vs. Dayton, Oct. 15, 1994 (4th)
Half32—David Clark, Dartmouth vs. Penn, Nov.
18, 1989 (2nd); Arnold Mickens, Butler vs. Valparaiso, Oct. 8, 1994 (1st)
Game56—Arnold Mickens, Butler vs. Valparaiso, Oct.
8, 1994 (295 yards)Season
450—Jamaal Branch, Colgate, 2003 (2,326 yards) (16 games)
Season Per Game40.9—Arnold Mickens, Butler, 1994 (409 in 10)
Career1,240—Jordan Scott, Colgate, 2005-08 (5,621
yards)Career Per Game
38.2—Arnold Mickens, Butler, 1994-95 (763 in 20)
Most Rushes in Two Consecutive Games
110—Arnold Mickens, Butler, 1994 (56 vs. Valparaiso, Oct. 8; 54 vs. Dayton, Oct. 15)
Most Consecutive Carries by Same PlayerGame
26—Arnold Mickens, Butler vs. Valparaiso, Oct. 8, 1994 (during six series)
Most Yards GainedQuarter
194—Otto Kelly, Nevada vs. Idaho, Nov. 12, 1983 (3rd, 8 rushes)
Half282—Herb Donaldson, Western Ill. vs. Indiana
St., Nov. 4, 2006 (2nd, 26 rushes) Game
437—Maurice Hicks, N.C. A&T vs. Morgan St., Oct. 6, 2001 (34 rushes)
Season2,519—Terrance West, Towson, 2013 (16
games, 413 rushes)Season Per Game
225.5—Arnold Mickens, Butler, 1994 (2,255 in 10)Career
6,559—Adrian Peterson, Ga. Southern, 1998-2001 (996 rushes)
Career Per Game(4 yrs.) 156.2—Adrian Peterson, Ga. Southern,
1998-2001 (6,559 in 42)
Most Yards Gained Per RushGame
(Min. 15 rushes) 21.12—Chase Edmonds, Fordham vs. Lafayette, Oct. 8, 2016 (17 for 359)
(Min. 20 rushes) 17.25—Russell Davis, Idaho vs. Portland St., Oct. 3, 1981 (20 for 345)
Season(Min. 150 rushes) 8.68—Tim Hall, Robert Morris,
1994 (154 for 1,336)(Min. 200 rushes) 7.86—Kade Harrington,
Lamar, 2015 (266 for 2,092)Career
(Min. 350 rushes) 7.40—Tim Hall, Robert Morris, 1994-95 (393 for 2,908)
(Min. 600 rushes) 7.25—Matt Cannon, Southern Utah, 1997-2000 (757 for 5,489)
Most Yards Gained by a FreshmanGame
393—Ryan Fuqua, Portland St. vs. Eastern Wash., Nov. 10, 2001 (45 rushes)
Season1,932—Adrian Peterson, Ga. Southern, 1998
(257 rushes)Season Per Game
175.6—Adrian Peterson, Ga. Southern, 1998 (1,932 in 11)
Most Yards Gained by a QuarterbackGame
316—Jerick McKinnon, Ga. Southern vs. Central Ark., Dec. 1, 2012 (34 rushes)
Season1,844—Jayson Foster, Ga. Southern, 2007 (261
rushes)

Individual Records 3
Season Per Game167.6—Jayson Foster, Ga. Southern, 2007
(1,844 in 11)Career
4,852—Matt Cannon, Southern Utah, 1997-2000 (674 rushes)
Note: Also played as a slotback in 1997 and those statistics are not included
Most Games Gaining 100 Yards or MoreSeason
14—Marshaun Coprich, Illinois St., 2014 (15 games)
Career40—Adrian Peterson, Ga. Southern, 1998-2001
(42 games)
Most Consecutive Games Gaining 100 Yards or MoreSeason
13—Marshun Coprich, Illinois St., 2014Career
36—Adrian Peterson, Ga. Southern, 1998-2001
Most Games Gaining 100 Yards or More by a Freshman
11—Adrian Peterson, Ga. Southern, 1998
Most Games Gaining 200 Yards or MoreSeason
8—Arnold Mickens, Butler, 1994Career
13—Charles Roberts, Sacramento St., 1997-2000
Most Consecutive Games Gaining 200 Yards or MoreSeason
8—Arnold Mickens, Butler, 1994
Most Yards Gained in Two, Three and Four Consecutive Games2 Games
691—Tony Vinson, Towson, 1993 (364 vs. Bucknell, Nov. 13; 327 vs. Morgan St., Nov. 20)
3 Games906—Ryan Fuqua, Portland St., 2001 (393 vs.
Eastern Wash., Nov. 10; 270 vs. CSUN, Nov. 17; 243 vs. Sacramento St., Nov. 24)
4 Games1,109—Arnold Mickens, Butler, 1994 (233 vs.
Georgetown [KY], Sept. 17; 288 vs. Wis.-Stevens Point, Sept. 24; 293 vs. Drake, Oct. 1; 295 vs. Valparaiso, Oct. 8)
Most Seasons Gaining 1,000 Yards or MoreCareer
4—Jerry Azumah, New Hampshire, 1995-98; Adrian Peterson, Ga. Southern, 1998-2001; Alonzo Coleman, Hampton, 2003-06; Don Chapman, UT Martin, 2004-07; Scott Phaydavong, Drake, 2004-07; Jordan Scott, Colgate, 2005-08; Trevyn Smith, Weber St., 2006-09; Chris Evans, Samford, 2007-10; Zach Bauman, Northern Ariz., 2010-13; Tarik Cohen, N.C. A&T, 2013-16
Most Seasons Gaining 2,000 Yards or MoreCareer
3—Zach Zenner, South Dakota St,, 2012-14
Two Players, Same Team, Each Gaining 1,000 Yards or More
35 times; Most recent: Youngstown St. 2016—Jody Webb (1,342) & Martin Ruiz (1,153); Chattanooga 2014—Keon Williams (1,037) & Jacob Huesman (1,009); Illinois St. 2014—Marshaun Coprich (2,274) & Tre Roberson (1,029); Colgate, 2012—Jordan McCord (1,708) & Gavin McCarney (1,406); Ga. Southern, 2012—Jerick McKinnon (1,817) & Dominique Swope (1,246); North Dakota St., 2012—Sam Ojuri (1,047) & John Crockett (1,038); Stony Brook, 2012—Miguel Maysonet (1,964) & Marcus Coker (1,018); Villanova, 2012—Kevin Monangai (1,210) & John Robertson (1,021)
Most Yards Gained by Two Players, Same TeamGame
491—Gavin McCarney (288) & Jordan McCord (203), Colgate vs. Lafayette, Nov. 3, 2012
Season3,138—Terrance West (2,519) & Darius Victor
(629), Towson, 2013
Most 100-Yard Rushers, Same TeamGame
4—Jacksonville St. vs. Jacksonville, Sept. 7, 2013 [Rushers were Troymaine Pope (160), Miles Jones (138), Eli Jenkins (128) & DaMarcus James (105)]
Earliest Game Gaining 1,000 Yards or MoreSeason
5th—Arnold Mickens, Butler, 1994 (1,106); Charles Roberts, Sacramento St., 1999 (1,018)
Most Yards Gained in Opening Game of Season
304—Tony Citizen, McNeese vs. Prairie View, Sept. 6, 1986 (30 rushes)
Most Yards Gained in First Game of Career
304—Tony Citizen, McNeese vs. Prairie View, Sept. 6, 1986 (30 rushes)
Most Touchdowns Scored by RushingGame
7—Archie Amerson, Northern Ariz. vs. Weber St., Oct. 5, 1996
Season41—Terrance West, Towson, 2013 (16 games)
Season Per Game2.64—Terrance West, Towson, 2011 (29 in 11
games)Career
84—Adrian Peterson, Ga. Southern, 1998-2001 (42 games); Terrance West, Towson, 2011-13 (37 games)
Career Per Game2.27—Terrance West, Towson, 2011-13 (84 in
37 games)
Most Touchdowns Scored by Rushing By a QuarterbackSeason
27—Chaz Williams, Ga. Southern, 2002Career
65—Armanti Edwards, Appalachian St., 2006-09Career
1.7—David Dinkins, Morehead St., 1997-2000 (63 in 37)
Longest Play99—Hubert Owens, Mississippi Val. vs. Ark.-
Pine Bluff, Sept. 20, 1980; Pedro Bacon, Western Ky. vs. West Ala., Sept. 13, 1986 (only rush of the game); Phillip Collins, Missouri St. vs. Western Ill., Sept. 16, 1989; Jim Varick, Monmouth vs. Sacred Heart, Oct. 29, 1994; Jermaine Creighton, St. John’s (NY) vs. Siena, Nov. 2, 1996; Michael Hobbs, Wofford vs. Ga. Southern, Nov. 4, 2006; David Sinisi, Monmouth vs. Sacred Heart, Oct. 6, 2007; Bobby Washington, Eastern Ky. vs. Murray St., Oct. 27, 2007; Zach Zenner, South Dakota St. vs. Kansas, Sept. 1, 2012; Lewis Washington, Southeast Mo. St. vs. Tennessee St., Oct. 5, 2013
ALL-PURPOSE YARDS(Yardage Gained From Rushing, Receiving and All Runbacks; Must Have One Attempt From at Least Two Categories)
Most PlaysGame
54—Ron Darby, Marshall vs. Western Caro., Nov. 12, 1988 (47 rushes, 4 receptions, 3 kickoff returns; 329 yards)
Note: 56—Arnold Mickens, Butler vs. Valparaiso, Oct. 8, 1994; all rushesSeason
453—Jamaal Branch, Colgate, 2003 (450 rushes, 3 receptions; 2,350 yards)
Career1,303—Jordan Scott, Colgate, 2005-08 (1,240
rushes, 62 receptions, 1 kickoff return; 6,153 yards)
Most Yards GainedGame
467—Joey Stockton, Western Ky. vs. Austin Peay, Sept. 16, 1995 (29 rushing, 276 receiving, 18 punt returns, 144 kickoff returns; 14 plays)

Individual Records 4
Season3,026—Brian Westbrook, Villanova, 1998 (1,046
rushing, 1,144 receiving, 192 punt returns, 644 kickoff returns; 329 plays)
Season Per Game275.1—Brian Westbrook, Villanova, 1998 (3,026
in 11)Career
9,512—Brian Westbrook, Villanova, 1997-98, 2000-01 (4,298 rushing, 2,582 receiving, 343 punt returns, 2,289 kickoff returns; 1,022 plays)
Career Per Game216.2—Brian Westbrook, Villanova, 1997-98,
2000-01 (9,512 in 44)
Most Yards Gained by a FreshmanGame
437—Ryan Fuqua, Portland St. vs. Eastern Wash., Nov. 10, 2001 (393 rushing, 44 kickoff returns)
Season2,014—David Wright, Indiana St., 1992 (1,313
rushing, 108 receiving, 593 kickoff returns; 254 plays)
Most Yards Gained Per PlayGame
(Min. 20 plays) 20.6—Herman Hunter, Tennessee St. vs. Mississippi Val., Nov. 13, 1982 (453 on 22)
Season(Min. 1,000 yards, 100 plays) 19.7—Otis
Washington, Western Caro., 1988 (2,086 on 106)
Career(Min. 4,000 yards, 350 plays) 17.2—Eddie Conti,
Delaware, 1994-98 (6,096 on 355)
Gaining 1,000 yards rushing and 1,000 yards receivingSeason
Brian Westbrook, Villanova, 1998 (1,046 rushing, 1,144 receiving)
Team Having a 200-Yard Rusher and a 200-Yard Receiver in the Same Game
Portland St., Charles Dunn (247 rushing yards) and Art Williams (208 receiving yards) vs. Sacramento St., Oct. 10, 1998 (Portland St. won, 58-31); Portland St., Charles Dunn (213 rushing yards) and Terry Charles (209 receiving yards) vs. Cal Poly, Oct. 30, 1999 (Portland St. won, 42-28); Murray St., Mike Harris (212 rushing yards) and Marcus Harris (213 receiving yards) vs. Missouri St., Oct. 9, 2010 (Murray St. won, 72-59); Jacksonville St., Washaun Ealey (217 rushing yards) and Alan Bonner (205 receiving yards) vs. Eastern Ky., Nov. 5, 2011 (Eastern Ky. won, 52-48); UC Davis, Manusamoa Luuga (249 rushing yards) and Keelan Doss (207 receiving yards) vs. Sacramento St., Nov. 19, 2016
PASSINGHighest Passing Efficiency Rating PointsGame
(Min. 15 atts.) 389.9—Mark Washington, Jackson St. vs. Alcorn, Nov. 20, 1999 (17 attempts, 16 completions, 0 interceptions, 363 yards, 6 TD passes)
(Min. 25 atts.) 319.07—Matt Barr, Western Ill. vs. Illinois St., Oct. 30, 2010 (25 attempts, 22 completions, 0 interceptions, 452 yards, 6 TD passes)
(Min. 45 atts.) 243.8—Derek Carr, UT Martin vs. Murray St., Oct. 13, 2012 (46 attempts, 42 completions, 0 interceptions, 560 yards, 7 TD passes)
Season(Min. 15 atts. per game) 204.6—Shawn Knight,
William & Mary, 1993 (177 attempts, 125 completions, 4 interceptions, 2,055 yards, 22 TD passes)
Career(Min. 300 comps.) 176.7—Josh Johnson,
San Diego, 2004-07 (1,065 attempts, 724 completions, 15 interceptions, 9,699 yards, 113 TD passes)
Most Passes AttemptedQuarter
33—Joe Walland, Yale vs. Harvard, Nov. 20, 1999 (3rd, completed 20)
Half51—Joe Walland, Yale vs. Harvard, Nov. 20,
1999 (2nd, completed 33)Game
85—Jeremy Moses, SFA vs. Sam Houston St., Nov. 1, 2008 (completed 57)
Season598—Jeremy Moses, SFA, 2008 (completed
352)Season Per Game
52.5—Joe Lee, Towson, 1999 (577 in 11)Career
1,893—Jeremy Moses, SFA, 2007-10 (completed 1,184)
Career Per Game(Min. 1,000 atts.) 47.5—Kevin Yost, Idaho St.,
2011-12 (1,046 in 22)(Min. 1,800 atts.) 43.0—Jeremy Moses, SFA,
2007-10 (1,893 in 44)
Most Passes Attempted by a FreshmanGame
66—Chris Swartz, Morehead St. vs. Tennessee Tech, Oct. 17, 1987 (completed 35); Kevin Glenn, Illinois St. vs. Western Ill., Nov. 8, 1997 (completed 41)
Season592—Martin Hankins, Southeastern La., 2003
(completed 353)Season Per Game
49.3—Martin Hankins, Southeastern La., 2003 (592 in 12)
Most Passes CompletedQuarter
20—Joe Walland, Yale vs. Harvard, Nov. 20, 1999 (3rd, attempted 33)
Half33—Joe Walland, Yale vs. Harvard, Nov. 20,
1999 (2nd, attempted 51)
Game57—Jeremy Moses, SFA vs. Sam Houston St.,
Nov. 1, 2008 (attempted 85)Season
398—Taylor Heinicke, Old Dominion, 2012 (attempted 579)
Season Per Game32.6—Casey Brockman, Murray St., 2012 (359
in 11)Career
1,184—Jeremy Moses, SFA, 2007-10 (attempted 1,893)
Career Per Game(Min. 500 comp.) 29.5—Kevin Yost, Idaho St.,
2011-12 (649 in 22)(Min. 1,000 comp.) 26.9—Jeremy Moses, SFA,
2007-10 (1,184 in 44)
Most Passes Completed by a FreshmanGame
42—Travis Brown, Northern Ariz. vs. Montana, Oct. 26, 1996 (attempted 65); Martin Hankins, Southeastern La. vs. Jacksonville, Nov. 8, 2003 (attempted 57)
Season353—Martin Hankins, Southeastern La., 2003
(attempted 592)Season Per Game
29.4—Martin Hankins, Southeastern La., 2003 (353 in 12)
Most Consecutive Passes CompletedGame
29—Quinn Epperly, Princeton vs. Cornell, Nov. 2, 2013
Most Consecutive Passes Completed to Start Game
29—Quinn Epperly, Princeton vs. Cornell, Nov. 2, 2013
Most Consecutive Passes Completed to Start First Game as a Freshman
12—Daunte Culpepper, UCF vs. Eastern Ky., Aug. 31, 1995
Most Consecutive Passes Completed in First Game as a Quarterback
20—Logan Hallock, Appalachian St. vs. Western Caro., Oct. 27, 2012
Highest Percentage of Passes CompletedGame
(Min. 20 comps.) 96.2%—Ricky Santos, New Hampshire vs. Northeastern, Oct. 22, 2005 (25 of 26)
(Min. 30 comps.) 91.4%—Quinn Epperly, Princeton vs. Cornell, Nov. 2, 2013 (32 of 35)
Season(Min. 200 atts.) 75.2%—Eric Sanders, UNI,
2007 (237 of 315)Career
(Min. 750 atts.) 69.6%—Eric Sanders, UNI, 2004-07 (714 of 1,026)

Individual Records 5
Most Yards GainedQuarter
293—Taylor Heinicke, Old Dominion vs. New Hampshire, Sept. 22, 2012 (4th)
Half480—Taylor Heinicke, Old Dominion vs. New
Hampshire, Sept. 22, 2012 (2nd)Game
730—Taylor Heinicke, Old Dominion vs. New Hampshire, Sept. 22, 2012
Season5,160—Gage Gubrud, Eastern Wash., 2016 (14
games)Season Per Game
455.7—Willie Totten, Mississippi Val., 1984 (4,557 in 10)
Career14,496—Steve McNair, Alcorn, 1991-94
Career Per Game350.0—Neil Lomax, Portland St., 1978-80
(11,550 in 33)
Most Yards Gained by a FreshmanGame
540—Brad Otton, Weber St. vs. Northern Ariz., Nov. 6, 1993
Season3,537—Martin Hankins, Southeastern La., 2003
(12 games)Season Per Game
308.9—Travis Brown, Northern Ariz., 1996 (3,398 in 11)
Most Yards Gained in Two, Three and Four Consecutive Games2 Games
1,216—Taylor Heinicke, Old Dominion, 2012 (486 vs. Campbell, Sept. 15; 730 vs. New Hampshire, Sept. 22)
3 Games1,626—Steve McNair, Alcorn, 1994 (587 vs.
Samford, Oct. 29; 563 vs. Mississippi Val., Nov. 5; 476 vs. Troy, Nov. 12)
4 Games2,159—Steve McNair, Alcorn, 1994 (587 vs.
Samford, Oct. 29; 563 vs. Mississippi Val., Nov. 5; 476 vs. Troy, Nov. 12; 533 vs. Jackson St., Nov. 19)
Most Games Gaining 200 Yards or MoreSeason
14—Vernon Adams, Eastern Wash., 2013Career
41—Steve McNair, Alcorn, 1991-94 (42 games); Dominic Randolph, Holy Cross, 2006-09 (43 games)
Most Consecutive Games Gaining 200 Yards or MoreSeason
13—Jeremy Moses, SFA, 2009; Chris Lum, Lehigh, 2011; Taylor Heinicke, Old Dominion, 2012
Career41—Dominic Randolph, Holy Cross, 2006-09
Most Games Gaining 300 Yards or MoreSeason
11—Gage Gubrud, Eastern Wash., 2016Career
28—Neil Lomax, Portland St., 1978-80
Most Consecutive Games Gaining 300 Yards or MoreSeason
10—Willie Totten, Mississippi Val., 1984; John Friesz, Idaho, 1989
Career13—Neil Lomax, Portland St., 1979-80
Most Yards Gained Against One OpponentCareer
1,675—Willie Totten, Mississippi Val. vs. Prairie View, 1982-85
Career Per Game418.8—Willie Totten, Mississippi Val. vs. Prairie
View, 1982-85 (1,675 in 4)
Quarterbacks Passing for 300 Yards and Rushing for 100 in a GameGame
23 times. Most recent: Javaughn Craig, Austin Peay vs. Tennessee St., Nov. 5, 2016 (322 passing, 144 rushing); Mike White, Marist vs. Stetson, Nov. 5, 2016 (344 passing, 102 rushing); Ronald Butler, Tennessee St. vs. Murray St., Oct. 29, 2016 (329 passing, 109 rushing); Chris Streveler, South Dakota vs. Western Ill., Oct. 29, 2016 (378 passing, 102 rushing); Taryn Christion, South Dakota St. vs. North Dakota St., Oct. 15, 2016 (303 passing, 141 rushing)
Most Yards Per AttemptGame
(Min. 30 atts.) 16.1—Gilbert Renfroe, Tennessee St. vs. Dist. Columbia, Nov. 5, 1983 (30 for 484)
(Min. 45 atts.) 12.7—Todd Hammel, SFA vs. La.-Monroe, Nov. 11, 1989 (45 for 571)
Season(Min. 250 atts.) 10.31—Mike Smith, UNI, 1986
(303 for 3,125)(Min. 325 atts.) 10.28—Vernon Adams, Eastern
Wash., 2013 (486 for 4,994)Career
(Min. 500 atts.) 9.5—Jay Johnson, UNI, 1989-92 (744 for 7,049)
(Min. 1,000 atts.) 9.2—Dave Dickenson, Montana, 1992-95 (1,208 for 11,080)
Most Yards Gained Per CompletionGame
(Min. 15 comps.) 28.5—Kendrick Nord, Grambling vs. Alcorn, Sept. 3, 1994 (17 for 485)
(Min. 20 comps.) 24.2—Matt Nagy, Delaware vs. UConn, Nov. 7, 1998 (23 for 556)
Season(Min. 200 comps.) 16.7—Bruce Eugene,
Grambling, 2002 (269 for 4,483)Career
(Min. 350 comps.) 17.8—Jay Johnson, UNI, 1989-92 (397 for 7,049)
(Min. 400 comps.) 16.0—Shane Stafford, UConn, 1995-98 (522 for 8,368)
Most Touchdown PassesQuarter
7—Neil Lomax, Portland St. vs. Delaware St., Nov. 8, 1980 (1st)
Half7—Neil Lomax, Portland St. vs. Delaware St.,
Nov. 8, 1980 (1st)Game
9—Willie Totten, Mississippi Val. vs. Kentucky St., Sept. 1, 1984; Drew Hubel, Portland St. vs. Weber St., Oct. 27, 2007
Season57—Jeremiah Briscoe, Sam Houston St., 2016
Season Per Game5.6—Willie Totten, Mississippi Val., 1984; Bruce
Eugene, Grambling, 2005 (56 in 10)Career
140—Bruce Eugene, Grambling, 2001-05Career Per Game
3.5—Willie Totten, Mississippi Val., 1982-85 (139 in 40)
Most touchdown Passes by a FreshmanSeason
31—Ricky Santos, New Hampshire, 2004 (13 games); Scott Riddle, Elon, 2007 (11 games)
Most Consecutive Games Throwing a Touchdown PassCareer
42—Dominic Randolph, Holy Cross, 2006-09
Most Touchdown Passes, Same Passer and ReceiverSeason
27—Willie Totten to Jerry Rice, Mississippi Val., 1984
Career53—Ricky Santos to David Ball, New Hampshire,
2004-06
Highest Percentage of Passes for TouchdownsSeason
(Min. 200 atts.) 12.5%—Ted White, Howard, 1996 (36 of 289)
(Min. 300 atts.) 11.33%—Jeremiah Briscoe, Sam Houston St., 2016 (57 of 503)
Career(Min. 500 atts.) 10.61%—Josh Johnson, San
Diego, 2004-07 (113 of 1,065)
Most Passes Had InterceptedGame
7—Mick Spoon, Idaho St. vs. Montana, Oct. 21, 1978 (attempted 35); Charles Hebert, Southeastern La. vs. Northwestern St., Nov. 12, 1983 (23 attempts); Carlton Jenkins, Mississippi Val. vs. Prairie View, Oct. 31, 1987 (34 attempts); Dan Crowley, Towson vs. Maine, Nov. 16, 1991 (53 attempts)
Season29—Willie Totten, Mississippi Val., 1985 (492
attempts)
Individual Records 6
Season Per Game2.6—Willie Totten, Mississippi Val., 1985 (29 in 11)
Career75—Willie Totten, Mississippi Val., 1982-85
Career Per Game2.0—John Witkowski, Columbia, 1981-83 (60
in 30)
Lowest Percentage of Passes Had InterceptedSeason
(Min. 175 atts.) 0.36%—Eric Rasmussen, San Diego, 2002 (1 of 279)
(Min. 325 atts.) 0.78%—Pat Devlin, Delaware, 2010 (3 of 384)
Career(Min. 750 atts.) 1.41%—Josh Johnson, San
Diego, 2004-07 (15 of 1,065)
Most Passes Attempted Without An InterceptionRegulation Game
79—Taylor Heinicke, Old Dominion vs. New Hampshire, Sept. 22, 2012 (completed 55)
Entire Season150—Ryan Fitzpatrick, Harvard, 2002
(completed 94)
Most Consecutive Passes Attempted Without An InterceptionSeason
342—Jimmy Blanchard, Portland St., 1999 (in 11 games, from Sept. 4 through Nov. 13)
Career342—Jimmy Blanchard, Portland St., began
Sept. 4, 1999, ended Nov. 13, 1999
TOTAL OFFENSE(Rushing Plus Passing)
Most PlaysQuarter
33—Mickey Fein, Maine vs. UConn, Oct. 11, 1997 (4th)
Half59—Joe Walland, Yale vs. Harvard, Nov. 20,
1999 (2nd)Game
93—Jeremy Moses, SFA vs. Sam Houston St., Nov. 1, 2008 (446 yards)
Season705—Taylor Heinicke, Old Dominion, 2012
(5,546 yards)Season Per Game
59.0—Steve McNair, Alcorn, 1994 (649 in 11)Career
2,140—Ricky Santos, New Hampshire, 2004-07 (14,615 yards)
Career Per Game(Min. 20 games) 55.7—Kevin Yost, Idaho St.,
2011-12 (1,226 in 22)
Most Plays by a FreshmanGame
81—Kevin Glenn, Illinois St. vs. Western Ill., Nov. 8, 1997 (470 yards)
Season632—Martin Hankins, Southeastern La., 2003
(3,390 yards)
Season Per Game52.7—Martin Hankins, Southeastern La., 2003
(632 in 12)
Most Yards GainedQuarter
293—Taylor Heinicke, Old Dominion vs. New Hampshire, Sept. 22, 2012 (4th)
Half496—Taylor Heinicke, Old Dominion vs. New
Hampshire, Sept. 22, 2012 (2nd)Game
791—Taylor Heinicke, Old Dominion vs. New Hampshire, Sept. 22, 2012 (730 passing, 61 rushing)
Season5,799—Steve McNair, Alcorn, 1994 (4,863
passing, 936 rushing)Season Per Game
527.2—Steve McNair, Alcorn, 1994 (5,799 in 11)Career
16,823—Steve McNair, Alcorn, 1991-94 (14,496 passing, 2,327 rushing)
Career Per Game(Min. 6,000 yards) 400.5—Steve McNair, Alcorn,
1991-94 (16,823 in 42)
Most Seasons Gaining 3,000 Yards or More
4—Steve McNair, Alcorn, 1991-94; Armanti Edwards, Appalachian St., 2006-09
Most Yards Gained by a FreshmanGame
538—Ricky Santos, New Hampshire vs. Villanova, Oct. 2, 2004 (61 plays)
Season3,738—Scott Riddle, Elon, 2007 (508 plays)
Season Per Game339.8—Scott Riddle, Elon, 2007 (3,738 in 11)
Most Yards Gained in Two, Three and Four Consecutive Games2 Games
1,318—Taylor Heinicke, Old Dominion, 2012 (527 vs. Campbell, Sept. 15; 791 vs. New Hampshire, Sept. 22)
3 Games1,859—Steve McNair, Alcorn, 1994 (649 vs.
Samford, Oct. 29; 624 vs. Mississippi Val., Nov. 5; 586 vs. Troy, Nov. 12)
4 Games2,423—Steve McNair, Alcorn, 1994 (649 vs.
Samford, Oct. 29; 624 vs. Mississippi Val., Nov. 5; 586 vs. Troy, Nov. 12; 564 vs. Jackson St., Nov. 19)
Most Games Gaining 300 Yards or MoreSeason
12—Vernon Adams, Eastern Wash., 2013; Gage Gubrud, Eastern Wash., 2016
Career32—Steve McNair, Alcorn, 1991-94
Most Consecutive Games Gaining 300 Yards or MoreSeason
11—Steve McNair, Alcorn, 1994
Career13—Neil Lomax, Portland St., 1979-80; Willie
Totten, Mississippi Val., 1984-85; Steve McNair, Alcorn, 1992-93; Dominic Randolph, Holy Cross, 2008-09
Most Games Gaining 400 Yards or MoreSeason
9—Steve McNair, Alcorn, 1994Career
15—Steve McNair, Alcorn, 1991-94
Most Consecutive Games Gaining 400 Yards or MoreSeason
5—Willie Totten, Mississippi Val., 1984; Steve McNair, Alcorn, 1994
Most Games Gaining 500 Yards or MoreSeason
6—Steve McNair, Alcorn, 1994Career
9—Steve McNair, Alcorn, 1991-94
Most Yards Gained Against One OpponentCareer
1,772—Steve McNair, Alcorn vs. Jackson St., 1991-94
Career Per Game443.0—Steve McNair, Alcorn vs. Jackson St.,
1991-94 (1,772 in 4)
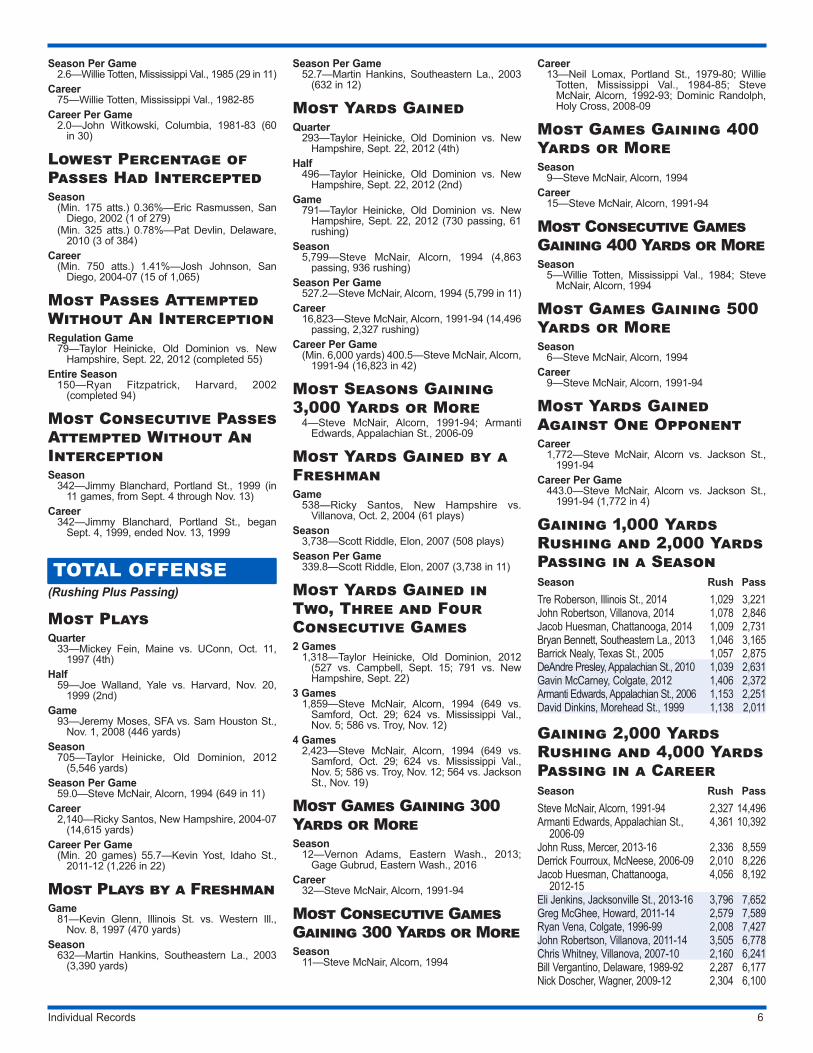
Gaining 1,000 Yards Rushing and 2,000 Yards Passing in a SeasonSeason Rush PassTre Roberson, Illinois St., 2014 1,029 3,221John Robertson, Villanova, 2014 1,078 2,846Jacob Huesman, Chattanooga, 2014 1,009 2,731Bryan Bennett, Southeastern La., 2013 1,046 3,165Barrick Nealy, Texas St., 2005 1,057 2,875 DeAndre Presley, Appalachian St., 2010 1,039 2,631Gavin McCarney, Colgate, 2012 1,406 2,372Armanti Edwards, Appalachian St., 2006 1,153 2,251David Dinkins, Morehead St., 1999 1,138 2,011
Gaining 2,000 Yards Rushing and 4,000 Yards Passing in a CareerSeason Rush PassSteve McNair, Alcorn, 1991-94 2,327 14,496Armanti Edwards, Appalachian St.,
2006-094,361 10,392
John Russ, Mercer, 2013-16 2,336 8,559Derrick Fourroux, McNeese, 2006-09 2,010 8,226Jacob Huesman, Chattanooga,
2012-154,056 8,192
Eli Jenkins, Jacksonville St., 2013-16 3,796 7,652Greg McGhee, Howard, 2011-14 2,579 7,589Ryan Vena, Colgate, 1996-99 2,008 7,427John Robertson, Villanova, 2011-14 3,505 6,778Chris Whitney, Villanova, 2007-10 2,160 6,241Bill Vergantino, Delaware, 1989-92 2,287 6,177Nick Doscher, Wagner, 2009-12 2,304 6,100

Individual Records 7
Season Rush PassJake Melville, Colgate, 2013-16 2,468 5,885Gavin McCarney, Colgate, 2011-13 2,783 5,682David Dinkins, Morehead St., 1997-2000 3,765 5,572Greg Sullivan, Colgate, 2007-10 2,337 4,996Tracy Ham, Ga. Southern, 1984-86 2,506 4,871Matt Scheible, Southeast Mo. St.,
2008-112,595 4,841
Travis Wilson, Wofford, 1998-2001 2,488 4,067
Most Yards Gained Per PlayGame
(Min. 40 plays) 12.40—John Whitcomb, UAB vs. Prairie View, Nov. 19, 1994 (43 for 533)
(Min. 50 plays) 11.35—Steve McNair, Alcorn vs. Chattanooga, Sept. 10, 1994 (57 for 647)
(Min. 60 plays) 9.92—Braden Hanson, North Dakota vs. Montana, Oct. 20, 2012 (66 for 655)
(Min. 70 plays) 8.79—Taylor Heinicke, Old Dominion vs. New Hampshire, Sept. 22, 2012 (90 for 791)
Season(Min. 2,500 yards) 9.57—Frank Baur, Lafayette,
1988 (285 for 2,727)(Min. 3,300 yards) 9.06—Vernon Adams,
Eastern Wash., 2013 (618 for 5,599)Career
(Min. 4,000 yards) 8.47—Vernon Adams, Eastern Wash., 2012-14 (1,378 for 11,665)
Most Touchdowns Responsible For(TDs Scored and Passed For)Game
9—Neil Lomax, Portland St. vs. Delaware St., Nov. 8, 1980 (passed for 8, scored 1); Willie Totten, Mississippi Val. vs. Kentucky St., Sept. 1, 1984 (passed for 9) & vs. Prairie View, Oct. 27, 1984 (passed for 8, scored 1); Drew Hubel, Portland St. vs. Weber St., Oct. 27, 2007 (passed for 9)
Season61—Willie Totten, Mississippi Val., 1984 (passed
for 56, scored 5)Season Per Game
6.1—Willie Totten, Mississippi Val., 1984 (61 in 10)
Career159—Bruce Eugene, Grambling, 2001-05
(passed for 140, scored 19)Career Per Game
3.9—Willie Totten, Mississippi Val., 1982-85 (157 in 40)
Most Points Responsible For(Points scored and passed for)Game
56—Willie Totten, Mississippi Val. vs. Kentucky St., Sept. 1, 1984 (passed for 9 TDs and 1 two-point conversion)
Season368—Willie Totten, Mississippi Val., 1984
(passed for 56 TDs, scored 5 TDs and passed for 1 two-point conversion)
Season Per Game36.8—Willie Totten, Mississippi Val., 1984 (368
in 10)Career
960—Bruce Eugene, Grambling, 2001-05 (passed for 140 TDs, scored 19 TDs and passed for 3 two-point conversions)
Career Per Game23.7—Willie Totten, Mississippi Val., 1982-85
(946 in 40)
RECEIVINGMost Passes CaughtGame
24—Jerry Rice, Mississippi Val. vs. Southern U., Oct. 1, 1983 (219 yards); Chas Gessner, Brown vs. Rhode Island, Oct. 5, 2002 (206 yards)
Season136—Erik Lora, Eastern Ill., 2012 (1,664 yards)
Season Per Game12.0—Stephen Campbell, Brown, 2000 (120
in 10)Career
428—Cooper Kupp, Eastern Wash., 2013-16 (6,464 yards)
Career Per Game8.78—Terrell Hudgins, Elon, 2006-09 (395 in 45)
Most Consecutive Games Catching a Pass
52—Cooper Kupp, Eastern Wash., 2013-16
Most Passes Caught by a Tight EndGame
18—Brian Forster, Rhode Island vs. Brown, Sept. 28, 1985 (327 yards)
Season120—Stephen Campbell, Brown, 2000 (1,332
yards)Season Per Game
12.0—Stephen Campbell, Brown, 2000 (120 in 10)
Career245—Brian Forster, Rhode Island, 1983-85,
1987 (3,410 yards)
Most Passes Caught by a Running BackGame
21—David Pandt, Montana St. vs. Eastern Wash., Sept. 21, 1985 (169 yards)
Season89—Brian Westbrook, Villanova, 1998 (1,144
yards)Career
188—Jason Corle, Towson, 1996-99 (1,725 yards)
Most Passes Caught by a FreshmanGame
21—Jerry Louie-McGee, Montana vs. Cal Poly, Sept. 24, 2016 (155 yards)
Season93—Cooper Kupp, Eastern Wash., 2013 (1,691
yards)
Most Passes Caught by Two Players, Same TeamSeason
208—Erik Lora (123 for 1,544 yards and 19 TDs) & Adam Drake (85 for 1,305 yards and 13 TDs), Eastern Ill., 2013
Career639—Cooper Kupp (428 for 6,464 yards and 73
TDs) & Kendrick Bourne (211 for 3,130 yards and 27 TDs), Eastern Wash., 2013-16
Most Yards GainedGame
376—Kassim Osgood, Cal Poly vs. UNI, Nov. 4, 2000 (caught 17)
Season1,850—Brandon Kaufman, Eastern Wash.,
2012 (caught 93)Season Per Game
168.2—Jerry Rice, Mississippi Val., 1984 (1,682 in 10)
Career6,464—Cooper Kupp, Eastern Wash., 2013-16
(caught 428)Career Per Game
(Min. 2,000 yds.) 124.3—Cooper Kupp, Eastern Wash., 2013-16 (6,464 in 52)
Most Yards Gained by a Tight EndGame
327—Brian Forster, Rhode Island vs. Brown, Sept. 28, 1985 (caught 18)
Season1,617—Brian Forster, Rhode Island, 1985
(caught 115)Season Per Game
161.7—Brian Forster, Rhode Island, 1985 (1,617 in 10)
Career3,410—Brian Forster, Rhode Island, 1983-85,
1987 (caught 245)
Most Yards Gained by a Running BackGame
246—Sam Hoekstra, San Diego vs. Dayton, Oct. 27, 2012 (caught 11)
Season1,152—Gordie Lockbaum, Holy Cross, 1987
(caught 78)Season Per Game
104.7—Gordie Lockbaum, Holy Cross, 1987 (1,152 in 11)
Most Yards Gained by a FreshmanGame
284—Jacquay Nunnally, Florida A&M vs. N.C. A&T, Oct. 11, 1997 (caught 13)
Season1,691—Cooper Kupp, Eastern Wash., 2013
(caught 93)
Most Yards Gained by Two Players, Same TeamSeason
2,924—Cooper Kupp (1,691, 93 caught and 21 TDs) & Ashton Clark (1,233, 83 caught and 10 TDs), Eastern Wash., 2013
Career9,594—Cooper Kupp (6,464, 428 caught and 73
TDs) & Kendrick Bourne (3,130, 211 caught and 27 TDs), Eastern Wash., 2013-16

Individual Records 8
Most Yards Gained Per ReceptionGame
(Min. 5 receps.) 44.6—John Taylor, Delaware St. vs. St. Paul’s, Sept. 21, 1985 (5 for 223)
(Min. 10 receps.) 31.5—Patrick Walker, Northern Colo. vs. North Dakota, Oct. 29, 2011 (10 for 315)
Season(Min. 35 receps.) 28.9—Mikhael Ricks, SFA,
1997 (47 for 1,358)(Min. 60 receps.) 21.0—Kevin Norrell, Stony
Brook, 2012 (66 for 1,388)Career
(Min. 90 receps.) 24.3—John Taylor, Delaware St., 1982-85 (100 for 2,426)
(Min. 125 receps.) 22.0—Dedric Ward, UNI, 1993-96 (176 for 3,876)
Most Games Gaining 100 Yards or MoreCareer
31—Cooper Kupp, Eastern Wash., 2013-16 (52 games)
Most Touchdown Passes CaughtGame
6—Cos DeMatteo, Chattanooga vs. Mississippi Val., Sept. 16, 2000 (9 total catches for 203 yards)
Season27—Jerry Rice, Mississippi Val., 1984
Season Per Game2.7—Jerry Rice, Mississippi Val., 1984 (27 in 10)
Career73—Cooper Kupp, Eastern Wash., 2013-16
Career Per Game1.40—Cooper Kupp, Eastern Wash., 2013-16
(73 in 52)
Most Touchdown Passes Caught by a FreshmanSeason
21—Cooper Kupp, Eastern Wash., 2013
Most Games Catching a Touchdown PassSeason
14—Cooper Kupp, Eastern Wash., 2013Consecutive Games in a Season
14—Cooper Kupp, Eastern Wash., 2013Career
42—Cooper Kupp, Eastern Wash., 2013-16Consecutive Games in a Career
20—Ramses Barden, Cal Poly, 2007-08Games With Two or More Touchdown Receptions
24—Cooper Kupp, Eastern Wash., 2013-16
SCORINGMost Points ScoredGame
42—Archie Amerson, Northern Ariz. vs. Weber St., Oct. 5, 1996 (7 TDs); Jessie Burton, McNeese vs. Southern Utah, Sept. 19, 1998 (7 TDs); Omar Cuff, Delaware vs. William & Mary, Aug. 30, 2007 (7 TDs)
Season252—Terrance West, Towson, 2013 (42 TDs)
Season Per Game16.2—Jerry Rice, Mississippi Val., 1984 (162
in 10)Career
544—Brian Westbrook, Villanova, 1997-98, 2000-01 (89 TDs, 10 extra points scored)
Career Per Game(Min. 200 pts.) 13.95—Terrance West, Towson,
2011-13 (516 in 37)
Most Touchdowns ScoredGame
7—Archie Amerson, Northern Ariz. vs. Weber St., Oct. 5, 1996; Jessie Burton, McNeese vs. Southern Utah, Sept. 19, 1998; Omar Cuff, Delaware vs. William & Mary, Aug. 30, 2007
Season42—Terrance West, Towson, 2013
Season Per Game2.70—Jerry Rice, Mississippi Val., 1984 (27 in
10)Career
89—Brian Westbrook, Villanova, 1997-98, 2000-01
Career Per Game(Min. 30 games) 2.32—Terrance West, Towson,
2011-13 (86 in 37)
Most Consecutive Games Scoring a TouchdownCareer
20—David Sinisi, Monmouth (from Sept. 2, 2006, through Nov. 10, 2007)
Most Touchdowns Scored by a FreshmanSeason
29—Terrance West, Towson, 2011Season Per Game
2.6—Terrance West, Towson, 2011 (29 in 11)
Passing for a Touchdown and Scoring Touchdowns by Rushing, Receiving and Punt ReturnGame
WR Sean Beckton, UCF, threw a 33-yard touchdown pass, rushed for an 11-yard touchdown, caught a 17-yard touchdown pass and returned a punt 60 yards for a touchdown vs. Texas Southern, Nov. 17, 1990
Most Extra Points Attempted by KickingGame
15—John Kincheloe, Portland St. vs. Delaware St., Nov. 8, 1980 (15 made)
Season92—Tyler Gray, James Madison, 2016 (90
made)Season Per Game
7.2—Jonathan Stokes, Mississippi Val., 1984 (72 in 10)
Career268—Luc Swimberghe, Sam Houston St., 2013-
16 (261 made)
Most Extra Points Made by KickingGame
15—John Kincheloe, Portland St. vs. Delaware St., Nov. 8, 1980 (15 attempts)
Season90—Tyler Gray, James Madison, 2016 (92
attempts)Season Per Game
6.8—Jonathan Stokes, Mississippi Val., 1984 (68 in 10)
Career261—Luc Swimberghe, Sam Houston St., 2013-
16 (268 attempts)Career Per Game
5.3—Luc Swimberghe, Sam Houston St., 2013-16 (261 in 49 games)
Best Perfect Record of Extra Points MadeSeason
73 of 73—Jarod Brown, Old Dominion, 2012Career
114 of 114—Tyler Sievertsen, UNI, 2011-13
Highest Percentage of Extra Points MadeCareer
(Min. 120 atts.) 99.2%—Brian Mitchell, Marshall/UNI, 1987, 1989-91 (130 of 131)
Most Consecutive Extra Points MadeGame
15—John Kincheloe, Portland St. vs. Delaware St., Nov. 8, 1980
Season73—Jarod Brown, Old Dominion, 2012
Career151—Adrian Mora, Ga. Southern, 2008-11
Most Points Scored by KickingGame
24—Goran Lingmerth, Northern Ariz. vs. Idaho, Oct. 25, 1986 (8 FGs)
Season134—Griffin Thomas, Jacksonville St., 2013 (24
of 32 FGs, 62 of 63 PATs)Season Per Game
10.1—Rob Hart, Murray St., 1996 (112 in 11)Career
407—Dan Carpenter, Montana, 2004-07 (75 FGs, 182 PATs)
Career Per Game9.1—Tony Zendejas, Nevada, 1981-83 (300
in 33)
Most Two-Point AttemptsSeason
11—Brent Woods, Princeton, 1982; Jamie Martin, Weber St., 1990
Most Successful Two-Point PassesGame
3—Brent Woods, Princeton vs. Lafayette, Nov. 6, 1982 (attempted 3)
Season7—Jamie Martin, Weber St., 1992 (attempted 7)
Career15—Jamie Martin, Weber St., 1989-92
(attempted 28)

Individual Records 9
DEFENSE
DEFENSIVE RECORDS
(Since 2000)
Total TacklesGame
30—Josh Cain, Chattanooga vs. The Citadel, Nov. 3, 2001; Kevin Talley, Norfolk St. vs. Savannah St., Sept. 11, 2004; Donald Payne, Stetson vs. Campbell, Nov. 1, 2014
Season195—Kevin Talley, Norfolk St., 2003
Season Per Game16.27—Boomer Grigsby, Illinois St., 2002 (179
in 11)Career
550—Boomer Grigsby, Illinois St., 2001-04 (44 games)
Career Per Game13.2—Josh Cain, Chattanooga, 2000-02 (450
in 34)
Solo TacklesGame
21—Dan Adams, Holy Cross vs. Colgate, Oct. 22, 2005
Season113—Josh Cain, Chattanooga, 2002
Season Per Game9.8—Boomer Grigsby, Illinois St., 2002 (108
in 11)Career
325—Boomer Grigsby, Illinois St., 2001-04 (44 games)
Career Per Game8.0—Josh Cain, Chattanooga, 2000-02 (273
in 34)
Assisted TacklesGame
23—Grant Olson, North Dakota St. vs. Wofford, Dec. 12, 2012
Season120—Kevin Talley, Norfolk St., 2003
Season Per Game12.0—Kevin Talley, Norfolk St., 2003 (120 in 12)
Career318—Scott Lewis, Saint Francis (PA), 2007-10
(43 games)Career Per Game
(Min. 150 assists) 11.19—Clarence Bumpas, Northern Colo., 2011-13 (176 in 27)
(Min. 300 assists) 7.40—Scott Lewis, Saint Francis (PA), 2007-10 (318 in 43)
Tackles for Loss Game
8.0—Sherrod Coates, Western Ky. vs. Indiana St., Oct. 26, 2002
Season36.0—Steve Baggs, Bethune-Cookman, 2003
Season Per Game3.0—Steve Baggs, Bethune-Cookman, 2003
(36.0 in 12)Career
80.0—James Cowser, Southern Utah, 2012-15 (48 games)
Career Per Game2.5—Steve Baggs, Bethune-Cookman, 2002-03
(62.0 in 25)
Pass SacksGame
6.0—Damien Huren, Southeastern La. vs. Northern Colo., Oct. 9, 2004; Pat Dowd, Dayton vs. Drake, Nov. 9, 2013; Javon Hargrave, South Carolina St. vs. Bethune-Cookman, Oct. 25, 2014
Season23.5—Chris Gocong, Cal Poly, 2005
Season Per Game1.89—Andrew Hollingsworth, Towson, 2000 (17
in 9)Career
42.5—James Cowser, Southern Utah, 2012-15 (48 games)
Career Per Game1.28—Adrian Hamilton, Prairie View, 2010-11
(25.5 in 20)
Passes DefendedGame
9—Anthony Goodwin, Montana vs. Portland St., Oct. 5, 2013
Season27—Bobby Sippio, Western Ky., 2000; Tyler
Williams, Central Ark., 2016Season Per Game
2.7—Bobby Sippio, Western Ky., 2000 (27 in 10)Career
62—Ian Williams, Fordham, 2010-14 (52 games); Casey DeAndrade, New Hampshire, 2013-16 (53 games)
Career Per Game1.54—Benny Sapp, UNI, 2002-03 (37 in 24);
Domonique Johnson, Jackson St., 2007-08 (37 in 24)
Forced FumblesGame
4—John Hugunin, Drake vs. North Dakota, Sept. 12, 2015
Season10—Robert Mathis, Alabama A&M, 2002
Season Per Game0.91—Robert Mathis, Alabama A&M, 2002 (10
in 11)Career
18—Marques Murrell, Appalachian St., 2003-06 (52 games)
Career Per Game0.42—Robert Mathis, Alabama A&M, 2000-02
(13 in 31)
Fumbles Returned for TouchdownsSeason
3—Dontrell Miller, UT Martin, 2008
INTERCEPTIONSMost Passes InterceptedGame
5—Karl Johnson, Jackson St. vs. Grambling, Oct. 23, 1982 (29 yards); Michael Richardson, Northwestern St. vs. Southeastern La., Nov. 12, 1983 (128 yards); Mark Cordes, Eastern Wash. vs. Boise St., Sept. 6, 1986 (48 yards)
Season14—Rashean Mathis, Bethune-Cookman, 2002
(455 yards)
Season Per Game1.2—Dean Cain, Princeton, 1987 (12 in 10)
Career31—Rashean Mathis, Bethune-Cookman, 1999-
2002 (682 yards)Career Per Game
0.73—Dean Cain, Princeton, 1985-87 (22 in 30)
Most Yards on Interception ReturnsGame
216—Keiron Bigby, Brown vs. Yale, Sept. 29, 1984 (3 interceptions) (first career game)
Season455—Rashean Mathis, Bethune-Cookman,
2002 (14 interceptions)Career
682—Rashean Mathis, Bethune-Cookman, 1999-2002 (31 interceptions)
Most Touchdowns Scored on Interception ReturnsGame
2—By 27 players. Most recent: Ray Mitchell, UNI vs. Western Ill., Nov. 23, 2013; Will McNamara, Dartmouth vs. Columbia, Oct. 26, 2013
Season4—Robert Turner, Jackson St., 1990 (9
interceptions, 212 yards); Joseph Vaughn, CSUN, 1994 (9 interceptions, 265 yards); William Hampton, Murray St., 1995 (8 interceptions, 280 yards)
Career7—Marcus Williams, North Dakota St., 2010-13
(21 interceptions)
Most Yards Gained Per InterceptionGame
(Min. 3 ints.) 72.0—Keiron Bigby, Brown vs. Yale, Sept. 29, 1984 (3 for 216)
Season(Min. 3 ints.) 72.0—Keiron Bigby, Brown, 1984
(3 for 216)Career
(Min. 12 ints.) 25.9—Michael Ford, Duquesne, 2003-05 (13 for 337)
Most Seasons Intercepting At Least One Pass
5—Rayshun Reed, Troy, 1999-2003 Note: Troy was an FBS member for 2002-03.

Individual Records 10
SPECIAL TEAMS
PUNTINGMost PuntsGame
16—Matt Stover, Louisiana Tech vs. La.-Monroe, Nov. 18, 1988 (567 yards)
Season101—Tony Epperson, Weber St., 2013 (4,356
yards)Career
301—Barry Bowman, Louisiana Tech, 1983-86 (11,441 yards); David Petroni, Elon, 2013-16 (12,245 yards)
Most Yards Per PuntGame
(5 punts) 61.5—Eddie Johnson, Idaho St. vs. Cal Poly, Nov. 16, 2002 (6 for 369)
(Min. 10 punts) 52.2—Stuart Dodds, Montana St. vs. Northern Ariz., Oct. 20, 1979 (10 for 522)
Season(Min. 60 punts) 48.2—Mark Gould, Northern
Ariz., 2002 (62 for 2,987)Career
(Min. 150 punts) 45.1—Jonathan Plisco, Old Dominion, 2009-12 (184 for 8,298)
Longest Punt93—Tyler Grogan, Northeastern vs. Villanova,
Sept. 8, 2001
PUNT RETURNSMost Punt ReturnsGame
11—Peter Athans, Sacred Heart vs. Siena, Nov. 9, 2002 (98 yards)
Season55—Tommy Houk, Murray St., 1980 (442 yards)
Season Per Game5.0—Tommy Houk, Murray St., 1980 (55 in 11)
Career143—Levander Segars, Montana, 2001-04
(1,441 yards)Career Per Game
3.8—Tommy Houk, Murray St., 1979-80 (84 in 22)
Most Yards on Punt ReturnsGame
227—Leonard Goolsby, South Carolina St. vs. Norfolk St., Oct. 11, 2003 (7 returns)
Season740—Khris Gardin, N.C. A&T, 2015 (32 returns)
Season Per Game61.7—Khris Gardin, N.C. A&T, 2015 (740 in 12)
Career1,668—Marquay McDaniel, Hampton, 2002-05
(116 returns)
Most Yards Gained Per ReturnGame
(Min. 5 rets.) 43.2—Ricky Pearsall, Northern Ariz. vs. Western N.M., Aug. 29, 1996 (5 for 216)
Season(Min. 1.2 rets. per game) 26.5—Curtis DeLoatch,
N.C. A&T, 2001 (20 for 530)Career
(Min. 1.2 rets. per game) 17.7—LeRoy Vann, Florida A&M, 2006-09 (59 for 1,042)
Most Touchdowns Scored on Punt ReturnsGame
3—Aaron Fix, Canisius vs. Siena, Sept. 24, 1994 (5 returns); Zuriel Smith, Hampton vs. Virginia St., Sept. 22, 2001 (3 returns)
Season5—Curtis DeLoatch, N.C. A&T, 2001 (20
returns); LeRoy Vann, Florida A&M, 2009 (29 returns)
Career8—LeRoy Vann, Florida A&M, 2006-09
Longest Punt Return100—Walter Powell, Murray St. vs. Southeast
Mo. St., Nov. 17, 2012
Most Consecutive Games Returning Punt for Touchdown
3—Troy Jones, McNeese, 1989 (vs. Mississippi Col., Sept. 2; vs. Samford, Sept. 9; vs. La.-Monroe, Sept. 16)
KICKOFF RETURNSMost Kickoff ReturnsGame
12—Eric Slenk, Valparaiso vs. Jacksonville, Oct. 16, 2010 (220 yards)
Season52—Terrence Holt, Austin Peay, 2009 (1,285
yards); Chika Madu, Nicholls St., 2011 (1,269 yards); Jordan Wells, Southeastern La., 2011 (1,383 yards)
Season Per Game4.73—Terrence Holt, Austin Peay, 2009 (52 in
11); Chika Madu, Nicholls St., 2011 (52 in 11); Jordan Wells, Southeastern La., 2011 (52 in 11)
Career191—Terrence Holt, Austin Peay, 2007-10
(4,683 yards)Career Per Game
4.3—Terrence Holt, Austin Peay, 2007-10 (191 in 44)
Most Yards on Kickoff ReturnsGame
333—Colby Goodwyn, Old Dominion vs. Cal Poly, Oct. 9, 2010 (9 returns)
Season1,411—David Primus, Samford, 1989 (50
returns)Season Per Game
128.3—David Primus, Samford, 1989 (1,411 in 11)
Career4,683—Terrence Holt, Austin Peay, 2007-10
(191 returns)
Career Per Game106.4—Terrence Holt, Austin Peay, 2007-10
(4,683 in 44)
Most Yards Gained Per ReturnGame
(Min. 5 rets.) 65.2—Bashir Levingston, Eastern Wash. vs. Sacramento St., Oct. 31, 1998 (5 for 326)
Season(Min. 1.2 rets. per game) 37.3—David Fraterrigo,
Canisius, 1993 (13 for 485)Career
(Min. 30 rets. and 1.2 rets. per game) 32.4—Xavier Roberson, Southeastern La., 2012-15 (65 for 2,106)
Most Touchdowns Scored on Kickoff ReturnsGame
3—Bashir Levingston, Eastern Wash. vs. Sacramento St., Oct. 31, 1998
Season5—Jerome Mathis, Hampton, 2004
Career6—Jerome Mathis, Hampton, 2001-04
TOTAL KICK RETURNS
(Combined Punt and Kickoff Returns)
Most Kick ReturnsGame
13—Eric Slenk, Valparaiso vs. Jacksonville, Oct. 16, 2010 (1 punt, 12 kickoffs; 225 yards)
Season77—Jabin Sambrano, Montana, 2011 (37 punts,
40 kickoffs; 1,190 yards)Career
241—Terrence Holt, Austin Peay, 2007-10 (50 punts, 191 kickoffs; 5,230 yards)
Most Yards on Kick ReturnsGame
349—Bashir Levingston, Eastern Wash. vs. Sacramento St., Oct. 31, 1998 (8 returns, 23 on punt returns, 326 on kickoff returns)
Season1,469—David Primus, Samford, 1989 (1,411 on
kickoffs, 58 on punts)Season Per Game
133.5—David Primus, Samford, 1989 (1,469 in 11)
Career5,230—Terrence Holt, Austin Peay, 2007-10
(547 on punts, 4,683 on kickoffs)Career Per Game
118.9—Terrence Holt, Austin Peay, 2007-10 (5,230 in 44)
Gaining 1,000 Yards on Punt Returns and 1,000

Individual Records 11
Yards on Kickoff ReturnsCareer
6—Joe Markus, UConn, 1979-82 (1,012 on punts and 1,185 on kickoffs); Kenny Shedd, UNI, 1989-92 (1,081 on punts and 1,359 on kickoffs); Joe Rosato, Duquesne, 1994-97 (1,036 on punts and 1,661 on kickoffs); Delvin Joyce, James Madison, 1997-2000 (1,488 on punts and 1,830 on kickoffs); Marc Mariani, Montana, 2006-09 (1,253 on punts and 1,158 on kickoffs); LeRoy Vann, Florida A&M, 2006-09 (1,042 on punts and 1,953 on kickoffs)
Most Yards Gained Per Kick ReturnGame
(Min. 6 rets.) 44.7—Jay Jones, James Madison vs. Richmond, Oct. 19, 1996 (6 for 268)
Season(Min. 40 rets.) 26.7—David Primus, Samford,
1989 (55 for 1,469)Career
(Min. 60 rets.) 26.4—Lamont Brightful, Eastern Wash., 1998-2001 (80 for 2,115)
Most Touchdowns Scored on Kick ReturnsGame
3—Aaron Fix, Canisius vs. Siena, Sept. 24, 1994 (3 punt returns); Bashir Levingston, Eastern Wash. vs. Sacramento St., Oct. 31, 1998 (3 kickoffs); Zuriel Smith, Hampton vs. Virginia St., Sept. 22, 2001 (3 punt returns)
Season6—Bashir Levingston, Eastern Wash., 1998
(3 punt returns and 3 kickoff returns); Corey Smith, Montana St., 2003 (4 punt returns and 2 kickoff returns); LeRoy Vann, Florida A&M, 2008 (3 punt returns and 3 kickoff returns)
Career11—LeRoy Vann, Florida A&M, 2006-09 (8 punt
returns and 3 kickoff returns)
FIELD GOALSMost Field Goals AttemptedGame
8—Goran Lingmerth, Northern Ariz. vs. Idaho, Oct. 25, 1986 (made 8)
Season35—Brian Pate, William & Mary, 2009 (made 23)
Career105—Chris Snyder, Montana, 2000-03 (made
70)
Most Field Goals MadeQuarter
4—Tony Zendejas, Nevada vs. Northern Ariz., Oct. 16, 1982 (4th); Ryan Weeks, Tennessee Tech vs. Chattanooga, Sept. 9, 1989 (3rd)
Half5—Dean Biasucci, Western Caro. vs. Mars Hill,
Sept. 18, 1982 (1st); Tony Zendejas, Nevada vs. Northern Ariz., Oct. 16, 1982 (2nd); Ryan Weeks, Tennessee Tech vs. Chattanooga, Sept. 9, 1989 (2nd); Drew Hareza, Old Dominion vs. Chowan, Sept. 5, 2009 (1st)
Game8—Goran Lingmerth, Northern Ariz. vs. Idaho,
Oct. 25, 1986 (39, 18, 20, 33, 46, 27, 22, 35 yards; by quarters—1, 3, 2, 2), 8 attempts
Season29—Adam Keller, North Dakota St., 2014 (34
attempts)Season Per Game
2.4—Tony Zendejas, Nevada, 1982 (26 in 11); Brian Mitchell, UNI, 1990 (26 in 11)
Career75—Dan Carpenter, Montana, 2004-07 (103
attempts)Career Per Game
2.1—Tony Zendejas, Nevada, 1981-83 (70 in 33)
Highest Percentage of Field Goals MadeSeason
(Min. 20 atts.) 96.3%—Brian Mitchell, UNI, 1990 (26 of 27)
Career(Min. 50 atts.) 82.6%—Adrian Mora, Ga.
Southern, 2008-11 (57 of 69)
Best Perfect Record of Field Goals MadeSeason
15 of 15—Jon Scifres, Missouri St., 2004
Most Consecutive Field Goals MadeGame
8—Goran Lingmerth, Northern Ariz. vs. Idaho, Oct. 25, 1986
Season21—Brian Mitchell, UNI, 1990
Career26—Brian Mitchell, UNI, 1990-91
Most Consecutive Games Kicking a Field GoalCareer
33—Tony Zendejas, Nevada, 1981-83 (at least one in every game played)
Most Field Goals Made, 50 Yards or MoreGame
3—Jesse Garcia, La.-Monroe vs. McNeese, Oct. 29, 1983 (52, 56, 53 yards); Terry Belden, Northern Ariz. vs. CSUN, Sept. 18, 1993 (60, 50, 54 yards)
Season7—Jesse Garcia, La.-Monroe, 1983 (12
attempts); Kirk Roach, Western Caro., 1987 (12 attempts)
Career11—Kirk Roach, Western Caro., 1984-87 (26
attempts); Pete Garces, Idaho St., 1998-99 (16 attempts)
Highest Percentage of Field Goals Made, 50 Yards or MoreSeason
(Min. 5 atts.) 100.0%—Wayne Boyer, Missouri St., 1996 (5 of 5)
Career(Min. 10 atts.) 90.9%—Tim Foley, Ga. Southern,
1984-87 (10 of 11)
Most Field Goals Made,
40 Yards or MoreSeason
12—Marty Zendejas, Nevada, 1985 (15 attempts)
Career30—Marty Zendejas, Nevada, 1984-87 (45
attempts)
Highest Percentage of Field Goals Made, 40 Yards or MoreSeason
(Min. 8 made) 100.0%—Tim Foley, Ga. Southern, 1985 (8 of 8)
Career(Min. 15 made) 72.0%—Tim Foley, Ga.
Southern, 1984-87 (18 of 25)
Highest Percentage of Field Goals Made, 40-49 YardsSeason
(Min. 8 made) 90.0%—Marty Zendejas, Nevada, 1985 (9 of 10)
Career(Min. 12 made) 72.0%—Tony Zendejas, Nevada,
1981-83 (18 of 25)
Highest Percentage of Field Goals Made, Under 40 YardsSeason
(Min. 15 made) 100.0%—Matt Stover, Louisiana Tech, 1986 (15 of 15); Kirk Roach, Western Caro., 1986 (17 of 17); Brian Mitchell, UNI, 1990 (23 of 23)
Career(Min. 25 made) 93.3%—Marty Zendejas,
Nevada, 1984-87 (42 of 45)
Most Times Kicking Two or More Field Goals in a GameSeason
10—Brian Mitchell, UNI, 1991Career
25—Kirk Roach, Western Caro., 1984-87
Most Times Kicking Three or More Field Goals in a GameSeason
7—Brian Mitchell, UNI, 1991Career
11—Brian Mitchell, Marshall/UNI, 1987, 1989-91
Most Consecutive Quarters Kicking a Field GoalSeason
7—Scott Roper, Arkansas St., 1986 (last 3 vs. McNeese, Oct. 25; all 4 vs. North Texas, Nov. 1)
Longest Average Distance Field Goals

Individual Records 12
MadeGame
(Min. 3 made) 54.7—Terry Belden, Northern Ariz. vs. Sacramento St., Sept. 18, 1993 (60, 50, 54 yards)
Season(Min. 14 made) 45.0—Jesse Garcia, La.-
Monroe, 1983 (15 made)Career
(Min. 35 made) 37.5—Roger Ruzek, Weber St., 1979-82 (46 made)
Longest Average Distance Field Goals AttemptedGame
(Min. 4 atts.) 55.5—Pete Garces, Idaho St. vs. Sacramento St., Nov. 7, 1998 (made 53, 54; missed 54, 61)
Season(Min. 20 atts.) 45.9—Jesse Garcia, La.-Monroe,
1983 (26 attempts)Career
(Min. 60 atts.) 40.5—Kirk Roach, Western Caro., 1984-87 (102 attempts)
Longest Field Goal Made63—Scott Roper, Arkansas St. vs. North Texas,
Nov. 7, 1987; Tim Foley, Ga. Southern vs. James Madison, Nov. 7, 1987; Bill Gramatica, South Fla. vs. Austin Peay, Nov. 18, 2000
Longest Field Goal Made by a Freshman
60—David Cool, Ga. Southern vs. James Madison, Nov. 5, 1988
Most Field Goals Made by a FreshmanGame
6—Drew Stewart, Appalachian St. vs. Western Caro., Nov. 12, 2011 (6 attempts)
Season22—Marty Zendejas, Nevada, 1984 (27
attempts)
Most Field Goals Made in First Game of Career
5—Mike Powers, Colgate vs. Army West Point, Sept. 10, 1983 (6 attempts); Patrick Jacob, Princeton vs. Lehigh, Sept. 18, 2010 (6 attempts)
Most Games in Which Field Goal(s) Provided Winning MarginCareer
11—John Dowling, Youngstown St., 1984-87
Longest Return of a Missed Field Goal
89—Pat Bayers, Western Ill. vs. Youngstown St., Nov. 6, 1982 (TD)
Longest Return of a Blocked Field Goal
90—Travis Hawkins, Delaware vs. William & Mary, Sept. 22, 2012 (TD)
BLOCKED KICKSMost Blocked PuntsGame
3—Ben Duhon, McNeese vs. Ark.-Monticello, Sept. 29, 1998; Brandon Tinson, Colgate vs. Towson, Sept. 30, 2000
Season5—Domonic Jones, The Citadel, 2011; Tevin
Richard, South Carolina St., 2015Career
9—Taurean Rhetta, Jacksonville St., 2004-07
Most Blocked Field GoalsGame
2—By manySeason
4—Leonard Smith, McNeese, 1981; Mark Weivoda, Idaho St., 2001; Clayton Smith, Dartmouth, 2004; Hunter Kiselick, Georgetown, 2016
Career10—Leonard Smith, McNeese, 1980-82
Most Blocked Extra PointsGame
3—Edmon McClam, Old Dominion vs. Chowan, Sept. 5, 2009; Josh Eden, Bucknell vs. Colgate, Nov. 13, 2010
Season6—Josh Eden, Bucknell, 2010
Career8—Josh Eden, Bucknell, 2006-07, 10-11
Most Combined Blocked Kicks(Includes Punts, PAT Attempts, FG Attempts)Game
3—Ben Duhon, McNeese vs. Ark.-Monticello, Sept. 29, 1998 (3 punts); Michael Adams, SFA vs. Central Okla., Aug. 30, 2000 (2 punts, 1 PAT); Brandon Tinson, Colgate vs. Towson, Sept. 30, 2000 (3 punts); Edmon McClam, Old Dominion vs. Chowan, Sept. 5, 2009 (3 PATs); Josh Eden, Bucknell vs. Colgate, Nov. 13, 2010 (3 PATs)
Season8—Josh Eden, Bucknell, 2010 (6 PATs, 2 FGs)
Career17—Leonard Smith, McNeese, 1980-82 (10
FGs, 4 PATs, 3 punts)
DEFENSIVE EXTRA POINTSMost Defensive Extra-Point ReturnsGame
2—Joe Lee Johnson, Western Ky. vs. Indiana St., Nov. 10, 1990 (both kick returns, scored on neither)
Most Defensive Extra Points ScoredGame
1—By many players
Season2—Jackie Kellogg, Eastern Wash. vs. Weber
St., Oct. 6, 1990 (90-yard interception return) & vs. Portland St., Oct. 27, 1990 (94-yard interception return)
Longest Return of a Defensive Extra Point
100—Morgan Ryan (DB), Montana St. vs. Sam Houston St., Sept. 7, 1991 (interception return); Rich Kinsman (DB), William & Mary vs. Lehigh, Nov. 14, 1992
First Defensive Extra-Point Attempts
Mike Rogers (DB), Davidson vs. Lehigh, Sept. 10, 1988 (30-yard interception return); Dave Benna (LB), Towson vs. Northeastern, Sept. 10, 1988 (35-yard interception return)

Team Records 13
TEAM RECORDS
SINGLE GAME—OFFENSE
RUSHINGMost Rushes
95—Cal Poly vs. Eastern Wash., Nov. 12, 2011 (405 yards)
Most Rushes, Both Teams
127—Western Ky. (73) & Elon (54), Oct. 24, 1998 (718 yards)
Fewest Rushes6—SFA vs. Sam Houston St., Oct. 6, 2012 (21
yards)
Most Yards Gained681—Missouri St. vs. Mo. Southern St., Sept.
10, 1988 (83 rushes)
Most Yards Gained, Both Teams
850—Jacksonville St. (440) & Southeast Mo. St. (410), Nov. 23, 2013 (115 rushes)
Most Yards Gained by a Losing Team
515—Nicholls St. vs. Portland St., Sept. 13, 2003 (lost 44-37; 74 rushes)
Most Yards Gained Per Rush(Min. 45 Rushes)
12.89—Northeastern vs. Stonehill, Aug. 30, 2003 (46 for 593)
Most Touchdowns Scored by Rushing
11—Ga. Southern vs. Johnson C. Smith, Sept. 11, 2004
PASSINGMost Passes Attempted
85—SFA vs. Sam Houston St., Nov. 1, 2008 (completed 57 for 449 yards)
Most Passes Attempted, Both Teams
133—SFA (57) & Eastern Wash. (76), Nov. 28, 2009 (completed 86 for 893 yards)
Fewest Passes Attempted0—Ga. Southern vs. Wofford, Oct. 13, 2012
Fewest Passes Attempted, Both Teams
8—Ga. Southern (0) vs. Wofford (8), Oct. 13, 2012 (completed 3)
Most Passes Attempted Without Interception
79—Old Dominion vs. New Hampshire, Sept. 22, 2012 (completed 55)
Most Passes Completed59—Southeastern La. vs. Jacksonville, Nov. 6,
2004 (attempted 72 for 551 yards)
Most Passes Completed, Both Teams
86—SFA (43) & Eastern Wash. (43), Nov. 28, 2009 (attempted 133 for 893 yards)
Fewest Passes Completed
0—By many teams. Most recent: Ga. Southern vs. Wofford, Oct. 13, 2012
Fewest Passes Completed, Both Teams
2—N.C. A&T (0) & Western Ky. (2), Nov. 19, 1988 (attempted 11)
Highest Percentage Completed(Min. 30 atts.)
91.3%—UT Martin vs. Murray St., Oct. 13, 2012 (42 of 46)
Lowest Percentage Completed(Min. 20 Attempts)
9.5%—Florida A&M vs. Central St. (OH), Oct. 11, 1986 (2 of 21)
Most Passes Had Intercepted
10—Mississippi Val. vs. Grambling, Oct. 17, 1987 (47 attempts); Boise St. vs. Montana, Oct. 28, 1989 (55 attempts)
Most Yards Gained730—Old Dominion vs. New Hampshire, Sept.
22, 2012
Most Yards Gained, Both Teams
1,190—La.-Monroe (619) & SFA (571), Nov. 11, 1989
Most Yards Gained Per Attempt(Min. 25 Attempts)
20.1—Delaware vs. UConn, Nov. 7, 1998 (29 for 584)
Most Yards Gained Per Completion
(Min. 10 comps.) 33.0—Jackson St. vs. Southern U., Oct. 13, 1990 (14 for 462)
(Min. 25 comps.) 22.9—Marshall vs. VMI, Nov. 16, 1991 (28 for 642)
Most Touchdown Passes11—Mississippi Val. vs. Kentucky St., Sept. 1,
1984
Most Touchdown Passes, Both Teams
14—Mississippi Val. (8) & Texas Southern (6), Oct. 26, 1985
TOTAL OFFENSEMost Plays
123—Eastern Ky. vs. Murray St., Nov. 14, 2015 (570 yards)
Most Plays, Both Teams210—Murray St. (110) & Eastern Ill. (100), Sept.
22, 2012 (1,142 yards)
Most Yards Gained876—Weber St. vs. Idaho St., Nov. 23, 1991
(252 rushing, 624 passing)
Most Yards Gained, Both Teams
1,549—Old Dominion (825) & New Hampshire (724), Sept. 22, 2012 (195 plays)
Most Yards Gained by a Losing Team
827—SFA vs. Prairie View, Sept. 28, 2013 (lost 56-48)
Fewest Yards Gained by a Winning Team
31—Middle Tenn. vs. Murray St., Oct. 17, 1981 (won 14-9)
Most Yards Gained Per Play(Min. 55 Plays)
13.1—Northeastern vs. Stonehill, Aug. 30, 2003 (57 for 745)
Most Touchdowns Scored by Rushing and Passing
14—Portland St. vs. Delaware St., Nov. 8, 1980 (10 passing, 4 rushing)
SCORINGMost Points Scored
105—Portland St. vs. Delaware St., Nov. 8, 1980 (15 TDs, 15 PATs)

Team Records 14
Most Points Scored, Both Teams
141—Weber St. (73) & Portland St. (68), Oct. 27, 2007 (20 TDs, 18 PATs, 1 field goal)
Most Points Scored by a Losing Team
68—Portland St. vs. Weber St. (73), Oct. 27, 2007
Most Points Scored Each Quarter
1st: 49—Portland St. vs. Delaware St., Nov. 8, 1980
2nd: 50—Alabama St. vs. Prairie View, Oct. 26, 1991
3rd: 35—Portland St. vs. Delaware St., Nov. 8, 1980; La.-Monroe vs. Arkansas St., Nov. 6, 1993
4th: 39—Montana vs. South Dakota St., Sept. 4, 1993
Most Points Scored Each Half
1st: 73—Montana St. vs. Eastern Ore., Sept. 14, 1985
2nd: 56—Brown vs. Columbia, Nov. 19, 1994
Most Touchdowns Scored
15—Portland St. vs. Delaware St., Nov. 8, 1980
Most Points Scored in Fourth Quarter, Both Teams
58—Brown (30) vs. Penn (28), Oct. 10, 1998
Most Touchdowns Scored, Both Teams
20—Weber St. (10) vs. Portland St. (10), Oct. 27, 2007
Most Extra Points Made by Kicking
15—Portland St. vs. Delaware St., Nov. 8, 1980 (15 attempts)
Most Two-Point Attempts Made
5—Weber St. vs. Eastern Wash., Oct. 6, 1990 (5 passes attempted)
Most Field Goals Made8—Northern Ariz. vs. Idaho, Oct. 25, 1986 (8
attempts)
Most Field Goals Attempted
8—Northern Ariz. vs. Idaho, Oct. 25, 1986 (made 8)
Most Field Goals Made, Both Teams
9—Nevada (5) & Northern Ariz. (4), Oct. 9, 1982 (12 attempts); Nevada (5) & Weber St. (4), Nov. 6, 1982 (11 attempts, 3 ot); Elon (5) & Ga. Southern (4), Oct. 13, 2007 (10 attempts)
Most Safeties Scored3—Alabama St. vs. Albany St. (GA), Oct. 15,
1988; Davidson vs. Drake, Oct. 20, 2007; Prairie View vs. Ark.-Pine Bluff, Sept. 17, 2011
Most Safeties Scored in a Half
3—Davidson vs. Drake, Oct. 20, 2007; Prairie View vs. Ark.-Pine Bluff, Sept. 17, 2011 (1st half)
Most Safeties Scored in a Quarter
3—Prairie View vs. Ark.-Pine Bluff, Sept. 17, 2011 (2nd quarter)
Most Defensive Extra Points Scored
2—VMI vs. Davidson, Nov. 4, 1989 (Jeff Barnes, 95-yard interception return, and Wayne Purcell, 90-yard interception return); Duquesne vs. Fairfield, Nov. 3, 2001 (Leigh Bodden, 88-yard fumble return on two-point attempt, and Armar Watson, blocked extra-point return)
Most Defensive Extra-Point Attempts
2—VMI vs. Davidson, Nov. 4, 1989 (2 interception returns); Western Ky. vs. Indiana St., Nov. 10, 1990 (2 interception returns); Duquesne vs. Fairfield, Nov. 3, 2001 (fumble return, blocked extra-point return)
FIRST DOWNSMost First Downs
46—Weber St. vs. Idaho St., Nov. 23, 1991 (12 rushing, 31 passing, 3 penalty)
Most First Downs, Both Teams
74—Old Dominion (39) & New Hampshire (35), Sept. 22, 2012
Most First Downs by Rushing
31—Ga. Southern vs. Glenville St., Nov. 12, 1994
Most First Downs by Passing
37—Old Dominion vs. New Hampshire, Sept. 22, 2012
Most First Downs by Penalty
11—Towson vs. Liberty, Oct. 21, 1990
FUMBLESMost Fumbles
16—Delaware St. vs. Portland St., Nov. 8, 1980 (lost 6)
Most Fumbles, Both Teams
21—N.C. A&T (15) & Lane (6), Nov. 11, 1995 (lost 12)
Most Fumbles Lost9—N.C. A&T vs. Lane, Nov. 11, 1995 (15
fumbles)
Most Fumbles Lost, Both Teams
12—Virginia St. (7) & Howard (5), Oct. 13, 1979 (16 fumbles); Austin Peay (8) & Mars Hill (4), Nov. 17, 1979 (18 fumbles); N.C. A&T (9) & Lane (3), Nov. 11, 1995 (21 fumbles)
PENALTIESMost Penalties Against
23—Idaho vs. Idaho St., Oct. 10, 1992 (204 yards)
Most Penalties, Both Teams
39—In four games. Most recent: Jackson St. (22) & Grambling (17), Oct. 24, 1987 (370 yards)
Most Yards Penalized260—Southern U. vs. Howard, Nov. 4, 1978 (22
penalties)
Most Yards Penalized, Both Teams
423—Southern U. (260) & Howard (163), Nov. 4, 1978 (37 penalties)
TURNOVERS(Passes Had Intercepted and Fumbles Lost)
Most Turnovers12—Texas Southern vs. Lamar, Sept. 6, 1980 (4
interceptions, 8 fumbles lost)
Most Turnovers, Both Teams
15—Bucknell (8) & Hofstra (7), Sept. 8, 1990 (10 interceptions, 5 fumbles lost); SFA (8) & Nicholls St. (7), Sept. 22, 1990 (8 interceptions, 7 fumbles lost)
OVERTIMESMost Overtime Periods, Both Teams FCS
6—Rhode Island (58) vs. Maine (55), Sept. 18, 1982; Villanova (41) vs. UConn (35), Oct. 7, 1989; Florida A&M (59) vs. Hampton (58), Oct. 5, 1996
Most Overtime Periods8—Bethune-Cookman (63) vs. Virginia St.
(Division II) (57), Sept. 26, 1998
Most Points Scored in Overtime Periods
39—Florida A&M (59) vs. Hampton (58), Oct. 5, 1996 (6 overtime periods)

Team Records 15
Most Points Scored in Overtime Periods, Both Teams
77—Florida A&M (39) vs. Hampton (38), Oct. 5, 1996 (6 overtime periods; Florida A&M won, 59-58)
Largest Winning Margin in Overtime
13—Nicholls St. (49) vs. Texas St. (36), Oct. 26, 1996 (5 overtime periods)
Most Overtime Games Played, Season
4—Ga. Southern, 2008 (Ga. Southern 34, Northeastern 27, Sept. 13; Wofford 38, Ga. Southern 37, Sept. 27; Ga. Southern 38, Western Caro. 31, Oct. 25; Ga. Southern 44, The Citadel 41, 3 OT, Nov. 1)
Most Consecutive Overtime Games Played
3—Penn, 2006 (Yale 17, Penn 14, Oct. 21; Brown 30, Penn 27, Oct. 28; and Princeton 31, Penn 30, 2 ot, Nov. 4); Jacksonville St., 2013 (JSU 24, North Ala. 21, 2 ot, Sept. 14; JSU 32, Georgia St. 26, Sept. 21; Murray St. 35, JSU 34, Sept. 28)
SINGLE GAME—DEFENSE
RUSHING DEFENSEFewest Rushes Allowed
6—Sam Houston St. vs. SFA, Oct. 6, 2012 (21 yards)
Fewest Rushing Yards Allowed
Minus 90—Sacred Heart vs. Iona, Nov. 16, 2002 (42 rushes)
PASS DEFENSEFewest Attempts Allowed
0—Wofford vs. Ga. Southern, Oct. 13, 2012
Fewest Completions Allowed
0—By many teams. Most recent: Youngstown St. vs. Wofford, Dec. 10, 2016 (3 attempts)
Lowest Completion Percentage Allowed(Min. 30 Attempts)
11.8%—Southern U. vs. Nicholls St., Oct. 11, 1980 (4 of 34)
Fewest Yards AllowedMinus 2—Florida A&M vs. Albany St. (GA), Oct.
16, 1982
Most Passes Intercepted By
10—Grambling vs. Mississippi Val., Oct. 17, 1987 (47 attempts); Montana vs. Boise St., Oct. 28, 1989 (55 attempts)
Most Sacks14—Duquesne vs. Iona, Oct. 31, 1998 (92
yards); Alcorn vs. Mississippi Val., Oct. 10, 2009 (101 yards)
Most Interceptions Returned for Touchdowns
4—Northwestern St. vs. Southeastern La., Oct. 11, 2003 (6 for 195 yards); Nicholls St. vs. Northwestern St., Nov. 6, 2007 (5 for 238)
TOTAL DEFENSEFewest Plays Allowed
31—Howard vs. Dist. Columbia, Sept. 2, 1989 (32 yards)
Fewest Yards AllowedMinus 12—Eastern Ill. vs. Kentucky St., Nov. 13,
1982 (-67 rushing, 55 passing)
FUMBLE RETURNS(Since 1992)
Most Fumbles Returned for Touchdowns
2—Marshall vs. VMI, Oct. 9, 1993; Idaho vs. Weber St., Nov. 12, 1994; Texas St. vs. Nicholls St., Oct. 7, 2000; Harvard vs. Northeastern, Oct. 6, 2001
SAFETIESMost Safeties
3—Alabama St. vs. Albany St. (GA), Oct. 15, 1988; Davidson vs. Drake, Oct. 20, 2007; Prairie View vs. Ark.-Pine Bluff, Sept. 17, 2011
SINGLE GAME—SPECIAL TEAMS
PUNTINGMost Punts
16—Louisiana Tech vs. La.-Monroe, Nov. 19, 1988 (567 yards)
Most Punts, Both teams26—Hofstra (14) vs. Buffalo (12), Nov. 2, 1996
Most Yards Per Punt(Min. 5 punts) 61.5—Idaho St. vs. Cal Poly, Nov.
16, 2002 (6 for 369)(Min. 10 punts) 52.2—Montana St. vs. Northern
Ariz., Oct. 20, 1979 (10 for 522)
Fewest Punts0—By many teams. Most recent: UT Martin vs.
Bacone, Sept. 17, 2016
Fewest Punts, Both Teams
0—Ga. Southern & James Madison, Nov. 15, 1986
Most Opponent’s Punts Blocked By
4—Montana vs. Montana St., Oct. 31, 1987 (13 punts); Middle Tenn. vs. Mississippi Val., Oct. 8, 1988 (7 punts)
PUNT RETURNSMost Punt Returns
12—UNI vs. Youngstown St., Oct. 20, 1984 (83 yards)
Most Yards on Punt Returns
322—Northern Ariz. vs. Western N.M., Aug. 29, 1996 (10 returns)
Most Yards Gained Per Return(Min. 6 Returns)
32.2—Northern Ariz. vs. Western N.M., Aug. 29, 1996 (10 for 322, 3 TDs)
Most Touchdowns Scored on Punt Returns
3—Canisius vs. Siena, Sept. 24, 1994; Northern Ariz. vs. Western N.M., Aug. 29, 1996; Hampton vs. Virginia St., Sept. 22, 2001

Team Records 16
KICKOFF RETURNSMost Kickoff Returns
15—Delaware St. vs. Portland St., Nov. 8, 1980 (209 yards)
Most Yards on Kickoff Returns
365—Old Dominion vs. Cal Poly, Oct. 9, 2010 (11 returns)
Most Yards Gained Per Return
(Min. 3 rets.) 65.2—Eastern Wash. vs. Sacramento St., Oct. 31, 1998 (5 for 326)
(Min. 6 rets.) 46.3—Western Caro. vs. VMI, Oct. 10, 1992 (6 for 278)
Most Touchdowns Scored on Kickoff Returns
3—Eastern Wash. vs. Sacramento St., Oct. 31, 1998
TOTAL KICK RETURNS
(Combined Punt and Kickoff Returns)
Most Yards on Kick Returns
362—Old Dominion vs. Cal Poly, Oct. 9, 2010 (-3 punt returns, 365 kickoff returns)
Most Yards Gained Per Return(Min. 6 Returns)
46.8—UConn vs. Yale, Sept. 24, 1983 (6 for 281)
Most Touchdowns Scored on Total Kick Returns
5—Hampton vs. Virginia St., Sept. 22, 2001 (3 punt returns, 2 kickoff returns)
OPPONENT’S KICKS BLOCKEDMost Opponent’s Punts Blocked
4—Montana vs. Montana St., Oct. 31, 1987 (13 punts); Middle Tenn. vs. Mississippi Val., Oct. 8, 1988 (7 punts)
Most Opponent’s Total Kicks Blocked(Includes punts, field goals, PATs)
4—Montana vs. Montana St., Oct. 31, 1987 (all punts); Middle Tenn. vs. Mississippi Val., Oct. 8, 1988 (all punts); Colgate vs. Towson, Sept. 30, 2000 (3 punts, 1 PAT)
SEASON—OFFENSE
RUSHINGMost Yards Gained Per Game
419.00—Ga. Southern, 1999 (4,609 in 11)
Most Yards Gained Per Rush
7.05—Ga. Southern, 1999 (654 for 4,609)
Most Rushes Per Game69.80—Northeastern, 1986 (698 in 10)
Most Touchdowns by Rushing Per Game
5.55—Ga. Southern, 1999 (61 in 11)
PASSINGMost Yards Gained Per Game
496.80—Mississippi Val., 1984 (4,968 in 10)
Most Yards Gained Per Attempt
(Min. 250 atts.) 10.71—UNI, 1996 (252 for 2,700)
(Min. 400 atts.) 10.19—Eastern Wash., 2013 (515 for 5,247)
Most Yards Gained Per Completion
(Min. 125 comps.) 19.27—Jackson St., 1990 (156 for 3,006)
(Min. 200 comps.) 17.22—Grambling, 2005 (256 for 4,408)
Most Passes Attempted Per Game
61.73—SFA, 2012 (679 in 11)
Most Passes Completed Per Game
35.91—SFA, 2012 (395 in 11)
Highest Percentage Completed
(Min. 200 atts.) 70.77%—James Madison, 2016 (247 of 349)
(Min. 450 atts.) 70.70%—Samford, 2016 (386 of 546)
Lowest Percentage Had Intercepted
(Min. 200 atts.) 0.60%—San Diego, 2007 (2 of 333)(Min. 400 atts.) 0.73%—Butler, 2012 (3 of 413)
Most Consecutive Passes Attempted Without an Interception
370—Portland St., 1999 (in 11 games, Sept. 4 to Nov. 13)
Most Touchdown Passes Per Game
6.4—Mississippi Val., 1984 (64 in 10)
Highest Passing Efficiency Rating Points
197.3—San Diego, 2007 (333 attempts, 228 completions, 2 interceptions, 3,270 yards, 48 TDs)
TOTAL OFFENSEMost Yards Gained Per Game
640.10—Mississippi Val., 1984 (6,401 in 10)
Most Yards Gained Per Play
7.76—Alcorn, 1994 (848 for 6,577)
Most Plays Per Game91.45—SFA, 2012 (1,006 in 11)
Most Touchdowns by Rushing and Passing Per Game
8.40—Mississippi Val., 1984 (84 in 10)
SCORINGMost Points Per Game
60.90—Mississippi Val., 1984 (609 in 10)
Most Touchdowns Per Game
8.70—Mississippi Val., 1984 (87 in 10)
Most Extra Points Made by KickingPer Game
7.70—Mississippi Val., 1984 (77 in 10)
Most Consecutive Extra Points Made by Kicking
68—Idaho, 1993

Team Records 17
Most Two-Point Attempts Made
9—Weber St., 1992 (11 attempts)
Most Defensive Extra-Point Attempts
2—VMI, 1989; Eastern Wash., 1990; Western Ky., 1990; VMI, 2008; Coastal Caro., 2012
Most Defensive Extra Points Scored
2—VMI, 1989 (2 interception returns); Eastern Wash., 1990 (2 interception returns); VMI, 2008 (2 blocked PAT returns); Coastal Caro., 2012 (2 interception returns)
Most Field Goals Made Per Game
2.36—Nevada, 1982 (26 in 11); UNI, 1990 (26 in 11)
Most Safeties Scored5—Jackson St., 1986; Monmouth, 2005
FIRST DOWNSMost First Downs Per Game
31.70—Mississippi Val., 1984 (317 in 10)
Most Rushing First Downs Per Game
19.43—Ga. Southern, 2012 (272 in 14)
Most Passing First Downs Per Game
21.40—Mississippi Val., 1984 (214 in 10)
Most First Downs by Penalty Per Game
3.73—Alabama St., 1984 (41 in 11; 109 penalties by opponents); Texas Southern, 1987 (41 in 11; 134 penalties by opponents)
FUMBLESMost Fumbles Per Game
5.27—Prairie View, 1984 (58 in 11)
Most Fumbles Lost Per Game
3.10—Idaho, 1978 (31 in 10); Delaware St., 1980 (31 in 10)
Fewest Own Fumbles Lost
1—Yale, 1999 (5 fumbles); Maine, 2016 (4 fumbles); Valparaiso (5 fumbles)
PENALTIESMost Penalties
152—Alabama St., 2001
Most Penalties Per Game13.73—Grambling, 1984 (151 in 11; 1,206
yards)
Most Yards Penalized Per Game
125.50—Tennessee St., 1982 (1,255 in 10; 132 penalties)
TURNOVERSFewest Turnovers lost
6—Wagner, 2012 (4 fumbles, 2 interceptions)
Most Turnovers lost59—Texas Southern, 1980 (27 fumbles, 32
interceptions)
Highest Turnover Margin Per Game Over Opponents
3.18—Saint Peter’s, 2001 (47 gained, 12 lost; 11 games)
SEASON—DEFENSE
RUSHING DEFENSEFewest Yards Allowed Per Game
39.67—Alabama A&M, 2000 (476 in 12)
Lowest Average Yards Allowed Per Rush
1.27—Marist, 1997 (319 for 404)
Fewest Rushing Touchdowns Allowed Per Game
0.10—Penn, 2009 (1 in 10)
PASS DEFENSEFewest Yards Allowed Per Game
59.91—Bethune-Cookman, 1981 (659 in 11)
Fewest Yards Allowed Per Attempt(Min. 200 Attempts)
3.98—Middle Tenn., 1988 (251 for 999)
Fewest Yards Allowed Per Completion(Min. 100 Completions)
8.88—Yale, 2008 (205 for 1,821)
Lowest Completion Percentage Allowed(Min. 200-299 attempts)
32.34%—Alcorn, 1979 (76 of 235)(Min. 300 attempts)
34.19%—Tennessee St., 1986 (107 of 313)
Fewest Touchdowns Allowed by Passing
1—Nevada, 1978; Middle Tenn., 1990; Penn, 1994
Lowest Passing Efficiency Defense Rating(Since 1990)
61.0—Sacred Heart, 2002 (252 attempts, 87 completions, 19 interceptions, 1,019 yards, 4 TDs)
Most Passes Intercepted By, Per Game
3.18—Florida A&M, 1981 (35 in 11)
Highest Percentage Intercepted By
13.36%—Florida A&M, 1981 (35 of 262)
Most Yards Gained on Interceptions
689—N.C. A&T, 2001 (20 interceptions)
Most Yards Gained Per Game on Interceptions
62.64—N.C. A&T, 2001 (689 in 11)
Most Yards Gained Per Interception Return(Min. 15 Returns)
34.45—N.C. A&T, 2001 (20 for 689)
Most Touchdowns on Interception Returns
7—Jackson St., 1985; Northeastern, 1996
TOTAL DEFENSEFewest Yards Allowed Per Game
149.91—Florida A&M, 1978 (1,649 in 11)

Team Records 18
Fewest Rushing and Passing Touchdowns Allowed Per Game
0.73—Western Mich., 1982 (8 in 11)
Lowest Average Yards Allowed Per Play
2.41—South Carolina St., 1978 (719 for 1,736)
SCORINGFewest Points Allowed Per Game
6.55—South Carolina St., 1978 (72 in 11)
Most Consecutive Games Scoring a Safety
3—Chattanooga, from Sept. 29 through Oct. 13, 2007
FUMBLESMost Opponents’ Fumbles Recovered
29—Western Ky., 1982 (43 fumbles)
FUMBLE RETURNS(Since 1992)
Most Fumbles Returned for Touchdowns
6—UT Martin, 2008 (1 vs. South Fla., Aug. 30; 1 vs. Concordia [AL], Sept. 11; 1 vs. Murray St., Sept. 27; 1 vs. Tennessee Tech, Oct. 16; 1 vs. Auburn, Nov. 8; 1 vs. Eastern Ky., Nov. 22)
TURNOVERSMost Opponents’ Turnovers Per Game
4.89—Canisius, 1996 (44 in 9)
SEASON—SPECIAL TEAMS
PUNTINGMost Punts Per Game
9.64—Louisiana Tech, 1987 (106 in 11)
Fewest Punts Per Game2.09—Ga. Southern, 1999 (23 in 11)
Highest Punting Average48.00—Northern Ariz., 2004 (57 for 2,736);
Southern Utah, 2009 (35 for 1,680)
Highest Net Punting Average(Min. 46 attempts)
44.88—Northern Ariz., 2004 (57 for 2,558)
Most Punts Had Blocked8—Western Ky., 1982
PUNT RETURNSMost Punt Returns Per Game
5.36—Murray St., 1980 (59 in 11)
Fewest Punt Returns Per Game
0.27—Rhode Island, 2009 (3 in 11)
Most Punt-Return Yards Per Game
64.80—Duquesne, 1996 (648 in 10)
Most Yards Gained Per Punt Return(Min. 20 returns)
26.65—James Madison, 2016 (23 for 613)(Min. 30 returns)
19.67—The Citadel, 2008 (30 for 590)
Most Touchdowns Scored on Punt Returns
7—N.C. A&T, 2001 (25 returns)
KICKOFF RETURNSMost Kickoff Returns Per Game
7.73—Morehead St., 1994 (85 in 11; 1,582 yards)
Fewest Kickoff Returns Per Game
1.18—McNeese, 1997 (13 in 11)
Most Kickoff-Return Yards Per Game
148.91—Illinois St., 2010 (1,638 in 11; 66 returns)
Most Yards Gained Per Kickoff Return(Min. 20 rets.)
30.45—Hampton, 2004 (38 for 1,157)
Most Touchdowns Scored on Kickoff Returns
6—Hampton, 2004 (38 returns)
COMBINED RETURNS
(Returns for Interceptions, Punts, Fumbles and Kickoffs)
Most Touchdowns Scored
10—Florida A&M, 2008 (1 interception, 2 fumbles, 4 punts, 3 kickoffs); N.C. Central, 2012 (2 interceptions, 2 fumbles, 5 punts, 1 kickoff)
PUNT RETURN DEFENSELowest Average Yards Allowed Per Punt Return
0.00—North Dakota St., 2016 (3 for 0)
Fewest Returns Allowed1—James Madison, 2012 (11 games, 3 yards)
KICKOFF RETURN DEFENSELowest Average Yards Allowed Per Kickoff Return
10.61—Southern Utah, 1996 (33 for 350)
BLOCKED PUNTSMost Opponents’ Punts Blocked By
9—Middle Tenn., 1988 (73 punts)
TOTAL KICKS BLOCKEDMost Opponents’ Total Kicks Blocked(Includes punts, field goals, PATs)
13—Davidson, 1999 (6 punts, 4 field goals, 3 PATs)

Team Records 19
OTHER RECORDS
ADDITIONAL RECORDSMost Consecutive Victories
24—Penn, from Nov. 14, 1992, through Sept. 30, 1995 (ended Oct. 7, 1995, with 24-14 loss to Columbia); Montana, from Sept. 22, 2001, through Nov. 9, 2002 (ended Nov. 16, 2002, with 30-21 loss to Eastern Wash.)
Most Consecutive Home Victories
39—Ga. Southern, from Sept. 27, 1997, through Dec. 15, 2001 (includes 11 FCS playoff games)
Most Consecutive Losses
80—Prairie View, from Nov. 4, 1989, until Sept. 26, 1998
Most Consecutive Games Without a Win
80—Prairie View, from Nov. 4, 1989, until Sept. 26, 1998
Most Consecutive Games Without Being Shut Out
370—Montana, from 1989 to present(Note: Dayton has a streak of 433 games but has only been an FCS member since 1993. Its FCS streak is 239 games.)
Most Shutouts in a Season
5—South Carolina St., 1978
Most Consecutive Quarters Holding Opponents Scoreless
15—Robert Morris, 1996
Most Consecutive Games with an Interception Return for a Touchdown
4—Jacksonville St., Nov. 11, 2006, through Sept. 8, 2007
Most Consecutive Games Without a Tie
343—Richmond, from Nov. 2, 1963, to Oct. 14, 1995 (ended Oct. 21, 1995, with 3-3 tie with Fordham)
Last tie gameNov. 18, 1995—Dartmouth 10, Princeton 10
Last Scoreless-Tie GameOct. 26, 1985—McNeese & North Texas
Most Points Overcome in Second Half to Win a Game
35—Nevada (55) vs. Weber St. (49), Nov. 2, 1991 (trailed 49-14 with 12:16 remaining in 3rd quarter)
32—Morehead St. (36) vs. Wichita St. (35), Sept. 20, 1986 (trailed 35-3 with 9:03 remaining in 3rd quarter)
31—Montana (52) vs. South Dakota St. (48), Sept. 4, 1993 (trailed 38-7 with 8:12 remaining in 3rd quarter)
Most Points Overcome in Fourth Quarter to Win a Game
28—Delaware St. (38) vs. Liberty (37), Oct. 6, 1990 (trailed 37-9 with 13:00 remaining); Ga. Southern (38) vs. Western Caro. (31) (ot), Oct. 25, 2008 (trailed 31-3 with 10:45 remaining)
Most Points Scored in Fourth Quarter to Win a Game
39—Montana (52) vs. South Dakota St. (48), Sept. 4, 1993 (trailed 38-13 to begin 4th quarter)
33—Missouri St. (40) vs. Illinois St. (28), Oct. 9, 1993 (trailed 21-7 with 11:30 remaining in 4th quarter)
Most Consecutive Extra-Point Kicks Made
134—Boise St. (began Oct. 27, 1984; ended Nov. 12, 1988)
Most Consecutive Winning Seasons
31—Eastern Ky., 1978-2008
Most Consecutive Non-Losing Seasons
37—Eastern Ky., 1973-2008
Most Improved Won-Lost Record
9½ games—Montana St., 1984 (12-2-0, including 3 FCS playoff games) from 1983 (1-10-0)
Most Points Scored in a Brief Period of Time by One Team
14 in :09—Stony Brook (24) vs. UTEP (31), Sept. 3, 2011 (2 TDs, 2 PATs; from 3:19 to 3:10 of 3rd quarter)

All-Time Leaders on Offense 20
ALL-TIME LEADERS ON OFFENSE
RUSHING *Record. †National champion or national leader in that category that season. ^Active player.
Single-Game YardsYds. Player, Team (Opponent) Date437 Maurice Hicks, N.C. A&T (Morgan St.) Oct. 6, 2001409 Charles Roberts, Sacramento St. (Idaho St.) Nov. 6, 1999393 Ryan Fuqua, Portland St. (Eastern Wash.) Nov. 10, 2001379 Reggie Greene, Siena (St. John’s [NY]) Nov. 2, 1996364 Tony Vinson, Towson (Bucknell) Nov. 13, 1993359 Chase Edmonds, Fordham (Lafayette) Oct. 8, 2016356 Joe Rubin, Portland St. (Northern Colo.) Sept. 24, 2005354 Terrance West, Towson (Eastern Ill.) Dec. 13, 2013353 Maurice Hicks, N.C. A&T (South Carolina St.) Nov. 18, 2000349 Shakir Bell, Indiana St. (Drake) Sept. 15, 2012348 Kyle Harbridge, Saint Francis (PA) (Morehead St.) Sept. 17, 2011347 Kade Harrington, Lamar (Abilene Christian) Oct. 10, 2015347 Chase Edmonds, Fordham (Lehigh) Oct. 24, 2015346 William Arnold, Jackson St. (Texas Southern) Nov. 6, 1993345 Russell Davis, Idaho (Portland St.) Oct. 3, 1981337 Gill Fenerty, Holy Cross (Columbia) Oct. 29, 1983337 Frank Alessio, Massachusetts (Boston U.) Nov. 11, 1995336 Gene Lake, Delaware St. (Liberty) Nov. 10, 1984332 Justise Hairston, Central Conn. St. (Saint Francis [PA]) Oct. 7, 2006331 Cory Harge, Central Conn. St. (Stony Brook) Nov. 6, 2004329 Jerry Azumah, New Hampshire (Hofstra) Nov. 7, 1998328 Herb Donaldson, Western Ill. (Indiana St.) Nov. 4, 2006327 Tony Vinson, Towson (Morgan St.) Nov. 20, 1993324 Robert Vaughn, Alabama St. (Tuskegee) Nov. 24, 1994324 John Campbell, Wagner (Jacksonville) Nov. 14, 1998324 Charles Dunn, Portland St. (Hofstra) Oct. 7, 2000Note: There have been 59 300-yard rushing games in FCS history.
Season YardsPlayer, Team Year G Carries Yards Yds/CTerrance West, Towson †2013 16 413 *2,519 6.10Jamaal Branch, Colgate †2003 16 *450 2,326 5.17Marshaun Coprich, Illinois St. †2014 15 370 2,274 6.14Charles Roberts, Sacramento St. †1998 11 386 2,260 5.85Arnold Mickens, Butler †1994 10 409 2,255 5.51Jerry Azumah, New Hampshire 1998 11 342 2,195 6.42Jesse Chatman, Eastern Wash. †2001 11 285 2,096 7.35Kade Harrington, Lamar †2015 11 266 2,092 7.86Charles Roberts, Sacramento St. †1999 11 303 2,082 6.87Archie Amerson, Northern Ariz. †1996 11 333 2,079 6.24Louis Ivory, Furman †2000 11 286 2,079 7.27Zach Zenner, South Dakota St. †2012 13 300 2,044 6.81Eric Breitenstein, Wofford 2012 13 290 2,035 7.02Zach Zenner, South Dakota St. 2014 14 337 2,019 5.99Tony Vinson, Towson †1993 10 293 2,016 6.89Zach Zenner, South Dakota St. 2013 14 351 2,015 5.74John Crockett, North Dakota St. 2014 16 368 1,994 5.42Marshaun Coprich, Illinois St. 2015 13 321 1,967 6.13Miguel Maysonet, Stony Brook 2012 13 267 1,964 7.36Steve Baylark, Massachusetts †2006 15 338 1,960 5.80Aaron Stecker, Western Ill. †1997 11 298 1,957 6.57Marcel Shipp, Massachusetts 1998 11 319 1,949 6.11Omar Cuff, Delaware †2007 15 398 1,945 4.89Adrian Peterson, Ga. Southern 1998 11 257 1,932 7.52Tim Hightower, Richmond 2007 14 327 1,924 5.88
Season Yards Per GamePlayer, Team Year G Carries Yards TD Yds/GArnold Mickens, Butler †1994 10 409 2,255 18 *225.5Charles Roberts, Sacramento St. †1998 11 386 2,260 19 205.5Tony Vinson, Towson †1993 10 293 2,016 23 201.6Jerry Azumah, New Hampshire 1998 11 342 2,195 22 199.6Reggie Greene, Siena †1997 9 256 1,778 18 197.6Reggie Greene, Siena †1996 9 280 1,719 12 191.0Jesse Chatman, Eastern Wash. †2001 11 285 2,096 24 190.6Kade Harrington, Lamar †2015 11 266 2,092 21 190.2Charles Roberts, Sacramento St. †1999 11 303 2,082 22 189.3Archie Amerson, Northern Ariz. 1996 11 333 2,079 25 189.0Louis Ivory, Furman †2000 11 286 2,079 16 189.0Aaron Stecker, Western Ill. 1997 11 298 1,957 24 177.9Marcel Shipp, Massachusetts 1998 11 319 1,949 13 177.2Adrian Peterson, Ga. Southern 1998 11 257 1,932 25 175.6Keith Elias, Princeton 1993 10 305 1,731 19 173.1Nick Hartigan, Brown †2005 10 314 1,727 20 172.7Gene Lake, Delaware St. †1984 10 238 1,722 20 172.2Karlton Carpenter, Southern Ill. 1998 11 323 1,892 16 172.0Rich Erenberg, Colgate †1983 11 302 1,883 20 171.2Jordan Scott, Colgate †2007 11 409 1,875 20 170.5Nate Eachus, Colgate †2010 11 317 1,871 21 170.1Justise Hairston, Central Conn. St. †2006 11 277 1,847 20 167.9Jayson Foster (QB), Ga. Southern 2007 11 261 1,844 24 167.6Sean Bennett, Evansville 1997 10 235 1,668 16 166.8Kenny Gamble, Colgate †1986 11 307 1,816 21 165.1
Career YardsPlayer, Team Years Carries Yards Yds/C LongAdrian Peterson, Ga. Southern 1998-2001 996 *6,559 6.59 91Charles Roberts, Sacramento St. 1997-2000 1,124 6,553 5.83 70Zach Zenner, South Dakota St. 2011-14 1,095 6,548 5.98 99Jerry Azumah, New Hampshire 1995-98 1,044 6,193 5.93 96Scott Phaydavong, Drake 2004-07 925 5,830 6.30 82Eric Breitenstein, Wofford 2008-12 912 5,730 6.28 90Tim Flanders, Sam Houston St. 2010-13 999 5,664 5.67 71Jordan Scott, Colgate 2005-08 *1,240 5,621 4.53 80Tarik Cohen, N.C. A&T 2013-16 868 5,619 6.47 94Matt Cannon (QB), Southern Utah 1997-2000 757 5,489 †7.25 93Reggie Greene, Siena 1994-97 890 5,415 6.08 82Jermaine Austin, Ga. Southern 2002-05 857 5,411 6.31 78Marcel Shipp, Massachusetts 1997-2000 1,042 5,383 5.17 82Thomas Haskins, VMI 1993-96 899 5,355 5.96 80Louis Ivory, Furman 1998-2001 847 5,353 6.32 88Frank Hawkins, Nevada 1977-80 945 5,333 5.64 50Steve Baylark, Massachusetts 2003-06 1,104 5,332 4.83 50Rick Sarille, Wagner 1995-99 965 5,290 5.48 80^Chase Edmonds, Fordham 2014-16 802 5,285 6.59 91Kenny Gamble, Colgate 1984-87 963 5,220 5.42 91Marshaun Coprich, Illinois St. 2012-15 926 5,195 5.61 83Markus Thomas, Eastern Ky. 1989-92 784 5,149 6.57 90Zach Bauman, Northern Ariz. 2010-13 1,003 5,132 5.12 57Charles Anthony, Tennessee St. 2001-04 910 5,057 5.56 80David Sinisi, Monmouth 2006-09 963 5,049 5.24 99*Record for minimum 600 rushes.
Career Yards Per Game(Minimum 2,500 yards; player must have concluded his career)Player, Team Years G Carries Yards TD Yds/GArnold Mickens, Butler 1994-95 20 763 3,813 29 *190.7Adrian Peterson, Ga. Southern 1998-2001 42 996 *6,559 *84 156.2

All-Time Leaders on Offense 21
Player, Team Years G Carries Yards TD Yds/GAaron Stecker, Western Ill. 1997-98 20 550 3,081 36 154.1Tim Hall, Robert Morris 1994-95 19 393 2,908 27 153.1Jerry Azumah, New Hampshire 1995-98 41 1,044 6,193 60 151.0Reggie Greene, Siena 1994-97 36 890 5,415 45 150.4Nick Hartigan, Brown 2003-05 30 912 4,488 52 149.6Charles Roberts, Sacramento St. 1997-2000 44 1,124 6,553 56 148.9Charles Dunn, Portland St. 1998-2000 33 872 4,831 46 146.4Archie Amerson, Northern Ariz. 1995-96 22 526 3,196 37 145.3Keith Elias, Princeton 1991-93 30 736 4,208 49 140.3Jesse Chatman, Eastern Wash. 1999-2001 31 627 4,173 48 134.6Jordan Scott, Colgate 2005-08 42 *1,240 5,621 57 133.8Mike Clark, Akron 1984-86 32 804 4,257 24 133.0Scott Phaydavong, Drake 2004-07 44 925 5,830 37 132.5Gary Jones, Albany (NY) 2002-03 23 442 3,033 40 131.9Corey Holmes, Mississippi Val. 1999-2000 22 526 2,897 21 131.7Terrance West, Towson 2011-13 37 802 4,859 *84 131.3Marcus Mason, Youngstown St. 2005-06 21 478 2,739 31 130.4Rick Sarille, Wagner 1995-99 41 965 5,290 50 129.0Charles Tharp, Western Ill. 1999-2000 22 520 2,834 29 128.8Michael Hicks, South Carolina St. 1993-95 32 701 4,093 51 127.9Miguel Maysonet, Stony Brook 2010-12 37 695 4,725 48 127.7Louis Ivory, Furman 1998-2001 42 847 5,353 53 127.5Marcel Shipp, Massachusetts 1997-2000 43 1,042 5,383 49 125.2
Career Rushing TouchdownsPlayer, Team Years G TDAdrian Peterson, Ga. Southern 1998-2001 42 *84Terrance West, Towson 2011-13 37 *84Matt Cannon (QB), Southern Utah 1997-2000 44 69Kevin Richardson, Appalachian St. 2004-07 55 66Tim Flanders, Sam Houston St. 2010-13 54 66Omar Cuff, Delaware 2004-07 41 65David Sinisi, Monmouth 2006-09 44 65Armanti Edwards (QB), Appalachian St. 2006-09 51 65Eric Breitenstein, Wofford 2008-12 50 65David Dinkins, Morehead St. (QB) 1997-2000 37 63Jerome Felton, Furman 2004-07 50 63Chaz Williams, Ga. Southern (QB) 2001-04 45 62Alonzo Coleman, Hampton 2003-06 46 62^Chase Edmonds, Fordham 2014-16 37 62Zach Zenner, South Dakota St. 2011-14 52 61Jerry Azumah, New Hampshire 1995-98 41 60Clifton Dawson, Harvard 2003-06 39 60Marshaun Coprich, Illinois St. 2012-15 52 59Jordan Scott, Colgate 2005-08 42 57Charles Roberts, Sacramento St. 1997-2000 44 56Tarik Cohen, N.C. A&T 2013-16 46 56Kenny Gamble, Colgate 1984-87 42 55Rene Ingoglia, Massachusetts 1992-95 41 54Jayson Foster (QB), Ga. Southern 2004-07 46 54Mike McLeod, Yale 2005-08 40 54Note: Anthony Russo of St. John’s (NY) scored 16 TDs in 1993 at the FCS level but had 57 total touchdowns during 1990-94.
Annual ChampionsYear Player, Team Cl. G Carries Yards Yds/G1978 Frank Hawkins, Nevada So. 10 259 1,445 144.51979 Frank Hawkins, Nevada Jr. 11 293 1,683 153.01980 Frank Hawkins, Nevada Sr. 11 307 1,719 156.31981 Gregg Drew, Boston U. Jr. 10 309 1,257 125.71982 Garry Pearson, Massachusetts Sr. 11 312 1,631 148.31983 Rich Erenberg, Colgate Sr. 11 302 1,883 171.21984 Gene Lake, Delaware St. Jr. 10 238 1,722 172.21985 Burton Murchison, Lamar So. 11 265 1,547 140.61986 Kenny Gamble, Colgate Jr. 11 307 1,816 165.11987 Harvey Reed, Howard Sr. 10 211 1,512 151.2
Year Player, Team Cl. G Carries Yards Yds/G1988 Elroy Harris, Eastern Ky. Jr. 10 277 1,543 154.31989 Carl Smith, Maine So. 11 305 1,680 152.71990 Walter Dean, Grambling Sr. 11 221 1,401 127.41991 Al Rosier, Dartmouth Sr. 10 258 1,432 143.21992 Keith Elias, Princeton Jr. 10 245 1,575 157.51993 Tony Vinson, Towson Sr. 10 293 2,016 201.61994 Arnold Mickens, Butler Jr. 10 409 2,255 *225.51995 Reggie Greene, Siena So. 9 273 1,461 162.31996 Reggie Greene, Siena Jr. 9 280 1,719 191.01997 Reggie Greene, Siena Sr. 9 256 1,778 197.61998 Charles Roberts, Sacramento St. So. 11 386 2,260 205.51999 Charles Roberts, Sacramento St. Jr. 11 303 2,082 189.32000 Louis Ivory, Furman Jr. 11 286 2,079 189.02001 Jesse Chatman, Eastern Wash. Sr. 11 285 2,096 190.62002 Jay Bailey, Austin Peay Sr. 12 319 1,687 140.62003 Nick Hartigan, Brown So. 10 275 1,498 149.82004 Charles Anthony, Tennessee St. Sr. 11 306 1,739 158.12005 Nick Hartigan, Brown Sr. 10 314 1,727 172.72006 Justise Hairston, Central Conn. St. Sr. 11 277 1,847 167.92007 Jordan Scott, Colgate Jr. 11 409 1,875 170.52008 Herb Donaldson, Western Ill. Sr. 11 324 1,784 162.22009 Pat Paschall, North Dakota St. Sr. 10 207 1,397 139.72010 Nate Eachus, Colgate Jr. 11 317 1,871 170.12011 Shakir Bell, Indiana St. So. 11 230 1,670 151.82012 Zach Zenner, South Dakota St. So. 13 300 2,044 157.22013 Terrance West, Towson Jr. 16 413 *2,519 157.42014 Khairi Dickson, Saint Francis (PA) Jr. 11 309 1,708 155.32015 Kade Harrington, Lamar Jr. 11 266 2,092 190.22016 Chase Edmonds, Fordham Jr. 11 257 1,799 163.5
QUARTERBACK RUSHING*Record. ^Active player.
Single-Game Yards(Since 2000)Yds. Player, Team (Opponent) Date316 Jerick McKinnon, Ga. Southern (Central Ark.) Dec. 1, 2012313 Armanti Edwards, Appalachian St. (Richmond) Dec. 7, 2007291 Armanti Edwards, Appalachian St. (The Citadel) Nov. 3, 2007288 Gavin McCarney, Colgate (Lafayette) Nov. 3, 2012281 Tuskani Figaro, Nicholls St. (Arkansas Tech) Sept. 28, 2013279 Jayson Foster, Ga. Southern (Wofford) Nov. 3, 2007276 Vad Lee, James Madison (SMU) Sept. 26, 2015274 Lenorris Footman, Alcorn (Southern U.) Oct. 31, 2015264 DeAndre Presley, Appalachian St. (Western Ill.) Dec. 4, 2010262 Matt Cannon, Southern Utah (Idaho St.) Oct. 21, 2000256 John Robertson, Villanova (New Hampshire) Oct. 19, 2013255 Matt Cannon, Southern Utah (Rocky Mountain) Nov. 4, 2000254 David Dinkins, Morehead St. (Butler) Sept. 9, 2000253 Jayson Foster, Ga. Southern (Coastal Caro.) Sept. 15, 2007252 Daris Wilson, Bucknell (Holy Cross) Oct. 30, 2004245 Donte Pimpleton, Western Ky. (Illinois St.) Nov. 3, 2001243 Greg Patton, Dartmouth (Cornell) Nov. 7, 2009241 Zach Terrell, Liberty (Chattanooga) Oct. 8, 2005236 Daris Wilson, Bucknell (Colgate) Nov. 13, 2004233 Allen Suber, Bethune-Cookman (Morgan St.) Oct. 5, 2002231 David Dinkins, Morehead St. (Ky. Wesleyan) Nov. 4, 2000231 Jayson Foster, Ga. Southern (West Ga.) Sept. 8, 2007231 Curtis Pulley, Florida A&M (Morgan St.) Oct. 31, 2009230 Nicholas Bazan, Albany (NY) (Stony Brook) Oct. 23, 2004226 Chris Brown, Cal Poly (Montana) Oct. 25, 2014

All-Time Leaders on Offense 22
Season Yards(Since 1978)Player, Team Year G Carries Yards TD Yds./CJayson Foster, Ga. Southern †2007 11 261 *1,844 24 7.07Jerick McKinnon, Ga. Southern †2012 14 269 1,817 20 6.75Rodney Landers, James Madison †2008 14 268 1,770 16 6.60Matt Cannon, Southern Utah †2000 11 218 1,602 22 7.35Armanti Edwards, Appalachian St. 2007 11 237 1,588 21 6.70Matt Cannon, Southern Utah †1998 11 199 1,533 14 7.80Jayson Foster, Ga. Southern †2005 12 239 1,481 21 6.20Chaz Williams, Ga. Southern †2002 14 *290 1,422 *27 4.90Gavin McCarney, Colgate †2012 12 193 1,406 23 7.28David Dinkins, Morehead St. 2000 9 190 1,405 21 7.39John Robertson, Villanova †2013 11 217 1,405 20 6.47Aaron Bailey, UNI †2015 14 257 1,334 19 5.19Willie Taggart, Western Ky. 1998 11 210 1,313 15 6.25Matt Cannon, Southern Utah †1999 11 203 1,310 23 6.45Tirrell Rennie, UNI †2010 12 232 1,291 15 5.56Rodney Landers, James Madison 2007 12 223 1,273 12 5.71Tim Maypray, VMI 2008 11 195 1,266 12 6.49Chris Brown, Cal Poly †2014 12 246 1,265 17 5.14Joe Dupaix, Southern Utah †1996 11 271 1,246 12 4.60Jacob Huesman, Chattanooga 2015 13 220 1,244 13 5.65Willie Taggart, Western Ky. †1997 10 152 1,217 15 *8.01Marvin Marshall, South Carolina St. †1994 11 160 1,201 10 7.51David Dinkins, Morehead St. 1998 11 147 1,169 20 7.95Eli Jenkins, Jacksonville St. 2015 15 192 1,161 15 6.05Armanti Edwards, Appalachian St. †2006 15 188 1,153 15 6.13
Career Yards(Since 1978)Player, Team Years G Carries Yards TD Yds/G#Matt Cannon, Southern Utah 1997-2000 44 674 *4,852 64 *110.3Armanti Edwards, Appalachian St. 2006-09 51 755 4,361 *65 85.5Jacob Huesman, Chattanooga 2012-15 50 789 4,056 43 81.1Willie Taggart, Western Ky. 1995-98 41 684 3,957 46 96.5Jerick McKinnon, Ga. Southern 2010-13 47 619 3,899 42 83.0Jayson Foster, Ga. Southern 2004-07 46 569 3,835 54 83.4Eli Jenkins, Jacksonville St. 2013-16 53 636 3,796 47 71.6David Dinkins, Morehead St. 1997-2000 37 553 3,765 63 101.8Jack Douglas, The Citadel 1989-92 44 *832 3,674 48 83.5John Robertson, Villanova 2011-15 40 684 3,643 48 91.1Rodney Landers, James Madison 2005-08 44 540 3,477 31 79.0Greg Hill, Ga. Southern 1996-99 41 575 3,309 49 80.7Chris Brown, Cal Poly 2011-15 31 578 3,034 38 97.9Allen Suber, Bethune-Cookman 2000-03 45 578 2,897 39 64.4Gavin McCarney, Colgate 2010-13 32 433 2,783 35 87.0Chaz Williams, Ga. Southern 2001-04 40 603 2,768 62 69.2Jayson Davis, Rhode Island 2002-05 42 684 2,717 42 64.7Ben Dupree, The Citadel 2010-13 45 598 2,679 36 59.5Josh Non, Nicholls St. 2000-03 44 664 2,658 29 60.4Matt Scheible, Southeast Mo. St. 2008-11 44 545 2,595 22 59.0Greg McGhee, Howard 2011-14 43 535 2,579 26 60.0Mitch Allen, Wofford 2008-11 46 502 2,574 23 56.0Tracy Ham, Ga. Southern 1984-86 33 511 2,506 32 75.9Travis Wilson, Wofford 1998-2001 44 550 2,488 18 56.5Tony Scales, VMI 1989-92 44 561 2,475 19 56.3#Does not include statistics as a slotback in 1997.
ALL-PURPOSE YARDS*Record. †National champion or national leader in that category that season. ^Active player.
All-Purpose Single-Game HighsYds. Player, Team (Opponent) Date467 Joey Stockton, Western Ky. (Austin Peay) Sept. 16, 1995463 Michael Lerch, Princeton (Brown) Oct. 12, 1991458 Brian Westbrook, Villanova (Delaware) Nov. 18, 2000457 Lyle Harbridge, Saint Francis (PA) (Morehead St.) Sept. 17, 2011453 Herman Hunter, Tennessee St. (Mississippi Val.) Nov. 13, 1982447 Maurice Hicks, N.C. A&T (Morgan St.) Oct. 6, 2001437 Ryan Fuqua, Portland St. (Eastern Wash.) Nov. 10, 2001430 William Osborne, Texas Southern (Mississippi Val.) Nov. 8, 2008428 Brian Westbrook, Villanova (Pittsburgh) Sept. 5, 1998420 Reggie Greene, Siena (St. John’s [NY]) Nov. 2, 1996420 Greg Hardin, North Dakota (Montana) Oct. 20, 2012410 Steven Rush, Missouri St. (Illinois St.) Nov. 8, 2003409 Charles Roberts, Sacramento St. (Idaho St.) Nov. 6, 1999409 Josh Rue, Duquesne (Canisius) Nov. 17, 2001407 C.J. Tuckett, Weber St. (Northern Ariz.) Nov. 12, 2011405 Brian Westbrook, Villanova (James Madison) Oct. 6, 2001402 Chase Edmonds, Fordham (Lehigh) Oct. 24, 2015401 Eddie Conti, Delaware (Northeastern) Oct. 3, 1998401 Eddie Conti, Delaware (UConn) Nov. 7, 1998399 Kentel Williams, Austin Peay (Eastern Ky.) Nov. 12, 2016398 Johnta Hebert, Prairie View (Southern U.) Oct. 17, 2015394 Jerome Mathis, Hampton (William & Mary) Nov. 27, 2004391 Gatlin Casey, Lehigh (Colgate) Oct. 8, 2016389 Marc Mariani, Montana (South Dakota St.) Nov. 28, 2009389 Gerald Stevenson, Charleston So. (Gardner-Webb) Oct. 16, 2010

All-Time Leaders on Offense 23
Season YardsPlayer, Team Year Rush Rcv. Int. PR KOR Yds. Yds./PBrian Westbrook, Villanova †1998 1,046 1,144 0 192 644 *3,026 9.2Brian Westbrook, Villanova †2000 1,220 724 0 0 1,048 2,992 10.8Brian Westbrook, Villanova †2001 1,603 658 0 122 440 2,823 8.5Terrance West, Towson †2013 *2,519 258 0 0 0 2,777 6.3Jerry Azumah, New Hampshire 1998 2,195 218 0 5 308 2,726 7.3Henry Harris, Southeast Mo. St. †2010 1,735 183 0 0 691 2,609 7.4Jesse Chatman, Eastern Wash. 2001 2,096 424 0 0 0 2,520 7.8Jonathan Grimes, William & Mary †2011 1,431 262 0 0 817 2,510 7.2Omar Cuff, Delaware †2007 1,945 554 0 0 0 2,499 5.5Brock Jackolski, Stony Brook 2011 1,418 114 0 55 854 2,441 9.5Charles Roberts, Sacramento St. 1998 2,260 79 0 0 91 2,430 6.1Archie Amerson, Northern Ariz. †1996 2,079 262 0 0 88 2,429 6.9Kenny Gamble, Colgate †1986 1,816 178 0 40 391 2,425 7.1Taiwan Jones, Eastern Wash. 2010 1,742 342 0 28 309 2,421 9.2Stephan Lewis, New Hampshire 2001 1,390 527 0 0 471 2,388 7.4Johnnie Gray, Weber St. 2001 1,571 446 0 0 369 2,386 6.5Terrence Holt, Austin Peay †2009 793 187 0 199 1,194 2,373 10.4Eddie Conti, Delaware 1998 -2 1,712 0 156 502 2,368 18.2Treyvn Smith, Weber St. †2008 1,585 778 0 0 0 2,363 6.6Jamaal Branch, Colgate †2003 2,326 24 0 0 0 2,350 5.2Kade Harrington, Lamar †2015 2,092 216 0 0 39 2,347 8.3Taiwan Jones, Eastern Wash. 2009 1,213 561 0 0 571 2,345 10.1Detrez Newsome, Western Caro. †2016 1,031 342 0 0 970 2,343 10.3Deji Karim, Southern Ill. 2009 1,694 212 0 0 433 2,339 8.6Marcel Shipp, Massachusetts 1998 1,949 288 0 0 100 2,337 6.6
Season Yards Per GamePlayer, Team Year Rush Rcv. Int. PR KOR Yds. Yds./GBrian Westbrook, Villanova †1998 1,046 1,144 0 192 644 *3,026 *275.1Brian Westbrook, Villanova †2000 1,220 724 0 0 1,048 2,992 272.0Brian Westbrook, Villanova †2001 1,603 658 0 122 440 2,823 256.6Jerry Azumah, New Hampshire 1998 2,195 218 0 5 308 2,726 247.8Reggie Greene, Siena †1996 1,719 50 0 0 337 2,106 234.0Jesse Chatman, Eastern Wash. 2001 2,096 424 0 0 0 2,520 229.1Jonathan Grimes, William & Mary †2011 1,431 262 0 0 817 2,510 228.2Arnold Mickens, Butler †1994 2,255 7 0 0 0 2,262 226.2Johnta’ Herbert, Prairie View †2015 1,063 269 0 0 921 2,253 225.3Reggie Greene, Siena †1997 1,719 50 0 0 158 2,009 223.2Charles Roberts, Sacramento St. 1998 2,260 79 0 0 91 2,430 220.9Archie Amerson, Northern Ariz. 1996 2,079 262 0 0 88 2,429 220.8Kenny Gamble, Colgate †1986 1,816 178 0 40 391 2,425 220.5Henry Harris, Southeast Mo. St. †2010 1,735 183 0 0 691 2,609 217.4Reggie Greene, Siena †1995 1,461 77 0 53 363 1,954 217.1Stephan Lewis, New Hampshire 2001 1,390 527 0 0 471 2,388 217.1Johnnie Gray, Weber St. 2001 1,571 446 0 0 369 2,386 216.9Terrence Holt, Austin Peay †2009 793 187 0 199 1,194 2,373 215.7Eddie Conti, Delaware 1998 -2 1,712 0 156 502 2,368 215.3Kade Harrington, Lamar †2015 2,092 216 0 0 39 2,347 213.4Steve Silva, Holy Cross †2005 912 364 0 395 462 2,133 213.3Detrez Newsome, Western Caro. †2016 1,031 342 0 0 970 2,343 213.0Marcel Shipp, Massachusetts 1998 1,949 288 0 0 100 2,337 212.5Michael Clemons, William & Mary 1986 1,065 516 0 330 423 2,334 212.2DaVon Fowlkes, Appalachian St. †2004 82 1,618 0 194 419 2,313 210.3
Career YardsPlayer, Team Year Rush Rcv. Int. PR KOR Yds. Yds./PBrian Westbrook, Villanova 1997-98, 2000-01 4,298 2,582 0 343 2,289 *9,512 9.3Jerry Azumah, New Hampshire 1995-98 6,193 1,153 0 5 1,025 8,376 7.4Zach Zenner, South Dakota St. 2011-14 6,548 909 0 10 754 8,221 7.3Jonathan Grimes, William & Mary 2008-11 4,541 1,125 0 0 2,289 7,955 6.8Kenny Gamble, Colgate 1984-87 5,220 536 0 104 1,763 7,623 7.0Johnta’ Hebert, Prairie View 2012-15 3,133 1,301 0 0 3,093 7,527 9.3Terrence Holt, Austin Peay 2007-10 1,939 343 0 547 *4,683 7,512 11.5Claude Mathis, Texas St. 1994-97 4,691 744 0 635 1,353 7,423 7.0Thomas Haskins, VMI 1993-96 5,355 179 0 216 1,661 7,411 7.2

All-Time Leaders on Offense 24
Player, Team Year Rush Rcv. Int. PR KOR Yds. Yds./PRick Sarille, Wagner 1995-99 5,290 365 0 0 1,682 7,337 6.9Javarus Dudley, Fordham 2000-03 58 4,197 0 192 2,668 7,115 16.3Charles Roberts, Sacramento St. 1997-2000 6,553 382 0 12 165 7,112 6.0Cooper Kupp, Eastern Wash. 2013-16 58 *6,464 0 426 90 7,038 14.8Reggie Greene, Siena 1994-97 5,415 274 0 53 1,217 6,959 7.1David Johnson, UNI 2011-14 4,682 1,734 0 0 438 6,854 6.7Jordan Brown, Bryant 2009-12 4,238 463 0 509 1,608 6,818 6.8JT Rogan, San Diego 2005-07, 09 3,559 1,068 0 0 2,184 6,811 7.6Adrian Peterson, Ga. Southern 1998-2001 *6,559 225 0 0 0 6,784 6.7Marcel Shipp, Massachusetts 1997-2000 5,383 932 0 0 392 6,707 5.7^Chase Edmonds, Fordham 2014-16 5,285 776 0 0 584 6,645 7.4Fabian Truss, Samford 2010-13 3,088 764 0 295 2,493 6,640 5.6Tarik Cohen, N.C. A&T 2013-16 5,619 945 0 4 26 6,594 6.8Ryan Fuqua, Portland St. 2001-04 4,730 819 0 0 982 6,531 6.2Brock Jackolski, Hofstra/Stony Brook 2008-09, 10-11 3,064 488 0 54 2,827 6,433 10.1Trevyn Smith, Weber St. 2006-09 5,025 1,349 0 0 42 6,416 5.8
Career Yards Per Game(Minimum 3,200 yards; player must have concluded his career)Player, Team Years G Rush Rcv. Int. PR KOR Yards Yds./GBrian Westbrook, Villanova 1997-98, 2000-01 44 4,298 2,582 0 343 2,289 *9,512 *216.2Jerry Azumah, New Hampshire 1995-98 41 6,193 1,153 0 5 1,025 8,376 204.3Arnold Mickens, Butler 1994-95 20 3,813 47 0 0 87 3,947 197.4Tim Hall, Robert Morris 1994-95 19 2,908 793 0 0 0 3,701 194.8Reggie Greene, Siena 1994-97 36 5,415 274 0 53 1,217 6,959 193.3Dave Meggett, Towson 1987-88 18 1,658 788 0 212 745 3,403 189.1Archie Amerson, Northern Ariz. 1995-96 22 3,196 484 0 0 382 4,062 184.6Kenny Gamble, Colgate 1984-87 42 5,220 536 0 104 1,763 7,623 181.5Rick Sarille, Wagner 1995-99 41 5,290 365 0 0 1,682 7,337 179.0Rob Holloman, Central Conn. St. 2012-14 33 3,672 773 0 63 1,300 5,808 176.0Aaron Stecker, Western Ill. 1997-98 20 3,081 427 0 0 0 3,508 175.4Johnta’ Hebert, Prairie View 2012-15 43 3,133 1,301 0 0 3,093 7,527 175.1Rich Erenberg, Colgate 1982-83 21 2,618 423 0 268 315 3,624 172.6Terrence Holt, Austin Peay 2007-10 44 1,939 343 0 547 *4,683 7,512 170.7Nick Miller, Southern Utah 2007-08 22 59 1,196 0 576 1,907 3,738 169.9Aaron Woods, Portland St. 2008-09 23 17 1,563 0 95 2,222 3,897 169.4Claude Mathis, Texas St. 1994-97 44 4,691 744 0 635 1,353 7,423 168.7Thomas Haskins, VMI 1993-96 44 5,355 179 0 216 1,661 7,411 168.4Ozzie Young, Valparaiso 1993-95 29 1,576 1,123 0 418 1,728 4,845 167.1Nick Hartigan, Brown 2003-05 30 4,488 510 0 0 0 4,998 166.6Fine Unga, Weber St. 1987-88 22 2,298 391 0 7 967 3,663 166.5Jonathan Grimes, William & Mary 2008-11 48 4,541 1,125 0 0 2,289 7,955 165.7Mark Rodgers, Cal Poly 2010-11 20 1,470 406 0 0 1,372 3,248 162.4Fabian Truss, Samford 2010-13 41 3,088 764 0 295 2,493 6,640 162.0Adrian Peterson, Ga. Southern 1998-2001 42 *6,559 225 0 0 0 6,784 161.5
Annual ChampionsYear Player, Team Class Rush Rcv. Int. PR KOR Yds. Yds./G1978 Frank Hawkins, Nevada So. 1,445 211 0 0 0 1,656 165.61979 Frank Hawkins, Nevada Jr. 1,683 123 0 0 0 1,806 164.21980 Ken Jenkins, Bucknell Jr. 1,270 293 0 65 256 1,884 188.41981 Garry Pearson, Massachusetts Jr. 1,026 105 0 0 450 1,581 175.71982 Pete Mandley, Northern Ariz. Jr. 36 1,067 0 344 532 1,979 179.91983 Rich Erenberg, Colgate Sr. 1,883 214 0 126 18 2,241 203.71984 Gene Lake, Delaware St. Jr. 1,722 37 0 0 0 1,759 175.91985 Gill Fenerty, Holy Cross Sr. 1,368 187 0 1 414 1,970 197.01986 Kenny Gamble, Colgate Jr. 1,816 178 0 40 391 2,425 220.51987 Dave Meggett, Towson Jr. 814 572 0 78 327 1,791 199.01988 Otis Washington, Western Caro. Sr. 66 907 0 0 1,113 2,086 189.61989 Dominic Corr, Eastern Wash. Sr. 796 52 0 0 807 1,655 183.91990 Barry Bourassa, New Hampshire So. 957 276 0 133 368 1,734 192.71991 Barry Bourassa, New Hampshire Jr. 1,130 426 0 0 596 2,152 195.61992 David Wright, Indiana St. Fr. 1,313 108 0 0 593 2,014 183.11993 Tony Vinson, Towson Sr. 2,016 57 0 0 0 2,073 207.31994 Arnold Mickens, Butler Jr. 2,255 7 0 0 0 2,262 226.21995 Reggie Greene, Siena So. 1,461 77 0 53 363 1,954 217.1

All-Time Leaders on Offense 25
Year Player, Team Class Rush Rcv. Int. PR KOR Yds. Yds./G1996 Reggie Greene, Siena Jr. 1,719 50 0 0 337 2,106 234.01997 Reggie Greene, Siena Sr. 1,778 73 0 0 158 2,009 223.21998 Brian Westbrook, Villanova So. 1,046 1,144 0 192 644 *3,026 *275.11999 Rick Sarille, Wagner Sr. 1,373 226 0 0 475 2,074 207.42000 Brian Westbrook, Villanova Jr. 1,220 724 0 0 1,048 2,992 272.02001 Brian Westbrook, Villanova Sr. 1,603 658 0 122 440 2,823 256.62002 Stephan Lewis, New Hampshire Sr. 1,152 419 0 13 645 2,229 202.62003 Luke McArdle, Georgetown Sr. 0 1,118 0 506 407 2,031 184.62004 DaVon Fowlkes, Appalachian St. Sr. 82 1,618 0 194 419 2,313 210.32005 Steve Silva, Holy Cross Sr. 912 364 0 395 462 2,133 213.32006 Justise Hairston, Central Conn. St. Sr. 1,847 58 0 123 170 2,198 199.82007 Bryant Eteuati, Weber St. Jr. 19 720 0 345 1,199 2,283 207.52008 Nick Miller, Southern Utah Sr. 9 763 0 384 993 2,149 195.42009 Terrence Holt, Austin Peay Jr. 793 187 0 199 1,194 2,373 215.72010 Henry Harris, Southeast Mo. St. Sr. 1,735 183 0 0 691 2,609 217.42011 Jonathan Grimes, William & Mary Sr. 1,431 262 0 0 817 2,510 228.22012 Tyler Varga, Yale So. 935 100 0 0 519 1,554 194.32013 Rob Hollomon, Central Conn. St. Jr. 1,452 223 0 4 591 2,270 189.22014 Johnta’ Herbert, Prairie View Jr. 1,063 269 0 0 921 2,253 225.32015 Kade Harrington, Lamar Jr. 2,092 216 0 0 39 2,347 213.42016 Detrez Newsome, Western Caro. Jr. 1,031 342 0 0 970 2,343 213.0
PASSING *Record. †National champion or national leader in that category that season.
Single-Game YardsYds. Player, Team (Opponent) Date730 Taylor Heinicke, Old Dominion (New Hampshire) Sept. 22, 2012662 Brady Attaway, SFA (Prairie View) Sept. 28, 2013660 Braden Hanson, North Dakota (Montana) Oct. 20, 2012624 Jamie Martin, Weber St. (Idaho St.) Nov. 23, 1991623 Drew Hubel, Portland St. (Eastern Wash.) Oct. 4, 2008619 Doug Pederson, La.-Monroe (SFA) Nov. 11, 1989618 Bruce Eugene, Grambling (Prairie View) Oct. 1, 2005600 Casey Brockman, Murray St. (Tennessee St.) Sept. 17, 2011599 Willie Totten, Mississippi Val. (Prairie View) Oct. 27, 1984595 Robert Kent, Jackson St. (Alabama St.) Oct. 6, 2001589 Vern Harris, Idaho St. (Montana) Oct. 12, 1985588 Martin Hankins, Southeastern La. (Ark.-Monticello) Sept. 2, 2004587 Steve McNair, Alcorn (Southern U.) Oct. 22, 1994577 Dustin Long, Sam Houston St. (McNeese) Nov. 6, 2004574 Michael Herrick, Northern Ariz. (Eastern Wash.) Nov. 21, 2009571 Todd Hammel, SFA (La.-Monroe) Nov. 11, 1989570 Casey Brockman, Murray St. (Missouri St.) Oct. 9, 2010567 Joe Lee, Towson (Lehigh) Oct. 30, 1999566 Tom Ehrhardt, Rhode Island (UConn) Nov. 16, 1985566 Seth Burford, Cal Poly (UNI) Nov. 4, 2000566 Michael Nebrich, Fordham (Penn) Oct. 11, 2014563 Steve McNair, Alcorn (Samford) Oct. 29, 1994560 Brian Ah Yat, Montana (Eastern Wash.) Oct. 19, 1996560 Bobby Seck, Hofstra (Rhode Island) Sept. 25, 2004560 Derek Carr, UT Martin (Murray St.) Oct. 13, 2012
Single-Game AttemptsAtt. Player, Team (Opponent) Date85 Jeremy Moses, SFA (Sam Houston St.) Nov. 1, 200879 Taylor Heinicke, Old Dominion (New Hampshire) Sept. 22, 201277 Neil Lomax, Portland St. (Northern Colo.) Oct. 20, 197976 Joe Lee, Towson (Lehigh) Oct. 30, 199976 Matt Nichols, Eastern Wash. (SFA) Nov. 28, 200976 Brady Attaway, SFA (Sam Houston St.) Oct. 6, 201274 Paul Peterson, Idaho St. (Nevada) Oct. 1, 198373 Drew Hubel, Portland St. (Eastern Wash.) Oct. 4, 200873 Kevin Yost, Idaho St. (Sacramento St.) Sept. 29, 2012

All-Time Leaders on Offense 26
Att. Player, Team (Opponent) Date72 Dave Dickenson, Montana (Idaho) Oct. 21, 199572 Val Troiani, Towson (St. Mary’s [CA]) Nov. 4, 200071 Doug Pederson, La.-Monroe (SFA) Nov. 11, 198971 Bobby Townsend, Howard (Morgan St.) Nov. 13, 199971 Josh Greco, Eastern Ky. (Eastern Ill.) Oct. 15, 200570 Greg Farland, Rhode Island (Boston U.) Oct. 18, 198670 Marcus Fuller, Brown (Princeton) Oct. 18, 201470 Joe Lee, Towson (Dayton) Nov. 6, 199970 Peter Pujals, Holy Cross (Fordham) Oct. 17, 201569 Floyd Haigler, Howard (Hampton) Sept. 13, 200869 Rhett Bomar, Sam Houston St. (Southeastern La.) Nov. 15, 200869 Bo Levi Mitchell, Eastern Wash. (Washington) Sept. 3, 201169 Andy Summerlin, Samford (Furman) Nov. 9, 201369 Devlin Hodges, Samford (Mississippi St.) Oct. 29, 201668 Bruce Eugene, Grambling (McNeese) Sept. 20, 200368 Kevin Yost, Idaho St. (Northern Colo.) Sept. 17, 201168 Zach Lewis, Morehead St. (Campbell) Nov. 5, 201168 Brady Attaway, SFA (Texas St.) Sept. 22, 201268 Brady Attaway, SFA (McNeese) Oct. 27, 201268 Matt Lancaster, Butler (Dartmouth) Sept. 21, 201368 Bennie Coney, Eastern Ky. (Murray St.) Nov. 14, 2015
Single-Game CompletionsCmp. Player, Team (Opponent) Date57 Jeremy Moses, SFA (Sam Houston St.) Nov. 1, 200855 Taylor Heinicke, Old Dominion (New Hampshire) Sept. 22, 201250 Martin Hankins, Southeastern La. (Jacksonville) Nov. 6, 200449 KD Humphries, Murray St. (Austin Peay) Oct. 1, 201648 Clayton Millis, CSUN (St. Mary’s [CA]) Nov. 11, 199548 KD Humphries, Murray St. (Tennessee Tech) Oct. 4, 201447 Jamie Martin, Weber St. (Idaho St.) Nov. 23, 199147 Joe Lee, Towson (Lehigh) Oct. 30, 199947 Michael Herrick, Northern Ariz. (Eastern Wash.) Nov. 21, 200947 Kevin Yost, Idaho St. (Northern Colo.) Sept. 17, 201147 Brady Gustafson, Montana (Cal Poly) Sept. 24, 201647 Gage Gubrud, Eastern Wash. (Central Ark.) Dec. 3, 201646 Willie Totten, Mississippi Val. (Southern U.) Sept. 29, 198446 Doug Pederson, La.-Monroe (SFA) Nov. 11, 198946 Kyle Newhall-Caballe, Brown (Holy Cross) Oct. 10, 200946 Troy Mitchell, Western Caro. (South Fla.) Aug. 30, 201445 Willie Totten, Mississippi Val. (Prairie View) Oct. 27, 198445 Ben Dougherty, Florida A&M (FIU) Nov. 27, 200445 Casey Brockman, Murray St. (Tennessee St.) Sept. 17, 201145 Casey Brockman, Murray St. (Tennessee St.) Oct. 13, 201245 Brady Gustafson, Montana (Eastern Wash.) Oct. 29, 201644 Neil Lomax, Portland St. (Northern Colo.) Oct. 20, 197944 Kyle Slager, Brown (Rhode Island) Oct. 5, 200244 Brady Wahlberg, UT Martin (Jacksonville St.) Oct. 11, 200344 Drew Hubel, Portland St. (Eastern Wash.) Oct. 4, 200844 Brady Attaway, SFA (Sam Houston St.) Oct. 6, 201244 Kevin Yost, Idaho St. (Sacramento St.) Sept. 29, 201244 Brady Attaway, SFA (Prairie View) Sept. 28, 201344 Justin Arias, Idaho St. (Eastern Wash.) Nov. 2, 201344 Andy Summerlin, Samford (Furman) Nov. 9, 201344 Bennie Coney, Eastern Ky. (Murray St.) Nov. 14, 2015
Season Passing Efficiency(Minimum 15 Attempts Per Game)Player, Team Year G Att. Cmp. Int. Pct. Yds. TD Pts.Shawn Knight, William & Mary †1993 10 177 125 4 .706 2,055 22 *204.6Josh Johnson, San Diego †2007 10 301 206 1 .684 2,988 43 198.3Jonathan Dally, Cal Poly 2007 11 192 104 5 .542 2,238 29 196.7Quentin Williams, Bethune-Cookman †2015 11 195 132 6 .677 2,171 19 187.2Bryan Schor, James Madison †2016 14 297 217 6 .731 3,002 29 186.2Case Cookus, Northern Ariz. 2015 11 323 223 5 .690 3,117 37 184.8Vernon Adams, Eastern Wash. †2013 15 486 319 15 .656 4,994 55 183.1

All-Time Leaders on Offense 27
Player, Team Year G Att. Cmp. Int. Pct. Yds. TD Pts.Michael Payton, Marshall †1991 9 216 143 5 .622 2,333 19 181.3John Robertson, Villanova †2014 13 301 197 3 .655 2,846 35 181.3Alli Abrew, Cal Poly †1997 11 191 130 4 .681 1,961 17 179.5Tony Romo, Eastern Ill. †2001 10 207 138 6 .667 2,068 21 178.3Doug Turner, Morehead St. 1997 10 290 190 6 .655 2,869 29 177.5Ted White, Howard †1996 11 289 174 10 .602 2,814 36 176.2Doug Nussmeier, Idaho 1993 11 304 185 5 .609 2,960 33 175.2Brian Kadel, Dayton †1995 11 183 115 6 .628 1,880 18 175.0Eric Rasmussen, San Diego †2003 10 318 195 3 .613 2,982 35 174.5Chris Boden, Villanova 1997 11 345 231 4 .670 3,079 36 174.0Bruce Eugene, Grambling †2005 12 456 254 6 .557 4,360 56 173.9Jeremiah Briscoe, Sam Houston St. 2016 13 503 315 10 .626 4,602 *57 172.9Kelvin Simmons, Troy 1993 11 224 143 6 .638 2,144 23 172.8K.J. Black, Prairie View †2009 9 230 162 4 .704 2,033 22 172.8Ryan Perrilloux, Jacksonville St. 2009 10 236 138 2 .585 2,350 23 172.6Chris Forcier, Furman †2011 11 231 148 8 .641 2,265 23 172.4Rocky Butler, Hofstra 2001 11 335 206 4 .615 3,311 30 171.7Jonathan Dally, Cal Poly †2008 11 202 116 5 .574 1,960 23 171.6
Season YardsPlayer, Team Year G Att. Cmp. Int. Pct. Yards TDGage Gubrud, Eastern Wash. †2016 14 570 386 14 .677 *5,160 48Taylor Heinicke, Old Dominion †2012 13 579 *398 14 .687 5,076 44Jimmy Garoppolo, Eastern Ill. †2013 14 568 375 9 .660 5,050 53Vernon Adams, Eastern Wash. 2013 15 486 319 15 .656 4,994 55Steve McNair, Alcorn †1994 11 530 304 17 .574 4,863 44Jeremiah Briscoe, Sam Houston St. 2016 13 503 315 10 .626 4,602 *57Dustin Long, Sam Houston St. †2004 14 531 333 18 .627 4,588 39Willie Totten, Mississippi Val. †1984 10 518 324 22 .626 4,557 56Bruce Eugene, Grambling †2002 13 543 269 16 .495 4,483 43Cameron Higgins, Weber St. †2008 14 464 304 13 .655 4,460 36Michael Nebrich, Fordham 2013 13 480 353 7 .735 4,380 35Chris Lum, Lehigh †2011 13 543 358 17 .659 4,378 32Bruce Eugene, Grambling †2005 12 456 254 6 .557 4,360 56Brett Gordon, Villanova 2002 15 578 385 14 .666 4,305 36Brady Attaway, SFA 2013 12 584 349 21 .598 4,268 32Joe Flacco, Delaware †2007 15 521 331 5 .635 4,263 23Martin Hankins, Southeastern La. 2004 11 540 357 12 .661 4,240 35Dave Dickenson, Montana †1995 11 455 309 9 .679 4,176 38Joe Lee, Towson †1999 11 577 322 13 .558 4,168 22Jamie Martin, Weber St. †1991 11 500 310 17 .620 4,125 35Jeremy Moses, SFA †2009 13 566 385 21 .680 4,124 40Neil Lomax, Portland St. †1980 11 473 296 12 .626 4,094 37Justin Arias, Idaho St. †2014 12 522 318 38 .609 4,076 38John Friesz, Idaho †1989 11 425 260 8 .612 4,041 31Jeremy Moses, SFA 2008 12 *598 352 20 .589 4,026 41
Season Yards Per GamePlayer, Team Year G Att. Cmp. Int. Pct. Yds. TD Yds/GWillie Totten, Mississippi Val. †1984 10 518 324 22 .626 4,557 56 *455.7Steve McNair, Alcorn †1994 11 530 304 17 .574 4,863 44 442.1Taylor Heinicke, Old Dominion †2012 13 579 *398 14 .687 5,076 44 390.5Martin Hankins, Southeastern La. †2004 11 540 357 12 .661 4,240 35 385.5Dave Dickenson, Montana †1995 11 455 309 9 .679 4,176 38 379.6Joe Lee, Towson †1999 11 577 322 13 .558 4,168 22 378.9Jamie Martin, Weber St. †1991 11 500 310 17 .620 4,125 35 375.0Neil Lomax, Portland St. †1980 11 473 296 12 .626 4,094 37 372.2Gage Gubrud, Eastern Wash. †2016 14 570 386 14 .677 *5,160 48 368.6John Friesz, Idaho †1989 11 425 260 8 .612 4,041 31 367.4Bo Levi Mitchell, Eastern Wash. †2011 11 503 318 13 .632 4,009 33 364.5Bruce Eugene, Grambling †2005 12 456 254 6 .557 4,360 56 363.3Jimmy Garoppolo, Eastern Ill. †2013 14 568 375 9 .660 5,050 53 360.7Neil Lomax, Portland St. †1979 11 516 299 16 .579 3,950 26 359.1Aaron Flowers, CSUN †1997 9 404 255 10 .631 3,226 24 358.4Todd Hammel, SFA 1989 11 401 238 13 .594 3,914 34 355.8Brady Attaway, SFA 2013 12 584 349 21 .598 4,268 32 355.7

All-Time Leaders on Offense 28
Player, Team Year G Att. Cmp. Int. Pct. Yds. TD Yds/GJeff Mathews, Cornell 2012 9 405 251 11 .620 3,196 18 355.1Tom Ehrhardt, Rhode Island †1985 10 497 283 19 .569 3,542 35 354.2Steve McNair, Alcorn †1992 10 427 231 11 .541 3,541 29 354.1Jeremiah Briscoe, Sam Houston St. 2016 13 503 315 10 .626 4,602 *57 354.0Sean Payton, Eastern Ill. 1984 11 473 270 15 .571 3,843 28 349.4Dominic Randolph, Holy Cross †2008 11 520 340 17 .654 3,838 34 348.9Scott Riddle, Elon †2007 11 508 346 13 .681 3,817 31 347.0Casey Therriault, Jackson St. 2011 11 453 272 15 .600 3,808 27 346.2
Season Touchdown PassesPlayer, Team Year G TD PassesJeremiah Briscoe, Sam Houston St. †2016 13 57Willie Totten, Mississippi Val. †1984 10 56Bruce Eugene, Grambling †2005 12 56Vernon Adams, Eastern Wash. †2013 15 55Jimmy Garoppolo, Eastern Ill. 2013 14 53Gage Gubrud, Eastern Wash. 2016 14 48Steve McNair, Alcorn †1994 11 44Taylor Heinicke, Old Dominion †2012 13 44Bruce Eugene, Grambling †2002 13 43Josh Johnson, San Diego †2007 10 43Brian Ah Yat, Montana †1996 11 42Jeremy Moses, SFA †2008 12 41Jeremy Moses, SFA †2009 13 40Johnathan Williams, Grambling †2015 12 39Willie Totten, Mississippi Val. †1985 11 39Dustin Long, Sam Houston St. †2004 14 39Ricky Santos, New Hampshire 2005 13 39Dave Dickenson, Montana †1995 11 38David Macchi, Valparaiso †2003 12 38Justin Arias, Idaho St. †2014 12 38Case Cookus, Northern Ariz. 2015 11 37Neil Lomax, Portland St. †1980 11 37Patrick Bonner, Florida A&M †1998 11 37Bo Levi Mitchell, Eastern Wash. †2010 15 37Ted White, Howard 1996 11 36Chris Boden, Villanova †1997 11 36Brett Gordon, Villanova 2002 15 36Josh Johnson, San Diego 2005 12 36Cameron Higgins, Weber St. 2008 14 36Devlin Hodges, Samford 2016 12 36
Career Passing Efficiency(Minimum 425 completions; player must have concluded his career)Player, Team Years Att. Cmp. Int. Pct. Yds. TD Pts.Josh Johnson, San Diego 2004-07 1,065 724 15 .680 9,699 113 *176.7#Vernon Adams, Eastern Wash. 2012-14 1,081 701 31 .649 10,433 110 173.8Erik Meyer, Eastern Wash. 2002-05 1,097 721 17 .657 10,261 84 166.5Dave Dickenson, Montana 1992-95 1,208 813 26 .673 11,080 96 166.3Michael Nebrich, Fordham 2012-14 926 637 16 .688 8,084 66 162.2Eric Sanders, UNI 2004-07 1,026 714 23 *.696 9,012 70 161.4Drew Miller, Montana 1999-2000 654 430 14 .657 5,900 46 160.5Eric Rasmussen, San Diego 2001-03 851 512 13 .602 7,490 75 160.1Ricky Santos, New Hampshire 2004-07 1,636 1,122 33 .686 13,212 123 157.2Lang Campbell, William & Mary 2001-04 763 495 12 .649 6,494 54 156.6Kevin Hoyng, Dayton 2004-07 862 530 24 .615 7,862 59 155.1Josh McGregor, Jacksonville 2008-11 1,310 784 42 .599 11,230 116 154.7John Robertson, Villanova 2011-15 875 561 18 .641 7,300 65 154.6Doug Nussmeier, Idaho 1990-93 1,225 746 32 .609 10,824 91 154.4Armanti Edwards, Appalachian St. 2006-09 1,180 768 33 .651 10,392 74 154.2Mason Mills, San Diego 2010-13 1,336 887 38 .664 11,104 95 154.0Justin Rascati, James Madison 2003-06 728 487 16 .669 5,912 51 153.8Alex Ross, Coastal Caro. 2012-15 1,174 760 24 .647 9,918 72 151.9Craig Ochs, Montana 2003-04 654 430 16 .657 5,419 42 151.7Liam Coen, Massachusetts 2005-08 1,303 830 46 .637 11,031 90 150.6Mike Brown, Liberty 2008-11 722 469 21 .650 6,072 45 150.4

All-Time Leaders on Offense 29
Player, Team Years Att. Cmp. Int. Pct. Yds. TD Pts.Matt Nagy, Delaware 1997-2000 771 433 32 .562 7,220 52 148.8Joel Sambursky, Southern Ill. 2002-05 933 559 25 .563 7,894 65 148.6Ryan Vena, Colgate 1996-99 819 482 46 .589 7,427 61 148.4Mike Cook, William & Mary 1995-98 804 495 21 .616 6,644 55 148.3#Transferred to an FBS institution for senior year.
Career YardsPlayer, Team Years Att. Cmp. Int. Pct. Yards TDSteve McNair, Alcorn 1991-94 1,680 927 58 .552 *14,496 119Bruce Eugene, Grambling 2001-05 1,657 872 38 .526 13,513 *140Dominic Randolph, Holy Cross 2006-09 1,786 1,131 46 .633 13,455 117Jeremy Moses, SFA 2007-10 *1,893 *1,184 55 .625 13,401 121Scott Riddle, Elon 2007-10 1,779 1,168 41 .657 13,264 106Ricky Santos, New Hampshire 2004-07 1,636 1,122 33 .686 13,212 123Jimmy Garoppolo, Eastern Ill. 2010-13 1,668 1,047 51 .628 13,156 118Willie Totten, Mississippi Val. 1982-85 1,555 907 *75 .583 12,711 139Matt Nichols, Eastern Wash. 2006-09 1,608 996 46 .619 12,616 96Marcus Brady, CSUN 1998-2001 1,680 1,039 47 .618 12,479 109Cameron Higgins, Weber St. 2007-10 1,510 934 53 .619 12,252 98Jamie Martin, Weber St. 1989-92 1,544 934 56 .605 12,207 87Austin Gahafer, Morehead St. 2013-16 1,844 1,096 45 .594 11,918 85Robert Kent, Jackson St. 2000-03 1,540 826 58 .536 11,784 104Sean Schaefer, Towson 2005-08 1,621 1,044 59 .644 11,644 76Neil Lomax, Portland St. 1978-80 1,425 836 50 .587 11,550 88Brady Attaway, SFA 2010-13 1,688 1,004 66 .602 11,433 89Travis Brown, Northern Ariz. 1996-99 1,577 888 42 .563 11,400 86Jeff Mathews, Cornell 2010-13 1,447 901 42 .623 11,284 72Josh McGregor, Jacksonville 2008-11 1,310 784 42 .599 11,230 116Denarius McGhee, Montana St. 2010-13 1,389 888 35 .639 11,203 79Mason Mills, San Diego 2010-13 1,336 887 38 .664 11,104 95Dave Dickenson, Montana 1992-95 1,208 813 26 .673 11,080 96Liam Coen, Massachusetts 2005-08 1,303 830 46 .637 11,031 90Doug Nussmeier, Idaho 1990-93 1,225 746 32 .609 10,824 91
Career Yards Per Game(Minimum 5,000 yards; player must have concluded his career)Player, Team Years G Att. Cmp. Yards TD Yds/GNeil Lomax, Portland St. 1978-80 33 1,425 836 11,550 88 *350.0Steve McNair, Alcorn 1991-94 42 1,680 927 *14,496 119 345.1Aaron Flowers, CSUN 1996-97 20 819 502 6,766 54 338.3Casey Therriault, Jackson St. 2010-11 22 890 527 7,244 58 329.3Chris Sanders, Chattanooga 1999-2000 22 953 584 7,230 49 328.6Drew Miller, Montana 1999-2000 18 654 430 5,900 46 327.8Willie Totten, Mississippi Val. 1982-85 40 1,555 907 12,711 139 317.8Dave Dickenson, Montana 1992-95 35 1,208 813 11,080 96 316.6Dominic Randolph, Holy Cross 2006-09 43 1,786 1,131 13,455 117 312.9David Macchi, Valparaiso 2002-03 23 802 450 7,089 59 308.2John Friesz, Idaho 1986-89 35 1,350 801 10,697 77 305.6Jeremy Moses, SFA 2007-10 44 *1,893 *1,184 13,401 121 304.6Kevin Yost, Idaho St. 2011-12 22 1,046 649 6,663 39 302.9James Perry, Brown 1996-99 31 1,309 789 9,294 74 299.8Tom Proudian, Iona 1993-95 27 1,134 656 8,088 58 299.6Jamie Martin, Weber St. 1989-92 41 1,544 934 12,207 87 297.7Jeff Mathews, Cornell 2010-13 38 1,447 901 11,284 72 296.9Scott Riddle, Elon 2007-10 45 1,779 1,168 13,264 106 294.8Casey Brockman, Murray St. 2009-12 34 1,405 938 9,990 71 293.8Bruce Eugene, Grambling 2001-05 46 1,657 872 13,513 *140 293.8Rhett Bomar, Sam Houston St. 2007-08 19 727 417 5,564 37 292.8Jimmy Garoppolo, Eastern Ill. 2010-13 45 1,668 1,047 13,156 118 292.4Marcus Brady, CSUN 1998-2001 43 1,680 1,039 12,479 109 290.2Bo Levi Mitchell, Eastern Wash. 2010-11 26 1,008 618 7,505 70 288.7Michael Nebrich, Fordham 2012-14 28 926 637 8,084 66 288.7

All-Time Leaders on Offense 30
Career Touchdown PassesPlayer, Team Years G TD PassesBruce Eugene, Grambling 2001-05 46 *140Willie Totten, Mississippi Val. 1982-85 40 139Ricky Santos, New Hampshire 2004-07 58 123Jeremy Moses, SFA 2007-10 44 121Steve McNair, Alcorn 1991-94 42 119Jimmy Garoppolo, Eastern Ill. 2010-13 45 118Dominic Randolph, Holy Cross 2006-09 43 117Josh McGregor, Jacksonville 2008-11 46 116Josh Johnson, San Diego 2004-07 41 113#Vernon Adams, Eastern Wash. 2012-14 37 110Marcus Brady, CSUN 1998-2001 43 109Scott Riddle, Elon 2007-10 45 106Robert Kent, Jackson St. 2000-03 45 104Niel Loebig, Duquesne 2001-04 43 103Cameron Higgins, Weber St. 2007-10 48 98Dave Dickenson, Montana 1992-95 35 96Matt Nichols, Eastern Wash. 2006-09 47 96Mason Mills, San Diego 2010-13 44 95Jason Murrietta, Northern Ariz. 2003-06 46 94Chris Boden, Villanova 1996-99 39 93Ted White, Howard 1995-98 41 92Doug Nussmeier, Idaho 1990-93 39 91Liam Coen, Massachusetts 2005-08 50 90Brian Ah Yat, Montana 1995-98 36 89Brady Attaway, SFA 2010-13 44 89Kade Bell, Jacksonville 2012-15 37 89#Transferred to an FBS institution for senior year.
Annual ChampionsYear Player, Team Class G Att. Cmp. Int. Pct. Yds. TD Pts.1978 Neil Lomax, Portland St. So. 11 436 241 21.9 22 .553 3,506 25Beginning in 1979, ranked on passing efficiency rating points (instead of per-game completions)Year Player, Team Class G Att. Cmp. Int. Pct. Yds. TD Pts.1979 Joe Aliotti, Boise St. Jr. 11 219 144 7 .658 1,870 19 159.71980 Mike Williams, Grambling Sr. 11 239 127 5 .531 2,116 28 162.01981 Mike Machurek, Idaho St. Sr. 9 313 188 11 .601 2,752 22 150.11982 Frank Novak, Lafayette Jr. 10 257 154 12 .599 2,257 20 150.01983 Willie Totten, Mississippi Val. So. 9 279 174 9 .624 2,566 29 167.51984 Willie Totten, Mississippi Val. Jr. 10 518 324 22 .626 4,557 56 163.61985 Bobby Lamb, Furman Sr. 11 181 106 6 .586 1,856 18 170.91986 Mike Smith, UNI Jr. 11 303 190 16 .627 3,125 27 168.21987 Jeff Wiley, Holy Cross Jr. 11 400 265 17 .663 3,677 34 163.01988 Frank Baur, Lafayette Jr. 10 256 164 11 .641 2,621 23 171.11989 Todd Hammel, SFA Sr. 11 401 238 13 .594 3,914 34 162.81990 Connell Maynor, N.C. A&T Jr. 11 191 123 10 .644 1,699 16 156.31991 Michael Payton, Marshall Jr. 9 216 143 5 .662 2,333 19 181.31992 Jay Fiedler, Dartmouth Jr. 10 273 175 13 .641 2,748 25 169.41993 Shawn Knight, William & Mary Jr. 10 177 125 4 .706 2,055 22 *204.61994 Dave Dickenson, Montana Jr. 9 336 229 6 .682 3,053 24 164.51995 Brian Kadel, Dayton Sr. 11 183 115 6 .628 1,880 18 175.01996 Ted White, Howard So. 11 289 174 10 .602 2,814 36 176.21997 Alli Abrew, Cal Poly Sr. 11 191 130 4 .681 1,961 17 179.51998 Jim Blanchard, Portland St. So. 9 169 112 1 .663 1,512 14 167.61999 Drew Miller, Montana Jr. 10 368 240 8 .652 3,461 32 168.62000 Terrance Ley, Southern U. Jr. 11 233 139 6 .597 2,249 23 168.22001 Tony Romo, Eastern Ill. Jr. 10 207 138 6 .667 2,068 21 178.32002 Eric Rasmussen, San Diego Jr. 10 279 170 1 .609 2,473 25 164.22003 Eric Rasmussen, San Diego Sr. 10 318 195 3 .613 2,982 35 174.52004 Erik Meyer, Eastern Wash. Jr. 13 382 259 9 .678 3,707 31 171.42005 Bruce Eugene, Grambling Sr. 12 456 254 6 .557 4,360 56 173.92006 Josh Johnson, San Diego Jr. 12 371 246 5 .663 3,320 34 169.02007 Josh Johnson, San Diego Sr. 10 301 206 1 .684 2,988 43 198.32008 Jonathan Dally, Cal Poly Sr. 11 202 116 5 .574 1,960 23 171.62009 K.J. Black, Prairie View Jr. 9 230 162 4 .704 2,033 22 172.8

All-Time Leaders on Offense 31
Year Player, Team Class G Att. Cmp. Int. Pct. Yds. TD Pts.2010 Josh McGregor, Jacksonville Jr. 11 326 205 7 .629 3,049 32 169.52011 Chris Forcier, Furman Sr. 11 231 148 8 .641 2,265 23 172.42012 Kyle Essington, Stony Brook Sr. 12 205 120 8 .585 2,032 23 171.02013 Vernon Adams, Eastern Wash. So. 15 486 319 15 .656 4,994 55 183.12014 John Robertson, Villanova Jr. 13 301 197 3 .655 2,846 35 181.32015 Quentin Williams, Bethune-Cookman Sr. 11 195 132 6 .677 2,171 19 187.22016 Bryan Schor, James Madison Jr. 14 297 217 6 .731 3,002 29 186.2

All-Time Leaders on Offense 32
TOTAL OFFENSERecord. †National champion or national leader in that category that season. ‡Touchdowns-responsible-for are player’s TDs scored and passed for.
Single-Game YardsYds. Player, Team (Opponent) Date791 Taylor Heinicke, Old Dominion (New Hampshire) Sept. 22, 2012668 Robert Kent, Jackson St. (Alabama St.) Oct. 6, 2001655 Braden Hanson, North Dakota (Montana) Oct. 20, 2012655 Brady Attaway, SFA (Prairie View) Sept. 28, 2013649 Steve McNair, Alcorn (Southern U.) Oct. 22, 1994647 Steve McNair, Alcorn (Chattanooga) Sept. 10, 1994643 Jamie Martin, Weber St. (Idaho St.) Nov. 23, 1991641 Bruce Eugene, Grambling (Prairie View) Oct. 1, 2005633 Steve McNair, Alcorn (Grambling) Sept. 3, 1994624 Steve McNair, Alcorn (Samford) Oct. 29, 1994621 Willie Totten, Mississippi Val. (Prairie View) Oct. 27, 1984614 Bryan Martin, Weber St. (Cal Poly) Sept. 23, 1995610 Casey Brockman, Murray St. (Tennessee St.) Sept. 17, 2011609 Garrett Safron, Sacramento St. (Montana St.) Oct. 4, 2014604 Steve McNair, Alcorn (Jackson St.) Nov. 21, 1992598 Robert Kent, Jackson St. (N.C. A&T) Sept. 7, 2002598 Dustin Long, Sam Houston St. (McNeese) Nov. 6, 2004598 Drew Hubel, Portland St. (Eastern Wash.) Oct. 4, 2008595 Doug Pederson, La.-Monroe (SFA) Nov. 11, 1989591 Caleb Berry, Lamar (Central Ark.) Nov. 8, 2014587 Vern Harris, Idaho St. (Montana) Oct. 12, 1985586 Steve McNair, Alcorn (Troy) Nov. 12, 1994586 Casey Brockman, Murray St. (Missouri St.) Oct. 9, 2010582 Martin Hankins, Southeastern La. (Ark.-Monticello) Sept. 2, 2004574 Dave Dickenson, Montana (Idaho) Oct. 21, 1995
Season YardsPlayer, Team Year G Plays Yards Yds/PSteve McNair, Alcorn †1994 11 649 *5,799 8.94Gage Gubrud, Eastern Wash. †2016 14 704 5,766 8.19Vernon Adams, Eastern Wash. †2013 15 618 5,599 9.10Taylor Heinicke, Old Dominion †2012 13 *705 5,546 7.87Jimmy Garoppolo, Eastern Ill. 2013 14 638 5,112 8.01Bruce Eugene, Grambling †2002 13 680 5,018 7.38Michael Nebrich, Fordham 2013 13 634 4,893 7.72Dustin Long, Sam Houston St. †2004 14 576 4,576 7.94Willie Totten, Mississippi Val. †1984 10 564 4,572 8.11Jeremiah Briscoe, Sam Houston St. 2016 13 531 4,549 8.57Bruce Eugene, Grambling †2005 12 456 4,517 8.43Chris Lum, Lehigh †2011 13 604 4,499 7.45Cameron Higgins, Weber St. †2008 14 519 4,383 8.45Jamie Martin, Weber St. †1991 11 591 4,337 7.34Devlin Hodges, Samford 2016 12 641 4,310 6.72Lang Campbell, William & Mary 2004 14 556 4,305 7.74Ricky Santos, New Hampshire 2005 13 548 4,296 7.84Vad Lee, James Madison 2014 13 648 4,288 6.62Joe Flacco, Delaware †2007 15 585 4,285 7.32Dominic Randolph, Holy Cross †2009 12 598 4,256 7.12Garrett Safron, Sacramento St. †2014 12 552 4,241 7.68Martin Hankins, Southeastern La. 2004 11 596 4,221 7.08Bruce Eugene, Grambling †2003 12 622 4,220 6.78Bryan Bennett, Southeastern La. 2013 14 537 4,211 7.84Brady Attaway, SFA 2013 12 600 4,210 7.02
Season Yards Per GamePlayer, Team Year G Plays Yards TDR‡ Yds/GSteve McNair, Alcorn †1994 11 649 *5,799 53 *527.2Willie Totten, Mississippi Val. †1984 10 564 4,572 *61 457.2
Player, Team Year G Plays Yards TDR‡ Yds/GTaylor Heinicke, Old Dominion †2012 13 *705 5,546 55 426.6Gage Gubrud, Eastern Wash. †2016 14 704 5,766 53 411.9Steve McNair, Alcorn †1992 10 519 4,057 39 405.7Jamie Martin, Weber St. †1991 11 591 4,337 37 394.3Bruce Eugene, Grambling †2002 13 680 5,018 43 386.0Martin Hankins, Southeastern La. †2004 11 596 4,221 38 383.7Dave Dickenson, Montana †1995 11 544 4,209 41 382.6Neil Lomax, Portland St. †1980 11 550 4,157 42 377.9Bruce Eugene, Grambling †2005 12 536 4,517 59 376.4Michael Nebrich, Fordham †2013 13 634 4,893 44 376.4Vernon Adams, Eastern Wash. 2013 15 618 5,599 59 373.3Josh Johnson, San Diego †2007 10 402 3,714 45 371.4Joe Lee, Towson †1999 11 608 4,031 22 366.5Jimmy Garoppolo, Eastern Ill. 2013 14 638 5,112 57 365.1Bo Levi Mitchell, Eastern Wash. †2011 11 558 4,004 35 364.0Marcus Brady, CSUN †2001 10 532 3,632 40 363.2Dave Dickenson, Montana †1993 11 530 3,978 46 361.6Neil Lomax, Portland St. †1979 11 611 3,966 31 360.5Devlin Hodges, Samford 2016 12 641 4,310 40 359.2Dominic Randolph, Holy Cross †2008 11 585 3,917 38 356.1Casey Therriault, Jackson St. 2011 11 547 3,911 36 355.5Mark Iannotti, Southern Ill. †2015 11 595 3,911 33 355.5Dominic Randolph, Holy Cross †2009 12 598 4,256 41 354.7
Career YardsPlayer, Team Years Plays Yards Yds/PSteve McNair, Alcorn 1991-94 2,055 *16,823 8.19Armanti Edwards, Appalachian St. 2006-09 1,935 14,753 7.62Bruce Eugene, Grambling 2001-05 1,998 14,720 7.37Ricky Santos, New Hampshire 2004-07 *2,140 14,615 6.83Dominic Randolph, Holy Cross 2006-09 2,064 14,240 6.90Matt Nichols, Eastern Wash. 2006-09 1,911 13,308 6.96Jeremy Moses, SFA 2007-10 2,034 13,201 6.49Scott Riddle, Elon 2007-10 2,069 13,147 6.35Marcus Brady, CSUN 1998-2001 2,116 13,095 6.19Jimmy Garoppolo, Eastern Ill. 2010-13 1,928 13,089 6.79Willie Totten, Mississippi Val. 1982-85 1,812 13,007 7.18Robert Kent, Jackson St. 2000-03 1,982 12,538 6.33Denarius McGhee, Montana St. 2010-13 1,778 12,352 6.95Jamie Martin, Weber St. 1989-92 1,838 12,287 6.68Jacob Huesman, Chattanooga 2012-15 1,893 12,248 6.47Cameron Higgins, Weber St. 2007-10 1,678 12,240 7.29Austin Gahafer, Morehead St. 2013-16 2,081 12,239 5.88Travis Lulay, Montana St. 2002-05 2,006 12,190 6.08Doug Nussmeier, Idaho 1990-93 1,556 12,054 7.75#Vernon Adams, Eastern Wash. 2012-14 1,378 11,665 *8.47Neil Lomax, Portland St. 1978-80 1,680 11,647 6.93Garrett Safron, Sacramento St. 2011-14 1,745 11,619 6.65Josh Johnson, San Diego 2004-07 1,372 11,563 8.43Dave Dickenson, Montana 1992-95 1,539 11,523 7.49Alex Ross, Coastal Caro. 2012-15 1,565 11,482 7.34Benjamin Anderson, Ark.-Pine Bluff 2011-14 1,861 11,467 6.16Eli Jenkins, Jacksonville St. 2013-16 1,667 11,448 6.87Sean Schaefer, Towson 2005-08 1,888 11,415 6.05Josh McGregor, Jacksonville 2008-11 1,566 11,387 7.27Travis Brown, Northern Ariz. 1996-99 1,732 11,267 6.51Note: There have been 60 total FCS student-athletes to reach 10,000 total yards.#Transferred to an FBS institution for senior year.
Career Yards Per Game(Minimum 6,000 yards; player must have concluded his career)Player, Team Years G Plays Yards TDR‡ Yds/GSteve McNair, Alcorn 1991-94 42 2,055 *16,823 152 *400.5Neil Lomax, Portland St. 1978-80 33 1,680 11,647 100 352.9Casey Therriault, Jackson St. 2010-11 22 1,085 7,511 77 341.4Aaron Flowers, CSUN 1996-97 20 944 6,754 60 337.7

All-Time Leaders on Offense 33
Player, Team Years G Plays Yards TDR‡ Yds/GDavid Macchi, Valparaiso 2002-03 23 1,047 7,628 65 331.7Dominic Randolph, Holy Cross 2006-09 43 2,064 14,240 133 331.2Chris Sanders, Chattanooga 1999-2000 22 1,044 7,247 52 329.4Dave Dickenson, Montana 1992-95 35 1,539 11,523 116 329.2Willie Totten, Mississippi Val. 1982-85 40 1,812 13,007 157 325.2Rhett Bomar, Sam Houston St. 2007-08 19 895 6,157 49 324.1Bruce Eugene, Grambling 2001-05 46 1,998 14,720 *159 320.0#Vernon Adams, Eastern Wash. 2012-14 37 1,378 11,665 121 315.3Michael Nebrich, Fordham 2012-14 28 1,182 8,663 80 309.4Tom Ehrhardt, Rhode Island 1984-85 21 1,010 6,492 66 309.1Doug Nussmeier, Idaho 1990-93 39 1,556 12,054 109 309.1Casey Brockman, Murray St. 2009-12 34 1,694 10,502 92 308.9Oteman Sampson, Florida A&M 1996-97 22 906 6,751 57 306.9Marcus Brady, CSUN 1998-2001 43 2,116 13,095 123 304.5Jeremy Moses, SFA 2007-10 44 2,034 13,201 122 300.0Jamie Martin, Weber St. 1989-92 41 1,838 12,287 93 299.7Kevin Yost, Idaho St. 2011-12 22 1,226 6,526 39 296.6Tom Proudian, Iona 1993-95 27 1,337 7,939 61 294.0Ricky Santos, New Hampshire 2004-07 50 *2,140 14,615 123 292.3Scott Riddle, Elon 2007-10 45 2,069 13,147 120 292.2Robert Dougherty, Boston U. 1993-94 21 918 6,135 56 292.1#Transferred to an FBS institution for senior year.
Annual ChampionsYear Player, Team Class G Plays Yards Yds/G1978 Neil Lomax, Portland St. So. 11 519 3,524 320.41979 Neil Lomax, Portland St. Jr. 11 611 3,966 360.51980 Neil Lomax, Portland St. Sr. 11 550 4,157 377.91981 Mike Machurek, Idaho St. Sr. 9 363 2,645 293.91982 Brent Woods, Princeton Sr. 10 577 3,079 307.91983 Ken Hobart, Idaho Sr. 11 578 3,800 345.51984 Willie Totten, Mississippi Val. Jr. 10 564 4,572 457.21985 Tom Ehrhardt, Rhode Island Sr. 10 529 3,460 346.01986 Brent Pease, Montana Sr. 10 499 3,094 309.41987 Jeff Wiley, Holy Cross Jr. 11 445 3,722 338.41988 John Friesz, Idaho Jr. 10 424 2,751 275.11989 John Friesz, Idaho Sr. 11 464 3,853 350.31990 Jamie Martin, Weber St. So. 11 508 3,713 337.61991 Jamie Martin, Weber St. Jr. 11 591 4,337 394.31992 Steve McNair, Alcorn So. 10 519 4,057 405.71993 Dave Dickenson, Montana So. 11 530 3,978 361.61994 Steve McNair, Alcorn Sr. 11 649 *5,799 *527.21995 Dave Dickenson, Montana Sr. 11 544 4,209 382.61996 Brian Ah Yat, Montana So. 11 501 3,744 340.41997 Aaron Flowers, CSUN Sr. 9 456 3,132 348.01998 Patrick Bonner, Florida A&M Sr. 11 488 3,568 324.41999 Joe Lee, Towson Sr. 11 608 4,031 366.52000 David Dinkins, Morehead St. Sr. 9 408 3,109 345.42001 Marcus Brady, CSUN Sr. 10 532 3,632 363.22002 Bruce Eugene, Grambling So. 13 680 5,018 386.02003 Bruce Eugene, Grambling Jr. 12 622 4,220 351.72004 Martin Hankins, Southeastern La. So. 11 596 4,221 383.72005 Bruce Eugene, Grambling Sr. 12 536 4,517 376.42006 Josh Johnson, San Diego Jr. 12 478 4,040 336.72007 Josh Johnson, San Diego Sr. 10 402 3,714 371.42008 Dominic Randolph, Holy Cross Jr. 11 585 3,917 356.12009 Dominic Randolph, Holy Cross Sr. 12 598 4,256 354.72010 Mike Brown, Liberty Jr. 11 511 3,810 346.42011 Bo Levi Mitchell, Eastern Wash. Sr. 11 558 4,004 364.02012 Taylor Heinicke, Old Dominion So. 13 *705 5,546 426.62013 Michael Nebrich, Fordham Jr. 13 634 4,893 376.42014 Garrett Safron, Sacramento St. Sr. 12 552 4,241 353.42015 Mark Iannotti, Southern Ill. Sr. 11 595 3,911 355.52016 Gage Gubrud, Eastern Wash. So. 14 704 5,766 411.9
RECEIVING*Record. †National champion or national leader in that category that season. ^Active player.
Single-Game ReceptionsRec. Player, Team (Opponent) Date24 Jerry Rice, Mississippi Val. (Southern U.) Oct. 1, 198324 Chas Gessner, Brown (Rhode Island) Oct. 5, 200222 Marvin Walker, North Texas (Tulsa) Nov. 20, 198221 David Pandt, Montana St. (Eastern Wash.) Sept. 21, 198521 Eric Johnson, Yale (Harvard) Nov. 20, 199921 Carl Morris, Harvard (Dartmouth) Nov. 2, 200221 Erik Lora, Eastern Ill. (Murray St.) Sept. 22, 201221 Jerry Louie-McGee, Montana (Cal Poly) Sept. 24, 201620 Tim Hilton, CSUN (St. Mary’s [CA]) Nov. 11, 199520 Cooper Kupp, Eastern Wash. (Northern Colo.) Oct. 24, 201519 Stephen Campbell, Brown (Rhode Island) Sept. 30, 200019 Chas Gessner, Brown (Rhode Island) Sept. 29, 200119 Rickey Gatewood, Montana St. (Portland St.) Oct. 15, 200519 Jeremy Harness, Murray St. (Tennessee Tech) Oct. 4, 201418 Brian Forster, Rhode Island (Brown) Sept. 28, 198518 Jerome Williams, Morehead St. (Eastern Ky.) Nov. 18, 198918 David Romines, CSUN (UC Davis) Sept. 14, 199618 Jeremy Nunamaker, Saint Francis (PA) (Sacred Heart) Oct. 2, 199918 Stephen Campbell, Brown (Penn) Oct. 28, 200018 Alonzo Nix, Chattanooga (Wofford) Oct. 4, 200318 Ralph Plumb, Yale (Brown) Nov. 6, 200418 Bobby Sewall, Brown (Dartmouth) Nov. 10, 200718 Tim Mastrino, Iona (Bryant) Nov. 15, 200818 Chris Carter, UC Davis (Montana) Sept. 12, 200918 Landis Williams, Maine (Rhode Island) Nov. 14, 200918 Aaron Mellette, Elon (Richmond) Sept. 18, 2010 18 Da’Rick Rogers, Tennessee Tech (Southeast Mo. St.) Sept. 22, 201218 Reggie Begelton, Lamar (SFA) Nov. 16, 201318 Erik Lora, Eastern Ill. (Towson) Dec. 13, 2013
Single-Game YardsYds. Player, Team (Opponent) Date376 Kassim Osgood, Cal Poly (UNI) Nov. 4, 2000370 Michael Lerch, Princeton (Brown) Oct. 12, 1991354 Eddie Conti, Delaware (UConn) Nov. 7, 1998333 Greg Hardin, North Dakota (Montana) Oct. 20, 2012330 Nate Singleton, Grambling (Virginia Union) Sept. 14, 1991327 Brian Forster, Rhode Island (Brown) Sept. 28, 1985319 Jason Cristino, Lehigh (Lafayette) Nov. 21, 1992316 Marcus Hinton, Alcorn (Chattanooga) Sept. 10, 1994315 Patrick Walker, Northern Colo. (North Dakota) Oct. 29, 2011305 Howard Gilmore, Norfolk St. (Morgan St.) Nov. 22, 2003303 Da’Rick Rogers, Tennessee Tech (Southeast Mo. St.) Sept. 22, 2012299 Brian Forster, Rhode Island (Lehigh) Oct. 12, 1985299 Treamelle Taylor, Nevada (Montana) Oct. 14, 1989294 Jerry Rice, Mississippi Val. (Kentucky St.) Sept. 1, 1984294 Michael Caputo, Saint Francis (PA) (Sacred Heart) Oct. 29, 2005292 Laurent Robinson, Illinois St. (Indiana St.) Nov. 12, 2005286 Frisman Jackson, Western Ill. (Indiana St.) Nov. 17, 2001284 David Ball, New Hampshire (Villanova) Oct. 2, 2004282 Sam Ajala, Fordham (Yale) Oct. 19, 2013280 DaVon Fowlkes, Appalachian St. (Elon) Nov. 6, 2004280 Luke Tasker, Cornell (Monmouth) Oct. 13, 2012275 Rob Giancola, Valparaiso (Dayton) Oct. 11, 2003275 Shawn Leonard, Rhode Island (New Hampshire) Nov. 7, 2009275 Cooper Kupp, Eastern Wash. (Northern Colo.) Oct. 24, 2015274 Joe Ort, Lafayette (Georgetown) Nov. 11, 2006274 Joel Bradford, Chattanooga (Furman) Oct. 23, 2010274 Cooper Kupp, Eastern Wash. (UC Davis) Oct. 1, 2016

All-Time Leaders on Offense 34
Season ReceptionsPlayer, Team Year G Rec. Yards TDErik Lora, Eastern Ill. †2012 12 *136 1,664 12Terrell Hudgins, Elon †2009 12 123 1,633 16Erik Lora, Eastern Ill. †2013 13 123 1,544 19Stephen Campbell, Brown †2000 10 120 1,332 11Duane Brooks, SFA 2009 13 118 1,076 6Terrell Hudgins, Elon †2007 11 117 1,474 18Cooper Kupp, Eastern Wash. †2016 13 117 1,700 17Brian Forster (TE), Rhode Island †1985 10 115 1,617 12Chas Gessner, Brown †2002 10 114 1,166 11Cooper Kupp, Eastern Wash. †2015 11 114 1,642 19Aaron Mellette, Elon †2011 11 113 1,639 12Rodrick Rumble, Idaho St. 2011 11 112 1,348 9Karel Hamilton, Samford 2016 11 111 1,389 14Brendan Flaherty, Holy Cross 2015 11 106 1,082 12Cooper Kupp, Eastern Wash. †2014 13 104 1,431 16Jerry Rice, Mississippi Val. †1984 10 103 1,682 *27DaVon Fowlkes, Appalachian St. †2004 11 103 1,618 14Maurice Price, Charleston So. †2006 11 103 985 10 Jerry Rice, Mississippi Val. †1983 10 102 1,450 14John Matthews, San Diego †2008 11 102 1,478 21Javarus Dudley, Fordham †2003 12 101 1,439 14Raymond Webber, Ark.-Pine Bluff †2010 11 101 1,429 10Lanny Funsten, Davidson 2011 11 100 1,107 8R.J. Harris, New Hampshire 2014 14 100 1,551 15Jarrod Fuller, Sam Houston St. 2004 14 99 1,383 8Lee Kurfis, Lehigh 2013 11 99 1,351 9Deandre Carter, Sacramento St. 2014 12 99 1,321 17
Season Receptions Per GamePlayer, Team Year G Rec. Yards TD Rec./GStephen Campbell, Brown †2000 10 120 1,332 11 *12.00Brian Forster (TE), Rhode Island †1985 10 115 1,617 12 11.50Chas Gessner, Brown †2002 10 114 1,166 11 11.40Erik Lora, Eastern Ill. †2012 12 *136 1,664 12 11.33Terrell Hudgins, Elon †2007 11 117 1,474 18 10.64Cooper Kupp, Eastern Wash. †2015 11 114 1,642 19 10.36Jerry Rice, Mississippi Val. †1984 10 103 1,682 *27 10.30Aaron Mellette, Elon †2011 11 113 1,639 12 10.27Terrell Hudgins, Elon †2009 12 123 1,633 16 10.25Jerry Rice, Mississippi Val. †1983 10 102 1,450 14 10.20Rodrick Rumble, Idaho St. 2011 11 112 1,348 9 10.18Karel Hamilton, Samford †2016 11 111 1,389 14 10.09Stuart Gaussoin, Portland St. †1979 9 90 1,132 8 10.00Drew Amerson, CSUN †2001 10 97 1,244 5 9.70Brendan Flaherty, Holy Cross 2015 11 106 1,082 12 9.64Erik Lora, Eastern Ill. †2013 13 123 1,544 19 9.46Tysson Poots, Southern Utah 2009 9 85 1,081 15 9.44DaVon Fowlkes, Appalachian St. †2004 11 103 1,618 14 9.36Maurice Price, Charleston So. †2006 11 103 985 10 9.36Marcus Harris, Murray St. †2010 9 84 1,057 9 9.33John Matthews, San Diego †2008 11 102 1,478 21 9.27Chas Gessner, Brown 2001 9 83 1,182 12 9.22Raymond Webber, Ark.-Pine Bluff 2010 11 101 1,429 10 9.18Grant Gellatly, Cornell 2013 10 91 1,224 8 9.10Lanny Funsten, Davidson 2011 11 100 1,107 8 9.09
Season YardsPlayer, Team Year Rec. Yards Yds/R TDBrandon Kaufman, Eastern Wash. †2012 93 *1,850 19.9 16Eddie Conti, Delaware †1998 91 1,712 18.8 10Tramon Douglas, Grambling †2002 92 1,704 18.5 18Cooper Kupp, Eastern Wash. †2016 117 1,700 14.5 17Cooper Kupp, Eastern Wash. †2013 93 1,691 18.2 21Jerry Rice, Mississippi Val. †1984 103 1,682 16.3 *27Erik Lora, Eastern Ill. 2012 *136 1,664 19.9 16
Player, Team Year Rec. Yards Yds/R TDSam Ajala, Fordham 2013 93 1,646 17.7 14Cooper Kupp, Eastern Wash. †2015 114 1,642 14.4 19Aaron Mellette, Elon †2011 113 1,639 14.5 12Terrell Hudgins, Elon †2009 123 1,633 13.3 16DaVon Fowlkes, Appalachian St. †2004 103 1,618 15.7 14Brian Forster, Rhode Island †1985 115 1,617 14.1 12Ryan Spadola, Lehigh 2011 96 1,614 16.8 11Dominique Thompson, William &
Mary2004 79 1,585 20.1 13
David Ball, New Hampshire †2005 87 1,551 17.8 24R.J. Harris, New Hampshire †2014 100 1,551 15.5 15Erik Lora, Eastern Ill. 2013 123 1,544 12.6 19Tim Toone, Weber St. †2008 84 1,525 18.2 7David Ball, New Hampshire 2004 86 1,504 17.5 17Rob Giancola, Valparaiso †2003 57 1,496 26.3 2Brian Brown, Richmond 2016 81 1,485 18.3 11Marc Mariani, Montana 2009 80 1,479 18.5 13John Matthews, San Diego 2008 102 1,478 14.5 21Terrell Hudgins, Elon †2007 117 1,474 12.6 18
Season Yards Per GamePlayer, Team Year G Rec. Yards TD Yd/GJerry Rice, Mississippi Val. †1984 10 103 1,682 *27 *168.2Brian Forster, Rhode Island (TE) †1985 10 115 1,617 12 161.7Eddie Conti, Delaware †1998 11 91 1,712 10 155.6Cooper Kupp, Eastern Wash. †2015 11 114 1,642 19 149.3Aaron Mellette, Elon †2011 11 113 1,639 12 149.0DaVon Fowlkes, Appalachian St. †2004 11 103 1,618 14 147.1Jerry Rice, Mississippi Val. †1983 10 102 1,450 14 145.0Sean Morey, Brown †1997 10 73 1,427 15 142.7Tramon Douglas, Grambling †2002 12 92 1,704 18 142.0Erik Lora, Eastern Ill. †2012 12 *136 1,664 12 138.7Terrell Hudgins, Elon †2009 12 123 1,633 16 136.1Mark Orlando, Towson †1994 9 55 1,223 12 135.9Ryan Spadola, Lehigh 2011 12 96 1,614 11 134.5John Matthews, San Diego †2008 11 102 1,478 21 134.4Terrell Hudgins, Elon †2007 11 117 1,474 18 134.0Joe Douglass, Montana †1996 11 82 1,469 18 133.5Ramses Barden, Cal Poly †2007 11 57 1,467 18 133.4Stephen Campbell, Brown †2000 10 120 1,332 11 133.2Laurent Robinson, Illinois St. †2005 11 86 1,465 12 133.2Derrick Ingram, UAB 1994 11 83 1,457 13 132.5Brandon Kaufman, Eastern Wash. 2012 14 93 *1,850 16 132.1Chas Gessner, Brown †2001 9 83 1,182 12 131.3Cooper Kupp, Eastern Wash. 2016 13 117 1,700 17 130.8Michael Caputo, Saint Francis (PA) 2005 11 92 1,433 12 130.3David Romines, CSUN 1996 10 87 1,300 12 130.0
Season Touchdown ReceptionsPlayer, Team Year G TDJerry Rice, Mississippi Val. †1984 10 *27David Ball, New Hampshire †2005 13 24Rob Giancola, Valparaiso †2003 12 23John Matthews, San Diego †2008 11 21Cooper Kupp, Eastern Wash. †2013 15 21Randy Moss, Marshall †1996 11 19Eric Kimble, Eastern Wash. †2004 13 19Henry Tolbert, Grambling 2005 12 19Nicholas Edwards, Eastern Wash. †2011 11 19Erik Lora, Eastern Ill. 2013 13 19Cooper Kupp, Eastern Wash. †2015 11 19Joe Douglass, Montana 1996 11 18Darnerian McCants, Delaware St. †2000 11 18Tramon Douglas, Grambling †2002 12 18Ramses Barden, Cal Poly †2007 11 18Terrell Hudgins, Elon †2007 11 18

All-Time Leaders on Offense 35
Player, Team Year G TDRamses Barden, Cal Poly 2008 11 18Dominique Edison, SFA 2008 12 18Mario Louis, Grambling 2011 12 18Aaron Mellette, Elon 2012 11 18Roy Banks, Eastern Ill. 1984 11 17Joe Thomas, Mississippi Val. †1985 11 17Dameon Reilly, Rhode Island †1985 11 17Mark Carrier, Nicholls St. †1986 11 17Sylvester Morris, Jackson St. †1995 11 17Brian Finneran, Villanova †1997 11 17Jonathon Cooper, Sam Houston St. †2001 11 17David Ball, New Hampshire 2004 12 17Cameron Luke, Texas St. 2008 13 17Deandre Carter, Sacramento St. †2014 12 17Cooper Kupp, Eastern Wash. †2016 13 17Shaq Hill, Eastern Wash. †2016 14 17
Career ReceptionsPlayer, Team Years Rec. Yards Yds/R TDCooper Kupp, Eastern Wash. 2013-16 *428 *6,464 15.1 *73Terrell Hudgins, Elon 2006-09 395 5,250 13.3 52Erik Lora, Eastern Ill. 2009-10, 12-13 332 4,006 12.1 35Jacquay Nunnally, Florida A&M 1997-2000 317 4,239 13.4 38R.J. Harris, New Hampshire 2011-14 310 4,328 14.0 36Stephen Campbell, Brown 1997-2000 305 3,555 11.7 31David Ball, New Hampshire 2003-06 304 4,655 15.3 58Aaron Mellette, Elon 2009-12 304 4,254 14.0 44Jerry Rice, Mississippi Val. 1981-84 301 4,693 15.6 50Javarus Dudley, Fordham 2000-03 295 4,197 14.2 34Chas Gessner, Brown 1999-2002 292 3,408 11.7 36Brian Wetzel, Fordham 2011-14 286 3,870 13.5 32Andre Roberts, The Citadel 2006-09 285 3,743 13.1 37Tysson Poots, Southern Utah 2007-10 282 3,975 14.1 43Karel Hamilton, Samford 2013-16 279 3,803 13.6 31Lance Lenoir, Western Ill. 2013-16 273 3,796 13.9 28Jake Raymond, Morehead St. 2013-16 272 2,907 10.7 19Kasey Dunn, Idaho 1988-91 268 3,847 14.4 25Rob Milanese, Penn 1999-2002 259 3,405 13.1 21Zach Watkins, Butler 2008-11 254 2,994 11.8 21Eric Kimble, Eastern Wash. 2002-05 253 4,410 16.4 46Sean Morey, Brown 1995-98 251 3,850 15.3 39Tyrone Walker, Illinois St. 2009-12 250 3,565 14.3 32Kelsey Pope, Samford 2010-13 250 2,385 9.5 13Eddie Berlin, UNI 1997-2000 249 3,735 15.0 34
Career Receptions Per Game(Minimum 125 Receptions; Player must have concluded his career)Player, Team Years G Rec. Yards TD Rec./GTerrell Hudgins, Elon 2006-09 45 395 5,250 52 *8.78Cooper Kupp, Eastern Wash. 2013-16 52 *428 *6,464 *73 8.23Duane Brooks, SFA 2006-09 23 186 1,939 10 8.09Maurice Price, Charleston So. 2004-06 26 202 2,429 19 7.77Tramon Douglas, Grambling 2002-03 22 169 2,621 28 7.68Stephen Campbell, Brown 1997-2000 40 305 3,555 31 7.63Chas Gessner, Brown 1999-2002 39 292 3,408 36 7.49Jerry Rice, Mississippi Val. 1981-84 41 301 4,693 50 7.34Mike Furrey, UNI 1997-99 33 242 3,544 27 7.33Ralph Plumb, Yale 2003-04 19 138 1,752 12 7.26Drew Amerson, CSUN 1999-2001 33 239 3,190 20 7.24Derrick Ingram, UAB 1993-94 22 159 2,572 21 7.23Jacquay Nunnally, Florida A&M 1997-2000 44 317 4,239 38 7.20Jeff Johnson, ETSU 1993-94 20 142 1,772 19 7.10Erik Lora, Eastern Ill. 2009-10,
12-1347 332 4,006 35 7.06
Tysson Poots, Southern Utah 2007-10 40 282 3,975 43 7.05Aaron Mellette, Elon 2009-12 44 304 4,254 44 6.91
Player, Team Years G Rec. Yards TD Rec./GMiles Macik, Penn 1993-95 29 200 2,364 26 6.90Ricky Gatewood, Montana St. 2004-05 19 131 1,759 13 6.89Kevin Guthrie, Princeton 1981-83 28 193 2,645 16 6.89A.J. Smith, Southern Utah 2003-04 21 143 1,358 6 6.81Eric Yarber, Idaho 1984-85 19 129 1,920 17 6.79Rob Milanese, Penn 1999-2002 39 259 3,405 21 6.64Joe Douglass, Montana 1995-96 22 145 2,301 25 6.59Alonzo Nix, Chattanooga 2003-04 23 150 1,879 14 6.52
Career YardsPlayer, Team Years Rec. Yards Yds/R TDCooper Kupp, Eastern Wash. 2013-16 *428 *6,464 15.1 *73Terrell Hudgins, Elon 2006-09 395 5,250 13.3 52Jerry Rice, Mississippi Val. 1981-84 301 4,693 15.6 50David Ball, New Hampshire 2003-06 304 4,655 15.3 58R.J. Harris, New Hampshire 2011-14 310 4,328 14.0 36Aaron Mellette, Elon 2009-12 304 4,254 14.0 44Jacquay Nunnally, Florida A&M 1997-2000 317 4,239 13.4 38Ramses Barden, Cal Poly 2005-08 206 4,203 20.4 50Javarus Dudley, Fordham 2000-03 295 4,197 14.2 34Brian Brown, Richmond 2013-16 246 4,195 17.1 23^Jake Wieneke, South Dakota St. 2014-16 223 4,192 18.8 43Eric Kimble, Eastern Wash. 2002-05 253 4,140 16.4 46Fred Amey, Sacramento St. 2001-04 248 4,049 16.3 27Rich Musinski, William & Mary 2000-03 219 4,017 18.3 30Erik Lora, Eastern Ill. 2009-10, 12-13 332 4,006 12.1 35Tysson Poots, Southern Utah 2007-10 282 3,975 14.1 43C.J. Johnson, Tennessee St. 2000-03 194 3,903 20.1 32Dedric Ward, UNI 1993-96 176 3,876 22.0 41Brian Wetzel, Fordham 2011-14 286 3,870 13.5 32Sean Morey, Brown 1995-98 251 3,850 15.3 39Kasey Dunn, Idaho 1988-91 268 3,847 14.4 25Rob Giancola, Valparaiso 2001-04 176 3,833 21.8 40Karel Hamilton, Samford 2013-16 279 3,803 13.6 31Lance Lenoir, Western Ill. 2013-16 273 3,796 13.9 28Andre Roberts, The Citadel 2006-09 285 3,743 13.1 37
Career Yards Per Game(Minimum 2,000 Yards; Player must have concluded his career)Player, Team Years G Yards Yds/GCooper Kupp, Eastern Wash. 2013-16 52 *6,464 *124.3Tramon Douglas, Grambling 2002-03 22 2,621 119.1Derrick Ingram, UAB 1993-94 22 2,572 116.9Terrell Hudgins, Elon 2006-09 45 5,250 116.7Jerry Rice, Mississippi Val. 1981-84 41 4,693 114.5Mike Furrey, UNI 1997-99 33 3,544 107.4Joe Douglass, Montana 1995-96 22 2,301 104.6Tysson Poots, Southern Utah 2007-10 40 3,975 99.4Derek Graham, Princeton 1981, 83-84 29 2,819 97.2Aaron Mellette, Elon 2009-12 44 4,254 96.7Drew Amerson, CSUN 1999-2001 33 3,190 96.7Jacquay Nunnally, Florida A&M 1997-2000 44 4,239 96.3Sean Morey, Brown 1995-98 40 3,850 96.3Ryan Spadola, Lehigh 2009-12 38 3,611 95.0Kevin Guthrie, Princeton 1981-83 28 2,645 94.5Fred Amey, Sacramento St. 2001-04 43 4,049 94.2Tracy Singleton, Howard 1979-82 34 3,187 93.7Maurice Price, Charleston So. 2004-06 26 2,429 93.4Rich Musinski, William & Mary 2000-03 43 4,017 93.4David Ball, New Hampshire 2003-06 50 4,655 93.1David Rhodes, UCF 1991-94 39 3,618 92.8Kasey Dunn, Idaho 1988-91 42 3,847 91.6Gordie Lockbaum, Holy Cross ‡1986-87 22 2,012 91.5Bryan Calder, Nevada 1984-86 28 2,559 91.4Ramses Barden, Cal Poly 2005-08 46 4,203 91.4‡Defensive back in 1984-85.

All-Time Leaders on Offense 36
Career Touchdown ReceptionsPlayer, Team Years G TDCooper Kupp, Eastern Wash. 2013-16 52 *73David Ball, New Hampshire 2003-06 50 58Terrell Hudgins, Elon 2006-09 45 52Jerry Rice, Mississippi Val. 1981-84 41 50John Matthews, San Diego 2005-08 45 50Ramses Barden, Cal Poly 2005-08 46 50Eric Kimble, Eastern Wash. 2002-05 46 46Rennie Benn, Lehigh 1982-85 41 44Jerome Simpson, Coastal Caro. 2004-07 45 44Aaron Mellette, Elon 2009-12 44 44Tysson Poots, Southern Utah 2007-10 40 43^Jake Wieneke, South Dakota St. 2014-16 39 43Dedric Ward, UNI 1993-96 43 41Rob Giancola, Valparaiso 2001-04 53 40Sean Morey, Brown 1995-98 40 39Gharun Hester, Georgetown 1997-2000 36 39Cordell Roberson, SFA 2009-12 43 39Mike Jones, Tennessee St. 1979-82 42 38Roy Banks, Eastern Ill. 1983-86 38 38Jacquay Nunnally, Florida A&M 1997-2000 44 38Cornell Craig, Southern Ill. 1996-99 44 37Andre Roberts, The Citadel 2006-09 45 37Joe Thomas, Mississippi Val. 1982-85 41 36Chas Gessner, Brown 1999-2002 39 36Adam Hannula, San Diego 2002-05 43 36R.J. Harris, New Hampshire 2011-14 49 36
Annual ChampionsYear Player, Team Cl. G Rec. Rec/G Yards TD1978 Dan Ross, Northeastern Sr. 11 68 6.2 988 71979 Stuart Gaussoin, Portland St. Jr. 9 90 10.0 1,132 81980 Kenny Johnson, Portland St. So. 11 72 6.5 1,011 111981 Ken Harvey, UNI Sr. 11 78 7.1 1,161 151982 Don Lewis, Columbia Jr. 10 84 8.4 1,000 61983 Jerry Rice, Mississippi Val. Jr. 10 102 10.2 1,450 141984 Jerry Rice, Mississippi Val. Sr. 10 103 10.3 1,682 *271985 Brian Forster (TE), Rhode Island Jr. 10 115 11.5 1,617 121986 Donald Narcisse, Texas Southern Sr. 11 88 8.0 1,074 151987 Mike Barber, Marshall Jr. 11 78 7.1 1,237 7
Gordie Lockbaum (RB), Holy Cross
Sr. 11 78 7.1 1,152 9
1988 Glenn Antrum, UConn Sr. 11 77 7.0 1,130 71989 Peter Macon, Weber St. Sr. 11 92 8.4 1,047 6Beginning in 1990, ranked on both per-game catches and yards per game.
Per-Game CatchesYear Player, Team Cl. G Rec. Rec/G Yards TD1990 Kasey Dunn, Idaho Jr. 11 88 8.0 1,164 71991 Alfred Pupunu (TE), Weber St. Sr. 11 93 8.5 1,204 121992 Glenn Krupa, Southeast Mo. St. Sr. 11 77 7.0 773 41993 Dave Cecchini, Lehigh Sr. 11 88 8.0 1,318 161994 Jeff Johnson, ETSU Sr. 9 73 8.1 857 81995 Ed Mantie, Boston U. Sr. 11 81 7.4 943 11996 David Romines, CSUN Sr. 10 87 8.7 1,300 121997 Eric Krawczyk, Cornell Sr. 10 89 8.9 1,042 111998 Jacquay Nunnally, Florida A&M So. 11 93 8.5 1,316 121999 Murle Sango, Villanova So. 11 98 8.9 1,064 102000 Stephen Campbell, Brown Sr. 10 120 *12.0 1,332 112001 Drew Amerson, CSUN Jr. 10 97 9.7 1,244 52002 Chas Gessner, Brown Sr. 10 114 11.4 1,166 112003 Javarus Dudley, Fordham Sr. 12 101 8.4 1,439 142004 DaVon Fowlkes, Appalachian St. Sr. 11 103 9.4 1,618 142005 Michael Caputo, Saint Francis
(PA)Jr. 11 92 8.4 1,433 12
2006 Maurice Price, Charleston So. Jr. 11 103 9.4 985 10
Year Player, Team Cl. G Rec. Rec/G Yards TD2007 Terrell Hudgins, Elon So. 11 117 10.6 1,474 182008 John Matthews, San Diego Sr. 11 102 9.3 1,478 212009 Terrell Hudgins, Elon Sr. 12 123 10.3 1,633 162010 Marcus Harris, Murray St. Sr. 9 84 9.3 1,057 92011 Aaron Mellette, Elon Jr. 11 113 10.3 1,639 122012 Erik Lora, Eastern Ill. Jr. 12 *136 12.2 1,664 122013 Erik Lora, Eastern Ill. Sr. 13 123 9.5 1,544 192014 Spencer Kulcsar (RB), Penn Sr. 10 83 8.3 889 42015 Cooper Kupp, Eastern Wash. Jr. 11 114 10.4 1,642 192016 Karel Hamilton, Samford Sr. 11 111 10.1 1,389 14
Yards Per GameYear Player, Team Cl. G Rec. Yards Yds/G TD1990 Kasey Dunn, Idaho Jr. 11 88 1,164 105.8 71991 Mark Didio, UConn Sr. 11 88 1,354 123.1 81992 Jason Cristino, Lehigh Sr. 11 65 1,282 116.5 91993 Dave Cecchini, Lehigh Sr. 11 88 1,318 119.8 161994 Mark Orlando, Towson Sr. 9 55 1,223 135.9 121995 Dedric Ward, UNI Jr. 10 44 1,164 116.4 121996 Joe Douglass, Montana Sr. 11 82 1,469 133.6 181997 Sean Morey, Brown Jr. 10 73 1,427 142.7 151998 Eddie Conti, Delaware Sr. 11 91 1,712 155.6 101999 Cornell Craig, Southern Ill. Sr. 11 77 1,419 129.0 152000 Stephen Campbell, Brown Sr. 10 120 1,332 133.2 112001 Chas Gessner, Brown Jr. 9 83 1,182 131.3 122002 Tramon Douglas, Grambling Jr. 12 92 1,704 142.0 182003 Efrem Hill, Samford Jr. 11 92 1,387 126.1 152004 DaVon Fowlkes, Appalachian St. Sr. 11 103 1,618 147.1 142005 Laurent Robinson, Illinois St. Jr. 11 86 1,465 133.2 122006 Bruce Hocker, Duquesne Jr. 10 61 1,070 107.0 162007 Terrell Hudgins, Elon So. 11 117 1,474 134.0 182008 John Matthews, San Diego Sr. 11 102 1,478 134.4 212009 Terrell Hudgins, Elon Sr. 12 123 1,633 136.1 162010 Raymond Webber, Ark.-Pine Bluff Sr. 11 101 1,429 129.9 102011 Aaron Mellette, Elon Jr. 11 113 1,639 149.0 122012 Erik Lora, Eastern Ill. Jr. 12 *136 1,664 138.7 122013 Lee Kurfis, Lehigh Sr. 11 99 1,351 122.8 92014 Grant Wallace, Yale Sr. 10 81 1,139 113.9 52015 Cooper Kupp, Eastern Wash. Jr. 11 114 1,642 149.3 192016 Cooper Kupp, Eastern Wash. Sr. 13 117 1,700 130.8 17
SCORING*Record. †National champion or national leader in that category that season.
Season PointsPlayer, Team Year TD PAT FG Pts.Terrance West, Towson †2013 *42 0 0 *252Omar Cuff, Delaware †2007 39 0 0 234Kevin Richardson, Appalachian St. †2006 31 0 0 186Brian Westbrook, Villanova †2001 29 2 0 176Adrian Peterson, Ga. Southern †1999 29 0 0 174Jamaal Branch, Colgate †2003 29 0 0 174Terrance West, Towson †2011 29 0 0 174Damarcus James, Jacksonville St. 2013 29 0 0 174Lorenzo Taliaferro, Coastal Caro. 2013 29 0 0 174Montrell Coley, Hampton †2000 28 4 0 172Jesse Chatman, Eastern Wash. 2001 28 4 0 172Geoff Mitchell, Weber St. †1991 28 2 0 170Treyvn Smith, Weber St. †2008 28 0 0 168Jerry Rice, Mississippi Val. †1984 27 0 0 162Chaz Williams, Ga. Southern †2002 27 0 0 162Marshaun Coprich, Illinois St. †2014 27 0 0 162Brian Westbrook, Villanova †1998 26 4 0 160Zach Zenner, South Dakota St. 2014 26 2 0 158

All-Time Leaders on Offense 37
Player, Team Year TD PAT FG Pts.Archie Amerson, Northern Ariz. †1996 26 0 0 156Adrian Peterson, Ga. Southern †1998 26 0 0 156Ronald Jean, Lehigh †1999 26 0 0 156Tyler Varga, Yale 2014 26 0 0 156Chaz Williams, Ga. Southern †2004 25 2 0 152Sherriden May, Idaho †1992 25 0 0 150Aaron Stecker, Western Ill. †1997 25 0 0 150Arkee Whitlock, Southern Ill. 2006 25 0 0 150Zach Zenner, South Dakota St. 2013 25 0 0 150Chase Edmonds, Fordham †2015 25 0 0 150Khalid Abdullah, James Madison 2016 25 0 0 150
Season Points Per GamePlayer, Team Year G TD PAT FG Pts. Pts/GJerry Rice, Mississippi Val. †1984 10 27 0 0 162 *16.2Brian Westbrook, Villanova †2001 11 29 2 0 176 16.0Adrian Peterson, Ga. Southern †1999 11 29 0 0 174 15.8Terrance West, Towson †2011 11 29 0 0 174 15.8Terrance West, Towson †2013 16 *42 0 0 *252 15.8Montrell Coley, Hampton †2000 11 28 4 0 172 15.6Jesse Chatman, Eastern Wash. 2001 11 28 4 0 172 15.6Omar Cuff, Delaware †2007 15 39 0 0 234 15.6Tyler Varga, Yale †2007 10 26 0 0 156 15.6Geoff Mitchell, Weber St. †1991 11 28 2 0 170 15.5Brian Westbrook, Villanova †1998 11 26 4 0 160 14.6Tony Vinson, Towson †1993 10 24 0 0 144 14.4David Dinkins, Morehead St. 2000 9 21 2 0 128 14.2Archie Amerson, Northern Ariz. †1996 11 26 0 0 156 14.2Adrian Peterson, Ga. Southern 1998 11 26 0 0 156 14.2Ronald Jean, Lehigh 1999 11 26 0 0 156 14.2Mike McLeod, Yale 2007 10 23 0 0 138 13.8Sherriden May, Idaho †1992 11 25 0 0 150 13.6Aaron Stecker, Western Ill. †1997 11 25 0 0 150 13.6Chris Reed, Monmouth 1998 10 22 0 0 132 13.2Clifton Dawson, Harvard †2006 10 22 0 0 132 13.2Jayson Foster, Ga. Southern 2007 11 24 0 0 144 13.1Keith Elias, Princeton 1993 10 21 4 0 130 13.0Elroy Harris, Eastern Ky. †1988 10 21 2 0 128 12.8
Career Points(Non-Kickers)
Player, Team Years TDExtra Pts.
Scored Pts.Brian Westbrook, Villanova 1997-98,
2000-01*89 10 *544
Adrian Peterson, Ga. Southern 1998-2001 87 2 524Terrance West, Towson 2011-13 86 0 516Cooper Kupp, Eastern Wash. 2013-16 77 2 464Kevin Richardson, Appalachian St. 2004-07 74 0 444Omar Cuff, Delaware 2004-07 73 2 440David Sinisi, Monmouth 2006-09 72 0 432Matt Cannon (QB), Southern Utah 1997-2000 69 6 420Tim Flanders, Sam Houston St. 2010-13 70 0 420Jerry Azumah, New Hampshire 1995-98 69 4 418Zach Zenner, South Dakota St. 2011-14 69 2 416^Chase Edmonds, Fordham 2014-16 69 0 414Jerome Felton, Furman 2004-07 67 10 412Clifton Dawson, Harvard 2003-06 66 2 398Armanti Edwards (QB), Appalachian St. 2006-09 65 2 392Eric Breitenstein, Wofford 2008-12 65 0 390David Dinkins, Morehead St. 1997-2000 63 6 384Alonzo Coleman, Hampton 2003-06 64 0 384David Johnson, UNI 2011-14 64 0 384Jayson Foster (QB), Ga. Southern 2004-07 62 4 376Chaz Williams (QB), Ga. Southern 2001-04 62 2 374Sherriden May, Idaho 1991-94 61 0 366
Player, Team Years TDExtra Pts.
Scored Pts.Charvez Foger, Nevada 1985-88 60 2 362Marshaun Coprich, Illinois St. 2012-15 60 2 362Jordan Scott, Colgate 2005-08 59 4 358
Career Points(Kickers)
Player, Team Years PATPAT Att. FG
FG Att. Pts.
Dan Carpenter, Montana 2004-07 182 188 *75 103 *+413Chris Snyder, Montana 2000-03 182 187 70 *105 %394Brody McKnight, Montana 2008-11 210 220 59 87 387Marty Zendejas, Nevada 1984-87 169 175 72 90 385Craig Coffin, Southern Ill. 2002-06 229 239 50 63 379Julian Rauch, Appalachian St. 2004-07 247 256 42 61 373Kyle Dougherty, Southern Ill. 2007-10 198 208 56 78 @368Luc Swimberghe, Sam Houston
St.2013-16 *261 *268 35 48 366
Billy Hallgren, UNI 2007-10 172 174 64 95 364Andrew Paterini, Hampton 2003-06 184 204 59 90 361Andrew Howard, Richmond 2006-09 195 199 55 84 360Jason Cunningham, Montana St. 2008-11 152 163 69 92 359Adam Keller, North Dakota St. 2011-14 198 191 56 70 359Jordan Wiggs, SFA 2011-14 180 187 56 77 348Greg Kuehn, William & Mary 2002-05 166 171 59 89 343Justin Langan, Western Ill. 2001-04 174 182 53 78 @335Brian Wingert, UNI 2003-06 151 157 60 79 331Adrian Mora, Ga. Southern 2008-11 157 159 57 69 328Dave Ettinger, Hofstra 1994-97 140 155 62 93 326Brian Morgan, Grambling 2001-04 174 197 50 87 324Miguel Antonio, Sam Houston St. 2009-12 171 174 51 80 324William Will, Dayton 2013-16 152 158 55 72 +323Brian Mitchell, Marshall/UNI 1987,
89-91130 131 64 81 322
Scott Shields, Weber St. 1995-98 109 118 67 90 #322Justin Syrovatka, South Dakota St. 2010-14 154 156 55 72 319+Includes one TD. %Includes one two-point conversion made in two attempts. @Includes one two-point conversion made in one attempt. #Includes 2 TDs.
Career Points Per Game(Minimum 225 points; player must have concluded his career)Player, Team Years G TD Scored FG Pts. Pts/GTerrance West, Towson 2011-13 37 86 0 0 516 *13.95Adrian Peterson, Ga. Southern 1998-2001 42 87 2 0 524 12.48Brian Westbrook, Villanova 1997-98,
2000-0144 *89 10 0 *544 12.36
Aaron Stecker, Western Ill. 1997-98 20 39 0 0 234 11.70Gary Jones, Albany (NY) 2002-03 23 42 0 0 252 10.96Nick Hartigan, Brown 2003-05 30 54 0 0 324 10.80Omar Cuff, Delaware 2004-07 41 73 2 0 440 10.73Keith Elias, Princeton 1991-93 30 52 8 0 320 10.67Jesse Chatman, Eastern Wash. 1999-2001 31 53 4 0 322 10.39David Dinkins, Morehead St. 1997-2000 37 63 6 0 384 10.38Archie Amerson, Northern Ariz. 1995-96 22 38 0 0 228 10.36Clifton Dawson, Harvard 2003-06 39 66 2 0 398 10.21Jerry Azumah, New Hampshire 1995-98 41 69 4 0 418 10.20Michael Hicks, S. Carolina St. 1993-95 32 52 4 0 316 9.88David Sinisi, Monmouth 2006-09 44 72 0 0 432 9.82Matt Cannon, Southern Utah 1997-2000 44 69 6 0 420 9.55Chaz Williams, Ga. Southern 2001-04 40 62 2 0 374 9.35Elroy Harris, Eastern Ky. 1985,
87-8831 47 6 0 288 9.29
Joel Sigel, Portland St. 1978-80 30 46 2 0 278 9.27Charles Dunn, Portland St. 1998-2000 33 51 0 0 306 9.27Tony Zendejas, Nevada 1981-83 33 0 90 70 300 9.09Tyler Varga, Yale 2011-14 24 36 0 0 216 9.00

All-Time Leaders on Offense 38
Player, Team Years G TD Scored FG Pts. Pts/GCooper Kupp, Eastern Wash. 2013-16 52 77 2 0 464 8.92Nate Euchus, Colgate 2008-11 37 55 0 0 330 8.92Rashad Jennings, Liberty 2005-08 31 46 0 0 276 8.90
Annual Champions
Year Player, Team Cl. G TDPAT
Scored FG Pts. Pts/G1978 Frank Hawkins, Nevada So. 10 17 0 0 102 10.21979 Joel Sigel, Portland St. Jr. 10 16 0 0 96 9.61980 Ken Jenkins, Bucknell Jr. 10 16 0 0 96 9.61981 Paris Wicks, Youngstown St. Jr. 11 17 2 0 104 9.51982 Paul Lewis, Boston U. So. 10 18 0 0 108 10.81983 Rich Erenberg, Colgate Sr. 11 21 10 0 136 12.41984 Jerry Rice, Mississippi Val. Sr. 10 27 0 0 162 *16.21985 Charvez Foger, Nevada Fr. 10 18 0 0 108 10.81986 Gordie Lockbaum, Holy Cross Jr. 11 22 0 0 132 12.01987 Sean Sanders, Weber St. Sr. 10 21 0 0 126 12.61988 Elroy Harris, Eastern Ky. Jr. 10 21 2 0 128 12.81989 Carl Smith, Maine So. 11 20 0 0 120 10.91990 Barry Bourassa, New Hampshire So. 9 16 0 0 96 10.71991 Geoff Mitchell, Weber St. Sr. 11 28 2 0 170 15.51992 Sherriden May, Idaho So. 11 25 0 0 150 13.61993 Tony Vinson, Towson Sr. 10 24 0 0 144 14.41994 Michael Hicks, S. Carolina St. Jr. 11 22 0 0 132 12.01995 Alcede Surtain, Alabama St. Sr. 11 21 6 0 132 12.0
Tim Hall, Robert Morris Sr. 10 20 0 0 120 12.01996 Archie Amerson, Northern Ariz. Sr. 11 26 0 0 156 14.21997 Aaron Stecker, Western Ill. Jr. 11 25 0 0 150 13.61998 Brian Westbrook, Villanova So. 11 26 4 0 160 14.61999 Adrian Peterson, Ga. Southern So. 11 29 0 0 174 15.82000 Montrell Coley, Hampton Sr. 11 28 4 0 172 15.62001 Brian Westbrook, Villanova Sr. 11 29 2 0 176 16.02002 T.J. Stallings, Morgan St. Sr. 12 23 6 0 144 12.0
Dale Jennings, Butler Sr. 10 20 0 0 120 12.02003 Evan Harney, San Diego Fr. 10 20 2 0 122 12.22004 Chaz Williams, Ga. Southern Sr. 12 25 2 0 152 12.72005 Nick Hartigan, Brown Sr. 10 21 0 0 126 12.62006 Clifton Dawson, Harvard Sr. 10 22 0 0 132 13.2 2007 Omar Cuff, Delaware Sr. 15 39 0 0 234 15.62008 Herb Donaldson, Western Ill. Sr. 11 22 0 0 132 12.0
David Sinisi, Monmouth Jr. 11 22 0 0 132 12.0Treyvn Smith, Weber St. Jr. 14 28 0 0 168 12.0
2009 Toddrick Pendland, McNeese Sr. 11 19 0 0 118 10.72010 Nate Eachus, Colgate Jr. 11 22 0 0 132 12.02011 Terrance West, Towson Fr. 11 29 0 0 174 15.82012 Gavin McCarney, Colgate Jr. 12 23 2 0 140 11.72013 Terrance West, Towson Jr. 16 *42 0 0 *252 15.82014 Tyler Varga, Yale Sr. 10 26 0 0 156 15.62015 Kade Harrington, Lamar Jr. 11 23 0 0 138 12.52016 John Lovett, Princeton Jr. 10 21 0 0 126 12.6

All-Time Leaders on Defense (Since 2000) 39
ALL-TIME LEADERS ON DEFENSE (SINCE 2000)
TOTAL TACKLES*Record. †National champion or national leader in that category that season.
Single-Game Total Tackles(Since 2000)TT Player, Team (Opponent) Date30 Josh Cain, Chattanooga (The Citadel) Nov. 3, 200130 Kevin Talley, Norfolk St. (Savannah St.) Sept. 11, 200430 Donald Payne, Stetson (Campbell) Nov. 1, 201429 Grant Olson, North Dakota St. (Wofford) Dec. 8, 201228 Chinedu Ahanonu, Southern Utah (Nevada) Aug. 30, 201427 Darnell Sankey, Sacramento St. (Weber St.) Sept. 19, 201526 Boomer Grigsby, Illinois St. (Youngstown St.) Nov. 9, 200226 Adam Goloboski, Richmond (Delaware) Nov. 13, 200426 Matt Loucks, Fordham (Albany [NY]) Sept. 8, 200725 Tim Johnson, Youngstown St. (Hofstra) Nov. 4, 200025 Nick Ricks, Eastern Ill. (Eastern Ky.) Oct. 12, 200225 Kevin Talley, Norfolk St. (N.C. A&T) Oct. 4, 200325 Chad Nkang, Elon (Chattanooga) Oct. 15, 200525 Mario Brown, Gardner-Webb (Southeastern La.) Sept. 30, 200625 Cory Weaver, Elon (Appalachian St.) Sept. 30, 200625 Kyle Glazier, Western Ill. (Missouri St.) Oct. 23, 201024 Neil Morrissey, Cornell (Colgate) Oct. 4, 200324 Mike Pavelko, Gardner-Webb (VMI) Oct. 22, 200524 J.C. Sherritt, Eastern Wash. (Weber St.) Oct. 10, 200924 Matthew Parker, Saint Francis (PA) (Wagner) Oct. 16, 201024 Matt Evans, New Hampshire (Lehigh) Sept. 10, 201124 DeVonte’ Hawkins, Hampton (Morgan St.) Nov. 19, 201124 Rock Williams, Western Caro. (The Citadel) Oct. 13, 2012
Season Total TacklesPlayer, Team Year G Solo Ast. TotalKevin Talley, Norfolk St. †2003 12 75 *120 *195Josh Cain, Chattanooga †2002 12 *113 79 192L.J. Fort, UNI †2011 13 67 117 184Boomer Grigsby, Illinois St. 2002 11 108 71 179Boomer Grigsby, Illinois St. 2003 12 109 70 179Nathan Williams, Murray St. †2008 12 76 103 179J.C. Sherritt, Eastern Wash. †2010 15 85 91 176Donald Payne, Stetson †2014 12 93 81 174Dietrich Lapsley, Indiana St. 2002 12 103 68 171J.C. Sherritt, Eastern Wash. †2009 12 70 100 170Edgerton Hartwell, Western Ill. †2000 11 107 62 169Erik Dandy, Western Ky. 2003 13 101 66 167Kyle Glazier, Western Ill. 2010 13 81 86 167Nick Dzubnar, Cal Poly 2014 12 73 94 167Matt Evans, New Hampshire 2011 12 92 73 165Tim Johnson, Youngstown St. 2000 11 83 80 163Deon King, Norfolk St. †2015 11 77 86 163P.J. Jones, Missouri St. †2001 11 66 95 161Dennard Melton, James Madison 2003 12 101 60 161Charles Thompson, Western Ky. 2002 15 93 66 159Robert McCabe, Georgetown †2012 11 62 97 159Kyle Shotwell, Cal Poly †2005 13 84 74 158Derrick Lloyd, James Madison 2001 11 94 63 157Matt Evans, New Hampshire 2010 13 79 77 156Cornell Middlebrook, Western Ill. 2002 13 101 53 154
Season Total Tackles Per GamePlayer, Team Year G Solo Ast. Total T/GBoomer Grigsby, Illinois St. †2002 11 108 71 179 *16.27Kevin Talley, Norfolk St. †2003 12 75 *120 *195 16.25Josh Cain, Chattanooga 2002 12 *113 79 192 16.00Edgerton Hartwell, Western Ill. †2000 11 107 62 169 15.36Kevin Talley, Norfolk St. †2004 9 58 77 135 15.00Boomer Grigsby, Illinois St. 2003 12 109 70 179 14.92Nathan Williams, Murray St. †2008 12 76 103 179 14.92Ronnie McCullough,
Bethune-Cookman†2007 10 59 90 149 14.90
Tim Johnson, Youngstown St. 2000 11 83 80 163 14.82Deon King, Norfolk St. †2015 11 77 86 163 14.82P.J. Jones, Missouri St. †2001 11 66 95 161 14.64Donald Payne, Stetson †2014 12 93 81 174 14.50Robert McCabe, Georgetown †2012 11 62 97 159 14.45Derrick Lloyd, James Madison 2001 11 94 63 157 14.27Dietrich Lapsley, Indiana St. 2002 12 103 68 171 14.25J.C. Sherritt, Eastern Wash. †2009 12 70 100 170 14.17L.J. Fort, UNI †2011 13 67 117 184 14.15Aden Smith, Stony Brook 2002 10 57 83 140 14.00Bobby Rosenberg, St. John’s (NY) 2002 10 80 60 140 14.00Nick Dzubnar, Cal Poly 2014 12 73 94 167 13.92Darnell Sankey, Sacramento St. 2015 11 57 96 153 13.91Chad Nkang, Elon †2005 11 73 79 152 13.82Dylan Cole, Missouri St. 2015 11 73 79 152 13.82Matt Evans, New Hampshire 2011 12 92 73 165 13.75Blake Peiffer, Southeast Mo. St. 2011 11 74 77 151 13.73
Career Total TacklesPlayer, Team Years G Solo Ast. TotalBoomer Grigsby, Illinois St. 2001-04 44 *325 225 *550Donald Payne, Stetson 2013-16 44 317 209 526D.J. Smith, Appalachian St. 2007-10 56 246 279 525Scott Lewis, Saint Francis (PA) 2007-10 43 206 *318 524Liam Ezekiel, Northeastern 2001-04 44 218 271 489Lee Russell, Western Ill. 2000-03 48 317 163 480Nick Ricks, Eastern Ill. 2000-03 47 298 180 478Matt Evans, New Hampshire 2009-12 49 266 194 460Jada Ross, Charleston So. 2004-07 43 195 259 454Dylan Cole, Missouri St. 2013-16 46 238 216 454Matt Nelson, Wofford 2000-03 47 296 156 452Josh Cain, Chattanooga 2000-02 34 273 177 450Jordan Beck, Cal Poly 2001-04 43 270 179 449Eric McBride, Richmond 2007-10 54 198 248 446Stephon Robertson, James Madison 2010-13 46 196 249 445Quinn Backus, Coastal Caro. 2011-14 51 243 198 441James Noel, Robert Morris 2002-05 41 179 258 437A.J. Storms, Idaho St. 2008-11 41 199 235 434J.C. Sherritt, Eastern Wash. 2007-10 47 196 236 432Brian Hulea, Villanova 2002-05 48 267 164 431Matthew Parker, Saint Francis (PA) 2007-10 42 163 268 431Erik Dandy, Western Ky. 2000-03 45 241 183 424Aaron Archie, Indiana St. 2009-12 41 179 245 424Kourtney Basile, Alabama St. 2013-16 44 208 212 420John Hugunin, Drake 2012-15 42 214 204 418
Career Total Tackles Per Game(Min. 250 Total Tackles; Player must have concluded his career)Player, Team Years G Solo Ast. Total T/GJosh Cain, Chattanooga 2000-02 34 273 177 450 *13.24Boomer Grigsby, Illinois St. 2001-04 44 *325 225 *550 12.50

All-Time Leaders on Defense (Since 2000) 40
Player, Team Years G Solo Ast. Total T/GScott Lewis, Saint Francis (PA) 2007-10 43 206 *318 524 12.19Donald Payne, Stetson 2013-16 44 317 209 526 11.95Clarence Bumpas, Northern Colo. 2011-13 27 126 176 302 11.19Liam Ezekiel, Northeastern 2001-04 44 218 271 489 11.11James Noel, Robert Morris 2002-05 41 179 258 437 10.66A.J. Storms, Idaho St. 2008-11 41 199 235 434 10.59Jada Ross, Charleston So. 2004-07 43 195 259 454 10.56Jordan Beck, Cal Poly 2001-04 43 270 179 449 10.44Aaron Archie, Indiana St. 2009-12 41 179 245 424 10.34Matthew Parker, Saint Francis (PA) 2007-10 42 163 268 431 10.26Nick Ricks, Eastern Ill. 2000-03 47 298 180 478 10.17Alex DiMichele, Robert Morris 2008-10 33 135 196 331 10.03Lee Russell, Western Ill. 2000-03 48 317 163 480 10.00John Hugunin, Drake 2012-15 42 214 204 418 9.95Dylan Cole, Missouri St. 2013-16 46 238 216 454 9.87Kevin Talley, Norfolk St. 2001-04 43 173 243 416 9.67Stephon Robertson, James Madison 2010-13 46 196 249 445 9.67Matt Nelson, Wofford 2000-03 47 296 156 452 9.62Kourtney Basile, Alabama St. 2013-16 44 208 212 420 9.55Tyler Holmes, Massachusetts 2008-11 38 184 176 360 9.47Nathan Totino, Duquesne 2007-10 39 197 172 369 9.46Alex Gross, Columbia 2007-10 35 161 170 331 9.46Erik Dandy, Western Ky. 2000-03 45 241 183 424 9.42
Annual ChampionsYear Player, Team Cl. G Solo Ast. Total T/G2000 Edgerton Hartwell, Western Ill. Sr. 11 107 62 169 15.362001 P.J. Jones, Missouri St. Sr. 11 66 95 161 14.642002 Boomer Grigsby, Illinois St. So. 11 108 71 179 *16.272003 Kevin Talley, Norfolk St. Jr. 12 75 *120 *195 16.252004 Kevin Talley, Norfolk St. Sr. 9 58 77 135 15.002005 Chad Nkang, Elon Jr. 11 73 79 152 13.822006 Mike Gallihugh, Colgate Jr. 11 84 56 140 12.732007 Ronnie McCullough, Bethune-Cookman Sr. 10 59 90 149 14.902008 Nathan Williams, Murray St. Sr. 12 76 103 179 14.922009 J.C. Sherritt, Eastern Wash. Jr. 12 70 100 170 14.172010 A.J. Storms, Idaho St. Jr. 11 63 83 146 13.272011 L.J. Fort, UNI Sr. 13 67 117 184 14.152012 Robert McCabe, Georgetown Sr. 11 62 97 159 14.452013 Tazmon Foster, N.C. Central Sr. 12 79 65 144 12.002014 Donald Payne, Stetson So. 12 93 81 174 14.502015 Deon King, Norfolk St. Sr. 11 77 86 163 14.822016 Dylan Cole, Missouri St. Sr. 11 85 57 142 12.91
SOLO TACKLES*Record. †National champion or national leader in that category that season. ^Active player.
Single-Game Solo Tackles (Since 2000)Solo Player, Team (Opponent) Date21 Dan Adams, Holy Cross (Colgate) Oct. 22, 200518 Nick Ricks, Eastern Ill. (Eastern Ky.) Oct. 12, 200218 Jordan Beck, Cal Poly (Eastern Wash.) Nov. 6, 200417 Josh Cain, Chattanooga (The Citadel) Nov. 3, 200117 Matt Evans, New Hampshire (Lehigh) Sept. 10, 201117 Rock Williams, Western Caro. (The Citadel) Oct. 13, 201217 Billy Boyko, Lehigh (Holy Cross) Nov. 3, 201217 Davin Bovie, Nicholls St. (SFA) Oct. 11, 201417 Rayshan Clark, Albany (NY) (Maine) Oct. 10, 201517 Nick McBeath, Holy Cross (Brown) Oct. 10, 201516 Marty Magerko, William & Mary (Rhode Island) Oct. 13, 200116 Alexander Henderson, Jacksonville St. (Murray St.) Oct. 18, 200816 John Hugunin, Drake (Grand View) Aug. 29, 2013
Solo Player, Team (Opponent) Date16 Donald Payne, Stetson (Jacksonville) Oct. 18, 201416 Darius Leonard, South Carolina St. (Florida A&M) Sept. 17, 201516 Dylan Weigel, ETSU (Emory & Henry) Sept. 26, 201516 Donald Payne, Stetson (Dayton) Oct. 3, 201515 Matt McFadden, Weber St. (Idaho St.) Oct. 27, 200115 Andrew Clarke, Georgetown (Colgate) Nov. 16, 200215 Karl Maslowski, Western Ky. (Illinois St.) Oct. 18, 200315 Markeseo Jackson, UT Martin (Murray St.) Nov. 13, 200415 Vincent Dancy, Jackson St. (Alabama St.) Oct. 8, 200515 Farod Muhammad, Central Conn. St. (Southern Conn. St.) Sept. 15, 2006 15 J.R. Webber, Murray St. (Illinois St.) Sept. 23, 200615 Mario Brown, Gardner-Webb (Southeastern La.) Sept. 30, 200615 Chris Camacho, Chattanooga (Furman) Oct. 20, 200715 Chris Camacho, Chattanooga (Wofford) Nov. 10, 200715 Cory Nicol, Montana St. (Northern Ariz.) Nov. 8, 200815 Donovan Richard, South Carolina St. (Bethune-Cookman) Oct. 16, 201015 Jordan Aubrey, SFA (Central Ark.) Oct. 1, 201115 Austin Miele, Saint Francis (PA) (Bryant) Nov. 12, 201115 Matt Evans, New Hampshire (Richmond) Oct. 13, 201215 Rashad Smith, Jacksonville St. (Chattanooga) Sept. 8, 201215 Jaquiski Tartt, Samford (Wofford) Oct. 26, 201315 Justin Cooper, Samford (The Citadel) Nov. 15, 201415 Omar Howard, Richmond (Rhode Island) Oct. 17, 201515 Brett Taylor, Western Ill. (UNI) Nov. 12, 2016
Season Solo Tackles Player, Team Year G SoloJosh Cain, Chattanooga †2002 12 *113Boomer Grigsby, Illinois St. †2003 12 109Boomer Grigsby, Illinois St. 2002 11 108Edgerton Hartwell, Western Ill. †2000 11 107Dietrich Lapsley, Indiana St. 2002 12 103Lee Russell, Western Ill. 2003 13 102Phil Archer, Western Ill. 2003 13 102Cornell Middlebrook, Western Ill. 2002 13 101Brian Hulea, Villanova 2003 11 101Dennard Melton, James Madison 2003 12 101Erik Dandy, Western Ky. 2003 13 101Nick Ricks, Eastern Ill. 2002 12 98Derick Pack, James Madison 2000 11 97Jeremy Cain, Massachusetts 2002 12 97Lee Russell, Western Ill. 2002 13 97Jordan Beck, Cal Poly †2004 11 97Chris Camacho, Chattanooga †2007 11 96Derrick Lloyd, James Madison †2001 11 94Stephen Hodge, Fordham †2013 14 94Brett Taylor, Western Ill. †2016 11 94Donald Payne, Stetson †2014 12 93Matt Evans, New Hampshire 2011 12 92Dan Adams, Holy Cross †2005 11 91Telvion Clark, Towson 2013 16 91Tony LeZotte, James Madison 2004 15 88
Season Solo Tackles Per GamePlayer, Team Year G Solo ST/GBoomer Grigsby, Illinois St. †2002 11 108 *9.82Edgerton Hartwell, Western Ill. †2000 11 107 9.73Josh Cain, Chattanooga 2002 12 *113 9.42Brian Hulea, Villanova †2003 11 101 9.18Boomer Grigsby, Illinois St. 2003 12 109 9.08Derick Pack, James Madison 2000 11 97 8.82Jordan Beck, Cal Poly †2004 11 97 8.82Chris Camacho, Chattanooga †2007 11 96 8.73Dietrich Lapsley, Indiana St. 2002 12 103 8.58Derrick Lloyd, James Madison †2001 11 94 8.55Brett Taylor, Western Ill. †2016 11 94 8.55

All-Time Leaders on Defense (Since 2000) 41
Player, Team Year G Solo ST/GNick Ricks, Eastern Ill. 2001 10 85 8.50Dennard Melton, James Madison 2003 12 101 8.42Melvin Wisham, Western Ky. 2000 11 92 8.36Dan Adams, Holy Cross †2005 11 91 8.27Nick Ricks, Eastern Ill. 2002 12 98 8.17Jeremy Cain, Massachusetts 2002 12 97 8.08Lee Russell, Western Ill. 2003 13 102 7.85Phil Archer, Western Ill. 2003 13 102 7.85Cornell Middlebrook, Western Ill. 2002 13 101 7.77Erik Dandy, Western Ky. 2003 13 101 7.77Donald Payne, Stetson †2014 12 93 7.75Bryce Smith, Samford †2010 11 85 7.73Matt Evans, New Hampshire 2011 12 92 7.67Matt Gallihugh, Colgate †2006 11 84 7.64
Career Solo Tackles Player, Team Year G SoloBoomer Grigsby, Illinois St. 2001-04 44 *325Lee Russell, Western Ill. 2000-03 48 317Donald Payne, Stetson 2013-16 44 317Nick Ricks, Eastern Ill. 2000-03 47 298Matt Nelson, Wofford 2000-03 47 296Josh Cain, Chattanooga 2000-02 34 273Jordan Beck, Cal Poly 2001-04 43 270Brian Hulea, Villanova 2002-05 48 267Matt Evans, New Hampshire 2009-12 49 266Dan Adams, Holy Cross 2003-06 45 257D.J. Smith, Appalachian St. 2007-10 56 246Quinn Backus, Coastal Caro. 2011-14 51 243Erik Dandy, Western Ky. 2000-03 45 241Mark Newbill, Southeastern La. 2007-10 43 239Matt Hansen, Rhode Island 2007-10 51 238Dylan Cole, Missouri St. 2013-16 46 238Ryan Garrison, McNeese 2000-03 52 236Anton McKenzie, Massachusetts 2000-03 42 234Darnell Taylor, Sam Houston St. 2009-12 52 225Nick Thrasher, Tennessee St. 2011-14 46 223Tye Smith, Towson 2011-14 50 220Donelle Williams, Presbyterian 2011-15 47 219Liam Ezekiel, Northeastern 2001-04 44 218Cliff Exama, Grambling 2008-11 48 217
Career Solo Tackles Per Game (Min. 200 solo tackles; player must have concluded his career)Player, Team Years G Solo ST/GJosh Cain, Chattanooga 2000-02 34 273 *8.03Boomer Grigsby, Illinois St. 2001-04 44 *325 7.39Donald Payne, Stetson 2013-16 44 317 7.20Lee Russell, Western Ill. 2000-03 48 317 6.60Nick Ricks, Eastern Ill. 2000-03 47 298 6.34Matt Nelson, Wofford 2000-03 47 296 6.30Jordan Beck, Cal Poly 2001-04 43 270 6.28Dan Adams, Holy Cross 2003-06 45 257 5.71Anton McKenzie, Massachusetts 2000-03 42 234 5.57Brian Hulea, Villanova 2002-05 48 267 5.56Mark Newbill, Southeastern La. 2007-10 43 239 5.56Matt Evans, New Hampshire 2009-12 49 266 5.43Erik Dandy, Western Ky. 2000-03 45 241 5.36Dante Balestracci, Harvard 2000-03 38 200 5.26Colton Caslow, Lehigh 2013-16 39 203 5.21Ryan Consiglio, Chattanooga 2008-11 39 202 5.18Dylan Cole, Missouri St. 2013-16 46 238 5.17John Hugunin, Drake 2012-15 42 214 5.10Liam Ezekiel, Northeastern 2001-04 44 218 4.95Nick Thrasher, Tennessee St. 2011-14 46 223 4.85Henry Carter, Duquesne 2002-05 43 207 4.81
Player, Team Years G Solo ST/GNathan Williams, Murray St. 2005-08 43 207 4.81Scott Lewis, Saint Francis (PA) 2007-10 43 206 4.79Quinn Backus, Coastal Caro. 2011-14 51 243 4.76Mark Kimener, Massachusetts 2000-03 45 214 4.76*Record.
Annual Champions Year Player, Team Cl. G Solo ST/G2001 Derrick Lloyd, James Madison Sr. 11 94 8.552002 Boomer Grigsby, Illinois St. So. 11 108 *9.822003 Brian Hulea, Villanova Jr. 11 101 9.182004 Jordan Beck, Cal Poly Sr. 11 97 8.822005 Dan Adams, Holy Cross Jr. 11 91 8.272006 Mike Gallihugh, Colgate Jr. 11 84 7.642007 Chris Camacho, Chattanooga Jr. 11 96 8.732008 Nathan Totino, Duquesne So. 9 60 6.672009 Bryce Smith, Samford Jr. 10 67 6.702010 Bryce Smith, Samford Sr. 11 85 7.732011 Matt Evans, New Hampshire Jr. 12 92 7.672012 Matt Evans, New Hampshire Sr. 12 87 7.252013 Stephen Hodge, Fordham Jr. 14 94 6.712014 Donald Payne, Stetson So. 12 93 7.752015 Donald Payne, Stetson Jr. 11 79 7.18
Dylan Weigel, ETSU Fr. 11 79 7.182016 Brett Taylor, Western Ill. Jr. 11 94 8.55
TACKLES FOR LOSS*Record. †National champion or national leader in that category that season.
Single-Game Tackles For a Loss(Since 2000)TFL Player, Team (Opponent) Date8.0 Sherrod Coates, Western Ky. (Indiana St.) Oct. 26, 20027.0 Greg Pitts, Texas St. (Texas Southern) Sept. 21, 20026.5 Fred Poole, Mississippi Val. (Jackson St.) Oct. 25, 20086.5 Robert De La Rosa, Bucknell (Georgetown) Oct. 1, 20116.5 Derrick Billups, Alabama St. (Mississippi Val.) Nov. 16, 20136.0 Eric Allen, Tennessee Tech (Eastern Ill.) Nov. 21, 20006.0 Valdamar Brower, Massachusetts (Rhode Island) Nov. 17, 20016.0 Michael Young, Nicholls St. (Bethel [TN]) Aug. 28, 20036.0 Jerame Southern, James Madison (Hofstra) Sept. 20, 20036.0 Erik Dandy, Western Ky. (Southern Ill.) Nov. 1, 20036.0 Chad Kincaid, Western Ky. (Youngstown St.) Nov. 15, 20036.0 Lee Basinger, Wofford (N.C. A&T) Nov. 29, 20036.0 Zack Nash, Sacramento St. (Idaho St.) Nov. 13, 20106.0 Marcus Hyde, William & Mary (New Hampshire) Oct. 15, 20116.0 Ryan Davis, Bethune-Cookman (Norfolk St.) Oct. 20, 20116.0 Troy Moore, Sacred Heart (Bryant) Oct. 19, 20136.0 Pat Dowd, Dayton (Drake) Nov. 9, 20136.0 Dylan Cole, Missouri St. (Oklahoma St.) Sept. 6, 20146.0 Javon Hargrave, South Carolina St. (Bethune-Cookman) Oct. 25, 20146.0 Joshua Thorne, Hampton (Delaware St.) Oct. 25, 20146.0 Elijah Daniel, Murray St. (Tennessee Tech) Sept. 26, 20156.0 Javancy Jones, Jackson St. (Alabama St.) Nov. 7, 20156.0 Christian Kuntz, Duquesne (Dayton) Sept. 17, 2016
Season Tackles For LossPlayer, Team Year G Solo Ast. TotalSteve Baggs, Bethune-Cookman †2003 12 28 16 *36.0Kyle Emanuel, North Dakota St. †2014 16 28 9 32.5Sherrod Coates, Western Ky. †2002 15 31 0 31.0Robert Mathis, Alabama A&M 2002 11 30 1 30.5

All-Time Leaders on Defense (Since 2000) 42
Player, Team Year G Solo Ast. TotalChris Gocong, Cal Poly †2005 13 27 7 30.5Corey Hart, Alabama A&M †2011 12 25 8 29.0Isaac Hilton, Hampton 2002 12 27 3 28.5Keith Pough, Howard †2010 11 25 7 28.5James Cowser, Southern Utah 2014 12 26 5 28.5Joseph Crear, Mississippi Val. 2002 11 27 2 28.0Anthony Jones, Wofford 2002 12 28 0 28.0Leonard Mack, Texas Southern 2002 11 25 5 27.5Andy Petek, Montana †2000 11 27 0 27.0Jamal Naji, Norfolk St. 2002 11 23 8 27.0Mario Kurn, San Diego 2010 11 24 6 27.0Brent Hawkins, Illinois St. 2005 11 22 9 26.5Marques Murrell, Appalachian St. 2005 15 21 11 26.5Adrian Hamilton, Prairie View 2011 11 22 9 26.5Steve Baggs, Bethune-Cookman 2002 13 25 2 26.0Shawn Johnson, Delaware 2003 16 22 8 26.0Christian Kuntz, Duquesne 2015 12 22 8 26.0Javancy Jones, Jackson St. †2015 11 19 13 25.5Keontre Anderson, Jackson St. †2016 11 20 11 25.5Brandon Thurmond, Ark.-Pine Bluff †2012 12 22 6 25.0Connor Underwood, Indiana St. 2014 14 21 8 25.0Gabe Sherrod, Delaware St. 2015 11 23 4 25.0
Season Tackles For Loss Per Game Player, Team Year G Solo Ast. Total T/GSteve Baggs, Bethune-Cookman †2003 12 28 16 *36.0 *3.00Robert Mathis, Alabama A&M †2002 11 30 1 30.5 2.77Keith Pough, Howard †2010 11 25 7 28.5 2.59Odain Mitchell, Sacred Heart 2002 10 20 11 25.5 2.55Joseph Crear, Mississippi Val. 2002 11 27 2 28.0 2.55Leonard Mack, Texas Southern 2002 11 25 5 27.5 2.50Andy Petek, Montana †2000 11 27 0 27.0 2.45Jamal Naji, Norfolk St. 2002 11 23 8 27.0 2.45Mario Kurn, San Diego 2010 11 24 6 27.0 2.45Corey Hart, Alabama A&M †2011 12 25 8 29.0 2.42Brent Hawkins, Illinois St. †2005 11 22 9 26.5 2.41Adrian Hamilton, Prairie View 2011 11 22 9 26.5 2.41D.J. Bleisath, Tennessee Tech †2001 10 24 0 24.0 2.40Isaac Hilton, Hampton 2002 12 27 3 28.5 2.38James Cowser, Southern Utah †2014 12 26 5 28.5 2.38Chris Gocong, Cal Poly 2005 13 27 7 30.5 2.35Anthony Jones, Wofford 2002 12 28 0 28.0 2.33Javancy Jones, Jackson St. †2015 11 19 13 25.5 2.32Keontre Anderson, Jackson St. †2016 11 20 11 25.5 2.32Gabe Sherrod, Delaware St. 2015 11 23 4 25.0 2.27Donavan Robinson, Jackson St. 2011 10 18 9 22.5 2.25Joseph LeBeau, Jackson St. 2011 11 21 7 24.5 2.23Chad Evitts, Tennessee Tech 2000 11 24 0 24.0 2.18Brian Bodor, Wofford 2000 11 24 0 24.0 2.18Jeff Allen, Eastern Wash. 2000 11 24 0 24.0 2.18Dain Taylor, Drake 2010 11 20 8 24.0 2.18Karter Schult, UNI 2016 11 22 4 24.0 2.18Christian Kuntz, Duquesne 2016 11 22 4 24.0 2.18
Career Tackles For LossPlayer, Team Years G Solo Ast. TotalJames Cowser, Southern Utah 2012-15 48 70 20 *80.0Javancy Jones, Jackson St. 2013-16 44 56 42 77.0Keith Pough, Howard 2008-12 44 61 22 72.0Christian Kuntz, Duquesne 2012-13,
15-1645 59 25 71.5
Sherrod Coates, Western Ky. 2000-02 40 67 0 67.0^P.J. Hall, Sam Houston St. 2014-16 45 54 25 66.5Donald Payne, Stetson 2013-16 44 56 21 66.5Jeff Covitz, Bryant 2011-14 45 50 32 66.0Valdamar Brower, Massachusetts 2000-03 46 63 0 63.0
Player, Team Years G Solo Ast. TotalJavon Hargrave, South Carolina St. 2012-15 45 56 14 63.0Adrian Tracy, William & Mary 2006-09 47 50 25 62.5Steve Baggs, Bethune-Cookman 2002-03 25 53 18 62.0Chris Gocong, Cal Poly 2001, 03-05 41 60 3 61.5Lee Basinger, Wofford 2001-04 46 61 0 61.0Anthony Jones, Wofford 2000-02 32 60 0 60.0Tim Knicky, SFA 2006-09 45 46 27 59.5Davis Tull, Chattanooga 2011-14 48 56 7 59.5Marques Murrell, Appalachian St. 2003-06 52 59 0 59.0Kyle Emanuel, North Dakota St. 2011-14 61 48 21 58.5Lee Russell, Western Ill. 2000-03 48 58 0 58.0Marquis Smith, Savannah St. 2013-16 39 46 24 58.0Vince Lands, Southern U. 2005-08 36 44 27 57.5Eric Bakhtiari, San Diego 2005-07 54 49 16 57.0Davion Belk, Stetson 2013-16 45 47 20 57.0Bryan Smith, McNeese 2005-07 31 48 17 56.5Dejuan Fulghum, Texas Southern 2007-10 45 45 23 56.5Donavan Robinson, Jackson St. 2008-11 38 49 15 56.5Derek Rivers, Youngstown St. 2013-16 49 51 11 56.5
Career Tackles For Loss Per Game(Min. 25 tackles for loss; player must have concluded his career)Player, Team Years G Solo Ast. Total T/GSteve Baggs, Bethune-Cookman 2002-03 25 53 18 62.0 *2.48Joseph LeBeau, Jackson St. 2011-12 23 40 16 48.0 2.09Anthony Jones, Wofford 2000-02 32 60 0 60.0 1.88Bryan Smith, McNeese 2005-07 31 48 17 56.5 1.82Javancy Jones, Jackson St. 2013-16 44 56 42 77.0 1.75Adrian Hamilton, Prairie View 2010-11 20 28 12 34.0 1.70Sherrod Coates, Western Ky. 2000-02 40 67 0 67.0 1.68James Cowser, Southern Utah 2012-15 48 70 20 *80.0 1.67Keith Pough, Howard 2008-12 44 61 22 72.0 1.64Vince Lands, Southern U. 2005-08 36 44 27 57.5 1.60Christian Kuntz, Duquesne 2012-13,
15-1645 59 25 71.5 1.59
Mike O’Brien, Western Ill. 2000-03 35 54 0 54.0 1.54Donald Payne, Stetson 2013-16 44 56 21 66.5 1.51Chris Gocong, Cal Poly 2001, 03-05 41 60 3 61.5 1.50Tyler Osborne, Southern Utah 2010-11 22 25 16 33.0 1.50Ronnie Cameron, Old Dominion 2010-11 24 22 28 36.0 1.50Marquis Smith, Savannah St. 2013-16 39 46 24 58.0 1.49Donavan Robinson, Jackson St. 2008-11 38 49 15 56.5 1.49Jeff Covitz, Bryant 2011-14 45 50 32 66.0 1.47Ronnie McCullough,
Bethune-Cookman2006-07 19 20 15 27.5 1.45
Marcus Benard, Jackson St. 2007-08 24 26 17 34.5 1.44Zack Nash, Sacramento St. 2010-11 22 29 5 31.5 1.43Clayton McGrath, Brown 2010-11 20 23 11 28.5 1.43Brandon Peguese, Hampton 2008-10 33 31 31 46.5 1.41Javon Hargrave, South Carolina St. 2012-15 45 56 14 63.0 1.40
Annual ChampionsYear Player, Team Cl. G Solo Ast. Total T/G2000 Andy Petek, Montana Sr. 11 27 0 27.0 2.452001 D.J. Bleisath, Tennessee Tech Jr. 10 24 0 24.0 2.402002 Robert Mathis, Alabama A&M Sr. 11 30 1 30.5 2.772003 Steve Baggs, Bethune-Cookman Sr. 12 28 16 *36.0 *3.002004 Harold Wells, Gardner-Webb Sr. 11 17 11 22.5 2.052005 Brent Hawkins, Illinois St. Sr. 11 22 9 26.5 2.412006 Chris Hunsaker, Northern Ariz. Sr. 11 17 8 21.0 1.912007 Derrick Gray, Texas Southern Sr. 11 21 7 24.5 2.23
Rudolph Hardie, Howard Sr. 11 22 5 24.5 2.232008 Greg Peach, Eastern Wash. Sr. 11 18 9 22.5 2.052009 Arthur Moats, James Madison Sr. 11 18 11 23.5 2.142010 Keith Pough, Howard So. 11 25 7 28.5 2.592011 Corey Hart, Alabama A&M Sr. 12 25 8 29.0 2.42

All-Time Leaders on Defense (Since 2000) 43
Year Player, Team Cl. G Solo Ast. Total T/G2012 Brandon Thurmond, Ark.-Pine Bluff Sr. 12 22 6 25.0 2.082013 Christian Kuntz, Duquesne So. 11 15 9 19.5 1.772014 James Cowser, Southern Utah Jr. 12 26 5 28.5 2.382015 Javancy Jones, Jackson St. Jr. 11 19 13 25.5 2.322016 Keontre Anderson, Jackson St. Jr. 11 20 11 25.5 2.32
PASS SACKS*Record. †National champion or national leader in that category that season. ^Active player.
Single Game Pass Sacks(Since 2000)
PS Player, Team (Opponent) Date6.0 Damien Huren, Southeastern La. (Northern Colo.) Oct. 9, 20046.0 Pat Dowd, Dayton (Drake) Nov. 9, 20136.0 Javon Hargrave, South Carolina St.
(Bethune-Cookman)Oct. 25, 2014
5.0 Maurice Troutman, Ark.-Pine Bluff (Mississippi Val.) Sept. 6, 20035.0 Brent Hawkins, Illinois St. (UNI) Oct. 22, 20055.0 Eric Bakhtiari, San Diego (Drake) Oct. 13, 20075.0 Zack Nash, Sacramento St. (Idaho St.) Nov. 13, 20105.0 Marcus Hyde, William & Mary (New Hampshire) Oct. 15, 20115.0 Zack Nash, Sacramento St. (Idaho St.) Nov. 12, 20115.0 Willie Jefferson, SFA (Northwestern St.) Nov. 19, 20115.0 Michael Cole, Maine (Delaware) Oct. 6, 20124.5 Michael Young, Nicholls St. (Bethel [TN]) Aug. 28, 20034.5 Tyree Broden, McNeese (Sam Houston St.) Oct. 25, 20034.5 Steve Lhotak, Penn (Harvard) Nov. 15, 20034.5 Marcus Edwards, Tennessee Tech (Eastern Ill.) Oct. 16, 20104.5 Devon Langhorst, Dayton (Drake) Nov. 6, 20104.5 Sackie Kerkulah, Howard (Savannah St.) Oct. 1, 20114.5 Willie Jefferson, SFA (McNeese) Oct. 29, 20114.5 Tony Bell, UT Martin (Murray St.) Nov. 2, 2013
Season Pass SacksPlayer, Team Year G Solo Ast. TotalChris Gocong, Cal Poly †2005 13 19 9 *23.5Adrian Hamilton, Prairie View †2011 11 17 7 20.5Robert Mathis, Alabama A&M †2002 11 19 2 20.0Eric Bakhtiari, San Diego †2007 11 18 4 20.0Kyle Emanuel, North Dakota St. †2014 16 18 3 19.5Andy Petek, Montana †2000 11 19 0 19.0Greg Peach, Eastern Wash. †2008 11 16 4 18.0Tyrone Holmes, Montana †2015 13 16 4 18.0Jared Allen, Idaho St. †2003 12 16 3 17.5Chris Gocong, Cal Poly †2004 11 16 3 17.5Brandon Thurmond, Ark.-Pine Bluff †2012 12 16 3 17.5Zack Wagenmann, Montana 2014 14 16 3 17.5Andrew Hollingsworth, Towson 2000 9 16 2 17.0Brent Hawkins, Illinois St. 2005 11 16 2 17.0Mario Kurn, San Diego †2010 11 16 2 17.0Karter Schult, UNI †2016 11 16 2 17.0Alec May, Georgetown 2014 11 16 1 16.5Odain Mitchell, Sacred Heart 2002 10 13 6 16.0Corey Hart, Alabama A&M 2011 12 15 2 16.0Javon Hargrave, South Carolina St. 2014 12 16 0 16.0Joseph LeBeau, Jackson St. 2011 11 15 1 15.5Renauld Williams, Hofstra 2002 12 15 0 15.0Steve Baggs, Bethune-Cookman 2003 12 13 4 15.0Kroy Biermann, Montana 2007 12 12 6 15.0Blake Oliaro, San Diego 2011 11 14 2 15.0Willie Jefferson, SFA 2011 11 13 4 15.0
Season Pass Sacks Per GamePlayer, Team Year G Solo Ast. Total T/GAndrew Hollingsworth, Towson †2000 9 16 2 17.0 *1.89Adrian Hamilton, Prairie View †2011 11 17 7 20.5 1.86Robert Mathis, Alabama A&M †2002 11 19 2 20.0 1.82Eric Bakhtiari, San Diego †2007 11 18 4 20.0 1.82Chris Gocong, Cal Poly †2005 13 19 9 *23.5 1.81Andy Petek, Montana †2000 11 19 0 19.0 1.73Greg Peach, Eastern Wash. †2008 11 16 4 18.0 1.64Odain Mitchell, Sacred Heart 2002 10 13 6 16.0 1.60Chris Gocong, Cal Poly †2004 11 16 3 17.5 1.59Brent Hawkins, Illinois St. 2005 11 16 2 17.0 1.55Mario Kurn, San Diego †2010 11 16 2 17.0 1.55Karter Schult, UNI †2016 11 16 2 17.0 1.55Alec May, Georgetown †2014 11 16 1 16.5 1.50Jared Allen, Idaho St. †2003 12 16 3 17.5 1.46Brandon Thurmond, Ark.-Pine Bluff †2012 12 16 3 17.5 1.46Joseph LeBeau, Jackson St. 2011 11 15 1 15.5 1.41Donavan Robinson, Jackson St. 2011 10 13 2 14.0 1.40Brady Fosmark, Weber St. 2003 9 11 3 12.5 1.39Tyrone Holmes, Montana †2015 13 16 4 18.0 1.38Blake Oliaro, San Diego 2011 11 14 2 15.0 1.36Willie Jefferson, SFA 2011 11 13 4 15.0 1.36Corey Hart, Alabama A&M 2011 12 15 2 16.0 1.33Javon Hargrave, South Carolina St. 2014 12 16 0 16.0 1.33
Career Pass SacksPlayer, Team Years G Solo Ast. TotalJames Cowser, Southern Utah 2012-15 48 40 5 *42.5Chris Gocong, Cal Poly 2001, 03-05 41 36 12 42.0Robert Mathis, Alabama A&M 2000-02 31 37 4 39.0Zack Wagenmann, Montana 2011-14 51 33 9 37.5Derek Rivers, Youngstown St. 2013-16 49 35 5 37.5Davis Tull, Chattanooga 2011-14 48 34 6 37.0Javon Hargrave, South Carolina St. 2012-15 45 36 2 37.0Marques Murrell, Appalachian St. 2003-06 52 36 0 36.0Greg Peach, Eastern Wash. 2005-08 47 31 9 35.5Kyle Emanuel, North Dakota St. 2011-14 61 30 11 35.5Karter Schult, UNI 2013-16 51 33 5 35.5Mario Kurn, San Diego 2008-11 39 30 9 34.5Grant Hunter, Butler 2008-11 40 31 7 34.5Tyrone Holmes, Montana 2012-15 51 29 11 34.5Matt Mitchell, UNI 2000-03 46 33 0 33.0Brad Daly, Montana St. 2009, 11-13 46 29 8 33.0Jeremy Maddox, Alabama A&M 2006-09 45 27 11 32.5Victor Ochi, Stony Brook 2012-15 45 30 5 32.5Tim Bush, Montana 2000-03 48 28 7 31.5Tim Knicky, SFA 2006-09 45 27 9 31.5Eric Bakhtiari, San Diego 2004-07 54 28 6 31.0^P.J. Hall, Sam Houston St. 2014-16 45 27 8 31.0Keionta Davis, Chattanooga 2013-16 50 29 4 31.0K.T. Stovall, Appalachian St. 2000-03 50 28 5 30.5Andrew Schaetzke, Georgetown 2008-11 41 28 5 30.5Brandon Coleman, Drake 2010-13 42 26 9 30.5Jonathan Woodard, Central Ark. 2011-15 48 26 9 30.5Christian Kuntz, Duquesne 2012-13,
15-1645 27 7 30.5
Career Pass Sacks Per Game(Min. 20 pass sacks; player must have concluded his career)Player, Team Years G Solo Ast. Total T/GAdrian Hamilton, Prairie View 2010-11 20 22 7 25.5 *1.28Robert Mathis, Alabama A&M 2000-02 31 37 4 39.0 1.26Joseph LeBeau, Jackson St. 2011-12 23 24 4 26.0 1.13Zack Nash, Sacramento St. 2010-11 22 23 1 23.5 1.07Brent Hawkins, Illinois St. 2004-05 19 19 2 20.0 1.05
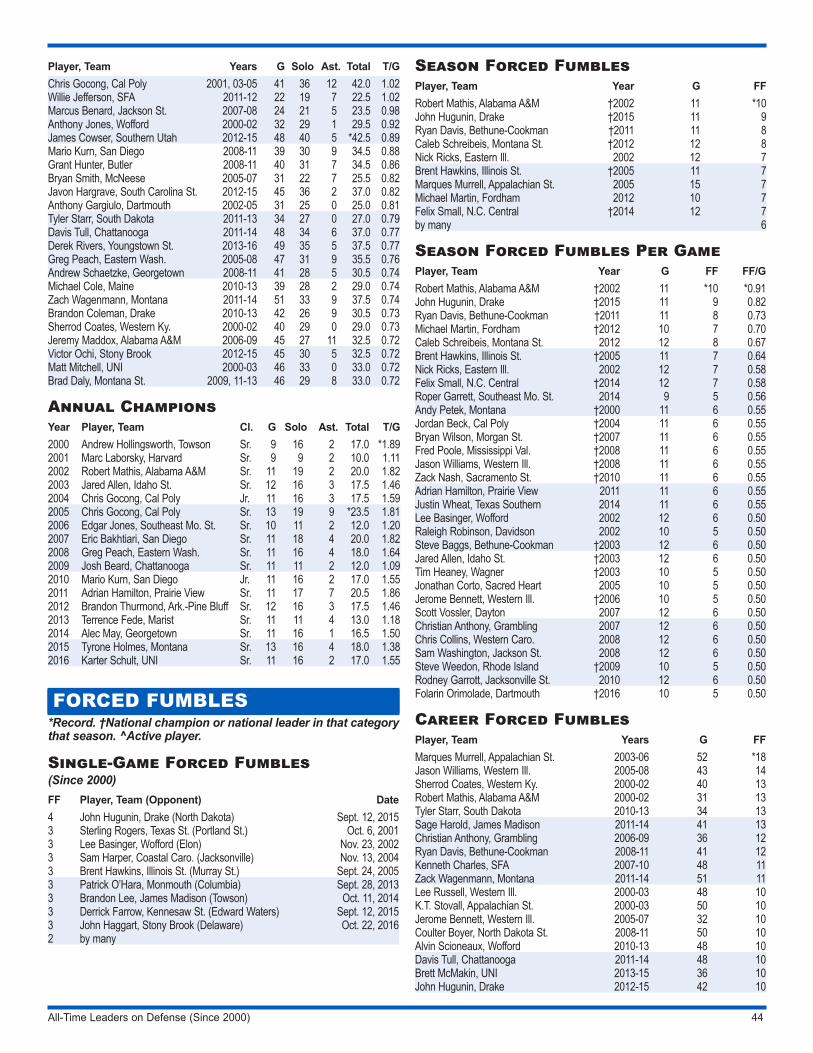
All-Time Leaders on Defense (Since 2000) 44
Player, Team Years G Solo Ast. Total T/GChris Gocong, Cal Poly 2001, 03-05 41 36 12 42.0 1.02Willie Jefferson, SFA 2011-12 22 19 7 22.5 1.02Marcus Benard, Jackson St. 2007-08 24 21 5 23.5 0.98Anthony Jones, Wofford 2000-02 32 29 1 29.5 0.92James Cowser, Southern Utah 2012-15 48 40 5 *42.5 0.89Mario Kurn, San Diego 2008-11 39 30 9 34.5 0.88Grant Hunter, Butler 2008-11 40 31 7 34.5 0.86Bryan Smith, McNeese 2005-07 31 22 7 25.5 0.82Javon Hargrave, South Carolina St. 2012-15 45 36 2 37.0 0.82Anthony Gargiulo, Dartmouth 2002-05 31 25 0 25.0 0.81Tyler Starr, South Dakota 2011-13 34 27 0 27.0 0.79Davis Tull, Chattanooga 2011-14 48 34 6 37.0 0.77Derek Rivers, Youngstown St. 2013-16 49 35 5 37.5 0.77Greg Peach, Eastern Wash. 2005-08 47 31 9 35.5 0.76Andrew Schaetzke, Georgetown 2008-11 41 28 5 30.5 0.74Michael Cole, Maine 2010-13 39 28 2 29.0 0.74Zach Wagenmann, Montana 2011-14 51 33 9 37.5 0.74Brandon Coleman, Drake 2010-13 42 26 9 30.5 0.73Sherrod Coates, Western Ky. 2000-02 40 29 0 29.0 0.73Jeremy Maddox, Alabama A&M 2006-09 45 27 11 32.5 0.72Victor Ochi, Stony Brook 2012-15 45 30 5 32.5 0.72Matt Mitchell, UNI 2000-03 46 33 0 33.0 0.72Brad Daly, Montana St. 2009, 11-13 46 29 8 33.0 0.72
Annual ChampionsYear Player, Team Cl. G Solo Ast. Total T/G2000 Andrew Hollingsworth, Towson Sr. 9 16 2 17.0 *1.892001 Marc Laborsky, Harvard Sr. 9 9 2 10.0 1.112002 Robert Mathis, Alabama A&M Sr. 11 19 2 20.0 1.822003 Jared Allen, Idaho St. Sr. 12 16 3 17.5 1.462004 Chris Gocong, Cal Poly Jr. 11 16 3 17.5 1.592005 Chris Gocong, Cal Poly Sr. 13 19 9 *23.5 1.812006 Edgar Jones, Southeast Mo. St. Sr. 10 11 2 12.0 1.202007 Eric Bakhtiari, San Diego Sr. 11 18 4 20.0 1.822008 Greg Peach, Eastern Wash. Sr. 11 16 4 18.0 1.642009 Josh Beard, Chattanooga Sr. 11 11 2 12.0 1.092010 Mario Kurn, San Diego Jr. 11 16 2 17.0 1.552011 Adrian Hamilton, Prairie View Sr. 11 17 7 20.5 1.862012 Brandon Thurmond, Ark.-Pine Bluff Sr. 12 16 3 17.5 1.462013 Terrence Fede, Marist Sr. 11 11 4 13.0 1.182014 Alec May, Georgetown Sr. 11 16 1 16.5 1.502015 Tyrone Holmes, Montana Sr. 13 16 4 18.0 1.382016 Karter Schult, UNI Sr. 11 16 2 17.0 1.55
FORCED FUMBLES*Record. †National champion or national leader in that category that season. ^Active player.
Single-Game Forced Fumbles(Since 2000)FF Player, Team (Opponent) Date4 John Hugunin, Drake (North Dakota) Sept. 12, 20153 Sterling Rogers, Texas St. (Portland St.) Oct. 6, 20013 Lee Basinger, Wofford (Elon) Nov. 23, 20023 Sam Harper, Coastal Caro. (Jacksonville) Nov. 13, 20043 Brent Hawkins, Illinois St. (Murray St.) Sept. 24, 20053 Patrick O’Hara, Monmouth (Columbia) Sept. 28, 20133 Brandon Lee, James Madison (Towson) Oct. 11, 20143 Derrick Farrow, Kennesaw St. (Edward Waters) Sept. 12, 20153 John Haggart, Stony Brook (Delaware) Oct. 22, 20162 by many
Season Forced FumblesPlayer, Team Year G FFRobert Mathis, Alabama A&M †2002 11 *10John Hugunin, Drake †2015 11 9Ryan Davis, Bethune-Cookman †2011 11 8Caleb Schreibeis, Montana St. †2012 12 8Nick Ricks, Eastern Ill. 2002 12 7Brent Hawkins, Illinois St. †2005 11 7Marques Murrell, Appalachian St. 2005 15 7Michael Martin, Fordham 2012 10 7Felix Small, N.C. Central †2014 12 7by many 6
Season Forced Fumbles Per GamePlayer, Team Year G FF FF/GRobert Mathis, Alabama A&M †2002 11 *10 *0.91John Hugunin, Drake †2015 11 9 0.82Ryan Davis, Bethune-Cookman †2011 11 8 0.73Michael Martin, Fordham †2012 10 7 0.70Caleb Schreibeis, Montana St. 2012 12 8 0.67Brent Hawkins, Illinois St. †2005 11 7 0.64Nick Ricks, Eastern Ill. 2002 12 7 0.58Felix Small, N.C. Central †2014 12 7 0.58Roper Garrett, Southeast Mo. St. 2014 9 5 0.56Andy Petek, Montana †2000 11 6 0.55Jordan Beck, Cal Poly †2004 11 6 0.55Bryan Wilson, Morgan St. †2007 11 6 0.55Fred Poole, Mississippi Val. †2008 11 6 0.55Jason Williams, Western Ill. †2008 11 6 0.55Zack Nash, Sacramento St. †2010 11 6 0.55Adrian Hamilton, Prairie View 2011 11 6 0.55Justin Wheat, Texas Southern 2014 11 6 0.55Lee Basinger, Wofford 2002 12 6 0.50Raleigh Robinson, Davidson 2002 10 5 0.50Steve Baggs, Bethune-Cookman †2003 12 6 0.50Jared Allen, Idaho St. †2003 12 6 0.50Tim Heaney, Wagner †2003 10 5 0.50Jonathan Corto, Sacred Heart 2005 10 5 0.50Jerome Bennett, Western Ill. †2006 10 5 0.50Scott Vossler, Dayton 2007 12 6 0.50Christian Anthony, Grambling 2007 12 6 0.50Chris Collins, Western Caro. 2008 12 6 0.50Sam Washington, Jackson St. 2008 12 6 0.50Steve Weedon, Rhode Island †2009 10 5 0.50Rodney Garrott, Jacksonville St. 2010 12 6 0.50Folarin Orimolade, Dartmouth †2016 10 5 0.50
Career Forced FumblesPlayer, Team Years G FFMarques Murrell, Appalachian St. 2003-06 52 *18Jason Williams, Western Ill. 2005-08 43 14Sherrod Coates, Western Ky. 2000-02 40 13Robert Mathis, Alabama A&M 2000-02 31 13Tyler Starr, South Dakota 2010-13 34 13Sage Harold, James Madison 2011-14 41 13Christian Anthony, Grambling 2006-09 36 12Ryan Davis, Bethune-Cookman 2008-11 41 12Kenneth Charles, SFA 2007-10 48 11Zack Wagenmann, Montana 2011-14 51 11Lee Russell, Western Ill. 2000-03 48 10K.T. Stovall, Appalachian St. 2000-03 50 10Jerome Bennett, Western Ill. 2005-07 32 10Coulter Boyer, North Dakota St. 2008-11 50 10Alvin Scioneaux, Wofford 2010-13 48 10Davis Tull, Chattanooga 2011-14 48 10Brett McMakin, UNI 2013-15 36 10John Hugunin, Drake 2012-15 42 10
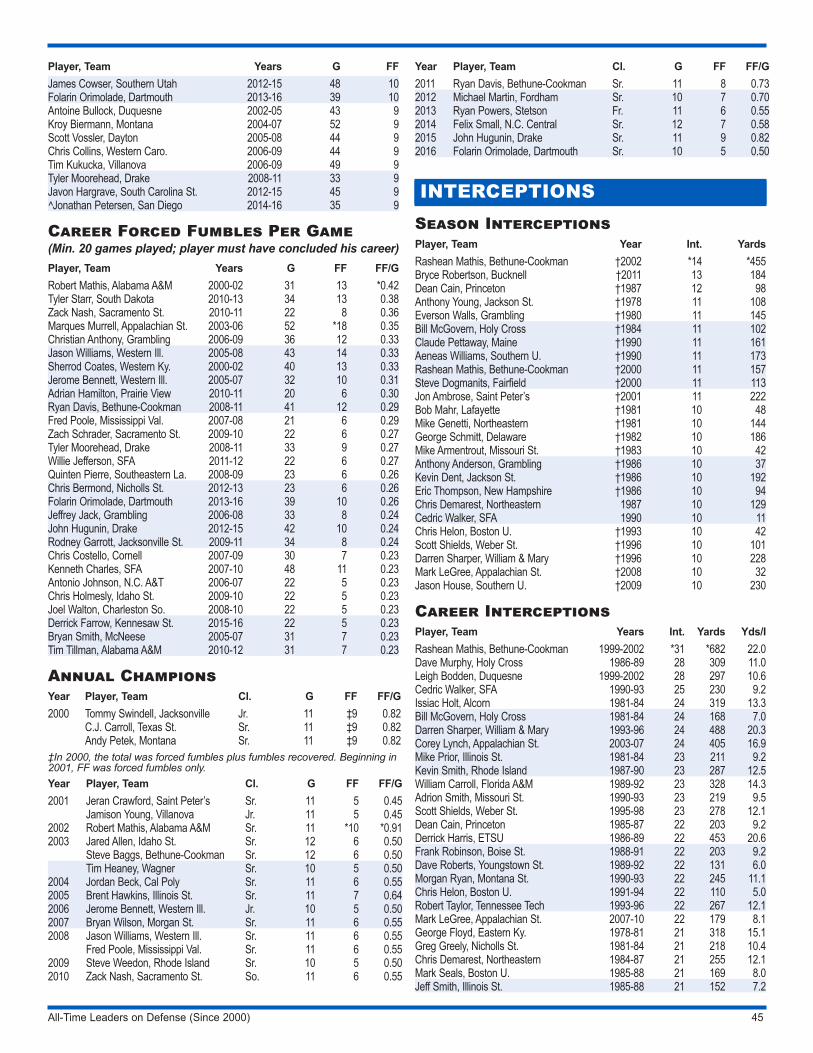
All-Time Leaders on Defense (Since 2000) 45
Player, Team Years G FFJames Cowser, Southern Utah 2012-15 48 10Folarin Orimolade, Dartmouth 2013-16 39 10Antoine Bullock, Duquesne 2002-05 43 9Kroy Biermann, Montana 2004-07 52 9Scott Vossler, Dayton 2005-08 44 9Chris Collins, Western Caro. 2006-09 44 9Tim Kukucka, Villanova 2006-09 49 9Tyler Moorehead, Drake 2008-11 33 9Javon Hargrave, South Carolina St. 2012-15 45 9^Jonathan Petersen, San Diego 2014-16 35 9
Career Forced Fumbles Per Game(Min. 20 games played; player must have concluded his career)Player, Team Years G FF FF/GRobert Mathis, Alabama A&M 2000-02 31 13 *0.42Tyler Starr, South Dakota 2010-13 34 13 0.38Zack Nash, Sacramento St. 2010-11 22 8 0.36Marques Murrell, Appalachian St. 2003-06 52 *18 0.35Christian Anthony, Grambling 2006-09 36 12 0.33Jason Williams, Western Ill. 2005-08 43 14 0.33Sherrod Coates, Western Ky. 2000-02 40 13 0.33Jerome Bennett, Western Ill. 2005-07 32 10 0.31Adrian Hamilton, Prairie View 2010-11 20 6 0.30Ryan Davis, Bethune-Cookman 2008-11 41 12 0.29Fred Poole, Mississippi Val. 2007-08 21 6 0.29Zach Schrader, Sacramento St. 2009-10 22 6 0.27Tyler Moorehead, Drake 2008-11 33 9 0.27Willie Jefferson, SFA 2011-12 22 6 0.27Quinten Pierre, Southeastern La. 2008-09 23 6 0.26Chris Bermond, Nicholls St. 2012-13 23 6 0.26Folarin Orimolade, Dartmouth 2013-16 39 10 0.26Jeffrey Jack, Grambling 2006-08 33 8 0.24John Hugunin, Drake 2012-15 42 10 0.24Rodney Garrott, Jacksonville St. 2009-11 34 8 0.24Chris Costello, Cornell 2007-09 30 7 0.23Kenneth Charles, SFA 2007-10 48 11 0.23Antonio Johnson, N.C. A&T 2006-07 22 5 0.23Chris Holmesly, Idaho St. 2009-10 22 5 0.23Joel Walton, Charleston So. 2008-10 22 5 0.23Derrick Farrow, Kennesaw St. 2015-16 22 5 0.23Bryan Smith, McNeese 2005-07 31 7 0.23Tim Tillman, Alabama A&M 2010-12 31 7 0.23
Annual ChampionsYear Player, Team Cl. G FF FF/G2000 Tommy Swindell, Jacksonville Jr. 11 ‡9 0.82
C.J. Carroll, Texas St. Sr. 11 ‡9 0.82Andy Petek, Montana Sr. 11 ‡9 0.82
‡In 2000, the total was forced fumbles plus fumbles recovered. Beginning in 2001, FF was forced fumbles only.Year Player, Team Cl. G FF FF/G2001 Jeran Crawford, Saint Peter’s Sr. 11 5 0.45
Jamison Young, Villanova Jr. 11 5 0.452002 Robert Mathis, Alabama A&M Sr. 11 *10 *0.912003 Jared Allen, Idaho St. Sr. 12 6 0.50
Steve Baggs, Bethune-Cookman Sr. 12 6 0.50Tim Heaney, Wagner Sr. 10 5 0.50
2004 Jordan Beck, Cal Poly Sr. 11 6 0.552005 Brent Hawkins, Illinois St. Sr. 11 7 0.642006 Jerome Bennett, Western Ill. Jr. 10 5 0.502007 Bryan Wilson, Morgan St. Sr. 11 6 0.552008 Jason Williams, Western Ill. Sr. 11 6 0.55
Fred Poole, Mississippi Val. Sr. 11 6 0.552009 Steve Weedon, Rhode Island Sr. 10 5 0.502010 Zack Nash, Sacramento St. So. 11 6 0.55
Year Player, Team Cl. G FF FF/G2011 Ryan Davis, Bethune-Cookman Sr. 11 8 0.732012 Michael Martin, Fordham Sr. 10 7 0.702013 Ryan Powers, Stetson Fr. 11 6 0.552014 Felix Small, N.C. Central Sr. 12 7 0.582015 John Hugunin, Drake Sr. 11 9 0.822016 Folarin Orimolade, Dartmouth Sr. 10 5 0.50
INTERCEPTIONSSeason InterceptionsPlayer, Team Year Int. YardsRashean Mathis, Bethune-Cookman †2002 *14 *455Bryce Robertson, Bucknell †2011 13 184Dean Cain, Princeton †1987 12 98Anthony Young, Jackson St. †1978 11 108Everson Walls, Grambling †1980 11 145Bill McGovern, Holy Cross †1984 11 102Claude Pettaway, Maine †1990 11 161Aeneas Williams, Southern U. †1990 11 173Rashean Mathis, Bethune-Cookman †2000 11 157Steve Dogmanits, Fairfield †2000 11 113Jon Ambrose, Saint Peter’s †2001 11 222Bob Mahr, Lafayette †1981 10 48Mike Genetti, Northeastern †1981 10 144George Schmitt, Delaware †1982 10 186Mike Armentrout, Missouri St. †1983 10 42Anthony Anderson, Grambling †1986 10 37Kevin Dent, Jackson St. †1986 10 192Eric Thompson, New Hampshire †1986 10 94Chris Demarest, Northeastern 1987 10 129Cedric Walker, SFA 1990 10 11Chris Helon, Boston U. †1993 10 42Scott Shields, Weber St. †1996 10 101Darren Sharper, William & Mary †1996 10 228Mark LeGree, Appalachian St. †2008 10 32Jason House, Southern U. †2009 10 230
Career InterceptionsPlayer, Team Years Int. Yards Yds/IRashean Mathis, Bethune-Cookman 1999-2002 *31 *682 22.0Dave Murphy, Holy Cross 1986-89 28 309 11.0Leigh Bodden, Duquesne 1999-2002 28 297 10.6Cedric Walker, SFA 1990-93 25 230 9.2Issiac Holt, Alcorn 1981-84 24 319 13.3Bill McGovern, Holy Cross 1981-84 24 168 7.0Darren Sharper, William & Mary 1993-96 24 488 20.3Corey Lynch, Appalachian St. 2003-07 24 405 16.9Mike Prior, Illinois St. 1981-84 23 211 9.2Kevin Smith, Rhode Island 1987-90 23 287 12.5William Carroll, Florida A&M 1989-92 23 328 14.3Adrion Smith, Missouri St. 1990-93 23 219 9.5Scott Shields, Weber St. 1995-98 23 278 12.1Dean Cain, Princeton 1985-87 22 203 9.2Derrick Harris, ETSU 1986-89 22 453 20.6Frank Robinson, Boise St. 1988-91 22 203 9.2Dave Roberts, Youngstown St. 1989-92 22 131 6.0Morgan Ryan, Montana St. 1990-93 22 245 11.1Chris Helon, Boston U. 1991-94 22 110 5.0Robert Taylor, Tennessee Tech 1993-96 22 267 12.1Mark LeGree, Appalachian St. 2007-10 22 179 8.1George Floyd, Eastern Ky. 1978-81 21 318 15.1Greg Greely, Nicholls St. 1981-84 21 218 10.4Chris Demarest, Northeastern 1984-87 21 255 12.1Mark Seals, Boston U. 1985-88 21 169 8.0Jeff Smith, Illinois St. 1985-88 21 152 7.2

All-Time Leaders on Defense (Since 2000) 46
Player, Team Years Int. Yards Yds/IKevin Dent, Jackson St. 1985-88 21 280 13.3Brian Randall, Delaware St. 1990-93 21 367 17.4Derek Carter, Maine 1994-97 21 301 14.3Paul Serie, Siena 1995-98 21 107 5.1Steve Dogmanits, Fairfield 1997-2000 21 231 11.0Tyrone Parsons, Alcorn 2000-03 21 270 12.9David Hyland, Morehead St. 2005-08 21 319 15.2Kejuan Riley, Alabama St. 2009-12 21 348 16.6Marcus Williams, North Dakota St. 2010-13 21 503 24.0
Annual Champions(Ranked on per-game average)Year Player, Team Cl. G Int. Int./G Yards1978 Anthony Young, Jackson St. Sr. 11 11 1.00 1081979 Neale Henderson, Southern U. Sr. 11 10 0.91 1511980 Everson Walls, Grambling Sr. 11 11 1.00 1451981 Mike Genetti, Northeastern So. 10 10 1.00 1441982 George Schmitt, Delaware Sr. 11 10 0.91 1861983 Mike Armentrout, Missouri St. Jr. 11 10 0.91 421984 Bill McGovern, Holy Cross Sr. 11 11 1.00 1021985 Mike Cassidy, Rhode Island Sr. 10 9 0.90 169
George Duarte, Northern Ariz. Jr. 10 9 0.90 1501986 Kevin Dent, Jackson St. So. 11 10 0.91 192
Eric Thompson, New Hampshire Sr. 11 10 0.91 94Anthony Anderson, Grambling Sr. 11 10 0.91 37
1987 Dean Cain, Princeton Sr. 10 12 *1.20 981988 Kevin Smith, Rhode Island So. 10 9 0.90 941989 Mike Babb, Weber St. Sr. 11 9 0.82 901990 Aeneas Williams, Southern U. Sr. 11 11 1.00 173
Claude Pettaway, Maine Sr. 11 11 1.00 1611991 Warren McIntire, Delaware Jr. 11 9 0.82 2081992 Dave Roberts, Youngstown St. Sr. 11 9 0.82 391993 Chris Helon, Boston U. Jr. 11 10 0.91 421994 Joseph Vaughn, CSUN Sr. 10 9 0.90 265
Brian Clark, Hofstra Jr. 10 9 0.90 561995 Picasso Nelson, Jackson St. Sr. 9 8 0.89 1011996 Shane Hurd, Canisius Jr. 7 7 1.00 1981997 Roderic Parson, Brown Sr. 8 8 1.00 931998 Ken Krapf, St. John’s (NY) Jr. 11 9 0.82 144
Eric Kenesie, Valparaiso Jr. 11 9 0.82 881999 Ryan Crawford, Davidson Jr. 11 8 0.73 632000 Steve Dogmanits, Fairfield Sr. 10 11 1.10 1132001 Jon Ambrose, Saint Peter’s Jr. 11 11 1.00 2222002 Rashean Mathis,
Bethune-CookmanSr. 13 *14 1.08 *455
2003 Brandon Martin, Butler Sr. 11 8 0.73 762004 Ahmad Treaudo, Southern U. Sr. 11 9 0.82 1662005 Jay McCareins, Princeton Jr. 10 9 0.90 2362006 Dre Dokes, UNI Sr. 11 7 0.64 116 2007 David Hyland, Morehead St. Jr. 9 8 0.89 57 2008 Mark LeGree, Appalachian St. So. 13 10 0.77 322009 Jason House, Southern U. Jr. 11 10 0.91 2302010 Moses Ellis, Prairie View Sr. 11 8 0.73 1122011 Bryce Robertson, Bucknell Sr. 11 13 1.18 1842012 Steven Godbolt, Tennessee St. So. 10 6 0.60 672013 Emory Polley, Brown Sr. 10 6 0.60 67 2014 Zach Adler, Marist Sr. 11 7 0.64 26
Jarrett Dieudonne, Wagner Sr. 11 7 0.64 2452015 Justin Grier, Morehead St. Sr. 11 9 0.82 1012016 Danny Johnson, Southern U. Jr. 11 7 0.64 99
PASSES DEFENDED *Record. †National champion or national leader in that category that season. ^Active player.
Single-Game Passes Defended(Since 2000)PD Player, Team (Opponent) Date9 Anthony Goodwin, Montana (Portland St.) Oct. 5, 20137 Kameron Scott, Morehead St. (Butler) Oct. 20, 20127 Ian Williams, Fordham (Sacred Heart) Nov. 29, 20147 Tyler Williams, Central Ark. (Nicholls St.) Nov. 12, 20166 Sam Young, Illinois St. (Youngstown St.) Oct. 7, 20006 Marcus Gray, Norfolk St. (Florida A&M) Oct. 26, 20026 James Young, Ga. Southern (Bethune-Cookman) Nov. 30, 20026 Robson Noel, Jacksonville (Dayton) Oct. 14, 2006 6 Lanny Kelly, Howard (Savannah St.) Oct. 1, 20116 Micah Pellerin, Hampton (N.C. Central) Oct. 22, 20116 Lyndell Gibson, Hampton (Norfolk St.) Oct. 13, 20126 Kendall James, Maine (Georgia St.) Nov. 10, 20126 DJ Bland, Eastern Ill. (San Diego St.) Aug. 31, 20136 Marcus Peters, Central Ark. (Sam Houston St.) Nov. 23, 20136 Jake Hoffman, Eastern Washington (Montana) Nov. 8, 20146 Matt Smalley, Lafayette (Bucknell) Nov. 1, 20146 Taylor Reynolds, James Madison (Stony Brook) Oct. 3, 20156 Dante Blackmon, Kennesaw St. (Duquesne) Sept. 24, 20166 Mike Viti, Western Ill. (Southern Ill.) Nov. 19, 2016
Season Passes DefendedPlayer, Team Year G PBU Int. TotalBobby Sippio, Western Ky. †2000 10 18 9 *27Tyler Williams, Central Ark. †2016 13 23 4 *27Leigh Bodden, Duquesne 2000 11 17 9 26Santino Hall, Texas Southern †2001 10 20 6 26Brandon Phillips, Morehead St. †2001 11 21 5 26Brian Sawyer, Hampton †2002 12 23 3 26Harry Sutton, Iona 2000 11 24 1 25Jon Ambrose, Saint Peter’s 2001 11 15 10 25Charles Byrd, Morehead St. †2003 11 23 2 25Gary Johnson, Villanova 2001 11 21 2 23Brandon Phillips, Morehead St. 2002 10 18 5 23Steven Williams, Harvard †2007 10 15 8 23Casey DeAndrade, New Hampshire 2013 14 20 3 23Jamal Agnew, San Diego †2014 11 19 4 23Yeremiah Bell, Eastern Ky. 2001 10 16 6 22LeVar Greene, Youngstown St. 2001 11 15 7 22Antwan Hill, Alabama St. 2002 12 12 10 22Scott Cunningham, Tennessee St. 2002 12 19 3 22Kenny Heatley, Bethune-Cookman 2003 12 21 1 22Allen Davis, Gardner-Webb †2004 11 17 5 22Calvin Bannister, Hampton †2004 11 19 3 22Moses Ellis, Prairie View †2010 11 14 8 22Marcus Williams, North Dakota St. †2011 15 15 7 22Ian Williams, Fordham 2014 14 18 4 22Steve Dogmanits, Fairfield 2000 10 10 11 21Don Milligan, Fairfield 2000 10 12 9 21Donald Wood, Towson 2000 11 19 2 21Benny Sapp, UNI 2003 13 19 2 21Ben Brown, Eastern Ill. 2004 11 16 5 21Corey Graham, New Hampshire 2004 13 17 4 21Matt Smyth, Dayton †2008 12 19 2 21Laron Scott, Ga. Southern 2011 14 18 3 21Travis Starks, Indiana St. 2014 14 17 4 21†National champion.

All-Time Leaders on Defense (Since 2000) 47
Season Passes Defended Per GamePlayer, Team Year G PBU Int. Total PD/GBobby Sippio, Western Ky. †2000 10 18 9 *27 *2.70Santino Hall, Texas Southern †2001 10 20 6 26 2.60Leigh Bodden, Duquesne 2000 11 17 9 26 2.36Brandon Phillips, Morehead St. 2001 11 21 5 26 2.36Brandon Phillips, Morehead St. †2002 10 18 5 23 2.30Steven Williams, Harvard †2007 10 15 8 23 2.30Harry Sutton, Iona 2000 11 24 1 25 2.27Jon Ambrose, Saint Peter’s 2001 11 15 10 25 2.27Charles Byrd, Morehead St. †2003 11 23 2 25 2.27Yeremiah Bell, Eastern Ky. 2001 10 16 6 22 2.20Brian Sawyer, Hampton 2002 12 23 3 26 2.17David Hyland, Morehead St. 2007 9 11 8 19 2.11Steve Dogmanits, Fairfield 2000 10 10 11 21 2.10Don Milligan, Fairfield 2000 10 12 9 21 2.10Jamal Agnew, San Diego †2014 11 19 4 23 2.09Tyler Williams, Central Ark. †2016 13 23 4 *27 2.08Calvin Bannister, Hampton †2004 11 19 3 22 2.00Allen Davis, Gardner-Webb †2004 11 17 5 22 2.00Jay McCareins, Princeton †2005 10 11 9 20 2.00Moses Ellis, Prairie View †2010 11 14 8 22 2.00Kyle Sebetic, Dayton †2012 9 15 3 18 2.00Mike Ribero, Dartmouth 2003 10 14 5 19 1.90Charles James, Charleston So. 2010 9 11 6 17 1.89Kenny Heatley, Bethune-Cookman 2003 12 21 1 22 1.83Ron St. Juste, Sacred Heart 2003 11 17 3 20 1.82Al Donaldson, Alabama A&M 2007 11 11 9 20 1.82
Career Passes DefendedPlayer, Team Year G PBU Int. TotalIan Williams, Fordham 2010-14 52 47 15 *62Casey DeAndrade, New Hampshire 2013-16 53 53 9 *62David Hyland, Morehead St. 2005-08 44 40 21 61Marcus Williams, North Dakota St. 2010-13 56 39 21 60Jamal Agnew, San Diego 2013-16 44 48 11 59C.J. Smith, North Dakota St. 2012-15 58 49 8 57J.D. Roussel, Sacred Heart 2011-14 45 38 17 55Corey Lynch, Appalachian St. 2003-07 56 28 24 52Billy Parker, William & Mary 2000-03 44 40 11 51Justin Woazeah, Appalachian St. 2004-07 55 41 8 51Chris Atkins, Stetson 2013-16 43 33 16 49Quinton Teal, Coastal Caro. 2003-06 44 31 17 48Josh Norman, Coastal Caro. 2008-11 46 35 13 48Mike Armiento, Colgate 2011-14 47 32 16 48Lorenzo Jerome, Saint Francis (PA) 2013-16 42 29 18 47Jesse Hendrix, Eastern Wash. 2002-05 47 41 5 46Alfred Phillips, Wagner 2004-07 36 30 16 46Anthony Walters, Delaware 2007-10 50 31 15 46Robert Shaw, Sam Houston St. 2009-12 52 39 7 46Mike Banks, Illinois St. 2011-14 50 39 7 46Taylor Reynolds, James Madison 2013-16 49 35 11 46Jarrett Dieudonne, Wagner 2011-14 46 31 14 45Kameron Scott, Morehead St. 2009-12 43 39 5 44Daxton Swanson, Sam Houston St. 2010-12 40 30 14 44Mario Williams, Gardner-Webb 2001-04 37 35 8 43K.J. Gerard, Northern Ariz. 2004-08 44 24 19 43Mark LeGree, Appalachian St. 2007-10 53 21 22 43
Career Passes Defended Per Game(Min. 25 passes defended; player must have concluded his career)Player, Team Years G PBU Int. Total PD/GBenny Sapp, UNI 2002-03 24 30 7 37 *1.54Domonique Johnson, Jackson St. 2007-08 24 27 10 37 *1.54Bobby Sippio, Western Ky. 2000-01 22 18 15 33 1.50Tyler Williams, Central Ark. 2015-16 24 29 7 36 1.50
Player, Team Years G PBU Int. Total PD/GDavid Hyland, Morehead St. 2005-08 44 40 21 61 1.39Jamal Agnew, San Diego 2013-16 44 48 11 59 1.34Alfred Phillips, Wagner 2004-07 36 30 16 46 1.28Tim Hayes, Wagner 2015-16 22 21 7 28 1.27Mario Williams, Gardner-Webb 2001-04 35 35 8 43 1.23J.D. Roussel, Sacred Heart 2011-14 45 38 17 55 1.22Steven Williams, Harvard 2004-07 30 24 12 36 1.20Ian Williams, Fordham 2010-14 52 47 15 *62 1.19Michael Blake, Holy Cross 2000-01 21 20 5 25 1.19Casey DeAndrade, New Hampshire 2013-16 53 53 9 *62 1.17Daquan Minter, Saint Francis (PA) 2012-15 36 29 13 42 1.17Billy Parker, William & Mary 2000-03 44 40 11 51 1.16Chris Atkins, Stetson 2013-16 43 33 16 49 1.14Brendan Langley, Lamar University 2015-16 22 18 7 25 1.14Lorenzo Jerome, Saint Francis (PA) 2013-16 42 29 18 47 1.12Daxton Swanson, Sam Houston St. 2010-12 40 30 14 44 1.10Michael Ford, Duquesne 2003-05 31 21 13 34 1.10Quinton Teal, Coastal Caro. 2003-06 44 31 17 48 1.09Alex Avant, Mercer 2012-15 33 30 6 36 1.09Marcus Williams, North Dakota St. 2010-13 56 39 21 60 1.07Ettian Scott, Georgetown 2012-15 36 32 6 38 1.06
Annual ChampionsYear Player, Team Cl. G PBU Int. Total PD/G2000 Bobby Sippio, Western Ky. So. 10 18 9 *27 *2.702001 Santino Hall, Texas Southern So. 10 20 6 26 2.602002 Brandon Phillips, Morehead St. Sr. 10 18 5 23 2.302003 Charles Byrd, Morehead St. Sr. 11 23 2 25 2.272004 Calvin Bannister, Hampton So. 11 19 3 22 2.00
Allen Davis, Gardner-Webb Sr. 11 17 5 22 2.002005 Jay McCareins, Princeton Sr. 10 11 9 20 2.002006 Tim Strickland, Princeton Sr. 10 14 3 17 1.702007 Steven Williams, Harvard Sr. 10 15 8 23 2.302008 Matt Smyth, Dayton Jr. 12 19 2 21 1.752009 Kelvin Colbert, Fordham Sr. 11 14 4 18 1.642010 Moses Ellis, Prairie View Sr. 11 14 8 22 2.002011 Bryce Robertson, Bucknell Sr. 11 6 13 19 1.73
Micah Pellerin, Hampton Sr. 11 15 4 19 1.732012 Kyle Sebetic, Dayton Jr. 9 15 3 18 2.002013 D.J. Monroe, Harvard Sr. 10 16 2 18 1.802014 Jamal Agnew, San Diego So. 11 19 4 23 2.092015 Ettian Scott, Georgetown Sr. 11 17 2 19 1.732016 Tyler Williams, Central Ark. Sr. 13 23 4 *27 2.08

All-Time Leaders on Special Teams 48
ALL-TIME LEADERS ON SPECIAL TEAMS
PUNTING*Record. †National champion or national leader in that category that season.
Season Average(Qualifiers for Championship)Player, Team Year Punts Yards Yds/PDavid Harrington, Idaho St. †2011 56 2,727 *48.70Mark Gould, Northern Ariz. †2002 62 2,987 48.18Mike Scifres, Western Ill. 2002 53 2,545 48.02Paul Ernster, Northern Ariz. †2004 55 2,631 47.84Miles Bergner, South Dakota †2016 68 3,230 47.50Brent Barth, VMI 2002 64 3,032 47.38Harold Alexander, Appalachian St. †1991 64 3,009 47.02Chad Stanley, SFA †1998 58 2,703 46.60Kyle Loomis, Portland St. †2013 56 2,603 46.48Andy Wilder, Northern Ariz. †2012 61 2,826 46.33Eddie Johnson, Idaho St. †2001 49 2,270 46.33Ryan Hawkins, Northern Ariz. †2015 52 2,406 46.27Eddie Johnson, Idaho St. 2002 51 2,357 46.22Jonathan Plisco, Old Dominion 2011 51 2,352 46.12David Simonhoff, Southeast Mo. St. 2004 69 3,174 46.00Kyle Loomis, Portland St. †2014 75 3,450 46.00Terry Belden, Northern Ariz. †1993 59 2,712 45.97Patrick Murray, Fordham 2012 52 2,390 45.96Chris McDonald, Texas St. †2007 49 2,250 45.92Sam Martin, Appalachian St. 2012 60 2,755 45.92Case de Bruijn, Idaho St. †1981 42 1,928 45.90Wesley Taylor, Florida A&M †2005 59 2,707 45.88Colin Godfrey, Tennessee St. †1990 57 2,614 45.86Ben LeCompte, North Dakota St. 2015 62 2,843 45.85Barry Cantrell, Fordham †1997 65 2,980 45.85
Career Average(Minimum 150 punts; player must have concluded his career)Player, Team Years Punts Yards Long Yds/PJonathan Plisco, Old Dominion 2009-12 184 8,298 61 *45.1Mark Gould, Northern Ariz. 2000-03 211 9,443 78 44.8Cory Carter, Texas Southern 2012-15 168 7,511 86 44.7Ben LeCompte, North Dakota St. 2012-15 228 10,158 75 44.6Pumpy Tudors, Chattanooga 1989-91 181 8,041 79 44.4David Simonhoff, Southeast Mo. St. 2003-06 237 10,402 75 43.9 Jake Miller. Eastern Wash. 2011-14 182 7,987 74 43.8Tate Lewis, Southern Utah 2011,
14-16264 11,538 81 43.7
Case de Bruijn, Idaho St. 1978-81 256 11,184 76 43.7Mike Scifres, Western Ill. 1999-02 203 8,842 89 43.6Terry Belden, Northern Ariz. 1990-93 225 9,760 76 43.4Chad Stanley, SFA 1996-98 178 7,709 79 43.3Bobby Wenzig, Alabama St. 2011-13 209 9,013 67 43.1Patrick Dolan, Nicholls St. 2007-10 165 7,101 74 43.0Brock Miller, Southern Utah 2010-13 164 7,055 72 43.0George Cimadevilla, ETSU 1983-86 225 9,676 72 43.0Harold Alexander, Appalachian St. 1989-92 259 11,100 78 42.9Miles Bergner, South Dakota 2013-16 262 11,223 69 42.8Wesley Taylor, Florida A&M 2004-07 161 6,893 82 42.8Chris Fraser, Cornell 2013-16 215 9,203 72 42.8Ken Hinsley, Western Caro. 1995-98 199 8,512 85 42.8Lachian Edwards, Sam Houston St. 2013-15 184 7,870 70 42.8Patrick Murray, Fordham 2009-12 181 7,740 73 42.8Jahmal Blanchard, Hampton 2006-09 216 9,216 79 42.7
Player, Team Years Punts Yards Long Yds/PScott Ravanesi, Southern Ill. 2006-09 191 8,129 83 42.6
Annual ChampionsYear Player, Team Cl. Punts Yards Yds/P1978 Nick Pavich, Nevada So. 47 1,939 41.31979 Stuart Dodds, Montana St. Sr. 59 2,689 45.61980 Case de Bruijn, Idaho St. Jr. 67 2,945 44.01981 Case de Bruijn, Idaho St. Sr. 42 1,928 45.91982 John Christopher, Morehead St. Sr. 93 4,084 43.91983 Pat Velarde, Marshall Sr. 64 2,852 44.61984 Steve Kornegay, Western Caro. Jr. 49 2,127 43.41985 Mike Rice, Montana Jr. 62 2,771 44.71986 Greg Davis, The Citadel Sr. 61 2,723 44.61987 Eric Stein, Eastern Wash. Sr. 74 3,193 43.21988 Mike McCabe, Illinois St. Sr. 69 3,042 44.11989 Pumpy Tudors, Chattanooga So. 65 2,817 43.31990 Colin Godfrey, Tennessee St. So. 57 2,614 45.91991 Harold Alexander, Appalachian St. Jr. 64 3,009 47.01992 Harold Alexander, Appalachian St. Sr. 55 2,445 44.51993 Terry Belden, Northern Ariz. Sr. 59 2,712 46.01994 Scott Holmes, Samford Jr. 49 2,099 42.81995 Kevin O’Leary, Northern Ariz. Sr. 44 1,881 42.81996 Mark Gagliano, Southern Ill. Sr. 54 2,432 45.01997 Barry Cantrell, Fordham Sr. 65 2,980 45.81998 Chad Stanley, SFA Sr. 58 2,703 46.61999 Matthew Peot, Montana St. Jr. 48 2,195 45.72000 David Beckford, Alabama St. So. 48 2,121 44.22001 Eddie Johnson, Idaho St. Jr. 49 2,270 46.32002 Mark Gould, Northern Ariz. Jr. 62 2,987 48.22003 Graham Whitlock, Gardner-Webb Jr. 57 2,593 45.52004 Paul Ernster, Northern Ariz. Sr. 55 2,631 47.82005 Wesley Taylor, Florida A&M So. 59 2,707 45.92006 Breck Ackley, Southern U. Sr. 49 2,228 45.52007 Chris McDonald, Texas St. Sr. 49 2,250 45.92008 Brett Arnold, Massachusetts Sr. 46 2,080 45.22009 Jonathan Plisco, Old Dominion Fr. 62 2,780 44.82010 David Harrington, Idaho St. Jr. 69 3,060 44.32011 David Harrington, Idaho St. Sr. 56 2,727 *48.72012 Andy Wilder, Northern Ariz. Jr. 61 2,826 46.32013 Kyle Loomis, Portland St. Jr. 56 2,603 46.52014 Kyle Loomis, Portland St. Sr. 75 3,450 46.02015 Ryan Hawkins, Northern Ariz. Sr. 52 2,406 46.32016 Miles Bergner, South Dakota Sr. 68 3,230 47.5
PUNT RETURNSSeason Average(Minimum 1.2 returns per game and qualifiers for champion-ship)Player, Team Year PR Yards Yds/RCurtis DeLoatch, N.C. A&T †2001 20 530 *26.5Antonio Hamilton, South Carolina St. †2014 15 384 25.6Derrick Harris, Sam Houston St. †2006 15 366 24.4 Terrence McGee, Northwestern St. †2000 18 427 23.7Khris Gardin, N.C. A&T †2015 32 *740 23.1Tim Egerton, Delaware St. †1988 16 368 23.0Dontrell Johnson, Murray St. †2010 15 342 22.8Ryan Priest, Lafayette †1982 12 271 22.6Craig Hodge, Tennessee St. †1987 19 398 21.0Chris Berry, Morehead St. †1997 13 273 21.0Nate Hughes, Alcorn 2006 22 460 20.9

All-Time Leaders on Special Teams 49
Player, Team Year PR Yards Yds/RReggie Barlow, Alabama St. †1995 12 249 20.8Bashir Levingston, Eastern Wash. †1998 16 333 20.8John Armstrong, Richmond †1985 19 391 20.6KaRon Coleman, SFA †1999 17 348 20.5Craig Agee, Jacksonville St. †2004 18 369 20.5Tim Toone, Weber St. †2009 19 378 19.9Mark Orlando, Towson †1994 19 377 19.8Austin Shanks, Northern Ariz. †2012 17 337 19.8Willie Ware, Mississippi Val. †1984 19 374 19.7LeRoy Vann, Florida A&M 2009 29 569 19.6Kiare Thompson, Grambling 2009 21 407 19.4Buck Phillips, Western Ill. 1994 24 464 19.3Andre Roberts, The Citadel †2008 24 461 19.2James Norris, Western Ill. †2003 15 287 19.1Michael Jones, N.C. Central 2014 15 287 19.1Junior Adams, Montana St. 2001 20 381 19.1
Career Average(Minimum 1.2 returns per game; minimum 30 returns; player must have concluded his career)Player, Team Years PR Yards Yds/RLeRoy Vann, Florida A&M 2006-09 59 1,042 *17.7Terrence McGee, Northwestern St. 1999-2002 56 972 17.4Kiare Thompson, Grambling 2007-10 59 1,001 17.0Willie Ware, Mississippi Val. 1982-85 61 1,003 16.4Buck Phillips, Western Ill. 1994-95 40 656 16.4Jeremy Gilchrist, Hampton 2005-08 50 818 16.4Tim Egerton, Delaware St. 1986-89 59 951 16.1Kiare Thompson, Grambling 2007-10 79 1,270 16.1Mark Orlando, Towson 1991-94 41 644 15.7Joseph Jefferson, Western Ky. 1998-2001 53 809 15.3Marc Mariani, Montana 2006-09 83 1,253 15.1Emery Beckles, Idaho St. 2002-03 60 903 15.1Corey Smith, Montana St. 2000-03 63 938 14.9Toby Zeigler, Northwestern St. 2002-05 93 1,363 14.7CJ Estelle, UT Martin 2010-11 33 478 14.5John Armstrong, Richmond 1984-85 31 449 14.5Joey Jamison, Texas Southern 1997-99 88 1,269 14.4Darrick Brown, Maine 1995-98 56 807 14.4Marquay McDaniel, Hampton 2002-05 116 *1,668 14.4Delvin Joyce, James Madison 1997-2000 104 1,488 14.3James Norris, Western Ill. 2001-04 33 467 14.2Ricky Pearsall, Northern Ariz. 1994-97 39 546 14.0Andy Erickson, Texas St. 2011-12 55 767 13.9Undre Williams, Florida A&M 1995-97 31 429 13.8
Annual ChampionsYear Player, Team Cl. PR Yards Yds/R1978 Ray Smith, Northern Ariz. Sr. 13 181 13.91979 Joseph Markus, UConn Fr. 17 219 12.91980 Trumaine Johnson, Grambling So. ††13 226 17.41981 Barney Bussey, South Carolina St. So. 14 255 18.21982 Ryan Priest, Lafayette Fr. 12 271 22.61983 Joe Fuller, UNI So. 22 344 15.61984 Willie Ware, Mississippi Val. Jr. 19 374 19.71985 John Armstrong, Richmond Sr. 19 391 20.61986 Chris Darrington, Weber St. Sr. 16 290 18.11987 Craig Hodge, Tennessee St. Sr. 19 398 21.01988 Tim Egerton, Delaware St. Jr. 16 368 23.01989 Henry Richard, La.-Monroe Jr. 15 258 17.21990 Gary Harrell, Howard Fr. 26 417 16.01991 Ashley Ambrose, Mississippi Val. Sr. 28 514 18.41992 Quincy Miller, South Carolina St. Jr. 17 311 18.31993 Ray Marshall, Saint Peter’s Jr. 10 171 17.11994 Mark Orlando, Towson Sr. 19 377 19.81995 Reggie Barlow, Alabama St. Sr. 12 249 20.8
Year Player, Team Cl. PR Yards Yds/R1996 Ricky Pearsall, Northern Ariz. Jr. 29 490 16.91997 Chris Berry, Morehead St. Sr. 13 273 21.01998 Bashir Levingston, Eastern Wash. Sr. 16 333 20.81999 KaRon Coleman, SFA Sr. 17 348 20.52000 Terrence McGee, Northwestern St. So. 18 427 23.72001 Curtis DeLoatch, N.C. A&T So. 20 530 *26.52002 Zuriel Smith, Hampton Sr. 27 500 18.52003 James Norris, Western Ill. Jr. 15 287 19.12004 Craig Agee, Jacksonville St. So. 18 369 20.52005 Nick Feldman, Morehead St. So. 27 512 18.92006 Derrick Harris, Sam Houston St. Sr. 15 366 24.42007 Jeremy Gilchrist, Hampton Jr. 20 380 19.02008 Andre Roberts, The Citadel Jr. 24 461 19.22009 Tim Toone, Weber St. Sr. 19 378 19.92010 Dontrell Johnson, Murray St. Jr. 15 342 22.82011 CJ Estelle, UT Martin Sr. 16 283 17.72012 Austin Shanks, Northern Ariz. Sr. 17 337 19.82013 Tavoris Doss, Alcorn Sr. 17 274 16.12014 Antonio Hamilton, South Carolina St. Jr. 15 384 25.62015 Khris Gardin, N.C. A&T So. 32 *740 23.12016 Khalid Thomas, Alabama St. Sr. 21 366 17.4††Declared champion; with one more return (making 1.3 per game) for zero yards, still would have highest average.
KICKOFF RETURNS*Record. †National champion or national leader in that category that season.
Season Average(Minimum 1.2 returns per game and qualifiers for champion-ship)Player, Team Year KR Yards Yds/RDavid Fraterrigo, Canisius †1993 13 485 *37.3Brian Bratton, Furman †2001 14 521 37.2Kevin Teel, Hampton †2008 15 553 36.9Kerry Hayes, Western Caro. 1993 16 584 36.5Cordell Roane, Richmond †1999 13 470 36.2Jerodis Williams, Furman †2012 16 574 35.9Jerome Mathis, Hampton †2004 25 888 35.5Xavier Roberson, Southeastern La. †2013 26 915 35.2Ulysses Banks, Alabama A&M †2006 13 454 34.9Jorrian Washington, Hampton 2012 12 419 34.9Jarrett Morgan, Valparaiso †2014 12 419 34.9Larrone Moore, Delaware St. †2010 15 522 34.8Craig Richardson, Eastern Wash. †1984 21 729 34.7Ryan Zimpleman, Butler †1998 28 972 34.7Randy Moss, Marshall †1996 14 484 34.6Avion Black, Tennessee St. 1999 23 786 34.2Lamont Brightful, Eastern Wash. 1999 26 882 33.9Darius Hammond, Charleston So. †2016 15 506 33.7Jeremy Caldwell, Eastern Ky. 2010 14 472 33.7Kevin Fogg, Liberty †2011 23 771 33.5Errin Hatwood, St. John’s (NY) †1994 12 401 33.4Marcus Durgin, Samford †1992 15 499 33.3JT Rogan, San Diego †2007 27 897 33.2Corey Smith, Montana St. †2003 20 664 33.2Richard Holland, VMI †2000 19 628 33.1
Career Average(Minimum 1.2 returns per game; minimum 30 returns; player must have concluded his career)Player, Team Years KR Yards Yds/RXavier Roberson, Southeastern La. 2012-15 65 2,106 *32.4Scotty McGee, James Madison 2006-09 71 2,166 30.5
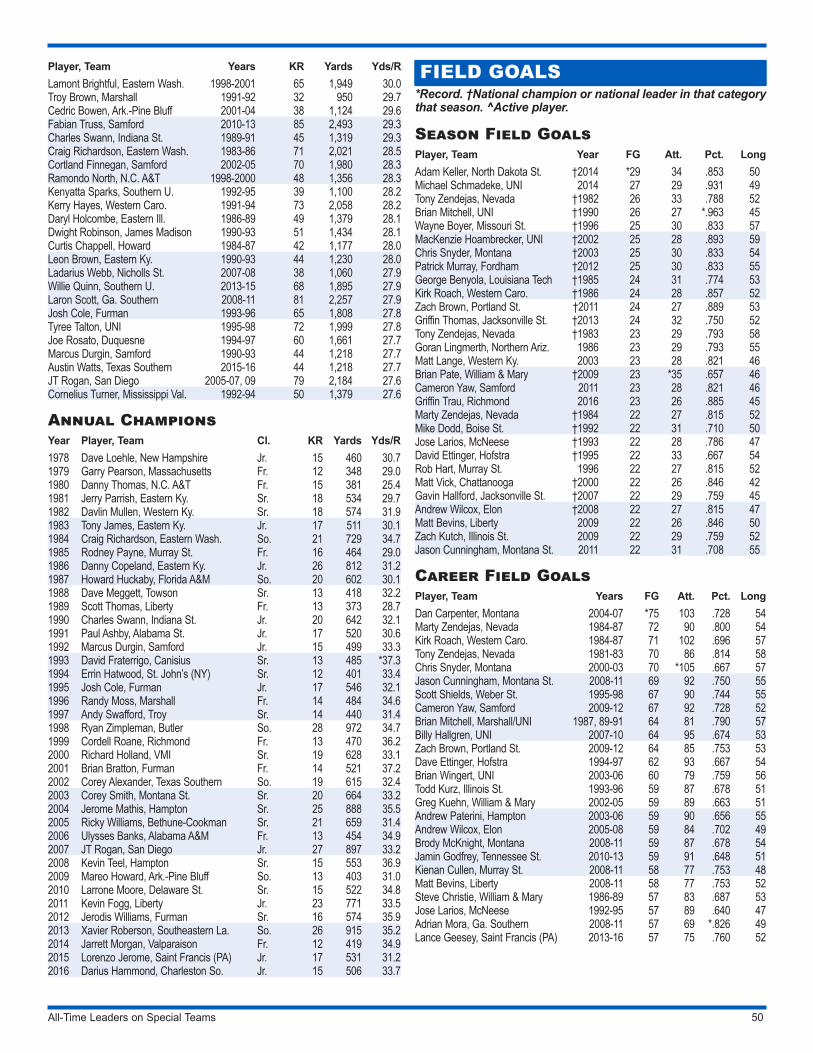
All-Time Leaders on Special Teams 50
Player, Team Years KR Yards Yds/RLamont Brightful, Eastern Wash. 1998-2001 65 1,949 30.0Troy Brown, Marshall 1991-92 32 950 29.7Cedric Bowen, Ark.-Pine Bluff 2001-04 38 1,124 29.6Fabian Truss, Samford 2010-13 85 2,493 29.3Charles Swann, Indiana St. 1989-91 45 1,319 29.3Craig Richardson, Eastern Wash. 1983-86 71 2,021 28.5Cortland Finnegan, Samford 2002-05 70 1,980 28.3Ramondo North, N.C. A&T 1998-2000 48 1,356 28.3Kenyatta Sparks, Southern U. 1992-95 39 1,100 28.2Kerry Hayes, Western Caro. 1991-94 73 2,058 28.2Daryl Holcombe, Eastern Ill. 1986-89 49 1,379 28.1Dwight Robinson, James Madison 1990-93 51 1,434 28.1Curtis Chappell, Howard 1984-87 42 1,177 28.0Leon Brown, Eastern Ky. 1990-93 44 1,230 28.0Ladarius Webb, Nicholls St. 2007-08 38 1,060 27.9Willie Quinn, Southern U. 2013-15 68 1,895 27.9Laron Scott, Ga. Southern 2008-11 81 2,257 27.9Josh Cole, Furman 1993-96 65 1,808 27.8Tyree Talton, UNI 1995-98 72 1,999 27.8Joe Rosato, Duquesne 1994-97 60 1,661 27.7Marcus Durgin, Samford 1990-93 44 1,218 27.7Austin Watts, Texas Southern 2015-16 44 1,218 27.7JT Rogan, San Diego 2005-07, 09 79 2,184 27.6Cornelius Turner, Mississippi Val. 1992-94 50 1,379 27.6
Annual ChampionsYear Player, Team Cl. KR Yards Yds/R1978 Dave Loehle, New Hampshire Jr. 15 460 30.71979 Garry Pearson, Massachusetts Fr. 12 348 29.01980 Danny Thomas, N.C. A&T Fr. 15 381 25.41981 Jerry Parrish, Eastern Ky. Sr. 18 534 29.71982 Davlin Mullen, Western Ky. Sr. 18 574 31.91983 Tony James, Eastern Ky. Jr. 17 511 30.11984 Craig Richardson, Eastern Wash. So. 21 729 34.71985 Rodney Payne, Murray St. Fr. 16 464 29.01986 Danny Copeland, Eastern Ky. Jr. 26 812 31.21987 Howard Huckaby, Florida A&M So. 20 602 30.11988 Dave Meggett, Towson Sr. 13 418 32.21989 Scott Thomas, Liberty Fr. 13 373 28.71990 Charles Swann, Indiana St. Jr. 20 642 32.11991 Paul Ashby, Alabama St. Jr. 17 520 30.61992 Marcus Durgin, Samford Jr. 15 499 33.31993 David Fraterrigo, Canisius Sr. 13 485 *37.31994 Errin Hatwood, St. John’s (NY) Sr. 12 401 33.41995 Josh Cole, Furman Jr. 17 546 32.11996 Randy Moss, Marshall Fr. 14 484 34.61997 Andy Swafford, Troy Sr. 14 440 31.41998 Ryan Zimpleman, Butler So. 28 972 34.71999 Cordell Roane, Richmond Fr. 13 470 36.22000 Richard Holland, VMI Sr. 19 628 33.12001 Brian Bratton, Furman Fr. 14 521 37.22002 Corey Alexander, Texas Southern So. 19 615 32.42003 Corey Smith, Montana St. Sr. 20 664 33.22004 Jerome Mathis, Hampton Sr. 25 888 35.52005 Ricky Williams, Bethune-Cookman Sr. 21 659 31.42006 Ulysses Banks, Alabama A&M Fr. 13 454 34.92007 JT Rogan, San Diego Jr. 27 897 33.22008 Kevin Teel, Hampton Sr. 15 553 36.92009 Mareo Howard, Ark.-Pine Bluff So. 13 403 31.02010 Larrone Moore, Delaware St. Sr. 15 522 34.82011 Kevin Fogg, Liberty Jr. 23 771 33.52012 Jerodis Williams, Furman Sr. 16 574 35.92013 Xavier Roberson, Southeastern La. So. 26 915 35.22014 Jarrett Morgan, Valparaison Fr. 12 419 34.92015 Lorenzo Jerome, Saint Francis (PA) Jr. 17 531 31.22016 Darius Hammond, Charleston So. Jr. 15 506 33.7
FIELD GOALS*Record. †National champion or national leader in that category that season. ^Active player.
Season Field GoalsPlayer, Team Year FG Att. Pct. LongAdam Keller, North Dakota St. †2014 *29 34 .853 50Michael Schmadeke, UNI 2014 27 29 .931 49Tony Zendejas, Nevada †1982 26 33 .788 52Brian Mitchell, UNI †1990 26 27 *.963 45Wayne Boyer, Missouri St. †1996 25 30 .833 57MacKenzie Hoambrecker, UNI †2002 25 28 .893 59Chris Snyder, Montana †2003 25 30 .833 54Patrick Murray, Fordham †2012 25 30 .833 55George Benyola, Louisiana Tech †1985 24 31 .774 53Kirk Roach, Western Caro. †1986 24 28 .857 52Zach Brown, Portland St. †2011 24 27 .889 53Griffin Thomas, Jacksonville St. †2013 24 32 .750 52Tony Zendejas, Nevada †1983 23 29 .793 58Goran Lingmerth, Northern Ariz. 1986 23 29 .793 55Matt Lange, Western Ky. 2003 23 28 .821 46Brian Pate, William & Mary †2009 23 *35 .657 46Cameron Yaw, Samford 2011 23 28 .821 46Griffin Trau, Richmond 2016 23 26 .885 45Marty Zendejas, Nevada †1984 22 27 .815 52Mike Dodd, Boise St. †1992 22 31 .710 50Jose Larios, McNeese †1993 22 28 .786 47David Ettinger, Hofstra †1995 22 33 .667 54Rob Hart, Murray St. 1996 22 27 .815 52Matt Vick, Chattanooga †2000 22 26 .846 42Gavin Hallford, Jacksonville St. †2007 22 29 .759 45Andrew Wilcox, Elon †2008 22 27 .815 47Matt Bevins, Liberty 2009 22 26 .846 50Zach Kutch, Illinois St. 2009 22 29 .759 52Jason Cunningham, Montana St. 2011 22 31 .708 55
Career Field GoalsPlayer, Team Years FG Att. Pct. LongDan Carpenter, Montana 2004-07 *75 103 .728 54Marty Zendejas, Nevada 1984-87 72 90 .800 54Kirk Roach, Western Caro. 1984-87 71 102 .696 57Tony Zendejas, Nevada 1981-83 70 86 .814 58Chris Snyder, Montana 2000-03 70 *105 .667 57Jason Cunningham, Montana St. 2008-11 69 92 .750 55Scott Shields, Weber St. 1995-98 67 90 .744 55Cameron Yaw, Samford 2009-12 67 92 .728 52Brian Mitchell, Marshall/UNI 1987, 89-91 64 81 .790 57Billy Hallgren, UNI 2007-10 64 95 .674 53Zach Brown, Portland St. 2009-12 64 85 .753 53Dave Ettinger, Hofstra 1994-97 62 93 .667 54Brian Wingert, UNI 2003-06 60 79 .759 56Todd Kurz, Illinois St. 1993-96 59 87 .678 51Greg Kuehn, William & Mary 2002-05 59 89 .663 51Andrew Paterini, Hampton 2003-06 59 90 .656 55Andrew Wilcox, Elon 2005-08 59 84 .702 49Brody McKnight, Montana 2008-11 59 87 .678 54Jamin Godfrey, Tennessee St. 2010-13 59 91 .648 51Kienan Cullen, Murray St. 2008-11 58 77 .753 48Matt Bevins, Liberty 2008-11 58 77 .753 52Steve Christie, William & Mary 1986-89 57 83 .687 53Jose Larios, McNeese 1992-95 57 89 .640 47Adrian Mora, Ga. Southern 2008-11 57 69 *.826 49Lance Geesey, Saint Francis (PA) 2013-16 57 75 .760 52

All-Time Leaders on Special Teams 51
Annual Champions(Ranked on per-game average)Year Player, Team Cl. Total PG Pct.1978 Tom Sarette, Boise St. Sr. 12-20 1.2 .6001979 Wilfredo Rosales, Alcorn Jr. 13-20 1.3 .650
Sandro Vitiello, Massachusetts Sr. 13-22 1.3 .5911980 Scott Norwood, James Madison Jr. 15-21 1.5 .7141981 Tony Zendejas, Nevada So. 21-24 1.9 .8751982 Tony Zendejas, Nevada Jr. 26-33 *2.4 .7881983 Tony Zendejas, Nevada Sr. 23-29 2.1 .7931984 Marty Zendejas, Nevada Fr. 22-27 2.0 .8151985 George Benyola, Louisiana Tech So. 24-31 2.2 .7741986 Kirk Roach, Western Caro. Jr. 24-28 2.2 .8571987 Micky Penaflor, Northern Ariz. So. 19-27 1.9 .7041988 Chris Lutz, Princeton So. 19-24 1.9 .7921989 Steve Christie, William & Mary Sr. 20-29 1.8 .6901990 Brian Mitchell, UNI So. 26-27 *2.4 *.9631991 Brian Mitchell, UNI Jr. 19-24 1.7 .7921992 Mike Dodd, Boise St. Sr. 22-31 2.0 .7101993 Jose Larios, McNeese So. 22-28 2.0 .7861994 Andy Glockner, Penn Sr. 14-20 1.6 .7001995 David Ettinger, Hofstra So. 22-33 2.0 .6671996 Wayne Boyer, Missouri St. Sr. 25-30 2.3 .8331997 Travis Brawner, Missouri St. So. 21-28 1.9 .750
Year Player, Team Cl. Total PG Pct.1998 Mike Goldstein, Northern Ariz. Sr, 16-23 1.5 .696
Scott Shields, Weber St. Sr. 16-23 1.5 .696Bill Gramatica, South Fla. So. 16-24 1.5 .667Chad Johnson, Hofstra So. 16-27 1.5 .593Joe Lopez, Western Ill. So. 16-28 1.5 .571
1999 Brett Sterba, William & Mary Sr. 18-23 1.6 .7832000 Matt Vick, Chattanooga Sr. 22-26 2.00 .8462001 Brian Morgan, Grambling Fr. 18-25 1.64 .7202002 MacKenzie Hoambrecker, UNI Sr. 25-28 2.30 .8932003 Chris Snyder, Montana Sr. 25-30 1.92 .8332004 Joe Johnson, Weber St. Jr. 17-22 1.55 .7732005 Steve Morgan, Brown So. 18-23 1.80 .7832006 Dan Carpenter, Montana Jr. 24-30 1.71 .8002007 Gavin Hallford, Jacksonville St. Jr. 22-29 2.00 .7592008 Andrew Wilcox, Elon Sr. 22-27 1.83 .8152009 Matt Bevins, Liberty So. 22-26 2.00 .846
Zach Kutch, Illinois St. Sr. 22-29 2.00 .7592010 Matt Bevins, Liberty Jr. 20-27 1.82 .7412011 Zach Brown, Portland St. Jr. 24-27 2.18 .8892012 Patrick Murray, Fordham Sr. 25-30 2.27 .8332013 Tyler Sievertsen, UNI Sr. 21-27 1.75 .7782014 Michael Schmadeke, UNI Jr. 27-29 1.93 .9312015 Anthony Pistelli, Samford Sr. 20-23 1.82 .8702016 Connor Mitchell, Murray St. Sr. 20-27 1.82 .741
BLOCKED KICKS RECORDSSpecial Note About Blocked-Kick Records:The blocked-kick records include players from the beginning of FCS play in 1978.Even though the other defensive statistics and records began in 2000, blocked-kick records are compiled by most institutions, and those records are more reliable than tackles, assists, tackles for loss, pass sacks, passes defended and forced fumbles.
BLOCKED PUNTS*Record. †National champion or national leader in that category that season.
Single-Game Blocked PuntsBP Player, Team (Opponent) Date3 Ben Duhon, McNeese (Ark.-Monticello) Sept. 29, 19983 Brandon Tinson, Colgate (Towson) Sept. 30, 20002 Bryan Cox, Western Ill. (Montana St.) Sept. 15, 19902 Demetrius Pope, Sam Houston St. (Tex. A&M-Kingsville) Sept. 14, 19962 Fabian Johnson, Sam Houston St. (Troy) Oct. 11, 19972 Michael Adams, SFA (Central Okla.) Aug. 30, 20002 Ryan Crawford, Davidson (Sewanee) Sept. 16, 20002 DeJuan Davis, Sam Houston St. (Mississippi Val.) Sept. 29, 20012 Robert Herron, Sam Houston St. (Ouachita Baptist) Sept. 4, 20042 Taurean Rhetta, Jacksonville St. (Southeast Mo. St.) Sept. 24, 20052 Tim Camp, Ga. Southern (Morehead St.) Nov. 12, 20052 Taurean Rhetta, Jacksonville St. (Murray St.) Sept. 29, 20072 Anthony D’Astice, Western Ill. (Missouri St.) Oct. 13, 20092 Frantz Placide, Wagner (Albany [NY]) Nov. 21, 20092 Robert Dim, Sacred Heart (Chowan) Sept. 21, 20132 Demetrius Carter, Southern U. (Alcorn) Oct. 26, 20132 Mason Ceasar, Southern U. (Alcorn) Dec. 6, 20142 Jarrett Morgan, Valparaiso (Mo. Baptist) Oct. 11, 20142 Mike Armiento, Colgate (Bucknell) Nov. 22, 2014
Season Blocked PuntsPlayer, Team Year BPDomonic Jones, The Citadel †2011 *5Tevin Richard, South Carolina St. †2015 *5
Player, Team Year BPRyan Crawford, Davidson †2000 4Robert Herron, Sam Houston St. †2004 4Taurean Rhetta, Jacksonville St. †2007 4Frantz Placide, Wagner †2009 4Nick Brewer, Prairie View †2015 4Trey Woods, Sam Houston St. †1993 3Ben Duhon, McNeese †1998 3Jamin Elliott, Delaware †1998 3Lamont Watson, Delaware †1998 3Carlos Dallis, UNI 2000 3Brandon Tinson, Colgate 2000 3Germaine Bennett, Delaware †2002 3DeJuan Davis, Sam Houston St. †2002 3Ben Endress, Jacksonville St. †2013 3Hunter Kiselick, Georgetown †2016 3
Career Blocked PuntsPlayer, Team Years BPTaurean Rhetta, Jacksonville St. 2004-07 *9Trey Woods, Sam Houston St. 1992-95 8Ryan Crawford, Davidson 1997-2000 7Frantz Placide, Wagner 2007-10 7Mike Pierce, McNeese 1987-90 6Domonic Jones, The Citadel 2010-12 6Lamont Watson, Delaware 1997-98 5Tevin Richard, South Carolina St. 2013-15 5
BLOCKED FIELD GOALS*Record. †National champion or national leader in that category that season. ^Active player.
Single-Game Blocked Field GoalsBFG Player, Team (Opponent) Date2 Rod Gulky, McNeese (Henderson St.) Aug. 30, 20032 Chris Mooney, Delaware (Massachusetts) Nov. 15, 2003

All-Time Leaders on Special Teams 52
BFG Player, Team (Opponent) Date2 Kambrell McGee, Hampton (Western Ill.) Aug. 29, 20132 Victor Dean, Portland St. (Humboldt St.) Sept. 14, 20132 Wayne Pettus, Richmond (Liberty) Sept. 21, 20132 Devin Borders, Eastern Ky. (Eastern Ill.) Sept. 28, 20132 DeAntrey Loche, Sam Houston St. (Northwestern St.) Oct. 26, 20132 Spencer Cummings, North Dakota (Robert Morris) Sept. 6, 20142 James Rentz, Sacred Heart (Bryant) Nov. 15, 2014
Season Blocked Field GoalsPlayer, Team Year BFGLeonard Smith, McNeese †1981 *4Mark Weivoda, Idaho St. †2001 *4Clayton Smith, Dartmouth †2004 *4Hunter Kiselick, Georgetown †2016 *4Bryan Cox, Western Ill. †1990 3Ryan Crawford, Davidson †1999 3Brent Browner, UNI 2001 3Tom Parks, Delaware †2005 3Corey Lynch, Appalachian St. †2006 3Devin Borders, Eastern Ky. †2013 3Josh Moody, Rhode Island †2013 3Theron Rice, Alabama A&M †2013 3Victor Dean, Portland St. †2013 3Ladarius Hawthorne, Coastal Caro. †2013 3P.J. Hall, Sam Houston St. †2014 3Devin Borders, Eastern Ky. †2014 3
Career Blocked Field GoalsPlayer, Team Years BFGLeonard Smith, McNeese 1980-82 *10Mark Weivoda, Idaho St. 2000-03 8Devin Borders, Eastern Ky. 2013-16 8Clayton Smith, Dartmouth 2001-04 6Ryan Crawford, Davidson 1997-2000 5Corey Lynch, Appalachian St. 2003-07 5Theron Rice, Alabama A&M 2010-13 5Bryan Cox, Western Ill. 1987-90 4Brent Browner, UNI 1998-2001 4P.J. Hall, Sam Houston St. 2014-16 4Hunter Kiselick, Georgetown 2013-16 4DeJuan Davis, Sam Houston St. 2001-02 3Tom Parks, Delaware 2002-05 3Everette Pedescleaux, UNI 2005-08 3Frantz Placide, Wagner 2007-10 3Josh Eden, Bucknell 2006-07, 10-11 3Justin Bethel, Presbyterian 2008-11 3Ladarius Hawthorne, Coastal Caro. 2010-13 3Sayyid Muhammad, N.C. Central 2012-14 3Victor Dean, Portland St. 2013 3Josh Moody, Rhode Island 2010-14 3
BLOCKED EXTRA POINTS*Record. †National champion or national leader in that category that season.
Single-Game Blocked Extra PointsBXP Player, Team (Opponent) Date3 Edmon McClam, Old Dominion (Chowan) Sept. 5, 20093 Josh Eden, Bucknell (Colgate) Nov. 13, 20102 Everette Pedescleaux, UNI (Delaware) Dec. 1, 20072 Felton Collins, Murray St. (Ky. Wesleyan) Oct. 25, 2014
Season Blocked Extra PointsPlayer, Team Year BXPJosh Eden, Bucknell †2010 *6Edmon McClam, Old Dominion †2009 5Tim Hauck, Montana †1988 4Ed Groszewski, Cornell †1991 4P.J. Hall, Sam Houston St. †2015 3Leonard Smith, McNeese †1982 2Bryan Cox, Western Ill. †1990 2David Gunn, UNI †2000 2Brent Browner, UNI †2000 2Mark Weivoda, Idaho St. †2001 2Everette Pedescleaux, UNI †2007 2Devin Borders, Eastern Ky. †2013 2Rakim Cox, Villanova †2013 2Bryan Presume, Southern Ill. †2013 2P.J. Hall, Sam Houston St. †2014 2Nick Brewer, Prairie View †2015 2
Career Blocked Extra PointsPlayer, Team Years BXPJosh Eden, Bucknell 2010-11 *8Tim Hauck, Montana 1987-89 7Joel Sussman, Cornell 2001-04 6Edmon McClam, Old Dominion 2009-11 6Bryan Cox, Western Ill. 1987-90 5P.J. Hall, Sam Houston St. 2014-160 5Leonard Smith, McNeese 1980-82 4Ed Groszewski, Cornell 1990-93 4Brent Browner, UNI 1998-2001 3Mark Weivoda, Idaho St. 2000-03 3Everette Pedescleaux, UNI 2005-08 3Justin Bethel, Presbyterian 2008-11 3
COMBINED BLOCKED KICKS*Record. †National champion or national leader in that category that season. ^Active player.
Single-Game Combined Blocked KicksBK Player, Team (Opponent) Date #Breakdown3 Ben Duhon, McNeese (Ark.-Monticello) Sept. 29, 1998 3 Punts3 Michael Adams, SFA (Central Okla.) Aug. 30, 2000 2 Punts; 1 PAT3 Brandon Tinson, Colgate (Towson) Sept. 30, 2000 3 Punts3 Edmon McClam, Old Dominion (Chowan) Sept. 5, 2009 3 PATs3 Josh Eden, Bucknell (Colgate) Nov. 13, 2010 3 PATs#Breakdown=No. of Punts, No. of FGs and No. of Extra Points Blocked.
Season Combined Blocked KicksPlayer, Team Year BK (#Breakdown)Josh Eden, Bucknell †2010 *8 (6 PATs, 2 FGs)Leonard Smith, McNeese †1981 6 (4 FGs, 2 Punts)Ryan Crawford, Davidson †2000 6 (4 Punts, 2 FGs)Mark Weivoda, Idaho St. †2001 6 (4 FGs, 2 PATs)Frantz Placide, Wagner †2009 6 (4 Punts, 1 FG, 1 PAT)Nick Brewer, Prairie View †2015 6 (4 Punts, 2 PAT)Bryan Cox, Western Ill. †1990 5 (3 FGs, 2 PATs)Trey Woods, Sam Houston St. †1993 5 (3 Punts, 1 FG, 1 PAT)DeJuan Davis, Sam Houston St. †2002 5 (3 Punts, 2 FGs)Edmon McClam, Old Dominion 2009 5 (5 PATs)Domonic Jones, The Citadel †2011 5 (5 Punts)Devin Borders, Eastern Ky. †2013 5 (3 FGs, 2 PATs)P.J. Hall, Sam Houston St. †2014 5 (3 FGs, 2 PATs)P.J. Hall, Sam Houston St. 2015 5 (3 PATs, 1 FG, 1 Punt)Tevin Richard, South Carolina St. 2015 5 (5 Punts)

All-Time Leaders on Special Teams 53
Career Combined Blocked KicksPlayer, Team Years BK (#Breakdown)Leonard Smith, McNeese 1980-82 *17 (10 FGs, 4 PATs, 3 Punts)Devin Borders, Eastern Ky. 2013-16 13 (8 FGs, 3 Punts, 2 PATs)Trey Woods, Sam Houston St. 1992-95 12 (8 Punts, 2 PATs, 2 FGs)Ryan Crawford, Davidson 1997-2000 12 (7 Punts, 5 FGs)Frantz Placide, Wagner 2007-10 12 (7 Punts, 3 FGs, 2 PATs)Mark Weivoda, Idaho St. 2000-03 11 (8 FGs, 3 PATs)Josh Eden, Bucknell 2010-11 11 (8 PATs, 3 FGs)Bryan Cox, Western Ill. 1987-90 10 (5 PATs, 4 FGs, 1 Punt)P.J. Hall, Sam Houston St. 2014-16 10 (5 PATs, 4 FGs, 1 Punt)Tim Hauck, Montana 1987-89 9 (7 PATs, 2 FGs)Taurean Rhetta, Jacksonville St. 2004-07 9 (9 Punts)Justin Bethel, Presbyterian 2008-11 9 (3 Punts, 3 FGs, 3 PATs)Brent Browner, UNI 1998-2001 7 (4 FGs, 3 PATs)Edmon McClam, Old Dominion 2009-11 7 (6 PATs, 1 FG)Theron Rice, Alabama A&M 2010-13 7 (5 FGs, 2 PATs)Nick Brewer, Prairie View 2014-15 7 (4 Punts, 2 PAT, 1 FG)Mike Pierce, McNeese 1987-90 6 (6 Punts)Clayton Smith, Dartmouth 2001-04 6 (6 FGs)Joel Sussman, Cornell 2001-04 6 (6 PATs)Corey Lynch, Appalachian St. 2003-07 6 (5 FGs, 1 Punt)Everette Pedescleaux, UNI 2005-08 6 (3 FGs, 3 PATs)
ALL-TIME LONGEST PLAYS(Since 1978 for FCS records) Since 1941, official maximum length of all plays fixed at 100 yards for every division.
RushingYds. Player, Team (Opponent) Year99 Lewis Washington, Southeast Mo. St. (Tennessee St.) 201399 Zach Zenner, South Dakota St. (Kansas) 201299 Bobby Washington, Eastern Ky. (Murray St.) 200799 David Sinisi, Monmouth (Sacred Heart) 200799 Michael Hobbs, Wofford (Ga. Southern) 200699 Jermaine Creighton, St. John’s (NY) (Siena) 199699 Jim Varick, Monmouth (Sacred Heart) 199499 Phillip Collins, Missouri St. (Western Ill.) 198999 Pedro Bacon, Western Ky. (West Ala.) 198699 Hubert Owens, Mississippi Val. (Ark.-Pine Bluff) 198098 Jon Underhill, Jacksonville (Greensboro) 199898 Johnny Gordon, Nevada (Montana St.) 198497 Chris Douglas, Missouri St. (Murray St.) 201097 Dedrick Poole, Ark.-Pine Bluff (Grambling) 200697 Stevie Chaney, Murray St. (Austin Peay) 200597 Dane Romero, Wofford (Gardner-Webb) 200597 Pat Williams, Delaware (West Chester) 199597 Norman Bradford, Grambling (Prairie View) 199297 David Clark, Dartmouth (Harvard) 198997 David Clark, Dartmouth (Princeton) 198896 Max Jacques, Marist (Valparaiso) 201296 Taiwan Jones, Eastern Wash. (Idaho St.) 200996 Jerry Azumah, New Hampshire (UConn) 199696 Jim Pizano, Massachusetts (Rhode Island) 199696 Kelvin Anderson, Southeast Mo. St. (Murray St.) 199296 Andre Lockhart, Chattanooga (ETSU) 198696 Jimmy Lera, Eastern Ill. (Southeast Mo. St.) 201496 Ricardo McCray, Bryant (Bucknell) 2014
PassingYds. Passer-Receiver, Team (Opponent) Year99 Jonathan Carkhuff-Lanny Funsten, Davidson (Johnson C. Smith) 201199 Antonio Bostick-Brian Lackey, Savannah St. (N.C. Central) 201199 Riley Walker-Fred Burnette, Tennessee St. (Jacksonville St.) 200499 Matt Verbit-Clinton Wu, Princeton (Brown) 2003
Yds. Passer-Receiver, Team (Opponent) Year99 Jimmy Blanchard-Terry Charles, Portland St. (Eastern Wash.) 199999 Michael Moore-Otis Covington, Morgan St. (Florida A&M) 199599 Todd Bernett-Jason Anderson, Eastern Wash. (Montana) 199499 Aaron Garcia-Greg Ochoa, Sacramento St. (Cal Poly) 199399 Todd Donnan-Troy Brown, Marshall (ETSU) 199199 Antoine Ezell-Tyrone Davis, Florida A&M (Bethune-Cookman) 199199 Jay Johnson-Kenny Shedd, UNI (Oklahoma St.) 199099 John Bonds-Hendricks Johnson, Northern Ariz. (Boise St.) 199099 Scott Stoker-Victor Robinson, Northwestern St. (La.-Monroe) 198998 Zack Drayer-Terrell Smith, Saint Francis (PA) (Sacred Heart) 201598 Jordan West-Kendrick Bourne, Eastern Wash. (Sacramento St.) 201598 Eric Williams-Cameron Sandquist, Yale (Georgetown) 201298 Chris Walley-Derrick Demps, Norfolk St. (Old Dominion) 201198 R.J. Archer-Cameron Dohse, William & Mary (Villanova) 200998 John Skelton-Asa Lucas, Fordham (Cornell) 200998 Chris Wallace-Jason Jones, Ark.-Pine Bluff (Southern Ill.) 200698 Steve LaFalce-Marco Thomas, Western Ill. (Illinois St.) 200598 Princeton Shepherd-Jerome Mathis, Hampton (South Carolina St.) 200498 Ben Anderson-Courtney Freeman, Liberty (Charleston So.) 199698 Derek Jensen-Jason Cannon, Missouri St. (Eastern Ill.) 199598 Jonathan Quinn-Dee Mostiller, Middle Tenn. (Tennessee Tech) 199598 Antoine Ezell-Tim Daniel, Florida A&M (Delaware St.) 199198 John Friesz-Lee Allen, Idaho (Northern Ariz.) 198998 Fred Gatlin-Treamelle Taylor, Nevada (Montana) 198998 Steve Monaco-Emerson Foster, Rhode Island (Holy Cross) 198898 Frank Baur-Maurice Caldwell, Lafayette (Columbia) 198898 David Gabianelli-Craig Morton, Dartmouth (Columbia) 198698 Joe Pizzo-Bryan Calder, Nevada (Eastern Wash.) 198498 Bobby Hebert-Randy Liles, Northwestern St. (Southeastern La.) 1980
Interception Returns47 players have returned interceptions for 100 yards. The most recent:Yds. Player, Team (Opponent) Year100 Orlando McKinley, Florida A&M (Delaware St.) 2016100 Rob Rolle, Villanova (Towson) 2016100 David Jones, Richmond (William & Mary) 2015100 Travis Starks, Indiana St. (Southeast Mo. St.) 2015100 Trocon Davis, Princeton (Yale) 2012100 Cal Schaffitzel, Missouri St. (North Dakota St.) 2012100 Anthony Thompson, Southern Ill. (Youngstown St.) 2012100 Branden Spann, Southeast Mo. St. (Tennessee Tech) 2012100 Kendall James, Maine (Bryant) 2012100 Darius Safford, Lafayette (Colgate) 2011100 Asa Jackson, Cal Poly (South Dakota St.) 2011100 Nick Womack, Fordham (Columbia) 2011100 KaJuan Lee, Liberty (Charleston So.) 2011
PuntsYds. Player, Team (Opponent) Year93 Tyler Grogan, Northeastern (Villanova) 200191 Jacob DeMaio, Weber St. (Southern Utah) 201691 Trevor Ward, Southern Utah (Air Force) 200891 Bart Helsley, North Texas (La.-Monroe) 199089 Steve Bulcavage, Towson (Colgate) 200389 Mike Scifres, Western Ill. (Missouri St.) 200089 Jim Carriere, UConn (Maine) 198788 Jeff Kaiser, Idaho St. (UTEP) 198387 John Starnes, North Texas (UT Arlington) 198386 Jean Breaux, McNeese (Sam Houston St.) 201586 Cory Carter, Texas Southern (Southern U.) 201586 Tony Epperson, Weber St. (Idaho St.) 201386 Hamish MacInnes, Jacksonville St. (Tennessee Tech) 201386 Kevin Cook, Eastern Ill. (Southeast Mo. St.) 201086 Jesse Ohliger, Murray St. (Eastern Ky.) 200386 Cory Elolf, Texas St. (McNeese) 2003

All-Time Leaders on Special Teams 54
Yds. Player, Team (Opponent) Year86 Andy Dorsey, Tennessee Tech (Eastern Ill.) 199885 Graham Purvis, Gardner-Webb (Charleston So.) 201185 Troy LeFever, Youngstown St. (UNI) 200085 Ken Hinsley, Western Caro. (Chattanooga) 199885 Don Alonzo, Nicholls St. (Northwestern St.) 198084 Sean Dennis, Monmouth (Central Conn. St.) 200384 Billy Smith, Chattanooga (Appalachian St.) 198883 John Fleck, Howard (Appalachian St.) 201583 Billy Janssen, Drake (Jacksonville) 201183 Scott Ravanesi, Southern Ill. (Massachusetts) 200783 David Simonhoff, Southeast Mo. St. (Eastern Ill.) 200383 Jason Harkins, Appalachian St. (The Citadel) 1986
Punt ReturnsYds. Player, Team (Opponent) Year100 Walter Powell, Murray St. (Southeast Mo. St.) 201299 Chandler Curtis, Mercer (Samford) 201498 Willie Ware, Mississippi Val. (Bishop) 198598 Barney Bussey, South Carolina St. (Johnson C. Smith) 198196 Tavoris Doss, Alcorn (Alabama St.) 201396 Josh Lee, Youngstown St. (Valparaiso) 201196 Quay Long, N.C. A&T (Bethune-Cookman) 200996 Ladarius Webb, Nicholls St. (Texas St.) 200796 Cletis Gordon, Jackson St. (Hampton) 200496 Carl Williams, Texas Southern (Grambling) 198195 Tim Toone, Weber St. (Sacramento St.) 200995 LeRoy Vann, Florida A&M (Winston-Salem) 200995 James Norris, Western Ill. (Eastern Mich.) 200395 Joseph Jefferson, Western Ky. (Illinois St.) 200195 Clarence Weathers, Delaware St. (Salisbury) 198095 Alex Tillman, North Dakota (Portland St.) 201494 Jalen Rima, UNI (Indiana St.) 201694 D’Andre Randle, Jacksonville (Davidson) 201194 Toms Bernhards-Callahan, Davidson (Marist) 201194 Marc Mariani, Montana (Idaho St.) 200894 Tuff Harris, Montana (Eastern Wash.) 200694 Jayson Foster, Ga. Southern (Appalachian St.) 200494 Drew Haddad, Buffalo (Cornell) 199894 Brad Friedman, Towson (Saint Francis [PA]) 199693 Austin Watts, Texas Southern (Houston Baptist) 201693 Brandon Cox, Central Ark. (Houston Baptist) 201593 Ladarius Vanlier, Tennessee Tech [Cumberland (TN)] 201393 Andrew McFadden, Liberty (Delaware St.) 199593 Patrick Plott, Jacksonville St. (Southwest Mo. St.) 199593 Joe Fuller, UNI (Wis.-Whitewater) 1984
Kickoff Returns131 players have returned kickoffs 100 yards. The most recent:Yds. Player, Team (Opponent) Year100 Bradley Street, Alabama St. (Miles) 2016100 Lennox McAfee, Wofford (Chattanooga) 2016100 Michael Dereus, Georgetown (Holy Cross) 2016100 John Santiago, North Dakota (Weber St.) 2016100 Shane Simpson, Towson (New Hampshire) 2016100 Dante Satcher, Robert Morris (Saint Francis [PA]) 2016100 Dontez Byrd, Tennessee Tech (Mercer) 2016100 Bruce Anderson, North Dakota St. (Montana) 2015100 Lawrence Dickens, Marist (Stetson) 2015100 Dre Nelson, Princeton (Cornell) 2015100 Deion Holliman, Missouri St. (South Dakota) 2015100 Logan Jones, Montana St. (Portland St.) 2015100 Willie Quinn, Southern U. (Prairie View) 2015100 Nehari Crawford, Duquesne (Alderson Broaddus) 2015100 Hakeem Deggs, Northern Colo. (Sacramento St.) 2015100 Martez Carter, Grambling (Prairie View) 2015100 Conley Wilkins, Drake (Stetson) 2015
Yds. Player, Team (Opponent) Year100 Nick Colvin, Wofford (Idaho) 2015100 Karel Hamilton, Samford (Chattanooga) 2015100 Eric Wilkes, Weber St. (North Dakota St.) 2015100 Devin Brown, Coastal Caro. (Furman) 2015100 Willie Quinn, Southern U. (Louisiana Tech) 2015
Fumble ReturnsYds. Player, Team (Opponent) Year99 Jarrell Guyton (20 yds.) and Everette Baker (79 yds. after lateral),
Morgan St. (Howard)2006
99 Randall State, Liberty (Akron) 200298 Branden Spann, Southeast Mo. St. (Austin Peay) 201290 Cornell Middlebrook, Western Ill. (UNI) 200287 Bryant Youngblood, VMI (Liberty) 200787 Garron Bible, Delaware (Lafayette) 200485 Onyemechi Anyaugo, Norfolk St. (South Carolina St.) 201182 Brendan Dete, Davidson (Newberry) 200279 Vincent Graves, Elon (Johnson C. Smith) 200279 Al Clark, Wofford (Middle Tenn.) 1999
Field GoalsYds. Player, Team (Opponent) Year63 Bill Gramatica, South Fla. (Austin Peay) 200063 Scott Roper, Arkansas St. (North Texas) 198763 Tim Foley, Ga. Southern (James Madison) 198762 Billy Cundiff, Drake (San Diego) 200062 Paul Hickert, Murray St. (Eastern Ky.) 198660 Alec Chadwick, Houston Baptist (Incarnate Word) 201660 Pete Garces, Idaho St. (CSUN) 199860 Terry Belden, Northern Ariz. (CSUN) 199360 David Cool, Ga. Southern (James Madison) 198860 John Lunsford, Liberty (Richmond) 201459 MacKenzie Hoambrecker, UNI (Missouri St.) 200258 Rich Emke, Eastern Ill. (UNI) 198658 Tony Zendejas, Nevada (Boise St.) 1983

All-Time Team Season Leaders 55
ALL-TIME TEAM SEASON LEADERS
OFFENSE*Record. †National champion or national leader in that category that season.
Rushing Yards Per GameTeam Year G Carries Yds. TD Yds/GGa. Southern †1999 11 654 4,609 61 *419.0Ga. Southern †2012 14 850 5,591 55 399.4Southern Utah †2000 11 684 4,336 49 394.2Cal Poly †2015 11 780 4,260 38 387.3Ga. Southern †2005 12 768 4,641 50 386.8Ga. Southern †2002 14 859 5,407 54 386.2Southern Utah †1998 11 695 4,246 38 386.0The Citadel †1994 11 633 4,202 48 382.0Howard †1987 10 578 3,816 45 381.6Ga. Southern 1998 11 620 4,166 53 378.7Delaware St. †1984 10 581 3,773 44 377.3Ga. Southern †2004 12 761 4,439 56 369.9Western Ky. †1997 10 610 3,660 39 366.0Nicholls St. 2005 10 626 3,648 38 364.8Wofford †2011 12 728 4,375 43 364.6VMI †2008 11 614 3,932 37 357.5Cal Poly †2014 12 764 4,221 44 351.8Wofford 1999 11 691 3,867 38 351.5Wofford 2012 13 766 4,546 39 349.7The Citadel †2016 12 778 4,178 32 348.2The Citadel 2014 12 760 4,166 34 347.2The Citadel 2015 13 791 4,510 41 346.9The Citadel †1992 11 672 3,800 33 345.5Western Ky. 1998 11 669 3,791 43 344.6Cal Poly 2016 12 717 4,122 39 343.5
Passing Yards Per GameTeam Year G Att. Com. Pct. Int. Yds. TD Yds/GMississippi Val. †1984 10 558 351 .629 24 4,968 64 *496.8Alcorn †1994 11 538 307 .571 19 4,865 44 442.3Portland St. †1980 11 580 353 .609 18 4,784 44 434.9Montana †1995 11 500 336 .672 12 4,490 38 408.2Southeastern La. †2004 11 576 383 .665 13 4,488 38 408.0Eastern Wash. †2016 14 620 421 .679 14 5,614 54 401.0Florida A&M †1998 11 551 325 .590 12 4,407 50 400.6Old Dominion †2012 13 586 403 .688 14 5,120 44 393.8Weber St. †1991 11 516 320 .620 17 4,280 36 389.1SFA †2013 12 622 373 .600 22 4,668 37 389.0SFA 2012 11 679 395 .582 26 4,240 31 385.5Rhode Island †1985 11 598 331 .554 25 4,227 40 384.3Towson †1999 11 584 325 .557 13 4,193 23 381.2Cornell 2012 10 478 289 .605 13 3,748 19 374.8Idaho †1989 11 445 269 .604 9 4,117 32 374.3Montana 1994 11 454 299 .659 12 4,097 30 372.5Eastern Ill. †2013 14 608 395 .650 10 5,213 55 372.4Portland St. †2008 11 559 307 .549 20 4,094 24 372.2Eastern Ill. 1984 11 508 288 .567 16 4,071 29 370.1Montana 1999 11 438 282 .644 10 4,070 40 370.0Portland St. †1979 11 553 312 .564 21 4,058 27 368.9Eastern Wash. †2011 11 509 320 .629 13 4,052 34 368.4Sam Houston St. 2016 13 546 333 .610 11 4,788 58 368.3Grambling †2005 12 465 256 .551 7 4,408 58 367.3Portland St. †1978 11 513 281 .548 28 4,038 29 367.1
Highest Passing Efficiency Rating PointsTeam Year G Att. Com. Pct. Int. Yds. TD RatingSan Diego †2007 11 333 228 .685 2 3,270 48 *197.3Cal Poly 2007 11 206 110 .534 6 2,364 30 192.0Eastern Wash. †2013 15 515 338 .656 15 5,247 58 182.6James Madison †2016 15 349 247 .708 9 3,487 34 181.7Northern Ariz. †2015 11 354 243 .686 7 3,335 39 180.2Eastern Ill. †2001 10 211 140 .664 6 2,078 21 176.3Cal Poly †2012 12 153 88 .575 4 1,502 19 175.7Villanova †2014 14 342 221 .646 4 3,185 36 175.3Cal Poly 2016 12 159 99 .623 4 1,534 17 173.6Ga. Southern †2004 12 135 70 .519 4 1,421 16 173.5Grambling †2005 12 465 256 .551 7 4,408 58 172.9Furman †2011 11 251 158 .629 8 2,448 25 171.3Hofstra †2001 11 336 206 .613 4 3,311 30 171.2San Diego †2006 12 391 260 .665 5 3,520 36 170.0Wofford †2008 12 145 93 .641 4 1,529 10 169.9San Diego †2003 10 341 208 .610 4 3,126 35 169.5Jacksonville †2010 11 348 217 .624 7 3,222 35 169.3San Diego 2013 11 400 265 .663 5 3,563 37 169.1San Diego 2005 12 412 282 .684 8 3,572 39 168.6New Hampshire 2005 13 445 310 .697 10 3,901 40 168.5Fordham 2015 12 353 234 .663 10 3,268 32 168.3UNI 2007 13 322 243 .755 6 2,989 18 168.2Eastern Wash. 2016 14 620 421 .679 14 5,614 54 168.2Cal Poly 2008 11 210 119 .567 5 1,991 23 167.7Stony Brook 2012 13 216 126 .583 8 2,096 23 167.5
Total Offense Yards Per GameTeam Year G Plays Yds. TD Yds/GMississippi Val. †1984 10 866 6,401 84 *640.1Alcorn †1994 11 848 6,577 66 597.9Eastern Ill. †2013 14 1,219 8,253 95 589.5Weber St. †1991 11 986 6,395 69 581.4SFA 2013 12 1,044 6,864 60 572.0Yale †2014 10 837 5,715 51 571.5Idaho St. 2014 12 992 6,744 64 562.0Holy Cross †1987 11 882 6,074 72 552.2Ga. Southern †1999 11 795 6,069 71 551.7Old Dominion †2012 13 1,055 7,127 79 548.2Sam Houston St. †2016 13 993 7,115 51 547.3Portland St. 2013 12 923 6,486 59 540.5Southeastern La. †2004 11 896 5,908 56 537.1Florida A&M †1998 11 855 5,893 68 535.7Eastern Wash. 2013 15 1,036 8,002 83 533.5Idaho †1993 11 791 5,852 70 532.0Sam Houston St. †2015 15 1,275 7,975 76 531.7Eastern Wash. 2016 14 1,062 7,414 49 529.6James Madison 2015 12 949 6,345 64 528.8Morehead St. †2000 9 698 4,715 53 523.9Northern Ariz. †1996 11 873 5,751 57 522.8Jacksonville 2013 11 818 5,750 61 522.7Montana St. 2015 11 838 5,718 61 519.8Idaho 1994 11 851 5,705 54 518.6Prairie View 2013 12 1,026 6,211 64 517.6
Scoring Per GameTeam Year G TD PAT 2XP FG Saf. Pts. Pts/GMississippi Val. †1984 10 87 - - - - 609 *60.9Ga. Southern †1999 11 - - - - - 550 50.0Florida A&M †1998 11 - - - - - 546 49.6

All-Time Team Season Leaders 56
Team Year G TD PAT 2XP FG Saf. Pts. Pts/GSam Houston St. †2016 13 90 87 0 5 1 644 49.5Portland St. †1980 11 - - - - - 541 49.2Eastern Ill. †2013 14 95 78 2 7 1 675 48.2Idaho †1993 11 - - - - - 522 47.5Ga. Southern †2004 12 77 65 2 9 3 564 47.0James Madison 2016 15 94 90 1 14 1 700 46.7Holy Cross †1987 11 - - - - - 511 46.5Montana 1999 11 - - - - - 510 46.4Alcorn †1994 11 - - - - - 503 45.7Florida A&M 1999 11 - - - - - 498 45.3Old Dominion †2012 13 79 75 3 10 0 587 45.2Nevada †1991 11 - - - - - 496 45.1Weber St. 1991 11 - - - - - 495 45.0Prairie View †2015 10 64 51 1 4 0 449 44.9San Diego †2007 11 66 63 1 9 0 488 44.4Cal Poly †2008 11 67 61 1 7 1 488 44.4James Madison 2015 12 71 67 1 12 0 531 44.3Grambling †2005 12 75 49 3 8 0 529 44.1Eastern Wash. †2014 14 84 73 1 13 0 618 44.1Alcorn 2014 13 79 74 0 8 0 572 44.0Princeton 2013 10 59 45 7 8 0 437 43.7Hampton 2004 12 69 59 1 16 0 523 43.6
DEFENSE*Record. †National champion or national leader in that category that season.
Rushing Yards Allowed Per GameTeam Year G Carries Yds. TD Yds/GAlabama A&M †2000 12 369 476 5 *39.7Marist †1997 10 319 404 3 40.4Grambling †1984 11 344 489 4 44.5Florida A&M †1978 13 - 632 - 48.6Georgetown †1996 10 - 532 - 53.2Morehead St. †2007 11 300 593 5 53.9Penn †2002 10 301 558 7 55.8Jackson St. 1978 12 - 679 - 56.6Alcorn †1979 10 - 567 - 56.7Penn †2001 9 259 526 5 58.4Saint Peter’s 2001 11 362 646 5 58.7South Carolina St. †1982 10 320 594 - 59.4Northern Ariz. †2008 11 307 658 12 59.8Dayton 2008 12 362 728 8 60.7South Carolina St. †1981 11 392 669 - 60.8McNeese †1995 11 317 670 4 60.9William & Mary †2009 14 427 856 10 61.1Fairfield †1998 11 329 679 4 61.7South Carolina St. †1980 11 - 680 - 61.8Eastern Ky. †1986 11 351 691 6 62.8Jackson St. †1985 10 348 630 6 63.0Penn †2009 10 298 632 1 63.2Tennessee St. 1986 11 359 697 4 63.4Maine †2006 11 335 703 9 63.9UNI 1984 11 353 704 9 64.0
Rushing Yards Allowed Per Game Since 2000Team Year G Carries Yds. TD Yds/GAlabama A&M †2000 12 369 476 5 39.7Morehead St. †2007 11 300 593 5 53.9Penn †2002 10 301 558 7 55.8Penn †2001 9 259 526 5 58.4Saint Peter’s 2001 11 362 646 5 58.7Northern Ariz. †2008 11 307 658 12 59.8
Team Year G Carries Yds. TD Yds/GDayton 2008 12 362 728 8 60.7William & Mary †2009 14 427 856 10 61.1Penn 2009 10 298 632 1 63.2Maine †2006 11 335 703 9 63.9Monmouth †2003 12 404 771 1 64.3Prairie View 2008 10 259 657 7 65.7Harvard 2006 10 329 665 14 66.5Villanova 2009 15 431 1001 8 66.7Iona 2006 10 271 669 6 66.9Dayton 2002 12 380 813 7 67.8Harvard †2012 10 328 694 6 69.4Colgate †2016 10 292 694 5 69.4Morehead St. 2009 11 357 797 7 72.5Duquesne †2005 10 370 725 6 72.5Central Ark. 2016 13 414 947 10 72.8Sam Houston St. †2011 15 413 1094 9 72.9Penn †2010 10 304 736 4 73.6Dayton 2007 12 401 905 10 75.4Montana 2000 11 360 843 9 76.6
Passing Yards Allowed Per GameTeam Year G Att. Com. Pct. Int. Yds. TD Yds/GBethune-Cookman †1981 11 192 59 30.73 19 659 - *59.9Mississippi Val. †1979 9 - - - - 578 - 64.2South Fla. †1997 11 139 63 45.32 10 826 5 75.1Lehigh 1979 11 - - - - 907 - 82.5Southern U. †1978 11 - - - - 942 - 85.6South Carolina St. 1978 11 - - - - 977 - 88.8Davidson 1979 10 - - - - 889 - 88.9Middle Tenn. †1988 11 251 110 43.82 23 999 3 90.8Robert Morris †2002 10 164 69 42.07 13 909 6 90.9Delaware St. 1978 10 - - - - 911 - 91.1Southern U. 1979 11 - - - - 1,015 - 92.3Grambling 1979 11 - - - - 1,017 - 92.5Western Ky. 1978 10 - - - - 935 - 93.5Howard †1980 10 - - - - 938 - 93.8Western Caro. †1998 11 163 75 46.01 7 1,033 5 93.9Duquesne †2002 12 256 104 40.63 25 1,140 5 95.0Wagner 2002 11 207 102 49.28 12 1,075 5 97.7Austin Peay 1980 11 - - - - 1,080 - 98.2Northeastern †1982 9 159 71 44.65 7 889 - 98.8Saint Peter’s †2001 11 265 107 40.38 27 1,089 7 99.0Northeastern 1978 11 - - - - 1,093 - 99.4Bethune-Cookman †1986 11 208 80 38.46 14 1,098 7 99.8Canisius 1995 10 203 81 39.90 21 1,010 5 101.0Alcorn †1987 9 223 75 33.63 13 912 9 101.3Eastern Ill. 1981 11 193 83 43.01 17 1,116 - 101.5
Passing Yards Allowed Per Game Since 2000Team Year G Att. Com. Pct. Int. Yds. TD Yds/GRobert Morris †2002 10 164 69 42.07 13 909 6 90.9Duquesne 2002 12 256 104 40.63 25 1,140 5 95.0Wagner 2002 11 207 102 49.28 12 1,075 5 97.7Saint Peter’s †2001 11 265 107 40.38 27 1,089 7 99.0Saint Francis (PA) 2002 10 220 92 41.82 11 1,077 6 107.7Sacred Heart 2002 10 252 87 34.52 19 1,091 4 109.1Monmouth †2000 11 210 108 51.43 8 1,262 9 114.7Youngstown St. †2015 11 202 83 41.19 8 1,284 8 116.7North Dakota St. †2008 11 228 128 56.14 7 1,285 11 116.8Florida Int’l 2002 11 221 123 55.66 10 1,287 6 117.0South Carolina St. †2010 12 290 141 48.62 17 1,411 5 117.6Morgan St. 2008 12 259 117 45.17 19 1,425 14 118.8Sam Houston St. †2000 11 248 113 45.56 10 1,331 9 121.0Alcorn 2015 13 301 138 45.85 10 1,575 8 121.2Texas Southern 2010 12 336 139 41.37 19 1,481 12 123.4

All-Time Team Season Leaders 57
Team Year G Att. Com. Pct. Int. Yds. TD Yds/GFlorida A&M †2013 12 273 155 56.78 15 1,504 12 125.3Ga. Southern 2001 11 257 135 52.53 13 1,382 7 125.6Bethune-Cookman 2002 13 298 120 40.27 21 1,652 7 127.1Robert Morris †2006 11 267 121 45.32 13 1,414 7 128.5Valparaiso †2004 11 255 130 50.98 7 1,417 14 128.8Sacred Heart 2000 11 271 124 45.76 14 1,431 9 130.1Western Caro. 2001 11 230 109 47.39 13 1,439 5 130.8Hofstra 2002 12 261 139 53.26 7 1,573 12 131.1Charleston So. 2004 10 240 142 59.17 12 1,318 8 131.8Western Caro. †2005 9 232 113 48.71 15 1,191 14 132.3
Lowest Passing Efficiency Rating Points AgainstTeam Year G Att. Com. Pct. Int. Yds. TD RatingBethune-Cookman †1981 11 192 59 30.73 19 659 - *59.9Sacred Heart †2002 10 220 87 34.52 19 1,091 4 61.0Mississippi Val. †1979 9 - - - - 578 - 64.2South Fla. †1997 11 139 63 45.32 10 826 5 75.1Lehigh 1979 11 - - - - 907 - 82.5Southern U. †1978 11 - - - - 942 - 85.6South Carolina St. 1978 11 - - - - 977 - 88.8Davidson 1979 10 - - - - 889 - 88.9San Diego †2016 12 362 149 41.2 9 1,922 10 89.9South Carolina St. †2015 11 314 145 46.18 14 1,578 10 90.0Middle Tenn. †1988 11 251 110 43.82 23 999 3 90.8Robert Morris †2002 10 164 69 42.07 13 909 6 90.9Delaware St. 1978 10 - - - - 911 - 91.1Alcorn 2015 13 301 138 45.85 8 1,575 8 91.9Southern U. 1979 11 - - - - 1,015 - 92.3Grambling 1979 11 - - - - 1,017 - 92.5Dartmouth 2015 10 393 220 56.00 18 1,912 6 92.7Western Ky. 1978 10 - - - - 935 - 93.5Howard †1980 10 - - - - 938 - 93.8Western Caro. †1998 11 163 75 46.01 7 1,033 5 93.9Southeastern La. †2014 13 425 212 49.88 21 2,315 11 94.3Duquesne 2002 12 256 104 40.63 25 1,140 5 95.0N.C. A&T 2014 12 392 199 50.76 21 2,243 10 96.5Wagner 2002 11 207 102 49.28 12 1,075 5 97.7Austin Peay †1980 11 - - - - 1,080 - 98.2
Lowest Passing Efficiency Rating Points Against Since 2000Team Year G Att. Com. Pct. Int. Yds. TD RatingSacred Heart †2002 10 220 87 34.52 19 1,091 4 61.0San Diego †2016 12 362 149 41.16 9 1,922 10 89.9South Carolina St. †2015 11 314 145 46.18 14 1,578 10 90.0Robert Morris 2002 10 164 69 42.07 13 909 6 90.9Alcorn 2015 13 301 138 45.85 10 1,575 8 91.9Dartmouth 2015 10 393 220 56.00 18 1,912 6 92.7Southeastern La. †2014 13 425 212 49.88 21 2,315 11 94.3Duquesne 2002 12 256 104 40.63 25 1,140 5 95.0N.C. A&T 2014 12 392 199 50.76 21 2,243 10 96.5Wagner 2002 11 207 102 49.28 12 1,075 5 97.7Jacksonville St. 2016 12 374 172 45.99 18 2,227 14 98.7Bryant 2014 11 315 155 49.21 14 1,859 9 99.3Saint Peter’s †2001 11 265 107 40.38 27 1,089 10 99.0Saint Francis (PA) 2015 10 268 133 49.63 12 1,630 6 99.2North Dakota St. 2014 16 446 237 53.13 19 2,480 11 99.4Youngstown St. 2015 11 202 83 41.09 8 1,284 8 99.6Hampton 2015 11 339 177 52.21 11 1,840 9 100.1Grambling 2016 12 452 228 50.44 13 2,534 12 100.5Campbell 2015 11 339 168 49.56 8 1,934 8 100.6North Dakota St. 2015 15 433 211 48.73 16 2,505 14 100.6Tennessee St. 2014 12 317 164 51.73 16 1,840 11 101.8Samford 2014 11 272 153 56.25 12 1,530 6 101.9
Team Year G Att. Com. Pct. Int. Yds. TD RatingSouthern Utah 2015 12 382 200 52.36 20 2,284 12 102.5Jacksonville St. 2015 15 460 231 50.22 20 2,691 17 102.9Maine 2014 11 322 161 50.00 14 1,894 12 103.0Eastern Ill. 2015 12 369 185 50.14 19 2,265 13 103.0
Total Defense Yards Allowed Per GameTeam Year G Plays Yds. TD Yds/GFlorida A&M †1978 11 642 1,649 - *149.9Saint Peter’s †2001 11 627 1,735 13 157.7Alcorn †1979 10 599 1,664 - 166.4Lehigh 1979 11 615 1,836 - 166.9South Carolina St. 1979 10 593 1,671 - 167.1Tennessee St. †1986 11 672 1,963 10 178.5Southern U. 1979 11 669 1,998 - 181.6Grambling 1979 11 644 2,055 - 186.8Tennessee St. †1984 11 632 2,057 15 187.0Duquesne †2002 12 724 2,256 13 188.0South Carolina St. †1982 10 578 1,914 - 191.4Massachusetts †1980 10 597 1,935 - 193.5Florida A&M 1982 11 672 2,177 - 197.9Middle Tenn. 1982 11 725 2,180 - 198.2Wagner †2002 11 628 2,192 16 199.3St. John’s (NY) †1999 11 677 2,197 18 199.7Chattanooga 1982 11 677 2,201 - 200.1Southern U. †1987 11 679 2,231 15 202.8Murray St. 1980 11 714 2,237 - 203.4Jackson St. 1980 11 646 2,242 - 203.8South Carolina St. †1981 11 686 2,244 - 204.0Texas Southern †2010 12 692 2,459 28 204.9Duquesne †2005 10 674 2,059 19 205.9Grambling †1983 11 689 2,266 - 206.0Sacred Heart 2002 10 678 2,063 15 206.3
Total Defense Yards Allowed Per Game Since 2000Team Year G Plays Yds. TD Yds/GSaint Peter’s †2001 11 627 1,735 13 157.7Duquesne †2002 12 724 2,256 13 188.0Wagner 2002 11 628 2,192 16 199.3Texas Southern †2010 12 692 2,459 28 204.9Duquesne †2005 10 674 2,059 19 205.9Sacred Heart 2002 10 678 2,063 15 206.3South Carolina St. 2010 12 760 2,508 23 209.0Morgan St. †2008 12 676 2,561 31 213.4Penn †2009 10 599 2,176 12 217.6Robert Morris †2006 11 650 2,512 19 228.4William & Mary 2009 14 839 3,217 22 229.8Maine 2006 11 637 2,529 18 229.9Monmouth †2000 11 678 2,553 24 232.1Iona 2006 10 574 2,321 24 232.1Western Ky. 2001 11 668 2,565 16 233.2North Dakota St. †2012 15 815 3,517 21 234.5Bethune-Cookman †2014 12 717 2,850 31 237.5South Carolina St. †2013 13 887 3,094 18 238.0Jackson St. 2008 12 743 2,862 32 238.5Albany (NY) 2006 11 712 2,649 18 240.8Prairie View 2008 10 571 2,420 17 242.0Dayton 2009 11 640 2,669 20 242.6Monmouth †2003 12 783 2,931 13 244.3St. John’s (NY) 2000 11 731 2,687 28 244.3Texas Southern †2011 11 589 2,695 36 245.0

All-Time Team Season Leaders 58
Scoring Allowed Per GameTeam Year G Pts. Pts/GSouth Carolina St. †1978 11 72 *6.55Nevada 1978 12 84 7.00Western Mich. †1982 11 78 7.09Lehigh †1979 11 79 7.18Penn †1994 9 68 7.56Florida A&M 1978 13 103 7.92Saint Peter’s †2001 11 90 8.18Tennessee St. †1986 11 91 8.27Monmouth †2003 12 102 8.50Youngstown St. 1994 11 94 8.55Grambling †1983 11 95 8.64Eastern Ill. 1982 11 97 8.82McNeese †1995 11 98 8.91Northwestern St. †1984 11 99 9.00Murray St. †1980 11 100 9.09Middle Tenn. †1990 11 101 9.18Jackson St. †1981 11 103 9.36Western Ill. †1998 11 103 9.36Penn †2009 10 95 9.50Akron 1983 11 104 9.45Duquesne †2002 12 115 9.58South Carolina St. 1981 11 106 9.64Eastern Ill. 1983 11 106 9.64Holy Cross 1990 11 106 9.64Furman 1988 11 107 9.73
Scoring Allowed Per Game Since 2000Team Year G TD PAT 2XP FG Saf. Pts. Pts/GSaint Peter’s †2001 11 13 12 0 0 0 90 8.18Monmouth †2003 12 13 12 0 4 0 102 8.50Penn †2009 10 12 11 0 4 0 95 9.50Duquesne †2002 12 13 11 1 8 0 115 9.58Dayton 2002 12 15 13 0 5 0 118 9.83Dartmouth †2015 10 13 8 0 5 0 101 10.10Yale †2008 10 11 10 0 9 1 105 10.50Western Ky. 2001 11 16 14 0 4 0 122 11.09North Dakota St. †2013 15 20 19 0 10 0 169 11.27Penn 2001 9 14 13 0 2 0 103 11.44North Dakota St. †2012 15 21 20 0 9 0 173 11.53Western Ky. †2000 11 16 10 2 6 0 128 11.64Stony Brook 2002 10 15 13 0 5 0 118 11.80Ga. Southern 2001 11 17 13 0 5 1 132 12.00Delaware †2010 15 22 19 0 10 0 181 12.07William & Mary 2009 14 22 20 0 5 1 169 12.07Wagner 2002 11 16 16 0 6 2 134 12.18Harvard †2014 10 15 12 0 7 0 123 12.30Monmouth †2006 12 21 9 1 5 0 152 12.67North Dakota St. †2011 15 23 20 0 11 0 191 12.73Prairie View 2008 10 17 12 1 4 0 128 12.80Sacred Heart 2002 10 15 15 0 8 0 129 12.90San Diego 2006 12 22 15 1 2 0 155 12.92Harvard 2015 10 17 13 0 5 0 130 13.00Albany (NY) 2006 11 18 11 0 8 0 143 13.00
SPECIAL TEAMS*Record. †National champion or national leader in that category that season.
Net PuntingTeam Year G Pnt Yds. Avg. Ret. Yds. TB Yds/PSouthern Utah †2009 11 34 1,619 47.6 11 32 2 *45.1Northern Ariz. †2004 11 57 2,736 48.0 26 178 0 @44.9Marshall †1996 15 38 1,740 45.8 12 47 - 44.5
Team Year G Pnt Yds. Avg. Ret. Yds. TB Yds/PIdaho St. †2001 11 49 2,270 46.3 22 98 0 44.3Northern Ariz. †2006 11 49 2,109 43.0 15 194 - 43.0Marshall †1994 14 27 1,226 45.4 13 69 - 42.9Idaho St. †2002 11 52 2,377 45.7 19 156 0 42.7Western Ill. †2002 13 56 2,632 47.0 23 284 0 41.9Portland St. †2013 12 56 2,603 46.5 17 87 9 41.7Montana St. †1979 10 - - - - - - 41.6Wofford †2016 14 57 2,597 45.6 23 104 6 41.6Western Ill. †1998 14 67 2,888 43.1 22 110 - 41.5Western Caro. 1998 11 58 2,569 44.3 21 162 - 41.5Delaware 2013 12 60 2,701 45.0 25 153 3 41.5Souith Dakota 2016 11 68 3,230 47.5 22 177 12 41.4UC Davis †2012 11 56 2,491 44.5 19 75 5 41.4Boise St. †1980 13 - - - 10 3 - 41.3Eastern Ky. 2016 11 59 2,485 42.1 14 35 1 41.2Portland St. 1979 11 46 1,969 42.8 17 95 - 41.0Fordham †2011 11 51 2,247 44.1 16 101 3 40.9Southern U. 1998 12 61 2,715 44.5 27 222 - 40.9@Record for minimum 46 attempts.
Punt ReturnsTeam Year G Ret Yds. TD Yds/RJames Madison †2016 15 23 613 6 *26.7N.C. Central †2012 11 16 392 5 24.5Northern Colo. †2015 11 11 266 2 24.2N.C. A&T 2015 12 32 740 3 @23.1N.C. A&T †2001 11 25 576 7 23.0Southern U. 2016 11 9 205 1 22.8Norfolk St. †2006 11 23 476 2 20.7Eastern Wash. 2016 14 9 183 1 20.3N.C. Central 2016 12 18 361 2 20.1Eastern Ill. †2013 14 23 460 4 20.0Sam Houston St. 2006 11 19 376 3 19.8South Carolina St. †2014 12 28 556 2 19.8Morgan St. 2015 10 11 217 1 19.7The Citadel †2008 12 30 590 4 19.7Murray St. †2010 11 18 354 2 19.7Grambling †2009 11 23 449 2 19.5Towson †1994 10 27 526 1 19.5South Carolina St. 2015 11 18 350 3 19.4Wofford †2011 12 7 136 2 19.4Morehead St. †1997 10 15 291 1 19.4Northwestern St. †2000 11 24 466 3 19.4Norfolk St. 2008 12 13 251 1 19.3Alcorn 2006 10 26 502 3 19.3Texas St. †1995 11 23 443 0 19.3Southeastern La. 2012 11 10 193 2 19.3@Record for minimum 30 returns.
Kickoff ReturnsTeam Year G Ret Yds. TD Yds/RHampton †2004 12 38 1,157 6 *30.4North Dakota St. †2015 15 34 989 2 29.1Butler †1998 10 41 1,182 4 28.8San Diego †1999 11 45 1,277 1 28.4Hampton †2001 10 44 1,240 3 28.2Montana †2003 13 36 1,013 1 28.1Tennessee St. 1999 11 45 1,256 3 27.9Western Caro. †2005 9 25 686 2 27.4Morehead St. 2001 10 42 1,148 2 27.3Youngstown St. †1994 11 23 628 0 27.3Monmouth †1996 10 32 869 2 27.2Furman †2006 11 30 814 2 27.1Tennessee St. 2006 11 40 1,085 1 27.1James Madison 1998 12 32 867 1 27.1Southern U. †1995 11 39 1,054 3 27.0

All-Time Team Season Leaders 59
Team Year G Ret Yds. TD Yds/RWestern Caro. †1993 11 24 643 3 26.8Furman 2001 11 30 803 4 26.8Florida A&M †2008 12 45 1,202 3 26.7Robert Morris 2006 10 31 828 1 26.7Alabama A&M †1997 12 39 1,037 2 26.6N.C. Central †2013 12 54 1,432 4 26.5McNeese 1998 11 22 583 1 26.5St. Mary’s (CA) 1994 10 32 847 1 26.5Nicholls St. 2003 11 41 1,083 2 26.4Southern U. 2003 13 40 1,054 2 26.4
Turnover Margin
Team Year GFum. Gain
Int. Gain
Total Gain
Fum. Lost
Int. Lost
Total Lost
TO Mar.
Saint Peter’s †2001 11 20 27 47 6 6 12 *3.18Western Ky. †2000 11 18 25 43 13 0 13 2.73Bucknell †2011 11 17 22 39 4 8 12 2.45Canisius †1996 9 17 27 44 13 9 22 2.44Bethune-Cookman †2010 12 22 19 41 7 7 14 2.25Princeton †1995 10 15 22 37 10 5 15 2.20Eastern Ill. 1995 11 15 19 34 6 4 10 2.18Sacred Heart 2001 10 16 23 39 9 9 18 2.10Hofstra 1995 11 12 20 32 6 3 9 2.09Dayton 2001 11 6 31 37 7 7 14 2.09Richmond †2012 11 8 24 32 6 4 10 2.00UNI 1996 11 17 23 40 9 9 18 2.00Coastal Caro. †2004 11 11 27 38 10 6 16 2.00Dayton †2002 12 9 28 37 10 4 14 1.92St. John’s (NY) †1993 11 20 19 39 6 12 18 1.91Texas Southern †1997 11 18 18 36 10 5 15 1.91Wofford †2006 11 15 16 31 4 6 10 1.91Liberty †2009 11 12 17 29 3 5 8 1.91Yale †2000 10 9 21 30 2 9 11 1.90Robert Morris †1994 9 15 19 34 6 11 17 1.89Sam Houston St. 2011 15 19 23 42 6 8 14 1.87Grambling †2008 13 15 29 44 12 8 20 1.85Hampton 2004 12 20 23 43 13 8 21 1.83Southern U. 1995 11 15 21 36 10 6 16 1.82Liberty 1997 11 22 18 40 10 10 20 1.82

Team Champions 60
TEAM CHAMPIONS
ANNUAL OFFENSE CHAMPIONS
*Record.
Rushing Offense Year Team Yds/G1978 Jackson St. 314.51979 Jackson St. 288.41980 N.C. A&T 322.11981 Idaho 266.31982 Delaware 258.41983 Furman 287.11984 Delaware St. 377.31985 Missouri St. 298.71986 Northeastern 336.01987 Howard 381.61988 Eastern Ky. 303.01989 Ga. Southern 329.21990 Delaware St. 298.71991 VMI 316.91992 The Citadel 345.51993 Western Ky. 300.11994 The Citadel 382.01995 Massachusetts 302.51996 Southern Utah 330.81997 Western Ky. 366.01998 Southern Utah 386.01999 Ga. Southern *419.02000 Southern Utah 394.22001 Ga. Southern 323.62002 Ga. Southern 386.22003 Ga. Southern 335.62004 Ga. Southern 369.92005 Ga. Southern 386.82006 Central Conn. St. 284.92007 Ga. Southern 326.32008 VMI 357.52009 VMI 276.72010 Wofford 297.82011 Wofford 364.62012 Ga. Southern 399.42013 Cal Poly 309.12014 Cal Poly 351.82015 Cal Poly 387.32016 The Citadel 348.2
Passing OffenseYear Team Yds/G1978 Portland St. 367.11979 Portland St. 368.91980 Portland St. 434.91981 Idaho St. 325.71982 West Tex. A&M 313.71983 Idaho 336.11984 Mississippi Val. *496.81985 Rhode Island 384.31986 Eastern Ill. 326.11987 Holy Cross 358.41988 Lehigh 330.11989 Idaho 374.31990 Weber St. 342.2
Year Team Yds/G1991 Weber St. 389.11992 Alcorn 360.51993 Montana 359.01994 Alcorn 442.31995 Montana 408.21996 Montana 339.61997 CSUN 358.11998 Florida A&M 400.61999 Towson 381.22000 Penn 342.72001 Jackson St. 344.42002 Grambling 360.72003 Grambling 321.82004 Southeastern La. 408.02005 Grambling 367.32006 San Diego 293.32007 Portland St. 360.92008 Portland St. 372.22009 SFA 343.72010 SFA 362.22011 Eastern Wash. 368.42012 Old Dominion 393.82013 SFA 389.02014 Idaho St. 348.12015 Eastern Wash. 353.32016 Eastern Wash. 401.0
Offensive Passing EfficiencyYear Team Yds/G2000 Western Ky. 164.62001 Eastern Ill. 176.32002 San Diego 158.72003 San Diego 169.52004 Ga. Southern 173.52005 Grambling 172.92006 San Diego 170.02007 San Diego *197.42008 Wofford 169.92009 Lafayette 161.62010 Jacksonville 169.32011 Furman 171.32012 Cal Poly 175.72013 Eastern Wash. 182.62014 Villanova 175.22015 Northern Ariz. 180.22016 James Madison 181.7
Total OffenseYear Team Yds/G1978 Portland St. 477.41979 Portland St. 460.71980 Portland St. 504.31981 Idaho 438.81982 Drake 444.81983 Idaho 479.51984 Mississippi Val. *640.11985 Weber St. 516.11986 Nevada 492.01987 Holy Cross 552.21988 Lehigh 485.61989 Idaho 495.91990 William & Mary 498.7
Year Team Yds/G1991 Weber St. 581.41992 Alcorn 502.91993 Idaho 532.01994 Alcorn 597.91995 Montana 512.51996 Northern Ariz. 522.81997 Eastern Wash. 505.61998 Florida A&M 535.71999 Ga. Southern 551.72000 Morehead St. 523.92001 Eastern Wash. 514.52002 Jackson St. 485.52003 San Diego 483.32004 Southeastern La. 537.12005 Grambling 495.62006 San Diego 494.32007 Appalachian St. 488.32008 Cal Poly 487.52009 Fordham 488.82010 Jacksonville 486.32011 Jackson St. 490.92012 Old Dominion 548.22013 Eastern Ill. 589.52014 Yale 571.52015 Sam Houston St. 531.72016 Sam Houston St. 547.3
Scoring OffenseYear Team Pts/G1978 Nevada 35.61979 Portland St. 34.31980 Portland St. 49.21981 Delaware 34.11982 Delaware 34.11983 Mississippi Val. 39.21984 Mississippi Val. *60.91985 Mississippi Val. 41.51986 Nevada 39.41987 Holy Cross 46.51988 Lafayette 38.21989 Grambling 37.11990 Jackson St. 38.01991 Nevada 45.11992 Marshall 42.41993 Idaho 47.51994 Alcorn 45.71995 Montana 42.51996 Northern Ariz. 43.21997 Morehead St. 41.91998 Florida A&M 49.61999 Ga. Southern 50.02000 Morehead St. 41.62001 Eastern Wash. 41.92002 Grambling 38.92003 Southern U. 40.02004 Ga. Southern 47.02005 Grambling 44.12006 San Diego 42.82007 San Diego 44.42008 Cal Poly 44.42009 Liberty 36.42010 Jacksonville 42.22011 Stony Brook 38.0

Team Champions 61
Year Team Pts/G2012 Old Dominion 45.22013 Eastern Ill. 48.22014 Eastern Wash. 44.12015 Prairie View 44.92016 Sam Houston St. 49.5
ANNUAL DEFENSE CHAMPIONS
*Record.
Rushing DefenseYear Team Yds/G1978 Florida A&M 48.61979 Alcorn 56.71980 South Carolina St. 61.81981 South Carolina St. 60.81982 South Carolina St. 59.41983 Jackson St. 79.21984 Grambling 44.51985 Jackson St. 63.01986 Eastern Ky. 62.81987 Southern U. 64.51988 SFA 83.51989 Montana 70.21990 Delaware St. 77.21991 Boise St. 84.41992 Villanova 77.81993 Wagner 87.01994 Idaho 65.31995 McNeese 60.91996 Georgetown 53.21997 Marist 40.41998 Fairfield 61.71999 Jackson St. 67.82000 Alabama A&M *39.72001 Penn 58.42002 Penn 55.82003 Monmouth 64.32004 Cal Poly 84.32005 Duquesne 72.52006 Maine 63.92007 Morehead St. 53.92008 Northern Ariz. 59.82009 William & Mary 61.12010 Penn 73.62011 Sam Houston St. 72.92012 Harvard 69.42013 N.C. A&T 90.32014 Bethune-Cookman 79.92015 Harvard 84.42016 Colgate 69.4
Passing DefenseYear Team Yds/G1978 Southern U. 85.61979 Mississippi Val. 64.21980 Howard 93.81981 Bethune-Cookman *59.91982 Northeastern 98.81983 Louisiana Tech 111.41984 Louisiana Tech 105.51985 Dartmouth 110.31986 Bethune-Cookman 99.81987 Alcorn 101.3
Year Team Yds/G1988 Middle Tenn. 90.81989 Chattanooga 104.41990 Middle Tenn. 78.831991 South Carolina St. 70.011992 Middle Tenn. 76.931993 Georgetown 76.921994 Penn 63.151995 Canisius 69.131996 Canisius 71.991997 McNeese 79.051998 Davidson 74.641999 Robert Morris 80.802000 Bethune-Cookman 76.392001 Saint Peter’s 63.262002 Sacred Heart *61.032003 South Carolina St. 93.142004 Coastal Caro. 86.792005 Duquesne 79.762006 Robert Morris 88.702007 Harvard 89.422008 Grambling 87.852009 Dayton 96.712010 Texas Southern 78.902011 Jackson St. 88.862012 N.C. A&T 97.882013 South Carolina St. 92.352014 Southeastern La. 94.302015 South Carolina St. 90.002016 San Diego 89.90Beginning in 1990, ranked on passing-efficiency defense rating points instead of per-game yard-age allowed.
Total DefenseYear Team Yds/G1978 Florida A&M *149.91979 Alcorn 166.31980 Massachusetts 193.51981 South Carolina St. 204.01982 South Carolina St. 191.41983 Grambling 206.01984 Tennessee St. 187.01985 Arkansas St. 258.81986 Tennessee St. 178.51987 Southern U. 202.81988 Alcorn 215.41989 Howard 220.01990 Middle Tenn. 244.81991 South Carolina St. 208.91992 South Carolina St. 250.91993 McNeese 249.51994 Penn 218.91995 Georgetown 216.41996 Georgetown 218.21997 Marist 213.61998 Fairfield 213.81999 St. John’s (NY) 199.72000 Monmouth 232.12001 Saint Peter’s 157.72002 Duquesne 188.02003 Monmouth 244.32004 Dayton 263.12005 Duquesne 205.92006 Robert Morris 228.42007 Lafayette 260.92008 Morgan St. 213.42009 Penn 217.6
Year Team Yds/G2010 Texas Southern 204.92011 Texas Southern 245.02012 North Dakota St. 234.52013 South Carolina St. 238.02014 Bethune-Cookman 237.52015 Stony Brook 250.12016 Villanova 259.8
Scoring DefenseYear Team Pts/G1978 South Carolina St. *6.51979 Lehigh 7.21980 Murray St. 9.11981 Jackson St. 9.41982 Western Mich. 7.11983 Grambling 8.61984 Northwestern St. 9.01985 Appalachian St. 9.91986 Tennessee St. 8.31987 Holy Cross 10.01988 Furman 9.71989 Howard 10.51990 Middle Tenn. 9.21991 Villanova 12.01992 The Citadel 13.01993 Marshall 11.21994 Penn 7.61995 McNeese 8.91996 Duquesne 10.11997 McNeese 10.51998 Western Ill. 9.41999 St. John’s (NY) 12.92000 Western Ky. 11.62001 Saint Peter’s 8.22002 Duquesne 9.62003 Monmouth 8.52004 Southern Ill. 13.22005 Massachusetts 13.32006 Monmouth 12.72007 Yale 13.72008 Yale 10.52009 Penn 9.52010 Delaware 12.12011 North Dakota St. 12.72012 North Dakota St. 11.52013 North Dakota St. 11.32014 Harvard 12.32015 Dartmouth 10.12016 Villanova 15.0
OTHER TEAM CHAMPIONS
Net Punting Year Team Yds/K1992 SFA 38.21993 Northern Ariz. 40.11994 Marshall 42.91995 Eastern Ky. 40.41996 Marshall 44.51997 James Madison 40.51998 Western Ill. 41.5
Western Caro. 41.51999 Missouri St. 40.02000 Idaho St. 39.22001 Idaho St. 44.3

Team Champions 62
Year Team Yds/K2002 Idaho St. 42.72003 Illinois St. 39.22004 Northern Ariz. 44.92005 Massachusetts 38.42006 Northern Ariz. 43.02007 Fordham 40.52008 Dartmouth 37.42009 Southern Utah 45.12010 Ga. Southern 39.22011 Fordham 40.92012 UC Davis 41.42013 Portland St. 41.72014 Montana St. 40.62015 Northern Ariz. 40.42016 Wofford 41.6
Punt ReturnsYear Team Yds/R1992 South Carolina St. 17.91993 Montana 14.61994 Towson 19.51995 Texas St. 19.31996 Northern Ariz. 16.61997 Morehead St. 19.41998 Buffalo 17.81999 SFA 19.12000 Northwestern St. 19.42001 N.C. A&T 23.02002 Hampton 17.82003 Eastern Ky. 16.52004 Jacksonville St. 18.62005 Southern U. 19.12006 Norfolk St. 20.72007 Hampton 19.02008 The Citadel 19.72009 Grambling 19.52010 Murray St. 19.72011 Wofford 19.42012 N.C. Central 24.52013 Eastern Ill. 20.02014 South Carolina St. 19.82015 Northern Colo. 24.22016 James Madison *26.7
Kickoff ReturnsYear Team Yds/R1992 Penn 25.01993 Western Caro. 26.81994 Youngstown St. 27.31995 Southern U. 27.01996 Monmouth 27.21997 Furman 27.11998 Butler 28.81999 Tennessee St. 27.92000 Weber St. 25.22001 Hampton 28.22002 Portland St. 25.22003 Montana 28.12004 Hampton 30.42005 Western Caro. 27.42006 James Madison 27.12007 San Diego 28.42008 Florida A&M 26.72009 James Madison 25.52010 Yale 25.42011 Southern Utah 26.3
Year Team Yds/R2012 UC Davis 26.32013 N.C. Central 26.52014 UNI 26.32015 North Dakota St. 29.12016 Towson 25.6
Turnover MarginYear Team TO Mar.1992 Howard 1.64
Youngstown St. 1.641993 St. John’s (NY) 1.911994 Robert Morris 1.891995 Princeton 2.201996 Canisius 2.441997 Texas Southern 1.911998 Yale 1.701999 Grambling 1.45
Valparaiso 1.452000 Western Ky. 2.732001 Saint Peter’s 3.182002 Dayton 1.922003 Wofford 1.642004 Coastal Caro. 2.002005 New Hampshire 1.542006 Wofford 1.912007 Harvard 1.802008 Grambling 1.852009 Liberty 1.912010 Bethune-Cookman 2.252011 Bucknell 2.452012 Richmond 2.002013 Sacred Heart 1.542014 Albany (NY) 1.252015 Southern Utah 1.672016 South Carolina St. 1.64
DEFENSIVE SINGLE-GAME RECORDS
(Since 2000)
Tackles For LossTFL Team (Opponent) Date23 Central Ark. (Nicholls St.) Sept. 27, 201422 Illinois St. (Western Ill.) Nov. 4, 200022 Butler (Wittenberg) Sept. 6, 201422 North Dakota (Stony Brook) Sept. 20, 201421 Eastern Wash. (Montana St.) Oct. 7, 200021 Duquesne (Iona) Oct. 9, 200421 Wagner (Sacred Heart) Nov. 1, 201421 Eastern Ill. (Tennessee Tech) Nov. 1, 201421 Grambling (Mississippi Val.) Nov. 6, 2014
Pass SacksPS Team (Opponent) Date14 Alcorn (Mississippi Val.) Oct. 10, 200912 Illinois St. (Western Ill.) Nov. 4, 200012 Sam Houston St. (Nicholls St.) Oct. 9, 201012 Stony Brook (Howard) Nov. 7, 201511 Fla. Atlantic (Bethune-Cookman) Sept. 7, 200211 Massachusetts (American Int’l) Sept. 14, 200211 Duquesne (La Salle) Nov. 5, 200511 Dayton [Central St. (OH)] Sept. 15, 200711 UNI (North Dakota St.) Sept. 11, 2010
PS Team (Opponent) Date11 Jacksonville St. (McNeese) Dec. 7, 201311 Grambling (Mississippi Val.) Nov. 6, 201411 South Carolina St. (Hampton) Oct. 31, 2015
Passed Defended(Pass interceptions and pass break-ups)PD Team (Opponent) Date18 Hampton (Delaware St.) Sept. 30, 201018 Princeton (Brown) Oct. 18, 201417 Penn (Lafayette) Sept. 21, 200217 Southeastern La. (SFA) Oct. 15, 201616 Sam Houston St. (Incarnate
Word)Oct. 10, 2015
16 New Hampshire (Dartmouth) Sept. 17, 201615 Murray St. (Eastern Ky.) Nov. 5, 201615 Jacksonville St. (UT Martin) Nov. 19, 201614 Holy Cross (Penn) Oct. 7, 200014 Massachusetts (Maine) Oct. 12, 200214 Campbell (Morehead St.) Oct. 24, 2015
Forced FumblesFF Team (Opponent) Date7 Monmouth (Robert Morris) Oct. 4, 20146 Delaware (Ga. Southern) Dec. 9, 20006 Delaware (The Citadel) Sept. 9, 20026 Fla. Atlantic (Troy) Oct. 26, 20026 Jacksonville (Valparaiso) Sept. 27, 20036 Southeastern La. (Florida Tech) Sept. 12, 20156 Southern Utah (Cal Poly) Oct. 31, 20155 Ga. Southern (Savannah St.) Sept. 1, 20015 Illinois St. (Missouri St.) Oct. 5, 20025 Delaware (Massachusetts) Nov. 15, 20035 Fla. Atlantic (Bethune-Cookman) Nov. 29, 20035 Southern U. (Alcorn) Spet. 27, 20145 James Madison (Towson) Oct. 11, 20145 Kennesaw St. (Edward Waters) Sept. 12, 20155 Nicholls St. (SFA) Oct. 10, 20155 Eastern Ill. (Murray St.) Oct. 31, 20155 Montana St. (North Dakota) Oct. 31, 20155 Tennessee St. (Murray St.) Nov. 7, 20155 Central Ark. (Arkansas St.) Sept. 24, 20165 Stony Brook (Delaware) Oct. 22, 2016

Toughest-Schedule Annual Leaders 63
TOUGHEST-SCHEDULE ANNUAL LEADERSThe FCS toughest-schedule program, which began in 1982, is based on what all FCS oppo-nents did against other FCS and FBS teams when not playing the team in question. Games against non-Division I teams are deleted. The top two leaders by year:
¢Opponents’ Record
Year Team (Record†) W L T Pct.1982 Massachusetts (5-6-0) 50 30 1 .623
Lehigh (4-6-0) 44 31 0 .5871983 Florida A&M (7-4-0) 42 23 3 .640
Grambling (8-1-2) 49 31 0 .6131984 North Texas (2-9-0) 55 35 2 .609
VMI (1-9-0) 53 37 2 .5871985 South Carolina St. (5-6-0) 43 20 1 .680
Lehigh (5-6-0) 47 33 1 .5861986 James Madison (5-5-1) 46 28 1 .620
Bucknell (3-7-0) 43 27 0 .6141987 Ga. Southern (8-3-0) 47 31 0 .603
Northeastern (6-5-0) 50 37 0 .5751988 Northwestern St. (9-2-0) 54 36 2 .598
Ga. Southern (9-2-0) 43 31 1 .5801989 Liberty (7-3-0) 39 22 2 .635
Western Caro. (3-7-1) 46 34 2 .5731990 Ga. Southern (8-3-0) 53 25 1 .677
Western Ky. (2-8-0) 55 36 1 .6031991 Bucknell (1-9-0) 53 29 1 .645
William & Mary (5-6-0) 62 43 0 .5901992 VMI (3-8-0) 46 36 0 .561
Harvard (3-7-0) 51 40 0 .5601993 Samford (5-6-0) 55 26 0 .679
Delaware St. (6-5-0) 44 30 0 .5951994 Montana (9-2-0) 46 30 1 .604
McNeese (9-2-0) 44 29 5 .5961995 Western Ky. (2-8-0) 59 32 0 .648
Nicholls St. (0-11-0) 61 38 0 .6161996 Indiana St. (6-5) 50 32 0 .610
Towson (6-4) 42 29 0 .5921997 Lehigh (4-7) 65 39 0 .625
William & Mary (7-4) 65 42 0 .6071998 UConn (9-2) 66 41 0 .617
New Hampshire (4-7) 54 40 0 .5961999 Elon (9-2) 50 26 0 .658
Cal Poly (3-8) 52 32 0 .6192000 Elon (7-4) 59 31 0 .656
Indiana St. (1-10) 62 38 0 .6202001 Elon (2-9) 63 36 0 .636
Nicholls St. (3-8) 55 34 0 .6182002 McNeese (13-2) 104 45 0 .698
Western Ky. (12-3) 98 49 0 .6672003 Delaware (15-1) 104 60 0 .634
Western Ky. (9-4) 68 46 0 .5962004 Delaware (9-4) 84 46 0 .646
Villanova (6-5) 73 44 0 .6242005 Appalachian St. (12-3) 106 51 0 .675
Princeton (7-3) 55 37 0 .5982006 Youngstown St. (11-3) 83 51 0 .619
Northeastern (5-6) 70 44 0 .6142007 Southern Utah (0-11) 71 28 0 .717
Delaware (11-4) 98 55 0 .6412008 James Madison (12-2) 103 56 0 .648
Richmond (13-3) 112 69 0 .6192009 Villanova (14-1) 111 51 0 .685
William & Mary (11-3) 96 56 0 .6322010 Villanova (9-5) 101 51 0 .664
¢Opponents’ Record
Year Team (Record†) W L T Pct.Delaware (12-3) 93 60 0 .608
2011 Lafayette (11-2) 71 43 0 .623Missouri St. (2-9) 75 47 0 .615
2012 Ga. Southern (10-4) 92 53 0 .634Sam Houston St. (11-4) 89 59 0 .601
2013 Towson (13-3) 102 55 0 .650North Dakota St. (15-0) 88 50 0 .638
2014 Indiana St. (8-6) 89 40 0 .690Liberty (9-5) 71 35 0 .670
2015 Western Ill. (7-6) 78 36 0 .684North Dakota St. (13-2) 82 47 0 .636
2016 North Dakota St. (12-2) 83 37 0 .692Youngstown St. (12-4) 98 50 0 .662
†Beginning in 2002, all playoff or postseason games are included in the record. ¢When not playing the team listed.
TOP 10 TOUGHEST-SCHEDULE LEADERS SINCE 2003
$When not playing the team listed.
2003
Team$Opp.
Record Pct.1. Delaware 104-60 .6342. Western Ky. 68-46 .5963. Princeton 58-40 .5924. Wofford 81-57 .5875. Idaho St. 58-41 .5866. Western Ill. 75-54 .5817. Massachusetts 84-62 .5758. Portland St. 57-44 .5649. Northeastern 66-51 .56410. Richmond 67-52 .563
2004
Team$Opp.
Record Pct.1. Delaware 84-46 .6462. Villanova 73-44 .6243. Sam Houston St. 71-45 .6124. James Madison 92-59 .6095. Northeastern 63-41 .6066. William & Mary 85-60 .5867. Massachusetts 66-49 .5748. Yale 52-40 .5659. Jackson St. 57-44 .56410. Texas St. 51-40 .560
2005
Team$Opp.
Record Pct.1. Appalachian St. 106-51 .6752. Princeton 55-37 .5983. Furman 83-56 .5974. Dartmouth 57-39 .5945. Yale 53-37 .5896. Richmond 77-54 .5887. UNI 81-58 .5838. Hofstra 66-48 .579
Team$Opp.
Record Pct.9. James Madison 56-41 .57710. Harvard 54-40 .574
2006
Team$Opp.
Record Pct.1. Youngstown St. 83-51 .6192. Northeastern 70-44 .6143. Massachusetts 96-63 .6044. Yale 55-38 .5915. Appalachian St. 85-61 .5826. Maine 63-46 .5787. Ga. Southern 61-45 .5758. Dartmouth 54-41 .5689. San Diego 46-35 .56810. Harvard 53-41 .564
2007
Team$Opp.
Record Pct.1. Southern Utah 71-28 .7172. Delaware 98-55 .6413. Appalachian St. 89-57 .6104. William & Mary 71-48 .5975. Illinois St. 66-45 .5956. Towson 69-48 .5907. Western Caro. 66-46 .5898. Albany (NY) 65-47 .5809. Massachusetts 79-58 .57710. New Hampshire 72-54 .571
2008
Team$Opp.
Record Pct.1. James Madison 103-56 .6482. Richmond 112-69 .6193. Delaware 79-49 .6174. Villanova 89-57 .6105. Massachusetts 82-54 .6036. Appalachian St. 87-63 .5807. Weber St. 72-53 .5768. Chattanooga 67-51 .5689. Dartmouth 54-42 .56310. Lehigh 60-47 .561
2009
Team$Opp.
Record Pct.1. Villanova 111-51 .6852. William & Mary 96-56 .6323. Delaware 67-43 .6094. Appalachian St. 88-58 .6035. Lehigh 66-46 .5896. Towson 71-51 .5827. Montana 84-61 .5798. Dartmouth 55-41 .5739. Davidson 46-35 .56810. Richmond 77-62 .554

Toughest-Schedule Annual Leaders 64
2010
Team$Opp.
Record Pct.1. Villanova 101-51 .6642. Delaware 93-60 .6083. New Hampshire 85-55 .6074. Savannah St. 53-35 .6025. Chattanooga 69-47 .5956. Eastern Wash. 88-60 .5957. William & Mary 79-54 .5948. James Madison 72-50 .5909. Ga. Southern 88-65 .57510. Robert Morris 61-47 .565
2011
Team$Opp.
Record Pct.1. Lafayette 71-43 .6232. Missouri St. 75-47 .6153. Ga. Southern 84-53 .6134. Western Ill. 74-48 .6075. Villanova 69-48 .5906. Cal Poly 57-40 .5887. Holy Cross 64-46 .5828. New Hampshire 74-55 .5749. Lehigh 76-57 .57110. North Dakota St. 93-70 .571
2012
Team$Opp.
Record Pct.1. Ga. Southern 92-53 .6342. Sam Houston St. 89-59 .6013. North Dakota 61-42 .5924. Holy Cross 65-45 .5915. Missouri St. 70-49 .5886. North Dakota St. 72-54 .5716. Wofford 72-54 .5718. South Dakota 67-51 .5688. Towson 67-51 .56810. UC Davis 60-46 .566
2013
Team$Opp.
Record Pct.1. Towson 102-55 .6502. North Dakota St. 88-50 .6383. New Hampshire 86-50 .6324. South Dakota St. 81-49 .6235. Coastal Caro. 76-48 .6136. Villanova 78-51 .6057. Furman 55-36 .6048. Eastern Wash. 73-48 .6039. Jacksonville St. 74-49 .60210. Southeast Mo. St. 60-40 .600
2014
Team$Opp.
Record Pct.1. Indiana St. 89-40 .6902. Liberty 71-35 .6703. Sam Houston St. 92-46 .6674. South Dakota 70-38 .6485. Western Ill. 67-38 .6386. South Dakota St. 73-43 .6297. Missouri St. 73-45 .619
Team$Opp.
Record Pct.8. North Dakota St. 82-57 .5909. Elon 64-40 .61510. Penn 58-37 .611
2015
Team$Opp.
Record Pct.1. Western Ill. 78-36 .6842. North Dakota St. 82-47 .6363. Elon 59-36 .6214. Jacksonville St. 73-46 .6135. James Madison 66-42 .6116. South Dakota St. 68-44 .6077. Chattanooga 54-36 .600
UNI 69-46 .6009. Sam Houston St. 65-44 .59610. Charleston So. 47-32 .595
2016
Team$Opp.
Record Pct.1. North Dakota St. 83-37 .6922. Youngstown St. 98-50 .6623. Richmond 79-45 .6374. James Madison 82-48 .6315. Cal Poly 58-34 .6306. South Dakota 64-39 .6217. South Dakota St. 67-41 .6208. Samford 60-37 .6199. Charleston So. 42-26 .61810. Maine 54-34 .614

Most-Improved Teams 65
MOST-IMPROVED TEAMS
Year Team Coach$Games
Improved From Record To Record1978 Western Ky. Jimmy Feix 6½ 1977 1-8-1 1978 8-2-01979 Murray St. Mike Gottfried 5 1978 4-7-0 1979 *9-2-11980 Idaho St. #Dave Kragthorpe 6 1979 0-11-0 1980 6-5-01981 Lafayette #Bill Russo 5½ 1980 3-7-0 1981 9-2-01982 Penn Jerry Berndt 6 1981 1-9-0 1982 7-3-01983 North Texas Corky Nelson 5½ 1982 2-9-0 1983 *8-4-0
Southern Ill. Rey Dempsey 5½ 1982 6-5-0 1983 *13-1-01984 Montana St. Dave Arnold 9½ 1983 1-10-0 1984 *12-2-0 1985 Appalachian St. Sparky Woods 4 1984 4-7-0 1985 8-3-0
Massachusetts Bob Stull 4 1984 3-8-0 1985 7-4-0West Tex. A&M #Bill Kelly 4 1984 3-8-0 1985 6-3-1
1986 Morehead St. Bill Baldridge 6 1985 1-10-0 1986 7-4-01987 Weber St. Mike Price 6 1986 3-8-0 1987 *10-3-01988 SFA Jim Hess 5½ 1987 3-7-1 1988 *10-3-01989 Yale Carmen Cozza 4½ 1988 3-6-1 1989 8-2-01990 Nevada Chris Ault 4 1989 7-4-0 1990 *13-2-0
N.C. A&T Bill Hayes 4 1989 5-6-0 1990 9-2-01991 Alcorn #Cardell Jones 5 1990 2-7-0 1991 7-2-1
Austin Peay #Roy Gregory 5 1990 0-11-0 1991 5-6-0Princeton Steve Tosches 5 1990 3-7-0 1991 8-2-0Southern Ill. Bob Smith 5 1990 2-9-0 1991 7-4-0
1992 Howard Steve Wilson 5 1991 2-9-0 1992 7-4-0Penn #Al Bagnoli 5 1991 2-8-0 1992 7-3-0Richmond Jim Marshall 5 1991 2-9-0 1992 7-4-0Tennessee Tech Jim Ragland 5 1991 2-9-0 1992 7-4-0Western Caro. Steve Hodgin 5 1991 2-9-0 1992 7-4-0
1993 Boston U. Dan Allen 8 1992 3-8-0 1993 *12-1-01994 Boise St. Pokey Allen 8 1993 3-8-0 1994 *13-2-01995 Murray St. Houston Nutt 5½ 1994 5-6-0 1995 *11-1-01996 Nicholls St. Darren Barbier 7½ 1995 0-11 1996 *8-41997 McNeese Bobby Keasler 8 1996 3-8 1997 *13-21998 Massachusetts #Mark Whipple 8 1997 2-9 1998 *12-31999 SFA #Mike Santiago 5 1998 3-8 1999 8-32000 Sacred Heart #Jim Fleming 8 1999 2-9 2000 10-12001 Alcorn Johnny Thomas 6 2000 0-11 2001 6-5
Saint Peter’s Rob Stern 6 2000 4-7 2001 10-12002 Mississippi Val. #Willie Totten 5 2001 0-11 2002 5-62003 Fla. Atlantic Howard Schnellenberger 7½ 2002 2-9 2003 *11-32004 Sam Houston St. Ron Randleman 7½ 2003 2-9 2004 *11-32005 Richmond Dave Clawson 5 2004 3-8 2005 *9-4
Weber St. #Ron McBride 5 2004 1-10 2005 6-52006 Bucknell Tim Landis 5 2005 1-10 2006 6-5
Liberty Danny Rocco 5 2005 1-10 2006 6-52007 Dayton Mike Kelly 6 2006 4-6 2007 11-12008 Florida A&M Joe Taylor 5½ 2007 3-8 2008 9-32009 Chattanooga Russ Huesman 5½ 2008 1-11 2009 6-5
SFA J.C. Harper 5½ 2008 4-8 2009 *10-32010 Southeast Mo. St. Tony Samuel 6½ 2009 2-9 2010 *9-32011 Towson Rob Ambrose 7½ 2010 1-10 2011 *9-32012 Villanova Andy Talley 5½ 2011 2-9 2012 *8-42013 Sacred Heart Mark Nofri 7 2012 2-9 2013 *10-32014 Albany (NY) Greg Gattuso 6 2013 1-11 2014 7-5
Illinois St. Brock Spack 6 2013 5-6 2014 *13-2Indiana St. Mike Sanford 6 2013 1-11 2014 *8-6
2015 Portland St. Bruce Barnum 6 2014 3-9 2015 *9-32016 Wagner Jason Houghtaling 5 2015 1-10 2016 6-5$To determine games improved, add the difference in victories between the two seasons to the difference in losses, then divide by two; ties not counted.*FCS playoff included. #First year as head coach at that college.

Most-Improved Teams 66
All-Time Most-Improved TeamsGames Team (Year)9½ Montana St. (1984)8 Boston U. (1993)8 Boise St. (1994)8 McNeese (1997)8 Massachusetts (1998)8 Sacred Heart (2000)7½ Nicholls St. (1996)7½ Fla. Atlantic (2003)7½ Sam Houston St. (2004)7½ Towson (2011)7 Lehigh (1998)7 Delaware (2003)7 Monmouth (2003)7 Sacred Heart (2013)6½ Western Ky. (1978)6½ Valparaiso (2003)6½ Southeast Mo. St. (2010)6 Idaho St. (1980)6 Penn (1982)6 Morehead St. (1986)6 Weber St. (1987)6 Colgate (1996)6 Jacksonville St. (1998)6 Alcorn (2001)6 Saint Peter’s (2001)6 Southern Ill. (2003)6 Dayton (2007)6 Western Ill. (2010)6 Wofford (2010)6 Sam Houston St. (2011)6 Albany (NY) (2014)6 Illinois St. (2014)6 Indiana St. (2014)6 Portland St. (2015)
2016 Most-Improved Teams(Includes Playoff Games)Team (Coach) 2015 2016 ImprovedWagner (Jason Houghtaling) 1-10 6-5 5Eastern Wash. (Beau Baldwin) 6-5 12-2 4½Youngstown St. (Bo Pelini) 5-6 12-4 4½Albany (NY) (Greg Gattuso) 3-8 7-4 4James Madison (Mike Houston) 9-3 14-1 3½Wofford (Mike Ayers) 5-6 10-4 3½$To determine games improved, add the difference in victories between the two seasons to the difference in losses, then divide by two. Includes postsea-son games.

All-Time Team Won-Lost Records 67
ALL-TIME TEAM WON-LOST RECORDSIncludes records as senior college only. Bowl and playoff games are includ-ed, and each tie game is computed as half won and half lost. Some records adjusted by the NCAA Committee on Infractions. Tiebreaker rule began with 1996 season.
By Percentage (Min. 10 Years)Team 1st Yr. Yrs. Won Lost Tied Pct.Yale 1872 144 893 373 55 .697Grambling 1941 74 552 242 15 .692Harvard 1874 142 864 388 50 .683Princeton 1869 147 817 406 50 .661Tennessee St. 1912 93 556 283 32 .657North Dakota St. 1894 120 696 370 34 .648Dayton 1905 109 668 363 25 .644Florida A&M 1907 99 579 319 22 .641Penn 1876 140 844 487 42 .630McNeese 1951 66 449 263 14 .628South Carolina St. 1907 94 530 322 27 .618North Dakota 1894 120 641 397 30 .614Jackson St. 1946 71 451 281 15 .614UNI 1895 118 655 410 47 .610Eastern Ky. 1909 104 591 375 38 .608Southern U. 1919 95 545 348 25 .607Bethune-Cookman 1925 91 482 310 27 .605Dartmouth 1881 135 689 454 46 .599Delaware 1889 125 682 451 43 .598Youngstown St. 1938 76 470 314 17 .597Albany (NY) 1973 44 273 186 0 .595Central Ark. 1908 105 566 384 42 .592James Madison 1973 44 294 206 4 .587San Diego 1956 50 290 208 6 .581Jacksonville St. 1904 107 554 395 39 .580
By VictoriesTeam 1st Yr. Yrs. Won Lost Tied Pct.Yale 1872 144 893 373 55 .697Harvard 1874 142 864 388 50 .683Penn 1876 140 844 487 42 .630Princeton 1869 147 817 406 50 .661North Dakota St. 1894 120 696 370 34 .648Dartmouth 1881 135 689 454 46 .599Lehigh 1884 133 686 588 45 .537Delaware 1889 125 682 451 43 .598Lafayette 1882 135 672 597 39 .529Dayton 1905 109 668 363 25 .644UNI 1895 118 655 410 47 .610North Dakota 1894 120 641 397 30 .614Colgate 1890 126 639 482 50 .567Cornell 1887 129 638 516 34 .551Holy Cross 1896 121 623 516 55 .545Villanova 1894 119 612 474 41 .561Brown 1878 131 610 569 40 .517Drake 1893 123 607 507 29 .544Bucknell 1883 131 595 577 51 .507Furman 1889 111 594 467 38 .558Eastern Ky. 1909 104 591 375 38 .608Montana 1897 117 581 492 26 .540South Dakota St. 1897 118 580 459 36 .556Florida A&M 1907 99 579 319 22 .641Butler 1887 127 578 457 35 .557
Alphabetical ListingTeam 1st Yr. Yrs. Won Lost Tied Pct.Alabama A&M 1912 92 412 398 33 .508Alabama St. 1901 111 475 462 43 .507
Team 1st Yr. Yrs. Won Lost Tied Pct.Albany (NY) 1973 44 273 186 0 .595Alcorn 1921 94 465 357 39 .563Ark.-Pine Bluff 1928 87 346 442 44 .442Austin Peay 1930 80 275 531 16 .344Bethune-Cookman 1925 91 482 310 27 .605Brown 1878 131 610 569 40 .517Bryant 1999 18 101 89 0 .532Bucknell 1883 131 595 577 51 .507Butler 1887 127 578 457 35 .557Cal Poly 1915 98 502 399 19 .556Campbell 2008 9 23 68 0 .253Central Ark. 1908 105 566 384 42 .592Central Conn. St. 1935 78 313 366 21 .462Charleston So. 1991 26 116 170 0 .406Chattanooga 1904 109 526 521 33 .502Colgate 1890 126 639 482 50 .567Columbia 1870 126 378 668 43 .367Cornell 1887 129 638 516 34 .551Dartmouth 1881 135 689 454 46 .599Davidson 1896 119 421 612 45 .411Dayton 1905 109 668 363 25 .644Delaware 1889 125 682 451 43 .598Delaware St. 1924 89 350 423 11 .453Drake 1893 123 607 507 29 .544Duquesne 1902 69 361 280 18 .561Eastern Ill. 1899 116 509 517 44 .496Eastern Ky. 1909 104 591 375 38 .608Eastern Wash. 1901 108 531 404 22 .566Elon 1909 95 495 443 18 .527ETSU 1920 82 349 413 27 .459Florida A&M 1907 99 579 319 22 .641Fordham 1882 115 534 426 48 .554Furman 1889 111 594 467 38 .558Gardner-Webb 1970 47 243 262 2 .481Georgetown 1887 105 470 409 32 .533Grambling 1941 74 552 242 15 .692Hampton 1902 115 558 417 36 .570Harvard 1874 142 864 388 50 .683Holy Cross 1896 121 623 516 55 .545Houston Baptist 2013 4 10 29 0 .256Howard 1893 120 494 455 40 .520Idaho St. 1902 112 462 508 20 .477Illinois St. 1887 121 499 538 68 .482Indiana St. 1896 104 383 519 23 .426Jackson St. 1946 71 451 281 15 .614Jacksonville 1998 19 106 94 0 .530Jacksonville St. 1904 107 554 395 39 .580James Madison 1973 44 294 206 4 .587Kennesaw St. 2015 2 14 8 0 .636Lafayette 1882 135 672 597 39 .529Lamar University 1951 46 205 271 9 .432Lehigh 1884 133 686 588 45 .537Liberty 1973 44 240 226 4 .515Maine 1892 125 523 497 38 .512Marist 1978 39 173 211 3 .451McNeese 1951 66 449 263 14 .628Mercer 1892 43 152 181 14 .458Mississippi Val. 1953 64 239 381 12 .388Missouri St. 1909 105 463 492 40 .485Monmouth 1993 24 135 115 0 .540Montana 1897 117 581 492 26 .540Montana St. 1897 113 490 480 34 .505Morehead St. 1927 87 340 464 22 .425Morgan St. 1920 97 447 416 35 .517Murray St. 1924 92 473 426 36 .525

All-Time Team Won-Lost Records 68
Team 1st Yr. Yrs. Won Lost Tied Pct.N.C. A&T 1924 93 485 406 40 .542N.C. Central 1923 92 459 376 27 .548New Hampshire 1893 120 565 462 54 .548Nicholls St. 1972 45 193 298 4 .394Norfolk St. 1938 76 325 354 13 .479North Dakota 1894 120 641 397 30 .614North Dakota St. 1894 120 696 370 34 .648Northern Ariz. 1915 102 466 444 23 .512Northern Colo. 1893 104 438 465 23 .485Northwestern St. 1907 108 524 457 33 .533Penn 1876 140 844 487 42 .630Portland St. 1955 62 325 332 7 .495Prairie View 1923 93 424 471 33 .475Presbyterian 1913 104 499 498 35 .500Princeton 1869 147 817 406 50 .661Rhode Island 1895 118 391 603 43 .398Richmond 1881 133 542 635 53 .462Robert Morris 1994 23 122 118 1 .508Sacramento St. 1954 63 273 375 8 .422Sacred Heart 1991 26 124 149 0 .454Saint Francis (PA) 1909 66 193 379 12 .341Sam Houston St. 1912 101 517 462 34 .527Samford 1902 101 449 454 47 .497San Diego 1956 50 290 208 6 .581Savannah St. 1950 67 205 410 17 .338SFA 1923 90 392 500 31 .441South Carolina St. 1907 94 530 322 27 .618South Dakota 1889 121 528 522 36 .503South Dakota St. 1897 118 580 459 36 .556Southeast Mo. St. 1904 111 450 520 37 .465Southeastern La. 1930 67 329 308 17 .516Southern Ill. 1913 101 443 512 32 .465Southern U. 1919 95 545 348 25 .607Southern Utah 1963 54 258 289 6 .472Stetson 1901 52 174 157 27 .524Stony Brook 1984 33 170 168 2 .503Tennessee St. 1912 93 556 283 32 .657Tennessee Tech 1922 95 419 497 31 .459Texas Southern 1946 71 322 400 27 .448The Citadel 1905 109 497 549 32 .476Towson 1969 48 267 244 4 .522UC Davis 1915 98 504 408 33 .551UNI 1895 118 655 410 47 .610UT Martin 1975 38 175 248 1 .414Valparaiso 1919 96 376 486 27 .438Villanova 1894 119 612 474 41 .561VMI 1891 126 472 684 42 .412Wagner 1927 86 405 355 19 .532Weber St. 1962 55 280 315 3 .471Western Caro. 1931 83 333 490 23 .407Western Ill. 1903 113 531 460 37 .535William & Mary 1893 122 571 557 39 .506Wofford 1889 108 516 500 36 .508Yale 1872 144 893 373 55 .697Youngstown St. 1938 76 470 314 17 .597

Winningest Teams by Decade 69
WINNINGEST TEAMS BY DECADE
RECORDS IN THE 2010S
(2010-16, Including playoffs)
By PercentageTeam W-L Pct.North Dakota St. 92-12 .885Harvard 59-11 .843Eastern Wash. 71-23 .755Jacksonville St. 66-22 .750Sam Houston St. 74-25 .747San Diego 58-21 .734Bethune-Cookman 59-22 .728Dayton 56-22 .718Lehigh 57-25 .695Jacksonville 52-24 .684James Madison 59-28 .678Old Dominion 58-28 .674New Hampshire 61-30 .670Central Ark. 55-29 .655Illinois St. 56-30 .651McNeese 51-28 .646Drake 49-28 .636Kennesaw St. 14-8 .636Montana St. 54-31 .635Duquesne 50-29 .633Montana 51-30 .630Dartmouth 44-26 .629Wofford 53-32 .624Chattanooga 53-32 .624Fordham 52-32 .619Liberty 50-31 .617South Carolina St. 50-31 .617South Dakota St. 54-34 .614N.C. A&T 48-32 .600UNI 52-35 .598Richmond 52-35 .598Villanova 51-35 .593Alabama St. 47-33 .588Mercer 27-19 .587Northern Ariz. 46-33 .582UT Martin 46-34 .575Youngstown St. 48-36 .571Brown 40-30 .571Penn 40-30 .571Grambling 46-35 .568Cal Poly 46-35 .568Samford 45-35 .563Eastern Ky. 45-36 .556Stony Brook 45-36 .556Alcorn 44-37 .543Delaware 45-38 .542Prairie View 41-35 .539Tennessee St. 43-37 .538Towson 45-39 .536Jackson St. 42-37 .532Bryant 41-37 .526Sacred Heart 42-38 .525Colgate 43-39 .524William & Mary 43-39 .524The Citadel 43-39 .524Charleston So. 43-39 .524
Team W-L Pct.Maine 42-39 .519Southern Utah 42-39 .519Yale 36-34 .514Albany (NY) 41-39 .513North Dakota 40-39 .506Butler 40-39 .506Southeastern La. 41-41 .500N.C. Central 40-40 .500South Ala. 41-42 .494Eastern Ill. 41-42 .494SFA 40-41 .494Princeton 33-37 .471Indiana St. 37-44 .457UTSA 32-39 .451Wagner 35-44 .443Southern Ill. 35-44 .443Monmouth 34-43 .442Hampton 34-44 .436Murray St. 34-45 .430Tennessee Tech 34-45 .430Marist 33-44 .429Lamar University 34-46 .425Western Ill. 35-48 .422Bucknell 32-45 .416Alabama A&M 33-47 .413Portland St. 33-47 .413Sacramento St. 32-47 .405Saint Francis (PA) 31-46 .403Furman 32-49 .395Holy Cross 31-48 .392Gardner-Webb 31-48 .392Northwestern St. 31-48 .392Morgan St. 31-48 .392Texas St. 32-51 .386Morehead St. 30-49 .380Florida A&M 30-49 .380Georgetown 29-48 .377Texas Southern 29-48 .377Southeast Mo. St. 30-50 .375Weber St. 30-50 .375Charlotte 16-30 .348Central Conn. St. 27-51 .346Howard 27-52 .342Robert Morris 26-51 .338UC Davis 26-52 .333South Dakota 25-53 .321ETSU 7-15 .318Stetson 14-31 .311Northern Colo. 24-54 .308Lafayette 24-54 .308Missouri St. 24-55 .304Norfolk St. 19-46 .292Elon 23-56 .291Cornell 20-50 .286Ark.-Pine Bluff 19-48 .284Western Caro. 22-57 .278Campbell 19-50 .275Presbyterian 21-56 .273Southern U. 14-39 .264Massachusetts 21-61 .256Houston Baptist 10-29 .256Delaware St. 20-58 .256Georgia St. 20-62 .244Idaho St. 19-60 .241
Team W-L Pct.Nicholls St. 18-61 .228VMI 16-63 .203Rhode Island 15-64 .190Columbia 13-57 .186Davidson 14-64 .179Mississippi Val. 12-64 .158Valparaiso 12-65 .156Savannah St. 8-69 .104Austin Peay 8-71 .101
By VictoriesTeam WinsNorth Dakota St. 92Sam Houston St. 74Eastern Wash. 71Jacksonville St. 66New Hampshire 61Bethune-Cookman 59Harvard 59James Madison 59Old Dominion 58San Diego 58Lehigh 57Dayton 56Illinois St. 56Central Ark. 55Montana St. 54South Dakota St. 54Chattanooga 53Wofford 53Fordham 52Jacksonville 52UNI 52Richmond 52McNeese 51Montana 51Villanova 51Duquesne 50Liberty 50South Carolina St. 50Drake 49N.C. A&T 48Youngstown St. 48Alabama St. 47Cal Poly 46Grambling 46Northern Ariz. 46UT Martin 46Delaware 45Eastern Ky. 45Samford 45Stony Brook 45Towson 45Alcorn 44Dartmouth 44Charleston So. 43The Citadel 43Colgate 43Tennessee St. 43William & Mary 43Jackson St. 42Maine 42Sacred Heart 42
Team WinsSouthern Utah 42Albany (NY) 41Bryant 41Eastern Ill. 41Prairie View 41South Ala. 41Southeastern La. 41Brown 40Butler 40N.C. Central 40North Dakota 40Penn 40SFA 40Indiana St. 37Yale 36Southern Ill. 35Wagner 35Western Ill. 35Hampton 34Lamar University 34Monmouth 34Murray St. 34Tennessee Tech 34Alabama A&M 33Marist 33Portland St. 33Princeton 33Bucknell 32Furman 32Sacramento St. 32UTSA 32Texas St. 32Gardner-Webb 31Holy Cross 31Morgan St. 31Northwestern St. 31Saint Francis (PA) 31Florida A&M 30Morehead St. 30Southeast Mo. St. 30Weber St. 30Georgetown 29Texas Southern 29Central Conn. St. 27Howard 27Mercer 27UC Davis 26Robert Morris 26South Dakota 25Lafayette 24Missouri St. 24Northern Colo. 24Elon 23Western Caro. 22Massachusetts 21Presbyterian 21Cornell 20Delaware St. 20Georgia St. 20Ark.-Pine Bluff 19Campbell 19Idaho St. 19Norfolk St. 19Nicholls St. 18

Winningest Teams by Decade 70
Team WinsCharlotte 16VMI 16Rhode Island 15Davidson 14Kennesaw St. 14Southern U. 14Stetson 14Columbia 13Mississippi Val. 12Valparaiso 12Houston Baptist 10Austin Peay 8Savannah St. 8ETSU 7
RECORDS IN THE 2000S
(2000-01-02-03-04-05-06-07-08-09, including playoffs)
By PercentageTeam W-L Pct.Montana 119-23 .838Dayton 87-23 .791Harvard 76-23 .768Appalachian St. 101-33 .754*North Dakota 93-31 .750Grambling 86-32 .729UNI 89-36 .712Penn 70-29 .707Colgate 82-35 .701McNeese 82-36 .695San Diego 74-33 .692Furman 83-40 .675Hampton 76-38 .667Ga. Southern 81-41 .664Lehigh 76-39 .661South Carolina St. 76-39 .661Duquesne 70-36 .660North Dakota St. 73-38 .658Villanova 78-42 .650Bethune-Cookman 71-40 .640Southern Ill. 78-45 .634Massachusetts 76-44 .633Coastal Caro. 50-29 .633Wofford 74-43 .632Central Ark. 73-43 .629Delaware 78-47 .624UC Davis 71-43 .623Eastern Ky. 70-43 .619Drake 68-42 .618Alabama A&M 72-45 .615New Hampshire 75-47 .615James Madison 74-47 .612Monmouth 66-42 .611Southern U. 68-44 .607Eastern Ill. 72-47 .605Albany (NY) 67-45 .598Youngstown St. 69-47 .595Jacksonville St. 65-45 .591Yale 58-41 .586South Dakota St. 65-46 .586Richmond 72-52 .581Eastern Wash. 67-49 .578*N.C. Central 60-45 .571
Team W-L Pct.Florida A&M 65-49 .570Gardner-Webb 62-47 .569*South Dakota 62-47 .569Brown 56-43 .566Cal Poly 63-49 .563William & Mary 65-51 .560Sacred Heart 59-47 .557Maine 64-52 .552Central Conn. St. 59-48 .551*Presbyterian 60-50 .545Morehead St. 61-51 .545Western Ill. 61-53 .535*Bryant 55-48 .534Lafayette 60-53 .531Robert Morris 54-49 .524Sam Houston St. 59-54 .522Montana St. 60-57 .513Texas St. 59-57 .509Davidson 50-50 .500Fordham 57-57 .500Wagner 54-54 .500Northwestern St. 57-58 .496Northern Ariz. 56-57 .496Delaware St. 55-56 .495Holy Cross 55-57 .491Portland St. 54-57 .486Hofstra 56-60 .483Charleston So. 54-58 .482Stony Brook 50-54 .481Illinois St. 54-59 .478SFA 54-59 .478Princeton 47-52 .475Jackson St. 53-59 .473Liberty 53-59 .473Weber St. 54-61 .470Alabama St. ^47-54 .465Marist 48-56 .462Jacksonville 47-59 .443Elon 50-63 .442Tennessee Tech 49-62 .441Tennessee St. 49-64 .434Missouri St. 47-62 .431Samford 47-62 .431Bucknell 46-64 .418Ark.-Pine Bluff 45-63 .417Alcorn 45-64 .413Northeastern 47-67 .412Towson 46-66 .411Southeastern La. 32-46 .410Nicholls St. 43-63 .406Prairie View 42-62 .404Morgan St. 45-67 .402Norfolk St. 43-67 .391Northern Colo. 44-70 .386Cornell 38-61 .384N.C. A&T 43-70 .381The Citadel 41-70 .369Idaho St. 41-71 .366Murray St. 41-71 .366UT Martin 41-73 .360Butler 38-70 .352Valparaiso 39-72 .351Sacramento St. 39-73 .348Western Caro. 38-72 .345Howard 37-73 .336Southeast Mo. St. 38-75 .336Rhode Island 37-76 .327
Team W-L Pct.Austin Peay 36-74 .327Texas Southern 34-76 .309Southern Utah 33-76 .303Mississippi Val. 33-77 .300Chattanooga 33-80 .292Georgetown 29-80 .266Columbia 26-74 .260VMI 27-85 .241Dartmouth 21-78 .212Campbell 4-18 .182Savannah St. 17-88 .162Saint Francis (PA) 17-89 .160Indiana St. 18-95 .159*Reclassifying. ^Had wins vacated by NCAA Committee on Infractions.
By VictoriesTeam WinsMontana 119Appalachian St. 101*North Dakota 93UNI 89Dayton 87Grambling 86Furman 83Colgate 82McNeese 82Ga. Southern 81Delaware 78Southern Ill. 78Villanova 78Hampton 76Harvard 76Lehigh 76Massachusetts 76South Carolina St. 76New Hampshire 75James Madison 74San Diego 74Wofford 74Central Ark. 73North Dakota St. 73Alabama A&M 72Eastern Ill. 72Richmond 72Bethune-Cookman 71UC Davis 71Duquesne 70Eastern Ky. 70Penn 70Youngstown St. 69Drake 68Southern U. 68Albany (NY) 67Eastern Wash. 67Monmouth 66Florida A&M 65Jacksonville St. 65South Dakota St. 65William & Mary 65Maine 64Cal Poly 63Gardner-Webb 62*South Dakota 62Morehead St. 61Western Ill. 61Lafayette 60
Team WinsMontana St. 60*N.C. Central 60*Presbyterian 60Central Conn. St. 59Sacred Heart 59Sam Houston St. 59Texas St. 59Yale 58Fordham 57Northwestern St. 57Brown 56Hofstra 56Northern Ariz. 56*Bryant 55Delaware St. 55Holy Cross 55Charleston So. 54Illinois St. 54Portland St. 54Robert Morris 54SFA 54Wagner 54Weber St. 54Jackson St. 53Liberty 53Coastal Caro. 50Davidson 50Elon 50Stony Brook 50Tennessee St. 49Tennessee Tech 49Marist 48Alabama St. ^47Jacksonville 47Missouri St. 47Northeastern 47Princeton 47Samford 47Bucknell 46Towson 46Alcorn 45Ark.-Pine Bluff 45Morgan St. 45Northern Colo. 44Nicholls St. 43Norfolk St. 43N.C. A&T 43Prairie View 42The Citadel 41Idaho St. 41Murray St. 41UT Martin 41Sacramento St. 39Valparaiso 39Butler 38Cornell 38Southeast Mo. St. 38Western Caro. 38Howard 37Rhode Island 37Austin Peay 36Texas Southern 34Chattanooga 33Mississippi Val. 33Southern Utah 33Southeastern La. 32Georgetown 29

Winningest Teams by Decade 71
Team WinsVMI 27Columbia 26Dartmouth 21Indiana St. 18Saint Francis (PA) 17Savannah St. 17Campbell 4*Reclassifying. ^Had wins vacated by NCAA Committee on Infractions.
RECORDS IN THE 1990S
(1990-91-92-93-94-95-96-97-98-99, playoffs included; tie-breaker began in 1996)
By PercentageTeam W-L-T *Pct.Dayton 92-17-0 .844Youngstown St. 103-30-2 .770Montana 93-32-0 .744Hofstra 81-29-2 .732Troy 87-32-1 .729Delaware 88-33-1 .725UNI 89-34-0 .724Ga. Southern 92-36-0 .719Eastern Ky. 85-35-0 .708Robert Morris 42-18-1 .697N.C. A&T 79-35-0 .693Drake 70-31-2 .689Hampton 78-36-1 .683McNeese 84-39-2 .680William & Mary 78-37-0 .678Southern U. 79-38-0 .675Jackson St. 76-37-1 .671Appalachian St. 79-40-0 .664Florida A&M 79-40-0 .664Ark.-Pine Bluff 56-31-0 .644Dartmouth 62-35-3 .635Fairfield 26-15-0 .634Georgetown 63-37-0 .630Southern Utah 66-39-0 .629Penn 62-37-0 .626Lehigh 70-42-1 .624Wagner 63-38-0 .624St. John’s (NY) 65-40-0 .619Marist 61-38-2 .614Samford 69-43-2 .614Western Ill. 71-45-1 .611Albany (NY) 62-40-0 .608South Fla. 20-13-0 .606Villanova 69-46-0 .600Portland St. 70-47-0 .598New Hampshire 65-45-2 .589Massachusetts 67-47-1 .587South Carolina St. 64-45-0 .587Princeton 58-41-1 .585Duquesne 59-42-1 .583Howard 65-47-0 .580Furman 66-48-1 .578San Diego 57-42-1 .575Missouri St. 57-43-1 .569Monmouth 33-25-0 .569Elon 61-47-0 .565James Madison 65-51-0 .560
Team W-L-T *Pct.Grambling 62-50-0 .554Northern Ariz. 62-50-0 .554Northwestern St. 63-51-0 .553Cornell 55-45-0 .550Eastern Wash. 61-51-0 .545Liberty 60-50-0 .545St. Mary’s (CA) 54-46-1 .540Wofford 59-51-1 .536Cal Poly 57-50-1 .532Weber St. 59-52-0 .532SFA 58-52-3 .527Butler 53-48-1 .525Bucknell 57-52-0 .523Murray St. 59-54-0 .522Alabama St. 55-51-4 .518UConn 57-54-0 .514Jacksonville St. 58-55-1 .513Eastern Ill. 57-55-1 .509Stony Brook 50-49-2 .505Alcorn 52-52-3 .500Davidson 49-49-1 .500Western Ky. 54-54-0 .500Illinois St. 55-57-2 .491Towson 51-53-0 .490The Citadel 55-58-0 .487Tennessee St. 54-58-0 .482Alabama A&M 52-57-1 .477Sam Houston St. 51-56-3 .477Tennessee Tech 51-58-0 .468Norfolk St. 48-55-1 .466Colgate 52-60-1 .465CSUN 49-57-0 .462Brown 46-54-0 .460Delaware St. 50-59-0 .459Yale 45-55-0 .450ETSU 50-62-0 .446Lafayette 47-59-3 .445Harvard 43-56-1 .435Sacramento St. 45-59-1 .433Iona 42-56-1 .429Richmond 47-63-1 .428Montana St. 47-63-0 .427Texas Southern 46-62-1 .427Valparaiso 43-59-1 .422Chattanooga 46-64-0 .418Indiana St. 46-64-0 .418Morehead St. 44-62-0 .415Bethune-Cookman 44-64-0 .407Holy Cross 44-65-1 .405Mississippi Val. 40-62-3 .395Western Caro. 43-66-0 .394Maine 43-67-0 .391Jacksonville 7-11-0 .389Southeast Mo. St. 40-70-0 .364Northeastern 39-70-1 .359Morgan St. 20-37-0 .351Canisius 34-64-1 .348Columbia 33-65-2 .340Southern Ill. 37-73-0 .336Idaho St. 36-73-1 .332Central Conn. St. 31-66-1 .321Nicholls St. 35-75-1 .320Rhode Island 34-75-0 .312Saint Francis (PA) 29-70-1 .295UT Martin 31-79-0 .282Sacred Heart 23-64-0 .264La Salle 7-20-0 .259
Team W-L-T *Pct.Texas St. 23-68-0 .253Siena 22-69-0 .242Saint Peter’s 21-70-0 .231Austin Peay 24-85-0 .220Charleston So. 19-73-0 .207VMI 22-88-0 .200Fordham 20-85-1 .193Prairie View 3-93-0 .031*Ties counted as half won and half lost.
By Victories(Minimum 55 wins; playoffs included)Team WinsYoungstown St. 103Montana 93Dayton 92Ga. Southern 92UNI 89Delaware 88Troy 87Eastern Ky. 85McNeese 84Hofstra 81Appalachian St. 79Florida A&M 79N.C. A&T 79Southern U. 79Hampton 78William & Mary 78Jackson St. 76Western Ill. 71Drake 70Lehigh 70Portland St. 70Samford 69Villanova 69Massachusetts 67Furman 66Southern Utah 66Howard 65James Madison 65New Hampshire 65St. John’s (NY) 65South Carolina St. 64Georgetown 63Northwestern St. 63Wagner 63Albany (NY) 62Dartmouth 62Grambling 62Northern Ariz. 62Penn 62Eastern Wash. 61Elon 61Marist 61Liberty 60Duquesne 59Murray St. 59Weber St. 59Wofford 59Jacksonville St. 58Princeton 58SFA 58Bucknell 57Cal Poly 57
Team WinsUConn 57Eastern Ill. 57Missouri St. 57San Diego 57Ark.-Pine Bluff 56Alabama St. 55The Citadel 55Cornell 55Illinois St. 55*Reclassifying. ^Had wins vacated by NCAA Committee on Infractions.
RECORDS IN THE 1980SBy PercentageTeam W-L *Pct.Eastern Ky. 88-24-2 .781Furman 83-23-4 .773Ga. Southern 68-22-1 ^.753Jackson St. 71-25-5 .728Grambling 68-30-3 .688Nevada 71-35-1 .668Holy Cross 67-33-2 .667Tennessee St. 64-32-4 .660Eastern Ill. 70-36-1 .659Idaho 69-36-0 .657Delaware 68-36-0 .654Middle Tenn. 65-36-0 .644Boise St. 66-38-0 .635Texas St. 66-39-0 .629Murray St. 61-36-2 .626UNI 64-38-2 .625Towson 60-36-2 .622Alcorn 56-34-0 .622La.-Monroe 64-39-0 .621South Carolina St. 55-34-1 .617* Ties counted as half won and half lost.^ Includes two non-varsity seasons and five varsity seasons; varsity record 55-14-0 for .797

National Poll Rankings 72
NATIONAL POLL RANKINGS
FINAL POLL LEADERSReleased before division championship playoffs before 2001 and released after the championship playoffs beginning with 2001.
Year Team, Record* CoachRecord in Championship†
1978 Nevada (10-0-0) Chris Ault 0-1 Lost in semifinals1979 Grambling (8-2-0) Eddie Robinson Did not compete1980 Lehigh (9-0-2) John Whitehead 0-1 Lost in semifinals1981 Eastern Ky. (9-1-0) Roy Kidd 2-1 Lost in championship1982 Eastern Ky. (10-0-0) Roy Kidd 3-0 Champion1983 Southern Ill. (10-1-0) Rey Dempsey 3-0 Champion1984 Alcorn (9-0-0) Marino Casem 0-1 Lost in quarterfinals1985 Middle Tenn. (11-0-0) James Donnelly 0-1 Lost in quarterfinals1986 Nevada (11-0-0) Chris Ault 2-1 Lost in semifinals1987 Holy Cross (11-0-0) Mark Duffner Did not compete1988 Idaho (9-1-0) Keith Gilbertson 2-1 Lost in semifinals1989 Ga. Southern (11-0-0) Erk Russell 4-0 Champion1990 Middle Tenn. (10-1-0) James Donnelly 1-1 Lost in quarterfinals1991 Nevada (11-0-0) Chris Ault 1-1 Lost in quarterfinals1992 The Citadel (10-1-0) Charlie Taaffe 1-1 Lost in quarterfinals
La.-Monroe (9-2-0) Dave Roberts 1-1 Lost in quarterfinals1993 Troy (10-0-1) Larry Blakeney 2-1 Lost in semifinals1994 Youngstown St. (10-0-1) Jim Tressel 4-0 Champion1995 McNeese (11-0-0) Bobby Keasler 2-1 Lost in semifinals1996 Marshall (11-0) Bob Pruett 4-0 Champion1997 Villanova (11-0) Andy Talley 1-1 Lost in quarterfinals1998 Ga. Southern (11-0) Paul Johnson 3-1 Lost in championship1999 Tennessee St. (11-0) L.C. Cole 0-1 Lost in first round2000 Montana (10-1) Joe Glenn 3-1 Lost in championship2001 Montana (11-1) Joe Glenn 4-0 Champion2002 Western Ky. (12-3) Jack Harbaugh 4-0 Champion2003 Delaware (15-1) K.C. Keeler 4-0 Champion2004 James Madison (13-2) Mickey Matthews 4-0 Champion2005 Appalachian St. (12-3) Jerry Moore 4-0 Champion2006 Appalachian St. (14-1) Jerry Moore 4-0 Champion2007 Appalachian St. (13-2) Jerry Moore 4-0 Champion2008 Richmond (13-3) Mike London 4-0 Champion2009 Villanova (14-1) Andy Talley 4-0 Champion2010 Eastern Wash. (13-2) Beau Baldwin 4-0 Champion2011 North Dakota St. (14-1) Craig Bohl 4-0 Champion2012 North Dakota St. (14-1) Craig Bohl 4-0 Champion2013 North Dakota St. (15-0) Craig Bohl 4-0 Champion2014 North Dakota St. (15-1) Chris Klieman 4-0 Champion2015 North Dakota St. (13-2) Chris Klieman 4-0 Champion2016 James Madison (14-1) Mike Houston 4-0 Champion*Final poll record; in some cases, a team had one or two games remaining before the championship playoffs. †Number of teams in the championship: 4 (1978-80); 8 (1981); 12 (1982-85); 16 (1986-2009); 20 (2010-2012); 24 (2013-16).
2016 STATS FCS WEEK-BY-WEEK POLLTeam Pre S5 S12 S19 S26 O3 O10 O17 O24 O31 N7 N14 N20 J9Albany (NY) - - 25 22 21 16 17 23 - - - - -Cal Poly - - - - 16 21 19 T-17 14 14 16 21 21 24Central Ark. - - - - - 25 23 20 19 17 13 11 14 14Charleston So. 7 7 12 12 10 8 9 9 9 8 14 14 10 15Chattanooga 6 6 6 5 5 5 5 11 10 9 7 12 11 13Coastal Caro. 16 17 17 17 14 17 16 T-17 18 18 15 16 15 18Colgate 21 21 23 23 - - - - - - - - -Eastern Ill. - - - 18 13 19 18 15 23 - - - -Eastern Wash. 14 8 8 4 4 4 4 3 3 3 3 3 3 4Grambling - - - - - - 25 22 21 21 20 17 16 16Harvard - - - - 25 22 20 - 24 23 24 - -Illinois St. 10 10 5 9 18 23 - - - - - - -

National Poll Rankings 73
Team Pre S5 S12 S19 S26 O3 O10 O17 O24 O31 N7 N14 N20 J9Indiana St. - - - - 24 - - - - - - - -Jacksonville St. 3 5 4 3 3 3 3 2 2 2 2 2 2 7James Madison 12 12 11 11 7 7 7 8 8 7 6 6 5 1Lehigh - - - - - - - - - 24 23 19 18 21Liberty - - - - - - - - - - 25 - -McNeese 11 11 14 24 23 20 - - - - - - -Montana 13 14 7 6 11 10 10 10 16 19 18 22 - -N.C. A&T 25 23 18 21 22 18 15 14 12 11 10 9 17 20N.C. Central - - - - - - - - - - - 24 20 22New Hampshire 22 24 22 - - - - - - 22 21 - 22 17North Dakota 19 25 - - - 24 22 19 17 16 12 10 8 12North Dakota St. 1 1 1 1 1 1 1 4 4 4 4 4 4 3Northern Ariz. 18 19 24 - - - - - - - - - -Portland St. 17 16 19 25 - - - - - - - - -Richmond 4 2 2 7 6 6 6 6 6 6 8 7 12 8Saint Francis (PA) - - - - - - - - - - - 25 - -Sam Houston St. 2 4 3 2 2 2 2 1 1 1 1 1 1 5Samford - - - - - - 24 21 20 20 22 18 23 23San Diego - - - - - - - - - - - - 24 19South Dakota St. 8 9 9 15 15 12 11 7 7 13 11 8 7 6Stony Brook - - - 20 - - - 24 22 25 - - -Tennessee St. - - - - - - - 25 25 - - - -The Citadel 15 15 15 10 9 9 8 5 5 5 5 5 6 10Towson 24 - - - - - - - - - - - -UNI 5 3 10 14 12 11 21 - - - - - -Villanova 23 22 21 19 17 14 13 16 11 10 9 13 9 11Weber St. - - - - - - - - - - - - 25 25Western Ill. 20 18 16 13 8 13 12 12 13 12 19 23 - -William & Mary 9 13 13 8 19 - - - - - - - -Wofford - - - - - - - - - - - 20 19 9Youngstown St. - 20 20 16 20 15 14 13 15 15 17 15 13 2
2016 COACHES FCS WEEK-BY-WEEK POLLSTeam Pre S5 S12 S19 S26 O3 O10 O17 O24 O31 N7 N14 N21 J9Albany (NY) - - 25 23 21 17 19 24 - - - - -Cal Poly - - - - 18 22 20 T-18 17 16 20 23 20 T-21Central Ark. - - - - - 24 22 T-18 18 17 13 12 16 16Charleston So. 6 7 12 11 T-8 8 8 9 9 9 14 13 10 14Chattanooga 7 6 4 3 3 3 3 8 8 8 7 11 9 10Colgate 16 20 23 21 25 - - - - - - - -Eastern Ill. - - - 16 13 20 17 15 22 24 - - -Eastern Wash. 17 8 7 5 5 5 5 3 3 3 3 3 4 4Fordham 20 25 - - - - - - - - - - -Grambling - - - - - 25 23 21 21 19 16 16 14 15Harvard 19 21 22 19 19 16 15 23 23 22 22 - -Illinois St. 8 9 5 12 20 23 - - - - - 25 -Jacksonville St. 3 5 6 4 4 4 4 2 2 2 2 2 2 6James Madison 11 11 8 7 6 6 6 5 5 5 5 5 5 1Kennesaw St. - - - - - - - - - - - 22 -Lehigh - - - - - - - - 24 21 18 17 15 18Liberty - - - - - - - - - - 24 - -McNeese 9 10 13 20 22 19 - - - - - - -Montana 13 15 9 6 11 10 10 10 16 20 17 21 22 25N.C. A&T 25 24 19 22 23 18 16 14 11 10 9 9 17 20N.C. Central - - - - - - - - - - 25 20 18 19New Hampshire - - - - - - 25 - - 23 23 - 21 17North Dakota 21 - - - - 21 18 16 12 11 10 8 8 12North Dakota St. 1 1 1 1 1 1 1 4 4 4 4 4 3 3Northern Ariz. 18 17 24 T-25 - - - - - - - - -Portland St. 12 14 17 T-25 - - - - - - - - -Richmond 4 2 2 9 7 7 7 7 6 6 8 7 T-12 8Sam Houston St. 2 T-3 3 2 2 2 2 1 1 1 1 1 1 5Samford - - - - - - 24 20 19 18 21 18 24 23San Diego - - - - - - - - - - - - 25 T-21

National Poll Rankings 74
FINAL POLLS
1978NCAA
1. Nevada2. Jackson St.3. Florida A&M4. Massachusetts5. Western Ky.6. South Carolina St.7. Northern Ariz. Montana St. Eastern Ky. Lehigh Rhode Island
1979NCAA
1. Grambling2. Murray St.3. Eastern Ky. Lehigh5. Nevada6. Alcorn7. Boston U.8. Jackson St.9. Montana St.10. Northern Ariz. Southern U.
1980NCAA
1. Lehigh2. Grambling3. Eastern Ky.4. South Carolina St.5. Western Ky.6. Delaware7. Boise St.8. Northwestern St.9. Boston U.10. UConn Massachusetts Murray St.
1981NCAA
1. Eastern Ky.2. Idaho St.3. South Carolina St.4. Jackson St.5. Boise St.6. Tennessee St.7. Delaware8. Lafayette9. Murray St.10. New Hampshire
1982NCAA
1. Eastern Ky.2. Louisiana Tech3. Delaware4. Tennessee St.5. Eastern Ill.6. Furman7. South Carolina St.8. Jackson St.9. Colgate10. Grambling11. Idaho12. Northern Ill.13. Holy Cross14. Bowling Green15. Boise St.16. Western Mich.17. Chattanooga18. Northwestern St.19. Montana20. Lafayette
1983NCAA
1. Southern Ill.2. Furman3. Holy Cross4. North Texas5. Indiana St.6. Eastern Ill.
7. Colgate8. Eastern Ky.9. Western Caro.10. Grambling11. Nevada12. Idaho St.13. Boston U. La.-Monroe15. Jackson St.16. Middle Tenn.17. Tennessee St.18. South Carolina St.19. Mississippi Val.20. New Hampshire
1984NCAA
1. Alcorn2. Montana St. Rhode Island4. Boston U.5. Indiana St.6. Middle Tenn. Mississippi Val.8. Eastern Ky.9. Louisiana Tech10. Arkansas St.11. New Hampshire12. Richmond13. Murray St.14. Western Caro.15. Holy Cross16. Furman17. Chattanooga18. UNI19. Delaware20. McNeese
1985NCAA
1. Middle Tenn.2. Furman Nevada4. UNI5. Idaho
6. Arkansas St.7. Rhode Island8. Grambling9. Ga. Southern10. Akron11. Eastern Wash.12. Appalachian St. Delaware St.14. Louisiana Tech15. Jackson St.16. William & Mary17. Murray St.18. Richmond19. Eastern Ky.20. Alcorn
1986NCAA
1. Nevada2. Arkansas St.3. Eastern Ill.4. Ga. Southern5. Holy Cross6. Appalachian St.7. Penn8. William & Mary9. Jackson St.10. Eastern Ky.11. Sam Houston St.12. Nicholls St.13. Delaware14. Tennessee St.15. Furman16. Idaho17. Southern Ill.18. Murray St.19. UConn20. N.C. A&T
1987NCAA
1. Holy Cross2. Appalachian St.3. La.-Monroe4. UNI
Team Pre S5 S12 S19 S26 O3 O10 O17 O24 O31 N7 N14 N21 J9South Dakota - - - - - - - - 25 - - - -South Dakota St. 14 12 10 18 16 15 14 11 10 15 12 10 7 7Southern Utah 23 23 21 - 24 - - - - - - - -Stony Brook - - - 24 - - - 22 20 25 - - -Tennessee St. - - - - - - - 25 - - - - -The Citadel 15 16 15 10 10 9 9 6 7 7 6 6 6 9UNI 5 T-3 11 14 12 11 21 - - - - - -Villanova 22 19 18 15 14 12 11 17 13 12 11 15 11 13Weber St. - - - - - - - - - - - - 23 24Western Ill. 24 18 16 13 T-8 14 13 13 15 14 19 24 -William & Mary 10 13 14 8 17 - - - - - - - -Wofford - - - - - - - - - - - 19 19 11Youngstown St. - 22 20 17 15 13 12 12 14 13 15 14 T-12 2T-Tie for ranking.

National Poll Rankings 75
5. Idaho6. Ga. Southern7. Eastern Ky.8. James Madison9. Jackson St.10. Weber St.11. Western Ky.12. Arkansas St.13. Maine14. Marshall15. Youngstown St.16. North Texas17. Richmond18. Howard19. Sam Houston St.20. Delaware St.
1988NCAA
1. SFA2. Idaho3. Ga. Southern4. Western Ill.5. Furman6. Jackson St.7. Marshall8. Eastern Ky.9. The Citadel10. Northwestern St.11. Massachusetts12. North Texas13. Boise St.14. Florida A&M Penn16. Western Ky.17. UConn18. Grambling19. Montana20. New Hampshire
1989NCAA
1. Ga. Southern2. Furman3. SFA4. Holy Cross Idaho6. Montana7. Appalachian St.8. Maine9. Missouri St.10. Middle Tenn. William & Mary12. Eastern Ky.13. Grambling14. Youngstown St.15. Eastern Ill.16. Villanova17. Jackson St.18. UConn19. Nevada20. UNI
1990NCAA
1. Middle Tenn.2. Youngstown St.3. Ga. Southern4. Nevada5. Eastern Ky.6. Missouri St.7. William & Mary8. Holy Cross9. Massachusetts10. Boise St.11. UNI12. Furman13. Idaho14. La.-Monroe15. The Citadel16. Jackson St.17. Dartmouth18. UCF19. New Hampshire N.C. A&T
1991NCAA
1. Nevada2. Eastern Ky.3. Holy Cross4. UNI5. Alabama St.6. Delaware7. Villanova8. Marshall9. Middle Tenn.10. Samford11. New Hampshire12. Sam Houston St.13. Youngstown St.14. Western Ill.15. Weber St.16. James Madison17. Appalachian St.18. La.-Monroe19. McNeese20. The Citadel Furman
1992NCAA
1. The Citadel La.-Monroe3. UNI4. Middle Tenn.5. Idaho6. Marshall7. Youngstown St.8. Delaware9. Samford10. Villanova11. McNeese12. Eastern Ky.13. William & Mary
14. Eastern Wash.15. Florida A&M16. Appalachian St.17. N.C. A&T18. Alcorn19. Liberty20. Western Ill.
1993Sports Network
1. Troy2. Ga. Southern3. Montana4. La.-Monroe5. McNeese6. Boston U.7. Youngstown St.8. Howard9. Marshall10. William & Mary11. Idaho12. UCF13. UNI14. SFA15. Southern U.16. Penn17. Eastern Ky.18. Delaware19. Western Ky.20. Eastern Wash.21. N.C. A&T22. Tennessee Tech23. Alcorn24. Towson25. Massachusetts
1994Sports Network
1. Youngstown St.2. Marshall3. Boise St.4. Eastern Ky.5. McNeese6. Idaho7. Grambling8. Montana9. Boston U.10. Troy11. UNI12. New Hampshire13. James Madison14. Penn15. Alcorn16. Middle Tenn.17. Appalachian St.18. North Texas19. William & Mary20. UCF21. SFA22. South Carolina St.23. Hofstra24. Western Ill.25. Northern Ariz.
1995Sports Network
1. McNeese2. Appalachian St.3. Troy4. Murray St.5. SFA6. Marshall7. Delaware8. Montana9. Hofstra10. Eastern Ky.11. Southern U.12. Eastern Ill.13. James Madison14. Jackson St.15. Ga. Southern16. Florida A&M17. Idaho18. UNI19. William & Mary20. Richmond21. Boise St.22. Northern Ariz.23. UConn24. Indiana St.25. Middle Tenn.
1996Sports Network
1. Marshall 2. Montana 3. UNI4. Murray St. 5. Troy 6. Northern Ariz. 7. William & Mary8. Jackson St. ETSU 10. Western Ill. 11. Delaware12. Florida A&M13. Furman14. Villanova15. Youngstown St. 16. Eastern Ill. 17. Dartmouth18. New Hampshire19. Nicholls St. 20. Howard21. Missouri St.22. SFA23. James Madison24. Dayton25. Appalachian St.
1997Sports Network
1. Villanova 2. Western Ill.3. Delaware 4. Eastern Wash.

National Poll Rankings 76
5. Western Ky. 6. McNeese 7. Hampton 8. Ga. Southern 9. Youngstown St. 10. Florida A&M 11. Montana 12. Southern U. 13. Jackson St. 14. Hofstra 15. Eastern Ky. 16. Cal Poly17. Northwestern St. 18. SFA19. South Carolina St. 20. Liberty 21. Eastern Ill. 22. Appalachian St.23. Dayton 24. Northeastern25. Colgate
USA Today/ESPN1. Youngstown St.2. McNeese3. Delaware4. Eastern Wash.5. Villanova6. Western Ill.7. Western Ky.8. Ga. Southern9. Montana10. Hampton11. Southern U. 12. Florida A&M13. Jackson St.14. Northwestern St.15. Eastern Ky.16. Hofstra17. Cal Poly18. SFA19. Liberty20. South Carolina St.21. Colgate22. Eastern Ill.23. Appalachian St.24. Northeastern25. Dayton
1998USA Today/ESPN(After Playoffs)
1. Massachusetts2. Ga. Southern3. Northwestern St. 4. Western Ill.5. Florida A&M6. Appalachian St.7. UConn8. McNeese 9. Richmond
10. Hampton11. Troy 12. Lehigh13. Tennessee St.14. Montana15. Illinois St.16. Southern U.17. South Fla.18. Hofstra19. William & Mary20. Murray St.21. Colgate22. Western Ky.23. Bethune-Cookman24. Delaware25. Montana St.
Sports Network1. Ga. Southern2. Northwestern St.3. Florida A&M4. Western Ill. 5. Richmond6. McNeese7. Appalachian St.8. UConn9. Hampton10. Tennessee St.11. Troy12. Massachusetts 13. Lehigh14. Montana 15. Southern U. 16. William & Mary17. Western Ky.18. Hofstra19. South Fla.20. Bethune-Cookman21. Illinois St.22. Delaware23. Murray St.24. Montana St.25. UNI
1999USA Today/ESPN
1. Tennessee St. (11-0)2. Ga. Southern (9-2)3. Appalachian St. (8-2)4. Hofstra (10-1)5. Illinois St. (9-2)6. Troy (10-1)7. Montana (9-2)8. Furman (9-2)9. Youngstown St. (9-2)10. Southern U. (9-1)11. Massachusetts (8-3)12. James Madison (8-3)13. Lehigh (10-1)14. Jackson St. (9-2)15. Florida A&M (8-3)
16. N.C. A&T (10-1)17. UNI (8-3)18. Colgate (10-1)19. Northern Ariz. (8-3)20. Elon (9-2)21. Portland St. (8-3)22. SFA (8-3)23. South Fla. (7-4)24. Southern Utah (8-3)25. Villanova (7-4)
Sports Network(After Playoffs)
1. Ga. Southern (13-2)2. Youngstown St. (12-3)3. Illinois St. (11-3)4. Florida A&M (10-4)5. Hofstra (11-2)6. Troy (11-2)7. Massachusetts (9-4)8. Montana (9-3)9. Appalachian St. (9-3) N.C. A&T (11-2)11. Tennessee St. (11-1)12. Furman (9-3)13. James Madison (8-4)14. Lehigh (10-2)15. UNI (8-3)16. Northern Ariz. (8-4)17. Southern U. (11-2)18. Colgate (10-2)19. Jackson St. (9-3)20. Portland St. (8-3)21. Elon (9-2)22. SFA (8-3)23. South Fla. (7-4)24. Villanova (7-4)25. Brown (9-1)
2000USA Today/ESPN
1. Montana (9-1)2. Delaware (9-1)3. Troy (8-2)4. Ga. Southern (9-2)5. Furman (8-2)6. Western Ill. (8-2)7. Western Ky. (9-1)8. Richmond (8-2)9. Youngstown St. (8-2)10. Appalachian St. 11. Lehigh (10-0) (7-3)12. Hofstra (7-3)13. Grambling (9-1)14. Florida A&M (8-2)15. Portland St. (7-3)16. McNeese (7-3)17. Bethune-Cookman (9-1)18. UNI (6-3)19. Weber St. (7-4)20. N.C. A&T (7-3)
21. Sam Houston St. (7-3)22. Eastern Ill. (7-3)23. James Madison (6-4)24. Tennessee Tech (7-3)25. Northwestern St. (6-4)
Sports Network(After Playoffs)
1. Ga. Southern (13-2)2. Montana (13-2)3. Delaware (12-2)4. Appalachian St. (10-4)5. Western Ky. (11-2)6. Richmond (10-3)7. Hofstra (9-4)8. Lehigh (12-1)9. Troy (9-3)10. Furman (9-3)11. Youngstown St. (9-3)12. Western Ill. (9-3)13. Grambling (10-2)14. Florida A&M (9-3)15. Portland St. (8-4)16. McNeese (8-4)17. Eastern Ill. (8-4)18. Weber St. (7-4)19. UNI (7-4)20. Bethune-Cookman (9-2)21. N.C. A&T (8-3)22. Tennessee Tech (8-3)23. Wofford (7-4)24. Illinois St. (7-4)25. Texas St. (7-4)
2001USA Today/ESPN(After Playoffs)
1. Montana (15-1)2. Furman (12-3)3. Ga. Southern (12-2)4. UNI (11-3)5. Lehigh (11-1)6. Appalachian St. (9-4)7. Hofstra (9-3)8. Sam Houston St. (10-3)9. Eastern Ill. (9-2)10. Western Ky. (8-4)11. Grambling (10-1)12. Maine (9-3)13. McNeese (8-4)14. Northwestern St. (8-4)15. Northern Ariz. (8-4)16. Youngstown St. (8-3)17. William & Mary (8-4)18. Eastern Ky. (8-2)19. Villanova (8-3)20. Rhode Island (8-3)21. Harvard (9-0)22. Florida A&M (7-4)23. Tennessee Tech (7-3)24. Penn (8-1)

National Poll Rankings 77
25. Portland St. (7-4)
Sports Network(After Playoffs)
1. Montana (15-1)2. Furman (12-3)3. Ga. Southern (12-2)4. UNI (11-3)5. Lehigh (11-1)6. Appalachian St. (9-4)7. Sam Houston St. (10-3)8. Grambling (10-1)9. Eastern Ill. (9-2)10. Maine (9-3)11. Hofstra (9-3)12. Western Ky. (8-4)13. McNeese (8-4)14. Northwestern St. (8-4)15. Youngstown St. (8-3)16. Northern Ariz. (8-4)17. William & Mary (8-4)18. Eastern Ky. (8-2)19. Harvard (9-0)20. Villanova (8-3)21. Rhode Island (8-3)22. Florida A&M (7-4)23. Tennessee Tech (7-3)24. Penn (8-1)25. Tennessee St. (8-3)
2002USA Today/ESPN(After Playoffs)
1. Western Ky. (12-3)2. McNeese (13-2)3. Ga. Southern (11-3)4. Villanova (11-4)5. Western Ill. (11-2)6. Maine (11-3) Montana (11-3)8. Grambling (11-2)9. Furman (8-4)10. Northeastern (10-3)11. Wofford (9-3)12. Bethune-Cookman (11-2) Eastern Ill. (8-4)14. Appalachian St. (8-4)15. Fordham (10-3)16. Northwestern St. (9-4)17. Idaho St. (8-3) Penn (9-1)19. Montana St. (7-6)20. Eastern Ky. (8-4)21. Nicholls St. (7-4)22. Murray St. (7-5)23. Southeast Mo. St. (8-4)24. Gardner-Webb (9-1)25. Colgate (9-3)
Sports Network(After Playoffs)
1. Western Ky. (12-3) 2. McNeese (13-2)3. Ga. Southern (11-3)
4. Villanova (11-4)5. Western Ill. (11-2)6. Maine (11-3)7. Montana (11-3)8. Grambling (11-2)9. Furman (8-4)10. Appalachian St. (8-4)11. Northeastern (10-3)12. Fordham (10-3)13. Eastern Ill. (8-4)14. Wofford (9-3)15. Bethune-Cookman (11-2)16. Northwestern St. (9-4)17. Penn (9-1)18. Idaho St. (8-3)19. Montana St. (7-6)20. Murray St. (7-5)21. Eastern Ky. (8-4)22. Gardner-Webb (9-1)23. Nicholls St. (7-4)24. Southeast Mo. St. (8-4)25. Colgate (9-3)
2003USA Today/ESPN(After Playoffs)
1. Delaware (15-1)2. Colgate (15-1)3. Wofford (12-2)4. Fla. Atlantic (11-3)5. Western Ill. (9-4)6. UNI (10-3)7. McNeese (10-2)8. Western Ky. (9-4)9. Northern Ariz. (9-4)10. Southern Ill. (10-2)11. Massachusetts (10-3)12. Penn (10-0)13. Montana (9-4)14. Southern U. (12-1)15. Bethune-Cookman (9-3)16. N.C. A&T (10-3)17. Grambling (9-3)18. Jacksonville St. (8-4)19. Northeastern (8-4)20. Northern Colo. (9-2)21. Montana St. (7-6)22. Idaho St. (8-4)23. Villanova (7-4)24. Lehigh (8-3)25. Ga. Southern (7-4)
Sports Network/CSTV(After Playoffs)
1. Delaware (15-1)2. Colgate (15-1)3. Wofford (12-2)4. Fla. Atlantic (11-3)5. UNI (10-3)6. Western Ill. (9-4)7. Western Ky. (9-4)8. McNeese (10-2)9. Southern Ill. (10-2)
10. Northern Ariz. (9-4)11. Massachusetts (10-3)12. Penn (10-0)13. Southern U. (12-1)14. Montana (9-4)15. Bethune-Cookman (9-3)16. N.C. A&T (10-3)17. Grambling (9-3)18. Jacksonville St. (8-4)19. Northern Colo. (9-2)20. Northeastern (8-4)21. Montana St. (7-6)22. Idaho St. (8-4)23. Lehigh (8-3)24. Ga. Southern (7-4)25. Villanova (7-4)
2004USA Today/ESPN(After Playoffs)
1. James Madison (13-2)2. Montana (12-3)3. William & Mary (11-3)4. Sam Houston St. (11-3)5. Furman (10-3)6. New Hampshire (10-3)7. Eastern Wash. (9-4)8. Delaware (9-4)9. Southern Ill. (10-2)10. Ga. Southern (9-3)11. Western Ky. (9-3)12. Hampton (10-2)13. Harvard (10-0)14. Lehigh (9-3)15. Cal Poly (9-2)16. Jacksonville St. (9-2)17. Northwestern St. (8-4)18. Wofford (8-3)19. Lafayette (8-4)20. Alabama St. (10-2)21. Penn (8-2)22. South Carolina St. (9-2)23. North Dakota St. (8-3)24. Coastal Caro. (10-1)25. UNI (7-4)
Sports Network/CSTV(After Playoffs)
1. James Madison (13-2)2. Montana (12-3)3. William & Mary (11-3)4. Sam Houston St. (11-3)5. Furman (10-3)6. New Hampshire (10-3)7. Delaware (9-4)8. Eastern Wash. (9-4)9. Southern Ill. (10-2)10. Ga. Southern (9-3)11. Western Ky. (9-3)12. Hampton (10-2)13. Harvard (10-0)14. Jacksonville St. (9-2)15. Lehigh (9-3)
16. Cal Poly (9-2)17. Northwestern St. (8-4)18. Wofford (8-3)19. Lafayette (8-4)20. Alabama St. (10-2)21. Penn (8-2)22. South Carolina St. (9-2)23. North Dakota St. (8-3)24. Coastal Caro. (10-1)25. UNI (7-4)
2005USA Today/ESPN(After Playoffs)
1. Appalachian St. (12-3)2. UNI (11-4)3. Furman (11-3)4. Texas St. (11-3)5. New Hampshire (11-2)6. Cal Poly (9-4)7. Southern Ill. (9-4)8. Richmond (9-4)9. Ga. Southern (8-4)10. Hampton (11-1)11. Montana (8-4)12. Grambling (11-1)13. Eastern Wash. (7-5)14. Youngstown St. (8-3)15. Eastern Ill. (9-3)16. Nicholls St. (6-4)17. Montana St. (7-4)18. Brown (9-1)19. South Carolina St. (9-2)20. Lafayette (8-4)21. Massachusetts (7-4)22. Colgate (8-4)23. Coastal Caro. (9-2)24. Illinois St. (7-4)25. Lehigh (8-3)
Sports Network/CSTV(After Playoffs)
1. Appalachian St. (12-3)2. UNI (11-4)3. Furman (11-3)4. Texas St. (11-3)5. New Hampshire (11-2)6. Cal Poly (9-4)7. Southern Ill. (9-4)8. Richmond (9-4)9. Ga. Southern (8-4)10. Hampton (11-1)11. Grambling (11-1)12. Montana (8-4)13. Eastern Wash. (7-5)14. Youngstown St. (8-3)15. Brown (9-1)16. Eastern Ill. (9-3)17. Nicholls St. (6-4)18. Montana St. (7-4)19. Massachusetts (7-4)20. South Carolina St. (9-2)21. Lafayette (8-4)

National Poll Rankings 78
22. Illinois St. (7-4)23. Colgate (8-4)24. Coastal Caro. (9-2)25. James Madison (7-4)
2006CollegeSporting News.com(After Playoffs)
1. Appalachian St. (14-1)2. Massachusetts (13-2)3. Montana (12-2)4. Youngstown St. (11-3)5. North Dakota St. (10-1)6. New Hampshire (9-4)7. Southern Ill. (9-4)8. Illinois St. (9-4)9. James Madison (9-3)10. Hampton (10-2)11. Montana St. (8-5) 12. Furman (8-4)13. UT Martin (9-3)14. Cal Poly (7-4)15. Coastal Caro. (9-3)16. Eastern Ill. (8-5)17. Princeton (9-1)18. San Diego (11-1)19. UNI (7-4)20. Portland St. (7-4)21. South Dakota St. (7-4)22. McNeese (7-5)23. Wofford (7-4)24. UC Davis (6-5)25. Northern Ariz. (6-5)
Sports Network/CSTV(After Playoffs)
1. Appalachian St. (14-1)2. Massachusetts (13-2)3. Montana (12-2)4. Youngstown St. (11-3)5. North Dakota St. (10-1)6. New Hampshire (9-4)7. Southern Ill. (9-4)8. Illinois St. (9-4)9. James Madison (9-3)10. Montana St. (8-5) 11. Hampton (10-2)12. Furman (8-4)13. UT Martin (9-3)14. Coastal Caro. (9-3)15. Eastern Ill. (8-5)16. Cal Poly (7-4)17. UNI (7-4)18. Princeton (9-1)19. Portland St. (7-4)20. San Diego (11-1)21. McNeese (7-5)22. South Dakota St. (7-4)23. Wofford (7-4)24. Central Ark. (8-3)25. Yale (8-2)
2007CollegeSportingNews.com/AFCA(After Playoffs)
1. Appalachian St. (13-2)2. Delaware (11-4)3. Southern Ill. (12-2)4. Richmond (11-3)5. UNI (12-1)6. Massachusetts (10-3)7. James Madison (8-4)8. Eastern Wash. (9-4)9. North Dakota St. (10-1)10. Wofford (9-4)11. McNeese (11-1)12. Montana (11-1)13. Eastern Ky. (9-3)14. New Hamsphire (7-5)15. Eastern Ill. (8-4)16. Delaware St. (10-2)17. Youngstown St. (7-4)18. Ga. Southern (7-4)19. Fordham (7-4)20. Harvard (8-2)21. Yale (9-1)22. South Dakota St. (7-4)23. Elon (7-4)24. Grambling (8-4)25. Dayton (11-1)
Sports Network(After Playoffs)
1. Appalachian St. (13-2)2. Delaware (11-4)3. Southern Ill. (12-2)4. UNI (12-1)5. Richmond (11-3)6. Wofford (9-4)7. Massachusetts (10-3)8. Eastern Wash. (9-4)9. North Dakota St. (10-1)10. Montana (11-1)11. McNeese (11-1)12. James Madison (8-4)13. Eastern Ky. (9-3)14. New Hampshire (7-5)15. Delaware St. (10-2)16. Youngstown St. (7-4)17. Ga. Southern (7-4)18. Eastern Ill. (8-4)19. South Dakota St. (7-4)20. Fordham (7-4)21. Harvard (8-2)22. Yale (9-1) 23. Elon (7-4)24. Cal Poly (7-4)25. Grambling (8-4)
2008AFCA(After Playoffs)
1. Richmond (13-3)2. Montana (14-2)
3. James Madison (12-2)4. UNI (12-3)5. Appalachian St. (11-3)6. Villanova (10-3)7. New Hampshire (10-3)8. Cal Poly (8-3)9. Weber St. (10-4)10. Southern Ill. (9-3)11. Wofford (9-3)12. Central Ark. (10-2)13. South Carolina St. (10-3)14. Harvard (9-1)15. Liberty (10-2)16. Maine (8-5)17. Colgate (9-3)18. Eastern Ky. (8-4)19. Elon (8-4)20. William & Mary (7-4)21. McNeese (7-4)22. Jacksonville St. (8-3)23. Texas St. (8-5)24. Grambling (11-2)25. Prairie View (9-1)
Sports Network(After Playoffs)
1. Richmond (13-3)2. Montana (14-2)3. James Madison (12-2)4. UNI (12-3)5. Appalachian St. (11-3)6. Villanova (10-3)7. Weber St. (10-4)8. New Hampshire (10-3)9. Wofford (9-3)10. Cal Poly (8-3)11. Southern Ill. (9-3)12. Central Ark. (10-2)13. South Carolina St. (10-3)14. Liberty (10-2)15. Harvard (9-1)16. Colgate (9-3)17. Elon (8-4)18. Maine (8-5)19. Eastern Ky. (8-4)20. William & Mary (7-4)21. McNeese (7-4)22. Texas St. (8-5)23. Jacksonville St. (8-3)24. Grambling (11-2)25. Prairie View (9-1)
2009Coaches(After Playoffs)
1. Villanova (14-1)2. Montana (14-1)3. Appalachian St. (11-3) William & Mary (11-3)5. Richmond (11-2)6. Southern Ill. (11-2)7. New Hampshire (10-3)8. South Carolina St. (10-2)
9. SFA (10-3)10. Elon (9-3)11. South Dakota St. (8-4)12. McNeese (9-3)13. Eastern Wash. (8-4)14. Holy Cross (9-3)15. Eastern Ill. (8-4)16. Jacksonville St. (8-3)17. Weber St. (7-5)18. UNI (7-4)19. Prairie View (9-1)20. Colgate (9-2)21. Liberty (8-3)22. Florida A&M (8-3)23. Penn (8-2)24. Texas St. (7-4)25. Lafayette (8-3)
Sports Network(After Playoffs)
1. Villanova (14-1)2. Montana (14-1)3. Appalachian St. (11-3)4. William & Mary (11-3)5. Richmond (11-2)6. Southern Ill. (11-2)7. New Hampshire (10-3)8. South Carolina St. (10-2)9. Elon (9-3)10. SFA (10-3)11. South Dakota St. (8-4)12. McNeese (9-3)13. Eastern Wash. (8-4)14. Holy Cross (9-3)15. Prairie View (9-1)16. Jacksonville St. (8-3)17. Weber St. (7-5)18. UNI (7-4)19. Eastern Ill. (8-4)20. Penn (8-2)21. Colgate (9-2)22. Liberty (8-3)23. Florida A&M (8-3)24. Lafayette (8-3)25. Texas St. (7-4)
2010Coaches(After Playoffs)
1. Eastern Wash. (13-2)2. Delaware (12-3)3. Villanova (9-5)4. Appalachian St. (11-3)5. Wofford (10-3)6. Ga. Southern (10-5)7. New Hampshire (8-5)8. William & Mary (8-4)9. North Dakota St. (9-5)10. SFA (9-3)11. Montana St. (9-3)12. Jacksonville St. (9-3)13. Southeast Mo. St. (9-3)14. Lehigh (10-3)

National Poll Rankings 79
15. Bethune-Cookman (10-2)16. Penn (9-1)17. South Carolina St. (9-3)18. UNI (7-5)19. Liberty (8-3)20. Western Ill. (8-5)21. Montana (7-4)22. Jacksonville (10-1)23. Cal Poly (7-4)24. Grambling (9-2)25. Dayton (10-1)
Sports Network(After Playoffs)
1. Eastern Wash. (13-2)2. Delaware (12-3)3. Villanova (9-5)4. Appalachian St. (11-3)5. Ga. Southern (10-5)6. Wofford (10-3)7. New Hampshire (8-5)8. SFA (9-3)9. North Dakota St. (9-5)10. William & Mary (8-4)11. Montana St. (9-3)12. Jacksonville St. (9-3)13. Southeast Mo. St. (9-3)14. Lehigh (10-3)15. Bethune-Cookman (10-2)16. South Carolina St. (9-3)17. Western Ill. (8-5)18. Penn (9-1)19. UNI (7-5)20. Montana (7-4)21. Liberty (8-3)22. Jacksonville (10-1)23. Grambling (9-2)24. Cal Poly (7-4)25. Dayton (10-1)
2011Coaches(After Playoffs)
1. North Dakota St. (14-1)2. Sam Houston St. (14-1)3. Ga. Southern (11-3)4. Montana (11-3)5. UNI (10-3)6. Lehigh (11-2)7. Montana St. (10-3)8. Maine (9-4)9. Towson (9-3)10. Old Dominion (10-3)11. Appalachian St. (8-4)12. New Hampshire (8-4)13. Wofford (8-4)14. James Madison (8-5)15. Central Ark. (9-4)16. Stony Brook (9-4)17. Harvard (9-1)18. Norfolk St. (9-3)19. Tennessee Tech (7-4)20. Delaware (7-4)
21. Eastern Ky. (7-5)22. Illinois St. (7-4)23. Albany (NY) (8-4)24. Jackson St. (9-2)25. Liberty (7-4)
Sports Network(After Playoffs)
1. North Dakota St. (14-1)2. Sam Houston St. (14-1)3. Montana (11-3)4. Ga. Southern (11-3)5. Lehigh (11-2)6. UNI (10-3)7. Montana St. (10-3)8. Maine (9-4)9. Towson (9-3)10. Old Dominion (10-3)11. New Hampshire (8-4)12. Appalachian St. (8-4)13. Wofford (8-4)14. Central Ark. (9-4)15. James Madison (8-5)16. Harvard (9-1)17. Delaware (7-4)18. Stony Brook (9-4)19. Norfolk St. (9-3)20. Illinois St. (7-4)21. Tennessee Tech (7-4)22. Jackson St. (9-2)23. North Dakota (8-3)24. Eastern Ky. (7-5)25. Liberty (7-4)
2012Coaches(After Playoffs)
1. North Dakota St. (14-1)2. Sam Houston St. (11-4)3. Ga. Southern (12-4)4. Eastern Wash. (11-3)5. Montana St. (11-2)6. Old Dominion (11-2)7. Wofford (9-4)8. Appalachian St. (8-4)9. Illinois St. (9-4)10. Central Ark. (9-3)11. Cal Poly (9-3)12. Stony Brook (10-3)13. New Hampshire (8-4)14. Lehigh (10-1)15. Towson (7-4)16. Villanova (8-4)17. South Dakota St. (9-4)18. Richmond (8-3)19. Eastern Ky. (8-3)20. Northern Ariz. (8-2)21. James Madison (7-4)22. Wagner (9-4)23. Bethune-Cookman (9-3)24. Coastal Caro. (8-5)25. Eastern Ill. (7-5)
Sports Network(After Playoffs)
1. North Dakota St. (14-1)2. Sam Houston St. (11-4)3. Ga. Southern (10-4)4. Eastern Wash. (11-3)5. Montana St. (11-2)6. Old Doninion (11-2)7. Wofford (9-4)8. Illinois St. (9-4)9. Appalachian St. (8-4)10. Central Ark. (9-3)11. Stony Brook (10-3)12. Cal Poly (9-3)13. New Hampshire (8-4)14. South Dakota St. (9-4)15. Villanova (8-4)16. Lehigh (10-1)17. Towson (7-4)18. Richmond (8-3)19. James Madison (7-4)20. Northern Ariz. (8-3)21. Wagner (9-4)22. Bethune-Cookman (9-3)23. Eastern Ky. (8-3)24. Coastal Caro. (8-5)25. Colgate (8-4)
2013Coaches(After Playoffs)
1. North Dakota St. (15-0)2. Towson (13-3)3. Eastern Wash. (12-3)4. Eastern Ill. (12-2)5. New Hampshire (10-5)6. Southeastern La. (11-3)7. Coastal Caro. (12-3)8. Montana (10-3)9. McNeese (10-3)10. Fordham (12-2)11. Maine (10-3)12. Jacksonville St. (12-2)13. Sam Houston St. (9-5)14. South Dakota St. (8-4)15. Northern Ariz. (9-3)16. Bethune-Cookman (10-3)17. Tennessee St. (10-4)18. Samford (8-5)19. Youngstown St. (8-4)20. Montana St. (7-5)21. Furman (8-6)22. Charleston So. (10-3)23. Harvard (9-1)24. Southern Utah (8-4)25. Chattanooga (8-4)
Sports Network(After Playoffs)
1. North Dakota St. (15-0)2. Towson (13-3)3. Eastern Wash. (12-3)4. Eastern Ill. (12-2)
5. New Hampshire (10-5)6. Southeastern La. (11-3)7. Coastal Caro. (12-3)8. Montana (10-3)9. Fordham (12-2)10. Jacksonville St. (12-2)11. McNeese (10-3)12. Maine (10-3)13. South Dakota St. (8-4)14. Sam Houston St. (9-5)15. Northern Ariz. (9-3)16. Bethune-Cookman (10-3)17. Tennessee St. (10-4)18. Youngstown St. (8-4)19. Samford (8-5)20. Montana St. (7-5)21. Southern Utah (8-4)22. Furman (8-6)23. Chattanooga (8-4)24. Charleston So. (10-3)25. South Carolina St. (9-4)
2014Coaches(After Playoffs)
1. North Dakota St. (15-1)2. Illinois St. (13-2)3. New Hampshire (12-2)4. Eastern Wash. (11-3)5. Coastal Caro. (12-2)6. Sam Houston St. (11-5)7. Villanova (11-3)8. Chattanooga (10-4)9. Jacksonville St. (10-2)10. UNI (9-5)11. Montana (9-5)12. Southeastern La. (9-4)13. South Dakota St. (9-5)14. Fordham (11-3)15. Harvard (10-0)16. Richmond (9-5)17. Liberty (9-5)18. Indiana St. (8-6)19. James Madison (9-3)20. Montana St. (8-5)21. Eastern Ky. (9-4)22. Bethune-Cookman (9-3)23. Sacred Heart (9-3)24. William & Mary (7-5)25. Youngstown St. (7-5)
Sports Network(After Playoffs)
1. North Dakota St. (15-1)2. Illinois St. (13-2)3. New Hampshire (12-2)4. Eastern Wash. (11-3)5. Coastal Caro. (12-2)6. Sam Houston St. (11-5)7. Villanova (11-3)8. Chattanooga (10-4)9. Jacksonville St. (10-2)10. UNI (9-5)

National Poll Rankings 80
11. Fordham (9-5)12. South Dakota St. (11-3)13. Montana (9-5)14. Southeastern La. (9-4)15. Harvard (10-0)16. Richmond (9-5)17. Liberty (9-5)18. James Madison (9-3)19. Indiana St. (8-6)20. Montana St. (8-5)21. Eastern Ky. (9-4)22. Youngstown St. (7-5)23. Bethune-Cookman (9-3)24. Sacred Heart (9-3)25. Idaho St. (8-4)
2015Coaches(After Playoffs)
1. North Dakota St. (13-2)2. Jacksonville St. (13-2)3. Richmond (10-4)4. Sam Houston St. (11-4)5. Illinois St. (10-3)6. UNI (9-5)7. Charleston So. (10-3)8. Chattanooga (9-4)9. McNeese (10-1)10. Portland St. (9-3)11. James Madison (9-3)12. William & Mary (9-4)13. Colgate (9-5)14. Montana (8-5)15. The Citadel (9-4)16. South Dakota St. (8-4)17. Coastal Caro. (9-3)18. Southern Utah (8-4)19. Fordham (9-3)20. Harvard (9-1)21. N.C. A&T (10-2)22. Western Ill. (7-6)23. Eastern Ill. (7-5)24. Dartmouth (9-1)25. Bethune-Cookman (9-2)
STATS(After Playoffs)
1. North Dakota St. (13-2)2. Jacksonville St. (13-2)3. Sam Houston St. (11-4)4. Richmond (10-4)5. Illinois St. (10-3)6. Charleston So. (10-3)7. McNeese (10-1)8. UNI (9-5)9. Chattanooga (9-4)10. Portland St. (9-3)11. James Madison (9-3)12. William & Mary (9-4)13. The Citadel (9-4)14. Montana (8-5)15. South Dakota St. (8-4)16. Coastal Caro. (9-3)17. Colgate (9-5)18. Southern Utah (8-4)19. Fordham (9-3)20. Harvard (9-1)21. N.C. A&T (10-2)22. Western Ill. (7-6)23. Dartmouth (9-1)24. Grambling (9-3)25. Eastern Ill. (7-5)
2016Coaches(After Playoffs)
1. James Madison (14-1)2. Youngstown St. (12-4)3. North Dakota St. (12-2)4. Eastern Wash. (12-2)5. Sam Houston St. (12-1)6. Jacksonville St. (10-2)7. South Dakota St. (9-4)8. Richmond (10-4)9. The Citadel (10-2)10. Chattanooga (9-4)11. Wofford (10-4)12. North Dakota (9-3)13. Villanova (9-4)14. Charleston So. (7-4)
15. Grambling (12-1)16. Central Ark. (10-3)17. New Hampshire (8-5)18. Lehigh (9-3)19. N.C. Central (9-3)20. N.C. A&T (9-3)21. Cal Poly (7-5) San Diego (10-2)23. Samford (7-5)24. Weber St. (7-5)25. Montana (6-5)
STATS(After Playoffs)
1. James Madison (14-1)2. Youngstown St. (12-4)3. North Dakota St. (12-2)4. Eastern Wash. (12-2)5. Sam Houston St. (12-1)6. South Dakota St. (9-4)7. Jacksonville St. (10-2)8. Richmond (10-4)9. Wofford (10-4)10. The Citadel (10-2)11. Villanova (9-4)12. North Dakota (9-3)13. Chattanooga (9-4)14. Central Ark. (10-3)15. Charleston So. (7-4)16. Grambling (12-1)17. New Hampshire (8-5)18. Coastal Caro. (10-2)19. San Diego (10-2)20. N.C. A&T (9-3)21. Lehigh (9-3)22. N.C. Central (9-3)23. Samford (7-5)24. Cal Poly (7-5)25. Weber St. (7-5)

National Poll Rankings 81
UNDEFEATED, UNTIED TEAMS
Regular-season games only, from 1978. Subsequent loss in FCS championship is indi-cated by (††).
Year Team Wins1978 Nevada ††111979 (None)1980 (None)1981 (None)1982 Eastern Ky. *101983 (None)1984 Tennessee St. 11
Alcorn ††91985 Middle Tenn. ††111986 Nevada ††11
Penn 101987 Holy Cross 111988 (None)1989 Ga. Southern *111990 Youngstown St. ††111991 Holy Cross 11
Year Team WinsNevada ††11
1992 (None)1993 Boston U. ††11
Howard ††11Penn 10
1994 Penn 91995 Appalachian St. ††11
McNeese ††11Murray St. ††11Troy ††11
1996 Dartmouth 10Dayton 11Marshall *11Montana ††11
1997 Villanova ††111998 Ga. Southern ††11
Lehigh ††111999 (None)2000 Davidson 10
Robert Morris 102001 Sacred Heart 10
Harvard 92002 (None)
Year Team Wins2003 Penn 102004 Harvard 102005 Hampton ††112006 None2007 McNeese ††11
Montana ††11UNI ††11
2008 None2009 Montana ††112010 None2011 Sam Houston St. ††112012 None2013 North Dakota St. *152014 Harvard 102015 McNeese ††102016 Sam Houston St. ††11*Won FCS championship.
THE SPOILERS(From 1978 Season)Following is a list of the spoilers of FCS teams that lost their perfect (unde-feated, untied) record in their season-ending game, including the FCS cham-pionship playoffs. An asterisk (*) indicates a championship playoff game and a dagger (†) indicates the home team in a regular-season game.
Date Spoiler Opponent Score12-9-78 *Massachusetts Nevada 44-2111-15-80 † Grambling South Carolina St. 26-311-22-80 † Murray St. Western Ky. 49-012-1-84 *Louisiana Tech Alcorn 44-2112-7-85 *Ga. Southern Middle Tenn. 28-2111-22-86 Boston College † Holy Cross 56-2612-13-86 *Ga. Southern Nevada 48-3811-19-88 *Cornell Penn 19-611-24-90 *UCF Youngstown St. 20-1712-7-91 *Youngstown St. Nevada 30-2811-27-93 *Marshall Howard 28-1412-4-93 *Idaho Boston U. 21-1411-25-95 *Ga. Southern Troy 24-2111-25-95 *UNI Murray St. 35-3412-2-95 *SFA Appalachian St. 27-1712-9-95 *Marshall McNeese 25-1311-23-96 Robert Morris Duquesne 28-2612-21-96 *Marshall Montana 49-2911-22-97 † Colgate Bucknell 48-1412-6-97 *Youngstown St. Villanova 37-3412-5-98 *Massachusetts Lehigh 27-2112-19-98 *Massachusetts Ga. Southern 55-4311-27-99 *N.C. A&T Tennessee St. 24-1012-2-00 *Delaware Lehigh 47-2212-8-01 *Furman Lehigh 34-1712-19-03 *Delaware Colgate 40-011-26-05 *Richmond Hampton 38-1011-17-07 † South Dakota St. North Dakota St. 29-2411-17-07 *Harvard † Yale 37-611-24-07 *Eastern Wash. McNeese 44-1411-24-07 *Wofford Montana 23-2212-1-07 *Delaware UNI 39-2712-18-09 *Villanova Montana 23-21
Date Spoiler Opponent Score1-7-12 *North Dakota St. Sam Houston St. 17-612-5-15 *Sam Houston St. McNeese 34-2912-9-16 *James Madison Sam Houston St. 65-7

Streaks and Rivalries 82
STREAKS AND RIVALRIESBecause FCS began in 1978, only those streaks from the period (1978-pres-ent) are listed. Only schools that have been FCS members for five years are eligible for inclusion.
LONGEST WINNING STREAKS(From 1978; includes playoff games)Wins Team Year(s) Ended by Score33 North Dakota St. 2012-14 UNI 23-324 Montana 2001-02 Eastern Wash. 21-3024 Penn 1992-95 Columbia 14-2422 Harvard 2013-15 Penn 25-3521 Colgate 2002-03 Delaware 0-4021 Montana 1995-96 Marshall 29-4920 Dayton 1996-97 Cal Poly 24-4420 Holy Cross 1990-92 Army West Point 7-1719 Duquesne 1995-96 Robert Morris 26-2818 San Diego 2005-06 UC Davis 27-3718 Davidson 1999-2001 Jacksonville 3-4518 Eastern Ky. 1982-83 Western Ky. 10-1017 Richmond 2008-09 Villanova 20-2117 Appalachian St. 2006-07 Wofford 31-4217 Penn 2002-04 Villanova 13-1617 Robert Morris 1999-2000 Buffalo 27-3316 Sam Houston St. 2010-11 North Dakota St. 17-616 Ga. Southern 1989-90 Middle Tenn. 13-1615 Dartmouth 1996-97 Lehigh 26-4615 Marshall 1996 Moved to FBS14 North Dakota St. 2015-16 South Dakota St. 17-1914 Montana 2009 Villanova 21-2314 Charleston So. 2005-06 Liberty 20-3414 Ga. Southern 1998 Massachusetts 43-5514 Youngstown St. 1994 Kent St. 14-1714 Delaware 1979-80 Lehigh 20-27
LONGEST UNBEATEN STREAKS(From 1978; includes playoff games and ties)
G Wins Ties Team Year(s) Ended by33 33 0 North Dakota St. 2012-14 UNI24 24 0 Montana 2001-02 Eastern Wash.24 24 0 Penn 1992-95 Columbia22 22 0 Harvard 2013-15 Penn22 21 1 Dartmouth 1995-97 Lehigh21 21 0 Colgate 2002-03 Delaware21 21 0 Montana 1995-96 Marshall20 20 0 Dayton 1996-97 Cal Poly20 20 0 Holy Cross 1990-92 Army West Point20 19 1 Youngstown St. 1993-94 Kent St.19 19 0 Duquesne 1995-96 Robert Morris19 18 1 Eastern Ky. 1982-83 Murray St.18 18 0 Davidson 1999-2001 Jacksonville17 17 0 Richmond 2008-09 Villanova17 17 0 Appalachian St. 2006-07 Wofford17 17 0 Penn 2002-04 Villanova17 17 0 Robert Morris 1999-2000 Buffalo17 16 1 Alabama St. 1990-92 Alcorn17 16 1 Grambling 1977-78 Florida A&M16 16 0 Sam Houston St. 2010-11 North Dakota St.16 16 0 Ga. Southern 1989-90 Middle Tenn.15 15 0 Marshall 1996 Moved to FBS15 14 1 Delaware 1994-95 Navy14 14 0 North Dakota St. 2015-16 South Dakota St.
G Wins Ties Team Year(s) Ended by14 14 0 Montana 2009 Villanova14 14 0 Charleston So. 2005-06 Liberty14 14 0 Ga. Southern 1998 Massachusetts14 14 0 Delaware 1979-80 Lehigh
LONGEST HOME WINNING STREAKS
(From 1978; includes playoff games)Wins Team Year(s) Ended by39 Ga. Southern 1997-2001 Furman38 Ga. Southern 1985-90 Eastern Ky.34 Eastern Ky. 1978-84 Western Ky.31 Middle Tenn. 1987-94 Eastern Ky.30 Montana 1994-97 Eastern Wash.29 Appalachian St. 2002-07 Ga. Southern28 San Diego 2004-08 Dayton26 North Dakota St. 2012-15 South Dakota25 Montana 2000-02 Montana St.25 UNI 1989-92 Youngstown St.24 Montana 2008-10 Montana St.23 UNI 1983-87 Montana23 Sam Houston St. 2010-14 Colorado St.-Pueblo22 Nevada 1989-91 Youngstown St.20 Arkansas St. 1984-87 Northwestern St.19 Penn 2000-03 Villanova19 Illinois St. 2013-15 Richmond17 Colgate 2003-05 Central Conn. St.16 Jacksonville 2009-12 San Diego16 Massachusetts 2006-08 Richmond16 Penn 1992-95 Princeton16 Texas St. 1981-83 Central St.16 The Citadel 1980-82 ETSU* active streak.
LONGEST LOSING STREAKS(From 1978; can include playoff games)Losses Team Years Ended Against
80 Prairie View 1989-98 Langston44 Columbia 1983-88 Princeton33 Indiana St. 2006-09 Western Ill.30 Saint Francis (PA) 1999-2002 La Salle29 Valparaiso 2009-11 Campbell27 *Austin Peay 2014-present active27 N.C. A&T 2005-07 Johnson C. Smith24 Canisius 1999-2001 Siena24 Columbia 2012-15 Wagner24 Savannah St. 2013-15 Florida A&M19 Southern Utah 2006-08 Adams St.19 Indiana St. 2004-06 Missouri St.19 Delaware St. 1997-99 Norfolk St.19 Charleston So. 1993-95 Morehead St.19 Idaho St. 1978-80 Portland St.18 Davidson 1985-87 Wofford17 Butler 2004-05 Hanover17 Tennessee Tech 1984-85 Morehead St.16 Colgate 1994-96 Brown16 Siena 1994-96 Iona16 Middle Tenn. 1978-79 Tennessee Tech
*Active streak.

Streaks and Rivalries 83
LONGEST ACTIVE HOME WINNING STREAKS
G Team Conference2016 Conference
Record13 Sam Houston St. Southland 9-011 Fordham Patriot 5-111 San Diego Pioneer 8-08 James Madison Colonial 8-08 N.C. Central Mid-Eastern 8-08 Saint Francis (PA) Northeast 5-18 Youngstown St. MVFC 6-2
LONGEST STREAK OF GAMES WITHOUT BEING SHUT OUT
G School Years370 *Montana 1989-present291 Hampton 1984-2009265 Lehigh 1986-2010260 *#Dayton 1993-present220 Delaware 1996-2014199 Eastern Wash. 1988-2006165 UNI 1983-96158 McNeese 1988-2001154 Delaware 1983-96
*Active streak. #Dayton actually holds a streak of 444 consecutive games without being shut out, but 194 games were when Dayton competed as a Division III program.
Before FCS was formed in 1978:G School Years
197 Eastern Ill. 1977-96124 Western Ill. 1968-80109 Dartmouth 1961-7389 Weber St. 1964-73
MOST PLAYED RIVALRIES(Ongoing Unless Indicated)(Series leader listed first)
Games OpponentsRivalry Record
First Game
152 Lafayette-Lehigh 78-69-5 1884140 Yale-Princeton 76-53-10 1873133 Yale-Harvard 66-59-8 1875127 William & Mary-Richmond 62-60-5 1898123 Penn-Cornell 72-46-5 1893121 Yale-Brown 81-35-5 1880120 Harvard-Dartmouth 71-44-5 1882116 Harvard-Brown 84-30-2 1893116 Montana-Montana St. 73-38-5 1897
^111 North Dakota-North Dakota St. 62-46-3 1894109 Princeton-Harvard 54-48-7 1877109 South Dakota St.-South Dakota 52-50-7 1889108 Princeton-Penn 65-42-1 1876105 North Dakota St.-South Dakota St. 60-40-5 1903104 Cornell-Columbia 65-36-3 1889104 Illinois St.-Eastern Ill. 52-43-9 1901104 New Hampshire-Maine 53-43-8 1903100 Western Ill.-Illinois St. 50-45-5 1904100 Dartmouth-Cornell 59-40-1 1900
^Did not play in 2016.
ADDITIONAL RIVALRY RECORDSLongest Uninterrupted Series(Must have played every year; current unless indicated)
127 games—Lafayette-Lehigh (from 1897)$98 games—Cornell-Dartmouth (from 1919)97 games—Cornell-Penn (from 1919)91 games—Dartmouth-Yale (from 1926)85 games—Brown-Yale (from 1932)84 games—Dartmouth-Princeton (from 1933)75 games—Columbia-Dartmouth (from 1942)74 games—Columbia-Yale (from 1943)74 games—Richmond-William & Mary (from 1944)&72 games—Brown-Harvard (from 1945)72 games—Bucknell-Lafayette (from 1945)72 games—Harvard-Yale (from 1945)72 games—Princeton-Yale (from 1945)71 games—Dartmouth-Harvard (from 1946)71 games—Harvard-Princeton (from 1946)71 games—Montana-Montana St. (from 1946)67 games—Sam Houston St.-Texas St. (1946-2012)67 games—SFA-Texas St. (1946-2012)
$Played twice in 1897-1901 and 1943-44; &Played twice in 2015.
Most Consecutive Wins Over an Opponent in an Uninterrupted Series (Must have played in consecutive years)
32—Grambling over Prairie View, 1977-200823—William & Mary over VMI, 1986-200822—Eastern Ky. over Tennessee Tech, 1976-9720—Eastern Ky. over Austin Peay, 1978-9720—Penn over Columbia, 1997-2016 (current)18—Western Ill. over Southern Ill., 1984-200118—Eastern Ky. over Morehead St., 1972-8918—Southeast Mo. St. over Lincoln (MO), 1972-8917—Princeton over Columbia, 1954-7016—Montana over Montana St., 1986-200116—Harvard over Columbia, 1979-9416—Middle Tenn. over Morehead St., 1951-6615—Evansville over Ky. Wesleyan, 1983-9715—Delaware over West Chester, 1968-8215—Dartmouth over Brown, 1960-7415—Lehigh over Bucknell, 1998-201214—Dartmouth over Columbia, 1984-9714—Marshall over VMI, 1983-96 14—Appalachian St. over ETSU, 1982-9514—Yale over Princeton, 1967-8013—Youngstown St. over Indiana St., 1997-200913—Duquesne over Saint Peter’s, 1994-200613—Appalachian St. over Western Caro., 1985-9713—Massachusetts over Northeastern, 1984-9613—Duquesne over Saint Francis (PA), 1977-8912—Idaho over Boise St., 1982-9312—Cornell over Columbia, 1977-88
Most Consecutive Wins Over an Opponent in a Series(Did not have to play in consecutive years)
46—Yale over Wesleyan (CT), 1875-191332—Grambling over Prairie View, 1977-200830—Harvard over Williams, 1883-192025—William & Mary over VMI, 1986-2011 (current)23—Harvard over Bates, 1899-194423—Brown over Rhode Island, 1909-3422—Eastern Ky. over Austin Peay, 1978-200821—Grambling over Mississippi Val., 1957-7720—Eastern Ky. over UT Martin, 1973-200920—Penn over Columbia, 1997-2016 (current)19—Delaware over West Chester, 1993-2012 (current)16—Montana over Montana St., 1986-200116—Massachusetts over Northeastern, 1984-200116—Harvard over Columbia, 1979-9416—Yale over UConn, 1948-6416—Davidson over Elon, 1921-4815—Lehigh over Bucknell, 1998-201215—Delaware over West Chester, 1968-8214—Delaware over Massachusetts, 1958-8913—Youngstown St. over Indiana St., 1997-200912—Idaho over Ricks College, 1919-3312—Yale over Penn, 1879-92

FCS Stadiums 84
FCS STADIUMS Listed Alphabetically By School
School Stadium ConferenceYear Built Cap. Surface * (Year)
Abilene Christian Anthony Field at Wildcat Stadium
Southland 2017 12,000 FieldTurf
Alabama A&M Louis Crews SWAC-E 1996 21,000 GrassAlabama St. New ASU Stadium SWAC-E 2012 26,500 FieldTurfAlbany (NY) Bob Ford Field Colonial 2013 8,500 FieldTurfAlcorn Casem-Spinks SWAC-E 1992 22,500 GrassArk.-Pine Bluff Golden Lion SWAC-W 2000 14,500 GrassAustin Peay Fortera Ohio Valley 1946 7,000 FieldTurfBethune-Cookman Municipal MEAC 1979 10,000 GrassBrown Brown Ivy 1925 20,000 GrassBryant Bulldog Northeast 1999 4,400 GrassBucknell Christy Mathewson Patriot 1924 13,100 GrassButler Butler Bowl Pioneer 1927 5,647 TurfUC Davis Aggie Big Sky 2007 10,000 ArtificialCal Poly Alex G. Spanos Big Sky 1935 11,075 GrassCampbell Barker-Lane Pioneer 2008 5,000 AstroTurfCentral Ark. Estes Southland 1939 8,500 GrassCentral Conn. St. Arute Field Northeast 2001 2,300 FieldTurfCharleston So. Buccaneer Field Big South 1970 4,000 GrassChattanooga ^Finley Southern 1997 20,668 Polyethylene turf (2005)The Citadel Johnson Hagood Southern 1948 21,000 GrassColgate Andy Kerr Patriot 1937 10,221 FieldTurfColumbia Lawrence A. Wien Ivy 1984 17,000 GrassCornell Schoellkopf Ivy 1915 25,597 All-Pro TurfDartmouth Memorial Field Ivy 1923 15,000 FieldTurf (2006)Davidson Richardson Pioneer 1924 4,000 GrassDayton Welcome Pioneer 1949 11,000 AstroTurfDelaware Delaware Colonial 1952 22,000 FieldTurfDelaware St. Alumni Field MEAC 1957 7,000 ArtificialDrake Drake Pioneer 1925 14,557 GrassDuquesne Arthur J. Rooney Field Northeast 1993 2,200 AstroPlayETSU William B. Greene Jr. Southern 2017 7,694 ArtificialEastern Ill. O’Brien Ohio Valley 1970 10,000 GrassEastern Ky. Roy Kidd Ohio Valley 1969 20,000 FieldTurf (2009)Eastern Wash. Roos Field Big Sky 1967 8,600 Red FieldTurf (2010)Elon Rhodes Colonial 2001 11,250 GrassFlorida A&M Bragg Memorial MEAC 1957 25,500 GrassFordham Jack Coffey Field Patriot 1930 7,000 GrassFurman Paladin Southern 1981 16,000 GrassGardner-Webb Ernest W. Spangler Big South 1969 9,000 GrassGeorgetown Cooper Field Patriot 2003 2,400 GrassGrambling Robinson SWAC-W 1983 19,600 GrassHampton Armstrong MEAC 1928 17,000 GrassHarvard Harvard Ivy 1903 30,323 GrassHoly Cross Fitton Field Patriot 1924 23,500 GrassHouston Baptist Husky Southland 2014 5,000 Desso iDNAHoward Greene MEAC 1986 8,890 AstroTurfIdaho St. #Holt Arena Big Sky 1970 12,000 AstroTurfIllinois St. Hancock MVFC 1967 15,000 AstroTurfIncarnate Word Gayle and Tom Benson Southland 2008 6,200 GrassIndiana St. Memorial MVFC 1970 12,764 All-Pro TurfJackson St. ^Mississippi Memorial SWAC-E 1949 60,492 GrassJacksonville Milne Field Pioneer 1998 4,500 GrassJacksonville St. JSU Stadium Ohio Valley 1947 24,000 GrassJames Madison Bridgeforth Colonial 1974 24,877 FieldTurfKennesaw St. Fifth Third Bank Big South 2010 8,300 Bermuda GrassLafayette Fisher Field Patriot 1926 13,750 GrassLamar University Provost Umphrey Southland 1964 16,000 FieldTurf (2010)Lehigh Goodman Patriot 1988 16,000 GrassLiberty Williams Big South 1989 19,200 FieldTurfMaine Alfond Colonial 1998 10,000 FieldTurfMarist Tenney Pioneer 2007 5,000 GrassMcNeese Cowboy Southland 1965 17,500 Grass

FCS Stadiums 85
School Stadium ConferenceYear Built Cap. Surface * (Year)
Mercer Five Star Stadium Southern 2013 10,200 FieldTurfMississippi Val. Rice-Totten SWAC-E 1958 10,500 GrassMissouri St. Plaster Sports Complex MVFC 1941 17,500 FieldTurfMonmouth Kessler Field Big South 1993 4,600 GrassMontana Washington-Grizzly Big Sky 1986 25,200 SprinTurfMontana St. Bobcat Big Sky 1973 15,197 FieldTurfMorehead St. Jayne Pioneer 1964 10,000 OmniTurfMorgan St. Hughes MEAC 1934 10,000 GrassMurray St. Stewart Ohio Valley 1973 16,800 AstroTurfNew Hampshire Wildcat Stadium Colonial 1936 11,015 FieldTurfNicholls St. John L. Guidry Southland 1972 10,500 AstroTurfNorfolk St. Price MEAC 1997 30,000 GrassN.C. A&T Aggie MEAC 1981 21,500 GrassN.C. Central O’Kelly-Riddick MEAC 1975 10,000 MondoturfNorth Dakota Alerus Center Big Sky 2001 12,283 AstroTurfNorth Dakota St. #FargoDome MVFC 1992 18,700 AstroTurfNorthern Ariz. #Walkup Skydome Big Sky 1977 15,000 REALGRASSNorthern Colo. Nottingham Field Big Sky 1995 8,500 GrassUNI #UNI-Dome MVFC 1976 16,324 AstroTurfNorthwestern St. Turpin Southland 1976 15,971 AstroTurfPenn Franklin Field Ivy 1895 52,593 AstroTurfPortland St. Providence Park Big Sky 1926 19,566 FieldTurfPrairie View Panther Stadium SWAC-W 2016 15,000 GrassPresbyterian Bailey Memorial Big South 2002 6,500 GrassPrinceton Princeton Ivy 1998 27,800 GrassRhode Island Meade Colonial 1928 6,555 GrassRichmond Robins Colonial 2010 8,700 SuperTurfRobert Morris Joe Walton Northeast 2005 3,000 FieldTurfSacramento St. Hornet Big Sky 1964 21,195 GrassSacred Heart Campus Field Northeast 1993 4,000 AstroTurfSaint Francis (PA) DeGol Field Northeast 2005 3,450 GrassSam Houston St. Bowers Southland 1986 14,000 All-Pro TurfSamford Seibert Southern 1960 6,700 GrassSan Diego USD Torero Pioneer 1955 7,000 GrassSavannah St. Ted Wright MEAC 1967 8,000 GrassSouth Carolina St. Dawson Bulldog MEAC 1955 22,000 GrassSouth Dakota DakotaDome MVFC 1979 10,000 TurfSouth Dakota St Dana J. Dykhouse Stadium MVFC 2016 19,340 AstroTurfSoutheast Mo. St. Houck Ohio Valley 1930 10,000 GrassSoutheastern La. Strawberry Southland 1936 7,400 SprinTurfSouthern Ill. Saluki MVFC 2010 15,000 FieldTurfSouthern U. A.W. Mumford SWAC-W 1928 28,500 GrassSouthern Utah Eccles Coliseum Great West 1967 8,500 GrassSFA Homer Bryce Southland 1973 14,575 AstroTurf-12Stetson Spec Martin Pioneer 1941 6,000Stony Brook Kenneth P. LaValle Big South 2002 8,126 FieldTurfUT Martin Hardy M. Graham Ohio Valley 1964 7,500 GrassTennessee St. ^Nissan Stadium Ohio Valley 1999 68,798 GrassTennessee Tech Tucker Ohio Valley 1966 16,500 Stadia TurfTexas Southern BBVA Compass Stadium SWAC-W 2012 22,039 GrassTowson Johnny Unitas Colonial 1978 11,000 TurfValparaiso Brown Field Pioneer 1947 5,000 GrassVillanova Villanova Colonial 1927 12,000 AstroTurfVMI Alumni Field Southern 1962 10,000 GrassWagner Wagner College Northeast 1997 3,300 FieldTurfWeber St. Elizabeth Dee Shaw Stewart Big Sky 1966 17,500 GrassWestern Caro. E.J. Whitmire Southern 1974 13,742 AstroTurfWestern Ill. Hanson Field MVFC 1948 15,168 GrassWilliam & Mary Walter Zable Colonial 1935 12,259 FieldTurf (2003)Wofford Gibbs Southern 1996 13,000 GrassYale Yale Bowl Ivy 1914 61,446 GrassYoungstown St. Arnold D. Stambaugh MVFC 1982 20,650 SprinTurf^Not located on campus. #Indoor facility.

FCS Stadiums 86
STADIUMS LISTED BY CAPACITY (TOP 30)School Stadium Capacity Surface*Tennessee St. ^Nissan Stadium 68,798 GrassYale Yale Bowl 61,446 GrassJackson St. ^Mississippi Memorial 60,492 GrassPenn Franklin Field 52,593 AstroTurfHarvard Harvard 30,323 GrassNorfolk St. Price 30,000 GrassSouthern U. A.W. Mumford 28,500 GrassPrinceton Princeton 27,800 GrassAlabama St. New ASU Stadium 26,500 GrassCornell Schoellkopf 25,597 All-Pro TurfFlorida A&M Bragg Memorial 25,500 GrassMontana Washington-Grizzly 25,200 SprinTurfJames Madison Bridgeforth 24,877 FieldTurfJacksonville St. Paul Snow 24,000 GrassHoly Cross Fitton Field 23,500 GrassAlcorn Jack Spinks 22,500 GrassTexas Southern BBVA Compass Stadium 22,039 GrasDelaware Delaware 22,000 GrassSouth Carolina St. Dawson Bulldog 22,000 GrassN.C. A&T Aggie 21,500 GrassSacramento St. Hornet Field 21,195 GrassAlabama A&M Louis Crews 21,000 GrassThe Citadel Johnson Hagood 21,000 GrassChattanooga ^Finley 20,668 Polyethylene turfYoungstown St. Stambaugh 20,650 SprinTurfBrown Brown 20,000 GrassEastern Ky. Roy Kidd 20,000 GrassGrambling Robinson 19,600 GrassPortland St. ^Providence Park 19,566 FieldTurfSouth Dakota St. Dana J. Dykhouse 19,340 AstroTurf^Not located on campus. Surface Notes: *This column indicates the type of surface (either artificial or natural grass) present this year in the stadium. The brand name of the artificial turf, if known, is listed. Legend: Turf—Any of several types of artificial turfs (name brands include AstroTurf, FieldTurf, All-Pro, Omni-Turf, SuperTurf, Sprinturf, etc.); Grass—Natural grass surface; PAT—Prescription Athletic Turf (a “natural-artificial” surface featuring a network of pipes connected to pumps capable of sucking water from the natural turf or watering it. The pipes are located 18 inches from the surface and covered with a mixture of sand and filler. The turf also is lined with heating coils to keep it from freezing in temperatures below 32 degrees).

FCS Statistics Trends 87
FCS STATISTICS TRENDS(Average Per Game, One Team)
Rushing Passing Total Offense ScoringYear Teams Games Plays Yds. Yds/P Att. Cmp. Pct. Yds. Yds/Att. Plays Yds. Yds/P TD FG Pts.1978 38 201 *48.4 171.8 3.55 20.7 9.5 46.2 129.3 6.24 69.1 301.1 4.36 2.60 0.52 19.51979 39 211 47.1 164.7 3.50 20.5 9.2 45.0 125.2 6.13 67.5 289.9 4.30 2.40 0.62 18.51980 46 251 45.2 164.8 3.65 22.4 10.4 46.5 144.4 6.45 67.6 309.2 4.58 2.58 0.59 19.61981 50 270 44.3 155.0 3.50 24.9 11.9 47.7 161.5 6.49 69.1 316.4 4.58 2.71 0.69 20.91982 92 483 44.4 156.6 3.53 26.1 12.8 48.9 166.0 6.35 70.5 322.6 4.57 2.62 0.80 20.51983 84 450 43.9 155.2 3.54 26.2 13.0 49.4 167.3 6.38 70.1 322.4 4.60 2.69 0.79 21.11984 87 465 42.9 152.6 3.56 27.9 14.0 50.0 181.0 6.49 70.7 333.5 4.72 2.80 0.80 21.81985 87 471 42.4 157.6 3.72 28.9 14.6 50.4 187.3 6.49 *71.2 344.9 4.84 2.84 0.81 22.11986 86 456 42.4 157.9 3.72 28.3 14.1 49.7 186.4 6.60 70.7 344.3 4.87 2.90 0.86 22.71987 87 460 43.1 158.6 3.68 27.1 13.6 50.1 175.6 6.48 70.2 334.2 4.76 2.78 0.91 22.01988 88 465 43.2 161.3 3.74 26.5 13.3 50.2 172.7 6.53 69.6 334.0 4.80 2.80 0.92 22.11989 89 471 42.5 160.2 3.77 27.7 14.2 51.3 186.0 6.71 70.2 346.2 4.93 2.72 0.75 22.81990 87 473 42.7 161.5 3.79 27.8 14.1 50.6 187.0 6.73 70.5 348.5 4.95 2.98 0.84 23.21991 89 490 43.2 170.6 3.95 26.9 14.0 51.9 184.7 6.87 70.1 355.3 5.07 3.19 0.67 24.11992 88 485 43.0 171.4 3.99 26.0 13.5 51.7 179.4 6.89 69.0 350.8 5.08 3.16 0.68 23.91993 115 623 42.4 168.3 3.97 27.0 14.0 51.8 186.4 6.90 69.4 354.7 5.11 3.20 0.70 24.21994 117 643 41.6 164.1 3.95 27.5 14.3 51.9 188.1 6.85 69.0 352.1 5.10 3.18 0.70 24.11995 119 647 42.0 165.1 3.94 27.1 13.9 51.3 177.7 6.57 69.0 342.8 4.97 3.06 0.68 23.21996 116 629 42.0 162.0 3.86 26.9 13.7 51.1 177.6 6.62 68.8 339.6 4.94 3.05 0.72 23.21997 118 642 40.2 153.2 3.81 27.8 14.3 51.3 185.2 6.67 68.0 338.4 4.98 3.06 0.72 23.31998 119 631 40.8 162.7 3.98 27.2 14.3 52.6 187.8 6.91 68.0 350.5 5.15 3.26 0.71 24.71999 122 661 40.8 162.9 4.02 28.8 15.1 52.5 197.1 6.83 69.4 360.0 5.19 3.45 0.71 25.92000 122 664 41.2 164.9 4.00 27.8 14.5 52.3 191.1 6.88 69.0 356.0 5.16 3.40 0.75 25.82001 123 649 40.6 160.4 3.95 28.1 14.8 52.6 193.7 6.89 68.7 354.1 5.15 3.34 0.72 25.32002 123 700 41.0 155.6 3.80 27.5 14.5 52.7 187.5 6.81 68.5 343.1 5.01 3.19 0.75 24.32003 121 699 40.5 159.5 3.94 28.7 15.6 54.2 197.4 6.87 69.2 356.9 5.16 3.32 0.81 25.42004 119 658 40.0 159.5 3.99 29.6 16.2 54.7 201.7 6.83 69.6 361.2 5.19 3.42 0.75 26.02005 116 638 41.3 162.8 4.04 28.7 15.9 55.5 198.1 6.90 69.0 360.9 5.23 3.37 0.82 25.82006 116 642 36.1 *172.2 *4.77 26.7 15.0 56.2 183.4 6.87 62.8 330.7 5.27 2.76 0.77 22.82007 116 644 40.1 166.0 4.14 29.3 16.7 57.3 203.7 6.96 69.4 369.6 5.33 3.42 0.91 26.62008 118 677 36.7 148.4 4.05 29.5 16.9 57.4 201.0 6.82 66.1 349.4 5.28 3.30 0.84 25.52009 118 642 36.6 141.4 3.86 29.5 17.0 57.6 198.6 6.73 66.1 340.0 5.14 3.01 0.88 23.62010 117 640 38.0 151.1 3.98 29.3 16.6 56.8 198.3 6.76 67.3 349.4 5.19 3.17 0.88 24.62011 121 666 38.3 154.5 4.02 29.9 17.3 58.0 207.2 6.94 68.2 361.7 5.27 2.94 *0.92 26.12012 122 660 38.6 161.2 4.18 30.8 *18.2 *59.1 212.0 6.90 69.3 373.2 5.38 3.37 0.88 26.12013 122 726 39.4 167.5 4.25 *31.1 18.1 58.2 *216.7 *6.98 70.5 *384.2 5.45 3.44 0.83 26.82014 121 737 39.3 169.3 4.31 30.7 17.8 57.8 214.7 *6.98 69.9 384.0 *5.48 *3.48 0.91 *26.92015 123 769 39.3 167.0 4.25 30.5 17.3 56.7 207.1 6.80 69.8 374.1 5.36 3.36 0.86 25.92016 124 790 38.3 161.4 4.22 *31.1 17.7 56.8 215.8 6.93 69.4 377.2 5.44 3.46 0.87 26.7
*Record.
ADDITIONAL FCS STATISTICS TRENDS(Average Per Game, One Team)
Punting Interceptions Punt Returns Kickoff ReturnsYear Punts Yds/P Net Avg. Int. Yds/Ret. Yds/G PR Yds/Ret. Yds/G KR Yds/Ret. Yds/G1978 *6.1 36.5 33.6 1.42 11.92 17.0 2.39 7.49 17.9 3.23 18.4 59.21979 6.0 36.5 33.4 1.44 11.39 16.4 2.41 7.46 18.0 3.06 18.4 56.21980 5.8 37.0 33.7 1.37 10.06 13.8 2.44 7.94 19.4 3.09 17.4 53.71981 5.9 37.2 33.9 *1.60 10.63 *17.0 2.50 7.77 19.4 3.27 18.4 60.11982 6.0 37.1 34.0 1.50 10.15 15.2 2.44 7.63 18.6 3.08 19.0 58.41983 6.0 37.3 34.1 1.52 9.99 15.1 2.59 7.58 19.6 3.06 18.6 56.91984 5.8 37.3 33.9 1.53 10.40 15.9 2.55 7.84 20.0 3.23 18.6 60.01985 5.7 37.6 34.2 1.51 10.56 16.0 2.55 7.52 19.2 3.20 18.1 57.91986 5.6 37.6 34.0 1.51 10.90 16.4 2.55 7.92 20.2 4.02 19.4 77.91987 5.6 36.8 33.4 1.40 10.57 14.9 2.48 7.51 18.7 3.96 19.0 74.61988 5.5 36.3 32.8 1.34 10.61 14.2 2.40 7.96 19.2 3.95 18.8 74.31989 5.5 36.1 32.8 1.31 10.40 13.7 2.32 7.93 18.4 3.96 18.9 74.71990 5.4 36.7 32.7 1.38 11.94 16.5 2.49 8.46 21.0 4.02 18.9 75.91991 5.3 36.6 32.6 1.35 10.81 14.6 2.46 8.57 21.1 3.84 19.1 73.41992 5.3 36.6 32.2 1.21 10.24 12.3 2.53 9.35 23.6 3.82 19.5 74.41993 5.2 36.0 32.3 1.23 10.79 13.2 2.35 8.26 19.5 3.72 19.3 71.71994 5.2 36.3 32.1 1.27 10.94 13.8 2.38 9.20 21.9 3.83 19.9 76.0

FCS Statistics Trends 88
Punting Interceptions Punt Returns Kickoff ReturnsYear Punts Yds/P Net Avg. Int. Yds/Ret. Yds/G PR Yds/Ret. Yds/G KR Yds/Ret. Yds/G1995 5.4 35.8 32.0 1.16 12.20 14.1 2.36 8.57 20.2 3.73 18.6 69.41996 5.5 36.6 32.8 1.22 12.25 15.0 2.44 8.54 20.9 3.60 19.0 68.41997 5.6 37.3 33.3 1.18 12.32 14.5 2.53 8.90 22.5 3.60 19.1 68.81998 5.3 37.6 33.3 1.12 12.33 13.8 2.54 8.98 22.8 3.90 19.5 75.91999 5.4 37.2 32.8 1.18 12.55 14.8 2.46 9.40 23.1 3.91 19.1 74.72000 5.3 36.5 32.2 1.19 12.25 14.6 2.49 9.20 22.9 3.94 19.3 76.02001 5.4 36.5 32.1 1.16 12.45 14.4 2.45 *9.82 24.0 3.96 19.2 75.92002 5.5 36.7 32.2 1.11 12.10 13.4 *2.63 9.38 *24.7 3.85 19.3 74.42003 5.3 37.1 32.8 1.12 13.33 14.9 2.53 9.20 23.3 3.86 19.9 76.82004 5.3 36.9 32.9 1.17 13.02 15.2 2.40 9.11 21.8 3.87 19.6 75.82005 5.1 37.2 33.1 1.07 12.34 13.2 2.20 9.57 21.0 3.77 19.3 72.62006 4.7 37.3 33.2 0.95 10.97 11.5 2.00 9.16 18.3 3.59 19.5 70.12007 5.0 38.1 32.7 1.05 13.20 13.7 2.05 9.24 18.9 *4.46 20.5 *91.52008 4.8 37.8 32.5 1.06 14.10 14.9 1.90 9.72 18.5 4.25 19.9 84.72009 5.6 37.6 33.2 1.05 13.99 14.7 1.81 8.57 15.5 4.15 20.2 83.82010 5.1 38.0 33.2 1.00 13.72 13.8 1.77 9.52 16.9 4.25 *20.6 87.42011 5.0 38.6 34.1 1.01 13.14 13.3 1.70 8.73 14.8 4.44 20.4 90.82012 5.1 *39.2 34.9 0.93 13.10 12.2 1.60 8.66 13.9 3.65 20.2 73.72013 5.3 39.1 *35.1 0.98 *14.36 14.0 1.70 8.40 14.3 3.72 20.3 75.62014 5.3 38.4 34.5 0.96 12.38 11.90 1.63 8.86 14.5 3.80 19.9 78.82015 5.4 38.8 34.7 0.93 12.18 11.35 1.57 9.16 14.4 3.65 20.5 74.72016 5.4 39.1 *35.1 0.95 11.97 11.42 1.59 8.76 14.0 3.67 20.2 74.0
*Record.

Classification History 89
CLASSIFICATION HISTORYSince 1978The following lists show years of active member-ship for current and former FCS football-playing institutions. The lists are from 1978, the year the Division I was divided into FBS and FCS.
Active Team Members (124)Team Year(s)Abilene Christian 2017-currentAlabama A&M 1999-currentAlabama St. 1982-currentAlbany (NY) 1999-currentAlcorn 1978-currentArk.-Pine Bluff 1998-currentAustin Peay 1978-currentBethune-Cookman 1980-currentBrown 1982-currentBryant 2012-currentBucknell 1978-currentButler 1993-currentUC Davis 2007-currentCal Poly 1994-currentCampbell 2008-currentCentral Ark. 2010-currentCentral Conn. St. 1993-currentCharleston So. 1993-currentChattanooga 1982-currentThe Citadel 1982-currentColgate 1982-currentColumbia 1982-currentCornell 1982-currentDartmouth 1982-currentDavidson 1978-90, 93-currentDayton 1993-currentDelaware 1980-currentDelaware St. 1978, 80-currentDrake 1992-85, 93-currentDuquesne 1993-currentEastern Ill. 1981-currentEastern Ky. 1978-currentEastern Wash. 1984-currentElon 1999-currentETSU 1982-2003, 15-currentFlorida A&M 1979-currentFordham 1989-currentFurman 1982-currentGardner-Webb 2002-currentGeorgetown 1993-currentGrambling 1978-currentHampton 1997-currentHarvard 1982-currentHoly Cross 1982-currentHouston Baptist 2013-currentHoward 1978, 80-currentIdaho St. 1978-currentIllinois St. 1982-currentIncarnate Word 2017-currentIndiana St. 1982-currentJackson St. 1978-currentJacksonville 1998-currentJacksonville St. 1997-currentJames Madison 1980-currentKennesaw St. 2015-current
Team Year(s)Lafayette 1978-currentLamar University 1982-89, 2010-currentLehigh 1978-currentLiberty 1989-currentMaine 1978-currentMarist 1993-currentMcNeese 1982-currentMercer 2013-currentMississippi Val. 1980-currentMissouri St. 1982-currentMonmouth 1994-currentMontana 1978-currentMontana St. 1978-currentMorehead St. 1978-currentMorgan St. 1986-currentMurray St. 1978-currentNew Hampshire 1978-currentNicholls St. 1980-currentNorfolk St. 1997-currentN.C. A&T 1978, 80-currentN.C. Central 2011-currentNorth Dakota 2012-currentNorth Dakota St. 2008-currentNorthern Ariz. 1978-currentNorthern Colo. 2007-currentUNI 1981-currentNorthwestern St. 1978-currentPenn 1982-currentPortland St. 1978-80, 98-currentPrairie View 1978-currentPresbyterian 2011-currentPrinceton 1982-currentRhode Island 1978-currentRichmond 1982-currentRobert Morris 1998-currentSacramento St. 1993-currentSacred Heart 1999-currentSaint Francis (PA) 1993-currentSam Houston St. 1986-currentSamford 1989-currentSan Diego 1993-currentSavannah St. 2002-currentSouth Carolina St. 1978, 80-currentSouth Dakota 2012-currentSouth Dakota St. 2008-currentSoutheast Mo. St. 1990-currentSoutheastern La. 1980-85; 2003-currentSouthern Ill. 1982-currentSouthern U. 1978-currentSouthern Utah 1993-currentSFA 1986-currentStetson 2013-currentStony Brook 1999-currentUT Martin 1992-currentTennessee St. 1981-currentTennessee Tech 1978-currentTexas Southern 1978-currentTowson 1987-currentValparaiso 1993-currentVillanova 1987-currentVMI 1982-currentWagner 1993-currentWeber St. 1978-currentWestern Caro. 1982-currentWestern Ill. 1981-current
Team Year(s)William & Mary 1982-currentWofford 1995-currentYale 1982-currentYoungstown St. 1981-current
Former MembersTeam Year(s)UAB 1993-95Appalachian St. 1982-2013Arkansas St. 1982-91Ball St. 1982Boise St. 1978-95Boston U. 1978-97Bowling Green 1982Buffalo 1993-98CSUN* 1993-2001Canisius* 1993-2002Charlotte 2013-14Coastal Caro. 2003-15Eastern Mich. 1982Evansville* 1993-97Fairfield* 1997-2002Fla. Atlantic 2001-04FIU 2003-05Ga. Southern 1984-2013Georgia St. 2010-12Hofstra* 1993-2009Idaho 1978-96Iona* 1993-2008Kent St. 1982La Salle* 1997-2007La.-Monroe 1982-93Louisiana Tech 1982-88Marshall 1982-96Massachusetts 1978-2011Middle Tenn. 1978-98Morris Brown* 2001-03Nevada 1978-91North Texas 1982-94Northeastern* 1978-2009Northern Ill. 1982Ohio U. 1982Old Dominion 2009-12St. John’s (NY)* 1993-2002St. Mary’s (CA)* 1993-2003Saint Peter’s* 1993-2006Siena* 1993-2003South Ala. 2010-11South Fla. 1997-2000UT Arlington* 1982-85Texas St. 1984-2010Troy 1993-2001UCF 1990-95UConn 1978-2001West Tex. A&M 1982-85Western Ky. 1978-2008*Dropped program.

Black College National Champions 90
BLACK COLLEGE NATIONAL CHAMPIONS
SBN SPORTS POLLSelected by the Pittsburgh Courier, 1920-80, and compiled by Collie Nicholson, former Grambling sports information director; William Nunn Jr., Pittsburgh Courier sports editor; and Eric “Ric” Roberts, Pittsburgh Courier sports writer and noted black college sports historian. Selected from 1981-1990 by the Sheridan Broadcasting Network and since 1991 by the American Urban Radio Networks. Records include postseason games.
Year Team Won Lost Tied Coach1920 Howard 7 0 0 Edward Morrison
Talladega 5 0 1 Jubie Bragg1921 Talladega 6 0 1 Jubie Bragg
Wiley 7 0 1 Jason Grant1922 Hampton 6 1 0 Gideon Smith1923 Virginia Union 6 0 1 Harold Martin1924 Tuskegee 9 0 1 Cleve Abbott
Wiley 8 0 1 Fred Long1925 Tuskegee 8 0 1 Cleve Abbott
Howard 6 0 2 Louis Watson1926 Tuskegee 10 0 0 Cleve Abbott
Howard 7 0 0 Louis Watson1927 Tuskegee 9 0 1 Cleve Abbott
Bluefield St. 8 0 1 Harry Jefferson1928 Bluefield St. 8 0 1 Harry Jefferson
Wiley 8 0 1 Fred Long1929 Tuskegee 10 0 0 Cleve Abbott1930 Tuskegee 11 0 1 Cleve Abbott1931 Wilberforce 9 0 0 Harry Graves1932 Wiley 9 0 0 Fred Long1933 Morgan St. 9 0 0 Edward Hurt1934 Kentucky St. 9 0 0 Henry Kean1935 Texas College 9 0 0 Arnett Mumford1936 West Virginia St. 8 0 0 Adolph Hamblin
Virginia St. 7 0 2 Harry Jefferson1937 Morgan St. 7 0 0 Edward Hurt1938 Florida A&M 8 0 0 Bill Bell1939 Langston 9 0 0 Felton “Zip” Gayles1940 Morris Brown 9 1 0 Artis Graves1941 Morris Brown 8 1 0 William Nicks1942 Florida A&M 9 0 0 Bill Bell1943 Morgan St. 5 0 0 Edward Hurt1944 Morgan St. 6 1 0 Edward Hurt1945 Wiley 10 0 0 Fred Long1946 Tennessee St. 10 1 0 Henry Kean
Morgan St. 8 0 0 Edward Hurt1947 Tennessee St. 10 0 0 Henry Kean
Shaw 10 0 0 Brutus Wilson1948 Southern U. 12 0 0 Arnett Mumford1949 Southern U. 10 0 1 Arnett Mumford
Morgan St. 8 0 0 Edward Hurt1950 Southern U. 10 0 1 Arnett Mumford
Florida A&M 8 1 1 Alonzo “Jake” Gaither1951 Morris Brown 10 1 0 Edward “Ox” Clemons1952 Florida A&M 8 2 0 Alonzo “Jake” Gaither
Texas Southern 10 0 1 Alexander DurleyLincoln (MO) 8 0 1 Dwight ReedVirginia St. 8 1 0 Sylvester “Sal” Hall
1953 Prairie View 12 0 0 William Nicks1954 Tennessee St. 10 1 0 Henry Kean
Southern U. 10 1 0 Arnett MumfordFlorida A&M 8 1 0 Alonzo “Jake” GaitherPrairie View 10 1 0 William Nicks
1955 Grambling 10 0 0 Eddie Robinson1956 Tennessee St. 10 0 0 Howard Gentry1957 Florida A&M 9 0 0 Alonzo “Jake” Gaither
Year Team Won Lost Tied Coach1958 Prairie View 10 0 1 William Nicks1959 Florida A&M 10 0 0 Alonzo “Jake” Gaither1960 Southern U. 9 1 0 Arnett Mumford1961 Florida A&M 10 0 0 Alonzo “Jake” Gaither1962 Jackson St. 10 1 0 John Merritt1963 Prairie View 10 1 0 William Nicks1964 Prairie View 9 0 0 William Nicks1965 Tennessee St. 9 0 1 John Merritt1966 Tennessee St. 10 0 0 John Merritt1967 Morgan St. 8 0 0 Earl Banks
Grambling 9 1 0 Eddie Robinson1968 Alcorn 9 1 0 Marino Casem
N.C. A&T 8 1 0 Hornsby Howell1969 Alcorn 8 0 1 Marino Casem1970 Tennessee St. 11 0 0 John Merritt1971 Tennessee St. 9 1 0 John Merritt1972 Grambling 11 2 0 Eddie Robinson1973 Tennessee St. 10 0 0 John Merritt1974 Grambling 11 1 0 Eddie Robinson
Alcorn 9 2 0 Marino Casem1975 Grambling 10 2 0 Eddie Robinson1976 South Carolina St. 10 1 0 Willie Jeffries1977 South Carolina St. 9 1 1 Willie Jeffries
Grambling 10 1 0 Eddie RobinsonFlorida A&M 11 0 0 Rudy Hubbard
1978 Florida A&M 12 1 0 Rudy Hubbard1979 Tennessee St. 8 3 0 John Merritt1980 Grambling 10 2 0 Eddie Robinson1981 South Carolina St. 10 3 0 Bill Davis1982 *Tennessee St. 9 0 1 John Merritt1983 Grambling 8 1 2 Eddie Robinson1984 Alcorn 9 1 0 Marino Casem1985 Jackson St. 8 3 0 W.C. Gorden1986 Central St. (OH) 10 1 1 Billy Joe1987 Central St. (OH) 10 1 1 Billy Joe1988 Central St. (OH) 11 2 0 Billy Joe1989 Central St. (OH) 10 2 0 Billy Joe1990 #Central St. (OH) 11 1 0 Billy Joe1991 Alabama St. 11 0 1 Houston Markham1992 Grambling 10 2 0 Eddie Robinson1993 Southern U. 11 1 0 Pete Richardson1994 Hampton 10 1 0 Joe Taylor1995 Southern U. 11 1 0 Pete Richardson1996 Jackson St. 10 2 0 James Carson1997 Southern U. 11 1 0 Pete Richardson1998 Florida A&M 11 2 0 Billy Joe1999 N.C. A&T 11 2 0 Bill Hayes2000 Tuskegee 12 0 0 Rick Comegy2001 Grambling 10 1 0 Doug Williams2002 Grambling 11 2 0 Doug Williams2003 Southern U. 12 1 0 Pete Richardson2004 Hampton 10 2 0 Joe Taylor2005 Grambling 11 1 0 Melvin Spears2006 N.C. Central 11 1 0 Rod Broadway2007 Tuskegee 12 0 0 Willie Slater2008 Grambling 11 2 0 Rod Broadway2009 South Carolina St. 10 2 0 Oliver “Buddy” Pough2010 Albany St. (GA) 11 1 0 James Mike White2011 Winston-Salem 13 1 0 Connell Maynor2012 Bethune-Cookman 9 3 0 Brian Jenkins2013 Tennessee St. 10 4 0 Rod Reed2014 Alcorn 10 3 0 Jay Hopson2015 N.C. A&T 10 2 0 Rod Broadway2016 Grambling 11 1 0 Broderick Fobbs*Tennessee State’s participation in the 1982 FCS championship (1-1 record)

Black College National Champions 91
voided. #NAIA Division I national champion.
AMERICAN SPORTS WIRESelected by American Sports Wire and compiled by Dick Simpson, executive director. Selected from 1990 by the American Sports Wire, P.O. Box 802031, Santa Clarita, California 91380-2031. Record includes postseason games.
Year Team Won Lost Tied Coach1990 N.C. A&T 9 2 0 Bill Hayes1991 Alabama St. 11 0 1 Houston Markham1992 Grambling 10 2 0 Eddie Robinson1993 Southern U. 11 1 0 Pete Richardson1994 Hampton 10 1 0 Joe Taylor1995 Southern U. 11 1 0 Pete Richardson1996 Jackson St. 10 2 0 James Carson1997 Southern U. 11 1 0 Pete Richardson1998 Florida A&M 11 2 0 Billy Joe1999 N.C. A&T 11 2 0 Bill Hayes2000 Grambling 10 2 0 Doug Williams2001 Grambling 10 1 0 Doug Williams2002 Grambling 11 2 0 Doug Williams2003 Southern U. 12 1 0 Pete Richardson2004 Hampton 10 2 0 Joe Taylor2005 Hampton 11 1 0 Joe Taylor2006 Hampton 10 2 0 Joe Taylor2007 Delaware St. 10 2 0 Al Lavan 2008 Grambling 11 2 0 Rod Broadway2009 Prairie View 9 1 0 Henry Frazier III2010 Bethune-Cookman 10 2 0 Brian Jenkins2011 Norfolk St. 9 3 0 Pete Adrian2012 Ark.-Pine Bluff 10 2 0 Monte Coleman2013 Tennessee St. 10 4 0 Rod Reed
ALL-TIME BLACK COLLEGE FOOTBALL TEAM
(Selected by the Sheridan Broadcasting Network in 1993)
Offense QB Doug Williams GramblingRB Walter Payton Jackson St.RB Tank Younger GramblingWR Jerry Rice Mississippi Val.WR John Stallworth Alabama A&MWR Charlie Joiner GramblingOL Art Shell UMESOL Rayfield Wright Fort Valley St.OL Jackie Slater Jackson St.OL Larry Little Bethune-CookmanOL Ernie Barnes N.C. Central
Defense DL Willie Davis GramblingDL Ed ”Too Tall“ Jones Tennessee St.DL Deacon Jones South Carolina St.DL L.C. Greenwood Ark.-Pine BluffLB Robert Brazile Jackson St.LB Harry Carson South Carolina St.LB Willie Lanier Morgan St.DB Mel Blount Southern U.DB Lem Barney Jackson St.DB Donnie Shell South Carolina St.DB Everson Walls Grambling
HERITAGE BOWLThe first bowl game matching historically black schools in FCS. The cham-pion of the Southwestern Athletic Conference met the champion of the Mid-Eastern Athletic Conference.
Date Score (Attendance) Site12-21-91 Alabama St. 36, N.C. A&T 13 (7,724) Miami
1-2-93 Grambling 45, Florida A&M 15 (11,273) Tallahassee, Fla.1-1-94 Southern U. 11, South Carolina St. 0 (36,128) Atlanta
12-30-94 South Carolina St. 31, Grambling 27 (22,179) Atlanta12-29-95 Southern U. 30, Florida A&M 25 (25,164) Atlanta12-31-96 Howard 27, Southern U. 24 (18,126) Atlanta12-27-97 Southern U. 34, South Carolina St. 28 (32,629) Atlanta12-26-98 Southern U. 28, Bethune-Cookman 2 (32, 955) Atlanta12-18-99 Hampton 24, Southern U. 3 (29,561) Atlanta
CELEBRATION BOWLThe Celebration Bowl was created in 2015 to again match the champions of the Southwestern Athletic Conference and the Mid-Eastern Athletic Conference. The game is scheduled to be played in Atlanta in mid-December of each year.
Date Score (Attendance) Site12-19-15 N.C. A&T 41, Alcorn 34 (35,528) Atlanta12-17-16 Grambling 10, N.C. Central 9 (31,096) Atlanta