Chinese Agricultural Aid in Tanzania: Reproduction of Chinese Agricultural R egime

Food Waste Research in China: Motivation, Field Study and Preliminary Results
Shengkui Cheng
Institute of Geographical Sciences and Natural Resources Research (IGSNRR),
Chinese Academy of Sciences (CAS), Beijing, China
August 17 , 2015, Birmingham, UK
Food Safety and Regulatory Measures,August 17-19

Food Waste: A Worldwide Issue
FAO: Globally, 1.3bt food(1/3 of
total food produced)wasted per
year,in which 0.67bt by developed
countries and 0.63bt by developing
one.
Huge cost of resources and
environment: 1.4bha farmland(23%-
30%of the total) , 23%fertilizer
wasted, and 3.3bt GHG.
Direct economic lose per year
750bm dollar.
Motivation and Background

A remarkable success in the past decades…
40%
50%
60%
70%
80%
90%
100%
110%
0
100
200
300
400
500
600
1949 1959 1969 1979 1989 1999 2009
Mt
Domestic production
Import
Export
Self-sufficiency rate (%)
% of soybean in total import
Self
-su
ffic
ien
cy r
ate
2004-2013 nine consecutive
years growth
However, costs (econ. and environ.) of production growth are rising. → Food loss and food
waste throughout the supply chain must be taken into account (Liu et.al 2013 Nature)…

Food demand increasingly,but the production
inputs reaching the limit, food increase very hard
Food waste reduction: an important way for
China’s food security
source: china statistic data and FAO
0
1
2
3
4
5
6
7
8
9
10
0
1
2
3
4
5
6
7
1961 1967 1973 1979 1985 1991 1997 2003 2009 2015 2021
化肥用量千万吨
粮食总产亿吨粮食播种面积(亿公顷)
粮食总产亿吨
50
100
150
200
250
300
粮食总产
亿吨
粮食总产
亿吨
农膜用量
/农药用量
(万吨
)
灌溉面积
农膜用量
农药用量
粮食面积
肥用量
粮食产量
粮食需求In 2010:
Sown area of grain crops:
110mha.
Total grain output:550mt
fertilizer:55.6mt
Irrigation water:370.7bm3
Agr -electric:96.6bkw
Ari-plastic:1.40mt
pesticide:1.25mt
农业机械总动力:9.3亿千瓦
Motivation and Background
demand

Huge lose and waste of grain in whole supply chain
12.5mt 20mt
7.5mt
7.5mt 20mt
From field to table:
grain losed and
wasted 67.5mt,11% of total grain
output, 12.55mha
farmland wasted
Data source state administration of grain in 2014
Motivation and Background

Quantity of wasted food in catering in the provincial capital cities (left)
and the food wasted per capita (right
注 省会城市餐饮业食物浪费数量根据新闻报道整理 人均食物浪费数量=省会城市餐饮业食物浪费数量/
省会城市人口 北京、西藏等旅游城市加入旅游人口 Cheng,2012
Food waste: very popular in city catering
Motivation and Background

Food waste: huge resources and inputs wasted and severe environmental pressure besides the food security
Food
waste
(Jun Tai et al., 2011)
食物残余物是MSW的主要组成成分
地区 食物残余物%其他
%
京 66.2 33.8
上海 71.1 28.9
广州 52.0 48.0
深圳 51.1 48.9
杭州 53.0 47.0
南京 70.6 29.4
厦门 74.6 25.4
桂林 61.3 38.7
城市固体垃圾 MSW
Food waste dwindling: Save huge resources and huge environmental benefit.
Motivation and Background
Food surplus%

Population increase,
urbanization ,Industrialization
返回
Har
v
tra
np
pro
c
sto
re water/land
Energy, variety
Fertilizer….
Rural reform
policy
pro
du
ctio
n
??
Co
nsu
mp
tion

Food waste in China: special characteristics
• Food culture: long history, diverse cuisines, local resources
• Save food & save face: a cultural conflict
• Official/Business and private (birthday or wedding) banquet
with more waste
• Food waste at consumption stage appears more serious
• Food byproducts efficiently used (e.g., bones, blood, heads,
internal organs…)
Boiled Tripe
Sliced Beef and Ox Tongue
LuZhu
Braised Intestines in Brown Sauce

How much do we waste? Data, data, data!
v.s. ca. 500
kg/cap prod
in 2012
Little information for developing countries (incl.
China), many data out of date;
FAO report: China aggregated with Japan and
South Korea in “Industrialized Asia”; Dramatic lifestyle changes in a fast urbanizing and
industrializing China…
→ we need more primary data collection!
Source:FAO
“Food waste in urban China: Patterns, environmental impacts, and sustainable consumption”, 2013-2017
Funded by Natural Sciences Foundation
Chinese Academy of Sciences (CAS)
Institute of Geographical Sciences and Natural Resources Research (IGSNRR)
Center for Chinese Agricultural Policy (CCAP)
Chinese Academy of Agricultural Sciences (CAAS)
Agricultural Information Institute (AII)
Focusing on away-from-home food waste in urban China, including:
Large-scale surveys (10,000 tables) in Lhasa and Beijing (IGSNRR, AII, CCAP)
Patterns, impact factors, and policy implication (IGSNRR; CCAP)
Resource and environmental impacts (IGSNRR)
The first national level key project

Large Scale Survey for China…
Field surveys and interviews for consumer stage (in 2013):
o 187 restaurants had been investigated,large, middle,
small, canteen and fast food
o 3833 samples(table) had been collected
o Each sample includes two parts: consumer
questionnaire, weight of food waste generated.

Team capacity building activities of volunteers
Survey- Step 1 : Volunteers Training
including: survey process, questionnaire,
wordload, etc.
The training in Beijing

Survey- Step 2 : Manager and head chef interview

Survey- Step 3 :
Customer interview and weighing of table food waste

About 80 gram per capita per meal food waste (raw food
equivalent), vegetables—cereals---meat. Wasted rate 23.5% of
the ordered food including soup and oil…)
Food waste in the urban catering sector in Beijing, by food category (left)
and absolute and relative amount per capita (right)
Vegetables
41.32%
Cereals
24.80%
Pork, beef
and mutton
13.13%
Poultry
6.71%
Aquatic
Product
11.13% Beans
1.27%
Eggs
1.60%
Dairy
products
0.04%
Others
2.91%
Results: in Beijing’s urban catering sector
0%
5%
10%
15%
20%
25%
0
100
200
300
400
500
600
700
800
900g
Source: Cheng Shengkui, et al., unpublished
0%
5%
10%
15%
20%
25%
30%
35%
40%
0100200300400500600700800900
1000
g
Beijing Lhasa
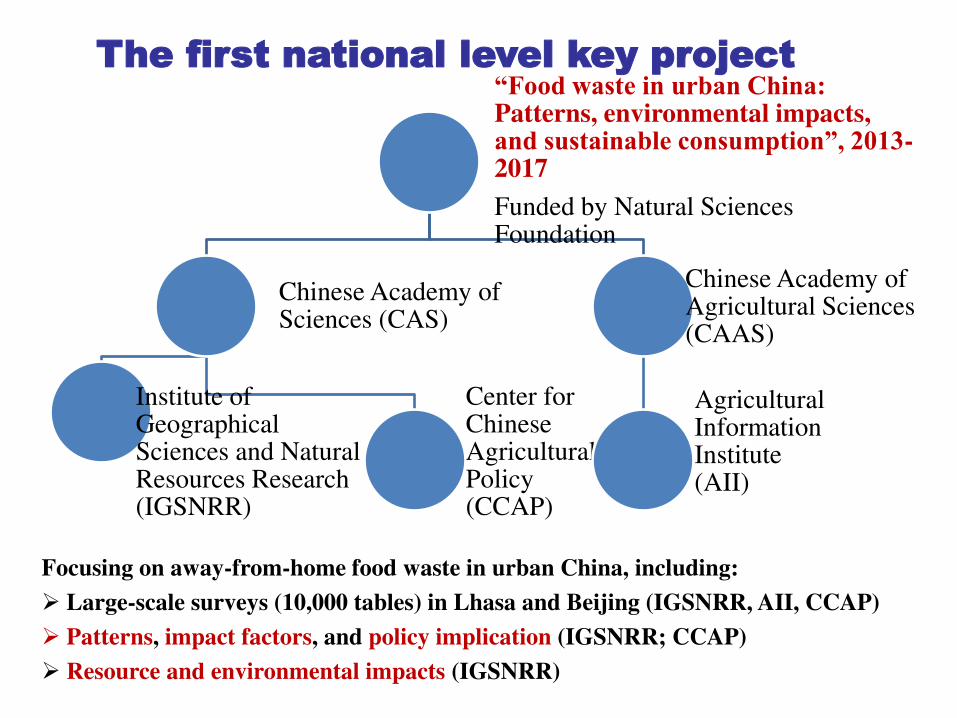
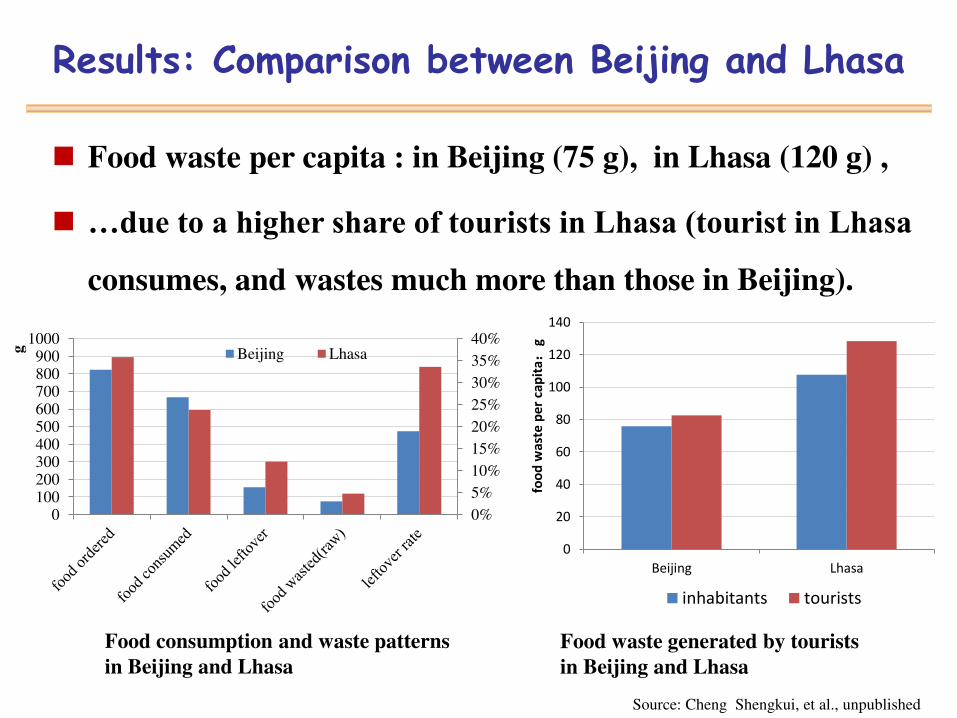
Food waste per capita : in Beijing (75 g), in Lhasa (120 g) ,
…due to a higher share of tourists in Lhasa (tourist in Lhasa
consumes, and wastes much more than those in Beijing).
Food consumption and waste patterns
in Beijing and Lhasa
Food waste generated by tourists
in Beijing and Lhasa
Results: Comparison between Beijing and Lhasa
Source: Cheng Shengkui, et al., unpublished
0
20
40
60
80
100
120
140
Beijing Lhasa
foo
d w
ast
e p
er
cap
ita
g
inhabitants tourists

Around 131.5g/cap/meal food is wasted, nearly occupied 23%
of total food supply: staple food (45%), vegetables(30%),
meat(15%), others (10%)
Results: Estimation of food waste at schools: A case study in Beijing
Scaled up to the whole Beijing
city: 98.6 tons of food was wasted
for each meal, cost¥1.97 million.

No considering tourism consumption: about 12 million tons/year
Considering tourism consumption: about 14 million tons/year.
Taking use of the data--the kitchen waste production of
provincial capital city (media reported): about 25-30 million
tons/year
Now the popular saying :
The food wasted in catering can feed 2 billion people _ a little
exaggerated, feeding 30-50 million people more reliable
Total food waste in urban catering sector in China

Results: Ecological Footprint (in Beijing)
Total catering EF of food waste is 294.5×10³ hm2,nearly one
fifth that of Beijing’s territory area, the largest contribution from meat (80%) and grain (7%)
0.30%
1.39%
2.08% 3.82% 7.12%
54.65%
13.02%
10.39%
5.79%
1.45%
17.63%
nuts&fruits
eggs&dairy
vegetables
bean&bean products
grain
mutton
beef
pork
poultry
other meat

Carbon emission along the different stages of the food value chain
Results: Carbon Footprint (in Beijing) Food production causes greenhouse gas emissions along the
entire food supply chain and wasting food means that those
emissions are produced in vain.

Total catering carbon footprint of food waste is 2.1×10⁶t CO2eq., with meat (49%), vegetables (25%), and grain
(11%) contributing the most.
48.98%
25.09%
11.30%
7.69%
5.01% 1.93%
Meat
Vegetables
Grain
Aquatic products
Bean& bean
products
Results: Carbon footprint – by food type

Agricultural production 50%
Catering consumption 40%
Treatment of leftover 14%
47.64%
37.39%
13.68%
1.05%
0.24%
1.29%
Agricultural production
Consumption
Management
Distribution
Processing
Results: Carbon Footprint-By chains (in Beijing)
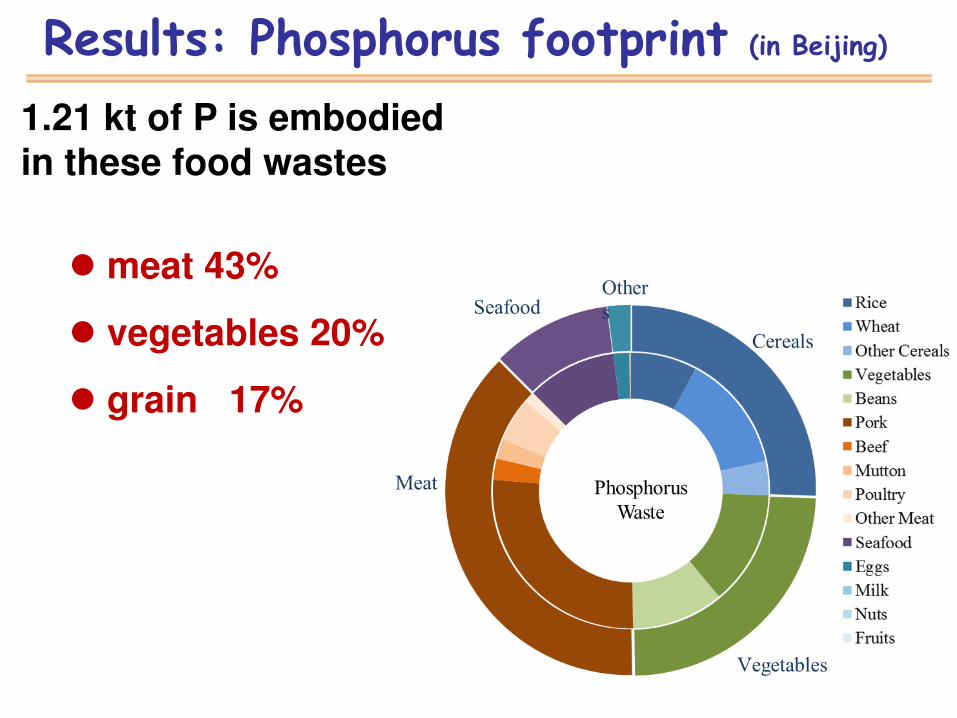
Results: Phosphorus footprint (in Beijing)
1.21 kt of P is embodied
in these food wastes
meat 43%
vegetables 20%
grain 17%

The next work
• In 2015: Beijing, Lhasa, Shanghai, and Chengdu.
• Database construction
• Methodology collaboration with University of Southern
Denmark
• New projects funded EU Horizion 2020: 2015-2019, with 29
European partners (potential matching funding sought from
Chinese Academy of Sciences)
… and welcome more collaboration from YOU!

Food loss and waste throughout the supply chain
Food waste differences from different level cities,
from different areas, from urban and rural, from
catering restaurant and household
First-hand data and quantitative research
supporting policy-making and arousing public
saving awareness.
Take-home messages

Thank you For your attention!