Food Security and the Formation of Agricultural Grain ...
45
Food Reserves Working Paper #2 March 2019 Food Security and the Formation of Agricultural Grain Stocks in Brazil Walter Belik Altivo R. A. de Almeida Cunha Study funded by the European Commission, Directorate-General for Development and Cooperation, Unit C1
Transcript of Food Security and the Formation of Agricultural Grain ...

Food Reserves
Working Paper #2
March 2019
Food Security and the Formation of
Agricultural Grain Stocks in Brazil
Walter Belik
Altivo R. A. de Almeida Cunha
Study funded by the European Commission,
Directorate-General for Development and Cooperation, Unit C1

DAI Europe Ltd. 3rd Floor Block C Tel: +44 (0) 1442 202 400
Westside, Fax: +44 (0) 207 420 8601
London Road, www.dai-europe.com
Apsley
HP3 9TD
United Kingdom

About this working paper
This working paper is one of the products of a study conducted by DAI at the request of the European Commission as part of the advisory
service ASiST managed by the unit in charge of rural development, food security and nutrition (C1) within the Directorate General for
International Cooperation and Development (DEVCO).
The study has aimed at clarifying the potential role of food reserves in enhancing food and nutrition security in developing countries, and
at making recommendations on how to use food reserves (in complement to other tools), taking into account the specificities on the
context and the constraints of World Trade Organization (WTO) disciplines.
The study was conducted based on i) an extensive review of the existing literature (both theoretical and empirical) and ii) 10 case studies
analysing national or regional experiences in Africa, Asia and South America.
All the products of the study (including other working papers, a compilation of case study summaries, and a synthesis report) are available
at: https://europa.eu/capacity4dev/hunger-foodsecurity-nutrition/discussions/how-can-food-reserves-best-enhance-food-and-nutrition-
security-developing-countries.
Acknowledgements
Franck Galtier (CIRAD) coordinated the overall study. This working paper was written by Walter Belik (Institute of Economics, Unicamp,
Brazil and Altivo R. A. de Almeida Cunha (consultant, FAO). It benefited from the review of Franck Galtier, Ralph Cummings (consultant, ex
IFPRI), Kalanidhi Subbarao (consultant, ex World Bank), and Steve Wiggins (Overseas Development Institute).
Disclaimer
The authors accept sole responsibility for this report. The contents of this publication do not necessarily reflect the official position or
opinion of the European Commission. Neither the European Commission nor any person acting on behalf of the Commission is responsible
for the use that might be made of the following information.
iv
Table of Contents
Contents List of Abbreviations and Acronyms ...................................................................................................... vi
Background: Institutional Evolution of Brazilian Agricultural Policies ............................................ 1
General characteristics of the Brazilian agricultural performance ................................................. 3
Family Farming and the Build-up of Food Public Stocks ................................................................. 7
Performance of the Agricultural Policy in Brazil and the Build-up of Stocks ................................ 12
Recent trends in grain stock build-up in Brazil ............................................................................. 15
Food prices to consumers in the last decade ............................................................................... 25
Food Consumption Indicators ....................................................................................................... 29
Conditional Cash Transfer Policy – “Bolsa Família” as food access policy .................................... 31
Conclusions ................................................................................................................................... 35
References ............................................................................................................................................ 38
List of Figures
Figure 1 Evolution of Brazilian grain production, 1976-2016 in tonnes 4
Figure 2 Evolution of grain production and land cultivated index in Brazil, 1976/77(=100) to
2014/15 5
Figure 3 Land cultivated (million ha) by major regions, Brazil 1976/77 to 2014/15 6
Figure 4 Grain yields (kg/ha) of main crops, Brazil 1976/77 to 2014/15 6
Figure 5 Allocated Resources in the Food Acquisition Programme (PAA), 2003-2015 (U$) 9
Figure 6 Purchased products (million tonnes) per year by PAA, 2003 to 2015 9
Figure 7 Number of producers participating in PAA, 2003 to 2015 10
Figure 8 FNDE Resource Transfer used for Direct Purchase by Municipalities in 2014 11
Figure 9 Brazil’s public stock of corn by modality 2001-2015 17
Figure 10 Public stocks of corn (tonnes) modalities “AGF” (Federal Government Acquirement),
“Option” and “PRONAF”, 2001-2015 18
Figure 11 Brazil’s public stock of rice by modality 2001-2015 19
Figure 12 Public stocks of rice (tonnes) modalities “AGF” (Federal Government Acquirement),
“Option” and “PRONAF”, 2001-2015 20
Figure 13 Brazil’s public stock of beans by modality 2001-2015 21
Figure 14 Public stocks of beans (tonne) modalities “AGF” (Federal Government Acquirement),
and “PRONAF”, 2001-2015 22
Figure 15 Brazil’s public stock of wheat by modality 2001-2015 23
Figure 16 Public stocks of wheat (tonne) modalities “AGF” (Federal Government Acquirement),
“Option”, and “PRONAF”, 2001-2015 24

v
Figure 17 Evolution of general index prices and food and beverage index prices. Brazil, 2001-2006
25
Figure 18 Evolution of general index prices and food and beverage index prices. Brazil, 2007-2015
26
Figure 19 Average fertiliser prices in Brazil, 1970-2015 27
Figure 20 Cost (R$/1,000 Kcal) of selected food groups. Brazil, 2008/2009 30
Figure 21 Distribution of average family spend on food, by total income class, Brazil 2008/2009 31
Figure 22 Evolution of the Minimum Wage in real values 1996-2016, Brazil (base= Jan. 1976) 32
Figure 23 Bolsa Família beneficiaries and total amount of transfers 33
Figure 24 Basic official food basket purchased with minimum wage in Brazil, 1996-2015 34
Figure 25 Gini Index of real income of all work undertaken by employed citizens who are at least
10 years old 35
List of Tables
Table 1 Food Acquisition Programme (PAA): Modalities and Characteristics (2013) 8
Table 2 Brazilian Agricultural trade 2001-2015 (tonnes) 15
Table 3 Position of AGF public stocks of main crops (million tonnes) 2003/04 to 2011/12 16
Table 4 Exchange Ratio for the purchase of 1 tonne of fertiliser in Brazil, 2000-2015 28
Table 5 Food Supply (kg/capita/year), Brazil 30

vi
List of Abbreviations and Acronyms
AGF Acquisitions of the Federal Government CDDS Direct Purchase with Simultaneous Donation CIBRAZEN Cia. Brasileira de Armazenamento CONAB National Company of Food Supply EGF Federal Government Loans FOB Free on Board FNDE National Fund for Educational Development PAA Food Acquisition Programme PEP Premium for Product Outflow PGPM Minimum Price Guarantee Policy PLE Stock Release Price instrument PNAE National School Feeding Programme PPAIS Paulista Programme of Social Interest Agriculture PRONAF National Programme to strength the Family Farms MERCOSUR Southern Common Market UNDP United Nations Development Programme

1
Background: Institutional Evolution of Brazilian Agricultural Policies
Brazil has a long tradition of agricultural policies. Brazil has utilised public procurement programmes
and maintained buffer stocks since the Convention of Taubaté (1906), by which the state held coffee
purchases from large landowners to regulate international prices. In the “Estado Novo” period (1937-
1945) various public institutions were created, whose aim was to promote and regulate the sugar,
mate and pine markets. These policies were intended to foster regional elites with price stabilization
programmes. In 1943, President Getúlio Vargas’ government created a production financing company,
the Cia. de Financiamento da Produção, with the aim of building regulatory stocks of grains and other
products, complemented by the creation of a storage company, the Cia. Brasileira de Armazenamento
(CIBRAZEN) in 1962 in order to build and manage public warehouses for food and ensure price
stability.
From the mid-twentieth century, Brazil has created support mechanisms for the production,
marketing of agricultural stocks heavily influenced by the US model of the Commodity Credit
Corporation. These policies are still in force, aiming to regulate domestic prices by placing public stocks
purchased through a system of minimum prices. The most common marketing instruments are direct
purchases from the federal government (AGF) and public loans to finance private stocks, with a
purchase option by the federal government (EGF).
The key element in this policy is the annual establishment of minimum purchase prices for agricultural
products by the Government. These prices serve as a reference for the purchase of produce which is
below the established limits, and for the release of produce through sale when prices are high.
Essentially, its goals are anti-cyclical policies to reduce large price swings in times of harvest and
between harvests.
In the 1980s and 1990s, this policy served as a strong incentive for opening domestic agricultural
frontiers by establishing minimum Free on Board (FoB) prices, which became profitable for producers
from more distant areas and without adequate outflow infrastructure.
Economically liberalising, the Brazilian government in the 1990s established clear policy rules for
intervention in regulating stocks, while exchanges rate appreciated and import barriers were reduced.
To avoid arbitrary decisions regarding the placement of public stocks in the market, in 1991 the
government created the Stock Release Price instrument (PLE) which becomes effective with the
Minimum Price as a ceiling and a floor for authorities’ action, establishing a system of "passive
intervention" (Delgado, 2005: 2) with very low pressure on market prices. The government also sought
to encourage private action in the management of public stocks through an increasing emphasis on
market price guarantees, without the need to purchase stocks.
From the 1990s, a series of financial innovations led Brazilian agricultural policy to adopt hedge
mechanisms and futures markets for price stabilization through instruments seeking to stimulate the
build-up of private stocks and commodity exchanges.

2
The main budgetary instrument for stock build-up is the Option Market. This instrument allows the
Federal Government to selectively acquire products, choosing the region and the type of product they
want to buy from farmers and cooperatives that are registered producers in accredited Commodity
Exchanges.
In selling mode, the beneficiary has the right - but not the obligation - to sell their product to the
Government at a future date, at a previously fixed price. The Put Option Agreement is released when
the market price is below the minimum price and the government is interested in signalling the future
price for the market, guaranteeing income to producers and stimulating production to meet domestic
consumption. Access to the contract is through auctions, where all accredited Commodity Exchanges
(of cereals, goods and/or futures) are simultaneously connected.
These policies aim to regulate domestic prices by placing public stocks purchased through the
minimum price system. Since its inception, there has not been any restriction on the participation of
small producers (latterly including family farmers) in the build-up of stocks.
Box 1 shows the dynamics of the main types of stock buildup policy instruments in Brazil.
Box 1 Brazil: Key Instruments of the Stock Build-up Policy
Minimum prices: fixed by Decree annually for each crop and implemented through instruments designed to operationalise the PGPM. The government action starts when the market price is below the minimum in production regions. On the other hand, every product purchased by the government should return to the market in due course and with the purchase prices consistent with the normal market. Products covered by the policy are: cotton, rice, beans, corn, soybean, cassava, milk, coffee, winter cereals (oats, canola, barley, wheat, triticale), garlic, peanuts, rubber, carnauba, Brazil nuts, cashews, sunflower, silk cocoon, guaraná, jute-mauve, castor beans, sisal and sorghum. Acquisitions of the Federal Government (AGF): allows the government to guarantee a minimum price to farmers, family farmers and / or their cooperative, through direct acquisition, i.e., the direct purchase and payment in cash, of product as part of the agenda of PGPM. This operation is performed when the market price is below the minimum price set for the current crop, subject to the transfer, by the National Treasury, of the resources for the operationalisation of the acquisition. Put Option Agreement: created with the liberalisation of the Brazilian economy, enables the Federal Government to acquire products selectively, i.e., choosing the region and the type of product they want to buy, benefiting farmers and cooperatives of registered producers in an accredited Stock Exchange, and who are not in default with the Company. It covers all products defined by the PGPM, and contracts are issued by decision of the government authorities, depending on the market conditions of each product. It aims to protect the producer / cooperative against the risks of falling prices, since the contract is (preferably) released within the period of harvest and maturity is in its off season. It also aims to improve the implementation of official policies of support and regulation of agricultural prices in the domestic market, becoming an alternative instrument to PGPM, at harvest time. Occurring in selling mode, it gives the beneficiary the right - but not the obligation - to sell their product to the Government at a future date, at a previously fixed price. The Put Option Agreement is released when the market price is below the minimum price and the government is interested in signalling the future price for the market, guaranteeing income to producers and stimulating production to meet domestic consumption. Access to the contract is through auctions, where all accredited Stock Exchanges (of cereal, goods and / or futures) are simultaneously connected. Premium for Product Outflow (PEP): enables the government to guarantee a minimum price to the producer or cooperative without the need to purchase the product. It consists of a specifically defined grant to the market

3
sector. Advanced warning is issued by the Federal Government of the public auction for the purchase of products at a guaranteed reference value. This reference value is later used by the bidder which undertakes to promote the outflow for consumption regions previously established, according to the conditions laid down in Regulation and specific Warnings. Through the auctions the payment of the difference between the minimum price and the market price is done, decomposed from the import parity price to the federal unit of production. This instrument can be used to supplement the supply of deficit areas from private stocks. Risk Premium for Agricultural Product Purchase coming from Put Option Private Agreement: an economic subsidy granted at public auction to the consumer segment (traders or processing industries, for example) that is willing to acquire a certain product at a later date, directly from producers and / or their cooperatives, at the fixed price established by the government, by means of the launch, in private auction, of a Put Option Agreement. It works similarly to the Put Option Agreement and to the PEP; however, the agreements are launched by the private sector. Equalizer Premium Paid to Producer (PEPRO): an economic subsidy granted to farmers and / or their cooperative that is willing to sell their product for the difference between the Reference Value set by the Federal Government and the value of the equalizer premium auctioned. Similar to PEP, it ensures the producer a price level, which can either be the minimum or another set (reference) price - the main difference is that the premium is paid directly to the farmers. This instrument, launched when the market price is below the Minimum Price, is operationalized through the accredited Stock Exchanges. As with PEP, it exempts the government from purchasing the product, allowing the outflow to the consuming regions to complement supply. Counter Sales: implemented in 1991 to support and stimulate small rural production, especially of domestic livestock, aims to ensure in a continuous and systematic way, the regular supply of raw materials, through the provision of official stocks at market prices compatible with those obtained in public auctions. Source: CONAB
General characteristics of the Brazilian agricultural performance
A successful agricultural research agenda focussing on adapted varieties and management of
savannah (cerrado), and institutional mechanisms to support agriculture through agricultural policies,
have contributed to the growth of Brazilian agricultural production. Although they have been selective
in terms of beneficiaries, they succeeded in structuring an agricultural model of large-scale export-
oriented grain production. From the early phase of modernisation of Brazilian agriculture (1960) until
the late 1970s agricultural production, production of grains (cereals and oilseeds) was practically
stationary at 50 million tonnes. At the end of 1990s, due to the stabilisation of the economy after
hyperinflation and trade liberalization, this production quickly reached 100 million tonnes. After 10
years, production again doubled to 200 million tonnes.
The most important factor associated with the growth of Brazilian agricultural production is
undoubtedly the stimulus given by the foreign market. In view of the “primarisation” movement
observed throughout the Brazilian economy, agriculture was no different. From the 2000s, most of
the grain production has been directed to the foreign market without processing. Many causes can be
associated with this phenomenon, for example, the Brazilian tax structure, the Trading Companies
strategy and even the obsolescence of national park processors, but the result has led to an
increasingly important part of grain production exported in natura moments after harvesting.
The “primarisation” movement changed the flow and production logistics. Its displaced flow paths
(roads and railways) and warehouses used by the processing industry, and redirected this once
4
important part of production (depending on the crop and market conditions) directly to the ports,
which started to obey a new geography dictated by external markets.
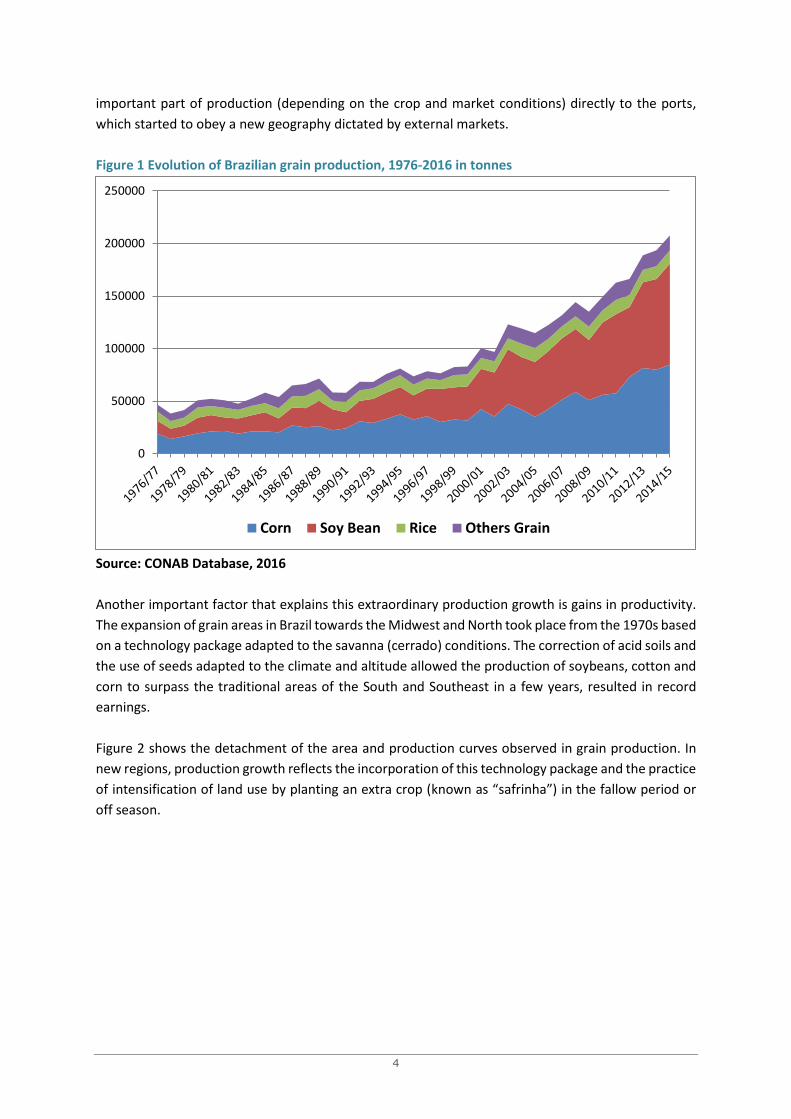
Figure 1 Evolution of Brazilian grain production, 1976-2016 in tonnes
Source: CONAB Database, 2016
Another important factor that explains this extraordinary production growth is gains in productivity.
The expansion of grain areas in Brazil towards the Midwest and North took place from the 1970s based
on a technology package adapted to the savanna (cerrado) conditions. The correction of acid soils and
the use of seeds adapted to the climate and altitude allowed the production of soybeans, cotton and
corn to surpass the traditional areas of the South and Southeast in a few years, resulted in record
earnings.
Figure 2 shows the detachment of the area and production curves observed in grain production. In
new regions, production growth reflects the incorporation of this technology package and the practice
of intensification of land use by planting an extra crop (known as “safrinha”) in the fallow period or
off season.
0
50000
100000
150000
200000
250000
Corn Soy Bean Rice Others Grain

5
Figure 2 Evolution of grain production and land cultivated index in Brazil, 1976/77(=100) to 2014/15
Source: CONAB Database. 2016
The growth of the cultivated area in the Midwest is the main explanatory factor for the huge expansion
in the use of land for agricultural activities in the last 40 years. This region made use of 4 million ha in
the late 1970s, reaching 23 million ha in the last two years. Currently, the Midwest is the main
productive pole of agriculture in Brazil, accounting for 40% of the cultivated area, which implies a
renewed discussion on the logistics and storage of this production for subsequent export or domestic
consumption. The growth of cultivated areas in the north was also explosive, experiencing an eightfold
increase in this period, but as it is a smaller footprint, the result cannot be considered as extraordinary.
The Southeast, however, lost acreage, mainly in S. Paulo due to the expansion of urban areas and the
crisis experienced by some strategic products for the state, such as sugarcane and citrus (see Figure
3).

6
Figure 3 Land cultivated (million ha) by major regions, Brazil 1976/77 to 2014/15
Source: CONAB Database. 2016
Figure 4 shows the productivity evolution of different grain crops in Brazil. This figure highlights what
the Brazilian average productivity figures cannot detect: bean and soybean productivity has nearly
doubled while rice, corn and wheat experienced threefold growth in a period of 40 years.
Figure 4 Grain yields (kg/ha) of main crops, Brazil 1976/77 to 2014/15
Source: CONAB Database. 2016

7
The grain storage system in Brazil still suffers from some distortions due to low private sector
investment and low public capacity for action. According to a recent survey by CONAB, the
government agency responsible for developing food supply policies, there were 17,538 storage units
with static capacity of 145 million tonnes (83% in silos for bulk storage) in Brazil in 2012. There was an
increase of more than 67% of static storage capacity between 2007 and 2012, but still, agricultural
production increased at a higher rate than the storage capacity.
The ratio between agricultural production and static capacity generates the rotation rate of these
stocks, which in Brazil is still low. It is estimated that a 1.5 rotation rate could be comfortably
administered. Maia et al. (2013) show that in 2012 (the last year to be researched) the index was at
1.17, reaching its worst mark in 2003 at 1.35. They found that the biggest storage problem is not the
static capacity, but the concentration of the same in the first semester (harvest period of major
summer crops) and its geographic distribution in relation to need. The government, directly or through
its companies, holds only 5% of static capacity, while 73% is in the hands of private agents and 22%
with cooperatives. Considering the government's performance and that of agents that have contracts
with the government, it is estimated that 42% of the static capacity is occupied by public use.
Unlike other countries with large agricultural production, only 13% of the static capacity was in farms
in 2011, while 35% was in rural areas, 45% in urban areas and 6% in port areas. Regarding geographical
distribution, static capacity is low and risky in the new agricultural border area and high in the southern
states of Brazil and São Paulo. Grain production has grown dramatically in the region known as
MAPITOBA, a polygon formed by the borders of the states of Maranhão, Piauí, Tocantins and Western
Bahia. In this region the soil and weather conditions are exceptional and the land, after correction,
has high yields.
The warehouses located in the new regions are basically modern grain silos whose operating costs are
lower. However, in general, it is estimated that storage costs are not high in Brazil. Overall storage
costs in 2013, including administrative costs, were approximately 5% of the price of soybeans and corn
(see calculations of Maia et al, 2013).
Family Farming and the Build-up of Food Public Stocks
One of the most notable innovations in public policy for food security in Brazil, is the use of
government food purchases as active stimuli for local production through defined regions of
production and food distribution. In particular, this policy created credit lines for stock build-up aimed
at family farming through the Food Acquisition Programme (PAA). “Family farmers” are legally defined
based on property parameters and agricultural work.
The PAA, implemented in 2004, created a new system for government procurement of foodstuffs,
expressly supporting the purchase of products from family farmers. This programme expanded its
objectives, covering the supply of foodstuffs for the National School Feeding Programme, encouraging
other federal entities (states and municipalities) to adhere to the same procedures similar to PAA.
8
PAA spending can be divided into two types: food assistance and interventions to stabilize prices. The
first case refers to PAA modes focused on donations for social programmes and school feeding. The
second case relates to procedures aimed at structuring the market through build-up of public stocks
that may or may not be donated in the future.
In its ten years of operation, the PAA has prioritised the procedures for public procurement with
simultaneous donations and other donation programs without build-up of stocks, representing 86%
of programme resources in 2014. This programme therefore did not constitute a significant change
for the build-up of government stocks from the products of family farming.
The Government Procurement programme to support family farming in Brazil is composed of several
sub-programmes, with different institutional and budgetary linkages, including executing agencies in
the Federation spheres (federal, state and municipal agencies).
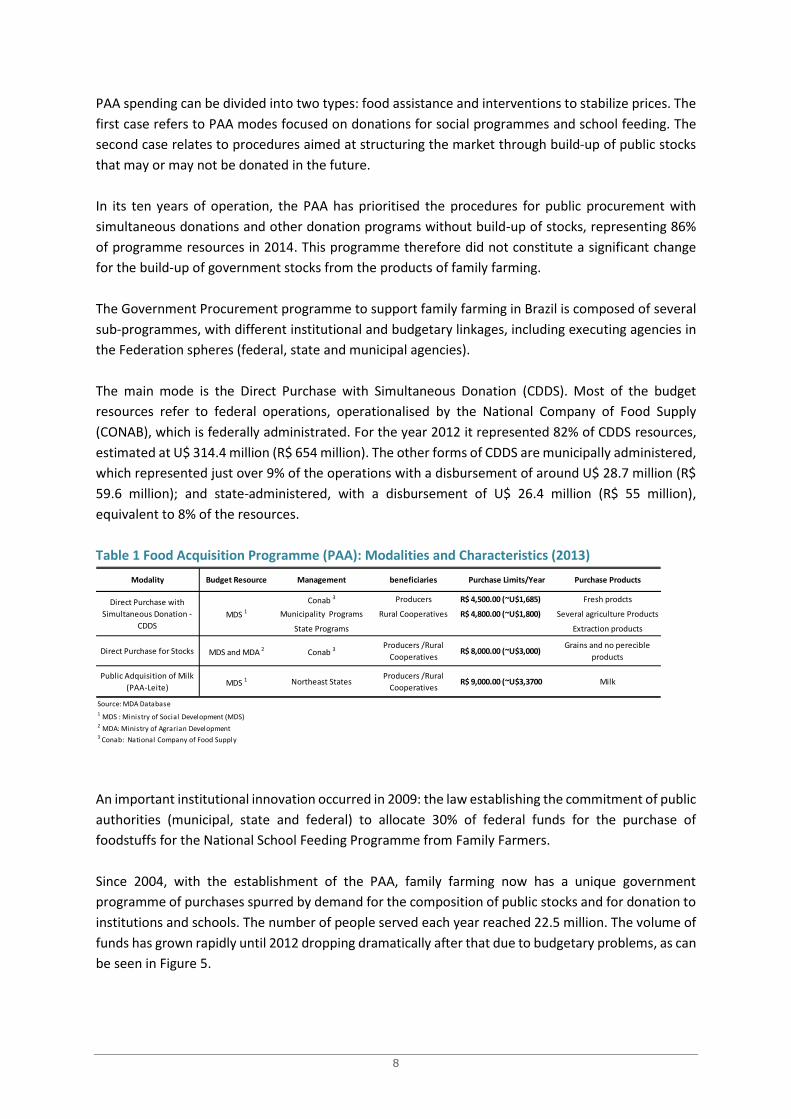
The main mode is the Direct Purchase with Simultaneous Donation (CDDS). Most of the budget
resources refer to federal operations, operationalised by the National Company of Food Supply
(CONAB), which is federally administrated. For the year 2012 it represented 82% of CDDS resources,
estimated at U$ 314.4 million (R$ 654 million). The other forms of CDDS are municipally administered,
which represented just over 9% of the operations with a disbursement of around U$ 28.7 million (R$
59.6 million); and state-administered, with a disbursement of U$ 26.4 million (R$ 55 million),
equivalent to 8% of the resources.
Table 1 Food Acquisition Programme (PAA): Modalities and Characteristics (2013)
An important institutional innovation occurred in 2009: the law establishing the commitment of public
authorities (municipal, state and federal) to allocate 30% of federal funds for the purchase of
foodstuffs for the National School Feeding Programme from Family Farmers.
Since 2004, with the establishment of the PAA, family farming now has a unique government
programme of purchases spurred by demand for the composition of public stocks and for donation to
institutions and schools. The number of people served each year reached 22.5 million. The volume of
funds has grown rapidly until 2012 dropping dramatically after that due to budgetary problems, as can
be seen in Figure 5.
Modality Budget Resource Management beneficiaries Purchase Limits/Year Purchase Products
Conab 3 Producers R$ 4,500.00 (~U$1,685) Fresh prodcts
Municipality Programs Rural Cooperatives R$ 4,800.00 (~U$1,800) Several agriculture Products
State Programs Extraction products
Direct Purchase for Stocks MDS and MDA 2 Conab 3 Producers /Rural
Cooperatives R$ 8,000.00 (~U$3,000)
Grains and no perecible
products
Public Adquisition of Milk
(PAA-Leite) MDS 1 Northeast States
Producers /Rural
Cooperatives R$ 9,000.00 (~U$3,3700 Milk
Source: MDA Database
3 Conab: National Company of Food Supply
Food Acquisition Program (PAA): Modalities and characteristics (2013)
2 MDA: Ministry of Agrarian Development
Direct Purchase with
Simultaneous Donation -
CDDS
MDS 1
1 MDS : Ministry of Social Development (MDS)

9
Figure 5 Allocated Resources in the Food Acquisition Programme (PAA), 2003-2015 (U$)
Source: MDA Database
The volume of purchased products increased significantly by 2012, except for 2011, and from that had
cuts due to budgetary restrictions. This reduction movement was reflected in the number of family
farmers involved in the supply of these products, as can be seen in Figures 6 and 7:
Figure 6 Purchased products (million tonnes) per year by PAA, 2003 to 2015
Source: MDA Database

10
Figure 7 Number of producers participating in PAA, 2003 to 2015
Source: MDA Database
According to the typology built by UNDP (2013), PAA spending can be divided into two types: food
assistance; and interventions to stabilise prices. In the first case, the study considered the terms of
PAA that focus on donations to social programmes and school feeding. The second case considered
the procedures aimed at structuring the market through the build-up of public stocks that may or may
not be donated in the future. Over its ten years PAA’s operation has changed, favouring purchases
with simultaneous donations and other donation programmes which now account for 86% of the
PAA's resources at the expense of structuring markets. Thus, even though from the producer's point
of view the type of government intervention makes no difference, there was effectively no change in
agricultural policy orientation in government stock build-up activity aimed at favouring family farming.
In 2009 Federal Law 11,947 established that the government should allocated 30% of federal funds
designated to the purchase of food to Family Farming (PAA). The share of direct purchases of family
farming in the National School Feeding Programme (PNAE), in turn, represents only a potential
amount of Federal Government expenditure, as the executive units (municipalities and state
governments) may not fully meet their quotas. The National Fund for Educational Development
(FNDE), the supervisory body of the Ministry of Education, states that municipalities that do not
comply with accountability requirements may have the transfer of funds for school feeding suspended
or rescheduled. Data collected by FNDE in 2011, referring to the rendering of accounts of the 2010
municipalities (one year after the enactment of the law) shows that there were few municipalities that
were buying products from family farms, and much fewer who were fulfilling the proportion of 30%
determined by law. Map 1 shows the consolidated transfer of funds data and the amounts spent on,
or committed to, purchases from family farms.

11
Figure 8 FNDE Resource Transfer used for Direct Purchase by Municipalities in 2014
More than 0and less than 30%
From 30% to 100%
More than 100%
Proportion of food purchased from family agriculture in relation to the total support granted by Federal Government to school meals.
Source: MEC – FNDE
As noted in Figure 8, a significant number of Brazilian municipalities did not meet the legal
requirement to use at least 30% of FNDE transfer for the purchase of products from family farming.
The municipalities with greater populations and more economically developed, located in Southern
and South-eastern Brazil, generally purchased a greater proportion of food from family farms.
The study which the map is based on uses 2014 data and a budget of approximately U$ 411.7 million
(R$ 1.1 billion) distributed among 5,493 Brazilian municipalities, of which 4,229 bought products from
family farming and 2,168 bought above 30% of the overall amount of federal funding. Due to the large
amount of foodstuff needed and the almost non-existence of a large family farming sector around,
the programme has found it difficult to access the State’s capitals and metropolitan areas (CORÁ, BELIK
(orgs), 2012).
Despite the efforts of some municipalities, family farming purchases have focused on the
municipalities of greater agricultural presence and those where family farming already played an
important role in supplying the population and public institutions. In other words, the National School
Feeding Programme (PNAE) likely has had much less of an impact than that indicated by the FNDE
data.
The scope of both PAA and the PNAE is limited, despite their tendency for growth. On the demand
side of the PNAE (the use of public resources for free food supply), the programme serves 42.2 million
public school students, promoting social protection and food and nutrition security for a vulnerable
part of the population. However, on the supply side, few of the 4.1 million Brazilian farmers have
access to these marketing programmes. Even though the federal government aims to spread its
resources among the largest possible number of suppliers, the range is still very low.

12
As at 2013, the PAA set a limit of approx. U$2,785 (R$ 6,500) per family unit/year when the programme
is accessed through supplying organizations (cooperatives, producer associations, etc.). For
beneficiaries in the register of extreme poverty (CADUNICO), the limit rises to approx. U$ 3,425 (R$
8,000) per family unit/year, which is the same in the case of direct purchase. In the case of the
individual farmer, the PAA also makes the purchase, but the limit is approx. U$ 2,355/year (R$ 5,500)
and approx. U$ 1,715/year (R$ 4,000) for the purchase of milk. The PNAE works with slightly higher
purchase values, reaching U$8,565 per family unit/year (R$ 20,000).
Filling the PAA budget in 2014 would therefore require about 180,000 farmers, while the PNAE would
require 55,000 producers at best projections, without considering that the same producer could
provide for both programmes at the same time. This amount to be spent on purchases of family
farming could therefore meet only somewhere around 5% of family farmers based on the 2006
Agricultural Census.
Given the initial success of the PAA and Family Farming purchases of PNAE, the federal government
extended the programme to supply other programmes related to Food Safety and for use in public
institutions such as hospitals, federal schools, prisons, etc. The example was followed by some states
of the federation, such as São Paulo State, whose Paulista Programme of Social Interest Agriculture
has grown rapidly since its launch in 2013.
In the ten years since its inception, the Brazilian Agricultural Policy targeted at family farming evolved
from a budget of ~U$785 million (R$ 2.6 billion) in 2002/2003, to ~U$16.7 billion (R$ 39 billion) in the
2013/2014 crop, including public financing and acquisitions for stock build-up, and for use in school
feeding and other public sector beneficiaries.
Performance of the Agricultural Policy in Brazil and the Build-up of Stocks
The practice of public intervention in the agricultural sector in Brazil analysed from the two main
instruments of agricultural policy, the Rural Credit Policy and Minimum Price Guarantee Policy
(PGPM), have well-defined temporal characteristics (ALMEIDA, 2014).
The period of spending expansion and stock build-up, from 1962 to 1979, is marked by a growing
intervention of investment in agriculture. From the mid-1960s, PGPM offered changes to deal with
the problems of domestic food supply, prioritising products such as rice and corn which are important
for the food supply of the country. The decade 1980-1990 was marked by an unstable macroeconomic
scenario, the fiscal and foreign exchange crisis and inflationary escalation, ending in the
hyperinflationary crisis that lasted until stabilisation in 1994. The resources for stock build-up then fell
sharply. In the early 1990s, the amount of rural credit represented only 22.9% of the 1979 year of
credit (ALMEIDA, 2014).
In the 1980s, the proportion of public spending on agriculture in relation to the total expenditure of
the Union averaged 5.6%. In the following decade, the average accounted for only 2.2%. Since 1987,
spending on agriculture (including Rural Credit and PGPM) was reduced as a direct consequence of

13
the reduction in resources for rural credit, supply and for specific products, such as wheat, sugar and
fuel alcohol.
Due to the reduction of the financial volume for the agricultural sector, rural credit policy in the period
1990/99 decreased by approximately 84%, while the PGPM decreased by around 43%. After a brief
rise in spending on PGPM between 1992 and 1995, from that period on the share of PGPM spending
compared to spending on agriculture has declined significantly with the introduction of new
agricultural policy mechanisms.
By the end of the 1980s, a strong State role in agricultural marketing prevailed in Brazil. Regarding the
EGF, a record volume of loans occurred in 1982, when the state-owned company acquired 14.9 million
tonnes of produce, equivalent to 29% of the national grain production that year. In 1987, AGF reached
its peak, with 12.8 million tonnes of grain withdrawn from the market, equivalent to 20% of the
national production.
The 1990s were marked by a process of trade liberalisation, which influenced the redesign of sectoral
policies, especially in agriculture, such as the PGPM. From the stabilisation of the Brazilian currency,
the so called "Plano Real" from 1994, commercial liberalisation was coordinated with macroeconomic
policies to contain possible domestic price increases by lowering barriers to imports.
With the reduction of barriers to imports and currency appreciation, imports of agricultural products,
previously limited to protect the domestic market, were significantly affected during the 1990s. There
were significant purchases in the foreign market of major food products, including through PGPM.
From 1988-98, imports of the two most important products supported by PGPM, rice and corn,
increased in volume by 791% and 10,566.7%, respectively.
Prices received by producers of major grains supported by PGPM exhibited a declining trend during
the 1990s. The products that faced the biggest falls were those whose production was focused directly
to supply the domestic market, such as corn and rice. From 1990-99, the price received by the
producers of these two products declined by 34% and 65%, respectively (CAMPOS, FERNANDES FILHO,
1998).
In a trade liberalisation scenario, the PGPM proved unable to raise prices for producers as it would
attract imports by the private sector, as indeed happened with imports of corn, which rose from 0.59
million tonnes in 1991 to 1.75 million tonnes in 2000, an increase of 195% (ALMEIDA, 2014). The
market for major crops supported by PGPM, such as rice and corn, gradually integrated with external
markets, so that Southern Common Market (MERCOSUR) countries accounted on average for 89% of
Brazilian imports in the 1990s to the 2000s, designed to meet both domestic consumption and for the
build-up of regular stocks of corn.
The trade liberalisation process, as well as providing greater commercial narrowing of Brazilian
products in the international market, as seen in the case of corn and rice, modified the dynamics of
the pricing of these products, so that the setting of domestic prices was also subject to world prices
(ALMEIDA, 2014). Besides the grains that make up the staple diet of the population (rice, beans, wheat
and soybeans), greater reliance was placed on wheat. Rice had a very high volume of imports until the

14
middle of the last decade (see Table 2) due to exchange rate appreciation and misguided sectoral
policies, but this situation was reversed later. Beans are a special case among Brazilian staple foods
because it is an essentially domestic product with low technification (i.e. it is labour intensive). Bean
prices increase significantly in times of scarcity, accompanied by speculation and instability, since
there are no beans with the characteristics of those consumed in Brazil in the international market.
The rejection rate of imported beans from China, India or Colombia is high.
Brazil’s rate of wheat consumption, combined with limits on domestic production due to
environmental factors, has consistently required that domestic production be supplemented by
imported wheat. However, domestic production has grown in recent decades. In the mid-1980s, for
example, due to exchange restrictions and government stimuli, domestic wheat production comprised
80% of the total consumed domestically. Today domestic production accounts for approximately 50%
of domestic consumption.
However, significant changes have occurred in the national productive system over the years.
Embrapa (Brazilian state-owned company of rural technology) research efforts in tropical wheat
cultivation resulted in the development of seeds appropriate for the savanna (cerrado) climate.
Currently, the regions of the Planalto Central with mild weather and no wind are threatening the
supremacy of Southern states as large producers. The Cerrado region can produce up to two wheat
crops - irrigated and rainfed - in a year. This change in the geography of production also brings
important changes regarding logistics and storage.
Traditionally, warehouses and flour mills were located in the regions near the landing ports of the
imported product or the producing regions. It is not common to carry wheat in natura great distances
by road in Brazil. Argentina, which until recently was Brazil’s main supplier, exports its wheat in natura
or flour at reduced costs (due to production costs, low freight costs and preferential rates) even to the
Northeast, leaving national produce at a disadvantage. Argentine wheat reaches the ports of Fortaleza
and Recife at cheaper prices than the domestic product. However, due to internal problems in
Argentina, currently the largest supplier of wheat to Brazil is the United States, with approximately
25% of the market.
The imported product, mainly from the US or Canada, is of high quality with few impurities and low
moisture content, which allows a good yield with few losses. In contrast, the domestic product is of
lower quality and is used for lower value purposes such as the production of biscuits and animal feed.
However, due to high international produce prices and the recent embargo on Russia, even lower
quality Brazilian produce is finding a good market internally and in other developing countries.
Table 2 illustrates the Trade Balance of the main agricultural products in the last 15 years.

15
Table 2 Brazilian Agricultural trade 2001-2015 (tonnes)
Since 2005, a series of institutional changes have occurred following the new government orientation
that took office in 2003. Federal government intervention through the CONAB started to play a more
regulatory than interventionist role. New tools for marketing support, such as the Risk Premium for
the Acquisition of Agricultural Product Coming from the Put Option Private Agreement (future market
mechanism), the Premium Equaliser Paid to Producer, and the Premium for Equalisation of the
Reference Value of Soybean Grains gradually transformed the private sector as a key agent in support
of PGPM.
Recent trends in grain stock build-up in Brazil
The build-up of public grain stock in Brazil is strong in corn, rice and more inconsistently in wheat.
However, the importance of this stock build-up has decreased gradually over the past 35 years.
The intervention of the Federal Government through CONAB in the increase of public stocks in the
period started to occur at specific times, reaching two peaks in the crop years 2006/07 and 2010/11,
but well below the level of the 1990s.
Year Transaction Rice Corn Wheat Soy (grain) Soybean meal Animal Feed Other
CerealsFruits Vegetables
Export 22.109 5.625.701 245 15.655.792 11.270.734 1.074.814 84.160 658.951 136.269
2001 Import 775.629 622.052 7.011.798 849.575 218.871 77.218 255.815 879.865 560.749
Balance -753.520 5.003.649 -7.011.553 14.806.218 11.051.864 997.596 -171.655 -220.914 -424.481
Export 30.194 2.739.766 107 15.961.443 12.517.419 136.400 10.462 749.862 136.483
2002 Import 639.322 342.201 6.562.524 1.045.204 367.633 84.753 153.891 256.431 577.702
Balance -609.128 2.397.565 -6.562.416 14.916.239 12.149.786 51.647 -143.429 493.431 -441.219
Export 19.779 3.561.801 49.909 19.881.261 13.602.548 58.978 302.357 903.001 133.728
2003 Import 1.293.489 796.162 6.611.926 1.189.229 305.515 89.453 258.496 198.126 646.219
Balance -1.273.709 2.765.639 -6.562.017 18.692.033 13.297.033 -30.476 43.861 704.875 -512.491
Export 36.806 5.018.604 1.320.473 19.237.367 14.485.795 92.906 134.436 954.877 111.013
2004 Import 926.644 328.757 4.847.852 348.312 187.883 96.374 186.723 210.783 709.439
Balance -889.837 4.689.847 -3.527.378 18.889.055 14.297.913 -3.468 -52.287 744.094 -598.425
Export 272.483 1.058.393 156.158 22.429.207 14.423.116 94.403 24.064 935.533 96.904
2005 Import 532.350 595.739 4.988.125 367.748 188.726 89.154 239.793 287.968 726.448
Balance -259.867 462.655 -4.831.966 22.061.459 14.234.391 5.249 -215.729 647.565 -629.544
Export 290.346 3.924.552 651.366 24.949.585 12.333.678 103.173 307 913.534 81.355
2006 Import 652.758 956.040 6.531.178 48.857 152.427 103.226 204.540 346.178 714.560
Balance -362.412 2.968.512 -5.879.812 24.900.728 12.181.251 -52 -204.233 567.356 -633.205
Export 201.406 10.914.634 102.835 23.721.481 12.477.203 126.742 225.462 1.047.583 176.244
2007 Import 720.222 1.095.266 6.638.010 97.920 101.223 107.238 248.450 352.824 731.210
Balance -518.815 9.819.368 -6.535.174 23.623.560 12.375.980 19.504 -22.988 694.759 -554.966
Export 517.922 6.370.665 640.808 24.492.629 12.288.707 133.573 37.118 1.001.445 195.322
2008 Import 443.771 767.003 6.033.578 96.028 117.323 115.067 277.941 338.804 930.243
Balance 74.152 5.603.662 -5.392.770 24.396.601 12.171.385 18.506 -240.823 662.641 -734.921
Export 602.001 7.765.370 384.210 28.547.886 12.253.169 101.610 7.724 885.987 328.946
2009 Import 670.733 1.132.895 5.445.894 98.227 43.401 97.530 461.577 402.749 826.544
Balance -68.731 6.632.474 -5.061.685 28.449.659 12.209.768 4.080 -453.853 483.238 -497.598
Export 430.429 10.792.581 1.316.834 29.064.451 13.668.639 141.282 4.047 839.518 233.387
2010 Import 781.870 459.428 6.323.206 116.644 39.475 117.163 299.814 480.789 1.166.057
Balance -351.441 10.333.153 -5.006.372 28.947.807 13.629.165 24.119 -295.767 358.729 -932.670
Export 1.350.852 9.459.471 2.347.335 32.973.107 14.355.230 148.914 6.440 748.988 91.366
2011 Import 619.237 655.896 5.740.451 40.940 24.805 117.543 328.544 620.770 1.121.554
Balance 731.615 8.803.576 -3.393.116 32.932.166 14.330.425 31.372 -322.104 128.218 -1.030.188
Export 1.152.390 19.775.331 2.404.563 32.909.804 14.289.064 160.303 2.346 765.329 84.424
2012 Import 737.407 829.589 6.580.434 267.958 5.019 116.995 237.023 599.280 1.187.326
Balance 414.983 18.945.742 -4.175.871 32.641.846 14.284.045 43.308 -234.677 166.049 -1.102.902
Export 917.859 26.610.206 1.187.731 42.792.703 13.333.589 188.350 37.956 777.987 85.324
2013 Import 753.337 907.875 7.273.279 282.429 3.879 128.752 374.579 591.796 1.424.372
Balance 164.522 25.702.331 -6.085.548 42.510.274 13.329.710 59.598 -336.623 186.191 -1.339.048
Export 914.755 20.638.756 276.800 45.688.848 13.716.461 193.343 23.074 733.720 116.797
2014 Import 620.563 771.322 5.782.822 578.677 994 133.989 423.113 607.537 1.104.259
Balance 294.192 19.867.434 -5.506.022 45.110.171 13.715.467 59.354 -400.039 126.182 -987.462
Export 961.473 28.902.801 1.778.711 54.322.601 14.826.738 170.692 64.150 854.806 194.425
2015 Import 372.567 369.575 5.170.437 323.084 1.141 125.563 462.831 519.585 1.164.142
Balance 588.906 28.533.226 -3.391.726 53.999.517 14.825.597 45.129 -398.681 335.221 -969.716
Source: Agrostat/Ministry of Agriculture of Brazil

16
Table 3 Position of AGF public stocks of main crops (million tonnes) 2003/04 to 2011/12
These two peaks of stock build-up are not due to a deliberate decision by CONAB to restart
accumulating large audiences via AGF, but because of the need to intervene regarding specific crops
such as corn, rice and wheat. In the case of corn, in the crop years 2006/07 and 2010/11 the physical
volume of public stocks reached 2.417 million tonnes and 1.195 million tonnes, due to the low market
price during these periods.
Stock build-up during that period of PGPM is therefore based on a short-term decision, in contrast
with the initial long-term focus of the policy on maintaining farmers’ income. From this perspective,
the Federal government began to use its main company (CONAB) more as a regulatory agency,
increasing the build-up of public stock only in critical agricultural situations, and working in places
where the private sector was not interested buying the produce.
As evidenced by the figures showing the evolution of stocks for corn, rice and beans in recent years,
there has been a remarkable decrease in this public policy action in the last five years.
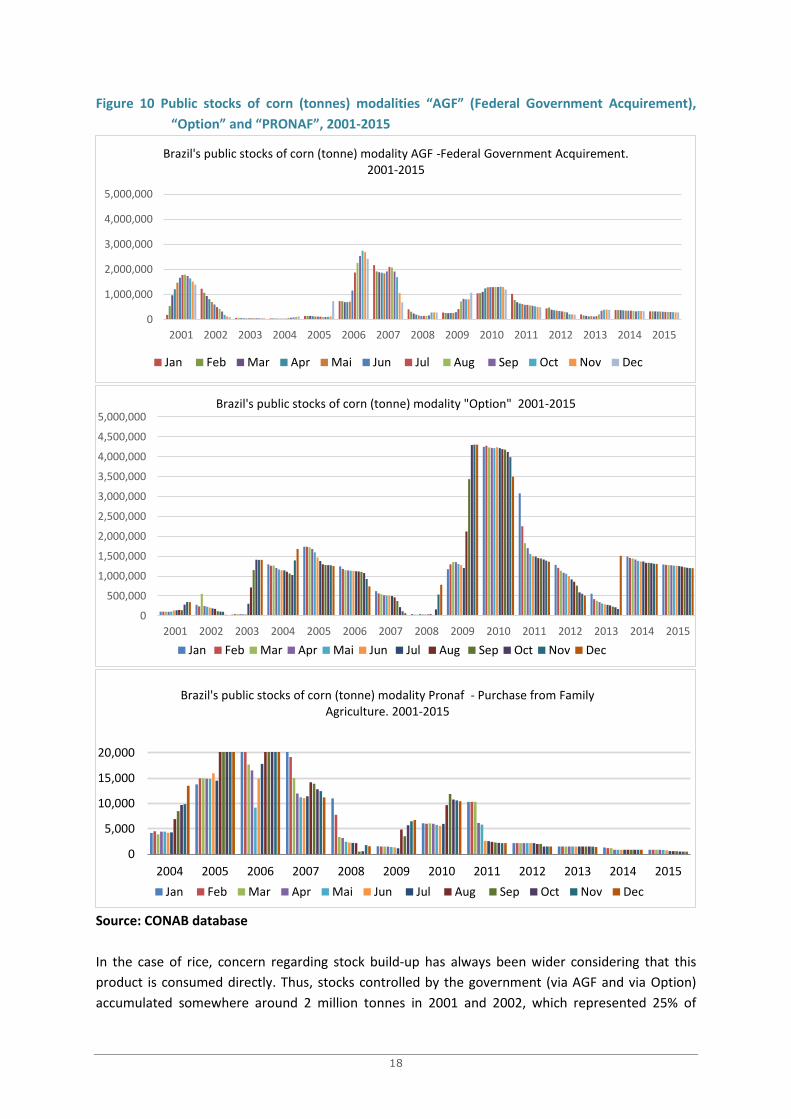
In the case of corn, there is a predominance of stock accumulated by the AGF traditional system in the
early 2000s, followed by a clear preference for the use of options markets from 2003-2005.
Accumulation of stocks via AGF again predominates in the pre-food crisis period (2006 and 2007), but
at the peak of the crisis (2008) public stocks are practically zero. In the next phase there is a large
accumulation of stocks in the two modes, reaching a total of 5 million tonnes in 2010 (almost 5% of
domestic consumption) under the pressure of swine breeders and poultry producers. Finally, between
the years 2013 and 2015 the government reduces its purchases and operation through the market
and instead emphasises use of PAA, which reaches 200,000 tons as Figure 10 shows (although this
figure is only 15% of total stock). The PRONAF (National Programme to Strengthen Family Farms)
programme is the modality which supports family agriculture.
Year Cotton Rice Bean Corn Wheat Soy
2003/2004 11.130 1.320 0 50.309 0 0
2004/2005 76 1.867 11.715 127.155 137.997 0
2005/2006 4.558 501.991 1.277 735.569 491.762 0
2006/2007 4.945 648.930 3.766 2.417.044 0 5.674
2007/2008 1.571 585.748 322 686.347 0 73
2008/2009 1.571 144.385 5 288.948 226.075 38
2011/2012 37 463.269 78.320 494.495 616.419 38
Source: Almeida (2014)

17
Figure 9 Brazil’s public stock of corn by modality 2001-2015
18
Figure 10 Public stocks of corn (tonnes) modalities “AGF” (Federal Government Acquirement),
“Option” and “PRONAF”, 2001-2015
Source: CONAB database
In the case of rice, concern regarding stock build-up has always been wider considering that this
product is consumed directly. Thus, stocks controlled by the government (via AGF and via Option)
accumulated somewhere around 2 million tonnes in 2001 and 2002, which represented 25% of
0
1,000,000
2,000,000
3,000,000
4,000,000
5,000,000
2001 2002 2003 2004 2005 2006 2007 2008 2009 2010 2011 2012 2013 2014 2015
Brazil's public stocks of corn (tonne) modality AGF -Federal Government Acquirement. 2001-2015
Jan Feb Mar Apr Mai Jun Jul Aug Sep Oct Nov Dec
0
500,000
1,000,000
1,500,000
2,000,000
2,500,000
3,000,000
3,500,000
4,000,000
4,500,000
5,000,000
2001 2002 2003 2004 2005 2006 2007 2008 2009 2010 2011 2012 2013 2014 2015
Brazil's public stocks of corn (tonne) modality "Option" 2001-2015
Jan Feb Mar Apr Mai Jun Jul Aug Sep Oct Nov Dec
0
5,000
10,000
15,000
20,000
2004 2005 2006 2007 2008 2009 2010 2011 2012 2013 2014 2015
Brazil's public stocks of corn (tonne) modality Pronaf - Purchase from Family Agriculture. 2001-2015
Jan Feb Mar Apr Mai Jun Jul Aug Sep Oct Nov Dec

19
domestic rice consumption. However, over the last 15 years, the product backed by the government
was reduced to near zero between 2003 and 2005. It then returned to represent something around
1.8 million tonnes from 2010 on, although at this point the government chose to act through the
option agreement. Figures 10 and 11 illustrate this movement.
Figure 11 Brazil’s public stock of rice by modality 2001-2015

20
Figure 12 Public stocks of rice (tonnes) modalities “AGF” (Federal Government Acquirement),
“Option” and “PRONAF”, 2001-2015
Source: CONAB database
0
200,000
400,000
600,000
800,000
1,000,000
1,200,000
1,400,000
2001 2002 2003 2004 2005 2006 2007 2008 2009 2010 2011 2012 2013 2014 2015
Brazil's public stocks of rice (tonne) modality Federal Government Acquirement (AGF) . 2001-2015
Jan Feb Mar Apr Mai Jun Jul Aug Sep Oct Nov Dec
0
200,000
400,000
600,000
800,000
1,000,000
1,200,000
1,400,000
2001 2002 2003 2004 2005 2006 2007 2008 2009 2010 2011 2012 2013 2014 2015
Brazil's public stocks of rice (tonne) modality "Option" 2001-2015
Jan Feb Mar Apr Mai Jun Jul Aug Sep Oct Nov Dec
0
5,000
10,000
15,000
20,000
25,000
30,000
35,000
40,000
2004 2005 2006 2007 2008 2009 2010 2011 2012 2013 2014
Brazil's public stocks of rice (tonne) modality Purchase from Family Agriculture. 2004-2015
Jan Feb Mar Apr Mai Jun Jul Aug Sep Oct Nov Dec

21
In the case of beans, a staple in the Brazilian diet, the government has not acted in the build-up of
stocks. The main mode is the AGF and there is no operation via the options market. In some years,
including the 2008 crisis, government stocks were virtually empty. Soon after, there was a move to
accumulate stocks, but these never surpassed 5% of the domestic consumption of the product, which
shows a great weakness in the price control operation (Figure 12).
Regarding government procurement of beans via PAA, we observe a very small presence. During the
2008 crisis stocks formed by PAA were tiny, and after the year 2013 they disappeared (Figure 13).
Figure 13 Brazil’s public stock of beans by modality 2001-2015
Source: CONAB database

22
Figure 14 Public stocks of beans (tonne) modalities “AGF” (Federal Government Acquirement), and
“PRONAF”, 2001-2015
Source: CONAB database
An important aspect of the price policy to consider in the build-up of stocks is that the PAA has
contributed very little to the increased volume of stocks. In the 2010/11 crop year, the stocks of the
three most important products of the PAA (rice, beans and corn) were only 25,741 tonnes - well below
the stock position of PGPM via AGF of 3,409,684 tonnes for the same products.
Finally, it is important to make some observations on the build-up of wheat stocks. This product is not
demanded directly by the consumer, and the AGF can influence the carrying costs charged by the mills.
The consumer’s absence puts the power to directly influence prices in the hands of the industrial
classes. It is therefore observed through Figures 16 and 17 that government presence in stock build-
up was very weak throughout the previous decade, assuming some importance only between 2010
and 2012 when it reached approximately 5-7% of domestic consumption. In addition, wheat stocks
through the PAA are very low and may even be disregarded.
0
20,000
40,000
60,000
80,000
100,000
120,000
140,000
160,000
180,000
2001 2002 2003 2004 2005 2006 2007 2008 2009 2010 2011 2012 2013 2014 2015
Brazil's public stocks of bean (tonne) modality Federal Governe Acquirement (AGF) .2001-2015
Jan Feb Mar Apr Mai Jun Jul Aug Sep Oct Nov Dec
0
20,000
40,000
60,000
2004 2005 2006 2007 2008 2009 2010 2011 2012 2013 2014
Brazil's public stocks of bean (tonne) modality Family Agriculture (Pronaf) .2001-2015
Jan Feb Mar Apr Mai Jun Jul Aug Sep Oct Nov Dec

23
Figure 15 Brazil’s public stock of wheat by modality 2001-2015
Source: CONAB database

24
Figure 16 Public stocks of wheat (tonne) modalities “AGF” (Federal Government Acquirement),
“Option”, and “PRONAF”, 2001-2015
Source: CONAB database
100,000
100,000
300,000
500,000
700,000
900,000
2001 2002 2003 2004 2005 2006 2007 2008 2009 2010 2011 2012 2013 2014 2015
Brazil's public stocks of wheat (tonne) modality Federal Government Acquirement (AGF) 2001-2015
Jan Feb Mar Apr Mai Jun Jul Aug Sep Oct Nov Dec
0
200,000
400,000
600,000
800,000
1,000,000
2001 2002 2003 2004 2005 2006 2007 2008 2009 2010 2011 2012 2013 2014 2015
Brazil's public stocks of wheat (tonne) modality "Option" 2001-2015
Jan Feb Mar Apr Mai Jun Jul Aug Sep Oct Nov Dec
0
20,000
40,000
60,000
80,000
100,000
2004 2005 2006 2007 2008 2009 2010 2011 2012 2013 2014 2015
Brazil's public stocks of wheat (tonne) modality Family Agriculture (Pronaf) .2001-2015
Jan Feb Mar Apr Mai Jun Jul Aug Sep Oct Nov Dec

25
Food prices to consumers in the last decade
The impact of international prices on food prices in Brazil can be seen in the effects of the food price
crisis. The behaviour of prices vis-à-vis the general food price index in Brazil indicates two distinct
temporary patterns in the 2000s.
The first period runs from 2000 to 2006. Except for an atypical movement, marked by expectations
regarding the political situation in 2002, the period can be described as a "peaceful lagoon", with small
fluctuations in quarterly prices, and high correlation between food price and general price indices.
Figure 17 Evolution of general index prices and food and beverage index prices. Brazil, 2001-2006
Source: IBGE DATABASE
From 2007 to 2013, Brazil began to experience significant instability in food prices relative to general
prices. The increase in inflation rates in the country from 2013 is accompanied by food prices, but with
less variation than that seen from 2007-2013.
-2
-1
0
1
2
3
4
5
6
7
Jan
-01
Ap
r-0
1
Jul-
01
Oct
-01
Jan
-02
Ap
r-0
2
Jul-
02
Oct
-02
Jan
-03
Ap
r-0
3
Jul-
03
Oct
-03
Jan
-04
Ap
r-0
4
Jul-
04
Oct
-04
Jan
-05
Ap
r-0
5
Jul-
05
Oct
-05
Jan
-06
Ap
r-0
6
Jul-
06
Oct
-06
General Index
Food and beverages

26
Figure 18 Evolution of general index prices and food and beverage index prices. Brazil, 2007-2015
Source: IBGE DATABASE
The international price of inputs rocketed from the beginning of the decade. Prices of many products
that are not directed to the external market (and therefore are not influenced by international prices,
as there is no opportunity cost) may have increased not because of demand but due to these cost
increases. The figure below illustrates the increase in the price of the main input of Brazilian
agriculture: agrochemical fertiliser, which soared from 2004 and peaked in 2009. Fertiliser now costs
more than four times the price observed at the beginning of the decade.
-1
-0.5
0
0.5
1
1.5
2
2.5
3Ja
n-0
7
May
-07
Sep
-07
Jan
-08
May
-08
Sep
-08
Jan
-09
May
-09
Sep
-09
Jan
-10
May
-10
Sep
-10
Jan
-11
May
-11
Sep
-11
Jan
-12
May
-12
Sep
-12
Jan
-13
May
-13
Sep
-13
Jan
-14
May
-14
Sep
-14
Jan
-15
May
-15
Sep
-15
General IndexFood and beverages

27
Figure 19 Average fertiliser prices in Brazil, 1970-2015
Source: World Bank Database
Table 4 below shows the massive deterioration of terms of trade for five products in relation to
fertiliser. The highest point of the increase in costs occurred in 2008 for soybeans, wheat and corn.
For beans, the worst situation occurred in 2009 and for rice, in 2011. The deterioration in the
relationship remained high and, except in the case of soy beans, it returned to the beginning of the
levels of the 2000 decade.
0
200
400
600
800
1000
1200
DAP TSP Urea Potassium chloride

28
Table 4 Exchange Ratio for the purchase of 1 tonne of fertiliser in Brazil, 2000-2015
Source: CONAB Database
We can separate the impact of the public policy of intervention in the market, via regulatory stocks,
into two types: the impact in terms of social costs and impact in budget terms. The first is the cost
imposed on society by supporting a higher price than the market price. This can occur through
consumer subsidies or buying surpluses from farmers. The budgetary impact is calculated from the
government's outlay for the acquisition of agricultural product or the cost of the implicit subsidy in
the operation of the stocks through the market.
Given the change in government intervention model, the presence of interventions like the AGF were
reduced in 1990 and 2000 and increased again only after the fall of international prices in 2010 and
2011, with rice and corn representing 90% of the government purchases between 1990-2007. To the
extent that the Brazilian economy was opening up to the foreign market, the minimum prices by the
government approached the international prices with the weakening of the PGPM.
Analysing the behaviour of these two products (rice and corn) since 1987, Schwantes (2015) estimated
the social and budgetary costs. This calculation considered the functioning of the various mechanisms
of stock policy (payment of insurance costs and production displacement) and the volume of product
involved in government negotiations for these two products. In all cases analysed there was a huge
reduction in the cost of intervention. For rice, the initial social cost with the purchase of surplus
represented 23.5% of the value of production in 1986/87, 14.5% in 1995/96, and 0% from the year
2000. The cost of the subsidy in social terms was zero or practically negligible over all years, except
for the year 1995/96 when it reached 11.9% of the production value. The expenses in budgetary terms
for rice fell from 21.9% of production to almost zero in the 1990s, where it remains to date. In the
case of corn, the situation was very similar, emphasising however that the participation of intervention
Irrigated Rice Bean Corn Soy Wheat
(Pack 50kg) (Pack 60kg) (Pack 60kg) (Pack 60kg) (Pack 60kg)
2000 30,6 14,7 40,2 25,4 33
2001 30 10,6 57,8 23,4 31,7
2002 26,5 9,4 38,1 17,6 23,6
2003 21,9 11,6 50,3 19,8 28,6
2004 27 15,8 57,1 22,7 35,8
2005 38,5 11,4 57,3 27,7 41,5
2006 28,1 17 59,8 26,7 34
2007 30,7 14,4 50,7 25,6 21,2
2008 41,4 13,8 87,4 38,6 52,2
2009 39 16,8 67,5 25,7 41,3
2010 29,9 12,1 64,7 25,4 39,3
2011 51 16,1 52,6 27,1 46,5
2012 41,8 9,7 53,6 22,6 45,8
2013 33,1 8,7 64,8 22,2 30,2
2014 31,3 17,7 62,6 20,9 35,2
2015 38,8 12,8 72,1 23,5 45,1
Exchange Ratio for the purchase of 1 ton of fertilizer
Year

29
budget costs can be considered negligible except for the year 1996/97, where it represented 7.9% of
the cost of production.
Overall government interventions, directly or through the market, had a very low weight in the set of
price stabilisation policies in Brazil. According to Schwantes (2015) the action of pressure groups made
the government buy the product when the minimum price was below the market price but,
contradictorily, the government bought also when the minimum price was below the market price to
remove the product of certain regions, preventing the market price from falling too much.
Food Consumption Indicators
Food consumption in Brazil has been growing steadily due to increasing incomes. The phenomenon of
urbanization and demographic changes in a context of trade liberalisation and globalisation have
transformed Brazilian eating habits toward a diet with more processed foods and more food away
from home. In higher income classes there was a change favouring the consumption of more fruits,
vegetables and fresh foods consistent with what happens in countries with higher incomes.
These changes in the eating habits of the Brazilian population are reflected in the growth of obesity
and the incidence of chronic diseases such as hypertension and diabetes - a common phenomenon in
the societies of the American continent. By the end of the 1970s the main nutritional problem in Brazil
was undernutrition, but by the end of the next decade the prevalence of obesity became a problem
to be addressed by public policy. The large national research on nutrition conducted nationally as a
module of the Pesquisa de Orçamentos Familiares (Household Budget Survey) (last held in 2008-09)
indicated the existence of obesity in 5.7 million children (5-9 years), 6.8 million adolescents (10-19
years) and 61.5 million adults over 20 years old.
When the first national research on nutrition was held in 1974-75 malnutrition was present in 8% of
adult men and 12% in adult women. These percentages were higher than the obesity rate: 3% and 8%,
respectively. Just over 30 years later, in the 2008-09 research, undernutrition rates had reduced to 2%
and 4% for adult men and adult women, and obesity rates had soared to 12% and 17% respectively.
The household spending on food aligns exactly to the shape of the Engel curve, so that the poorest
families have to use 32% of their income on food consumption, and the highest-income families
(above 30 minimum monthly wages, or approximately USD 6,000 monthly per capita) spend less than
9% on food. The increase in incomes of the poor and the support of social feeding programmes have
allowed this social layer to spend less proportionately on food, but at the same time, directed their
spending to other types of food. In this 30-year interval, the per capita consumption of cereals and
vegetables fell from 57.8 to 31.4 kg / year, fruits observed a drop of 38.4 to 32.9 kg / year, while drinks
and infusions increased from 4.6 to 59.5 kg / year and prepared foods from 1.6 to 4.4 kg / year.
By calculating the availability of food in Brazil through its apparent consumption, it is possible to
present data on an annual basis. Table 5 presents this information for a homogeneous group of
products in selected years.

30
Table 5 Food Supply (kg/capita/year), Brazil
Increased consumption of processed foods is linked not only to increased income and changing habits,
but also to relative prices and the growing share of supermarkets as the place for the purchase of food
prepared in the home. Figure 20 presents this scenario, taking as a basis the prices charged in Brazilian
currency to the consumer at the time of the last budget survey of 2008/09.
Figure 20 Cost (R$/1,000 Kcal) of selected food groups. Brazil, 2008/2009
Source: Ricardo and Claro (2012)
Figure 21 below shows the distribution of food consumption by income class (measured in terms of
minimum wages in Brazilian currency) in 2008/09. The consumption scale is 1 to 12.5 minimum wages
of household income per capita. Emphasis should be given to the increased consumption of food away
from home for the higher income classes and the increase in consumption of fresh food (fruit and
vegetables) proportional to income growth.
Brazil is a major producer of food and, although exports have an important role, domestic agriculture
ensures domestic supply. With the stability of the economy and income growth observed in recent
Product 1970 1990 2000 2005 2008 2009 2010 2011 2012
Beans 20,70 13,41 16,41 15,35 16,36 16,30 16,27 16,40 15,34
Bovine Meat 17,75 27,51 34,87 36,15 37,41 37,41 38,69 39,07 39,32
Maize 22,06 21,66 15,60 22,45 25,10 25,01 24,38 24,31 27,55
Meat, Other 0,03 0,05 0,04 0,02 0,07 0,07 0,10 0,10 0,11
Rice (Milled equivalent) 38,72 40,69 38,24 39,25 33,26 34,57 33,53 34,16 31,76
Soybeans 0,02 2,06 2,43 3,20 3,36 3,14 3,64 3,78 3,67
Wheat 36,02 43,55 43,75 51,77 53,63 53,41 53,88 53,46 52,29
Poultry Meat 3,94 14,14 29,59 27,54 36,57 35,04 37,74 40,63 40,84

31
decades, a significant portion of the population has started to spend proportionately less on food in
relation to their income, but that does not guarantee a better quality of food consumed. These
distortions are reflected in the dramatic increase in the obesity rate and the incidence of non-
degenerative chronic diseases. Even with the sharp rise in food prices observed since 2008, discussed
below, the impact on domestic consumption did not significantly reduce household access.
Figure 21 Distribution of average family spend on food, by total income class, Brazil 2008/2009
Conditional Cash Transfer Policy – “Bolsa Família” as food access policy
The “Fome Zero” or Zero Hunger programmes were implemented quickly, which allowed some
indicators of vulnerability to be rapidly reversed in Brazil. There was a significant reduction in the level
of poverty in relative terms and in the concentration of income (measured by Gini coefficient). The
explanation for such changes can be found not only in concentrated efforts in terms of social politics,
but also from the measures in the economic policies which had a direct impact on the level of
economic growth, generating more jobs, increasing salaries and leading to a virtuous cycle of
prosperity.
The original Fome Zero Project anticipated the need to promote growth and increase incomes. In
terms of macroeconomy, Brazil experienced accelerated growth from 2002-12: annual income per
inhabitant rose from USD 3,760 to USD 11,082 (Brazil National Accounts). However, aside from the
statistical illusion promoted by the depreciated dollar during the present decade, we can observe an
explosive growth in the minimum wage in real values.
0%
10%
20%
30%
40%
50%
60%
70%
80%
90%
100%
até 830 More than830 to1,245
More than1,245 to
2,490
More than2,490 to
4,150
More 4,150to 6,225
More than6,225 to10,375
More than10,375
Pe
rce
nt
Spe
nd
wit
h f
oo
d t
ype
Total Family Income
Prepared food
Salt and spices
Canned and Preserved
Drinks and infusions
Oil and fat
bakery
Milk and dairy products
Poultry and eggs
Meat, offal and fish
fruits
Vegetables
Sugars and derivatives
Tubers and roots
Flours, starches and pasta
Cereals, legumes and oilseeds
Food away from home

32
As observed in Figure 22, over the past decade the government has promoted the rescue of the
minimum wage by implementing raises in real values, which gave workers more purchase power.
Figure 22 Evolution of the Minimum Wage in real values 1996-2016, Brazil (base= Jan. 1976)
Source: IBGE (deflationed by IPCA)
The minimum wage doubled from 2000-11, and because this is the base for different categories of
workers, the raise benefited the base of the population. In addition, in a period of low inflation, in
contrast to the 1980s and 1990s, the fluctuations and the loss of purchase power between the dates
of adjustment was also reduced, raising the consumption rate among the low-income classes and
transforming into a development virtuous circle.
The unemployment rates during the period confirm the increase in demand. A comparative study
between the years 2002 and 2011 shows that unemployment rate dropped from 12.6% to 6.0%. Not
even the international financial crisis which started in 2008 reduced the general tendency of falling
unemployment rates, although the unemployment rate did oscillate upward at that time.
In addition to the increased number of jobs offered in the last decade, there was also an increase in
the number of formalised workers. In 2001, only 45.5% of workers were registered professionally,
with both employer and employees collecting taxes directly from their main occupation. In 2011, the
proportion increased to 59.2% due to increased demand for workers in the market.
Another factor that has contributed to increased consumption and income for families was the Bolsa
Família Programme (a component of Fome Zero). This project is the result of the combination of all
other cash transfer projects at the federal level. At the end of 2002, Bolsa Família started off with
more than three million families granted benefits. At the end of 2009, the project accomplished the
goal of establishing a presence in all 5,564 municipalities of Brazil, generating a wide system of
coverage in partnership with local powers.
50
70
90
110
130
150
170
190
210
230
250
19
96
.01
19
96
.09
19
97
.05
19
98
.01
19
98
.09
19
99
.05
20
00
.01
20
00
.09
20
01
.05
20
02
.01
20
02
.09
20
03
.05
20
04
.01
20
04
.09
20
05
.05
20
06
.01
20
06
.09
20
07
.05
20
08
.01
20
08
.09
20
09
.05
20
10
.01
20
10
.09
20
11
.05
20
12
.01
20
12
.09
20
13
.05
20
14
.01
20
14
.09
20
15
.05
20
16
.01

33
In 2011, with the new administration, the project was improved with an active search for families that
would supposedly be living in conditions of misery and had not been enrolled in the programme. As a
result, by the end of that year, a new record of 13.3 million families were participating in the program.
Figure 23 Bolsa Família beneficiaries and total amount of transfers
Source: MDS database
The combination of economic development and combating poverty through conditional cash transfer
programmes and productive inclusion has enabled improvement in the purchasing power of the
population. Studies developed by IBGE demonstrate that there was a reduction in the level of poverty
according to relative criteria and an increase in the power of consumption.
Figure 24 shows that in 2001, the minimum wage was sufficient to purchase 1.37 food baskets in the
city of São Paulo. At the beginning of 2012, the purchasing capacity of the minimum wage rose to 2.24
food baskets.

34
Figure 24 Basic official food basket purchased with minimum wage in Brazil, 1996-2015
Source: DIEESE database
Considering that there was a raise in the minimum wage and that the dimension of poverty is
measured in terms of the minimum wage (and taking population growth into consideration), we
conclude that the number of families now below the poverty line has increased.
According to studies by Dedecca et. al. (2012), considering the amount equivalent to half of the real
minimum wage per capita as the bottom line, the number of families now below the poverty line has
increased from 13,043,345 in 2001 to 15,812,850 in 2011.
However, considering a poverty line of BRL 70,00 per capita in real terms, the same measure adopted
recently for the planning of the “Brasil sem Miséria” project, which represents a figure very close to
the estimate of USD 1.25 per capita per day, we conclude that the number of families in extreme
poverty conditions has dropped. In that case, the total number of families has reduced from 4,900,116
to 3,689,571 between 2001 and 2009 (Brazilian Institute of Geography and Statistics, IBGE).
Another important indicator was the reduction of wealth concentration, especially because significant
changes had not yet been observed in relation to this indicator in the last decades. In fact, on the
contrary, with the hyperinflation in the 1980s and early 1990s, the concentration of income and
wealth was aggravated in Brazil. Figure 24 shows a clear trajectory leading to less concentration in
labour income. The information about wealth concentration in general does not point to an acute
reduction, although the tendency is maintained.
According to preliminary calculations provided by Dedecca (2012), the Gini Index for all levels of
income declined from 0.594 to 0.546 between 2001 and 2009. The concentration of total income
among the poorest 10% rose from 0.4% to 0.6%, while the concentration of total income among the
0
0.5
1
1.5
2
2.5Ja
n-9
6
Sep
-96
May
-97
Jan
-98
Sep
-98
May
-99
Jan
-00
Sep
-00
May
-01
Jan
-02
Sep
-02
May
-03
Jan
-04
Sep
-04
May
-05
Jan
-06
Sep
-06
May
-07
Jan
-08
Sep
-08
May
-09
Jan
-10
Sep
-10
May
-11
Jan
-12
Sep
-12
May
-13
Jan
-14
Sep
-14
May
-15
Jan
-16

35
richest 10% was reduced from 42.7% to 38.9%. The following diagram presents the evolution of the
Gini Index by 2014.
Figure 25 Gini Index of real income of all work undertaken by employed citizens who are at least 10
years old
Source: CEPAL Databases
Conclusions
Brazil’s experience shows that agricultural policy has acted via market intervention, although the
authorities have not conducted an active policy in this direction in the last two decades. There are no
direct mechanisms of granting subsidies to specific producers, as this policy has not been used since
the liberalisation of Brazil’s markets in the early 1990s.
During this period market intervention also decreased, either because the high inflation of the early
1990s could not be fought with intervention in the markets, or because later during the two Cardoso
governments (1995-2002) and the two Lula governments (2003-2010) volume stocks accumulated by
CONAB would not allow for greater intervention. In practice, the government food stocks build-up
policy was driven to sustain the prices of producers and not to reduce the prices charged by
wholesalers or by suppliers of food raw materials.
From 2003 guidelines were also introduced establishing procedures for the formation of commodity
stocks starting from purchases from family farming and aiming the donation to social institutions or
school feeding. Despite the impact generated by this policy on the income of producers, trading
volume has not been sufficient to affect prices.
Regarding the formation of prices for agricultural products on the domestic market, the stock
management policy did not allow the government to handle a higher level of intervention. Similarly,

36
this power of intervention is not available to any agent of the private sector, given the dispersion of
production and storage system.
In Brazil, the network of public warehouses is very limited, and the major part of it is leased to the
private sector. Analysing the Brazilian regulatory stocks, it appears that in recent decades the mode
option has grown, overcoming the physical stocks held by the government. As Brazil is a major
producer, crises due to availability problems are rare. Comparison of domestic prices with
international ones shows that there is no necessary and direct adhesion between the external price
changes and what happens domestically. The transmission of the recent rise in international prices
showed that it was completed due to internal intercession as tax exemptions and moves in the
exchange rate.
From the point of view of better management of agricultural policies, it would be better to have a
combination of public stocks, private and financial options. This would give greater agility to the
government and greater transparency regarding the trends for the producer.
Regarding the use of public food stocks for social purposes, Brazil has the Bolsa Família programme
that serves 44 million people (14 million households) in a cash transfer system. There is no guarantee
that these resources are being used to purchase food, but surveys conducted by the Ministry of Social
Development and NGOs show that more than 80% goes to food consumption, consistent with the
income elasticity of that range of consumers. The operation of the Bolsa Família programme over the
past 10 years has shown that the use of debit cards spread, reducing transaction costs. Previous
experiences demonstrate that the distribution of food baskets was not efficient and suffered several
deviations, increasing their costs which ultimately paralysed them (LAVINAS & VARSANO 1997), in
addition to logistical problems. The beginning of the “Zero Hunger” (Fome Zero) Programme with the
enthusiastic flood of donations showed how difficult it is to manage the logistics of food in natura.
Currently, the Bolsa Família programme is considered an example and inspiration for other programs
in Latin America. At the beginning of this decade the Economic Commission for Latin America and the
Caribbean had implemented similar programmes in 18 countries in the region that benefitted more
than 25 million households, or 19% of the Latin American and Caribbean population at a cost around
0.4% of the regional GDP (CECCHINI, MADARIAGA, 2011: 7).
Alongside the conditional cash transfer programmes, distributing through programmes such as PNAE
and PAA proved optimal solutions. This is a solution with low focusing error which acts synergistically
with education and health programmes, enhancing the results of food security for the medium and
long term. This architecture of the cash transfer programmes has enhanced their sustainability despite
political and economic fluctuations in Brazil.
In the past the large network of philanthropic institutions accredited to provided social assistance was
very much needed because government didn’t have an efficient and centralized system. Nowadays
this role is played by PAA but, apart from the supply and logistics problems, there were problems with
the quality of food donation. As the programme promotes a rotation in public stocks, naturally the
food which is donated is always the oldest one in the public warehouses. Sometimes, the donated
food was of poor quality (old and contaminated) and always was not enough to meet demand.

37
The social policy developments in Brazil have shown that the so-called institutional market is being
amplified since the purchase programmes are being managed by federal and state facilities such as
universities, prisons and hospitals far beyond the traditional donations to philanthropic institutions.
In this sense more food stocks, in physical terms, are going to be demanded. On the other hand,
programmes to provide individual food donations in natura are rejected, except in cases of public
calamity. Attention then turns to the issue of institutional purchase programmes, and in this case
Brazil does need more stocks in good condition.

38
References
ABREU, M.P.; MEDEIROS, M.C.; WERNECK, R.L.F. Formação de preços de commodities: padrões de vinculações dos preços
internos aos externos. Rio de Janeiro: PUCRJ, 2003. 51p. (Texto para discussão, 474). Disponível em:
<www.economia.puc- rio.br/mpabreu/pdf/TD474.pdf>. Acesso em: 12 jul. 2011.
ALMEIDA, ANDRÉ MARTINS DE A. Política de Garantia de Preços Mínimos – PGPM e a atuação da Companhia Nacional de
Abastecimento – CONAB no período após a abertura comercial: mudança institucional e novos instrumentos /
André Martins de Almeida. Piracicaba, 2014. 206 p: il.
ANDRADE, L. A.; REIS, J. M. L. A política de garantia de preços mínimos e os programas sociais de abastecimento. Revista de
Política Agrícola, Brasília, v. 2, n. 3, p. 15-17, 1993.
BELIK, WALTER. O Financiamento da Agropecuária Brasileira no Período Recente. Texto para Discussão (IPEA. Brasília)., v.1,
p.1 - 62, 2015.
_____________ and Luiz Fernando de Oriani. O financiamento da produção agrícola na década de 90: Ajustamento e crise
In: Políticas públicas e Agricultura: Estado e desenvolvimento rural no Brasil do final do século XX.1 ed. Porto Alegre
: UFRGS, 2001, v.1, p. 95-120.
_____________and CUNHA, ALTIVO R.A. DE ALMEIDA. Abastecimento no Brasil: o desafio de alimentar as cidades e
promover o Desenvolvimento Rural. Políticas públicas de desenvolvimento rural no Brasil / Organizadores Catia
Grisa e Sergio Schneider. – Porto Alegre: Editora da UFRGS, 2015.
_____________and ROSA DE SOUZA, L R (2009) Algumas Reflexões sobre os Programas de Alimentação Escolar na América
Latina. Planejamento e Políticas Públicas IPEA no. 33 jul/dez 2009, pp103-122.
BEZERRA, ILANA NOGUEIRA; SOUZA, AMANDA DE MOURA; PEREIRA, ROSANGELA ALVES SICHIERI, ROSELY. Consumption of
foods away from home in Brazil. Rev Saúde Pública 2013;47(1)
CECCHINI, Simone and MADARIAGA, Aldo. Programas de transferencias condicionadas: Balance de la experiencia reciente
en América Latina y el Caribe. Santiago del Chile, CEPAL / UN, 2011
BRASIL. Indicadores da Agropecuária / Companhia Nacional de Abastecimento. Brasília, Ano XXV, n. 4, abr. 2016, p. 01-116
CUNHA, ALTIVO R.A. DE ALMEIDA. Documento técnico contendo a avaliação da contribuição de programas de compras
governamentais para a inserção comercial dos produtos da agricultura familiar no Brasil, com destaque para os
produtos hortifrutícolas. FAO/UTF/BRA/083/BRA - “Nova Organização produtiva e social da agricultura familiar
brasileira – uma necessidade”, Brasília, julho de 2013
DEDECCA, C. S. et al. A Questão Social na Primeira Década do Século XXI: Conquistas e Desafios In: Avaliação de políticas
públicas: reflexões acadêmicas sobre o desenvolvimento social e o combate à fome.1 ed. Brasília : MDS, 2014, v.3,
p. 90-117
DELGADO, GUILHERME C, CONCEIÇÃO. Políticas de preços agrícolas e de estoques de alimentos. Revista de Política Agrícola.
Ano XIV – Nº 3 – Jul./Ago./Set. 2005
FGV / CNA Fundação Getúlio Vargas, Instituto Brasileiro de Economia e Confederação da Agricultura e Pecuária do Brasil
(2010) Quem produz o que no campo: quanto e onde II. Brasília, 2010
LAVINAS, L.; VARSANO, R. Programas de Garantia de Renda Mínima e Ação Coordenada de Combate à Pobreza. IPEA, Texto
para Discussão no. 534, 1997.

39
MINISTÉRIO DO DESENVOLVIMENTO AGRÁRIO. Secretaria da Agricultura Familiar; Instituto Via Pública Projeto Nutre SP:
análise da inclusão da agricultura familiar na alimentação escolar no estado de São Paulo./Maria Amélia Jundurian
Corá; Walter Belik , organizadores --São Paulo: Instituto Via Pública, 2012.
RICARDO, Camila Z.; CLARO, Rafael Moreira. Custo da alimentação e densidade energética da dieta no Brasil, 2008-2009. Cad
Saude Publica; 28(12): 2349-2361, dez. 2012.
SCHWANTES, FERNANDA. Política de garantia de preços mínimos no Brasil – uma avaliação dos custos sociais e
orçamentários para arroz e milho no período de 1987 a 2013. Tese Doutorado. Escola Superior de Agricultura “Luiz
de Queiroz”. Universidade de São Paulo. Piracicaba. 2015139 p. : il.
MAIA, GUILHERME BAPTISTA DA SILVA MAIA ARTHUR DE REZENDE PINTO CRISTIANE YAIKA TAKAOKA MARQUES DANIELLE
DIDIER LYRA FÁBIO BRENER ROITMAN. Panorama da armazenagem de produtos agrícolas no Brasil. Revista do
BNDES 40, dezembro 2013.
MALUF, RENATO S. E SPERANZA, JULIANA S. Volatilidade dos preços internacionais e inflação de alimentos no Brasil: fatores
determinantes e repercussões na segurança alimentar e nutricional. Brasília, DF: MDS; Secretaria Nacional de
Segurança Alimentar e Nutricional, 2013. 148 p.
NOGUEIRA JR., S.; TSUNECHIRO, A. Produção agrícola e infraestrutura de armazenagem no Brasil. Informações Econômicas,
v. 35, n. 2, p. 7-18, fev. 2005
SOUZA, AMANDA DE M; PEREIRA, ROSANGELA A; YOKOOI LEVY EDNA M RENATA B; SICHIERI, ROSELY. Most consumed
foods in Brazil: National Dietary Survey 2008-2009. Rev Saúde Pública 2013;47(1 Supl)
YUBA, TANIA YUKA; SARTI, FLÁVIA MORI; CAMPINO, ANTONIO CARLOS COELHO; CARMO HERON CARLOS ESVAEL DO.
Evolution of the relative prices of food groups between 1939 and 2010 in the city of Sao Paulo, Southeastern Brazil.
Rev Saúde Pública 2013; 47(3):1-10.
Databases accessed
http://faostat.fao.org
http://www.conab.gov.br/
http://seriesestatisticas.ibge.gov.br/
http://www.sidra.ibge.gov.br/
https://www.dieese.org.br/icv/
http://aplicacoes.mds.gov.br/sagi-data/
www.ipeadata.gov.br