
Stunting Takes Over in 1000 Days Chronic Malnutrition Stunting is Irreversible at 2 years old.

FOOD SECURITY AND STUNTING IN CHILDREN
UNDER FIVE IN THE DEVELOPING WORLD
by
Asim Farooq Raja Bachelor of Medicine and Surgery, University of Health Sciences,
Pakistan (2006)
PROJECT SUBMITTED IN PARTIAL FULFILLMENT OF THE REQUIREMENTS FOR THE DEGREE OF
MASTER OF PUBLIC HEALTH
In the Faculty of Health Sciences
© Asim Farooq Raja 2010 SIMON FRASER UNIVERSITY
Fall 2010
All rights reserved. However, in accordance with the Copyright Act of Canada, this work may be reproduced, without authorization, under the conditions for Fair Dealing. Therefore, limited reproduction of this work for the purposes of private
study, research, criticism, review and news reporting is likely to be in accordance with the law, particularly if cited appropriately.
ii
APPROVAL
Name: Asim Farooq Raja Degree: Master of Public Health Title of Thesis: Food Security and Stunting in Children Under Five
in the Developing world Examining Committee: Chair Dr. Zabrina Brumme Assistant professor, Faculty of Health Sciences
______________________________________
Dr. Tim Takaro Senior Supervisor Associate Professor
Faculty of Health Sciences
___________________________________ Dr. Ryan Allen
Supervisor Assistant Professor
Faculty of Health Sciences _________________________________________ External Examiner
Dr. Nicole Berry Assistant Professor, Faculty of Health Sciences, Simon Fraser University
Date of Defence: November 3rd, 2010

Last revision: Spring 09
Declaration of Partial Copyright Licence The author, whose copyright is declared on the title page of this work, has granted to Simon Fraser University the right to lend this thesis, project or extended essay to users of the Simon Fraser University Library, and to make partial or single copies only for such users or in response to a request from the library of any other university, or other educational institution, on its own behalf or for one of its users.
The author has further granted permission to Simon Fraser University to keep or make a digital copy for use in its circulating collection (currently available to the public at the “Institutional Repository” link of the SFU Library website <www.lib.sfu.ca> at: <http://ir.lib.sfu.ca/handle/1892/112>) and, without changing the content, to translate the thesis/project or extended essays, if technically possible, to any medium or format for the purpose of preservation of the digital work.
The author has further agreed that permission for multiple copying of this work for scholarly purposes may be granted by either the author or the Dean of Graduate Studies.
It is understood that copying or publication of this work for financial gain shall not be allowed without the author’s written permission.
Permission for public performance, or limited permission for private scholarly use, of any multimedia materials forming part of this work, may have been granted by the author. This information may be found on the separately catalogued multimedia material and in the signed Partial Copyright Licence.
While licensing SFU to permit the above uses, the author retains copyright in the thesis, project or extended essays, including the right to change the work for subsequent purposes, including editing and publishing the work in whole or in part, and licensing other parties, as the author may desire.
The original Partial Copyright Licence attesting to these terms, and signed by this author, may be found in the original bound copy of this work, retained in the Simon Fraser University Archive.
Simon Fraser University Library Burnaby, BC, Canada
iii
ABSTRACT
Over the past decades, the concept of food security has evolved. The
recent concept focuses on three pillars: food availability, food access and food
use & utilization. This study used this broader definition of food security to
identify the predictors of stunting among children in the developing world. Two
stepwise regression models were run with national prevalence of stunting in
children under 5 as the main outcome variable and 18 food security indicators as
potential independent variables. The EM method was used to impute the missing
values for the countries lacking data for the indicators. The models were also
cross-validated. The models explained more than 67 % of the variance of
stunting in the developing world. In both the models, the predictors of stunting
were from all the three pillars of food security. This study highlights the
importance of addressing all the pillars of food security to understand and tackle
the stunting among children.
Keywords: Under-nutrition, stunting, food security, food availability, food
access, food use and utilization

iv
DEDICATION
To my parents

v
ACKNOWLEDGEMENTS
I owe my deepest gratitude to my supervisors, Dr. Tim Takaro and Dr.
Ryan Allen, whose encouragement, guidance and support from the initial to the
final level enabled me to develop an understanding of the subject.
I am also heartily thankful to my friends Larissa Coser, Sirad Deria, Chris
Aloia, Lisa Lazarus and Lauren Wallace who supported me in completion of this
project.
Special thanks are owed to my parents, whose support throughout my
education years has been unbroken, and multi-faceted.
vi
TABLE OF CONTENTS
Approval........................................................................................................................... ii
Abstract........................................................................................................................... iii
Dedication ....................................................................................................................... iv
Acknowledgements ........................................................................................................ v
Table of Contents ........................................................................................................... vi
List of Tables ................................................................................................................ viii
List of Figures ................................................................................................................ ix
1: INTRODUCTION .......................................................................................................... 1 1.1 INTRODUCTION & BACKGROUND TO THE PUBLIC HEALTH PROBLEM .......... 1 1.2 PURPOSE ................................................................................................................ 2 1.3 RESEARCH QUESTION .......................................................................................... 3 1.4 LITERATURE REVIEW ............................................................................................ 3
1.4.1 Child under-nutrition ...................................................................................... 3 1.4.2 Stunting ......................................................................................................... 4 1.4.3 Food security................................................................................................. 8
2: METHODS .................................................................................................................. 11 2.1 CONCEPTUAL FRAMEWORK ............................................................................... 11 2.2 DATA SOURCES AND VARIABLE DEFINITIONS ................................................. 17 2.3 STUDY POPULATION............................................................................................ 19 2.4 DATA ANALYSIS .................................................................................................... 21
3: RESULTS ................................................................................................................... 24
4: DISCUSSION .............................................................................................................. 33 4.1 FOOD CONSUMPTION.......................................................................................... 33 4.2 DIET DIVERSIFICATION INDEX ............................................................................ 34 4.3 SHARE OF FOOD IMPORTS IN TOTAL FOOD CONSUMPTION ........................ 35 4.4 STILL BREAST FEEDING (20 - 23 MONTHS) ....................................................... 35 4.5 AVERAGE ANNUAL INFLATION RATE ................................................................. 36 4.6 IMPROVED SANITATION COVERAGE ................................................................. 37 4.7 INEQUALITY IN DIETARY ENERGY CONSUMPTION ......................................... 37 4.8 FURTHER IMPLICATIONS .................................................................................... 38 4.9 LIMITATIONS ......................................................................................................... 41

vii
5: CONCLUSION ............................................................................................................ 43
REFERENCES ................................................................................................................ 44
APPENDICES ................................................................................................................. 52 APPENDIX A ................................................................................................................... 52 APPENDIX B ................................................................................................................... 57 APPENDIX C .................................................................................................................. 58 APPENDIX D .................................................................................................................. 60
viii
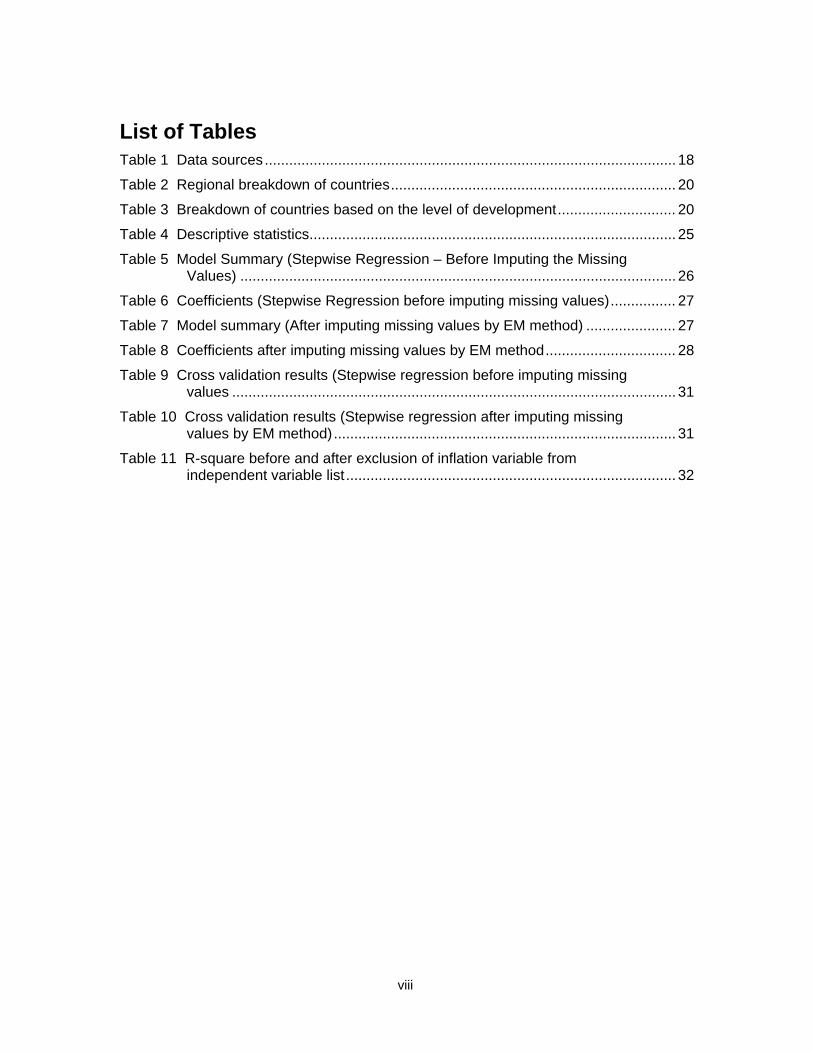
List of Tables Table 1 Data sources ..................................................................................................... 18
Table 2 Regional breakdown of countries ...................................................................... 20
Table 3 Breakdown of countries based on the level of development ............................. 20
Table 4 Descriptive statistics .......................................................................................... 25
Table 5 Model Summary (Stepwise Regression – Before Imputing the Missing Values) ........................................................................................................... 26
Table 6 Coefficients (Stepwise Regression before imputing missing values) ................ 27
Table 7 Model summary (After imputing missing values by EM method) ...................... 27
Table 8 Coefficients after imputing missing values by EM method ................................ 28
Table 9 Cross validation results (Stepwise regression before imputing missing values ............................................................................................................. 31
Table 10 Cross validation results (Stepwise regression after imputing missing values by EM method) .................................................................................... 31
Table 11 R-square before and after exclusion of inflation variable from independent variable list ................................................................................. 32
ix
List of Figures
Figure 1 UNICEF Conceptual framework of stunting (UNICEF, 1990) .......................... 11
Figure 2 Conceptual framework - Stunting among under five and Food security .......... 15
Figure 3 Percentage of stunted children under five years (UNICEF, 2008) ................... 19
Figure 4 Number of stunted children under five years (UNICEF, 2008) ........................ 19
Figure 5 Graphical presentations of bi-variate association between stunting and the indicators that came out as predictors in the two models ......................... 30

1
1: INTRODUCTION
1.1 INTRODUCTION & BACKGROUND TO THE PUBLIC HEALTH PROBLEM
In order to achieve a healthy, productive and prosperous population,
maintenance of food security is of vital significance (Nord, 2009). Limited or
uncertain access to food is hazardous especially for the growing children
because inadequate nutrition negatively affects their growth and development,
health and future progress in life and even survival (UNICEF, 2009). Under-
nutrition is the major consequence seen in children due to food insecurity (Gray
et al., 2006). Under-nutrition is defined as “being underweight for one’s age, too
short for one’s age (stunting), dangerously thin for one’s height (wasting) and
deficient in vitamins and minerals (micronutrient deficiencies)” (UNICEF, 2009,p.
4). In 2008, an estimated 195 million children under the age of five were short for
their age, 129 million children were underweight for their age and 26 million
children were thin for their height (UNICEF, 2009). Africa and Asia account for
the majority of this global burden of child under-nutrition (UNICEF, 2009).
Interventions implemented in the last two decades have led to a decline in
the global prevalence of under-nutrition (UNICEF, 2009). However, most of this
progress is a result of marked reduction in under-nutrition prevalence in China
(UNICEF, 2009). Apart from that, progress has remained slow especially for
Africa where the stunting and underweight prevalence have declined just three
2
and four percent respectively since 1990 (UNICEF, 2009). Despite this reduction
in the prevalence, the number of undernourished children has actually increased
due to an increase in the world population over the time (UNICEF, 2009).
The prevalence of under-nutrition among children under five is vital in
assessing the progress regarding the first millennium development goal that aims
at eradicating poverty and hunger. Failure to achieve a progress in the first MDG
makes it difficult to succeed in other millennium development goals especially
MDG 2, achieving primary universal education, and MDG 4, reducing child
mortality (UNICEF, 2009).
1.2 PURPOSE
The concept of food security has evolved over time. The recent concept
focuses on three main pillars: food availability, food access and food use and
utilization (FAO, 2003). This concept of food security is an outcome of
international food conferences and summits held by Food and Agricultural
Organization since 1974 (FAO, 2003). These pillars of food security encompass
a wide range of factors that can be helpful in understanding the prevalence of
stunting globally. The child under-nutrition studies conducted in the past have not
utilized the broader definition of the food security. Analyzing the relationship of
stunting with food security pillars, will be useful in pointing out important areas
that have been either neglected or overlooked in the past by major international
organizations dealing with the issues of food security and child under nutrition,
which include UNICEF, FAO, and WFP.
3
The present paper is the first attempt to determine the associations
between stunting and the selected food security indicators from each of the three
pillars of food security.
1.3 RESEARCH QUESTION
The research questions for this study are as follows:
1. Which food security indicators are predictors of national prevalence of
stunting in children under five in the developing countries?
2. Which pillar of food security best represents the factors that predict
stunting?
1.4 LITERATURE REVIEW
1.4.1 Child under-nutrition
Child under-nutrition is a major public health problem in low and middle-
income countries of the world (UNICEF, 2008). Child under-nutrition results from
lack of an adequate and nutritious diet, improper care and infections (UNICEF,
2008).
In the early 1970s, Waterloo proposed a classification for child under-
nutrition that led to origin of the concept of stunting and wasting (Victoria, 1992).
According to the Waterloo classification, stunting (inadequate height for age)
resulted from chronic under-nutrition compared to wasting (inadequate weight for
height) which was a consequence of acute food shortage (Shrimpton et al.,
2001). The classification also revealed that children who are chronically
undernourished could also develop acute under-nutrition (acute on chronic

4
nutrition), a condition in which both stunting and wasting would be present
(Shrimpton et al., 2001).
A committee of the World Health Organization initially approved the
Waterloo classification in 1977 (Victoria, 1992). However, in the next decade the
WHO showed slight concern on the interpretation of Waterloo classification
(Victoria, 1992). A WHO paper on the use of anthropometric indicators in 1986
stated that "terms such as acute under-nutrition for wasting, chronic under-
nutrition for stunting and acute-on-chronic for the combination of wasting plus
stunting, are not direct observations but deductions which may not always be
correct" (Victoria, 1992, para. 1).
Currently, three anthropometric indicators used to assess child under-
nutrition include stunting, wasting and being underweight (Reinhard, 2001).
Unlike stunting and wasting, the measure of being “underweight” does not give
any indication about the presence of either acute or chronic under-nutrition
(Reinhard, 2001).
1.4.2 Stunting
Stunting is usually defined as, “the height for age below minus two
standard deviations from the median height for age of the standard reference
population” (UNICEF, 2009, p. 4).
Statistics indicate that stunting (195 million) is a bigger global burden than
wasting (26 million) and underweight (129 million) (UNICEF, 2009). In 2008, 47
% of children in Africa and 36 % of children in Asia had a low height for their
5
respective age (UNICEF, 2009). These two continents account for more than 90
% of the children suffering from stunted growth worldwide (ibid). In addition, in
nine developing countries (Afghanistan, Yemen, Guatemala, Timor-Leste,
Burundi, Madagascar, Malawi, Ethiopia and Rwanda) more than 50 % of
children, under the age of five, have stunted growth (UNICEF, 2009). Moreover,
in countries with large populations, this high prevalence of stunting translates into
a huge number of children with stunted growth. For instance, in India a stunting
prevalence of 48 % equates to 61 million chronically undernourished children
(UNICEF, 2009).
Research reveals that stunting of growth can occur during the second
trimester of gestation due to an impaired nutrient supply to the fetus and can
negatively affect fetal tissue growth (Branca, 2002). Postnatal stunting starts
soon after birth and continues up to two years of life (Frongillo, 1999). Though
the greatest degree of stunting occurs in first two years of life, research shows
that the stunting can progress in school age years (Friedman et al., 2005).
The adverse consequences of stunting on a nation are severe and long
lasting. Children who have stunted growth show delays in motor and cognitive
development (Chilton, 2007). Stunted children are more prone to develop
infectious diseases at an early age, which can further aggravate the growth
faltering (UNICEF, 2009). Moreover, those stunted children who survive early life
infectious diseases are at a higher risk of developing metabolic disorders in later
life (Victoria, 2008) This sequence has been seen in countries where rates of

6
underweight children declined while prevalence of stunting remained high
(UNICEF, 2009).
Risk of giving birth to low weight children is high in case of mothers who
have suffered from chronic under-nutrition in their early life (UNICEF, 2009).
Studies conducted in the developing countries have found an association
between short maternal stature and offspring stunting (Ozaltin et. al., 2010). In
addition, a study found that offspring stunting is also associated with paternal
stature (Espo et al., 2002, Ozaltin et. al., 2010). Epigenetics (DNA methylation &
histone modifications) explains this continuation of the stunted growth in the
future generations (Ozaltin et. al., 2010).
Studies elsewhere have shown poor school performance in children and
adolescents who suffered from stunting in early life (Mendez & Adair, 1999). In
addition, some evidence exist that stunted children are more prone to develop
anxiety, depression, low self-esteem and aggressive behaviour in their late
adolescence (Walker et al., 2007). Poor school performance reduces the
chances of acquiring appropriate earning capacity later in life (Victoria, 2008).
Thus, a higher prevalence of stunted children per capita can result in a lower
human capital per capita (Victoria et al., 2008). In sum, high rate of stunting can
result in a poor country with reduced capacity and strength to grow and develop
which further increases the chances of under-nutrition.
The adverse health effects of stunting are irreversible once they have
developed (Shrimpton et al., 2001). This means that the interventions
implemented once the growth faltering has occurred have, little significance.

7
Literature reveals that a number of indicators have been analyzed as
predictors of stunting in wide range of settings. A majority of the studies have
looked at the socioeconomic predictors of stunting in children aged less than five
year. These studies have found higher stunting rates among children belonging
to poor households (El Taguri et al., 2008, Ramli et al., 2009, Janevic et al.,
2010). A population-based study conducted in South Africa found a negative
association between prevalence of stunting among preschool children and
employment status of the parents (Willey et al., 2009)
Research shows that factors like low education level of parents
(Taguri et al., 2008), inadequate child feeding practices (Espo et al., 2002,
Anderson et al., 2010), large household size (Sereebutra et al, 2006, Das et
al.,2008), poor household sanitation and drinking water measures and the
resulting infections (Bloss et al., 2004, Pongou et al., 2006, Medhin et al., 2010)
and lack of proper access to health (Ramli et al., 2009) are associated with
stunting in children aged less than five years. Inverse association between
maternal literacy rates and child stunting has been seen in countries from
different regions of the world such as Serbia (Janevic et al, 2010), Guatemala
(Lee et al., 2010) South Africa (Willey et al., 2009) and Bangladesh (Das et al.,
2008). Low diet diversity is another established risk factor of stunting seen in low
and middle-income countries (Arimond and Ruel, 2004, Sawadogo et al., 2006,
Rah et al., 2010).
8
1.4.3 Food security
Food security is a complex and flexible phenomenon. The definition has
evolved considerably over the last three to four decades. Literature reveals
almost 200 different definitions of food security (ODI, 1997). The right to
adequate food was included into the Universal Declaration on Human Rights for
the first time in 1948 at the forum of the United Nations (Reinhard, 2001). It is a
fundamental requirement of every individual, community or a nation to be food
secure in order to survive.
The concept of food security gained global attention after massive food
shortages worldwide in the early 1970’s (Reinhard, 2001). This led to the first
World Food Conference in 1974 to understand the phenomenon of food security
and its implications (Reinhard, 2001). Initial understandings of food security were
mainly limited to ensuring food availability and stabilizing food prices at national
and international levels (FAO, 2003). This is evident from the food security
definition at the 1974 World Food Summit, which is:
“Availability at all times of adequate world food supplies of basic foodstuffs to
sustain a steady expansion of food consumption and to offset fluctuations in
production and prices” (FAO, 2003, p. 27).
In the following few years, it was realized that the presence of sufficient
amount of food was not enough to overcome food insecurity. Instead, it became
understood that available food must be accessible to the people in need (FAO,
2003). As a result, FAO redefined food security in 1983 as:

9
“Ensuring that all people at all times have both physical and economic access to
the basic food that they need”. (FAO, 2003, p.27)
With the passing time, the concept of food security went through further
reconstruction. Focus broadened to availability and access to food, which is
nutritious and is enough for “an active and healthy life” (FAO, 2003). In addition,
the access to food was further broken down into physical, social and economic
access. The recent definition of food security is as follows:
“Food security is a situation that exists when all people, at all times, have
physical, social and economic access to sufficient, safe and nutritious food that
meets their dietary needs and food preferences for an active and healthy life”
(FAO, 2003, p. 28).
Food security has now become a multidimensional phenomenon, which
makes it difficult to measure. It now encompasses a wide range of food related
and non-food related factors like sustainability in agricultural production, import-
export balance, economic progress (WHO, 2009) climate change and natural
disasters (FAO, 2005).
Despite the complexity of the food security phenomenon, it is now widely
accepted that food security is built on three pillars: food availability, food access
and food use and utilization (FAO, 2006). International organizations like WHO,
USAID and FAO clearly mention food availability, food access and food utilization
as the main dimensions of food security, on their respective websites and
publications. The Food and Agricultural Organization has defined these three
pillars as follows,

10
Food availability: “The availability of sufficient quantities of food of
appropriate quality, supplied through domestic production or imports (including
food aid).” (FAO, 2006)
Food Access: “Access by individuals to adequate resources (entitlements)
for acquiring appropriate foods for a nutritious diet. Entitlements are defined as
the set of all commodity bundles over which a person can establish command
given the legal, political, economic and social arrangements of the community in
which they live (including traditional rights such as access to common
resources). “(FAO, 2006)
Food Utilization: “Utilization of food through adequate diet, clean water,
sanitation and health care to reach a state of nutritional well-being where all
physiological needs are met.” (FAO, 2006)
Generally, food availability explains the supply side of food while the
demand side determines food access (World Bank, 2008). However, these two
dimensions are not completely separate because having enough money to buy
adequate nutritious food is determined by not just one’s income, but also by the
price of the food (Staatz, 2009). Thus, fluctuations in food prices at national and
international levels influence both food availability and food access.

11
2: METHODS 2.1 CONCEPTUAL FRAMEWORK
The conceptual framework for child under-nutrition devised by UNICEF in
1990 considers food security, maternal health & childcare and health services
and environment as the basic underlying factors affecting the stunting rates
(Shrimpton et al., 2001). The maternal health & childcare is further dependant on
economic, social and political factors (Shrimpton et al., 2001). Studies in the past
have used this model to identify predictors of stunting.
Figure 1 UNICEF Conceptual framework of stunting (UNICEF, 1990)
Provided the broadening of the concept of food security, the factors
affecting the rates of under-nutrition and stunting seem to be strongly
Child under-nutrition
Food security
Maternal health & Child Care
Health Services & Environment
Socio-economic and political factors

12
interrelated. Indicators that determine the socioeconomic stability and health of
households or nations, also influence their food security and all its dimensions
whether directly or indirectly.
Food security pillars envelop a wide range of factors that can possibly
influence the national prevalence of stunting. Studies in the past have not
analyzed the linkage of stunting with the food security pillars and may have
missed certain important factors. The complexity of the food security
phenomenon might have limited this analysis. In addition, child-stunting studies
in the past have focused mostly on household food security and hence were
conducted in one setting or jurisdiction. Household food security is an essential
component of food security but does not address the macro level implications of
food security. For instance, factors like food price fluctuations, per capita food
production and consumption that influence both food availability and access,
cannot be addressed by just focusing on household food security. Apart from
addressing pillars of food security, this study is an attempt to identify predictors of
stunting using population level data from all the developing countries that have
stunting prevalence of greater than or equal to 1 %.
Selection of Indicators- Stunting was chosen as main outcome variable because,
• Stunting is a bigger global burden compared to wasting and underweight
(UNICEF, 2008)
• Stunting reflects chronic food insufficiency (Shrimpton et al., 2001)
13
• Unlike wasting and underweight, the adverse health effects of stunting are
irreversible (UNICEF, 2008)
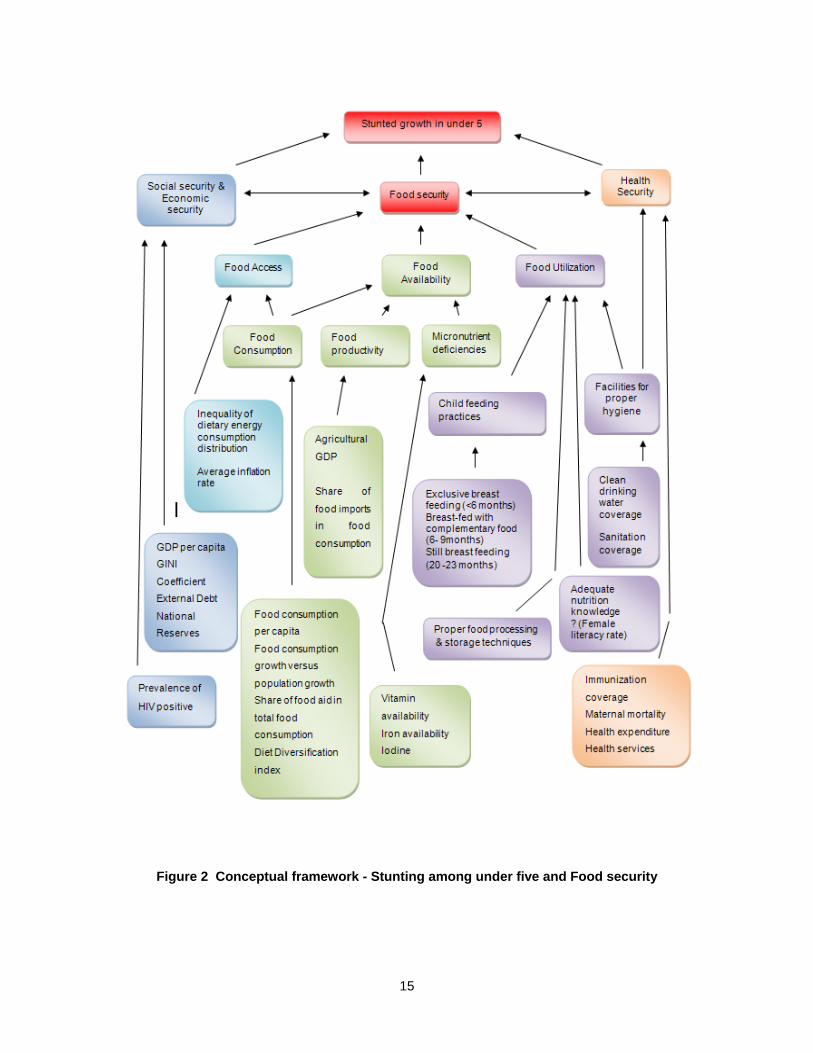
The complex nature of food security and its pillars makes it difficult to
establish indicators that address all the dimensions. The definitions of food
security pillars were utilized to identify different food security indicators. However,
lack of a reliable data on certain aspects of food security issues limited the
selection of food security indicators.
All matters, which relate to the physical presence of food within an area,
determine the availability of food. These include production of food, food trade,
domestic food reserves and food aids. Consumption of food per capita and diet
diversification index depict the picture of availability of nutritious food in a
country.
Enhancing agricultural development in developing countries has received
a lot of attention at the World Food Summits to tackle under-nutrition and food
insecurity (FAO, 2008). Indicators like the agricultural share of GDP and share of
food imports in total food consumption shed light on the agricultural sustainability
of the respective jurisdiction.
Indicators like vitamin A intake, iron availability and iodized salt
consumption were selected because they are the most common micronutrient
deficiencies among children in the developing world (UNICEF, 2009). In order to
ensure food availability at all times, it is vital to keep the pace of domestic food
production along with the population growth. The average annual rate of dietary
14
energy consumption explains the effect of population growth on food
consumption per person in the respective area.
Over the years, food aids have remained an important strategy to increase the
availability of food in least developed countries. In order to see the impact of food
aids on stunting, share of food aid in total food consumption was selected under
the rubric of food availability.
Food access is a broad term and includes all matters whether legal,
political, social or economic which affect in having an adequate nutritious diet.
Indicators selected in this study aim mostly at the economic aspects of food
access. Indicators under the rubric of food access include inequality in dietary
energy consumption and an average annual inflation rate for the respective
countries.
Food utilization highlights all the activities and facilities which are not only
required for intake of a nutritious food but also ensure the physiological well
being of an individual. These include hygienic ways of food processing and
preparation, healthy feeding practices especially for children, adequate
knowledge of food nutrition and hygiene at the level of household, clean water,
proper sanitation facilities and proper health care.
15
Figure 2 Conceptual framework - Stunting among under five and Food security
16
Data could not be found for any indicators that specify the food processing
and storage in the particular population. Female literacy rate was used as
surrogate for adequate knowledge of food nutrition and hygiene since the
mothers are often primarily responsible for all the matters related to the hygiene
and nutrition of children. Improper breast-feeding practices, unsafe water and
inadequate sanitation can lead to illnesses like diarrhoea that can negatively
influence the growth of the child (UNCEF, 2009). As a result, breast feeding
indicators, improved sanitation coverage and improved drinking water coverage
were added to the list of food use and utilization indicators.
Over the years, HIV prevalence has been related to under-nutrition. HIV
infected regions are more vulnerable to food crises since HIV infected people are
in greater need of an adequate nutritious diet (Baro, 2006) and often are too sick
to contribute to food production . Studies conducted in the developing world
reveal that children born with HIV infection are more vulnerable to stunting
compared to HIV negative children (WHO, 2005). The growth faltering which
results from being HIV positive has been seen well before the child has suffered
from any opportunistic infections (WHO, 2005). High HIV morbidity and mortality
in a region or a family not only diverts the public or households assets to the care
of infected individuals but also reduces the overall productivity of the family or
region and increases the dependency ratio within the family or region (Baro,
2006). A huge number of children in countries with high HIV prevalence are
orphans due to the death of either one or both of the parents. Thus a higher
17
prevalence of HIV in a region raises the threat of economic insecurity and hence
the food insecurity for the region or household (CHGA, 2008).
2.2 DATA SOURCES AND VARIABLE DEFINITIONS
The study design was cross-sectional and in some ways ecological, as
national-level data on stunting and food security measures were examined.
Consistent with the objective of the current study, the main outcome measure
was prevalence of stunting in children under-five. All the independent indicators
were continuous variables with the exception of vitamin A availability and share
of food imports in total food consumption. In total, eighteen food security
indicators were screened as predictors of stunting. The coefficient of variation in
dietary energy consumption is estimated by combining the GINI coefficient, which
measures the level of income inequality within a country, and the coefficient of
variation in energy requirements (FAO, 2010). The coefficient of variation in
dietary energy consumption measures an aggregate numerical measure of
dietary energy consumption inequality, ranging from 0 (perfect equality) to 100
(perfect inequality) (FAO, 2010). Detailed definitions of the rest of the indicators
can be found in Appendix A.
Data for dependent and independent variables were taken from the WHO,
UNICEF, FAO and UNESCO. Data sources of the indicators are listed in Table 1.
Details about the statistical methods and standards used by the different
data sources are available on their respective websites, which are listed in
Appendix B.
18
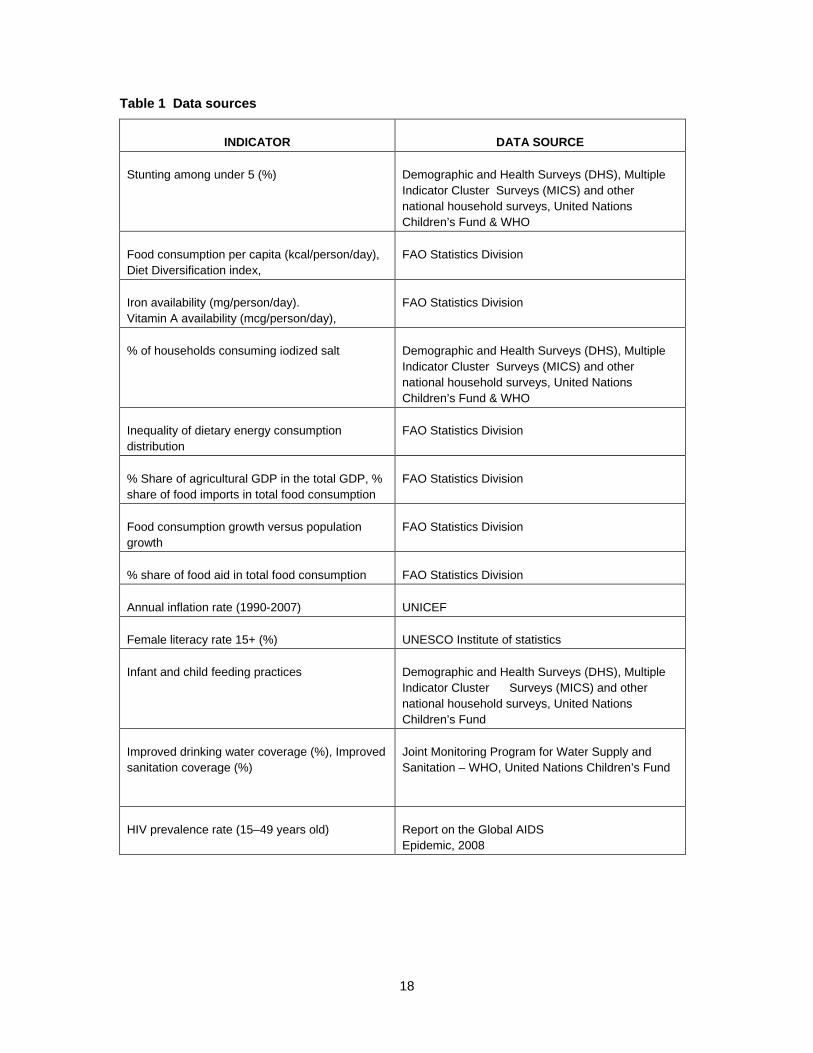
Table 1 Data sources
INDICATOR
DATA SOURCE Stunting among under 5 (%)
Demographic and Health Surveys (DHS), Multiple Indicator Cluster Surveys (MICS) and other national household surveys, United Nations Children’s Fund & WHO
Food consumption per capita (kcal/person/day), Diet Diversification index,
FAO Statistics Division
Iron availability (mg/person/day). Vitamin A availability (mcg/person/day),
FAO Statistics Division
% of households consuming iodized salt
Demographic and Health Surveys (DHS), Multiple Indicator Cluster Surveys (MICS) and other national household surveys, United Nations Children’s Fund & WHO
Inequality of dietary energy consumption distribution
FAO Statistics Division
% Share of agricultural GDP in the total GDP, % share of food imports in total food consumption
FAO Statistics Division
Food consumption growth versus population growth
FAO Statistics Division
% share of food aid in total food consumption
FAO Statistics Division
Annual inflation rate (1990-2007)
UNICEF
Female literacy rate 15+ (%)
UNESCO Institute of statistics
Infant and child feeding practices
Demographic and Health Surveys (DHS), Multiple Indicator Cluster Surveys (MICS) and other national household surveys, United Nations Children’s Fund
Improved drinking water coverage (%), Improved sanitation coverage (%)
Joint Monitoring Program for Water Supply and Sanitation – WHO, United Nations Children’s Fund
HIV prevalence rate (15–49 years old)
Report on the Global AIDS Epidemic, 2008

19
2.3 STUDY POPULATION
UNICEF data reveal that there are 134 developing countries (Appendix C)
in which stunting prevalence among children under five is ≥ 1 %. Out of 134
countries, indicator data were complete for 93 countries.
Figure 3 Percentage of stunted children under five years (UNICEF, 2008)
Figure 4 Number of stunted children under five years (UNICEF, 2008)
20
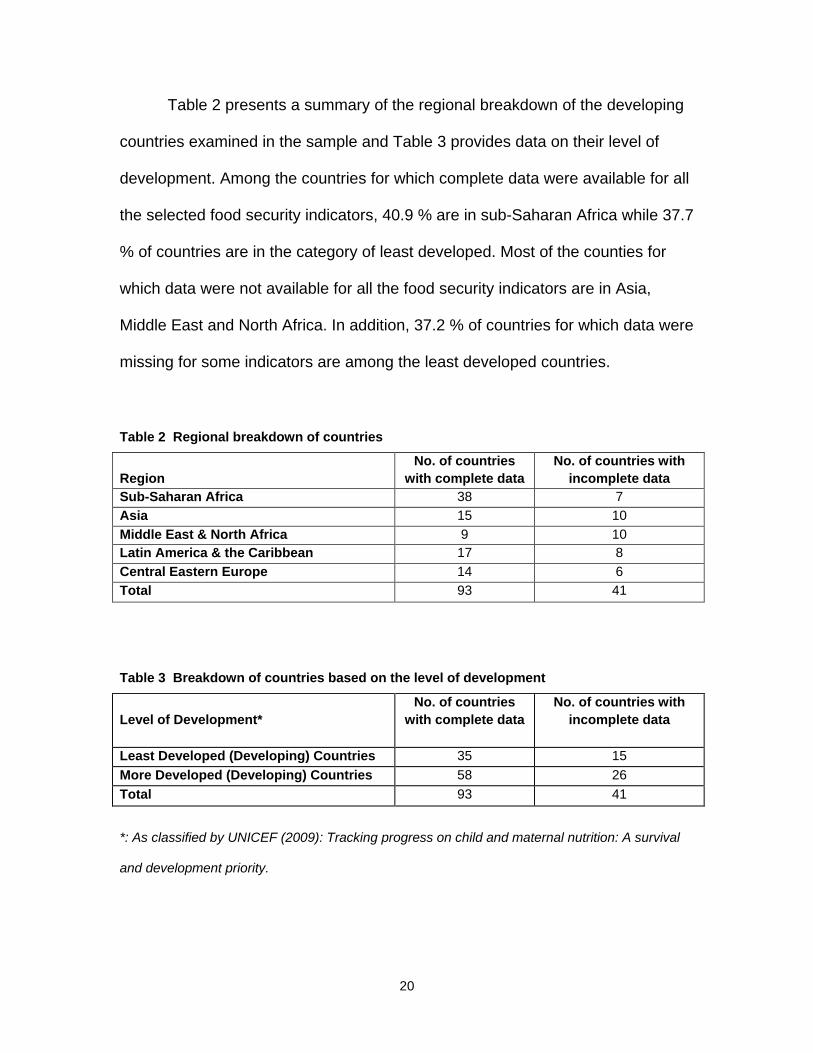
Table 2 presents a summary of the regional breakdown of the developing
countries examined in the sample and Table 3 provides data on their level of
development. Among the countries for which complete data were available for all
the selected food security indicators, 40.9 % are in sub-Saharan Africa while 37.7
% of countries are in the category of least developed. Most of the counties for
which data were not available for all the food security indicators are in Asia,
Middle East and North Africa. In addition, 37.2 % of countries for which data were
missing for some indicators are among the least developed countries.
Table 2 Regional breakdown of countries
Region
No. of countries with complete data
No. of countries with incomplete data
Sub-Saharan Africa 38 7 Asia 15 10 Middle East & North Africa 9 10 Latin America & the Caribbean 17 8 Central Eastern Europe 14 6 Total 93 41
Table 3 Breakdown of countries based on the level of development
Level of Development*
No. of countries with complete data
No. of countries with incomplete data
Least Developed (Developing) Countries 35 15 More Developed (Developing) Countries 58 26 Total 93 41 *: As classified by UNICEF (2009): Tracking progress on child and maternal nutrition: A survival
and development priority.

21
2.4 DATA ANALYSIS
Because of high positive skewness, average annual inflation rate, HIV
prevalence, female literacy rate and share of food aid in total food consumption
were transformed using the natural logarithm. Share of agricultural GDP in total
GDP was transformed using the square root. (*The indictors which came out as
predictors of stunting remained the same even without the transformation of
above mentioned indicators. It is easy to interpret the results with untransformed
indicators so, final results of regression analysis displayed in the next section are
based on untransformed indicators).
Multiple linear regression analyses were conducted using the Statistical
Package for Social Sciences (SPSS) version 17. Analysis of histograms, Q-Q
plots and scatter plots, with and without inclusion of variables with missing values
indicated that there was no violation of normality, linearity or homoscedasticity.
The food security data were complete for 93 countries. In order to
overcome the missing data, EM (expectation-maximization) was used to estimate
missing statistics and impute missing values. The EM method does not impute
values for the categorical variables. As a result, the two categorical variables,
vitamin A availability and share of food imports in total food consumption, were
excluded from the independent variable list.
The EM method is a simple and robust method for imputing the missing
values (B Do & Batzoglou, 2008). Two steps are repeated to find maximum
likelihood estimates of the incomplete data: E step and M step (SPSS Inc.,
2007). “The E- step calculates the conditional expectation of the missing data,

22
given the observed values and current estimates of the parameters. These
expectations are then substitutes for the missing data. In the M-step, maximum
likelihood estimates of the parameters are computed as though the missing data
has been filled in” (SPSS Inc., 2007, p. 7).
One of the pre-requisite for the use of the EM method is the missing of
data at random. Missing at random (MAR) means that the missing values are
randomly distributed within the sample (SPSS Inc., 2007). Little’s chi-square
testing revealed that missing of data was completely at random. A regression
analysis was done using the new data set.
Since the aim of study was to identify predictors of stunting, a stepwise
regression method was used. Two models were run:
Model 1 - Stepwise regression without imputing the missing values
Model 2 - Stepwise regression after imputing the data for missing values by the
EM method
Cross validation was also performed to assess the predictive power of
both the models. For both models, the main sample was randomly divided in to
10 subsamples. One of the 10 subsamples was retained as the validation data
for testing the model and the remaining subsamples were used as training set. A
prediction equation was created using the training set. The equation was then
used to calculate predicted stunting values for the member countries of validation
sample. The process was repeated 10 times, with each of the ten subsamples
23
used exactly once as the validation data. The predicted stunting scores for all the
member counties were then correlated with their observed stunting scores.
No analysis was done to analyze interactions between independent
variables because it would not have been possible to look for interaction with the
available data. Studies in future with primary data should look for interaction in
these variables.

24
3: RESULTS
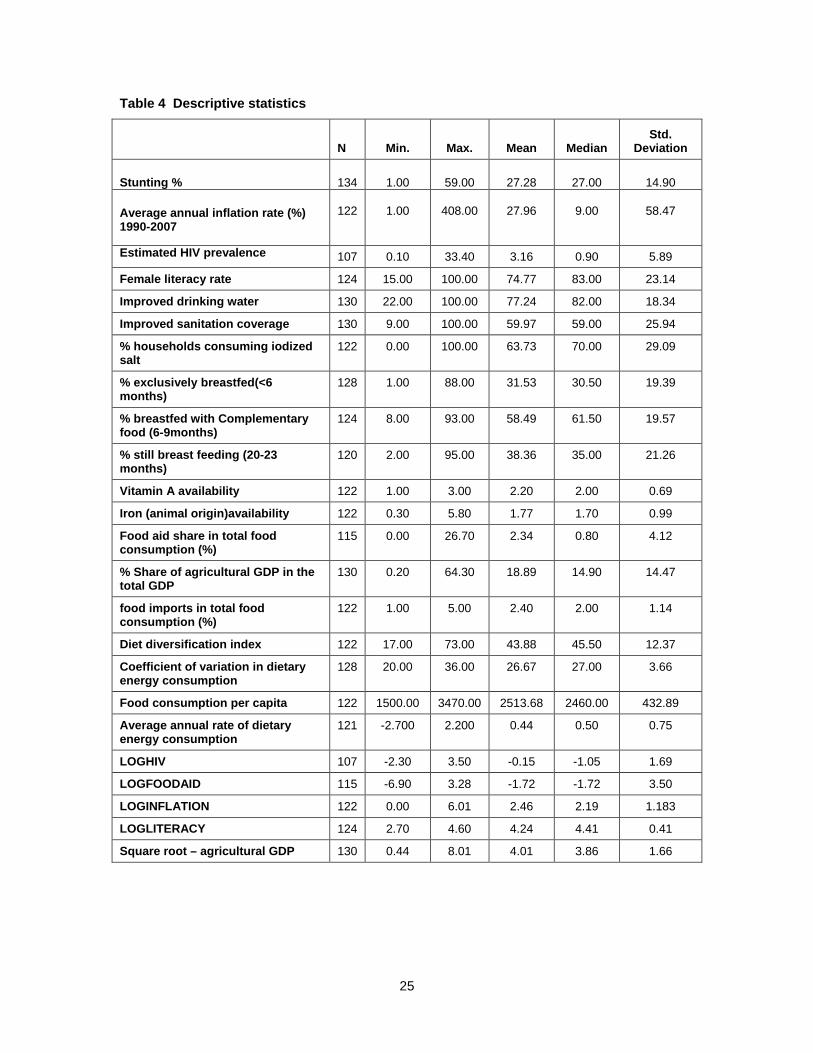
The prevalence of stunting ranged from 1% to 59% (M=27.28; SD=14.90)
in the developing and least developed countries that were examined in the study.
Descriptive statistics are listed in the Table 4.
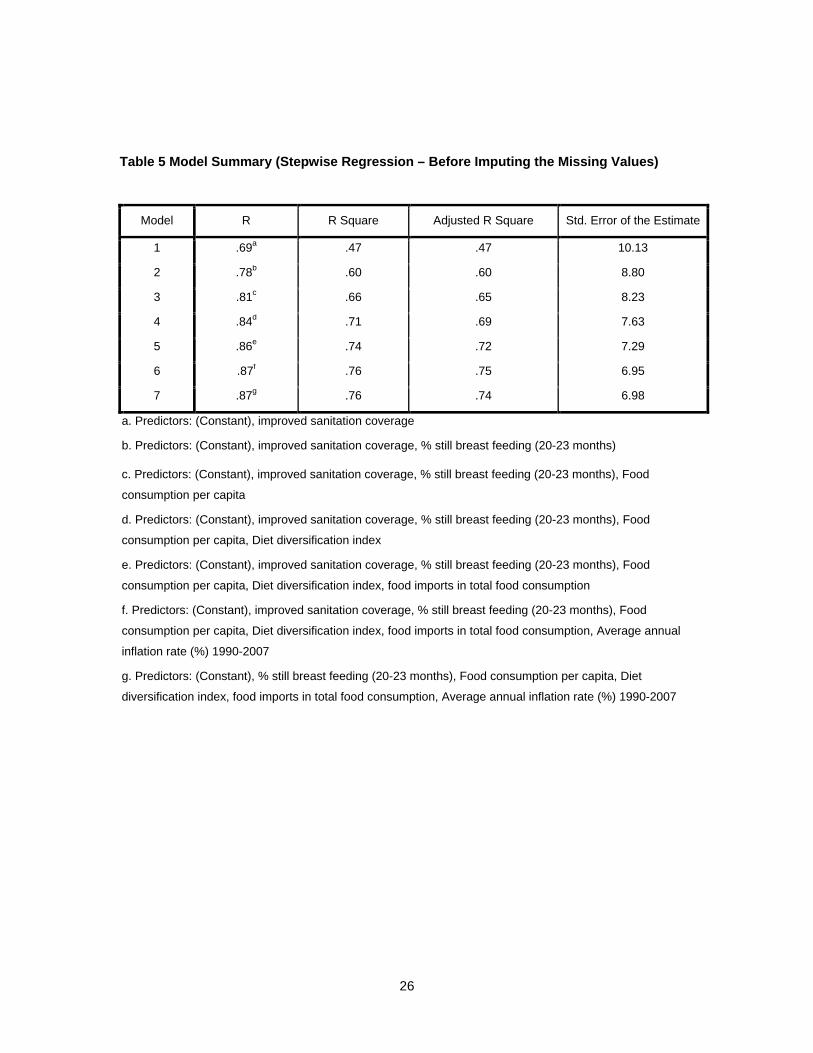
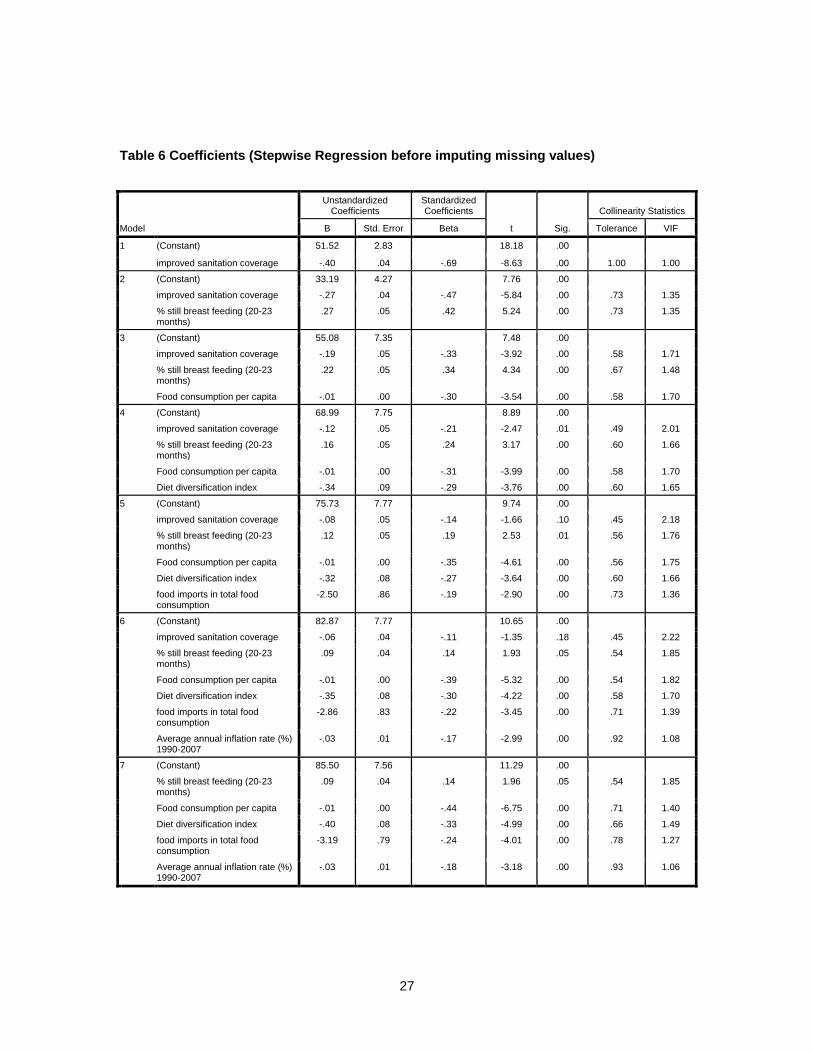
Model 1 explained 76.1 % of the variation in childhood stunting in the
developing world. The “percentage of children still breast feeding at 20 – 23
months”, “food consumption per capita”, “diet diversification index”, “percentage
share of food imports in total food consumption” and “average annual inflation
rate” came out as predictors of stunting under five among after the stepwise
regression. The cross validation R2 was 0.69 (Table 9).
The stepwise regression analysis done after imputing the missing
values by the EM method lead to the inclusion of “co-efficient of variation in
dietary energy consumption” and “improved sanitation coverage” in the predictor
list. Increase in the sample size after imputing the missing values, resulted in
addition of variables to the predictor list. “Food consumption per capita”, “diet
diversification index” and “still breast-feeding (20- 23 months)” came out as
predictors of stunting among under five in both models. Model 2 explained 72.9
% of the variation in childhood stunting in the developing world. The cross
validation R2 was 0.67 (Table 10).
25
Table 4 Descriptive statistics
N Min. Max. Mean
Median
Std. Deviation
Stunting % 134 1.00 59.00 27.28 27.00 14.90
Average annual inflation rate (%) 1990-2007
122
1.00
408.00
27.96
9.00
58.47
Estimated HIV prevalence 107 0.10 33.40 3.16 0.90 5.89
Female literacy rate 124 15.00 100.00 74.77 83.00 23.14
Improved drinking water 130 22.00 100.00 77.24 82.00 18.34
Improved sanitation coverage 130 9.00 100.00 59.97 59.00 25.94
% households consuming iodized salt
122 0.00 100.00 63.73 70.00 29.09
% exclusively breastfed(<6 months)
128 1.00 88.00 31.53 30.50 19.39
% breastfed with Complementary food (6-9months)
124 8.00 93.00 58.49 61.50 19.57
% still breast feeding (20-23 months)
120 2.00 95.00 38.36 35.00 21.26
Vitamin A availability 122 1.00 3.00 2.20 2.00 0.69
Iron (animal origin)availability 122 0.30 5.80 1.77 1.70 0.99
Food aid share in total food consumption (%)
115 0.00 26.70 2.34 0.80 4.12
% Share of agricultural GDP in the total GDP
130 0.20 64.30 18.89 14.90 14.47
food imports in total food consumption (%)
122 1.00 5.00 2.40 2.00 1.14
Diet diversification index 122 17.00 73.00 43.88 45.50 12.37
Coefficient of variation in dietary energy consumption
128 20.00 36.00 26.67 27.00 3.66
Food consumption per capita 122 1500.00 3470.00 2513.68 2460.00 432.89
Average annual rate of dietary energy consumption
121 -2.700 2.200 0.44 0.50 0.75
LOGHIV 107 -2.30 3.50 -0.15 -1.05 1.69
LOGFOODAID 115 -6.90 3.28 -1.72 -1.72 3.50
LOGINFLATION 122 0.00 6.01 2.46 2.19 1.183
LOGLITERACY 124 2.70 4.60 4.24 4.41 0.41
Square root – agricultural GDP 130 0.44 8.01 4.01 3.86 1.66
26
Table 5 Model Summary (Stepwise Regression – Before Imputing the Missing Values)
Model R R Square Adjusted R Square Std. Error of the Estimate
1 .69a .47 .47 10.13
2 .78b .60 .60 8.80
3 .81c .66 .65 8.23
4 .84d .71 .69 7.63
5 .86e .74 .72 7.29
6 .87f .76 .75 6.95
7 .87g .76 .74 6.98
a. Predictors: (Constant), improved sanitation coverage
b. Predictors: (Constant), improved sanitation coverage, % still breast feeding (20-23 months)
c. Predictors: (Constant), improved sanitation coverage, % still breast feeding (20-23 months), Food
consumption per capita
d. Predictors: (Constant), improved sanitation coverage, % still breast feeding (20-23 months), Food
consumption per capita, Diet diversification index
e. Predictors: (Constant), improved sanitation coverage, % still breast feeding (20-23 months), Food
consumption per capita, Diet diversification index, food imports in total food consumption
f. Predictors: (Constant), improved sanitation coverage, % still breast feeding (20-23 months), Food
consumption per capita, Diet diversification index, food imports in total food consumption, Average annual
inflation rate (%) 1990-2007
g. Predictors: (Constant), % still breast feeding (20-23 months), Food consumption per capita, Diet
diversification index, food imports in total food consumption, Average annual inflation rate (%) 1990-2007
27
Table 6 Coefficients (Stepwise Regression before imputing missing values)
Model
Unstandardized Coefficients
Standardized Coefficients
t Sig.
Collinearity Statistics
B Std. Error Beta Tolerance VIF
1 (Constant) 51.52 2.83 18.18 .00
improved sanitation coverage -.40 .04 -.69 -8.63 .00 1.00 1.00
2 (Constant) 33.19 4.27 7.76 .00
improved sanitation coverage -.27 .04 -.47 -5.84 .00 .73 1.35
% still breast feeding (20-23 months)
.27 .05 .42 5.24 .00 .73 1.35
3 (Constant) 55.08 7.35 7.48 .00
improved sanitation coverage -.19 .05 -.33 -3.92 .00 .58 1.71
% still breast feeding (20-23 months)
.22 .05 .34 4.34 .00 .67 1.48
Food consumption per capita -.01 .00 -.30 -3.54 .00 .58 1.70
4 (Constant) 68.99 7.75 8.89 .00
improved sanitation coverage -.12 .05 -.21 -2.47 .01 .49 2.01
% still breast feeding (20-23 months)
.16 .05 .24 3.17 .00 .60 1.66
Food consumption per capita -.01 .00 -.31 -3.99 .00 .58 1.70
Diet diversification index -.34 .09 -.29 -3.76 .00 .60 1.65
5 (Constant) 75.73 7.77 9.74 .00
improved sanitation coverage -.08 .05 -.14 -1.66 .10 .45 2.18
% still breast feeding (20-23 months)
.12 .05 .19 2.53 .01 .56 1.76
Food consumption per capita -.01 .00 -.35 -4.61 .00 .56 1.75
Diet diversification index -.32 .08 -.27 -3.64 .00 .60 1.66
food imports in total food consumption
-2.50 .86 -.19 -2.90 .00 .73 1.36
6 (Constant) 82.87 7.77 10.65 .00
improved sanitation coverage -.06 .04 -.11 -1.35 .18 .45 2.22
% still breast feeding (20-23 months)
.09 .04 .14 1.93 .05 .54 1.85
Food consumption per capita -.01 .00 -.39 -5.32 .00 .54 1.82
Diet diversification index -.35 .08 -.30 -4.22 .00 .58 1.70
food imports in total food consumption
-2.86 .83 -.22 -3.45 .00 .71 1.39
Average annual inflation rate (%) 1990-2007
-.03 .01 -.17 -2.99 .00 .92 1.08
7 (Constant) 85.50 7.56 11.29 .00
% still breast feeding (20-23 months)
.09 .04 .14 1.96 .05 .54 1.85
Food consumption per capita -.01 .00 -.44 -6.75 .00 .71 1.40
Diet diversification index -.40 .08 -.33 -4.99 .00 .66 1.49
food imports in total food consumption
-3.19 .79 -.24 -4.01 .00 .78 1.27
Average annual inflation rate (%) 1990-2007
-.03 .01 -.18 -3.18 .00 .93 1.06

28
Table 7 Model summary (After imputing missing values by EM method)
Model R R Square Adjusted R Square Std. Error of the Estimate
1 .73a .54 .54 10.10
2 .83b .69 .68 8.35
3 .85c .72 .72 7.88
4 .86d .73 .73 7.72
5 .86e .74 .73 7.60
a. Predictors: (Constant), Diet diversification index
b. Predictors: (Constant), Diet diversification index, Food consumption per capita
c. Predictors: (Constant), Diet diversification index, Food consumption per capita, coefficient of variation in
dietary energy consumption
d. Predictors: (Constant), Diet diversification index, Food consumption per capita, coefficient of variation in
dietary energy consumption., Average annual inflation rate (%) 1990-2007
e. Predictors: (Constant), Diet diversification index, Food consumption per capita, coefficient of variation-
dietary energy consumption., Average annual inflation rate (%) 1990-2007, improved sanitation coverage

29
Table 8 Coefficients after imputing missing values by EM method
Model
Unstandardized Coefficients Standardized Coefficients
t Sig.
Collinearity Statistics
B Std. Error Beta Tolerance VIF
1 (Constant) 66.04 3.21 20.55 .00
Diet diversification index -.88 .07 -.737 -12.53 .00 1.00 1.00
2 (Constant) 93.62 4.39 21.30 .00
Diet diversification index -.60 .06 -.50 -8.78 .00 .72 1.37
Food consumption per capita
-.01 .00 -.45 -7.87 .00 .72 1.37
3 (Constant) 57.24 9.72 5.88 .00
Diet diversification index -.49 .07 -.41 -7.12 .00 .62 1.59
Food consumption per capita
-.01 .00 -.38 -6.76 .00 .66 1.50
Coefficient of variation in dietary energy consumption
.96 .23 .23 4.13 .00 .65 1.52
4 (Constant) 62.69 9.76 6.42 .00
Diet diversification index -.51 .06 -.43 -7.54 .00 .61 1.62
Food consumption per capita
-.01 .00 -.39 -7.07 .00 .65 1.51
Coefficient of variation in dietary energy consumption
.86 .23 .21 3.74 .00 .63 1.56
Average annual inflation rate (%) 1990-2007
-.03 .01 -.11 -2.54 .01 .96 1.04
5 (Constant) 62.37 9.61 6.48 .00
Diet diversification index -.45 .07 -.37 -6.09 .00 .51 1.94
Food consumption per capita
-.01 .00 -.32 -5.33 .00 .51 1.93
Coefficient of variation in dietary energy consumption
.75 .23 .18 3.25 .00 .61 1.63
Average annual inflation rate (%) 1990-2007
-.02 .01 -.10 -2.41 .01 .95 1.04
improved sanitation coverage
-.09 .04 -.15 -2.24 .02 .39 2.50

30
Figure 5 Graphical presentations of bi-variate association between stunting and the indicators that came out as predictors in the two models
31
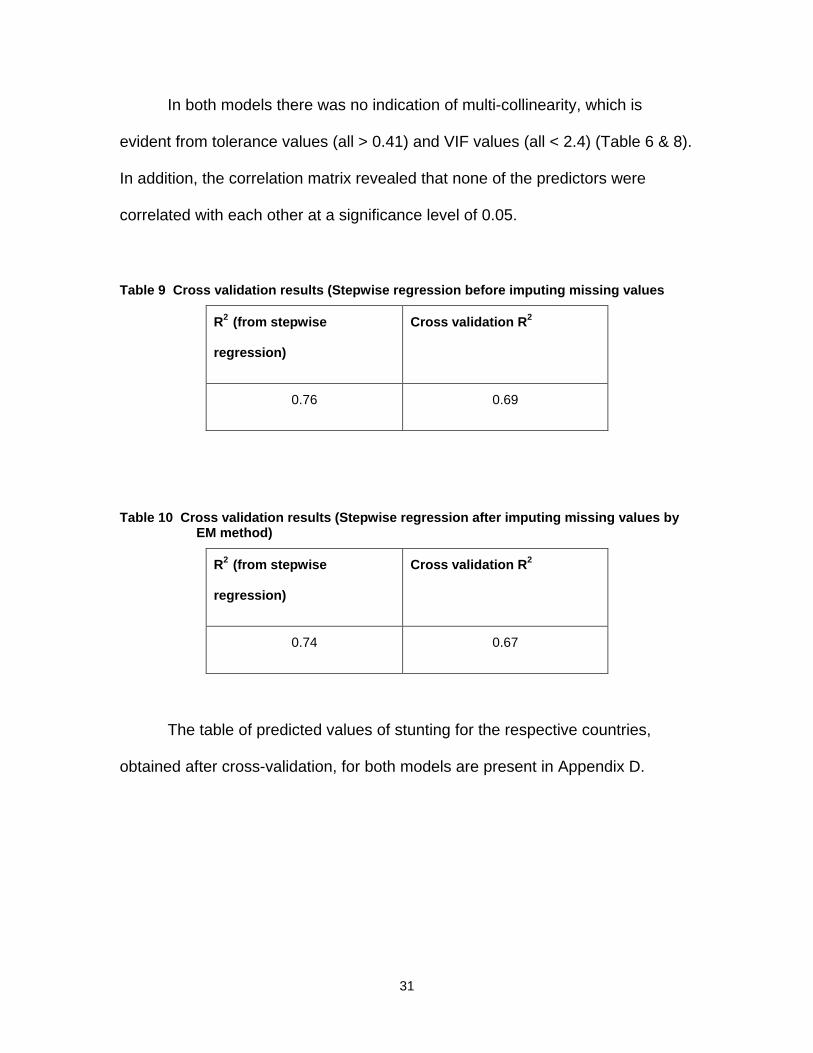
In both models there was no indication of multi-collinearity, which is
evident from tolerance values (all > 0.41) and VIF values (all < 2.4) (Table 6 & 8).
In addition, the correlation matrix revealed that none of the predictors were
correlated with each other at a significance level of 0.05.
Table 9 Cross validation results (Stepwise regression before imputing missing values
R2 (from stepwise
regression)
Cross validation R2
0.76 0.69
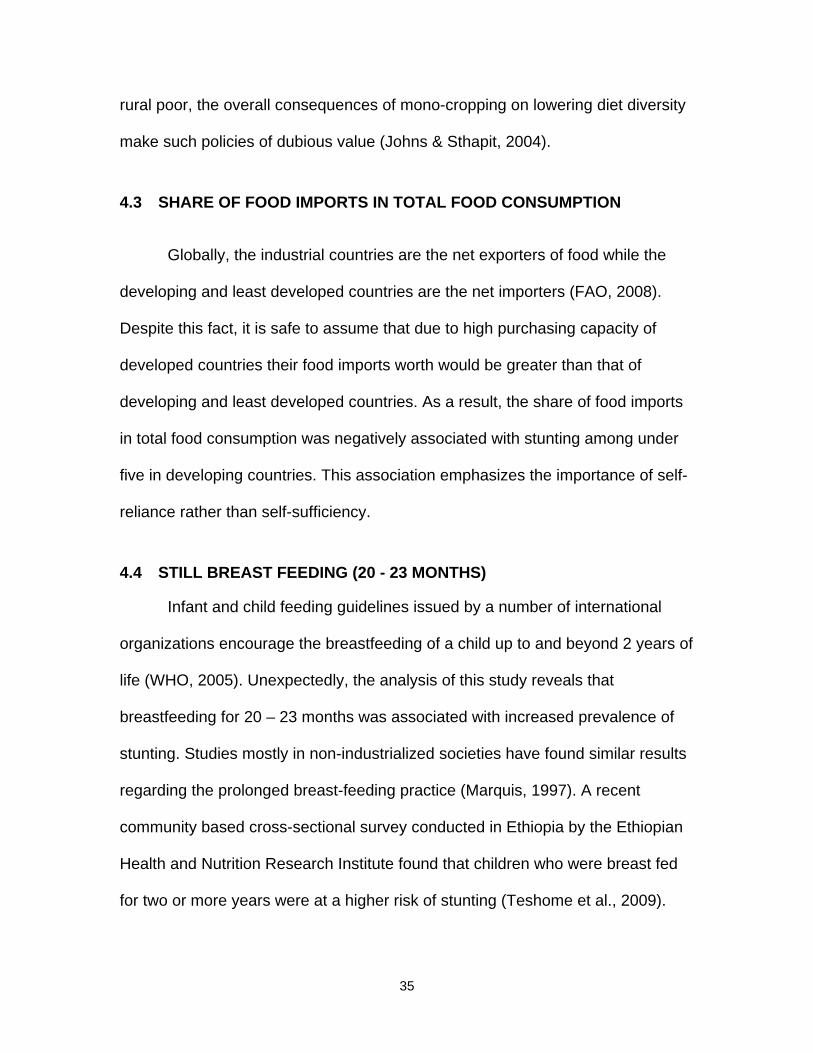
Table 10 Cross validation results (Stepwise regression after imputing missing values by EM method)
R2 (from stepwise
regression)
Cross validation R2
0.74 0.67
The table of predicted values of stunting for the respective countries,
obtained after cross-validation, for both models are present in Appendix D.

32
Due to an unexpected negative association between average inflation
rates and stunting, regression analysis was done for both models after excluding
the average inflation rate from the dataset. There was a negligible decrease in R2
in both models while the predictors of stunting remained same in both models.
Table 11 R-square before and after exclusion of inflation variable from independent variable list
Model R2 after exclusion of inflation
variable
R2 after exclusion of inflation variable
1 0.76 0.74
2 0.74 0.73

33
4: DISCUSSION
The finding that predictors of stunting come from each of the three pillars
of food security demonstrates the need for a broad conceptualization of food
security in order to predict stunting in children under five in developing countries.
Given the significance of these indicators, the next section will discuss the
implications of each of these food security indicators to under-nutrition and
stunting.
4.1 FOOD CONSUMPTION
The first thing on which food consumption per person in a country is
dependant is the food availability within the respective country, which has been
the main pillar of food security since the term was first developed (Baro &
Deubel, 2006). Sustainable increases in agricultural productivity are already
among the goals of major international institutions such as the World Bank,
United Nations Food for Agriculture Organization (FAO) and the International
Fund for Agricultural Development, as well as an important strategy in bilateral
development agencies and non- governmental organizations (Smith & Haddad,
2001). In most developing countries, agricultural production is the main avenue
by which the amount of food available is increased, either by increased national
food production for consumption or by providing foreign exchange for food
imports (Smith & Haddad, 2001). Increasingly, fewer farmers practice
subsistence agriculture, as most are orientated to the market for income

34
generation and for buying foodstuff (Johns & Sthapit, 2004). Furthermore, the
agriculture sector employs 61% of workers in developing countries (World Bank
1999 as cited in Henson & Loader 2001), and small landholder farmers represent
90 percent of the rural poor (FAO , 2008). As such, food production and
productivity need to address not only increasing food stocks, but also reducing
rural poverty, increasing availability of land and generally improving the livelihood
of farmers and their families (FAO, 2008).
4.2 DIET DIVERSIFICATION INDEX
In addition to food sufficiency, the nutritious and diversified nature of
available food is crucial to decrease the prevalence of under-nutrition (Johns &
Sthapit 2004). Accordingly, the Diet Diversification Index was also significant in
both the regression models. The rise in mono-cropping for bio-fuel and other
cash crops for export and the consequent diversion from food crops has affected
food prices, and in some countries lowered the availability of basic food staples,
and adversely affected nutrition worldwide (FAO, 2008). A study by Block et al
(2004) found that a rise in rice prices in the late nineties in Indonesia forced
households to buy less nutritious foods in order to afford the expensive rice.
Some professionals argue that the recent increase in bio-fuel production and the
resulting soaring of food prices will be fruitful for food security and agricultural
production in the long run as it will result in increased income for farmers who
own the land and increased chances of agricultural employment for those who
are employed as labourers (FAO, 2008). Despite the income advantages for the
35
rural poor, the overall consequences of mono-cropping on lowering diet diversity
make such policies of dubious value (Johns & Sthapit, 2004).
4.3 SHARE OF FOOD IMPORTS IN TOTAL FOOD CONSUMPTION
Globally, the industrial countries are the net exporters of food while the
developing and least developed countries are the net importers (FAO, 2008).
Despite this fact, it is safe to assume that due to high purchasing capacity of
developed countries their food imports worth would be greater than that of
developing and least developed countries. As a result, the share of food imports
in total food consumption was negatively associated with stunting among under
five in developing countries. This association emphasizes the importance of self-
reliance rather than self-sufficiency.
4.4 STILL BREAST FEEDING (20 - 23 MONTHS)
Infant and child feeding guidelines issued by a number of international
organizations encourage the breastfeeding of a child up to and beyond 2 years of
life (WHO, 2005). Unexpectedly, the analysis of this study reveals that
breastfeeding for 20 – 23 months was associated with increased prevalence of
stunting. Studies mostly in non-industrialized societies have found similar results
regarding the prolonged breast-feeding practice (Marquis, 1997). A recent
community based cross-sectional survey conducted in Ethiopia by the Ethiopian
Health and Nutrition Research Institute found that children who were breast fed
for two or more years were at a higher risk of stunting (Teshome et al., 2009).
36
It is well known that after six months of age, a child needs
complementary food to meet up the nutritional requirements. Therefore, in poor
households, due to lack of enough additional food source, mothers are left with
the option of feeding their children mostly with breast milk (Marquis, 1997).
Research has also proven that reverse causality is the reason behind this
positive relationship between prolonged breast feeding and stunting among
children under five (Marquis, 1997).
4.5 AVERAGE ANNUAL INFLATION RATE
High inflation rates, especially for food products, are the major factor for
rise in undernourishment and stunting in the last decade (FAO, 2008).
Surprisingly, stunting prevalence was negatively associated with average
inflation rates for the respective countries.
Upon stratifying the inflation data, the top three regions with higher
average annual inflation rate (from 1990 – 2007) were Central Eastern Europe/
Commonwealth Independent States, Latin America and Caribbean and Sub-
Saharan Africa. During the 1990’s, countries in CES/ CIS experienced massive
surge in their annual inflation rates mainly due to a dramatic increase in the
prices of goods and services following their convergence to free market and
liberalization (Paula & Koen, 1995, Fischer et al., 1996). Similarly, countries in
Latin America experienced massive inflations due to their poor fiscal
performance especially in the first half of 1990’s (Bernanke, 2005). Due to the
inflation surges in both these regions, their average annual inflation rates from
1990 to 2007 were higher compared to rest of the developing world. The higher
37
inflation rates for both the regions along with their low stunting prevalence
resulted in a negative association between the stunting and the inflation variable
for the whole sample.
4.6 IMPROVED SANITATION COVERAGE
It is important to highlight the importance of non-food inputs like health
care access, water and sanitation on food security, which fall within food
utilization or use (FAO, 2006). The environment in which food is produced and
consumed is also important and affects nutrition. Related to child under-nutrition,
the high prevalence of infectious diseases in developing countries is a major
contributor, and these interact in a vicious circle (Müller & Krawinkel, 2005).
Contaminated waterborne or food borne illnesses affect how the body absorbs
nutrients, and even if food is available and accessible, under-nutrition continues
to occur by virtue of the presence of these diseases such as chronic diarrhea
(UNICEF, 2009). Therefore, using the model of food security to address stunting
necessitates also dealing with sanitation and access to health care.
4.7 INEQUALITY IN DIETARY ENERGY CONSUMPTION
In developing countries, progress in consumption of nutritious food
resulting from economic growth has remained limited to the economically
advantaged groups of society (Hong, 2006). Consequently, a positive association
was seen between the coefficient of variation in dietary energy intake and
stunting among children under five. This association explains the importance of
38
tackling poverty and inequality in the society in order to reduce stunting among
children under five, which cannot be achieved merely through economic growth.
4.8 FURTHER IMPLICATIONS
This study reveals significant associations between the selected food
indicators and stunting in children under five in the developing world. Although
one is unable to make claims of a causal relationship, this study highlights the
importance of analyzing all three dimensions of food security to reduce stunting
as predictors of stunting were from all the three.
Intervene all the three pillars within the context of chronic food insecurity - Over
the years, UNICEF has been the major international organization dealing with the
problem of child under-nutrition. A recent technical note by UNICEF
acknowledges the importance of achieving long-term food and nutrition security
in developing countries in order to reduce their child under nutrition rates
(UNICEF, 2008). However, apart from educating the mothers about proper breast
feeding practices, the focal point of all their other interventions has revolved
around achieving short term or transitory food security. The major UNICEF
interventions include distribution of fortified foods for children, provision of vitamin
A supplements, and enhancing the consumption of iodine among households
(UNICEF, 2009). Although, UNICEF has done significant effort to increase
access to safe water and sanitation (2009), most of these interventions were
implemented in areas hit by some environmental disaster.

39
Similarly, other international organizations (IMF, World Bank, WFP) have
focused on financial and food aid to address food security (NAPC/FAO, 2004).
These strategies were aimed only at transitory food security and their impact on
chronic food security was minimal (NAPC/FAO, 2004). Strategies aimed at
transitory food security were done in all the dimensions of food security i.e.
availability, access and utilization (Staatz, 2009). However, when it comes to
dealing with chronic food insecurity, which contributes to stunted growth in
children under five, much of the focus has revolved around improving food
availability by increasing agricultural production (Staatz, 2009). This strategy has
been criticized for being an attempt by the West to grow food in the developing
countries that can later be imported to fulfil their needs while at the same time
keeping their focus on bio-fuel production (Staatz, 2009). The criticism seems
unjust as the idea of boosting the agricultural sector in the developing world
came to origin based on the statistics, which revealed that the majority of the low-
income countries are net food importers. Even in 1999, more than 75% of the
low-income countries were net food importers (FAO, 2003). However, with time it
has been realized that food self-reliance is more important than food self-
sufficiency. Future focus should be given to the policies that can make the
developing countries more food self-reliant.
In sum, there is need for interventions at the global level that can address
all the three dimensions within the context of chronic food security as stunting is
an indicator of long term nutritional deprivation. The use of this food security
framework will assist the decision makers of international organizations, such as
40
UNICEF and WFP, in sorting out areas that have been previously ignored to
decrease stunting among under five and hence more targeted interventions could
be devised. In addition, the use of the framework will be helpful in systematizing
the interventions and will ease the process of monitoring the progress.
Need for international collaboration - One of the commitments made at the World
Food Summit held in Rome in 1996 was to implement “polices that are conducive
to fostering food security for all” (NAPC/FAO, 2004). However, one of the
significant factors behind the rise in food prices after 2002 was the change in
agricultural policies by major cereal producers, which include China, the
European Union and the United States of America (FAO, 2008). The resulting
reduction in food supply accompanied by the rise in oil prices and bio-fuel
production led other countries to put a restriction on food export to overcome the
food vulnerability within their countries (FAO, 2008). These developments reveal
that trade based approaches to tackle food insecurity, important especially to
achieve food access, are not given due priority. Furthermore, these
developments emphasize the importance of international collaboration and
coordination to develop strategies focused on improving all the three pillars of
food security. World Food Summit, launched by Food and Agricultural
Organization in 1996, can serve the purpose of establishing international
collaboration. The Rome declaration by the World Food Summit in 1996 was an
important landmark in establishing a global commitment on halving the number of
hungry people by 2015 (FAO, 2008).

41
Enhance the global monitoring of food security indicators - Food security and its
dimensions are complex and dynamic in nature. The Food and Agriculture
Organization have done significant work to collect the data for food security
indicators in different countries. However, research is still limited in countries that
have the worst prevalence of under-nutrition and stunting. Data for the selected
food security variables were incomplete for countries like Afghanistan and
Yemen who have the highest prevalence of stunting among children under five
globally. Data imputation methods can be used for imputing missing values for
indicators in countries undergoing disturbance (civil wars, conflicts, lack of
infrastructure) limiting the data collection. However, all the missing data
imputation methods have statistical pre-requisites, which may be difficult to
achieve. As a result, there is need for enhancing monitoring and surveillance
systems in developing countries.
4.9 LIMITATIONS
Food security is a valuable term in addressing under-nutrition given that it
can be used to characterize nations, communities, households and individuals,
making it possible to use at different levels of analysis. However, this paper only
looked at national-level data, therefore the importance of household-level and
community food insecurity, which may be critical to addressing food security
(Baro & Deubel, 2006), and in particular the pillar of food access, was not
addressed.
Food stability is another important aspect of food security and can serve
as a fourth pillar. Food stability is a part of food availability and food access and
42
is defined as “access to adequate food at all times” (FAO, 2006, p. 1). Factors
that can destabilize food access and availability include economic crises
(unemployment, inflation rates), natural disasters & climatic changes
(earthquakes, floods, and drought) and political & social unrest and conflicts
(wars, terrorism and corruption). Food stability factors such as natural disasters,
climatic changes and political and social unrest were not included in the study
due to lack of the data.
Gender inequality and women’s status are also important indicators for
child nutrition (UNICEF 2009). However, they were not included in the study due
to lack of a reliable population level data for the majority of the developing
countries.
Food access and under-nutrition patterns can be different for the urban
and rural populations within a country. This aspect was missing in the underlying
study and should be addressed in future studies.

43
5: CONCLUSION
The broader definition of food security offers a nexus for understanding
and addressing the multiplicity of factors related to under-nutrition and stunting in
children under five. Furthermore, the term as it has been conceptualized in this
study does not allow for simplistic or individualistic approaches to the problem of
famine and under-nutrition, but rather underscores the importance of economic
and socio-political solutions at the international level that addresses the root
causes of under-nutrition and stunting.
44
REFERENCES
Arimond. M., Ruel, M. T. (2004). Dietary diversity is associated with child
nutritional status: evidence from 11 demographic and health surveys.
Journal of Nutrition, 134, 2579–2585
Baro, M., Deubel T. F. (2006). Persistent hunger: Perspectives on vulnerability,
famine, and food security in Sub-Saharan Africa. Annual Review of
Anthropology, 35, 521-538
Bernanke, B. S. (2005, Feb.) Federal Reserve Board. Speech presented at
Stanford Institute for Economic Policy Research Economic Summit,
Stanford, California
Block, S., Kiess, L. et al. (2004).Macro shocks and micro outcomes: Child
nutrition during Indonesia’s crisis. Economics and Human Biology, 2(1),
21–44.
Bloss, E., Wainaina, F., Bailey, R.C. (2004). Prevalence and predictors of
underweight, stunting and wasting among children aged five and under in
western Kenya. Journal of Tropical Paediatrics, 50, 5
Branca, F., Ferrari, M. (2002). Impact of micronutrient deficiencies on growth:
The stunting syndrome. Annals of Nutrition and Metabolism, 46 (1), 8 -17
Chilton, M., Chyatte, M., Breaux, J. (2007). The negative effects of food
insecurity on child development. Indian Journal of Medical Research, 126,
262 – 272.

45
Commission on HIV/AIDS and Governance in Africa (CHGA) (2008).Securing our
future. Retrieved August 4th, 2010 from
http://www.uneca.org/CHGA/Report/CHGAReport.pdf
Das, S., Hossain, M. Z., Islam, M. A. (2008). Predictors of child chronic
malnutrition in Bangladesh. Proc. Pakistan Acad. Sci., 45 (3), 137 -155
El Taguri, A., Betilmal, I., Mahmud, S. M. et al. (2009). Risk factors for stunting
among under five in Libya. Public Health Nutrition, 12 (8), 1141 -9
Espo, M., Kulmala, T., Maleta, K. et al. (2002). Determinants of linear growth and
predictors of severe stunting during infancy in rural Malawi, Acta
Paediatrica, 91(12), 1364-1370
Fischer et al. (1996). Stabilization and growth in transition economies: The early
experience. Journal of Economic Perspectives, 10 (2), 45-66
Food and Agricultural Organization (2010).Food security statistics - Metadata.
Retrieved August 4th, 2010 from
http://www.fao.org/economic/ess/food-security-statistics/food-security-
statistics-metadata/en/
Food and Agriculture Organization of the United Nations (FAO) (2008). The state
of food security: High food prices and food security –threats and
opportunities. Retrieved August 4th, 2010 from
http://www.fao.org/docrep/011/i0291e/i0291e00.htm
Food and Agriculture Organization of the United Nations (FAO) (2006). Policy
Brief-Food Security. Retrieved August 4th, 2010 from
ftp://ftp.fao.org/es/ESA/policybriefs/pb_02.pdf

46
Food and Agriculture Organization of the United Nations (FAO) (2003). Trade
reforms and food security: Conceptualizing the linkages. Retrieved from
ftp://ftp.fao.org/docrep/fao/005/y4671E/y4671E00.pdf
Food and Nutrition Technical Assistance (2002, August).Diet diversity as
household food security indicator. Retrieved August 4, 2010 from
http://www.fantaproject.org/downloads/pdfs/tn4_dd.pdf
Fongillo, E. A. (1999). Symposium: Causes and etiology of stunting. Introduction.
Journal of Nutrition, 129, S529 – S530
Gray, V. B., Cossman, J. S., Powers, E. L. (2006). Stunted growth is associated
with physical indicators of malnutrition but not food insecurity among rural
school children in Honduras. Nutrition Research, 26, 549-555
Henson, S., Loader, R. (2001). Barriers to agricultural exports from developing
countries: The role of sanitary and phytosanitary requirements. World
Development, 29 (1), 85-102
Hong, R., Mishra, V. (2006). Effect of wealth inequality on chronic under-nutrition
in Cambodian children. Journal of Health Population and Nutrition, 24 (1),
89 – 99
Janevic, T., Petrovic, O., Bjelic, I., Kubera, A. (2010). Risk factors for childhood
malnutrition in Roma settlements in Serbia, BMC Public Health, 10, 509
Johns T., Sthapit B. R. (2004). Biocultural diversity in the sustainability of
developing-country food systems. Food and Nutrition Bulletin, 25(2), 143-
155

47
Lee, J., Houser, F. R., Must, A. et al. (2010). Disentangling nutritional factors and
household charcteristics related to child stunting and maternal overweight
in Guatemala. Economics and Human Biology, 8, 188 -196
Marquis, G. S. et al. (1997). Association of breastfeeding and stunting in
Peruvian toddlers: An example of reverse causality. International Journal
of Epidemiology, 26(2), 349-56.
Medhin, G., Hanlon, C., Dewey, M. et al. (2010). Prevalence and predictors of
undernutrition among infants aged six and twelve months in Butajira,
Ethiopia: The P-Mamie Birth Cohort. BMC Public Health, 10, 27
Mendez, M. A., Adair, L. S. (1999). Severity and timing of stunting in the first two
years of life affect performance on cognitive tests in late childhood.
Journal of Nutrition. 129, 1555–1562.
Müller, O., Krawinkel M. (2005). Malnutrition and health in developing countries.
Canadian Medical Association, 173 (3), 279-286
NAPC/FAO.(2004). Proceeding no. 11 of the agricultural policy forum on food
security and development. Retrieved August 4th 2010 from
www.napcsyr.org/dwnld-files/.../en/11_food_security_en.pdf
Nord, M., Hopwood, H. (2007). Recent advances provide improved tools for
measuring children’s food security. The Journal of Nutrition, 137, 533-536
Overseas Development Institute (1997, Feb.). Global Hunger and Food Security
after the World Food Summit. Retrieved September 15th, 2010 from,
http://www.odi.org.uk/resources/download/1964.pdf

48
Ozaltin, E., Hill, K., Subramanian, S. V. (2010). Association of maternal stature with
offspring mortality, underweight, and stunting. JAMA, 303, 1507-1516.
Paula, D. M., Koen, V. (1995). Relative Price Convergence in Russia. IMF
Working Paper, Vol. 43, 1-48. Available at SSRN:
http://ssrn.com/abstract=883202
Pongou, R., Ezzati, M., Salomon, J. A. (2006). Household and community
socioeconomic and environmental determinants of child nutritional status
in Cameroon, BMC Public Health, 6, 98
Rah, J. H., Akhtar, N., Semba, R. D. et al. (2010). Low dietary diversity is a
predictor of child stunting in rural Bangladesh. European Journal of
Clinical Nutrition, 1-6
Reinhard, I., & Wijayaratne, K. B. S. (2001) The use of stunting and wasting as
indicators for food insecurity and poverty. PIMU Open Forum. Integrated
Food Security Program Working Paper 27. Retrieved August 4th, 2010
from
www.ifsp-srilanka.org/wp-27-stunting-wasting.pdf
Sawadogo, P. S., Martin-Prevel, Y., Savy, M. et al. (2006). An infant and child-
feeding index is associated with the nutritional status of 6- to 23-month-old
children in rural Burkina Faso. Journal of Nutrition, 136, 656–663
Shrimpton, R., Victoria, C. G. et al. (2001). Worldwide timing of growth faltering:
Implications for nutritional interventions. Paediatrics. 107 (5), 5-6

49
Smith, L.C., Haddad, L. (2001). How important is improving food availability for
reducing child malnutrition in developing countries? Agricultural
Economics 26, 191-204
SPSS Inc. (2007). SPSS Advanced statistics 17. SPSS Inc., Chicago IL.
Retrieved August 4th,2010 from
www.support.spss.com/.../SPSS/.../17/.../SPSS%20Advanced%20Statistic
s%2017.0.pdf
Staatz, J. M. et al. (2009). Food security in developing countires. Retrieved
August 4th, 2010 from
www.ageconsearch.umn.edu/.../SP_2009_03_Food%20SecurityDevelopin
gCountries.pdf
Teshome, B. et al. (2009). Magnitude and determinants of stunting in children
under five years of age in food surplus region of Ethiopia: the case of west
Gojam zone. Ethiopian Journal of Health Development 23 (2),
98 – 106
United Nations (2009, December).Indicators on literacy. Retrieved August 4,
2010 from
http://unstats.un.org/unsd/demographic/products/socind/literacy.htm
United Nations Children’s Fund (2009, November). Tracking progress on child
and maternal nutrition: A survival and development priority. Retrieved
August 4, 2010 from
www.unicef.org/.../Tracking_Progress_on_Child_and_Maternal_Nutrition_
EN_110309.pdf

50
United Nations Children’s Fund (2008, July). Food Prices Increases/Nutrition
Security: Action for Children. Retrieved November 10, 2010 from
www.unicef.org/eapro/Food_Prices_Technical_Note_-july_4th.pdf
Victora, C. G., et al. (2008). Maternal and Child Under-nutrition: Consequences
for adult health and human capital. The Lancet, 371 (9609), 340–357.
Victora, C. G. (1992). The association between wasting and stunting: An
international perspective. Journal of Nutrition, 122, 1105 – 1110.
Walker, S. P. (2007). Early childhood stunting is associated with
poor psychological functioning in late adolescence and effects are
reduced by psychosocial stimulation. Journal of Nutrition, 137(11), 2464-9
Willey, A. B., Cameron, N., Norris, A. S. et al. (2009). Socio-economic predictors
of stunting in preschool children: A population- based study from
Johannesburg and Soweto, SAMJ, 99 (6)
World Health Organization (2009). Food Security. Retrieved August 4th, 2010
from
www.who.int/trade/glossary/story028/en/
World Health Organization (2009). Water Sanitation and Health. Retrieved
August 4th, 2010 from
http://www.who.int/water_sanitation_health/en/
World Health Organization (2005).Growth Failure in HIV infected children.
Retrieved August 4th, 2010 from

51
http://www.who.int/nutrition/topics/Paper%20Number%204%20-
%20Growth%20failure.pdf
World Health Organization (2005). Guiding Principles for Feeding Non-breastfed
Children 6-24 Months of Age. Retrieved August 4th, 2010 from
http://whqlibdoc.who.int/publications/2005/9241593431.pdf
52
APPENDICES
APPENDIX A
Definitions of selected food security indicators
Food consumption per capita (kcal/person/day) – Amount of food
consumption, in kcal per day, for each individual in the total population.
Diet diversification index - percentage share of non-starchy foods in total
dietary energy consumption
Vitamin A availability (mcg/person/day) -“The dietary availability of vitamin A is
calculated by converting the amount of food available for human consumption as
estimated by the FAO Food Balance Sheets in equivalent of Vitamin A
(micrograms of retinol activity equivalent - RAE). However the actual food
consumption may be lower than the quantity shown as food availability
depending on the magnitude of wastage and losses of food in the household”.
(FAO, 2010)
Categories of vitamin A availability
1 - Less than 300 mcg RAE/person/day
2 - 300 — 600 mcg RAE/person/day
3 - More than 600 mcg RAE/person/day
Iron availability (mg/person/day) - “The dietary availability of iron is calculated
by converting the amount of food available for human consumption as estimated
by the FAO Food Balance Sheets in equivalent of iron. However the actual food
53
consumption may be lower than the quantity shown as food availability
depending on the magnitude of wastage and losses of food in the household”
(FAO, 2010)
Food consumption growth versus population growth - The average annual
rate of change of dietary energy consumption (kcal/person/day) — r PCDEC
The average annual rate of change of population — r POP
The average annual rate of change of total dietary energy consumption for total
population (kcal/day) — r DEC
r PCDEC = r DEC - r POP (FAO, 2010)
Percentage share of food imports in total food consumption - Role of food
imports in total food consumption. Data on imports are converted in kilocalories
using conversion factors by commodities in order to calculate the share of
imports in the total Dietary Energy Supply (FAO, 2010) Role of food imports in
total food consumption (%) has been divided into five categories:
1) 0- 25
2) 25 – 50
3) 50 – 100
4) 100 - 150
5) 150 over
Percentage of households consuming iodized salt - Percentage of
households consuming adequately iodized salt (UNICEF, 2009)
Percentage Share of agricultural GDP in the total GDP – The share of the
country’s GDP derived from agriculture (FAO, 2010)

54
Percentage share of food aid in total food consumption - Contribution of food
aid shipments (cereals and non-cereal products) in total food consumption. Data
on food aid in tonnes are converted in kilocalories using conversion factors by
commodities in order to calculate the share of the food aid in the total Dietary
Energy Supply (FAO, 2010)
Average annual inflation rates (1990- 2007) - The average annual inflation rate
for a respective country from 1990 to 2007.
Inequality in dietary energy consumption- Two measures have been used to
determine inequality of dietary energy consumption. 1) Coefficient of variation
2) GINI coefficient. The coefficient of variation of dietary energy consumption, is
“defined as a composite of the coefficient of variation in income (CV_I) and the
coefficient of variation of energy requirements (CV_R) as follows: CV2 = CV_I2 +
CV_R2. The CV_I is estimated using household Survey data. The CV_R is
estimated using demographic and anthropometric data and recommendations on
dietary energy requirements. The GINI coefficient of dietary energy consumption
is derived from the coefficient of variation of dietary energy consumption defined
above, under the assumption of log-normal distribution. (FAO, 2010)
Female literacy rate in 15+ - Percentage of literate female who are 15 and
above (The United Nations Educational, Scientific and Cultural Organization
(UNESCO) define a literate person as someone who can both read and write
with understanding, a short, simple statement on his or her everyday life. A
person who can only read but not write, or can write but not read is considered
55
illiterate. A person who can only write figures, his or her name or a memorized
ritual phrase is also not considered literate.) (UN, 2009)
Exclusive breastfeeding (<6months) - Percentage of infants younger than 6
months old who are exclusively breastfed (UNICEF, 2009).
Breastfed with complementary food (6–9 months) - Percentage of infants 6–9
months old who are breastfed and receive complementary food (Data do not
reflect the quality of complementary food used in developing countries.)
(UNICEF, 2009)
Still breast feeding at 20-23months - Percentage of children 20 - 23 months
old who are currently breastfeeding (UNICEF, 2009).
Improved Drinking Water Coverage (%) - Percentage of the population using
improved drinking water source (UNICEF, 2009).
Improved – Piped into a dwelling, plot or yard, public taps or standpipes, tube
wells or boreholes, protected dug wells, protected springs, rainwater collection
(UNICEF, 2009)
Unimproved – unprotected dug well, unprotected spring cart with small
tank/drum. Tanker truck, surface water (river dam, lake, pond, stream, canal,
irrigation channels) (UNICEF, 2009)
Improved Sanitation Coverage (%) - percentage of the population using an
improved sanitation facility (UNICEF, 2009).
Improved – Number of household members using improved sanitation facilities
(facilities that ensure hygienic separation of human excreta from human contact),
including flush or pour flush toilet/latrine to piped sewer system, septic tank or pit
56
latrine ;ventilated improved pit (VIP) latrine; pit latrine with slab; and composting
toilet. (UNICEF, 2009)
Shared – Number of household members using sanitation facilities of an
otherwise acceptable type shared between two or more households including
public toilets (UNICEF, 2009)
Unimproved – Number of household members using sanitation facilities that do
not ensure hygienic separation of human excreta from human contact, including
pit latrines without a slab or platform, hanging latrines and bucket latrines
(UNICEF, 2009)
Open defecation – Number of household members defecating in fields, forests,
bushes, bodies of water or other open spaces (UNICEF, 2009.
57
APPENDIX B
FAO Statistics Division
http://www.fao.org/economic/ess/methodology/methodology-
systems/publications-on-statistical-methods-and-standards/en/
UNICEF
http://www.unicef.org/statistics/index_24287.html
Demographic and Health Surveys (DHS), Multiple Indicator Cluster Surveys
(MICS) and other national household surveys
http://www.unicef.org/statistics/index_24302.html
http://www.childinfo.org/mics.html
Joint Monitoring Program for Water Supply and Sanitation – WHO, United
Nations Children’s Fund
http://www.wssinfo.org/definitions/methodology.html
UNESCO Institute of statistics
http://www.uis.unesco.org/template/pdf/EducGeneral/Indicator_Technical_guideli
nes_EN.pdf

58
APPENDIX C
i) List of countries for which data were available for all selected food security
indicators
Asia – Bangladesh, Cambodia, China, India, Indonesia, Lao People’s Democratic
Republic, Mongolia, Myanmar, Nepal, Pakistan, Philippines, Sri Lanka, Thailand,
Vanuatu, Vietnam
Central Eastern Europe/ Commonwealth Of Independent States – Albania, Armenia,
Azerbaijan, Belarus, Bosnia and Herzegovina, Georgia, Kazakhstan, Kyrgyzstan,
Republic of Moldova, Tajikistan, Turkey, Turkmenistan, Uzbekistan, Ukraine
Latin America & The Caribbean – Bolivia, Brazil, Colombia, Costa Rica, Cuba,
Dominican Republic, Ecuador, Guatemala, Haiti, Honduras, Jamaica, Mexico,
Nicaragua, Panama, Peru, Venezuela, El Salvador
Middle East & North Africa – Algeria, Egypt, Iran (Islamic Republic of), Jordan,
Lebanon, Morocco, Sudan, Syrian Arab Republic, Tunisia
Sub-Saharan Africa – Angola, Benin, Botswana, Burkina Faso, Cameroon, Cape
Verde, Central African Republic, Chad, Comoros, Congo, Côte d’Ivoire
Democratic Republic of the Congo, Eritrea, Ethiopia, Gabon, Gambia, Ghana, Guinea,
Guinea-Bissau, Kenya, Lesotho, Madagascar, Malawi, Mali, Mozambique, Namibia,
Nigeria, Rwanda, Sao Tome and Principe, Senegal, Sierra Leone, South Africa,
Swaziland, Togo, Uganda, United Republic of Tanzania, Zambia, Zimbabwe.
Below is the list of countries for which data were missing for one or more food security
indicators.

59
ii) List of countries for which data were missing for some food security indicators
Asia- Afghanistan, Bhutan, Burundi, Maldives, Nauru, Papua New Guinea, Solomon
Islands, Timor-Leste, Tuvalu, Singapore
Latin America & The Caribbean - Argentina, Belize, Guyana, Paraguay, Suriname,
Trinidad & Tobago, Uruguay, Chile
Central Eastern Europe/ Commonwealth Of Independent States - Croatia,
Montenegro, Romania, Russian Federation, Serbia, the Former Yugoslav Republic of
Macedonia
Middle East & North Africa – Bahrain, Iraq, Kuwait, Libya, Occupied Palestinian
territory, Oman, Qatar, Saudi Arabia, UAE, Yemen
Sub-Saharan Africa - Djibouti, Equatorial Guinea, Liberia, Mauritania, Mauritius, Niger,
Somalia

60
APPENDIX D
Model 1- Table of observed and predicted values of stunting for respective countries
Country Obs. Stunting
(%)
Pred. stunting
(%)
Country Obs. Stunting (%)
Pred. Stunting
(%)
Country Obs. Stunting
(%)
Pred. Stunting (%)
Albania 26 12.20 Eritrea 44 46.9 Myanmar 41 38.19
Algeria 15 11.30 Ethiopia 51 56.37 Namibia 29 30.35
Angola 29 27.96 Gabon 25 15.74 Nepal 49 41.08
Armenia 18 17.79 Gambia 28 27.46 Nicaragua 22 32.33
Azerbaijan 25 18.88 Georgia 13 11.3 Nigeria 41 32.07
Bangladesh 43 49.93 Ghana 28 33.14 Pakistan 42 31.97
Belarus 4 4.5 Guatemala 54 25.46 Panama 22 26.33
Benin 43 39.87 Guinea 40 38.7 Peru 30 26.99
Bolivia 22 30.47 Guinea-Bissau 47 40.16 Philippines 34 30.85
Bosnia 10 12.12 Haiti 29 33.68 Republic of
Moldova 10 18.24
Botswana 29 24.72 Honduras 29 18.54 Rwanda 51 41.05
Brazil 7 9.77 India 48 39.40 Sao Tome and
Principe 29 25.84
Burkina Faso 36 44.33 Indonesia 37 36.42 Senegal 19 37.5
Cambodia 42 38.64 Iran 5 19.78 Sierra Leone 36 41.56
Cameroon 36 33.41 Jamaica 4 7.69 South Africa 27 27.31
Cape Verde 12 21.38 Jordan 12 10.68 Sri Lanka 18 34.5
CAR 43 43.02 Kazakhstan 17 12.65 Sudan 40 28.79
Chad 41 44.83 Kenya 35 33.85 Swaziland 29 22.18
China 15 23.21 Kyrgyzstan 18 20.03 Syrian Arab
Republic 28 13.12
Colombia 15 18.61
Lao People’s Democratic
Republic 48 39.89 Tajikistan 39 30.38
Comoros 44 39.78 Lebanon 11 3.29 Thailand 16 27.98
Congo 30 27.83 Lesotho 42 37.33 Togo 27 45.94
Costa Rica 6 10.31 Madagascar 53 47.68 Tunisia 6 9.6
Côte d’Ivoire 40 29.79 Malawi 53 43.21 Turkey 10 9.91 Cuba 5 4.63 Mali 38 37.77 Turkmenistan 19 20.5
Democratic Republic of the Congo
46
50.37
Mexico
16
6.21
Uganda
38
28.6
Dominican Republic 18 15.82 Mongolia 27 24.50
United Republic of Tanzania 44 50.4
Ecuador 23 22.39 Morocco 23 19.35 Uzbekistan 19 29.6
Egypt 29 18.01 Mozambique 44 50.88 Vanuatu 20 20.13
Venezuela 12 16.9 Ukraine 3 13.3 Zimbabwe 33 32.38
Viet Nam 36 34.43 El Salvador 19 23.37 Zambia 45 47.7

61
Model 2- Table of observed and predicted values of stunting for respective countries Country Obs.
Stunting (%)
Pred. stunting (%)
Country Obs. Stunting
(%)
Pred. Stunting
(%)
Country Obs. Stunting (%)
Pred. Stunting (%)
Afghanistan 59 47.49 Cuba 5 5.85 Lebanon 11 7.5
Albania 26 11.75 DPR Korea 45 31.07 Lesotho 42 38.22
Algeria 15 18.21 DPR Congo 46 48.84 Liberia 39 49.7
Angola 29 43 Djibouti 33 27.04 Libya 21 10.9
Argentina 8 5.62 Dominican Republic 18 16.19 Madagascar 53 44.60
Armenia 18 23.21 Ecuador 23 16.45 Malawi 53 42.82
Azerbaijan 25 25.13 Egypt 29 23.4 Maldives 32 15.33
Bahrain 10 12.62 Equatorial Guinea 43 32.86 Mali 38 36.81
Bangladesh 43 46.49 Eritrea 44 49.02 Mauritania 32 25.77
Belarus 4 10.49 Ethiopia 51 54.88 Mauritius 10 14.85
Belize 22 15.81 Gabon 25 20.36 Mexico 16 13.4
Benin 43 39.69 Gambia 28 33.67 Mongolia 27 28.32
Bhutan 48 34.21 Georgia 13 20.65 Montenegro 7 12
Bolivia 22 28.12 Ghana 28 35.1 Morocco 23 24
Bosnia 10 14.9 Guatemala 54 35.57 Mozambique 44 47.14
Botswana 29 31.03 Guinea 40 30.36 Myanmar 41 33.37
Brazil 7 17.33 Guinea-Bissau 47 40.67 Namibia 29 33.97
Burkina Faso 36 41.77 Guyana 17 18.69 Nauru 24 32
Burundi 53 40.01 Haiti 29 44.43 Nepal 49 38.33
Cambodia 42 45.42 Honduras 29 24.25 Nicaragua 22 33
Cameroon 36 32.37 India 48 38.43 Niger 47 44.64
Cape Verde 12 28 Indonesia 37 33.8 Nigeria 41 32.49
C.A. R. 43 29.08 Iran 5 19.8 O. P. T. 10 29
Chad 41 45.2 Iraq 26 20.89 Oman 13 28.6
China 15 22 Jamaica 4 10.4 Pakistan 42 34.86
Colombia 15 16.27 Jordan 12 15.25 Panama 22 28.12
Comoros 44 34.81 Kazakhstan 17 8.57 Papua New Guinea 43 41.47
Congo 30 31.5 Kenya 35 34.89 Paraguay 18 24
Costa Rica 6 10.5 Kuwait 24 8.03 Peru 30 29.2
Côte d’Ivoire 40 31.77 Kyrgyzstan 18 23.18 Philippines 34 33.7
Croatia
1
3.8
Lao People’s D. Republic
48
43.79
Qatar
8
10.39
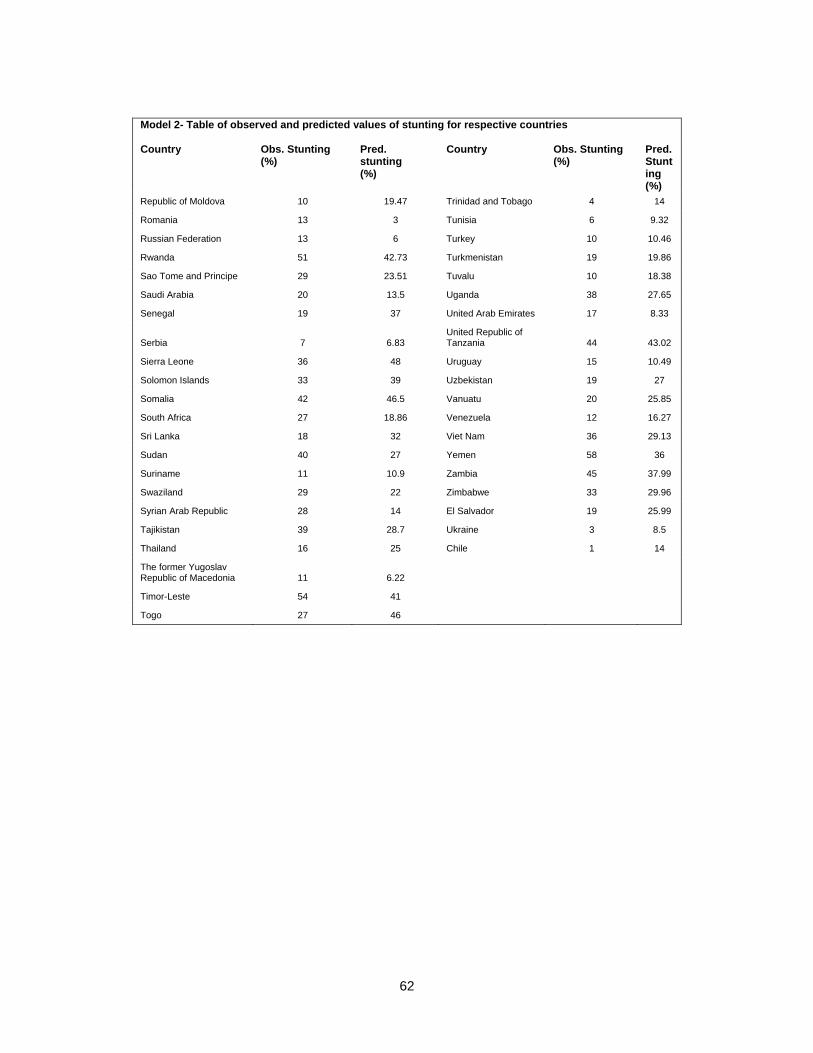
62
Model 2- Table of observed and predicted values of stunting for respective countries Country Obs. Stunting
(%) Pred. stunting (%)
Country Obs. Stunting (%)
Pred. Stunting (%)
Republic of Moldova 10 19.47 Trinidad and Tobago 4 14
Romania 13 3 Tunisia 6 9.32
Russian Federation 13 6 Turkey 10 10.46
Rwanda 51 42.73 Turkmenistan 19 19.86
Sao Tome and Principe 29 23.51 Tuvalu 10 18.38
Saudi Arabia 20 13.5 Uganda 38 27.65
Senegal 19 37 United Arab Emirates 17 8.33
Serbia 7 6.83 United Republic of Tanzania 44 43.02
Sierra Leone 36 48 Uruguay 15 10.49
Solomon Islands 33 39 Uzbekistan 19 27
Somalia 42 46.5 Vanuatu 20 25.85
South Africa 27 18.86 Venezuela 12 16.27
Sri Lanka 18 32 Viet Nam 36 29.13
Sudan 40 27 Yemen 58 36
Suriname 11 10.9 Zambia 45 37.99
Swaziland 29 22 Zimbabwe 33 29.96
Syrian Arab Republic 28 14 El Salvador 19 25.99
Tajikistan 39 28.7 Ukraine 3 8.5
Thailand 16 25 Chile 1 14
The former Yugoslav Republic of Macedonia 11 6.22
Timor-Leste 54 41
Togo 27 46