FOOD SECURITY AMONG FAMILIES WITH CHILDREN WITH SPECIAL HEALTH
26
Tara Corbridge MCH Research Festival June 2013 FOOD SECURITY AMONG FAMILIES WITH CHILDREN WITH SPECIAL HEALTH CARE NEEDS
Transcript of FOOD SECURITY AMONG FAMILIES WITH CHILDREN WITH SPECIAL HEALTH

Tara Corbridge MCH Research Festival
June 2013
FOOD SECURITY AMONG FAMILIES WITH CHILDREN
WITH SPECIAL HEALTH CARE NEEDS

BACKGROUND AND SIGNIFICANCE
FOOD INSECURITY
Very low food security Reports of multiple indications of disrupted eating patterns & reduced food intake.
Low food security Reports of reduced quality, variety, or desirability of diet. Little or no indications of reduced food intake.
USDA Economic Research Service
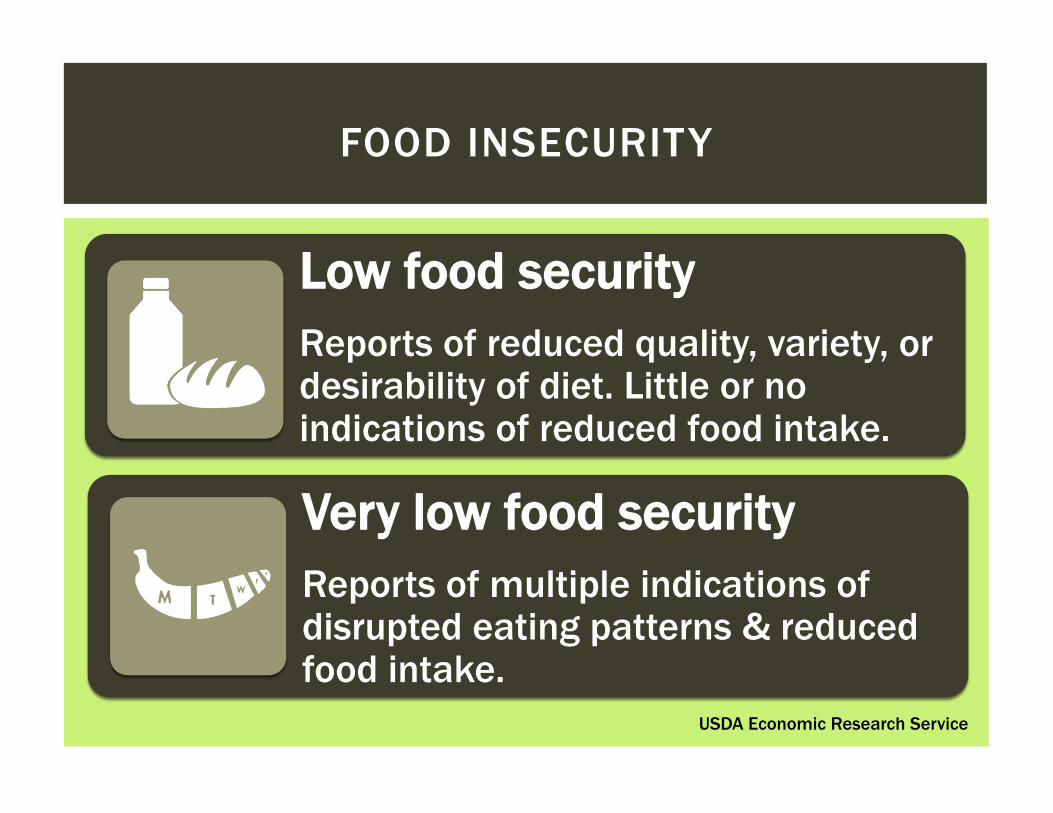
FOOD INSECURITY
Calculated by ERS based on Current Populat ion Sur vey Food Secur i ty Supplement data.
0.00
2.00
4.00
6.00
8.00
10.00
12.00
14.00
16.00
1995 2000 2005 2010
Perc
ent o
f Hou
seho
lds
Trends in Prevalence of Food Insecurity in U.S. Households, 1995 - 2011
Food Insecurity
Very Low Food Insecurity
Food Insecurity
Very Low Food Security

CHILDREN WITH SPECIAL HEALTH CARE NEEDS (CSHCN)
15% of U.S. children have a special health care need
23% of U.S. households have at
least one CSHCN
CSHCN
Healthy children
Data Resource Center for Child & Adolescent Health
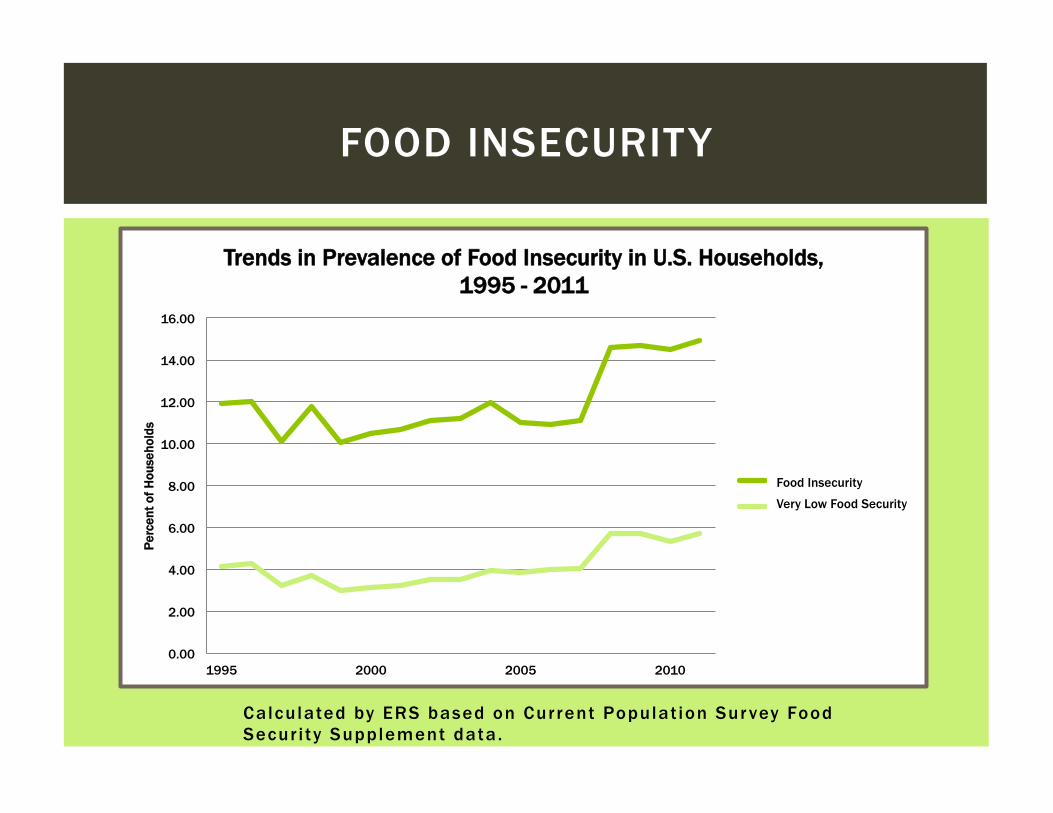
Families with CSHCN are at risk for:
Economic hardship
Employment
issues
Health service
difficulties
Social & psychological
issues
CSHCN & FOOD INSECURITY
Waldman, et al., 2010; Rogers & Hogan, 2010
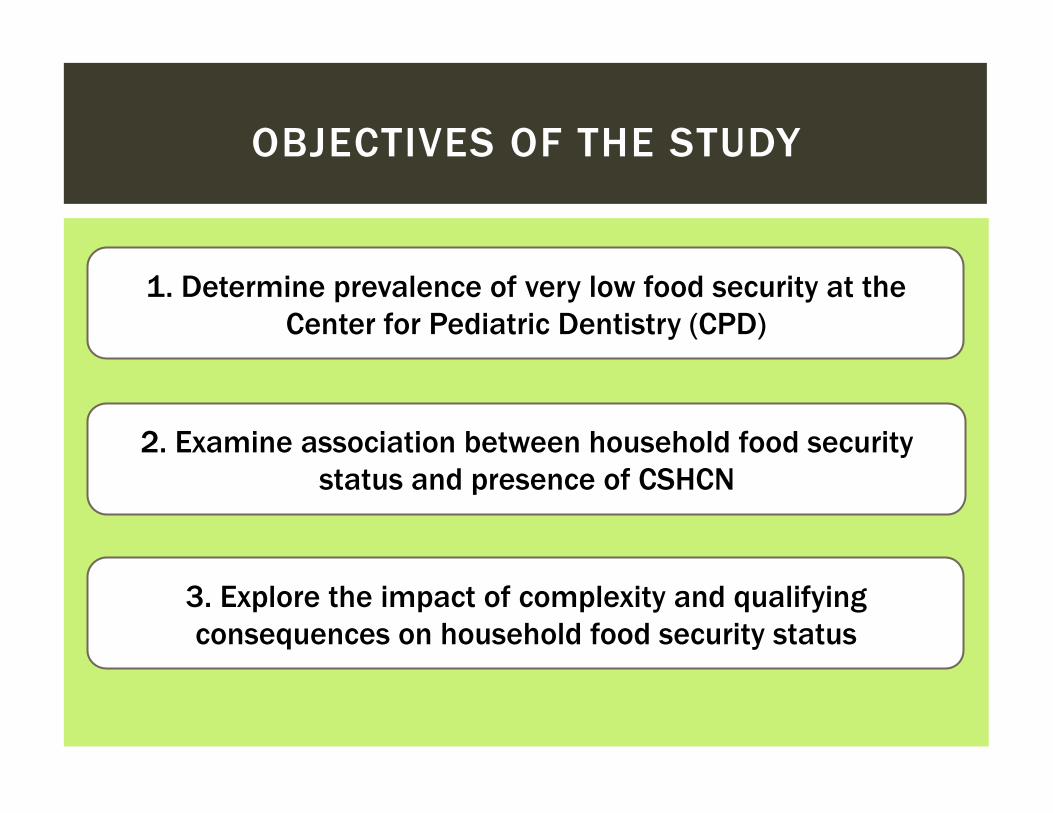
OBJECTIVES OF THE STUDY
1. Determine prevalence of very low food security at the Center for Pediatric Dentistry (CPD)
3. Explore the impact of complexity and qualifying consequences on household food security status
2. Examine association between household food security status and presence of CSHCN

METHODS

STUDY DESIGN AND SAMPLE
• Study Design • Cross-sectional
• Setting: CPD • Participants • 150 caregivers • Inclusion criteria: • Age 18 years or older • Parent or legal guardian • Read English

MEASUREMENT: EXPOSURE
Prescription medications
Above routine service use
Functional limitation
Specialized therapies
Mental health counseling
Exposure: Presence of
CSHCN in the household
Measured by: CSHCN
screener
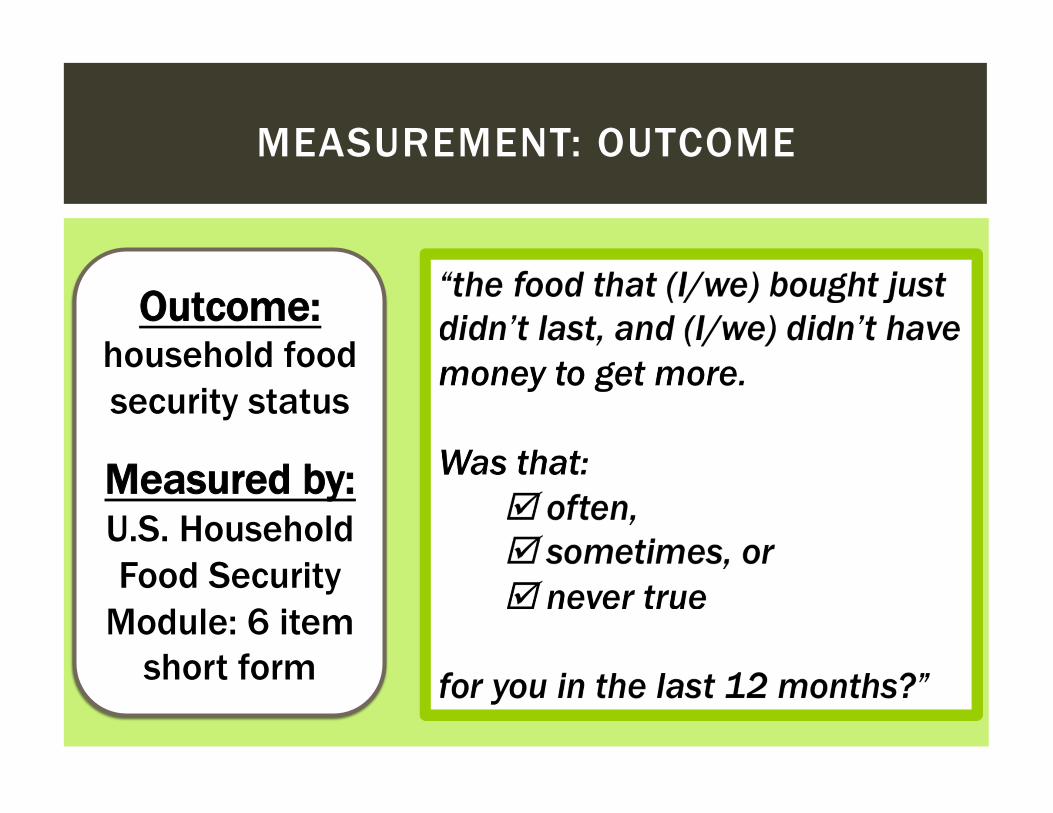
MEASUREMENT: OUTCOME
Outcome: household food security status
Measured by: U.S. Household Food Security
Module: 6 item short form

MEASUREMENT: COVARIATES
Caregiver data Household data
• Age • Race/ethnicity • Education • Health status • Primary language • Relationship to
patient
• Number of adults & children
• Children’s age • Smoking • Food and nutrition
assistance programs • Medicaid

DATA ANALYSIS
1. Determine prevalence of very low food security at CPD
2. Examine association between household food security status and presence of CSHCN
3. Explore the impact of complexity and qualifying consequences on household food security status
Descriptive, bivariate analyses to compare food-secure & food-insecure households
Multiple logistic regression
Multiple logistic regression, bivariate analysis

RESULTS

Food-secure & food-insecure households had similar:
¡ Number of children ¡ Number of children < age 6 ¡ Primary language English ¡ Caregiver age ¡ Race/ethnicity
Food-insecure households were significantly more likely to: ¡ Have a single-parent ¡ Have smokers ¡ Be enrolled in federal food
and nutrition assistance programs
¡ Be enrolled in Medicaid ¡ Have a caregiver with lower
education ¡ Have a caregiver with
poorer health status
CHARACTERISTICS OF FOOD-SECURE & FOOD-INSECURE HOUSEHOLDS

FOOD SECURITY AT CPD
68%
23%
9%
Food Security Status at CPD High food security (n=97) Low food security (n=32) Very low food security (n=13)

63%
37%
CSHCN
Food-secure Food-insecure
CSHCN AND FOOD INSECURITY
74%
26%
No CHSCN
Food-secure Food-insecure
OR 95% CI P
CSHCN 1.67 0.8 – 3.47 0.17
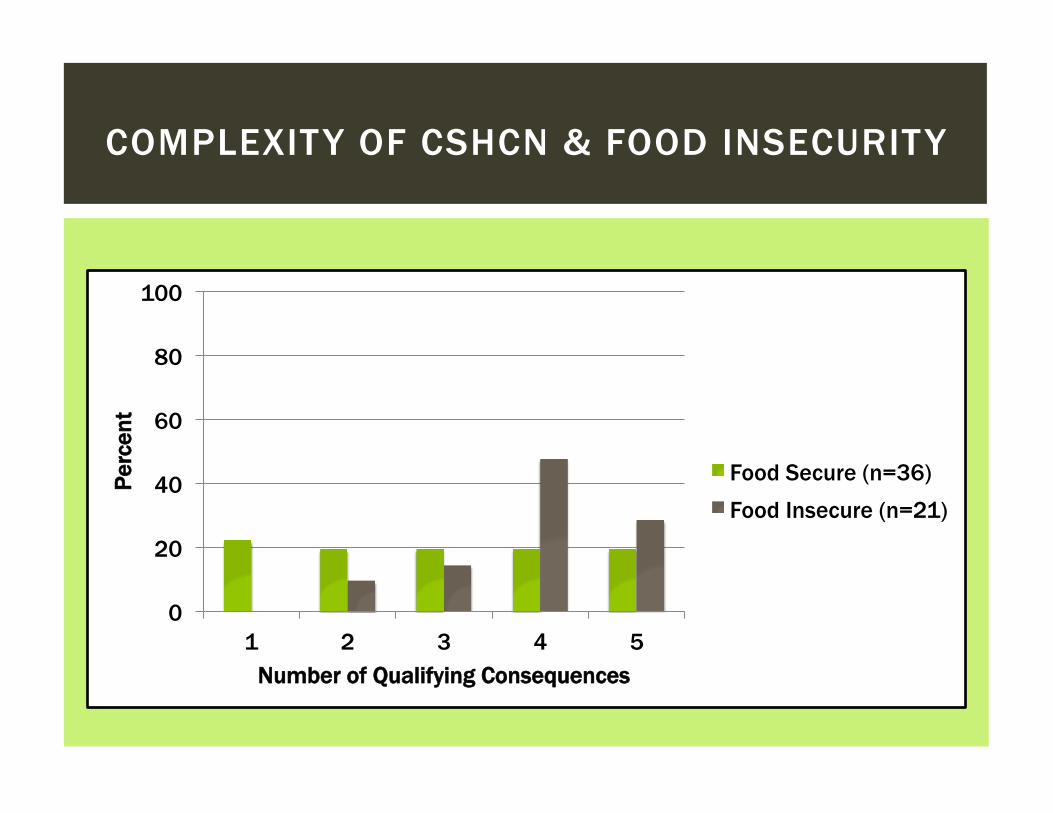
COMPLEXITY OF CSHCN & FOOD INSECURITY
0
20
40
60
80
100
1 2 3 4 5
Perc
ent
Number of Qualifying Consequences
Food Secure (n=36) Food Insecure (n=21)
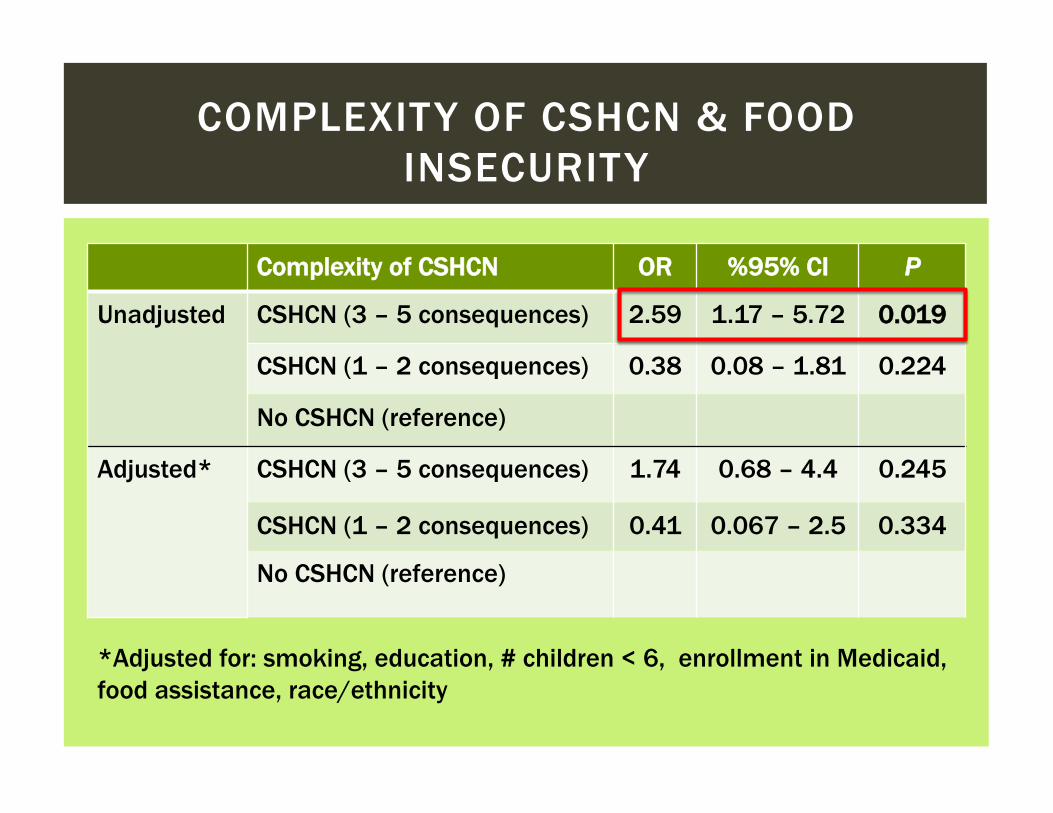
COMPLEXITY OF CSHCN & FOOD INSECURITY
Complexity of CSHCN OR %95% CI P
Unadjusted CSHCN (3 – 5 consequences) 2.59 1.17 – 5.72 0.019
CSHCN (1 – 2 consequences) 0.38 0.08 – 1.81 0.224
No CSHCN (reference)
Adjusted* CSHCN (3 – 5 consequences) 1.74 0.68 – 4.4 0.245
CSHCN (1 – 2 consequences) 0.41 0.067 – 2.5 0.334
No CSHCN (reference)
*Adjusted for: smoking, education, # children < 6, enrollment in Medicaid, food assistance, race/ethnicity

CSHCN QUALIFYING HEALTH CONSEQUENCES & FOOD INSECURITY
Consequence Food-secure (n=36) n (%)
Food-insecure (n=21) n (%)
P
Prescription medications 28 (78) 16 (76) 0.89
Above routine service use
26 (72) 20 (95) 0.04
Functional limitations 17 (47) 16 (76) 0.03
Specialized therapies 19 (53) 12 (57) 0.75
Mental health counseling 16 (46) 19 (90) 0.001

DISCUSSION
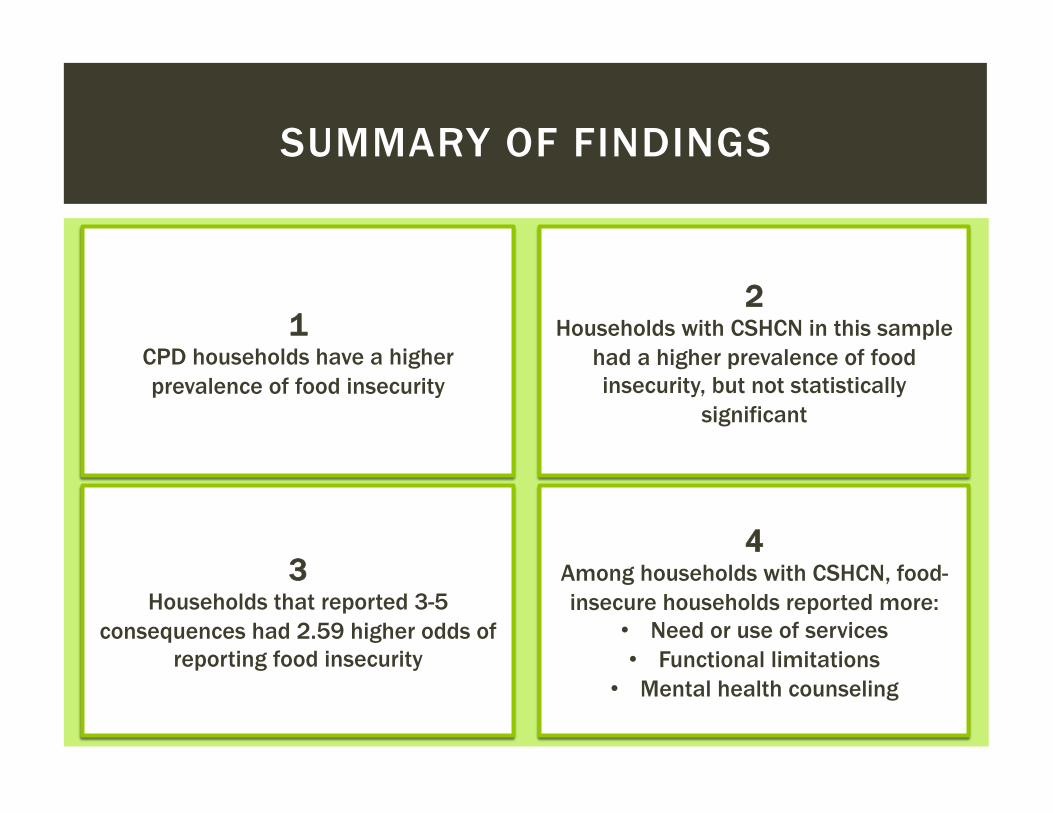
SUMMARY OF FINDINGS
1 CPD households have a higher prevalence of food insecurity
2 Households with CSHCN in this sample
had a higher prevalence of food insecurity, but not statistically
significant
3 Households that reported 3-5
consequences had 2.59 higher odds of reporting food insecurity
4 Among households with CSHCN, food-insecure households reported more:
• Need or use of services • Functional limitations
• Mental health counseling
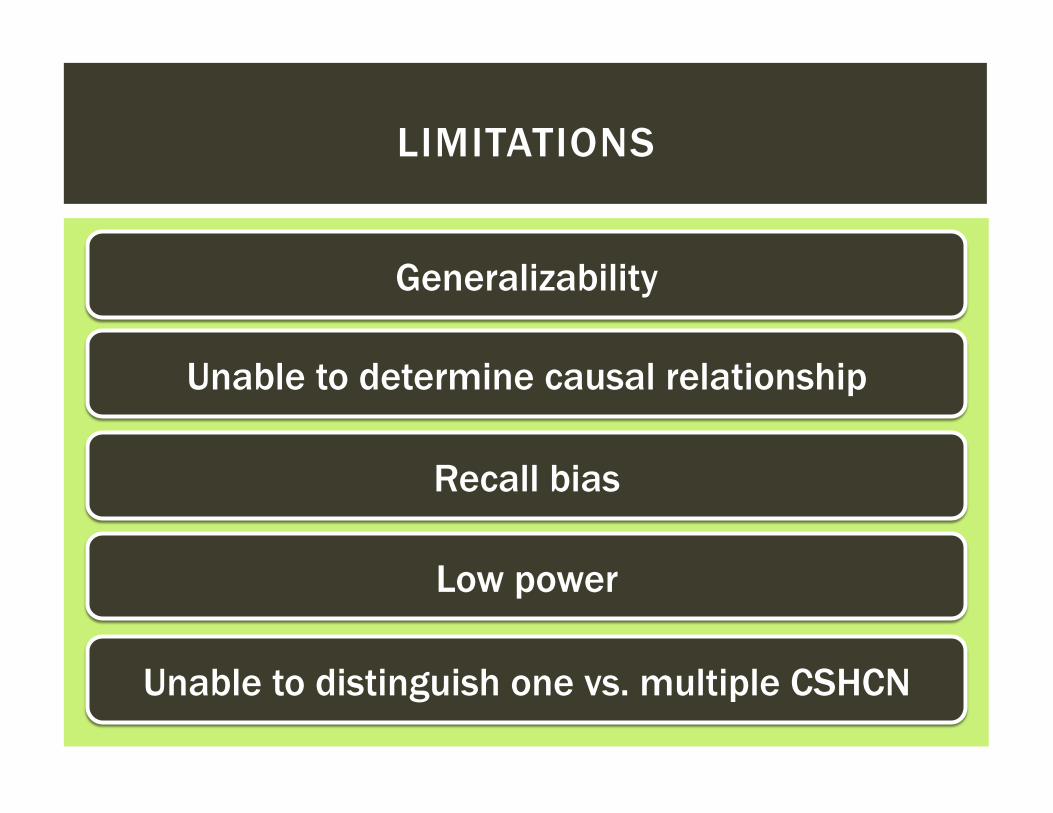
LIMITATIONS
Generalizability
Unable to determine causal relationship
Recall bias
Low power
Unable to distinguish one vs. multiple CSHCN

CONCLUSIONS
Families with more complex CSHCN may have a higher likelihood of food insecurity.
The AAPD recommends a dental home for all children, especially CSHCN.
Consideration of social risk factors may improve oral health care.

Thesis committee: Donna Johnson & Mollie Greves Grow
Andy Hoegh, Nick Radant, Sue Coldwell, Amy Kim, Joanna Scott, & others at the Center for Pediatric Dentistry
This study is supported by the US Department of Health and Human Services, Health Resources and Services Administration’s Maternal and Child Health Bureau (Title V, Social Security Act), grant #T76MC00011.
ACKNOWLEDGEMENTS

THANK YOU!