
Food Safety & Quality A Novel Food Freshness Assay … II... · research and development when...
6
A p p l i c a t i o n N o t e BioTek Instruments, Inc. P.O. Box 998, Highland Park, Winooski, Vermont 05404-0998 USA Phone: 888-451-5171 Outside the USA: 802-655-4740 Email: [email protected] www.biotek.com Copyright © 2014 Wendy Goodrich, Applications Department, BioTek Instruments, Inc., Winooski, VT, USA Larissa Balakireva, NovoCIB, Lyon, France Key Words: NADH ATP Freshness Testing Seafood Quality Control Inosine Monophosphate Inosine Hypoxanthine IMP Hx Ino Tissue Decomposition Introduction Quality assurance is a governing quality management system wherein quality control monitors material conformance to specification [2] . Regulatory standards for quality are often mandated in the food industry, and range along the full commodity cycle from harvest or conception to final consumer purchase according to the principles of HACCP (Hazard Analysis and Critical Control Points). Preventative controls are one tool for providing HACCP data, for example to insure food safety by testing for product spoilage or pathogen indicators, natural or process contamination, or intentional or unintentional adulteration parameters. Quality methods are also useful in research and development when merchandise specifications are developed. For example, testing the effects of new preservative techniques or packaging design on extending a product shelf- life may require time course studies that evaluate the effects of these variables on product freshness. Results from those studies are then used to develop test criteria required later in the manufacturing life cycle to ensure lot to lot homogeny. It is generally recognized that a good quality method provides both prescriptive (analytical) and operational (screening) quantitative or qualitative objective measures of conformance to requirements and fitness for use. Criteria for measuring the value of a quality method include reliability, sensitivity, specificity, flexibility, and reproducibility among other factors. For a method to be viable for any given application it should be performance based, easy to use, and with a realistic Here we present results from challenge testing the applied automation and sample prep methods developed and published in BioTek's Application Note ‘Automation and Sample Prep Optimization of a Novel Freshness Assay Measuring Inosine Monophosphate (IMP), Inosine (Ino), and Hypoxanthine (Hx) as a % Ratio in Animal Muscle Tissue’ [1] . Using a variety of sample matrices, experimental conditions were designed to highlight the versatility of this assay as both a screening and analytical tool, hallmarks of a good quality control assay. Results suggest that this reliable, rapid, easy to use assay could be efficacious in a host of applications that could benefit from non-sensory quantification of fish freshness, such as in quality assurance systems common to Good Manufacturing Practice (GMP) and HACCP environments typical of the food industry. time to result [3] . These principles provided the foundation of experimental design for challenge testing an automated workflow model developed for a 96-well microplate adaptation of the NovoCIB Precice Freshness Assay [4] . Briefly, the assay uses proprietary technology to convert 3 nucleotides produced during post- mortem ATP degradation in animal muscle tissue to NADH. NADH is then detected at absorbance 340 nm . Percent ratio of each nucleotide is calculated based on the principles of K and Ki values (Saito, Karube respectively) [5] . Higher percent ratio values of Inosine Monophosphate (IMP) represent fresher tissue. Values for Inosine (Ino) and Hypoxathine (Hx) are also calculated, and in addition to the IMP content provide an overall view of the sample freshness pathway. The assay was designed for 1 cm cuvette detection, but has also been applied using filter based detection in 96-well microplates. Detection of NADH at 340 nm, automated liquid handling, and sample prep method optimization for higher throughput were introduced and validated by BioTek as options for diversifying the workflow options of the assay in 96-well microplate format. Also highlighted in our initial work was a new Epoch™ 2 Microplate Spectrophotometer. With an integrated touch screen tablet, onboard linear and orbital shaking, and a front loading 1 cm cuvette port, among other options, the Epoch 2 is particularly suited to expand throughput options for the assay even further. A Novel Food Freshness Assay Based on ATP Depletion Part 2: Challenge Testing of the Automated Assay Food Safety & Quality
Transcript of Food Safety & Quality A Novel Food Freshness Assay … II... · research and development when...
A p p l i c a t i o n N o t e
BioTek Instruments, Inc.P.O. Box 998, Highland Park, Winooski, Vermont 05404-0998 USAPhone: 888-451-5171 Outside the USA: 802-655-4740 Email: [email protected] www.biotek.comCopyright © 2014
Wendy Goodrich, Applications Department, BioTek Instruments, Inc., Winooski, VT, USALarissa Balakireva, NovoCIB, Lyon, France
Key Words:
NADH ATP Freshness Testing
Seafood Quality Control
Inosine Monophosphate
Inosine
Hypoxanthine
IMP
Hx
Ino
Tissue Decomposition
Introduction
Quality assurance is a governing quality management system wherein quality control monitors material conformance to specification
[2]. Regulatory standards for quality are often mandated in the food industry, and range along the full commodity cycle from harvest or conception to final consumer purchase according to the principles of HACCP (Hazard Analysis and Critical Control Points). Preventative controls are one tool for providing HACCP data, for example to insure food safety by testing for product spoilage or pathogen indicators, natural or process contamination, or intentional or unintentional adulteration parameters. Quality methods are also useful in research and development when merchandise specifications are developed. For example, testing the effects of new preservative techniques or packaging design on extending a product shelf-life may require time course studies that evaluate the effects of these variables on product freshness. Results from those studies are then used to develop test criteria required later in the manufacturing life cycle to ensure lot to lot homogeny.
It is generally recognized that a good quality method provides both prescriptive (analytical) and operational (screening) quantitative or qualitative objective measures of conformance to requirements and fitness for use. Criteria for measuring the value of a quality method include reliability, sensitivity, specificity, flexibility, and reproducibility among other factors. For a method to be viable for any given application it should be performance based, easy to use, and with a realistic
Here we present results from challenge testing the applied automation and sample prep methods developed and published in BioTek's Application Note ‘Automation and Sample Prep Optimization of a Novel Freshness Assay Measuring Inosine Monophosphate (IMP), Inosine (Ino), and Hypoxanthine (Hx) as a % Ratio in Animal Muscle Tissue’[1]. Using a variety of sample matrices, experimental conditions were designed to highlight the versatility of this assay as both a screening and analytical tool, hallmarks of a good quality control assay. Results suggest that this reliable, rapid, easy to use assay could be efficacious in a host of applications that could benefit from non-sensory quantification of fish freshness, such as in quality assurance systems common to Good Manufacturing Practice (GMP) and HACCP environments typical of the food industry.
time to result [3]. These principles provided the foundation of experimental design for challenge testing an automated workflow model developed for a 96-well microplate adaptation of the NovoCIB Precice Freshness Assay[4].
Briefly, the assay uses proprietary technology to convert 3 nucleotides produced during post-mortem ATP degradation in animal muscle tissue to NADH. NADH is then detected at absorbance 340nm. Percent ratio of each nucleotide is calculated based on the principles of K and Ki values (Saito, Karube respectively)[5]. Higher percent ratio values of Inosine Monophosphate (IMP) represent fresher tissue. Values for Inosine (Ino) and Hypoxathine (Hx) are also calculated, and in addition to the IMP content provide an overall view of the sample freshness pathway. The assay was designed for 1 cm cuvette detection, but has also been applied using filter based detection in 96-well microplates. Detection of NADH at 340 nm, automated liquid handling, and sample prep method optimization for higher throughput were introduced and validated by BioTek as options for diversifying the workflow options of the assay in 96-well microplate format. Also highlighted in our initial work was a new Epoch™ 2 Microplate Spectrophotometer. With an integrated touch screen tablet, onboard linear and orbital shaking, and a front loading 1 cm cuvette port, among other options, the Epoch 2 is particularly suited to expand throughput options for the assay even further.
A Novel Food Freshness Assay Based on ATP Depletion Part 2: Challenge Testing of the Automated Assay
Food Safety & Quality
2
Application Note
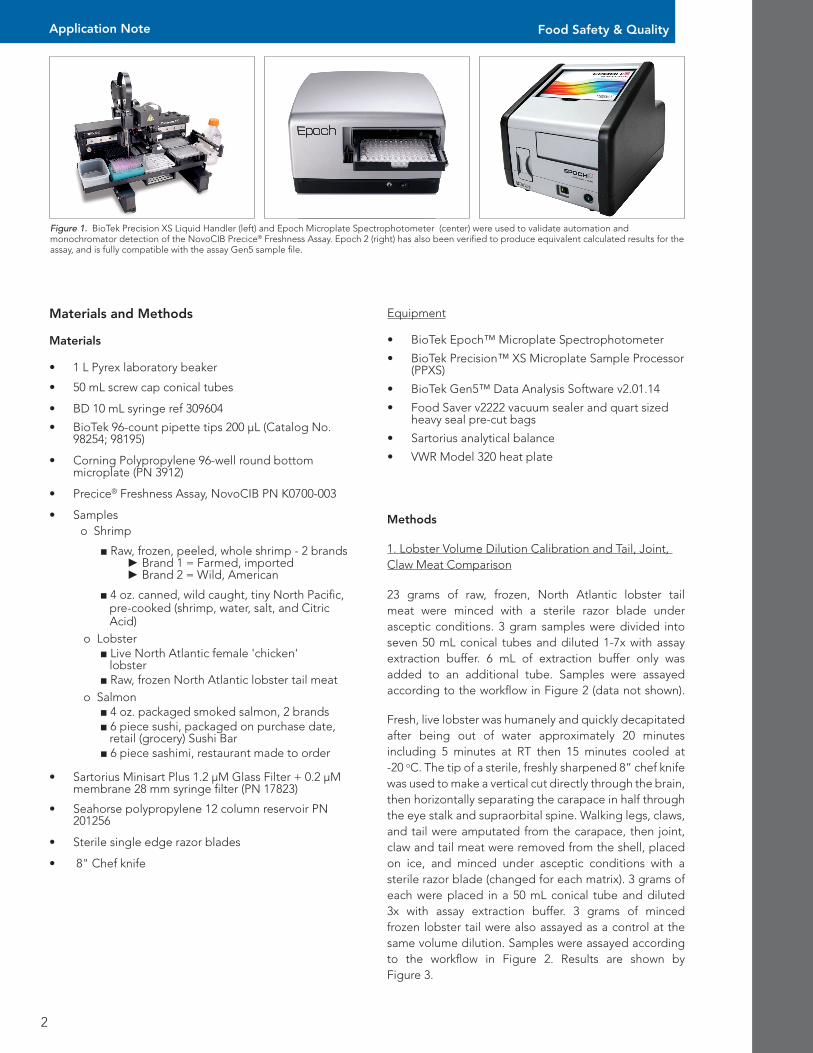
Figure 1. BioTek Precision XS Liquid Handler (left) and Epoch Microplate Spectrophotometer (center) were used to validate automation and monochromator detection of the NovoCIB Precice® Freshness Assay. Epoch 2 (right) has also been verified to produce equivalent calculated results for the assay, and is fully compatible with the assay Gen5 sample file.
Materials and Methods Materials
• 1 L Pyrex laboratory beaker
• 50 mL screw cap conical tubes
• BD 10 mL syringe ref 309604
• BioTek 96-count pipette tips 200 µL (Catalog No. 98254; 98195)
• Corning Polypropylene 96-well round bottom microplate (PN 3912)
• Precice® Freshness Assay, NovoCIB PN K0700-003
• Samples o Shrimp ■ Raw, frozen, peeled, whole shrimp - 2 brands ► Brand 1 = Farmed, imported ► Brand 2 = Wild, American
■ 4 oz. canned, wild caught, tiny North Pacific, pre-cooked (shrimp, water, salt, and Citric Acid) o Lobster ■ Live North Atlantic female 'chicken' lobster ■ Raw, frozen North Atlantic lobster tail meat o Salmon ■ 4 oz. packaged smoked salmon, 2 brands ■ 6 piece sushi, packaged on purchase date, retail (grocery) Sushi Bar ■ 6 piece sashimi, restaurant made to order
• Sartorius Minisart Plus 1.2 µM Glass Filter + 0.2 µM membrane 28 mm syringe filter (PN 17823)
• Seahorse polypropylene 12 column reservoir PN 201256
• Sterile single edge razor blades
• 8" Chef knife
Equipment
• BioTek Epoch™ Microplate Spectrophotometer
• BioTek Precision™ XS Microplate Sample Processor (PPXS)
• BioTek Gen5™ Data Analysis Software v2.01.14
• Food Saver v2222 vacuum sealer and quart sized heavy seal pre-cut bags
• Sartorius analytical balance
• VWR Model 320 heat plate
Methods
1. Lobster Volume Dilution Calibration and Tail, Joint, Claw Meat Comparison
23 grams of raw, frozen, North Atlantic lobster tail meat were minced with a sterile razor blade under asceptic conditions. 3 gram samples were divided into seven 50 mL conical tubes and diluted 1-7x with assay extraction buffer. 6 mL of extraction buffer only was added to an additional tube. Samples were assayed according to the workflow in Figure 2 (data not shown).
Fresh, live lobster was humanely and quickly decapitated after being out of water approximately 20 minutes including 5 minutes at RT then 15 minutes cooled at -20 oC. The tip of a sterile, freshly sharpened 8” chef knife was used to make a vertical cut directly through the brain, then horizontally separating the carapace in half through the eye stalk and supraorbital spine. Walking legs, claws, and tail were amputated from the carapace, then joint, claw and tail meat were removed from the shell, placed on ice, and minced under asceptic conditions with a sterile razor blade (changed for each matrix). 3 grams of each were placed in a 50 mL conical tube and diluted 3x with assay extraction buffer. 3 grams of minced frozen lobster tail were also assayed as a control at the same volume dilution. Samples were assayed according to the workflow in Figure 2. Results are shown by Figure 3.
Food Safety & Quality
3
Application Note
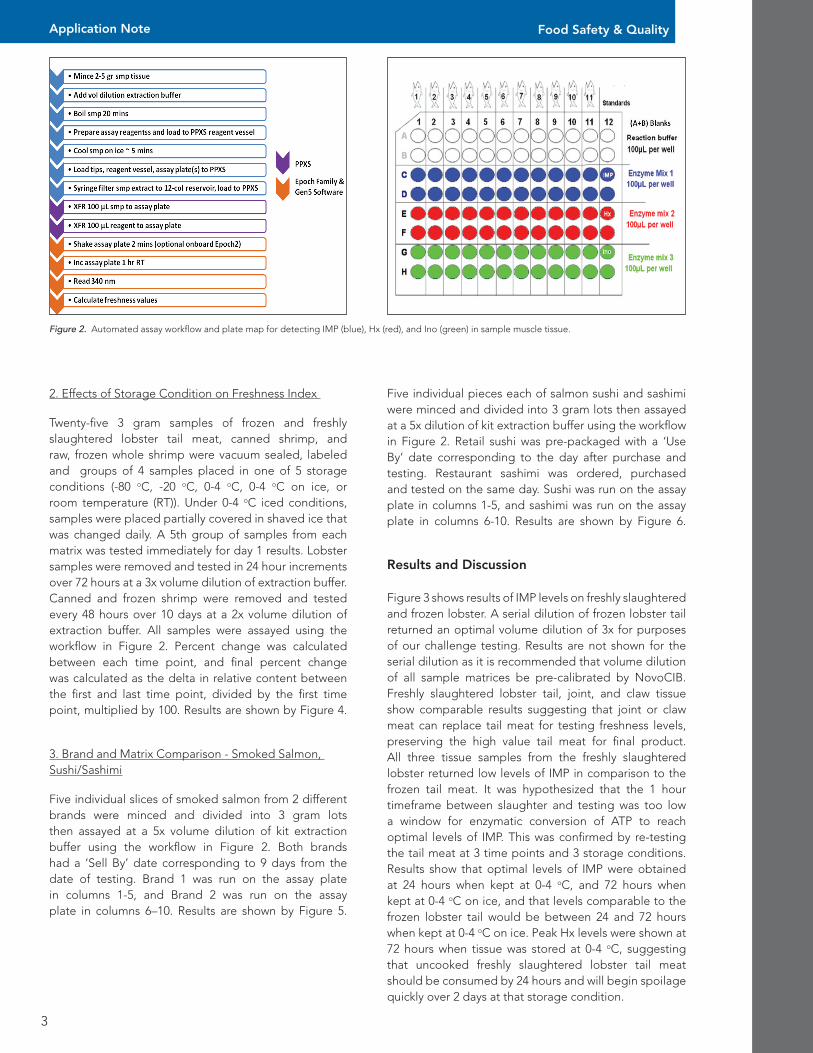
Figure 2. Automated assay workflow and plate map for detecting IMP (blue), Hx (red), and Ino (green) in sample muscle tissue.
2. Effects of Storage Condition on Freshness Index
Twenty-five 3 gram samples of frozen and freshly slaughtered lobster tail meat, canned shrimp, and raw, frozen whole shrimp were vacuum sealed, labeled and groups of 4 samples placed in one of 5 storage conditions (-80 oC, -20 oC, 0-4 oC, 0-4 oC on ice, or room temperature (RT)). Under 0-4 oC iced conditions, samples were placed partially covered in shaved ice that was changed daily. A 5th group of samples from each matrix was tested immediately for day 1 results. Lobster samples were removed and tested in 24 hour increments over 72 hours at a 3x volume dilution of extraction buffer. Canned and frozen shrimp were removed and tested every 48 hours over 10 days at a 2x volume dilution of extraction buffer. All samples were assayed using the workflow in Figure 2. Percent change was calculated between each time point, and final percent change was calculated as the delta in relative content between the first and last time point, divided by the first time point, multiplied by 100. Results are shown by Figure 4.
3. Brand and Matrix Comparison - Smoked Salmon, Sushi/Sashimi
Five individual slices of smoked salmon from 2 different brands were minced and divided into 3 gram lots then assayed at a 5x volume dilution of kit extraction buffer using the workflow in Figure 2. Both brands had a ‘Sell By’ date corresponding to 9 days from the date of testing. Brand 1 was run on the assay plate in columns 1-5, and Brand 2 was run on the assay plate in columns 6–10. Results are shown by Figure 5.
Five individual pieces each of salmon sushi and sashimi were minced and divided into 3 gram lots then assayed at a 5x dilution of kit extraction buffer using the workflow in Figure 2. Retail sushi was pre-packaged with a ‘Use By’ date corresponding to the day after purchase and testing. Restaurant sashimi was ordered, purchased and tested on the same day. Sushi was run on the assay plate in columns 1-5, and sashimi was run on the assay plate in columns 6-10. Results are shown by Figure 6.
Results and Discussion
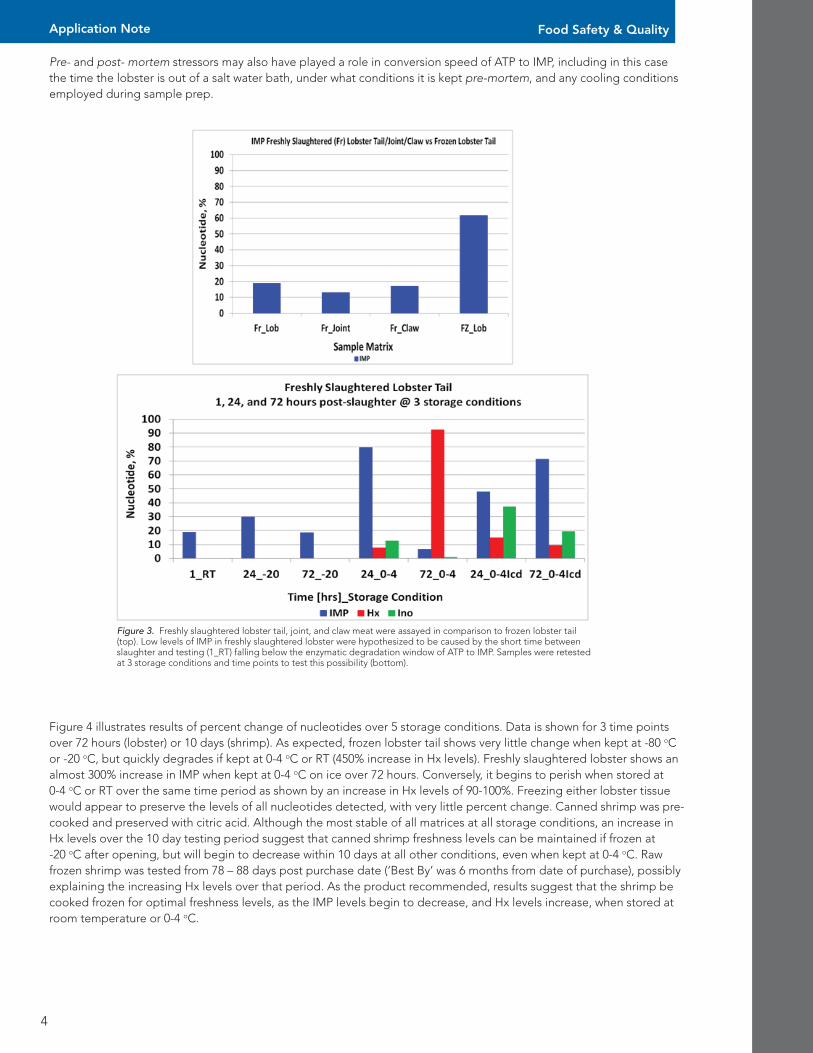
Figure 3 shows results of IMP levels on freshly slaughtered and frozen lobster. A serial dilution of frozen lobster tail returned an optimal volume dilution of 3x for purposes of our challenge testing. Results are not shown for the serial dilution as it is recommended that volume dilution of all sample matrices be pre-calibrated by NovoCIB. Freshly slaughtered lobster tail, joint, and claw tissue show comparable results suggesting that joint or claw meat can replace tail meat for testing freshness levels, preserving the high value tail meat for final product. All three tissue samples from the freshly slaughtered lobster returned low levels of IMP in comparison to the frozen tail meat. It was hypothesized that the 1 hour timeframe between slaughter and testing was too low a window for enzymatic conversion of ATP to reach optimal levels of IMP. This was confirmed by re-testing the tail meat at 3 time points and 3 storage conditions. Results show that optimal levels of IMP were obtained at 24 hours when kept at 0-4 oC, and 72 hours when kept at 0-4 oC on ice, and that levels comparable to the frozen lobster tail would be between 24 and 72 hours when kept at 0-4 oC on ice. Peak Hx levels were shown at 72 hours when tissue was stored at 0-4 oC, suggesting that uncooked freshly slaughtered lobster tail meat should be consumed by 24 hours and will begin spoilage quickly over 2 days at that storage condition.
Food Safety & Quality
4
Application Note
Pre- and post- mortem stressors may also have played a role in conversion speed of ATP to IMP, including in this case the time the lobster is out of a salt water bath, under what conditions it is kept pre-mortem, and any cooling conditions employed during sample prep.
Figure 3. Freshly slaughtered lobster tail, joint, and claw meat were assayed in comparison to frozen lobster tail (top). Low levels of IMP in freshly slaughtered lobster were hypothesized to be caused by the short time between slaughter and testing (1_RT) falling below the enzymatic degradation window of ATP to IMP. Samples were retested at 3 storage conditions and time points to test this possibility (bottom).
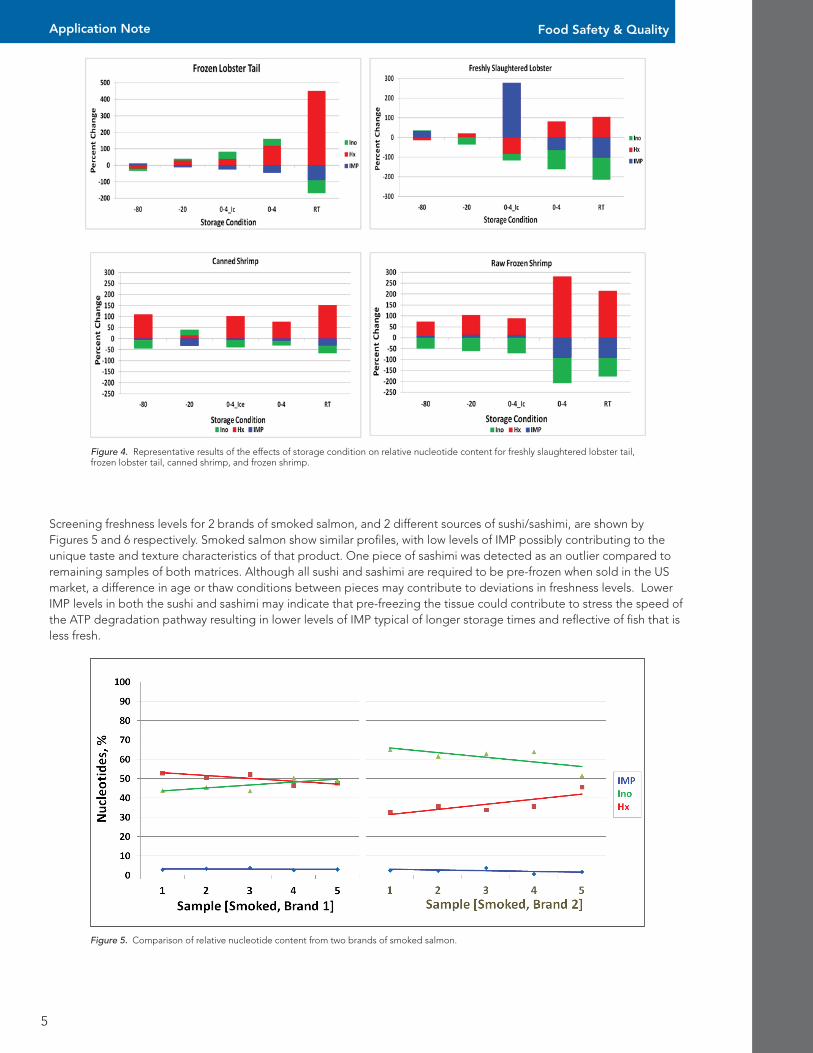
Figure 4 illustrates results of percent change of nucleotides over 5 storage conditions. Data is shown for 3 time points over 72 hours (lobster) or 10 days (shrimp). As expected, frozen lobster tail shows very little change when kept at -80 oC or -20 oC, but quickly degrades if kept at 0-4 oC or RT (450% increase in Hx levels). Freshly slaughtered lobster shows an almost 300% increase in IMP when kept at 0-4 oC on ice over 72 hours. Conversely, it begins to perish when stored at 0-4 oC or RT over the same time period as shown by an increase in Hx levels of 90-100%. Freezing either lobster tissue would appear to preserve the levels of all nucleotides detected, with very little percent change. Canned shrimp was pre-cooked and preserved with citric acid. Although the most stable of all matrices at all storage conditions, an increase in Hx levels over the 10 day testing period suggest that canned shrimp freshness levels can be maintained if frozen at -20 oC after opening, but will begin to decrease within 10 days at all other conditions, even when kept at 0-4 oC. Raw frozen shrimp was tested from 78 – 88 days post purchase date (‘Best By’ was 6 months from date of purchase), possibly explaining the increasing Hx levels over that period. As the product recommended, results suggest that the shrimp be cooked frozen for optimal freshness levels, as the IMP levels begin to decrease, and Hx levels increase, when stored at room temperature or 0-4 oC.
Food Safety & Quality
5
Application Note
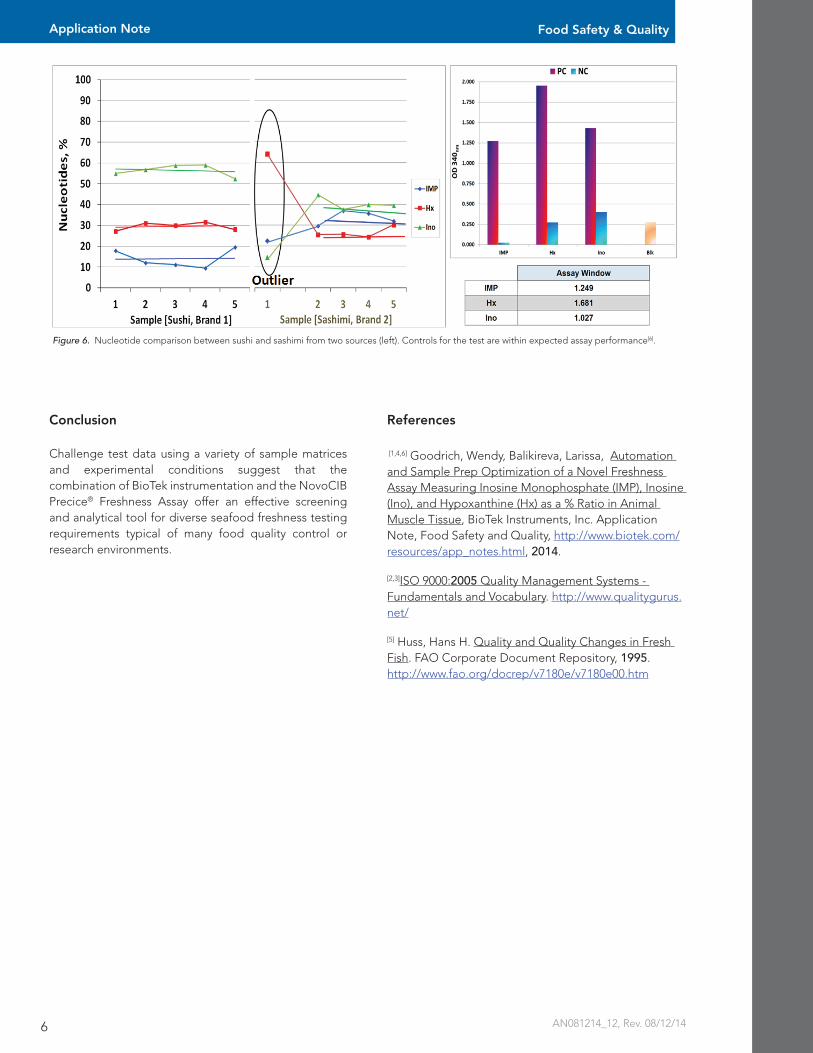
Screening freshness levels for 2 brands of smoked salmon, and 2 different sources of sushi/sashimi, are shown by Figures 5 and 6 respectively. Smoked salmon show similar profiles, with low levels of IMP possibly contributing to the unique taste and texture characteristics of that product. One piece of sashimi was detected as an outlier compared to remaining samples of both matrices. Although all sushi and sashimi are required to be pre-frozen when sold in the US market, a difference in age or thaw conditions between pieces may contribute to deviations in freshness levels. Lower IMP levels in both the sushi and sashimi may indicate that pre-freezing the tissue could contribute to stress the speed of the ATP degradation pathway resulting in lower levels of IMP typical of longer storage times and reflective of fish that is less fresh.
Figure 4. Representative results of the effects of storage condition on relative nucleotide content for freshly slaughtered lobster tail, frozen lobster tail, canned shrimp, and frozen shrimp.
Figure 5. Comparison of relative nucleotide content from two brands of smoked salmon.
Food Safety & Quality
6
Application Note
Figure 6. Nucleotide comparison between sushi and sashimi from two sources (left). Controls for the test are within expected assay performance[6].
AN081214_12, Rev. 08/12/14
Conclusion
Challenge test data using a variety of sample matrices and experimental conditions suggest that the combination of BioTek instrumentation and the NovoCIB Precice® Freshness Assay offer an effective screening and analytical tool for diverse seafood freshness testing requirements typical of many food quality control or research environments.
References
[1,4,6] Goodrich, Wendy, Balikireva, Larissa, Automation and Sample Prep Optimization of a Novel Freshness Assay Measuring Inosine Monophosphate (IMP), Inosine (Ino), and Hypoxanthine (Hx) as a % Ratio in Animal Muscle Tissue, BioTek Instruments, Inc. Application Note, Food Safety and Quality, http://www.biotek.com/resources/app_notes.html, 2014.
[2,3]ISO 9000:2005 Quality Management Systems - Fundamentals and Vocabulary. http://www.qualitygurus.net/
[5] Huss, Hans H. Quality and Quality Changes in Fresh Fish. FAO Corporate Document Repository, 1995. http://www.fao.org/docrep/v7180e/v7180e00.htm
Food Safety & Quality


